UNITED STATES
SECURITIES AND EXCHANGE COMMISSION
Washington, D.C. 20549
FORM N-CSR
CERTIFIED SHAREHOLDER REPORT OF REGISTERED
MANAGEMENT INVESTMENT COMPANIES
| | |
| Investment Company Act file number: | | 811-06677 |
| |
| Exact name of registrant as specified in charter: | | Prudential Investment Portfolios 8 |
| |
| Address of principal executive offices: | | Gateway Center 3, |
| | 100 Mulberry Street, |
| | Newark, New Jersey 07102 |
| |
| Name and address of agent for service: | | Deborah A. Docs |
| | Gateway Center 3, |
| | 100 Mulberry Street, |
| | Newark, New Jersey 07102 |
| |
| Registrant’s telephone number, including area code: | | 800-225-1852 |
| |
| Date of fiscal year end: | | 9/30/2014 |
| |
| Date of reporting period: | | 9/30/2014 |
Item 1 – Reports to Stockholders –

PRUDENTIAL INVESTMENTS»MUTUAL FUNDS
PRUDENTIAL STOCK INDEX FUND
ANNUAL REPORT · SEPTEMBER 30, 2014
Fund Type
Large-Cap Stock
Objective
Provide investment results that correspond to the price and yield performance of the S&P 500 Index
This report is not authorized for distribution to prospective investors unless preceded or accompanied by a current prospectus.
The views expressed in this report and
information about the Fund’s portfolio holdings are for the period covered by this report and are subject to change thereafter.
Mutual funds are distributed by Prudential Investment Management Services LLC, a Prudential Financial company. Quantitative Management Associates, LLC (QMA) is a wholly owned subsidiary of Prudential Investment Management, Inc. (PIM). QMA and PIM are registered investment advisers and Prudential Financial companies. © 2014 Prudential Financial, Inc. and its related entities. Prudential Investments LLC, Prudential, the Prudential logo, Bring Your Challenges, and the Rock symbol are service marks of Prudential Financial, Inc. and its related entities, registered in many jurisdictions worldwide.

November 14, 2014
Dear Shareholder:
We hope you find the annual report for the Prudential Stock Index Fund informative and useful. The report covers performance for the 12-month period that ended September 30, 2014.
Since market conditions change over time, we believe it is important to maintain a diversified portfolio of funds consistent with your tolerance for risk, time horizon, and financial goals.
Your financial advisor can help you create a diversified investment plan that may include funds covering all the basic asset classes and that reflects your personal investor profile and risk tolerance. Keep in mind, however, that diversification and asset allocation strategies do not assure a profit or protect against loss in declining markets.
Prudential Investments® is dedicated to helping you solve your toughest investment challenges—whether it’s capital growth, reliable income, or protection from market volatility and other risks. We offer the expertise of Prudential Financial’s affiliated asset managers* that strive to be leaders in a broad range of funds to help you stay on course to the future you envision. They also manage money for major corporations and pension funds around the world, which means you benefit from the same expertise, innovation, and attention to risk demanded by today’s most sophisticated investors.
Thank you for choosing the Prudential Investments family of funds.
Sincerely,

Stuart S. Parker, President
Prudential Stock Index Fund
*Most of Prudential Investments’ equity funds are advised by Jennison Associates LLC, Quantitative Management Associates LLC (QMA), or Prudential Real Estate Investors. Prudential Investments’ fixed income and money market funds are advised by Prudential Investment Management, Inc. (PIM) through its Prudential Fixed Income unit. Jennison Associates LLC, QMA, and PIM are registered investment advisers and Prudential Financial companies. Prudential Real Estate Investors is a unit of PIM.
| | | | |
| Prudential Stock Index Fund | | | 1 | |
Your Fund’s Performance (Unaudited)
Performance data quoted represent past performance. Past performance does not guarantee future results. The investment return and principal value of an investment will fluctuate, so that an investor’s shares, when redeemed, may be worth more or less than their original cost. Current performance may be lower or higher than the past performance data quoted. An investor may obtain performance data as of the most recent month-end by visiting our website at www.prudentialfunds.com or by calling (800) 225-1852.
| | | | | | | | | | | | |
Cumulative Total Returns (Without Sales Charges) as of 9/30/14 | |
| | | One Year | | | Five Years | | | Ten Years | |
Class A | | | 19.12 | % | | | 102.50 | % | | | 107.98 | % |
Class C | | | 18.38 | | | | 96.20 | | | | 93.89 | |
Class I | | | 19.54 | | | | 106.03 | | | | 115.38 | |
Class Z | | | 19.42 | | | | 105.43 | | | | 113.92 | |
S&P 500 Index | | | 19.70 | | | | 107.21 | | | | 117.93 | |
Lipper S&P 500 Index Objective Funds Average | | | 19.07 | | | | 101.60 | | | | 108.10 | |
| | | | | | | | | | | | |
Average Annual Total Returns (With Sales Charges) as of 9/30/14 | |
| | | One Year | | | Five Years | | | Ten Years | |
Class A | | | 15.25 | % | | | 14.40 | % | | | 7.24 | % |
Class C | | | 17.38 | | | | 14.43 | | | | 6.85 | |
Class I | | | 19.54 | | | | 15.55 | | | | 7.97 | |
Class Z | | | 19.42 | | | | 15.49 | | | | 7.90 | |
S&P 500 Index | | | 19.70 | | | | 15.69 | | | | 8.10 | |
Lipper S&P 500 Index Objective Funds Average | | | 19.07 | | | | 15.05 | | | | 7.60 | |
| | | | | | | | | | | | |
Average Annual Total Returns (Without Sales Charges) as of 9/30/14 | |
| | | One Year | | | Five Years | | | Ten Years | |
Class A | | | 19.12 | % | | | 15.16 | % | | | 7.60 | % |
Class C | | | 18.38 | | | | 14.43 | | | | 6.85 | |
Class I | | | 19.54 | | | | 15.55 | | | | 7.97 | |
Class Z | | | 19.42 | | | | 15.49 | | | | 7.90 | |
| | |
| 2 | | Visit our website at www.prudentialfunds.com |
Growth of a $10,000 Investment
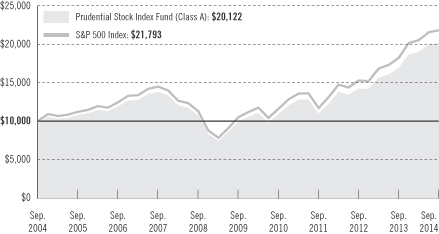
The graph compares a $10,000 investment in the Fund’s Class A shares with a similar investment in the Standard & Poor’s 500 Composite Stock Price Index (S&P 500 Index) by portraying the initial account values at the beginning of the 10-year period for Class A shares (September 30, 2004) and the account values at the end of the current fiscal year (September 30, 2014) as measured on a quarterly basis. For purposes of the graph, and unless otherwise indicated, it has been assumed that (a) the maximum applicable front-end sales charge was deducted from the initial $10,000 investment in Class A shares; (b) all recurring fees (including management fees) were deducted; and (c) all dividends and distributions were reinvested. The line graph provides information for Class A shares only. As indicated in the tables provided earlier, performance for Class C, Class I, and Class Z shares will vary due to the differing charges and expenses applicable to each share class (as indicated in the following paragraphs). Without waiver of fees and/or expense reimbursement, if any, the returns would have been lower.
Past performance does not predict future performance. Total returns and the ending account values in the graphs include changes in share price and reinvestment of dividends and capital gains distributions in a hypothetical investment for the periods shown. The Fund’s total returns do not reflect the deduction of income taxes on an individual’s investment. Taxes may reduce your actual investment returns on income or gains paid by the Fund or any gains you may realize if you sell your shares.
Source: Prudential Investments LLC and Lipper Inc.
| | | | |
| Prudential Stock Index Fund | | | 3 | |
Your Fund’s Performance (continued)
The returns in the tables do not reflect the deduction of taxes that a shareholder would pay on Fund distributions or following the redemption of Fund shares. The average annual total returns take into account applicable sales charges, which are described for each share class in the table below.
| | | | | | | | |
| | Class A | | Class C | | Class I | | Class Z |
Maximum initial sales charge | | 3.25% of
the public
offering
price | | None | | None | | None |
Contingent Deferred Sales Charge (CDSC) (as a percentage of the lower of original purchase price or sale proceeds) | | 1% on sales
of $1 million
or more
made within
12 months of
purchase | | 1% on sales
made within
12 months
of purchase | | None | | None |
Annual distribution and service (12b-1) fees (shown as a percentage of average daily net assets) | | .30% | | 1% | | None | | None |
Benchmark Definitions
S&P 500 Index
The S&P 500 Index is an unmanaged index of 500 stocks of large US public companies. It gives a broad look at how stock prices in the United States have performed.
Lipper S&P 500 Index Objective Funds Average
The Lipper S&P 500 Index Objective Funds Average (Lipper Average) represents returns based on the average return of all funds in the Lipper S&P 500 Index Objective Funds category for the periods noted. Funds in the Lipper Average are passively managed, limited expense (management fee no higher than 0.50%) funds designed to replicate the performance of the S&P 500 Index on a reinvested basis.
Investors cannot invest directly in an index or average. The returns for the Index would be lower if they included the effects of sales charges, operating expenses of a mutual fund, or taxes. Returns for the Lipper Average reflect the deduction of operating expenses, but not sales charges or taxes.
| | |
| 4 | | Visit our website at www.prudentialfunds.com |
S&P 500 Index as of 9/30/14
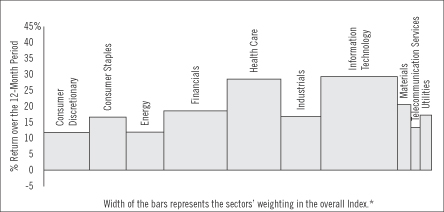
*Sector weightings are subject to change.
Source: FactSet.
The S&P 500 Index is a product of S&P Dow Jones Indices LLC (“SPDJI”), and has been licensed for use by Prudential Investments LLC, its affiliates, and subsidiaries. Standard & Poor’s®, S&P® and S&P 500® are registered trademarks of Standard & Poor’s Financial Services LLC (“S&P”); Dow Jones® is a registered trademark of Dow Jones Trademark Holdings LLC (“Dow Jones”); and these trademarks have been licensed for use by SPDJI and sublicensed for certain purposes by Prudential Investments LLC, its affiliates, and subsidiaries. The Prudential Stock Index Fund is not sponsored, endorsed, sold or promoted by SPDJI, Dow Jones, S&P, their respective affiliates, and none of such parties make any representation regarding the advisability of investing in such product(s) nor do they have any liability for any errors, omissions, or interruptions of the S&P 500 Index.
The performance cited does not represent the performance of the Prudential Stock Index Fund. Past performance does not guarantee future results. Investors cannot invest directly in an index or average.
| | | | |
| Prudential Stock Index Fund | | | 5 | |
Strategy and Performance Overview
How did the Fund perform?
The Prudential Stock Index Fund’s Class A shares returned 19.12% for the 12-month reporting period that ended September 30, 2014, trailing the 19.70% gain of the S&P 500 Index (the Index), but slightly outperforming the 19.07% return of the Lipper S&P 500 Index Objective Funds Average.
| | • | | The Fund closely tracked the performance of the S&P 500 Index over the 12-month period ending September 30, 2014. |
| | • | | The Fund holds all 500 stocks included in the Index in approximately the same proportions. |
| | • | | The Fund held S&P 500 stock index futures to maintain exposure to equities and provide portfolio liquidity. Futures had a small negative impact on performance over the year. |
What were market conditions like?
| | • | | In the fourth quarter 2013, at the beginning of the reporting period, US equities posted solid gains, capping off a banner year. Market volatility was modest, despite a partial government shutdown during October. In December, amid stronger economic growth, the Federal Reserve (the Fed) announced it would start trimming its quantitative easing bond buying program in January 2014. Investors greeted the news with enthusiasm and stocks rallied. |
| | • | | US equities generated a small gain during the first quarter of 2014, slogging through a harsh winter and fighting economic headwinds. In January, weaker manufacturing growth in China led to a steep selloff. Although stock prices rebounded and hit a new record high in February, they stumbled during March due to geopolitical tensions in Crimea and Ukraine. Slowing US economic growth, driven by unusually bad winter weather, also dampened stock market performance. In addition, investors reacted unfavorably to suggestions by new Fed chair Janet Yellen that the Fed might hike interest rates shortly after the end of its quantitative easing program. |
| | • | | During the second quarter of 2014, US equities posted modest gains. The quarter began with a new high during the first week of April, but fell back on continued geopolitical worries, largely about Ukraine, and uncertainty about corporate earnings. Market sentiment was more positive in May, leading to a series of new market highs. In June, stocks continued their advance, posting record highs even as the Fed continued to taper its quantitative easing program. Later in the month, a militant insurgency in Iraq briefly slowed market momentum and put oil markets on edge. Also, during the second quarter, first-quarter US economic growth was revised downward to its worst contraction in five years. |
| | |
| 6 | | Visit our website at www.prudentialfunds.com |
| | • | | US equities turned in tepid performance during the third quarter of 2014. A “buy-on-the-dip” sentiment prevailed, driven by solid fundamentals and robust economic growth. US stocks seemed mostly immune to intensifying geopolitical conflicts in the Middle East and Ukraine, hitting a new record high during August. In September, the market grew somewhat more volatile as investors speculated that the Fed might raise interest rates sooner rather than later following the end of its quantitative easing program in October. |
| | | | |
| Prudential Stock Index Fund | | | 7 | |
Fees and Expenses (Unaudited)
As a shareholder of the Fund, you incur two types of costs: (1) transaction costs, including sales charges (loads) on purchase payments and redemptions, as applicable, and (2) ongoing costs, including management fees, distribution and/or service (12b-1) fees, and other Fund expenses, as applicable. This example is intended to help you understand your ongoing costs (in dollars) of investing in the Fund and to compare these costs with the ongoing costs of investing in other mutual funds.
The example is based on an investment of $1,000 invested on April 1, 2014, at the beginning of the period, and held through the six-month period ended September 30, 2014. The example is for illustrative purposes only; you should consult the Prospectus for information on initial and subsequent minimum investment requirements.
Actual Expenses
The first line for each share class in the table on the following page provides information about actual account values and actual expenses. You may use the information on this line, together with the amount you invested, to estimate the expenses that you paid over the period. Simply divide your account value by $1,000 (for example, an $8,600 account value ÷ $1,000 = 8.6), then multiply the result by the number on the first line under the heading “Expenses Paid During the Six-Month Period” to estimate the expenses you paid on your account during this period.
Hypothetical Example for Comparison Purposes
The second line for each share class in the table on the following page provides information about hypothetical account values and hypothetical expenses based on the Fund’s actual expense ratio and an assumed rate of return of 5% per year before expenses, which is not the Fund’s actual return. The hypothetical account values and expenses may not be used to estimate the actual ending account balance or expenses you paid for the period. You may use this information to compare the ongoing costs of investing in the Fund and other funds. To do so, compare this 5% hypothetical example with the 5% hypothetical examples that appear in the shareholder reports of the other funds.
The Fund’s transfer agent may charge additional fees to holders of certain accounts that are not included in the expenses shown in the table on the following page. These fees apply to individual retirement accounts (IRAs) and Section 403(b) accounts. As of the close of the six-month period covered by the table, IRA fees included an annual maintenance fee of $15 per account (subject to a maximum annual maintenance fee of $25 for all accounts held by the same shareholder). Section 403(b) accounts are charged an annual $25 fiduciary maintenance fee. Some of the fees may vary in amount, or may be waived, based on your total account balance or the number of Prudential Investment funds, including the Fund, that you own. You should consider
| | |
| 8 | | Visit our website at www.prudentialfunds.com |
the additional fees that were charged to your Fund account over the six-month period when you estimate the total ongoing expenses paid over the period and the impact of these fees on your ending account value, as these additional expenses are not reflected in the information provided in the expense table. Additional fees have the effect of reducing investment returns.
Please note that the expenses shown in the table are meant to highlight your ongoing costs only and do not reflect any transactional costs such as sales charges (loads). Therefore, the second line for each share class in the table is useful in comparing ongoing costs only and will not help you determine the relative total costs of owning different funds. In addition, if these transactional costs were included, your costs would have been higher.
| | | | | | | | | | | | | | | | | | |
Prudential Stock
Index Fund | | Beginning Account
Value
April 1, 2014 | | | Ending Account
Value
September 30, 2014 | | | Annualized
Expense Ratio
Based on the
Six-Month Period | | | Expenses Paid
During the
Six-Month Period* | |
| | | | | | | | | | | | | | | | | | |
| Class A | | Actual | | $ | 1,000.00 | | | $ | 1,061.50 | | | | 0.55 | % | | $ | 2.84 | |
| | | Hypothetical | | $ | 1,000.00 | | | $ | 1,022.31 | | | | 0.55 | % | | $ | 2.79 | |
| | | | | | | | | | | | | | | | | | |
| Class C | | Actual | | $ | 1,000.00 | | | $ | 1,058.20 | | | | 1.16 | % | | $ | 5.99 | |
| | | Hypothetical | | $ | 1,000.00 | | | $ | 1,019.25 | | | | 1.16 | % | | $ | 5.87 | |
| | | | | | | | | | | | | | | | | | |
| Class I | | Actual | | $ | 1,000.00 | | | $ | 1,063.60 | | | | 0.20 | % | | $ | 1.03 | |
| | | Hypothetical | | $ | 1,000.00 | | | $ | 1,024.07 | | | | 0.20 | % | | $ | 1.01 | |
| | | | | | | | | | | | | | | | | | |
| Class Z | | Actual | | $ | 1,000.00 | | | $ | 1,062.90 | | | | 0.26 | % | | $ | 1.34 | |
| | | Hypothetical | | $ | 1,000.00 | | | $ | 1,023.76 | | | | 0.26 | % | | $ | 1.32 | |
*Fund expenses (net of fee waivers or subsidies, if any) for each share class are equal to the annualized expense ratio for each share class (provided in the table), multiplied by the average account value over the period, multiplied by the 183 days in the six-month period ended September 30, 2014, and divided by the 365 days in the Fund’s fiscal year ended September 30, 2014 (to reflect the six-month period). Expenses presented in the table include the expenses of any underlying portfolios in which the Fund may invest.
| | | | |
| Prudential Stock Index Fund | | | 9 | |
Fees and Expenses (continued)
The Fund’s annual expense ratios for the year ended September 30, 2014, are as follows:
| | | | | | | | |
| Class | | Gross Operating Expenses | | | Net Operating Expenses | |
A | | | 0.67 | % | | | 0.53 | % |
C | | | 1.30 | | | | 1.16 | |
I | | | 0.33 | | | | 0.19 | |
Z | | | 0.39 | | | | 0.25 | |
Net operating expenses shown above reflect any fee waivers and/or expense reimbursements. Additional information on Fund expenses and any fee waivers and/or expense reimbursements can be found in the “Financial Highlights” tables in this report and in the Notes to the Financial Statements in this report.
| | |
| 10 | | Visit our website at www.prudentialfunds.com |
Portfolio of Investments
as of September 30, 2014
| | | | | | | | |
| Description | | Shares | | | Value (Note 1) | |
LONG-TERM INVESTMENTS 96.2% | | | | | | | | |
| | |
COMMON STOCKS | | | | | | | | |
| | |
Aerospace & Defense 2.5% | | | | | | | | |
Boeing Co. (The) | | | 33,784 | | | $ | 4,303,407 | |
General Dynamics Corp. | | | 16,412 | | | | 2,085,801 | |
Honeywell International, Inc. | | | 39,515 | | | | 3,679,637 | |
L-3 Communications Holdings, Inc. | | | 4,300 | | | | 511,356 | |
Lockheed Martin Corp. | | | 13,456 | | | | 2,459,488 | |
Northrop Grumman Corp. | | | 10,948 | | | | 1,442,508 | |
Precision Castparts Corp. | | | 7,380 | | | | 1,748,174 | |
Raytheon Co. | | | 15,844 | | | | 1,610,067 | |
Rockwell Collins, Inc. | | | 6,863 | | | | 538,746 | |
Textron, Inc. | | | 13,134 | | | | 472,693 | |
United Technologies Corp. | | | 42,540 | | | | 4,492,224 | |
| | | | | | | | |
| | | | | | | 23,344,101 | |
| | |
Air Freight & Logistics 0.7% | | | | | | | | |
C.H. Robinson Worldwide, Inc. | | | 7,700 | | | | 510,664 | |
Expeditors International of Washington, Inc. | | | 10,300 | | | | 417,974 | |
FedEx Corp. | | | 13,716 | | | | 2,214,448 | |
United Parcel Service, Inc. (Class B Stock) | | | 35,300 | | | | 3,469,637 | |
| | | | | | | | |
| | | | | | | 6,612,723 | |
| | |
Airlines 0.3% | | | | | | | | |
Delta Air Lines, Inc. | | | 42,500 | | | | 1,536,375 | |
Southwest Airlines Co. | | | 34,174 | | | | 1,154,056 | |
| | | | | | | | |
| | | | | | | 2,690,431 | |
| | |
Auto Components 0.4% | | | | | | | | |
BorgWarner, Inc. | | | 11,500 | | | | 605,015 | |
Delphi Automotive PLC (United Kingdom) | | | 14,400 | | | | 883,296 | |
Goodyear Tire & Rubber Co. (The) | | | 13,771 | | | | 311,018 | |
Johnson Controls, Inc. | | | 33,556 | | | | 1,476,464 | |
| | | | | | | | |
| | | | | | | 3,275,793 | |
| | |
Automobiles 0.6% | | | | | | | | |
Ford Motor Co. | | | 197,338 | | | | 2,918,629 | |
General Motors Co. | | | 64,900 | | | | 2,072,906 | |
Harley-Davidson, Inc. | | | 11,300 | | | | 657,660 | |
| | | | | | | | |
| | | | | | | 5,649,195 | |
See Notes to Financial Statements.
| | | | |
| Prudential Stock Index Fund | | | 11 | |
Portfolio of Investments
as of September 30, 2014 continued
| | | | | | | | |
| Description | | Shares | | | Value (Note 1) | |
COMMON STOCKS (Continued) | | | | | | | | |
| | |
Banks 5.8% | | | | | | | | |
Bank of America Corp. | | | 527,095 | | | $ | 8,986,970 | |
BB&T Corp. | | | 36,258 | | | | 1,349,160 | |
Citigroup, Inc. | | | 152,415 | | | | 7,898,145 | |
Comerica, Inc. | | | 8,361 | | | | 416,879 | |
Fifth Third Bancorp | | | 40,473 | | | | 810,270 | |
Huntington Bancshares, Inc. | | | 39,829 | | | | 387,536 | |
JPMorgan Chase & Co. | | | 190,393 | | | | 11,469,274 | |
KeyCorp | | | 43,035 | | | | 573,657 | |
M&T Bank Corp.(a) | | | 6,500 | | | | 801,385 | |
PNC Financial Services Group, Inc. (The) | | | 27,202 | | | | 2,327,947 | |
Regions Financial Corp. | | | 67,574 | | | | 678,443 | |
SunTrust Banks, Inc. | | | 26,483 | | | | 1,007,149 | |
U.S. Bancorp | | | 90,895 | | | | 3,802,138 | |
Wells Fargo & Co. | | | 239,416 | | | | 12,418,508 | |
Zions Bancorporation(a) | | | 9,000 | | | | 261,540 | |
| | | | | | | | |
| | | | | | | 53,189,001 | |
| | |
Beverages 2.1% | | | | | | | | |
Brown-Forman Corp. (Class B Stock) | | | 8,130 | | | | 733,489 | |
Coca-Cola Co. (The) | | | 196,964 | | | | 8,402,484 | |
Coca-Cola Enterprises, Inc. | | | 11,200 | | | | 496,832 | |
Constellation Brands, Inc. (Class A Stock)* | | | 8,800 | | | | 767,008 | |
Dr. Pepper Snapple Group, Inc. | | | 9,800 | | | | 630,238 | |
Molson Coors Brewing Co. (Class B Stock) | | | 7,794 | | | | 580,185 | |
Monster Beverage Corp.* | | | 6,900 | | | | 632,523 | |
PepsiCo, Inc. | | | 76,351 | | | | 7,107,515 | |
| | | | | | | | |
| | | | | | | 19,350,274 | |
| | |
Biotechnology 2.8% | | | | | | | | |
Alexion Pharmaceuticals, Inc.* | | | 10,200 | | | | 1,691,364 | |
Amgen, Inc. | | | 38,046 | | | | 5,343,941 | |
Biogen Idec, Inc.* | | | 12,020 | | | | 3,976,336 | |
Celgene Corp.* | | | 40,400 | | | | 3,829,112 | |
Gilead Sciences, Inc.* | | | 76,500 | | | | 8,143,425 | |
Regeneron Pharmaceuticals, Inc.*(a) | | | 3,900 | | | | 1,406,028 | |
Vertex Pharmaceuticals, Inc.* | | | 11,800 | | | | 1,325,258 | |
| | | | | | | | |
| | | | | | | 25,715,464 | |
See Notes to Financial Statements.
| | | | | | | | |
| Description | | Shares | | | Value (Note 1) | |
COMMON STOCKS (Continued) | | | | | | | | |
| | |
Building Products 0.1% | | | | | | | | |
Allegion PLC | | | 4,233 | | | $ | 201,660 | |
Masco Corp. | | | 17,926 | | | | 428,790 | |
| | | | | | | | |
| | | | | | | 630,450 | |
| | |
Capital Markets 2.2% | | | | | | | | |
Affiliated Managers Group, Inc.* | | | 2,700 | | | | 540,972 | |
Ameriprise Financial, Inc. | | | 9,571 | | | | 1,180,870 | |
Bank of New York Mellon Corp. (The) | | | 57,338 | | | | 2,220,701 | |
BlackRock, Inc. | | | 6,450 | | | | 2,117,664 | |
Charles Schwab Corp. (The) | | | 57,111 | | | | 1,678,492 | |
E*TRADE Financial Corp.* | | | 13,720 | | | | 309,935 | |
Franklin Resources, Inc. | | | 20,442 | | | | 1,116,338 | |
Goldman Sachs Group, Inc. (The) | | | 21,000 | | | | 3,854,970 | |
Invesco Ltd. | | | 21,600 | | | | 852,768 | |
Legg Mason, Inc. | | | 5,300 | | | | 271,148 | |
Morgan Stanley | | | 75,236 | | | | 2,600,908 | |
Northern Trust Corp.(a) | | | 11,262 | | | | 766,154 | |
State Street Corp. | | | 21,862 | | | | 1,609,262 | |
T. Rowe Price Group, Inc. | | | 13,100 | | | | 1,027,040 | |
| | | | | | | | |
| | | | | | | 20,147,222 | |
| | |
Chemicals 2.5% | | | | | | | | |
Air Products & Chemicals, Inc. | | | 9,632 | | | | 1,253,894 | |
Airgas, Inc. | | | 3,400 | | | | 376,210 | |
CF Industries Holdings, Inc. | | | 2,700 | | | | 753,894 | |
Dow Chemical Co. (The) | | | 57,936 | | | | 3,038,164 | |
E.I. du Pont de Nemours & Co.(a) | | | 46,044 | | | | 3,304,117 | |
Eastman Chemical Co. | | | 7,686 | | | | 621,720 | |
Ecolab, Inc. | | | 13,682 | | | | 1,571,104 | |
FMC Corp. | | | 6,700 | | | | 383,173 | |
International Flavors & Fragrances, Inc. | | | 4,175 | | | | 400,299 | |
LyondellBasell Industries NV (Class A Stock) | | | 21,200 | | | | 2,303,592 | |
Monsanto Co. | | | 26,384 | | | | 2,968,464 | |
Mosaic Co. (The) | | | 16,000 | | | | 710,560 | |
PPG Industries, Inc. | | | 7,074 | | | | 1,391,739 | |
Praxair, Inc. | | | 14,908 | | | | 1,923,132 | |
Sherwin-Williams Co. (The) | | | 4,416 | | | | 967,060 | |
Sigma-Aldrich Corp. | | | 5,532 | | | | 752,407 | |
| | | | | | | | |
| | | | | | | 22,719,529 | |
See Notes to Financial Statements.
| | | | |
| Prudential Stock Index Fund | | | 13 | |
Portfolio of Investments
as of September 30, 2014 continued
| | | | | | | | |
| Description | | Shares | | | Value (Note 1) | |
COMMON STOCKS (Continued) | | | | | | | | |
| | |
Commercial Services & Supplies 0.5% | | | | | | | | |
ADT Corp. (The)(a) | | | 8,300 | | | $ | 294,318 | |
Cintas Corp.(a) | | | 5,400 | | | | 381,186 | |
Iron Mountain, Inc. | | | 7,372 | | | | 240,696 | |
Pitney Bowes, Inc. | | | 9,625 | | | | 240,529 | |
Republic Services, Inc. | | | 12,475 | | | | 486,774 | |
Stericycle, Inc.* | | | 4,500 | | | | 524,520 | |
Tyco International Ltd. | | | 23,200 | | | | 1,034,024 | |
Waste Management, Inc. | | | 21,613 | | | | 1,027,266 | |
| | | | | | | | |
| | | | | | | 4,229,313 | |
| | |
Communications Equipment 1.6% | | | | | | | | |
Cisco Systems, Inc. | | | 257,744 | | | | 6,487,417 | |
F5 Networks, Inc.* | | | 3,800 | | | | 451,212 | |
Harris Corp. | | | 5,700 | | | | 378,480 | |
Juniper Networks, Inc. | | | 22,700 | | | | 502,805 | |
Motorola Solutions, Inc. | | | 11,616 | | | | 735,060 | |
QUALCOMM, Inc. | | | 84,900 | | | | 6,347,973 | |
| | | | | | | | |
| | | | | | | 14,902,947 | |
| | |
Construction & Engineering 0.1% | | | | | | | | |
Fluor Corp. | | | 8,074 | | | | 539,262 | |
Jacobs Engineering Group, Inc.*(a) | | | 6,700 | | | | 327,094 | |
Quanta Services, Inc.* | | | 10,700 | | | | 388,303 | |
| | | | | | | | |
| | | | | | | 1,254,659 | |
| | |
Construction Materials 0.1% | | | | | | | | |
Martin Marietta Materials, Inc. | | | 3,200 | | | | 412,608 | |
Vulcan Materials Co. | | | 6,500 | | | | 391,495 | |
| | | | | | | | |
| | | | | | | 804,103 | |
| | |
Consumer Finance 0.9% | | | | | | | | |
American Express Co. | | | 45,759 | | | | 4,005,743 | |
Capital One Financial Corp. | | | 28,966 | | | | 2,364,205 | |
Discover Financial Services | | | 23,218 | | | | 1,495,007 | |
Navient Corp. | | | 19,492 | | | | 345,203 | |
| | | | | | | | |
| | | | | | | 8,210,158 | |
| | |
Containers & Packaging 0.2% | | | | | | | | |
Avery Dennison Corp. | | | 4,768 | | | | 212,891 | |
Ball Corp. | | | 6,664 | | | | 421,631 | |
See Notes to Financial Statements.
| | | | | | | | |
| Description | | Shares | | | Value (Note 1) | |
COMMON STOCKS (Continued) | | | | | | | | |
| | |
Containers & Packaging (cont’d.) | | | | | | | | |
Bemis Co., Inc. | | | 5,310 | | | $ | 201,886 | |
MeadWestvaco Corp. | | | 8,735 | | | | 357,611 | |
Owens-Illinois, Inc.* | | | 6,700 | | | | 174,535 | |
Sealed Air Corp.(a) | | | 9,336 | | | | 325,640 | |
| | | | | | | | |
| | | | | | | 1,694,194 | |
| | |
Distributors 0.1% | | | | | | | | |
Genuine Parts Co. | | | 7,799 | | | | 684,050 | |
| | |
Diversified Consumer Services | | | | | | | | |
H&R Block, Inc. | | | 13,620 | | | | 422,356 | |
| | |
Diversified Financial Services 1.9% | | | | | | | | |
Berkshire Hathaway, Inc. (Class B Stock)* | | | 91,400 | | | | 12,625,996 | |
CME Group, Inc. | | | 16,000 | | | | 1,279,280 | |
Intercontinental Exchange, Inc. | | | 5,888 | | | | 1,148,454 | |
Leucadia National Corp. | | | 13,700 | | | | 326,608 | |
McGraw Hill Financial, Inc. | | | 13,700 | | | | 1,156,965 | |
Moody’s Corp. | | | 9,376 | | | | 886,032 | |
NASDAQ OMX Group, Inc. (The) | | | 5,900 | | | | 250,278 | |
| | | | | | | | |
| | | | | | | 17,673,613 | |
| | |
Diversified Telecommunication Services 2.3% | | | | | | | | |
AT&T, Inc. | | | 261,131 | | | | 9,202,256 | |
CenturyLink, Inc. | | | 27,908 | | | | 1,141,158 | |
Frontier Communications Corp. | | | 47,260 | | | | 307,663 | |
Verizon Communications, Inc. | | | 208,133 | | | | 10,404,569 | |
Windstream Holdings, Inc. | | | 27,577 | | | | 297,280 | |
| | | | | | | | |
| | | | | | | 21,352,926 | |
| | |
Electric Utilities 1.6% | | | | | | | | |
American Electric Power Co., Inc. | | | 24,891 | | | | 1,299,559 | |
Duke Energy Corp. | | | 35,339 | | | | 2,642,297 | |
Edison International | | | 16,362 | | | | 914,963 | |
Entergy Corp. | | | 8,815 | | | | 681,664 | |
Exelon Corp. | | | 43,212 | | | | 1,473,097 | |
FirstEnergy Corp. | | | 21,077 | | | | 707,555 | |
NextEra Energy, Inc. | | | 21,872 | | | | 2,053,343 | |
Northeast Utilities | | | 16,200 | | | | 717,660 | |
Pepco Holdings, Inc. | | | 11,600 | | | | 310,416 | |
See Notes to Financial Statements.
| | | | |
| Prudential Stock Index Fund | | | 15 | |
Portfolio of Investments
as of September 30, 2014 continued
| | | | | | | | |
| Description | | Shares | | | Value (Note 1) | |
COMMON STOCKS (Continued) | | | | | | | | |
| | |
Electric Utilities (cont’d.) | | | | | | | | |
Pinnacle West Capital Corp. | | | 5,200 | | | $ | 284,128 | |
PPL Corp. | | | 33,552 | | | | 1,101,848 | |
Southern Co. (The) | | | 44,615 | | | | 1,947,445 | |
Xcel Energy, Inc. | | | 24,383 | | | | 741,243 | |
| | | | | | | | |
| | | | | | | 14,875,218 | |
| | |
Electrical Equipment 0.6% | | | | | | | | |
AMETEK, Inc. | | | 12,000 | | | | 602,520 | |
Eaton Corp. PLC | | | 24,293 | | | | 1,539,447 | |
Emerson Electric Co. | | | 35,550 | | | | 2,224,719 | |
Rockwell Automation, Inc. | | | 7,163 | | | | 787,071 | |
Roper Industries, Inc. | | | 5,100 | | | | 746,079 | |
| | | | | | | | |
| | | | | | | 5,899,836 | |
| | |
Electronic Equipment, Instruments & Components 0.4% | | | | | | | | |
Amphenol Corp. (Class A Stock) | | | 8,000 | | | | 798,880 | |
Corning, Inc. | | | 63,697 | | | | 1,231,900 | |
FLIR Systems, Inc. | | | 7,200 | | | | 225,648 | |
Jabil Circuit, Inc. | | | 8,600 | | | | 173,462 | |
TE Connectivity Ltd. (Switzerland) | | | 20,700 | | | | 1,144,503 | |
| | | | | | | | |
| | | | | | | 3,574,393 | |
| | |
Energy Equipment & Services 1.8% | | | | | | | | |
Baker Hughes, Inc. | | | 22,345 | | | | 1,453,766 | |
Cameron International Corp.* | | | 10,100 | | | | 670,438 | |
Diamond Offshore Drilling, Inc.(a) | | | 3,600 | | | | 123,372 | |
Ensco PLC (Class A Stock)(a) | | | 11,500 | | | | 475,065 | |
FMC Technologies, Inc.* | | | 12,100 | | | | 657,151 | |
Halliburton Co. | | | 42,222 | | | | 2,723,741 | |
Helmerich & Payne, Inc. | | | 5,500 | | | | 538,285 | |
Nabors Industries Ltd. | | | 12,900 | | | | 293,604 | |
National Oilwell Varco, Inc. | | | 21,700 | | | | 1,651,370 | |
Noble Corp. PLC(a) | | | 12,200 | | | | 271,084 | |
Schlumberger Ltd. | | | 65,641 | | | | 6,675,033 | |
Transocean Ltd.(a) | | | 17,000 | | | | 543,490 | |
| | | | | | | | |
| | | | | | | 16,076,399 | |
| | |
Food & Staples Retailing 2.2% | | | | | | | | |
Costco Wholesale Corp. | | | 22,108 | | | | 2,770,575 | |
CVS Health Corp. | | | 58,999 | | | | 4,695,730 | |
See Notes to Financial Statements.
| | | | | | | | |
| Description | | Shares | | | Value (Note 1) | |
COMMON STOCKS (Continued) | | | | | | | | |
| | |
Food & Staples Retailing (cont’d.) | | | | | | | | |
Kroger Co. (The) | | | 25,634 | | | $ | 1,332,968 | |
Safeway, Inc. | | | 11,500 | | | | 394,450 | |
Sysco Corp. | | | 28,780 | | | | 1,092,201 | |
Wal-Mart Stores, Inc. | | | 80,426 | | | | 6,150,176 | |
Walgreen Co. | | | 44,178 | | | | 2,618,430 | |
Whole Foods Market, Inc. | | | 18,600 | | | | 708,846 | |
| | | | | | | | |
| | | | | | | 19,763,376 | |
| | |
Food Products 1.5% | | | | | | | | |
Archer-Daniels-Midland Co. | | | 33,459 | | | | 1,709,755 | |
Campbell Soup Co.(a) | | | 8,747 | | | | 373,759 | |
ConAgra Foods, Inc. | | | 20,243 | | | | 668,829 | |
General Mills, Inc. | | | 30,344 | | | | 1,530,855 | |
Hershey Co. (The) | | | 7,516 | | | | 717,252 | |
Hormel Foods Corp. | | | 6,700 | | | | 344,313 | |
J.M. Smucker Co. (The) | | | 5,200 | | | | 514,748 | |
Kellogg Co. | | | 12,870 | | | | 792,792 | |
Keurig Green Mountain, Inc. | | | 6,300 | | | | 819,819 | |
Kraft Foods Group, Inc. | | | 29,855 | | | | 1,683,822 | |
McCormick & Co., Inc.(a) | | | 6,400 | | | | 428,160 | |
Mead Johnson Nutrition Co. | | | 10,165 | | | | 978,076 | |
Mondelez International, Inc. (Class A Stock) | | | 84,566 | | | | 2,897,654 | |
Tyson Foods, Inc. (Class A Stock) | | | 14,800 | | | | 582,676 | |
| | | | | | | | |
| | | | | | | 14,042,510 | |
| | |
Gas Utilities | | | | | | | | |
AGL Resources, Inc. | | | 5,630 | | | | 289,044 | |
| | |
Health Care Equipment & Supplies 2.0% | | | | | | | | |
Abbott Laboratories | | | 75,774 | | | | 3,151,441 | |
Baxter International, Inc. | | | 27,274 | | | | 1,957,455 | |
Becton, Dickinson and Co. | | | 9,812 | | | | 1,116,704 | |
Boston Scientific Corp.* | | | 66,272 | | | | 782,672 | |
C.R. Bard, Inc. | | | 3,912 | | | | 558,282 | |
CareFusion Corp.* | | | 10,086 | | | | 456,391 | |
Covidien PLC | | | 22,800 | | | | 1,972,428 | |
DENTSPLY International, Inc. | | | 7,200 | | | | 328,320 | |
Edwards Lifesciences Corp.* | | | 5,400 | | | | 551,610 | |
Intuitive Surgical, Inc.* | | | 1,850 | | | | 854,367 | |
Medtronic, Inc. | | | 50,058 | | | | 3,101,093 | |
See Notes to Financial Statements.
| | | | |
| Prudential Stock Index Fund | | | 17 | |
Portfolio of Investments
as of September 30, 2014 continued
| | | | | | | | |
| Description | | Shares | | | Value (Note 1) | |
COMMON STOCKS (Continued) | | | | | | | | |
| | |
Health Care Equipment & Supplies (cont’d.) | | | | | | | | |
St. Jude Medical, Inc. | | | 14,364 | | | $ | 863,707 | |
Stryker Corp. | | | 15,200 | | | | 1,227,400 | |
Varian Medical Systems, Inc.*(a) | | | 5,200 | | | | 416,624 | |
Zimmer Holdings, Inc. | | | 8,511 | | | | 855,781 | |
| | | | | | | | |
| | | | | | | 18,194,275 | |
| | |
Health Care Providers & Services 2.1% | | | | | | | | |
Aetna, Inc. | | | 18,144 | | | | 1,469,664 | |
AmerisourceBergen Corp. | | | 11,100 | | | | 858,030 | |
Cardinal Health, Inc. | | | 17,173 | | | | 1,286,601 | |
Cigna Corp. | | | 13,491 | | | | 1,223,499 | |
DaVita HealthCare Partners, Inc.* | | | 9,200 | | | | 672,888 | |
Express Scripts Holding Co.* | | | 37,570 | | | | 2,653,569 | |
Humana, Inc. | | | 8,010 | | | | 1,043,623 | |
Laboratory Corp. of America Holdings* | | | 4,500 | | | | 457,875 | |
McKesson Corp. | | | 11,776 | | | | 2,292,434 | |
Patterson Cos., Inc. | | | 3,500 | | | | 145,005 | |
Quest Diagnostics, Inc.(a) | | | 7,000 | | | | 424,760 | |
Tenet Healthcare Corp.*(a) | | | 4,743 | | | | 281,687 | |
UnitedHealth Group, Inc. | | | 49,448 | | | | 4,264,890 | |
Universal Health Services, Inc. (Class B Stock) | | | 3,800 | | | | 397,100 | |
WellPoint, Inc. | | | 13,900 | | | | 1,662,718 | |
| | | | | | | | |
| | | | | | | 19,134,343 | |
| | |
Health Care Technology 0.1% | | | | | | | | |
Cerner Corp.* | | | 14,900 | | | | 887,593 | |
| | |
Hotels, Restaurants & Leisure 1.6% | | | | | | | | |
Carnival Corp. | | | 21,800 | | | | 875,706 | |
Chipotle Mexican Grill, Inc.* | | | 1,590 | | | | 1,059,878 | |
Darden Restaurants, Inc.(a) | | | 6,753 | | | | 347,510 | |
Marriott International, Inc. (Class A Stock) | | | 11,170 | | | | 780,783 | |
McDonald’s Corp. | | | 49,730 | | | | 4,714,901 | |
Starbucks Corp. | | | 37,500 | | | | 2,829,750 | |
Starwood Hotels & Resorts Worldwide, Inc. | | | 9,600 | | | | 798,816 | |
Wyndham Worldwide Corp. | | | 6,651 | | | | 540,460 | |
Wynn Resorts Ltd.(a) | | | 4,200 | | | | 785,736 | |
Yum! Brands, Inc. | | | 22,364 | | | | 1,609,761 | |
| | | | | | | | |
| | | | | | | 14,343,301 | |
See Notes to Financial Statements.
| | | | | | | | |
| Description | | Shares | | | Value (Note 1) | |
COMMON STOCKS (Continued) | | | | | | | | |
| | |
Household Durables 0.3% | | | | | | | | |
D.R. Horton, Inc. | | | 16,100 | | | $ | 330,372 | |
Garmin Ltd.(a) | | | 6,200 | | | | 322,338 | |
Harman International Industries, Inc. | | | 3,400 | | | | 333,336 | |
Leggett & Platt, Inc.(a) | | | 5,700 | | | | 199,044 | |
Lennar Corp. (Class A Stock)(a) | | | 8,200 | | | | 318,406 | |
Mohawk Industries, Inc.* | | | 2,900 | | | | 390,978 | |
Newell Rubbermaid, Inc. | | | 12,827 | | | | 441,377 | |
PulteGroup, Inc. | | | 14,511 | | | | 256,265 | |
Whirlpool Corp. | | | 3,985 | | | | 580,415 | |
| | | | | | | | |
| | | | | | | 3,172,531 | |
| | |
Household Products 1.8% | | | | | | | | |
Clorox Co. (The)(a) | | | 6,232 | | | | 598,522 | |
Colgate-Palmolive Co. | | | 44,160 | | | | 2,880,115 | |
Kimberly-Clark Corp. | | | 19,216 | | | | 2,067,065 | |
Procter & Gamble Co. (The) | | | 135,723 | | | | 11,365,444 | |
| | | | | | | | |
| | | | | | | 16,911,146 | |
| | |
Independent Power & Renewable Electricity Producers 0.1% | | | | | | | | |
AES Corp. (The) | | | 31,200 | | | | 442,416 | |
NRG Energy, Inc. | | | 15,600 | | | | 475,488 | |
| | | | | | | | |
| | | | | | | 917,904 | |
| | |
Industrial Conglomerates 2.2% | | | | | | | | |
3M Co. | | | 32,198 | | | | 4,561,813 | |
Danaher Corp. | | | 30,400 | | | | 2,309,792 | |
General Electric Co. | | | 504,572 | | | | 12,927,134 | |
| | | | | | | | |
| | | | | | | 19,798,739 | |
| | |
Insurance 2.7% | | | | | | | | |
ACE Ltd. | | | 17,000 | | | | 1,782,790 | |
Aflac, Inc. | | | 23,000 | | | | 1,339,750 | |
Allstate Corp. (The) | | | 21,708 | | | | 1,332,220 | |
American International Group, Inc. | | | 72,401 | | | | 3,911,102 | |
Aon PLC | | | 15,189 | | | | 1,331,620 | |
Assurant, Inc. | | | 3,900 | | | | 250,770 | |
Chubb Corp. (The) | | | 12,268 | | | | 1,117,369 | |
Cincinnati Financial Corp. | | | 7,507 | | | | 353,204 | |
Genworth Financial, Inc. (Class A Stock)* | | | 23,300 | | | | 305,230 | |
Hartford Financial Services Group, Inc. (The) | | | 22,153 | | | | 825,199 | |
See Notes to Financial Statements.
| | | | |
| Prudential Stock Index Fund | | | 19 | |
Portfolio of Investments
as of September 30, 2014 continued
| | | | | | | | |
| Description | | Shares | | | Value (Note 1) | |
COMMON STOCKS (Continued) | | | | | | | | |
| | |
Insurance (cont’d.) | | | | | | | | |
Lincoln National Corp. | | | 13,251 | | | $ | 709,989 | |
Loews Corp. | | | 15,117 | | | | 629,774 | |
Marsh & McLennan Cos., Inc. | | | 27,940 | | | | 1,462,380 | |
MetLife, Inc. | | | 56,900 | | | | 3,056,668 | |
Principal Financial Group, Inc. | | | 14,100 | | | | 739,827 | |
Progressive Corp. (The) | | | 26,516 | | | | 670,325 | |
Prudential Financial, Inc.(b) | | | 23,800 | | | | 2,092,972 | |
Torchmark Corp. | | | 6,933 | | | | 363,081 | |
Travelers Cos., Inc. (The) | | | 17,111 | | | | 1,607,407 | |
Unum Group | | | 12,626 | | | | 434,082 | |
XL Group PLC (Ireland) | | | 13,100 | | | | 434,527 | |
| | | | | | | | |
| | | | | | | 24,750,286 | |
| | |
Internet & Catalog Retail 1.3% | | | | | | | | |
Amazon.com, Inc.* | | | 18,770 | | | | 6,052,199 | |
Expedia, Inc. | | | 4,800 | | | | 420,576 | |
Netflix, Inc.* | | | 3,100 | | | | 1,398,658 | |
Priceline Group, Inc. (The)* | | | 2,690 | | | | 3,116,580 | |
TripAdvisor, Inc.*(a) | | | 5,700 | | | | 521,094 | |
| | | | | | | | |
| | | | | | | 11,509,107 | |
| | |
Internet Software & Services 3.3% | | | | | | | | |
Akamai Technologies, Inc.* | | | 9,100 | | | | 544,180 | |
eBay, Inc.* | | | 57,600 | | | | 3,261,888 | |
Facebook, Inc. (Class A Stock)* | | | 97,300 | | | | 7,690,592 | |
Google, Inc. (Class A Stock)* | | | 14,280 | | | | 8,402,495 | |
Google, Inc. (Class C Stock)* | | | 14,290 | | | | 8,250,474 | |
VeriSign, Inc.*(a) | | | 6,100 | | | | 336,232 | |
Yahoo!, Inc.* | | | 47,300 | | | | 1,927,475 | |
| | | | | | | | |
| | | | | | | 30,413,336 | |
| | |
IT Services 3.2% | | | | | | | | |
Accenture PLC (Class A Stock) | | | 31,500 | | | | 2,561,580 | |
Alliance Data Systems Corp.* | | | 2,540 | | | | 630,606 | |
Automatic Data Processing, Inc. | | | 24,078 | | | | 2,000,400 | |
Cognizant Technology Solutions Corp. (Class A Stock)* | | | 30,900 | | | | 1,383,393 | |
Computer Sciences Corp. | | | 7,251 | | | | 443,399 | |
Fidelity National Information Services, Inc. | | | 14,600 | | | | 821,980 | |
Fiserv, Inc.* | | | 12,900 | | | | 833,791 | |
International Business Machines Corp. | | | 46,834 | | | | 8,890,498 | |
MasterCard, Inc. (Class A Stock) | | | 50,300 | | | | 3,718,176 | |
See Notes to Financial Statements.
| | | | | | | | |
| Description | | Shares | | | Value (Note 1) | |
COMMON STOCKS (Continued) | | | | | | | | |
| | |
IT Services (cont’d.) | | | | | | | | |
Paychex, Inc. | | | 16,625 | | | $ | 734,825 | |
Teradata Corp.*(a) | | | 7,600 | | | | 318,592 | |
Total System Services, Inc. | | | 7,971 | | | | 246,782 | |
Visa, Inc. (Class A Stock)(a) | | | 24,880 | | | | 5,308,646 | |
Western Union Co. (The)(a) | | | 25,452 | | | | 408,250 | |
Xerox Corp. | | | 51,600 | | | | 682,668 | |
| | | | | | | | |
| | | | | | | 28,983,586 | |
| | |
Leisure Products 0.1% | | | | | | | | |
Hasbro, Inc. | | | 5,554 | | | | 305,442 | |
Mattel, Inc. | | | 17,113 | | | | 524,514 | |
| | | | | | | | |
| | | | | | | 829,956 | |
| | |
Life Sciences Tools & Services 0.4% | | | | | | | | |
Agilent Technologies, Inc. | | | 16,798 | | | | 957,150 | |
PerkinElmer, Inc. | | | 5,170 | | | | 225,412 | |
Thermo Fisher Scientific, Inc. | | | 20,002 | | | | 2,434,243 | |
Waters Corp.* | | | 4,500 | | | | 446,040 | |
| | | | | | | | |
| | | | | | | 4,062,845 | |
| | |
Machinery 1.5% | | | | | | | | |
Caterpillar, Inc. | | | 31,456 | | | | 3,115,088 | |
Cummins, Inc. | | | 8,716 | | | | 1,150,338 | |
Deere & Co. | | | 18,280 | | | | 1,498,777 | |
Dover Corp. | | | 8,462 | | | | 679,752 | |
Flowserve Corp. | | | 6,900 | | | | 486,588 | |
Illinois Tool Works, Inc. | | | 18,836 | | | | 1,590,135 | |
Ingersoll-Rand PLC | | | 12,400 | | | | 698,864 | |
Joy Global, Inc.(a) | | | 5,300 | | | | 289,062 | |
PACCAR, Inc. | | | 17,864 | | | | 1,016,015 | |
Pall Corp. | | | 5,804 | | | | 485,795 | |
Parker Hannifin Corp. | | | 7,538 | | | | 860,463 | |
Pentair PLC (United Kingdom)(a) | | | 9,946 | | | | 651,364 | |
Snap-on, Inc. | | | 2,942 | | | | 356,217 | |
Stanley Black & Decker, Inc. | | | 8,188 | | | | 727,012 | |
Xylem, Inc. | | | 9,300 | | | | 330,057 | |
| | | | | | | | |
| | | | | | | 13,935,527 | |
| | |
Media 3.4% | | | | | | | | |
Cablevision Systems Corp. (Class A Stock)(a) | | | 8,500 | | | | 148,835 | |
CBS Corp. (Class B Stock) | | | 24,876 | | | | 1,330,866 | |
See Notes to Financial Statements.
| | | | |
| Prudential Stock Index Fund | | | 21 | |
Portfolio of Investments
as of September 30, 2014 continued
| | | | | | | | |
| Description | | Shares | | | Value (Note 1) | |
COMMON STOCKS (Continued) | | | | | | | | |
| | |
Media (cont’d.) | | | | | | | | |
Comcast Corp. (Class A Stock) | | | 130,685 | | | $ | 7,028,239 | |
DIRECTV* | | | 24,300 | | | | 2,102,436 | |
Discovery Communications, Inc. (Class A Stock)* | | | 7,400 | | | | 279,720 | |
Discovery Communications, Inc. (Class C Stock)*(a) | | | 11,700 | | | | 436,176 | |
Gannett Co., Inc. | | | 10,289 | | | | 305,275 | |
Interpublic Group of Cos., Inc. (The) | | | 18,788 | | | | 344,196 | |
News Corp. (Class A Stock)* | | | 24,375 | | | | 398,531 | |
Omnicom Group, Inc. | | | 13,034 | | | | 897,521 | |
Scripps Networks Interactive, Inc. (Class A Stock)(a) | | | 5,600 | | | | 437,304 | |
Time Warner Cable, Inc. | | | 13,981 | | | | 2,006,134 | |
Time Warner, Inc. | | | 43,474 | | | | 3,269,680 | |
Twenty-First Century Fox, Inc. (Class A Stock) | | | 96,300 | | | | 3,302,127 | |
Viacom, Inc. (Class B Stock) | | | 19,476 | | | | 1,498,484 | |
Walt Disney Co. (The) | | | 80,113 | | | | 7,132,460 | |
| | | | | | | | |
| | | | | | | 30,917,984 | |
| | |
Metals & Mining 0.5% | | | | | | | | |
Alcoa, Inc. | | | 57,544 | | | | 925,883 | |
Allegheny Technologies, Inc. | | | 5,218 | | | | 193,588 | |
Freeport-McMoRan, Inc. | | | 52,192 | | | | 1,704,069 | |
Newmont Mining Corp. | | | 24,997 | | | | 576,181 | |
Nucor Corp. | | | 15,912 | | | | 863,703 | |
| | | | | | | | |
| | | | | | | 4,263,424 | |
| | |
Multi-Utilities 1.1% | | | | | | | | |
Ameren Corp. | | | 12,469 | | | | 477,937 | |
CenterPoint Energy, Inc. | | | 20,279 | | | | 496,227 | |
CMS Energy Corp. | | | 13,100 | | | | 388,546 | |
Consolidated Edison, Inc. | | | 14,751 | | | | 835,792 | |
Dominion Resources, Inc. | | | 29,304 | | | | 2,024,613 | |
DTE Energy Co. | | | 8,787 | | | | 668,515 | |
Integrys Energy Group, Inc. | | | 3,708 | | | | 240,353 | |
NiSource, Inc. | | | 15,700 | | | | 643,386 | |
PG&E Corp. | | | 22,552 | | | | 1,015,742 | |
Public Service Enterprise Group, Inc. | | | 24,894 | | | | 927,052 | |
SCANA Corp.(a) | | | 6,800 | | | | 337,348 | |
Sempra Energy | | | 11,698 | | | | 1,232,735 | |
TECO Energy, Inc. | | | 9,700 | | | | 168,586 | |
Wisconsin Energy Corp.(a) | | | 11,500 | | | | 494,500 | |
| | | | | | | | |
| | | | | | | 9,951,332 | |
See Notes to Financial Statements.
| | | | | | | | |
| Description | | Shares | | | Value (Note 1) | |
COMMON STOCKS (Continued) | | | | | | | | |
| | |
Multiline Retail 0.7% | | | | | | | | |
Dollar General Corp.* | | | 14,700 | | | $ | 898,317 | |
Dollar Tree, Inc.* | | | 10,200 | | | | 571,914 | |
Family Dollar Stores, Inc. | | | 5,000 | | | | 386,200 | |
Kohl’s Corp. | | | 9,500 | | | | 579,785 | |
Macy’s, Inc. | | | 18,482 | | | | 1,075,283 | |
Nordstrom, Inc. | | | 7,300 | | | | 499,101 | |
Target Corp. | | | 31,682 | | | | 1,985,828 | |
| | | | | | | | |
| | | | | | | 5,996,428 | |
| | |
Oil, Gas & Consumable Fuels 7.6% | | | | | | | | |
Anadarko Petroleum Corp. | | | 25,736 | | | | 2,610,660 | |
Apache Corp. | | | 19,448 | | | | 1,825,584 | |
Cabot Oil & Gas Corp. | | | 20,800 | | | | 679,952 | |
Chesapeake Energy Corp. | | | 24,700 | | | | 567,853 | |
Chevron Corp. | | | 95,792 | | | | 11,429,901 | |
Cimarex Energy Co. | | | 4,400 | | | | 556,732 | |
ConocoPhillips | | | 61,957 | | | | 4,740,950 | |
CONSOL Energy, Inc. | | | 11,200 | | | | 424,032 | |
Denbury Resources, Inc. | | | 14,800 | | | | 222,444 | |
Devon Energy Corp. | | | 19,200 | | | | 1,309,056 | |
EOG Resources, Inc. | | | 27,700 | | | | 2,742,854 | |
EQT Corp. | | | 7,900 | | | | 723,166 | |
Exxon Mobil Corp. | | | 215,052 | | | | 20,225,640 | |
Hess Corp. | | | 13,334 | | | | 1,257,663 | |
Kinder Morgan, Inc. | | | 33,780 | | | | 1,295,125 | |
Marathon Oil Corp. | | | 33,878 | | | | 1,273,474 | |
Marathon Petroleum Corp. | | | 14,889 | | | | 1,260,652 | |
Murphy Oil Corp. | | | 8,600 | | | | 489,426 | |
Newfield Exploration Co.* | | | 6,800 | | | | 252,076 | |
Noble Energy, Inc. | | | 18,200 | | | | 1,244,152 | |
Occidental Petroleum Corp. | | | 39,576 | | | | 3,805,232 | |
ONEOK, Inc. | | | 10,200 | | | | 668,610 | |
Phillips 66 | | | 28,428 | | | | 2,311,481 | |
Pioneer Natural Resources Co. | | | 7,300 | | | | 1,437,881 | |
QEP Resources, Inc. | | | 9,200 | | | | 283,176 | |
Range Resources Corp. | | | 8,400 | | | | 569,604 | |
Southwestern Energy Co.* | | | 17,800 | | | | 622,110 | |
Spectra Energy Corp. | | | 33,784 | | | | 1,326,360 | |
Tesoro Corp. | | | 6,800 | | | | 414,664 | |
Valero Energy Corp. | | | 26,900 | | | | 1,244,663 | |
See Notes to Financial Statements.
| | | | |
| Prudential Stock Index Fund | | | 23 | |
Portfolio of Investments
as of September 30, 2014 continued
| | | | | | | | |
| Description | | Shares | | | Value (Note 1) | |
COMMON STOCKS (Continued) | | | | | | | | |
| | |
Oil, Gas & Consumable Fuels (cont’d.) | | | | | | | | |
Williams Cos., Inc. (The) | | | 33,792 | | | $ | 1,870,387 | |
| | | | | | | | |
| | | | | | | 69,685,560 | |
| | |
Paper & Forest Products 0.1% | | | | | | | | |
International Paper Co. | | | 21,984 | | | | 1,049,516 | |
| | |
Personal Products 0.1% | | | | | | | | |
Avon Products, Inc. | | | 21,444 | | | | 270,194 | |
Estee Lauder Cos., Inc. (The) (Class A Stock) | | | 11,300 | | | | 844,336 | |
| | | | | | | | |
| | | | | | | 1,114,530 | |
| | |
Pharmaceuticals 6.0% | | | | | | | | |
AbbVie, Inc. | | | 80,274 | | | | 4,636,626 | |
Actavis PLC* | | | 13,283 | | | | 3,204,922 | |
Allergan, Inc. | | | 15,064 | | | | 2,684,254 | |
Bristol-Myers Squibb Co. | | | 83,279 | | | | 4,262,219 | |
Eli Lilly & Co. | | | 49,797 | | | | 3,229,336 | |
Hospira, Inc.* | | | 8,507 | | | | 442,619 | |
Johnson & Johnson | | | 142,369 | | | | 15,175,112 | |
Mallinckrodt PLC*(a) | | | 5,800 | | | | 522,870 | |
Merck & Co., Inc. | | | 145,833 | | | | 8,644,981 | |
Mylan, Inc.*(a) | | | 19,000 | | | | 864,310 | |
Perrigo Co. PLC | | | 6,900 | | | | 1,036,311 | |
Pfizer, Inc. | | | 321,523 | | | | 9,507,435 | |
Zoetis, Inc. | | | 25,100 | | | | 927,445 | |
| | | | | | | | |
| | | | | | | 55,138,440 | |
| | |
Professional Services 0.2% | | | | | | | | |
Dun & Bradstreet Corp. (The) | | | 1,700 | | | | 199,699 | |
Equifax, Inc. | | | 6,530 | | | | 488,052 | |
Nielsen NV | | | 14,300 | | | | 633,919 | |
Robert Half International, Inc. | | | 6,900 | | | | 338,100 | |
| | | | | | | | |
| | | | | | | 1,659,770 | |
| | |
Real Estate Investment Trusts (REITs) 2.0% | | | | | | | | |
American Tower Corp. | | | 19,900 | | | | 1,863,237 | |
Apartment Investment & Management Co. (Class A Stock) | | | 6,880 | | | | 218,921 | |
AvalonBay Communities, Inc. | | | 6,011 | | | | 847,371 | |
Boston Properties, Inc.* | | | 7,800 | | | | 902,928 | |
Crown Castle International Corp. | | | 16,500 | | | | 1,328,745 | |
See Notes to Financial Statements.
| | | | | | | | |
| Description | | Shares | | | Value (Note 1) | |
COMMON STOCKS (Continued) | | | | | | | | |
| | |
Real Estate Investment Trusts (REITs) (cont’d.) | | | | | | | | |
Equity Residential | | | 17,300 | | | $ | 1,065,334 | |
Essex Property Trust, Inc. | | | 3,200 | | | | 572,000 | |
General Growth Properties, Inc. | | | 27,600 | | | | 649,980 | |
HCP, Inc. | | | 23,100 | | | | 917,301 | |
Health Care REIT, Inc. | | | 15,500 | | | | 966,735 | |
Host Hotels & Resorts, Inc. | | | 37,136 | | | | 792,111 | |
Kimco Realty Corp. | | | 19,100 | | | | 418,481 | |
Macerich Co. (The) | | | 6,800 | | | | 434,044 | |
Plum Creek Timber Co., Inc. | | | 8,100 | | | | 315,981 | |
Prologis, Inc. | | | 24,737 | | | | 932,585 | |
Public Storage | | | 7,400 | | | | 1,227,216 | |
Simon Property Group, Inc. | | | 15,689 | | | | 2,579,585 | |
Ventas, Inc. | | | 15,033 | | | | 931,294 | |
Vornado Realty Trust | | | 8,884 | | | | 888,045 | |
Weyerhaeuser Co. | | | 25,959 | | | | 827,054 | |
| | | | | | | | |
| | | | | | | 18,678,948 | |
| | |
Real Estate Management & Development | | | | | | | | |
CBRE Group, Inc. (Class A Stock)* | | | 13,300 | | | | 395,542 | |
| | |
Road & Rail 1.0% | | | | | | | | |
CSX Corp. | | | 49,418 | | | | 1,584,341 | |
Kansas City Southern | | | 5,700 | | | | 690,840 | |
Norfolk Southern Corp. | | | 15,711 | | | | 1,753,348 | |
Ryder System, Inc. | | | 2,821 | | | | 253,805 | |
Union Pacific Corp. | | | 45,516 | | | | 4,934,845 | |
| | | | | | | | |
| | | | | | | 9,217,179 | |
| | |
Semiconductors & Semiconductor Equipment 2.4% | | | | | | | | |
Altera Corp. | | | 15,300 | | | | 547,434 | |
Analog Devices, Inc. | | | 15,600 | | | | 772,044 | |
Applied Materials, Inc. | | | 59,388 | | | | 1,283,375 | |
Avago Technologies Ltd. (Singapore) | | | 13,000 | | | | 1,131,000 | |
Broadcom Corp. (Class A Stock) | | | 28,200 | | | | 1,139,844 | |
First Solar, Inc.* | | | 3,800 | | | | 250,078 | |
Intel Corp. | | | 250,088 | | | | 8,708,064 | |
KLA-Tencor Corp. | | | 8,420 | | | | 663,328 | |
Lam Research Corp. | | | 8,162 | | | | 609,701 | |
Linear Technology Corp. | | | 11,600 | | | | 514,924 | |
Microchip Technology, Inc.(a) | | | 9,700 | | | | 458,131 | |
See Notes to Financial Statements.
| | | | |
| Prudential Stock Index Fund | | | 25 | |
Portfolio of Investments
as of September 30, 2014 continued
| | | | | | | | |
| Description | | Shares | | | Value (Note 1) | |
COMMON STOCKS (Continued) | | | | | | | | |
| | |
Semiconductors & Semiconductor Equipment (cont’d.) | | | | | | | | |
Micron Technology, Inc.* | | | 53,216 | | | $ | 1,823,180 | |
NVIDIA Corp. | | | 28,000 | | | | 516,600 | |
Texas Instruments, Inc. | | | 54,452 | | | | 2,596,816 | |
Xilinx, Inc. | | | 13,500 | | | | 571,725 | |
| | | | | | | | |
| | | | | | | 21,586,244 | |
| | |
Software 3.7% | | | | | | | | |
Adobe Systems, Inc.* | | | 23,240 | | | | 1,607,976 | |
Autodesk, Inc.* | | | 11,420 | | | | 629,242 | |
CA, Inc. | | | 15,558 | | | | 434,690 | |
Citrix Systems, Inc.*(a) | | | 8,200 | | | | 584,988 | |
Electronic Arts, Inc.*(a) | | | 15,900 | | | | 566,199 | |
Intuit, Inc. | | | 14,300 | | | | 1,253,395 | |
Microsoft Corp. | | | 413,912 | | | | 19,188,960 | |
Oracle Corp. | | | 165,540 | | | | 6,336,871 | |
Red Hat, Inc.* | | | 9,600 | | | | 539,040 | |
salesforce.com, inc.* | | | 27,700 | | | | 1,593,581 | |
Symantec Corp. | | | 33,317 | | | | 783,283 | |
| | | | | | | | |
| | | | | | | 33,518,225 | |
| | |
Specialty Retail 2.0% | | | | | | | | |
AutoNation, Inc.* | | | 2,423 | | | | 121,901 | |
AutoZone, Inc.* | | | 1,630 | | | | 830,746 | |
Bed Bath & Beyond, Inc.*(a) | | | 10,500 | | | | 691,215 | |
Best Buy Co., Inc. | | | 13,000 | | | | 436,670 | |
CarMax, Inc.* | | | 10,500 | | | | 487,725 | |
GameStop Corp. (Class A Stock)(a) | | | 5,600 | | | | 230,720 | |
Gap, Inc. (The) | | | 12,613 | | | | 525,836 | |
Home Depot, Inc. (The) | | | 68,084 | | | | 6,246,026 | |
L. Brands, Inc. | | | 12,622 | | | | 845,422 | |
Lowe’s Cos., Inc. | | | 50,296 | | | | 2,661,664 | |
O’Reilly Automotive, Inc.* | | | 5,400 | | | | 811,944 | |
PetSmart, Inc. | | | 5,100 | | | | 357,459 | |
Ross Stores, Inc. | | | 10,700 | | | | 808,706 | |
Staples, Inc. | | | 29,625 | | | | 358,462 | |
Tiffany & Co. | | | 5,500 | | | | 529,705 | |
TJX Cos., Inc. (The) | | | 35,164 | | | | 2,080,654 | |
Tractor Supply Co.(a) | | | 6,600 | | | | 405,966 | |
Urban Outfitters, Inc.* | | | 5,300 | | | | 194,510 | |
| | | | | | | | |
| | | | | | | 18,625,331 | |
See Notes to Financial Statements.
| | | | | | | | |
| Description | | Shares | | | Value (Note 1) | |
COMMON STOCKS (Continued) | | | | | | | | |
| | |
Technology Hardware, Storage & Peripherals 4.4% | | | | | | | | |
Apple, Inc. | | | 302,038 | | | $ | 30,430,329 | |
EMC Corp. | | | 102,304 | | | | 2,993,415 | |
Hewlett-Packard Co. | | | 94,602 | | | | 3,355,533 | |
NetApp, Inc. | | | 16,800 | | | | 721,728 | |
SanDisk Corp. | | | 11,300 | | | | 1,106,835 | |
Seagate Technology PLC | | | 16,400 | | | | 939,228 | |
Western Digital Corp. | | | 10,600 | | | | 1,031,592 | |
| | | | | | | | |
| | | | | | | 40,578,660 | |
| | |
Textiles, Apparel & Luxury Goods 0.8% | | | | | | | | |
Coach, Inc. | | | 14,000 | | | | 498,540 | |
Fossil Group, Inc.* | | | 2,500 | | | | 234,750 | |
Michael Kors Holdings Ltd.* | | | 10,300 | | | | 735,317 | |
NIKE, Inc. (Class B Stock) | | | 35,652 | | | | 3,180,159 | |
PVH Corp. | | | 4,200 | | | | 508,830 | |
Ralph Lauren Corp. | | | 2,900 | | | | 477,717 | |
Under Armour, Inc. (Class A Stock)*(a) | | | 7,400 | | | | 511,340 | |
VF Corp. | | | 17,336 | | | | 1,144,696 | |
| | | | | | | | |
| | | | | | | 7,291,349 | |
| | |
Thrifts & Mortgage Finance 0.1% | | | | | | | | |
Hudson City Bancorp, Inc. | | | 22,600 | | | | 219,672 | |
People’s United Financial, Inc.(a) | | | 15,000 | | | | 217,050 | |
| | | | | | | | |
| | | | | | | 436,722 | |
| | |
Tobacco 1.4% | | | | | | | | |
Altria Group, Inc. | | | 99,479 | | | | 4,570,065 | |
Lorillard, Inc. | | | 18,280 | | | | 1,095,155 | |
Philip Morris International, Inc. | | | 79,179 | | | | 6,603,529 | |
Reynolds American, Inc. | | | 15,700 | | | | 926,300 | |
| | | | | | | | |
| | | | | | | 13,195,049 | |
| | |
Trading Companies & Distributors 0.2% | | | | | | | | |
Fastenal Co.(a) | | | 13,100 | | | | 588,190 | |
United Rentals, Inc.* | | | 4,300 | | | | 477,730 | |
W.W. Grainger, Inc. | | | 3,174 | | | | 798,737 | |
| | | | | | | | |
| | | | | | | 1,864,657 | |
| | | | | | | | |
TOTAL LONG-TERM INVESTMENTS
(cost $291,420,478) | | | | | | | 882,082,643 | |
| | | | | | | | |
See Notes to Financial Statements.
| | | | |
| Prudential Stock Index Fund | | | 27 | |
Portfolio of Investments
as of September 30, 2014 continued
| | | | | | | | |
| Description | | Shares | | | Value (Note 1) | |
SHORT-TERM INVESTMENTS 6.9% | | | | | | | | |
| | |
AFFILIATED MONEY MARKET MUTUAL FUND 6.7% | | | | | | | | |
Prudential Investment Portfolios 2 - Prudential Core Taxable Money Market Fund
(cost $61,484,489; includes $29,331,456 of cash collateral for securities on loan) (Note 3)(c)(d) | | | 61,484,489 | | | $ | 61,484,489 | |
| | | | | | | | |
| | |
| | | Principal
Amount (000)# | | | | |
U.S. TREASURY OBLIGATIONS 0.2% | | | | | | | | |
U.S. Treasury Bills, | | | | | | | | |
0.025%, 12/18/14(e)(f) | | | 100 | | | | 99,996 | |
0.045%, 03/19/15(e)(f) | | | 1,600 | | | | 1,599,755 | |
| | | | | | | | |
TOTAL U.S. TREASURY OBLIGATIONS
(cost $1,699,657) | | | | | | | 1,699,751 | |
| | | | | | | | |
TOTAL SHORT-TERM INVESTMENTS
(cost $63,184,146) | | | | | | | 63,184,240 | |
| | | | | | | | |
TOTAL INVESTMENTS 103.1%
(cost $354,604,624; Note 5) | | | | | | | 945,266,883 | |
Liabilities in excess of other assets(g) (3.1)% | | | | | | | (28,759,156 | ) |
| | | | | | | | |
NET ASSETS 100.0% | | | | | | $ | 916,507,727 | |
| | | | | | | | |
The following abbreviation is used in the portfolio descriptions:
REIT—Real Estate Investment Trust
| * | Non-income producing security. |
| # | Principal amount shown in U.S. dollars unless otherwise stated. |
| (a) | All or a portion of security is on loan. The aggregate market value of such securities, including those sold and pending settlement, is $28,679,362; cash collateral of $29,331,456 (included in liabilities) was received with which the Fund purchased highly liquid short-term investments. Securities on loan are subject to contractual netting arrangements. |
| (b) | An affiliated security. |
| (c) | Represents security, or a portion thereof, purchased with cash collateral received for securities on loan. |
| (d) | Prudential Investments LLC, the manager of the Fund, also serves as manager of the Prudential Investment Portfolios 2 - Prudential Core Taxable Money Market Fund. |
| (e) | Rate quoted represents yield-to-maturity as of purchase date. |
| (f) | Represents security, or a portion thereof, segregated as collateral for futures contracts. |
See Notes to Financial Statements.
| (g) | Liabilities in excess of other assets includes net unrealized appreciation (depreciation) on futures contracts as follows: |
Futures contracts outstanding at September 30, 2014:
| | | | | | | | | | | | | | | | | | | | |
Number of
Contracts | | | Type | | Expiration
Date | | | Value at
Trade Date | | | Value at
September 30,
2014 | | | Unrealized
Depreciation(1) | |
| | | | Long Positions: | | | | | | | | | | | | | | | | |
| | 169 | | | S&P 500 E-Mini | | | Dec. 2014 | | | $ | 16,700,280 | | | $ | 16,608,475 | | | $ | (91,805 | ) |
| | 34 | | | S&P 500 Index | | | Dec. 2014 | | | | 16,781,746 | | | | 16,706,750 | | | | (74,996 | ) |
| | | | | | | | | | | | | | | | | | | | |
| | | | | | | | | | | | | | | | | | $ | (166,801 | ) |
| | | | | | | | | | | | | | | | | | | | |
| (1) | U.S. Treasury obligations with a combined market value of $1,699,751 have been segregated with UBS AG to cover requirements for open contracts at September 30, 2014. |
Various inputs are used in determining the value of the Fund’s investments. These inputs are summarized in the three broad levels listed below.
Level 1—quoted prices generally in active markets for identical securities.
Level 2—other significant observable inputs including, but not limited to, quoted prices for similar securities, interest rates and yield curves, prepayment speeds, foreign currency exchange rates, and amortized cost.
Level 3—significant unobservable inputs for securities valued in accordance with Board approved fair valuation procedures.
The following is a summary of the inputs used as of September 30, 2014 in valuing such portfolio securities:
| | | | | | | | | | | | |
| | | Level 1 | | | Level 2 | | | Level 3 | |
Investments in Securities | | | | | | | | | | | | |
Common Stocks | | | | | | | | | | | | |
Aerospace & Defense | | $ | 23,344,101 | | | $ | — | | | $ | — | |
Air Freight & Logistics | | | 6,612,723 | | | | — | | | | — | |
Airlines | | | 2,690,431 | | | | — | | | | — | |
Auto Components | | | 3,275,793 | | | | — | | | | — | |
Automobiles | | | 5,649,195 | | | | — | | | | — | |
Banks | | | 53,189,001 | | | | — | | | | — | |
Beverages | | | 19,350,274 | | | | — | | | | — | |
See Notes to Financial Statements.
| | | | |
| Prudential Stock Index Fund | | | 29 | |
Portfolio of Investments
as of September 30, 2014 continued
| | | | | | | | | | | | |
| | | Level 1 | | | Level 2 | | | Level 3 | |
Common Stocks (continued) | | | | | | | | | | | | |
Biotechnology | | $ | 25,715,464 | | | $ | — | | | $ | — | |
Building Products | | | 630,450 | | | | — | | | | — | |
Capital Markets | | | 20,147,222 | | | | — | | | | — | |
Chemicals | | | 22,719,529 | | | | — | | | | — | |
Commercial Services & Supplies | | | 4,229,313 | | | | — | | | | — | |
Communications Equipment | | | 14,902,947 | | | | — | | | | — | |
Construction & Engineering | | | 1,254,659 | | | | — | | | | — | |
Construction Materials | | | 804,103 | | | | — | | | | — | |
Consumer Finance | | | 8,210,158 | | | | — | | | | — | |
Containers & Packaging | | | 1,694,194 | | | | — | | | | — | |
Distributors | | | 684,050 | | | | — | | | | — | |
Diversified Consumer Services | | | 422,356 | | | | — | | | | — | |
Diversified Financial Services | | | 17,673,613 | | | | — | | | | — | |
Diversified Telecommunication Services | | | 21,352,926 | | | | — | | | | — | |
Electric Utilities | | | 14,875,218 | | | | — | | | | — | |
Electrical Equipment | | | 5,899,836 | | | | — | | | | — | |
Electronic Equipment, Instruments & Components | | | 3,574,393 | | | | — | | | | — | |
Energy Equipment & Services | | | 16,076,399 | | | | — | | | | — | |
Food & Staples Retailing | | | 19,763,376 | | | | — | | | | — | |
Food Products | | | 14,042,510 | | | | — | | | | — | |
Gas Utilities | | | 289,044 | | | | — | | | | — | |
Health Care Equipment & Supplies | | | 18,194,275 | | | | — | | | | — | |
Health Care Providers & Services | | | 19,134,343 | | | | — | | | | — | |
Health Care Technology | | | 887,593 | | | | — | | | | — | |
Hotels, Restaurants & Leisure | | | 14,343,301 | | | | — | | | | — | |
Household Durables | | | 3,172,531 | | | | — | | | | — | |
Household Products | | | 16,911,146 | | | | — | | | | — | |
Independent Power & Renewable Electricity Producers | | | 917,904 | | | | — | | | | — | |
Industrial Conglomerates | | | 19,798,739 | | | | — | | | | — | |
Insurance | | | 24,750,286 | | | | — | | | | — | |
Internet & Catalog Retail | | | 11,509,107 | | | | — | | | | — | |
Internet Software & Services | | | 30,413,336 | | | | — | | | | — | |
IT Services | | | 28,983,586 | | | | — | | | | — | |
Leisure Products | | | 829,956 | | | | — | | | | — | |
Life Sciences Tools & Services | | | 4,062,845 | | | | — | | | | — | |
Machinery | | | 13,935,527 | | | | — | | | | — | |
Media | | | 30,917,984 | | | | — | | | | — | |
Metals & Mining | | | 4,263,424 | | | | — | | | | — | |
Multi-Utilities | | | 9,951,332 | | | | — | | | | — | |
Multiline Retail | | | 5,996,428 | | | | — | | | | — | |
Oil, Gas & Consumable Fuels | | | 69,685,560 | | | | — | | | | — | |
Paper & Forest Products | | | 1,049,516 | | | | — | | | | — | |
See Notes to Financial Statements.
| | | | | | | | | | | | |
| | | Level 1 | | | Level 2 | | | Level 3 | |
Common Stocks (continued) | | | | | | | | | | | | |
Personal Products | | $ | 1,114,530 | | | $ | — | | | $ | — | |
Pharmaceuticals | | | 55,138,440 | | | | — | | | | — | |
Professional Services | | | 1,659,770 | | | | — | | | | — | |
Real Estate Investment Trusts (REITs) | | | 18,678,948 | | | | — | | | | — | |
Real Estate Management & Development | | | 395,542 | | | | — | | | | — | |
Road & Rail | | | 9,217,179 | | | | — | | | | — | |
Semiconductors & Semiconductor Equipment | | | 21,586,244 | | | | — | | | | — | |
Software | | | 33,518,225 | | | | — | | | | — | |
Specialty Retail | | | 18,625,331 | | | | — | | | | — | |
Technology Hardware, Storage & Peripherals | | | 40,578,660 | | | | — | | | | — | |
Textiles, Apparel & Luxury Goods | | | 7,291,349 | | | | — | | | | — | |
Thrifts & Mortgage Finance | | | 436,722 | | | | — | | | | — | |
Tobacco | | | 13,195,049 | | | | — | | | | — | |
Trading Companies & Distributors | | | 1,864,657 | | | | — | | | | — | |
Affiliated Money Market Mutual Fund | | | 61,484,489 | | | | — | | | | — | |
U.S. Treasury Obligations | | | — | | | | 1,699,751 | | | | — | |
Other Financial Instruments* | | | | | | | | | | | | |
Futures Contracts | | | (166,801 | ) | | | — | | | | — | |
| | | | | | | | | | | | |
Total | | $ | 943,400,331 | | | $ | 1,699,751 | | | $ | — | |
| | | | | | | | | | | | |
| * | Other financial instruments are derivative instruments not reflected in the Portfolio of Investments, such as futures, forwards and swaps contracts, which are recorded at the unrealized appreciation/depreciation of the instrument. |
The industry classification of investments and liabilities in excess of other assets shown as a percentage of net assets as of September 30, 2014 was as follows (Unaudited):
| | | | |
Oil, Gas & Consumable Fuels | | | 7.6 | % |
Affiliated Money Market Mutual Fund (including 3.2% of collateral for securities on loan) | | | 6.7 | |
Pharmaceuticals | | | 6.0 | |
Banks | | | 5.8 | |
Technology Hardware, Storage & Peripherals | | | 4.4 | |
Software | | | 3.7 | |
Media | | | 3.4 | |
Internet Software & Services | | | 3.3 | |
IT Services | | | 3.2 | |
Biotechnology | | | 2.8 | |
Insurance | | | 2.7 | |
Aerospace & Defense | | | 2.5 | |
Chemicals | | | 2.5 | |
Semiconductors & Semiconductor Equipment | | | 2.4 | |
Diversified Telecommunication Services | | | 2.3 | % |
Capital Markets | | | 2.2 | |
Industrial Conglomerates | | | 2.2 | |
Food & Staples Retailing | | | 2.2 | |
Beverages | | | 2.1 | |
Health Care Providers & Services | | | 2.1 | |
Real Estate Investment Trusts (REITs) | | | 2.0 | |
Specialty Retail | | | 2.0 | |
Health Care Equipment & Supplies | | | 2.0 | |
Diversified Financial Services | | | 1.9 | |
Household Products | | | 1.8 | |
Energy Equipment & Services | | | 1.8 | |
Communications Equipment | | | 1.6 | |
Electric Utilities | | | 1.6 | |
Hotels, Restaurants & Leisure | | | 1.6 | |
See Notes to Financial Statements.
| | | | |
| Prudential Stock Index Fund | | | 31 | |
Portfolio of Investments
as of September 30, 2014 continued
| | | | |
Food Products | | | 1.5 | % |
Machinery | | | 1.5 | |
Tobacco | | | 1.4 | |
Internet & Catalog Retail | | | 1.3 | |
Multi-Utilities | | | 1.1 | |
Road & Rail | | | 1.0 | |
Consumer Finance | | | 0.9 | |
Textiles, Apparel & Luxury Goods | | | 0.8 | |
Air Freight & Logistics | | | 0.7 | |
Multiline Retail | | | 0.7 | |
Electrical Equipment | | | 0.6 | |
Automobiles | | | 0.6 | |
Metals & Mining | | | 0.5 | |
Commercial Services & Supplies | | | 0.5 | |
Life Sciences Tools & Services | | | 0.4 | |
Electronic Equipment, Instruments & Components | | | 0.4 | |
Auto Components | | | 0.4 | |
Household Durables | | | 0.3 | |
Airlines | | | 0.3 | |
Trading Companies & Distributors | | | 0.2 | % |
U.S. Treasury Obligations | | | 0.2 | |
Containers & Packaging | | | 0.2 | |
Professional Services | | | 0.2 | |
Construction & Engineering | | | 0.1 | |
Personal Products | | | 0.1 | |
Paper & Forest Products | | | 0.1 | |
Independent Power & Renewable Electricity Producers | | | 0.1 | |
Health Care Technology | | | 0.1 | |
Leisure Products | | | 0.1 | |
Construction Materials | | | 0.1 | |
Distributors | | | 0.1 | |
Building Products | | | 0.1 | |
Thrifts & Mortgage Finance | | | 0.1 | |
| | | | |
| | | 103.1 | |
Liabilities in excess of other assets | | | (3.1 | ) |
| | | | |
| | | 100.0 | % |
| | | | |
The Fund invested in derivative instruments during the reporting period. The primary types of risk associated with these derivative instruments is equity risk. The effect of such derivative instruments on the Fund’s financial position and financial performance as reflected in the Statement of Assets and Liabilities and Statement of Operations is presented in the summary below.
Fair values of derivative instruments as of September 30, 2014 as presented in the Statement of Assets and Liabilities:
| | | | | | | | | | | | |
Derivatives not accounted for
as hedging instruments,
carried at fair value | | Asset Derivatives | | | Liability Derivatives | |
| | Balance Sheet
Location | | Fair
Value | | | Balance Sheet
Location | | Fair
Value | |
| Equity contracts | | — | | $ | — | | | Due from/to broker—variation margin
futures | | $ | 166,801 | * |
| | | | | | | | | | | | |
| * | Includes cumulative appreciation/depreciation as reported in schedule of open futures. Only unsettled variation margin receivable (payable) is reported within the Statement of Assets and Liabilities. |
See Notes to Financial Statements.
The effects of derivative instruments on the Statement of Operations for the year ended September 30, 2014 are as follows:
| | | | |
Amount of Realized Gain or (Loss) on Derivatives Recognized in Income | |
Derivatives not accounted for as hedging instruments, carried at fair value | | Futures | |
Equity contracts | | $ | 4,626,668 | |
| | | | |
| | | | |
Change in Unrealized Appreciation or (Depreciation) on Derivatives Recognized in Income | |
Derivatives not accounted for as hedging instruments, carried at fair value | | Futures | |
Equity contracts | | $ | 103,972 | |
| | | | |
For the year ended September 30, 2014, the Fund’s average value at trade date for futures long positions was $28,525,411.
See Notes to Financial Statements.
| | | | |
| Prudential Stock Index Fund | | | 33 | |
Statement of Assets and Liabilities
as of September 30, 2014
| | | | |
Assets | | | | |
Investments at value, including securities on loan of $28,679,362: | | | | |
Unaffiliated Investments (cost $292,328,732) | | $ | 881,689,422 | |
Affiliated Investments (cost $62,275,892) | | | 63,577,461 | |
Receivable for Fund shares sold | | | 1,106,074 | |
Dividends receivable | | | 1,044,425 | |
Receivable for investments sold | | | 546,689 | |
Prepaid expenses | | | 9,967 | |
| | | | |
Total assets | | | 947,974,038 | |
| | | | |
| |
Liabilities | | | | |
Payable to broker for collateral for securities on loan | | | 29,331,456 | |
Payable for Fund shares reacquired | | | 1,097,386 | |
Payable for investments purchased | | | 593,573 | |
Accrued expenses | | | 145,354 | |
Affiliated transfer agent fee payable | | | 88,311 | |
Distribution fee payable | | | 81,064 | |
Due to broker—variation margin futures | | | 68,292 | |
Management fee payable | | | 60,875 | |
| | | | |
Total liabilities | | | 31,466,311 | |
| | | | |
| |
Net Assets | | $ | 916,507,727 | |
| | | | |
| | | | | |
Net assets were comprised of: | | | | |
Shares of beneficial interest, at par | | $ | 20,795 | |
Paid-in capital in excess of par | | | 275,875,710 | |
| | | | |
| | | 275,896,505 | |
Undistributed net investment income | | | 13,650,514 | |
Accumulated net realized gain on investment transactions | | | 36,465,250 | |
Net unrealized appreciation on investments | | | 590,495,458 | |
| | | | |
Net assets, September 30, 2014 | | $ | 916,507,727 | |
| | | | |
See Notes to Financial Statements.
| | | | |
Class A | | | | |
Net asset value and redemption price per share
($197,250,206 ÷ 4,485,511 shares of beneficial interest issued and outstanding) | | $ | 43.97 | |
Maximum sales charge (3.25% of offering price) | | | 1.48 | |
| | | | |
Maximum offering price to public | | $ | 45.45 | |
| | | | |
| |
Class C | | | | |
Net asset value, offering price and redemption price per share
($38,749,245 ÷ 887,906 shares of beneficial interest issued and outstanding) | | $ | 43.64 | |
| | | | |
| |
Class I | | | | |
Net asset value, offering price and redemption price per share
($255,507,206 ÷ 5,789,135 shares of beneficial interest issued and outstanding) | | $ | 44.14 | |
| | | | |
| |
Class Z | | | | |
Net asset value, offering price and redemption price per share
($425,001,070 ÷ 9,632,124 shares of beneficial interest issued and outstanding) | | $ | 44.12 | |
| | | | |
See Notes to Financial Statements.
| | | | |
| Prudential Stock Index Fund | | | 35 | |
Statement of Operations
Year Ended September 30, 2014
| | | | |
Net Investment Income | | | | |
Income | | | | |
Unaffiliated dividend income (net of foreign withholding taxes of $1,649) | | $ | 17,552,872 | |
Affiliated dividend income | | | 85,972 | |
Affiliated income from securities loaned, net | | | 57,947 | |
Interest income | | | 515 | |
| | | | |
Total income | | | 17,697,306 | |
| | | | |
| |
Expenses | | | | |
Management fee | | | 1,971,532 | |
Distribution fee—Class A | | | 552,597 | |
Distribution fee—Class C | | | 344,187 | |
Custodian’s fees and expenses | | | 115,000 | |
Transfer agent fee—Class A (including affiliated expense of $132,000) | | | 210,000 | |
Transfer agent fee—Class C (including affiliated expense of $3,300) | | | 12,000 | |
Transfer agent fee—Class I (including affiliated expense of $169,000) | | | 169,000 | |
Transfer agent fee—Class Z (including affiliated expense of $551,000) | | | 551,000 | |
Registration fees | | | 79,000 | |
Shareholders’ reports | | | 54,000 | |
Trustees’ fees | | | 33,000 | |
Legal fees and expenses | | | 27,000 | |
Audit fee | | | 23,000 | |
Insurance expenses | | | 11,000 | |
Miscellaneous | | | 20,268 | |
| | | | |
Total expenses | | | 4,172,584 | |
Less: Management fee waiver | | | (1,263,807 | ) |
| | | | |
Net expenses | | | 2,908,777 | |
| | | | |
Net investment income | | | 14,788,529 | |
| | | | |
| |
Realized And Unrealized Gain On Investments | | | | |
Net realized gain on: | | | | |
Investment transactions (including affiliated $93,381) | | | 41,647,236 | |
Futures transactions | | | 4,626,668 | |
| | | | |
| | | 46,273,904 | |
| | | | |
Net change in unrealized appreciation (depreciation) on: | | | | |
Investments (including affiliated $149,000) | | | 93,534,122 | |
Futures | | | 103,972 | |
| | | | |
| | | 93,638,094 | |
| | | | |
Net gain on investment transactions | | | 139,911,998 | |
| | | | |
Net Increase In Net Assets Resulting From Operations | | $ | 154,700,527 | |
| | | | |
See Notes to Financial Statements.
Statement of Changes in Net Assets
| | | | | | | | |
| | | Year Ended September 30, | |
| | | 2014 | | | 2013 | |
Increase (Decrease) In Net Assets | | | | | | | | |
Operations | | | | | | | | |
Net investment income | | $ | 14,788,529 | | | $ | 14,518,487 | |
Net realized gain on investment transactions | | | 46,273,904 | | | | 21,530,799 | |
Net change in unrealized appreciation (depreciation) on investments | | | 93,638,094 | | | | 96,216,868 | |
| | | | | | | | |
Net increase in net assets resulting from operations | | | 154,700,527 | | | | 132,266,154 | |
| | | | | | | | |
| | |
Dividends and Distributions (Note 1) | | | | | | | | |
Dividends from net investment income | | | | | | | | |
Class A | | | (2,095,357 | ) | | | (2,357,155 | ) |
Class C | | | (198,743 | ) | | | (249,255 | ) |
Class I | | | (3,431,791 | ) | | | (3,437,440 | ) |
Class Z | | | (6,202,457 | ) | | | (7,015,339 | ) |
| | | | | | | | |
| | | (11,928,348 | ) | | | (13,059,189 | ) |
| | | | | | | | |
Distributions from net realized gains | | | | | | | | |
Class A | | | (381,468 | ) | | | — | |
Class C | | | (69,520 | ) | | | — | |
Class I | | | (495,263 | ) | | | — | |
Class Z | | | (928,809 | ) | | | — | |
| | | | | | | | |
| | | (1,875,060 | ) | | | — | |
| | | | | | | | |
| | |
Fund share transactions (Net of share conversions) (Note 6) | | | | | | | | |
Net proceeds from shares sold | | | 170,437,276 | | | | 178,974,200 | |
Net asset value of shares issued in reinvestment of dividends and distributions | | | 13,641,211 | | | | 12,833,316 | |
Cost of shares reacquired | | | (228,878,658 | ) | | | (217,929,434 | ) |
| | | | | | | | |
Net decrease in net assets from Fund share transactions | | | (44,800,171 | ) | | | (26,121,918 | ) |
| | | | | | | | |
Total increase | | | 96,096,948 | | | | 93,085,047 | |
| | |
Net Assets: | | | | | | | | |
Beginning of year | | | 820,410,779 | | | | 727,325,732 | |
| | | | | | | | |
End of year(a) | | $ | 916,507,727 | | | $ | 820,410,779 | |
| | | | | | | | |
(a) Includes undistributed net investment income of: | | $ | 13,650,514 | | | $ | 10,815,319 | |
| | | | | | | | |
See Notes to Financial Statements.
| | | | |
| Prudential Stock Index Fund | | | 37 | |
Notes to Financial Statements
Prudential Investment Portfolios 8 (the “Trust”) is an open-end management investment company, registered under the Investment Company Act of 1940, as amended, (“1940 Act”). The Trust was established as a Delaware business trust on May 11, 1992 and currently consists of one fund, which is the Prudential Stock Index Fund (the “Fund”). The Fund’s investment objective is to provide investment results that correspond to the price and yield performance of the Standard & Poor’s 500 Composite Stock Price Index.
Note 1. Accounting Policies
The following accounting policies conform to U.S. generally accepted accounting principles. The Fund consistently follows such policies in the preparation of its financial statements.
Securities Valuation: The Fund holds securities and other assets that are fair valued at the close of each day the New York Stock Exchange (“NYSE”) is open for trading. Fair value is the price that would be received to sell an asset or paid to transfer a liability in an orderly transaction between market participants on the measurement date. The Board of Trustees (the “Board”) has adopted Valuation Procedures for security valuation under which fair valuation responsibilities have been delegated to Prudential Investments LLC (“PI” or “Manager”). Under the current Valuation Procedures, the established Valuation Committee is responsible for supervising the valuation of portfolio securities and other assets. The Valuation Procedures permit the Fund to utilize independent pricing vendor services, quotations from market makers, and alternative valuation methods when market quotations are either not readily available or not deemed representative of fair value. A record of the Valuation Committee’s actions is subject to the Board’s review, approval, and ratification at its next regularly-scheduled quarterly meeting.
Various inputs determine how the Fund’s investments are valued, all of which are categorized according to the three broad levels (Level 1, 2, or 3) detailed in the table following the Portfolio of Investments.
Common and preferred stocks, exchange-traded funds, and derivative instruments that are traded on a national securities exchange are valued at the last sale price as of the close of trading on the applicable exchange. Securities traded via NASDAQ are valued at the NASDAQ official closing price. To the extent these securities are valued
at the last sale price or NASDAQ official closing price, they are classified as Level 1 in the fair value hierarchy except for exchange-traded and cleared swaps which are classified as Level 2 in the fair value hierarchy, as the prices marked at the official settle are not public.
In the event that no sale or official closing price on valuation date exists, these securities are generally valued at the mean between the last reported bid and ask prices, or at the last bid price in the absence of an ask price. These securities are classified as Level 2 in the fair value hierarchy, as the inputs are observable and considered to be significant to the valuation.
Common and preferred stocks traded on foreign securities exchanges are valued using pricing vendor services that provide model prices derived using adjustment factors based on information such as local closing price, relevant general and sector indices, currency fluctuations, depositary receipts, and futures, as applicable. Securities valued using such model prices are classified as Level 2 in the fair value hierarchy, as the adjustment factors are observable and considered to be significant to the valuation. Securities not valued using such model prices are valued in accordance with exchange-traded common and preferred stocks discussed above.
Investments in open-end, non-exchange-traded mutual funds are valued at their net asset values as of the close of the NYSE on the date of valuation. These securities are classified as Level 1 in the fair value hierarchy since they may be purchased or sold at their net asset values on the date of valuation.
Fixed income securities traded in the over-the-counter market are generally valued at prices provided by approved independent pricing vendors. The pricing vendors provide these prices after evaluating observable inputs including, but not limited to yield curves, yield spreads, credit ratings, deal terms, tranche level attributes, default rates, cash flows, prepayment speeds, broker/dealer quotations, and reported trades. Securities valued using such vendor prices are classified as Level 2 in the fair value hierarchy.
Over-the-counter derivative instruments are generally valued using pricing vendor services, which derive the valuation based on inputs such as underlying asset prices, indices, spreads, interest rates, and exchange rates. These instruments are categorized as Level 2 in the fair value hierarchy.
Securities and other assets that cannot be priced according to the methods described above are valued based on pricing methodologies approved by the Board. In the event that significant unobservable inputs are used when determining such valuations, the securities will be classified as Level 3 in the fair value hierarchy.
| | | | |
| Prudential Stock Index Fund | | | 39 | |
Notes to Financial Statements
continued
When determining the fair value of securities, some of the factors influencing the valuation include: the nature of any restrictions on disposition of the securities; assessment of the general liquidity of the securities; the issuer’s financial condition and the markets in which it does business; the cost of the investment; the size of the holding and the capitalization of the issuer; the prices of any recent transactions or bids/offers for such securities or any comparable securities; any available analyst media or other reports or information deemed reliable by the investment adviser regarding the issuer or the markets or industry in which it operates. Using fair value to price securities may result in a value that is different from a security’s most recent closing price and from the price used by other mutual funds to calculate their net asset values.
Financial Futures Contracts: A financial futures contract is an agreement to purchase (long) or sell (short) an agreed amount of securities at a set price for delivery on a future date. Upon entering into a financial futures contract, the Fund is required to pledge to the broker an amount of cash and/or other assets equal to a certain percentage of the contract amount. This amount is known as the “initial margin.” Subsequent payments, known as “variation margin,” are made or received by the Fund each day, depending on the daily fluctuations in the value of the underlying security. Such variation margin is recorded for financial statement purposes on a daily basis as unrealized gain (loss). When the contract expires or is closed, the gain (loss) is realized and is presented in the Statement of Operations as net realized gain (loss) on financial futures transactions.
The Fund invested in financial futures contracts in order to hedge its existing portfolio securities, or securities the Fund intends to purchase, against fluctuations in value caused by changes in prevailing interest rates or foreign currency exchange rates. Should interest rates move unexpectedly, the Fund may not achieve the anticipated benefits of the financial futures contracts and may realize a loss. The use of futures transactions involves the risk of imperfect correlation in movements in the price of futures contracts, interest rates and the underlying hedged assets. With exchange-traded futures contracts, there is minimal counterparty credit risk to the Fund since the exchanges’ clearing house acts as counterparty to all exchange-traded futures and guarantees the futures contracts against default.
Master Netting Arrangements: The Fund is subject to various Master Agreements, or netting arrangements, with select counterparties. A master netting arrangement between the Fund and the counterparty permits the Fund to offset amounts payable
by the Fund to the same counterparty against amounts to be received; and by the receipt of collateral from the counterparty by the Fund to cover the Fund’s exposure to the counterparty. However, there is no assurance that such mitigating factors are easily enforceable. The right to set-off exists when all the conditions are met such that each of the parties owes the other determinable amounts, the reporting party has the right to set-off the amount owed with the amount owed by the other party, the reporting party intends to set-off and the right of set-off is enforceable by law. During the reporting period, there were no instances where the right to set-off existed and management has not elected to offset.
Financial futures contracts involve elements of both market and credit risk in excess of the amounts reflected on the Statement of Assets and Liabilities. Such risks may be mitigated by engaging in master netting arrangements.
Securities Lending: The Fund may lend its portfolio securities to banks and broker-dealers. The loans are secured by collateral at least equal to the market value of the securities loaned. Collateral pledged by each borrower is invested in a highly liquid short-term money market fund and is marked to market daily, based on the previous day’s market value, such that the value of the collateral exceeds the value of the loaned securities. Loans are subject to termination at the option of the borrower or the Fund. Upon termination of the loan, the borrower will return to the Fund securities identical to the loaned securities. Should the borrower of the securities fail financially, the Fund has the right to repurchase the securities in the open market using the collateral. The Fund recognizes income, net of any rebate and securities lending agent fees, for lending its securities, and any interest on the investment of cash received as collateral. The Fund also continues to receive interest and dividends or amounts equivalent thereto, on the securities loaned and recognizes any unrealized gain or loss in the market price of the securities loaned that may occur during the term of the loan.
REITs: The Fund invests in real estate investment trusts (“REITs”), which report information on the source of their distributions annually. Based on current and historical information, a portion of distributions received from REITs during the period is estimated to be dividend income, capital gain or return of capital and recorded accordingly. These estimates are adjusted periodically when the actual sources of distributions are disclosed by the REITs.
Securities Transactions and Net Investment Income: Securities transactions are recorded on the trade date. Realized gains or losses from investment and currency transactions are calculated on the identified cost basis. Dividend income is recorded
| | | | |
| Prudential Stock Index Fund | | | 41 | |
Notes to Financial Statements
continued
on the ex-dividend date. Interest income, including amortization of premium and accretion of discount on debt securities, as required, is recorded on an accrual basis.
Expenses are recorded on an accrual basis, which may require the use of certain estimates by management that may differ from actual.
Net investment income or loss (other than distribution fees, which are charged directly to the respective class) and unrealized and realized gains or losses are allocated daily to each class of shares based upon the relative proportion of adjusted net assets of each class at the beginning of the day.
Dividends and Distributions: The Fund expects to pay dividends from net investment income and distributions from net realized capital gains, if any, at least annually. Dividends and distributions to shareholders, which are determined in accordance with federal income tax regulations and which may differ from generally accepted accounting principles, are recorded on the ex-dividend date. Permanent book/tax differences relating to income and gains are reclassified amongst undistributed net investment income, accumulated net realized gain or loss and paid-in capital in excess of par, as appropriate.
Taxes: For federal income tax purposes, the Fund is treated as a separate taxpaying entity. It is the Fund’s policy to continue to meet the requirements of the Internal Revenue Code applicable to regulated investment companies and to distribute all of its taxable net investment income and capital gains, if any, to its shareholders. Therefore, no federal income tax provision is required. Withholding taxes on foreign dividends, interest and capital gains are recorded, net of reclaimable amounts, at the time the related income is earned.
Estimates: The preparation of the financial statements requires management to make estimates and assumptions that affect the reported amounts and disclosures in the financial statements. Actual results could differ from those estimates.
Note 2. Agreements
The Fund has a management agreement with PI. Pursuant to this agreement, PI has responsibility for all investment advisory services and supervises the subadviser’s performance of such services. PI has entered into a subadvisory agreement with
Quantitative Management Associates LLC (“QMA”). The subadvisory agreement provides that QMA will furnish investment advisory services in connection with the management of the Fund. PI pays for the services of QMA, the cost of compensation of officers of the Fund, occupancy and certain clerical and bookkeeping costs of the Fund. The Fund bears all other costs and expenses.
The management fee paid to PI is accrued daily and payable monthly, at an annual rate of .30% of the Fund’s average daily net assets up to and including $1 billion and .25% of such average daily net assets in excess of $1 billion. Effective April 1, 2014, the management fee was reduced to an annual rate of .15% of the Fund’s average daily net assets up to and including $1 billion and .10% of such average daily net assets in excess of $1 billion. Effective June 1, 2007 to January 31, 2016, the Fund’s manager has agreed to contractually waive a portion of its management fee, so that the effective management fee for the Fund will be .08% of the average daily net assets of Fund. The effective management fee rate was .08% of the average daily net assets for the year ended September 30, 2014.
The Fund has a distribution agreement with Prudential Investment Management Services LLC (“PIMS”), which acts as the distributor of the Class A, Class C, Class I and Class Z shares of the Fund. The Fund compensates PIMS for distributing and servicing the Fund’s Class A and Class C shares, pursuant to plans of distribution, (the “Class A and C Plans”), regardless of expenses actually incurred by PIMS. The distribution fees are accrued daily and payable monthly. No distribution or service fees are paid to PIMS as distributor of the Class I and Class Z shares of the Fund.
Pursuant to the Class A and C Plans, the Fund compensates PIMS for distribution-related activities at an annual rate of up to .30% and 1% of the average daily net assets of the Class A and C shares, respectively.
PIMS has advised the Fund that it has received $134,933 in front-end sales charges resulting from sales of Class A shares during the year ended September 30, 2014. From these fees, PIMS paid such sales charges to affiliated broker-dealers which in turn paid commissions to salespersons and incurred other distribution costs.
PIMS has advised the Fund that for the year ended September 30, 2014, it received $606 and $3,239 in contingent deferred sales charges imposed upon redemptions by certain Class A and Class C shareholder, respectively.
PI, PIMS and QMA are indirect, wholly-owned subsidiaries of Prudential Financial, Inc. (“Prudential”).
| | | | |
| Prudential Stock Index Fund | | | 43 | |
Notes to Financial Statements
continued
Note 3. Other Transactions with Affiliates
Prudential Mutual Fund Services LLC (“PMFS”), an affiliate of PI and an indirect, wholly-owned subsidiary of Prudential, serves as the Fund’s transfer agent. Transfer agent’s fees and expenses in the Statement of Operations include certain out-of-pocket expenses paid to non-affiliates, where applicable. The Fund’s Class I and Class Z shares are subject to a transfer agent fee of .07% and .13% of the average daily net assets of the Class I and Class Z shares, respectively. Classes A and C each compensate PMFS for its services as they are incurred.
Prudential Investment Management Inc. (“PIM”), an indirect, wholly-owned subsidiary of Prudential, is the Fund’s security lending agent. For the year ended September 30, 2014, PIM has been compensated approximately $17,300 for these services.
The Fund invests in the Prudential Core Taxable Money Market Fund (the “Core Fund”), a portfolio of the Prudential Investment Portfolios 2, registered under the 1940 Act and managed by PI. Earnings from the Core Fund are disclosed on the Statement of Operations as affiliated dividend income.
Note 4. Portfolio Securities
Purchases and sales of portfolio securities, other than short-term investments, for the year ended September 30, 2014, were $33,364,946 and $81,141,352, respectively.
Note 5. Distributions and Tax Information
Distributions to shareholders, which are determined in accordance with federal income tax regulations and which may differ from generally accepted accounting principles, are recorded on the ex-dividend date. In order to present undistributed net investment income, accumulated net realized gain on investment transactions and paid-in capital in excess of par on the Statement of Assets and Liabilities that more closely represent their tax character, certain adjustments have been made to undistributed net investment income and accumulated net realized gain on investment transactions. For the year ended September 30, 2014, the adjustments were to decrease undistributed net investment income and increase accumulated net realized gain on investment transactions by $24,986 due to differences in financial
and tax reporting. Net investment income, net realized gain on investments and net assets were not affected by this change.
For the year ended September 30, 2014, the tax character of dividends paid as reflected in the Statement of Changes in Net Assets were $11,928,348 from ordinary income and $1,875,060 from long-term capital gains. For the year ended September 30, 2013, the tax character of dividends paid as reflected in the Statement of Changes in Net Assets was $13,059,189 from ordinary income.
As of September 30, 2014, the accumulated undistributed earnings on a tax basis were $16,084,606 of ordinary income and $42,692,752 of long-term capital gains. This differs from the amount shown on the Statement of Assets and Liabilities primarily due to cumulative timing differences between financial and tax reporting.
The United States federal income tax basis of the Fund’s investments and the net unrealized appreciation as of September 30, 2014 were as follows:
| | | | | | |
Tax Basis | | Appreciation | | Depreciation | | Net Unrealized
Appreciation |
| $363,433,018 | | $587,108,549 | | $(5,274,684) | | $581,833,865 |
The difference between book basis and tax basis was primarily attributable to deferred losses on wash sales, Lehman Brothers securities adjustments and other tax adjustments.
Management has analyzed the Fund’s tax positions taken on federal income tax returns for all open tax years and has concluded that no provision for income tax is required in the Fund’s financial statements for the current reporting period. The Fund’s federal and state income and federal excise tax returns for tax years for which the applicable statutes of limitations have not expired are subject to examination by the Internal Revenue Service and state departments of revenue.
Note 6. Capital
The Fund offers Class A, Class C, Class I and Class Z shares. Class A shares are sold with a front-end sales charge of up to 3.25%. Investors who purchase $1 million or more of Class A shares and sell these shares within 12 months of purchase are subject to a 1% contingent deferred sales charge (“CDSC”), although they are not subject to an initial sales charge. The Class A CDSC is waived for purchases by certain retirement or benefit plans. Class C shares are sold with a CDSC of 1% during the first year.
Class I and Class Z shares are not subject to any sales or redemption charge and are offered exclusively for sale to a limited group of investors. The Trust has authorized
| | | | |
| Prudential Stock Index Fund | | | 45 | |
Notes to Financial Statements
continued
an unlimited number of shares of beneficial interest at $.001 par value, currently of one series, divided into four classes, designated Class A, Class C, Class I and Class Z. Under certain circumstances, an exchange may be made from specified share classes of the Fund to one or more other share classes of the Fund as presented in the table of transactions in shares of beneficial interest.
Transactions in shares of beneficial interest were as follows:
| | | | | | | | |
Class A | | Shares | | | Amount | |
Year ended September 30, 2014: | | | | | | | | |
Shares sold | | | 1,057,138 | | | $ | 43,682,829 | |
Shares issued in reinvestment of dividends and distributions | | | 61,893 | | | | 2,421,271 | |
Shares reacquired | | | (970,302 | ) | | | (40,179,359 | ) |
| | | | | | | | |
Net increase (decrease) in shares outstanding before conversion | | | 148,729 | | | | 5,924,741 | |
Shares issued upon conversion from Class C | | | 593 | | | | 26,095 | |
Shares reacquired upon conversion into Class Z | | | (4,578 | ) | | | (178,608 | ) |
| | | | | | | | |
Net increase (decrease) in shares outstanding | | | 144,744 | | | $ | 5,772,228 | |
| | | | | | | | |
Year ended September 30, 2013: | | | | | | | | |
Shares sold | | | 1,177,526 | | | $ | 40,497,854 | |
Shares issued in reinvestment of dividends and distributions | | | 71,208 | | | | 2,170,398 | |
Shares reacquired | | | (1,421,832 | ) | | | (49,183,007 | ) |
| | | | | | | | |
Net increase (decrease) in shares outstanding before conversion | | | (173,098 | ) | | | (6,514,755 | ) |
Shares issued upon conversion from Class Z | | | 238 | | | | 8,874 | |
Shares reacquired upon conversion into Class Z | | | (307 | ) | | | (11,076 | ) |
| | | | | | | | |
Net increase (decrease) in shares outstanding | | | (173,167 | ) | | $ | (6,516,957 | ) |
| | | | | | | | |
Class C | | | | | | |
Year ended September 30, 2014: | | | | | | | | |
Shares sold | | | 188,195 | | | $ | 7,775,012 | |
Shares issued in reinvestment of dividends and distributions | | | 6,625 | | | | 258,525 | |
Shares reacquired | | | (88,143 | ) | | | (3,615,900 | ) |
| | | | | | | | |
Net increase (decrease) in shares outstanding before conversion | | | 106,677 | | | | 4,417,637 | |
Shares reacquired upon conversion into Class A, Class I and Class Z | | | (2,466 | ) | | | (103,367 | ) |
| | | | | | | | |
Net increase (decrease) in shares outstanding | | | 104,211 | | | $ | 4,314,270 | |
| | | | | | | | |
Year ended September 30, 2013: | | | | | | | | |
Shares sold | | | 132,606 | | | $ | 4,654,096 | |
Shares issued in reinvestment of dividends and distributions | | | 7,778 | | | | 236,622 | |
Shares reacquired | | | (106,901 | ) | | | (3,621,594 | ) |
| | | | | | | | |
Net increase (decrease) in shares outstanding before conversion | | | 33,483 | | | | 1,269,124 | |
Shares reacquired upon conversion into Class Z | | | (481 | ) | | | (17,428 | ) |
| | | | | | | | |
Net increase (decrease) in shares outstanding | | | 33,002 | | | $ | 1,251,696 | |
| | | | | | | | |
| | | | | | | | |
Class I | | Shares | | | Amount | |
Year ended September 30, 2014: | | | | | | | | |
Shares sold | | | 880,960 | | | $ | 36,923,342 | |
Shares issued in reinvestment of dividends and distributions | | | 98,424 | | | | 3,853,305 | |
Shares reacquired | | | (1,126,200 | ) | | | (46,740,710 | ) |
| | | | | | | | |
Net increase (decrease) in shares outstanding before conversion | | | (146,816 | ) | | | (5,964,063 | ) |
Shares issued upon conversion from Class C | | | 451 | | | | 20,041 | |
| | | | | | | | |
Net increase (decrease) in shares outstanding | | | (146,365 | ) | | $ | (5,944,022 | ) |
| | | | | | | | |
Year ended September 30, 2013: | | | | | | | | |
Shares sold | | | 1,411,124 | | | $ | 50,148,795 | |
Shares issued in reinvestment of dividends and distributions | | | 112,570 | | | | 3,432,246 | |
Shares reacquired | | | (1,056,017 | ) | | | (36,289,579 | ) |
| | | | | | | | |
Net increase (decrease) in shares outstanding | | | 467,677 | | | $ | 17,291,462 | |
| | | | | | | | |
Class Z | | | | | | |
Year ended September 30, 2014: | | | | | | | | |
Shares sold | | | 1,976,752 | | | $ | 82,056,093 | |
Shares issued in reinvestment of dividends and distributions | | | 181,468 | | | | 7,108,110 | |
Shares reacquired | | | (3,332,087 | ) | | | (138,342,689 | ) |
| | | | | | | | |
Net increase (decrease) in shares outstanding before conversion | | | (1,173,867 | ) | | | (49,178,486 | ) |
Shares issued upon conversion from Class A and Class C | | | 5,967 | | | | 235,839 | |
| | | | | | | | |
Net increase (decrease) in shares outstanding | | | (1,167,900 | ) | | $ | (48,942,647 | ) |
| | | | | | | | |
Year ended September 30, 2013: | | | | | | | | |
Shares sold | | | 2,440,931 | | | $ | 83,673,455 | |
Shares issued in reinvestment of dividends and distributions | | | 229,313 | | | | 6,994,050 | |
Shares reacquired | | | (3,753,807 | ) | | | (128,835,254 | ) |
| | | | | | | | |
Net increase (decrease) in shares outstanding before conversion | | | (1,083,563 | ) | | | (38,167,749 | ) |
Shares issued upon conversion from Class A and Class C | | | 783 | | | | 28,504 | |
Shares reacquired upon conversion into Class A | | | (237 | ) | | | (8,874 | ) |
| | | | | | | | |
Net increase (decrease) in shares outstanding | | | (1,083,017 | ) | | $ | (38,148,119 | ) |
| | | | | | | | |
Note 7. Borrowings
The Fund, along with other affiliated registered investment companies (the “Funds”), is a party to a Syndicated Credit Agreement (“SCA”) with a group of banks. The purpose of the SCA is to provide an alternative source of temporary funding for capital share redemptions. The SCA provides for a commitment of $900 million for the period November 5, 2013 through October 8, 2014. The Funds pay an annualized commitment fee of 0.08% on the unused portion of the SCA. Interest on any borrowings under the SCA is paid at contracted market rates. The commitment fee for the unused amount is accrued daily and paid quarterly.
| | | | |
| Prudential Stock Index Fund | | | 47 | |
Notes to Financial Statements
continued
Subsequent to the fiscal year end, the SCA has been renewed effective October 9, 2014 and will continue to provide a commitment of $900 million through October 8, 2015. Effective October 9, 2014, the Funds pay an annualized commitment fee of .075% of the unused portion of the SCA.
The Fund did not utilize the SCA during the year ended September 30, 2014.
Financial Highlights
| | | | | | | | | | | | | | | | | | | | |
| Class A Shares | |
| | | Year Ended September 30, | |
| | | 2014 | | | 2013 | | | 2012 | | | 2011 | | | 2010 | |
| Per Share Operating Performance(a): | | | | | | | | | | | | | | | | | | | | |
| Net Asset Value, Beginning Of Year | | | $37.45 | | | | $32.09 | | | | $25.16 | | | | $25.34 | | | | $23.48 | |
| Income (loss) from investment operations: | | | | | | | | | | | | | | | | | | | | |
| Net investment income | | | .61 | | | | .58 | | | | .47 | | | | .40 | | | | .37 | |
| Net realized and unrealized gain (loss) on investment transactions | | | 6.47 | | | | 5.30 | | | | 6.90 | | | | (.20 | ) | | | 1.88 | |
| Total from investment operations | | | 7.08 | | | | 5.88 | | | | 7.37 | | | | .20 | | | | 2.25 | |
| Less Dividends and Distributions: | | | | | | | | | | | | | | | | | | | | |
| Dividends from net investment income | | | (.47 | ) | | | (.52 | ) | | | (.44 | ) | | | (.38 | ) | | | (.39 | ) |
| Distributions from net realized gains | | | (.09 | ) | | | - | | | | - | | | | - | | | | - | |
| Total dividends and distributions | | | (.56 | ) | | | (.52 | ) | | | (.44 | ) | | | (.38 | ) | | | (.39 | ) |
| Net asset value, end of year | | | $43.97 | | | | $37.45 | | | | $32.09 | | | | $25.16 | | | | $25.34 | |
| Total Return(b): | | | 19.09% | | | | 18.71% | | | | 29.60% | | | | .74% | | | | 9.63% | |
| | | | | | | | | | | | | | | | | | | | |
| Ratios/Supplemental Data: | | | | | | | | | | | | | | | |
| Net assets, end of year (000) | | | $197,250 | | | | $162,557 | | | | $144,851 | | | | $118,691 | | | | $114,403 | |
| Average net assets (000) | | | $184,199 | | | | $153,755 | | | | $135,485 | | | | $131,565 | | | | $104,488 | |
| Ratios to average net assets(c): | | | | | | | | | | | | | | | | | | | | |
| Expenses after waivers and/or expense reimbursement | | | .53% | | | | .54% | | | | .55% | | | | .55% | | | | .56% | |
| Expenses before waivers and/or expense reimbursement | | | .67% | | | | .76% | | | | .77% | | | | .77% | | | | .78% | |
| Net investment income | | | 1.47% | | | | 1.69% | | | | 1.61% | | | | 1.43% | | | | 1.50% | |
| Portfolio turnover rate | | | 4% | | | | 3% | | | | 4% | | | | 5% | | | | 5% | |
(a) Calculated based on average shares outstanding during the year.
(b) Total return does not consider the effects of sales loads. Total return is calculated assuming a purchase of a share on the first day and a sale on the last day of each year reported, and includes reinvestment of dividends and distributions. Total returns may reflect adjustments to conform to generally accepted accounting principles. Total return includes the effect of expense subsidies.
(c) Does not include expenses of the underlying portfolio in which the Fund invests.
See Notes to Financial Statements.
| | | | |
| Prudential Stock Index Fund | | | 49 | |
Financial Highlights
continued
| | | | | | | | | | | | | | | | | | | | |
| Class C Shares | |
| | | Year Ended September 30, | |
| | | 2014 | | | 2013 | | | 2012 | | | 2011 | | | 2010 | |
| Per Share Operating Performance(a): | | | | | | | | | | | | | | | | | | | | |
| Net Asset Value, Beginning Of Year | | | $37.18 | | | | $31.87 | | | | $24.99 | | | | $25.18 | | | | $23.33 | |
| Income (loss) from investment operations: | | | | | | | | | | | | | | | | | | | | |
| Net investment income | | | .35 | | | | .36 | | | | .29 | | | | .23 | | | | .21 | |
| Net realized and unrealized gain (loss) on investment and transactions | | | 6.45 | | | | 5.29 | | | | 6.86 | | | | (.19 | ) | | | 1.87 | |
| Total from investment operations | | | 6.80 | | | | 5.65 | | | | 7.15 | | | | .04 | | | | 2.08 | |
| Less Dividends and Distributions: | | | | | | | | | | | | | | | | | | | | |
| Dividends from net investment income | | | (.25 | ) | | | (.34 | ) | | | (.27 | ) | | | (.23 | ) | | | (.23 | ) |
| Distributions from net realized gains | | | (.09 | ) | | | - | | | | - | | | | - | | | | - | |
| Total dividends and distributions | | | (.34 | ) | | | (.34 | ) | | | (.27 | ) | | | (.23 | ) | | | (.23 | ) |
| Net asset value, end of year | | | $43.64 | | | | $37.18 | | | | $31.87 | | | | $24.99 | | | | $25.18 | |
| Total Return(b): | | | 18.38% | | | | 17.96% | | | | 28.78% | | | | .14% | | | | 8.96% | |
| | | | | | | | | | | | | | | | | | | | |
| Ratios/Supplemental Data: | | | | | | | | | | | | | | | |
| Net assets, end of year (000) | | | $38,749 | | | | $29,139 | | | | $23,924 | | | | $20,351 | | | | $22,615 | |
| Average net assets (000) | | | $34,419 | | | | $25,730 | | | | $23,103 | | | | $23,884 | | | | $23,196 | |
| Ratios to average net assets(c): | | | | | | | | | | | | | | | | | | | | |
Expenses after waivers and/or expense reimbursement | | | 1.16% | | | | 1.16% | | | | 1.17% | | | | 1.17% | | | | 1.19% | |
| Expenses before waivers and/or expense reimbursement | | | 1.30% | | | | 1.38% | | | | 1.39% | | | | 1.39% | | | | 1.41% | |
| Net investment income | | | .84% | | | | 1.06% | | | | .99% | | | | .81% | | | | .86% | |
| Portfolio turnover rate | | | 4% | | | | 3% | | | | 4% | | | | 5% | | | | 5% | |
(a) Calculated based on average shares outstanding during the year.
(b) Total return does not consider the effects of sales loads. Total return is calculated assuming a purchase of a share on the first day and a sale on the last day of each year reported, and includes reinvestment of dividends and distributions. Total returns may reflect adjustments to conform to generally accepted accounting principles. Total return includes the effect of expense subsidies.
(c) Does not include expenses of the underlying portfolio in which the Fund invests.
See Notes to Financial Statements.
| | | | | | | | | | | | | | | | | | | | |
| Class I Shares | |
| | | Year Ended September 30, | |
| | | 2014 | | | 2013 | | | 2012 | | | 2011 | | | 2010 | |
| Per Share Operating Performance(a): | | | | | | | | | | | | | | | | | | | | |
| Net Asset Value, Beginning Of Year | | | $37.57 | | | | $32.20 | | | | $25.25 | | | | $25.43 | | | | $23.55 | |
| Income (loss) from investment operations: | | | | | | | | | | | | | | | | | | | | |
| Net investment income | | | .75 | | | | .70 | | | | .55 | | | | .50 | | | | .46 | |
| Net realized and unrealized gain (loss) on investment and transactions | | | 6.51 | | | | 5.30 | | | | 6.94 | | | | (.21 | ) | | | 1.89 | |
| Total from investment operations | | | 7.26 | | | | 6.00 | | | | 7.49 | | | | .29 | | | | 2.35 | |
| Less Dividends and Distributions: | | | | | | | | | | | | | | | | | | | | |
| Dividends from net investment income | | | (.60 | ) | | | (.63 | ) | | | (.54 | ) | | | (.47 | ) | | | (.47 | ) |
| Distributions from net realized gains | | | (.09 | ) | | | - | | | | - | | | | - | | | | - | |
| Total dividends and distributions | | | (.69 | ) | | | (.63 | ) | | | (.54 | ) | | | (.47 | ) | | | (.47 | ) |
| Net asset value, end of year | | | $44.14 | | | | $37.57 | | | | $32.20 | | | | $25.25 | | | | $25.43 | |
| Total Return(b): | | | 19.54% | | | | 19.09% | | | | 30.06% | | | | 1.08% | | | | 10.08% | |
| | | | | | | | | | | | | | | | | | | | |
| Ratios/Supplemental Data: | | | | | | | | | | | | | | | |
| Net assets, end of year (000) | | | $255,507 | | | | $222,993 | | | | $176,040 | | | | $331,595 | | | | $322,850 | |
| Average net assets (000) | | | $241,829 | | | | $193,507 | | | | $214,339 | | | | $376,719 | | | | $321,048 | |
| Ratios to average net assets(c): | | | | | | | | | | | | | | | | | | | | |
| Expenses after waivers and/or expense reimbursement | | | .19% | | | | .19% | | | | .19% | | | | .19% | | | | .20% | |
| Expenses before waivers and/or expense reimbursement | | | .33% | | | | .41% | | | | .41% | | | | .41% | | | | .42% | |
| Net investment income | | | 1.81% | | | | 2.03% | | | | 2.00% | | | | 1.79% | | | | 1.85% | |
| Portfolio turnover rate | | | 4% | | | | 3% | | | | 4% | | | | 5% | | | | 5% | |
(a) Calculated based on average shares outstanding during the year.
(b) Total return is calculated assuming a purchase of a share on the first day and a sale on the last day of each year reported, and includes reinvestment of dividends and distributions. Total returns may reflect adjustments to conform to generally accepted accounting principles. Total return includes the effect of expense subsidies.
(c) Does not include expenses of the underlying portfolio in which the Fund invests.
See Notes to Financial Statements.
| | | | |
| Prudential Stock Index Fund | | | 51 | |
Financial Highlights
continued
| | | | | | | | | | | | | | | | | | | | |
| Class Z Shares | |
| | | Year Ended September 30, | |
| | | 2014 | | | 2013 | | | 2012 | | | 2011 | | | 2010 | |
| Per Share Operating Performance(a): | | | | | | | | | | | | | | | | | | | | |
| Net Asset Value, Beginning Of Year | | | $37.57 | | | | $32.19 | | | | $25.25 | | | | $25.42 | | | | $23.54 | |
| Income (loss) from investment operations: | | | | | | | | | | | | | | | | | | | | |
| Net investment income | | | .73 | | | | .68 | | | | .56 | | | | .48 | | | | .44 | |
| Net realized and unrealized gain (loss) on investment transactions | | | 6.49 | | | | 5.31 | | | | 6.90 | | | | (.20 | ) | | | 1.90 | |
| Total from investment operations | | | 7.22 | | | | 5.99 | | | | 7.46 | | | | .28 | | | | 2.34 | |
| Less Dividends and Distributions: | | | | | | | | | | | | | | | | | | | | |
| Dividends from net investment income | | | (.58 | ) | | | (.61 | ) | | | (.52 | ) | | | (.45 | ) | | | (.46 | ) |
| Distributions from net realized gains | | | (.09 | ) | | | - | | | | - | | | | - | | | | - | |
| Total dividends and distributions | | | (.67 | ) | | | (.61 | ) | | | (.52 | ) | | | (.45 | ) | | | (.46 | ) |
| Net asset value, end of year | | | $44.12 | | | | $37.57 | | | | $32.19 | | | | $25.25 | | | | $25.42 | |
| Total Return(b): | | | 19.42% | | | | 19.06% | | | | 29.94% | | | | 1.06% | | | | 10.03% | |
| | | | | | | | | | | | | | | | | | | | |
| Ratios/Supplemental Data: | | | | | | | | | | | | | | | |
| Net assets, end of year (000) | | | $425,001 | | | | $405,721 | | | | $382,510 | | | | $336,727 | | | | $352,470 | |
| Average net assets (000) | | | $424,209 | | | | $390,330 | | | | $373,819 | | | | $381,784 | | | | $383,488 | |
| Ratios to average net assets(c): | | | | | | | | | | | | | | | | | | | | |
| Expenses after waivers and/or expense reimbursement | | | .25% | | | | .25% | | | | .25% | | | | .25% | | | | .26% | |
| Expenses before waivers and/or expense reimbursement | | | .39% | | | | .47% | | | | .47% | | | | .47% | | | | .48% | |
| Net investment income | | | 1.75% | | | | 1.98% | | | | 1.91% | | | | 1.73% | | | | 1.79% | |
| Portfolio turnover rate | | | 4% | | | | 3% | | | | 4% | | | | 5% | | | | 5% | |
(a) Calculated based on average shares outstanding during the year.
(b) Total return is calculated assuming a purchase of a share on the first day and a sale on the last day of each year reported, and includes reinvestment of dividends and distributions. Total returns may reflect adjustments to conform to generally accepted accounting principles. Total return includes the effect of expense subsidies.
(c) Does not include expenses of the underlying portfolio in which the Fund invests.
See Notes to Financial Statements.
Report of Independent Registered Public
Accounting Firm
The Board of Trustees and Shareholders
Prudential Investment Portfolios 8:
We have audited the accompanying statement of assets and liabilities of Prudential Stock Index Fund, a series of Prudential Investment Portfolios 8, (hereafter referred to as the “Fund”), including the portfolio of investments, as of September 30, 2014, and the related statement of operations for the year then ended, the statements of changes in net assets for each of the years in the two-year period then ended and the financial highlights for each of the years in the five-year period then ended. These financial statements and financial highlights are the responsibility of the Fund’s management. Our responsibility is to express an opinion on these financial statements and financial highlights based on our audits.
We conducted our audits in accordance with the standards of the Public Company Accounting Oversight Board (United States). Those standards require that we plan and perform the audit to obtain reasonable assurance about whether the financial statements and financial highlights are free of material misstatement. An audit includes examining, on a test basis, evidence supporting the amounts and disclosures in the financial statements. Our procedures included confirmation of securities owned as of September 30, 2014, by correspondence with the custodian, transfer agent and brokers or by other appropriate auditing procedures when replies from brokers were not received. An audit also includes assessing the accounting principles used and significant estimates made by management, as well as evaluating the overall financial statement presentation. We believe that our audits provide a reasonable basis for our opinion.
In our opinion, the financial statements and financial highlights referred to above present fairly, in all material respects, the financial position of the Fund as of September 30, 2014, and the results of its operations for the year then ended, the changes in its net assets for each of the years in the two-year period then ended and the financial highlights for each of the years in the five-year period then ended, in conformity with U.S. generally accepted accounting principles.
New York, New York
November 14, 2014
| | | | |
| Prudential Stock Index Fund | | | 53 | |
Tax Information
(Unaudited)
We are advising you that during the fiscal year ended September 30, 2014, the Fund reported the maximum amount allowed per share, but not less that $0.09 per share for classes A, C, I, and Z shares as a capital gain distribution in accordance with Section 852(b)(3)(C) of the Internal Revenue Code.
For the year ended September 30, 2014, the Fund reports, in accordance with Section 854 of the Internal Revenue Code, the following percentages of the ordinary income dividends paid as 1) qualified dividend income (QDI); and 2) eligible for corporate dividends received deduction (DRD):
| | | | | | | | |
| | | QDI | | | DRD | |
Prudential Stock Index Fund | | | 100.00% | | | | 99.52% | |
In January 2015, you will be advised on IRS Form 1099-DIV or substitute 1099-DIV, as to the federal tax status of dividends and distributions received by you in calendar year 2014.
INFORMATION ABOUT BOARD MEMBERS AND OFFICERS
(Unaudited)
Information about Board Members and Officers of the Fund is set forth below. Board Members who are not deemed to be “interested persons” of the Fund, as defined in the 1940 Act, are referred to as “Independent Board Members.” Board Members who are deemed to be “interested persons” of the Fund are referred to as “Interested Board Members.” The Board Members are responsible for the overall supervision of the operations of the Fund and perform the various duties imposed on the directors of investment companies by the 1940 Act. The Board in turn elects the Officers, who are responsible for administering the day-to-day operations of the Fund.
| | | | |
| Independent Board Members(1) |
Name, Address, Age Position(s) Portfolios Overseen | | Principal Occupation(s) During Past Five Years | | Other Directorships Held |
Ellen S. Alberding (56) Board Member Portfolios Overseen: 70 | | President and Board Member, The Joyce Foundation (charitable foundation) (since 2002); Vice Chair, City Colleges of Chicago (community college system) (since 2011); Trustee, Skills for America’s Future (national initiative to connect employers to community colleges) (since 2011); Trustee, National Park Foundation (charitable foundation for national park system) (since 2009); Trustee, Economic Club of Chicago (since 2009). | | None. |
Kevin J. Bannon (62) Board Member Portfolios Overseen: 71 | | Managing Director (since April 2008) and Chief Investment Officer (October 2008-November 2013) of Highmount Capital LLC (registered investment adviser); formerly Executive Vice President and Chief Investment Officer (April 1993-August 2007) of Bank of New York Company; President (May 2003-May 2007) of BNY Hamilton Family of Mutual Funds. | | Director of Urstadt Biddle Properties (equity real estate investment trust) (since September 2008). |
Linda W. Bynoe (62) Board Member Portfolios Overseen: 71 | | President and Chief Executive Officer (since March 1995) and formerly Chief Operating Officer (December 1989-February 1995) of Telemat Ltd. (management consulting); formerly Vice President (January 1985-June 1989) at Morgan Stanley & Co (broker-dealer). | | Director of Simon Property Group, Inc. (retail real estate) (May 2003-May 2012); Director of Anixter International, Inc. (communication products distributor) (since January 2006); Director of Northern Trust Corporation (financial services) (since April 2006); Trustee of Equity Residential (residential real estate) (since December 2009). |
Prudential Stock Index Fund
| | | | |
| Independent Board Members(1) |
Name, Address, Age Position(s) Portfolios Overseen | | Principal Occupation(s) During Past Five Years | | Other Directorships Held |
Keith F. Hartstein (58) Board Member Portfolios Overseen: 71 | | Retired; Formerly President and Chief Executive Officer (2005-2012), Senior Vice President (2004-2005), Senior Vice President of Sales and Marketing (1997-2004), and various executive management positions (1990-1997), John Hancock Funds, LLC (asset management); Chairman, Investment Company Institute’s Sales Force Marketing Committee (2003-2008). | | None. |
Michael S. Hyland, CFA (69) Board Member Portfolios Overseen: 70 | | Retired (since February 2005); Formerly Senior Managing Director (July 2001-February 2005) of Bear Stearns & Co, Inc.; Global Partner, INVESCO (1999-2001); Managing Director and President of Salomon Brothers Asset Management (1989-1999). | | None. |
Douglas H. McCorkindale (75) Board Member Portfolios Overseen: 70 | | Retired; Formerly Chairman (February 2001-June 2006), Chief Executive Officer (June 2000-July 2005), President (September 1997-July 2005) and Vice Chairman (March 1984-May 2000) of Gannett Co. Inc. (publishing and media). | | Director of Lockheed Martin Corp. (aerospace and defense) (since May 2001). |
Stephen P. Munn (72) Board Member Portfolios Overseen: 71 | | Lead Director (since 2007) and formerly Chairman (1993-2007) of Carlisle Companies Incorporated (manufacturer of industrial products). | | Lead Director (since 2007) of Carlisle Companies Incorporated (manufacturer of industrial products). |
James E. Quinn (62) Board Member Portfolios Overseen: 70 | | Retired; Formerly President (2003-2012) and Director (2003-2008), and Vice Chairman and Director (1998-2003), Tiffany & Company (jewelry retailing); Director, Mutual of America Capital Management Corporation (asset management) (since 1996); Director, Hofstra University (since 2008); Vice Chairman, Museum of the City of New York (since 1994). | | Director of Deckers Outdoor Corporation (footwear manufacturer) (since 2011). |
Richard A. Redeker (71) Board Member & Independent Chair Portfolios Overseen: 71 | | Retired Mutual Fund Senior Executive (44 years); Management Consultant; Director, Mutual Fund Directors Forum (since 2014); Independent Directors Council (organization of 2,800 Independent Mutual Fund Directors)-Executive Committee, Chair of Policy Steering Committee, Governing Council. | | None. |
Visit our website at www.prudentialfunds.com
| | | | |
| Independent Board Members(1) |
Name, Address, Age Position(s) Portfolios Overseen | | Principal Occupation(s) During Past Five Years | | Other Directorships Held |
Robin B. Smith (75) Board Member Portfolios Overseen: 70 | | Chairman of the Board (since January 2003) of Publishers Clearing House (direct marketing); Member of the Board of Directors of ADLPartner (marketing) (since December 2010); formerly Chairman and Chief Executive Officer (August 1996-January 2003) of Publishers Clearing House. | | Formerly Director of BellSouth Corporation (telecommunications) (1992-2006). |
Stephen G. Stoneburn (71) Board Member Portfolios Overseen: 71 | | Chairman, (since July 2011), President and Chief Executive Officer (since June 1996) of Quadrant Media Corp. (publishing company); formerly President (June 1995-June 1996) of Argus Integrated Media, Inc.; Senior Vice President and Managing Director (January 1993-1995) of Cowles Business Media; Senior Vice President of Fairchild Publications, Inc. (1975-1989). | | None. |
| | | | |
| Interested Board Members(1) |
Name, Address, Age Position(s) Portfolios Overseen | | Principal Occupation(s) During Past Five Years | | Other Directorships Held |
Stuart S. Parker (52) Board Member & President Portfolios Overseen: 65 | | President of Prudential Investments LLC (since January 2012); Executive Vice President of Prudential Investment Management Services LLC (since December 2012); Executive Vice President of Jennison Associates LLC and Head of Retail Distribution of Prudential Investments LLC (June 2005-December 2011). | | None. |
Scott E. Benjamin (41) Board Member & Vice President Portfolios Overseen: 71 | | Executive Vice President (since June 2009) of Prudential Investments LLC; Executive Vice President (June 2009-June 2012) and Vice President (since June 2012) of Prudential Investment Management Services LLC; Executive Vice President (since September 2009) of AST Investment Services, Inc.; Senior Vice President of Product Development and Marketing, Prudential Investments (since February 2006); Vice President of Product Development and Product Management, Prudential Investments (2003-2006). | | None. |
Prudential Stock Index Fund
| (1) | The year in which each individual joined the Fund’s Board is as follows: |
Ellen S. Alberding, 2013; Kevin J. Bannon, 2008; Linda W. Bynoe, 2005; Keith F. Hartstein, 2013; Michael S. Hyland, 2008; Douglas H. McCorkindale, 1996; Stephen P. Munn, 2008; James E. Quinn, 2013; Richard A. Redeker, 1996; Robin B. Smith, 1996; Stephen G. Stoneburn, 2003; Stuart S. Parker, Board Member and President since 2012; Scott E. Benjamin, Board Member since 2010 and Vice President since 2009.
| | | | |
| Fund Officers(a) |
Name, Address and Age Position with Fund | | Principal Occupation(s) During Past Five Years | | Length of Service as Fund Officer |
Raymond A. O’Hara (59) Chief Legal Officer | | Vice President and Corporate Counsel (since July 2010) of Prudential Insurance Company of America (Prudential); Vice President (March 2011-Present) of Pruco Life Insurance Company and Pruco Life Insurance Company of New Jersey; Vice President and Corporate Counsel (March 2011-Present) of Prudential Annuities Life Assurance Corporation; Chief Legal Officer of Prudential Investments LLC (since June 2012); Chief Legal Officer of Prudential Mutual Fund Services LLC (since June 2012) and Corporate Counsel of AST Investment Services, Inc. (since June 2012); formerly Assistant Vice President and Corporate Counsel (September 2008-July 2010) of The Hartford Financial Services Group, Inc.; formerly Associate (September 1980-December 1987) and Partner (January 1988–August 2008) of Blazzard & Hasenauer, P.C. (formerly, Blazzard, Grodd & Hasenauer, P.C.). | | Since 2012 |
Chad A. Earnst (39) Chief Compliance Officer | | Chief Compliance Officer (September 2014-Present) of Prudential Investments LLC; Chief Compliance Officer (September 2014-Present) of the Prudential Investments Funds, Target Funds, Advanced Series Trust, The Prudential Series Fund, Prudential’s Gibraltar Fund, Inc., Prudential Global Short Duration High Yield Income Fund, Inc., Prudential Short Duration High Yield Fund, Inc. and Prudential Jennison MLP Income Fund, Inc.; formerly Assistant Director (March 2010-August 2014) of the Asset Management Unit, Division of Enforcement, US Securities & Exchange Commission; Assistant Regional Director (January 2010-August 2014), Branch Chief (June 2006–December 2009) and Senior Counsel (April 2003-May 2006) of the Miami Regional Office, Division of Enforcement, US Securities & Exchange Commission. | | Since 2014 |
Deborah A. Docs (56) Secretary | | Vice President and Corporate Counsel (since January 2001) of Prudential; Vice President (since December 1996) and Assistant Secretary (since March 1999) of Prudential Investments LLC; formerly Vice President and Assistant Secretary (May 2003-June 2005) of AST Investment Services, Inc. | | Since 2004 |
Visit our website at www.prudentialfunds.com
| | | | |
| Fund Officers(a) |
Name, Address and Age Position with Fund | | Principal Occupation(s) During Past Five Years | | Length of Service as Fund Officer |
Jonathan D. Shain (56) Assistant Secretary | | Vice President and Corporate Counsel (since August 1998) of Prudential; Vice President and Assistant Secretary (since May 2001) of Prudential Investments LLC; Vice President and Assistant Secretary (since February 2001) of Prudential Mutual Fund Services LLC; formerly Vice President and Assistant Secretary (May 2003-June 2005) of AST Investment Services, Inc. | | Since 2005 |
Claudia DiGiacomo (40) Assistant Secretary | | Vice President and Corporate Counsel (since January 2005) of Prudential; Vice President and Assistant Secretary of Prudential Investments LLC (since December 2005); Associate at Sidley Austin Brown & Wood LLP (1999-2004). | | Since 2005 |
Andrew R. French (51) Assistant Secretary | | Vice President and Corporate Counsel (since February 2010) of Prudential; formerly Director and Corporate Counsel (2006-2010) of Prudential; Vice President and Assistant Secretary (since January 2007) of Prudential Investments LLC; Vice President and Assistant Secretary (since January 2007) of Prudential Mutual Fund Services LLC. | | Since 2006 |
Amanda S. Ryan (36) Assistant Secretary | | Director and Corporate Counsel (since March 2012) of Prudential; Director and Assistant Secretary (since June 2012) of Prudential Investments LLC; Associate at Ropes & Gray LLP (2008-2012). | | Since 2012 |
Theresa C. Thompson (52) Deputy Chief Compliance Officer | | Vice President, Compliance, Prudential Investments LLC (since April 2004); and Director, Compliance, Prudential Investments LLC (2001-2004). | | Since 2008 |
Richard W. Kinville (46) Anti-Money Laundering Compliance Officer | | Vice President, Corporate Compliance, Anti-Money Laundering Unit (since January 2005) of Prudential; committee member of the American Council of Life Insurers Anti-Money Laundering and Critical Infrastructure Committee (since January 2007); formerly Investigator and Supervisor in the Special Investigations Unit for the New York Central Mutual Fire Insurance Company (August 1994-January 1999); Investigator in AXA Financial’s Internal Audit Department and Manager in AXA’s Anti-Money Laundering Office (January 1999-January 2005); first chair of the American Council of Life Insurers Anti-Money Laundering and Critical Infrastructure Committee (June 2007-December 2009). | | Since 2011 |
M. Sadiq Peshimam (50) Treasurer and Principal Financial and Accounting Officer | | Assistant Treasurer of funds in the Prudential Mutual Fund Complex (2006-2014); Vice President (since 2005) of Prudential Investments LLC. | | Since 2006 |
Peter Parrella (56) Assistant Treasurer | | Vice President (since 2007) and Director (2004-2007) within Prudential Mutual Fund Administration; formerly Tax Manager at SSB Citi Fund Management LLC (1997-2004). | | Since 2007 |
Prudential Stock Index Fund
| | | | |
| Fund Officers(a) |
Name, Address and Age Position with Fund | | Principal Occupation(s) During Past Five Years | | Length of Service as Fund Officer |
Lana Lomuti (47) Assistant Treasurer | | Vice President (since 2007) and Director (2005-2007), within Prudential Mutual Fund Administration; formerly Assistant Treasurer (December 2007-February 2014) of The Greater China Fund, Inc. | | Since 2014 |
Linda McMullin (53) Assistant Treasurer | | Vice President (since 2011) and Director (2008-2011) within Prudential Mutual Fund Administration. | | Since 2014 |
| (a) | Excludes Mr. Parker and Mr. Benjamin, interested Board Members who also serve as President and Vice President, respectively. |
Explanatory Notes to Tables:
| • | | Board Members are deemed to be “Interested,” as defined in the 1940 Act, by reason of their affiliation with Prudential Investments LLC and/or an affiliate of Prudential Investments LLC. |
| • | | Unless otherwise noted, the address of all Board Members and Officers is c/o Prudential Investments LLC, Gateway Center Three, 100 Mulberry Street, Newark, New Jersey 07102-4077. |
| • | | There is no set term of office for Board Members or Officers. The Board Members have adopted a retirement policy, which calls for the retirement of Board Members on December 31 of the year in which they reach the age of 75. |
| • | | “Other Directorships Held” includes only directorships of companies required to register or file reports with the SEC under the 1934 Act (that is, “public companies”) or other investment companies registered under the 1940 Act. |
| • | | “Portfolios Overseen” includes all investment companies managed by Prudential Investments LLC. The investment companies for which Prudential Investments LLC serves as manager include the Prudential Investments Mutual Funds, The Prudential Variable Contract Accounts, Target Mutual Funds, Prudential Short Duration High Yield Fund, Inc., Prudential Global Short Duration High Yield Fund, Inc., The Prudential Series Fund, Prudential’s Gibraltar Fund, Inc. and the Advanced Series Trust. |
Visit our website at www.prudentialfunds.com
Approval of Advisory Agreements
The Fund’s Board of Trustees
The Board of Trustees (the “Board”) of Prudential Stock Index Fund (the “Fund”)1 consists of thirteen individuals, eleven of whom are not “interested persons” of the Fund, as defined in the Investment Company Act of 1940, as amended (the “1940 Act”) (the “Independent Trustees”). The Board is responsible for the oversight of the Fund and its operations, and performs the various duties imposed on the directors of investment companies by the 1940 Act. The Independent Trustees have retained independent legal counsel to assist them in connection with their duties. The Chair of the Board is an Independent Trustee. The Board has established three standing committees: the Audit Committee, the Nominating and Governance Committee, and the Investment Committee. Each committee is chaired by, and composed of, Independent Trustees.
Annual Approval of the Fund’s Advisory Agreements
As required under the 1940 Act, the Board determines annually whether to renew the Fund’s management agreement with Prudential Investments LLC (“PI”) and the Fund’s subadvisory agreement with Quantitative Management Associates LLC (“QMA”). In considering the renewal of the agreements, the Board, including all of the Independent Trustees, met on June 9-11, 2014 and approved the renewal of the agreements through July 31, 2015, after concluding that the renewal of the agreements was in the best interests of the Fund and its shareholders.
In advance of the meetings, the Board requested and received materials relating to the agreements, and had the opportunity to ask questions and request further information in connection with its consideration. Among other things, the Board considered comparative fee information from PI and QMA. Also, the Board considered comparisons with other mutual funds in relevant Peer Universes and Peer Groups, as is further discussed below.
In approving the agreements, the Board, including the Independent Trustees advised by independent legal counsel, considered the factors it deemed relevant, including the nature, quality and extent of services provided by PI and the subadviser, the performance of the Fund, the profitability of PI and its affiliates, expenses and fees, and the potential for economies of scale that may be shared with the Fund and its shareholders as the Fund’s assets grow. In their deliberations, the Trustees did not identify any single factor which alone was responsible for the Board’s decision to approve the agreements with respect to the Fund. In connection with its deliberations, the Board considered information provided by PI throughout the year at regular Board
| 1 | Prudential Stock Index Fund is the sole outstanding series of Prudential Investment Portfolios 8. |
Prudential Stock Index Fund
Approval of Advisory Agreements (continued)
meetings, presentations from portfolio managers and other information, as well as information furnished at or in advance of the meetings on June 9-11, 2014.
The Trustees determined that the overall arrangements between the Fund and PI, which serves as the Fund’s investment manager pursuant to a management agreement, and between PI and QMA, which serves as the Fund’s subadviser pursuant to the terms of a subadvisory agreement with PI, are in the best interests of the Fund and its shareholders in light of the services performed, fees charged and such other matters as the Trustees considered relevant in the exercise of their business judgment.
The material factors and conclusions that formed the basis for the Trustees’ reaching their determinations to approve the continuance of the agreements are separately discussed below.
Nature, Quality and Extent of Services
The Board received and considered information regarding the nature, quality and extent of services provided to the Fund by PI and QMA. The Board considered the services provided by PI, including but not limited to the oversight of the subadviser for the Fund, as well as the provision of fund recordkeeping, compliance, and other services to the Fund. With respect to PI’s oversight of the subadviser, the Board noted that PI’s Strategic Investment Research Group (“SIRG”), which is a business unit of PI, is responsible for monitoring and reporting to PI’s senior management on the performance and operations of the subadviser. The Board also considered that PI pays the salaries of all of the officers and non-independent Trustees of the Fund. The Board also considered the investment subadvisory services provided by QMA, as well as adherence to the Fund’s investment restrictions and compliance with applicable Fund policies and procedures. The Board considered PI’s evaluation of the subadviser, as well as PI’s recommendation, based on its review of the subadviser, to renew the subadvisory agreement.
The Board considered the qualifications, backgrounds and responsibilities of PI’s senior management responsible for the oversight of the Fund and QMA, and also considered the qualifications, backgrounds and responsibilities of QMA’s portfolio managers who are responsible for the day-to-day management of the Fund’s portfolio. The Board was provided with information pertaining to PI’s and QMA’s organizational structure, senior management, investment operations, and other relevant information pertaining to both PI and QMA. The Board also noted that it received favorable compliance reports from the Fund’s Chief Compliance Officer (“CCO”) as to both PI and QMA. The Board noted that QMA is affiliated with PI.
Visit our website at www.prudentialfunds.com
The Board concluded that it was satisfied with the nature, extent and quality of the investment management services provided by PI and the subadvisory services provided to the Fund by QMA, and that there was a reasonable basis on which to conclude that the Fund benefits from the services provided by PI and QMA under the management and subadvisory agreements.
Costs of Services and Profits Realized by PI
The Board was provided with information on the profitability of PI and its affiliates in serving as the Fund’s investment manager. The Board discussed with PI the methodology utilized in assembling the information regarding profitability and considered its reasonableness. The Board recognized that it is difficult to make comparisons of profitability from fund management contracts because comparative information is not generally publicly available and is affected by numerous factors, including the structure of the particular adviser, the types of funds it manages, its business mix, numerous assumptions regarding allocations and the adviser’s capital structure and cost of capital. However, the Board considered that the cost of services provided by PI during the year ended December 31, 2013 exceeded the management fees paid by PI, resulting in an operating loss to PI. The Board separately considered information regarding the profitability of the subadviser, an affiliate of PI. Taking these factors into account, the Board concluded that the profitability of PI and its affiliates in relation to the services rendered was not unreasonable.
Economies of Scale
In 2013, PI and the Board retained an outside business consulting firm, in order to assist the Board in its consideration of the renewal of the management and subadvisory agreements, by reviewing management fee breakpoint usage and trends in management fees across the mutual fund industry. The consulting firm’s analysis and conclusions with respect to the Funds’ management fee structures were presented to the Board and PI at the December 3-5, 2013 meeting, and were discussed extensively by the Board and PI over the following two quarters.
The Board noted that the management fee schedule for the Fund includes breakpoints, which have the effect of decreasing the fee rate as assets increase, but at the current level of assets, the Fund does not realize the effect of those rate reductions. The Board received and discussed information concerning whether PI realizes economies of scale as the Fund’s assets grow beyond current levels. The Board took note that the Fund’s fee structure would result in benefits to Fund shareholders when (and if) assets reach the levels at which the fee rate is reduced. These benefits will accrue whether or not PI is then realizing any economies of scale. The Board recognized the inherent limitations of any analysis of economies of scale,
Prudential Stock Index Fund
Approval of Advisory Agreements (continued)
stemming largely from the Board’s understanding that most of PI’s costs are not specific to individual funds, but rather are incurred across a variety of products and services.
Other Benefits to PI and QMA
The Board considered potential ancillary benefits that might be received by PI and QMA and their affiliates as a result of their relationship with the Fund. The Board concluded that potential benefits to be derived by PI included fees received by affiliates of PI for serving as the Fund’s securities lending agent, transfer agency fees received by the Fund’s transfer agent (which is affiliated with PI), and benefits to its reputation as well as other intangible benefits resulting from PI’s association with the Fund. The Board concluded that the potential benefits to be derived by QMA included its ability to use soft dollar credits, as well as the potential benefits consistent with those generally resulting from an increase in assets under management, specifically, potential access to additional research resources and benefits to its reputation. The Board concluded that the benefits derived by PI and QMA were consistent with the types of benefits generally derived by investment managers and subadvisers to mutual funds.
Performance of the Fund / Fees and Expenses
The Board considered certain additional specific factors and made related conclusions relating to the historical performance of the Fund for the one-, three-, five- and ten-year periods ended December 31, 2013.
The Board also considered the Fund’s actual management fee, as well as the Fund’s net total expense ratio, for the fiscal year ended September 30, 2013. The Board considered the management fee for the Fund as compared to the management fee charged by PI to other funds and the fee charged by other advisers to comparable mutual funds in a Peer Group. The actual management fee represents the fee rate actually paid by Fund shareholders and includes any fee waivers or reimbursements. The net total expense ratio for the Fund represents the actual expense ratio incurred by Fund shareholders.
The mutual funds included in the Peer Universe (the Lipper S&P 500 Index Funds Performance Universe) and the Peer Group were objectively determined by Lipper Inc. (“Lipper”), an independent provider of mutual fund data. The comparisons placed the Fund in various quartiles, with the first quartile being the best 25% of the mutual funds (for performance, the best performing mutual funds and, for expenses, the lowest cost mutual funds).
Visit our website at www.prudentialfunds.com
The section below summarizes key factors considered by the Board and the Board’s conclusions regarding the Fund’s performance, fees and overall expenses. The table sets forth gross performance comparisons (which do not reflect the impact on performance of fund expenses, or any subsidies, expense caps or waivers that may be applicable) with the Peer Universe, actual management fees with the Peer Group (which reflect the impact of any subsidies or fee waivers), and net total expenses with the Peer Group, each of which were key factors considered by the Board.
| | | | | | | | |
| Performance | | 1 Year | | 3 Years | | 5 Years | | 10 Years |
| | | 1st Quartile | | 1st Quartile | | 2nd Quartile | | 1st Quartile |
| Actual Management Fees: 1st Quartile |
| Net Total Expenses: 1st Quartile |
| | • | | The Board noted that the Fund outperformed its benchmark index over all periods. |
| | • | | The Board noted that effective April 1, 2014, PI had agreed to reduce the Fund’s existing contractual management fee rate, so that the Fund’s contractual management fee rate was as follows: 0.150% up to $1 billion, and 0.100% over $1 billion. |
| | • | | The Board and PI agreed to retain the existing management fee waiver so that the effective management fee rate is 0.08% though January 31, 2015. |
| | • | | The Board concluded that, in light of the Fund’s competitive performance, it would be in the best interests of the Fund and its shareholders to renew the agreements. |
| | • | | The Board concluded that the management fees (including subadvisory fees) and total expenses were reasonable in light of the services provided. |
* * *
After full consideration of these factors, the Board concluded that the approval of the agreements was in the best interests of the Fund and its shareholders.
Prudential Stock Index Fund
| | | | |
| n MAIL | | n TELEPHONE | | n WEBSITE |
Gateway Center Three 100 Mulberry Street Newark, NJ 07102 | | (800) 225-1852 | | www.prudentialfunds.com |
|
| PROXY VOTING |
| The Board of Trustees of the Fund has delegated to the Fund’s investment subadviser the responsibility for voting any proxies and maintaining proxy recordkeeping with respect to the Fund. A description of these proxy voting policies and procedures is available without charge, upon request, by calling (800) 225-1852 or by visiting the Securities and Exchange Commission’s website at www.sec.gov. Information regarding how the Fund voted proxies relating to portfolio securities during the most recent 12-month period ended June 30 is available on the Fund’s website and on the Securities and Exchange Commission’s website. |
|
| TRUSTEES |
| Ellen S. Alberding • Kevin J. Bannon • Scott E. Benjamin • Linda W. Bynoe • Keith F. Hartstein • Michael S. Hyland • Douglas H. McCorkindale • Stephen P. Munn • Stuart S. Parker • James E. Quinn • Richard A. Redeker • Robin B. Smith • Stephen G. Stoneburn |
|
| OFFICERS |
| Stuart S. Parker, President • Scott E. Benjamin, Vice President • M. Sadiq Peshimam, Treasurer and Principal Financial and Accounting Officer • Raymond A. O’Hara, Chief Legal Officer • Deborah A. Docs, Secretary • Chad A. Earnst, Chief Compliance Officer • Theresa C. Thompson, Deputy Chief Compliance Officer • Richard W. Kinville, Anti-Money Laundering Compliance Officer • Jonathan D. Shain, Assistant Secretary • Claudia DiGiacomo, Assistant Secretary • Amanda S. Ryan, Assistant Secretary • Andrew R. French, Assistant Secretary • Peter Parrella, Assistant Treasurer • Lana Lomuti, Assistant Treasurer • Linda McMullin, Assistant Treasurer |
| | | | |
| MANAGER | | Prudential Investments LLC | | Gateway Center Three
100 Mulberry Street
Newark, NJ 07102 |
|
| INVESTMENT SUBADVISER | | Quantitative Management
Associates LLC | | Gateway Center Two
100 Mulberry Street
Newark, NJ 07102 |
|
| DISTRIBUTOR | | Prudential Investment
Management Services LLC | | Gateway Center Three
100 Mulberry Street
Newark, NJ 07102 |
|
| CUSTODIAN | | The Bank of New York Mellon | | One Wall Street
New York, NY 10286 |
|
| TRANSFER AGENT | | Prudential Mutual Fund
Services LLC | | PO Box 9658
Providence, RI 02940 |
|
| INDEPENDENT REGISTERED PUBLIC ACCOUNTING FIRM | | KPMG LLP | | 345 Park Avenue
New York, NY 10154 |
|
| FUND COUNSEL | | Willkie Farr & Gallagher LLP | | 787 Seventh Avenue
New York, NY 10019 |
|
| An investor should consider the investment objectives, risks, charges, and expenses of the Fund carefully before investing. The prospectus and summary prospectus contain this and other information about the Fund. An investor may obtain a prospectus and summary prospectus by visiting our website at www.prudentialfunds.com or by calling (800) 225-1852. The prospectus and summary prospectus should be read carefully before investing. |
|
| E-DELIVERY |
| To receive your mutual fund documents online, go to www.prudentialfunds.com/edelivery and enroll. Instead of receiving printed documents by mail, you will receive notification via email when new materials are available. You can cancel your enrollment or change your email address at any time by visiting the website address above. |
|
| SHAREHOLDER COMMUNICATIONS WITH TRUSTEES |
| Shareholders can communicate directly with the Board of Trustees by writing to the Chair of the Board, Prudential Stock Index Fund, Prudential Investments, Attn: Board of Trustees, 100 Mulberry Street, Gateway Center Three, Newark, NJ 07102. Shareholders can communicate directly with an individual Trustee by writing to the same address. Communications are not screened before being delivered to the addressee. |
|
| AVAILABILITY OF PORTFOLIO SCHEDULE |
| The Fund files its complete schedule of portfolio holdings with the Securities and Exchange Commission for the first and third quarters of each fiscal year on Form N-Q. The Fund’s Forms N-Q are available on the Commission’s website at www.sec.gov. The Fund’s Forms N-Q may also be reviewed and copied at the Commission’s Public Reference Room in Washington, D.C. Information on the operation and location of the Public Reference Room may be obtained by calling 1-800-SEC-0330. The Fund’s schedule of portfolio holdings is also available on the Fund’s website as of the end of each month. |
|
| The Fund’s Statement of Additional Information contains additional information about the Fund’s Trustees and is available without charge, upon request, by calling (800) 225-1852. |
Mutual Funds:
| | | | |
ARE NOT INSURED BY THE FDIC OR ANY
FEDERAL GOVERNMENT AGENCY | | MAY LOSE VALUE | | ARE NOT A DEPOSIT OF OR GUARANTEED
BY ANY BANK OR ANY BANK AFFILIATE |

PRUDENTIAL STOCK INDEX FUND
| | | | | | | | | | |
| | | SHARE CLASS | | A | | C | | I | | Z |
| | NASDAQ | | PSIAX | | PSICX | | PDSIX | | PSIFX |
| | CUSIP | | 74441F108 | | 74441F306 | | 74441F405 | | 74441F504 |
MF174E 0269797-00001-00
Item 2 – Code of Ethics — See Exhibit (a)
As of the end of the period covered by this report, the registrant has adopted a code of ethics (the “Section 406 Standards for Investment Companies – Ethical Standards for Principal Executive and Financial Officers”) that applies to the registrant’s Principal Executive Officer and Principal Financial Officer; the registrant’s Principal Financial Officer also serves as the Principal Accounting Officer.
The registrant hereby undertakes to provide any person, without charge, upon request, a copy of the code of ethics. To request a copy of the code of ethics, contact the registrant 800-225-1852, and ask for a copy of the Section 406 Standards for Investment Companies - Ethical Standards for Principal Executive and Financial Officers.
Item 3 – Audit Committee Financial Expert –
The registrant’s Board has determined that Mr. Stephen P. Munn, member of the Board’s Audit Committee is an “audit committee financial expert,” and that he is “independent,” for purposes of this Item.
Item 4 – Principal Accountant Fees and Services –
(a) Audit Fees
For the fiscal years ended September 30, 2014 and September 30, 2013, KPMG LLP (“KPMG”), the Registrant’s principal accountant, billed the Registrant $22,950 and $22,500, respectively, for professional services rendered for the audit of the Registrant’s annual financial statements or services that are normally provided in connection with statutory and regulatory filings.
(b) Audit-Related Fees
None.
(c) Tax Fees
None.
(d) All Other Fees
None.
(e) (1) Audit Committee Pre-Approval Policies and Procedures
THE PRUDENTIAL MUTUAL FUNDS
AUDIT COMMITTEE POLICY
on
Pre-Approval of Services Provided by the Independent Accountants
The Audit Committee of each Prudential Mutual Fund is charged with the responsibility to monitor the independence of the Fund’s independent accountants. As part of this responsibility, the Audit Committee must pre-approve any independent accounting firm’s engagement to render audit and/or permissible non-audit services, as required by law. In evaluating a proposed engagement of the independent accountants, the Audit Committee will assess the effect that the engagement might reasonably be expected to have on the accountant’s independence. The Committee’s evaluation will be based on:
| | • | | a review of the nature of the professional services expected to be provided, |
| | • | | a review of the safeguards put into place by the accounting firm to safeguard independence, and |
| | • | | periodic meetings with the accounting firm. |
Policy for Audit and Non-Audit Services Provided to the Funds
On an annual basis, the scope of audits for each Fund, audit fees and expenses, and audit-related and non-audit services (and fees proposed in respect thereof) proposed to be performed by the Fund’s independent accountants will be presented by the Treasurer and the independent accountants to the Audit Committee for review and, as appropriate, approval prior to the initiation of such services. Such presentation shall be accompanied by confirmation by both the Treasurer and the independent accountants that the proposed services will not adversely affect the independence of the independent accountants. Proposed services shall be described in sufficient detail to enable the Audit Committee to assess the appropriateness of such services and fees, and the compatibility of the provision of such services with the auditor’s independence. The Committee shall receive periodic reports on the progress of the audit and other services which are approved by the Committee or by the Committee Chair pursuant to authority delegated in this Policy.
The categories of services enumerated under “Audit Services”, “Audit-related Services”, and “Tax Services” are intended to provide guidance to the Treasurer and the independent accountants as to those categories of services which the Committee believes are generally consistent with the independence of the independent accountants and which the Committee (or the Committee Chair) would expect upon the presentation of specific proposals to pre-approve. The enumerated categories are not intended as an exclusive list of audit, audit-related or tax services, which the Committee (or the Committee Chair) would consider for pre-approval.
Audit Services
The following categories of audit services are considered to be consistent with the role of the Fund’s independent accountants:
| | • | | Annual Fund financial statement audits |
| | • | | Seed audits (related to new product filings, as required) |
| | • | | SEC and regulatory filings and consents |
Audit-related Services
The following categories of audit-related services are considered to be consistent with the role of the Fund’s independent accountants:
| | • | | Accounting consultations |
| | • | | Fund merger support services |
| | • | | Agreed Upon Procedure Reports |
| | • | | Other Internal Control Reports |
Individual audit-related services that fall within one of these categories and are not presented to the Audit Committee as part of the annual pre-approval process will be subject to pre-approval by the Committee Chair (or any other Committee member on whom this responsibility has been delegated) so long as the estimated fee for those services does not exceed $50,000.
Tax Services
The following categories of tax services are considered to be consistent with the role of the Fund’s independent accountants:
| | • | | Tax compliance services related to the filing or amendment of the following: |
| | • | | Federal, state and local income tax compliance; and, |
| | • | | Sales and use tax compliance |
| | • | | Timely RIC qualification reviews |
| | • | | Tax distribution analysis and planning |
| | • | | Tax authority examination services |
| | • | | Tax appeals support services |
| | • | | Accounting methods studies |
| | • | | Fund merger support services |
| | • | | Tax consulting services and related projects |
Individual tax services that fall within one of these categories and are not presented to the Audit Committee as part of the annual pre-approval process will be subject to pre-approval by the Committee Chair (or any other Committee member on whom this responsibility has been delegated) so long as the estimated fee for those services does not exceed $50,000.
Other Non-audit Services
Certain non-audit services that the independent accountants are legally permitted to render will be subject to pre-approval by the Committee or by one or more Committee members to whom the Committee has delegated this authority and who will report to the full Committee any pre-approval decisions made pursuant to this Policy. Non-audit services presented for pre-approval pursuant to this paragraph will be accompanied by a confirmation from both the Treasurer and the
independent accountants that the proposed services will not adversely affect the independence of the independent accountants.
Proscribed Services
The Fund’s independent accountants will not render services in the following categories of non-audit services:
| | • | | Bookkeeping or other services related to the accounting records or financial statements of the Fund |
| | • | | Financial information systems design and implementation |
| | • | | Appraisal or valuation services, fairness opinions, or contribution-in-kind reports |
| | • | | Internal audit outsourcing services |
| | • | | Management functions or human resources |
| | • | | Broker or dealer, investment adviser, or investment banking services |
| | • | | Legal services and expert services unrelated to the audit |
| | • | | Any other service that the Public Company Accounting Oversight Board determines, by regulation, is impermissible. |
Pre-approval of Non-Audit Services Provided to Other Entities Within the Prudential Fund Complex
Certain non-audit services provided to Prudential Investments LLC or any of its affiliates that also provide ongoing services to the Prudential Mutual Funds will be subject to pre-approval by the Audit Committee. The only non-audit services provided to these entities that will require pre-approval are those related directly to the operations and financial reporting of the Funds. Individual projects that are not presented to the Audit Committee as part of the annual pre-approval process will be subject to pre-approval by the Committee Chair (or any other Committee member on whom this responsibility has been delegated) so long as the estimated fee for those services does not exceed $50,000. Services presented for pre-approval pursuant to this paragraph will be accompanied by a confirmation from both the Treasurer and the independent accountants that the proposed services will not adversely affect the independence of the independent accountants.
Although the Audit Committee will not pre-approve all services provided to Prudential Investments LLC and its affiliates, the Committee will receive an annual report from the Fund’s independent accounting firm showing the aggregate fees for all services provided to Prudential Investments and its affiliates.
(e) (2) Percentage of services referred to in 4(b) – 4(d) that were approved by the audit committee –
Not applicable.
(f) Percentage of hours expended attributable to work performed by other than full time employees of principal accountant if greater than 50%.
The percentage of hours expended on the principal accountant’s engagement to audit the registrant’s financial statements for the most recent fiscal year that were attributed to work performed by persons other than the principal accountant’s full-time, permanent employees was 0%.
(g) Non-Audit Fees
Not applicable to Registrant for the fiscal years 2014 and 2013. The aggregate non-audit fees billed by KPMG for services rendered to the registrant’s investment adviser and any entity controlling, controlled by, or under common control with the investment adviser that provides ongoing services to the registrant for the fiscal years 2014 and 2013 was $0 and $0, respectively.
(h) Principal Accountant’s Independence
Not applicable as KPMG has not provided non-audit services to the registrant’s investment adviser and any entity controlling, controlled by, or under common control with the investment adviser that provides ongoing services to the registrant that were not pre-approved pursuant to Rule 2-01(c)(7)(ii) of Regulation S-X.
| | |
| Item 5 – | | Audit Committee of Listed Registrants – Not applicable. |
| |
| Item 6 – | | Schedule of Investments – The schedule is included as part of the report to shareholders filed under Item 1 of this Form. |
| |
| Item 7 – | | Disclosure of Proxy Voting Policies and Procedures for Closed-End Management Investment Companies – Not applicable. |
| |
| Item 8 – | | Portfolio Managers of Closed-End Management Investment Companies – Not applicable. |
| |
| Item 9 – | | Purchases of Equity Securities by Closed-End Management Investment Company and Affiliated Purchasers – Not applicable. |
| |
| Item 10 – | | Submission of Matters to a Vote of Security Holders – Not applicable. |
| |
| Item 11 – | | Controls and Procedures |
| | (a) | It is the conclusion of the registrant’s principal executive officer and principal financial officer that the effectiveness of the registrant’s current disclosure controls and procedures (such disclosure controls and procedures having been evaluated within 90 days of the date of this filing) provide reasonable assurance that the information required to be disclosed by the registrant has been recorded, processed, summarized and reported within the time period specified in the Commission’s rules and forms and that the information required to be disclosed by the registrant has been accumulated and communicated to the registrant’s principal executive officer and principal financial officer in order to allow timely decisions regarding required disclosure. |
| | (b) | There has been no significant change in the registrant’s internal control over financial reporting that occurred during the registrant’s most recent fiscal quarter of the period covered by this report that has materially affected, or is likely to materially affect, the registrant’s internal control over financial reporting. |
Item 12 – Exhibits
(a) | (1) | Code of Ethics – Attached hereto as Exhibit EX-99.CODE-ETH |
| | (2) | Certifications pursuant to Section 302 of the Sarbanes-Oxley Act – Attached hereto as Exhibit EX-99.CERT. |
| | (3) | Any written solicitation to purchase securities under Rule 23c-1. – Not applicable. |
| | (b) | Certifications pursuant to Section 906 of the Sarbanes-Oxley Act – Attached hereto as Exhibit EX-99.906CERT. |
SIGNATURES
Pursuant to the requirements of the Securities Exchange Act of 1934 and the Investment Company Act of 1940, the registrant has duly caused this report to be signed on its behalf by the undersigned, thereunto duly authorized.
| | | | |
| Registrant: | | Prudential Investment Portfolios 8 | | |
| | |
| By: | | /s/ Deborah A. Docs | | |
| | Deborah A. Docs | | |
| | Secretary | | |
| | |
| Date: | | November 19, 2014 | | |
Pursuant to the requirements of the Securities Exchange Act of 1934 and the Investment Company Act of 1940, this report has been signed below by the following persons on behalf of the registrant and in the capacities and on the dates indicated. |
| By: | | /s/ Stuart S. Parker | | |
| | Stuart S. Parker | | |
| | President and Principal Executive Officer | | |
| | |
| Date: | | November 19, 2014 | | |
| | |
| By: | | /s/ M. Sadiq Peshimam | | |
| | M. Sadiq Peshimam | | |
| | Treasurer and Principal Financial and Accounting Officer | | |
| | |
| Date: | | November 19, 2014 | | |