UNITED STATES
SECURITIES AND EXCHANGE COMMISSION
Washington, D.C. 20549
FORM N-CSR
CERTIFIED SHAREHOLDER REPORT OF REGISTERED
MANAGEMENT INVESTMENT COMPANIES
| Investment Company Act file number: | 811-06677 | |
| Exact name of registrant as specified in charter: | Prudential Investment Portfolios 8 | |
| Address of principal executive offices: | Gateway Center 3, | |
| 100 Mulberry Street, | ||
| Newark, New Jersey 07102 | ||
| Name and address of agent for service: | Deborah A. Docs | |
| Gateway Center 3, | ||
| 100 Mulberry Street, | ||
| Newark, New Jersey 07102 | ||
| Registrant’s telephone number, including area code: | 800-225-1852 | |
| Date of fiscal year end: | 9/30/2015 | |
| Date of reporting period: | 3/31/2015 | |
Item 1 | – Reports to Stockholders |

PRUDENTIAL INVESTMENTS»MUTUAL FUNDS
PRUDENTIAL STOCK INDEX FUND
SEMIANNUAL REPORT · MARCH 31, 2015
Objective
Provide investment results that correspond to the price and yield performance of the S&P 500 Index
This report is not authorized for distribution to prospective investors unless preceded or accompanied by a current prospectus.
The views expressed in this report and
information about the Fund’s portfolio holdings are for the period covered by this report and are subject to change thereafter.
The accompanying financial statements as of March 31, 2015, were not audited and, accordingly, no auditor’s opinion is expressed on them.
Mutual funds are distributed by Prudential Investment Management Services LLC, a Prudential Financial company. Quantitative Management Associates, LLC (QMA) is a wholly owned subsidiary of Prudential Investment Management, Inc. (PIM). QMA and PIM are registered investment advisers and Prudential Financial companies. © 2015 Prudential Financial, Inc. and its related entities. Prudential Investments LLC, Prudential, the Prudential logo, Bring Your Challenges, and the Rock symbol are service marks of Prudential Financial, Inc. and its related entities, registered in many jurisdictions worldwide.

|  |

May 15, 2015
Dear Shareholder:
We hope you find the semiannual report for the Prudential Stock Index Fund informative and useful. The report covers performance for the six-month period that ended March 31, 2015.
Since market conditions change over time, we believe it is important to maintain a diversified portfolio of funds consistent with your tolerance for risk, time horizon, and financial goals.
Your financial advisor can help you create a diversified investment plan that may include funds covering all the basic asset classes and that reflects your personal investor profile and risk tolerance. Keep in mind, however, that diversification and asset allocation strategies do not assure a profit or protect against loss in declining markets.
Prudential Investments® is dedicated to helping you solve your toughest investment challenges—whether it’s capital growth, reliable income, or protection from market volatility and other risks. We offer the expertise of Prudential Financial’s affiliated asset managers that strive to be leaders in a broad range of funds to help you stay on course to the future you envision. They also manage money for major corporations and pension funds around the world, which means you benefit from the same expertise, innovation, and attention to risk demanded by today’s most sophisticated investors.
Thank you for choosing the Prudential Investments family of funds.
Sincerely,

Stuart S. Parker, President
Prudential Stock Index Fund
| Prudential Stock Index Fund | 1 |
Your Fund’s Performance (Unaudited)
Performance data quoted represent past performance. Past performance does not guarantee future results. The investment return and principal value of an investment will fluctuate, so that an investor’s shares, when redeemed, may be worth more or less than their original cost. Current performance may be lower or higher than the past performance data quoted. An investor may obtain performance data as of the most recent month-end by visiting our website at www.prudentialfunds.com or by calling (800) 225-1852.
Cumulative Total Returns (Without Sales Charges) as of 3/31/15 |
| |||||||||||||||
| Six Months | One Year | Five Years | Ten Years | |||||||||||||
Class A | 5.64 | % | 12.14 | % | 91.72 | % | 106.02 | % | ||||||||
Class C | 5.33 | 11.46 | 86.04 | 92.23 | ||||||||||||
Class I | 5.83 | 12.56 | 95.08 | 113.40 | ||||||||||||
Class Z | 5.82 | 12.47 | 94.57 | 112.04 | ||||||||||||
S&P 500 Index | 5.92 | 12.71 | 96.40 | 115.97 | ||||||||||||
Lipper S&P 500 Index Objective Funds Average | 5.53 | 12.01 | 90.97 | 105.77 | ||||||||||||
Average Annual Total Returns (With Sales Charges) as of 3/31/15 |
| |||||||||||||||
| One Year | Five Years | Ten Years | ||||||||||||||
Class A | 8.50 | % | 13.15 | % | 7.14 | % | ||||||||||
Class C | 10.46 | 13.22 | 6.75 | |||||||||||||
Class I | 12.56 | 14.30 | 7.87 | |||||||||||||
Class Z | 12.47 | 14.24 | 7.81 | |||||||||||||
S&P 500 Index | 12.71 | 14.45 | 8.00 | |||||||||||||
Lipper S&P 500 Index Objective Funds Average | 12.01 | 13.81 | 7.48 | |||||||||||||
Source: Prudential Investments LLC and Lipper Inc.
| 2 | Visit our website at www.prudentialfunds.com |
The returns in the tables do not reflect the deduction of taxes that a shareholder would pay on Fund distributions or following the redemption of Fund shares. The average annual total returns take into account applicable sales charges, which are described for each share class in the table below.
| Class A | Class C | Class I | Class Z | |||||
Maximum initial sales charge | 3.25% of the public offering price | None | None | None | ||||
Contingent Deferred Sales Charge (CDSC) (as a percentage of the lower of original purchase price or sale proceeds) | 1% on sales of $1 million or more made within 12 months of purchase | 1% on sales made within 12 months of purchase | None | None | ||||
Annual distribution and service (12b-1) fees (shown as a percentage of average daily net assets) | .30% | 1% | None | None |
Benchmark Definitions
S&P 500 Index
The S&P 500 Index is an unmanaged index of 500 stocks of large US public companies. It gives a broad look at how stock prices in the United States have performed.
Lipper S&P 500 Index Objective Funds Average
The Lipper S&P 500 Index Objective Funds Average (Lipper Average) represents returns based on the average return of all funds in the Lipper S&P 500 Index Objective Funds category for the periods noted. Funds in the Lipper Average are passively managed, limited expense (management fee no higher than 0.50%) funds designed to replicate the performance of the S&P 500 Index on a reinvested basis.
Investors cannot invest directly in an index or average. The returns for the Index would be lower if they included the effects of sales charges, operating expenses of a mutual fund, or taxes. Returns for the Lipper Average reflect the deduction of operating expenses, but not sales charges or taxes.
| Prudential Stock Index Fund | 3 |
Your Fund’s Performance (continued)
S&P 500 Index as of 3/31/15
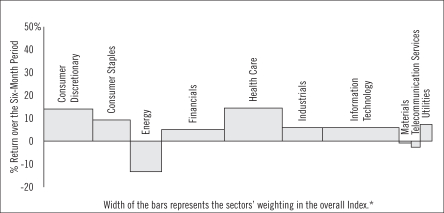
*Sector weightings are subject to change.
Source: FactSet.
The S&P 500 Index is a product of S&P Dow Jones Indices LLC (“SPDJI”), and has been licensed for use by Prudential Investments LLC, its affiliates, and subsidiaries. Standard & Poor’s®, S&P® and S&P 500® are registered trademarks of Standard & Poor’s Financial Services LLC (“S&P”); Dow Jones® is a registered trademark of Dow Jones Trademark Holdings LLC (“Dow Jones”); and these trademarks have been licensed for use by SPDJI and sublicensed for certain purposes by Prudential Investments LLC, its affiliates, and subsidiaries. The Prudential Stock Index Fund is not sponsored, endorsed, sold or promoted by SPDJI, Dow Jones, S&P, or their respective affiliates, and none of such parties make any representation regarding the advisability of investing in such product(s) nor do they have any liability for any errors, omissions, or interruptions of the S&P 500 Index.
The performance cited does not represent the performance of the Prudential Stock Index Fund. Past performance does not guarantee future results.
| 4 | Visit our website at www.prudentialfunds.com |
Fees and Expenses (Unaudited)
As a shareholder of the Fund, you incur two types of costs: (1) transaction costs, including sales charges (loads) on purchase payments and redemptions, as applicable, and (2) ongoing costs, including management fees, distribution and/or service (12b-1) fees, and other Fund expenses, as applicable. This example is intended to help you understand your ongoing costs (in dollars) of investing in the Fund and to compare these costs with the ongoing costs of investing in other mutual funds.
The example is based on an investment of $1,000 invested on October 1, 2014, at the beginning of the period, and held through the six-month period ended March 31, 2015. The example is for illustrative purposes only; you should consult the Prospectus for information on initial and subsequent minimum investment requirements.
Actual Expenses
The first line for each share class in the table on the following page provides information about actual account values and actual expenses. You may use the information on this line, together with the amount you invested, to estimate the expenses that you paid over the period. Simply divide your account value by $1,000 (for example, an $8,600 account value ÷ $1,000 = 8.6), then multiply the result by the number on the first line under the heading “Expenses Paid During the Six-Month Period” to estimate the expenses you paid on your account during this period.
Hypothetical Example for Comparison Purposes
The second line for each share class in the table on the following page provides information about hypothetical account values and hypothetical expenses based on the Fund’s actual expense ratio and an assumed rate of return of 5% per year before expenses, which is not the Fund’s actual return. The hypothetical account values and expenses may not be used to estimate the actual ending account balance or expenses you paid for the period. You may use this information to compare the ongoing costs of investing in the Fund and other funds. To do so, compare this 5% hypothetical example with the 5% hypothetical examples that appear in the shareholder reports of the other funds.
The Fund’s transfer agent may charge additional fees to holders of certain accounts that are not included in the expenses shown in the table on the following page. These fees apply to individual retirement accounts (IRAs) and Section 403(b) accounts. As of the close of the six-month period covered by the table, IRA fees included an annual maintenance fee of $15 per account (subject to a maximum annual maintenance fee of $25 for all accounts held by the same shareholder). Section 403(b) accounts are charged an annual $25 fiduciary maintenance fee. Some of the fees may vary in amount, or may be waived, based on your total account balance or the number of Prudential Investment funds, including the Fund, that you own. You should consider
| Prudential Stock Index Fund | 5 |
Fees and Expenses (continued)
the additional fees that were charged to your Fund account over the six-month period when you estimate the total ongoing expenses paid over the period and the impact of these fees on your ending account value, as these additional expenses are not reflected in the information provided in the expense table. Additional fees have the effect of reducing investment returns.
Please note that the expenses shown in the table are meant to highlight your ongoing costs only and do not reflect any transactional costs such as sales charges (loads). Therefore, the second line for each share class in the table is useful in comparing ongoing costs only and will not help you determine the relative total costs of owning different funds. In addition, if these transactional costs were included, your costs would have been higher.
| Prudential Stock Index Fund | Beginning Account Value October 1, 2014 | Ending Account Value March 31, 2015 | Annualized Expense Ratio Based on the Six-Month Period | Expenses Paid During the Six-Month Period* | ||||||||||||||
| Class A | Actual | $ | 1,000.00 | $ | 1,056.40 | 0.53 | % | $ | 2.72 | |||||||||
| Hypothetical | $ | 1,000.00 | $ | 1,022.29 | 0.53 | % | $ | 2.67 | ||||||||||
| Class C | Actual | $ | 1,000.00 | $ | 1,053.30 | 1.16 | % | $ | 5.94 | |||||||||
| Hypothetical | $ | 1,000.00 | $ | 1,019.15 | 1.16 | % | $ | 5.84 | ||||||||||
| Class I | Actual | $ | 1,000.00 | $ | 1,058.30 | 0.20 | % | $ | 1.03 | |||||||||
| Hypothetical | $ | 1,000.00 | $ | 1,023.93 | 0.20 | % | $ | 1.01 | ||||||||||
| Class Z | Actual | $ | 1,000.00 | $ | 1,058.20 | 0.26 | % | $ | 1.33 | |||||||||
| Hypothetical | $ | 1,000.00 | $ | 1,023.64 | 0.26 | % | $ | 1.31 | ||||||||||
*Fund expenses (net of fee waivers or subsidies, if any) for each share class are equal to the annualized expense ratio for each share class (provided in the table), multiplied by the average account value over the period, multiplied by the 182 days in the six-month period ended March 31, 2015, and divided by the 365 days in the Fund’s fiscal year ending September 30, 2015 (to reflect the six-month period). Expenses presented in the table include the expenses of any underlying portfolios in which the Fund may invest.
| 6 | Visit our website at www.prudentialfunds.com |
The Fund’s annual expense ratios for the six-month period ended March 31, 2015, are as follows:
| Class | Gross Operating Expenses | Net Operating Expenses | ||||||
A | 0.60 | % | 0.53 | % | ||||
C | 1.23 | 1.16 | ||||||
I | 0.27 | 0.20 | ||||||
Z | 0.33 | 0.26 | ||||||
Net operating expenses shown above reflect any fee waivers and/or expense reimbursements. Additional information on Fund expenses and any fee waivers and/or expense reimbursements can be found in the “Financial Highlights” tables in this report and in the Notes to the Financial Statements in this report.
| Prudential Stock Index Fund | 7 |
Portfolio of Investments
as of March 31, 2015 (Unaudited)
| Description | Shares | Value (Note 1) | ||||||
LONG-TERM INVESTMENTS 94.9% | ||||||||
COMMON STOCKS 94.3% | ||||||||
Aerospace & Defense 2.6% | ||||||||
Boeing Co. (The) | 35,184 | $ | 5,280,415 | |||||
General Dynamics Corp. | 16,712 | 2,268,320 | ||||||
Honeywell International, Inc. | 41,515 | 4,330,429 | ||||||
L-3 Communications Holdings, Inc. | 4,600 | 578,634 | ||||||
Lockheed Martin Corp. | 14,456 | 2,933,990 | ||||||
Northrop Grumman Corp. | 10,748 | 1,729,998 | ||||||
Precision Castparts Corp. | 7,580 | 1,591,800 | ||||||
Raytheon Co. | 16,444 | 1,796,507 | ||||||
Rockwell Collins, Inc. | 7,463 | 720,553 | ||||||
Textron, Inc. | 14,134 | 626,560 | ||||||
United Technologies Corp. | 44,740 | 5,243,528 | ||||||
|
| |||||||
| 27,100,734 | ||||||||
Air Freight & Logistics 0.7% | ||||||||
C.H. Robinson Worldwide, Inc.(a) | 7,700 | 563,794 | ||||||
Expeditors International of Washington, Inc. | 10,500 | 505,890 | ||||||
FedEx Corp. | 14,116 | 2,335,492 | ||||||
United Parcel Service, Inc. (Class B Stock) | 37,100 | 3,596,474 | ||||||
|
| |||||||
| 7,001,650 | ||||||||
Airlines 0.5% | ||||||||
American Airlines Group, Inc. | 36,900 | 1,947,582 | ||||||
Delta Air Lines, Inc. | 44,800 | 2,014,208 | ||||||
Southwest Airlines Co. | 36,474 | 1,615,798 | ||||||
|
| |||||||
| 5,577,588 | ||||||||
Auto Components 0.4% | ||||||||
BorgWarner, Inc. | 11,900 | 719,712 | ||||||
Delphi Automotive PLC (United Kingdom) | 16,100 | 1,283,814 | ||||||
Goodyear Tire & Rubber Co. (The) | 13,771 | 372,919 | ||||||
Johnson Controls, Inc. | 35,556 | 1,793,444 | ||||||
|
| |||||||
| 4,169,889 | ||||||||
Automobiles 0.6% | ||||||||
Ford Motor Co. | 208,738 | 3,369,031 | ||||||
General Motors Co. | 71,900 | 2,696,250 | ||||||
Harley-Davidson, Inc. | 11,300 | 686,362 | ||||||
|
| |||||||
| 6,751,643 | ||||||||
See Notes to Financial Statements.
| Prudential Stock Index Fund | 9 |
Portfolio of Investments
as of March 31, 2015 (Unaudited) continued
| Description | Shares | Value (Note 1) | ||||||
COMMON STOCKS (Continued) | ||||||||
Banks 5.4% | ||||||||
Bank of America Corp. | 560,995 | $ | 8,633,713 | |||||
BB&T Corp. | 38,258 | 1,491,679 | ||||||
Citigroup, Inc. | 162,415 | 8,367,621 | ||||||
Comerica, Inc.(a) | 9,261 | 417,949 | ||||||
Fifth Third Bancorp | 42,673 | 804,386 | ||||||
Huntington Bancshares, Inc. | 39,829 | 440,110 | ||||||
JPMorgan Chase & Co. | 199,593 | 12,091,344 | ||||||
KeyCorp | 45,035 | 637,696 | ||||||
M&T Bank Corp.(a) | 7,200 | 914,400 | ||||||
PNC Financial Services Group, Inc. (The) | 28,302 | 2,638,879 | ||||||
Regions Financial Corp. | 71,574 | 676,374 | ||||||
SunTrust Banks, Inc. | 27,683 | 1,137,495 | ||||||
U.S. Bancorp | 94,895 | 4,144,065 | ||||||
Wells Fargo & Co. | 250,516 | 13,628,070 | ||||||
Zions Bancorporation | 9,000 | 243,000 | ||||||
|
| |||||||
| 56,266,781 | ||||||||
Beverages 2.0% | ||||||||
Brown-Forman Corp. (Class B Stock) | 8,530 | 770,685 | ||||||
Coca-Cola Co. (The) | 210,364 | 8,530,260 | ||||||
Coca-Cola Enterprises, Inc. | 11,200 | 495,040 | ||||||
Constellation Brands, Inc. (Class A Stock)* | 9,100 | 1,057,511 | ||||||
Dr. Pepper Snapple Group, Inc. | 10,400 | 816,192 | ||||||
Molson Coors Brewing Co. (Class B Stock) | 8,894 | 662,158 | ||||||
Monster Beverage Corp.* | 8,050 | 1,114,080 | ||||||
PepsiCo, Inc. | 79,451 | 7,597,105 | ||||||
|
| |||||||
| 21,043,031 | ||||||||
Biotechnology 2.9% | ||||||||
Alexion Pharmaceuticals, Inc.* | 11,000 | 1,906,300 | ||||||
Amgen, Inc. | 40,846 | 6,529,233 | ||||||
Biogen, Inc.* | 12,570 | 5,307,557 | ||||||
Celgene Corp.* | 42,900 | 4,945,512 | ||||||
Gilead Sciences, Inc.* | 80,100 | 7,860,213 | ||||||
Regeneron Pharmaceuticals, Inc.* | 4,050 | 1,828,494 | ||||||
Vertex Pharmaceuticals, Inc.* | 13,100 | 1,545,407 | ||||||
|
| |||||||
| 29,922,716 | ||||||||
See Notes to Financial Statements.
| 10 |
| Description | Shares | Value (Note 1) | ||||||
COMMON STOCKS (Continued) | ||||||||
Building Products 0.1% | ||||||||
Allegion PLC | 5,233 | $ | 320,103 | |||||
Masco Corp. | 18,426 | 491,974 | ||||||
|
| |||||||
| 812,077 | ||||||||
Capital Markets 2.1% | ||||||||
Affiliated Managers Group, Inc.* | 3,200 | 687,296 | ||||||
Ameriprise Financial, Inc. | 9,971 | 1,304,606 | ||||||
Bank of New York Mellon Corp. (The) | 59,838 | 2,407,881 | ||||||
BlackRock, Inc. | 6,900 | 2,524,296 | ||||||
Charles Schwab Corp. (The) | 60,911 | 1,854,131 | ||||||
E*TRADE Financial Corp.* | 13,720 | 391,775 | ||||||
Franklin Resources, Inc. | 21,142 | 1,085,007 | ||||||
Goldman Sachs Group, Inc. (The) | 21,800 | 4,097,746 | ||||||
Invesco Ltd. | 22,900 | 908,901 | ||||||
Legg Mason, Inc. | 5,300 | 292,560 | ||||||
Morgan Stanley | 81,536 | 2,910,020 | ||||||
Northern Trust Corp. | 11,962 | 833,153 | ||||||
State Street Corp. | 22,462 | 1,651,631 | ||||||
T. Rowe Price Group, Inc. | 13,600 | 1,101,328 | ||||||
|
| |||||||
| 22,050,331 | ||||||||
Chemicals 2.3% | ||||||||
Air Products & Chemicals, Inc. | 10,232 | 1,547,897 | ||||||
Airgas, Inc. | 3,900 | 413,829 | ||||||
CF Industries Holdings, Inc. | 2,700 | 765,936 | ||||||
Dow Chemical Co. (The) | 58,736 | 2,818,153 | ||||||
E.I. du Pont de Nemours & Co. | 48,144 | 3,440,852 | ||||||
Eastman Chemical Co. | 7,686 | 532,332 | ||||||
Ecolab, Inc. | 14,582 | 1,667,889 | ||||||
FMC Corp. | 6,700 | 383,575 | ||||||
International Flavors & Fragrances, Inc. | 4,675 | 548,845 | ||||||
LyondellBasell Industries NV (Class A Stock) | 22,100 | 1,940,380 | ||||||
Monsanto Co. | 25,684 | 2,890,477 | ||||||
Mosaic Co. (The) | 17,000 | 783,020 | ||||||
PPG Industries, Inc. | 7,274 | 1,640,578 | ||||||
Praxair, Inc. | 15,608 | 1,884,510 | ||||||
Sherwin-Williams Co. (The) | 4,516 | 1,284,802 | ||||||
Sigma-Aldrich Corp. | 6,582 | 909,962 | ||||||
|
| |||||||
| 23,453,037 | ||||||||
See Notes to Financial Statements.
| Prudential Stock Index Fund | 11 |
Portfolio of Investments
as of March 31, 2015 (Unaudited) continued
| Description | Shares | Value (Note 1) | ||||||
COMMON STOCKS (Continued) | ||||||||
Commercial Services & Supplies 0.4% | ||||||||
ADT Corp. (The)(a) | 8,300 | $ | 344,616 | |||||
Cintas Corp. | 5,400 | 440,802 | ||||||
Pitney Bowes, Inc. | 9,625 | 224,455 | ||||||
Republic Services, Inc. | 13,775 | 558,714 | ||||||
Stericycle, Inc.* | 4,500 | 631,935 | ||||||
Tyco International PLC | 22,000 | 947,320 | ||||||
Waste Management, Inc. | 22,713 | 1,231,726 | ||||||
|
| |||||||
| 4,379,568 | ||||||||
Communications Equipment 1.5% | ||||||||
Cisco Systems, Inc. | 271,344 | 7,468,743 | ||||||
F5 Networks, Inc.* | 4,200 | 482,748 | ||||||
Harris Corp. | 5,700 | 448,932 | ||||||
Juniper Networks, Inc.(a) | 22,100 | 499,018 | ||||||
Motorola Solutions, Inc. | 11,416 | 761,105 | ||||||
QUALCOMM, Inc. | 88,200 | 6,115,788 | ||||||
|
| |||||||
| 15,776,334 | ||||||||
Construction & Engineering 0.1% | ||||||||
Fluor Corp. | 8,074 | 461,510 | ||||||
Jacobs Engineering Group, Inc.*(a) | 6,700 | 302,572 | ||||||
Quanta Services, Inc.* | 10,700 | 305,271 | ||||||
|
| |||||||
| 1,069,353 | ||||||||
Construction Materials 0.1% | ||||||||
Martin Marietta Materials, Inc. | 3,600 | 503,280 | ||||||
Vulcan Materials Co. | 6,900 | 581,670 | ||||||
|
| |||||||
| 1,084,950 | ||||||||
Consumer Finance 0.8% | ||||||||
American Express Co. | 47,659 | 3,723,121 | ||||||
Capital One Financial Corp. | 29,866 | 2,354,038 | ||||||
Discover Financial Services | 24,018 | 1,353,414 | ||||||
Navient Corp. | 21,792 | 443,032 | ||||||
|
| |||||||
| 7,873,605 | ||||||||
Containers & Packaging 0.2% | ||||||||
Avery Dennison Corp. | 4,768 | 252,275 | ||||||
Ball Corp. | 7,264 | 513,129 | ||||||
MeadWestvaco Corp. | 8,735 | 435,615 | ||||||
See Notes to Financial Statements.
| 12 |
| Description | Shares | Value (Note 1) | ||||||
COMMON STOCKS (Continued) | ||||||||
Containers & Packaging (cont’d.) | ||||||||
Owens-Illinois, Inc.* | 8,600 | $ | 200,552 | |||||
Sealed Air Corp. | 11,036 | 502,800 | ||||||
|
| |||||||
| 1,904,371 | ||||||||
Distributors 0.1% | ||||||||
Genuine Parts Co. | 8,199 | 764,065 | ||||||
Diversified Consumer Services | ||||||||
H&R Block, Inc. | 13,620 | 436,793 | ||||||
Diversified Financial Services 2.0% | ||||||||
Berkshire Hathaway, Inc. (Class B Stock)* | 97,700 | 14,100,064 | ||||||
CME Group, Inc. | 17,200 | 1,629,012 | ||||||
Intercontinental Exchange, Inc. | 6,188 | 1,443,475 | ||||||
Leucadia National Corp. | 14,900 | 332,121 | ||||||
McGraw Hill Financial, Inc. | 14,700 | 1,519,980 | ||||||
Moody’s Corp. | 9,676 | 1,004,369 | ||||||
NASDAQ OMX Group, Inc. (The) | 5,900 | 300,546 | ||||||
|
| |||||||
| 20,329,567 | ||||||||
Diversified Telecommunication Services 2.1% | ||||||||
AT&T, Inc. | 277,831 | 9,071,182 | ||||||
CenturyLink, Inc. | 30,208 | 1,043,686 | ||||||
Frontier Communications Corp. | 47,260 | 333,183 | ||||||
Level 3 Communications, Inc.* | 14,400 | 775,296 | ||||||
Verizon Communications, Inc. | 221,433 | 10,768,287 | ||||||
Windstream Holdings, Inc. | 27,577 | 204,070 | ||||||
|
| |||||||
| 22,195,704 | ||||||||
Electric Utilities 1.6% | ||||||||
American Electric Power Co., Inc. | 26,391 | 1,484,494 | ||||||
Duke Energy Corp. | 37,939 | 2,912,957 | ||||||
Edison International | 17,162 | 1,072,110 | ||||||
Entergy Corp. | 10,015 | 776,062 | ||||||
Eversource Energy | 17,300 | 873,996 | ||||||
Exelon Corp. | 44,612 | 1,499,409 | ||||||
FirstEnergy Corp. | 22,577 | 791,550 | ||||||
NextEra Energy, Inc. | 23,272 | 2,421,452 | ||||||
Pepco Holdings, Inc. | 11,600 | 311,228 | ||||||
Pinnacle West Capital Corp. | 5,700 | 363,375 | ||||||
PPL Corp. | 35,652 | 1,200,046 | ||||||
See Notes to Financial Statements.
| Prudential Stock Index Fund | 13 |
Portfolio of Investments
as of March 31, 2015 (Unaudited) continued
| Description | Shares | Value (Note 1) | ||||||
COMMON STOCKS (Continued) | ||||||||
Electric Utilities (cont’d.) | ||||||||
Southern Co. (The) | 47,815 | $ | 2,117,248 | |||||
Xcel Energy, Inc. | 25,683 | 894,025 | ||||||
|
| |||||||
| 16,717,952 | ||||||||
Electrical Equipment 0.5% | ||||||||
AMETEK, Inc. | 12,800 | 672,512 | ||||||
Eaton Corp. PLC | 25,093 | 1,704,819 | ||||||
Emerson Electric Co.(a) | 37,250 | 2,109,095 | ||||||
Rockwell Automation, Inc.(a) | 7,163 | 830,836 | ||||||
|
| |||||||
| 5,317,262 | ||||||||
Electronic Equipment, Instruments & Components 0.4% | ||||||||
Amphenol Corp. (Class A Stock) | 16,900 | 995,917 | ||||||
Corning, Inc. | 67,997 | 1,542,172 | ||||||
FLIR Systems, Inc. | 6,300 | 197,064 | ||||||
TE Connectivity Ltd. (Switzerland) | 21,400 | 1,532,668 | ||||||
|
| |||||||
| 4,267,821 | ||||||||
Energy Equipment & Services 1.2% | ||||||||
Baker Hughes, Inc. | 23,045 | 1,465,201 | ||||||
Cameron International Corp.* | 10,100 | 455,712 | ||||||
Diamond Offshore Drilling, Inc.(a) | 2,800 | 75,012 | ||||||
Ensco PLC (Class A Stock) | 11,500 | 242,305 | ||||||
FMC Technologies, Inc.* | 12,100 | 447,821 | ||||||
Halliburton Co. | 44,522 | 1,953,626 | ||||||
Helmerich & Payne, Inc.(a) | 5,500 | 374,385 | ||||||
National Oilwell Varco, Inc. | 22,400 | 1,119,776 | ||||||
Noble Corp. PLC(a) | 13,600 | 194,208 | ||||||
Schlumberger Ltd. | 68,341 | 5,702,373 | ||||||
Transocean Ltd.(a) | 17,000 | 249,390 | ||||||
|
| |||||||
| 12,279,809 | ||||||||
Food & Staples Retailing 2.4% | ||||||||
Costco Wholesale Corp. | 23,508 | 3,561,345 | ||||||
CVS Health Corp. | 60,899 | 6,285,386 | ||||||
Kroger Co. (The) | 26,034 | 1,995,766 | ||||||
Sysco Corp. | 30,880 | 1,165,102 | ||||||
Wal-Mart Stores, Inc. | 84,626 | 6,960,489 | ||||||
Walgreens Boots Alliance, Inc. | 46,578 | 3,944,225 | ||||||
Whole Foods Market, Inc. | 19,200 | 999,936 | ||||||
|
| |||||||
| 24,912,249 | ||||||||
See Notes to Financial Statements.
| 14 |
| Description | Shares | Value (Note 1) | ||||||
COMMON STOCKS (Continued) | ||||||||
Food Products 1.6% | ||||||||
Archer-Daniels-Midland Co. | 34,659 | $ | 1,642,837 | |||||
Campbell Soup Co. | 9,647 | 449,068 | ||||||
ConAgra Foods, Inc. | 22,843 | 834,455 | ||||||
General Mills, Inc. | 32,144 | 1,819,350 | ||||||
Hershey Co. (The) | 7,916 | 798,804 | ||||||
Hormel Foods Corp. | 7,500 | 426,375 | ||||||
J.M. Smucker Co. (The) | 5,500 | 636,515 | ||||||
Kellogg Co. | 13,670 | 901,536 | ||||||
Keurig Green Mountain, Inc. | 6,700 | 748,591 | ||||||
Kraft Foods Group, Inc. | 31,455 | 2,740,202 | ||||||
McCormick & Co., Inc. | 7,000 | 539,770 | ||||||
Mead Johnson Nutrition Co. | 10,865 | 1,092,258 | ||||||
Mondelez International, Inc. (Class A Stock) | 89,266 | 3,221,610 | ||||||
Tyson Foods, Inc. (Class A Stock) | 14,800 | 566,840 | ||||||
|
| |||||||
| 16,418,211 | ||||||||
Gas Utilities | ||||||||
AGL Resources, Inc. | 6,430 | 319,250 | ||||||
Health Care Equipment & Supplies 2.1% | ||||||||
Abbott Laboratories | 80,274 | 3,719,094 | ||||||
Baxter International, Inc. | 28,574 | 1,957,319 | ||||||
Becton, Dickinson and Co. | 11,081 | 1,591,121 | ||||||
Boston Scientific Corp.* | 69,172 | 1,227,803 | ||||||
C.R. Bard, Inc. | 4,412 | 738,348 | ||||||
DENTSPLY International, Inc. | 7,200 | 366,408 | ||||||
Edwards Lifesciences Corp.* | 5,800 | 826,268 | ||||||
Intuitive Surgical, Inc.* | 2,050 | 1,035,311 | ||||||
Medtronic PLC | 76,615 | 5,975,204 | ||||||
St. Jude Medical, Inc. | 15,164 | 991,726 | ||||||
Stryker Corp. | 16,100 | 1,485,225 | ||||||
Varian Medical Systems, Inc.* | 5,200 | 489,268 | ||||||
Zimmer Holdings, Inc. | 9,011 | 1,058,973 | ||||||
|
| |||||||
| 21,462,068 | ||||||||
Health Care Providers & Services 2.7% | ||||||||
Aetna, Inc. | 18,944 | 2,018,104 | ||||||
AmerisourceBergen Corp. | 11,100 | 1,261,737 | ||||||
Anthem, Inc. | 14,400 | 2,223,504 | ||||||
Cardinal Health, Inc. | 17,673 | 1,595,342 | ||||||
See Notes to Financial Statements.
| Prudential Stock Index Fund | 15 |
Portfolio of Investments
as of March 31, 2015 (Unaudited) continued
| Description | Shares | Value (Note 1) | ||||||
COMMON STOCKS (Continued) | ||||||||
Health Care Providers & Services (cont’d.) | ||||||||
Cigna Corp. | 14,291 | $ | 1,849,827 | |||||
DaVita HealthCare Partners, Inc.* | 9,100 | 739,648 | ||||||
Express Scripts Holding Co.* | 39,270 | 3,407,458 | ||||||
HCA Holdings, Inc.* | 16,300 | 1,226,249 | ||||||
Henry Schein, Inc.* | 4,300 | 600,366 | ||||||
Humana, Inc. | 8,410 | 1,497,148 | ||||||
Laboratory Corp. of America Holdings* | 5,600 | 706,104 | ||||||
McKesson Corp. | 12,476 | 2,822,071 | ||||||
Patterson Cos., Inc.(a) | 4,400 | 214,676 | ||||||
Quest Diagnostics, Inc. | 7,700 | 591,745 | ||||||
Tenet Healthcare Corp.*(a) | 4,743 | 234,826 | ||||||
UnitedHealth Group, Inc. | 51,148 | 6,050,297 | ||||||
Universal Health Services, Inc. (Class B Stock) | 5,000 | 588,550 | ||||||
|
| |||||||
| 27,627,652 | ||||||||
Health Care Technology 0.1% | ||||||||
Cerner Corp.* | 16,000 | 1,172,160 | ||||||
Hotels, Restaurants & Leisure 1.6% | ||||||||
Carnival Corp. | 23,900 | 1,143,376 | ||||||
Chipotle Mexican Grill, Inc.* | 1,660 | 1,079,897 | ||||||
Darden Restaurants, Inc. | 6,753 | 468,253 | ||||||
Marriott International, Inc. (Class A Stock) | 11,170 | 897,174 | ||||||
McDonald’s Corp. | 51,930 | 5,060,059 | ||||||
Royal Caribbean Cruises Ltd. | 9,200 | 753,020 | ||||||
Starbucks Corp. | 39,600 | 3,750,120 | ||||||
Starwood Hotels & Resorts Worldwide, Inc. | 9,600 | 801,600 | ||||||
Wyndham Worldwide Corp. | 6,651 | 601,716 | ||||||
Wynn Resorts Ltd. | 4,600 | 579,048 | ||||||
Yum! Brands, Inc. | 23,664 | 1,862,830 | ||||||
|
| |||||||
| 16,997,093 | ||||||||
Household Durables 0.4% | ||||||||
D.R. Horton, Inc. | 17,800 | 506,944 | ||||||
Garmin Ltd.(a) | 6,200 | 294,624 | ||||||
Harman International Industries, Inc. | 3,700 | 494,431 | ||||||
Leggett & Platt, Inc. | 7,400 | 341,066 | ||||||
Lennar Corp. (Class A Stock)(a) | 9,100 | 471,471 | ||||||
Mohawk Industries, Inc.* | 3,300 | 612,975 | ||||||
Newell Rubbermaid, Inc. | 13,627 | 532,407 | ||||||
See Notes to Financial Statements.
| 16 |
| Description | Shares | Value (Note 1) | ||||||
COMMON STOCKS (Continued) | ||||||||
Household Durables (cont’d.) | ||||||||
PulteGroup, Inc. | 15,711 | $ | 349,256 | |||||
Whirlpool Corp. | 4,185 | 845,621 | ||||||
|
| |||||||
| 4,448,795 | ||||||||
Household Products 1.7% | ||||||||
Clorox Co. (The) | 7,432 | 820,418 | ||||||
Colgate-Palmolive Co. | 45,360 | 3,145,262 | ||||||
Kimberly-Clark Corp. | 20,016 | 2,143,914 | ||||||
Procter & Gamble Co. (The) | 144,623 | 11,850,409 | ||||||
|
| |||||||
| 17,960,003 | ||||||||
Independent Power & Renewable Electricity Producers 0.1% | ||||||||
AES Corp. | 34,800 | 447,180 | ||||||
NRG Energy, Inc. | 17,000 | 428,230 | ||||||
|
| |||||||
| 875,410 | ||||||||
Industrial Conglomerates 2.2% | ||||||||
3M Co. | 34,198 | 5,640,960 | ||||||
Danaher Corp. | 32,600 | 2,767,740 | ||||||
General Electric Co. | 537,572 | 13,337,161 | ||||||
Roper Industries, Inc. | 5,400 | 928,800 | ||||||
|
| |||||||
| 22,674,661 | ||||||||
Insurance 2.5% | ||||||||
ACE Ltd. | 17,900 | 1,995,671 | ||||||
Aflac, Inc. | 23,900 | 1,529,839 | ||||||
Allstate Corp. (The) | 22,308 | 1,587,660 | ||||||
American International Group, Inc. | 74,301 | 4,070,952 | ||||||
Aon PLC | 15,089 | 1,450,355 | ||||||
Assurant, Inc. | 3,900 | 239,499 | ||||||
Chubb Corp. (The) | 12,768 | 1,290,845 | ||||||
Cincinnati Financial Corp. | 7,507 | 399,973 | ||||||
Genworth Financial, Inc. (Class A Stock)* | 23,300 | 170,323 | ||||||
Hartford Financial Services Group, Inc. (The) | 22,753 | 951,531 | ||||||
Lincoln National Corp. | 14,151 | 813,116 | ||||||
Loews Corp. | 15,117 | 617,227 | ||||||
Marsh & McLennan Cos., Inc. | 28,640 | 1,606,418 | ||||||
MetLife, Inc. | 60,700 | 3,068,385 | ||||||
Principal Financial Group, Inc. | 14,100 | 724,317 | ||||||
Progressive Corp. (The) | 27,716 | 753,875 | ||||||
See Notes to Financial Statements.
| Prudential Stock Index Fund | 17 |
Portfolio of Investments
as of March 31, 2015 (Unaudited) continued
| Description | Shares | Value (Note 1) | ||||||
COMMON STOCKS (Continued) | ||||||||
Insurance (cont’d.) | ||||||||
Prudential Financial, Inc.(b) | 24,500 | $ | 1,967,595 | |||||
Torchmark Corp. | 6,933 | 380,760 | ||||||
Travelers Cos., Inc. (The) | 17,511 | 1,893,464 | ||||||
Unum Group | 12,626 | 425,875 | ||||||
XL Group PLC (Ireland) | 13,100 | 482,080 | ||||||
|
| |||||||
| 26,419,760 | ||||||||
Internet & Catalog Retail 1.3% | ||||||||
Amazon.com, Inc.* | 20,260 | 7,538,746 | ||||||
Expedia, Inc. | 5,300 | 498,889 | ||||||
Netflix, Inc.* | 3,200 | 1,333,408 | ||||||
Priceline Group, Inc. (The)* | 2,800 | 3,259,620 | ||||||
TripAdvisor, Inc.* | 6,300 | 523,971 | ||||||
|
| |||||||
| 13,154,634 | ||||||||
Internet Software & Services 3.2% | ||||||||
Akamai Technologies, Inc.* | 9,900 | 703,346 | ||||||
eBay, Inc.* | 59,800 | 3,449,264 | ||||||
Equinix, Inc. | 3,000 | 698,550 | ||||||
Facebook, Inc. (Class A Stock)* | 112,100 | 9,216,301 | ||||||
Google, Inc. (Class A Stock)* | 15,280 | 8,475,816 | ||||||
Google, Inc. (Class C Stock)* | 15,240 | 8,351,520 | ||||||
VeriSign, Inc.*(a) | 5,700 | 381,729 | ||||||
Yahoo!, Inc.* | 48,100 | 2,137,324 | ||||||
|
| |||||||
| 33,413,850 | ||||||||
IT Services 3.2% | ||||||||
Accenture PLC (Class A Stock) | 33,200 | 3,110,508 | ||||||
Alliance Data Systems Corp.* | 3,410 | 1,010,213 | ||||||
Automatic Data Processing, Inc. | 25,778 | 2,207,628 | ||||||
Cognizant Technology Solutions Corp. (Class A Stock)* | 32,800 | 2,046,392 | ||||||
Computer Sciences Corp. | 7,251 | 473,345 | ||||||
Fidelity National Information Services, Inc. | 15,400 | 1,048,124 | ||||||
Fiserv, Inc.* | 12,900 | 1,024,260 | ||||||
International Business Machines Corp. | 49,134 | 7,886,007 | ||||||
MasterCard, Inc. (Class A Stock) | 52,200 | 4,509,558 | ||||||
Paychex, Inc.(a) | 17,625 | 874,464 | ||||||
Teradata Corp.*(a) | 7,600 | 335,464 | ||||||
Total System Services, Inc. | 7,971 | 304,094 | ||||||
Visa, Inc. (Class A Stock)(a) | 104,120 | 6,810,489 | ||||||
See Notes to Financial Statements.
| 18 |
| Description | Shares | Value (Note 1) | ||||||
COMMON STOCKS (Continued) | ||||||||
IT Services (cont’d.) | ||||||||
Western Union Co. (The)(a) | 25,452 | $ | 529,656 | |||||
Xerox Corp. | 54,600 | 701,610 | ||||||
|
| |||||||
| 32,871,812 | ||||||||
Leisure Products 0.1% | ||||||||
Hasbro, Inc. | 5,954 | 376,531 | ||||||
Mattel, Inc. | 17,013 | 388,747 | ||||||
|
| |||||||
| 765,278 | ||||||||
Life Sciences Tools & Services 0.4% | ||||||||
Agilent Technologies, Inc. | 18,098 | 751,972 | ||||||
PerkinElmer, Inc. | 6,170 | 315,534 | ||||||
Thermo Fisher Scientific, Inc. | 21,702 | 2,915,446 | ||||||
Waters Corp.* | 4,500 | 559,440 | ||||||
|
| |||||||
| 4,542,392 | ||||||||
Machinery 1.4% | ||||||||
Caterpillar, Inc. | 32,056 | 2,565,442 | ||||||
Cummins, Inc. | 9,016 | 1,249,978 | ||||||
Deere & Co. | 18,680 | 1,638,049 | ||||||
Dover Corp.(a) | 9,162 | 633,277 | ||||||
Flowserve Corp. | 6,900 | 389,781 | ||||||
Illinois Tool Works, Inc. | 19,336 | 1,878,299 | ||||||
Ingersoll-Rand PLC | 13,800 | 939,504 | ||||||
Joy Global, Inc. | 5,300 | 207,654 | ||||||
PACCAR, Inc. | 18,664 | 1,178,445 | ||||||
Pall Corp. | 5,604 | 562,586 | ||||||
Parker-Hannifin Corp. | 7,938 | 942,876 | ||||||
Pentair PLC (United Kingdom)(a) | 9,946 | 625,504 | ||||||
Snap-on, Inc. | 3,242 | 476,768 | ||||||
Stanley Black & Decker, Inc. | 8,188 | 780,808 | ||||||
Xylem, Inc. | 9,300 | 325,686 | ||||||
|
| |||||||
| 14,394,657 | ||||||||
Media 3.3% | ||||||||
Cablevision Systems Corp. (Class A Stock)(a) | 9,700 | 177,510 | ||||||
CBS Corp. (Class B Stock) | 25,576 | 1,550,673 | ||||||
Comcast Corp. (Class A Stock) | 136,685 | 7,718,602 | ||||||
DIRECTV*(a) | 27,200 | 2,314,720 | ||||||
Discovery Communications, Inc. (Class A Stock)*(a) | 7,400 | 227,624 | ||||||
See Notes to Financial Statements.
| Prudential Stock Index Fund | 19 |
Portfolio of Investments
as of March 31, 2015 (Unaudited) continued
| Description | Shares | Value (Note 1) | ||||||
COMMON STOCKS (Continued) | ||||||||
Media (cont’d.) | ||||||||
Discovery Communications, Inc. (Class C Stock)* | 13,900 | $ | 409,702 | |||||
Gannett Co., Inc. | 11,589 | 429,720 | ||||||
Interpublic Group of Cos., Inc. (The) | 20,088 | 444,347 | ||||||
News Corp. (Class A Stock)* | 24,375 | 390,244 | ||||||
Omnicom Group, Inc.(a) | 13,034 | 1,016,391 | ||||||
Scripps Networks Interactive, Inc. (Class A Stock)(a) | 5,200 | 356,512 | ||||||
Time Warner Cable, Inc. | 15,081 | 2,260,340 | ||||||
Time Warner, Inc. | 44,774 | 3,780,716 | ||||||
Twenty-First Century Fox, Inc. (Class A Stock) | 98,400 | 3,329,856 | ||||||
Viacom, Inc. (Class B Stock) | 19,476 | 1,330,211 | ||||||
Walt Disney Co. (The) | 83,713 | 8,780,657 | ||||||
|
| |||||||
| 34,517,825 | ||||||||
Metals & Mining 0.3% | ||||||||
Alcoa, Inc. | 65,444 | 845,537 | ||||||
Allegheny Technologies, Inc. | 5,218 | 156,592 | ||||||
Freeport-McMoRan, Inc. | 54,192 | 1,026,938 | ||||||
Newmont Mining Corp. | 24,997 | 542,685 | ||||||
Nucor Corp. | 16,712 | 794,321 | ||||||
|
| |||||||
| 3,366,073 | ||||||||
Multi-Utilities 1.1% | ||||||||
Ameren Corp. | 12,469 | 526,192 | ||||||
CenterPoint Energy, Inc. | 22,179 | 452,673 | ||||||
CMS Energy Corp. | 14,300 | 499,213 | ||||||
Consolidated Edison, Inc. | 15,751 | 960,811 | ||||||
Dominion Resources, Inc. | 31,304 | 2,218,515 | ||||||
DTE Energy Co. | 9,287 | 749,368 | ||||||
Integrys Energy Group, Inc. | 4,108 | 295,858 | ||||||
NiSource, Inc. | 16,900 | 746,304 | ||||||
PG&E Corp. | 26,153 | 1,387,940 | ||||||
Public Service Enterprise Group, Inc. | 26,894 | 1,127,396 | ||||||
SCANA Corp. | 7,200 | 395,928 | ||||||
Sempra Energy | 12,198 | 1,329,826 | ||||||
TECO Energy, Inc. | 10,800 | 209,520 | ||||||
Wisconsin Energy Corp. | 11,500 | 569,250 | ||||||
|
| |||||||
| 11,468,794 | ||||||||
Multiline Retail 0.8% | ||||||||
Dollar General Corp.* | 16,000 | 1,206,080 | ||||||
See Notes to Financial Statements.
| 20 |
| Description | Shares | Value (Note 1) | ||||||
COMMON STOCKS (Continued) | ||||||||
Multiline Retail (cont’d.) | ||||||||
Dollar Tree, Inc.* | 10,800 | $ | 876,366 | |||||
Family Dollar Stores, Inc. | 5,000 | 396,200 | ||||||
Kohl’s Corp. | 11,000 | 860,750 | ||||||
Macy’s, Inc.(a) | 18,282 | 1,186,684 | ||||||
Nordstrom, Inc. | 7,300 | 586,336 | ||||||
Target Corp. | 34,182 | 2,805,317 | ||||||
|
| |||||||
| 7,917,733 | ||||||||
Oil, Gas & Consumable Fuels 6.4% | ||||||||
Anadarko Petroleum Corp. | 27,136 | 2,247,132 | ||||||
Apache Corp. | 20,348 | 1,227,595 | ||||||
Cabot Oil & Gas Corp. | 20,800 | 614,224 | ||||||
Chesapeake Energy Corp.(a) | 26,100 | 369,576 | ||||||
Chevron Corp. | 100,792 | 10,581,144 | ||||||
Cimarex Energy Co. | 4,900 | 563,941 | ||||||
ConocoPhillips | 65,557 | 4,081,579 | ||||||
CONSOL Energy, Inc. | 11,200 | 312,368 | ||||||
Devon Energy Corp. | 20,800 | 1,254,448 | ||||||
EOG Resources, Inc. | 29,300 | 2,686,517 | ||||||
EQT Corp. | 7,900 | 654,673 | ||||||
Exxon Mobil Corp. | 225,052 | 19,129,420 | ||||||
Hess Corp. | 13,334 | 904,979 | ||||||
Kinder Morgan, Inc. | 90,180 | 3,792,971 | ||||||
Marathon Oil Corp. | 35,778 | 934,163 | ||||||
Marathon Petroleum Corp. | 14,989 | 1,534,724 | ||||||
Murphy Oil Corp. | 8,600 | 400,760 | ||||||
Newfield Exploration Co.* | 8,500 | 298,265 | ||||||
Noble Energy, Inc. | 20,500 | 1,002,450 | ||||||
Occidental Petroleum Corp. | 40,976 | 2,991,248 | ||||||
ONEOK, Inc. | 11,100 | 535,464 | ||||||
Phillips 66 | 29,228 | 2,297,321 | ||||||
Pioneer Natural Resources Co. | 8,000 | 1,308,080 | ||||||
QEP Resources, Inc. | 9,200 | 191,820 | ||||||
Range Resources Corp. | 8,400 | 437,136 | ||||||
Southwestern Energy Co.*(a) | 18,800 | 435,972 | ||||||
Spectra Energy Corp. | 35,284 | 1,276,222 | ||||||
Tesoro Corp. | 6,800 | 620,772 | ||||||
Valero Energy Corp. | 27,700 | 1,762,274 | ||||||
Williams Cos., Inc. (The) | 35,692 | 1,805,658 | ||||||
|
| |||||||
| 66,252,896 | ||||||||
See Notes to Financial Statements.
| Prudential Stock Index Fund | 21 |
Portfolio of Investments
as of March 31, 2015 (Unaudited) continued
| Description | Shares | Value (Note 1) | ||||||
COMMON STOCKS (Continued) | ||||||||
Paper & Forest Products 0.1% | ||||||||
International Paper Co. | 22,284 | $ | 1,236,539 | |||||
Personal Products 0.1% | ||||||||
Estee Lauder Cos., Inc. (The) (Class A Stock) | 12,300 | 1,022,868 | ||||||
Pharmaceuticals 6.0% | ||||||||
AbbVie, Inc. | 84,574 | 4,950,962 | ||||||
Actavis PLC* | 20,875 | 6,212,817 | ||||||
Bristol-Myers Squibb Co. | 88,979 | 5,739,146 | ||||||
Eli Lilly & Co. | 52,497 | 3,813,907 | ||||||
Endo International PLC*(a) | 8,800 | 789,360 | ||||||
Hospira, Inc.* | 9,307 | 817,527 | ||||||
Johnson & Johnson | 149,069 | 14,996,341 | ||||||
Mallinckrodt PLC* | 6,300 | 797,895 | ||||||
Merck & Co., Inc. | 151,333 | 8,698,621 | ||||||
Mylan NV* | 19,900 | 1,181,065 | ||||||
Perrigo Co. PLC | 7,700 | 1,274,735 | ||||||
Pfizer, Inc. | 329,823 | 11,474,542 | ||||||
Zoetis, Inc. | 26,300 | 1,217,427 | ||||||
|
| |||||||
| 61,964,345 | ||||||||
Professional Services 0.2% | ||||||||
Dun & Bradstreet Corp. (The) | 1,900 | 243,884 | ||||||
Equifax, Inc. | 6,530 | 607,290 | ||||||
Nielsen NV | 16,500 | 735,405 | ||||||
Robert Half International, Inc. | 6,900 | 417,588 | ||||||
|
| |||||||
| 2,004,167 | ||||||||
Real Estate Investment Trusts (REITs) 2.4% | ||||||||
American Tower Corp. | 22,300 | 2,099,545 | ||||||
Apartment Investment & Management Co. (Class A Stock) | 8,180 | 321,965 | ||||||
AvalonBay Communities, Inc. | 7,111 | 1,239,092 | ||||||
Boston Properties, Inc. | 8,400 | 1,180,032 | ||||||
Crown Castle International Corp. | 17,800 | 1,469,212 | ||||||
Equity Residential | 19,600 | 1,526,056 | ||||||
Essex Property Trust, Inc. | 3,400 | 781,660 | ||||||
General Growth Properties, Inc. | 33,300 | 984,015 | ||||||
HCP, Inc. | 24,000 | 1,037,040 | ||||||
Health Care REIT, Inc. | 18,300 | 1,415,688 | ||||||
Host Hotels & Resorts, Inc. | 39,036 | 787,746 | ||||||
See Notes to Financial Statements.
| 22 |
| Description | Shares | Value (Note 1) | ||||||
COMMON STOCKS (Continued) | ||||||||
Real Estate Investment Trusts (REITs) (cont’d.) | ||||||||
Iron Mountain, Inc. | 9,805 | $ | 357,686 | |||||
Kimco Realty Corp.(a) | 20,700 | 555,795 | ||||||
Macerich Co. (The) | 7,400 | 624,042 | ||||||
Plum Creek Timber Co., Inc. | 8,800 | 382,360 | ||||||
Prologis, Inc. | 26,937 | 1,173,376 | ||||||
Public Storage | 7,700 | 1,517,978 | ||||||
Simon Property Group, Inc. | 16,589 | 3,245,472 | ||||||
SL Green Realty Corp. | 4,600 | 590,548 | ||||||
Ventas, Inc. | 17,333 | 1,265,656 | ||||||
Vornado Realty Trust | 9,384 | 1,051,008 | ||||||
Weyerhaeuser Co. | 27,359 | 906,951 | ||||||
|
| |||||||
| 24,512,923 | ||||||||
Real Estate Management & Development 0.1% | ||||||||
CBRE Group, Inc. (Class A Stock)* | 14,600 | 565,166 | ||||||
Road & Rail 0.9% | ||||||||
CSX Corp. | 52,218 | 1,729,460 | ||||||
Kansas City Southern | 6,200 | 632,896 | ||||||
Norfolk Southern Corp.(a) | 16,711 | 1,719,896 | ||||||
Ryder System, Inc. | 2,821 | 267,685 | ||||||
Union Pacific Corp. | 47,216 | 5,113,965 | ||||||
|
| |||||||
| 9,463,902 | ||||||||
Semiconductors & Semiconductor Equipment 2.3% | ||||||||
Altera Corp. | 15,300 | 656,523 | ||||||
Analog Devices, Inc. | 16,500 | 1,039,500 | ||||||
Applied Materials, Inc. | 62,888 | 1,418,753 | ||||||
Avago Technologies Ltd. (Singapore) | 14,000 | 1,777,720 | ||||||
Broadcom Corp. (Class A Stock) | 29,200 | 1,264,214 | ||||||
First Solar, Inc.* | 3,800 | 227,202 | ||||||
Intel Corp. | 255,788 | 7,998,491 | ||||||
KLA-Tencor Corp. | 8,420 | 490,802 | ||||||
Lam Research Corp. | 8,862 | 622,422 | ||||||
Linear Technology Corp. | 12,700 | 594,360 | ||||||
Microchip Technology, Inc. | 10,700 | 523,230 | ||||||
Micron Technology, Inc.*(a) | 57,616 | 1,563,122 | ||||||
NVIDIA Corp.(a) | 26,800 | 560,790 | ||||||
Skyworks Solutions, Inc. | 10,300 | 1,012,387 | ||||||
Texas Instruments, Inc. | 56,052 | 3,205,334 | ||||||
Xilinx, Inc. | 13,500 | 571,050 | ||||||
|
| |||||||
| 23,525,900 | ||||||||
See Notes to Financial Statements.
| Prudential Stock Index Fund | 23 |
Portfolio of Investments
as of March 31, 2015 (Unaudited) continued
| Description | Shares | Value (Note 1) | ||||||
COMMON STOCKS (Continued) | ||||||||
Software 3.4% | ||||||||
Adobe Systems, Inc.* | 25,240 | $ | 1,866,246 | |||||
Autodesk, Inc.* | 12,120 | 710,717 | ||||||
CA, Inc. | 17,158 | 559,522 | ||||||
Citrix Systems, Inc.* | 8,200 | 523,734 | ||||||
Electronic Arts, Inc.* | 16,400 | 964,566 | ||||||
Intuit, Inc. | 15,500 | 1,502,880 | ||||||
Microsoft Corp. | 439,312 | 17,860,229 | ||||||
Oracle Corp. | 171,640 | 7,406,266 | ||||||
Red Hat, Inc.* | 10,400 | 787,800 | ||||||
salesforce.com, inc.* | 31,400 | 2,097,834 | ||||||
Symantec Corp. | 35,017 | 818,172 | ||||||
|
| |||||||
| 35,097,966 | ||||||||
Specialty Retail 2.3% | ||||||||
AutoNation, Inc.* | 3,923 | 252,367 | ||||||
AutoZone, Inc.* | 1,790 | 1,221,066 | ||||||
Bed Bath & Beyond, Inc.* | 10,500 | 806,138 | ||||||
Best Buy Co., Inc. | 15,800 | 597,082 | ||||||
CarMax, Inc.* | 11,700 | 807,417 | ||||||
GameStop Corp. (Class A Stock)(a) | 5,600 | 212,576 | ||||||
Gap, Inc. (The) | 13,713 | 594,184 | ||||||
Home Depot, Inc. (The) | 69,984 | 7,950,882 | ||||||
L. Brands, Inc. | 13,222 | 1,246,702 | ||||||
Lowe’s Cos., Inc. | 52,296 | 3,890,300 | ||||||
O’Reilly Automotive, Inc.* | 5,400 | 1,167,696 | ||||||
Ross Stores, Inc. | 11,200 | 1,180,032 | ||||||
Staples, Inc. | 33,925 | 552,469 | ||||||
Tiffany & Co. | 5,900 | 519,259 | ||||||
TJX Cos., Inc. (The) | 36,564 | 2,561,308 | ||||||
Tractor Supply Co. | 7,200 | 612,432 | ||||||
Urban Outfitters, Inc.* | 5,300 | 241,945 | ||||||
|
| |||||||
| 24,413,855 | ||||||||
Technology Hardware, Storage & Peripherals 4.6% | ||||||||
Apple, Inc. | 311,938 | 38,814,446 | ||||||
EMC Corp. | 106,604 | 2,724,798 | ||||||
Hewlett-Packard Co. | 98,102 | 3,056,858 | ||||||
NetApp, Inc. | 16,300 | 577,998 | ||||||
SanDisk Corp. | 11,800 | 750,716 | ||||||
Seagate Technology PLC(a) | 17,200 | 894,916 | ||||||
See Notes to Financial Statements.
| 24 |
| Description | Shares | Value (Note 1) | ||||||
COMMON STOCKS (Continued) | ||||||||
Technology Hardware, Storage & Peripherals (cont’d.) | ||||||||
Western Digital Corp. | 11,600 | $ | 1,055,716 | |||||
|
| |||||||
| 47,875,448 | ||||||||
Textiles, Apparel & Luxury Goods 0.9% | ||||||||
Coach, Inc.(a) | 14,000 | 580,020 | ||||||
Fossil Group, Inc.*(a) | 2,500 | 206,125 | ||||||
Hanesbrands, Inc. | 20,200 | 676,902 | ||||||
Michael Kors Holdings Ltd.* | 10,900 | 716,675 | ||||||
NIKE, Inc. (Class B Stock) | 37,052 | 3,717,427 | ||||||
PVH Corp. | 4,600 | 490,176 | ||||||
Ralph Lauren Corp. | 3,300 | 433,950 | ||||||
Under Armour, Inc. (Class A Stock)*(a) | 8,800 | 710,600 | ||||||
VF Corp. | 18,736 | 1,411,008 | ||||||
|
| |||||||
| 8,942,883 | ||||||||
Thrifts & Mortgage Finance | ||||||||
Hudson City Bancorp, Inc. | 22,600 | 236,848 | ||||||
People’s United Financial, Inc.(a) | 15,000 | 228,000 | ||||||
|
| |||||||
| 464,848 | ||||||||
Tobacco 1.3% | ||||||||
Altria Group, Inc. | 105,679 | 5,286,064 | ||||||
Lorillard, Inc. | 19,480 | 1,273,018 | ||||||
Philip Morris International, Inc. | 82,479 | 6,213,143 | ||||||
Reynolds American, Inc. | 16,500 | 1,137,015 | ||||||
|
| |||||||
| 13,909,240 | ||||||||
Trading Companies & Distributors 0.2% | ||||||||
Fastenal Co.(a) | 14,000 | 580,090 | ||||||
United Rentals, Inc.*(a) | 5,400 | 492,264 | ||||||
W.W. Grainger, Inc.(a) | 3,474 | 819,204 | ||||||
|
| |||||||
| 1,891,558 | ||||||||
|
| |||||||
TOTAL COMMON STOCKS | 979,391,495 | |||||||
|
| |||||||
See Notes to Financial Statements.
| Prudential Stock Index Fund | 25 |
Portfolio of Investments
as of March 31, 2015 (Unaudited) continued
| Description | Shares | Value (Note 1) | ||||||
EXCHANGE TRADED FUND 0.6% | ||||||||
iShares Core S&P 500 ETF | 32,400 | $ | 6,733,692 | |||||
|
| |||||||
TOTAL LONG-TERM INVESTMENTS | 986,125,187 | |||||||
|
| |||||||
SHORT-TERM INVESTMENTS 6.5% | ||||||||
AFFILIATED MONEY MARKET MUTUAL FUND 6.3% | ||||||||
Prudential Investment Portfolios 2 - Prudential Core Taxable Money Market Fund | 65,728,419 | 65,728,419 | ||||||
|
| |||||||
Principal | ||||||||
U.S. TREASURY OBLIGATION 0.2% | ||||||||
U.S. Treasury Bill, 0.152%, 09/17/15 | 2,000 | 1,999,062 | ||||||
|
| |||||||
TOTAL SHORT-TERM INVESTMENTS | 67,727,481 | |||||||
|
| |||||||
TOTAL INVESTMENTS 101.4% | 1,053,852,668 | |||||||
Liabilities in excess of other assets(g) (1.4)% | (15,015,374 | ) | ||||||
|
| |||||||
NET ASSETS 100.0% | $ | 1,038,837,294 | ||||||
|
| |||||||
The following abbreviation is used in the portfolio descriptions:
ETF—Exchange Traded Fund
REIT—Real Estate Investment Trust
| * | Non-income producing security. |
| # | Principal amount shown in U.S. dollars unless otherwise stated. |
| (a) | All or a portion of security is on loan. The aggregate market value of such securities, including those sold and pending settlement, is $23,063,559; cash collateral of $23,697,962 (included in liabilities) was received with which the Fund purchased highly liquid short-term investments. Securities on loan are subject to contractual netting arrangements. |
| (b) | An affiliated security. |
| (c) | Represents security, or a portion thereof, purchased with cash collateral received for securities on loan. |
| (d) | Prudential Investments LLC, the manager of the Fund, also serves as manager of the Prudential Investment Portfolios 2 - Prudential Core Taxable Money Market Fund. |
| (e) | Rate quoted represents yield-to-maturity as of purchase date. |
| (f) | Represents security, or a portion thereof, segregated as collateral for futures contracts. |
See Notes to Financial Statements.
| 26 |
| (g) | Liabilities in excess of other assets includes net unrealized appreciation (depreciation) on futures contracts as follows: |
Futures contracts outstanding at March 31, 2015:
| Number of Contracts | Type | Expiration Date | Value at Trade Date | Value at March 31, 2015 | Unrealized Appreciation (Depreciation)(1) | |||||||||||||||
| Long Positions: | ||||||||||||||||||||
| 112 | S&P 500 E-Mini | Jun. 2015 | $ | 11,520,286 | $ | 11,540,480 | $ | 20,194 | ||||||||||||
| 50 | S&P 500 Index | Jun. 2015 | 25,806,160 | 25,760,000 | (46,160 | ) | ||||||||||||||
|
| |||||||||||||||||||
| $ | (25,966 | ) | ||||||||||||||||||
|
| |||||||||||||||||||
| (1) | A U.S. Treasury Obligation with a market value of $1,999,062 has been segregated with UBS AG to cover requirements for open contracts at March 31, 2015. |
Various inputs are used in determining the value of the Fund’s investments. These inputs are summarized in the three broad levels listed below.
Level 1—quoted prices generally in active markets for identical securities.
Level 2—quoted prices for similar securities, interest rates and yield curves, prepayment speeds, foreign currency exchange rates and other observable inputs.
Level 3—unobservable inputs for securities valued in accordance with Board approved fair valuation procedures.
The following is a summary of the inputs used as of March 31, 2015 in valuing such portfolio securities:
| Level 1 | Level 2 | Level 3 | ||||||||||
Investments in Securities | ||||||||||||
Common Stocks | ||||||||||||
Aerospace & Defense | $ | 27,100,734 | $ | — | $ | — | ||||||
Air Freight & Logistics | 7,001,650 | — | — | |||||||||
Airlines | 5,577,588 | — | — | |||||||||
Auto Components | 4,169,889 | — | — | |||||||||
Automobiles | 6,751,643 | — | — | |||||||||
Banks | 56,266,781 | — | — | |||||||||
Beverages | 21,043,031 | — | — | |||||||||
See Notes to Financial Statements.
| Prudential Stock Index Fund | 27 |
Portfolio of Investments
as of March 31, 2015 (Unaudited) continued
| Level 1 | Level 2 | Level 3 | ||||||||||
Common Stocks (continued) | ||||||||||||
Biotechnology | $ | 29,922,716 | $ | — | $ | — | ||||||
Building Products | 812,077 | — | — | |||||||||
Capital Markets | 22,050,331 | — | — | |||||||||
Chemicals | 23,453,037 | — | — | |||||||||
Commercial Services & Supplies | 4,379,568 | — | — | |||||||||
Communications Equipment | 15,776,334 | — | — | |||||||||
Construction & Engineering | 1,069,353 | — | — | |||||||||
Construction Materials | 1,084,950 | — | — | |||||||||
Consumer Finance | 7,873,605 | — | — | |||||||||
Containers & Packaging | 1,904,371 | — | — | |||||||||
Distributors | 764,065 | — | — | |||||||||
Diversified Consumer Services | 436,793 | — | — | |||||||||
Diversified Financial Services | 20,329,567 | — | — | |||||||||
Diversified Telecommunication Services | 22,195,704 | — | — | |||||||||
Electric Utilities | 16,717,952 | — | — | |||||||||
Electrical Equipment | 5,317,262 | — | — | |||||||||
Electronic Equipment, Instruments & Components | 4,267,821 | — | — | |||||||||
Energy Equipment & Services | 12,279,809 | — | — | |||||||||
Food & Staples Retailing | 24,912,249 | — | — | |||||||||
Food Products | 16,418,211 | — | — | |||||||||
Gas Utilities | 319,250 | — | — | |||||||||
Health Care Equipment & Supplies | 21,462,068 | — | — | |||||||||
Health Care Providers & Services | 27,627,652 | — | — | |||||||||
Health Care Technology | 1,172,160 | — | — | |||||||||
Hotels, Restaurants & Leisure | 16,997,093 | — | — | |||||||||
Household Durables | 4,448,795 | — | — | |||||||||
Household Products | 17,960,003 | — | — | |||||||||
Independent Power & Renewable Electricity Producers | 875,410 | — | — | |||||||||
Industrial Conglomerates | 22,674,661 | — | — | |||||||||
Insurance | 26,419,760 | — | — | |||||||||
Internet & Catalog Retail | 13,154,634 | — | — | |||||||||
Internet Software & Services | 33,413,850 | — | — | |||||||||
IT Services | 32,871,812 | — | — | |||||||||
Leisure Products | 765,278 | — | — | |||||||||
Life Sciences Tools & Services | 4,542,392 | — | — | |||||||||
Machinery | 14,394,657 | — | — | |||||||||
Media | 34,517,825 | — | — | |||||||||
Metals & Mining | 3,366,073 | — | — | |||||||||
Multi-Utilities | 11,468,794 | — | — | |||||||||
Multiline Retail | 7,917,733 | — | — | |||||||||
Oil, Gas & Consumable Fuels | 66,252,896 | — | — | |||||||||
Paper & Forest Products | 1,236,539 | — | — | |||||||||
See Notes to Financial Statements.
| 28 |
| Level 1 | Level 2 | Level 3 | ||||||||||
Common Stocks (continued) | ||||||||||||
Personal Products | $ | 1,022,868 | $ | — | $ | — | ||||||
Pharmaceuticals | 61,964,345 | — | — | |||||||||
Professional Services | 2,004,167 | — | — | |||||||||
Real Estate Investment Trusts (REITs) | 24,512,923 | — | — | |||||||||
Real Estate Management & Development | 565,166 | — | — | |||||||||
Road & Rail | 9,463,902 | — | — | |||||||||
Semiconductors & Semiconductor Equipment | 23,525,900 | — | — | |||||||||
Software | 35,097,966 | — | — | |||||||||
Specialty Retail | 24,413,855 | — | — | |||||||||
Technology Hardware, Storage & Peripherals | 47,875,448 | — | — | |||||||||
Textiles, Apparel & Luxury Goods | 8,942,883 | — | — | |||||||||
Thrifts & Mortgage Finance | 464,848 | — | — | |||||||||
Tobacco | 13,909,240 | — | — | |||||||||
Trading Companies & Distributors | 1,891,558 | — | — | |||||||||
Exchange Traded Fund | 6,733,692 | — | — | |||||||||
Affiliated Money Market Mutual Fund | 65,728,419 | — | — | |||||||||
U.S. Treasury Obligation | — | 1,999,062 | — | |||||||||
Other Financial Instruments* | ||||||||||||
Futures Contracts | (25,966 | ) | — | — | ||||||||
|
|
|
|
|
| |||||||
Total | $ | 1,051,827,640 | $ | 1,999,062 | $ | — | ||||||
|
|
|
|
|
| |||||||
| * | Other financial instruments are derivative instruments not reflected in the Portfolio of Investments, such as futures, forwards and exchange-traded swap contracts, which are recorded at the unrealized appreciation/depreciation on the instrument, and over-the-counter swap contracts which are recorded at fair value. |
The industry classification of investments and liabilities in excess of other assets shown as a percentage of net assets as of March 31, 2015 was as follows:
Oil, Gas & Consumable Fuels | 6.4 | % | ||
Affiliated Money Market Mutual Fund (including 2.3% of collateral for securities on loan) | 6.3 | |||
Pharmaceuticals | 6.0 | |||
Banks | 5.4 | |||
Technology Hardware, Storage & Peripherals | 4.6 | |||
Software | 3.4 | |||
Media | 3.3 | |||
Internet Software & Services | 3.2 | |||
IT Services | 3.2 | |||
Biotechnology | 2.9 | |||
Health Care Providers & Services | 2.7 | |||
Aerospace & Defense | 2.6 | |||
Insurance | 2.5 | |||
Food & Staples Retailing | 2.4 | % | ||
Real Estate Investment Trusts (REITs) | 2.4 | |||
Specialty Retail | 2.3 | |||
Semiconductors & Semiconductor Equipment | 2.3 | |||
Chemicals | 2.3 | |||
Industrial Conglomerates | 2.2 | |||
Diversified Telecommunication Services | 2.1 | |||
Capital Markets | 2.1 | |||
Health Care Equipment & Supplies | 2.1 | |||
Beverages | 2.0 | |||
Diversified Financial Services | 2.0 | |||
Household Products | 1.7 | |||
Hotels, Restaurants & Leisure | 1.6 | |||
Electric Utilities | 1.6 |
See Notes to Financial Statements.
| Prudential Stock Index Fund | 29 |
Portfolio of Investments
as of March 31, 2015 (Unaudited) continued
Food Products | 1.6 | % | ||
Communications Equipment | 1.5 | |||
Machinery | 1.4 | |||
Tobacco | 1.3 | |||
Internet & Catalog Retail | 1.3 | |||
Energy Equipment & Services | 1.2 | |||
Multi-Utilities | 1.1 | |||
Road & Rail | 0.9 | |||
Textiles, Apparel & Luxury Goods | 0.9 | |||
Multiline Retail | 0.8 | |||
Consumer Finance | 0.8 | |||
Air Freight & Logistics | 0.7 | |||
Automobiles | 0.6 | |||
Exchange Traded Fund | 0.6 | |||
Airlines | 0.5 | |||
Electrical Equipment | 0.5 | |||
Life Sciences Tools & Services | 0.4 | |||
Household Durables | 0.4 | |||
Commercial Services & Supplies | 0.4 | |||
Electronic Equipment, Instruments & Components | 0.4 | |||
Auto Components | 0.4 | % | ||
Metals & Mining | 0.3 | |||
Professional Services | 0.2 | |||
U.S. Treasury Obligation | 0.2 | |||
Containers & Packaging | 0.2 | |||
Trading Companies & Distributors | 0.2 | |||
Paper & Forest Products | 0.1 | |||
Health Care Technology | 0.1 | |||
Construction Materials | 0.1 | |||
Construction & Engineering | 0.1 | |||
Personal Products | 0.1 | |||
Independent Power & Renewable Electricity Producers | 0.1 | |||
Building Products | 0.1 | |||
Leisure Products | 0.1 | |||
Distributors | 0.1 | |||
Real Estate Management & Development | 0.1 | |||
|
| |||
| 101.4 | ||||
Liabilities in excess of other assets | (1.4 | ) | ||
|
| |||
| 100.0 | % | |||
|
|
The Fund invested in derivative instruments during the reporting period. The primary type of risk associated with these derivative instruments is equity risk. The effect of such derivative instruments on the Fund’s financial position and financial performance as reflected in the Statement of Assets and Liabilities and Statement of Operations is presented in the summary below.
Fair values of derivative instruments as of March 31, 2015 as presented in the Statement of Assets and Liabilities:
Derivatives not accounted for | Asset Derivatives | Liability Derivatives | ||||||||||
Balance Sheet | Fair Value | Balance Sheet | Fair Value | |||||||||
| Equity contracts | — | $ | — | Due from/to broker— variation margin futures | $ | 25,966 | * | |||||
|
|
|
| |||||||||
| * | Includes cumulative appreciation/depreciation as reported in schedule of open futures. Only unsettled variation margin receivable (payable) is reported within the Statement of Assets and Liabilities. |
See Notes to Financial Statements.
| 30 |
The effects of derivative instruments on the Statement of Operations for the six months ended March 31, 2015 are as follows:
Amount of Realized Gain or (Loss) on Derivatives Recognized in Income | ||||
Derivatives not accounted for as hedging instruments, carried at fair value | Futures | |||
Equity contracts | $ | 1,738,184 | ||
|
| |||
Change in Unrealized Appreciation or (Depreciation) on Derivatives Recognized in Income | ||||
Derivatives not accounted for as hedging instruments, carried at fair value | Futures | |||
Equity contracts | $ | 140,835 | ||
|
| |||
For the six months ended March 31, 2015, the Fund’s average value at trade date for futures long positions was $34,427,544.
See Notes to Financial Statements.
| Prudential Stock Index Fund | 31 |
Statement of Assets and Liabilities
as of March 31, 2015 (Unaudited)
Assets | ||||
Investments at value, including securities on loan of $23,063,559: | ||||
Unaffiliated Investments (cost $366,155,113) | $ | 986,156,654 | ||
Affiliated Investments (cost $66,577,315) | 67,696,014 | |||
Receivable for Fund shares sold | 15,063,387 | |||
Dividends receivable | 1,226,001 | |||
Prepaid expenses | 4,001 | |||
|
| |||
Total assets | 1,070,146,057 | |||
|
| |||
Liabilities | ||||
Payable to broker for collateral for securities on loan | 23,697,962 | |||
Payable for investments purchased | 5,698,677 | |||
Payable for Fund shares reacquired | 1,241,088 | |||
Due to broker—variation margin futures | 264,180 | |||
Accrued expenses | 125,289 | |||
Affiliated transfer agent fee payable | 98,894 | |||
Distribution fee payable | 95,062 | |||
Management fee payable | 68,828 | |||
Payable to custodian | 18,783 | |||
|
| |||
Total liabilities | 31,308,763 | |||
|
| |||
Net Assets | $ | 1,038,837,294 | ||
|
| |||
Net assets were comprised of: | ||||
Shares of beneficial interest, at par | $ | 23,738 | ||
Paid-in capital in excess of par | 405,223,543 | |||
|
| |||
| 405,247,281 | ||||
Undistributed net investment income | 7,077,902 | |||
Accumulated net realized gain on investment transactions | 5,417,837 | |||
Net unrealized appreciation on investments | 621,094,274 | |||
|
| |||
Net assets, March 31, 2015 | $ | 1,038,837,294 | ||
|
| |||
See Notes to Financial Statements.
| 32 |
Class A | ||||
Net asset value and redemption price per share | $ | 43.69 | ||
Maximum sales charge (3.25% of offering price) | 1.47 | |||
|
| |||
Maximum offering price to public | $ | 45.16 | ||
|
| |||
Class C | ||||
Net asset value, offering price and redemption price per share | ||||
($47,519,820 ÷ 1,093,359 shares of beneficial interest issued and outstanding) | $ | 43.46 | ||
|
| |||
Class I | ||||
Net asset value, offering price and redemption price per share | ||||
($317,076,533 ÷ 7,239,192 shares of beneficial interest issued and outstanding) | $ | 43.80 | ||
|
| |||
Class Z | ||||
Net asset value, offering price and redemption price per share | ||||
($459,072,372 ÷ 10,481,273 shares of beneficial interest issued and outstanding) | $ | 43.80 | ||
|
| |||
See Notes to Financial Statements.
| Prudential Stock Index Fund | 33 |
Statement of Operations
Six Months Ended March 31, 2015 (Unaudited)
Net Investment Income | ||||
Income | ||||
Unaffiliated dividend income (net of foreign withholding taxes of $1,215) | $ | 9,860,265 | ||
Affiliated dividend income | 54,585 | |||
Affiliated income from securities lending, net | 34,396 | |||
Interest income | 482 | |||
|
| |||
Total income | 9,949,728 | |||
|
| |||
Expenses | ||||
Management fee | 722,575 | |||
Distribution fee—Class A | 306,426 | |||
Distribution fee—Class C | 213,945 | |||
Custodian and accounting fees | 57,000 | |||
Transfer agent fee—Class A (including affiliated expense of $61,000) | 105,000 | |||
Transfer agent fee—Class C (including affiliated expense of $2,000) | 6,000 | |||
Transfer agent fee—Class I (including affiliated expense of $94,000) | 94,000 | |||
Transfer agent fee—Class Z (including affiliated expense of $291,000) | 291,000 | |||
Shareholders’ reports | 96,000 | |||
Registration fees | 40,000 | |||
Trustees’ fees | 16,000 | |||
Legal fees and expenses | 14,000 | |||
Audit fee | 11,000 | |||
Insurance expenses | 6,000 | |||
Commitment fee on syndicated credit agreement | 1,000 | |||
Miscellaneous | 8,559 | |||
|
| |||
Total expenses | 1,988,505 | |||
Less: Management fee waiver | (337,202 | ) | ||
|
| |||
Net expenses | 1,651,303 | |||
|
| |||
Net investment income | 8,298,425 | |||
|
| |||
Realized And Unrealized Gain On Investments | ||||
Net realized gain on: | ||||
Investment transactions | 12,536,765 | |||
Futures transactions | 1,738,184 | |||
|
| |||
| 14,274,949 | ||||
|
| |||
Net change in unrealized appreciation (depreciation) on: | ||||
Investments (including affiliated ($182,870)) | 30,457,981 | |||
Futures | 140,835 | |||
|
| |||
| 30,598,816 | ||||
|
| |||
Net gain on investment transactions | 44,873,765 | |||
|
| |||
Net Increase In Net Assets Resulting From Operations | $ | 53,172,190 | ||
|
| |||
See Notes to Financial Statements.
| 34 |
Statement of Changes in Net Assets
(Unaudited)
Six Months Ended March 31, 2015 | Year Ended September 30, 2014 | |||||||
Increase (Decrease) in Net Assets | ||||||||
Operations | ||||||||
Net investment income | $ | 8,298,425 | $ | 14,788,529 | ||||
Net realized gain on investment transactions | 14,274,949 | 46,273,904 | ||||||
Net change in unrealized appreciation (depreciation) on investments | 30,598,816 | 93,638,094 | ||||||
|
|
|
| |||||
Net increase in net assets resulting from operations | 53,172,190 | 154,700,527 | ||||||
|
|
|
| |||||
Dividends and Distributions (Note 1) | ||||||||
Dividends from net investment income | ||||||||
Class A | (2,772,211 | ) | (2,095,357 | ) | ||||
Class C | (336,055 | ) | (198,743 | ) | ||||
Class I | (4,457,273 | ) | (3,431,791 | ) | ||||
Class Z | (7,305,498 | ) | (6,202,457 | ) | ||||
|
|
|
| |||||
| (14,871,037 | ) | (11,928,348 | ) | |||||
|
|
|
| |||||
Distributions from net realized gains | ||||||||
Class A | (9,526,261 | ) | (381,468 | ) | ||||
Class C | (1,988,380 | ) | (69,520 | ) | ||||
Class I | (12,540,604 | ) | (495,263 | ) | ||||
Class Z | (21,267,117 | ) | (928,809 | ) | ||||
|
|
|
| |||||
| (45,322,362 | ) | (1,875,060 | ) | |||||
|
|
|
| |||||
Fund share transactions (Net of share conversions) (Note 6) | ||||||||
Net proceeds from shares sold | 175,007,444 | 170,437,276 | ||||||
Net asset value of shares issued in reinvestment of dividends and distributions | 59,793,539 | 13,641,211 | ||||||
Cost of shares reacquired | (105,450,207 | ) | (228,878,658 | ) | ||||
|
|
|
| |||||
Net increase (decrease) in net assets from Fund share transactions | 129,350,776 | (44,800,171 | ) | |||||
|
|
|
| |||||
Total increase | 122,329,567 | 96,096,948 | ||||||
Net Assets: | ||||||||
Beginning of period | 916,507,727 | 820,410,779 | ||||||
|
|
|
| |||||
End of period(a) | $ | 1,038,837,294 | $ | 916,507,727 | ||||
|
|
|
| |||||
(a) Includes undistributed net investment income of: | $ | 7,077,902 | $ | 13,650,514 | ||||
|
|
|
| |||||
See Notes to Financial Statements.
| Prudential Stock Index Fund | 35 |
Notes to Financial Statements
(Unaudited)
Prudential Investment Portfolios 8 (the “Trust”) is an open-end management investment company, registered under the Investment Company Act of 1940, as amended, (“1940 Act”). The Trust was established as a Delaware business trust on May 11, 1992 and currently consists of one fund, which is the Prudential Stock Index Fund (the “Fund”). The Fund’s investment objective is to provide investment results that correspond to the price and yield performance of the Standard & Poor’s 500 Composite Stock Price Index.
Note 1. Accounting Policies
The Fund follows investment company accounting and reporting guidance of the Financial Accounting Standards Board (“FASB”) Accounting Standard Codification Topic 946 Financial Services—Investment Companies. The following accounting policies conform to U.S. generally accepted accounting principles. The Fund consistently follows such policies in the preparation of its financial statements.
Securities Valuation: The Fund holds securities and other assets that are fair valued at the close of each day the New York Stock Exchange (“NYSE”) is open for trading. Fair value is the price that would be received to sell an asset or paid to transfer a liability in an orderly transaction between market participants on the measurement date. The Board of Trustees (the “Board”) has adopted Valuation Procedures for security valuation under which fair valuation responsibilities have been delegated to Prudential Investments LLC (“PI” or “Manager”). Under the current Valuation Procedures, the established Valuation Committee is responsible for supervising the valuation of portfolio securities and other assets. The Valuation Procedures permit the Fund to utilize independent pricing vendor services, quotations from market makers, and alternative valuation methods when market quotations are either not readily available or not deemed representative of fair value. A record of the Valuation Committee’s actions is subject to the Board’s review, approval, and ratification at its next regularly-scheduled quarterly meeting.
Various inputs determine how the Fund’s investments are valued, all of which are categorized according to the three broad levels (Level 1, 2, or 3) detailed in the table following the Portfolio of Investments.
Common and preferred stocks, exchange-traded funds, and derivative instruments, such as futures or options that are traded on a national securities exchange are
| 36 |
valued at the last sale price as of the close of trading on the applicable exchange where the security principally trades. Securities traded via NASDAQ are valued at the NASDAQ official closing price. To the extent these securities are valued at the last sale price or NASDAQ official closing price, they are classified as Level 1 in the fair value hierarchy.
In the event that no sale or official closing price on valuation date exists, these securities are generally valued at the mean between the last reported bid and ask prices, or at the last bid price in the absence of an ask price. These securities are classified as Level 2 in the fair value hierarchy, as the inputs are observable.
Common and preferred stocks traded on foreign securities exchanges are valued using pricing vendor services that provide model prices derived using adjustment factors based on information such as local closing price, relevant general and sector indices, currency fluctuations, depositary receipts, and futures, as applicable. Securities valued using such model prices are classified as Level 2 in the fair value hierarchy, as the adjustment factors are observable. Such securities are valued using model prices to the extent that the valuation meets the established confidence level for each security. If the confidence level is not met or the vendor does not provide a model price, securities are valued in accordance with exchange-traded common and preferred stocks discussed above.
Investments in open-end, non-exchange-traded mutual funds are valued at their net asset values as of the close of the NYSE on the date of valuation. These securities are classified as Level 1 in the fair value hierarchy since they may be purchased or sold at their net asset values on the date of valuation.
Fixed income securities traded in the over-the-counter market are generally valued at prices provided by approved independent pricing vendors. The pricing vendors provide these prices after evaluating observable inputs including, but not limited to yield curves, yield spreads, credit ratings, deal terms, tranche level attributes, default rates, cash flows, prepayment speeds, broker/dealer quotations, and reported trades. Securities valued using such vendor prices are classified as Level 2 in the fair value hierarchy.
Over-the-counter derivative instruments are generally valued using pricing vendor services, which derive the valuation based on inputs such as underlying asset prices, indices, spreads, interest rates, and exchange rates. These instruments are categorized as Level 2 in the fair value hierarchy.
| Prudential Stock Index Fund | 37 |
Notes to Financial Statements
(Unaudited) continued
Centrally cleared swaps listed or traded on a multilateral or trade facility platform, such as a registered exchange, are valued at the daily settlement price determined by the respective exchange. These securities are classified as Level 2 in the fair value hierarchy, as the daily settlement price is not public.
Securities and other assets that cannot be priced according to the methods described above are valued based on pricing methodologies approved by the Board. In the event that unobservable inputs are used when determining such valuations, the securities will be classified as Level 3 in the fair value hierarchy.
When determining the fair value of securities, some of the factors influencing the valuation include: the nature of any restrictions on disposition of the securities; assessment of the general liquidity of the securities; the issuer’s financial condition and the markets in which it does business; the cost of the investment; the size of the holding and the capitalization of the issuer; the prices of any recent transactions or bids/offers for such securities or any comparable securities; any available analyst media or other reports or information deemed reliable by the investment adviser regarding the issuer or the markets or industry in which it operates. Using fair value to price securities may result in a value that is different from a security’s most recent closing price and from the price used by other mutual funds to calculate their net asset values.
Financial Futures Contracts: A financial futures contract is an agreement to purchase (long) or sell (short) an agreed amount of securities at a set price for delivery on a future date. Upon entering into a financial futures contract, the Fund is required to pledge to the broker an amount of cash and/or other assets equal to a certain percentage of the contract amount. This amount is known as the “initial margin.” Subsequent payments, known as “variation margin,” are made or received by the Fund each day, depending on the daily fluctuations in the value of the underlying security. Such variation margin is recorded for financial statement purposes on a daily basis as unrealized gain (loss). When the contract expires or is closed, the gain (loss) is realized and is presented in the Statement of Operations as net realized gain (loss) on financial futures transactions.
The Fund invested in financial futures contracts in order to hedge its existing portfolio securities, or securities the Fund intends to purchase, against fluctuations in value caused by changes in prevailing interest rates or foreign currency exchange rates.
| 38 |
Should interest rates move unexpectedly, the Fund may not achieve the anticipated benefits of the financial futures contracts and may realize a loss. The use of futures transactions involves the risk of imperfect correlation in movements in the price of futures contracts, interest rates and the underlying hedged assets. With exchange-traded futures contracts, there is minimal counterparty credit risk to the Fund since the exchanges’ clearing house acts as counterparty to all exchange-traded futures and guarantees the futures contracts against default.
Master Netting Arrangements: The Fund is subject to various Master Agreements, or netting arrangements, with select counterparties. These are agreements which a sub-adviser may have negotiated and entered into on behalf of the Fund. A master netting arrangement between the Fund and the counterparty permits the Fund to offset amounts payable by the Fund to the same counterparty against amounts to be received; and by the receipt of collateral from the counterparty by the Fund to cover the Fund’s exposure to the counterparty. However, there is no assurance that such mitigating factors are easily enforceable. The right to set-off exists when all the conditions are met such that each of the parties owes the other determinable amounts, the reporting party has the right to set-off the amount owed with the amount owed by the other party, the reporting party intends to set-off and the right of set-off is enforceable by law. During the reporting period, there were no instances where the right to set-off existed and management has not elected to offset.
Financial futures contracts involve elements of both market and credit risk in excess of the amounts reflected on the Statement of Assets and Liabilities. Such risks may be mitigated by engaging in master netting arrangements.
Securities Lending: The Fund may lend its portfolio securities to banks and broker-dealers. The loans are secured by collateral at least equal to the market value of the securities loaned. Collateral pledged by each borrower is invested in a highly liquid short-term money market fund and is marked to market daily, based on the previous day’s market value, such that the value of the collateral exceeds the value of the loaned securities. Loans are subject to termination at the option of the borrower or the Fund. Upon termination of the loan, the borrower will return to the Fund securities identical to the loaned securities. Should the borrower of the securities fail financially, the Fund has the right to repurchase the securities in the open market using the collateral. The Fund recognizes income, net of any rebate and securities lending agent fees, for lending its securities, and any interest on the investment of cash received as collateral. The Fund also continues to receive interest and dividends or amounts equivalent thereto, on the securities loaned and recognizes any unrealized gain or loss in the market price of the securities loaned that may occur during the term of the loan.
| Prudential Stock Index Fund | 39 |
Notes to Financial Statements
(Unaudited) continued
REITs: The Fund invests in real estate investment trusts (“REITs”), which report information on the source of their distributions annually. Based on current and historical information, a portion of distributions received from REITs during the period is estimated to be dividend income, capital gain or return of capital and recorded accordingly. These estimates are adjusted periodically when the actual sources of distributions are disclosed by the REITs.
Securities Transactions and Net Investment Income: Securities transactions are recorded on the trade date. Realized gains or losses from investment and currency transactions are calculated on the identified cost basis. Dividend income is recorded on the ex-dividend date. Interest income, including amortization of premium and accretion of discount on debt securities, as required, is recorded on an accrual basis.
Expenses are recorded on an accrual basis, which may require the use of certain estimates by management that may differ from actual.
Net investment income or loss (other than distribution fees, which are charged directly to the respective class) and unrealized and realized gains or losses are allocated daily to each class of shares based upon the relative proportion of adjusted net assets of each class at the beginning of the day.
Dividends and Distributions: The Fund expects to pay dividends from net investment income and distributions from net realized capital gains, if any, at least annually. Dividends and distributions to shareholders, which are determined in accordance with federal income tax regulations and which may differ from generally accepted accounting principles, are recorded on the ex-dividend date. Permanent book/tax differences relating to income and gains are reclassified amongst undistributed net investment income, accumulated net realized gain or loss and paid-in capital in excess of par, as appropriate.
Taxes: For federal income tax purposes, the Fund is treated as a separate taxpaying entity. It is the Fund’s policy to continue to meet the requirements of the Internal Revenue Code applicable to regulated investment companies and to distribute all of its taxable net investment income and capital gains, if any, to its shareholders. Therefore, no federal income tax provision is required. Withholding taxes on foreign dividends, interest and capital gains are recorded, net of reclaimable amounts, at the time the related income is earned.
| 40 |
Estimates: The preparation of the financial statements requires management to make estimates and assumptions that affect the reported amounts and disclosures in the financial statements. Actual results could differ from those estimates.
Note 2. Agreements
The Fund has a management agreement with PI. Pursuant to this agreement, PI has responsibility for all investment advisory services and supervises the subadviser’s performance of such services. PI has entered into a subadvisory agreement with Quantitative Management Associates LLC (“QMA”). The subadvisory agreement provides that QMA will furnish investment advisory services in connection with the management of the Fund. PI pays for the services of QMA, the cost of compensation of officers of the Fund, occupancy and certain clerical and bookkeeping costs of the Fund. The Fund bears all other costs and expenses.
The management fee paid to PI is accrued daily and payable monthly, at an annual rate of .15% of the Fund’s average daily net assets up to and including $1 billion and .10% of such average daily net assets in excess of $1 billion. The Fund’s manager has agreed to contractually waive a portion of its management fee, so that the effective management fee for the Fund will be .08% of the average daily net assets of Fund through January 31, 2016. The effective management fee rate before any waivers and/or expense reimbursement was .15% of the average daily net assets for the six months ended March 31, 2015. The effective management fee rate, net of waivers and/or expense reimbursement, was .08%.
The Fund has a distribution agreement with Prudential Investment Management Services LLC (“PIMS”), which acts as the distributor of the Class A, Class C, Class I and Class Z shares of the Fund. The Fund compensates PIMS for distributing and servicing the Fund’s Class A and Class C shares, pursuant to plans of distribution, (the “Class A and C Plans”), regardless of expenses actually incurred by PIMS. The distribution fees are accrued daily and payable monthly. No distribution or service fees are paid to PIMS as distributor of the Class I and Class Z shares of the Fund.
Pursuant to the Class A and C Plans, the Fund compensates PIMS for distribution-related activities at an annual rate of up to .30% and 1% of the average daily net assets of the Class A and C shares, respectively.
PIMS has advised the Fund that it has received $68,701 in front-end sales charges resulting from sales of Class A shares during the six months ended March 31, 2015. From these fees, PIMS paid such sales charges to affiliated broker-dealers which in turn paid commissions to salespersons and incurred other distribution costs.
| Prudential Stock Index Fund | 41 |
Notes to Financial Statements
(Unaudited) continued
PIMS has advised the Fund that for the six months ended March 31, 2015, it received $15 and $3,157 in contingent deferred sales charges imposed upon redemptions by certain Class A and Class C shareholder, respectively.
PI, PIMS and QMA are indirect, wholly-owned subsidiaries of Prudential Financial, Inc. (“Prudential”).
Note 3. Other Transactions with Affiliates
Prudential Mutual Fund Services LLC (“PMFS”), an affiliate of PI and an indirect, wholly-owned subsidiary of Prudential, serves as the Fund’s transfer agent. Transfer agent’s fees and expenses in the Statement of Operations include certain out-of-pocket expenses paid to non-affiliates, where applicable. The Fund’s Class I and Class Z shares are subject to a transfer agent fee of .07% and .13% of the average daily net assets of the Class I and Class Z shares, respectively. Classes A and C each compensate PMFS for its services as they are incurred.
Prudential Investment Management Inc. (“PIM”), an indirect, wholly-owned subsidiary of Prudential, is the Fund’s securities lending agent. Earnings from securities lending are disclosed on the Statement of Operations as “Affiliated income from securities lending, net”. For the six months ended March 31, 2015, PIM was compensated approximately $10,300 for these services.
The Fund invests in the Prudential Core Taxable Money Market Fund (the “Core Fund”), a portfolio of the Prudential Investment Portfolios 2, registered under the 1940 Act and managed by PI. Earnings from the Core Fund are disclosed on the Statement of Operations as “Affiliated dividend income”.
Note 4. Portfolio Securities
Purchases and sales of portfolio securities, other than short-term investments, for the six months ended March 31, 2015, were $81,344,279 and $20,093,970, respectively.
| 42 |
Note 5. Tax Information
The United States federal income tax basis of investments and net unrealized appreciation as of March 31, 2015 were as follows:
Tax Basis | $ | 441,560,822 | ||
|
| |||
Appreciation | 617,745,285 | |||
Depreciation | (5,453,439 | ) | ||
|
| |||
Net Unrealized Appreciation | $ | 612,291,846 | ||
|
|
The book basis may differ from tax basis due to certain tax related adjustments.
Management has analyzed the Fund’s tax positions taken on federal, state and local income tax returns for all open tax years and has concluded that no provision for income tax is required in the Fund’s financial statements for the current reporting period. The Fund’s federal, state and local income tax returns for tax years for which the applicable statutes of limitations have not expired are subject to examination by the Internal Revenue Service and state departments of revenue.
Note 6. Capital
The Fund offers Class A, Class C, Class I and Class Z shares. Class A shares are sold with a front-end sales charge of up to 3.25%. Investors who purchase $1 million or more of Class A shares and sell these shares within 12 months of purchase are subject to a 1% contingent deferred sales charge (“CDSC”), although they are not subject to an initial sales charge. The Class A CDSC is waived for purchases by certain retirement or benefit plans. Class C shares are sold with a CDSC of 1% during the first year.
Class I and Class Z shares are not subject to any sales or redemption charge and are offered exclusively for sale to a limited group of investors. The Trust has authorized an unlimited number of shares of beneficial interest at $.001 par value, currently of one series, divided into four classes, designated Class A, Class C, Class I and Class Z. Under certain circumstances, an exchange may be made from specified share classes of the Fund to one or more other share classes of the Fund as presented in the table of transactions in shares of beneficial interest.
| Prudential Stock Index Fund | 43 |
Notes to Financial Statements
(Unaudited) continued
Transactions in shares of beneficial interest were as follows:
Class A | Shares | Amount | ||||||
Six months ended March 31, 2015: | ||||||||
Shares sold | 830,549 | $ | 36,507,330 | |||||
Shares issued in reinvestment of dividends and distributions | 276,458 | 12,089,501 | ||||||
Shares reacquired | (660,885 | ) | (29,135,845 | ) | ||||
|
|
|
| |||||
Net increase (decrease) in shares outstanding before conversion | 446,122 | 19,460,986 | ||||||
Shares issued upon conversion from Class Z | 141 | 6,187 | ||||||
Shares reacquired upon conversion into Class I and Class Z | (7,235 | ) | (328,265 | ) | ||||
|
|
|
| |||||
Net increase (decrease) in shares outstanding | 439,028 | $ | 19,138,908 | |||||
|
|
|
| |||||
Year ended September 30, 2014: | ||||||||
Shares sold | 1,057,138 | $ | 43,682,829 | |||||
Shares issued in reinvestment of dividends and distributions | 61,893 | 2,421,271 | ||||||
Shares reacquired | (970,302 | ) | (40,179,359 | ) | ||||
|
|
|
| |||||
Net increase (decrease) in shares outstanding before conversion | 148,729 | 5,924,741 | ||||||
Shares issued upon conversion from Class C | 593 | 26,095 | ||||||
Shares reacquired upon conversion into Class Z | (4,578 | ) | (178,608 | ) | ||||
|
|
|
| |||||
Net increase (decrease) in shares outstanding | 144,744 | $ | 5,772,228 | |||||
|
|
|
| |||||
Class C | ||||||||
Six months ended March 31, 2015: | ||||||||
Shares sold | 229,544 | $ | 10,009,665 | |||||
Shares issued in reinvestment of dividends and distributions | 51,764 | 2,255,861 | ||||||
Shares reacquired | (75,623 | ) | (3,286,486 | ) | ||||
|
|
|
| |||||
Net increase (decrease) in shares outstanding before conversion | 205,685 | 8,979,040 | ||||||
Shares reacquired upon conversion into Class Z | (232 | ) | (10,218 | ) | ||||
|
|
|
| |||||
Net increase (decrease) in shares outstanding | 205,453 | $ | 8,968,822 | |||||
|
|
|
| |||||
Year ended September 30, 2014: | ||||||||
Shares sold | 188,195 | $ | 7,775,012 | |||||
Shares issued in reinvestment of dividends and distributions | 6,625 | 258,525 | ||||||
Shares reacquired | (88,143 | ) | (3,615,900 | ) | ||||
|
|
|
| |||||
Net increase (decrease) in shares outstanding before conversion | 106,677 | 4,417,637 | ||||||
Shares reacquired upon conversion into Class A, Class I and Class Z | (2,466 | ) | (103,367 | ) | ||||
|
|
|
| |||||
Net increase (decrease) in shares outstanding | 104,211 | $ | 4,314,270 | |||||
|
|
|
| |||||
| 44 |
Class I | Shares | Amount | ||||||
Six months ended March 31, 2015: | ||||||||
Shares sold | 1,464,497 | $ | 64,204,507 | |||||
Shares issued in reinvestment of dividends and distributions | 387,419 | 16,968,958 | ||||||
Shares reacquired | (408,060 | ) | (17,988,690 | ) | ||||
|
|
|
| |||||
Net increase (decrease) in shares outstanding before conversion | 1,443,856 | 63,184,775 | ||||||
Shares issued upon conversion from Class A | 6,201 | 283,452 | ||||||
|
|
|
| |||||
Net increase (decrease) in shares outstanding | 1,450,057 | $ | 63,468,227 | |||||
|
|
|
| |||||
Year ended September 30, 2014: | ||||||||
Shares sold | 880,960 | $ | 36,923,342 | |||||
Shares issued in reinvestment of dividends and distributions | 98,424 | 3,853,305 | ||||||
Shares reacquired | (1,126,200 | ) | (46,740,710 | ) | ||||
|
|
|
| |||||
Net increase (decrease) in shares outstanding before conversion | (146,816 | ) | (5,964,063 | ) | ||||
Shares issued upon conversion from Class C | 451 | 20,041 | ||||||
|
|
|
| |||||
Net increase (decrease) in shares outstanding | (146,365 | ) | $ | (5,944,022 | ) | |||
|
|
|
| |||||
Class Z | ||||||||
Six months ended March 31, 2015: | ||||||||
Shares sold | 1,447,507 | $ | 64,285,942 | |||||
Shares issued in reinvestment of dividends and distributions | 650,062 | 28,479,219 | ||||||
Shares reacquired | (1,249,514 | ) | (55,039,186 | ) | ||||
|
|
|
| |||||
Net increase (decrease) in shares outstanding before conversion | 848,055 | 37,725,975 | ||||||
Shares issued upon conversion from Class A and Class C | 1,235 | 55,031 | ||||||
Shares reacquired upon conversion into Class A | (141 | ) | (6,187 | ) | ||||
|
|
|
| |||||
Net increase (decrease) in shares outstanding | 849,149 | $ | 37,774,819 | |||||
|
|
|
| |||||
Year ended September 30, 2014: | ||||||||
Shares sold | 1,976,752 | $ | 82,056,093 | |||||
Shares issued in reinvestment of dividends and distributions | 181,468 | 7,108,110 | ||||||
Shares reacquired | (3,332,087 | ) | (138,342,689 | ) | ||||
|
|
|
| |||||
Net increase (decrease) in shares outstanding before conversion | (1,173,867 | ) | (49,178,486 | ) | ||||
Shares issued upon conversion from Class A and Class C | 5,967 | 235,839 | ||||||
|
|
|
| |||||
Net increase (decrease) in shares outstanding | (1,167,900 | ) | $ | (48,942,647 | ) | |||
|
|
|
| |||||
Note 7. Borrowings
The Fund, along with other affiliated registered investment companies (the “Funds”), is a party to a Syndicated Credit Agreement (“SCA”) with a group of banks. The purpose of the SCA is to provide an alternative source of temporary funding for capital share redemptions. The SCA provides for a commitment of $900 million for the period October 9, 2014 through October 8, 2015. The Funds pay an annualized commitment fee of .075% on the unused portion of the SCA. Prior to October 9, 2014 the Funds had another SCA that provided a commitment fee of $900 million and the
| Prudential Stock Index Fund | 45 |
Notes to Financial Statements
(Unaudited) continued
Funds paid an annualized commitment fee of .08% of the unused portion of the SCA. Interest on any borrowings under the SCA is paid at contracted market rates. The commitment fee for the unused amount is accrued daily and paid quarterly.
The Fund did not utilize the SCA during the six months ended March 31, 2015.
Note 8. New Accounting Pronouncement
In May 2015, the FASB issued Accounting Standards Update (“ASU”) No. 2015-07 regarding “Disclosures for Investments in Certain Entities That Calculate Net Asset Value per Share”. The amendments in this update are effective for the Fund for fiscal years beginning after December 15, 2015, and interim periods within those fiscal years. ASU No. 2015-07 will eliminate the requirement to categorize investments in the fair value hierarchy if their fair value is measured at net asset value (“NAV”) per share (or its equivalent) using the practical expedient in the FASB’s fair value measurement guidance. At this time, management is evaluating the implications of ASU No. 2015-07 and its impact on the financial statement disclosures has not yet been determined.
| 46 |
Financial Highlights
(Unaudited)
| Class A Shares | ||||||||||||||||||||||||||
| Six Months Ended March 31, | Year Ended September 30, | |||||||||||||||||||||||||
| 2015 | 2014 | 2013 | 2012 | 2011 | �� | 2010 | ||||||||||||||||||||
| Per Share Operating Performance(a): | ||||||||||||||||||||||||||
| Net Asset Value, Beginning Of Period | $43.97 | $37.45 | $32.09 | $25.16 | $25.34 | $23.48 | ||||||||||||||||||||
| Income (loss) from investment operations: | ||||||||||||||||||||||||||
| Net investment income | .34 | .61 | .58 | .47 | .40 | .37 | ||||||||||||||||||||
| Net realized and unrealized gain (loss) on investment transactions | 2.16 | 6.47 | 5.30 | 6.90 | (.20 | ) | 1.88 | |||||||||||||||||||
| Total from investment operations | 2.50 | 7.08 | 5.88 | 7.37 | .20 | 2.25 | ||||||||||||||||||||
| Less Dividends and Distributions: | ||||||||||||||||||||||||||
| Dividends from net investment income | (.63 | ) | (.47 | ) | (.52 | ) | (.44 | ) | (.38 | ) | (.39 | ) | ||||||||||||||
| Distributions from net realized gains | (2.15 | ) | (.09 | ) | - | - | - | - | ||||||||||||||||||
| Total dividends and distributions | (2.78 | ) | (.56 | ) | (.52 | ) | (.44 | ) | (.38 | ) | (.39 | ) | ||||||||||||||
| Net asset value, end of period | $43.69 | $43.97 | $37.45 | $32.09 | $25.16 | $25.34 | ||||||||||||||||||||
| Total Return(b): | 5.67% | 19.09% | 18.71% | 29.60% | .74% | 9.63% | ||||||||||||||||||||
| Ratios/Supplemental Data: | ||||||||||||||||||||||||||
| Net assets, end of period (000) | $215,169 | $197,250 | $162,557 | $144,851 | $118,691 | $114,403 | ||||||||||||||||||||
| Average net assets (000) | $204,845 | $184,199 | $153,755 | $135,485 | $131,565 | $104,488 | ||||||||||||||||||||
| Ratios to average net assets(c): | ||||||||||||||||||||||||||
| Expenses after waivers and/or expense reimbursement | .53% | (d) | .53% | .54% | .55% | .55% | .56% | |||||||||||||||||||
| Expenses before waivers and/or expense reimbursement | .60% | (d) | .67% | .76% | .77% | .77% | .78% | |||||||||||||||||||
| Net investment income | 1.53% | (d) | 1.47% | 1.69% | 1.61% | 1.43% | 1.50% | |||||||||||||||||||
| Portfolio turnover rate | 2% | (e) | 4% | 3% | 4% | 5% | 5% | |||||||||||||||||||
(a) Calculated based on average shares outstanding during the period.
(b) Total return does not consider the effects of sales loads. Total return is calculated assuming a purchase of a share on the first day and a sale on the last day of each period reported, and includes reinvestment of dividends and distributions. Total returns may reflect adjustments to conform to generally accepted accounting principles. Total return includes the effect of expense subsidies. Total returns for periods less than one full year are not annualized.
(c) Does not include expenses of the underlying portfolio in which the Fund invests.
(d) Annualized.
(e) Not annualized.
See Notes to Financial Statements.
| Prudential Stock Index Fund | 47 |
Financial Highlights
(Unaudited) continued
| Class C Shares | ||||||||||||||||||||||||||
| Six Months Ended March 31, | Year Ended September 30, | |||||||||||||||||||||||||
| 2015 | 2014 | 2013 | 2012 | 2011 | 2010 | |||||||||||||||||||||
| Per Share Operating Performance(a): | ||||||||||||||||||||||||||
| Net Asset Value, Beginning Of Period | $43.64 | $37.18 | $31.87 | $24.99 | $25.18 | $23.33 | ||||||||||||||||||||
| Income (loss) from investment operations: | ||||||||||||||||||||||||||
| Net investment income | .20 | .35 | .36 | .29 | .23 | .21 | ||||||||||||||||||||
| Net realized and unrealized gain (loss) on investment and transactions | 2.13 | 6.45 | 5.29 | 6.86 | (.19 | ) | 1.87 | |||||||||||||||||||
| Total from investment operations | 2.33 | 6.80 | 5.65 | 7.15 | .04 | 2.08 | ||||||||||||||||||||
| Less Dividends and Distributions: | ||||||||||||||||||||||||||
| Dividends from net investment income | (.36 | ) | (.25 | ) | (.34 | ) | (.27 | ) | (.23 | ) | (.23 | ) | ||||||||||||||
| Distributions from net realized gains | (2.15 | ) | (.09 | ) | - | - | - | - | ||||||||||||||||||
| Total dividends and distributions | (2.51 | ) | (.34 | ) | (.34 | ) | (.27 | ) | (.23 | ) | (.23 | ) | ||||||||||||||
| Net asset value, end of period | $43.46 | $43.64 | $37.18 | $31.87 | $24.99 | $25.18 | ||||||||||||||||||||
| Total Return(b): | 5.33% | 18.38% | 17.96% | 28.78% | .14% | 8.96% | ||||||||||||||||||||
| Ratios/Supplemental Data: | ||||||||||||||||||||||||||
| Net assets, end of period (000) | $47,520 | $38,749 | $29,139 | $23,924 | $20,351 | $22,615 | ||||||||||||||||||||
| Average net assets (000) | $42,906 | $34,419 | $25,730 | $23,103 | $23,884 | $23,196 | ||||||||||||||||||||
| Ratios to average net assets(c): | ||||||||||||||||||||||||||
Expenses after waivers and/or expense reimbursement |
| 1.16% | (d) | 1.16% | 1.16% | 1.17% | 1.17% | 1.19% | ||||||||||||||||||
| Expenses before waivers and/or expense reimbursement | 1.23% | (d) | 1.30% | 1.38% | 1.39% | 1.39% | 1.41% | |||||||||||||||||||
| Net investment income | .91% | (d) | .84% | 1.06% | .99% | .81% | .86% | |||||||||||||||||||
| Portfolio turnover rate | 2% | (e) | 4% | 3% | 4% | 5% | 5% | |||||||||||||||||||
(a) Calculated based on average shares outstanding during the period.
(b) Total return does not consider the effects of sales loads. Total return is calculated assuming a purchase of a share on the first day and a sale on the last day of each period reported, and includes reinvestment of dividends and distributions. Total returns may reflect adjustments to conform to generally accepted accounting principles. Total return includes the effect of expense subsidies. Total returns for periods less than one full year are not annualized.
(c) Does not include expenses of the underlying portfolio in which the Fund invests.
(d) Annualized.
(e) Not annualized.
See Notes to Financial Statements.
| 48 |
| Class I Shares | ||||||||||||||||||||||||||
| Six Months Ended March 31, | Year Ended September 30, | |||||||||||||||||||||||||
| 2015 | 2014 | 2013 | 2012 | 2011 | 2010 | |||||||||||||||||||||
| Per Share Operating Performance(a): | ||||||||||||||||||||||||||
| Net Asset Value, Beginning Of Period | $44.14 | $37.57 | $32.20 | $25.25 | $25.43 | $23.55 | ||||||||||||||||||||
| Income (loss) from investment operations: | ||||||||||||||||||||||||||
| Net investment income | .41 | .75 | .70 | .55 | .50 | .46 | ||||||||||||||||||||
| Net realized and unrealized gain (loss) on investment and transactions | 2.16 | 6.51 | 5.30 | 6.94 | (.21 | ) | 1.89 | |||||||||||||||||||
| Total from investment operations | 2.57 | 7.26 | 6.00 | 7.49 | .29 | 2.35 | ||||||||||||||||||||
| Less Dividends and Distributions: | ||||||||||||||||||||||||||
| Dividends from net investment income | (.76 | ) | (.60 | ) | (.63 | ) | (.54 | ) | (.47 | ) | (.47 | ) | ||||||||||||||
| Distributions from net realized gains | (2.15 | ) | (.09 | ) | - | - | - | - | ||||||||||||||||||
| Total dividends and distributions | (2.91 | ) | (.69 | ) | (.63 | ) | (.54 | ) | (.47 | ) | (.47 | ) | ||||||||||||||
| Net asset value, end of period | $43.80 | $44.14 | $37.57 | $32.20 | $25.25 | $25.43 | ||||||||||||||||||||
| Total Return(b): | 5.83% | 19.54% | 19.09% | 30.06% | 1.08% | 10.08% | ||||||||||||||||||||
| Ratios/Supplemental Data: | ||||||||||||||||||||||||||
| Net assets, end of period (000) | $317,077 | $255,507 | $222,993 | $176,040 | $331,595 | $322,850 | ||||||||||||||||||||
| Average net assets (000) | $268,984 | $241,829 | $193,507 | $214,339 | $376,719 | $321,048 | ||||||||||||||||||||
| Ratios to average net assets(c): | ||||||||||||||||||||||||||
| Expenses after waivers and/or expense reimbursement | .20% | (d) | .19% | .19% | .19% | .19% | .20% | |||||||||||||||||||
| Expenses before waivers and/or expense reimbursement | .27% | (d) | .33% | .41% | .41% | .41% | .42% | |||||||||||||||||||
| Net investment income | 1.86% | (d) | 1.81% | 2.03% | 2.00% | 1.79% | 1.85% | |||||||||||||||||||
| Portfolio turnover rate | 2% | (e) | 4% | 3% | 4% | 5% | 5% | |||||||||||||||||||
(a) Calculated based on average shares outstanding during the period.
(b) Total return is calculated assuming a purchase of a share on the first day and a sale on the last day of each period reported, and includes reinvestment of dividends and distributions. Total returns may reflect adjustments to conform to generally accepted accounting principles. Total return includes the effect of expense subsidies. Total returns for periods less than one full year are not annualized.
(c) Does not include expenses of the underlying portfolio in which the Fund invests.
(d) Annualized.
(e) Not annualized.
See Notes to Financial Statements.
| Prudential Stock Index Fund | 49 |
Financial Highlights
(Unaudited) continued
| Class Z Shares | ||||||||||||||||||||||||||
| Six Months Ended March 31, | Year Ended September 30, | |||||||||||||||||||||||||
| 2015 | 2014 | 2013 | 2012 | 2011 | 2010 | |||||||||||||||||||||
| Per Share Operating Performance(a): | ||||||||||||||||||||||||||
| Net Asset Value, Beginning Of Period | $44.12 | $37.57 | $32.19 | $25.25 | $25.42 | $23.54 | ||||||||||||||||||||
| Income (loss) from investment operations: | ||||||||||||||||||||||||||
| Net investment income | .40 | .73 | .68 | .56 | .48 | .44 | ||||||||||||||||||||
| Net realized and unrealized gain (loss) on investment transactions | 2.17 | 6.49 | 5.31 | 6.90 | (.20 | ) | 1.90 | |||||||||||||||||||
| Total from investment operations | 2.57 | 7.22 | 5.99 | 7.46 | .28 | 2.34 | ||||||||||||||||||||
| Less Dividends and Distributions: | ||||||||||||||||||||||||||
| Dividends from net investment income | (.74 | ) | (.58 | ) | (.61 | ) | (.52 | ) | (.45 | ) | (.46 | ) | ||||||||||||||
| Distributions from net realized gains | (2.15 | ) | (.09 | ) | - | - | - | - | ||||||||||||||||||
| Total dividends and distributions | (2.89 | ) | (.67 | ) | (.61 | ) | (.52 | ) | (.45 | ) | (.46 | ) | ||||||||||||||
| Net asset value, end of period | $43.80 | $44.12 | $37.57 | $32.19 | $25.25 | $25.42 | ||||||||||||||||||||
| Total Return(b): | 5.82% | 19.42% | 19.06% | 29.94% | 1.06% | 10.03% | ||||||||||||||||||||
| Ratios/Supplemental Data: | ||||||||||||||||||||||||||
| Net assets, end of period (000) | $459,072 | $425,001 | $405,721 | $382,510 | $336,727 | $352,470 | ||||||||||||||||||||
| Average net assets (000) | $449,344 | $424,209 | $390,330 | $373,819 | $381,784 | $383,488 | ||||||||||||||||||||
| Ratios to average net assets(c): | ||||||||||||||||||||||||||
| Expenses after waivers and/or expense reimbursement | .26% | (d) | .25% | .25% | .25% | .25% | .26% | |||||||||||||||||||
| Expenses before waivers and/or expense reimbursement | .33% | (d) | .39% | .47% | .47% | .47% | .48% | |||||||||||||||||||
| Net investment income | 1.80% | (d) | 1.75% | 1.98% | 1.91% | 1.73% | 1.79% | |||||||||||||||||||
| Portfolio turnover rate | 2% | (e) | 4% | 3% | 4% | 5% | 5% | |||||||||||||||||||
(a) Calculated based on average shares outstanding during the period.
(b) Total return is calculated assuming a purchase of a share on the first day and a sale on the last day of each period reported, and includes reinvestment of dividends and distributions. Total returns may reflect adjustments to conform to generally accepted accounting principles. Total return includes the effect of expense subsidies. Total returns for periods less than one full year are not annualized.
(c) Does not include expenses of the underlying portfolio in which the Fund invests.
(d) Annualized.
(e) Not annualized.
See Notes to Financial Statements.
| 50 |
Results of Proxy Voting
(Unaudited)
At the special meeting of shareholders held on November 26, 2014, shareholders of the Prudential Investment Portfolios 8 which is comprised of the Prudential Stock Index Fund (the Fund), approved the following proposal.
To elect twelve Directors:
| SHARES VOTED | % OF VOTED | % OF TOTAL | ||||||||||
(a) Ellen S. Alberding; | ||||||||||||
FOR | 7,417,823.501 | 94.964 | 35.711 | |||||||||
WITHHELD | 393,448.229 | 5.036 | 1.894 | |||||||||
(b) Kevin J. Bannon; | ||||||||||||
FOR | 7,414,858.361 | 94.926 | 35.697 | |||||||||
WITHHELD | 396,413.369 | 5.074 | 1.908 | |||||||||
(c) Linda W. Bynoe; | ||||||||||||
FOR | 7,415,646.370 | 94.936 | 35.701 | |||||||||
WITHHELD | 395,625.360 | 5.064 | 1.904 | |||||||||
(d) Keith F. Hartstein; | ||||||||||||
FOR | 7,416,178.765 | 94.943 | 35.703 | |||||||||
WITHHELD | 395,092.965 | 5.057 | 1.904 | |||||||||
(e) Michael S. Hyland; | ||||||||||||
FOR | 7,414,373.569 | 94.919 | 35.695 | |||||||||
WITHHELD | 396,898.161 | 5.081 | 1.910 | |||||||||
(f) Stephen P. Munn; | ||||||||||||
FOR | 7,404,786.610 | 94.797 | 35.649 | |||||||||
WITHHELD | 406,485.120 | 5.203 | 1.956 | |||||||||
(g) James E. Quinn; | ||||||||||||
FOR | 7,416,800.629 | 94.950 | 35.706 | |||||||||
WITHHELD | 394,471.101 | 5.050 | 1.899 | |||||||||
(h) Richard A. Redeker; | ||||||||||||
FOR | 7,403,841.623 | 94.785 | 35.644 | |||||||||
WITHHELD | 407,430.107 | 5.215 | 1.961 | |||||||||
(i) Stephen G. Stoneburn; | ||||||||||||
FOR | 7,405,831.382 | 94.810 | 35.644 | |||||||||
WITHHELD | 405,440.348 | 5.190 | 1.951 | |||||||||
(j) Stuart S. Parker; | ||||||||||||
FOR | 7,416,209.875 | 94.943 | 35.704 | |||||||||
WITHHELD | 395,061.855 | 5.057 | 1.901 | |||||||||
(k) Scott E. Benjamin; and | ||||||||||||
FOR | 7,415,976.459 | 94.940 | 35.702 | |||||||||
WITHHELD | 395,295.271 | 5.060 | 1.903 | |||||||||
(l) Grace C. Torres. | ||||||||||||
FOR | 7,421,095.327 | 95.005 | 35.727 | |||||||||
WITHHELD | 390,176.403 | 4.995 | 1.878 | |||||||||
| Prudential Stock Index Fund | 51 |
Results of Proxy Voting
(Unaudited) continued
The special meeting of shareholders of the Fund held on November 26, 2014, was adjourned to December 3, 2014, and further adjourned to December 10, 2014, January 9, 2015, and February 9, 2015 to permit further solicitation of proxies on the proposals noted below.
An abstention or a broker non-vote is considered present for purposes of determining a quorum but has the effect of a vote against such matters. At the special meeting of shareholders held on February 9, 2015, insufficient votes were obtained to approve the following proposals:
Proposal 1: To permit PI to enter into or make material changes to the Fund’s subadvisory agreements with subadvisers that are wholly-owned subsidiaries of PI or a sister company of PI (wholly-owned subadvisers) without shareholder approval.
| SHARES VOTED | % OF VOTED | % OF TOTAL | ||||||||||
FOR | 3,717,516.550 | 47.233 | 17.897 | |||||||||
AGAINST | 342,613.650 | 4.353 | 1.650 | |||||||||
ABSTAIN | 255,104.998 | 3.241 | 1.228 | |||||||||
BROKER NON-VOTE | 3,555,488.604 | 45.173 | 17.117 | |||||||||
TOTAL | 7,870,723.802 | 100.000 | % | 37.892 | ||||||||
Proposal 2: To designate the Fund’s investment objective as a non-fundamental policy of the Fund, meaning that the Fund’s investment objective could be changed with the approval of the Fund’s Board of Directors, but without shareholder approval.
| SHARES VOTED | % OF VOTED | % OF TOTAL | ||||||||||
FOR | 3,559,344.718 | 45.223 | 17.136 | |||||||||
AGAINST | 474,427.757 | 6.028 | 2.284 | |||||||||
ABSTAIN | 281,462.723 | 3.576 | 1.355 | |||||||||
BROKER NON-VOTE | 3,555,488.604 | 45.173 | 17.117 | |||||||||
TOTAL | 7,870,723.802 | 100.000 | % | 37.892 | ||||||||
| 52 |
| n MAIL | n TELEPHONE | n WEBSITE | ||
Gateway Center Three 100 Mulberry Street Newark, NJ 07102 | (800) 225-1852 | www.prudentialfunds.com |
| PROXY VOTING |
| The Board of Trustees of the Fund has delegated to the Fund’s investment subadviser the responsibility for voting any proxies and maintaining proxy recordkeeping with respect to the Fund. A description of these proxy voting policies and procedures is available without charge, upon request, by calling (800) 225-1852 or by visiting the Securities and Exchange Commission’s website at www.sec.gov. Information regarding how the Fund voted proxies relating to portfolio securities during the most recent 12-month period ended June 30 is available on the Fund’s website and on the Securities and Exchange Commission’s website. |
| TRUSTEES |
| Ellen S. Alberding • Kevin J. Bannon • Scott E. Benjamin • Linda W. Bynoe • Keith F. Hartstein • Michael S. Hyland • Stephen P. Munn • Stuart S. Parker • James E. Quinn • Richard A. Redeker • Stephen G. Stoneburn • Grace C. Torres |
| OFFICERS |
| Stuart S. Parker, President • Scott E. Benjamin, Vice President • M. Sadiq Peshimam, Treasurer and Principal Financial and Accounting Officer • Raymond A. O’Hara, Chief Legal Officer • Deborah A. Docs, Secretary • Chad A. Earnst, Chief Compliance Officer • Theresa C. Thompson, Deputy Chief Compliance Officer • Richard W. Kinville, Anti-Money Laundering Compliance Officer • Jonathan D. Shain, Assistant Secretary • Claudia DiGiacomo, Assistant Secretary • Amanda S. Ryan, Assistant Secretary • Andrew R. French, Assistant Secretary • Peter Parrella, Assistant Treasurer • Lana Lomuti, Assistant Treasurer • Linda McMullin, Assistant Treasurer • Kelly A. Coyne, Assistant Treasurer |
| MANAGER | Prudential Investments LLC | Gateway Center Three 100 Mulberry Street | ||
| ||||
| INVESTMENT SUBADVISER | Quantitative Management Associates LLC | Gateway Center Two 100 Mulberry Street | ||
| ||||
| DISTRIBUTOR | Prudential Investment Management Services LLC | Gateway Center Three 100 Mulberry Street | ||
| ||||
| CUSTODIAN | The Bank of New York Mellon | One Wall Street New York, NY 10286 | ||
| ||||
| TRANSFER AGENT | Prudential Mutual Fund Services LLC | PO Box 9658 Providence, RI 02940 | ||
| ||||
| INDEPENDENT REGISTERED PUBLIC ACCOUNTING FIRM | KPMG LLP | 345 Park Avenue New York, NY 10154 | ||
| ||||
| FUND COUNSEL | Willkie Farr & Gallagher LLP | 787 Seventh Avenue New York, NY 10019 | ||
| An investor should consider the investment objectives, risks, charges, and expenses of the Fund carefully before investing. The prospectus and summary prospectus contain this and other information about the Fund. An investor may obtain a prospectus and summary prospectus by visiting our website at www.prudentialfunds.com or by calling (800) 225-1852. The prospectus and summary prospectus should be read carefully before investing. |
| E-DELIVERY |
| To receive your mutual fund documents online, go to www.prudentialfunds.com/edelivery and enroll. Instead of receiving printed documents by mail, you will receive notification via email when new materials are available. You can cancel your enrollment or change your email address at any time by visiting the website address above. |
| SHAREHOLDER COMMUNICATIONS WITH TRUSTEES |
| Shareholders can communicate directly with the Board of Trustees by writing to the Chair of the Board, Prudential Stock Index Fund, Prudential Investments, Attn: Board of Trustees, 100 Mulberry Street, Gateway Center Three, Newark, NJ 07102. Shareholders can communicate directly with an individual Trustee by writing to the same address. Communications are not screened before being delivered to the addressee. |
| AVAILABILITY OF PORTFOLIO SCHEDULE |
| The Fund files its complete schedule of portfolio holdings with the Securities and Exchange Commission for the first and third quarters of each fiscal year on Form N-Q. The Fund’s Forms N-Q are available on the Commission’s website at www.sec.gov. The Fund’s Forms N-Q may also be reviewed and copied at the Commission’s Public Reference Room in Washington, D.C. Information on the operation and location of the Public Reference Room may be obtained by calling 1-800-SEC-0330. The Fund’s schedule of portfolio holdings is also available on the Fund’s website as of the end of each month. |
Mutual Funds:
| ARE NOT INSURED BY THE FDIC OR ANY FEDERAL GOVERNMENT AGENCY | MAY LOSE VALUE | ARE NOT A DEPOSIT OF OR GUARANTEED BY ANY BANK OR ANY BANK AFFILIATE |
PRUDENTIAL STOCK INDEX FUND
| SHARE CLASS | A | C | I | Z | ||||||
| NASDAQ | PSIAX | PSICX | PDSIX | PSIFX | ||||||
| CUSIP | 74441F108 | 74441F306 | 74441F405 | 74441F504 |
MF174E2 0277419-00001-00
Item 2 | – Code of Ethics – Not required, as this is not an annual filing. | |
Item 3 | – Audit Committee Financial Expert – Not required, as this is not an annual filing. | |
Item 4 | – Principal Accountant Fees and Services – Not required, as this is not an annual filing. | |
Item 5 | – Audit Committee of Listed Registrants – Not applicable. | |
Item 6 | – Schedule of Investments – The schedule is included as part of the report to shareholders filed under Item 1 of this Form. | |
Item 7 | – Disclosure of Proxy Voting Policies and Procedures for Closed-End Management Investment Companies – Not applicable. | |
Item 8 | – Portfolio Managers of Closed-End Management Investment Companies – Not applicable. | |
Item 9 | – Purchases of Equity Securities by Closed-End Management Investment Company and Affiliated Purchasers – Not applicable. | |
Item 10 | – Submission of Matters to a Vote of Security Holders – Not applicable. | |
Item 11 | – Controls and Procedures | |
(a) It is the conclusion of the registrant’s principal executive officer and principal financial officer that the effectiveness of the registrant’s current disclosure controls and procedures (such disclosure controls and procedures having been evaluated within 90 days of the date of this filing) provide reasonable assurance that the information required to be disclosed by the registrant has been recorded, processed, summarized and reported within the time period specified in the Commission’s rules and forms and that the information required to be disclosed by the registrant has been accumulated and communicated to the registrant’s principal executive officer and principal financial officer in order to allow timely decisions regarding required disclosure. | ||
(b) There has been no significant change in the registrant’s internal control over financial reporting that occurred during the registrant’s most recent fiscal quarter of the period covered by this report that has materially affected, or is likely to materially affect, the registrant’s internal control over financial reporting. | ||
Item 12 | – Exhibits | |
(a) (1) Code of Ethics – Not required, as this is not an annual filing. | ||
(2) Certifications pursuant to Section 302 of the Sarbanes-Oxley Act – Attached hereto as Exhibit EX-99.CERT. | ||
(3) Any written solicitation to purchase securities under Rule 23c-1. – Not applicable. | ||
(b) Certifications pursuant to Section 906 of the Sarbanes-Oxley Act – Attached hereto as Exhibit EX-99.906CERT. | ||
SIGNATURES
Pursuant to the requirements of the Securities Exchange Act of 1934 and the Investment Company Act of 1940, the registrant has duly caused this report to be signed on its behalf by the undersigned, thereunto duly authorized.
| Registrant: | Prudential Investment Portfolios 8 | |||
| By: | /s/ Deborah A. Docs | |||
| Deborah A. Docs | ||||
| Secretary | ||||
| Date: | May 19, 2015 | |||
Pursuant to the requirements of the Securities Exchange Act of 1934 and the Investment Company Act of 1940, this report has been signed below by the following persons on behalf of the registrant and in the capacities and on the dates indicated.
| By: | /s/ Stuart S. Parker | |||
| Stuart S. Parker | ||||
| President and Principal Executive Officer | ||||
| Date: | May 19, 2015 | |||
| By: | /s/ M. Sadiq Peshimam | |||
| M. Sadiq Peshimam | ||||
| Treasurer and Principal Financial and Accounting Officer | ||||
| Date: | May 19, 2015 | |||