Exhibit 99.1
| • | Total revenues down 2% to Euro 66 billion |
| • | Life & Savings New Business Value up 11% driven by a continued improvement in business mix |
| • | Property & Casualty revenues up 3% driven by underwriting discipline |
| • | Asset management revenues up 4% |
| • | Robust balance sheet, with solvency I ratio estimated above 190% and economic capital ratio estimated above 150% |
“Our top line trends for the first nine months are generally in line with those observed in the half year, with continued selectivity across all business lines. Going forward, we will continue to deliver on our strategic priorities and benefit from the strength of our balance sheet which allows us to navigate through the current market conditions”, commented Denis Duverne, Deputy CEO of AXA.
“In Life & Savings, our activities showed a significant improvement in mix towards profitable businesses, with a 13% growth in Protection & Health and a greater share of Unit-Linked in new Savings contracts. This resulted in improved new business profitability.
In Property & Casualty, we experienced revenue growth of 3%, benefiting from strong performance in high growth markets and Direct, combined with selective underwriting and rate increases across the board.
In Asset management, revenues increased 4%, driven by higher performance fees and real estate transaction fees at AXA IM as well as higher research fees at AllianceBernstein.”
| Investor Relations | Gérald Harlin, Group CFO, will hold a conference call to discuss 9M 2011 Activity Indicators. Time: October 27th 2011 – 9.00 CET Call number France: +33 (0)1 70 77 09 44 UK: +44 (0)20 33 67 9455 US: +1 866 907 5924 Replay available from 12.00 CET Call number: +33(0)1 72 00 15 00 Access code: 274563# | Contents: Key Highlights Life & Savings Property & Casualty Asset Management International Insurance Notes & Other information Appendices | ||||||
| +33 1 40 75 46 85 | 2 | |||||||
Media Relations | 4 | |||||||
| +33 1 40 75 46 74 | 7 | |||||||
Individual Shareholder Relations | 9 | |||||||
| +33 1 40 75 48 43 | 9 | |||||||
| 10 | ||||||||
| 11 | ||||||||


All comments are on a comparable basis (constant Forex, scope and methodology for activity indicators). 9M10 APE and NBV of the sold UK operations are excluded from reported figures. 9M11 APE and NBV of Australia & New Zealand, Hong Kong, South-East Asia, India & China are restated for AXA APH transaction in reported figures. Canadian operations are treated as discontinued operations and therefore excluded from the overall Group revenues for 9M10 and 9M11.
Activity indicators: Key figures
| Change | ||||||||||||||||||||||||
In Euro million, except when otherwise noted | 9M10 | 9M11 | Change on a reported basis | Comp.(a) basis | Scope & Other | FX impact(b) | ||||||||||||||||||
Life & Savingsrevenues | 43,868 | 39,790 | -9.3 | % | -5.0 | % | -5.3 | % | +1.0 | % | ||||||||||||||
Net inflows (Euro billion) | 7.8 | 4.5 | ||||||||||||||||||||||
APE1(Group share) | 4,317 | 4,255 | -1.4 | % | -1.2 | % | -0.1 | % | -0.2 | % | ||||||||||||||
NBV2(Group share) | 931 | 1,147 | +23.1 | % | +10.6 | % | +10.1 | % | +2.5 | % | ||||||||||||||
NBV to APE margin (Group share) | 21.6 | % | 27.0 | % | +5.4 | pts | +2.8 | pts | ||||||||||||||||
|
|
|
|
|
|
|
|
|
|
|
| |||||||||||||
Property & Casualty revenues | 20,294 | 21,087 | +3.9 | % | +3.1 | % | +0.2 | % | +0.7 | % | ||||||||||||||
|
|
|
|
|
|
|
|
|
|
|
| |||||||||||||
International Insurance revenues | 2,296 | 2,288 | -0.3 | % | +2.0 | % | +0.1 | % | -1.7 | % | ||||||||||||||
|
|
|
|
|
|
|
|
|
|
|
| |||||||||||||
Asset Management revenues | 2,463 | 2,443 | -0.8 | % | +3.5 | % | +0.1 | % | -4.4 | % | ||||||||||||||
Net inflows (Euro billion) | -41 | -33 | ||||||||||||||||||||||
|
|
|
|
|
|
|
|
|
|
|
| |||||||||||||
Total revenues(c) | 69,266 | 65,945 | -4.8 | % | -2.0 | % | -3.4 | % | +0.6 | % | ||||||||||||||
| (a) | Change on a comparable basis was calculated at constant FX and scope |
| (b) | Mainly due to the depreciation of the Euro against major currencies |
| (c) | Including banking revenues down 4% to Euro 335 million in 9M11 (vs. Euro 344 million in 9M10). |
Numbers herein have not been audited. APE and NBV are both in line with the Group’s EEV disclosure. They are non-GAAP measures, which Management uses as key indicators of performance in assessing AXA’s Life & Savings business and believes to provide useful and important information to shareholders and investors.
Revenues
| • | Total Revenues were down 2% to Euro 65,945 million. |
| • | Life & Savings revenues were down 5% to Euro 39,790 million. |
New Business Volume (APE1) was down 1% to Euro 4,255 million mainly driven by a strong performance in General Account (“G/A”) Protection & Health business up 13%, more than offset by a 22% decrease in G/A Savings business. Unit-Linked APE was down 4%.
New Business Value (NBV2) was up 11% to Euro 1,147 million, mainly driven by an improved business mix towards G/A Protection & Health and towards Unit-Linked within the Savings business.
As a result, and combined with a favourable country mix effect, new business margin was up 3 pts to 27%, with high margin levels in both G/A Protection & Health business at 49% and Unit-Linked business at 25%. Nevertheless, if current financial market conditions were to persist, they are expected to affect new business margin as measured at year end.
Net inflows amounted to Euro +4.5 billion vs. Euro +7.8 billion in 9M10. By business, we experienced strong net inflows in G/A Protection & Health (Euro +4.1 billion) and Unit-Linked (Euro +2.0 billion), party offset by net outflows in G/A Savings (Euro -1.7 billion).
| • | Property & Casualty revenues were up 3% to Euro 21,087 million. Personal lines revenues grew 4% largely driven by a 4.6% average price increase. Commercial lines revenues grew 2% mainly driven by a 2.4% average price increase, whilst favorable change in business mix was offset by lower volumes in a context of selective underwriting. |
On average, prices increased by 3.7%.
| • | Asset Managementrevenues were up 4% to Euro 2,443 million, mainly driven by higher performance fees and real estate transaction fees at AXA IM as well as higher research fees at AllianceBernstein. Average assets under management decreased slightly, down 1% to Euro 837 billion. AXA IM experienced net inflows of Euro +2 billion, whilst AllianceBernstein net outflows amounted to Euro -35 billion, mainly from institutional clients. |
Page 2/19

Balance sheet update
AXA’s balance sheet remained robust at September 30, 2011 despite current financial market conditions:
| • | Regulatory solvency I ratiowas estimated above 190% (vs. 186% at June 30, 2011), close to historically highest level. |
| • | Economic capital ratio5was estimated above 150% (vs. 184% at June 30, 2011). The decrease was primarily driven by credit spread widening and the decrease in both interest rates and equity markets. |
| • | Unrealized gains on fixed income assetsamounted to approximately Euro 3.6 billion (vs. Euro 2.6 billion at June 30, 2011), of which Euro 4.6 billion on fixed income assets excluding government bonds of Eurozone peripheral countries. |
Changes in scope
Partial sale of UK Life operations and sale of Canadian operations
Following the partial sale of the UK Life operations, published 9M10 APE and NBV were restated to exclude volumes and margins related to the sold portion of the business.
Following the sale of the Canadian operations, these operations are treated as discontinued operations in AXA’s consolidated financial statements. As a consequence, their revenues are restated from the overall Group revenues aggregate.
In Euro million, except when otherwise noted | 9M10 published | UK | Canada | 9M10 restated | ||||||||||||
APE1 (Group share) | 4,632 | -316 | 4,317 | |||||||||||||
NBV2 (Group share) | 984 | -53 | 931 | |||||||||||||
NBV margin (%) | 21.2 | % | 21.6 | % | ||||||||||||
|
|
|
|
|
|
|
| |||||||||
Property & Casualty revenues | 21,389 | -1,095 | 20,294 | |||||||||||||
|
|
|
|
|
|
|
| |||||||||
AXA APH transaction
9M11 APE and NBV of Australia and New Zealand, Hong Kong, South-East Asia, India & China were restated for AXA APH transaction in reported figures.
Page 3/19

Life & Savings
New Business Volume (APE1) and margins by business
Improvement in business mix towards G/A Protection & Health and Unit-Linked businesses…
| Life & Savings: analysis by business | ||||||||||||||||
| NBV margin | APE | |||||||||||||||
In Euro million | 9M11 | 9M10 | 9M11 | Change on a comparable basis | ||||||||||||
G/A Protection & Health | 49 | % | 1,332 | 1,632 | +13 | % | ||||||||||
G/A Savings | -3 | % | 1,090 | 837 | -22 | % | ||||||||||
Unit-Linked | 25 | % | 1,323 | 1,338 | -4 | % | ||||||||||
o/w Continental Europe3 | 27 | % | 325 | 316 | -4 | % | ||||||||||
Mutual funds & Other | 6 | % | 572 | 448 | +14 | % | ||||||||||
|
|
|
|
|
|
|
| |||||||||
Total | 27 | % | 4,317 | 4,255 | -1 | % | ||||||||||
|
|
|
|
|
|
|
| |||||||||
| • | G/A Protection & Health new business APE(38% of total) was up 13% to Euro 1,632 million, mainly driven by Switzerland (strong sales in Group Life), the US (launch of the new “Indexed Universal Life” product), Germany (favourable change in regulation facilitating access to private Health insurance) and France (mainly Group Protection and success of the “Family Protection” product). |
| • | G/A Savings new business APE(20% of total) was down 22% to Euro 837 million, mainly driven by Italy (mostly non repeat of 2010 fiscal amnesty and stronger focus on Unit-Linked products), France (uncertainties on Life insurance tax regulation and increased competition from short term banking accounts) and Belgium (more conservative offer in a low profitability environment). |
| • | Unit-Linked new business APE(31% of total) was down 4% to Euro 1,338 million, mainly driven by (i) the UK (down 14% due to lower volumes in pension products following change in minimum pension age adopted last year) and (ii) Continental Europe (down 4%) with Germany down 33% mainly as a result of Variable Annuity product repricing, non-repeat of 1H10 marketing campaign on Unit-Linked Savings products and difficult financial markets conditions, partly offset by France up 15% notably driven by the “Bonus Euro+” initiative. These negative impacts were partly compensated by South-East Asia, India & China up 15% mainly driven by strong sales through Bank Mandiri branches in Indonesia. |
| • | Mutual funds & Other new business APE(11% of total) was up 14% to Euro 448 million as strong performance of the wrap platform Elevate in the UK was partly offset by lower pension fund sales in CEE. |
As a result, new business value (NBV2) was up 11% to Euro 1,147 million, mainly driven by an improved business mix towards G/A Protection & Health and Unit-Linked businesses, as well as a favourable country mix effect.
In mature markets, NBV was up 13% to Euro 849 million. In high growth markets, NBV was up 6% to Euro 298 million (26% of total NBV) mainly in South-East Asia, India & China (up 19%), as a result of continued high profitability levels combined with strong growth in volumes, partly offset by CEE (down 28%) where the closing of pension fund new business in Poland and Hungary following a change in regulation affected sales.
…leading to an increase in New Business Margin
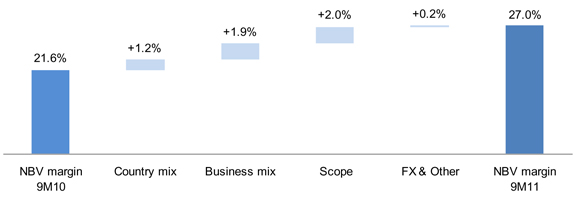
NBV margin was up 3 pts to 27%, comprised of 24% NBV margin in mature markets and 43% NBV margin in high growth markets.
Page 4/19
Actuarial and financial assumptions are not updated on a quarterly basis, except for interest rates which are hedged at point of sale for Variable Annuity products. These assumptions will be updated at year-end 2011 and will notably take into account, if current market conditions were to persist, the decline in interest rates and equity markets, as well as the increase in volatility.
New Business Volume (APE1) and margins by country
| • | New Business Volume (APE1)was down 1% to Euro 4,255 million, as strong sales in Switzerland (+28%), Germany (+5%), the US (+8%), Hong Kong (+27%) and South-East Asia, India & China (+15%) were more than offset by decreases in Italy (-37%), Belgium (-28%), CEE (-19%) and Japan (-9%). |
Annual Premium Equivalent by country/region |
| |||||||||||||||
In Euro million | 9M10 | 9M11 | Change on a reported basis | Change on a comparable basis | ||||||||||||
France | 996 | 956 | -4 | % | -4 | % | ||||||||||
|
|
|
|
|
|
|
| |||||||||
United States | 741 | 749 | +1 | % | +8 | % | ||||||||||
|
|
|
|
|
|
|
| |||||||||
United Kingdom | 421 | 418 | -1 | % | +1 | % | ||||||||||
|
|
|
|
|
|
|
| |||||||||
NORCEE(a) | 938 | 1,010 | +8 | % | -0 | % | ||||||||||
|
|
|
|
|
|
|
| |||||||||
of which Germany | 358 | 377 | +5 | % | +5 | % | ||||||||||
of which Switzerland | 233 | 338 | +45 | % | +28 | % | ||||||||||
of which Belgium | 176 | 128 | -28 | % | -28 | % | ||||||||||
of which Central & Eastern Europe | 171 | 168 | -2 | % | -19 | % | ||||||||||
|
|
|
|
|
|
|
| |||||||||
Asia Pacific | 789 | 820 | +4 | % | +8 | % | ||||||||||
|
|
|
|
|
|
|
| |||||||||
of which Japan | 335 | 337 | +1 | % | -9 | % | ||||||||||
of which Australia/ New Zealand | 223 | 0 | n.a. | n.a. | ||||||||||||
of which Hong Kong | 111 | 243 | +119 | % | +27 | % | ||||||||||
of which South-East Asia, India & China | 120 | 240 | +100 | % | +15 | % | ||||||||||
|
|
|
|
|
|
|
| |||||||||
MedLA(b) | 431 | 302 | -30 | % | -30 | % | ||||||||||
|
|
|
|
|
|
|
| |||||||||
of which Spain | 58 | 55 | -6 | % | -6 | % | ||||||||||
of which Italy | 294 | 184 | -37 | % | -37 | % | ||||||||||
of which other | 79 | 63 | -21 | % | -20 | % | ||||||||||
|
|
|
|
|
|
|
| |||||||||
Total Life & Savings APE1 | 4,317 | 4,255 | -1 | % | -1 | % | ||||||||||
|
|
|
|
|
|
|
| |||||||||
of which mature markets | 3,862 | 3,566 | -8 | % | -2 | % | ||||||||||
of which high growth markets4 | 455 | 689 | +51 | % | +5 | % | ||||||||||
|
|
|
|
|
|
|
| |||||||||
| (a) | Northern Central and Eastern Europe: Germany, Belgium, Switzerland and Central and Eastern Europe. Luxemburg’s APE and NBV are not modelled. |
| (b) | Mediterranean and Latin American Region: Italy, Spain, Portugal, Turkey, Mexico, Morocco and Greece. |
The United States
New business APE increased by 8% to Euro 749 million, primarily driven by increases in both G/A Protection & Health with the launch of the new “Indexed Universal Life” product and in Unit-Linked Savings with Variable Annuities, as strong sales of “Retirement Cornerstone” and the roll-out of the new “Structured Capital Strategies” product to all distribution channels since 4Q 10 were partly offset by lower sales of “Accumulator”.
NBV margin was up 2 points to 15%, mainly driven by lower unit costs reflecting higher volumes as well as improved business mix, notably driven by the launch of the new “Indexed Universal Life” product.
France
New business APE was down 4% to Euro 956 million, mostly driven by:
(i) G/A Savings sales down 15%, mainly in Individual lines following fewer large contracts on traditional business, negative impact from uncertainties around the Life insurance tax regulation and increased competition from short term banking accounts with higher offered rates, partly offset by:
(ii) Unit-Linked sales up 15%, benefiting from the “Bonus Euro+” initiative despite market slowdown in August and September. Unit-Linked share in Individual Savings premiums was 19% in 9M11 (above market average which was 15%) and by
(iii) G/A Protection & Health sales up 5%, mainly driven by an increase in Group Protection sales and the success of the “Family Protection” product.
NBV margin was up 2 points to 13%, mostly driven by improved business mix as a result of higher proportion of Protection products as well as higher share of Unit-Linked sales.
Page 5/19
The United Kingdom
New business APE was up 1% to Euro 418 million, mainly driven by strong Mutual Funds sales through the Elevate wrap platform. This was mostly offset by lower sales of Individual pension products (change in minimum pension age adopted last year), as well as lower corporate pension sales due to fewer large schemes underwritten in 2011.
NBV margin was stable at 5%.
Northern Central & Eastern Europe
| • | Germany new business APE was up 5% to Euro 377 million, mainly driven by strong sales in G/A Protection & Health supported by a favourable change in regulation in Health facilitating access to private Health insurance. This was partly offset by a decrease in Unit-Linked sales mainly as a result of Twinstar Variable Annuity product repricing, non repeat of 1H10 marketing campaign on Unit-Linked Savings products and difficult financial markets conditions. |
NBV margin was up 2 points to 23%, mainly driven by the repricing of Twinstar Variable Annuity product in 3Q10.
| • | Switzerland new business APE was up 28% to Euro 338 million, mainly due to strong sales in Group Life. |
NBV margin was down 1 point to 45%.
| • | Belgium new business APE was down 28% to Euro 128 million, mostly due to a decrease in G/A Savings sales reflecting a more conservative offer in a low profitability market environment. |
NBV marginwas down 1 point to 8%, mainly due to increase in unit costs reflecting lower volumes, partly offset by a slight improvement in business mix.
| • | Central & Eastern Europe new business APEwas down 19% to Euro 168 million. The closing of new business in Pension Funds following the new regulations in Hungary and Poland was partly compensated by the success of the strategic focus on Individual Unit-Linked business (up 41%). |
NBV marginwas down 2 pts to 18%, mainly due to higher unit costs reflecting lower volumes, partly offset by improved business mix towards Individual Unit-Linked.
Asia Pacific
| • | Japan new business APEwas down 9% to Euro 337 million, mainly driven by the non-repeat of strong Variable Annuity product sales in 1H10 anticipating the end of tax advantage, and by a decrease in Health sales. |
NBV marginwas up 11 points to 82%, mainly driven by improved business mix (notably due to focus on higher margin products in G/A Protection & Health), partly offset by higher unit costs.
| • | Hong Kong new business APEwas up 27% to Euro 243 million, driven by strong performance in G/A Protection & Health, Unit-Linked and Mutual Funds businesses. |
NBV margin was down 12 points to 60%, mainly driven by the launch of new products in a more competitive market combined with increased expenses to support growth momentum.
| • | South-East Asia, India & China new business APEwas up 15% to Euro 240 million, mostly reflecting strong sales of Unit-Linked products, in particular in Indonesia through Bank Mandiri branches. |
NBV margin was up 2 points to 48%, mostly reflecting favorable country mix with increasing contribution from Indonesia (NBV margin of 62%).
Mediterranean and Latin America Region (MedLA)
| • | New business APEwas down 30% to Euro 302 million, mainly impacted by lower G/A Savings sales in Italy with the non repeat of 2010 fiscal amnesty, partly offset by a stronger focus on Unit-Linked sales (+22%) mainly in Italy, through AXA MPS Joint-Venture. |
| • | NBV marginwas up 7 points to 22%, mainly reflecting significant improvement in business mix, more than offsetting higher unit costs. |
Page 6/19

Property & Casualty
Change in presentation
In order to improve visibility on P&C Direct activities, Direct P&C is now reported as a separate business unit and no longer as part of countries or regions. 9M10 figures in the table below already reflect this change. Please refer to Appendix 8 for more details.
Property & Casualty revenueswere up 3% to Euro 21,087 million. Personal lines revenues grew 4% largely driven by a 4.6% average price increase. Commercial lines revenues grew 2%, mainly driven by a 2.4% average price increase, whilst favorable change in business mix was offset by lower volumes in a context of selective underwriting.
Overall, prices increased by 3.7% on average.
Property & Casualty revenues strongly increased both in high growth markets (+14%), mainly in Turkey and Mexico, and in Direct (+10%).
Net new personal contracts in high growth markets and Direct amounted to +664k and +204k respectively, representing 77% of total net new personal contracts which amounted to +1,124k.
Property & Casualty : IFRS revenues by country |
| |||||||||||||||
In Euro million | 9M10 | 9M11 | Change on a reported basis | Change on a comparable basis | ||||||||||||
NORCEE(a) | 6,762 | 7,208 | +7 | % | +2 | % | ||||||||||
of which Germany | 2,869 | 2,967 | +3 | % | +3 | % | ||||||||||
of which Belgium | 1,565 | 1,602 | +2 | % | +2 | % | ||||||||||
of which Switzerland | 2,201 | 2,513 | +14 | % | +1 | % | ||||||||||
|
|
|
|
|
|
|
| |||||||||
MedLA(b) | 4,709 | 4,798 | +2 | % | +4 | % | ||||||||||
of which Spain | 1,605 | 1,523 | -5 | % | -5 | % | ||||||||||
of which Italy | 1,014 | 1,019 | +1 | % | +1 | % | ||||||||||
of which other | 2,090 | 2,257 | +8 | % | +14 | % | ||||||||||
|
|
|
|
|
|
|
| |||||||||
France | 4,280 | 4,334 | +1 | % | +1 | % | ||||||||||
|
|
|
|
|
|
|
| |||||||||
United Kingdom & Ireland | 2,791 | 2,821 | +1 | % | +2 | % | ||||||||||
|
|
|
|
|
|
|
| |||||||||
Asia | 290 | 322 | +11 | % | 0 | % | ||||||||||
|
|
|
|
|
|
|
| |||||||||
Direct4 | 1,462 | 1,605 | +10 | % | +10 | % | ||||||||||
|
|
|
|
|
|
|
| |||||||||
Total P&C revenues | 20,294 | 21,087 | +4 | % | +3 | % | ||||||||||
|
|
|
|
|
|
|
| |||||||||
of which Direct4 | 1,462 | 1,605 | +10 | % | +10 | % | ||||||||||
of which mature markets | 16,736 | 17,186 | +3 | % | +1 | % | ||||||||||
of which high growth markets4 | 2,096 | 2,296 | +10 | % | +14 | % | ||||||||||
|
|
|
|
|
|
|
| |||||||||
| (a) | Northern Central and Eastern Europe: Germany, Belgium, Switzerland, Central an Eastern Europe and Luxembourg |
| (b) | Mediterranean and Latin American Region: Italy, Spain, Portugal, Turkey, Mexico, Gulf region, Greece and Morocco |
Personal lines revenues (60% of total P&C revenues) increased 4%, mainly benefiting from a 4.6% average price increase.
| • | Personal Motor revenues(37% of total P&C revenues) were up 5%, mainly driven by: |
| • | MedLA (+7%) with Turkey up 34% led by the success of Motor products driven by increased car sales and Italy up 8% due to higher volumes and tariff increases, partly offset by Spain, down 7%, mainly due to lower volumes in a context of difficult macro environment and severe price competition, |
| • | Germany (+9%), as a result of both (i) higher volumes benefiting from a slowdown in price competition and (ii) price increases with the launch of two new product ranges with higher tariffs, |
| • | Direct (+8%) mainly driven by the UK primarily as a result of tariff increases, as well as strong growth in Italy, France and Poland. |
Personal Motor net new contracts amounted to +910k.
Page 7/19
| • | Personal Non-Motor revenues(24% of total P&C revenues) increased 2% in particular Direct business (+31%), mainly in the UK, supported by the launch of Home products in 2010 and 2011, and France (+3%) led by price increases. |
Household net new contracts amounted to +214k.
Commercial lines revenues (39% of total P&C revenues) were up 2%, largely driven by a 2.4% average price increase, whilst favorable change in business mix was offset by lower volumes in a context of selective underwriting.
| • | Commercial Motor revenues(8% of total P&C revenues) were up 4% notably driven by Mexico (+17%) and the UK (+16%) as a result of both tariff increases and higher new business. This was partly offset by selective underwriting in other MedLA region countries. |
| • | Commercial Non-Motor revenues(31% of total P&C revenues) were up 2% largely driven by (i) MedLA (+6%), in particular Turkey (+27%) and Mexico (+10%) mainly driven by large accounts in Property and the Gulf Region (+13%) with strong new business in Health, and by (ii) the UK (+2%) supported by volume growth and tariff increases in Health. This was partly offset by Spain (-5%), due to the difficult economic environment. |
Page 8/19

Asset Management
| • | Asset Management revenueswere up 4% to Euro 2,443 million, mainly driven by higher performance fees and real estate transaction fees at AXA IM as well as higher research fees at AllianceBernstein. |
Asset management revenues
In Euro million | 9M10 | 9M11 | Change on a reported basis | Change on a comparable basis | ||||||||||||
AXA IM | 868 | 937 | +8 | % | +8 | % | ||||||||||
AllianceBernstein | 1,595 | 1,506 | -6 | % | +1 | % | ||||||||||
|
|
|
|
|
|
|
| |||||||||
Total Asset management | 2,463 | 2,443 | -1 | % | +4 | % | ||||||||||
|
|
|
|
|
|
|
| |||||||||
| • | Assets Under Managementwere down Euro 59 billion versus December 31, 2010 at Euro 837 billion: |
| • | Net flows of Euro -33 billion comprised of: |
| • | Euro -35 billion at AllianceBernstein, primarily from institutional clients, |
| • | Euro +2 billion at AXA IM, mainly driven by Euro +3 billion on Money Market, Euro +2 billion at AXA Private Equity and Euro +2 billion at AXA Framlington, partly offset by Euro -1 billion on Fixed Income and Euro -4 billion at AXA Rosenberg. |
| • | Market impact: Euro -20 billion mainly at AllianceBernstein. |
| • | Forex impact: Euro -2 billion as a result of the slight depreciation of the USD versus the Euro. |
Assets Under Management Roll-forward
In Euro billion | Alliance Bernstein | AXA IM | Total | |||||||||
AUM at December 31, 2010 | 362 | 516 | 878 | |||||||||
|
|
|
|
|
| |||||||
Net inflows | -35 | +2 | -33 | |||||||||
Market impact | -20 | -1 | -20 | |||||||||
Scope & other impacts | +1 | -4 | -3 | |||||||||
Forex impact | -3 | +1 | -2 | |||||||||
|
|
|
|
|
| |||||||
AUM at September 30, 2011 | 305 | 514 | 819 | |||||||||
|
|
|
|
|
| |||||||
Average AUM over the period (12/31/10 - 09/30/11) | 334 | 503 | 837 | |||||||||
|
|
|
|
|
| |||||||
Change of average AUM 9M11 vs. 9M10 | ||||||||||||
On a reported basis | -9 | % | +1 | % | -3 | % | ||||||
On a comparable basis | -2 | % | 0 | % | -1 | % | ||||||
|
|
|
|
|
| |||||||
International Insurance
International Insurance revenues were up 2% to Euro 2,288 million, mainly driven by AXA Corporate Solutions Assurance up 4% mostly driven by Marine (+6%) and Motor (+12%) businesses whilst Liability was flat.
International Insurance IFRS revenues
In Euro million | 9M10 | 9M11 | Change on a reported basis | Change on a comparable basis | ||||||||||||
AXA Corporate Solutions Assurance | 1,597 | 1,626 | +2 | % | +4 | % | ||||||||||
AXA Assistance | 575 | 569 | -1 | % | -0 | % | ||||||||||
Other International activities | 124 | 93 | -25 | % | -13 | % | ||||||||||
|
|
|
|
|
|
|
| |||||||||
Total International Insurance | 2,296 | 2,288 | -0 | % | +2 | % | ||||||||||
|
|
|
|
|
|
|
| |||||||||
Page 9/19

Notes
| 1 | Annual Premium Equivalent (APE) represents 100% of new business regular premiums + 10% of new business single premiums. APE is Group share. |
| 2 | New Business Value is Group Share. |
| 3 | Continental Europe is France, Germany, Belgium, Switzerland, Italy, Spain, Portugal and Greece. |
| 4 | Life & Savings high growth markets are: Hong-Kong, Central & Eastern Europe (Poland, Czech Republic, Slovakia and Hungary), South-East Asia (Singapore, Indonesia, Philippine and Thailand), China, India, Morocco, Mexico and Turkey. |
Property & Casualty high growth markets are: Morocco, Mexico, Turkey, Gulf, Hong-Kong, Singapore, Malaysia, Ukraine and Poland (exc. Direct).
Direct markets are: AXA Global Direct (France, Belgium, Spain, Portugal, Italy, Poland, Korea and Japan) and UK Direct operations.
| 5 | Economic Capital Ratio: AXA’s internal economic model calibrated based on an adverse 1/200 year shock. |
About AXA
AXA Group is a worldwide leader in insurance and asset management, with 214,000 employees serving 95 million clients. In 2010, IFRS revenues amounted to Euro 91 billion and IFRS underlying earnings to Euro 3.9 billion.
AXA had Euro 1,104 billion in assets under management as of December 31, 2010.
The AXA ordinary share is listed on compartment A of Euronext Paris under the ticker symbol CS (ISN FR 0000120628 – Bloomberg: CS FP – Reuters: AXAF.PA). AXA’s American Depository Shares are also quoted on the OTC QX platform under the ticker symbol AXAHY.
The Group is included in the main international SRI indexes, such as Dow Jones Sustainability Index (DJSI) and FTSE4GOOD.
This press release is available on the AXA Group website
www.axa.com
AXA Investor Relations: | AXA Media Relations: | |||||||
Mattieu Rouot: | +33.1.40.75.46.85 | Guillaume Borie: | +33.1.40.75.49.98 | |||||
Gilbert Chahine: | +33.1.40.75.56.07 | Hélène Caillet: | +33.1.40.75.55.51 | |||||
Yael Beer-Gabel: | +33.1.40.75.47.93 | |||||||
Thomas Hude: | +33.1.40.75.97.24 | |||||||
Solange Brossollet: | +33.1.40.75.73.60 | |||||||
Florian Bezault: | +33.1.40.75.59.17 | |||||||
Jennifer Lawn: | +1.212.314.28.68 | |||||||
AXA Individual Shareholders Relations: +33.1.40.75.48.43
IMPORTANT LEGAL INFORMATION AND CAUTIONARY STATEMENTS CONCERNING FORWARD-LOOKING STATEMENTS
Certain statements contained herein are forward-looking statements including, but not limited to, statements that are predictions of or indicate future events, trends, plans or objectives. Undue reliance should not be placed on such statements because, by their nature, they are subject to known and unknown risks and uncertainties. Please refer to the section “Cautionary statements” in page 2 of AXA’s Document de Référence for the year ended December 31, 2010, for a description of certain important factors, risks and uncertainties that may affect AXA’s business. AXA undertakes no obligation to publicly update or revise any of these forward-looking statements, whether to reflect new information, future events or circumstances or otherwise.
Page 10/19

Group IFRS revenues – contribution & growth by segment and country/region
|
| |||||||||||||||
In Euro million | 9M10 | 9M11 | IFRS revenues change | |||||||||||||
| IFRS | IFRS | Reported | Comp. basis | |||||||||||||
United States | 7,142 | 7,198 | +0.8 | % | +7.8 | % | ||||||||||
France | 10,825 | 10,236 | -5.4 | % | -5.0 | % | ||||||||||
NORCEE | 11,765 | 12,539 | +6.6 | % | +1.0 | % | ||||||||||
of which Germany | 5,110 | 5,115 | +0.1 | % | +0.1 | % | ||||||||||
of which Switzerland | 4,349 | 5,371 | +23.5 | % | +8.8 | % | ||||||||||
of which Belgium | 1,886 | 1,599 | -15.2 | % | -15.2 | % | ||||||||||
of which Central & Eastern Europe | 360 | 394 | +9.3 | % | +6.2 | % | ||||||||||
United Kingdom | 1,905 | 495 | -74.0 | % | +21.3 | % | ||||||||||
Asia Pacific | 6,533 | 5,817 | -11.0 | % | -1.9 | % | ||||||||||
of which Japan | 4,134 | 4,201 | +1.6 | % | -7.5 | % | ||||||||||
of which Australia/New-Zealand | 1,192 | 354 | -70.3 | % | -1.0 | % | ||||||||||
of which Hong Kong | 1,029 | 1,068 | +3.7 | % | +20.3 | % | ||||||||||
of which South East Asia | 178 | 195 | +9.4 | % | +8.3 | % | ||||||||||
MedLA | 5,698 | 3,505 | -38.5 | % | -38.4 | % | ||||||||||
of which Spain | 531 | 468 | -11.9 | % | -11.9 | % | ||||||||||
of which Italy | 4,635 | 2,544 | -45.1 | % | -45.1 | % | ||||||||||
of which other | 533 | 493 | -7.4 | % | -6.3 | % | ||||||||||
|
|
|
|
|
|
|
| |||||||||
Life & Savings | 43,868 | 39,790 | -9.3 | % | -5.0 | % | ||||||||||
|
|
|
|
|
|
|
| |||||||||
of which mature markets | 41,992 | 37,851 | -9.9 | % | -5.8 | % | ||||||||||
of which high growth markets | 1,876 | 1,939 | +3.3 | % | +11.7 | % | ||||||||||
|
|
|
|
|
|
|
| |||||||||
NORCEE | 6,762 | 7,208 | +6.6 | % | +2.2 | % | ||||||||||
of which Germany | 2,869 | 2,967 | +3.4 | % | +3.4 | % | ||||||||||
of which Belgium | 1,565 | 1,602 | +2.4 | % | +2.4 | % | ||||||||||
of which Switzerland | 2,201 | 2,513 | +14.2 | % | +0.6 | % | ||||||||||
France | 4,280 | 4,334 | +1.2 | % | +1.2 | % | ||||||||||
MedLA | 4,709 | 4,798 | +1.9 | % | +4.4 | % | ||||||||||
of which Spain | 1,605 | 1,523 | -5.2 | % | -5.2 | % | ||||||||||
of which Italy | 1,014 | 1,019 | +0.5 | % | +0.5 | % | ||||||||||
of which other | 2,090 | 2,257 | +8.0 | % | +13.6 | % | ||||||||||
United Kingdom & Ireland | 2,791 | 2,821 | +1.1 | % | +2.5 | % | ||||||||||
Asia | 290 | 322 | +10.8 | % | +0.0 | % | ||||||||||
Direct | 1,462 | 1,605 | +9.8 | % | +9.8 | % | ||||||||||
|
|
|
|
|
|
|
| |||||||||
Property & Casualty | 20,294 | 21,087 | +3.9 | % | +3.1 | % | ||||||||||
|
|
|
|
|
|
|
| |||||||||
AXA Corporate Solutions Assurance | 1,597 | 1,626 | +1.8 | % | +3.9 | % | ||||||||||
Others | 700 | 663 | -5.3 | % | -2.4 | % | ||||||||||
|
|
|
|
|
|
|
| |||||||||
International Insurance | 2,296 | 2,288 | -0.3 | % | +2.0 | % | ||||||||||
|
|
|
|
|
|
|
| |||||||||
AllianceBernstein | 1,595 | 1,506 | -5.6 | % | +1.0 | % | ||||||||||
AXA Investment Managers | 868 | 937 | +8.0 | % | +8.2 | % | ||||||||||
|
|
|
|
|
|
|
| |||||||||
Asset Management | 2,463 | 2,443 | -0.8 | % | +3.5 | % | ||||||||||
|
|
|
|
|
|
|
| |||||||||
Banking & Holding | 344 | 335 | -2.7 | % | -3.9 | % | ||||||||||
|
|
|
|
|
|
|
| |||||||||
Total | 69,266 | 65,945 | -4.8 | % | -2.0 | % | ||||||||||
|
|
|
|
|
|
|
| |||||||||
Page 11/19

in Euro million | 9M11 APE | % Unit-Linked in APE | % G/A Protection & Health in APE | |||||||||||||||||||||||||||||
| G/A Protection & Health | G/A Savings | Unit-Linked | Mutual Funds & Other | 9M10 | 9M11 | 9M10 | 9M11 | |||||||||||||||||||||||||
United States | 134 | 54 | 322 | 239 | 46 | % | 43 | % | 13 | % | 18 | % | ||||||||||||||||||||
France | 392 | 435 | 129 | 0 | 11 | % | 13 | % | 38 | % | 41 | % | ||||||||||||||||||||
United Kingdom | 24 | 0 | 265 | 130 | 75 | % | 63 | % | 6 | % | 6 | % | ||||||||||||||||||||
NORCEE | 528 | 213 | 230 | 40 | 27 | % | 23 | % | 41 | % | 52 | % | ||||||||||||||||||||
Germany | 185 | 101 | 68 | 24 | 28 | % | 18 | % | 40 | % | 49 | % | ||||||||||||||||||||
Switzerland | 310 | 9 | 19 | 1 | 9 | % | 5 | % | 88 | % | 92 | % | ||||||||||||||||||||
Belgium | 25 | 94 | 8 | 0 | 8 | % | 7 | % | 14 | % | 20 | % | ||||||||||||||||||||
Central & Eastern Europe | 8 | 9 | 135 | 15 | 67 | % | 81 | % | 5 | % | 5 | % | ||||||||||||||||||||
Asia Pacific | 484 | 6 | 297 | 34 | 29 | % | 36 | % | 48 | % | 59 | % | ||||||||||||||||||||
Japan | 254 | 0 | 82 | 0 | 28 | % | 24 | % | 72 | % | 76 | % | ||||||||||||||||||||
Australia/New-Zealand | — | — | — | — | 11 | % | — | 9 | % | — | ||||||||||||||||||||||
Hong Kong | 116 | 6 | 87 | 34 | 42 | % | 36 | % | 53 | % | 48 | % | ||||||||||||||||||||
South-East Asia, India & China | 113 | 0 | 127 | 0 | 53 | % | 53 | % | 47 | % | 47 | % | ||||||||||||||||||||
MedLA | 71 | 129 | 96 | 6 | 18 | % | 32 | % | 19 | % | 24 | % | ||||||||||||||||||||
Spain | 13 | 30 | 7 | 4 | 16 | % | 13 | % | 18 | % | 24 | % | ||||||||||||||||||||
Italy | 12 | 87 | 83 | 2 | 22 | % | 45 | % | 3 | % | 7 | % | ||||||||||||||||||||
Other | 45 | 11 | 6 | 0 | 5 | % | 10 | % | 80 | % | 72 | % | ||||||||||||||||||||
|
|
|
|
|
|
|
|
|
|
|
|
|
|
|
| |||||||||||||||||
Total | 1,632 | 837 | 1,338 | 448 | 31 | % | 31 | % | 31 | % | 38 | % | ||||||||||||||||||||
|
|
|
|
|
|
|
|
|
|
|
|
|
|
|
| |||||||||||||||||
Page 12/19

Net Inflows by country/region
In Euro billion | 9M10 | 9M11 | ||||||
France | +2.2 | +0.8 | ||||||
NORCEE(a) | +3.2 | +2.9 | ||||||
United States | -0.8 | -0.4 | ||||||
United Kingdom | -0.8 | +0.7 | ||||||
Asia Pacific(b) | +1.5 | +1.6 | ||||||
MedLA(c) | +2.4 | -1.0 | ||||||
|
|
|
| |||||
Total L&S Net Inflows | +7.8 | +4.5 | ||||||
|
|
|
| |||||
of which mature markets | +6.4 | +3.2 | ||||||
of which high growth markets | +1.3 | +1.4 | ||||||
|
|
|
| |||||
| (a) | Northern Central and Eastern Europe: Germany, Belgium, Switzerland, Central & Eastern Europe and Luxembourg. |
| (b) | Asia Pacific: Hong Kong, Japan and South-East Asia, India & China. |
| (c) | Mediterranean and Latin American Region: Italy, Spain, Portugal, Turkey, Mexico, Greece and Morocco. |
Page 13/19

(In million local currency except Japan in billion) | 1Q10 | 2Q10 | 3Q10 | 4Q10 | 1Q11 | 2Q11 | 3Q11 | |||||||||||||||||||||
Life & Savings | ||||||||||||||||||||||||||||
United States | 3,084 | 3,174 | 3,138 | 3,249 | 3,390 | 3,285 | 3,142 | |||||||||||||||||||||
France | 3,824 | 3,502 | 3,500 | 3,799 | 3,665 | 3,429 | 3,445 | |||||||||||||||||||||
NORCEE | ||||||||||||||||||||||||||||
of which Germany | 1,696 | 1,786 | 1,628 | 1,757 | 1,656 | 1,663 | 1,796 | |||||||||||||||||||||
of which Switzerland | 4,325 | 899 | 868 | 978 | 4,697 | 1,066 | 865 | |||||||||||||||||||||
of which Belgium | 731 | 605 | 549 | 618 | 655 | 455 | 489 | |||||||||||||||||||||
of which Central & Eastern Europe | 119 | 118 | 123 | 151 | 137 | 138 | 119 | |||||||||||||||||||||
United Kingdom | 605 | 612 | 417 | 123 | 136 | 148 | 147 | |||||||||||||||||||||
Asia Pacific | ||||||||||||||||||||||||||||
of which Japan | 154 | 210 | 154 | 158 | 158 | 163 | 157 | |||||||||||||||||||||
of which Australia/New-Zealand | 559 | 646 | 544 | 513 | 479 | — | — | |||||||||||||||||||||
of which Hong Kong | 3,368 | 3,493 | 3,659 | 3,196 | 3,774 | 3,905 | 4,017 | |||||||||||||||||||||
MedLA | 2,355 | 1,879 | 1,464 | 1,245 | 1,272 | 1,059 | 1,175 | |||||||||||||||||||||
|
|
|
|
|
|
|
|
|
|
|
|
|
| |||||||||||||||
Property & Casualty | ||||||||||||||||||||||||||||
NORCEE | ||||||||||||||||||||||||||||
of which Germany | 1,584 | 593 | 692 | 588 | 1,659 | 586 | 722 | |||||||||||||||||||||
of which Switzerland | 2,645 | 256 | 182 | 154 | 2,653 | 272 | 175 | |||||||||||||||||||||
of which Belgium | 617 | 486 | 462 | 465 | 636 | 487 | 479 | |||||||||||||||||||||
France | 1,808 | 1,170 | 1,303 | 1,205 | 1,842 | 1,195 | 1,296 | |||||||||||||||||||||
MedLA | 1,681 | 1,626 | 1,402 | 1,912 | 1,712 | 1,658 | 1,427 | |||||||||||||||||||||
United Kingdom & Ireland | 765 | 863 | 766 | 711 | 783 | 875 | 801 | |||||||||||||||||||||
Asia | 92 | 90 | 108 | 82 | 114 | 98 | 110 | |||||||||||||||||||||
Direct | 455 | 507 | 500 | 467 | 517 | 542 | 546 | |||||||||||||||||||||
|
|
|
|
|
|
|
|
|
|
|
|
|
| |||||||||||||||
International Insurance | ||||||||||||||||||||||||||||
AXA Corporate Solutions Assurance | 933 | 338 | 326 | 334 | 932 | 338 | 355 | |||||||||||||||||||||
Other International activities | 279 | 212 | 208 | 217 | 277 | 192 | 194 | |||||||||||||||||||||
|
|
|
|
|
|
|
|
|
|
|
|
|
| |||||||||||||||
Asset Management | ||||||||||||||||||||||||||||
AllianceBernstein | 701 | 712 | 685 | 722 | 723 | 716 | 681 | |||||||||||||||||||||
AXA Investment Managers | 302 | 303 | 263 | 350 | 299 | 335 | 304 | |||||||||||||||||||||
|
|
|
|
|
|
|
|
|
|
|
|
|
| |||||||||||||||
Banking & Holdings | 105 | 113 | 126 | 115 | 130 | 119 | 86 | |||||||||||||||||||||
|
|
|
|
|
|
|
|
|
|
|
|
|
| |||||||||||||||
Page 14/19

Property & Casualty revenues – contribution & growth by business line
in % | Personal Motor | Personal Non-Motor | Commercial Motor | Commercial Non-Motor | ||||||||||||||||||||||||||||
| % Gross revenues | Change on comp. basis | % Gross revenues | Change on comp. basis | % Gross revenues | Change on comp. basis | % Gross revenues | Change on comp. basis | |||||||||||||||||||||||||
France | 29 | % | -1 | % | 29 | % | +3 | % | 9 | % | +4 | % | 33 | % | +2 | % | ||||||||||||||||
United Kingdom(a) | 16 | % | +3 | % | 39 | % | +0 | % | 9 | % | +16 | % | 38 | % | +2 | % | ||||||||||||||||
NORCEE | 34 | % | +4 | % | 21 | % | +2 | % | 8 | % | +4 | % | 38 | % | +0 | % | ||||||||||||||||
of which Germany | 32 | % | +9 | % | 24 | % | +1 | % | 7 | % | +4 | % | 30 | % | -1 | % | ||||||||||||||||
of which Belgium | 28 | % | +1 | % | 21 | % | +4 | % | 13 | % | +5 | % | 38 | % | +2 | % | ||||||||||||||||
of which Switzerland | 37 | % | +2 | % | 15 | % | +2 | % | 4 | % | +2 | % | 44 | % | -1 | % | ||||||||||||||||
MedLA | 43 | % | +7 | % | 20 | % | -0 | % | 10 | % | +1 | % | 27 | % | +6 | % | ||||||||||||||||
of which Spain | 46 | % | -7 | % | 28 | % | -1 | % | 7 | % | -10 | % | 20 | % | -5 | % | ||||||||||||||||
of which Italy | 63 | % | +8 | % | 23 | % | -10 | % | 0 | % | -85 | % | 14 | % | -4 | % | ||||||||||||||||
of which other(b) | 33 | % | +21 | % | 13 | % | +10 | % | 17 | % | +8 | % | 38 | % | +11 | % | ||||||||||||||||
Asia | 38 | % | +9 | % | 11 | % | +8 | % | 11 | % | -17 | % | 44 | % | -6 | % | ||||||||||||||||
Direct | 90 | % | +8 | % | 10 | % | +32 | % | — | — | — | — | ||||||||||||||||||||
|
|
|
|
|
|
|
|
|
|
|
|
|
|
|
| |||||||||||||||||
Total | 37 | % | +5 | % | 24 | % | +2 | % | 8 | % | +4 | % | 31 | % | +2 | % | ||||||||||||||||
|
|
|
|
|
|
|
|
|
|
|
|
|
|
|
| |||||||||||||||||
of which mature markets | 32 | % | +2 | % | 26 | % | +1 | % | 8 | % | +3 | % | 33 | % | +0 | % | ||||||||||||||||
of which high growth markets | 34 | % | +21 | % | 12 | % | +11 | % | 16 | % | +7 | % | 38 | % | +10 | % | ||||||||||||||||
| (a) | Including Ireland. |
| (b) | Portugal, Greece, Turkey, Mexico, Gulf and Morocco. |
Page 15/19

Property & Casualty traiff increases by country and business line
In % | Personal | Commercial(a) | ||||||
France | +3.8 | % | +5.7 | % | ||||
Germany | +1.1 | % | +0.4 | % | ||||
United Kingdom & Ireland | +9.9 | % | +4.1 | % | ||||
Switzerland | -0.5 | % | -0.5 | % | ||||
Belgium | +4.5 | % | +1.5 | % | ||||
MedLA | +3.0 | % | +1.4 | % | ||||
Direct | +11.8 | % | ||||||
|
|
|
| |||||
Total | +4.6 | % | +2.4 | % | ||||
|
|
|
| |||||
| (a) | New business only |
Page 16/19

in Euro million | 9M10 APE | 9M11 APE | Change on a comparable basis | 9M10 NBV | 9M11 NBV | Change on a comparable basis | 9M11 NBV/APE margin | Change on a comparable basis | ||||||||||||||||||||||||
United States | 741 | 749 | +8.1 | % | 93 | 113 | +29.3 | % | 15.1 | % | +2.5 | pts | ||||||||||||||||||||
France | 996 | 956 | -4.0 | % | 111 | 126 | +15.2 | % | 13.2 | % | +2.2 | pts | ||||||||||||||||||||
United Kingdom | 421 | 418 | +0.9 | % | 23 | 22 | +0.4 | % | 5.4 | % | -0.0 | pt | ||||||||||||||||||||
NORCEE | 938 | 1,010 | -0.3 | % | 233 | 281 | +8.8 | % | 27.8 | % | +2.3 | pts | ||||||||||||||||||||
Germany | 358 | 377 | +5.3 | % | 75 | 86 | +14.9 | % | 22.8 | % | +1.9 | pts | ||||||||||||||||||||
Switzerland | 233 | 338 | +27.7 | % | 108 | 154 | +25.2 | % | 45.5 | % | -0.9 | pt | ||||||||||||||||||||
Belgium | 176 | 128 | -27.6 | % | 16 | 10 | -35.2 | % | 8.0 | % | -0.9 | pt | ||||||||||||||||||||
Central & Eastern Europe | 171 | 168 | -18.6 | % | 35 | 31 | -27.7 | % | 18.4 | % | -2.3 | pts | ||||||||||||||||||||
ASIA PACIFIC | 789 | 820 | +7.6 | % | 407 | 539 | +8.1 | % | 65.7 | % | +0.3 | pt | ||||||||||||||||||||
Japan | 335 | 337 | -8.8 | % | 239 | 277 | +5.1 | % | 82.2 | % | +10.9 | pts | ||||||||||||||||||||
Australia/New-Zealand | 223 | — | — | 32 | — | — | — | — | ||||||||||||||||||||||||
Hong Kong | 111 | 243 | +26.6 | % | 80 | 146 | +5.5 | % | 60.1 | % | -12.0 | pts | ||||||||||||||||||||
South-East Asia, India & China | 120 | 240 | +15.5 | % | 56 | 116 | +19.5 | % | 48.3 | % | +1.6 | pts | ||||||||||||||||||||
MedLA | 431 | 302 | -30.0 | % | 64 | 66 | +3.9 | % | 21.9 | % | +7.2 | pts | ||||||||||||||||||||
Spain | 58 | 55 | -6.2 | % | 7 | 8 | +26.6 | % | 15.2 | % | +3.9 | pts | ||||||||||||||||||||
Italy | 294 | 184 | -37.4 | % | 43 | 45 | +3.4 | % | 24.2 | % | +9.6 | pts | ||||||||||||||||||||
Other | 79 | 63 | -19.9 | % | 14 | 13 | -5.3 | % | 21.2 | % | +3.3 | pts | ||||||||||||||||||||
|
|
|
|
|
|
|
|
|
|
|
|
|
|
|
| |||||||||||||||||
TOTAL | 4,317 | 4,255 | -1.2 | % | 931 | 1,147 | +10.6 | % | 27.0 | % | +2.8 | pts | ||||||||||||||||||||
|
|
|
|
|
|
|
|
|
|
|
|
|
|
|
| |||||||||||||||||
of which mature markets | 3,862 | 3,566 | -2.3 | % | 756 | 849 | +12.6 | % | 23.8 | % | +3.0 | pts | ||||||||||||||||||||
of which high growth markets | 455 | 689 | +5.1 | % | 175 | 298 | +5.6 | % | 43.3 | % | +0.2 | pt | ||||||||||||||||||||
|
|
|
|
|
|
|
|
|
|
|
|
|
|
|
| |||||||||||||||||
Page 17/19

In order to improve visibility on P&C Direct activities, Direct P&C is now reported as a separate business unit and no longer as part of countries or regions.
| Gross revenues | ||||||||
In Euro million | 9M10(d) | 9M10 restated | ||||||
NORCEE(a) | 6,845 | 6,762 | ||||||
of which Germany | 2,869 | 2,869 | ||||||
of which Belgium | 1,617 | 1,565 | ||||||
of which Switzerland | 2,201 | 2,201 | ||||||
MedLA(b) | 4,906 | 4,709 | ||||||
of which Spain | 1,765 | 1,605 | ||||||
of which Italy | 1,036 | 1,014 | ||||||
of which other | 2,105 | 2,090 | ||||||
France | 4,556 | 4,280 | ||||||
United Kingdom & Ireland | 3,208 | 2,791 | ||||||
Asia | 779 | 290 | ||||||
Direct(c) | — | 1,462 | ||||||
|
|
|
| |||||
Total P&C | 20,294 | 20,294 | ||||||
|
|
|
| |||||
of which Direct | 1,462 | |||||||
of which mature markets | 16,736 | |||||||
of which high growth markets | 2,096 | |||||||
| (a) | Northern Central and Eastern Europe: Germany, Belgium, Switzerland, Central an Eastern Europe and Luxembourg. |
| (b) | Mediterranean and Latin American Region: Italy, Spain, Portugal, Turkey, Mexico, Gulf region, Greece and Morocco. |
| (c) | Direct: AXA Global Direct (France, Belgium, Spain, Portugal, Italy, Poland, Korea and Japan) and UK Direct operations. |
| (d) | Canadian operations are treated as discontinued operations and therefore excluded from 9M 2010 figures. |
Page 18/19

| • | 08/04/2011 - Half year 2011 Earnings - In line with Ambition AXA |
| • | 08/23/2011 - AXA launches its 2011 employee share offering (Shareplan 2011) |
| • | 09/26/2011 - AXA has completed the sale of its Canadian operations |
| • | 09/28/2011 - AXA Group announcement regarding AXA Private Equity |
| • | 10/05/2011 - Henri de Castries will be speaking at the Bank of America Merrill Lynch Conference |
| • | 10/20/2011 - AXA Global P&C announces the successful placement of €180 million catastrophe bonds |
Please refer to the following web site address for further details:
http://www.axa.com/en/press/pr/

Shareholders’ Equity
No significant operations
Debt
No significant operations

| • | 02/16/2012 Full Year 2011 Earnings |
| • | 04/25/2012 Shareholders’ Meeting |
Page 19/19