Washington, D.C. 20549
Kevin J. McCarthy
Form N-CSR is to be used by management investment companies to file reports with the Commission not later than 10 days after the transmission to stockholders of any report that is required to be transmitted to stockholders under Rule 30e-1 under the Investment Company Act of 1940 (17 CFR 270.30e-1). The Commission may use the information provided on Form N-CSR in its regulatory, disclosure review, inspection, and policymaking roles.
A registrant is required to disclose the information specified by Form N-CSR, and the Commission will make this information public. A registrant is not required to respond to the collection of information contained in Form N-CSR unless the Form displays a currently valid Office of Management and Budget ("OMB") control number. Please direct comments concerning the accuracy of the information collection burden estimate and any suggestions for reducing the burden to Secretary, Securities and Exchange Commission, 450 Fifth Street, NW, Washington, DC 20549-0609. The OMB has reviewed this collection of information under the clearance requirements of 44 U.S.C. ss. 3507.
ITEM 1. REPORTS TO STOCKHOLDERS.
INVESTMENT ADVISER NAME CHANGE
Effective January 1, 2011, Nuveen Asset Management, the Funds’ investment adviser, changed its name to Nuveen Fund Advisors, Inc. (“Nuveen Fund Advisors”). Concurrently, Nuveen Fund Advisors formed a wholly-owned subsidiary, Nuveen Asset Management, LLC, to house its portfolio management capabilities.
NUVEEN INVESTMENTS COMPLETES STRATEGIC COMBINATION WITH FAF ADVISORS
On December 31, 2010, Nuveen Investments completed the strategic combination between Nuveen Asset Management, LLC, the largest investment affiliate of Nuveen Investments, and FAF Advisors. As part of this transaction, U.S. Bancorp – the parent of FAF Advisors – received cash consideration and a 9.5% stake in Nuveen Investments in exchange for the long-term investment business of FAF Advisors, including investment management responsibilities for the non-money market mutual funds of the First American Funds family.
The approximately $27 billion of mutual fund and institutional assets managed by FAF Advisors, along with the investment professionals managing these assets and other key personnel, have become part of Nuveen Asset Management, LLC. With these additions to Nuveen Asset Management, LLC, this affiliate now manages more than $100 billion of assets across a broad range of strategies from municipal and taxable fixed income to traditional and specialized equity investments.
This combination does not affect the investment objectives or strategies of the Funds in this report. Over time, Nuveen Investments expects that the combination will provide even more ways to meet the needs of investors who work with financial advisors and consultants by enhancing the multi-boutique model of Nuveen Investments, which also includes highly respected investment teams at HydePark, NWQ Investment Management, Santa Barbara Asset Management, Symphony Asset Management, Tradewinds Global Investors and Winslow Capital. Nuveen Investments managed approximately $206 billion of assets as of March 31, 2011.
Table of Contents
| | |
Chairman’s Letter to Shareholders | 4 |
Portfolio Managers’ Comments | 5 |
Dividend and Share Price Information | 12 |
Performance Overviews | 13 |
Report of Independent Registered Public Accounting Firm | 18 |
Portfolios of Investments | 19 |
Statement of Assets and Liabilities | 50 |
Statement of Operations | 51 |
Statement of Changes in Net Assets | 52 |
Financial Highlights | 54 |
Notes to Financial Statements | 60 |
Board Members and Officers | 67 |
Annual Investment Management Agreement Approval Process | 72 |
Board Approval of Sub-Advisory Arrangements | 79 |
Reinvest Automatically, Easily and Conveniently | 80 |
Glossary of Terms Used in this Report | 82 |
Other Useful Information | 87 |
Chairman’s
Letter to Shareholders
Dear Shareholders,
In 2010, the global economy recorded another year of recovery from the financial and economic crises of 2008, but many of the factors that caused the downturn still weigh on the prospects for continued improvement. In the U.S., ongoing weakness in housing values has put pressure on homeowners and mortgage lenders. Similarly, the strong earnings recovery for corporations and banks is only slowly being translated into increased hiring or more active lending. Globally, deleveraging by private and public borrowers has inhibited economic growth and that process is far from complete.
Encouragingly, constructive actions are being taken by governments around the world to deal with economic issues. In the U.S., the recent passage of a stimulatory tax bill relieved some of the pressure on the Federal Reserve to promote economic expansion through quantitative easing and offers the promise of sustained economic growth. A number of European governments are undertaking programs that could significantly reduce their budget deficits. Governments across the emerging markets are implementing various steps to deal with global capital flows without undermining international trade and investment.
The success of these government actions could determine whether 2011 brings further economic recovery and financial market progress. One risk associated with the extraordinary efforts to strengthen U.S. economic growth is that the debt of the U.S. government will continue to grow to unprecedented levels. Another risk is that over time there could be inflationary pressures on asset values in the U.S. and abroad, because what happens in the U.S. impacts the rest of the world economy. Also, these various actions are being taken in a setting of heightened global economic uncertainty, primarily about the supplies of energy and other critical commodities. In this challenging environment, your Nuveen investment team continues to seek sustainable investment opportunities and to remain alert to potential risks in a recovery still facing many headwinds. On your behalf, we monitor their activities to assure they maintain their investment disciplines.
As you will note elsewhere in this report, on December 31, 2010, Nuveen Investments completed a strategic combination with FAF Advisors, Inc., the manager of the First American Funds. The combination adds highly respected and distinct investment teams to meet the needs of investors and their advisors and is designed to benefit all fund shareholders by creating a fund organization with the potential for further economies of scale and the ability to draw from even greater talent and expertise to meet those investor needs.
As of the end of April, 2011, Nuveen Investments had completed the refinancing of all of the Auction Rate Preferred Securities issued by its taxable closed-end funds and 89% of the MuniPreferred shares issued by its tax-exempt closed-end funds. Please consult the Nuveen Investments web site, www.Nuveen.com, for the current status of this important refinancing program.
As always, I encourage you to contact your financial consultant if you have any questions about your investment in a Nuveen Fund. On behalf of the other members of your Fund Board, we look forward to continuing to earn your trust in the months and years ahead.
Sincerely,
Robert P. Bremner
Chairman of the Board
May 19, 2011
4 Nuveen Investments
Portfolio Managers’ Comments
Nuveen Select Tax-Free Income Portfolio (NXP)
Nuveen Select Tax-Free Income Portfolio 2 (NXQ)
Nuveen Select Tax-Free Income Portfolio 3 (NXR)
Nuveen California Select Tax-Free Income Portfolio (NXC)
Nuveen New York Select Tax-Free Income Portfolio (NXN)
Portfolio managers Tom Spalding and Scott Romans examine economic and municipal market conditions at the national and state levels, key investment strategies, and the twelve-month performance of the Nuveen Select Portfolios. With 35 years of investment experience, Tom has managed the three national Portfolios since 1999. Scott, who joined Nuveen in 2000, has managed NXC since 2003. He assumed portfolio management responsibility for NXN in January 2011 from Cathryn Steeves, who managed this Portfolio from 2006 to December 2010.
What factors affected the U.S. economy and municipal market during the twelve-month reporting period ended March 31, 2011?
During this period, the U.S. economy demonstrated some signs of improvement, supported by the efforts of both the Federal Reserve (Fed) and the federal government. For its part, the Fed continued to hold the benchmark fed funds rate in a target range of zero to 0.25% since cutting it to this record low level in December 2008. At its April 2011 meeting (following the end of this reporting period), the central bank renewed its commitment to keeping the fed funds rate at “exceptionally low levels” for an “extended period.” The Fed also left unchanged its second round of quantitative easing, which calls for purchasing $600 billion in longer-term U.S. Treasury bonds by June 30, 2011. The goal of this plan is to lower long-term interest rates and thereby stimulate economic activity and create jobs. The federal government continued to focus on implementing the economic stimulus package passed in early 2009 aimed at providing job creation, tax relief, fiscal assistance to state and local governments and expansion of unemployment benefits and other federal social welfare programs.
In the first quarter of 2011, the U.S. economy, as measured by the U.S. gross domestic product (GDP), grew at an annualized rate of 1.8%, marking the seventh consecutive quarter of positive growth. The employment picture continued to improve gradually, with the national jobless rate registering 8.8% in March 2011, its lowest level since March 2009 and down from 9.7% a year earlier. Inflation posted its largest twelve-month gain since December 2009, as the Consumer Price Index (CPI) rose 2.7% year-over-year as of March 2011, driven mainly by increased prices for energy. The core CPI (which excludes food and energy) increased 1.2% over this period. The housing market
Certain statements in this report are forward-looking statements. Discussions of specific investments are for illustration only and are not intended as recommendations of individual investments. The forward-looking statements and other views expressed herein are those of the portfolio managers as of the date of this report. Actual future results or occurrences may differ significantly from those anticipated in any forward-looking statements and the views expressed herein are subject to change at any time, due to numerous market and other factors. The Portfolios disclaim any obligation to update publicly or revise any forward-looking statements or views expressed herein.
Any reference to credit ratings for portfolio holdings denotes the highest rating assigned by a Nationally Recognized Statistical Rating Organization (NRSRO) such as Standard & Poor’s (S&P), Moody’s or Fitch. AAA, AA, A and BBB ratings are investment grade; BB, B, CCC, CC, C and D ratings are below investment grade. Holdings and ratings may change over time.
Nuveen Investments 5
continued to be a weak spot in the economy. For the twelve months ended February 2011 (most recent data available at the time this report was prepared), the average home price in the Standard & Poor’s (S&P)/Case-Shiller index of 20 major metropolitan areas lost 3.3%, with 10 of the 20 metropolitan areas hitting their lowest levels since housing prices peaked in 2006.
Municipal bond prices generally rose during this period, as the combination of strong demand and tight supply of new tax-exempt issuance created favorable market conditions. One reason for the decrease in new tax-exempt supply was the heavy issuance of taxable municipal debt under the Build America Bond (BAB) program, which was created as part of the American Recovery and Reinvestment Act of February 2009, and which expired on December 31, 2010. Between the beginning of this reporting period on April 1, 2010, and the end of the BAB program, taxable Build America Bond issuance totaled $90.5 billion, accounting for over 27% of new bonds issued in the municipal market.
After rallying strongly over most of the period, the municipal market suffered a reversal in mid-November 2010, due largely to investor concerns about inflation, the federal deficit, and its impact on demand for U.S. Treasuries. Adding to this situation was media coverage of the strained finances of many state and local governments, which often failed to differentiate between gaps in these governments’ operating budgets and their ability to meet their debt service obligation. As a result, money began to flow out of municipal mutual funds, yields rose and valuations lowered. Toward the end of this period, we saw the environment in the municipal market improve, as crossover buyers—including hedge funds and life insurance companies—were attracted by municipal bond prices and tax-exempt yields, resulting in decreased outflows, declining yields and rising valuations.
Over the twelve months ended March 31, 2011, municipal bond issuance nationwide—both tax-exempt and taxable—totaled $378.9 billion. Demand for municipal bonds was exceptionally strong during the majority of this period, especially from individual investors. In recent months, crossover buyers have provided support for the market.
How were economic and market conditions in California and New York during this period?
During the twelve-month period, California continued to struggle to emerge from recession. The impact of the past few years on the state’s economic growth can be seen in its ranking in terms of GDP growth. In 2009 (most recent data available at the time this report was prepared), California ranked 32nd in the nation in GDP growth by state, as its economy contracted 2.2%. As of March 2011, California’s unemployment rate was 12.0%, the second highest in the nation (behind Nevada), down from 12.4% in March 2010. Employment losses, especially in the construction sector, far outweighed the
6 Nuveen Investments
growth in professional and business services, education and health services, and leisure and hospitality, the only sectors to report recent gains. On the positive side, job losses in real estate-related sectors appeared to be easing. In the housing market, a dwindling number of real estate-owned foreclosures has helped the outlook for home prices by reducing distressed housing sales. According to the S&P/Case-Shiller home price index of 20 major metropolitan areas, home prices in San Diego, Los Angeles, and San Francisco lost 1.8%, 2.1%, and 3.5%, respectively, over the twelve months ended February 2011, compared with an average decrease of 3.3% nationwide.
California continued to be burdened by serious budget problems. The $125.3 billion California state budget for fiscal 2011 was enacted in October 2010. This budget eliminated a $19.3 billion shortfall through use of additional federal funds, various one-time receipts and loans, and spending reductions that affected pay for state workers, home care for the elderly, child care services, and state prisons. The budget deficit for fiscal 2012 was estimated at $25.4 billion, including an $8.2 billion carry-over from fiscal 2011. The governor was expected to unveil a revised budget in mid-May 2011, with updated revenue and spending estimates, as legislators face a June 15 budget deadline. As of March 2011, Moody’s and S&P rated California general obligation (GOs) bonds at A1 and A-, respectively. For the twelve months ended March 31, 2011, municipal issuance in California totaled $49.6 billion, a decrease of 32% from the previous twelve months.
The impact of the recession on New York’s economy was even more evident than in California. In 2009, New York ranked 48th in the nation in GDP growth by state, ahead of only Michigan and Nevada. Recently, New York reported employment gains in its primary industries, including financial activities, professional and business services, education and health services, and leisure and hospitality. In March 2011, unemployment in New York was 8.0%, the lowest level since March 2009, down from 8.8% in March 2010. The decline in housing prices also continued to weigh on the New York economy. Between February 2010 and February 2011, housing prices in New York City dropped 3.1%, compared with an average decrease of 3.3% nationwide.
New York continued to face substantial fiscal challenges. The $133.8 billion fiscal 2010-2011 state budget was adopted piecemeal, with the final sections enacted June 28, 2010. This budget closed a $9 billion gap through expenditure reductions and a $1.60 per pack hike in the state cigarette tax, among other measures. On March 31, 2011, the $132.5 billion New York state budget for fiscal 2011-2012 was approved on schedule. As of March 2011, New York state GOs were rated Aa2 by Moody’s and AA by S&P. Both rating agencies maintained stable outlooks for the state. For the twelve months ended March 31, 2011, municipal issuance in New York totaled $39.5 billion, a decrease of 5% from the previous twelve months. For this period, New York continued to rank second in the nation, following California, in terms of municipal issuance by state.
Nuveen Investments 7
What key strategies were used to manage the Nuveen Select Portfolios during this reporting period?
As previously mentioned, the new issue supply of tax-exempt bonds declined nationally during this period, due largely to the issuance of taxable bonds under the BAB program (which expired on December 31, 2010). This program also significantly affected the availability of tax-exempt bonds in California and New York. Between the beginning of this reporting period on April 1, 2010, and the end of the BAB program, Build America Bonds accounted for approximately 37% of municipal supply in California and 32% in New York. Since interest payments from Build America Bonds represent taxable income, we did not view these bonds as good investment opportunities for these Portfolios. Further compounding the supply situation was the drop-off in new municipal issuance during the first three months of 2011, when issuance in California and New York declined 84% and 16%, respectively, from that of the same period in 2010.
In this environment of constrained tax-exempt municipal bond issuance, we continued to take a bottom-up approach to discovering undervalued sectors and individual credits with the potential to perform well over the long-term. During this period, the national Portfolios found value in various areas of the market, including health care across a geographically diverse range of states. In general, our focus was on intermediate to longer-term bonds that would help to maintain the Portfolios’ durations. In recent months, we began to add bonds with longer maturities in an effort to slightly extend duration and position the Portfolios advantageously for changes in the market environment.
During this period, portfolio activity in NXN was lower than usual due to the difficulty of finding appropriate tax-exempt bonds in the New York market. However, we did discover attractive opportunities to add to our holdings of health care, airport and charter school bonds.
In California, opportunities to purchase attractive bonds for NXC were more numerous. One of the areas we favored during this period was the “other revenue” sector, where we were actively adding tax increment financing district, or redevelopment district, bonds. The proposed elimination of redevelopment district programs in California, suggested as part of efforts to close gaps in the state budget, prompted issuers to come to market with their remaining authorizations of redevelopment district bonds. This resulted in heavier supply of these bonds and higher yields at attractive prices. NXC also purchased health care credits and school district zero coupon bonds during this period.
During 2010, a portion of our investment activity resulted from opportunities created by the provisions of the BAB program. For example, tax-exempt supply was more plentiful in the health care sector because, as 501(c)(3) (nonprofit) organizations, hospitals generally did not qualify for the BAB program and continued to issue bonds
8 Nuveen Investments
in the tax-exempt municipal market. Bonds with proceeds earmarked for refundings, working capital, and private activities also were not covered by the BAB program, and this resulted in attractive opportunities in various other sectors of the market.
Cash for new purchases during this period was generated primarily by the proceeds from bond calls and maturing bonds, which we worked to redeploy to keep the Portfolios fully invested. In NXC, we also sold some very short-dated bonds to fund additional purchases during this period. Selling in the other four Portfolios was generally minimal because of the difficulty in finding appropriate replacement securities.
As of March 31, 2011, all five Portfolios continued to use inverse floating rate securities. We employ inverse floaters as a form of leverage for a variety of reasons, including duration management, income enhancement and total return enhancement.
How did the Portfolios perform?
Individual results for the Nuveen Select Portfolios, as well as relevant index and peer group information, are presented in the accompanying table.
| | | | |
Average Annual Total Returns on Net Asset Value | | | |
For periods ended 3/31/11 | | | |
| | 1-Year | 5-Year | 10-Year |
National Portfolios | | | |
NXP | 0.69% | 3.48% | 4.34% |
NXQ | 0.13% | 2.53% | 3.75% |
NXR | 0.62% | 3.52% | 4.26% |
| | | | |
Standard & Poor’s (S&P) National Municipal Bond Index1 | 1.45% | 3.80% | 4.64% |
Lipper General and Insured Unleveraged Municipal Debt Funds Average2 | 0.51% | 3.00% | 3.93% |
| | | | |
California Portfolio | | | |
NXC | 0.83% | 3.11% | 4.07% |
| | | | |
Standard & Poor’s (S&P) California Municipal Bond Index1 | 1.57% | 3.43% | 4.46% |
Lipper California Municipal Debt Funds Average2 | -2.53% | 1.17% | 4.20% |
| | | | |
New York Portfolio | | | |
NXN | 1.84% | 3.83% | 4.31% |
| | | | |
Standard & Poor’s (S&P) New York Municipal Bond Index1 | 1.47% | 4.10% | 4.72% |
Lipper New York Municipal Debt Funds Average2 | -0.56% | 2.28% | 4.76% |
Past performance is not predictive of future results. Current performance may be higher or lower than the data shown. Returns do not reflect the deduction of taxes that shareholders may have to pay on Portfolio distributions or upon the sale of Portfolio shares.
For additional information, see the individual Performance Overview for your Portfolio in this report.
| 1 | The Standard & Poor’s (S&P) National Municipal Bond Index is an unleveraged, market value-weighted index designed to measure the performance of the tax-exempt, investment-grade U.S. municipal bond market. The Standard & Poor’s (S&P) Municipal Bond Indexes for California and New York are also unleveraged and market value-weighted and comprise a broad range of tax-exempt, investment-grade municipal bonds issued in California and New York, respectively. The S&P indexes do not reflect any initial or ongoing expenses and are not available for direct investment. |
| 2 | Each of the Lipper Municipal Debt Funds Averages shown in this report is calculated using the returns of all closed-end funds in their respective categories for each period as follows: Lipper General and Insured Unleveraged Average, 1-year, 8 funds; 5-year, 7 funds; and 10-year, 7 funds; Lipper California Average, 1-year, 24 funds; 5-year, 23 funds; and 10-year, 12 funds; and Lipper New York Average, 1-year, 17 funds; 5-year, 16 fund; and 10-year, 6 funds.Lipper returns account for the effects of management fees and assume reinvestment of dividends, but do not reflect any applicable sales charges. The Lipper averages are not available for direct investment. |
Nuveen Investments 9
For the twelve months ended March 31, 2011, the total returns on net asset value (NAV) for NXP, NXQ and NXR underperformed the return for the Standard & Poor’s (S&P) National Municipal Bond Index. NXP and NXR exceeded the average return for the Lipper General and Insured Unleveraged Municipal Debt Funds Average, while NXQ trailed this measure. NXC underperformed the S&P California Municipal Bond Index and outperformed the Lipper California Municipal Debt Funds Average, while NXN outperformed both the S&P New York Municipal Bond Index and the Lipper New York Municipal Debt Funds Average.
Key management factors that influenced the Portfolios’ returns during this period included duration and yield curve positioning, credit exposure, and sector allocation. During this period, municipal bonds with intermediate maturities generally outperformed other maturity categories, with credits at the longest end of the yield curve posting the weakest returns. Overall, duration and yield curve positioning was a positive contributor to the performances of NXP, NXR, NXC, and NXN and a negative factor in NXQ. Among these five Portfolios, NXN was the most advantageously positioned in terms of duration and yield curve positioning, with greater exposure to the outperforming segments of the yield curve, especially bonds with maturities of two to eight years. This Portfolio also was substantially underweighted in the longest part of the curve that underperformed. NXQ, on the other hand, had the longest duration among the three national Portfolios, and its greater exposure to the underperforming long end of the curve hurt its performance for this period.
Credit exposure also played an important role in performance. During the market reversal of late 2010, as redemption activity in high-yield funds increased, lower-rated credits were negatively impacted. For the period as a whole, bonds rated BBB typically under-performed those rated AAA. These Portfolios tended to be overweighted in bonds rated BBB, which detracted from their performances, especially in NXQ and NXC. While this was offset to some degree in NXP, NXQ, NXR and NXN by overweights to bonds rated AAA, NXC was also negatively impacted by its underexposure to bonds rated AAA.
Holdings that generally made positive contributions to the Portfolios’ returns during this period included general obligation and other tax-supported bonds, housing credits and resource recovery bonds. All of these Portfolios were underexposed to tax-supported bonds, which detracted from their performance. For NXC, the predominant factor in its performance for this period was its underweighting in the tax-supported sector, especially California state GOs, relative to the California market. This underweighting was due to the fact that California state GOs comprise such a large portion (just over 25% as of March 2011) of the tax-supported sector in California that it is impossible to match this market weighting in our Portfolios. During this period, due in part to their scarcity and security provisions, California state GOs outperformed the general municipal market by a significant margin. Consequently, the more underweight a Portfolio was in these credits, the more it hurt that Portfolio’s performance.
10 Nuveen Investments
Based on its duration and quality characteristics, the health care segment of the California municipal bond market also performed well, and NXC had good exposure to this sector. In addition, pre-refunded bonds, which are often backed by U.S. Treasury securities, were among the stronger performers during this period, primarily due to their shorter effective maturities and higher credit quality. As of March 31, 2011, all three of the national Portfolios were overweighted in pre-refunded bonds, with NXP and NXR having the heaviest weightings.
In contrast, the industrial development revenue (IDR), transportation and education sectors turned in relatively weak performances, as did the health care component of the national and New York municipal markets. The three national Portfolios and NXN tended to be overweight in health care, which detracted from their performance.
Nuveen Investments 11
Dividend
and Share Price Information
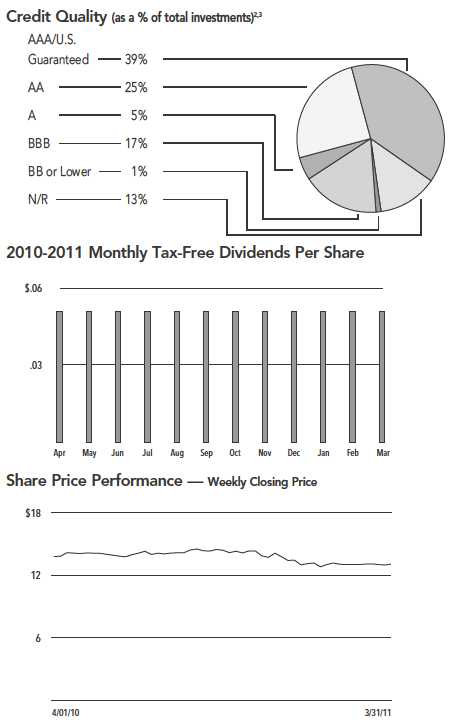
The monthly dividends of all five of the Portfolios remained stable throughout the twelve-month reporting period ended March 31, 2011.
Due to normal portfolio activity, shareholders of NXR received a long-term capital gains distribution of $0.0011 per share in December 2010.
All of these Portfolios seek to pay stable dividends at rates that reflect each Portfolio’s past results and projected future performance. During certain periods, each Portfolio may pay dividends at a rate that may be more or less than the amount of net investment income actually earned by the Portfolio during the period. If a Portfolio has cumulatively earned more than it has paid in dividends, it holds the excess in reserve as undistributed net investment income (UNII) as part of the Portfolio’s NAV. Conversely, if a Portfolio has cumulatively paid dividends in excess of its earnings, the excess constitutes negative UNII that is likewise reflected in the Portfolio’s NAV. Each Portfolio will, over time, pay all of its net investment income as dividends to shareholders. As of March 31, 2011, all of the Portfolios in this report had positive UNII balances for both tax purposes and financial reporting purposes.
SHARE REPURCHASES AND SHARE PRICE INFORMATION
Since the inception of the Portfolios’ repurchase program, the Portfolios’ have not repurchased any of their outstanding shares.
As of March 31, 2011, and during the twelve-month reporting period, the share prices of the Portfolios were trading at (+) premiums or (-) discounts to their NAVs as shown in the accompanying table.
| | | |
| | 3/31/11 | Twelve-Month Average |
Portfolio | (-) Discount | (+) Premium/(-) Discount |
NXP | (-)2.43% | (+)2.36% |
NXQ | (-)3.80% | (+)0.56% |
NXR | (-)3.55% | (+)0.64% |
NXC | (-)6.25% | (-)4.99% |
NXN | (-)4.74% | (-)2.13% |
12 Nuveen Investments
| | |
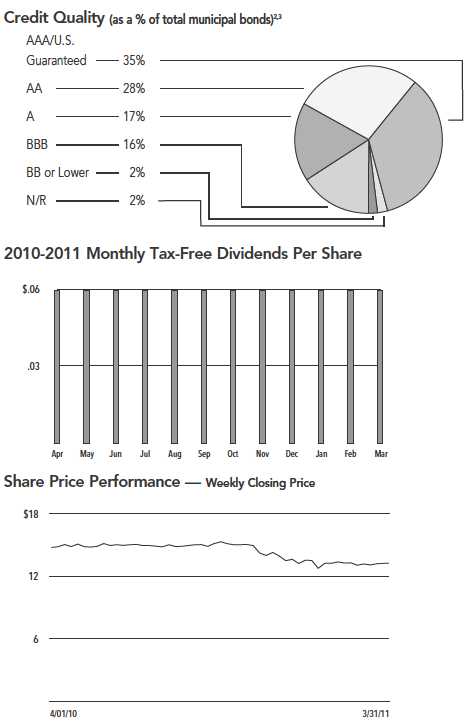
| NXP | Nuveen Select Tax-Free Income Portfolio |
| Performance | |
OVERVIEW | |
| | as of March 31, 2011 |
Fund Snapshot | | |
Share Price | | $13.25 |
Net Asset Value (NAV) | | $13.58 |
Premium/(Discount) to NAV | | -2.43% |
Market Yield | | 5.39% |
Taxable-Equivalent Yield1 | | 7.49% |
Net Assets ($000) | | $224,268 |
Average Annual Total Return | | |
(Inception 3/19/92) | | |
| | On Share Price | On NAV |
1-Year | -5.40% | 0.69% |
5-Year | 3.61% | 3.48% |
10-Year | 4.65% | 4.34% |
States3 | | |
(as a % of total municipal bonds) | | |
Illinois | | 15.1% |
Colorado | | 10.2% |
Texas | | 8.4% |
South Carolina | | 7.7% |
California | | 7.7% |
Florida | | 7.6% |
Indiana | | 6.7% |
Washington | | 6.6% |
Nevada | | 5.2% |
New Jersey | | 2.7% |
New Mexico | | 2.2% |
Oklahoma | | 2.2% |
Alaska | | 1.9% |
Wisconsin | | 1.9% |
Other | | 13.9% |
Portfolio Composition3 | | |
(as a % of total investments) | | |
U.S. Guaranteed | | 29.5% |
Health Care | | 24.5% |
Transportation | | 10.6% |
Tax Obligation/Limited | | 9.9% |
Utilities | | 7.5% |
Tax Obligation/General | | 6.1% |
Consumer Staples | | 5.9% |
Other | | 6.0% |
| | Refer to the Glossary of Terms Used in this Report for further definition of the terms used within this Fund’s Performance Overview page. |
| 1 | Taxable-Equivalent Yield represents the yield that must be earned on a fully taxable investment in order to equal the yield of the Fund on an after-tax basis. It is based on a federal income tax rate of 28%. When comparing this Fund to investments that generate qualified dividend income, the Taxable-Equivalent Yield is lower. |
| 2 | Ratings shown are the highest of Standard & Poor’s Group, Moody’s Investor Service, Inc. or Fitch, Inc. AAA includes bonds with an implied AAA rating since they are backed by U.S. Government or agency securities. AAA, AA, A and BBB ratings are investment grade; BB, B, CCC, CC, C and D ratings are below-investment grade. Holdings designated N/R are not rated by any of these national rating agencies. |
| 3 | Holdings are subject to change. |
Nuveen Investments 13
| | |
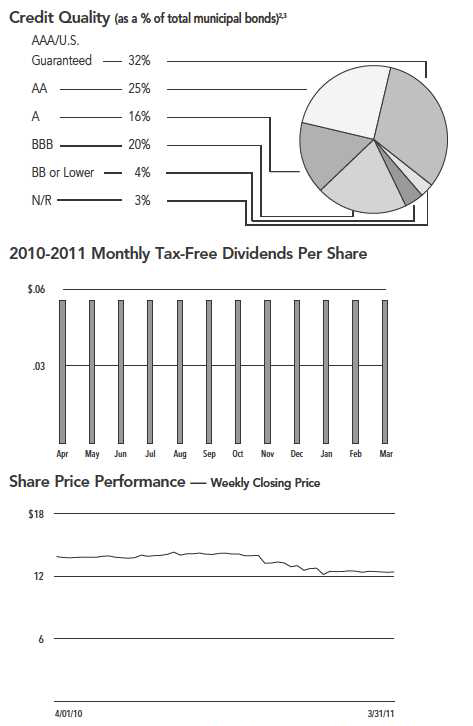
NXQ | Nuveen Select Tax-Free |
| | Income Portfolio 2 |
Performance | |
OVERVIEW | |
| | as of March 31, 2011 |
Fund Snapshot | | |
Share Price | | $12.40 |
Net Asset Value (NAV) | | $12.89 |
Premium/(Discount) to NAV | | -3.80% |
Market Yield | | 5.37% |
Taxable-Equivalent Yield1 | | 7.46% |
Net Assets ($000) | | $228,016 |
Average Annual Total Return | | |
(Inception 5/21/92) | | |
| | On Share Price | On NAV |
1-Year | -5.56% | 0.13% |
5-Year | 3.43% | 2.53% |
10-Year | 4.13% | 3.75% |
States3 | | |
(as a % of total municipal bonds) | | |
Illinois | | 15.3% |
Texas | | 11.8% |
Colorado | | 10.6% |
California | | 8.0% |
Indiana | | 6.1% |
South Carolina | | 5.1% |
New Mexico | | 3.1% |
New York | | 3.0% |
Washington | | 3.0% |
Iowa | | 3.0% |
Massachusetts | | 2.5% |
Nevada | | 2.5% |
Florida | | 2.4% |
Louisiana | | 2.4% |
Pennsylvania | | 2.3% |
Rhode Island | | 2.2% |
New Jersey | | 1.9% |
Other | | 14.8% |
| | | |
Portfolio Composition3 | | |
(as a % of total investments) | | |
U.S. Guaranteed | | 22.9% |
Health Care | | 21.3% |
Tax Obligation/Limited | | 12.3% |
Transportation | | 12.0% |
Utilities | | 8.0% |
Tax Obligation/General | | 6.4% |
Consumer Staples | | 5.7% |
Other | | 11.4% |
| | Refer to the Glossary of Terms Used in this Report for further definition of the terms used within this Fund’s Performance Overview page. |
| 1 | Taxable-Equivalent Yield represents the yield that must be earned on a fully taxable investment in order to equal the yield of the Fund on an after-tax basis. It is based on a federal income tax rate of 28%. When comparing this Fund to investments that generate qualified dividend income, the Taxable-Equivalent Yield is lower. |
| 2 | Ratings shown are the highest of Standard & Poor’s Group, Moody’s Investor Service, Inc. or Fitch, Inc. AAA includes bonds with an implied AAA rating since they are backed by U.S. Government or agency securities. AAA, AA, A and BBB ratings are investment grade; BB, B, CCC, CC, C and D ratings are below-investment grade. Holdings designated N/R are not rated by any of these national rating agencies. |
| 3 | Holdings are subject to change. |
14 Nuveen Investments
| | |
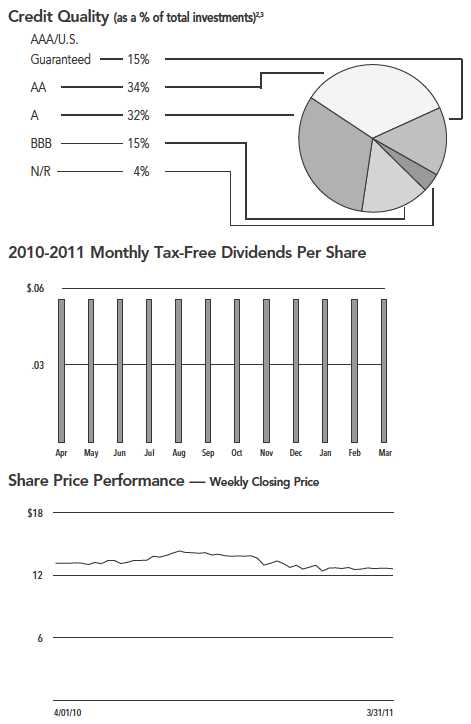
| NXR | Nuveen Select Tax-Free Income Portfolio 3 |
| Performance | |
OVERVIEW | |
| | as of March 31, 2011 |
Fund Snapshot | | |
Share Price | | $13.03 |
Net Asset Value (NAV) | | $13.51 |
Premium/(Discount) to NAV | | -3.55% |
Market Yield | | 4.93% |
Taxable-Equivalent Yield1 | | 6.85% |
Net Assets ($000) | | $175,846 |
| | | |
Average Annual Total Return | | |
(Inception 7/24/92) | | |
| | On Share Price | On NAV |
1-Year | -3.98% | 0.62% |
5-Year | 4.14% | 3.52% |
10-Year | 4.75% | 4.26% |
| | | |
States4 | | |
(as a % of total municipal bonds) | | |
Illinois | | 19.1% |
California | | 10.3% |
Texas | | 10.2% |
Colorado | | 7.0% |
Indiana | | 6.2% |
Iowa | | 5.3% |
North Carolina | | 4.4% |
Nevada | | 3.7% |
Florida | | 3.4% |
South Carolina | | 3.3% |
New York | | 3.1% |
Pennsylvania | | 2.9% |
New Mexico | | 2.8% |
Michigan | | 2.5% |
Nebraska | | 2.0% |
Other | | 13.8% |
| | | |
Portfolio Composition4 | | |
(as a % of total investments) | | |
U.S. Guaranteed | | 25.0% |
Health Care | | 20.5% |
Tax Obligation/Limited | | 13.8% |
Utilities | | 13.5% |
Transportation | | 7.6% |
Tax Obligation/General | | 4.9% |
Other | | 14.7% |

| | Refer to the Glossary of Terms Used in this Report for further definition of the terms used within this Fund’s Performance Overview page. |
| 1 | Taxable-Equivalent Yield represents the yield that must be earned on a fully taxable investment in order to equal the yield of the Fund on an after-tax basis. It is based on a federal income tax rate of 28%. When comparing this Fund to investments that generate qualified dividend income, the Taxable-Equivalent Yield is lower. |
| 2 | The Fund paid shareholders a capital gains distribution in December 2010 of $0.0011 per share. |
| 3 | Ratings shown are the highest of Standard & Poor’s Group, Moody’s Investor Service, Inc. or Fitch, Inc. AAA includes bonds with an implied AAA rating since they are backed by U.S. Government or agency securities. AAA, AA, A and BBB ratings are investment grade; BB, B, CCC, CC, C and D ratings are below-investment grade. Holdings designated N/R are not rated by any of these national rating agencies. |
| 4 | Holdings are subject to change. |
Nuveen Investments 15
| | |
NXC | Nuveen California |
| | Select Tax-Free |
Performance | Income Portfolio |
OVERVIEW | |
| | as of March 31, 2011 |
Fund Snapshot | | |
Share Price | | $12.59 |
Net Asset Value (NAV) | | $13.43 |
Premium/(Discount) to NAV | | -6.25% |
Market Yield | | 5.29% |
Taxable-Equivalent Yield1 | | 8.10% |
Net Assets ($000) | | $84,199 |
| | | |
Average Annual Total Return | | |
(Inception 6/19/92) | | |
| | On Share Price | On NAV |
1-Year | 1.18% | 0.83% |
5-Year | 3.46% | 3.11% |
10-Year | 4.24% | 4.07% |
| | | |
Portfolio Composition3 | | |
(as a % of total investments) | | |
Tax Obligation/General | | 28.0% |
Tax Obligation/Limited | | 19.0% |
Health Care | | 14.0% |
Education and Civic Organizations | | 9.5% |
Utilities | | 6.5% |
Transportation | | 5.6% |
U.S. Guaranteed | | 5.3% |
Other | | 12.1% |
| | Refer to the Glossary of Terms Used in this Report for further definition of the terms used within this Fund’s Performance Overview page. |
| 1 | Taxable-Equivalent Yield represents the yield that must be earned on a fully taxable investment in order to equal the yield of the Fund on an after-tax basis. It is based on a combined federal and state income tax rate of 34.7%. When comparing this Fund to investments that generate qualified dividend income, the Taxable-Equivalent Yield is lower. |
| 2 | Ratings shown are the highest of Standard & Poor’s Group, Moody’s Investor Service, Inc. or Fitch, Inc. AAA includes bonds with an implied AAA rating since they are backed by U.S. Government or agency securities. AAA, AA, A and BBB ratings are investment grade; BB, B, CCC, CC, C and D ratings are below-investment grade. Holdings designated N/R are not rated by any of these national rating agencies. |
| 3 | Holdings are subject to change. |
16 Nuveen Investments
| | |
| NXN | Nuveen New York
Select Tax-Free |
| Performance | Income Portfolio |
OVERVIEW | |
| | as of March 31, 2011 |
Fund Snapshot | | |
Share Price | | $13.06 |
Net Asset Value (NAV) | | $13.71 |
Premium/(Discount) to NAV | | -4.74% |
Market Yield | | 4.69% |
Taxable-Equivalent Yield1 | | 6.99% |
Net Assets ($000) | | $53,705 |
| | | |
Average Annual Total Return | | |
(Inception 6/19/92) | | |
| | On Share Price | On NAV |
1-Year | -1.08% | 1.84% |
5-Year | 4.24% | 3.83% |
10-Year | 4.34% | 4.31% |
| | | |
Portfolio Composition3 | | |
(as a % of total investments) | | |
Tax Obligation/Limited | | 18.0% |
Health Care | | 14.6% |
Water and Sewer | | 12.8% |
Long-Term Care | | 11.1% |
Housing/Single Family | | 8.2% |
Education and Civic Organizations | | 8.1% |
Tax Obligation/General | | 7.4% |
Housing/Multifamily | | 6.0% |
Other | | 13.8% |
| | Refer to the Glossary of Terms Used in this Report for further definition of the terms used within this Fund’s Performance Overview page. |
| 1 | Taxable-Equivalent Yield represents the yield that must be earned on a fully taxable investment in order to equal the yield of the Fund on an after-tax basis. It is based on a combined federal and state income tax rate of 32.9%. When comparing this Fund to investments that generate qualified dividend income, the Taxable-Equivalent Yield is lower. |
| 2 | Ratings shown are the highest of Standard & Poor’s Group, Moody’s Investor Service, Inc. or Fitch, Inc. AAA includes bonds with an implied AAA rating since they are backed by U.S. Government or agency securities. AAA, AA, A and BBB ratings are investment grade; BB, B, CCC, CC, C and D ratings are below-investment grade. Holdings designated N/R are not rated by any of these national rating agencies. |
| 3 | Holdings are subject to change. |
Nuveen Investments 17
Report of Independent
Registered Public Accounting Firm
The Board of Trustees and Shareholders
Nuveen Select Tax-Free Income Portfolio
Nuveen Select Tax-Free Income Portfolio 2
Nuveen Select Tax-Free Income Portfolio 3
Nuveen California Select Tax-Free Income Portfolio
Nuveen New York Select Tax-Free Income Portfolio
We have audited the accompanying statements of assets and liabilities, including the portfolios of investments, of Nuveen Select Tax-Free Income Portfolio, Nuveen Select Tax-Free Income Portfolio 2, Nuveen Select Tax-Free Income Portfolio 3, Nuveen California Select Tax-Free Income Portfolio, and Nuveen New York Select Tax-Free Income Portfolio (the “Funds”) as of March 31, 2011, and the related statements of operations for the year then ended, the statements of changes in net assets for each of the two years in the period then ended, and the financial highlights for each of the five years in the period then ended. These financial statements and financial highlights are the responsibility of the Funds’ management. Our responsibility is to express an opinion on these financial statements and financial highlights based on our audits.
We conducted our audits in accordance with the standards of the Public Company Accounting Oversight Board (United States). Those standards require that we plan and perform the audits to obtain reasonable assurance about whether the financial statements and financial highlights are free of material misstatement. We were not engaged to perform an audit of the Funds’ internal control over financial reporting. Our audits included consideration of internal control over financial reporting as a basis for designing audit procedures that are appropriate in the circumstances, but not for the purpose of expressing an opinion on the effectiveness of the Funds’ internal control over financial reporting. Accordingly, we express no such opinion. An audit also includes examining, on a test basis, evidence supporting the amounts and disclosures in the financial statements and financial highlights, assessing the accounting principles used and significant estimates made by management, and evaluating the overall financial statement presentation. Our procedures included confirmation of securities owned as of March 31, 2011, by correspondence with the custodian and brokers or by other appropriate auditing procedures where replies from brokers were not received. We believe that our audits provide a reasonable basis for our opinion.
In our opinion, the financial statements and financial highlights referred to above present fairly, in all material respects, the financial positions of Nuveen Select Tax-Free Income Portfolio, Nuveen Select Tax-Free Income Portfolio 2, Nuveen Select Tax-Free Income Portfolio 3, Nuveen California Select Tax-Free Income Portfolio, and Nuveen New York Select Tax-Free Income Portfolio at March 31, 2011, and the results of their operations for the year then ended, the changes in their net assets for each of the two years in the period then ended, and the financial highlights for each of the five years in the period then ended in conformity with U.S. generally accepted accounting principles.
Chicago, Illinois
May 25, 2011
18 Nuveen Investments
| | |
| | Nuveen Select Tax-Free Income Portfolio |
NXP | Portfolio of Investments |
| | March 31, 2011 |
| | | | | | |
Principal | | | Optional Call | | |
Amount (000) | | Description (1) | Provisions (2) | Ratings (3) | Value |
| | | Municipal Bonds – 98.7% | | | |
| | | Alaska – 1.9% | | | |
$ 2,475 | | Alaska Municipal Bond Bank Authority, General Obligation Bonds, Series 2003E, 5.250%, 12/01/23 | 12/13 at 100.00 | A+ (4) | $ 2,768,832 |
| | | (Pre-refunded 12/01/13) – NPFG Insured | | | |
2,635 | | Northern Tobacco Securitization Corporation, Alaska, Tobacco Settlement Asset-Backed Bonds, | 6/14 at 100.00 | Baa3 | 1,557,338 |
| | | Series 2006A, 5.000%, 6/01/46 | | | |
5,110 | | Total Alaska | | | 4,326,170 |
| | | Arizona – 0.2% | | | |
625 | | Pima County Industrial Development Authority, Arizona, Revenue Bonds, Tucson Electric Power | 10/20 at 100.00 | BBB– | 541,275 |
| | | Company, Series 2010A, 5.250%, 10/01/40 | | | |
| | | Arkansas – 0.3% | | | |
5,915 | | Arkansas Development Finance Authority, Tobacco Settlement Revenue Bonds, Arkansas Cancer | No Opt. Call | Aa2 | 702,170 |
| | | Research Center Project, Series 2006, 0.000%, 7/01/46 – AMBAC Insured | | | |
| | | California – 7.6% | | | |
2,000 | | Alameda Corridor Transportation Authority, California, Subordinate Lien Revenue Bonds, Series | 10/17 at 100.00 | A– | 1,595,520 |
| | | 2004A, 0.000%, 10/01/25 – AMBAC Insured | | | |
3,325 | | California Department of Water Resources, Power Supply Revenue Bonds, Series 2002A, 6.000%, | 5/12 at 101.00 | AA– (4) | 3,560,377 |
| | | 5/01/14 (Pre-refunded 5/01/12) | | | |
1,000 | | California Statewide Community Development Authority, Revenue Bonds, Methodist Hospital | 8/19 at 100.00 | Aa2 | 1,083,960 |
| | | Project, Series 2009, 6.750%, 2/01/38 | | | |
2,645 | | Cypress Elementary School District, San Bernardino County, California, General Obligation | No Opt. Call | AA+ | 643,238 |
| | | Bonds, Series 2009A, 0.000%, 5/01/34 – AGM Insured | | | |
3,000 | | Golden State Tobacco Securitization Corporation, California, Tobacco Settlement Asset-Backed | 6/13 at 100.00 | AAA | 3,379,500 |
| | | Bonds, Series 2003A-1, 6.750%, 6/01/39 (Pre-refunded 6/01/13) | | | |
2,350 | | Golden Valley Unified School District, Madera County, California, General Obligation Bonds, | 8/17 at 56.07 | AA+ | 649,376 |
| | | Election 2006 Series 2007A, 0.000%, 8/01/29 – AGM Insured | | | |
3,030 | | Grossmont Union High School District, San Diego County, California, General Obligation Bonds, | No Opt. Call | Aa2 | 1,226,211 |
| | | Series 2006, 0.000%, 8/01/25 – NPFG Insured | | | |
1,130 | | Los Angeles Department of Water and Power, California, Waterworks Revenue Refunding Bonds, | 7/11 at 100.00 | AA | 1,096,123 |
| | | Series 2001A, 5.125%, 7/01/41 – FGIC Insured | | | |
365 | | Los Angeles, California, Parking System Revenue Bonds, Series 1999A, 5.250%, 5/01/29 – | 5/11 at 100.00 | A+ | 362,040 |
| | | AMBAC Insured | | | |
1,000 | | Moreno Valley Unified School District, Riverside County, California, General Obligation Bonds, | No Opt. Call | AA– | 437,780 |
| | | Series 2007, 0.000%, 8/01/23 – NPFG Insured | | | |
590 | | Palomar Pomerado Health Care District, California, Certificates of Participation, Series 2009, | 11/19 at 100.00 | Baa3 | 561,373 |
| | | 6.750%, 11/01/39 | | | |
1,700 | | Placentia-Yorba Linda Unified School District, Orange County, California, Certificates of | No Opt. Call | A+ | 304,946 |
| | | Participation, Series 2006, 0.000%, 10/01/34 – FGIC Insured | | | |
2,930 | | San Joaquin Hills Transportation Corridor Agency, Orange County, California, Toll Road Revenue | No Opt. Call | Baa1 | 724,325 |
| | | Refunding Bonds, Series 1997A, 0.000%, 1/15/27 – NPFG Insured | | | |
2,110 | | Sierra Sands Unified School District, Kern County, California, General Obligation Bonds, | No Opt. Call | Aa3 | 634,709 |
| | | Election of 2006, Series 2006A, 0.000%, 11/01/28 – FGIC Insured | | | |
750 | | Tobacco Securitization Authority of Northern California, Tobacco Settlement Asset-Backed | 6/15 at 100.00 | Baa3 | 466,860 |
| | | Bonds, Series 2005A-1, 5.500%, 6/01/45 | | | |
1,150 | | Woodside Elementary School District, San Mateo County, California, General Obligation Bonds, | No Opt. Call | AAA | 318,355 |
| | | Series 2007, 0.000%, 10/01/30 – AMBAC Insured | | | |
29,075 | | Total California | | | 17,044,693 |
Nuveen Investments 19
| | |
| | Nuveen Select Tax-Free Income Portfolio (continued) |
NXP | Portfolio of Investments March 31, 2011 |
| | | | | | |
Principal | | | Optional Call | | |
Amount (000) | | Description (1) | Provisions (2) | Ratings (3) | Value |
| | | Colorado – 10.1% | | | |
$ 1,000 | | Colorado Health Facilities Authority, Health Facilities Revenue Bonds, Sisters of Charity of | No Opt. Call | AA | $ 910,690 |
| | | Leavenworth Health Services Corporation, Series 2010A, 5.000%, 1/01/40 | | | |
| | | Colorado Health Facilities Authority, Revenue Bonds, Catholic Health Initiatives, Series 2002A: | | | |
1,700 | | 5.500%, 3/01/22 (Pre-refunded 3/02/12) | 3/12 at 100.00 | AA (4) | 1,773,321 |
690 | | 5.500%, 3/01/22 (Pre-refunded 3/01/12) | 3/12 at 100.00 | Aa2 (4) | 721,457 |
5,295 | | Denver City and County, Colorado, Airport System Revenue Bonds, Series 1991D, 7.750%, 11/15/13 | No Opt. Call | A+ | 5,716,164 |
| | | (Alternative Minimum Tax) | | | |
5,000 | | Denver City and County, Colorado, Airport System Revenue Refunding Bonds, Series 2001A, | 11/11 at 100.00 | A+ | 5,121,250 |
| | | 5.625%, 11/15/17 – FGIC Insured (Alternative Minimum Tax) | | | |
3,000 | | Denver Convention Center Hotel Authority, Colorado, Senior Revenue Bonds, Convention Center | 12/13 at 100.00 | N/R (4) | 3,304,500 |
| | | Hotel, Series 2003A, 5.000%, 12/01/23 (Pre-refunded 12/01/13) – SYNCORA GTY Insured | | | |
500 | | Denver, Colorado, Airport System Revenue Refunding Bonds, Series 2003B, 5.000%, 11/15/33 – | 11/13 at 100.00 | A+ | 469,065 |
| | | SYNCORA GTY Insured | | | |
12,500 | | E-470 Public Highway Authority, Colorado, Toll Revenue Bonds, Series 2006B, 0.000%, 9/01/38 – | 9/26 at 54.77 | Baa1 | 1,397,250 |
| | | NPFG Insured | | | |
3,160 | | Northwest Parkway Public Highway Authority, Colorado, Revenue Bonds, Senior Series 2001A, | 6/11 at 102.00 | N/R (4) | 3,256,506 |
| | | 5.500%, 6/15/20 (Pre-refunded 6/15/11) – AMBAC Insured | | | |
32,845 | | Total Colorado | | | 22,670,203 |
| | | Florida – 7.5% | | | |
2,000 | | Halifax Hospital Medical Center, Florida, Revenue Bonds, Series 2006, 5.375%, 6/01/46 | 6/16 at 100.00 | A– | 1,746,640 |
5,000 | | Jacksonville Health Facilities Authority, Florida, Revenue Bonds, Ascension Health, Series | 11/12 at 101.00 | Aa1 | 4,923,450 |
| | | 2002A, 5.250%, 11/15/32 | | | |
10,000 | | JEA St. John’s River Power Park System, Florida, Revenue Refunding Bonds, Issue 2, Series | 10/11 at 100.00 | Aa2 | 10,190,200 |
| | | 2002-17, 5.000%, 10/01/17 | | | |
17,000 | | Total Florida | | | 16,860,290 |
| | | Georgia – 0.9% | | | |
2,000 | | Franklin County Industrial Building Authority, Georgia, Revenue Bonds, Ty Cobb Regional | 12/20 at 100.00 | N/R | 1,942,960 |
| | | Medical Center Project, Series 2010, 8.125%, 12/01/45 | | | |
| | | Illinois – 14.9% | | | |
1,965 | | Board of Trustees of Southern Illinois University, Housing and Auxiliary Facilities System | No Opt. Call | A2 | 1,205,095 |
| | | Revenue Bonds, Series 1999A, 0.000%, 4/01/20 – NPFG Insured | | | |
2,600 | | Chicago Heights, Illinois, General Obligation Corporate Purpose Bonds, Series 1993, 5.650%, | 6/11 at 100.00 | BBB | 2,620,618 |
| | | 12/01/17 – FGIC Insured | | | |
195 | | DuPage County Community School District 200, Wheaton, Illinois, General Obligation Bonds, | 11/13 at 100.00 | Aa3 | 207,287 |
| | | Series 2003B, 5.250%, 11/01/20 – AGM Insured | | | |
805 | | DuPage County Community School District 200, Wheaton, Illinois, General Obligation Bonds, | 11/13 at 100.00 | Aa3 (4) | 896,512 |
| | | Series 2003B, 5.250%, 11/01/20 (Pre-refunded 11/01/13) – AGM Insured | | | |
600 | | Illinois Educational Facilities Authority, Student Housing Revenue Bonds, Educational | 5/12 at 101.00 | Aaa | 642,180 |
| | | Advancement Foundation Fund, University Center Project, Series 2002, 6.000%, 5/01/22 | | | |
| | | (Pre-refunded 5/01/12) | | | |
1,050 | | Illinois Finance Authority, Revenue Bonds, Loyola University of Chicago, Tender Option Bond | No Opt. Call | Aa1 | 900,627 |
| | | Trust 1137, 9.166%, 7/01/15 (IF) | | | |
4,000 | | Illinois Finance Authority, Revenue Bonds, Northwestern Memorial Hospital, Series 2004A, | 8/14 at 100.00 | N/R (4) | 4,570,280 |
| | | 5.500%, 8/15/43 (Pre-refunded 8/15/14) | | | |
1,000 | | Illinois Finance Authority, Revenue Bonds, Silver Cross Hospital and Medical Centers, Series | 8/19 at 100.00 | BBB | 984,750 |
| | | 2009, 6.875%, 8/15/38 | | | |
2,100 | | Illinois Finance Authority, Revenue Refunding Bonds, Silver Cross Hospital and Medical | 8/18 at 100.00 | BBB | 1,778,322 |
| | | Centers, Series 2008A, 5.500%, 8/15/30 | | | |
1,320 | | Illinois Health Facilities Authority, Revenue Bonds, Decatur Memorial Hospital, Series 2001, | 10/11 at 100.00 | A | 1,329,768 |
| | | 5.600%, 10/01/16 | | | |
2,950 | | Illinois Health Facilities Authority, Revenue Bonds, Lake Forest Hospital, Series 2002A, | 7/12 at 100.00 | AA+ | 3,060,566 |
| | | 6.000%, 7/01/17 | | | |
20 Nuveen Investments
| | | | | | |
Principal | | | Optional Call | | |
Amount (000) | | Description (1) | Provisions (2) | Ratings (3) | Value |
| | | Illinois (continued) | | | |
$ 2,275 | | Illinois Health Facilities Authority, Revenue Refunding Bonds, Elmhurst Memorial Healthcare, | 1/13 at 100.00 | Baa1 | $ 2,319,954 |
| | | Series 2002, 6.250%, 1/01/17 | | | |
400 | | Illinois Health Facilities Authority, Revenue Refunding Bonds, Rockford Health System, Series | 8/11 at 100.00 | N/R | 346,196 |
| | | 1997, 5.000%, 8/15/21 – AMBAC Insured | | | |
3,125 | | Metropolitan Pier and Exposition Authority, Illinois, Revenue Bonds, McCormick Place Expansion | No Opt. Call | A2 | 2,395,656 |
| | | Project, Series 1993A, 0.000%, 6/15/17 – FGIC Insured | | | |
| | | Metropolitan Pier and Exposition Authority, Illinois, Revenue Bonds, McCormick Place Expansion | | | |
| | | Project, Series 2002A: | | | |
1,500 | | 0.000%, 12/15/29 – NPFG Insured | No Opt. Call | AAA | 477,840 |
810 | | 0.000%, 6/15/30 – NPFG Insured | No Opt. Call | AAA | 245,649 |
5,000 | | 0.000%, 12/15/36 – NPFG Insured | No Opt. Call | AAA | 903,000 |
5,000 | | Metropolitan Pier and Exposition Authority, Illinois, Revenue Refunding Bonds, McCormick Place | 6/12 at 101.00 | AAA | 5,085,650 |
| | | Expansion Project, Series 2002B, 5.000%, 6/15/21 – NPFG Insured | | | |
1,300 | | Schaumburg, Illinois, General Obligation Bonds, Series 2004B, 5.250%, 12/01/34 – FGIC Insured | 12/14 at 100.00 | Aaa | 1,305,057 |
| | | Yorkville, Illinois, General Obligation Debt Certificates, Series 2003: | | | |
1,000 | | 5.000%, 12/15/19 (Pre-refunded 12/15/11) – RAAI Insured | 12/11 at 100.00 | N/R (4) | 1,033,160 |
1,000 | | 5.000%, 12/15/20 (Pre-refunded 12/15/11) – RAAI Insured | 12/11 at 100.00 | N/R (4) | 1,033,160 |
39,995 | | Total Illinois | | | 33,341,327 |
| | | Indiana – 6.6% | | | |
1,000 | | Franklin Community Multi-School Building Corporation, Marion County, Indiana, First Mortgage | 7/14 at 100.00 | A (4) | 1,129,740 |
| | | Revenue Bonds, Series 2004, 5.000%, 7/15/22 (Pre-refunded 7/15/14) – FGIC Insured | | | |
1,525 | | Indiana Health Facility Financing Authority, Hospital Revenue Refunding Bonds, Columbus | No Opt. Call | AA+ | 1,697,706 |
| | | Regional Hospital, Series 1993, 7.000%, 8/15/15 – AGM Insured | | | |
1,000 | | Indiana Health Facility Financing Authority, Revenue Bonds, Community Foundation of Northwest | 3/17 at 100.00 | BBB+ | 887,940 |
| | | Indiana, Series 2007, 5.500%, 3/01/37 | | | |
9,855 | | Indianapolis Local Public Improvement Bond Bank, Indiana, Waterworks Project, Series 2002A, | 7/12 at 100.00 | AAA | 10,431,813 |
| | | 5.125%, 7/01/21 (Pre-refunded 7/01/12) – NPFG Insured | | | |
750 | | West Clark 2000 School Building Corporation, Clark County, Indiana, First Mortgage Bonds, | 1/15 at 100.00 | AA+ | 764,663 |
| | | Series 2005, 5.000%, 7/15/22 – NPFG Insured | | | |
14,130 | | Total Indiana | | | 14,911,862 |
| | | Iowa – 1.7% | | | |
1,000 | | Iowa Tobacco Settlement Authority, Asset Backed Settlement Revenue Bonds, Series 2005C, | 6/15 at 100.00 | BBB | 714,090 |
| | | 5.375%, 6/01/38 | | | |
4,000 | | Iowa Tobacco Settlement Authority, Tobacco Asset-Backed Revenue Bonds, Series 2005B, | 6/17 at 100.00 | BBB | 3,181,320 |
| | | 5.600%, 6/01/34 | | | |
5,000 | | Total Iowa | | | 3,895,410 |
| | | Kansas – 0.5% | | | |
500 | | Lawrence, Kansas, Hospital Revenue Bonds, Lawrence Memorial Hospital, Refunding Series 2006, | 7/16 at 100.00 | A2 | 434,280 |
| | | 4.875%, 7/01/36 | | | |
750 | | Wamego, Kansas, Pollution Control Revenue Bonds, Kansas Gas and Electric Company, Series 2004, | 6/14 at 100.00 | BBB+ | 739,433 |
| | | 5.300%, 6/01/31 – NPFG Insured | | | |
1,250 | | Total Kansas | | | 1,173,713 |
| | | Louisiana – 1.1% | | | |
2,735 | | Tobacco Settlement Financing Corporation, Louisiana, Tobacco Settlement Asset-Backed Bonds, | 5/11 at 101.00 | A– | 2,502,197 |
| | | Series 2001B, 5.875%, 5/15/39 | | | |
Nuveen Investments 21
| | |
| | Nuveen Select Tax-Free Income Portfolio (continued) |
NXP | Portfolio of Investments March 31, 2011 |
| | | | | | |
Principal | | | Optional Call | | |
Amount (000) | | Description (1) | Provisions (2) | Ratings (3) | Value |
| | | Massachusetts – 1.3% | | | |
$ 500 | | Massachusetts Health and Educational Facilities Authority, Revenue Bonds, CareGroup Inc., | 7/18 at 100.00 | A3 | $ 451,655 |
| | | Series 2008E-1 & 2, 5.000%, 7/01/28 | | | |
20 | | Massachusetts Health and Educational Facilities Authority, Revenue Bonds, Partners HealthCare | 7/11 at 101.00 | AA | 20,407 |
| | | System Inc., Series 2001C, 6.000%, 7/01/17 | | | |
480 | | Massachusetts Health and Educational Facilities Authority, Revenue Bonds, Partners HealthCare | 7/11 at 101.00 | AAA | 491,659 |
| | | System Inc., Series 2001C, 6.000%, 7/01/17 (Pre-refunded 7/01/11) | | | |
1,955 | | Massachusetts Housing Finance Agency, Housing Bonds, Series 2009F, 5.700%, 6/01/40 | 12/18 at 100.00 | AA– | 1,874,493 |
2,955 | | Total Massachusetts | | | 2,838,214 |
| | | Michigan – 1.3% | | | |
2,900 | | Michigan State Hospital Finance Authority, Hospital Revenue Refunding Bonds, Trinity Health | 12/12 at 100.00 | AA | 2,812,478 |
| | | Credit Group, Series 2002C, 5.375%, 12/01/30 | | | |
| | | Missouri – 0.8% | | | |
| | | Kansas City Municipal Assistance Corporation, Missouri, Leasehold Revenue Bonds, | | | |
| | | Series 2004B-1: | | | |
500 | | 0.000%, 4/15/23 – AMBAC Insured | No Opt. Call | AA+ | 277,955 |
5,000 | | 0.000%, 4/15/30 – AMBAC Insured | No Opt. Call | AA– | 1,537,800 |
5,500 | | Total Missouri | | | 1,815,755 |
| | | Nevada – 5.1% | | | |
2,500 | | Clark County, Nevada, Motor Vehicle Fuel Tax Highway Improvement Revenue Bonds, Series 2003, | 7/13 at 100.00 | AA– | 2,528,800 |
| | | 5.000%, 7/01/23 – AMBAC Insured | | | |
1,000 | | Clark County, Nevada, Passenger Facility Charge Revenue Bonds, Las Vegas-McCarran | 1/20 at 100.00 | Aa3 | 902,390 |
| | | International Airport, Series 2010A, 5.250%, 7/01/42 | | | |
| | | Director of Nevada State Department of Business and Industry, Revenue Bonds, Las Vegas | | | |
| | | Monorail Project, First Tier, Series 2000: | | | |
2,360 | | 0.000%, 1/01/21 – AMBAC Insured | No Opt. Call | D | 293,796 |
4,070 | | 0.000%, 1/01/22 – AMBAC Insured | No Opt. Call | D | 474,684 |
6,025 | | 5.375%, 1/01/40 – AMBAC Insured (5) | 7/11 at 100.00 | D | 1,342,310 |
1,500 | | Las Vegas Redevelopment Agency, Nevada, Tax Increment Revenue Bonds, Series 2009A, | 6/19 at 100.00 | A | 1,659,210 |
| | | 8.000%, 6/15/30 | | | |
1,515 | | Reno, Nevada, Capital Improvement Revenue Bonds, Series 2002, 5.500%, 6/01/21 – FGIC Insured | 6/12 at 100.00 | A | 1,523,575 |
2,555 | | Reno, Nevada, Capital Improvement Revenue Bonds, Series 2002, 5.500%, 6/01/21 (Pre-refunded | 6/12 at 100.00 | A3 (4) | 2,704,672 |
| | | 6/01/12) – FGIC Insured | | | |
21,525 | | Total Nevada | | | 11,429,437 |
| | | New Hampshire – 0.2% | | | |
335 | | New Hampshire Housing Finance Authority, Single Family Mortgage Acquisition Bonds, Series | 5/11 at 100.00 | Aa2 | 341,898 |
| | | 2001A, 5.600%, 7/01/21 (Alternative Minimum Tax) | | | |
| | | New Jersey – 2.6% | | | |
2,500 | | New Jersey Health Care Facilities Financing Authority, Revenue Bonds, Somerset Medical Center, | 7/13 at 100.00 | Ba2 | 2,132,150 |
| | | Series 2003, 5.500%, 7/01/23 | | | |
| | | Tobacco Settlement Financing Corporation, New Jersey, Tobacco Settlement Asset-Backed Bonds, | | | |
| | | Series 2002: | | | |
1,175 | | 5.750%, 6/01/32 (Pre-refunded 6/01/12) | 6/12 at 100.00 | AAA | 1,227,252 |
1,000 | | 6.000%, 6/01/37 (Pre-refunded 6/01/12) | 6/12 at 100.00 | AAA | 1,064,760 |
2,500 | | Tobacco Settlement Financing Corporation, New Jersey, Tobacco Settlement Asset-Backed Bonds, | 6/17 at 100.00 | Baa3 | 1,514,425 |
| | | Series 2007-1A, 5.000%, 6/01/41 | | | |
7,175 | | Total New Jersey | | | 5,938,587 |
| | | New Mexico – 2.1% | | | |
1,000 | | New Mexico Mortgage Finance Authority, Multifamily Housing Revenue Bonds, St Anthony, Series | 9/17 at 100.00 | N/R | 810,050 |
| | | 2007A, 5.250%, 9/01/42 (Alternative Minimum Tax) | | | |
4,000 | | University of New Mexico, FHA-Insured Mortgage Hospital Revenue Bonds, Series 2004, 4.625%, | 7/14 at 100.00 | AA+ | 4,001,520 |
| | | 7/01/25 – AGM Insured | | | |
5,000 | | Total New Mexico | | | 4,811,570 |
22 Nuveen Investments
| | | | | | |
Principal | | | Optional Call | | |
Amount (000) | | Description (1) | Provisions (2) | Ratings (3) | Value |
| | | New York – 0.7% | | | |
$ 1,000 | | Dormitory Authority of the State of New York, FHA-Insured Mortgage Revenue Bonds, Kaleida | 2/14 at 100.00 | AAA | $ 1,005,510 |
| | | Health, Series 2004, 5.050%, 2/15/25 | | | |
530 | | Port Authority of New York and New Jersey, Special Project Bonds, JFK International Air | 12/20 at 100.00 | BBB– | 502,700 |
| | | Terminal LLC Project, Eighth Series 2010, 6.000%, 12/01/42 | | | |
1,530 | | Total New York | | | 1,508,210 |
| | | North Carolina – 1.4% | | | |
1,000 | | North Carolina Eastern Municipal Power Agency, Power System Revenue Bonds, Series 2008C, | 1/19 at 100.00 | A– | 1,138,740 |
| | | 6.750%, 1/01/24 | | | |
1,420 | | North Carolina Eastern Municipal Power Agency, Power System Revenue Refunding Bonds, Series | 7/11 at 100.00 | A– | 1,421,377 |
| | | 1993B, 5.500%, 1/01/21 | | | |
500 | | Raleigh Durham Airport Authority, North Carolina, Airport Revenue Bonds, Series 2001A, 5.250%, | 5/11 at 101.00 | Aa3 (4) | 507,085 |
| | | 11/01/17 (Pre-refunded 5/01/11) – FGIC Insured | | | |
2,920 | | Total North Carolina | | | 3,067,202 |
| | | Ohio – 0.5% | | | |
1,545 | | Buckeye Tobacco Settlement Financing Authority, Ohio, Tobacco Settlement Asset-Backed Revenue | 6/17 at 100.00 | Baa3 | 1,062,898 |
| | | Bonds, Senior Lien, Series 2007A-2, 6.000%, 6/01/42 | | | |
| | | Oklahoma – 2.1% | | | |
1,000 | | Norman Regional Hospital Authority, Oklahoma, Hospital Revenue Bonds, Series 2005, | 9/16 at 100.00 | BB+ | 769,450 |
| | | 5.375%, 9/01/36 | | | |
4,000 | | Oklahoma Development Finance Authority, Revenue Bonds, St. John Health System, Series 2004, | 2/14 at 100.00 | A | 4,010,360 |
| | | 5.000%, 2/15/24 | | | |
5,000 | | Total Oklahoma | | | 4,779,810 |
| | | Pennsylvania – 0.9% | | | |
500 | | Pennsylvania Higher Educational Facilities Authority, Revenue Bonds, Widener University, | 7/13 at 100.00 | BBB+ | 503,060 |
| | | Series 2003, 5.250%, 7/15/24 | | | |
1,000 | | Pennsylvania Turnpike Commission, Motor License Fund-Enhanced Subordinate Special Revenue | 12/20 at 100.00 | AA | 731,480 |
| | | Bonds, Series 2010B-2, 0.000%, 12/01/30 | | | |
700 | | Pennsylvania Turnpike Commission, Turnpike Revenue Bonds, Series 2004A, 5.500%, 12/01/31 – | 12/14 at 100.00 | Aa3 | 703,857 |
| | | AMBAC Insured | | | |
2,200 | | Total Pennsylvania | | | 1,938,397 |
| | | Puerto Rico – 0.6% | | | |
1,000 | | Puerto Rico Sales Tax Financing Corporation, Sales Tax Revenue Bonds, First Subordinate Series | 8/19 at 100.00 | A+ | 988,760 |
| | | 2009A, 6.000%, 8/01/42 | | | |
7,000 | | Puerto Rico Sales Tax Financing Corporation, Sales Tax Revenue Bonds, Series 2007A, 0.000%, | No Opt. Call | Aa2 | 347,690 |
| | | 8/01/54 – AMBAC Insured | | | |
8,000 | | Total Puerto Rico | | | 1,336,450 |
| | | South Carolina – 7.6% | | | |
1,250 | | Dorchester County School District 2, South Carolina, Installment Purchase Revenue Bonds, | 12/14 at 100.00 | AA– | 1,313,738 |
| | | GROWTH, Series 2004, 5.250%, 12/01/20 | | | |
10,000 | | Greenville County School District, South Carolina, Installment Purchase Revenue Bonds, Series | 12/12 at 101.00 | AA (4) | 10,984,396 |
| | | 2002, 5.875%, 12/01/19 (Pre-refunded 12/01/12) | | | |
1,500 | | Lexington County Health Service District, South Carolina, Hospital Revenue Refunding and | 11/13 at 100.00 | A+ (4) | 1,702,125 |
| | | Improvement Bonds, Series 2003, 6.000%, 11/01/18 (Pre-refunded 11/01/13) | | | |
520 | | South Carolina JOBS Economic Development Authority, Economic Development Revenue Bonds, Bon | 11/12 at 100.00 | A3 (4) | 561,808 |
| | | Secours Health System Inc., Series 2002A, 5.625%, 11/15/30 (Pre-refunded 11/15/12) | | | |
1,980 | | South Carolina JOBS Economic Development Authority, Economic Development Revenue Bonds, Bon | 11/12 at 100.00 | A– | 1,868,764 |
| | | Secours Health System Inc., Series 2002B, 5.625%, 11/15/30 | | | |
685 | | Tobacco Settlement Revenue Management Authority, South Carolina, Tobacco Settlement | 5/11 at 101.00 | BBB (4) | 694,830 |
| | | Asset-Backed Bonds, Series 2001B, 6.000%, 5/15/22 (Pre-refunded 5/15/11) | | | |
15,935 | | Total South Carolina | | | 17,125,661 |
Nuveen Investments 23
| | |
| | Nuveen Select Tax-Free Income Portfolio (continued) |
NXP | Portfolio of Investments March 31, 2011 |
| | | | | | |
Principal | | | Optional Call | | |
Amount (000) | | Description (1) | Provisions (2) | Ratings (3) | Value |
| | | Texas – 8.3% | | | |
$ 5,000 | | Brazos River Harbor Navigation District, Brazoria County, Texas, Environmental Facilities | 5/12 at 101.00 | BBB– | $ 4,970,750 |
| | | Revenue Bonds, Dow Chemical Company Project, Series 2002A-6, 6.250%, 5/15/33 (Mandatory | | | |
| | | put 5/15/17) (Alternative Minimum Tax) | | | |
500 | | Central Texas Regional Mobility Authority, Travis and Williamson Counties, Toll Road Revenue | 1/15 at 100.00 | BBB | 403,140 |
| | | Bonds, Series 2005, 5.000%, 1/01/35 – FGIC Insured | | | |
360 | | Dallas-Fort Worth International Airport Public Facility Corporation, Texas, Airport Hotel | 7/11 at 100.00 | AA+ | 360,486 |
| | | Revenue Bonds, Series 2001, 5.500%, 1/15/20 – AGM Insured | | | |
2,300 | | Harris County Health Facilities Development Corporation, Texas, Thermal Utility Revenue Bonds, | 11/13 at 100.00 | AA | 2,268,743 |
| | | TECO Project, Series 2003, 5.000%, 11/15/30 – NPFG Insured | | | |
1,750 | | Harris County-Houston Sports Authority, Texas, Junior Lien Revenue Bonds, Series 2001H, | No Opt. Call | Baa1 | 353,150 |
| | | 0.000%, 11/15/30 – NPFG Insured | | | |
3,470 | | Harris County-Houston Sports Authority, Texas, Senior Lien Revenue Refunding Bonds, Series | 11/30 at 61.17 | Baa1 | 413,104 |
| | | 2001A, 0.000%, 11/15/38 – NPFG Insured | | | |
3,805 | | Harris County-Houston Sports Authority, Texas, Third Lien Revenue Bonds, Series 2004-A3, | 11/24 at 52.47 | Baa1 | 447,240 |
| | | 0.000%, 11/15/35 – NPFG Insured | | | |
45 | | Irving Independent School District, Dallas County, Texas, General Obligation Refunding Bonds, | 2/12 at 100.00 | AAA | 45,032 |
| | | Series 2002A, 5.000%, 2/15/31 | | | |
3,455 | | Irving Independent School District, Dallas County, Texas, General Obligation Refunding Bonds, | 2/12 at 100.00 | AAA | 3,596,966 |
| | | Series 2002A, 5.000%, 2/15/31 (Pre-refunded 2/15/12) | | | |
1,780 | | Leander Independent School District, Williamson and Travis Counties, Texas, General Obligation | 8/16 at 35.23 | AAA | 373,444 |
| | | Bonds, Series 2007, 0.000%, 8/15/37 | | | |
2,000 | | North Texas Tollway Authority, First Tier System Revenue Refunding Bonds, Capital Appreciation | 1/25 at 100.00 | A2 | 1,485,860 |
| | | Series 2008I, 0.000%, 1/01/43 | | | |
2,000 | | Richardson Hospital Authority, Texas, Revenue Bonds, Richardson Regional Medical Center, | 12/13 at 100.00 | Baa2 | 1,848,100 |
| | | Series 2004, 6.000%, 12/01/34 | | | |
465 | | San Antonio, Texas, Water System Revenue Refunding Bonds, Series 1992, 6.000%, 5/15/16 | 5/12 at 100.00 | Aa3 (4) | 479,345 |
| | | (Pre-refunded 5/15/12) – NPFG Insured | | | |
1,750 | | Texas, General Obligation Bonds, Water Financial Assistance Program, Series 2003A, 5.125%, | 8/13 at 100.00 | Aaa | 1,585,973 |
| | | 8/01/42 (Alternative Minimum Tax) | | | |
28,680 | | Total Texas | | | 18,631,333 |
| | | Utah – 0.4% | | | |
775 | | Utah State Building Ownership Authority, Lease Revenue Bonds, State Facilities Master Lease | 11/11 at 100.00 | AA+ (4) | 798,459 |
| | | Program, Series 2001B, 5.250%, 5/15/24 (Pre-refunded 11/15/11) | | | |
| | | Virginia – 0.9% | | | |
1,000 | | Fairfax County Economic Development Authority, Virginia, Residential Care Facilities Mortgage | 10/17 at 100.00 | N/R | 830,500 |
| | | Revenue Bonds, Goodwin House, Inc., Series 2007A, 5.125%, 10/01/42 | | | |
2,000 | | Metropolitan Washington DC Airports Authority, Virginia, Dulles Toll Road Revenue Bonds, | 10/28 at 100.00 | BBB+ | 1,125,340 |
| | | Dulles Metrorail Capital Appreciation, Series 2010B, 0.000%, 10/01/44 | | | |
3,000 | | Total Virginia | | | 1,955,840 |
| | | Washington – 6.5% | | | |
250 | | Energy Northwest, Washington, Electric Revenue Refunding Bonds, Columbia Generating Station, | 7/12 at 100.00 | Aaa | 262,635 |
| | | Series 2002A, 5.500%, 7/01/17 – NPFG Insured | | | |
1,330 | | Snohomish County Public Utility District 1, Washington, Generation System Revenue Bonds, | No Opt. Call | Aaa | 1,383,945 |
| | | Series 1989, 6.750%, 1/01/12 (ETM) | | | |
9,750 | | Washington State Health Care Facilities Authority, Revenue Bonds, Sisters of Providence Health | 10/11 at 100.00 | AA | 9,913,410 |
| | | System, Series 2001A, 5.125%, 10/01/17 – NPFG Insured | | | |
2,025 | | Washington State Tobacco Settlement Authority, Tobacco Settlement Asset-Backed Revenue Bonds, | 6/13 at 100.00 | BBB | 2,039,641 |
| | | Series 2002, 6.500%, 6/01/26 | | | |
2,115 | | Washington State, Motor Vehicle Fuel Tax General Obligation Bonds, Series 2003F, 0.000%, | No Opt. Call | AA+ | 912,178 |
| | | 12/01/27 – NPFG Insured | | | |
15,470 | | Total Washington | | | 14,511,809 |
24 Nuveen Investments
| | | | | | |
Principal | | | Optional Call | | |
Amount (000) | | Description (1) | Provisions (2) | Ratings (3) | Value |
| | | West Virginia – 0.2% | | | |
$ 500 | | West Virginia Hospital Finance Authority, Revenue Bonds, United Hospital Center Inc. Project, | 6/16 at 100.00 | A+ | $ 456,000 |
| | | Series 2006A, 4.500%, 6/01/26 – AMBAC Insured | | | |
| | | Wisconsin – 1.9% | | | |
640 | | Badger Tobacco Asset Securitization Corporation, Wisconsin, Tobacco Settlement Asset-Backed | 6/12 at 100.00 | AAA | 666,483 |
| | | Bonds, Series 2002, 6.125%, 6/01/27 (Pre-refunded 6/01/12) | | | |
1,000 | | Wisconsin Health and Educational Facilities Authority, Revenue Bonds, Wheaton Franciscan | 8/13 at 100.00 | BBB+ | 1,009,300 |
| | | Services Inc., Series 2003A, 5.500%, 8/15/17 | | | |
2,500 | | Wisconsin, General Obligation Refunding Bonds, Series 2003-3, 5.000%, 11/01/26 | 11/13 at 100.00 | AA | 2,548,075 |
4,140 | | Total Wisconsin | | | 4,223,858 |
$ 290,765 | | Total Municipal Bonds (cost $227,294,266) | | | 221,296,136 |
| | | | | | |
Shares | | Description | | | Value |
| | | Common Stocks – 0.0% | | | |
| | | Airlines – 0.0% | | | |
122 | | United Continental Holdings Inc. (6), (7) | | | $ 2,805 |
| | | Total Common Stocks (cost $0) | | | 2,805 |
| | | Total Investments (cost $227,294,266) – 98.7% | | | 221,298,941 |
| | | Other Assets Less Liabilities – 1.3% | | | 2,969,006 |
| | | Net Assets – 100% | | | $ 224,267,947 |
| (1) | All percentages shown in the Portfolio of Investments are based on net assets. |
| (2) | Optional Call Provisions (not covered by the report of independent registered public accounting firm): Dates (month and year) and prices of the earliest optional call or redemption. There may be other call provisions at varying prices at later dates. Certain mortgage-backed securities may be subject to periodic principal paydowns. |
| (3) | Ratings (not covered by the report of independent registered public accounting firm): Using the highest of Standard & Poor’s Group (“Standard & Poor’s”), Moody’s Investor Service, Inc. (“Moody’s”) or Fitch, Inc. (“Fitch”) rating. Ratings below BBB by Standard & Poor’s, Baa by Moody’s or BBB by Fitch are considered to be below investment grade. Holdings designated N/R are not rated by any of these national rating agencies. |
| (4) | Backed by an escrow or trust containing sufficient U.S. Government or U.S. Government agency securities, which ensure the timely payment of principal and interest. Such investments are normally considered to be equivalent to AAA rated securities. |
| (5) | The Fund’s Adviser has concluded this issue is not likely to meet its future interest payment obligations and has directed the Fund’s custodian to cease accruing additional income on the Fund’s records. |
| (6) | On December 9, 2002, UAL Corporation (“UAL”), the holding company of United Air Lines, Inc. (“United”) filed for federal bankruptcy protection. The Adviser determined that it was likely that United would not remain current on their interest payment obligations with respect to the bonds previously held and thus the Fund had stopped accruing interest on its UAL bonds. On February 1, 2006, UAL emerged from federal bankruptcy with the acceptance of its reorganization plan by the bankruptcy court. Under the settlement agreement established to meet UAL’s unsecured bond obligations, the bondholders, including the Fund, received three distributions of UAL common stock over the subsequent months, and the bankruptcy court dismissed all unsecured claims of bondholders, including those of the Fund. On May 5, 2006, the Fund liquidated such UAL common stock holdings. On September 29, 2006 and May 30, 2007, the Fund received additional distributions of 1,901 and 617 shares, respectively, of UAL common stock as a result of its earlier ownership of the UAL bonds. The Fund liquidated the 1,901 shares of such UAL common stock holdings on November 15, 2006. The Fund received an additional distribution of 172 UAL common stock shares on November 14, 2007. The remaining 789 shares of UAL common stock were liquidated by the Fund on March 30, 2010. The Fund received an additional distribution of 122 UAL common stock shares on July 20, 2010, which are still held by the Fund as of March 31, 2011. On October 1, 2010, UAL Corporation was renamed United Continental Holdings, Inc. |
| (7) | Non-income producing; issuer has not declared a dividend within the past twelve months. |
| (ETM) | Escrowed to maturity. |
| (IF) | Inverse floating rate investment. |
See accompanying notes to financial statements.
Nuveen Investments 25
| | |
| | Nuveen Select Tax-Free Income Portfolio 2 |
NXQ | Portfolio of Investments |
| | March 31, 2011 |
| | | | | | |
Principal | | | Optional Call | | |
Amount (000) | | Description (1) | Provisions (2) | Ratings (3) | Value |
| | | Municipal Bonds – 99.0% | | | |
| | | Arizona – 1.0% | | | |
$ 600 | | Pima County Industrial Development Authority, Arizona, Revenue Bonds, Tucson Electric Power | 10/20 at 100.00 | BBB– | $ 519,624 |
| | | Company, Series 2010A, 5.250%, 10/01/40 | | | |
2,250 | | Salt Verde Financial Corporation, Arizona, Senior Gas Revenue Bonds, Citigroup Energy Inc | No Opt. Call | A | 1,844,415 |
| | | Prepay Contract Obligations, Series 2007, 5.000%, 12/01/37 | | | |
2,850 | | Total Arizona | | | 2,364,039 |
| | | Arkansas – 1.3% | | | |
1,000 | | Fort Smith, Arkansas, Water and Sewer Revenue Bonds, Series 2002A, 5.000%, 10/01/19 | 10/11 at 100.00 | AA+ (4) | 1,023,590 |
| | | (Pre-refunded 10/01/11) – AGM Insured | | | |
2,000 | | University of Arkansas, Fayetteville, Various Facilities Revenue Bonds, Series 2002, 5.000%, | 12/12 at 100.00 | Aa2 | 2,005,880 |
| | | 12/01/32 – FGIC Insured | | | |
3,000 | | Total Arkansas | | | 3,029,470 |
| | | California – 7.9% | | | |
1,000 | | Alameda Corridor Transportation Authority, California, Subordinate Lien Revenue Bonds, Series | 10/17 at 100.00 | A– | 797,760 |
| | | 2004A, 0.000%, 10/01/25 – AMBAC Insured | | | |
3,325 | | California Department of Water Resources, Power Supply Revenue Bonds, Series 2002A, 6.000%, | 5/12 at 101.00 | AA– (4) | 3,560,377 |
| | | 5/01/14 (Pre-refunded 5/01/12) | | | |
500 | | California State Public Works Board, Lease Revenue Refunding Bonds, Community Colleges | 6/11 at 100.00 | A2 | 500,645 |
| | | Projects, Series 1998A, 5.250%, 12/01/16 | | | |
2,000 | | California State Public Works Board, Lease Revenue Refunding Bonds, Various University of | No Opt. Call | Aa2 | 2,121,040 |
| | | California Projects, Series 1993A, 5.500%, 6/01/14 | | | |
2,500 | | California State, General Obligation Bonds, Series 2005, 5.000%, 3/01/31 | 3/16 at 100.00 | A1 | 2,377,325 |
60 | | California, General Obligation Bonds, Series 1997, 5.000%, 10/01/18 – AMBAC Insured | 4/11 at 100.00 | A1 | 60,149 |
3,200 | | Golden State Tobacco Securitization Corporation, California, Tobacco Settlement Asset-Backed | 6/13 at 100.00 | AAA | 3,604,800 |
| | | Bonds, Series 2003A-1, 6.750%, 6/01/39 (Pre-refunded 6/01/13) | | | |
1,000 | | Golden State Tobacco Securitization Corporation, California, Tobacco Settlement Asset-Backed | 6/17 at 100.00 | Baa3 | 600,110 |
| | | Bonds, Series 2007A-1, 5.125%, 6/01/47 | | | |
3,030 | | Grossmont Union High School District, San Diego County, California, General Obligation Bonds, | No Opt. Call | Aa2 | 1,226,211 |
| | | Series 2006, 0.000%, 8/01/25 – NPFG Insured | | | |
450 | | M-S-R Energy Authority, California, Gas Revenue Bonds, Series 2009C, 6.500%, 11/01/39 | No Opt. Call | A | 457,623 |
1,195 | | Palmdale Elementary School District, Los Angeles County, California, General Obligation Bonds, | No Opt. Call | AA+ | 394,983 |
| | | Series 2003, 0.000%, 8/01/28 – AGM Insured | | | |
590 | | Palomar Pomerado Health Care District, California, Certificates of Participation, Series 2009, | 11/19 at 100.00 | Baa3 | 561,373 |
| | | 6.750%, 11/01/39 | | | |
| | | San Joaquin Delta Community College District, California, General Obligation Bonds, Election | | | |
| | | 2004 Series 2008B: | | | |
1,000 | | 0.000%, 8/01/30 – AGM Insured | 8/18 at 50.12 | AA+ | 263,440 |
1,890 | | 0.000%, 8/01/31 – AGM Insured | 8/18 at 47.14 | AA+ | 461,066 |
1,750 | | Tobacco Securitization Authority of Northern California, Tobacco Settlement Asset-Backed | 6/15 at 100.00 | Baa3 | 1,089,340 |
| | | Bonds, Series 2005A-1, 5.500%, 6/01/45 | | | |
23,490 | | Total California | | | 18,076,242 |
| | | Colorado – 10.5% | | | |
500 | | Colorado Health Facilities Authority, Colorado, Revenue Bonds, Catholic Health Initiatives, | 7/19 at 100.00 | AA | 499,955 |
| | | Series 2009A, 5.500%, 7/01/34 | | | |
1,000 | | Colorado Health Facilities Authority, Health Facilities Revenue Bonds, Sisters of Charity of | No Opt. Call | AA | 910,690 |
| | | Leavenworth Health Services Corporation, Series 2010A, 5.000%, 1/01/40 | | | |
26 Nuveen Investments
| | | | | | |
Principal | | | Optional Call | | |
Amount (000) | | Description (1) | Provisions (2) | Ratings (3) | Value |
| | | Colorado (continued) | | | |
| | | Colorado Health Facilities Authority, Revenue Bonds, Catholic Health Initiatives, Series 2002A: | | | |
$ 1,300 | | 5.500%, 3/01/22 (Pre-refunded 3/01/12) | 3/12 at 100.00 | Aa2 (4) | $ 1,359,267 |
1,700 | | 5.500%, 3/01/22 (Pre-refunded 3/02/12) | 3/12 at 100.00 | AA (4) | 1,773,321 |
1,570 | | Denver City and County, Colorado, Airport System Revenue Bonds, Series 1991D, 7.750%, 11/15/13 | No Opt. Call | A+ | 1,694,878 |
| | | (Alternative Minimum Tax) | | | |
5,000 | | Denver City and County, Colorado, Airport System Revenue Refunding Bonds, Series 2001A, | 11/11 at 100.00 | A+ | 5,121,249 |
| | | 5.625%, 11/15/17 – FGIC Insured (Alternative Minimum Tax) | | | |
1,555 | | Denver City and County, Colorado, Airport System Revenue Refunding Bonds, Series 2001, 5.500%, | 11/11 at 100.00 | A+ | 1,592,787 |
| | | 11/15/16 – FGIC Insured | | | |
3,000 | | Denver Convention Center Hotel Authority, Colorado, Senior Revenue Bonds, Convention Center | 12/13 at 100.00 | N/R (4) | 3,304,500 |
| | | Hotel, Series 2003A, 5.000%, 12/01/23 (Pre-refunded 12/01/13) – SYNCORA GTY Insured | | | |
2,000 | | Denver Convention Center Hotel Authority, Colorado, Senior Revenue Bonds, Convention Center | 11/16 at 100.00 | BBB– | 1,484,100 |
| | | Hotel, Series 2006, 4.750%, 12/01/35 – SYNCORA GTY Insured | | | |
| | | E-470 Public Highway Authority, Colorado, Senior Revenue Bonds, Series 2000B: | | | |
5,100 | | 0.000%, 9/01/24 – NPFG Insured | No Opt. Call | Baa1 | 1,979,412 |
8,100 | | 0.000%, 9/01/29 – NPFG Insured | No Opt. Call | Baa1 | 2,039,742 |
4,200 | | 0.000%, 9/01/33 – NPFG Insured | No Opt. Call | Baa1 | 755,664 |
250 | | Northwest Parkway Public Highway Authority, Colorado, Revenue Bonds, Senior Series 2001A, | 6/11 at 102.00 | AA+ (4) | 257,508 |
| | | 5.250%, 6/15/41 (Pre-refunded 6/15/11) – AGM Insured | | | |
1,100 | | University of Colorado Hospital Authority, Revenue Bonds, Series 2001A, 5.600%, 11/15/31 | 11/11 at 100.00 | A3 (4) | 1,135,959 |
| | | (Pre-refunded 11/15/11) | | | |
36,375 | | Total Colorado | | | 23,909,032 |
| | | Florida – 2.4% | | | |
1,000 | | Hillsborough County Industrial Development Authority, Florida, Hospital Revenue Bonds, Tampa | 10/16 at 100.00 | A3 | 843,110 |
| | | General Hospital, Series 2006, 5.250%, 10/01/41 | | | |
1,500 | | Jacksonville, Florida, Guaranteed Entitlement Revenue Refunding and Improvement Bonds, Series | 10/12 at 100.00 | A+ | 1,527,765 |
| | | 2002, 5.000%, 10/01/21 – FGIC Insured | | | |
2,500 | | JEA, Florida, Electric System Revenue Bonds, Series Three 2006A, 5.000%, 10/01/41 – AGM Insured | 4/15 at 100.00 | AA+ | 2,369,125 |
625 | | Miami-Dade County Expressway Authority, Florida, Toll System Revenue Refunding Bonds, Series | 7/11 at 101.00 | A3 | 625,138 |
| | | 2001, 5.125%, 7/01/29 – FGIC Insured | | | |
5,625 | | Total Florida | | | 5,365,138 |
| | | Georgia – 0.4% | | | |
1,000 | | Franklin County Industrial Building Authority, Georgia, Revenue Bonds, Ty Cobb Regional | 12/20 at 100.00 | N/R | 971,480 |
| | | Medical Center Project, Series 2010, 8.125%, 12/01/45 | | | |
| | | Illinois – 15.2% | | | |
630 | | Chicago Metropolitan Housing Development Corporation, Illinois, FHA-Insured Section 8 Assisted | 7/11 at 100.00 | AA | 631,581 |
| | | Housing Development Revenue Refunding Bonds, Series 1992, 6.800%, 7/01/17 | | | |
590 | | Chicago, Illinois, Motor Fuel Tax Revenue Bonds, Series 2003A, 5.000%, 1/01/33 – AMBAC Insured | 7/13 at 100.00 | AA+ | 563,232 |
1,665 | | Chicago, Illinois, Third Lien General Airport Revenue Bonds, O’Hare International Airport, | 1/16 at 100.00 | A1 | 1,499,516 |
| | | Series 2005A, 5.000%, 1/01/33 – FGIC Insured | | | |
600 | | Illinois Educational Facilities Authority, Student Housing Revenue Bonds, Educational | 5/12 at 101.00 | Aaa | 642,180 |
| | | Advancement Foundation Fund, University Center Project, Series 2002, 6.000%, 5/01/22 | | | |
| | | (Pre-refunded 5/01/12) | | | |
1,050 | | Illinois Finance Authority, Revenue Bonds, Loyola University of Chicago, Tender Option Bond | No Opt. Call | Aa1 | 900,627 |
| | | Trust 1137, 9.166%, 7/01/15 (IF) | | | |
150 | | Illinois Finance Authority, Revenue Bonds, Palos Community Hospital, Series 2007A, 5.000%, | 5/17 at 100.00 | Baa1 | 128,637 |
| | | 5/15/32 – NPFG Insured | | | |
2,185 | | Illinois Finance Authority, Revenue Bonds, YMCA of Southwest Illinois, Series 2005, 5.000%, | 9/15 at 100.00 | Aa3 | 1,651,926 |
| | | 9/01/31 – RAAI Insured | | | |
Nuveen Investments 27
| | |
| | Nuveen Select Tax-Free Income Portfolio 2 (continued) |
NXQ | Portfolio of Investments March 31, 2011 |
| | | | | | |
Principal | | | Optional Call | | |
Amount (000) | | Description (1) | Provisions (2) | Ratings (3) | Value |
| | | Illinois (continued) | | | |
$ 1,600 | | Illinois Finance Authority, Revenue Refunding Bonds, Silver Cross Hospital and Medical | 8/18 at 100.00 | BBB | $ 1,354,912 |
| | | Centers, Series 2008A, 5.500%, 8/15/30 | | | |
2,255 | | Illinois Health Facilities Authority, Revenue Bonds, Lake Forest Hospital, Series 2002A, | 7/12 at 100.00 | AA+ | 2,316,652 |
| | | 6.250%, 7/01/22 | | | |
1,055 | | Illinois Health Facilities Authority, Revenue Bonds, Loyola University Health System, Series | 7/11 at 100.00 | Baa3 (4) | 1,069,970 |
| | | 2001A, 6.125%, 7/01/31 (Pre-refunded 7/01/11) | | | |
415 | | Illinois Health Facilities Authority, Revenue Refunding Bonds, Rockford Health System, Series | 8/11 at 100.00 | N/R | 359,178 |
| | | 1997, 5.000%, 8/15/21 – AMBAC Insured | | | |
1,000 | | Illinois Housing Development Authority, Housing Finance Bonds, Series 2005E, 4.750%, 7/01/30 – | 1/15 at 100.00 | AA | 891,890 |
| | | FGIC Insured | | | |
5,700 | | Illinois, Sales Tax Revenue Bonds, First Series 2002, 5.000%, 6/15/22 | 6/13 at 100.00 | AAA | 5,775,182 |
| | | Metropolitan Pier and Exposition Authority, Illinois, Revenue Bonds, McCormick Place Expansion | | | |
| | | Project, Series 2002A: | | | |
1,350 | | 0.000%, 6/15/35 – NPFG Insured | No Opt. Call | AAA | 272,592 |
5,000 | | 0.000%, 12/15/36 – NPFG Insured | No Opt. Call | AAA | 903,000 |
7,000 | | Metropolitan Pier and Exposition Authority, Illinois, Revenue Refunding Bonds, McCormick Place | 6/12 at 101.00 | AAA | 7,119,906 |
| | | Expansion Project, Series 2002B, 5.000%, 6/15/21 – NPFG Insured | | | |
5,045 | | Sauk Village, Illinois, General Obligation Alternate Revenue Source Bonds, Tax Increment, | 12/12 at 100.00 | A | 4,893,499 |
| | | Series 2002A, 5.000%, 6/01/22 – RAAI Insured | | | |
| | | Sauk Village, Illinois, General Obligation Alternate Revenue Source Bonds, Tax Increment, | | | |
| | | Series 2002B: | | | |
1,060 | | 0.000%, 12/01/17 – RAAI Insured | No Opt. Call | BB | 764,631 |
1,135 | | 0.000%, 12/01/18 – RAAI Insured | No Opt. Call | BB | 758,089 |
1,100 | | Schaumburg, Illinois, General Obligation Bonds, Series 2004B, 5.250%, 12/01/34 – FGIC Insured | 12/14 at 100.00 | Aaa | 1,104,279 |
1,000 | | Yorkville, Illinois, General Obligation Debt Certificates, Series 2003, 5.000%, 12/15/21 | 12/11 at 100.00 | N/R (4) | 1,033,160 |
| | | (Pre-refunded 12/15/11) – RAAI Insured | | | |
41,585 | | Total Illinois | | | 34,634,639 |
| | | Indiana – 6.0% | | | |
1,000 | | Franklin Community Multi-School Building Corporation, Marion County, Indiana, First Mortgage | 7/14 at 100.00 | A (4) | 1,129,740 |
| | | Revenue Bonds, Series 2004, 5.000%, 7/15/22 (Pre-refunded 7/15/14) – FGIC Insured | | | |
1,600 | | Indiana Bond Bank, Special Program Bonds, Carmel Junior Waterworks Project, Series 2008B, | No Opt. Call | AA+ | 514,304 |
| | | 0.000%, 6/01/30 – AGM Insured | | | |
750 | | Indiana Health and Educational Facilities Financing Authority, Revenue Bonds, Ascension | No Opt. Call | Aa1 | 684,368 |
| | | Health, Series 2006B-5, 5.000%, 11/15/36 | | | |
600 | | Indiana Health Facility Financing Authority, Hospital Revenue Bonds, Methodist Hospitals Inc., | 9/11 at 100.00 | BBB | 546,942 |
| | | Series 2001, 5.375%, 9/15/22 | | | |
1,000 | | Indiana Health Facility Financing Authority, Revenue Bonds, Community Foundation of Northwest | 3/17 at 100.00 | BBB+ | 887,940 |
| | | Indiana, Series 2007, 5.500%, 3/01/37 | | | |
585 | | Indiana Housing Finance Authority, Single Family Mortgage Revenue Bonds, Series 2002C-2, | 7/11 at 100.00 | Aaa | 589,458 |
| | | 5.250%, 7/01/23 (Alternative Minimum Tax) | | | |
4,380 | | Indiana Municipal Power Agency, Power Supply System Revenue Bonds, Series 2002A, 5.125%, | 1/12 at 100.00 | A+ | 4,442,765 |
| | | 1/01/21 – AMBAC Insured | | | |
385 | | St. Joseph County Hospital Authority, Indiana, Revenue Bonds, Memorial Health System, Series | 8/11 at 100.00 | AA– | 361,115 |
| | | 1998A, 4.625%, 8/15/28 – NPFG Insured | | | |
750 | | West Clark 2000 School Building Corporation, Clark County, Indiana, First Mortgage Bonds, | 1/15 at 100.00 | AA+ | 764,663 |
| | | Series 2005, 5.000%, 7/15/22 – NPFG Insured | | | |
3,840 | | Whiting Redevelopment District, Indiana, Tax Increment Revenue Bonds, Lakefront Development | No Opt. Call | N/R | 3,739,622 |
| | | Project, Series 2010, 6.000%, 1/15/19 | | | |
14,890 | | Total Indiana | | | 13,660,917 |
28 Nuveen Investments
| | | | | | |
Principal | | | Optional Call | | |
Amount (000) | | Description (1) | Provisions (2) | Ratings (3) | Value |
| | | Iowa – 3.0% | | | |
$ 695 | | Iowa Finance Authority, Single Family Mortgage Revenue Bonds, Series 2007B, 4.800%, 1/01/37 | 7/16 at 100.00 | AAA | $ 628,363 |
| | | (Alternative Minimum Tax) | | | |
1,350 | | Iowa Tobacco Settlement Authority, Asset Backed Settlement Revenue Bonds, Series 2005C, | 6/15 at 100.00 | BBB | 964,022 |
| | | 5.375%, 6/01/38 | | | |
1,000 | | Iowa Tobacco Settlement Authority, Tobacco Asset-Backed Revenue Bonds, Series 2005B, | 6/17 at 100.00 | BBB | 795,330 |
| | | 5.600%, 6/01/34 | | | |
| | | Iowa Tobacco Settlement Authority, Tobacco Settlement Asset-Backed Revenue Bonds, | | | |
| | | Series 2001B: | | | |
845 | | 5.300%, 6/01/25 (Pre-refunded 6/01/11) | 6/11 at 101.00 | AAA | 859,872 |
3,500 | | 5.600%, 6/01/35 (Pre-refunded 6/01/11) | 6/11 at 101.00 | AAA | 3,565,695 |
7,390 | | Total Iowa | | | 6,813,282 |
| | | Kansas – 0.7% | | | |
795 | | Lawrence, Kansas, Hospital Revenue Bonds, Lawrence Memorial Hospital, Refunding Series 2006, | 7/16 at 100.00 | A2 | 690,505 |
| | | 4.875%, 7/01/36 | | | |
1,000 | | Salina, Kansas, Hospital Revenue Bonds, Salina Regional Medical Center, Series 2006, | 4/13 at 100.00 | A1 | 922,420 |
| | | 4.500%, 10/01/26 | | | |
1,795 | | Total Kansas | | | 1,612,925 |
| | | Louisiana – 2.4% | | | |
2,180 | | Louisiana Public Facilities Authority, Revenue Bonds, Baton Rouge General Hospital, Series | 7/14 at 100.00 | Baa1 | 2,191,445 |
| | | 2004, 5.250%, 7/01/24 – NPFG Insured | | | |
3,000 | | Louisiana Public Facilities Authority, Revenue Bonds, Tulane University, Series 2002A, 5.125%, | 7/12 at 100.00 | N/R (4) | 3,171,690 |
| | | 7/01/27 (Pre-refunded 7/01/12) – AMBAC Insured | | | |
5,180 | | Total Louisiana | | | 5,363,135 |
| | | Massachusetts – 2.5% | | | |
3,000 | | Massachusetts Health and Educational Facilities Authority, Revenue Bonds, Berkshire Health | 10/11 at 101.00 | BBB+ | 2,935,620 |
| | | System, Series 2001E, 6.250%, 10/01/31 | | | |
500 | | Massachusetts Health and Educational Facilities Authority, Revenue Bonds, CareGroup Inc., | 7/18 at 100.00 | A3 | 451,655 |
| | | Series 2008E-1 &2, 5.000%, 7/01/28 | | | |
1,270 | | Massachusetts Water Resources Authority, General Revenue Bonds, Series 1993C, 5.250%, | No Opt. Call | Aa2 (4) | 1,409,408 |
| | | 12/01/15 – NPFG Insured (ETM) | | | |
820 | | Massachusetts Water Resources Authority, General Revenue Bonds, Series 1993C, 5.250%, | No Opt. Call | Aa1 | 904,599 |
| | | 12/01/15 – NPFG Insured | | | |
5,590 | | Total Massachusetts | | | 5,701,282 |
| | | Michigan – 1.6% | | | |
545 | | Detroit, Michigan, General Obligation Bonds, Series 2003A, 5.250%, 4/01/19 – SYNCORA | 4/13 at 100.00 | BB | 467,245 |
| | | GTY Insured | | | |
2,900 | | Michigan State Hospital Finance Authority, Hospital Revenue Refunding Bonds, Trinity Health | 12/12 at 100.00 | AA | 2,812,478 |
| | | Credit Group, Series 2002C, 5.375%, 12/01/30 | | | |
250 | | Royal Oak Hospital Finance Authority, Michigan, Hospital Revenue Bonds, William Beaumont | 9/18 at 100.00 | A1 | 282,778 |
| | | Hospital, Refunding Series 2009V, 8.250%, 9/01/39 | | | |
3,695 | | Total Michigan | | | 3,562,501 |
| | | Minnesota – 0.6% | | | |
1,500 | | Minnesota Housing Finance Agency, Residential Housing Finance Bonds, Series 2007-I, 4.850%, | 7/16 at 100.00 | AA+ | 1,343,580 |
| | | 7/01/38 (Alternative Minimum Tax) | | | |
| | | Mississippi – 0.2% | | | |
500 | | Mississippi Development Bank, Revenue Bonds, Mississippi Municipal Energy Agency, Mississippi | 3/16 at 100.00 | Baa2 | 490,410 |
| | | Power, Series 2006A, 5.000%, 3/01/21 – SYNCORA GTY Insured | | | |
Nuveen Investments 29
| | |
| | Nuveen Select Tax-Free Income Portfolio 2 (continued) |
NXQ | Portfolio of Investments March 31, 2011 |
| | | | | | |
Principal | | | Optional Call | | |
Amount (000) | | Description (1) | Provisions (2) | Ratings (3) | Value |
| | | Nevada – 2.5% | | | |
$ 1,500 | | Clark County, Nevada, General Obligation Bank Bonds, Southern Nevada Water Authority Loan, | 6/11 at 100.00 | AA+ (4) | $ 1,512,540 |
| | | Series 2001, 5.300%, 6/01/19 (Pre-refunded 6/01/11) – FGIC Insured | | | |
1,000 | | Clark County, Nevada, Passenger Facility Charge Revenue Bonds, Las Vegas-McCarran | 1/20 at 100.00 | Aa3 | 902,390 |
| | | International Airport, Series 2010A, 5.250%, 7/01/42 | | | |
| | | Director of Nevada State Department of Business and Industry, Revenue Bonds, Las Vegas | | | |
| | | Monorail Project, First Tier, Series 2000: | | | |
4,595 | | 0.000%, 1/01/22 – AMBAC Insured | No Opt. Call | D | 535,915 |
12,250 | | 5.375%, 1/01/40 – AMBAC Insured (5) | 7/11 at 100.00 | D | 2,729,178 |
19,345 | | Total Nevada | | | 5,680,023 |
| | | New Jersey – 1.9% | | | |
2,500 | | New Jersey Health Care Facilities Financing Authority, Revenue Bonds, Somerset Medical Center, | 7/13 at 100.00 | Ba2 | 2,132,150 |
| | | Series 2003, 5.500%, 7/01/23 | | | |
| | | Tobacco Settlement Financing Corporation, New Jersey, Tobacco Settlement Asset-Backed Bonds, | | | |
| | | Series 2003: | | | |
1,000 | | 6.375%, 6/01/32 (Pre-refunded 6/01/13) | 6/13 at 100.00 | AAA | 1,101,820 |
1,010 | | 6.250%, 6/01/43 (Pre-refunded 6/01/13) | 6/13 at 100.00 | AAA | 1,130,665 |
4,510 | | Total New Jersey | | | 4,364,635 |
| | | New Mexico – 3.1% | | | |
1,000 | | New Mexico Mortgage Finance Authority, Multifamily Housing Revenue Bonds, St Anthony, Series | 9/17 at 100.00 | N/R | 810,050 |
| | | 2007A, 5.250%, 9/01/42 (Alternative Minimum Tax) | | | |
| | | University of New Mexico, FHA-Insured Mortgage Hospital Revenue Bonds, Series 2004: | | | |
555 | | 4.625%, 1/01/25 – AGM Insured | 7/14 at 100.00 | AA+ | 555,294 |
660 | | 4.625%, 7/01/25 – AGM Insured | 7/14 at 100.00 | AA+ | 660,251 |
2,000 | | 4.750%, 7/01/27 – AGM Insured | 7/14 at 100.00 | AA+ | 1,983,100 |
3,000 | | 4.750%, 1/01/28 – AGM Insured | 7/14 at 100.00 | AA+ | 2,943,720 |
7,215 | | Total New Mexico | | | 6,952,415 |
| | | New York – 3.0% | | | |
1,700 | | Dormitory Authority of the State of New York, FHA Insured Mortgage Hospital Revenue Bonds, | 8/16 at 100.00 | AAA | 1,506,727 |
| | | Kaleida Health, Series 2006, 4.700%, 2/15/35 | | | |
2,000 | | New York City Municipal Water Finance Authority, New York, Water and Sewerage System Revenue | 12/14 at 100.00 | AAA | 1,945,380 |
| | | Bonds, Series 2004B, 5.000%, 6/15/36 – AGM Insured (UB) | | | |
3,000 | | New York State Tobacco Settlement Financing Corporation, Tobacco Settlement Asset-Backed and | 6/11 at 100.00 | AA– | 3,030,540 |
| | | State Contingency Contract-Backed Bonds, Series 2003B-1C, 5.500%, 6/01/16 | | | |
395 | | Port Authority of New York and New Jersey, Special Project Bonds, JFK International Air | 12/20 at 100.00 | BBB– | 374,654 |
| | | Terminal LLC Project, Eighth Series 2010, 6.000%, 12/01/42 | | | |
7,095 | | Total New York | | | 6,857,301 |
| | | North Carolina – 0.5% | | | |
1,155 | | Charlotte-Mecklenburg Hospital Authority, North Carolina, Healthcare System Revenue Bonds, | 1/12 at 100.00 | AA– | 1,112,750 |
| | | Carolinas Healthcare System, Series 2001A, 5.000%, 1/15/31 | | | |
| | | Ohio – 1.9% | | | |
| | | Buckeye Tobacco Settlement Financing Authority, Ohio, Tobacco Settlement Asset-Backed Revenue | | | |
| | | Bonds, Senior Lien, Series 2007A-2: | | | |
50 | | 5.125%, 6/01/24 | 6/17 at 100.00 | Baa3 | 38,153 |
1,845 | | 5.375%, 6/01/24 | 6/17 at 100.00 | Baa3 | 1,444,801 |
680 | | 5.875%, 6/01/30 | 6/17 at 100.00 | Baa3 | 491,844 |
775 | | 5.750%, 6/01/34 | 6/17 at 100.00 | Baa3 | 531,999 |
2,680 | | 5.875%, 6/01/47 | 6/17 at 100.00 | Baa3 | 1,787,614 |
6,030 | | Total Ohio | | | 4,294,411 |
30 Nuveen Investments
��
| | | | | | |
Principal | | | Optional Call | | |
Amount (000) | | Description (1) | Provisions (2) | Ratings (3) | Value |
| | | Oklahoma – 1.5% | | | |
$ 1,000 | | Norman Regional Hospital Authority, Oklahoma, Hospital Revenue Bonds, Series 2005, | 9/16 at 100.00 | BB+ | $ 769,450 |
| | | 5.375%, 9/01/36 | | | |
3,000 | | Oklahoma Development Finance Authority, Revenue Bonds, Saint John Health System, Series 2007, | 2/17 at 100.00 | A | 2,724,570 |
| | | 5.000%, 2/15/42 | | | |
4,000 | | Total Oklahoma | | | 3,494,020 |
| | | Pennsylvania – 2.3% | | | |
1,000 | | Pennsylvania Turnpike Commission, Motor License Fund-Enhanced Subordinate Special Revenue | 12/20 at 100.00 | AA | 731,480 |
| | | Bonds, Series 2010B-2, 0.000%, 12/01/30 | | | |
1,000 | | Philadelphia Authority for Industrial Development, Pennsylvania, Airport Revenue Bonds, | 7/11 at 101.00 | A+ | 1,017,950 |
| | | Philadelphia Airport System Project, Series 2001A, 5.500%, 7/01/17 – FGIC Insured (Alternative | | | |
| | | Minimum Tax) | | | |
3,250 | | Philadelphia School District, Pennsylvania, General Obligation Bonds, Series 2002A, 5.500%, | 2/12 at 100.00 | AA+ (4) | 3,387,963 |
| | | 2/01/31 (Pre-refunded 2/01/12) – AGM Insured | | | |
5,250 | | Total Pennsylvania | | | 5,137,393 |
| | | Puerto Rico – 1.7% | | | |
1,035 | | Puerto Rico Housing Finance Authority, Capital Fund Program Revenue Bonds, Series 2003, | 12/13 at 100.00 | AA+ | 1,049,780 |
| | | 5.000%, 12/01/20 | | | |
1,965 | | Puerto Rico Housing Finance Authority, Capital Fund Program Revenue Bonds, Series 2003, | 12/13 at 100.00 | AAA | 2,174,469 |
| | | 5.000%, 12/01/20 (Pre-refunded 12/01/13) | | | |
15,000 | | Puerto Rico Sales Tax Financing Corporation, Sales Tax Revenue Bonds, Series 2007A, 0.000%, | No Opt. Call | Aa2 | 745,050 |
| | | 8/01/54 – AMBAC Insured | | | |
18,000 | | Total Puerto Rico | | | 3,969,299 |
| | | Rhode Island – 2.2% | | | |
5,835 | | Rhode Island Tobacco Settlement Financing Corporation, Tobacco Settlement Asset-Backed Bonds, | 6/12 at 100.00 | BBB | 5,072,073 |
| | | Series 2002A, 6.250%, 6/01/42 | | | |
| | | South Carolina – 5.0% | | | |
700 | | Dorchester County School District 2, South Carolina, Installment Purchase Revenue Bonds, | 12/14 at 100.00 | AA– | 735,693 |
| | | GROWTH, Series 2004, 5.250%, 12/01/20 | | | |
4,000 | | Greenville County School District, South Carolina, Installment Purchase Revenue Bonds, Series | 12/12 at 101.00 | AA (4) | 4,393,760 |
| | | 2002, 5.875%, 12/01/19 (Pre-refunded 12/01/12) | | | |
2,500 | | Lexington County Health Service District, South Carolina, Hospital Revenue Refunding and | 11/13 at 100.00 | A+ (4) | 2,836,875 |
| | | Improvement Bonds, Series 2003, 6.000%, 11/01/18 (Pre-refunded 11/01/13) | | | |
| | | Medical University Hospital Authority, South Carolina, FHA-Insured Mortgage Revenue Bonds, | | | |
| | | Series 2004A: | | | |
500 | | 5.250%, 8/15/20 – NPFG Insured | 8/14 at 100.00 | Baa1 | 513,835 |
2,435 | | 5.250%, 2/15/21 – NPFG Insured | 8/14 at 100.00 | Baa1 | 2,497,701 |
475 | | The College of Charleston, Charleston South Carolina, Academic and Administrative Revenue | 4/14 at 100.00 | A1 | 477,423 |
| | | Bonds, Series 2004B, 5.125%, 4/01/30 – SYNCORA GTY Insured | | | |
10,610 | | Total South Carolina | | | 11,455,287 |
| | | South Dakota – 0.4% | | | |
1,000 | | South Dakota Health and Educational Facilities Authority, Revenue Bonds, Sioux Valley | 11/14 at 100.00 | AA– | 940,740 |
| | | Hospitals, Series 2004A, 5.250%, 11/01/34 | | | |
Nuveen Investments 31
| | |
| | Nuveen Select Tax-Free Income Portfolio 2 (continued) |
NXQ | Portfolio of Investments March 31, 2011 |
| | | | | | |
Principal | | | Optional Call | | |
Amount (000) | | Description (1) | Provisions (2) | Ratings (3) | Value |
| | | Texas – 11.7% | | | |
$ 4,000 | | Brazos River Harbor Navigation District, Brazoria County, Texas, Environmental Facilities | 5/12 at 101.00 | BBB– | $ 3,976,600 |
| | | Revenue Bonds, Dow Chemical Company Project, Series 2002A-6, 6.250%, 5/15/33 (Mandatory | | | |
| | | put 5/15/17) (Alternative Minimum Tax) | | | |
1,500 | | Central Texas Regional Mobility Authority, Travis and Williamson Counties, Toll Road Revenue | 1/15 at 100.00 | BBB | 1,155,555 |
| | | Bonds, Series 2005, 5.000%, 1/01/45 – FGIC Insured | | | |
2,500 | | Harris County Health Facilities Development Corporation, Texas, Hospital Revenue Bonds, Texas | No Opt. Call | BBB (4) | 2,847,325 |
| | | Children’s Hospital, Series 1995, 5.500%, 10/01/16 – NPFG Insured (ETM) | | | |
3,000 | | Harris County Health Facilities Development Corporation, Texas, Thermal Utility Revenue Bonds, | 11/13 at 100.00 | AA | 2,959,230 |
| | | TECO Project, Series 2003, 5.000%, 11/15/30 – NPFG Insured | | | |
10,025 | | Harris County-Houston Sports Authority, Texas, Junior Lien Revenue Bonds, Series 2001H, | 11/31 at 53.78 | Baa1 | 803,805 |
| | | 0.000%, 11/15/41 – NPFG Insured | | | |
575 | | Houston, Texas, Hotel Occupancy Tax and Special Revenue Bonds, Convention and Entertainment | No Opt. Call | A2 | 244,070 |
| | | Project, Series 2001B, 0.000%, 9/01/24 – AMBAC Insured | | | |
2,000 | | Houston, Texas, Subordinate Lien Airport System Revenue Bonds, Series 2002A, 5.625%, 7/01/20 – | 7/12 at 100.00 | AA+ | 2,030,060 |
| | | AGM Insured (Alternative Minimum Tax) | | | |
3,125 | | Katy Independent School District, Harris, Fort Bend and Waller Counties, Texas, General | 2/12 at 100.00 | AAA | 3,247,219 |
| | | Obligation Bonds, Series 2002A, 5.000%, 2/15/32 (Pre-refunded 2/15/12) | | | |
1,400 | | Kerrville Health Facilities Development Corporation, Texas, Revenue Bonds, Sid Peterson | No Opt. Call | BBB– | 1,205,498 |
| | | Memorial Hospital Project, Series 2005, 5.375%, 8/15/35 | | | |
90 | | Lewisville Independent School District, Denton County, Texas, General Obligation Bonds, Series | 8/11 at 100.00 | AAA | 91,051 |
| | | 2004, 5.000%, 8/15/23 | | | |
335 | | Live Oak, Texas, General Obligation Bonds, Series 2004, 5.250%, 8/01/20 – NPFG Insured | 8/14 at 100.00 | Aa3 | 346,541 |
4,850 | | Sam Rayburn Municipal Power Agency, Texas, Power Supply System Revenue Refunding Bonds, Series | 10/12 at 100.00 | BBB | 4,954,906 |
| | | 2002A, 5.500%, 10/01/17 – RAAI Insured | | | |
1,000 | | San Antonio, Texas, Water System Revenue Bonds, Series 2005, 4.750%, 5/15/37 – NPFG Insured | 5/15 at 100.00 | Aa1 | 957,380 |
500 | | Texas Water Development Board, Senior Lien State Revolving Fund Revenue Bonds, Series 2000A, | 7/11 at 100.00 | AAA | 502,125 |
| | | 5.625%, 7/15/13 | | | |
1,560 | | Texas, General Obligation Bonds, Water Financial Assistance Program, Series 2003A, 5.125%, | 8/13 at 100.00 | Aaa | 1,413,781 |
| | | 8/01/42 (Alternative Minimum Tax) | | | |
36,460 | | Total Texas | | | 26,735,146 |
| | | Utah – 0.7% | | | |
1,435 | | Salt Lake City and Sandy Metropolitan Water District, Utah, Water Revenue Bonds, Series 2004, | 7/14 at 100.00 | Aa2 | 1,511,514 |
| | | 5.000%, 7/01/21 – AMBAC Insured | | | |
| | | Vermont – 0.4% | | | |
915 | | Vermont Housing Finance Agency, Multifamily Housing Bonds, Series 1999C, 5.800%, 8/15/16 – | 8/11 at 100.00 | AA+ | 916,748 |
| | | AGM Insured | | | |
| | | Virginia – 0.8% | | | |
470 | | Metropolitan District of Columbia Airports Authority, Virginia, Airport System Revenue Bonds, | 10/11 at 100.00 | N/R | 455,872 |
| | | Series 1998B, 5.000%, 10/01/28 – NPFG Insured (Alternative Minimum Tax) | | | |
1,500 | | Metropolitan Washington DC Airports Authority, Virginia, Dulles Toll Road Revenue Bonds, | 10/26 at 100.00 | AA+ | 1,054,755 |
| | | Series 2009C, 0.000%, 10/01/41 – AGC Insured | | | |
250 | | Norfolk, Virginia, Water Revenue Bonds, Series 1995, 5.750%, 11/01/13 – NPFG Insured | 5/11 at 100.00 | Aa2 | 251,020 |
2,220 | | Total Virginia | | | 1,761,647 |
| | | Washington – 3.0% | | | |
6,715 | | Washington State Health Care Facilities Authority, Revenue Bonds, Sisters of Providence Health | 10/11 at 100.00 | AA | 6,827,542 |
| | | System, Series 2001A, 5.125%, 10/01/17 – NPFG Insured | | | |
32 Nuveen Investments
| | | | | | |
Principal | | | Optional Call | | |
Amount (000) | | Description (1) | Provisions (2) | Ratings (3) | Value |
| | | Wisconsin – 0.7% | | | |
$ 1,000 | | Wisconsin Health and Educational Facilities Authority, Revenue Bonds, Wheaton Franciscan | 8/13 at 100.00 | BBB+ | $ 1,005,660 |
| | | Services Inc., Series 2003A, 5.500%, 8/15/18 | | | |
680 | | Wisconsin Housing and Economic Development Authority, Home Ownership Revenue Bonds, Series | 3/12 at 100.00 | AA | 688,357 |
| | | 2002G, 4.850%, 9/01/17 | | | |
1,680 | | Total Wisconsin | | | 1,694,017 |
$ 293,935 | | Total Municipal Bonds (cost $242,919,749) | | | 225,675,033 |
| | | | | | |
Shares | | Description | | | Value |
| | | Common Stocks – 0.0% | | | |
| | | Airlines – 0.0% | | | |
117 | | United Continental Holdings Inc. (6), (7) | | | $ 2,690 |
| | | Total Common Stocks (cost $0) | | | 2,690 |
| | | Total Investments (cost $242,919,749) – 99.0% | | | 225,677,723 |
| | | Floating Rate Obligations – (0.4)% | | | (1,000,000) |
| | | Other Assets Less Liabilities – 1.4% | | | 3,337,875 |
| | | Net Assets – 100% | | | $ 228,015,598 |
| (1) | All percentages shown in the Portfolio of Investments are based on net assets. |
| (2) | Optional Call Provisions (not covered by the report of independent registered public accounting firm): Dates (month and year) and prices of the earliest optional call or redemption. There may be other call provisions at varying prices at later dates. Certain mortgage-backed securities may be subject to periodic principal paydowns. |
| (3) | Ratings (not covered by the report of independent registered public accounting firm): Using the highest of Standard & Poor’s Group (“Standard & Poor’s”), Moody’s Investor Service, Inc. (“Moody’s”) or Fitch, Inc. (“Fitch”) rating. Ratings below BBB by Standard & Poor’s, Baa by Moody’s or BBB by Fitch are considered to be below investment grade. Holdings designated N/R are not rated by any of these national rating agencies. |
| (4) | Backed by an escrow or trust containing sufficient U.S. Government or U.S. Government agency securities, which ensure the timely payment of principal and interest. Such investments are normally considered to be equivalent to AAA rated securities. |
| (5) | The Fund’s Adviser has concluded this issue is not likely to meet its future interest payment obligations and has directed the Fund’s custodian to cease accruing additional income on the Fund’s records. |
| (6) | On December 9, 2002, UAL Corporation (“UAL”), the holding company of United Air Lines, Inc. (“United”) filed for federal bankruptcy protection. The Adviser determined that it was likely that United would not remain current on their interest payment obligations with respect to the bonds previously held and thus the Fund had stopped accruing interest on its UAL bonds. On February 1, 2006, UAL emerged from federal bankruptcy with the acceptance of its reorganization plan by the bankruptcy court. Under the settlement agreement established to meet UAL’s unsecured bond obligations, the bondholders, including the Fund, received three distributions of UAL common stock over the subsequent months, and the bankruptcy court dismissed all unsecured claims of bondholders, including those of the Fund. On May 5, 2006, the Fund liquidated such UAL common stock holdings. On September 29, 2006 and May 30, 2007, the Fund received additional distributions of 1,825 and 592 shares, respectively, of UAL common stock as a result of its earlier ownership of the UAL bonds. The Fund liquidated the 1,825 shares of such UAL common stock holdings on November 15, 2006. The Fund received an additional distribution of 165 UAL common stock shares on November 14, 2007. The remaining 757 shares of UAL common stock were liquidated by the Fund on March 30, 2010. The Fund received an additional distribution of 117 UAL common stock shares on July 20, 2010, which are still held by the Fund as of March 31, 2011. On October 1, 2010, UAL Corporation was renamed United Continental Holdings, Inc. |
| (7) | Non-income producing; issuer has not declared a dividend within the past twelve months. |
| (ETM) | Escrowed to maturity. |
| (IF) | Inverse floating rate investment. |
| (UB) | Underlying bond of an inverse floating rate trust reflected as a financing transaction. See Notes to Financial Statements, Footnote 1 – General Information and Significant Accounting Policies, Inverse Floating Rate Securities for more information. |
See accompanying notes to financial statements.
Nuveen Investments 33
| | |
| | Nuveen Select Tax-Free Income Portfolio 3 |
NXR | Portfolio of Investments |
| | March 31, 2011 |
| | | | | | |
Principal | | | Optional Call | | |
Amount (000) | | Description (1) | Provisions (2) | Ratings (3) | Value |
| | | Municipal Bonds – 98.6% | | | |
| | | Alabama – 0.3% | | | |
$ 500 | | Marshall County Healthcare Authority, Alabama, Revenue Bonds, Series 2002A, 6.250%, 1/01/22 | 1/12 at 101.00 | A– | $ 509,315 |
| | | California – 10.2% | | | |
2,105 | | Azusa Unified School District, Los Angeles County, California, General Obligation Bonds, | 7/12 at 100.00 | AA+ | 2,193,663 |
| | | Series 2002, 5.375%, 7/01/21 – AGM Insured | | | |
1,000 | | California County Tobacco Securitization Agency, Tobacco Settlement Asset-Backed Bonds, Los | 12/18 at 100.00 | Baa3 | 715,780 |
| | | Angeles County Securitization Corporation, Series 2006A, 5.600%, 6/01/36 | | | |
1,000 | | California County Tobacco Securitization Agency, Tobacco Settlement Asset-Backed Bonds, Sonoma | 6/15 at 100.00 | BBB | 774,930 |
| | | County Tobacco Securitization Corporation, Series 2005, 5.000%, 6/01/26 | | | |
3,350 | | California Department of Water Resources, Power Supply Revenue Bonds, Series 2002A, 6.000%, | 5/12 at 101.00 | AA– (4) | 3,587,147 |
| | | 5/01/14 (Pre-refunded 5/01/12) | | | |
2,595 | | California Health Facilities Financing Authority, Revenue Bonds, Kaiser Permanante System, | 4/16 at 100.00 | A+ | 2,183,693 |
| | | Series 2006, 5.000%, 4/01/37 | | | |
1,000 | | California Statewide Community Development Authority, Revenue Bonds, Methodist Hospital | 8/19 at 100.00 | Aa2 | 1,083,960 |
| | | Project, Series 2009, 6.750%, 2/01/38 | | | |
320 | | California Statewide Financing Authority, Tobacco Settlement Asset-Backed Bonds, Pooled | No Opt. Call | Baa3 | 286,694 |
| | | Tobacco Securitization Program, Series 2002A, 5.625%, 5/01/29 | | | |
1,605 | | Golden State Tobacco Securitization Corporation, California, Enhanced Tobacco Settlement | No Opt. Call | A2 | 461,951 |
| | | Asset-Backed Revenue Bonds, Series 2005A, 0.000%, 6/01/28 – AMBAC Insured | | | |
3,000 | | Golden State Tobacco Securitization Corporation, California, Tobacco Settlement Asset-Backed | 6/13 at 100.00 | AAA | 3,379,500 |
| | | Bonds, Series 2003A-1, 6.750%, 6/01/39 (Pre-refunded 6/01/13) | | | |
| | | Golden State Tobacco Securitization Corporation, California, Tobacco Settlement Asset-Backed | | | |
| | | Bonds, Series 2007A-1: | | | |
770 | | 4.500%, 6/01/27 | 6/17 at 100.00 | BBB– | 574,405 |
1,885 | | 5.000%, 6/01/33 | 6/17 at 100.00 | Baa3 | 1,264,515 |
1,500 | | Placer Union High School District, Placer County, California, General Obligation Bonds, Series | No Opt. Call | AA+ | 346,365 |
| | | 2004C, 0.000%, 8/01/32 – AGM Insured | | | |
3,940 | | Rancho Mirage Redevelopment Agency, California, Tax Allocation Bonds, Combined Whitewater and | No Opt. Call | A+ | 695,252 |
| | | 1984 Project Areas, Series 2003A-1, 0.000%, 4/01/35 – NPFG Insured | | | |
465 | | Riverside Public Financing Authority, California, University Corridor Tax Allocation Bonds, | 8/17 at 100.00 | Baa1 | 352,000 |
| | | Series 2007C, 5.000%, 8/01/37 – NPFG Insured | | | |
24,535 | | Total California | | | 17,899,855 |
| | | Colorado – 6.9% | | | |
1,540 | | Arkansas River Power Authority, Colorado, Power Revenue Bonds, Series 2006, 5.250%, 10/01/40 – | 10/16 at 100.00 | BBB | 1,232,062 |
| | | SYNCORA GTY Insured | | | |
400 | | Colorado Department of Transportation, Certificates of Participation, Series 2004, 5.000%, | 6/14 at 100.00 | AA– | 388,996 |
| | | 6/15/34 – NPFG Insured | | | |
1,000 | | Colorado Health Facilities Authority, Health Facilities Revenue Bonds, Sisters of Charity of | No Opt. Call | AA | 910,690 |
| | | Leavenworth Health Services Corporation, Series 2010A, 5.000%, 1/01/40 | | | |
| | | Colorado Health Facilities Authority, Revenue Bonds, Catholic Health Initiatives, Series 2002A: | | | |
2,265 | | 5.500%, 3/01/22 (Pre-refunded 3/02/12) | 3/12 at 100.00 | AA (4) | 2,362,689 |
1,735 | | 5.500%, 3/01/22 (Pre-refunded 3/01/12) | 3/12 at 100.00 | Aa2 (4) | 1,814,099 |
1,330 | | Denver City and County, Colorado, Airport System Revenue Bonds, Series 1991D, 7.750%, 11/15/13 | No Opt. Call | A+ | 1,435,788 |
| | | (Alternative Minimum Tax) | | | |
34 Nuveen Investments
| | | | | | |
Principal | | | Optional Call | | |
Amount (000) | | Description (1) | Provisions (2) | Ratings (3) | Value |
| | | Colorado (continued) | | | |
$ 3,000 | | Denver Convention Center Hotel Authority, Colorado, Senior Revenue Bonds, Convention Center | 12/13 at 100.00 | N/R (4) | $ 3,304,500 |
| | | Hotel, Series 2003A, 5.000%, 12/01/24 (Pre-refunded 12/01/13) – SYNCORA GTY Insured | | | |
2,585 | | E-470 Public Highway Authority, Colorado, Toll Revenue Bonds, Series 2004B, 0.000%, 9/01/28 – | 9/20 at 63.99 | Baa1 | 714,623 |
| | | NPFG Insured | | | |
13,855 | | Total Colorado | | | 12,163,447 |
| | | Connecticut – 0.1% | | | |
250 | | Connecticut Health and Educational Facilities Authority, Revenue Bonds, Bridgeport Hospital | 7/11 at 100.00 | Baa1 | 252,935 |
| | | Issue, Series 1992A, 6.625%, 7/01/18 – NPFG Insured | | | |
| | | District of Columbia – 0.3% | | | |
445 | | District of Columbia Tobacco Settlement Corporation, Tobacco Settlement Asset-Backed Bonds, | 5/11 at 101.00 | BBB | 424,303 |
| | | Series 2001, 6.250%, 5/15/24 | | | |
15 | | District of Columbia, General Obligation Bonds, Series 1993E, 6.000%, 6/01/13 – | 6/11 at 100.00 | AAA | 15,068 |
| | | NPFG Insured (ETM) | | | |
460 | | Total District of Columbia | | | 439,371 |
| | | Florida – 3.4% | | | |
1,000 | | Hillsborough County Industrial Development Authority, Florida, Hospital Revenue Bonds, Tampa | 10/16 at 100.00 | A3 | 843,110 |
| | | General Hospital, Series 2006, 5.250%, 10/01/41 | | | |
5,020 | | JEA St. John’s River Power Park System, Florida, Revenue Refunding Bonds, Issue 2, Series | 10/11 at 100.00 | Aa2 | 5,113,722 |
| | | 2002-17, 5.000%, 10/01/18 | | | |
6,020 | | Total Florida | | | 5,956,832 |
| | | Illinois – 18.9% | | | |
65 | | Chicago Metropolitan Housing Development Corporation, Illinois, FHA-Insured Section 8 Assisted | 7/11 at 100.00 | AA | 65,105 |
| | | Housing Development Revenue Refunding Bonds, Series 1992, 6.850%, 7/01/22 | | | |
1,930 | | Illinois Development Finance Authority, Revenue Bonds, Midwestern University, Series 2001B, | 5/11 at 101.00 | AAA | 1,961,324 |
| | | 5.750%, 5/15/16 (Pre-refunded 5/15/11) | | | |
1,050 | | Illinois Finance Authority, Revenue Bonds, Loyola University of Chicago, Tender Option Bond | No Opt. Call | Aa1 | 900,627 |
| | | Trust 1137, 9.166%, 7/01/15 (IF) | | | |
2,185 | | Illinois Finance Authority, Revenue Bonds, YMCA of Southwest Illinois, Series 2005, 5.000%, | 9/15 at 100.00 | Aa3 | 1,651,926 |
| | | 9/01/31 – RAAI Insured | | | |
4,435 | | Illinois Health Facilities Authority, Remarketed Revenue Bonds, University of Chicago Project, | 8/11 at 103.00 | Aa1 | 4,579,980 |
| | | Series 1985A, 5.500%, 8/01/20 | | | |
1,500 | | Illinois Health Facilities Authority, Revenue Bonds, Evangelical Hospitals Corporation, Series | No Opt. Call | N/R (4) | 1,829,415 |
| | | 1992C, 6.250%, 4/15/22 (ETM) | | | |
315 | | Illinois Health Facilities Authority, Revenue Bonds, Holy Family Medical Center, Series 1997, | 8/11 at 100.00 | Baa1 | 302,813 |
| | | 5.125%, 8/15/17 – NPFG Insured | | | |
2,255 | | Illinois Health Facilities Authority, Revenue Refunding Bonds, Elmhurst Memorial Healthcare, | 1/13 at 100.00 | Baa1 | 2,299,559 |
| | | Series 2002, 6.250%, 1/01/17 | | | |
730 | | Illinois Health Facilities Authority, Revenue Refunding Bonds, Rockford Health System, Series | 8/11 at 100.00 | N/R | 631,808 |
| | | 1997, 5.000%, 8/15/21 – AMBAC Insured | | | |
2,300 | | Illinois Housing Development Authority, Homeowner Mortgage Revenue Bonds, Series 2006C2, | 2/16 at 100.00 | AA | 2,242,408 |
| | | 5.050%, 8/01/27 (Alternative Minimum Tax) | | | |
5,700 | | Illinois, Sales Tax Revenue Bonds, First Series 2002, 5.000%, 6/15/22 | 6/13 at 100.00 | AAA | 5,775,182 |
1,000 | | Kankakee & Will Counties Community Unit School District 5, Illinois, General Obligation Bonds, | No Opt. Call | Aa3 | 501,730 |
| | | Series 2006, 0.000%, 5/01/23 – AGM Insured | | | |
Nuveen Investments 35
| | |
| | Nuveen Select Tax-Free Income Portfolio 3 (continued) |
NXR | Portfolio of Investments March 31, 2011 |
| | | | | | |
Principal | | | Optional Call | | |
Amount (000) | | Description (1) | Provisions (2) | Ratings (3) | Value |
| | | Illinois (continued) | | | |
| | | Metropolitan Pier and Exposition Authority, Illinois, Revenue Bonds, McCormick Place Expansion | | | |
| | | Project, Series 2002A: | | | |
$ 2,500 | | 0.000%, 12/15/30 – NPFG Insured | No Opt. Call | AAA | $ 734,975 |
5,000 | | 0.000%, 12/15/36 – NPFG Insured | No Opt. Call | AAA | 903,000 |
2,000 | | 0.000%, 6/15/37 – NPFG Insured | No Opt. Call | AAA | 346,740 |
6,000 | | Metropolitan Pier and Exposition Authority, Illinois, Revenue Refunding Bonds, McCormick Place | 6/12 at 101.00 | AAA | 6,102,777 |
| | | Expansion Project, Series 2002B, 5.000%, 6/15/21 – NPFG Insured | | | |
1,300 | | Schaumburg, Illinois, General Obligation Bonds, Series 2004B, 5.250%, 12/01/34 – FGIC Insured | 12/14 at 100.00 | Aaa | 1,305,057 |
1,000 | | Yorkville, Illinois, General Obligation Debt Certificates, Series 2003, 5.000%, 12/15/22 | 12/11 at 100.00 | N/R (4) | 1,033,160 |
| | | (Pre-refunded 12/15/11) – RAAI Insured | | | |
41,265 | | Total Illinois | | | 33,167,586 |
| | | Indiana – 6.1% | | | |
1,000 | | Franklin Community Multi-School Building Corporation, Marion County, Indiana, First Mortgage | 7/14 at 100.00 | A (4) | 1,129,740 |
| | | Revenue Bonds, Series 2004, 5.000%, 7/15/22 (Pre-refunded 7/15/14) – FGIC Insured | | | |
3,500 | | Indiana Health Facility Financing Authority, Hospital Revenue Bonds, Methodist Hospitals Inc., | 9/11 at 100.00 | BBB | 3,190,495 |
| | | Series 2001, 5.375%, 9/15/22 | | | |
1,900 | | Indiana Health Facility Financing Authority, Hospital Revenue Refunding Bonds, Columbus | No Opt. Call | AA+ | 2,115,175 |
| | | Regional Hospital, Series 1993, 7.000%, 8/15/15 – AGM Insured | | | |
2,000 | | Indianapolis Local Public Improvement Bond Bank, Indiana, Waterworks Project, Series 2002A, | 7/12 at 100.00 | AAA | 2,120,160 |
| | | 5.250%, 7/01/33 (Pre-refunded 7/01/12) – NPFG Insured | | | |
2,295 | | Shelbyville Central Renovation School Building Corporation, Indiana, First Mortgage Bonds, | 7/15 at 100.00 | AA+ | 2,253,002 |
| | | Series 2005, 4.375%, 7/15/25 – NPFG Insured | | | |
10,695 | | Total Indiana | | | 10,808,572 |
| | | Iowa – 5.2% | | | |
2,745 | | Iowa Finance Authority, Health Facility Revenue Bonds, Care Initiatives Project, Series 2006A, | 7/16 at 100.00 | BB+ | 2,329,517 |
| | | 5.000%, 7/01/20 | | | |
750 | | Iowa Tobacco Settlement Authority, Tobacco Asset-Backed Revenue Bonds, Series 2005B, | 6/17 at 100.00 | BBB | 596,498 |
| | | 5.600%, 6/01/34 | | | |
| | | Iowa Tobacco Settlement Authority, Tobacco Settlement Asset-Backed Revenue Bonds, | | | |
| | | Series 2001B: | | | |
3,255 | | 5.300%, 6/01/25 (Pre-refunded 6/01/11) | 6/11 at 101.00 | AAA | 3,312,288 |
2,850 | | 5.600%, 6/01/35 (Pre-refunded 6/01/11) | 6/11 at 101.00 | AAA | 2,903,495 |
9,600 | | Total Iowa | | | 9,141,798 |
| | | Kansas – 1.1% | | | |
| | | Lawrence, Kansas, Hospital Revenue Bonds, Lawrence Memorial Hospital, Refunding Series 2006: | | | |
1,425 | | 5.125%, 7/01/26 | 7/16 at 100.00 | A2 | 1,382,350 |
700 | | 4.875%, 7/01/36 | 7/16 at 100.00 | A2 | 607,992 |
2,125 | | Total Kansas | | | 1,990,342 |
| | | Maine – 0.1% | | | |
90 | | Maine Health and Higher Educational Facilities Authority, Revenue Bonds, Series 1999B, 6.000%, | 7/11 at 100.00 | Aaa | 90,781 |
| | | 7/01/19 – NPFG Insured | | | |
| | | Massachusetts – 0.9% | | | |
1,000 | | Massachusetts Development Finance Agency, Resource Recovery Revenue Bonds, Ogden Haverhill | 6/11 at 100.00 | A– | 1,000,370 |
| | | Associates, Series 1998B, 5.200%, 12/01/13 (Alternative Minimum Tax) | | | |
15 | | Massachusetts Health and Educational Facilities Authority, Revenue Bonds, Partners HealthCare | 7/11 at 101.00 | AA | 15,305 |
| | | System Inc., Series 2001C, 6.000%, 7/01/17 | | | |
485 | | Massachusetts Health and Educational Facilities Authority, Revenue Bonds, Partners HealthCare | 7/11 at 101.00 | AAA | 496,781 |
| | | System Inc., Series 2001C, 6.000%, 7/01/17 (Pre-refunded 7/01/11) | | | |
1,500 | | Total Massachusetts | | | 1,512,456 |
36 Nuveen Investments
| | | | | | |
Principal | | | Optional Call | | |
Amount (000) | | Description (1) | Provisions (2) | Ratings (3) | Value |
| | | Michigan – 2.5% | | | |
$ 1,500 | | Detroit, Michigan, Sewer Disposal System Revenue Bonds, Second Lien, Series 2006B, 4.625%, | 7/16 at 100.00 | A | $ 1,258,755 |
| | | 7/01/34 – FGIC Insured | | | |
2,900 | | Michigan State Hospital Finance Authority, Hospital Revenue Refunding Bonds, Trinity Health | 12/12 at 100.00 | AA | 2,812,478 |
| | | Credit Group, Series 2002C, 5.375%, 12/01/30 | | | |
250 | | Royal Oak Hospital Finance Authority, Michigan, Hospital Revenue Bonds, William Beaumont | 9/18 at 100.00 | A1 | 282,778 |
| | | Hospital, Refunding Series 2009V, 8.250%, 9/01/39 | | | |
4,650 | | Total Michigan | | | 4,354,011 |
| | | Mississippi – 0.4% | | | |
725 | | Mississippi Hospital Equipment and Facilities Authority, Revenue Bonds, Baptist Memorial | 9/14 at 100.00 | AA | 734,273 |
| | | Healthcare, Series 2004B-1, 5.000%, 9/01/24 | | | |
| | | Nebraska – 2.0% | | | |
3,500 | | Nebraska Public Power District, General Revenue Bonds, Series 2002B, 5.000%, 1/01/33 – | 1/13 at 100.00 | A1 | 3,500,315 |
| | | AMBAC Insured | | | |
| | | Nevada – 3.7% | | | |
1,000 | | Clark County, Nevada, Passenger Facility Charge Revenue Bonds, Las Vegas-McCarran | 1/20 at 100.00 | Aa3 | 902,390 |
| | | International Airport, Series 2010A, 5.250%, 7/01/42 | | | |
4,095 | | Director of Nevada State Department of Business and Industry, Revenue Bonds, Las Vegas | 7/11 at 100.00 | N/R | 912,325 |
| | | Monorail Project, First Tier, Series 2000, 5.375%, 1/01/40 – AMBAC Insured (5) | | | |
1,680 | | Reno, Nevada, Capital Improvement Revenue Bonds, Series 2002, 5.500%, 6/01/22 – FGIC Insured | 6/12 at 100.00 | A | 1,685,947 |
2,830 | | Reno, Nevada, Capital Improvement Revenue Bonds, Series 2002, 5.500%, 6/01/22 (Pre-refunded | 6/12 at 100.00 | A3 (4) | 2,995,781 |
| | | 6/01/12) – FGIC Insured | | | |
9,605 | | Total Nevada | | | 6,496,443 |
| | | New Hampshire – 0.2% | | | |
430 | | New Hampshire Housing Finance Authority, Single Family Mortgage Acquisition Bonds, Series | 5/11 at 100.00 | Aa2 | 438,854 |
| | | 2001A, 5.600%, 7/01/21 (Alternative Minimum Tax) | | | |
| | | New Jersey – 1.5% | | | |
| | | Tobacco Settlement Financing Corporation, New Jersey, Tobacco Settlement Asset-Backed Bonds, | | | |
| | | Series 2003: | | | |
1,000 | | 6.750%, 6/01/39 (Pre-refunded 6/01/13) | 6/13 at 100.00 | AAA | 1,130,200 |
1,355 | | 6.250%, 6/01/43 (Pre-refunded 6/01/13) | 6/13 at 100.00 | AAA | 1,516,882 |
2,355 | | Total New Jersey | | | 2,647,082 |
| | | New Mexico – 2.7% | | | |
1,000 | | New Mexico Mortgage Finance Authority, Multifamily Housing Revenue Bonds, St Anthony, Series | 9/17 at 100.00 | N/R | 810,050 |
| | | 2007A, 5.250%, 9/01/42 (Alternative Minimum Tax) | | | |
4,000 | | University of New Mexico, FHA-Insured Mortgage Hospital Revenue Bonds, Series 2004, 4.625%, | 7/14 at 100.00 | AA+ | 4,002,120 |
| | | 1/01/25 – AGM Insured | | | |
5,000 | | Total New Mexico | | | 4,812,170 |
| | | New York – 3.1% | | | |
1,000 | | Dormitory Authority of the State of New York, FHA Insured Mortgage Hospital Revenue Bonds, | 8/16 at 100.00 | AAA | 886,310 |
| | | Kaleida Health, Series 2006, 4.700%, 2/15/35 | | | |
2,335 | | Long Island Power Authority, New York, Electric System General Revenue Bonds, Series 2001A, | 9/11 at 100.00 | AAA | 2,384,549 |
| | | 5.375%, 9/01/21 (Pre-refunded 9/01/11) | | | |
35 | | New York City, New York, General Obligation Bonds, Series 1991B, 7.000%, 2/01/18 | 8/11 at 100.00 | AA | 35,178 |
1,850 | | New York State Tobacco Settlement Financing Corporation, Tobacco Settlement Asset-Backed and | 6/11 at 100.00 | AA– | 1,856,586 |
| | | State Contingency Contract-Backed Bonds, Series 2003B-1C, 5.500%, 6/01/15 | | | |
Nuveen Investments 37
| | |
| | Nuveen Select Tax-Free Income Portfolio 3 (continued) |
NXR | Portfolio of Investments March 31, 2011 |
| | | | | | |
Principal | | | Optional Call | | |
Amount (000) | | Description (1) | Provisions (2) | Ratings (3) | Value |
| | | New York (continued) | | | |
$ 265 | | Port Authority of New York and New Jersey, Special Project Bonds, JFK International Air | 12/20 at 100.00 | BBB– | $ 251,350 |
| | | Terminal LLC Project, Eighth Series 2010, 6.000%, 12/01/42 | | | |
5,485 | | Total New York | | | 5,413,973 |
| | | North Carolina – 4.4% | | | |
5,000 | | North Carolina Municipal Power Agency 1, Catawba Electric Revenue Bonds, Series 2003A, 5.250%, | 1/13 at 100.00 | A | 5,302,849 |
| | | 1/01/18 – NPFG Insured | | | |
2,345 | | Piedmont Triad Airport Authority, North Carolina, Airport Revenue Bonds, Series 2001A, 5.250%, | 7/11 at 101.00 | AA+ | 2,393,002 |
| | | 7/01/16 – AGM Insured | | | |
7,345 | | Total North Carolina | | | 7,695,851 |
| | | Ohio – 1.9% | | | |
| | | Buckeye Tobacco Settlement Financing Authority, Ohio, Tobacco Settlement Asset-Backed Revenue | | | |
| | | Bonds, Senior Lien, Series 2007A-2: | | | |
1,345 | | 5.375%, 6/01/24 | 6/17 at 100.00 | Baa3 | 1,053,256 |
1,355 | | 6.000%, 6/01/42 | 6/17 at 100.00 | Baa3 | 932,186 |
2,280 | | Buckeye Tobacco Settlement Financing Authority, Ohio, Tobacco Settlement Asset-Backed Revenue | 6/22 at 100.00 | Baa3 | 1,432,228 |
| | | Bonds, Senior Lien, Series 2007A-3, 0.000%, 6/01/37 | | | |
4,980 | | Total Ohio | | | 3,417,670 |
| | | Oklahoma – 1.7% | | | |
3,000 | | Oklahoma Development Finance Authority, Revenue Bonds, St. John Health System, Series 2004, | 2/14 at 100.00 | A | 3,007,770 |
| | | 5.000%, 2/15/24 | | | |
| | | Pennsylvania – 2.9% | | | |
2,435 | | Dauphin County Industrial Development Authority, Pennsylvania, Water Development Revenue | No Opt. Call | A– | 2,778,992 |
| | | Refunding Bonds, Dauphin Consolidated Water Supply Company, Series 1992B, 6.700%, 6/01/17 | | | |
500 | | Pennsylvania Higher Educational Facilities Authority, Revenue Bonds, Widener University, | 7/13 at 100.00 | BBB+ | 503,060 |
| | | Series 2003, 5.250%, 7/15/24 | | | |
1,000 | | Pennsylvania Turnpike Commission, Motor License Fund-Enhanced Subordinate Special Revenue | 12/20 at 100.00 | AA | 731,480 |
| | | Bonds, Series 2010B-2, 0.000%, 12/01/30 | | | |
1,000 | | Philadelphia Authority for Industrial Development, Pennsylvania, Airport Revenue Bonds, | 7/11 at 101.00 | A+ | 1,017,950 |
| | | Philadelphia Airport System Project, Series 2001A, 5.500%, 7/01/17 – FGIC Insured (Alternative | | | |
| | | Minimum Tax) | | | |
4,935 | | Total Pennsylvania | | | 5,031,482 |
| | | Puerto Rico – 0.9% | | | |
1,000 | | Puerto Rico Sales Tax Financing Corporation, Sales Tax Revenue Bonds, First Subordinate Series | 8/19 at 100.00 | A+ | 988,760 |
| | | 2009A, 6.000%, 8/01/42 | | | |
| | | Puerto Rico Sales Tax Financing Corporation, Sales Tax Revenue Bonds, Series 2007A: | | | |
1,170 | | 0.000%, 8/01/40 – NPFG Insured | No Opt. Call | Aa2 | 163,625 |
8,430 | | 0.000%, 8/01/54 – AMBAC Insured | No Opt. Call | Aa2 | 418,718 |
10,600 | | Total Puerto Rico | | | 1,571,103 |
| | | South Carolina – 3.2% | | | |
1,500 | | Lexington County Health Service District, South Carolina, Hospital Revenue Refunding and | 11/13 at 100.00 | A+ (4) | 1,702,125 |
| | | Improvement Bonds, Series 2003, 6.000%, 11/01/18 (Pre-refunded 11/01/13) | | | |
1,500 | | Medical University Hospital Authority, South Carolina, FHA-Insured Mortgage Revenue Bonds, | 8/14 at 100.00 | Baa1 | 1,541,505 |
| | | Series 2004A, 5.250%, 8/15/20 – NPFG Insured | | | |
520 | | South Carolina JOBS Economic Development Authority, Economic Development Revenue Bonds, Bon | 11/12 at 100.00 | A3 (4) | 561,808 |
| | | Secours Health System Inc., Series 2002A, 5.625%, 11/15/30 (Pre-refunded 11/15/12) | | | |
38 Nuveen Investments
| | | | | | |
Principal | | | Optional Call | | |
Amount (000) | | Description (1) | Provisions (2) | Ratings (3) | Value |
| | | South Carolina (continued) | | | |
$ 1,980 | | South Carolina JOBS Economic Development Authority, Economic Development Revenue Bonds, Bon | 11/12 at 100.00 | A– | $ 1,868,764 |
| | | Secours Health System Inc., Series 2002B, 5.625%, 11/15/30 | | | |
5,500 | | Total South Carolina | | | 5,674,202 |
| | | South Dakota – 1.1% | | | |
1,010 | | South Dakota Health and Educational Facilities Authority, Revenue Bonds, Avera Health, Series | 7/12 at 101.00 | A+ | 962,783 |
| | | 2002, 5.125%, 7/01/27 – AMBAC Insured | | | |
1,000 | | South Dakota Health and Educational Facilities Authority, Revenue Bonds, Sioux Valley | 11/14 at 100.00 | AA– | 940,740 |
| | | Hospitals, Series 2004A, 5.250%, 11/01/34 | | | |
2,010 | | Total South Dakota | | | 1,903,523 |
| | | Tennessee – 1.2% | | | |
2,000 | | Knox County Health, Educational and Housing Facilities Board, Tennessee, Hospital Revenue | 4/12 at 101.00 | A1 | 2,090,840 |
| | | Bonds, Baptist Health System of East Tennessee Inc., Series 2002, 6.375%, 4/15/22 | | | |
| | | Texas – 10.0% | | | |
1,500 | | Central Texas Regional Mobility Authority, Travis and Williamson Counties, Toll Road Revenue | 1/15 at 100.00 | BBB | 1,155,555 |
| | | Bonds, Series 2005, 5.000%, 1/01/45 – FGIC Insured | | | |
2,500 | | Harris County Health Facilities Development Corporation, Texas, Thermal Utility Revenue Bonds, | 11/13 at 100.00 | AA | 2,466,025 |
| | | TECO Project, Series 2003, 5.000%, 11/15/30 – NPFG Insured | | | |
1,525 | | Harris County-Houston Sports Authority, Texas, Junior Lien Revenue Bonds, Series 2001H, | 11/31 at 73.51 | Baa1 | 173,149 |
| | | 0.000%, 11/15/36 – NPFG Insured | | | |
4,005 | | Harris County-Houston Sports Authority, Texas, Senior Lien Revenue Refunding Bonds, Series | 11/30 at 61.17 | Baa1 | 476,795 |
| | | 2001A, 0.000%, 11/15/38 – NPFG Insured | | | |
125 | | Harris County-Houston Sports Authority, Texas, Third Lien Revenue Bonds, Series 2004-A3, | 11/24 at 62.71 | Baa1 | 20,558 |
| | | 0.000%, 11/15/32 – NPFG Insured | | | |
3,000 | | Houston, Texas, Subordinate Lien Airport System Revenue Bonds, Series 2002B, 5.500%, 7/01/18 – | 7/12 at 100.00 | AA+ | 3,153,930 |
| | | AGM Insured | | | |
3,125 | | Katy Independent School District, Harris, Fort Bend and Waller Counties, Texas, General | 2/12 at 100.00 | AAA | 3,247,219 |
| | | Obligation Bonds, Series 2002A, 5.000%, 2/15/32 (Pre-refunded 2/15/12) | | | |
4,750 | | Sam Rayburn Municipal Power Agency, Texas, Power Supply System Revenue Refunding Bonds, Series | 10/12 at 100.00 | BBB | 4,852,742 |
| | | 2002A, 5.500%, 10/01/17 – RAAI Insured | | | |
1,750 | | Texas, General Obligation Bonds, Water Financial Assistance Program, Series 2003A, 5.125%, | 8/13 at 100.00 | Aaa | 1,585,973 |
| | | 8/01/42 (Alternative Minimum Tax) | | | |
500 | | Victoria, Texas, General Obligation Bonds, Series 2001, 5.000%, 8/15/23 (Pre-refunded | 8/11 at 100.00 | AA (4) | 508,780 |
| | | 8/15/11) – FGIC Insured | | | |
22,780 | | Total Texas | | | 17,640,726 |
| | | Washington – 0.3% | | | |
510 | | Port of Seattle, Washington, Revenue Bonds, Series 2001A, 5.000%, 4/01/31 – FGIC Insured | 10/11 at 100.00 | Aa2 | 501,141 |
Nuveen Investments 39
| | |
| | Nuveen Select Tax-Free Income Portfolio 3 (continued) |
NXR | Portfolio of Investments March 31, 2011 |
| | | | | | |
Principal | | | Optional Call | | |
Amount (000) | | Description (1) | Provisions (2) | Ratings (3) | Value |
| | | Wisconsin – 1.4% | | | |
$ 2,500 | | Wisconsin, General Obligation Refunding Bonds, Series 2003-3, 5.000%, 11/01/26 | 11/13 at 100.00 | AA | $ 2,548,075 |
$ 208,805 | | Total Municipal Bonds (cost $177,339,204) | | | 173,412,794 |
| | | | | | |
Shares | | Description | | | Value |
| | | Common Stocks – 0.0% | | | |
| | | Airlines – 0.0% | | | |
34 | | United Continental Holdings Inc. (6), (7) | | | $ 782 |
| | | Total Common Stocks (cost $0) | | | 782 |
| | | Total Investments (cost $177,339,204) – 98.6% | | | 173,413,576 |
| | | Other Assets Less Liabilities – 1.4% | | | 2,432,471 |
| | | Net Assets – 100% | | | $ 175,846,047 |
| (1) | All percentages shown in the Portfolio of Investments are based on net assets. |
| (2) | Optional Call Provisions (not covered by the report of independent registered public accounting firm): Dates (month and year) and prices of the earliest optional call or redemption. There may be other call provisions at varying prices at later dates. Certain mortgage-backed securities may be subject to periodic principal paydowns. |
| (3) | Ratings (not covered by the report of independent registered public accounting firm): Using the highest of Standard & Poor’s Group (“Standard & Poor’s”), Moody’s Investor Service, Inc. (“Moody’s”) or Fitch, Inc. (“Fitch”) rating. Ratings below BBB by Standard & Poor’s, Baa by Moody’s or BBB by Fitch are considered to be below investment grade. Holdings designated N/R are not rated by any of these national rating agencies. |
| (4) | Backed by an escrow or trust containing sufficient U.S. Government or U.S. Government agency securities, which ensure the timely payment of principal and interest. Such investments are normally considered to be equivalent to AAA rated securities. |
| (5) | The Fund’s Adviser has concluded this issue is not likely to meet its future interest payment obligations and has directed the Fund’s custodian to cease accruing additional income on the Fund’s records. |
| (6) | On December 9, 2002, UAL Corporation (“UAL”), the holding company of United Air Lines, Inc. (“United”) filed for federal bankruptcy protection. The Adviser determined that it was likely that United would not remain current on their interest payment obligations with respect to the bonds previously held and thus the Fund had stopped accruing interest on its UAL bonds. On February 1, 2006, UAL emerged from federal bankruptcy with the acceptance of its reorganization plan by the bankruptcy court. Under the settlement agreement established to meet UAL’s unsecured bond obligations, the bondholders, including the Fund, received three distributions of UAL common stock over the subsequent months, and the bankruptcy court dismissed all unsecured claims of bondholders, including those of the Fund. On May 5, 2006, the Fund liquidated such UAL common stock holdings. On September 29, 2006 and May 30, 2007, the Fund received additional distributions of 532 and 172 shares, respectively, of UAL common stock as a result of its earlier ownership of the UAL bonds. The Fund liquidated the 532 shares of such UAL common stock holdings on November 15, 2006. The Fund received an additional distribution of 48 UAL common stock shares on November 14, 2007. The remaining 220 shares of UAL common stock were liquidated by the Fund on March 30, 2010. The Fund received an additional distribution of 34 UAL common stock shares on July 20, 2010, which are still held by the Fund as of March 31, 2011. On October 1, 2010, UAL Corporation was renamed United Continental Holdings, Inc. |
| (7) | Non-income producing; issuer has not declared a dividend within the past twelve months. |
| (ETM) | Escrowed to maturity. |
| (IF) | Inverse floating rate investment. |
See accompanying notes to financial statements.
| | | | | | |
| | | Nuveen California Select Tax-Free Income Portfolio | | |
NXC | | Portfolio of Investments | | |
| | | March 31, 2011 | |
| | | | | | |
Principal | | | Optional Call | | |
Amount (000) | | Description (1) | Provisions (2) | Ratings (3) | Value |
| | | Consumer Staples – 4.2% | | | |
$ 155 | | California County Tobacco Securitization Agency, Tobacco Settlement Asset-Backed Bonds, Sonoma | 6/15 at 100.00 | BBB | $ 142,394 |
| | | County Tobacco Securitization Corporation, Series 2005, 4.250%, 6/01/21 | | | |
1,080 | | California County Tobacco Securitization Agency, Tobacco Settlement Asset-Backed Revenue | 6/12 at 100.00 | BBB | 1,065,701 |
| | | Bonds, Fresno County Tobacco Funding Corporation, Series 2002, 5.625%, 6/01/23 | | | |
4,045 | | Golden State Tobacco Securitization Corporation, California, Tobacco Settlement Asset-Backed | 6/22 at 100.00 | Baa3 | 2,315,358 |
| | | Bonds, Series 2007A-2, 0.000%, 6/01/37 | | | |
5,280 | | Total Consumer Staples | | | 3,523,453 |
| | | Education and Civic Organizations – 9.6% | | | |
3,000 | | California Educational Facilities Authority, Revenue Bonds, Santa Clara University, Series | 4/18 at 100.00 | Aa3 | 3,062,550 |
| | | 2008A, 5.625%, 4/01/37 | | | |
45 | | California Educational Facilities Authority, Revenue Bonds, University of Redlands, Series | 10/15 at 100.00 | A3 | 37,477 |
| | | 2005A, 5.000%, 10/01/35 | | | |
1,000 | | California Educational Facilities Authority, Revenue Bonds, University of San Diego, Series | 10/12 at 100.00 | A2 | 1,005,420 |
| | | 2002A, 5.500%, 10/01/32 | | | |
| | | California Educational Facilities Authority, Revenue Bonds, University of the Pacific, Series 2006: | | | |
35 | | 5.000%, 11/01/21 | 11/15 at 100.00 | A2 | 35,786 |
45 | | 5.000%, 11/01/25 | 11/15 at 100.00 | A2 | 45,062 |
3,000 | | California Infrastructure Economic Development Bank, Revenue Bonds, J. David Gladstone | 10/11 at 101.00 | A– | 3,051,480 |
| | | Institutes, Series 2001, 5.500%, 10/01/19 | | | |
1,000 | | Long Beach Bond Financing Authority, California, Lease Revenue Refunding Bonds, Long Beach | 11/11 at 101.00 | BBB | 874,100 |
| | | Aquarium of the South Pacific, Series 2001, 5.250%, 11/01/30 – AMBAC Insured | | | |
8,125 | | Total Education and Civic Organizations | | | 8,111,875 |
| | | Health Care – 14.1% | | | |
110 | | California Health Facilities Financing Authority, Revenue Bonds, Kaiser Permanante System, | 4/16 at 100.00 | A+ | 92,565 |
| | | Series 2006, 5.000%, 4/01/37 | | | |
2,550 | | California Health Facilities Financing Authority, Revenue Bonds, Sutter Health, Series 2007A, | 11/16 at 100.00 | AA– | 2,199,579 |
| | | 5.250%, 11/15/46 (UB) | | | |
2,000 | | California Infrastructure Economic Development Bank, Revenue Bonds, Kaiser Hospital Assistance | 8/11 at 102.00 | A+ | 1,903,920 |
| | | LLC, Series 2001A, 5.550%, 8/01/31 | | | |
1,500 | | California Statewide Community Development Authority, Hospital Revenue Bonds, Monterey | 6/13 at 100.00 | AA+ | 1,587,240 |
| | | Peninsula Hospital, Series 2003B, 5.250%, 6/01/18 – AGM Insured | | | |
1,500 | | California Statewide Community Development Authority, Insured Mortgage Hospital Revenue Bonds, | 5/11 at 102.00 | A– | 1,458,315 |
| | | Mission Community Hospital, Series 2001, 5.375%, 11/01/26 | | | |
545 | | California Statewide Community Development Authority, Revenue Bonds, Kaiser Permanente System, | 8/16 at 100.00 | A+ | 492,566 |
| | | Series 2001C, 5.250%, 8/01/31 | | | |
1,880 | | California Statewide Community Development Authority, Revenue Bonds, Los Angeles Orthopaedic | 6/11 at 100.00 | BBB+ | 1,881,128 |
| | | Hospital Foundation, Series 2000, 5.500%, 6/01/17 – AMBAC Insured | | | |
540 | | Loma Linda, California, Hospital Revenue Bonds, Loma Linda University Medical Center, Series | 12/17 at 100.00 | BBB | 577,460 |
| | | 2008A, 8.250%, 12/01/38 | | | |
1,100 | | Palomar Pomerado Health Care District, California, Certificates of Participation, Series 2010, | 11/20 at 100.00 | Baa3 | 941,237 |
| | | 6.000%, 11/01/41 | | | |
800 | | Upland, California, Certificates of Participation, San Antonio Community Hospital, Series | 1/21 at 100.00 | A | 786,464 |
| | | 2011, 6.500%, 1/01/41 | | | |
12,525 | | Total Health Care | | | 11,920,474 |
| | | Housing/Multifamily – 1.3% | | | |
380 | | California Municipal Finance Authority, Mobile Home Park Revenue Bonds, Caritas Projects | 8/20 at 100.00 | BBB– | 343,129 |
| | | Series 2010A, 6.400%, 8/15/45 | | | |
750 | | California Statewide Community Development Authority, Student Housing Revenue Bonds, EAH – | 8/12 at 100.00 | Baa1 | 735,698 |
| | | Irvine East Campus Apartments, LLC Project, Series 2002A, 5.500%, 8/01/22 – ACA Insured | | | |
1,130 | | Total Housing/Multifamily | | | 1,078,827 |
Nuveen Investments 41
| | |
| | Nuveen California Select Tax-Free Income Portfolio (continued) |
NXC | Portfolio of Investments March 31, 2011 |
| | | | | | |
Principal | | | Optional Call | | |
Amount (000) | | Description (1) | Provisions (2) | Ratings (3) | Value |
| | | Housing/Single Family – 0.1% | | | |
$ 75 | | California Housing Finance Agency, Home Mortgage Revenue Bonds, Series 2006H, 5.750%, | 2/16 at 100.00 | A | $ 76,142 |
| | | 8/01/30 – FGIC Insured (Alternative Minimum Tax) | | | |
| | | Industrials – 1.3% | | | |
1,015 | | California Pollution Control Financing Authority, Solid Waste Disposal Revenue Bonds, Republic | No Opt. Call | BBB | 1,064,735 |
| | | Services Inc., Series 2002C, 5.250%, 6/01/23 (Mandatory put 12/01/17) (Alternative Minimum Tax) | | | |
| | | Long-Term Care – 2.8% | | | |
1,500 | | ABAG Finance Authority for Non-Profit Corporations, California, Insured Senior Living Revenue | 11/12 at 100.00 | A– | 1,479,720 |
| | | Bonds, Odd Fellows Home of California, Series 2003A, 5.200%, 11/15/22 | | | |
1,000 | | California Statewide Communities Development Authority, Revenue Bonds, Inland Regional Center | 12/17 at 100.00 | Baa1 | 895,370 |
| | | Project, Series 2007, 5.250%, 12/01/27 | | | |
2,500 | | Total Long-Term Care | | | 2,375,090 |
| | | Tax Obligation/General – 28.3% | | | |
750 | | California State, General Obligation Bonds, Series 2004, 5.000%, 2/01/23 | 2/14 at 100.00 | A1 | 757,598 |
1,650 | | California State, General Obligation Bonds, Various Purpose Series 2009, 5.500%, 11/01/39 | 11/19 at 100.00 | A1 | 1,595,732 |
6,225 | | Escondido Union High School District, San Diego County, California, General Obligation | No Opt. Call | AA+ | 1,076,614 |
| | | Refunding Bonds, Series 2009B, 0.000%, 8/01/36 – AGM Insured | | | |
1,000 | | Fremont Unified School District, Alameda County, California, General Obligation Bonds, Series | 8/12 at 101.00 | Aa2 | 1,036,270 |
| | | 2002A, 5.000%, 8/01/21 – FGIC Insured | | | |
| | | Golden West Schools Financing Authority, California, General Obligation Revenue Refunding | | | |
| | | Bonds, School District Program, Series 1999A: | | | |
4,650 | | 0.000%, 8/01/16 – NPFG Insured | No Opt. Call | AAA | 3,571,200 |
1,750 | | 0.000%, 2/01/17 – NPFG Insured | No Opt. Call | AAA | 1,279,565 |
2,375 | | 0.000%, 8/01/17 – NPFG Insured | No Opt. Call | AAA | 1,678,104 |
2,345 | | 0.000%, 2/01/18 – NPFG Insured | No Opt. Call | AAA | 1,578,513 |
| | | Mountain View-Los Altos Union High School District, Santa Clara County, California, General | | | |
| | | Obligation Capital Appreciation Bonds, Series 1997C: | | | |
1,015 | | 0.000%, 5/01/17 – NPFG Insured | No Opt. Call | Aa1 | 784,534 |
1,080 | | 0.000%, 5/01/18 – NPFG Insured | No Opt. Call | Aa1 | 773,086 |
100 | | Roseville Joint Union High School District, Placer County, California, General Obligation | 8/15 at 100.00 | AA– | 100,360 |
| | | Bonds, Series 2006B, 5.000%, 8/01/27 – FGIC Insured | | | |
3,220 | | Sacramento City Unified School District, Sacramento County, California, General Obligation | 7/15 at 100.00 | Aa2 | 3,225,249 |
| | | Bonds, Series 2005, 5.000%, 7/01/27 – NPFG Insured | | | |
8,075 | | San Bernardino Community College District, California, General Obligation Bonds, Election of | No Opt. Call | Aa2 | 732,806 |
| | | 2008 Series 2009B, 0.000%, 8/01/44 | | | |
1,500 | | San Diego Unified School District, San Diego County, California, General Obligation Bonds, | 7/13 at 101.00 | AA+ | 1,649,925 |
| | | Series 2003E, 5.250%, 7/01/24 – AGM Insured | | | |
2,565 | | Sunnyvale School District, Santa Clara County, California, General Obligation Bonds, Series | 9/15 at 100.00 | AA+ | 2,585,084 |
| | | 2005A, 5.000%, 9/01/26 – AGM Insured | | | |
4,250 | | West Hills Community College District, California, General Obligation Bonds, School Facilities | 8/31 at 100.00 | AA+ | 1,395,870 |
| | | Improvement District 3, 2008 Election Series 2011B, 0.000%, 8/01/38 – AGM Insured | | | |
42,550 | | Total Tax Obligation/General | | | 23,820,510 |
| | | Tax Obligation/Limited – 19.2% | | | |
1,000 | | Bell Community Redevelopment Agency, California, Tax Allocation Bonds, Bell Project Area, | 10/13 at 100.00 | N/R | 767,120 |
| | | Series 2003, 5.625%, 10/01/33 – RAAI Insured | | | |
3,500 | | California State Public Works Board, Lease Revenue Bonds, Department of Corrections, | No Opt. Call | A2 | 3,870,016 |
| | | Calipatria State Prison, Series 1991A, 6.500%, 9/01/17 – NPFG Insured | | | |
1,000 | | California State Public Works Board, Lease Revenue Bonds, Department of Mental Health, | 6/14 at 100.00 | A2 | 1,000,610 |
| | | Coalinga State Hospital, Series 2004A, 5.500%, 6/01/23 | | | |
1,500 | | California State Public Works Board, Lease Revenue Bonds, Various Capital Projects, Series | 11/19 at 100.00 | A2 | 1,527,150 |
| | | 2009I-1, 6.375%, 11/01/34 | | | |
120 | | Capistrano Unified School District, Orange County, California, Special Tax Bonds, Community | 9/15 at 100.00 | BBB | 110,183 |
| | | Facilities District, Series 2005, 5.000%, 9/01/24 – FGIC Insured | | | |
360 | | Chino Redevelopment Agency, California, Merged Chino Redevelopment Project Area Tax Allocation | 9/16 at 101.00 | A– | 274,669 |
| | | Bonds, Series 2006, 5.000%, 9/01/38 – AMBAC Insured | | | |
42 Nuveen Investments
| | | | | | |
Principal | | | Optional Call | | |
Amount (000) | | Description (1) | Provisions (2) | Ratings (3) | Value |
| | | Tax Obligation/Limited (continued) | | | |
$ 1,000 | | Fontana Public Financing Authority, California, Tax Allocation Revenue Bonds, North Fontana | 10/15 at 100.00 | A | $ 776,610 |
| | | Redevelopment Project, Series 2005A, 5.000%, 10/01/32 – AMBAC Insured | | | |
| | | Irvine, California, Unified School District, Community Facilities District Special Tax Bonds, | | | |
| | | Series 2006A: | | | |
55 | | 5.000%, 9/01/26 | 9/16 at 100.00 | N/R | 48,956 |
130 | | 5.125%, 9/01/36 | 9/16 at 100.00 | N/R | 105,833 |
215 | | Los Angeles Community Redevelopment Agency, California, Lease Revenue Bonds, Manchester Social | 9/15 at 100.00 | A1 | 171,228 |
| | | Services Project, Series 2005, 5.000%, 9/01/37 – AMBAC Insured | | | |
50 | | Novato Redevelopment Agency, California, Tax Allocation Bonds, Hamilton Field Redevelopment | 9/21 at 100.00 | A– | 49,367 |
| | | Project, Series 2011, 6.750%, 9/01/40 | | | |
1,300 | | Orange County, California, Special Tax Bonds, Community Facilities District 03-1 of Ladera | 8/12 at 101.00 | N/R | 1,157,715 |
| | | Ranch, Series 2004A, 5.625%, 8/15/34 | | | |
105 | | Rialto Redevelopment Agency, California, Tax Allocation Bonds, Merged Project Area, Series | 9/15 at 100.00 | A– | 82,061 |
| | | 2005A, 5.000%, 9/01/35 – SYNCORA GTY Insured | | | |
30 | | Riverside County, California, Redevelopment Agency Jurupa Valley Project Area 2011 Tax Allocation | 10/21 at 100.00 | A– | 29,367 |
| | | Bonds Series B, 6.500%, 10/01/25 | | | |
130 | | Roseville, California, Certificates of Participation, Public Facilities, Series 2003A, 5.000%, | 8/13 at 100.00 | AA– | 124,036 |
| | | 8/01/25 – AMBAC Insured | | | |
605 | | Sacramento City Financing Authority, California, Lease Revenue Refunding Bonds, Series 1993A, | No Opt. Call | A1 | 623,265 |
| | | 5.400%, 11/01/20 – NPFG Insured | | | |
25 | | San Francisco Redevelopment Finance Authority, California, Tax Allocation Revenue Bonds, | 2/21 at 100.00 | A– | 25,049 |
| | | Mission Bay North Redevelopment Project, Series 2011C, 6.750%, 8/01/41 | | | |
| | | San Francisco Redevelopment Financing Authority, California, Tax Allocation Revenue Bonds, | | | |
| | | Mission Bay South Redevelopment Project, Series 2011D: | | | |
25 | | 7.000%, 8/01/33 | 2/21 at 100.00 | BBB | 25,102 |
30 | | 7.000%, 8/01/41 | 2/21 at 100.00 | BBB | 30,017 |
3,000 | | San Mateo County Transit District, California, Sales Tax Revenue Bonds, Series 2005A, 5.000%, | 6/15 at 100.00 | AA | 3,097,650 |
| | | 6/01/21 – NPFG Insured | | | |
225 | | San Mateo Union High School District, San Mateo County, California, Certificates of | 12/17 at 100.00 | AA– | 200,489 |
| | | Participation, Phase 1, Series 2007A, 5.000%, 12/15/30 – AMBAC Insured | | | |
1,000 | | Santa Clara County Board of Education, California, Certificates of Participation, Series 2002, | 4/12 at 101.00 | Baa1 | 870,130 |
| | | 5.000%, 4/01/25 – NPFG Insured | | | |
40 | | Signal Hill Redevelopment Agency, California, Project 1 Tax Allocation Bonds, Series 2011, | 4/21 at 100.00 | N/R | 38,933 |
| | | 7.000%, 10/01/26 | | | |
1,000 | | Travis Unified School District, Solano County, California, Certificates of Participation, | 9/16 at 100.00 | N/R | 822,170 |
| | | Series 2006, 5.000%, 9/01/26 – FGIC Insured | | | |
360 | | Turlock Public Financing Authority, California, Tax Allocation Revenue Bonds, Series 2011, | 3/21 at 100.00 | BBB+ | 361,789 |
| | | 7.500%, 9/01/39 | | | |
16,805 | | Total Tax Obligation/Limited | | | 16,189,515 |
| | | Transportation – 5.7% | | | |
1,150 | | Foothill/Eastern Transportation Corridor Agency, California, Toll Road Revenue Bonds, Series | 7/11 at 100.00 | BBB– | 874,069 |
| | | 1995A, 5.000%, 1/01/35 | | | |
3,500 | | Los Angeles Harbors Department, California, Revenue Refunding Bonds, Series 2001B, 5.500%, | 8/11 at 100.00 | AA | 3,541,475 |
| | | 8/01/17 – AMBAC Insured (Alternative Minimum Tax) | | | |
445 | | San Francisco Airports Commission, California, Revenue Bonds, San Francisco International | 5/11 at 100.00 | A1 | 392,281 |
| | | Airport, Second Series 1999, Issue 23A, 5.000%, 5/01/30 – FGIC Insured (Alternative | | | |
| | | Minimum Tax) | | | |
5,095 | | Total Transportation | | | 4,807,825 |
| | | U.S. Guaranteed – 5.4% (4) | | | |
400 | | Beverly Hills Unified School District, Los Angeles County, California, General Obligation | 8/12 at 100.00 | Aa1 (4) | 424,264 |
| | | Bonds, Series 2002A, 5.000%, 8/01/26 (Pre-refunded 8/01/12) | | | |
800 | | California State, General Obligation Bonds, Series 2004, 5.125%, 2/01/27 (Pre-refunded 2/01/14) | 2/14 at 100.00 | AAA | 895,888 |
2,000 | | North Orange County Community College District, California, General Obligation Bonds, Series | 8/12 at 101.00 | AA (4) | 2,133,680 |
| | | 2002A, 5.000%, 8/01/22 (Pre-refunded 8/01/12) – NPFG Insured | | | |
Nuveen Investments 43
| | |
| | Nuveen California Select Tax-Free Income Portfolio (continued) |
NXC | Portfolio of Investments March 31, 2011 |
| | | | | | |
Principal | | | Optional Call | | |
Amount (000) | | Description (1) | Provisions (2) | Ratings (3) | Value |
| | | U.S. Guaranteed (4) (continued) | | | |
$ 1,000 | | Port of Oakland, California, Revenue Bonds, Series 2002M, 5.250%, 11/01/20 (Pre-refunded | 11/12 at 100.00 | A (4) | $ 1,075,230 |
| | | 11/01/12) – FGIC Insured | | | |
4,200 | | Total U.S. Guaranteed | | | 4,529,062 |
| | | Utilities – 6.6% | | | |
1,000 | | Imperial Irrigation District, California, Electric System Revenue Bonds, Refunding Series | 11/20 at 100.00 | AA– | 966,940 |
| | | 2011A, 5.500%, 11/01/41 | | | |
645 | | Long Beach Bond Finance Authority, California, Natural Gas Purchase Revenue Bonds, Series | No Opt. Call | A | 569,703 |
| | | 2007A, 5.500%, 11/15/37 | | | |
200 | | Los Angeles Department of Water and Power, California, Power System Revenue Bonds, Series | 7/13 at 100.00 | AA– | 205,360 |
| | | 2003A-2, 5.000%, 7/01/21 – NPFG Insured | | | |
7,600 | | Merced Irrigation District, California, Certificates of Participation, Water and Hydroelectric | 9/16 at 64.56 | A | 3,332,980 |
| | | Series 2008B, 0.000%, 9/01/23 | | | |
215 | | Merced Irrigation District, California, Electric System Revenue Bonds, Series 2005, 5.125%, | 9/15 at 100.00 | N/R | 177,607 |
| | | 9/01/31 – SYNCORA GTY Insured | | | |
275 | | Turlock Irrigation District, California, Revenue Refunding Bonds, Series 1992A, 6.250%, | No Opt. Call | A1 | 282,301 |
| | | 1/01/12 – NPFG Insured | | | |
9,935 | | Total Utilities | | | 5,534,891 |
| | | Water and Sewer – 2.5% | | | |
150 | | Healdsburg Public Financing Authority, California, Wastewater Revenue Bonds, Series 2006, | 4/16 at 100.00 | AA– | 136,656 |
| | | 5.000%, 4/01/36 – NPFG Insured | | | |
250 | | Sacramento County Sanitation District Financing Authority, California, Revenue Bonds, Series | 6/16 at 100.00 | AA | 250,153 |
| | | 2006, 5.000%, 12/01/31 – FGIC Insured | | | |
825 | | South Feather Water and Power Agency, California, Water Revenue Certificates of Participation, | 4/13 at 100.00 | A | 806,528 |
| | | Solar Photovoltaic Project, Series 2003, 5.375%, 4/01/24 | | | |
1,000 | | Woodbridge Irrigation District, California, Certificates of Participation, Water Systems | 7/13 at 100.00 | A+ | 899,670 |
| | | Project, Series 2003, 5.625%, 7/01/43 | | | |
2,225 | | Total Water and Sewer | | | 2,093,007 |
$ 111,460 | | Total Investments (cost $88,083,125) – 101.1% | | | 85,125,406 |
| | | Floating Rate Obligations – (1.8)% | | | (1,540,000) |
| | | Other Assets Less Liabilities – 0.7% | | | 613,627 |
| | | Net Assets – 100% | | | $ 84,199,033 |
| (1) | All percentages shown in the Portfolio of Investments are based on net assets. |
| (2) | Optional Call Provisions (not covered by the report of independent registered public accounting firm): Dates (month and year) and prices of the earliest optional call or redemption. There may be other call provisions at varying prices at later dates. Certain mortgage-backed securities may be subject to periodic principal paydowns. |
| (3) | Ratings (not covered by the report of independent registered public accounting firm): Using the highest of Standard & Poor’s Group (“Standard & Poor’s”), Moody’s Investor Service, Inc. (“Moody’s”) or Fitch, Inc. (“Fitch”) rating. Ratings below BBB by Standard & Poor’s, Baa by Moody’s or BBB by Fitch are considered to be below investment grade. Holdings designated N/R are not rated by any of these national rating agencies. |
| (4) | Backed by an escrow or trust containing sufficient U.S. Government or U.S. Government agency securities, which ensure the timely payment of principal and interest. Such investments are normally considered to be equivalent to AAA rated securities. |
| (UB) | Underlying bond of an inverse floating rate trust reflected as a financing transaction. See Notes to Financial Statements, Footnote 1 – General Information and Significant Accounting Policies, Inverse Floating Rate Securities for more information. |
See accompanying notes to financial statements.
| | | | | | |
| | | Nuveen New York Select Tax-Free Income Portfolio | | |
NXN | | Portfolio of Investments | | |
| | | March 31, 2011 | |
Principal | | | Optional Call | | |
Amount (000) | | Description (1) | Provisions (2) | Ratings (3) | Value |
| | | Consumer Discretionary – 0.2% | | | |
$ 100 | | New York City Industrial Development Agency, New York, Liberty Revenue Bonds, | 9/15 at 100.00 | BB+ | $ 85,725 |
| | | IAC/InterActiveCorp, Series 2005, 5.000%, 9/01/35 | | | |
| | | Consumer Staples – 1.6% | | | |
| | | TSASC Inc., New York, Tobacco Asset-Backed Bonds, Series 2006: | | | |
375 | | 4.750%, 6/01/22 | 6/16 at 100.00 | BBB | 350,250 |
540 | | 5.000%, 6/01/26 | 6/16 at 100.00 | BBB | 487,172 |
915 | | Total Consumer Staples | | | 837,422 |
| | | Education and Civic Organizations – 8.1% | | | |
100 | | Albany Industrial Development Agency, New York, Revenue Bonds, Albany Law School, Series | 7/17 at 100.00 | BBB | 90,975 |
| | | 2007A, 5.000%, 7/01/31 | | | |
50 | | Albany Industrial Development Agency, New York, Revenue Bonds, Brighter Choice Charter | 4/17 at 100.00 | N/R | 36,827 |
| | | Schools, Series 2007A, 5.000%, 4/01/37 | | | |
280 | | Buffalo and Erie County, New York, Industrial Land Development Corporation Tax-Exempt Revenue | 12/20 at 100.00 | N/R | 275,380 |
| | | Bonds (Enterprise Charter School Project), Series 2011A, 7.500%, 12/01/40 | | | |
30 | | Cattaraugus County Industrial Development Agency, New York, Revenue Bonds, St. Bonaventure | 5/16 at 100.00 | BBB– | 27,470 |
| | | University, Series 2006, 5.000%, 5/01/23 | | | |
430 | | Dormitory Authority of the State of New York, General Revenue Bonds, Manhattan College, Series | 7/17 at 100.00 | N/R | 351,843 |
| | | 2007A, 5.000%, 7/01/41 – RAAI Insured | | | |
1,000 | | Dormitory Authority of the State of New York, Housing Revenue Bonds, Fashion Institute of | No Opt. Call | BBB | 899,020 |
| | | Technology, Series 2007, 5.250%, 7/01/34 – FGIC Insured | | | |
785 | | Dormitory Authority of the State of New York, Insured Revenue Bonds, Iona College, Series | 7/12 at 100.00 | BBB | 790,330 |
| | | 2002, 5.000%, 7/01/22 – SYNCORA GTY Insured | | | |
50 | | Dormitory Authority of the State of New York, Lease Revenue Bonds, State University Dormitory | 7/15 at 100.00 | Aa2 | 50,396 |
| | | Facilities, Series 2004A, 5.000%, 7/01/29 – NPFG Insured | | | |
120 | | Dormitory Authority of the State of New York, Revenue Bonds, St. Joseph’s College, Series | 7/20 at 100.00 | Baa1 | 112,342 |
| | | 2010, 5.250%, 7/01/35 | | | |
100 | | Hempstead Town Industrial Development Agency, New York, Revenue Bonds, Adelphi University, | 10/15 at 100.00 | A | 95,122 |
| | | Civic Facility Project, Series 2005, 5.000%, 10/01/35 | | | |
100 | | New York City Industrial Development Agency, New York, Civic Facility Revenue Bonds, St. | 10/14 at 100.00 | A– | 94,077 |
| | | Francis College, Series 2004, 5.000%, 10/01/34 | | | |
500 | | New York City Industrial Development Agency, New York, Civic Facility Revenue Bonds, YMCA of | 8/11 at 100.00 | A– | 500,310 |
| | | Greater New York, Series 2002, 5.250%, 8/01/21 | | | |
430 | | New York City Industrial Development Agency, New York, PILOT Revenue Bonds, Queens Baseball | 1/17 at 100.00 | BB+ | 327,845 |
| | | Stadium Project, Series 2006, 4.750%, 1/01/42 – AMBAC Insured | | | |
590 | | New York City Industrial Development Authority, New York, PILOT Revenue Bonds, Yankee Stadium | 9/16 at 100.00 | BBB– | 457,746 |
| | | Project, Series 2006, 4.500%, 3/01/39 – FGIC Insured | | | |
185 | | Puerto Rico Industrial, Tourist, Educational, Medical and Environmental Control Facilities | 8/11 at 100.00 | BBB– | 181,228 |
| | | Financing Authority, Higher Education Revenue Bonds, Ana G. Mendez University System, | | | |
| | | Series 1999, 5.375%, 2/01/19 | | | |
65 | | Seneca County Industrial Development Authority, New York, Revenue Bonds, New York Chiropractic | 10/17 at 100.00 | BBB | 60,438 |
| | | College, Series 2007, 5.000%, 10/01/27 | | | |
4,815 | | Total Education and Civic Organizations | | | 4,351,349 |
| | | Financials – 0.8% | | | |
435 | | Liberty Development Corporation, New York, Goldman Sachs Headquarters Revenue Bonds Series | No Opt. Call | A1 | 431,999 |
| | | 2007, 5.500%, 10/01/37 | | | |
Nuveen Investments 45
| | |
| | Nuveen New York Select Tax-Free Income Portfolio (continued) |
NXN | Portfolio of Investments March 31, 2011 |
| | | | | | |
Principal | | | Optional Call | | |
Amount (000) | | Description (1) | Provisions (2) | Ratings (3) | Value |
| | | Health Care – 14.7% | | | |
$ 450 | | Dormitory Authority of the State of New York, FHA-Insured Mortgage Revenue Bonds, Montefiore | 2/15 at 100.00 | BBB | $ 444,650 |
| | | Hospital, Series 2004, 5.000%, 8/01/29 – FGIC Insured | | | |
500 | | Dormitory Authority of the State of New York, FHA-Insured Revenue Bonds, St. Lukes Roosevelt | 8/15 at 100.00 | N/R | 454,930 |
| | | Hospital, Series 2005, 4.900%, 8/15/31 | | | |
100 | | Dormitory Authority of the State of New York, Highland Hospital of Rochester Revenue Bonds, | 7/20 at 100.00 | A2 | 95,057 |
| | | Series 2010, 5.200%, 7/01/32 | | | |
| | | Dormitory Authority of the State of New York, Revenue Bonds, Lenox Hill Hospital Obligated | | | |
| | | Group, Series 2001: | | | |
110 | | 5.375%, 7/01/20 | 7/11 at 101.00 | Baa3 | 110,208 |
100 | | 5.500%, 7/01/30 | 7/11 at 101.00 | Baa3 | 95,645 |
950 | | Dormitory Authority of the State of New York, Revenue Bonds, Memorial Sloan Kettering Cancer | 7/16 at 100.00 | AA | 920,094 |
| | | Center, Series 2006-1, 5.000%, 7/01/35 | | | |
670 | | Dormitory Authority of the State of New York, Revenue Bonds, Memorial Sloan-Kettering Cancer | 7/13 at 100.00 | AA | 687,956 |
| | | Center, Series 2003-1, 5.000%, 7/01/21 – NPFG Insured | | | |
390 | | Dormitory Authority of the State of New York, Revenue Bonds, New York and Presbyterian | 8/14 at 100.00 | AA+ | 417,117 |
| | | Hospital, Series 2004A, 5.250%, 8/15/15 – AGM Insured | | | |
1,680 | | Dormitory Authority of the State of New York, Revenue Bonds, Winthrop South Nassau University | 7/11 at 101.00 | N/R | 1,700,832 |
| | | Health System Obligated Group, Series 2001A, 5.250%, 7/01/17 – AMBAC Insured | | | |
1,195 | | Dormitory Authority of the State of New York, Revenue Bonds, Winthrop South Nassau University | 7/11 at 101.00 | Baa1 | 1,209,818 |
| | | Health System Obligated Group, Series 2001B, 5.250%, 7/01/17 – AMBAC Insured | | | |
500 | | Dormitory Authority of the State of New York, Revenue Bonds, Winthrop-South Nassau University | 7/13 at 100.00 | Baa1 | 474,165 |
| | | Hospital Association, Series 2003A, 5.500%, 7/01/32 | | | |
| | | Madison County Industrial Development Agency, New York, Civic Facility Revenue Bonds, Oneida | | | |
| | | Health System, Series 2007A: | | | |
100 | | 5.250%, 2/01/27 | No Opt. Call | BBB– | 87,476 |
90 | | 5.500%, 2/01/32 | No Opt. Call | BBB– | 77,865 |
750 | | New York City Health and Hospitals Corporation, New York, Health System Revenue Bonds, Series | 2/13 at 100.00 | Aa3 | 771,908 |
| | | 2003A, 5.250%, 2/15/21 – AMBAC Insured | | | |
235 | | New York City Industrial Development Agency, New York, Civic Facility Revenue Bonds, Staten | 7/12 at 101.00 | Baa3 | 225,412 |
| | | Island University Hospital, Series 2002C, 6.450%, 7/01/32 | | | |
125 | | Westchester County Health Care Corporation, New York, Senior Lien Revenue Bonds, Series | 11/20 at 100.00 | A3 | 122,188 |
| | | 2010-C2, 6.125%, 11/01/37 | | | |
7,945 | | Total Health Care | | | 7,895,321 |
| | | Housing/Multifamily – 6.0% | | | |
1,700 | | Amherst Industrial Development Agency, New York, Revenue Bonds, UBF Faculty/Student Housing | 8/12 at 101.00 | N/R | 1,702,329 |
| | | Corporation, University of Buffalo Creekside Project, Series 2002A, 5.000%, 8/01/22 – | | | |
| | | AMBAC Insured | | | |
1,000 | | New Hartford-Sunset Woods Funding Corporation, New York, FHA-Insured Mortgage Revenue Bonds, | 8/12 at 101.00 | AAA | 1,021,940 |
| | | Sunset Woods Apartments II Project, Series 2002, 5.350%, 2/01/20 | | | |
250 | | New York City Housing Development Corporation, New York, Multifamily Housing Revenue Bonds, | 5/14 at 100.00 | AA | 250,623 |
| | | Series 2004A, 5.250%, 11/01/30 | | | |
275 | | New York State Housing Finance Agency, Affordable Housing Revenue, Series 2007A, 5.250%, | 11/17 at 100.00 | Aa2 | 257,158 |
| | | 11/01/38 (Alternative Minimum Tax) | | | |
3,225 | | Total Housing/Multifamily | | | 3,232,050 |
| | | Housing/Single Family – 8.3% | | | |
2,000 | | New York State Mortgage Agency, Homeowner Mortgage Revenue Bonds, Series 101, 5.000%, | 10/11 at 100.00 | Aa1 | 2,005,680 |
| | | 10/01/18 (Alternative Minimum Tax) | | | |
2,500 | | New York State Mortgage Agency, Mortgage Revenue Bonds, Thirty-First Series A, 5.300%, | 10/11 at 100.00 | Aaa | 2,441,974 |
| | | 10/01/31 (Alternative Minimum Tax) | | | |
4,500 | | Total Housing/Single Family | | | 4,447,654 |
46 Nuveen Investments
| | | | | | |
Principal | | | Optional Call | | |
Amount (000) | | Description (1) | Provisions (2) | Ratings (3) | Value |
| | | Long-Term Care – 11.2% | | | |
$ 1,700 | | Dormitory Authority of the State of New York, FHA-Insured Nursing Home Mortgage Revenue Bonds, | 8/11 at 101.00 | Baa1 | $ 1,612,807 |
| | | Norwegian Christian Home and Health Center, Series 2001, 5.200%, 8/01/36 – NPFG Insured | | | |
100 | | Dormitory Authority of the State of New York, Non-State Supported Debt, Ozanam Hall of Queens | 11/16 at 100.00 | Baa3 | 74,659 |
| | | Nursing Home Revenue Bonds, Series 2006, 5.000%, 11/01/31 | | | |
50 | | Dormitory Authority of the State of New York, Revenue Bonds, Providence Rest, Series 2005, | 7/15 at 100.00 | N/R | 30,167 |
| | | 5.000%, 7/01/35 – ACA Insured | | | |
2,000 | | East Rochester Housing Authority, New York, FHA-Insured Mortgage Revenue Refunding Bonds, | 8/12 at 101.00 | AAA | 2,064,259 |
| | | Jewish Home of Rochester, Series 2002, 4.625%, 2/15/17 | | | |
1,000 | | East Rochester Housing Authority, New York, Revenue Bonds, GNMA/FHA-Secured Revenue Bonds, St. | 12/12 at 103.00 | N/R | 1,027,690 |
| | | Mary’s Residence Project, Series 2002A, 5.375%, 12/20/22 | | | |
980 | | New York City Industrial Development Agency, New York, GNMA Collateralized Mortgage Revenue | 11/12 at 101.00 | N/R | 938,154 |
| | | Bonds, Eger Harbor House Inc., Series 2002A, 4.950%, 11/20/32 | | | |
25 | | Suffolk County Industrial Development Agency, New York, Civic Facility Revenue Bonds, Special | 7/16 at 100.00 | N/R | 22,399 |
| | | Needs Facilities Pooled Program, Series 2008-B1, 5.500%, 7/01/18 | | | |
275 | | Yonkers Industrial Development Agency, New York, Civic Facilities Revenue Bonds, Special Needs | 7/16 at 101.00 | N/R | 246,392 |
| | | Facilities Pooled Program Bonds, Series 2008-C1, 5.500%, 7/01/18 | | | |
6,130 | | Total Long-Term Care | | | 6,016,527 |
| | | Materials – 0.2% | | | |
90 | | Jefferson County Industrial Development Agency, New York, Solid Waste Disposal Revenue Bonds, | 12/13 at 100.00 | BBB | 86,651 |
| | | International Paper Company Project, Series 2003A, 5.200%, 12/01/20 (Alternative Minimum Tax) | | | |
| | | Tax Obligation/General – 7.4% | | | |
| | | Clarkstown, Rickland County, New York, Various Purposes Serial Bonds, Series 1992: | | | |
525 | | 5.600%, 6/15/11 – AMBAC Insured | No Opt. Call | AAA | 530,791 |
525 | | 5.600%, 6/15/12 – AMBAC Insured | No Opt. Call | AAA | 557,330 |
1,260 | | New York City, New York, General Obligation Bonds, Fiscal 2008 Series D, 5.125%, 12/01/25 | 12/17 at 100.00 | AA | 1,314,054 |
300 | | New York City, New York, General Obligation Bonds, Fiscal Series 2004C, 5.250%, 8/15/16 | 8/14 at 100.00 | AA | 327,612 |
200 | | New York City, New York, General Obligation Bonds, Fiscal Series 2005J, 5.000%, 3/01/19 – | 3/15 at 100.00 | AA | 212,020 |
| | | FGIC Insured | | | |
1,000 | | New York City, New York, General Obligation Bonds, Fiscal Series 2006J-1, 5.000%, 6/01/25 | 6/16 at 100.00 | AA | 1,033,140 |
3,810 | | Total Tax Obligation/General | | | 3,974,947 |
| | | Tax Obligation/Limited – 18.1% | | | |
600 | | Battery Park City Authority, New York, Senior Revenue Bonds, Series 2003A, 5.000%, 11/01/23 | 11/13 at 100.00 | AAA | 628,428 |
500 | | Erie County Industrial Development Agency, New York, School Facility Revenue Bonds, Buffalo | 5/14 at 100.00 | AA+ | 509,655 |
| | | City School District, Series 2004, 5.750%, 5/01/26 – AGM Insured | | | |
500 | | Metropolitan Transportation Authority, New York, State Service Contract Refunding Bonds, | 7/12 at 100.00 | AA– | 523,545 |
| | | Series 2002A, 5.500%, 1/01/20 – NPFG Insured | | | |
| | | New York City Sales Tax Asset Receivable Corporation, New York, Dedicated Revenue Bonds, Local | | | |
| | | Government Assistance Corporation, Series 2004A: | | | |
250 | | 5.000%, 10/15/25 – NPFG Insured | 10/14 at 100.00 | AAA | 260,768 |
200 | | 5.000%, 10/15/26 – NPFG Insured | 10/14 at 100.00 | AAA | 209,196 |
1,225 | | 5.000%, 10/15/29 – AMBAC Insured | 10/14 at 100.00 | AAA | 1,245,813 |
600 | | New York City Transitional Finance Authority, New York, Building Aid Revenue Bonds, Fiscal | 1/17 at 100.00 | AA– | 606,414 |
| | | Series 2007S-2, 5.000%, 1/15/28 – FGIC Insured | | | |
670 | | New York City Transitional Finance Authority, New York, Future Tax Secured Bonds, Fiscal | 2/13 at 100.00 | AAA | 702,147 |
| | | Series 2003E, 5.000%, 2/01/23 – FGIC Insured | | | |
550 | | New York City Transitional Finance Authority, New York, Future Tax Secured Bonds, Fiscal | 11/17 at 100.00 | AAA | 571,054 |
| | | Series 2007C-1, 5.000%, 11/01/27 | | | |
535 | | New York City Transitional Finance Authority, New York, Future Tax Secured Bonds, Tender | 5/19 at 100.00 | AAA | 498,839 |
| | | Option Bond Trust 3545, 13.613%, 5/01/32 (IF) | | | |
Nuveen Investments 47
| | |
| | Nuveen New York Select Tax-Free Income Portfolio (continued) |
NXN | Portfolio of Investments March 31, 2011 |
| | | | | | |
Principal | | | Optional Call | | |
Amount (000) | | Description (1) | Provisions (2) | Ratings (3) | Value |
| | | Tax Obligation/Limited (continued) | | | |
$ 775 | | New York State Environmental Facilities Corporation, State Personal Income Tax Revenue Bonds, | 12/17 at 100.00 | AAA | $ 808,790 |
| | | Series 2008A, 5.000%, 12/15/26 (UB) | | | |
250 | | New York State Thruway Authority, Highway and Bridge Trust Fund Bonds, Second General, Series | 4/14 at 100.00 | AA | 259,235 |
| | | 2004A, 5.000%, 4/01/21 – NPFG Insured | | | |
425 | | New York State Thruway Authority, Highway and Bridge Trust Fund Bonds, Series 2007, | 10/17 at 100.00 | AA | 434,580 |
| | | 5.000%, 4/01/27 | | | |
570 | | New York State Thruway Authority, Highway and Bridge Trust Fund Bonds, Series 2005B, | No Opt. Call | AA | 653,003 |
| | | 5.500%, 4/01/20 – AMBAC Insured (UB) | | | |
| | | New York State Tobacco Settlement Financing Corporation, Tobacco Settlement Asset-Backed and | | | |
| | | State Contingency Contract-Backed Bonds, Series 2003A-1: | | | |
1,000 | | 5.250%, 6/01/20 – AMBAC Insured | 6/13 at 100.00 | AA– | 1,044,420 |
250 | | 5.250%, 6/01/21 – AMBAC Insured | 6/13 at 100.00 | AA– | 256,093 |
500 | | New York State Tobacco Settlement Financing Corporation, Tobacco Settlement Asset-Backed and | 6/13 at 100.00 | AA– | 521,270 |
| | | State Contingency Contract-Backed Bonds, Series 2003B-1C, 5.500%, 6/01/21 | | | |
9,400 | | Total Tax Obligation/Limited | | | 9,733,250 |
| | | Transportation – 2.9% | | | |
180 | | Albany Parking Authority, New York, Revenue Bonds, Series 2001A, 5.625%, 7/15/25 | 7/11 at 101.00 | BBB+ | 180,826 |
500 | | Metropolitan Transportation Authority, New York, Transportation Revenue Bonds, Series 2003A, | No Opt. Call | A | 553,310 |
| | | 5.000%, 11/15/15 – FGIC Insured | | | |
100 | | New York State Thruway Authority, General Revenue Bonds, Series 2005G, 5.000%, 1/01/30 – | 7/15 at 100.00 | AA+ | 100,201 |
| | | AGM Insured | | | |
105 | | Port Authority of New York and New Jersey, Consolidated Revenue Bonds, One Hundred Fortieth | 6/15 at 101.00 | Aa2 | 105,242 |
| | | Series 2005, 5.000%, 12/01/31 – SYNCORA GTY Insured | | | |
120 | | Port Authority of New York and New Jersey, Consolidated Revenue Bonds, One Hundred Forty | 8/17 at 100.00 | AA+ | 118,411 |
| | | Eighth Series 2007, Trust 2920, 17.512%, 8/15/32 – AGM Insured (IF) | | | |
| | | Port Authority of New York and New Jersey, Special Project Bonds, JFK International Air | | | |
| | | Terminal LLC Project, Eighth Series 2010: | | | |
290 | | 6.500%, 12/01/28 | 12/15 at 100.00 | BBB– | 296,386 |
215 | | 6.000%, 12/01/36 | 12/20 at 100.00 | BBB– | 207,724 |
1,510 | | Total Transportation | | | 1,562,100 |
| | | U.S. Guaranteed – 4.9% (4) | | | |
220 | | Albany Parking Authority, New York, Revenue Bonds, Series 2001A, 5.625%, 7/15/25 | 7/11 at 101.00 | BBB+ (4) | 225,595 |
| | | (Pre-refunded 7/15/11) | | | |
880 | | Dormitory Authority of the State of New York, Judicial Facilities Lease Revenue Bonds, Suffolk | No Opt. Call | AAA | 1,020,527 |
| | | County Issue, Series 1986, 7.375%, 7/01/16 (ETM) | | | |
250 | | Dormitory Authority of the State of New York, Revenue Bonds, North Shore Long Island Jewish | 5/13 at 100.00 | Aaa | 274,448 |
| | | Group, Series 2003, 5.375%, 5/01/23 (Pre-refunded 5/01/13) | | | |
180 | | Suffolk County Water Authority, New York, Water Revenue Bonds, Series 1986V, | No Opt. Call | AAA | 187,065 |
| | | 6.750%, 6/01/12 (ETM) | | | |
880 | | TSASC Inc., New York, Tobacco Asset-Backed Bonds, Series 2002-1, 5.500%, 7/15/24 | 7/12 at 100.00 | AAA | 927,142 |
| | | (Pre-refunded 7/15/12) | | | |
2,410 | | Total U.S. Guaranteed | | | 2,634,777 |
| | | Utilities – 3.3% | | | |
| | | Long Island Power Authority, New York, Electric System General Revenue Bonds, Series 2006A: | | | |
570 | | 5.000%, 12/01/23 – FGIC Insured | 6/16 at 100.00 | A– | 586,256 |
430 | | 5.000%, 12/01/25 – FGIC Insured | 6/16 at 100.00 | A– | 438,398 |
500 | | New York State Energy Research and Development Authority, Pollution Control Revenue Bonds, New | 9/11 at 100.00 | BBB+ | 500,510 |
| | | York State Electric and Gas Corporation, Series 2005A, 4.100%, 3/15/15 – NPFG Insured | | | |
250 | | Niagara County Industrial Development Agency, New York, Solid Waste Disposal Facility Revenue | 11/11 at 101.00 | Baa2 | 254,313 |
| | | Bonds, American Ref-Fuel Company of Niagara LP, Series 2001A, 5.450%, 11/15/26 (Mandatory | | | |
| | | put 11/15/12) (Alternative Minimum Tax) | | | |
1,750 | | Total Utilities | | | 1,779,477 |
48 Nuveen Investments
| | | | | | |
Principal | | | Optional Call | | |
Amount (000) | | Description (1) | Provisions (2) | Ratings (3) | Value |
| | | Water and Sewer – 12.8% | | | |
$ 2,500 | | New York City Municipal Water Finance Authority, New York, Water and Sewerage System Revenue | 6/11 at 101.00 | AAA | $ 2,502,396 |
| | | Bonds, Fiscal Series 2001C, 5.125%, 6/15/33 | | | |
275 | | New York City Municipal Water Finance Authority, New York, Water and Sewerage System Revenue | 6/18 at 100.00 | AA+ | 242,858 |
| | | Bonds, Tender Option Bond Trust 3484, 17.625%, 6/15/32 (IF) | | | |
| | | New York State Environmental Facilities Corporation, State Clean Water and Drinking Water | | | |
| | | Revolving Funds Revenue Bonds, New York City Municipal Water Finance Authority Loan, | | | |
| | | Series 2002B: | | | |
2,000 | | 5.250%, 6/15/19 | 6/12 at 100.00 | AAA | 2,092,199 |
2,000 | | 5.000%, 6/15/27 | 6/12 at 100.00 | AAA | 2,049,820 |
6,775 | | Total Water and Sewer | | | 6,887,273 |
$ 53,810 | | Total Investments (cost $54,018,637) – 100.5% | | | 53,956,522 |
| | | Floating Rate Obligations – (1.9)% | | | (1,005,000) |
| | | Other Assets Less Liabilities – 1.4% | | | 753,620 |
| | | Net Assets – 100% | | | $ 53,705,142 |
| (1) | All percentages shown in the Portfolio of Investments are based on net assets. |
| (2) | Optional Call Provisions (not covered by the report of independent registered public accounting firm): Dates (month and year) and prices of the earliest optional call or redemption. There may be other call provisions at varying prices at later dates. Certain mortgage-backed securities may be subject to periodic principal paydowns. |
| (3) | Ratings (not covered by the report of independent registered public accounting firm): Using the highest of Standard & Poor’s Group (“Standard & Poor’s”), Moody’s Investor Service, Inc. (“Moody’s”) or Fitch, Inc. (“Fitch”) rating. Ratings below BBB by Standard & Poor’s, Baa by Moody’s or BBB by Fitch are considered to be below investment grade. Holdings designated N/R are not rated by any of these national rating agencies. |
| (4) | Backed by an escrow or trust containing sufficient U.S. Government or U.S. Government agency securities, which ensure the timely payment of principal and interest. Such investments are normally considered to be equivalent to AAA rated securities. |
| (ETM) | Escrowed to maturity. |
| (IF) | Inverse floating rate investment. |
| (UB) | Underlying bond of an inverse floating rate trust reflected as a financing transaction. See Notes to Financial Statements, Footnote 1 – General Information and Significant Accounting Policies, Inverse Floating Rate Securities for more information. |
See accompanying notes to financial statements.
Nuveen Investments 49
| | | | | | |
Statement of | | | | | |
Assets & Liabilities | | | |
| | | March 31, 2011 | |
| | | Select | | | Select | | | Select | | | California | | | New York | |
| | | Tax-Free | | | Tax-Free 2 | | | Tax-Free 3 | | | Select Tax-Free | | | Select Tax-Free | |
| | | (NXP) | | | (NXQ) | | | (NXR) | | | (NXC) | | | (NXN) | |
Assets | | | | | | | | | | | | | | | |
Investments, at value | | | | | | | | | | | | | | | |
(cost $227,294,266, $242,919,749, $177,339,204, | | | | | | | | | | | | | | | |
$88,083,125 and $54,018,637, respectively) | | $ | 221,298,941 | | | $ | 225,677,723 | | | $ | 173,413,576 | | | $ | 85,125,406 | | | $ | 53,956,522 | |
Cash | | | 354,575 | | | | 551,638 | | | | 497,836 | | | | — | | | | 125,975 | |
Receivables: | | | | | | | | | | | | | | | | | | | | |
Interest | | | 3,599,169 | | | | 3,741,771 | | | | 2,646,591 | | | | 1,076,937 | | | | 849,570 | |
Investments sold | | | — | | | | 40,497 | | | | 25,210 | | | | — | | | | — | |
Other assets | | | 56,436 | | | | 58,475 | | | | 42,764 | | | | 21,190 | | | | 13,244 | |
Total assets | | | 225,309,121 | | | | 230,070,104 | | | | 176,625,977 | | | | 86,223,533 | | | | 54,945,311 | |
Liabilities | | | | | | | | | | | | | | | | | | | | |
Cash overdraft | | | — | | | | — | | | | — | | | | 85,300 | | | | — | |
Floating rate obligations | | | — | | | | 1,000,000 | | | | — | | | | 1,540,000 | | | | 1,005,000 | |
Dividends payable | | | 901,659 | | | | 917,969 | | | | 651,684 | | | | 322,141 | | | | 184,562 | |
Accrued expenses: | | | | | | | | | | | | | | | | | | | | |
Management fees | | | 42,935 | | | | 53,376 | | | | 41,408 | | | | 20,191 | | | | 12,833 | |
Other | | | 96,580 | | | | 83,161 | | | | 86,838 | | | | 56,868 | | | | 37,774 | |
Total liabilities | | | 1,041,174 | | | | 2,054,506 | | | | 779,930 | | | | 2,024,500 | | | | 1,240,169 | |
Net assets | | $ | 224,267,947 | | | $ | 228,015,598 | | | $ | 175,846,047 | | | $ | 84,199,033 | | | $ | 53,705,142 | |
Shares outstanding | | | 16,511,417 | | | | 17,695,939 | | | | 13,018,458 | | | | 6,267,291 | | | | 3,916,592 | |
Net asset value per share outstanding | | $ | 13.58 | | | $ | 12.89 | | | $ | 13.51 | | | $ | 13.43 | | | $ | 13.71 | |
Net assets consist of: | | | | | | | | | | | | | | | | | | | | |
Shares, $.01 par value per share | | $ | 165,114 | | | $ | 176,959 | | | $ | 130,185 | | | $ | 62,673 | | | $ | 39,166 | |
Paid-in surplus | | | 229,503,065 | | | | 246,884,130 | | | | 179,142,602 | | | | 87,267,477 | | | | 53,739,413 | |
Undistributed (Over-distribution of) | | | | | | | | | | | | | | | | | | | | |
net investment income | | | 1,060,422 | | | | 258,232 | | | | 498,395 | | | | 137,282 | | | | 104,497 | |
Accumulated net realized gain (loss) | | | (465,329 | ) | | | (2,061,697 | ) | | | 493 | | | | (310,680 | ) | | | (115,819 | ) |
Net unrealized appreciation (depreciation) | | | (5,995,325 | ) | | | (17,242,026 | ) | | | (3,925,628 | ) | | | (2,957,719 | ) | | | (62,115 | ) |
Net assets | | $ | 224,267,947 | | | $ | 228,015,598 | | | $ | 175,846,047 | | | $ | 84,199,033 | | | $ | 53,705,142 | |
Authorized shares | | Unlimited | | | Unlimited | | | Unlimited | | | Unlimited | | | Unlimited | |
See accompanying notes to financial statements.
50 Nuveen Investments
| | | | | | |
Statement of | | | | | |
Operations | | | | |
| | | Year Ended March 31, 2011 |
| | | Select | | | Select | | | Select | | | California | | | New York | |
| | | Tax-Free | | | Tax-Free 2 | | | Tax-Free 3 | | | Select Tax-Free | | | Select Tax-Free | |
| | | (NXP) | | | (NXQ) | | | (NXR) | | | (NXC) | | | (NXN) | |
Investment Income | | $ | 12,442,964 | | | $ | 12,298,352 | | | $ | 9,270,835 | | | $ | 4,611,052 | | | $ | 2,728,974 | |
Expenses | | | | | | | | | | | | | | | | | | | | |
Management fees | | | 526,583 | | | | 655,525 | | | | 506,174 | | | | 247,621 | | | | 155,814 | |
Shareholders’ servicing agent fees and expenses | | | 22,319 | | | | 20,543 | | | | 17,484 | | | | 5,991 | | | | 5,246 | |
Interest expense on floating rate obligations | | | — | | | | 7,960 | | | | — | | | | 10,793 | | | | 5,633 | |
Custodian’s fees and expenses | | | 46,334 | | | | 48,698 | | | | 38,084 | | | | 21,918 | | | | 17,611 | |
Trustees’ fees and expenses | | | 5,279 | | | | 5,418 | | | | 4,133 | | | | 2,000 | | | | 1,259 | |
Professional fees | | | 90,777 | | | | 132,309 | | | | 47,610 | | | | 12,105 | | | | 10,378 | |
Shareholders’ reports – printing and mailing expenses | | | 46,539 | | | | 48,877 | | | | 36,970 | | | | 17,393 | | | | 13,305 | |
Stock exchange listing fees | | | 9,253 | | | | 9,220 | | | | 9,172 | | | | 9,089 | | | | 9,111 | |
Investor relations expense | | | — | | | | — | | | | — | | | | — | | | | 67 | |
Other expenses | | | 763 | | | | 1,016 | | | | 3,134 | | | | 5,737 | | | | 6,989 | |
Total expenses before custodian fee credit | | | 747,847 | | | | 929,566 | | | | 662,761 | | | | 332,647 | | | | 225,413 | |
Custodian fee credit | | | (2,856 | ) | | | (2,216 | ) | | | (1,497 | ) | | | (97 | ) | | | (561 | ) |
Net expenses | | | 744,991 | | | | 927,350 | | | | 661,264 | | | | 332,550 | | | | 224,852 | |
Net investment income (loss) | | | 11,697,973 | | | | 11,371,002 | | | | 8,609,571 | | | | 4,278,502 | | | | 2,504,122 | |
Realized and Unrealized Gain (Loss) | | | | | | | | | | | | | | | | | | | | |
Net realized gain (loss) from investments | | | 378,580 | | | | 124,603 | | | | 7,746 | | | | 321,966 | | | | (52,944 | ) |
Change in net unrealized appreciation | | | | | | | | | | | | | | | | | | | | |
(depreciation) of investments | | | (10,357,591 | ) | | | (11,123,104 | ) | | | (7,416,691 | ) | | | (3,775,747 | ) | | | (1,410,318 | ) |
Net realized and unrealized gain (loss) | | | (9,979,011 | ) | | | (10,998,501 | ) | | | (7,408,945 | ) | | | (3,453,781 | ) | | | (1,463,262 | ) |
Net increase (decrease) in net assets from operations | | $ | 1,718,962 | | | $ | 372,501 | | | $ | 1,200,626 | | | $ | 824,721 | | | $ | 1,040,860 | |
See accompanying notes to financial statements.
Nuveen Investments 51
Statement of
Changes in Net Assets
| | | | | | | | | | | | | | | | | | | |
| | | Select Tax-Free (NXP) | | | Select Tax-Free 2 (NXQ) | | | Select Tax-Free 3 (NXR) | |
| | | Year | | | Year | | | Year | | | Year | | | Year | | | Year | |
| | | Ended | | | Ended | | | Ended | | | Ended | | | Ended | | | Ended | |
| | | 3/31/11 | | | 3/31/10 | | | 3/31/11 | | | 3/31/10 | | | 3/31/11 | | | 3/31/10 | |
Operations | | | | | | | | | | | | | | | | | | |
Net investment income (loss) | | $ | 11,697,973 | | | $ | 11,988,538 | | | $ | 11,371,002 | | | $ | 11,980,343 | | | $ | 8,609,571 | | | $ | 8,677,072 | |
Net realized gain (loss) from investments | | | 378,580 | | | | 52,099 | | | | 124,603 | | | | (381,407 | ) | | | 7,746 | | | | 11,888 | |
Change in net unrealized appreciation | | | | | | | | | | | | | | | | | | | | | | | | |
(depreciation) of investments | | | (10,357,591 | ) | | | 10,863,997 | | | | (11,123,104 | ) | | | 16,031,656 | | | | (7,416,691 | ) | | | 8,445,903 | |
Net increase (decrease) in net assets | | | | | | | | | | | | | | | | | | | | | | | | |
from operations | | | 1,718,962 | | | | 22,904,634 | | | | 372,501 | | | | 27,630,592 | | | | 1,200,626 | | | | 17,134,863 | |
Distributions to Shareholders | | | | | | | | | | | | | | | | | | | | | | | | |
From net investment income | | | (11,781,528 | ) | | | (11,808,528 | ) | | | (11,780,156 | ) | | | (11,759,649 | ) | | | (8,354,275 | ) | | | (8,340,466 | ) |
From accumulated net realized gains | | | — | | | | — | | | | — | | | | — | | | | (14,320 | ) | | | (12,996 | ) |
Decrease in net assets from distributions | | | | | | | | | | | | | | | | | | | | | | | | |
to shareholders | | | (11,781,528 | ) | | | (11,808,528 | ) | | | (11,780,156 | ) | | | (11,759,649 | ) | | | (8,368,595 | ) | | | (8,353,462 | ) |
Capital Share Transactions | | | | | | | | | | | | | | | | | | | | | | | | |
Net proceeds from shares issued | | | | | | | | | | | | | | | | | | | | | | | | |
to shareholders due to | | | | | | | | | | | | | | | | | | | | | | | | |
reinvestment of distributions | | | 462,007 | | | | 657,992 | | | | 322,937 | | | | 458,195 | | | | 235,146 | | | | 319,912 | |
Net increase (decrease) in net assets | | | | | | | | | | | | | | | | | | | | | | | | |
from capital share transactions | | | 462,007 | | | | 657,992 | | | | 322,937 | | | | 458,195 | | | | 235,146 | | | | 319,912 | |
Net increase (decrease) in net assets | | | (9,600,559 | ) | | | 11,754,098 | | | | (11,084,718 | ) | | | 16,329,138 | | | | (6,932,823 | ) | | | 9,101,313 | |
Net assets at the beginning of year | | | 233,868,506 | | | | 222,114,408 | | | | 239,100,316 | | | | 222,771,178 | | | | 182,778,870 | | | | 173,677,557 | |
Net assets at the end of year | | $ | 224,267,947 | | | $ | 233,868,506 | | | $ | 228,015,598 | | | $ | 239,100,316 | | | $ | 175,846,047 | | | $ | 182,778,870 | |
Undistributed (Over-distribution of) net | | | | | | | | | | | | | | | | | | | | | | | | |
investment income at the | | | | | | | | | | | | | | | | | | | | | | | | |
end of year | | $ | 1,060,422 | | | $ | 1,144,492 | | | $ | 258,232 | | | $ | 680,474 | | | $ | 498,395 | | | $ | 253,475 | |
See accompanying notes to financial statements.
52 Nuveen Investments
| | | California Select Tax-Free (NXC) | | | New York Select Tax-Free (NXN) | |
| | | Year | | | Year | | | Year | | | Year | |
| | | Ended | | | Ended | | | Ended | | | Ended | |
| | | 3/31/11 | | | 3/31/10 | | | 3/31/11 | | | 3/31/10 | |
Operations | | | | | | | | | | | | |
Net investment income (loss) | | $ | 4,278,502 | | | $ | 4,213,923 | | | $ | 2,504,122 | | | $ | 2,441,261 | |
Net realized gain (loss) from investments | | | 321,966 | | | | 226,399 | | | | (52,944 | ) | | | (5,962 | ) |
Change in net unrealized appreciation | | | | | | | | | | | | | | | | |
(depreciation) of investments | | | (3,775,747 | ) | | | 4,328,914 | | | | (1,410,318 | ) | | | 2,655,873 | |
Net increase (decrease) in net assets | | | | | | | | | | | | | | | | |
from operations | | | 824,721 | | | | 8,769,236 | | | | 1,040,860 | | | | 5,091,172 | |
Distributions to Shareholders | | | | | | | | | | | | | | | | |
From net investment income | | | (4,174,015 | ) | | | (4,174,015 | ) | | | (2,395,928 | ) | | | (2,393,983 | ) |
From accumulated net realized gains | | | — | | | | — | | | | — | | | | — | |
Decrease in net assets from distributions | | | | | | | | | | | | | | | | |
to shareholders | | | (4,174,015 | ) | | | (4,174,015 | ) | | | (2,395,928 | ) | | | (2,393,983 | ) |
Capital Share Transactions | | | | | | | | | | | | | | | | |
Net proceeds from shares issued | | | | | | | | | | | | | | | | |
to shareholders due to | | | | | | | | | | | | | | | | |
reinvestment of distributions | | | — | | | | — | | | | 53,132 | | | | 41,902 | |
Net increase (decrease) in net assets | | | | | | | | | | | | | | | | |
from capital share transactions | | | — | | | | — | | | | 53,132 | | | | 41,902 | |
Net increase (decrease) in net assets | | | (3,349,294 | ) | | | 4,595,221 | | | | (1,301,936 | ) | | | 2,739,091 | |
Net assets at the beginning of year | | | 87,548,327 | | | | 82,953,106 | | | | 55,007,078 | | | | 52,267,987 | |
Net assets at the end of year | | $ | 84,199,033 | | | $ | 87,548,327 | | | $ | 53,705,142 | | | $ | 55,007,078 | |
Undistributed (Over-distribution of) net | | | | | | | | | | | | | | | | |
investment income at the | | | | | | | | | | | | | | | | |
end of year | | $ | 137,282 | | | $ | 37,041 | | | $ | 104,497 | | | $ | (1,802 | ) |
See accompanying notes to financial statements.
Nuveen Investments 53
| | | | | | | | | | |
| | Financial | | | | | | | | |
| | Highlights | | | | | | |
| | | | |
| | Selected data for a Common share outstanding throughout each period: | | |
| | | | | | | | | Investment Operations | | | | | | | | | Less Distributions | | | | | | | | | | |
| | | | | | | | | Net | | | | | | | | | | | | | | | Ending | | | | |
| | | Beginning | | | Net | | | Realized/ | | | | | | Net | | | | | | | | | Net | | | Ending | |
| | | Net Asset | | | Investment | | | Unrealized | | | | | | Investment | | | Capital | | | | | | Asset | | | Market | |
| | | Value | | | Income | | | Gain (Loss) | | | Total | | | Income | | | Gains | | | Total | | | Value | | | Value | |
| Select Tax-Free (NXP) | | | | | | | | | | | | | | | | | | | | | | | | | |
Year Ended 3/31: | | | | | | | | | | | | | | | | | | | | | | | | | | | |
2011 | | $ | 14.19 | | | $ | .71 | | | $ | (.61 | ) | | $ | .10 | | | $ | (.71 | ) | | $ | — | | | $ | (.71 | ) | | $ | 13.58 | | | $ | 13.25 | |
2010 | | | 13.52 | | | | .73 | | | | .66 | | | | 1.39 | | | | (.72 | ) | | | — | | | | (.72 | ) | | | 14.19 | | | | 14.74 | |
2009 | | | 14.30 | | | | .71 | | | | (.81 | ) | | | (.10 | ) | | | (.68 | ) | | | — | | | | (.68 | ) | | | 13.52 | | | | 13.67 | |
2008 | | | 14.72 | | | | .70 | | | | (.44 | ) | | | .26 | | | | (.68 | ) | | | — | | | | (.68 | ) | | | 14.30 | | | | 14.24 | |
2007 | | | 14.62 | | | | .70 | | | | .08 | | | | .78 | | | | (.68 | ) | | | — | | | | (.68 | ) | | | 14.72 | | | | 14.85 | |
| | | | | | | | | | | | | | | | | | | | | | | | | | | | | | | | | | | | | |
| Select Tax-Free 2 (NXQ) | | | | | | | | | | | | | | | | | | | | | | | | | | | | | | | | | |
Year Ended 3/31: | | | | | | | | | | | | | | | | | | | | | | | | | | | | | | | | | | | | |
2011 | | | 13.53 | | | | .64 | | | | (.61 | ) | | | .03 | | | | (.67 | ) | | | — | | | | (.67 | ) | | | 12.89 | | | | 12.40 | |
2010 | | | 12.63 | | | | .68 | | | | .89 | | | | 1.57 | | | | (.67 | ) | | | — | | | | (.67 | ) | | | 13.53 | | | | 13.81 | |
2009 | | | 13.93 | | | | .67 | | | | (1.30 | ) | | | (.63 | ) | | | (.67 | ) | | | — | | | | (.67 | ) | | | 12.63 | | | | 13.14 | |
2008 | | | 14.60 | | | | .66 | | | | (.69 | ) | | | (.03 | ) | | | (.64 | ) | | | — | | | | (.64 | ) | | | 13.93 | | | | 13.79 | |
2007 | | | 14.44 | | | | .66 | | | | .14 | | | | .80 | | | | (.64 | ) | | | — | | | | (.64 | ) | | | 14.60 | | | | 14.07 | |
54 Nuveen Investments
| | | | | | | | | | | | | | | | | | | | |
| | | | | | | | | | | | | Ratios/Supplemental Data | | | | | | | |
| Total Returns | | | | | | | | | | | | Ratios to Average Net Assets(b) | | | | | | | |
| | | | Based on | | | Ending | | | | | | | | | | | | | |
| Based on | | | Net | | | Net | | | Expenses | | | Expenses | | | Net | | | Portfolio | |
| Market | | | Asset | | | Assets | | | Including | | | Excluding | | | Investment | | | Turnover | |
| Value(a) | | | Value(a) | | | | (000) | | | Interest(c) | | | Interest | | | Income | | | Rate | |
| | | | | | | | | | | | | | | | | | | | | |
| | (5.40 | )% | | | .69 | % | | $ | 224,268 | | | | .32 | % | | | .32 | % | | | 5.05 | % | | | 6 | % |
| | 13.45 | | | | 10.45 | | | | 233,869 | | | | .32 | | | | .32 | | | | 5.20 | | | | 3 | |
| | .89 | | | | (.65 | ) | | | 222,114 | | | | .33 | | | | .33 | | | | 5.12 | | | | 11 | |
| | .61 | | | | 1.83 | | | | 234,494 | | | | .32 | | | | .32 | | | | 4.83 | | | | 4 | |
| | 9.59 | | | | 5.48 | | | | 241,074 | | | | .31 | | | | .31 | | | | 4.77 | | | | 2 | |
| | | | | | | | | | | | | �� | | | | | | | | | | | | | | |
| | | | | | | | | | | | | | | | | | | | | | | | | | | |
| | (5.56 | ) | | | .13 | | | | 228,016 | | | | .39 | | | | .39 | | | | 4.81 | | | | 6 | |
| | 10.45 | | | | 12.62 | | | | 239,100 | | | | .37 | | | | .37 | | | | 5.12 | | | | 4 | |
| | .24 | | | | (4.63 | ) | | | 222,771 | | | | .39 | | | | .38 | | | | 5.08 | | | | 6 | |
| | 2.69 | | | | (.24 | ) | | | 245,244 | | | | .40 | | | | .36 | | | | 4.58 | | | | 7 | |
| | 10.21 | | | | 5.62 | | | | 257,037 | | | | .37 | | | | .36 | | | | 4.50 | | | | 3 | |
| (a) | Total Return Based on Market Value is the combination of changes in the market price per share and the effect of reinvested dividend income and reinvested capital gains distributions, if any, at the average price paid per share at the time of reinvestment. The last dividend declared in the period, which is typically paid on the first business day of the following month, is assumed to be reinvested at the ending market price. The actual reinvestment for the last dividend declared in the period may take place over several days, and in some instances may not be based on the market price, so the actual reinvestment price may be different from the price used in the calculation. Total returns are not annualized. |
| | |
| | Total Return Based on Net Asset Value is the combination of changes in net asset value, reinvested dividend income at net asset value and reinvested capital gains distributions at net asset value, if any. The last dividend declared in the period, which is typically paid on the first business day of the following month, is assumed to be reinvested at the ending net asset value. The actual reinvest price for the last dividend declared in the period may often be based on the Fund’s market price (and not its net asset value), and therefore may be different from the price used in the calculation. Total returns are not annualized. |
| (b) | Ratios do not reflect the effect of custodian fee credits earned on the Fund’s net cash on deposit with the custodian bank, where applicable. |
| (c) | The expense ratios reflect, among other things, the interest expense deemed to have been paid by the Fund on the floating rate certificates issued by the special purpose trusts for the self-deposited inverse floaters held by the Fund, where applicable, as described in Footnote 1 – General Information and Significant Accounting Policies, Inverse Floating Rate Securities. |
See accompanying notes to financial statements.
Nuveen Investments 55
| | | | | | | | | | |
| | Financial | | | | | | | | |
| | Highlights (continued) | | | | | | |
| | | | |
| | Selected data for a Common share outstanding throughout each period: | | |
| | | | | | | Investment Operations | | | | | Less Distributions | | | | | | | | |
| | | | | | | | | Net | | | | | | | | | | | | | | | Ending | | | | |
| | | Beginning | | | Net | | | Realized/ | | | | | | Net | | | | | | | | | Net | | | Ending | |
| | | Net Asset | | | Investment | | | Unrealized | | | | | | Investment | | | Capital | | | | | | Asset | | | Market | |
| | | Value | | | Income | | | Gain (Loss) | | | Total | | | Income | | | Gains | | | Total | | | Value | | | Value | |
| Select Tax-Free 3 (NXR) | | | | | | | | | | | | | | | | | | | | | | | | | |
Year Ended 3/31: | | | | | | | | | | | | | | | | | | | | | | | | | | | |
2011 | | $ | 14.06 | | | $ | .66 | | | $ | (.57 | ) | | $ | .09 | | | $ | (.64 | ) | | $ | — | * | | $ | (.64 | ) | | $ | 13.51 | | | $ | 13.03 | |
2010 | | | 13.38 | | | | .67 | | | | .65 | | | | 1.32 | | | | (.64 | ) | | | — | * | | | (.64 | ) | | | 14.06 | | | | 14.22 | |
2009 | | | 13.98 | | | | .66 | | | | (.62 | ) | | | .04 | | | | (.64 | ) | | | — | | | | (.64 | ) | | | 13.38 | | | | 13.57 | |
2008 | | | 14.42 | | | | .64 | | | | (.44 | ) | | | .20 | | | | (.64 | ) | | | — | | | | (.64 | ) | | | 13.98 | | | | 13.75 | |
2007 | | | 14.29 | | | | .64 | | | | .13 | | | | .77 | | | | (.64 | ) | | | — | | | | (.64 | ) | | | 14.42 | | | | 14.01 | |
| | | | | | | | | | | | | | | | | | | | | | | | | | | | | | | | | | | | | |
| California Select Tax-Free (NXC) | | | | | | | | | | | | | | | | | | | | | | | | | | | | | |
Year Ended 3/31: | | | | | | | | | | | | | | | | | | | | | | | | | | | | | | | | | | | | |
2011 | | | 13.97 | | | | .68 | | | | (.55 | ) | | | .13 | | | | (.67 | ) | | | — | | | | (.67 | ) | | | 13.43 | | | | 12.59 | |
2010 | | | 13.24 | | | | .67 | | | | .73 | | | | 1.40 | | | | (.67 | ) | | | — | | | | (.67 | ) | | | 13.97 | | | | 13.08 | |
2009 | | | 14.09 | | | | .66 | | | | (.84 | ) | | | (.18 | ) | | | (.67 | ) | | | — | | | | (.67 | ) | | | 13.24 | | | | 12.00 | |
2008 | | | 14.73 | | | | .66 | | | | (.65 | ) | | | .01 | | | | (.64 | ) | | | (.01 | ) | | | (.65 | ) | | | 14.09 | | | | 14.08 | |
2007 | | | 14.57 | | | | .64 | | | | .18 | | | | .82 | | | | (.64 | ) | | | (.02 | ) | | | (.66 | ) | | | 14.73 | | | | 14.22 | |
56 Nuveen Investments
| | | | | | | | | | | | | | | | | | | | |
| | | | | | | | | | | | | Ratios/Supplemental Data | | | | | | | |
| Total Returns | | | | | | | | | | | | Ratios to Average Net Assets(b) | | | | | | | |
| | | | Based on | | | Ending | | | | | | | | | | | | | |
| Based on | | | Net | | | Net | | | Expenses | | | Expenses | | | Net | | | Portfolio | |
| Market | | | Asset | | | Assets | | | Including | | | Excluding | | | Investment | | | Turnover | |
| Value(a) | | | Value(a) | | | | (000 | ) | | Interest(c) | | | Interest | | | Income | | | Rate | |
| | | | | | | | | | | | | | | | | | | | | |
| | (3.98 | )% | | | .62 | % | | $ | 175,846 | | | | .37 | % | | | .37 | % | | | 4.75 | % | | | 4 | % |
| | 9.70 | | | | 10.05 | | | | 182,779 | | | | .38 | | | | .38 | | | | 4.81 | | | | 3 | |
| | 3.51 | | | | .34 | | | | 173,678 | | | | .39 | | | | .39 | | | | 4.83 | | | | 5 | |
| | 2.91 | | | | 1.42 | | | | 181,288 | | | | .38 | | | | .36 | | | | 4.49 | | | | 2 | |
| | 9.15 | | | | 5.51 | | | | 186,969 | | | | .38 | | | | .37 | | | | 4.43 | | | | 9 | |
| | | | | | | | | | | | | | | | | | | | | | | | | | | |
| | | | | | | | | | | | | | | | | | | | | | | | | | | |
| | 1.18 | | | | .83 | | | | 84,199 | | | | .38 | | | | .37 | | | | 4.89 | | | | 8 | |
| | 14.71 | | | | 10.71 | | | | 87,548 | | | | .41 | | | | .39 | | | | 4.87 | | | | 4 | |
| | (10.34 | ) | | | (1.30 | ) | | | 82,953 | | | | .43 | | | | .41 | | | | 4.85 | | | | 12 | |
| | 3.68 | | | | .05 | | | | 88,224 | | | | .44 | | | | .38 | | | | 4.52 | | | | 8 | |
| | 9.89 | | | | 5.72 | | | | 92,177 | | | | .40 | | | | .39 | | | | 4.37 | | | | 16 | |
| (a) | Total Return Based on Market Value is the combination of changes in the market price per share and the effect of reinvested dividend income and reinvested capital gains distributions, if any, at the average price paid per share at the time of reinvestment. The last dividend declared in the period, which is typically paid on the first business day of the following month, is assumed to be reinvested at the ending market price. The actual reinvestment for the last dividend declared in the period may take place over several days, and in some instances may not be based on the market price, so the actual reinvestment price may be different from the price used in the calculation. |
| | Total returns are not annualized. |
| | Total Return Based on Net Asset Value is the combination of changes in net asset value, reinvested dividend income at net asset value and reinvested capital gains distributions at net asset value, if any. The last dividend declared in the period, which is typically paid on the first business day of the following month, is assumed to be reinvested at the ending net asset value. The actual reinvest price for the last dividend declared in the period may often be based on the Fund’s market price (and not its net asset value), and therefore may be different from the price used in the calculation. Total returns are not annualized. |
| (b) | Ratios do not reflect the effect of custodian fee credits earned on the Fund’s net cash on deposit with the custodian bank, where applicable. |
| (c) | The expense ratios reflect, among other things, the interest expense deemed to have been paid by the Fund on the floating rate certificates issued by the special purpose trusts for the self-deposited inverse floaters held by the Fund, where applicable, as described in Footnote 1 – General Information and Significant Accounting Policies, Inverse Floating Rate Securities. |
| * | Rounds to less than $.01 per share. |
See accompanying notes to financial statements.
Nuveen Investments 57
| | | | | | | | | | |
| | Financial | | | | | | | | |
| | Highlights (continued) | | | | | | |
| | | | | | | | |
| | Selected data for a Common share outstanding throughout each period: | | |
| | | | | | | | | Investment Operations | | | | | | | | | Less Distributions | | | | | | | | | | |
| | | | | | | | | Net | | | | | | | | | | | | | | | Ending | | | | |
| | | Beginning | | | Net | | | Realized/ | | | | | | Net | | | | | | | | | Net | | | Ending | |
| | | Net Asset | | | Investment | | | Unrealized | | | | | | Investment | | | Capital | | | | | | Asset | | | Market | |
| | | Value | | | Income | | | Gain (Loss) | | | Total | | | Income | | | Gains | | | Total | | | Value | | | Value | |
| New York Select Tax-Free (NXN) | | | | | | | | | | | | | | | | | | | | | | | | | |
Year Ended 3/31: | | | | | | | | | | | | | | | | | | | | | | | | | | | |
2011 | | $ | 14.06 | | | $ | .64 | | | $ | (.38 | ) | | $ | .26 | | | $ | (.61 | ) | | $ | — | | | $ | (.61 | ) | | $ | 13.71 | | | $ | 13.06 | |
2010 | | | 13.37 | | | | .62 | | | | .68 | | | | 1.30 | | | | (.61 | ) | | | — | | | | (.61 | ) | | | 14.06 | | | | 13.80 | |
2009 | | | 13.79 | | | | .62 | | | | (.43 | ) | | | .19 | | | | (.61 | ) | | | — | | | | (.61 | ) | | | 13.37 | | | | 13.08 | |
2008 | | | 14.28 | | | | .62 | | | | (.49 | ) | | | .13 | | | | (.61 | ) | | | (.01 | ) | | | (.62 | ) | | | 13.79 | | | | 13.79 | |
2007 | | | 14.19 | | | | .61 | | | | .13 | | | | .74 | | | | (.61 | ) | | | (.04 | ) | | | (.65 | ) | | | 14.28 | | | | 14.15 | |
58 Nuveen Investments
| | | | | | | | | | | | | | | | | | | | |
| | | | | | | | | | | | | Ratios/Supplemental Data | | | | | |
| Total Returns | | | | | | | | | Ratios to Average Net Assets(b) | | | | | |
| | | | Based on | | | Ending | | | | | | | | | | | | | |
| Based on | | | Net | | | Net | | | Expenses | | | Expenses | | | Net | | | Portfolio | |
| Market | | | Asset | | | Assets | | | Including | | | Excluding | | | Investment | | | Turnover | |
| Value(a) | | | Value(a) | | | | (000) | | | Interest(c) | | | Interest | | | Income | | | Rate | |
| | | | | | | | | | | | | | | | | | | | | |
| | | | | | | | | | | | | | | | | | | | | |
| | (1.08 | )% | | | 1.84 | % | | $ | 53,705 | | | | .41 | % | | | .40 | % | | | 4.55 | % | | | 3 | % |
| | 10.31 | | | | 9.89 | | | | 55,007 | | | | .44 | | | | .42 | | | | 4.50 | | | | 1 | |
| | (.57 | ) | | | 1.47 | | | | 52,268 | | | | .47 | | | | .45 | | | | 4.57 | | | | 1 | |
| | 2.06 | | | | .94 | | | | 53,908 | | | | .46 | | | | .43 | | | | 4.35 | | | | 20 | |
| | 11.15 | | | | 5.30 | | | | 55,828 | | | | .46 | | | | .42 | | | | 4.29 | | | | 6 | |
| (a) | Total Return Based on Market Value is the combination of changes in the market price per share and the effect of reinvested dividend income and reinvested capital gains distributions, if any, at the average price paid per share at the time of reinvestment. The last dividend declared in the period, which is typically paid on the first business day of the following month, is assumed to be reinvested at the ending market price. The actual reinvestment for the last dividend declared in the period may take place over several days, and in some instances may not be based on the market price, so the actual reinvestment price may be different from the price used in the calculation. |
| | Total returns are not annualized. |
| | Total Return Based on Net Asset Value is the combination of changes in net asset value, reinvested dividend income at net asset value and reinvested capital gains distributions at net asset value, if any. The last dividend declared in the period, which is typically paid on the first business day of the following month, is assumed to be reinvested at the ending net asset value. The actual reinvest price for the last dividend declared in the period may often be based on the Fund’s market price (and not its net asset value), and therefore may be different from the price used in the calculation. Total returns are not annualized. |
| (b) | Ratios do not reflect the effect of custodian fee credits earned on the Fund’s net cash on deposit with the custodian bank, where applicable. |
| (c) | The expense ratios reflect, among other things, the interest expense deemed to have been paid by the Fund on the floating rate certificates issued by the special purpose trusts for the self-deposited inverse floaters held by the Fund, where applicable, as described in Footnote 1 – General Information and Significant Accounting Policies, Inverse Floating Rate Securities. |
See accompanying notes to financial statements.
Nuveen Investments 59
Notes to
Financial Statements
1. General Information and Significant Accounting Policies
General Information
The funds covered in this report and their corresponding New York Stock Exchange (“NYSE”) symbols are Nuveen Select Tax-Free Income Portfolio (NXP), Nuveen Select Tax-Free Income Portfolio 2 (NXQ), Nuveen Select Tax-Free Income Portfolio 3 (NXR), Nuveen California Select Tax-Free Income Portfolio (NXC) and Nuveen New York Select Tax-Free Income Portfolio (NXN) (collectively, the “Funds”). The Funds are registered under the Investment Company Act of 1940, as amended, as closed-end, registered investment companies.
Effective January 1, 2011, the Funds’ adviser, Nuveen Asset Management, a wholly-owned subsidiary of Nuveen Investments, Inc. (“Nuveen”), changed its name to Nuveen Fund Advisors, Inc. (the “Adviser”). Concurrently, the Adviser formed a wholly-owned subsidiary, Nuveen Asset Management, LLC (the “Sub-Adviser”) to house its portfolio management capabilities and serve as the Funds’ sub-adviser, and the Funds’ portfolio manager became an employee of the Sub-Adviser. This allocation of responsibilities between the Adviser and the Sub-Adviser affects each of the Funds. The Adviser will compensate the Sub-Adviser for the portfolio management services it provides to the Funds from each Fund’s management fee.
Each Fund seeks to provide current income and stable dividends, exempt from regular federal and designated state income taxes, where applicable, consistent with the preservation of capital by investing primarily in a portfolio of municipal obligations.
Significant Accounting Policies
The following is a summary of significant accounting policies followed by the Funds in the preparation of their financial statements in accordance with U.S. generally accepted accounting principles (“U.S. GAAP”).
Investment Valuation
Prices of municipal bonds are provided by a pricing service approved by the Funds’ Board of Trustees. These securities are generally classified as Level 2 for fair value measurement purposes. Common stocks and other equity-type securities are valued at the last sales price on the securities exchange on which such securities are primarily traded and are generally classified as Level 1. Securities primarily traded on the NASDAQ National Market (“NASDAQ”) are valued, except as indicated below, at the NASDAQ Official Closing Price and are generally classified as Level 1. However, securities traded on a securities exchange or NASDAQ for which there were no transactions on a given day or securities not listed on a securities exchange or NASDAQ are valued at the mean between the quoted bid and ask prices. When price quotes are not readily available (which is usually the case for municipal bonds) the pricing service establishes a security’s fair value using methods that may include consideration of the following: yields or prices of investments of comparable quality, type of issue, coupon, maturity and rating, market quotes or indications of value from security dealers, evaluations of anticipated cash flows or collateral, general market conditions and other information and analysis, including the obligor’s credit characteristics considered relevant. In pricing certain securities, particularly less liquid and lower quality securities, the pricing service may consider information about a security, its issuer, or market activity, provided by the Adviser. These securities are generally classified as Level 2 or Level 3 depending on the priority of the significant inputs.
Certain securities may not be able to be priced by the pre-established pricing methods as described above. Such securities may be valued by the Funds’ Board of Trustees or its designee at fair value. These securities generally include, but are not limited to, restricted securities (securities which may not be publicly sold without registration under the Securities Act of 1933, as amended) for which a pricing service is unable to provide a market price; securities whose trading has been formally suspended; debt securities that have gone into default and for which there is no current market quotation; a security whose market price is not available from a pre-established pricing source; a security with respect to which an event has occurred that is likely to materially affect the value of the security after the market has closed but before the calculation of a Fund’s net asset value (as may be the case in non-U.S. markets on which the security is primarily traded) or make it difficult or impossible to obtain a reliable market quotation; and a security whose price, as provided by the pricing service, is not deemed to reflect the security’s fair value. As a general principle, the fair value of a security would appear to be the amount that the owner might reasonably expect to receive for it in a current sale. A variety of factors may be considered in determining the fair value of these securities, which may include consideration of the following: yields or prices of investments of comparable quality, type of issue, coupon, maturity and rating, market quotes or indications of value from security dealers, evaluations of anticipated cash flows or collateral, general market conditions and other information and analysis, including the obligor’s credit characteristics considered relevant. These securities are generally classified as Level 2 or Level 3 depending on the priority of the significant inputs. Regardless of the method employed to value a particular security, all valuations are subject to review by the Funds’ Board of Trustees or its designee.
60 Nuveen Investments
Refer to Footnote 2 – Fair Value Measurements for further details on the leveling of securities held by the Funds as of the end of the reporting period.
Investment Transactions
Investment transactions are recorded on a trade date basis. Realized gains and losses from transactions are determined on the specific identification method, which is the same basis used for federal income tax purposes. Investments purchased on a when-issued/delayed delivery basis may have extended settlement periods. Any investments so purchased are subject to market fluctuation during this period. The Funds have instructed the custodian to segregate assets with a current value at least equal to the amount of the when-issued/delayed delivery purchase commitments. At March 31, 2011, there were no such outstanding purchase commitments in any of the Funds.
Investment Income
Investment income, which reflects the amortization of premiums and includes accretion of discounts for financial reporting purposes, is recorded on an accrual basis. Investment income also reflects paydown gains and losses, if any.
Professional Fees
Professional fees presented on the Statement of Operations consist of legal fees incurred in the normal course of operations, audit fees, tax consulting fees and, in some cases, workout expenditures. Workout expenditures are incurred in an attempt to protect or enhance an investment, or to pursue other claims or legal actions on behalf of Fund shareholders.
Income Taxes
Each Fund is a separate taxpayer for federal income tax purposes. Each Fund intends to distribute substantially all of its net investment income and net capital gains to shareholders and to otherwise comply with the requirements of Subchapter M of the Internal Revenue Code applicable to regulated investment companies. Therefore, no federal income tax provision is required. Furthermore, each Fund intends to satisfy conditions that will enable interest from municipal securities, which is exempt from regular federal and designated state income taxes, to retain such tax-exempt status when distributed to shareholders of the Funds. Net realized capital gains and ordinary income distributions paid by the Funds are subject to federal taxation.
For all open tax years and all major taxing jurisdictions, management of the Funds has concluded that there are no significant uncertain tax positions that would require recognition in the financial statements. Open tax years are those that are open for examination by taxing authorities (i.e., generally the last four tax year ends and the interim tax period since then). Furthermore, management of the Funds is also not aware of any tax positions for which it is reasonably possible that the total amounts of unrecognized tax benefits will significantly change in the next twelve months.
Dividends and Distributions to Shareholders
Dividends from net investment income are declared monthly. Net realized capital gains and/or market discount from investment transactions, if any, are distributed to shareholders at least annually. Furthermore, capital gains are distributed only to the extent they exceed available capital loss carryforwards.
Distributions to shareholders of net investment income, net realized capital gains and/or market discount, if any, are recorded on the ex-dividend date. The amount and timing of distributions are determined in accordance with federal income tax regulations, which may differ from U.S. GAAP.
Inverse Floating Rate Securities
Each Fund is authorized to invest in inverse floating rate securities. An inverse floating rate security is created by depositing a municipal bond, typically with a fixed interest rate, into a special purpose trust created by a broker-dealer. In turn, this trust (a) issues floating rate certificates, in face amounts equal to some fraction of the deposited bond’s par amount or market value, that typically pay short-term tax-exempt interest rates to third parties, and (b) issues to a long-term investor (such as one of the Funds) an inverse floating rate certificate (sometimes referred to as an “inverse floater”) that represents all remaining or residual interest in the trust. The income received by the inverse floater holder varies inversely with the short-term rate paid to the floating rate certificates’ holders, and in most circumstances the inverse floater holder bears substantially all of the underlying bond’s downside investment risk and also benefits disproportionately from any potential appreciation of the underlying bond’s value. The price of an inverse floating rate security will be more volatile than that of the underlying bond because the interest rate is dependent on not only the fixed coupon rate of the underlying bond but also on the short-term interest paid on the floating rate certificates, and because the inverse floating rate security essentially bears the risk of loss of the greater face value of the underlying bond.
A Fund may purchase an inverse floating rate security in a secondary market transaction without first owning the underlying bond (referred to as an “externally-deposited inverse floater”), or instead by first selling a fixed-rate bond to a broker-dealer for deposit into the special purpose trust and receiving in turn the residual interest in the trust (referred to as a “self-deposited inverse floater”). The inverse floater held by a Fund gives the Fund the right (a) to cause the holders of the floating rate certificates to tender their notes at par, and (b) to have the broker transfer the fixed-rate bond held by the trust to the Fund, thereby collapsing the trust. An investment in an externally-deposited inverse floater is identified in the Portfolio of Investments as “(IF) – Inverse floating rate investment.” An investment in a self-deposited inverse floater is accounted for as a financing transaction. In such instances, a fixed-rate bond deposited into a special purpose trust is identified in the Portfolio of Investments as “(UB) – Underlying bond of an inverse floating rate trust reflected as a financing transaction,” with the Fund accounting for the short-term floating rate certificates issued by the trust
Nuveen Investments 61
Notes to
Financial Statements (continued)
as “Floating rate obligations” on the Statement of Assets and Liabilities. In addition, the Fund reflects in “Investment Income” the entire earnings of the underlying bond and recognizes the related interest paid to the holders of the short-term floating rate certificates as “Interest expense on floating rate obligations” on the Statement of Operations.
During the fiscal year ended March 31, 2011, each Fund invested in externally deposited inverse floaters and/or self-deposited inverse floaters.
Each Fund may also enter into shortfall and forbearance agreements (sometimes referred to as a “recourse trust” or “credit recovery swap”) (such agreements referred to herein as “Recourse Trusts”) with a broker-dealer by which a Fund agrees to reimburse the broker-dealer, in certain circumstances, for the difference between the liquidation value of the fixed-rate bond held by the trust and the liquidation value of the floating rate certificates issued by the trust plus any shortfalls in interest cash flows. Under these agreements, a Fund’s potential exposure to losses related to or on inverse floaters may increase beyond the value of a Fund’s inverse floater investments as a Fund may potentially be liable to fulfill all amounts owed to holders of the floating rate certificates. At period end, any such shortfall is recognized as “Unrealized depreciation on Recourse Trusts” on the Statement of Assets and Liabilities.
| | | | | | |
At March 31, 2011, the Funds were not invested in externally-deposited Recourse Trusts. | | | | |
| | | | | | | | | | | | California | | | New York | |
| | | Select | | | Select | | | Select | | | Select | | | Select | |
| | | Tax-Free | | | Tax-Free 2 | | | Tax-Free 3 | | | Tax-Free | | | Tax-Free | |
| | | (NXP) | | | (NXQ) | | | (NXR) | | | (NXC) | | | (NXN) | |
Maximum exposure to Recourse Trusts | | $ | — | | | $ | — | | | $ | — | | | $ | — | | | $ | — | |
The average floating rate obligations outstanding and average annual interest rate and fees related to self-deposited inverse floaters for the following Funds during the fiscal year ended March 31, 2011, were as follows:
| | | | | | | | | | |
| | | | | | California | | | New York | |
| | | Select | | | Select | | | Select | |
| | | Tax-Free 2 | | | Tax-Free | | | Tax-Free | |
| | | (NXQ) | | | (NXC) | | | (NXN) | |
Average floating rate obligations outstanding | | $ | 1,000,000 | | | $ | 1,540,000 | | | $ | 1,005,000 | |
Average annual interest rate and fees | | | 0.80 | % | | | 0.70 | % | | | 0.56 | % |
Derivative Financial Instruments
Each Fund is authorized to invest in futures, options, swaps and other derivative instruments. Although the Funds are authorized to invest in such financial instruments, and may do so in the future, they did not make any such investments during the fiscal year ended March 31, 2011.
Zero Coupon Securities
Each Fund is authorized to invest in zero coupon securities. A zero coupon security does not pay a regular interest coupon to its holders during the life of the security. Tax-exempt income to the holder of the security comes from accretion of the difference between the original purchase price of the security at issuance and the par value of the security at maturity and is effectively paid at maturity. The market prices of zero coupon securities generally are more volatile than the market prices of securities that pay interest periodically.
Custodian Fee Credit
Each Fund has an arrangement with the custodian bank whereby certain custodian fees and expenses are reduced by net credits earned on each Fund’s cash on deposit with the bank. Such deposit arrangements are an alternative to overnight investments. Credits for cash balances may be offset by charges for any days on which a Fund overdraws its account at the custodian bank.
Indemnifications
Under the Funds’ organizational documents, their officers and trustees are indemnified against certain liabilities arising out of the performance of their duties to the Funds. In addition, in the normal course of business, the Funds enter into contracts that provide general indemnifications to other parties. The Funds’ maximum exposure under these arrangements is unknown as this would involve future claims that may be made against the Funds that have not yet occurred. However, the Funds have not had prior claims or losses pursuant to these contracts and expect the risk of loss to be remote.
Use of Estimates
The preparation of financial statements in conformity with U.S. GAAP requires management to make estimates and assumptions that affect the reported amounts of assets and liabilities at the date of the financial statements and the reported amounts of increases and decreases in net assets from operations during the reporting period. Actual results may differ from those estimates.
62 Nuveen Investments
2. Fair Value Measurements
Fair value is defined as the price that the Funds would receive upon selling an investment or transferring a liability in an orderly transaction to an independent buyer in the principal or most advantageous market of the investment. A three-tier hierarchy is used to maximize the use of observable market data and minimize the use of unobservable inputs and to establish classification of fair value measurements for disclosure purposes. Observable inputs reflect the assumptions market participants would use in pricing the asset or liability. Observable inputs are based on market data obtained from sources independent of the reporting entity. Unobservable inputs reflect the reporting entity’s own assumptions about the assumptions market participants would use in pricing the asset or liability. Unobservable inputs are based on the best information available in the circumstances. The three-tier hierarchy of inputs is summarized in the three broad levels listed below:
Level 1 – Quoted prices in active markets for identical securities.
Level 2 – Other significant observable inputs (including quoted prices for similar securities, interest rates, prepayment speeds, credit risk, etc.).
Level 3 – Significant unobservable inputs (including management’s assumptions in determining the fair value of investments).
The inputs or methodologies used for valuing securities are not an indication of the risk associated with investing in those securities. The following is a summary of each Fund’s fair value measurements as of March 31, 2011:
| | | | | | | | | | | | | |
Select Tax-Free (NXP) | | Level 1 | | | Level 2 | | | Level 3 | | | Total | |
Investments: | | | | | | | | | | | | |
Municipal Bonds | | $ | — | | | $ | 221,296,136 | | | $ | — | | | $ | 221,296,136 | |
Common Stocks | | | 2,805 | | | | — | | | | — | | | | 2,805 | |
Total | | $ | 2,805 | | | $ | 221,296,136 | | | $ | — | | | $ | 221,298,941 | |
Select Tax-Free 2 (NXQ) | | Level 1 | | | Level 2 | | | Level 3 | | | Total | |
Investments: | | | | | | | | | | | | | | | | |
Municipal Bonds | | $ | — | | | $ | 225,675,033 | | | $ | — | | | $ | 225,675,033 | |
Common Stocks | | | 2,690 | | | | — | | | | — | | | | 2,690 | |
Total | | $ | 2,690 | | | $ | 225,675,033 | | | $ | — | | | $ | 225,677,723 | |
Select Tax-Free 3 (NXR) | | Level 1 | | | Level 2 | | | Level 3 | | | Total | |
Investments: | | | | | | | | | | | | | | | | |
Municipal Bonds | | $ | — | | | $ | 173,412,794 | | | $ | — | | | $ | 173,412,794 | |
Common Stocks | | | 782 | | | | — | | | | — | | | | 782 | |
Total | | $ | 782 | | | $ | 173,412,794 | | | $ | — | | | $ | 173,413,576 | |
California Select Tax-Free (NXC) | | Level 1 | | | Level 2 | | | Level 3 | | | Total | |
Investments: | | | | | | | | | | | | | | | | |
Municipal Bonds | | $ | — | | | $ | 85,125,406 | | | $ | — | | | $ | 85,125,406 | |
New York Select Tax-Free (NXN) | | Level 1 | | | Level 2 | | | Level 3 | | | Total | |
Investments: | | | | | | | | | | | | | | | | |
Municipal Bonds | | $ | — | | | $ | 53,956,522 | | | $ | — | | | $ | 53,956,522 | |
| During the fiscal year ended March 31, 2011, the Funds recognized no significant transfers to/from Level 1, Level 2 or Level 3. | | | | | | | | | |
3. Derivative Instruments and Hedging Activities
The Funds record derivative instruments at fair value, with changes in fair value recognized on the Statement of Operations, when applicable. Even though the Funds’ investments in derivatives may represent economic hedges, they are not considered to be hedge transactions for financial reporting purposes. The Funds did not invest in derivative instruments during the fiscal year ended March 31, 2011.
4. Fund Shares
The Funds did not repurchase any of their outstanding shares during the fiscal year ended March 31, 2011, or the fiscal year ended March 31, 2010.
| | | | | | | |
Transactions in shares were as follows: | | | | | | |
| | Select | Select | Select |
| | Tax-Free (NXP) | Tax-Free 2 (NXQ) | Tax-Free 3 (NXR) |
| | Year Ended | Year Ended | Year Ended | Year Ended | Year Ended | Year Ended |
| | 3/31/11 | 3/31/10 | 3/31/11 | 3/31/10 | 3/31/11 | 3/31/10 |
Shares issued to shareholders | | | | | | |
due to reinvestment of distributions | 32,336 | 47,024 | 23,798 | 34,706 | 16,661 | 23,083 |
Nuveen Investments 63
| | | | | |
Notes to | | | | |
Financial Statements (continued) | | | | |
| | California Select | New York Select |
| | Tax-Free (NXC) | Tax-Free (NXN) |
| | Year Ended | Year Ended | Year Ended | Year Ended |
| | 3/31/11 | 3/31/10 | 3/31/11 | 3/31/10 |
Shares issued to shareholders | | | | |
due to reinvestment of distributions | — | — | 3,724 | 3,021 |
5. Investment Transactions
Purchases and sales (including maturities but excluding short-term investments and derivative transactions, when applicable) during the fiscal year ended March 31, 2011, were as follows:
| | | | | | | | | | | | | | | | |
| | | | | | | | | | | | California | | | New York | |
| | | Select | | | Select | | | Select | | | Select | | | Select | |
| | | Tax-Free | | | Tax-Free 2 | | | Tax-Free 3 | | | Tax-Free | | | Tax-Free | |
| | | (NXP) | | | (NXQ) | | | (NXR) | | | (NXC) | | | (NXN) | |
Purchases | | $ | 14,463,224 | | | $ | 13,488,051 | | | $ | 6,679,177 | | | $ | 6,958,146 | | | $ | 1,890,167 | |
Sales and maturities | | | 14,964,449 | | | | 13,597,514 | | | | 6,841,675 | | | | 7,392,416 | | | | 1,878,260 | |
6. Income Tax Information
The following information is presented on an income tax basis. Differences between amounts for financial statement and federal income tax purposes are primarily due to timing differences in recognizing taxable market discount, timing differences in recognizing certain gains and losses on investment transactions and the treatment of investments in inverse floating rate securities reflected as financing transactions, if any. To the extent that differences arise that are permanent in nature, such amounts are reclassified within the capital accounts as detailed below. Temporary differences do not require reclassification. Temporary and permanent differences do not impact the net asset values of the Funds.
At March 31, 2011, the cost and unrealized appreciation (depreciation) of investments (excluding investments in derivatives, when applicable), as determined on a federal income tax basis, were as follows:
| | | | | | | | | | | | | | | | |
| | | | | | | | | | | | California | | | New York | |
| | | Select | | | Select | | | Select | | | Select | | | Select | |
| | | Tax-Free | | | Tax-Free 2 | | | Tax-Free 3 | | | Tax-Free | | | Tax-Free | |
| | | (NXP) | | | (NXQ) | | | (NXR) | | | (NXC) | | | (NXN) | |
Cost of investments | | $ | 226,814,383 | | | $ | 241,640,093 | | | $ | 177,071,048 | | | $ | 86,536,720 | | | $ | 53,003,059 | |
Gross unrealized: | | | | | | | | | | | | | | | | | | | | |
Appreciation | | $ | 10,035,726 | | | $ | 5,445,681 | | | $ | 5,528,453 | | | $ | 1,468,299 | | | $ | 954,853 | |
Depreciation | | | (15,551,168 | ) | | | (22,408,051 | ) | | | (9,185,925 | ) | | | (4,422,847 | ) | | | (1,004,698 | ) |
Net unrealized appreciation (depreciation) of investments | | $ | (5,515,442 | ) | | $ | (16,962,370 | ) | | $ | (3,657,472 | ) | | $ | (2,954,548 | ) | | $ | (49,845 | ) |
Permanent differences, primarily due to federal taxes paid, taxable market discount and distribution character reclassifications, resulted in | |
reclassifications among the Funds’ components of net assets at March 31, 2011, the Funds’ tax year end, as follows: | | |
| | | | | | | | | | | | California | | | New York | |
| | | Select | | | Select | | | Select | | | Select | | | Select | |
| | | Tax-Free | | | Tax-Free 2 | | | Tax-Free 3 | | | Tax-Free | | | Tax-Free | |
| | | (NXP) | | | (NXQ) | | | (NXR) | | | (NXC) | | | (NXN) | |
Paid-in-surplus | | $ | 405 | | | $ | 9,131 | | | $ | 16,160 | | | $ | 3,609 | | | $ | — | |
Undistributed (Over-distribution of) net investment income | | | (515 | ) | | | (13,088 | ) | | | (10,376 | ) | | | (4,246 | ) | | | (1,895 | ) |
Accumulated net realized gain (loss) | | | 110 | | | | 3,957 | | | | (5,784 | ) | | | 637 | | | | 1,895 | |
64 Nuveen Investments
The tax components of undistributed net tax-exempt income, net ordinary income and net long-term capital gains at March 31, 2011, the Funds’ tax year end, were as follows:
| | | | | | | | | | | | | | | | |
| | | | | | | | | | | | California | | | New York | |
| | | Select | | | Select | | | Select | | | Select | | | Select | |
| | | Tax-Free | | | Tax-Free 2 | | | Tax-Free 3 | | | Tax-Free | | | Tax-Free | |
| | | (NXP) | | | (NXQ) | | | (NXR) | | | (NXC) | | | (NXN) | |
Undistributed net tax-exempt income* | | $ | 1,507,365 | | | $ | 956,516 | | | $ | 926,575 | | | $ | 481,944 | | | $ | 291,976 | |
Undistributed net ordinary income** | | | 55,604 | | | | 4,185 | | | | 185 | | | | — | | | | — | |
Undistributed net long-term capital gains | | | — | | | | — | | | | 465 | | | | — | | | | — | |
| * | Undistributed net tax-exempt income (on a tax basis) has not been reduced for the dividend declared on March 1, 2011, paid on April 1, 2011. |
| ** | Net ordinary income consists of taxable market discount income and net short-term capital gains, if any. |
The tax character of distributions paid during the Funds’ tax years ended March 31, 2011 and March 31, 2010, was designated for purposes of the dividends paid deduction as follows:
| | | | | | | | | | | | | | | | |
| | | | | | | | | | | | California | | | New York | |
| | | Select | | | Select | | | Select | | | Select | | | Select | |
| | | Tax-Free | | | Tax-Free 2 | | | Tax-Free 3 | | | Tax-Free | | | Tax-Free | |
2011 | | (NXP) | | | (NXQ) | | | (NXR) | | | (NXC) | | | (NXN) | |
Distributions from net tax-exempt income*** | | $ | 11,779,604 | | | $ | 11,778,835 | | | $ | 8,353,383 | | | $ | 4,174,015 | | | $ | 2,395,738 | |
Distributions from net ordinary income** | | | — | | | | — | | | | — | | | | — | | | | — | |
Distributions from net long-term capital gains**** | | | — | | | | — | | | | 14,320 | | | | — | | | | — | |
| | | | | | | | | | | | California | | | New York | |
| | | Select | | | Select | | | Select | | | Select | | | Select | |
| | | Tax-Free | | | Tax-Free 2 | | | Tax-Free 3 | | | Tax-Free | | | Tax-Free | |
2010 | | (NXP) | | | (NXQ) | | | (NXR) | | | (NXC) | | | (NXN) | |
Distributions from net tax-exempt income | | $ | 11,501,182 | | | $ | 11,757,723 | | | $ | 8,339,231 | | | $ | 4,174,015 | | | $ | 2,393,829 | |
Distributions from net ordinary income** | | | 263,468 | | | | — | | | | 306 | | | | — | | | | — | |
Distributions from net long-term capital gains | | | — | | | | — | | | | 12,690 | | | | — | | | | — | |
| ** | Net ordinary income consists of taxable market discount income and net short-term capital gains, if any. |
| *** | The Funds hereby designate these amounts paid during the fiscal year ended March 31, 2011, as Exempt Interest Dividends. |
| **** | The Funds designate as a long-term capital gain dividend, pursuant to the Internal Revenue Code Section 852(b)(3), the amount necessary to reduce earnings and profits of the Funds related to net capital gain to zero for the tax year ended March 31, 2011. |
At March 31, 2011, the Funds’ tax year end, the following Funds had unused capital loss carryforwards available for federal income tax purposes to be applied against future capital gains, if any. If not applied, the carryforwards will expire as follows:
| | | | | | | | | | | | | |
| | | | | | | | | California | | | New York | |
| | | Select | | | Select | | | Select | | | Select | |
| | | Tax-Free | | | Tax-Free 2 | | | Tax-Free | | | Tax-Free | |
| | | (NXP) | | | (NXQ) | | | (NXC) | | | (NXN) | |
Expiration: | | | | | | | | | | | | |
March 31, 2015 | | $ | 465,330 | | | $ | 1,317,559 | | | $ | — | | | $ | — | |
March 31, 2016 | | | — | | | | 7,597 | | | | 29,942 | | | | 40,192 | |
March 31, 2017 | | | — | | | | 400,800 | | | | 107,619 | | | | 15,314 | |
March 31, 2018 | | | — | | | | — | | | | — | | | | 9,265 | |
March 31, 2019 | | | — | | | | 335,742 | | | | 173,121 | | | | 27,908 | |
Total | | $ | 465,330 | | | $ | 2,061,698 | | | $ | 310,682 | | | $ | 92,679 | |
During the tax year ended March 31, 2011, Select Tax-Free (NXP) utilized $378,690 of its capital loss carryforwards.
Nuveen Investments 65
Notes to
Financial Statements (continued)
The following Fund has elected to defer net realized losses from investments incurred from November 1, 2010 through March 31, 2011, the Fund’s tax year end, (“post-October losses”) in accordance with federal income tax regulations. Post-October losses are treated as having arisen on the first day of the following fiscal year. The following Fund has elected to defer post-October losses as follows:
| | |
| | New York Select Tax-Free (NXN) |
| Post-October capital losses | $23,141 |
7. Management Fees and Other Transactions with Affiliates
Each Fund’s management fee consists of two components – a fund-level fee, based only on the amount of assets within the Fund, and a complex-level fee, based on the aggregate amount of all eligible fund assets managed by the Adviser. This pricing structure enables Fund shareholders to benefit from growth in the assets within their Fund as well as from growth in the amount of complex-wide assets managed by the Adviser.
| | | |
The annual fund-level fee for each Fund, payable monthly, is calculated according to the following schedule: | |
| | | | | | Select Tax-Free 2 (NXQ) | |
| | | | | | Select Tax-Free 3 (NXR) | |
| | | | | | California Select Tax-Free (NXC) | |
| | | Select Tax-Free (NXP) | | | New York Select Tax-Free (NXN) | |
Average Daily Managed Assets* | | Fund-Level Fee Rate | | | Fund-Level Fee Rate | |
For the first $125 million | | | .0500 | % | | | .1000 | % |
For the next $125 million | | | .0375 | | | | .0875 | |
For the next $250 million | | | .0250 | | | | .0750 | |
For the next $500 million | | | .0125 | | | | .0625 | |
The annual complex-level fee for each Fund, payable monthly, is calculated according to the following schedule:
| | | |
Complex-Level Managed Asset Breakpoint Level* | Effective Rate at Breakpoint Level |
$55 billion | .2000 | % |
$56 billion | .1996 | |
$57 billion | .1989 | |
$60 billion | .1961 | |
$63 billion | .1931 | |
$66 billion | .1900 | |
$71 billion | .1851 | |
$76 billion | .1806 | |
$80 billion | .1773 | |
$91 billion | .1691 | |
$125 billion | .1599 | |
$200 billion | .1505 | |
$250 billion | .1469 | |
$300 billion | .1445 | |
| * | For the fund-level and complex-level fees, managed assets include closed-end fund assets managed by the Adviser that are attributable to financial leverage. For these purposes, financial leverage includes the funds’ use of preferred stock and borrowings and certain investments in the residual interest certificates (also called inverse floating rate securities) in tender option bond (TOB) trusts, including the portion of assets held by a TOB trust that has been effectively financed by the trust’s issuance of floating rate securities, subject to an agreement by the Adviser as to certain funds to limit the amount of such assets for determining managed assets in certain circumstances. The complex-level fee is calculated based upon the aggregate daily managed assets of all Nuveen funds that constitute “eligible assets.” Eligible assets do not include assets attributable to investments in other Nuveen funds and assets in excess of $2 billion added to the Nuveen Fund complex in connection with the Adviser’s assumption of the management of the former First American Funds effective January 1, 2011. As of March 31, 2011, the complex-level fee rate for these Funds was .1800%. |
The management fee compensates the Adviser for overall investment advisory and administrative services and general office facilities. The Adviser has entered into Sub-Advisory Agreements with the Sub-Adviser under which the Sub-Adviser manages the investment portfolios of the Funds. The Sub-Adviser is compensated for its services to the Funds from the management fees paid to the Adviser.
The Funds pay no compensation directly to those of its trustees who are affiliated with the Adviser or to its officers, all of whom receive remuneration for their services to the Funds from the Adviser or its affiliates. The Board of Trustees has adopted a deferred compensation plan for independent trustees that enables trustees to elect to defer receipt of all or a portion of the annual compensation they are entitled to receive from certain Nuveen advised funds. Under the plan, deferred amounts are treated as though equal dollar amounts had been invested in shares of select Nuveen advised funds.
66 Nuveen Investments
| |
Board Members & Officers(Unaudited) |
The management of the Funds, including general supervision of the duties performed for the Funds by the Adviser, is the responsibility of the Board Members of the Funds. The number of board members of the Fund is currently set at ten. None of the board members who are not “interested” persons of the Funds (referred to herein as “independent board members”) has ever been a director or employee of, or consultant to, Nuveen or its affiliates. The names and business addresses of the board members and officers of the Funds, their principal occupations and other affiliations during the past five years, the number of portfolios each oversees and other directorships they hold are set forth below.
| | | | | Number |
| Name, | Position(s) Held | Year First | Principal | |
| Birthdate | the Funds | Elected or | Occupation(s) | in Fund |
| & Address | | Appointed | Including other | Complex |
| | | and Term(1) | Directorships | Overseen by |
| | | | During Past 5 Years | Board Member |
Independent Board Members: | | | |
■ ROBERT P. BREMNER(2) | | | Private Investor and Management Consultant; Treasurer and Director, | |
| 8/22/40 | Chairman of | | Humanities Council of Washington, D.C.; Board Member, | |
| 333 W. Wacker Drive | the Board | 1996 | Independent Directors Council affiliated with the Investment | 246 |
| Chicago, IL 60606 | and Board Member | | Company Institute. | |
| | | | | |
■ JACK B. EVANS | | | President, The Hall-Perrine Foundation, a private philanthropic | |
10/22/48 | | | corporation (since 1996); Director and Chairman, United Fire | |
| 333 W. Wacker Drive | Board Member | 1999 | Group, a publicly held company; President Pro Tem of the Board of | 246 |
| Chicago, IL 60606 | | | Regents for the State of Iowa University System; Director, Source Media | |
| | | | Group; Life Trustee of Coe College and the Iowa College Foundation; | |
| | | | formerly, Director, Alliant Energy; formerly, Director, Federal | |
| | | | Reserve Bank of Chicago; formerly, President and Chief Operating | |
| | | | Officer, SCI Financial Group, Inc., a regional financial services firm. | |
| | | | | |
■ WILLIAM C. HUNTER | | | Dean, Tippie College of Business, University of Iowa (since | |
| 3/6/48 | | | 2006); Director (since 2004) of Xerox Corporation; Director | |
| 333 W. Wacker Drive | Board Member | 2004 | (since 2005), Beta Gamma Sigma International Honor Society; | 246 |
| Chicago, IL 60606 | | | Director of Wellmark, Inc. (since 2009); formerly, Dean and | |
| | | | Distinguished Professor of Finance, School of Business at the | |
| | | | University of Connecticut (2003-2006); previously, Senior Vice | |
| | | | President and Director of Research at the Federal Reserve Bank | |
| | | | of Chicago (1995-2003); formerly, Director (1997-2007), Credit | |
| | | | Research Center at Georgetown University. | |
| | | | | |
■ DAVID J. KUNDERT(2) | | | Director, Northwestern Mutual Wealth Management | |
| 10/28/42 | | | Company; retired (since 2004) as Chairman, JPMorgan | |
| 333 W. Wacker Drive | Board Member | 2005 | Fleming Asset Management, President and CEO, Banc One | 246 |
| Chicago, IL 60606 | | | Investment Advisors Corporation, and President, One Group | |
| | | | Mutual Funds; prior thereto, Executive Vice President, Banc One | |
| | | | Corporation and Chairman and CEO, Banc One Investment | |
| | | | Management Group; Member, Board of Regents, Luther College; | |
| | | | member of the Wisconsin Bar Association; member of Board of | |
| | | | Directors, Friends of Boerner Botanical Gardens; member of Board | |
| | | | of Directors and Chair of Investment Committee, Greater | |
| | | | Milwaukee Foundation. | |
| | | | |
■ WILLIAM J. SCHNEIDER(2) | | Chairman of Miller-Valentine Partners Ltd., a real estate investment | |
| 9/24/44 | | | company; formerly, Senior Partner and Chief Operating Officer | |
| 333 W. Wacker Drive | Board Member | 1997 | (retired 2004) of Miller-Valentine Group; member, University of | 246 |
| Chicago, IL 60606 | | | Dayton Business School Advisory Council;member, Mid-America | |
| | | | Health System Board; formerly, member and chair, Dayton Philharmonic | |
| | | | Orchestra Association; formerly, member, Business Advisory Council, | |
| | | | Cleveland Federal Reserve Bank. | |
Nuveen Investments 67
Board Members & Officers (Unaudited) (continued)
| | | | | Number |
| Name, | Position(s) Held | Year First | Principal | of Portfolios |
| Birthdate | withthe Funds | Elected or | Occupation(s) | in Fund |
| & Address | | Appointed | Including other | Complex |
| | | and Term(1) | Directorships | Overseen by |
| | | | During Past 5 Years | Board Member |
Independent Board Members: | | | |
■ JUDITH M. STOCKDALE | | | Executive Director, Gaylord and Dorothy Donnelley | |
| 12/29/47 | Board Member | | Foundation (since 1994); prior thereto, Executive Director, | |
| 333 W. Wacker Drive | | 1997 | Great Lakes Protection Fund (1990-1994). | 246 |
| Chicago, IL 60606 | | | | |
| | | | | |
■ CAROLE E. STONE(2) | | | Director, Chicago Board Options Exchange (since 2006); Director, | |
| 6/28/47 | | | C2 Options Exchange, Incorporated (since 2009); formerly, | |
| 333 W. Wacker Drive | Board Member | 2007 | Commissioner, New York State Commission on Public Authority | 246 |
| Chicago, IL 60606 | | | Reform (2005-2010); formerly, Chair, New York Racing Association | |
| | | | Oversight Board (2005-2007). | |
| | | | | |
■ VIRGINIA L. STRINGER | | | Board Member, Mutual Fund Directors Forum; Member, Governing | |
| 8/16/44 | | | Board, Investment Company Institute’s Independent Directors | |
| 333 W. Wacker Drive | Board Member | 2011 | Council; governance consultant and non-profit board member; | 246 |
| Chicago, IL 60606 | | | former Owner and President, Strategic Management Resources, Inc. | |
| | | | a management consulting firm; previously, held several executive | |
| | | | positions in general management, marketing and human resources at | |
| | | | IBM and The Pillsbury Company; Independent Director, First American | |
| | | | Fund Complex (1987-2010) and Chair (1997-2010). | |
■ TERENCE J. TOTH(2) | | | | |
| 9/29/59 | | | Director, Legal & General Investment Management America, Inc. | |
| 333 W. Wacker Drive | Board Member | 2008 | (since 2008); Managing Partner, Promus Capital (since 2008); | 246 |
| Chicago, IL 60606 | | | formerly, CEO and President, Northern Trust Global Investments | |
| | | | (2004-2007); Executive Vice President, Quantitative Management | |
| | | | & Securities Lending (2000-2004); prior thereto, various positions | |
| | | | with Northern Trust Company (since 1994); member: Goodman | |
| | | | Theatre Board (since 2004), Chicago Fellowship Board (since | |
| | | | 2005), and Catalyst Schools of Chicago Board (since 2008); formerly, | |
| | | | member: Northern Trust Mutual Funds Board (2005-2007), | |
| | | | Northern Trust Global Investments Board (2004-2007), Northern | |
| | | | Trust Japan Board (2004-2007), Northern Trust Securities Inc. | |
| | | | Board (2003-2007) and Northern Trust Hong Kong Board | |
| | | | (1997-2004). | |
Interested Board Member: | | | |
■ JOHN P. AMBOIAN(3) | | | Chief Executive Officer and Chairman (since 2007), and Director (since | |
| 6/14/61 | | | 1999) of Nuveen Investments, Inc., formerly, President (1999-2007); | |
| 333 W. Wacker Drive | Board Member | 2008 | Chief Executive Officer (since 2007) of Nuveen Investments Advisors, | 246 |
| Chicago, IL 60606 | | | Inc.; Director (since 1998) formerly, Chief Executive Officer (2007-2010) | |
| | | | of Nuveen Fund Advisors, Inc. | |
68 Nuveen Investments
| | | | | Number |
| Name, | Position(s) Held | Year First | Principal | of Portfolios |
| Birthdate | with the Funds | Elected or | Occupation(s) | in Fund |
| and Address | | Appointed(4) | During Past 5 Years | Complex |
| | | | | Overseen |
| | | | | by Officer |
Officers of the Funds: | | | | |
■ GIFFORD R. ZIMMERMAN | | Managing Director (since 2002), Assistant Secretary and Associate | |
| 9/9/56 | Chief | | General Counsel of Nuveen Securities, LLC; Managing Director | |
| 333 W. Wacker Drive | Administrative | 1988 | (since 2004) and Assistant Secretary (since 1994) of Nuveen | 246 |
| Chicago, IL 60606 | Officer | | Investments, Inc.; Managing Director (since 2002), Assistant | |
| | | | Secretary (since 1997) and Co-General Counsel (since 2011) of Nuveen | |
| | | | Fund Advisors, Inc.; Managing Director, Assistant Secretary and Associate | |
| | | | General Counsel of Nuveen Asset Management, LLC (since 2011); | |
| | | | Managing Director, Associate General Counsel and Assistant Secretary | |
| | | | of Symphony Asset Management LLC (since 2003); Vice President and | |
| | | | Assistant Secretary of NWQ Investment Management Company, LLC | |
| | | | (since 2002), Nuveen Investments Advisers Inc. (since 2002), Tradewinds | |
| | | | Global Investors LLC, and Santa Barbara Asset Management, LLC | |
| | | | (since 2006), Nuveen HydePark Group LLC and Nuveen Investment | |
| | | | Solutions, Inc. (since 2007) and of Winslow Capital Management Inc. | |
| | | | (since 2010); Chief Administrative Officer and Chief Compliance Officer | |
| | | | (since 2010) of Nuveen Commodities Asset Management, LLC; | |
| | | | Chartered Financial Analyst. | |
| | | | | |
■ WILLIAM ADAMS IV | | | Senior Executive Vice President, Global Structured Products | |
| 6/9/55 | | | (since 2010), formerly, Executive Vice President (1999-2010) | |
| 333 W. Wacker Drive | Vice President | 2007 | of Nuveen Securities, LLC; Co-President of Nuveen Fund | 132 |
| Chicago, IL 60606 | | | Advisors, Inc. (since 2011); Managing Director (since 2010) of | |
| | | Nuveen Commodities Asset Management, LLC. | |
| | | | |
■ CEDRIC H. ANTOSIEWICZ | | Managing Director of Nuveen Securities, LLC. | |
| 1/11/62 | | | | |
| 333 W. Wacker Drive | Vice President | 2007 | | 132 |
| Chicago, IL 60606 | | | | |
| | | | | |
■ MARGO L. COOK | | | Executive Vice President (since 2008) of Nuveen Investments, Inc. | |
| 4/11/64 | | | and of Nuveen Fund Advisors, Inc. (since 2011); previously, Head of | |
| 333 W. Wacker Drive | Vice President | 2009 | Institutional Asset Management (2007-2008) of Bear Stearns Asset | 246 |
| Chicago, IL 60606 | | | Management; Head of Institutional Asset Management (1986-2007) of | |
| | | | Bank of NY Mellon; Chartered Financial Analyst. | |
| | | | | |
■ LORNA C. FERGUSON | | | Managing Director (since 2004) of Nuveen Securities, LLC and | |
| 10/24/45 | | | Managing Director (since 2005) of Nuveen Fund Advisors, Inc. | |
| 333 W. Wacker Drive | Vice President | 1998 | | 246 |
| Chicago, IL 60606 | | | | |
| | | | | |
■ STEPHEN D. FOY | | | Senior Vice President (since 2010), formerly, Vice President (1993- | |
| 5/31/54 | Vice President | | 2010) and Funds Controller (since 1998) of Nuveen Securities, | |
| 333 W. Wacker Drive | and Controller | 1998 | LLC; Senior Vice President (since 2010), formerly, Vice President | 246 |
| Chicago, IL 60606 | | | (2005-2010) of Nuveen Fund Advisors, Inc.; Certified Public Accountant. | |
Nuveen Investments 69
Board Members & Officers (Unaudited) (continued)
| | | | | Number |
| Name, | Position(s) Held | Year First | Principal | of Portfolios |
| Birthdate | with the Funds | Elected or | Occupation(s) | in Fund |
| and Address | | Appointed(4) | During Past 5 Years | Complex |
| | | | | Overseen |
| | | | | by Officer |
Officers of the Funds: | | | | |
■ SCOTT S. GRACE | | | Managing Director, Corporate Finance & Development, Treasurer | |
| 8/20/70 | Vice President | | (since 2009) of Nuveen Securities, LLC; Managing Director and | |
| 333 W. Wacker Drive | and Treasurer | 2009 | Treasurer (since 2009) of Nuveen Fund Advisors, Inc., Nuveen | 246 |
| Chicago, IL 60606 | | | Investment Solutions, Inc., Nuveen Investments Advisers, Inc., | |
| | | | Nuveen Investments Holdings Inc. and (since (2011) Nuveen | |
| | | | Asset Management, LLC; Vice President and Treasurer of | |
| | | | NWQ Investment Management Company, LLC, Tradewinds | |
| | | | Global Investors, LLC, Symphony Asset Management LLC and | |
| | | | Winslow Capital Management, Inc.; Vice President of Santa | |
| | | | Barbara Asset Management, LLC; formerly, Treasurer (2006- | |
| | | | 2009), Senior Vice President (2008-2009), previously, Vice | |
| | | | President (2006-2008) of Janus Capital Group, Inc.; formerly, | |
| | | | Senior Associate in Morgan Stanley’s Global Financial | |
| | | | Services Group (2000-2003); Chartered Accountant | |
| | | | Designation. | |
| | | | | |
■ WALTER M. KELLY | | | Senior Vice President (since 2008), Vice President (2006-2008) | |
| 2/24/70 | Chief Compliance | | of Nuveen Securities, LLC; Senior Vice President (since 2008) | |
| 333 W. Wacker Drive | Officer and | 2003 | and Assistant Secretary (since 2008) of Nuveen Fund Advisors, Inc. | 246 |
| Chicago, IL 60606 | Vice President | | | |
| | | | | |
■ TINA M. LAZAR | | | Senior Vice President (since 2009), formerly, Vice President of Nuveen | |
| 8/27/61 | | | Securities, LLC (1999-2009); Senior Vice President (since 2010), | |
| 333 W. Wacker Drive | Vice President | 2002 | formerly, Vice President (2005-2010) of Nuveen Fund Advisors, Inc. | 246 |
| Chicago, IL 60606 | | | | |
| | | | | |
■ LARRY W. MARTIN | | | Senior Vice President (since 2010), formerly, Vice President | |
| 7/27/51 | Vice President and | | (1993-2010), Assistant Secretary and Assistant General Counsel | |
| 333 W. Wacker Drive | Assistant Secretary | 1997 | of Nuveen Securities, LLC; Senior Vice President (since 2011) of | 246 |
| Chicago, IL 60606 | | | Nuveen Asset Management, LLC: Senior Vice President (since 2010), | |
| | | | formerly, Vice President (2005-2010), and Assistant Secretary of | |
| | | | Nuveen Investments, Inc.; Senior Vice President (since 2010), formerly | |
| | | | Vice President (2005-2010), and Assistant Secretary (since 1997) of | |
| | | | Nuveen Fund Advisors, Inc.; Vice President and Assistant Secretary of Nuveen | |
| | | | Investments Advisers, Inc. (since 2002), NWQ Investment Management | |
| | | | Company, LLC, Symphony Asset Management LLC (since 2003), | |
| | | | Tradewinds Global Investors, LLC, Santa Barbara Asset Management, | |
| | | | LLC (since 2006), Nuveen HydePark Group, LLC and Nuveen Investment | |
| | | | Solutions, Inc. (since 2007); and of Winslow Capital Management, Inc. | |
| | | | (since 2010); Vice President and Assistant Secretary of Nuveen Commodities | |
| | | | Asset Management, LLC (since 2010). | |
| | | | | |
■ KEVIN J. MCCARTHY | | | Managing Director (since 2008), formerly, Vice President (2007-2008), | |
| 3/26/66 | Vice President | | Nuveen Securities, LLC; Managing Director (since 2008), Assistant | |
| 333 W. Wacker Drive | and Secretary | 2007 | Secretary (since 2007) and Co-General Counsel (since 2011) | 246 |
| Chicago, IL 60606 | | | of Nuveen Fund Advisors, Inc.; Managing Director, Assistant Secretary | |
| | | | and Associate General Counsel (since 2011) of Nuveen Asset | |
| | | | Management, LLC; Managing Director (since 2008), and Assistant | |
| | | | Secretary, Nuveen Investment Holdings, Inc.; Vice President | |
| | | | (since 2007) and Assistant Secretary of Nuveen Investments Advisers | |
| | | | Inc., NWQ Investment Management Company, LLC, Tradewinds | |
| | | | Global Investors LLC, NWQ Holdings, LLC, Symphony Asset Management | |
| | | | LLC, Santa Barbara Asset Management, LLC, Nuveen HydePark | |
| | | | Group, LLC, Nuveen Investment Solutions, Inc. (since 2007) and | |
| | | | of Winslow Capital Management, Inc. (since 2010); Vice President | |
| | | | and Secretary (since 2010) of Nuveen Commodities Asset Management, | |
| | | | LLC; prior thereto, Partner, Bell, Boyd & Lloyd LLP (1997-2007). | |
70 Nuveen Investments
| | | | | Number |
| Name, | Position(s) Held | Year First | Principal | of Portfolios |
| Birthdate | with the Funds | Elected or | Occupation(s) | in Fund |
| and Address | | Appointed(4) | During Past 5 Years | Complex |
| | | | | Overseen |
| | | | | by Officer |
Officers of the Funds: | | | | |
■ KATHLEEN L. PRUDHOMME | | Managing Director, Assistant Secretary and Co-General Counsel | |
| 3/30/53 | Vice President and | | (since 2011) of Nuveen Fund Advisors, Inc.; Managing Director, | |
| 800 Nicollet Mall | Assistant Secretary | 2011 | Assistant Secretary and Associate General Counsel (since 2011) | 246 |
| Minneapolis, MN 55402 | | | of Nuveen Asset Management, LLC; Managing Director and | |
| | | | Assistant Secretary (since 2011) of Nuveen Securities, LLC; | |
| | | | formerly, Secretary of FASF (2004-2010); Deputy General | |
| | | | Counsel, FAF Advisors, Inc. (2004-2010). | |
| (1) | Board Members serve three year terms. The Board of Trustees is divided into three classes, Class I, Class II, and Class III, with each being elected to serve until the third succeeding annual shareholders’ meeting subsequent to its election or thereafter in each case when its respective successors are duly elected or appointed. The first year elected or appointed represents the year in which the board member was first elected or appointed to any fund in the Nuveen Complex. |
| (2) | Also serves as a trustee of the Nuveen Diversified Commodity Fund, an exchange-traded commodity pool managed by Nuveen Commodities Asset Management, LLC, an affiliate of the Adviser. |
| (3) | Mr. Amboian is an interested trustee because of his position with Nuveen Investments, Inc. and certain of its subsidiaries, which are affiliates of the Nuveen Funds. |
| (4) | Officers serve one year terms through August of each year. The year first elected or appointed represents the year in which the Officer was first elected or appointed to any fund in the Nuveen Complex. |
Nuveen Investments 71
Annual Investment Management
Agreement Approval Process(Unaudited)
The Investment Company Act of 1940, as amended (the “1940 Act”), provides, in substance, that each investment advisory agreement between a fund and its investment adviser will continue in effect from year to year only if its continuance is approved at least annually by the fund’s board members, including by a vote of a majority of the board members who are not parties to the advisory agreement or “interested persons” of any parties (the “Independent Board Members”), cast in person at a meeting called for the purpose of considering such approval. In connection with such approvals, the fund’s board members must request and evaluate, and the investment adviser is required to furnish, such information as may be reasonably necessary to evaluate the terms of the advisory agreement. Accordingly, at a meeting held on May 25-26, 2010 (the “May Meeting”), the Boards of Trustees or Directors (as the case may be) (each a “Board” and each Trustee or Director, a “Board Member”) of the Funds, including a majority of the Independent Board Members, considered and approved the continuation of the advisory agreements (each an “Advisory Agreement”) between each Fund and Nuveen Asset Management (the “Adviser”) for an additional one-year period. In preparation for their considerations at the May Meeting, the Board also held a separate meeting on April 21-22, 2010 (the “April Meeting”). Accordingly, the factors considered and determinations made regarding the renewals by the Independent Board Members include those made at the April Meeting.
In addition, in evaluating the Advisory Agreements, the Independent Board Members reviewed a broad range of information relating to the Funds and the Adviser, including absolute and comparative performance, fee and expense information for the Funds (as described in more detail below), the profitability of Nuveen for its advisory activities (which includes its wholly owned subsidiaries), and other information regarding the organization, personnel, and services provided by the Adviser. The Independent Board Members also met quarterly as well as at other times as the need arose during the year and took into account the information provided at such meetings and the knowledge gained therefrom. Prior to approving the renewal of the Advisory Agreements, the Independent Board Members reviewed the foregoing information with their independent legal counsel and with management, reviewed materials from independent legal counsel describing applicable law and their duties in reviewing advisory contracts, and met with independent legal counsel in private sessions without management present. The Independent Board Members considered the legal advice provided by independent legal counsel and relied upon their knowledge of the Adviser, its services and the Funds resulting from their meetings and other interactions throughout the year and their own business judgment in determining the factors to be considered in evaluating the
72 Nuveen Investments
Advisory Agreements. Each Board Member may have accorded different weight to the various factors in reaching his or her conclusions with respect to a Fund’s Advisory Agreement. The Independent Board Members did not identify any single factor as all-important or controlling. The Independent Board Members’ considerations were instead based on a comprehensive consideration of all the information presented. The principal factors considered by the Board and its conclusions are described below.
A. Nature, Extent and Quality of Services
In considering renewal of the Advisory Agreements, the Independent Board Members considered the nature, extent and quality of the Adviser’s services, including advisory services and administrative services. The Independent Board Members reviewed materials outlining, among other things, the Adviser’s organization and business; the types of services that the Adviser or its affiliates provide and are expected to provide to the Funds; the performance record of the applicable Fund (as described in further detail below); and any initiatives Nuveen had taken for the applicable fund product line, including continued activities to refinance auction rate preferred securities, manage leverage during periods of market turbulence and implement an enhanced leverage management process, modify investment mandates in light of market conditions and seek shareholder approval as necessary, maintain the fund share repurchase program and maintain shareholder communications to keep shareholders apprised of Nuveen’s efforts in refinancing preferred shares. In addition to the foregoing, the Independent Board Members also noted the additional services that the Adviser or its affiliates provide to closed-end funds, including, in particular, Nuveen’s continued commitment to supporting the secondary market for the common shares of its closed-end funds through a variety of programs designed to raise investor and analyst awareness and understanding of closed-end funds. These efforts include maintaining an investor relations program to provide timely information and education to financial advisers and investors; providing marketing for the closed-end funds; maintaining and enhancing a closed-end fund website; participating in conferences and having direct communications with analysts and financial advisors.
As part of their review, the Independent Board Members also evaluated the background, experience and track record of the Adviser’s investment personnel. In this regard, the Independent Board Members considered any changes in the personnel, and the impact on the level of services provided to the Funds, if any. The Independent Board Members also reviewed information regarding portfolio manager compensation arrangements to evaluate the Adviser’s ability to attract and retain high quality investment personnel, preserve stability, and reward performance but not provide an incentive for taking undue risks.
Nuveen Investments 73
Annual Investment Management Agreement
Approval Process (Unaudited) (continued)
In addition to advisory services, the Independent Board Members considered the quality of administrative services provided by the Adviser and its affiliates including product management, fund administration, oversight of service providers, shareholder services, administration of Board relations, regulatory and portfolio compliance and legal support. Given the importance of compliance, the Independent Board Members also considered the Adviser’s compliance program, including the report of the chief compliance officer regarding the Funds’ compliance policies and procedures.
Based on their review, the Independent Board Members found that, overall, the nature, extent and quality of services provided (and expected to be provided) to the respective Funds under the Advisory Agreements were satisfactory.
B. The Investment Performance of the Funds and the Adviser
The Board considered the performance results of each Fund over various time periods. The Board reviewed, among other things, each Fund’s historic investment performance as well as information comparing the Fund’s performance information with that of other funds (the “Performance Peer Group”) based on data provided by an independent provider of mutual fund data and with recognized and/or customized benchmarks. In this regard, the Board reviewed each Fund’s total return information compared to its Performance Peer Group for the quarter, one-, three- and five-year periods ending December 31, 2009 and for the same periods ending March 31, 2010. In addition, the Board reviewed each Fund’s total return information compared to recognized and/or customized benchmarks for the quarter, one- and three-year periods ending December 31, 2009 and for the same periods ending March 31, 2010. Moreover, the Board reviewed the peer ranking of the Nuveen municipal funds advised by the Adviser in the aggregate. The Independent Board Members also reviewed historic premium and discount levels. This information supplemented the Fund performance information provided to the Board at each of its quarterly meetings.
In reviewing peer comparison information, the Independent Board Members recognized that the Performance Peer Group of certain funds may not adequately represent the objectives and strategies of the funds, thereby limiting the usefulness of comparing a fund’s performance with that of its Performance Peer Group. In this regard, the Independent Board Members considered that the Performance Peer Groups of certain funds (including the Funds) were classified as having significant differences from such funds based on considerations such as special fund objectives, potential investable universe and the composition of the peer set (e.g., the number and size of competing funds and number of competing managers).
Based on their review, the Independent Board Members determined that each Fund’s investment performance over time had been satisfactory. The Independent Board Members noted that the Funds underperformed the performance of their benchmarks in the three-year period but outperformed the performance of their benchmarks in the one-year period.
74 Nuveen Investments
C. Fees, Expenses and Profitability
1. Fees and Expenses
The Board evaluated the management fees and expenses of each Fund reviewing, among other things, such Fund’s gross management fees, net management fees and net expense ratios in absolute terms as well as compared to the fee and expenses of a comparable universe of funds based on data provided by an independent fund data provider (the “Peer Universe”) and in certain cases, to a more focused subset of funds in the Peer Universe (the “Peer Group”) and any expense limitations.
The Independent Board Members further reviewed the methodology regarding the construction of the applicable Peer Universe and/or Peer Group. In reviewing the comparisons of fee and expense information, the Independent Board Members took into account that in certain instances various factors such as: the asset level of a fund relative to peers; the limited size and particular composition of the Peer Universe or Peer Group; the investment objectives of the peers; expense anomalies; changes in the funds comprising the Peer Universe or Peer Group from year to year; levels of reimbursement; the timing of information used; the differences in the type and use of leverage; and differences in the states reflected in the Peer Universe or Peer Group (with respect to state municipal funds) may impact the comparative data, thereby limiting the ability to make a meaningful comparison with peers, including for each of the Funds.
In reviewing the fee schedule for a Fund, the Independent Board Members also considered the fund-level and complex-wide breakpoint schedules (described in further detail below) and any fee waivers and reimbursements provided by Nuveen (applicable, in particular, for certain closed-end funds launched since 1999). The Independent Board Members noted that the Funds had net management fees and/or net expense ratios below, at or near (within 5 basis point or less) the peer averages of their Peer Group or Peer Universe.
Based on their review of the fee and expense information provided, the Independent Board Members determined that each Fund’s management fees were reasonable in light of the nature, extent and quality of services provided to the Fund.
2. Comparisons with the Fees of Other Clients
The Independent Board Members further reviewed information regarding the nature of services and fee rates offered by the Adviser to other clients, including municipal separately managed accounts and passively managed municipal bond exchange traded funds (ETFs) that are sub-advised by the Adviser. In evaluating the comparisons of fees, the Independent Board Members noted that the fee rates charged to the Funds and other clients vary, among other things, because of the different services involved and the additional regulatory and compliance requirements associated with registered investment companies, such as the Funds. Accordingly, the Independent Board Members considered the differences in the product types, including, but not limited to, the services provided, the structure and operations,
Nuveen Investments 75
Annual Investment Management Agreement
Approval Process (Unaudited) (continued)
product distribution and costs thereof, portfolio investment policies, investor profiles, account sizes and regulatory requirements. The Independent Board Members noted, in particular, that the range of services provided to the Funds (as discussed above) is much more extensive than that provided to separately managed accounts. Given the inherent differences in the products, particularly the extensive services provided to the Funds, the Independent Board Members believe such facts justify the different levels of fees.
3. Profitability of Nuveen
In conjunction with its review of fees, the Independent Board Members also considered the profitability of Nuveen for its advisory activities (which incorporated Nuveen’s wholly-owned affiliated sub-advisers) and its financial condition. The Independent Board Members reviewed the revenues and expenses of Nuveen’s advisory activities for the last two years, the allocation methodology used in preparing the profitability data and an analysis of the key drivers behind the changes in revenues and expenses that impacted profitability in 2009. The Independent Board Members noted this information supplemented the profitability information requested and received during the year to help keep them apprised of developments affecting profitability (such as changes in fee waivers and expense reimbursement commitments). In this regard, the Independent Board Members noted that they had also appointed an Independent Board Member as a point person to review and keep them apprised of changes to the profitability analysis and/or methodologies during the year. The Independent Board Members also considered Nuveen’s revenues for advisory activities, expenses, and profit margin compared to that of various unaffiliated management firms with similar amounts of assets under management and relatively comparable asset composition prepared by Nuveen.
In reviewing profitability, the Independent Board Members recognized the subjective nature of determining profitability which may be affected by numerous factors including the allocation of expenses. Further, the Independent Board Members recognized the difficulties in making comparisons as the profitability of other advisers generally is not publicly available and the profitability information that is available for certain advisers or management firms may not be representative of the industry and may be affected by, among other things, the adviser’s particular business mix, capital costs, types of funds managed and expense allocations. Notwithstanding the foregoing, the Independent Board Members reviewed Nuveen’s methodology and assumptions for allocating expenses across product lines to determine profitability. In reviewing profitability, the Independent Board Members recognized Nuveen’s investment in its fund business. Based on their review, the Independent Board Members concluded that Nuveen’s level of profitability for its advisory activities was reasonable in light of the services provided.
In evaluating the reasonableness of the compensation, the Independent Board Members also considered other amounts paid to the Adviser by the Funds as well as
76 Nuveen Investments
any indirect benefits (such as soft dollar arrangements, if any) the Adviser and its affiliates receive, or are expected to receive, that are directly attributable to the management of the Funds, if any. See Section E below for additional information on indirect benefits the Adviser may receive as a result of its relationship with the Funds. Based on their review of the overall fee arrangements of each Fund, the Independent Board Members determined that the advisory fees and expenses of the respective Fund were reasonable.
D. Economies of Scale and Whether Fee Levels Reflect These Economies of Scale
With respect to economies of scale, the Independent Board Members have recognized the potential benefits resulting from the costs of a fund being spread over a larger asset base, although economies of scale are difficult to measure and predict with precision, particularly on a fund-by-fund basis. One method to help ensure the shareholders share in these benefits is to include breakpoints in the advisory fee schedule. Generally, management fees for funds in the Nuveen complex are comprised of a fund-level component and a complex-level component, subject to certain exceptions. Accordingly, the Independent Board Members reviewed and considered the applicable fund-level breakpoints in the advisory fee schedules that reduce advisory fees as asset levels increase. Further, the Independent Board Members noted that although closed-end funds may from time-to-time make additional share offerings, the growth of their assets will occur primarily through the appreciation of such funds’ investment portfolio.
In addition to fund-level advisory fee breakpoints, the Board also considered the Funds’ complex-wide fee arrangement. Pursuant to the complex-wide fee arrangement, the fees of the funds in the Nuveen complex are generally reduced as the assets in the fund complex reach certain levels. The complex-wide fee arrangement seeks to provide the benefits of economies of scale to fund shareholders when total fund complex assets increase, even if assets of a particular fund are unchanged or have decreased. The approach reflects the notion that some of Nuveen’s costs are attributable to services provided to all its funds in the complex and therefore all funds benefit if these costs are spread over a larger asset base.
Based on their review, the Independent Board Members concluded that the breakpoint schedules and complex-wide fee arrangement were acceptable and reflect economies of scale to be shared with shareholders when assets under management increase.
Nuveen Investments 77
Annual Investment Management Agreement
Approval Process (Unaudited) (continued)
E. Indirect Benefits
In evaluating fees, the Independent Board Members received and considered information regarding potential “fall out” or ancillary benefits the Adviser or its affiliates may receive as a result of its relationship with each Fund. In this regard, the Independent Board Members considered any revenues received by affiliates of the Adviser for serving as agent at Nuveen’s trading desk and as co-manager in initial public offerings of new closed-end funds.
In addition to the above, the Independent Board Members considered whether the Adviser received any benefits from soft dollar arrangements whereby a portion of the commissions paid by a Fund for brokerage may be used to acquire research that may be useful to the Adviser in managing the assets of the Funds and other clients. The Independent Board Members noted that the Adviser does not currently have any soft dollar arrangements; however, to the extent certain bona fide agency transactions that occur on markets that traditionally trade on a principal basis and riskless principal transactions are considered as generating “commissions,” the Adviser intends to comply with the applicable safe harbor provisions.
Based on their review, the Independent Board Members concluded that any indirect benefits received by the Adviser as a result of its relationship with the Funds were reasonable and within acceptable parameters.
F. Other Considerations
The Independent Board Members did not identify any single factor discussed previously as all-important or controlling. The Board Members, including the Independent Board Members, unanimously concluded that the terms of the Advisory Agreements are fair and reasonable, that the Adviser’s fees are reasonable in light of the services provided to each Fund and that the Advisory Agreements be renewed.
78 Nuveen Investments
Board Approval of Sub-Advisory
Arrangements (Unaudited)
Since the May Meeting, Nuveen has engaged in an internal restructuring (the “Restructuring”) pursuant to which the portfolio management services provided by the Adviser to the Funds were transferred to Nuveen Asset Management, LLC (“NAM LLC”), a newly-organized wholly-owned subsidiary of the Adviser and the Adviser changed its name to Nuveen Fund Advisors, Inc. (“NFA”). The Adviser, under its new name NFA, continues to serve as investment adviser to the Funds and, in that capacity, will continue to provide various oversight, administrative, compliance and other services. To effectuate the foregoing, NFA entered into sub-advisory agreements with NAM LLC on behalf of the Funds (each, a “Sub-Advisory Agreement”). Under each Sub-Advisory Agreement, NAM LLC, subject to the oversight of NFA and the Board, will furnish an investment program, make investment decisions for, and place all orders for the purchase and sale of securities for the portion of the respective Fund’s investment portfolio allocated to it by NFA. There have been no changes to the advisory fees paid by the Funds; rather, NFA will pay a portion of the investment advisory fee it receives to NAM LLC for its sub-advisory services. The Independent Board Members reviewed the allocation of fees between NFA and NAM LLC. NFA and NAM LLC do not anticipate any reduction in the nature or level of services provided to the Funds following the Restructuring. The personnel of NFA who engaged in portfolio management activities prior to the spinoff of NAM LLC are not expected to materially change as a result of the spinoff. In light of the foregoing, at a meeting held on November 16-18, 2010, the Board Members, including a majority of the Independent Board Members, approved the Sub-Advisory Agreements on behalf of the Funds. Given that the Restructuring was not expected to reduce the level or nature of services provided and the advisory fees paid by the Funds were the same, the factors considered and determinations made at the May Meeting in approving the Advisory Agreements were equally applicable to the approval of the Sub-Advisory Agreements.
Nuveen Investments 79
Reinvest Automatically,
Easily and Conveniently
Nuveen makes reinvesting easy. A phone call is all it takes to set up your reinvestment account.
Nuveen Closed-End Funds Automatic Reinvestment Plan
Your Nuveen Closed-End Fund allows you to conveniently reinvest distributions in additional Fund shares.
By choosing to reinvest, you’ll be able to invest money regularly and automatically, and watch your investment grow through the power of compounding. Just like distributions in cash, there may be times when income or capital gains taxes may be payable on distributions that are reinvested.
It is important to note that an automatic reinvestment plan does not ensure a profit, nor does it protect you against loss in a declining market.
Easy and convenient
To make recordkeeping easy and convenient, each month you’ll receive a statement showing your total distributions, the date of investment, the shares acquired and the price per share, and the total number of shares you own.
How shares are purchased
The shares you acquire by reinvesting will either be purchased on the open market or newly issued by the Fund. If the shares are trading at or above net asset value at the time of valuation, the Fund will issue new shares at the greater of the net asset value or 95% of the then-current market price. If the shares are trading at less than net asset value, shares for your account will be purchased on the open market. If the Plan Agent begins purchasing Fund shares on the open market while shares are trading below net asset value, but the Fund’s shares subsequently trade at or above their net asset value before the Plan Agent is able to complete its purchases, the Plan Agent may cease open-market purchases and may invest the uninvested portion of the distribution in newly-issued Fund shares at a price equal to the greater of the shares’ net asset value or 95% of the shares’ market value on the last business day immediately prior to the purchase date. Distributions received to purchase shares in the open market will normally be invested shortly after the distribution payment date. No interest will be paid on distributions awaiting reinvestment. Because the market price of the shares may increase before purchases are completed, the average purchase price per share may
80 Nuveen Investments
exceed the market price at the time of valuation, resulting in the acquisition of fewer shares than if the distribution had been paid in shares issued by the Fund. A pro rata portion of any applicable brokerage commissions on open market purchases will be paid by Plan participants. These commissions usually will be lower than those charged on individual transactions.
Flexible
You may change your distribution option or withdraw from the Plan at any time, should your needs or situation change.
You can reinvest whether your shares are registered in your name, or in the name of a brokerage firm, bank, or other nominee. Ask your investment advisor if his or her firm will participate on your behalf. Participants whose shares are registered in the name of one firm may not be able to transfer the shares to another firm and continue to participate in the Plan.
The Fund reserves the right to amend or terminate the Plan at any time. Although the Fund reserves the right to amend the Plan to include a service charge payable by the participants, there is no direct service charge to participants in the Plan at this time.
Call today to start reinvesting distributions
For more information on the Nuveen Automatic Reinvestment Plan or to enroll in or withdraw from the Plan, speak with your financial advisor or call us at (800) 257-8787.
Nuveen Investments 81
Glossary of Terms
Used in this Report
| · | Auction Rate Bond: An auction rate bond is a security whose interest payments are adjusted periodically through an auction process, which process typically also serves as a means for buying and selling the bond. Auctions that fail to attract enough buyers for all the shares offered for sale are deemed to have “failed,” with current holders receiving a formula-based interest rate until the next scheduled auction. |
| · | Average Annual Total Return: This is a commonly used method to express an investment’s performance over a particular, usually multi-year time period. It expresses the return that would have been necessary each year to equal the invest- ment’s actual cumulative performance (including change in NAV or market price and reinvested dividends and capital gains distributions, if any) over the time period being considered. |
| · | Average Effective Maturity: The market-value-weighted average of the effective maturity dates of the individual securities including cash. In the case of a bond that has been advance-refunded to a call date, the effective maturity is the date on which the bond is scheduled to be redeemed using the proceeds of an escrow account. In most other cases the effective maturity is the stated maturity date of the security. |
| · | Inverse Floaters: Inverse floating rate securities, also known as inverse floaters, are created by depositing a municipal bond, typically with a fixed interest rate, into a special purpose trust created by a broker-dealer. This trust, in turn, (a) issues floating rate certificates typically paying short-term tax-exempt interest rates to third parties in amounts equal to some fraction of the deposited bond’s par amount or market value, and (b) issues an inverse floating rate certificate (sometimes referred to as an “inverse floater”) to an investor (such as a Fund) interested in gaining investment exposure to a long-term municipal bond. The income received by the holder of the inverse floater varies inversely with the short-term rate paid to the floating rate certificates’ holders, and in most circumstances the holder of the inverse floater bears substantially all of the underlying bond’s downside investment risk. The holder of the inverse floater typi- cally also benefits disproportionately from any potential appreciation of the underlying bond’s value. Hence, an inverse floater essentially represents an investment in the underlying bond on a leveraged basis. |
82 Nuveen Investments
| · | Leverage-Adjusted Duration: Duration is a measure of the expected period over which a bond’s principal and interest will be paid, and consequently is a measure of the sensitivity of a bond’s or bond Fund’s value to changes when market interest rates change. Generally, the longer a bond’s or Fund’s duration, the more the price of the bond or Fund will change as interest rates change. Leverage-adjusted duration takes into account the leveraging process for a Fund and therefore is longer than the duration of the Fund’s portfolio of bonds. |
| · | Market Yield (also known as Dividend Yield or Current Yield): An investment’s current annualized dividend divided by its current market price. |
| · | Net Asset Value (NAV): A Fund’s NAV per common share is calculated by subtracting the liabilities of the Fund (including any Preferred shares issued in order to leverage the Fund) from its total assets and then dividing the remainder by the number of common shares outstanding. Fund NAVs are calculated at the end of each business day. |
| · | Pre-Refunding: Pre-Refunding, also known as advanced refundings or refinancings, is a procedure used by state and local governments to refinance municipal bonds to lower interest expenses. The issuer sells new bonds with a lower yield and uses the proceeds to buy U.S. Treasury securities, the interest from which is used to make payments on the higher-yielding bonds. Because of this collateral, pre-refunding generally raises a bond’s credit rating and thus its value. |
| · | Taxable-Equivalent Yield: The yield necessary from a fully taxable investment to equal, on an after-tax basis, the yield of a municipal bond investment. |
| · | Zero Coupon Bond: A zero coupon bond does not pay a regular interest coupon to its holders during the life of the bond. Tax-exempt income to the holder of the bond comes from accretion of the difference between the original purchase price of the bond at issuance and the par value of the bond at maturity and is effectively paid at maturity. The market prices of zero coupon bonds generally are more volatile than the market prices of bonds that pay interest periodically. |
Nuveen Investments 83
Notes
84 Nuveen Investments
Notes
Nuveen Investments 85
Notes
86 Nuveen Investments
Other Useful Information
Board of Trustees
John P. Amboian
Robert P. Bremner
Jack B. Evans
William C. Hunter
David J. Kundert
William J. Schneider
Judith M. Stockdale
Carole E. Stone
Virginia L. Stringer
Terence J. Toth
Fund Manager
Nuveen Fund Advisors, Inc.
333 West Wacker Drive
Chicago, IL 60606
Custodian
State Street Bank
& Trust Company
Boston, MA
Transfer Agent and
Shareholder Services
State Street Bank
& Trust Company
Nuveen Funds
P.O. Box 43071
Providence, RI 02940-3071
(800) 257-8787
Legal Counsel
Chapman and Cutler LLP
Chicago, IL
Independent Registered
Public Accounting Firm
Ernst & Young LLP
Chicago, IL
Quarterly Portfolio of Investments and Proxy Voting Information
You may obtain (i) each Fund’s quarterly portfolio of investments, (ii) information regarding how the Funds voted proxies relating to portfolio securities held during the most recent twelve-month period ended June 30, and (iii) a description of the policies and procedures that the Funds used to determine how to vote proxies relating to portfolio securities without charge, upon request, by calling Nuveen Investments toll-free at (800) 257-8787 or on Nuveen’s website at www.nuveen.com.
You may also obtain this and other Fund information directly from the Securities and Exchange Commission (SEC). The SEC may charge a copying fee for this information. Visit the SEC on-line at http://www.sec.gov or in person at the SEC’s Public Reference Room in Washington, D.C. Call the SEC at (202) 942-8090 for room hours and operation. You may also request Fund information by sending an e-mail request to publicinfo@sec.gov or by writing to the SEC’s Public References Section at 100 F Street NE, Washington, D.C. 20549.
CEO Certification Disclosure
Each Fund’s Chief Executive Officer has submitted to the New York Stock Exchange (NYSE) the annual CEO certification as required by Section 303A.12(a) of the NYSE Listed Company Manual.
Each Fund has filed with the SEC the certification of its Chief Executive Officer and Chief Financial Officer required by Section 302 of the Sarbanes-Oxley Act.
Share Information
Each Fund intends to repurchase shares of its own common stock in the future at such times and in such amounts as is deemed advisable. During the period covered by this report, the Funds did not repurchase any of their common shares.
Any future repurchases will be reported to shareholders in the next annual or semi-annual report.
Nuveen Investments 87
Nuveen Investments:
Serving Investors for Generations
Since 1898, financial advisors and their clients have relied on Nuveen Investments to provide dependable investment solutions through continued adherence to proven, long-term investing principles. Today, we offer a range of high quality equity and fixed-income solutions designed to be integral components of a well-diversified core portfolio.
Focused on meeting investor needs.
Nuveen Investments is a global investment management firm that seeks to help secure the long-term goals of institutions and high net worth investors as well as the consultants and financial advisors who serve them. We market our growing range of specialized investment solutions under the high-quality brands of HydePark, NWQ, Nuveen Asset Management, Santa Barbara, Symphony, Tradewinds and Winslow Capital. In total, Nuveen Investments managed approximately $206 billion of assets as of March 31, 2011.
Find out how we can help you.
To learn more about how the products and services of Nuveen Investments may be able to help you meet your financial goals, talk to your financial advisor, or call us at (800) 257-8787. Please read the information provided carefully before you invest. Investors should consider the investment objective and policies, risk considerations, charges and expenses of any investment carefully. Where applicable, be sure to obtain a prospectus, which contains this and other relevant information. To obtain a prospectus, please contact your securities representative or Nuveen Investments, 333 W. Wacker Dr., Chicago, IL 60606. Please read the prospectus carefully before you invest or send money.
Learn more about Nuveen Funds at: www.nuveen.com/cef
| Nuveen makes things e-simple. It only takes a minute to sign up for e-Reports. Once enrolled, you’ll receive an e-mail as soon as your Nuveen Fund information is ready - no more waiting for delivery by regular mail. Just click on the link within the e-mail to see the report and save it on your computer if you wish. Free e-Reports right to your e-mail! www.investordelivery.com If you receive your Nuveen Fund distributions and statements from your financial advisor or brokerage account. OR www.nuveen.com/accountaccess If you receive your Nuveen Fund distributions and statements directly from Nuveen. |
| |
Distributed by |
Nuveen Securities, LLC |
333 West Wacker Drive |
Chicago, IL 60606 |
www.nuveen.com |
EAN-B-0311D
ITEM 2. CODE OF ETHICS.
As of the end of the period covered by this report, the registrant has adopted a code of ethics that applies to the registrant's principal executive officer, principal financial officer, principal accounting officer or controller, or persons performing similar functions. There were no amendments to or waivers from the Code during the period covered by this report. The registrant has posted the code of ethics on its website at www.nuveen.com/CEF/Info/Shareholder. (To view the code, click on Fund Governance and then click on Code of Conduct.)
ITEM 3. AUDIT COMMITTEE FINANCIAL EXPERT.
The registrant's Board of Directors or Trustees ("Board") determined that the registrant has at least one "audit committee financial expert" (as defined in Item 3 of Form N-CSR) serving on its Audit Committee. The registrant's audit committee financial expert is Carole E. Stone, who is "independent" for purposes of Item 3 of Form N-CSR.
Ms. Stone served for five years as Director of the New York State Division of the Budget. As part of her role as Director, Ms. Stone was actively involved in overseeing the development of the State's operating, local assistance and capital budgets, its financial plan and related documents; overseeing the development of the State's bond-related disclosure documents and certifying that they fairly presented the State's financial position; reviewing audits of various State and local agencies and programs; and coordinating the State's system of internal audit and control. Prior to serving as Director, Ms Stone worked as a budget analyst/examiner with increasing levels of responsibility over a 30 year period, including approximately five years as Deputy Budget Director. Ms. Stone has also served as Chair of the New York State Racing Association Oversight Board, as Chair of the Public Authorities Control Board, as a Commissioner on the New York State Commission on Public Authority Reform and as a member of the Boards of Directors of several New York State public authorities. These positions have involved overseeing operations and finances of certain entities and assessing the adequacy of project/entity financing and financial reporting. Currently, Ms. Stone is on the Board of Directors of CBOE Holdings, Inc., of the Chicago Board Options Exchange, and of C2 Options Exchange. Ms. Stone's position on the boards of these entities and as a member of both CBOE Holdings' Audit Committee and its Finance Committee has involved, among other things, the oversight of audits, audit plans and preparation of financial statements.
ITEM 4. PRINCIPAL ACCOUNTANT FEES AND SERVICES.
The following tables show the amount of fees that Ernst & Young LLP, the Fund's auditor, billed to the Fund during the Fund's last two full fiscal years. For engagements with Ernst & Young LLP the Audit Committee approved in advance all audit services and non-audit services that Ernst & Young LLP provided to the Fund, except for those non-audit services that were subject to the pre-approval exception under Rule 2-01 of Regulation S-X (the "pre-approval exception"). The pre-approval exception for services provided directly to the Fund waives the pre-approval requirement for services other than audit, review or attest services if: (A) the aggregate amount of all such services provided constitutes no more than 5% of the total amount of revenues paid by the Fund to its accountant during the fiscal year in which the services are provided; (B) the Fund did not recognize the services as non-audit services at the time of the engagement; and (C) the services are promptly brought to the Audit Committee's attention, and the Committee (or its delegate) approves the services before the audit is completed.
The Audit Committee has delegated certain pre-approval responsibilities to its Chairman (or, in his absence, any other member of the Audit Committee).
SERVICES THAT THE FUND'S AUDITOR BILLED TO THE ADVISER AND AFFILIATED FUND SERVICE PROVIDERS
The tables also show the percentage of fees subject to the pre-approval exception. The pre-approval exception for services provided to the Adviser and any Affiliated Fund Service Provider (other than audit, review or attest services) waives the pre-approval requirement if: (A) the aggregate amount of all such services provided constitutes no more than 5% of the total amount of revenues paid to Ernst & Young LLP by the Fund, the Adviser and Affiliated Fund Service Providers during the fiscal year in which the services are provided that would have to be pre-approved by the Audit Committee; (B) the Fund did not recognize the services as non-audit services at the time of the engagement; and (C) the services are promptly brought to the Audit Committee's attention, and the Committee (or its delegate) approves the services before the Fund's audit is completed.
The following table shows the amount of fees that Ernst & Young LLP billed during the Fund's last two full fiscal years for non-audit services. The Audit Committee is required to pre-approve non-audit services that Ernst & Young LLP provides to the Adviser and any Affiliated Fund Services Provider, if the engagement related directly to the Fund's operations and financial reporting (except for those subject to the pre-approval exception described above). The Audit Committee requested and received information from Ernst & Young LLP about any non-audit services that Ernst & Young LLP rendered during the Fund's last fiscal year to the Adviser and any Affiliated Fund Service Provider. The Committee considered this information in evaluating Ernst & Young LLP's independence.
Audit Committee Pre-Approval Policies and Procedures. Generally, the Audit Committee must approve (i) all non-audit services to be performed for the Fund by the Fund's independent accountants and (ii) all audit and non-audit services to be performed by the Fund's independent accountants for the Affiliated Fund Service Providers with respect to operations and financial reporting of the Fund. Regarding tax and research projects conducted by the independent accountants for the Fund and Affiliated Fund Service Providers (with respect to operations and financial reports of the Fund) such engagements will be (i) pre-approved by the Audit Committee if they are expected to be for amounts greater than $10,000; (ii) reported to the Audit Committee chairman for his verbal approval prior to engagement if they are expected to be for amounts under $10,000 but greater than $5,000; and (iii) reported to the Audit Committee at the next Audit Committee meeting if they are expected to be for an amount under $5,000.
ITEM 5. AUDIT COMMITTEE OF LISTED REGISTRANTS.
ITEM 6. SCHEDULE OF INVESTMENTS.
a) See Portfolio of Investments in Item 1.
b) Not applicable.
ITEM 7. DISCLOSURE OF PROXY VOTING POLICIES AND PROCEDURES FOR CLOSED-END MANAGEMENT INVESTMENT COMPANIES.
Not applicable.
ITEM 10. SUBMISSION OF MATTERS TO A VOTE OF SECURITY HOLDERS.
There have been no material changes to the procedures by which shareholders may recommend nominees to the registrant's Board implemented after the registrant last provided disclosure in response to this item.
ITEM 11. CONTROLS AND PROCEDURES.
ITEM 12. EXHIBITS.
File the exhibits listed below as part of this Form. Letter or number the exhibits in the sequence indicated.
Pursuant to the requirements of the Securities Exchange Act of 1934 and the Investment Company Act of 1940, the registrant has duly caused this report to be signed on its behalf by the undersigned, thereunto duly authorized.
Kevin J. McCarthy
Pursuant to the requirements of the Securities Exchange Act of 1934 and the Investment Company Act of 1940, this report has been signed below by the following persons on behalf of the registrant and in the capacities and on the dates indicated.
Gifford R. Zimmerman
Stephen D. Foy