Life is Complex
Nuveen makes things e-simple.
It only takes a minute to sign up for e-Reports. Once enrolled, you'll receive an e-mail as soon as your Nuveen Investments Fund information is ready—no more waiting for delivery by regular mail. Just click on the link within the e-mail to see the report and save it on your computer if you wish.
Free e-Reports right to your e-mail!
www.investordelivery.com
If you receive your Nuveen Fund dividends and statements from your financial advisor or brokerage account.
or
www.nuveen.com/accountaccess
If you receive your Nuveen Fund dividends and statements directly from Nuveen.
Table of Contents
| Chairman's Letter to Shareholders | 4 |
| | |
| Portfolio Managers' Comments | 5 |
| | |
| Fund Leverage | 10 |
| | |
| Share Information | 11 |
| | |
| Risk Considerations | 13 |
| | |
| Performance Overview and Holding Summaries | 14 |
| | |
| Report of Independent Registered Public Accounting Firm | 22 |
| | |
| Portfolios of Investments | 23 |
| | |
| Statement of Assets and Liabilities | 56 |
| | |
| Statement of Operations | 57 |
| | |
| Statement of Changes in Net Assets | 58 |
| | |
| Financial Highlights | 60 |
| | |
| Notes to Financial Statements | 66 |
| | |
| Additional Fund Information | 77 |
| | |
| Glossary of Terms Used in this Report | 78 |
| | |
| Reinvest Automatically, Easily and Conveniently | 80 |
| | |
| Board Members & Officers | 81 |
Chairman's Letter to Shareholders
Dear Shareholders,
The financial markets saw an increase in volatility over the past year. Global economic growth has continued to look fragile, led by China's ongoing slowdown and stagnant growth in Europe and Japan. By contrast, the U.S. economy's modest recovery stayed on pace. However, concerns about downside risks to U.S. economic growth were heightened in early 2016 amid a weak global growth outlook and churning stock markets. In addition to the challenging economic backdrop, the persistent decline of oil prices and a rally in the U.S. dollar dampened U.S. corporate earnings growth, further contributing to an uncertain outlook.
For most of 2015, the U.S. Federal Reserve postponed the first increase to its main policy interest rate, which tended to boost risky assets and weigh on longer-term bond yields at points throughout the year. However, volatility rose in the late spring amid Greece's turbulent negotiations with its European Union creditors. China's stock market declined amid worries about its decelerating economy and a loss of confidence in its policy makers. Conditions turned more favorable in the fall, as the Fed delayed its rate hike again in October, the European Central Bank appeared poised for further easing and China administered another round of stimulus measures. By the time the Fed announced the rate hike in December, the move was widely expected and had very little market impact.
Although volatility spiked in early 2016, conditions have generally improved since mid-February 2016. Global growth expectations remain subdued, but investors have gained more confidence that the Fed's interest rate increases will be gradual, oil prices appear more stable, the U.S. dollar has weakened and the U.S. economy continues to look fairly resilient. Consumer spending, which represents roughly two-thirds of the economy, continues to be supported by the meaningful improvement in the labor market, wage growth and cheaper gas prices.
The global markets may continue seeing bouts of market turbulence this year. While short-term volatility can be uncomfortable for investors, these periods can also provide opportunities. The experienced investment professionals working for you at Nuveen continue to seek upside potential and manage downside risks, whether markets are rising or falling. We also encourage you to contact your financial advisor, who can help you develop a plan to weather short-term price swings, while remaining consistent with your investment goals, time horizon and risk tolerance.
On behalf of the other members of the Nuveen Fund Board, we look forward to continuing to earn your trust in the months and years ahead.
Sincerely,
William J. Schneider
Chairman of the Board
May 23, 2016
Portfolio Managers' Comments
Nuveen Select Tax-Free Income Portfolio (NXP)
Nuveen Select Tax-Free Income Portfolio 2 (NXQ)
Nuveen Select Tax-Free Income Portfolio 3 (NXR)
Nuveen California Select Tax-Free Income Portfolio (NXC)
Nuveen New York Select Tax-Free Income Portfolio (NXN)
These Funds feature portfolio management by Nuveen Asset Management, LLC, an affiliate of Nuveen Investments, Inc. Portfolio managers Thomas C. Spalding, CFA, and Scott R. Romans, PhD, review U.S. economic and municipal market conditions, key investment strategies and the twelve-month performance of the Nuveen Select Portfolios (the "Funds"). Tom has managed NXP, NXQ and NXR since 1999, while Scott has managed NXC since 2003 and NXN since 2011.
Effective May 31, 2016 (subsequent to the close of this reporting period), Thomas C. Spalding, CFA, retired from Nuveen Asset Management. Michael S. Hamilton has taken over portfolio management responsibilities for NXP, NXQ and NXR.
What factors affected the U.S. economy and the national municipal bond market during the twelve-month reporting period ended March 31, 2016?
Over the twelve-month period, U.S. economic data continued to point to subdued growth, rising employment and tame inflation. Economic activity has continued to hover around a 2% annualized growth rate since the end of the Great Recession in 2009, as measured by real gross domestic product (GDP), which is the value of the goods and services produced by the nation's economy less the value of the goods and services used up in production, adjusted for price changes. For the first quarter of 2016, real GDP increased at an annual rate of 0.5%, as reported by the "advance" estimate of the Bureau of Economic Analysis, down from 1.4% in the fourth quarter of 2015.
The labor and housing markets were among the bright spots in the economy during the reporting period, as both showed steady improvement. As reported by the Bureau of Labor Statistics, the unemployment rate fell to 5.0% in March 2016 from 5.5% in March 2015, and job gains averaged slightly above 200,000 per month for the past twelve months. The S&P/Case-Shiller U.S. National Home Price Index, which covers all nine U.S. census divisions, recorded a 5.3% annual gain in February 2016 (most recent data available at the time this report was prepared). The 10-City and 20-City Composites reported year-over-year increases of 4.6% and 5.4%, respectively.
Consumers, whose purchases comprise the largest component of the U.S. economy, benefited from lower gasoline prices. Pessimism about the economy's future and lackluster wage growth likely contributed to consumers' somewhat muted spending. Lower energy prices and tepid wage growth also weighed on inflation during this reporting period. The Consumer Price Index CPI rose 0.9% over the twelve-month period ended March 2016 on a seasonally adjusted basis, as reported by the U.S. Bureau of Labor
| |
| Certain statements in this report are forward-looking statements. Discussions of specific investments are for illustration only and are not intended as recommendations of individual investments. The forward-looking statements and other views expressed herein are those of the portfolio managers as of the date of this report. Actual future results or occurrences may differ significantly from those anticipated in any forward-looking statements, and the views expressed herein are subject to change at any time, due to numerous market and other factors. The Funds disclaim any obligation to update publicly or revise any forward-looking statements or views expressed herein. |
Ratings shown are the highest rating given by one of the following national rating agencies: Standard & Poor's (S&P), Moody's Investors Service, Inc. (Moody's) or Fitch, Inc. (Fitch). Credit ratings are subject to change. AAA, AA, A and BBB are investment grade ratings; BB, B, CCC, CC, C and D are below investment grade ratings. Certain bonds backed by U.S. government or agency securities are regarded as having an implied rating equal to the rating of such securities. Holdings designated N/R are not rated by these national rating agencies.
Bond insurance guarantees only the payment of principal and interest on the bond when due, and not the value of the bonds themselves, which will fluctuate with the bond market and the financial success of the issuer and the insurer. Insurance relates specifically to the bonds in the portfolio and not to the share prices of a Fund. No representation is made as to the insurers' ability to meet their commitments.
Refer to the Glossary of Terms Used in this Report for further definition of the terms used within this section.
Portfolio Managers' Comments (continued)
Statistics. The core CPI (which excludes food and energy) increased 2.2% during the same period, slightly above the Fed's unofficial longer term inflation objective of 2.0%.
Business investment was also rather restrained. Corporate earnings growth slowed during 2015, reflecting an array of factors ranging from weakening demand amid sluggish U.S. and global growth to the impact of falling commodity prices and a strong U.S. dollar. Energy, materials and industrials companies were hit particularly hard by the downturn in natural resource prices, as well as the expectation of rising interest rates, which would make their debts more costly to service. With demand waning, companies, especially in the health care and technology sectors, looked to consolidations with rivals as a way to boost revenues. Merger and acquisition deals, both in the U.S. and globally, reached record levels in the calendar year 2015.
With the current expansion on solid footing, the U.S. Federal Reserve (Fed) prepared to raise one of its main interest rates, which had been held near zero since December 2008 to help stimulate the economy. After delaying the rate change for most of 2015 because of a weak global economic growth outlook, the Fed announced in December 2015 that it would raise the fed funds target rate by 0.25%. The news was widely expected and therefore had a relatively muted impact on the financial markets.
Although the Fed continued to emphasize future rate increases would be gradual, investors worried about the pace. This, along with uncertainties about the global macroeconomic backdrop, another downdraft in oil prices and a spike in stock market volatility triggered significant losses across risky assets and fueled demand for "safe haven" assets such as Treasury bonds and gold from January through mid-February. However, fear began to subside in March, propelling risky assets higher. The Fed held the rate steady at both the January and March policy meetings, as well as lowered its expectations to two rate increases in 2016 from four. Also boosting investor confidence were reassuring statements from the European Central Bank, some positive economic data in the U.S. and abroad, a retreat in the U.S. dollar and an oil price rally.
In the broad municipal bond market, yields ended the twelve-month reporting period slightly below where they started, although their downward path was not a straight line. For most of the period, the generally improved condition of the U.S. economy and expectation of rising interest rates propelled municipal bond yields higher. However, after the Fed's first rate hike, subsequent rate hikes seemed unlikely in the near future as the pace of the U.S. economic recovery remained below average and weakness lingered abroad, especially in Europe and China. This helped renew demand for municipal bonds, bolstering prices and weighing on yields (as bond prices and yields move in opposite directions) in the final months of the reporting period.
The municipal market's supply-demand balance was generally favorable over this reporting period. Issuance was unusually strong at the beginning of 2015, fueling concerns about potential oversupply conditions. Over the twelve months ended March 31, 2016, municipal bond gross issuance nationwide totaled $384.7 billion, an increase of 1.1% from the issuance for the twelve-month period ended March 31, 2015. The surge in gross issuance is due mostly to increased refunding deals as issuers have been actively and aggressively refunding their outstanding debt given the very low interest rate environment. In these transactions the issuers are issuing new bonds and taking the bond proceeds and redeeming (calling) old bonds. These refunding transactions have ranged from 40%-60% of total issuance over the past few years. Thus, the net issuance (all bonds issued less bonds redeemed) is actually much lower than the gross issuance. In fact, the total municipal bonds outstanding has actually declined in each of the past four calendar years. So, the gross is surging, but the net is not and this has been an overall positive technical factor on municipal bond investment performance.
At the same time, regulatory changes, increased risk aversion and expectations for rising interest rates have encouraged bond dealers, typically brokers and banks, to reduce the size of their inventories in recent years. By holding fewer bonds on their books, dealers seek to mitigate their exposure that could potentially be worth less or be more difficult to sell in the future. Banks have reduced their participation in the markets in order to hold fewer bonds on their balance sheets. As a result, there has been less liquidity in the marketplace, which contributed to periods of increased price volatility.
How were the economic and market environments in California and New York during the twelve-month reporting period ended March 31, 2016?
California's economy is the largest in the United States and ranks eighth in the world according to the International Monetary Fund. Job growth continues to increase faster than the nation, driven by high technology, international trade and tourism but also supplemented by better residential construction and real estate conditions. As a result, the state's unemployment rate improved to 5.4% as of March 2016, down from 6.6% the year prior and the gap between the state and the nation's 5.0% unemployment rate is narrowing. According to the S&P/Case-Shiller Index, home prices in San Diego, Los Angeles and San Francisco rose 6.4%, 6.8% and 9.3%, respectively, over the twelve months ended February 2016 (most recent data available at the time this report was prepared) compared with an average increase of 5.3% nationally. California entered its fifth straight year of drought conditions resulting in the Governor issuing mandatory water cuts. El Nino storms since December 2015 have provided some relief, but a full recovery from the drought will require more rain and snowfall. Agriculture is exempt from the mandate. Although farms consume 80% of California's water, they only generate 2% of the state's economic activity. The most significant economic risk would be a slowdown in California's home building industry, which is a major part of the state's economy.
The enacted Fiscal 2016 budget is 0.8% higher than the revised estimate for Fiscal Year 2015. Strong revenue growth due to a recovering economy and the passage of Proposition 30 (increases state sales and personal income taxes temporarily) have aided in the State's fiscal recovery. For Fiscal Year 2016-2017, the proposed General Fund Governor's Budget totals $122.6 billion. The proposed budget echoes Governor Brown's recurring theme since he took office in 2011 to maintain a cautious approach to managing the state's finances. The proposal, after meeting the constitutional requirements for reserve deposits and increased spending on education, calls for an extra deposit into the Rainy Day Fund and one-time infrastructure spending from discretionary resources. On July 2, 2015, S&P upgraded its rating on California general obligation (GO) debt to "AA-/STABLE" from "A+/CreditWatch Positive." Moody's upgraded the State GO to Aa3 with stable outlook from A1 in June 2014. During the twelve months ended March 31, 2016, municipal issuance in California totaled $51.2 billion, a 5.5% gross issuance decrease over the prior twelve months. For this reporting period, California was the largest state issuer in the nation, representing approximately 13.3% of total issuance nationwide.
New York State's $1.4 trillion economy represents 8.1% of U.S. GDP and, according to the International Monetary Fund, would be the 15th largest economy in the world on a stand-alone basis. As of March 2016, the state's unemployment rate registered 4.8%, closely mirroring the national average of 5.0%. According to the S&P/Case-Shiller Index of 20 major metropolitan areas, housing prices in New York City rose 2.1% over the twelve months ended February 2016 (most recent data available at the time this report was prepared), compared with an average increase of 5.3% nationally. The state's budget picture has improved considerably over the past few years. Revenues have been increased through tax hikes and expenditures have been more tightly controlled. On a significant positive note, New York State has collected approximately $8 billion in various settlements and assessments from the financial industry over the past two years. Proceeds from those settlements have been used to bolster reserves, foster economic development upstate, and provide funds for the replacement of the Tappan Zee Bridge. The adopted $142 billion budget for Fiscal Year 2016 is 3% higher than the adopted Fiscal Year 2015 budget. The Fiscal Year 2016 budget contains no new taxes. The budget includes a $1.1 billion increase in education spending. New York is a high-income state, with per-capita income at 122% of the U.S. average, fourth-highest among the 50 states. New York is a heavily indebted state. The state's pensions have traditionally been well funded, though they did decline with the stock market financial crisis. As of March 2015, Moody's rates New York "Aa1" with a stable outlook. Moody's upgraded New York State from Aa2 to Aa1 on June 16, 2014 citing the State's sustained improvements in fiscal governance. S&P rates the state "AA+" with a stable outlook. S&P upgraded New York State from AA to AA+ on July 23, 2014, citing the State's improved budget framework. New York municipal bond supply totaled $44 billion for the twelve-month period ended March 31, 2016, a 7.9% gross issuance increase from the same period ended March 31, 2015. This ranked New York third among state issuers behind California and Texas.
Portfolio Managers' Comments (continued)
What key strategies were used to manage these Funds during the twelve-month reporting period ended March 31, 2016?
Despite recent bouts of heightened volatility, generally favorable market conditions supported a modest gain in the broad municipal market for the reporting period overall. Our trading activity focused on pursuing the Funds' investment objectives. We continued to seek bonds in areas of the market that we expected to perform well as the economy continued to improve. The Funds' positioning emphasized intermediate and longer maturities, lower rated credits and sectors offering higher yields. To fund these purchases, we generally reinvested the proceeds from called and maturing bonds. In some cases, we sold bonds that we believed had deteriorating fundamentals or could be traded for a better relative value, as well as selling short-dated, higher quality issues that we tend to hold over short timeframes as a source of liquidity.
We've also continued to be more cautious in selecting individual securities. As investor demand for municipal securities has increased and created a slight supply-demand imbalance, we've started to see underwriters bring new issues to market that are structured with terms more favorable to the issuer and perhaps less advantageous to the investor than in the recent past. We believe this shift in the marketplace merits extra vigilance on our part to ensure that every credit considered for the portfolio offers adequate reward potential for the level of risk to the bondholder. In cases where our convictions have been less certain, we've sought compensation for the additional risk or have passed on the deal all together.
Generally speaking, throughout this reporting period, the Funds maintained their overall positioning strategies in terms of duration and yield curve positioning, credit quality exposures and sector allocations. In NXP, NXQ and NXR, duration management continued to be a focus. When short-term bonds, including pre-refunded credits, rolled off, we purchased bonds with longer maturities to help maintain the Funds' longer durations. These purchases included zero coupon bonds, which offer long maturities and additional income to support their dividends. We also took advantage of some of the price dislocation that has occurred in Illinois' municipal bond market recently. We added a Springfield Electric Revenue issue to the three national Funds because we believe it offered good value for an essential service. In NXP, we bought an attractively priced Northwestern Memorial Health Care bond. The Chicago-based academic medical center has strong fundraising capabilities and no exposure to the state's budget woes.
For NXC and NXN, we found the most long-term relative value in the A rated category, which included additions in the higher education and health care sectors, as these sectors tend to have a higher proportion of A rated credits. Especially in the primary market, A rated bonds featured better pricing relative to BBB and AA rated credits.
That being said, NXC also pursued a short-term tactical strategy, which increased its exposure to higher grade (primarily AA rated), higher liquidity bonds during this reporting period. These positions helped keep the Fund fully invested and were intended not as long-term holding opportunities but as short-term positions that could be easily sold when proceeds were needed to fund a new purchase.
As yield spreads on lower rated bonds have tightened, we have become more selective within the lower credit quality segments of the market (BBB and below investment grade). We did find some attractive buying opportunities for NXN during the reporting period, including bonds backed by the redevelopment of the World Trade Center, Guam tax revenues, charter schools and health care.
As of March 31, 2016, NXP, NXQ, NXR and NXN continued to use inverse floating rate securities. We employ inverse floaters for a variety of reasons, including duration management, income enhancement and total return enhancement. Also for duration management purposes, NXP and NXR held interest rate swaps during the reporting period. At the end of May, we reduced the Funds' swap positions, decreasing the amount of hedge in the portfolios. The swap positions had a negative impact on the two Funds' performance over this reporting period but nevertheless worked as intended to shorten the durations of these two Funds and bring them within our target range.
How did the Funds perform during the twelve-month reporting period ended March 31, 2016?
The tables in each Fund's Performance Overview and Holding Summaries section of this report provide the Funds' total returns for the one-year, five-year and ten-year periods ended March 31, 2016. Each Fund's returns on common share net asset value (NAV) are compared with the performance of corresponding market indexes and Lipper classification average.
For the twelve months ended March 31, 2016, the total returns on common share NAV for NXC outperformed and NXN underperformed their respective state's S&P Municipal Bond Index. NXP, NXQ, NXR and NXC beat the national S&P Municipal Bond Index, while NXN performed in line with the national index over the twelve-month period. For this same period, NXP, NXQ and NXR outperformed the average return for the Lipper General and Insured Unleveraged Municipal Debt Funds Classification Average, while NXC and NXN trailed the Lipper California Municipal Debt Funds and the Lipper New York Municipal Debt Funds classification average returns, respectively.
The main contributor to the Funds' relative performance during this reporting period was yield curve and duration positioning. We continued to overweight the longer parts of the yield curve with corresponding underweights to the shorter end of the curve, which resulted in longer durations than its benchmark. This positioning was advantageous in this reporting period as intermediate- and longer-dated bonds generally outperformed shorter-dated bonds. NXP, NXQ and NXR's allocation to zero coupon bonds, which have very long maturities, was particularly beneficial to the three Funds' performance.
Credit quality exposures also contributed positively to the Funds' performance, although to a lesser extent than yield curve and duration positioning. Lower rated municipal bonds outperformed higher rated bonds during this reporting period, as the low interest rate environment continued to propel investor demand for yield. The Funds were positioned with overweight allocations to the generally outperforming lower rated credits, including below investment grade and non-rated bonds and with underweight allocations to the underperforming AA and AAA rated categories. These tilts were advantageous to performance during this reporting period.
An Update Involving Puerto Rico
As noted in the Funds' previous shareholder reports, we continue to monitor situations in the broader municipal market for any impact on the Funds' holdings and performance: the ongoing economic problems of Puerto Rico is one such case. Puerto Rico's continued economic weakening, escalating debt service obligations, and long-standing inability to deliver a balanced budget led to multiple downgrades on its debt over the past two years. Puerto Rico has warned investors since 2014 that the island's debt burden may be unsustainable and the Commonwealth has been exploring various strategies to deal with this burden, including Chapter 9 bankruptcy, which is currently not available by law.
In terms of Puerto Rico holdings, shareholders should note that NXC and NXN had no exposure to Puerto Rico debt during this reporting period, while NXP, NXQ and NXR had insured exposure allocations of 1.4%, 0.9% and 2.1%, respectively, at the end of the reporting period. The Puerto Rico credits offered higher yields, added diversification and triple exemption (i.e., exemption from most federal, state and local taxes). Puerto Rico general obligation debt is currently rated Caa2/CC/CC (below investment grade) by Moody's, S&P and Fitch, respectively, with negative outlooks.
Fund Leverage
IMPACT OF THE FUNDS' LEVERAGE STRATEGIES ON PERFORMANCE
One important factor impacting the returns of the Funds relative to their comparative benchmarks was the Funds' use of leverage through investments in inverse floating rate securities, which represent leveraged investments in underlying bonds. The Funds use leverage because our research has shown that, over time, leveraging provides opportunities for additional income, particularly in the recent market environment where short-term market rates are at or near historical lows, meaning that the short-term rates the Fund has been paying on its leveraging instruments have been much lower than the interest the Fund has been earning on its portfolio of long-term bonds that it has bought with the proceeds of that leverage. However, use of leverage also can expose the Fund to additional price volatility. When a Fund uses leverage, the Fund will experience a greater increase in its net asset value if the municipal bonds acquired through the use of leverage increase in value, but it will also experience a correspondingly larger decline in its net asset value if the bonds acquired through leverage decline in value, which will make the Fund's net asset value more volatile, and its total return performance more variable over time. In addition, income in levered funds will typically decrease in comparison to unlevered funds when short-term interest rates increase and increase when short-term interest rates decrease. Leverage had a positive impact on the performance of the Funds during the current reporting period, where applicable.
As of March 31, 2016, the Funds' percentages of leverage are as shown in the accompanying table.
| | | | NXP | | | NXQ | | | NXR | | | NXC | | | NXN | |
| Effective Leverage* | | | 1.27 | % | | 1.79 | % | | 0.51 | % | | N/A | | | 8.44 | % |
| * | Effective Leverage is a Fund's effective economic leverage, and includes both regulatory leverage and the leverage effects of certain derivative and other investments in a Fund's portfolio that increase the Fund's investment exposure. Currently, the leverage effects of Tender Option Bond (TOB) inverse floater holdings are included in effective leverage values. |
N/A NXC did not invest in inverse floating rate securities during the current reporting period.
Share Information
DISTRIBUTION INFORMATION
The following information regarding the Funds' distributions is current as of March 31, 2016. Each Fund's distribution levels may vary over time based on each Fund's investment activity and portfolio investment value changes.
During the current reporting period, each Fund's distributions to shareholders were as shown in the accompanying table.
| | | Per Share Amounts |
| Monthly Distributions (Ex-Dividend Date) | | | NXP | | | NXQ | | | NXR | | | NXC | | | NXN | |
| April 2015 | | $ | 0.0475 | | $ | 0.0460 | | $ | 0.0490 | | $ | 0.0570 | | $ | 0.0460 | |
| May | | | 0.0475 | | | 0.0460 | | | 0.0490 | | | 0.0570 | | | 0.0460 | |
| June | | | 0.0475 | | | 0.0445 | | | 0.0470 | | | 0.0545 | | | 0.0460 | |
| July | | | 0.0475 | | | 0.0445 | | | 0.0470 | | | 0.0545 | | | 0.0460 | |
| August | | | 0.0475 | | | 0.0445 | | | 0.0470 | | | 0.0545 | | | 0.0460 | |
| September | | | 0.0455 | | | 0.0445 | | | 0.0455 | | | 0.0545 | | | 0.0460 | |
| October | | | 0.0455 | | | 0.0445 | | | 0.0455 | | | 0.0545 | | | 0.0460 | |
| November | | | 0.0455 | | | 0.0445 | | | 0.0455 | | | 0.0545 | | | 0.0460 | |
| December | | | 0.0455 | | | 0.0445 | | | 0.0455 | | | 0.0525 | | | 0.0460 | |
| January | | | 0.0455 | | | 0.0445 | | | 0.0455 | | | 0.0525 | | | 0.0460 | |
| February | | | 0.0455 | | | 0.0445 | | | 0.0455 | | | 0.0525 | | | 0.0460 | |
| March 2016 | | | 0.0455 | | | 0.0445 | | | 0.0455 | | | 0.0525 | | | 0.0460 | |
| Total Monthly Per Share Distributions | | $ | 0.5560 | | $ | 0.5370 | | $ | 0.5575 | | $ | 0.6510 | | $ | 0.5520 | |
| Ordinary Income Distribution* | | $ | 0.0064 | | $ | 0.0005 | | $ | 0.0013 | | $ | — | | $ | — | |
| Total Distributions from Net Investment Income | | $ | 0.5624 | | $ | 0.5375 | | $ | 0.5588 | | $ | 0.6510 | | $ | 0.5520 | |
| Total Distributions from Long-Term Capital Gains* | | $ | — | | $ | — | | $ | — | | $ | 0.0171 | | $ | — | |
| Total Distributions | | $ | 0.5624 | | $ | 0.5375 | | $ | 0.5588 | | $ | 0.6681 | | $ | 0.5520 | |
| | | | | | | | | | | | | | | | | |
| Yields | | | | | | | | | | | | | | | | |
| Market Yield** | | | 3.67 | % | | 3.78 | % | | 3.67 | % | | 3.77 | % | | 3.93 | % |
| Taxable-Equivalent Yield** | | | 5.09 | % | | 5.25 | % | | 5.09 | % | | 5.78 | % | | 5.84 | % |
| * | Distribution paid in December 2015. |
| | |
| ** | Market Yield is based on the Fund's current annualized monthly distribution divided by the Fund's current market price as of the end of the reporting period. Taxable-Equivalent Yield represents the yield that must be earned on a fully taxable investment in order to equal the yield of the Fund on an after-tax basis. It is based on a combined federal and state income tax rate of 28.0%, 28.0%, 28.0%, 34.7% and 32.8% for NXP, NXQ, NXR, NXC and NXN, respectively. When comparing a Fund to investments that generate qualified dividend income, the Taxable-Equivalent Yield is lower. |
Each Fund in this report seeks to pay regular monthly dividends out of its net investment income at a rate that reflects its past and projected net income performance. To permit each Fund to maintain a more stable monthly dividend, the Fund may pay dividends at a rate that may be more or less than the amount of net income actually earned by the Fund during the period. If a Fund has cumulatively earned more than it has paid in dividends, it will hold the excess in reserve as undistributed net investment income (UNII) as part of the Fund's net asset value. Conversely, if a Fund has cumulatively paid in dividends more than it has earned, the excess will constitute a negative UNII that will likewise be reflected in the Fund's net asset value. Each Fund will, over time, pay all its net investment income as dividends to shareholders.
Share Information (continued)
As of March 31, 2016, the Funds had positive UNII balances for tax purposes. NXP, NXQ, NXR and NXN had positive UNII balances while NXC had a negative UNII balance for financial reporting purposes.
All monthly dividends paid by each Fund during the current reporting period were paid from net investment income. If a portion of the Fund's monthly distributions was sourced from or comprised of elements other than net investment income, including capital gains and/or a return of capital, shareholders would have received a notice to that effect. For financial reporting purposes, the composition and per share amounts of each Fund's dividends for the reporting period are presented in this report's Statement of Changes in Net Assets and Financial Highlights, respectively. For income tax purposes, distribution information for each Fund as of its most recent tax year end is presented in Note 6 — Income Tax Information within the Notes to Financial Statements of this report.
SHARE REPURCHASES
During August 2015, the Funds' Board of Trustees reauthorized an open-market share repurchase program, allowing each Fund to repurchase an aggregate of up to approximately 10% of its outstanding shares.
As of March 31, 2016, and since the inception of the Funds' repurchase programs, the Funds have cumulatively repurchased and retired their outstanding shares as shown in the accompanying table.
| | | | | | | | | | | | | | | | | |
| | | | NXP | | | NXQ | | | NXR | | | NXC | | | NXN | |
| Shares cumulatively repurchased and retired | | | 0 | | | 0 | | | 0 | | | 0 | | | 0 | |
| Shares authorized for repurchase | | | 1,655,000 | | | 1,770,000 | | | 1,305,000 | | | 630,000 | | | 390,000 | |
OTHER SHARE INFORMATION
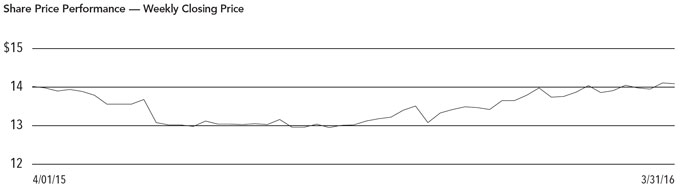
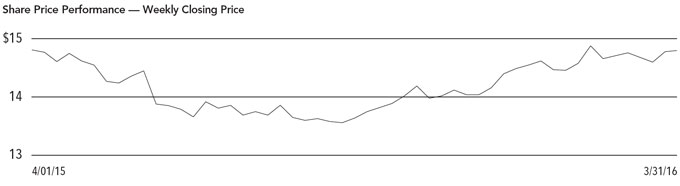
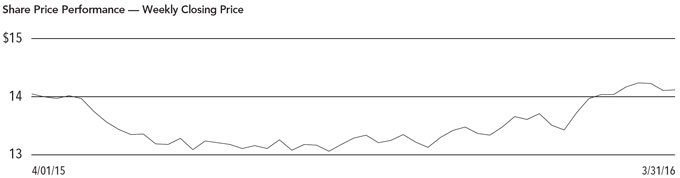
As of March 31, 2016, and during the current reporting period, the Funds' share prices were trading at a premium/(discount) to their NAVs as shown in the accompanying table.
| | | | | | | | | | | | | | | | | |
| | | | NXP | | | NXQ | | | NXR | | | NXC | | | NXN | |
| NAV | | $ | 15.46 | | $ | 14.88 | | $ | 15.76 | | $ | 15.68 | | $ | 14.53 | |
| Share price | | $ | 14.89 | | $ | 14.13 | | $ | 14.89 | | $ | 16.70 | | $ | 14.06 | |
| Premium/(Discount) to NAV | | | (3.69 | )% | | (5.04 | )% | | (5.52 | )% | | 6.51 | % | | (3.23 | )% |
| 12-month average premium/(discount) to NAV | | | (7.35 | )% | | (7.20 | )% | | (6.95 | )% | | 0.41 | % | | (6.00 | )% |
Risk Considerations
Fund shares are not guaranteed or endorsed by any bank or other insured depository institution, and are not federally insured by the Federal Deposit Insurance Corporation.
Nuveen Select Tax-Free Income Portfolio (NXP)
Investing in closed-end funds involves risk; principal loss is possible. There is no guarantee the Fund's investment objectives will be achieved. Closed-end fund shares may frequently trade at a discount or premium to their net asset value. Debt or fixed income securities such as those held by the Fund, are subject to market risk, credit risk, interest rate risk, derivatives risk, liquidity risk, and income risk. As interest rates rise, bond prices fall. These and other risk considerations such as tax risk are described in more detail on the Fund's web page at www.nuveen.com/NXP.
Nuveen Select Tax-Free Income Portfolio 2 (NXQ)
Investing in closed-end funds involves risk; principal loss is possible. There is no guarantee the Fund's investment objectives will be achieved. Closed-end fund shares may frequently trade at a discount or premium to their net asset value. Debt or fixed income securities such as those held by the Fund, are subject to market risk, credit risk, interest rate risk, derivatives risk, liquidity risk, and income risk. As interest rates rise, bond prices fall. These and other risk considerations such as tax risk are described in more detail on the Fund's web page at www.nuveen.com/NXQ.
Nuveen Select Tax-Free Income Portfolio 3 (NXR)
Investing in closed-end funds involves risk; principal loss is possible. There is no guarantee the Fund's investment objectives will be achieved. Closed-end fund shares may frequently trade at a discount or premium to their net asset value. Debt or fixed income securities such as those held by the Fund, are subject to market risk, credit risk, interest rate risk, derivatives risk, liquidity risk, and income risk. As interest rates rise, bond prices fall. These and other risk considerations such as tax risk are described in more detail on the Fund's web page at www.nuveen.com/NXR.
Nuveen California Select Tax-Free Income Portfolio (NXC)
Investing in closed-end funds involves risk; principal loss is possible. There is no guarantee the Fund's investment objectives will be achieved. Closed-end fund shares may frequently trade at a discount or premium to their net asset value. Debt or fixed income securities such as those held by the Fund, are subject to market risk, credit risk, interest rate risk, derivatives risk, liquidity risk, and income risk. As interest rates rise, bond prices fall. State concentration makes the Fund more susceptible to local adverse economic, political, or regulatory changes affecting municipal bond issuers. These and other risk considerations such as tax risk are described in more detail on the Fund's web page at www.nuveen.com/NXC.
Nuveen New York Select Tax-Free Income Portfolio (NXN)
Investing in closed-end funds involves risk; principal loss is possible. There is no guarantee the Fund's investment objectives will be achieved. Closed-end fund shares may frequently trade at a discount or premium to their net asset value. Debt or fixed income securities such as those held by the Fund, are subject to market risk, credit risk, interest rate risk, derivatives risk, liquidity risk, and income risk. As interest rates rise, bond prices fall. State concentration makes the Fund more susceptible to local adverse economic, political, or regulatory changes affecting municipal bond issuers. These and other risk considerations such as tax risk are described in more detail on the Fund's web page at www.nuveen.com/NXN.
| NXP | |
| | Nuveen Select Tax-Free Income Portfolio |
| | Performance Overview and Holding Summaries as of March 31, 2016 |
Refer to the Glossary of Terms Used in this Report for further definition of the terms used within this section.
Average Annual Total Returns as of March 31, 2016
| | Average Annual |
| | 1-Year | 5-Year | 10-Year | |
| NXP at NAV | 5.78% | 7.23% | 5.34% | |
| NXP at Share Price | 6.82% | 7.14% | 5.36% | |
| S&P Municipal Bond Index | 3.95% | 5.78% | 4.78% | |
| Lipper General and Insured Unleveraged Municipal Debt Funds Classification Average | 4.95% | 7.00% | 5.09% | |
Past performance is not predictive of future results. Current performance may be higher or lower than the data shown. Returns do not reflect the deduction of taxes that shareholders may have to pay on Fund distributions or upon the sale of Fund shares. Returns at NAV are net of Fund expenses, and assume reinvestment of distributions. Comparative index and Lipper return information is provided for the Fund's shares at NAV only. Indexes and Lipper averages are not available for direct investment.
This data relates to the securities held in the Fund's portfolio of investments as of the end of the reporting period. It should not be construed as a measure of performance for the Fund itself. Holdings are subject to change.
Ratings shown are the highest rating given by one of the following national rating agencies: Standard & Poor's Group, Moody's Investors Service, Inc. or Fitch, Inc. Credit ratings are subject to change. AAA, AA, A and BBB are investment grade ratings; BB, B, CCC, CC, C and D are below-investment grade ratings. Certain bonds backed by U.S. Government or agency securities are regarded as having an implied rating equal to the rating of such securities. Holdings designated N/R are not rated by these national rating agencies.
| Fund Allocation | |
| (% of net assets) | |
| Long-Term Municipal Bonds | 99.0% |
| Corporate Bonds | 0.0% |
| Other Assets Less Liabilities | 1.0% |
| Net Assets | 100% |
| | |
| Credit Quality | |
(% of total investment exposure)1 | |
| AAA/U.S. Guaranteed | 10.9% |
| AA | 48.5% |
| A | 19.7% |
| BBB | 11.0% |
| BB or Lower | 7.7% |
| N/R (not rated) | 2.2% |
| Total | 100% |
| | |
| Portfolio Composition | |
(% of total investments)1 | |
| Tax Obligation/Limited | 28.8% |
| Tax Obligation/General | 17.0% |
| Transportation | 16.1% |
| Health Care | 11.9% |
| Consumer Staples | 6.6% |
| U.S. Guaranteed | 6.6% |
| Other | 13.0% |
| Total | 100% |
| | |
| States and Territories | |
| (% of total municipal bonds) | |
| California | 17.0% |
| Illinois | 10.8% |
| Texas | 10.7% |
| New Jersey | 9.2% |
| Colorado | 4.6% |
| Washington | 4.4% |
| Florida | 4.3% |
| Virginia | 4.2% |
| New York | 4.2% |
| Missouri | 2.7% |
| Iowa | 2.7% |
| Michigan | 2.6% |
| Minnesota | 2.4% |
| Nevada | 2.3% |
| Other | 17.9% |
| Total | 100% |
1 Excluding investments in derivatives.
| NXQ | |
| | Nuveen Select Tax-Free Income Portfolio 2 |
| | Performance Overview and Holding Summaries as of March 31, 2016 |
Refer to the Glossary of Terms Used in this Report for further definition of the terms used within this section.
Average Annual Total Returns as of March 31, 2016
| | Average Annual |
| | 1-Year | 5-Year | 10-Year | |
| NXQ at NAV | 5.46% | 7.45% | 4.96% | |
| NXQ at Share Price | 5.46% | 7.36% | 5.37% | |
| S&P Municipal Bond Index | 3.95% | 5.78% | 4.78% | |
| Lipper General and Insured Unleveraged Municipal Debt Funds Classification Average | 4.95% | 7.00% | 5.09% | |
Past performance is not predictive of future results. Current performance may be higher or lower than the data shown. Returns do not reflect the deduction of taxes that shareholders may have to pay on Fund distributions or upon the sale of Fund shares. Returns at NAV are net of Fund expenses, and assume reinvestment of distributions. Comparative index and Lipper return information is provided for the Fund's shares at NAV only. Indexes and Lipper averages are not available for direct investment.
This data relates to the securities held in the Fund's portfolio of investments as of the end of the reporting period. It should not be construed as a measure of performance for the Fund itself. Holdings are subject to change.
Ratings shown are the highest rating given by one of the following national rating agencies: Standard & Poor's Group, Moody's Investors Service, Inc. or Fitch, Inc. Credit ratings are subject to change. AAA, AA, A and BBB are investment grade ratings; BB, B, CCC, CC, C and D are below-investment grade ratings. Certain bonds backed by U.S. Government or agency securities are regarded as having an implied rating equal to the rating of such securities. Holdings designated N/R are not rated by these national rating agencies.
| Fund Allocation | |
| (% of net assets) | |
| Long-Term Municipal Bonds | 98.1% |
| Corporate Bonds | 0.0% |
| Other Assets Less Liabilities | 1.9% |
| Net Assets | 100% |
| Credit Quality | |
| (% of total investment exposure) | |
| AAA/U.S. Guaranteed | 14.0% |
| AA | 41.8% |
| A | 25.4% |
| BBB | 9.7% |
| BB or Lower | 8.0% |
| N/R (not rated) | 1.1% |
| Total | 100% |
| Portfolio Composition | |
| (% of total investments) | |
| Tax Obligation/General | 22.9% |
| Tax Obligation/Limited | 18.4% |
| Transportation | 16.5% |
| Health Care | 14.5% |
| U.S. Guaranteed | 7.0% |
| Consumer Staples | 6.1% |
| Other | 14.6% |
| Total | 100% |
| | |
| States and Territories | |
| (% of total municipal bonds) | |
| California | 14.7% |
| Illinois | 12.4% |
| Texas | 11.3% |
| Colorado | 9.5% |
| Indiana | 5.3% |
| New York | 4.7% |
| Nevada | 4.1% |
| Ohio | 3.5% |
| Michigan | 3.3% |
| Washington | 3.3% |
| New Jersey | 3.1% |
| Florida | 2.6% |
| Wisconsin | 2.6% |
| Other | 19.6% |
| Total | 100% |
| NXR | |
| | Nuveen Select Tax-Free Income Portfolio 3 |
| | Performance Overview and Holding Summaries as of March 31, 2016 |
Refer to the Glossary of Terms Used in this Report for further definition of the terms used within this section.
Average Annual Total Returns as of March 31, 2016
| | Average Annual | |
| | 1-Year | 5-Year | 10-Year | |
| NXR at NAV | 6.56% | 7.66% | 5.57% | |
| NXR at Share Price | 4.76% | 7.40% | 5.76% | |
| S&P Municipal Bond Index | 3.95% | 5.78% | 4.78% | |
| Lipper General and Insured Unleveraged Municipal Debt Funds Classification Average | 4.95% | 7.00% | 5.09% | |
Past performance is not predictive of future results. Current performance may be higher or lower than the data shown. Returns do not reflect the deduction of taxes that shareholders may have to pay on Fund distributions or upon the sale of Fund shares. Returns at NAV are net of Fund expenses, and assume reinvestment of distributions. Comparative index and Lipper return information is provided for the Fund's shares at NAV only. Indexes and Lipper averages are not available for direct investment.
This data relates to the securities held in the Fund's portfolio of investments as of the end of the reporting period. It should not be construed as a measure of performance for the Fund itself. Holdings are subject to change.
Ratings shown are the highest rating given by one of the following national rating agencies: Standard & Poor's Group, Moody's Investors Service, Inc. or Fitch, Inc. Credit ratings are subject to change. AAA, AA, A and BBB are investment grade ratings; BB, B, CCC, CC, C and D are below-investment grade ratings. Certain bonds backed by U.S. Government or agency securities are regarded as having an implied rating equal to the rating of such securities. Holdings designated N/R are not rated by these national rating agencies.
| Fund Allocation | |
| (% of net assets) | |
| Long-Term Municipal Bonds | 97.9% |
| Corporate Bonds | 0.0% |
| Other Assets Less Liabilities | 2.1% |
| Net Assets | 100% |
| | |
| Credit Quality | |
(% of total investment exposure)1 | |
| AAA/U.S. Guaranteed | 15.0% |
| AA | 48.1% |
| A | 15.0% |
| BBB | 9.5% |
| BB or Lower | 10.6% |
| N/R (not rated) | 1.8% |
| Total | 100% |
| | |
| Portfolio Composition | |
(% of total investments)1 | |
| Tax Obligation/Limited | 25.2% |
| Tax Obligation/General | 19.6% |
| Transportation | 14.4% |
| Health Care | 10.4% |
| Consumer Staples | 7.7% |
| U.S. Guaranteed | 7.5% |
| Utilities | 5.3% |
| Other | 9.9% |
| Total | 100% |
| | |
| States and Territories | |
| (% of total municipal bonds) | |
| California | 21.4% |
| Illinois | 13.2% |
| Texas | 10.4% |
| Florida | 6.5% |
| Colorado | 5.9% |
| New York | 4.2% |
| Ohio | 4.2% |
| Washington | 3.9% |
| Virginia | 3.3% |
| Indiana | 3.1% |
| New Jersey | 2.7% |
| Iowa | 2.5% |
| Other | 18.7% |
| Total | 100% |
1 Excluding investments in derivatives.
| NXC | |
| | Nuveen California Select Tax-Free Income Portfolio |
| | Performance Overview and Holding Summaries as of March 31, 2016 |
Refer to the Glossary of Terms Used in this Report for further definition of the terms used within this section.
Average Annual Total Returns as of March 31, 2016
| | Average Annual |
| | 1-Year | 5-Year | 10-Year | |
| NXC at NAV | 5.51% | 8.42% | 5.73% | |
| NXC at Share Price | 13.25% | 11.37% | 7.34% | |
| S&P Municipal Bond California Index | 4.59% | 6.94% | 5.17% | |
| S&P Municipal Bond Index | 3.95% | 5.78% | 4.78% | |
| Lipper California Municipal Debt Funds Classification Average | 6.77% | 10.96% | 5.79% | |
Past performance is not predictive of future results. Current performance may be higher or lower than the data shown. Returns do not reflect the deduction of taxes that shareholders may have to pay on Fund distributions or upon the sale of Fund shares. Returns at NAV are net of Fund expenses, and assume reinvestment of distributions. Comparative index and Lipper return information is provided for the Fund's shares at NAV only. Indexes and Lipper averages are not available for direct investment.
This data relates to the securities held in the Fund's portfolio of investments as of the end of the reporting period. It should not be construed as a measure of performance for the Fund itself. Holdings are subject to change.
Ratings shown are the highest rating given by one of the following national rating agencies: Standard & Poor's Group, Moody's Investors Service, Inc. or Fitch, Inc. Credit ratings are subject to change. AAA, AA, A and BBB are investment grade ratings; BB, B, CCC, CC, C and D are below-investment grade ratings. Certain bonds backed by U.S. Government or agency securities are regarded as having an implied rating equal to the rating of such securities. Holdings designated N/R are not rated by these national rating agencies.
| Fund Allocation | |
| (% of net assets) | |
| Long-Term Municipal Bonds | 98.7% |
| Other Assets Less Liabilities | 1.3% |
| Net Assets | 100% |
| | |
| Portfolio Composition | |
| (% of total investments) | |
| Tax Obligation/General | 34.2% |
| Tax Obligation/Limited | 19.6% |
| U.S. Guaranteed | 11.4% |
| Water and Sewer | 10.9% |
| Transportation | 6.7% |
| Health Care | 5.5% |
| Other | 11.7% |
| Total | 100% |
| | |
| Credit Quality | |
| (% of total investment exposure) | |
| AAA/U.S. Guaranteed | 18.3% |
| AA | 42.0% |
| A | 23.0% |
| BBB | 7.9% |
| BB or Lower | 7.4% |
| N/R (not rated) | 1.4% |
| Total | 100% |
| NXN | |
| | Nuveen New York Select Tax-Free Income Portfolio |
| | Performance Overview and Holding Summaries as of March 31, 2016 |
Refer to the Glossary of Terms Used in this Report for further definition of the terms used within this section.
Average Annual Total Returns as of March 31, 2016
| | Average Annual |
| | 1-Year | 5-Year | 10-Year | |
| NXN at NAV | 3.98% | 5.62% | 4.72% | |
| NXN at Share Price | 3.63% | 6.12% | 5.17% | |
| S&P Municipal Bond New York Index | 4.25% | 5.51% | 4.80% | |
| S&P Municipal Bond Index | 3.95% | 5.78% | 4.78% | |
| Lipper New York Municipal Debt Funds Classification Average | 6.13% | 8.72% | 5.31% | |
Past performance is not predictive of future results. Current performance may be higher or lower than the data shown. Returns do not reflect the deduction of taxes that shareholders may have to pay on Fund distributions or upon the sale of Fund shares. Returns at NAV are net of Fund expenses, and assume reinvestment of distributions. Comparative index and Lipper return information is provided for the Fund's shares at NAV only. Indexes and Lipper averages are not available for direct investment.
This data relates to the securities held in the Fund's portfolio of investments as of the end of the reporting period. It should not be construed as a measure of performance for the Fund itself. Holdings are subject to change.
Ratings shown are the highest rating given by one of the following national rating agencies: Standard & Poor's Group, Moody's Investors Service, Inc. or Fitch, Inc. Credit ratings are subject to change. AAA, AA, A and BBB are investment grade ratings; BB, B, CCC, CC, C and D are below-investment grade ratings. Certain bonds backed by U.S. Government or agency securities are regarded as having an implied rating equal to the rating of such securities. Holdings designated N/R are not rated by these national rating agencies.
| Fund Allocation | |
| (% of net assets) | |
| Long-Term Municipal Bonds | 97.5% |
| Short-Term Municipal Bonds | 1.3% |
| Other Assets Less Liabilities | 3.0% |
| Net Assets Plus Floating Rate Obligations | 101.8% |
| Floating Rate Obligations | (1.8)% |
| Net Assets | 100% |
| | |
| Portfolio Composition | |
| (% of total investments) | |
| Tax Obligation/Limited | 26.5% |
| Education and Civic Organizations | 25.2% |
| U.S. Guaranteed | 15.2% |
| Transportation | 9.2% |
| Utilities | 8.2% |
| Other | 15.7% |
| Total | 100% |
| | |
| Credit Quality | |
| (% of total investment exposure) | |
| AAA/U.S. Guaranteed | 35.0% |
| AA | 35.9% |
| A | 14.9% |
| BBB | 2.9% |
| BB or Lower | 7.5% |
| N/R (not rated) | 3.8% |
| Total | 100% |
Report of Independent Registered Public Accounting Firm
To the Board of Trustees and Shareholders of
Nuveen Select Tax-Free Income Portfolio
Nuveen Select Tax-Free Income Portfolio 2
Nuveen Select Tax-Free Income Portfolio 3
Nuveen California Select Tax-Free Income Portfolio
Nuveen New York Select Tax-Free Income Portfolio:
We have audited the accompanying statements of assets and liabilities, including the portfolios of investments, of Nuveen Select Tax-Free Income Portfolio, Nuveen Select Tax-Free Income Portfolio 2, Nuveen Select Tax-Free Income Portfolio 3, Nuveen California Select Tax-Free Income Portfolio and Nuveen New York Select Tax-Free Income Portfolio (the "Funds") as of March 31, 2016, and the related statements of operations for the year then ended and the statements of changes in net assets and the financial highlights for each of the years in the two-year period then ended. The financial highlights for the periods presented through March 31, 2014, were audited by other auditors whose report dated May 27, 2014, expressed an unqualified opinion on those financial highlights. These financial statements and financial highlights are the responsibility of the Funds' management. Our responsibility is to express an opinion on these financial statements and financial highlights based on our audits.
We conducted our audits in accordance with the standards of the Public Company Accounting Oversight Board (United States). Those standards require that we plan and perform the audit to obtain reasonable assurance about whether the financial statements and financial highlights are free of material misstatement. An audit includes examining, on a test basis, evidence supporting the amounts and disclosures in the financial statements. Our procedures included confirmation of securities owned as of March 31, 2016, by correspondence with the custodian and brokers or other appropriate auditing procedures. An audit also includes assessing the accounting principles used and significant estimates made by management, as well as evaluating the overall financial statement presentation. We believe that our audits provide a reasonable basis for our opinion.
In our opinion, the financial statements and financial highlights referred to above present fairly, in all material respects, the financial position of the Funds as of March 31, 2016, the results of their operations for the year then ended and the changes in their net assets and the financial highlights for each of the years in the two-year period then ended, in conformity with U.S. generally accepted accounting principles.
/s/ KPMG LLP
Chicago, Illinois
May 25, 2016
| NXP | | |
| | Nuveen Select Tax-Free Income Portfolio | |
| | Portfolio of Investments | March 31, 2016 |
| | Principal Amount (000) | | Description (1) | Optional Call Provisions (2) | | Ratings (3) | | Value | |
| | | | LONG-TERM INVESTMENTS – 99.0% | | | | | | |
| | | | MUNICIPAL BONDS – 99.0% | | | | | | |
| | | | Alaska – 0.9% | | | | | | |
| $ | 2,675 | | Northern Tobacco Securitization Corporation, Alaska, Tobacco Settlement Asset-Backed Bonds, Series 2006A, 5.000%, 6/01/46 | 6/16 at 100.00 | | B3 | $ | 2,371,575 | |
| | | | Arizona – 1.4% | | | | | | |
| | 2,500 | | Arizona Health Facilities Authority, Hospital Revenue Bonds, Catholic Healthcare West, Series 2011B-1&2, 5.250%, 3/01/39 | 3/21 at 100.00 | | A | | 2,792,225 | |
| | 625 | | Pima County Industrial Development Authority, Arizona, Revenue Bonds, Tucson Electric Power Company, Series 2010A, 5.250%, 10/01/40 | 10/20 at 100.00 | | A3 | | 701,456 | |
| | 3,125 | | Total Arizona | | | | | 3,493,681 | |
| | | | Arkansas – 0.7% | | | | | | |
| | 6,555 | | Arkansas Development Finance Authority, Tobacco Settlement Revenue Bonds, Arkansas Cancer Research Center Project, Series 2006, 0.000%, 7/01/46 – AMBAC Insured | No Opt. Call | | Aa2 | | 1,911,831 | |
| | | | California – 16.8% | | | | | | |
| | 2,000 | | Alameda Corridor Transportation Authority, California, Revenue Bonds, Refunding Subordinate Lien Series 2004A, 5.450%, 10/01/25 – AMBAC Insured | 10/17 at 100.00 | | BBB+ | | 2,125,320 | |
| | 4,245 | | Anaheim City School District, Orange County, California, General Obligation Bonds, Election 2002 Series 2007, 0.000%, 8/01/31 – AGM Insured | No Opt. Call | | AA | | 2,556,381 | |
| | 2,840 | | Anaheim Public Financing Authority, California, Lease Revenue Bonds, Public Improvement Project, Series 1997C, 0.000%, 9/01/30 – AGM Insured | No Opt. Call | | AA | | 1,725,840 | |
| | 3,000 | | Bay Area Toll Authority, California, Revenue Bonds, San Francisco Bay Area Toll Bridge, Series 2013S-4, 5.000%, 4/01/38 | 4/23 at 100.00 | | AA– | | 3,495,660 | |
| | 2,310 | | California Health Facilities Financing Authority, Revenue Bonds, Saint Joseph Health System, Series 2013A, 5.000%, 7/01/33 | 7/23 at 100.00 | | AA– | | 2,717,484 | |
| | 1,630 | | California State Public Works Board, Lease Revenue Bonds, Various Capital Projects, Series 2013I, 5.000%, 11/01/38 | 11/23 at 100.00 | | A+ | | 1,908,649 | |
| | 895 | | California Statewide Community Development Authority, Revenue Bonds, Methodist Hospital Project, Series 2009, 6.750%, 2/01/38 (Pre-refunded 8/01/19) | 8/19 at 100.00 | | N/R (4) | | 1,070,456 | |
| | 3,790 | | Coast Community College District, Orange County, California, General Obligation Bonds, Series 2006C, 0.000%, 8/01/36 (Pre-refunded 8/01/16) – AGM Insured | 8/16 at 33.78 | | Aa1 (4) | | 1,278,519 | |
| | 2,645 | | Cypress Elementary School District, Orange County, California, General Obligation Bonds, Series 2009A, 0.000%, 5/01/34 – AGM Insured | No Opt. Call | | AA | | 1,324,854 | |
| | 2,710 | | Golden State Tobacco Securitization Corporation, California, Enhanced Tobacco Settlement Asset-Backed Revenue Bonds, Series 2005A, 0.000%, 6/01/28 – AMBAC Insured | No Opt. Call | | A+ | | 1,925,807 | |
| | 1,395 | | Golden State Tobacco Securitization Corporation, California, Tobacco Settlement Asset-Backed Bonds, Series 2007A-1, 4.500%, 6/01/27 | 6/17 at 100.00 | | B+ | | 1,412,186 | |
| | 2,350 | | Golden Valley Unified School District, Madera County, California, General Obligation Bonds, Election 2006 Series 2007A, 0.000%, 8/01/29 – AGM Insured | 8/17 at 56.07 | | AA | | 1,292,054 | |
| | 3,030 | | Grossmont Union High School District, San Diego County, California, General Obligation Bonds, Series 2006, 0.000%, 8/01/25 – NPFG Insured | No Opt. Call | | Aa3 | | 2,437,696 | |
| | 1,000 | | Moreno Valley Unified School District, Riverside County, California, General Obligation Bonds, Series 2007, 0.000%, 8/01/23 – NPFG Insured | No Opt. Call | | AA– | | 845,610 | |
| | 1,160 | | Mount San Antonio Community College District, Los Angeles County, California, General Obligation Bonds, Election of 2008, Series 2013A, 0.000%, 8/01/43 (6) | 8/35 at 100.00 | | AA | | 893,954 | |
| | 5,395 | | Napa Valley Community College District, Napa and Sonoma Counties, California, General Obligation Bonds, Election 2002 Series 2007C, 0.000%, 8/01/32 – NPFG Insured | 8/17 at 46.57 | | Aa2 | | 2,465,137 | |
| NXP | Nuveen Select Tax-Free Income Portfolio | |
| | Portfolio of Investments (continued) | March 31, 2016 |
| | Principal Amount (000) | | Description (1) | Optional Call Provisions (2) | | Ratings (3) | | Value | |
| | | | California (continued) | | | | | | |
| $ | 2,180 | | New Haven Unified School District, Alameda County, California, General Obligation Bonds, Series 2004A, 0.000%, 8/01/28 – NPFG Insured | No Opt. Call | | AA– | $ | 1,202,030 | |
| | 590 | | Palomar Pomerado Health Care District, California, Certificates of Participation, Series 2009, 6.750%, 11/01/39 | 11/19 at 100.00 | | Ba1 | | 660,889 | |
| | 4,390 | | Pittsburg Redevelopment Agency, California, Tax Allocation Bonds, Los Medanos Community Development Project, Series 1999, 0.000%, 8/01/29 – AMBAC Insured | No Opt. Call | | A+ | | 2,628,205 | |
| | 1,700 | | Placentia-Yorba Linda Unified School District, Orange County, California, Certificates of Participation, Series 2006, 0.000%, 10/01/34 – NPFG Insured (ETM) | No Opt. Call | | AA– (4) | | 1,072,598 | |
| | 8,000 | | Poway Unified School District, San Diego County, California, General Obligation Bonds, School Facilities Improvement District 2007-1, Election 2008 Series 2009A, 0.000%, 8/01/33 | No Opt. Call | | AA– | | 4,689,760 | |
| | 2,110 | | Sierra Sands Unified School District, Kern County, California, General Obligation Bonds, Election of 2006, Series 2006A, 0.000%, 11/01/28 – FGIC Insured | No Opt. Call | | AA | | 1,441,636 | |
| | 1,195 | | Tobacco Securitization Authority of Northern California, Tobacco Settlement Asset-Backed Bonds, Series 2005A-1, 5.500%, 6/01/45 | 6/16 at 100.00 | | B– | | 1,193,172 | |
| | 1,150 | | Woodside Elementary School District, San Mateo County, California, General Obligation Bonds, Election of 2005, Series 2007, 0.000%, 10/01/30 – AMBAC Insured | No Opt. Call | | AAA | | 739,864 | |
| | 61,710 | | Total California | | | | | 43,103,761 | |
| | | | Colorado – 4.5% | | | | | | |
| | 1,780 | | Colorado Health Facilities Authority, Colorado, Revenue Bonds, Catholic Health Initiatives, Series 2013A, 5.250%, 1/01/45 | 1/23 at 100.00 | | A+ | | 2,034,095 | |
| | 1,000 | | Colorado Health Facilities Authority, Colorado, Revenue Bonds, Sisters of Charity of Leavenworth Health Services Corporation, Series 2010A, 5.000%, 1/01/40 | 1/20 at 100.00 | | AA– | | 1,107,450 | |
| | 1,935 | | Denver City and County, Colorado, Airport System Revenue Bonds, Subordinate Lien Series 2013B, 5.000%, 11/15/43 | 11/23 at 100.00 | | A | | 2,201,121 | |
| | 250 | | E-470 Public Highway Authority, Colorado, Senior Revenue Bonds, Series 2000B, 0.000%, 9/01/29 – NPFG Insured | No Opt. Call | | AA– | | 160,830 | |
| | 12,500 | | E-470 Public Highway Authority, Colorado, Senior Revenue Bonds, Series 2006A, 0.000%, 9/01/38 – NPFG Insured | 9/26 at 54.77 | | AA– | | 4,571,625 | |
| | 2,000 | | E-470 Public Highway Authority, Colorado, Toll Revenue Bonds, Series 2004B, 0.000%, 9/01/32 – NPFG Insured | 9/20 at 50.83 | | AA– | | 865,480 | |
| | 620 | | Park Creek Metropolitan District, Colorado, Senior Limited Property Tax Supported Revenue Bonds, Refunding Series 2015A, 5.000%, 12/01/35 | 12/25 at 100.00 | | BBB | | 708,257 | |
| | 20,085 | | Total Colorado | | | | | 11,648,858 | |
| | | | Connecticut – 0.9% | | | | | | |
| | 2,350 | | Connecticut Health and Educational Facilities Authority, Revenue Bonds, Yale University, Series 2007Z-1, 5.000%, 7/01/42 | 7/16 at 100.00 | | AAA | | 2,375,874 | |
| | | | Florida – 4.3% | | | | | | |
| | 2,000 | | Florida State Turnpike Authority, Turnpike Revenue Bonds, Department of Transportation, Series 2010B, 5.000%, 7/01/16 | No Opt. Call | | AA | | 2,023,060 | |
| | | | Halifax Hospital Medical Center, Daytona Beach, Florida, Hospital Revenue Bonds, Series 2006: | | | | | | |
| | 1,420 | | 5.375%, 6/01/46 (Pre-refunded 6/01/16) | 6/16 at 100.00 | | N/R (4) | | 1,431,545 | |
| | 580 | | 5.375%, 6/01/46 (Pre-refunded 6/01/16) | 6/16 at 100.00 | | A– (4) | | 584,791 | |
| | 2,500 | | JEA St. Johns River Power Park System, Florida, Revenue Bonds, 2012-Issue 2 Series 25, 5.000%, 10/01/16 | No Opt. Call | | Aa2 | | 2,557,125 | |
| | 4,240 | | Miami-Dade County, Florida, Special Obligation Bonds, Capital Asset Acquisition, Series 2007A, 5.000%, 4/01/23 – AMBAC Insured | 4/17 at 100.00 | | AA– | | 4,419,861 | |
| | 10,740 | | Total Florida | | | | | 11,016,382 | |
| | Principal Amount (000) | | Description (1) | Optional Call Provisions (2) | | Ratings (3) | | Value | |
| | | | Illinois – 10.7% | | | | | | |
| | | | Board of Trustees of Southern Illinois University, Housing and Auxiliary Facilities System Revenue Bonds, Series 1999A: | | | | | | |
| $ | 2,565 | | 0.000%, 4/01/20 – NPFG Insured | No Opt. Call | | AA– | $ | 2,280,567 | |
| | 2,000 | | 0.000%, 4/01/23 – NPFG Insured | No Opt. Call | | AA– | | 1,586,940 | |
| | 735 | | Chicago Board of Education, Illinois, General Obligation Bonds, Dedicated Revenues Series 2011A, 5.000%, 12/01/41 | 12/21 at 100.00 | | B+ | | 581,297 | |
| | 1,370 | | Chicago, Illinois, General Airport Revenue Bonds, O'Hare International Airport, Third Lien Series 2008B, 5.000%, 1/01/20 – AGM Insured | 1/17 at 100.00 | | AA | | 1,414,402 | |
| | 2,000 | | Illinois Finance Authority, Revenue Bonds, Northwestern Memorial HealthCare, Series 2013, 4.000%, 8/15/33 | No Opt. Call | | AA+ | | 2,154,860 | |
| | 260 | | Illinois Finance Authority, Revenue Bonds, Rehabilitation Institute of Chicago, Series 2013A, 6.000%, 7/01/43 | 7/23 at 100.00 | | A– | | 311,126 | |
| | 1,000 | | Illinois Finance Authority, Revenue Bonds, Silver Cross Hospital and Medical Centers, Series 2009, 6.875%, 8/15/38 (Pre-refunded 8/15/19) | 8/19 at 100.00 | | N/R (4) | | 1,195,710 | |
| | 1,050 | | Illinois Finance Authority, Revenue Bonds, University of Chicago, Tender Option Bond Trust 2015-XF0248, 9.104%, 7/01/46 (Pre-refunded 7/01/17) (IF) (5) | 7/17 at 100.00 | | AA+ (4) | | 1,163,390 | |
| | 2,100 | | Illinois Finance Authority, Revenue Refunding Bonds, Silver Cross Hospital and Medical Centers, Series 2008A, 5.500%, 8/15/30 | 8/18 at 100.00 | | BBB+ | | 2,229,444 | |
| | 2,190 | | Illinois State, General Obligation Bonds, Refunding Series 2012, 5.000%, 8/01/23 | No Opt. Call | | A– | | 2,465,590 | |
| | 1,000 | | Kendall, Kane, and Will Counties Community Unit School District 308 Oswego, Illinois, General Obligation Bonds, Series 2008, 0.000%, 2/01/24 – AGM Insured | No Opt. Call | | Aa2 | | 802,460 | |
| | 1,520 | | Metropolitan Pier and Exposition Authority, Illinois, Revenue Bonds, McCormick Place Expansion Project, Series 1993A, 0.000%, 6/15/17 – NPFG Insured | No Opt. Call | | AA– | | 1,491,150 | |
| | 470 | | Metropolitan Pier and Exposition Authority, Illinois, Revenue Bonds, McCormick Place Expansion Project, Series 1993A, 0.000%, 6/15/17 – NPFG Insured (ETM) | No Opt. Call | | AA– (4) | | 465,098 | |
| | | | Metropolitan Pier and Exposition Authority, Illinois, Revenue Bonds, McCormick Place Expansion Project, Series 2002A: | | | | | | |
| | 1,720 | | 0.000%, 12/15/29 – NPFG Insured | No Opt. Call | | AA– | | 1,016,451 | |
| | 810 | | 0.000%, 6/15/30 – NPFG Insured | No Opt. Call | | AA– | | 460,509 | |
| | 6,070 | | 0.000%, 12/15/31 – NPFG Insured | No Opt. Call | | AA– | | 3,221,288 | |
| | 5,000 | | 0.000%, 12/15/36 – NPFG Insured | No Opt. Call | | AA– | | 2,028,400 | |
| | 1,775 | | Springfield, Illinois, Electric Revenue Bonds, Senior Lien Series 2015, 5.000%, 3/01/28 | 3/25 at 100.00 | | A | | 2,128,758 | |
| | 310 | | University of Illinois, Health Services Facilities System Revenue Bonds, Series 2013, 6.000%, 10/01/42 | 10/23 at 100.00 | | A | | 359,960 | |
| | 33,945 | | Total Illinois | | | | | 27,357,400 | |
| | | | Indiana – 0.5% | | | | | | |
| | 270 | | Indiana Finance Authority, Tax-Exempt Private Activity Revenue Bonds, I-69 Section 5 Project, Series 2014, 5.250%, 9/01/34 (Alternative Minimum Tax) | 9/24 at 100.00 | | BBB | | 309,477 | |
| | 485 | | Indiana Health Facility Financing Authority, Revenue Bonds, Community Foundation of Northwest Indiana, Series 2007, 5.500%, 3/01/37 | 3/17 at 100.00 | | A+ | | 501,054 | |
| | 515 | | Indiana Health Facility Financing Authority, Revenue Bonds, Community Foundation of Northwest Indiana, Series 2007, 5.500%, 3/01/37 (Pre-refunded 3/01/17) | 3/17 at 100.00 | | N/R (4) | | 538,041 | |
| | 1,270 | | Total Indiana | | | | | 1,348,572 | |
| | | | Iowa – 2.6% | | | | | | |
| | 1,665 | | Iowa Finance Authority, Iowa, Midwestern Disaster Area Revenue Bonds, Iowa Fertilizer Company Project, Series 2013, 5.000%, 12/01/19 | No Opt. Call | | BB– | | 1,720,028 | |
| | 1,000 | | Iowa Tobacco Settlement Authority, Asset Backed Settlement Revenue Bonds, Series 2005C, 5.375%, 6/01/38 | 6/16 at 100.00 | | B+ | | 999,940 | |
| | 4,000 | | Iowa Tobacco Settlement Authority, Tobacco Asset-Backed Revenue Bonds, Series 2005B, 5.600%, 6/01/34 | 6/17 at 100.00 | | B+ | | 4,008,160 | |
| | 6,665 | | Total Iowa | | | | | 6,728,128 | |
| NXP | Nuveen Select Tax-Free Income Portfolio | |
| | Portfolio of Investments (continued) | March 31, 2016 |
| | Principal Amount (000) | | Description (1) | Optional Call Provisions (2) | | Ratings (3) | | Value | |
| | | | Kansas – 0.2% | | | | | | |
| $ | 500 | | Lawrence, Kansas, Hospital Revenue Bonds, Lawrence Memorial Hospital, Refunding Series 2006, 4.875%, 7/01/36 | 7/16 at 100.00 | | A1 | $ | 504,710 | |
| | | | Kentucky – 1.1% | | | | | | |
| | 2,500 | | Kentucky Economic Development Finance Authority, Hospital Revenue Bonds, Baptist Healthcare System Obligated Group, Series 2011, 5.250%, 8/15/46 | 8/21 at 100.00 | | A+ | | 2,706,750 | |
| | | | Massachusetts – 1.4% | | | | | | |
| | 1,075 | | Martha's Vineyard Land Bank, Massachusetts, Revenue Bonds, Refunding Series 2006, 5.000%, 5/01/18 – AMBAC Insured | 5/17 at 100.00 | | A– | | 1,124,246 | |
| | 500 | | Massachusetts Health and Educational Facilities Authority, Revenue Bonds, CareGroup Inc., Series 2008E-1 &2, 5.000%, 7/01/28 | 7/18 at 100.00 | | A– | | 542,220 | |
| | 1,790 | | Massachusetts Housing Finance Agency, Housing Bonds, Series 2009F, 5.700%, 6/01/40 (Alternative Minimum Tax) | 12/18 at 100.00 | | AA– | | 1,883,510 | |
| | 3,365 | | Total Massachusetts | | | | | 3,549,976 | |
| | | | Michigan – 2.6% | | | | | | |
| | 355 | | Detroit Water and Sewerage Department, Michigan, Sewage Disposal System Revenue Bonds, Refunding Senior Lien Series 2012A, 5.250%, 7/01/39 | 7/22 at 100.00 | | A– | | 393,578 | |
| | 1,500 | | Detroit, Michigan, Sewer Disposal System Revenue Bonds, Second Lien, Series 2001E, 5.750%, 7/01/31 – BHAC Insured | 7/18 at 100.00 | | AA+ | | 1,634,550 | |
| | 2,500 | | Detroit, Michigan, Sewer Disposal System Revenue Bonds, Second Lien, Series 2006B, 5.000%, 7/01/33 – FGIC Insured | 7/16 at 100.00 | | AA– | | 2,514,325 | |
| | 2,075 | | Detroit, Michigan, Water Supply System Senior Lien Revenue Bonds, Series 2004A, 4.500%, 7/01/25 – NPFG Insured | 7/16 at 100.00 | | AA– | | 2,082,138 | |
| | 6,430 | | Total Michigan | | | | | 6,624,591 | |
| | | | Minnesota – 2.4% | | | | | | |
| | 6,075 | | Minnesota State, General Obligation Bonds, Various Purpose Series 2013A, 5.000%, 8/01/16 | No Opt. Call | | AA+ | | 6,168,615 | |
| | | | Missouri – 2.7% | | | | | | |
| | 360 | | Bi-State Development Agency of the Missouri-Illinois Metropolitan District, Mass Transit Sales Tax Appropriation Bonds, Refunding Combined Lien Series 2013A, 5.000%, 10/01/28 | 10/18 at 100.00 | | AA+ | | 394,902 | |
| | | | Kansas City Municipal Assistance Corporation, Missouri, Leasehold Revenue Bonds, Series 2004B-1: | | | | | | |
| | 1,165 | | 0.000%, 4/15/23 – AMBAC Insured | No Opt. Call | | AA | | 1,007,643 | |
| | 5,000 | | 0.000%, 4/15/30 – AMBAC Insured | No Opt. Call | | AA– | | 3,182,050 | |
| | 2,000 | | Missouri Health and Educational Facilities Authority, Health Facilities Revenue Bonds, CoxHealth, Series 2013A, 5.000%, 11/15/38 | 11/23 at 100.00 | | A2 | | 2,253,980 | |
| | 8,525 | | Total Missouri | | | | | 6,838,575 | |
| | | | Nevada – 2.3% | | | | | | |
| | 750 | | Clark County, Nevada, Airport Revenue Bonds, Tender Option Bond Trust Series 11823, 19.547%, 1/01/18 (IF) | No Opt. Call | | A+ | | 1,214,340 | |
| | 1,250 | | Clark County, Nevada, Passenger Facility Charge Revenue Bonds, Las Vegas-McCarran International Airport, Series 2010A, 5.250%, 7/01/42 | 1/20 at 100.00 | | A+ | | 1,397,950 | |
| | 1,500 | | Las Vegas Redevelopment Agency, Nevada, Tax Increment Revenue Bonds, Series 2009A, 8.000%, 6/15/30 | 6/19 at 100.00 | | BBB+ | | 1,726,590 | |
| | 1,500 | | Las Vegas Valley Water District, Nevada, General Obligation Bonds, Refunding Series 2011D, 5.000%, 6/01/16 | No Opt. Call | | Aa1 | | 1,511,625 | |
| | 5,000 | | Total Nevada | | | | | 5,850,505 | |
| | | | New Jersey – 9.1% | | | | | | |
| | 940 | | New Jersey Economic Development Authority, Private Activity Bonds, The Goethals Bridge Replacement Project, Series 2013, 5.125%, 1/01/39 – AGM Insured (Alternative Minimum Tax) | 1/24 at 100.00 | | AA | | 1,045,553 | |
| | Principal Amount (000) | | Description (1) | Optional Call Provisions (2) | | Ratings (3) | | Value | |
| | | | New Jersey (continued) | | | | | | |
| $ | 2,550 | | New Jersey Economic Development Authority, Revenue Bonds, Motor Vehicle Surcharge, Series 2004A, 5.250%, 7/01/33 – NPFG Insured | 6/16 at 100.00 | | AA– | $ | 2,576,520 | |
| | 1,035 | | New Jersey Economic Development Authority, School Facilities Construction Financing Program Bonds, Refunding Series 2011GG, 5.000%, 9/01/22 | 3/21 at 100.00 | | A– | | 1,120,574 | |
| | 260 | | New Jersey Health Care Facilities Financing Authority, Revenue Bonds, University Hospital Issue, Refunding Series 2015A, 5.000%, 7/01/29 – AGM Insured | 7/25 at 100.00 | | AA | | 305,045 | |
| | 35,000 | | New Jersey Transportation Trust Fund Authority, Transportation System Bonds, Refunding Series 2006C, 0.000%, 12/15/34 – AGM Insured | No Opt. Call | | AA | | 15,923,247 | |
| | 2,500 | | Tobacco Settlement Financing Corporation, New Jersey, Tobacco Settlement Asset-Backed Bonds, Series 2007-1A, 5.000%, 6/01/41 | 6/17 at 100.00 | | B– | | 2,265,250 | |
| | 42,285 | | Total New Jersey | | | | | 23,236,189 | |
| | | | New Mexico – 2.2% | | | | | | |
| | 1,000 | | New Mexico Mortgage Finance Authority, Multifamily Housing Revenue Bonds, St Anthony, Series 2007A, 5.250%, 9/01/42 (Alternative Minimum Tax) | 9/17 at 100.00 | | N/R | | 1,013,230 | |
| | 4,650 | | State of New Mexico, State Severance Tax Revenue Bonds, Refunding Series 2010D, 5.000%, 7/01/16 | No Opt. Call | | Aa1 | | 4,703,846 | |
| | 5,650 | | Total New Mexico | | | | | 5,717,076 | |
| | | | New York – 4.1% | | | | | | |
| | 4,500 | | Dormitory Authority of the State of New York, State Personal Income Tax Revenue Bonds, Education Series 2006D, 5.000%, 3/15/36 (Pre-refunded 9/15/16) | 9/16 at 100.00 | | N/R (4) | | 4,593,105 | |
| | 500 | | Hudson Yards Infrastructure Corporation, New York, Revenue Bonds, Senior Fiscal 2012 Series 2011A, 5.250%, 2/15/47 | 2/21 at 100.00 | | A | | 570,145 | |
| | 1,810 | | Hudson Yards Infrastructure Corporation, New York, Revenue Bonds, Series 2006A, 5.000%, 2/15/47 – FGIC Insured | 2/17 at 100.00 | | A | | 1,865,929 | |
| | 840 | | New York City Transitional Finance Authority, New York, Future Tax Secured Bonds, Fiscal Series 2007B, 4.750%, 11/01/27 | 5/17 at 100.00 | | AAA | | 875,750 | |
| | 1,660 | | New York City Transitional Finance Authority, New York, Future Tax Secured Bonds, Fiscal Series 2007B, 4.750%, 11/01/27 (Pre-refunded 5/01/17) | 5/17 at 100.00 | | N/R (4) | | 1,733,389 | |
| | 780 | | Port Authority of New York and New Jersey, Special Project Bonds, JFK International Air Terminal LLC Project, Eighth Series 2010, 6.000%, 12/01/42 | 12/20 at 100.00 | | Baa1 | | 919,511 | |
| | 10,090 | | Total New York | | | | | 10,557,829 | |
| | | | North Carolina – 0.4% | | | | | | |
| | 1,000 | | North Carolina Eastern Municipal Power Agency, Power System Revenue Bonds, Series 2008C, 6.750%, 1/01/24 (Pre-refunded 1/01/19) | 1/19 at 100.00 | | AAA | | 1,160,760 | |
| | | | Ohio – 2.3% | | | | | | |
| | | | Buckeye Tobacco Settlement Financing Authority, Ohio, Tobacco Settlement Asset-Backed Revenue Bonds, Senior Lien, Series 2007A-2: | | | | | | |
| | 1,670 | | 6.000%, 6/01/42 | 6/17 at 100.00 | | B– | | 1,592,445 | |
| | 1,000 | | 6.500%, 6/01/47 | 6/17 at 100.00 | | B– | | 1,000,110 | |
| | 1,975 | | Buckeye Tobacco Settlement Financing Authority, Ohio, Tobacco Settlement Asset-Backed Revenue Bonds, Senior Lien, Series 2007A-3, 6.250%, 6/01/37 | 6/22 at 100.00 | | B– | | 1,942,946 | |
| | 1,105 | | Ohio Turnpike Commission, Turnpike Revenue Bonds, Infrastructure Project, Junior Lien Series 2013A-1, 5.000%, 2/15/48 | 2/23 at 100.00 | | A+ | | 1,246,860 | |
| | 5,750 | | Total Ohio | | | | | 5,782,361 | |
| | | | Oklahoma – 1.2% | | | | | | |
| | 1,000 | | Norman Regional Hospital Authority, Oklahoma, Hospital Revenue Bonds, Series 2005, 5.375%, 9/01/36 | 9/16 at 100.00 | | BBB– | | 1,011,210 | |
| | 2,000 | | Oklahoma City, Oklahoma, General Obligation Bonds, Refunding Series 2015, 2.000%, 9/01/16 | No Opt. Call | | AAA | | 2,013,440 | |
| | 3,000 | | Total Oklahoma | | | | | 3,024,650 | |
| NXP | Nuveen Select Tax-Free Income Portfolio | |
| | Portfolio of Investments (continued) | March 31, 2016 |
| | Principal Amount (000) | | Description (1) | Optional Call Provisions (2) | | Ratings (3) | | Value | |
| | | | Pennsylvania – 0.7% | | | | | | |
| $ | 1,490 | | Pennsylvania Turnpike Commission, Motor License Fund-Enhanced Subordinate Special Revenue Bonds, Series 2010B, 5.000%, 12/01/30 | 12/20 at 100.00 | | AA– | $ | 1,675,371 | |
| | | | Puerto Rico – 1.4% | | | | | | |
| | | | Puerto Rico Sales Tax Financing Corporation, Sales Tax Revenue Bonds, Series 2007A: | | | | | | |
| | 17,500 | | 0.000%, 8/01/41 – NPFG Insured | No Opt. Call | | AA– | | 3,442,950 | |
| | 1,000 | | 0.000%, 8/01/43 – NPFG Insured | No Opt. Call | | AA– | | 174,010 | |
| | 18,500 | | Total Puerto Rico | | | | | 3,616,960 | |
| | | | Texas – 10.6% | | | | | | |
| | 250 | | Central Texas Regional Mobility Authority, Revenue Bonds, Senior Lien Series 2011, 6.000%, 1/01/41 | 1/21 at 100.00 | | BBB+ | | 296,588 | |
| | 110 | | Central Texas Regional Mobility Authority, Revenue Bonds, Senior Lien, Series 2015A, 5.000%, 1/01/33 | 7/25 at 100.00 | | BBB+ | | 128,037 | |
| | 3,000 | | Fort Worth Independent School District, Tarrant County, Texas, General Obligation Bonds, Refunding Series 2006, 5.000%, 2/15/18 (5) | No Opt. Call | | AAA | | 3,053,160 | |
| | 5,565 | | Grand Parkway Transportation Corporation, Texas, System Toll Revenue Bonds, First Tier Series 2013A, 5.500%, 4/01/53 | 10/23 at 100.00 | | BBB+ | | 6,282,272 | |
| | 3,415 | | Harris County-Houston Sports Authority, Texas, Revenue Bonds, Junior Lien Series 2001H, 0.000%, 11/15/30 – NPFG Insured | No Opt. Call | | AA– | | 1,992,174 | |
| | 4,230 | | Harris County-Houston Sports Authority, Texas, Revenue Bonds, Third Lien Series 2004A-3, 0.000%, 11/15/35 – NPFG Insured | 11/24 at 52.47 | | AA– | | 1,581,343 | |
| | 4,015 | | Harris County-Houston Sports Authority, Texas, Special Revenue Bonds, Refunding Senior Lien Series 2001A, 0.000%, 11/15/38 – NPFG Insured | 11/30 at 61.17 | | AA | | 1,471,216 | |
| | 1,780 | | Leander Independent School District, Williamson and Travis Counties, Texas, General Obligation Bonds, Series 2007, 0.000%, 8/15/37 (Pre-refunded 8/15/16) | 8/16 at 35.23 | | AAA | | 625,670 | |
| | 2,260 | | Love Field Airport Modernization Corporation, Texas, Special Facilities Revenue Bonds, Southwest Airlines Company, Series 2010, 5.250%, 11/01/40 | 11/20 at 100.00 | | Baa1 | | 2,545,257 | |
| | 2,000 | | North Texas Tollway Authority, System Revenue Bonds, Refunding First Tier Capital Appreciation Series 2008I, 6.500%, 1/01/43 | 1/25 at 100.00 | | A1 | | 2,567,060 | |
| | 5,000 | | Texas Municipal Gas Acquisition and Supply Corporation III, Gas Supply Revenue Bonds, Series 2012, 5.000%, 12/15/26 | No Opt. Call | | A3 | | 5,770,449 | |
| | 830 | | Wood County Central Hospital District, Texas, Revenue Bonds, East Texas Medical Center Quitman Project, Series 2011, 6.000%, 11/01/41 | 11/21 at 100.00 | | Baa3 | | 932,812 | |
| | 32,455 | | Total Texas | | | | | 27,246,038 | |
| | | | Virginia – 4.2% | | | | | | |
| | 1,000 | | Fairfax County Economic Development Authority, Virginia, Residential Care Facilities Mortgage Revenue Bonds, Goodwin House, Inc., Series 2007A, 5.125%, 10/01/42 | 10/17 at 100.00 | | BBB | | 1,035,490 | |
| | 2,000 | | Metropolitan Washington Airports Authority, Virginia, Dulles Toll Road Revenue Bonds, Dulles Metrorail Capital Appreciation, Second Senior Lien Series 2010B, 0.000%, 10/01/44 (6) | 10/28 at 100.00 | | BBB+ | | 2,279,140 | |
| | 400 | | Stafford County Economic Development Authority, Virginia, Hospital Facilities Revenue Bonds, MediCorp Health System, Series 2006, 5.250%, 6/15/37 | 6/16 at 100.00 | | Baa1 | | 401,680 | |
| | 1,500 | | Virginia Public Building Authority, Public Facilities Revenue Bonds, Series 2009B, 5.000%, 8/01/17 | No Opt. Call | | AA+ | | 1,587,360 | |
| | | | Virginia Small Business Financing Authority, Senior Lien Revenue Bonds, Elizabeth River Crossing, Opco LLC Project, Series 2012: | | | | | | |
| | 1,000 | | 5.250%, 1/01/32 (Alternative Minimum Tax) | 7/22 at 100.00 | | BBB– | | 1,117,640 | |
| | 1,470 | | 6.000%, 1/01/37 (Alternative Minimum Tax) | 7/22 at 100.00 | | BBB– | | 1,718,636 | |
| | 1,010 | | 5.500%, 1/01/42 (Alternative Minimum Tax) | 7/22 at 100.00 | | BBB– | | 1,127,261 | |
| | 1,390 | | Virginia Small Business Financing Authority, Wellmont Health System Project Revenue Bonds, Series 2007A, 5.250%, 9/01/37 | 9/17 at 100.00 | | BBB+ | | 1,445,322 | |
| | 9,770 | | Total Virginia | | | | | 10,712,529 | |
| | Principal Amount (000) | | Description (1) | Optional Call Provisions (2) | | Ratings (3) | | Value | |
| | | | Washington – 4.3% | | | | | | |
| $ | 1,375 | | Energy Northwest, Washington, Electric Revenue Bonds, Columbia Generating Station, Refunding Series 2006A, 5.000%, 7/01/21 (Pre-refunded 7/01/16) | 7/16 at 100.00 | | Aa1 (4) | $ | 1,390,373 | |
| | 2,000 | | Pierce County School District 3 Puyallup, Washington, General Obligation Bonds, Refunding Series 2004, 5.000%, 6/01/16 – AGM Insured | No Opt. Call | | AA+ | | 2,015,360 | |
| | 2,250 | | Seattle, Washington, General Obligation Bonds, Refunding and Improvement Series 2010B, 5.000%, 8/01/16 (5) | No Opt. Call | | AAA | | 2,284,673 | |
| | 990 | | Washington Health Care Facilities Authority, Revenue Bonds, Fred Hutchinson Cancer Research Center, Series 2011A, 5.625%, 1/01/35 | 1/21 at 100.00 | | A | | 1,110,958 | |
| | 2,500 | | Washington State, General Obligation Motor Vehicle Fuel Tax Bonds, Series 2008D, 5.000%, 1/01/33 (Pre-refunded 1/01/18) | 1/18 at 100.00 | | AA+ (4) | | 2,684,575 | |
| | 2,115 | | Washington State, Motor Vehicle Fuel Tax General Obligation Bonds, Series 2003F, 0.000%, 12/01/27 – NPFG Insured | No Opt. Call | | AA+ | | 1,613,492 | |
| | 11,230 | | Total Washington | | | | | 11,099,431 | |
| | | | West Virginia – 0.9% | | | | | | |
| | 500 | | West Virginia Hospital Finance Authority, Hospital Revenue Bonds, West Virginia United Health Project, Series 2006A, 4.500%, 6/01/26 – AMBAC Insured | 6/16 at 100.00 | | A | | 501,680 | |
| | 1,500 | | West Virginia Hospital Finance Authority, Hospital Revenue Bonds, West Virginia United Health System Obligated Group, Refunding & Improvement Series 2013A, 5.500%, 6/01/44 | 6/23 at 100.00 | | A | | 1,741,725 | |
| | 2,000 | | Total West Virginia | | | | | 2,243,405 | |
| | | | Wisconsin – 1.6% | | | | | | |
| | 1,645 | | Wisconsin Health and Educational Facilities Authority, Revenue Bonds, Mercy Alliance, Inc., Series 2012, 5.000%, 6/01/39 | 6/22 at 100.00 | | A2 | | 1,806,062 | |
| | 1,500 | | Wisconsin Health and Educational Facilities Authority, Revenue Bonds, Wheaton Franciscan Healthcare System, Series 2006A, 5.250%, 8/15/31 (Pre-refunded 8/15/16) | 8/16 at 100.00 | | N/R (4) | | 1,526,445 | |
| | 775 | | Wisconsin, General Obligation Refunding Bonds, Series 2003-3, 5.000%, 11/01/26 | 6/16 at 100.00 | | AA | | 778,085 | |
| | 3,920 | | Total Wisconsin | | | | | 4,110,592 | |
| $ | 328,655 | | Total Municipal Bonds (cost $221,723,749) | | | | | 253,782,975 | |
| | Principal Amount (000) | | Description (1) | Coupon | | Maturity | | Ratings (3) | | Value | |
| | | | CORPORATE BONDS – 0.0% | | | | | | | | |
| | | | Transportation – 0.0% | | | | | | | | |
| $ | 210 | | Las Vegas Monorail Company, Senior Interest Bonds (7), (8) | 5.500% | | 7/15/19 | | N/R | $ | 6,297 | |
| | 56 | | Las Vegas Monorail Company, Senior Interest Bonds (7), (8) | 5.500% | | 7/15/55 | | N/R | | 1,674 | |
| $ | 266 | | Total Corporate Bonds (cost $23,822) | | | | | | | 7,971 | |
| | | | Total Long-Term Investments (cost $221,747,571) | | | | | | | 253,790,946 | |
| | | | Other Assets Less Liabilities – 1.0% (9) | | | | | | | 2,436,715 | |
| | | | Net Assets – 100% | | | | | | $ | 256,227,661 | |
| NXP | Nuveen Select Tax-Free Income Portfolio | |
| | Portfolio of Investments (continued) | March 31, 2016 |
Investments in Derivatives as of March 31, 2016
Interest Rate Swaps outstanding:
| | | | | Fund | | | | | | Fixed Rate | | | | | | Unrealized | |
| | | Notional | | Pay/Receive | | Floating Rate | | Fixed Rate | | Payment | | Effective | | Termination | | Appreciation | |
| Counterparty | | Amount | | Floating Rate | | Index | | (Annualized | ) | Frequency | | Date (10 | ) | Date | | (Depreciation | ) |
| JPMorgan Chase Bank, N.A. | $ | 7,400,000 | | Receive | | USD-BMA | | 1.940% | | Quarterly | | 6/29/16 | | 6/29/26 | $ | (443,326) | |
| (1) | All percentages shown in the Portfolio of Investments are based on net assets. |
| (2) | Optional Call Provisions (not covered by the report of independent registered public accounting firm): Dates (month and year) and prices of the earliest optional call or redemption. There may be other call provisions at varying prices at later dates. Certain mortgage-backed securities may be subject to periodic principal paydowns. |
| (3) | Ratings (not covered by the report of independent registered public accounting firm): Using the highest of Standard & Poor's Group ("Standard & Poor's"), Moody's Investors Service, Inc. ("Moody's") or Fitch, Inc. ("Fitch") rating. Ratings below BBB by Standard & Poor's, Baa by Moody's or BBB by Fitch are considered to be below investment grade. Holdings designated N/R are not rated by any of these national rating agencies. |
| (4) | Backed by an escrow or trust containing sufficient U.S. Government or U.S. Government agency securities, which ensure the timely payment of principal and interest. Certain bonds backed by U.S. Government or agency securities are regarded as having an implied rating equal to the rating of such securities. |
| (5) | Investment, or portion of investment, has been pledged to collateralize the net payment obligations for investments in derivatives and/or inverse floating rate transactions. |
| (6) | Step-up coupon. The rate shown is the coupon as of the end of the reporting period. |
| (7) | Investment valued at fair value using methods determined in good faith by, or at the discretion of, the Board. For fair value measurement disclosure purposes, investment classified as Level 3. See Notes to Financial Statements, Note 2 – Investment Valuation and Fair Value Measurements for more information. |
| (8) | During January 2010, Las Vegas Monorail Company ("Las Vegas Monorail") filed for federal bankruptcy protection. During March 2012, Las Vegas Monorail emerged from federal bankruptcy with the acceptance of a reorganization plan assigned by the Federal Bankruptcy Court. Under the reorganization plan, the Fund surrendered its Las Vegas Monorail Project Revenue Bonds, First Tier, Series 2000 and in turn received two senior interest corporate bonds: the first with an annual coupon rate of 5.500% maturing on July 15, 2019 and the second with an annual coupon rate of 3.000% (5.500% after December 31, 2015) maturing on July 15, 2055. The Fund is not accruing income for either senior interest corporate bond. |
| (9) | Other assets less liabilities includes the unrealized appreciation (depreciation) of certain over-the-counter derivatives as presented on the Statement of Assets and Liabilities. The unrealized appreciation (depreciation) of exchange-cleared and exchange-traded derivatives is recognized as part of the cash collateral at brokers and/or the receivable or payable for variation margin as presented on the Statement of Assets and Liabilities, when applicable. |
| (10) | Effective date represents the date on which both the Fund and counterparty commence interest payment accruals on each contract. |
| (ETM) | Escrowed to maturity. |
| (IF) | Inverse floating rate investment. |
| USD-BMA | United States Dollar-Bond Market Association |
See accompanying notes to financial statements.
| NXQ | | |
| | Nuveen Select Tax-Free Income Portfolio 2 | |
| | Portfolio of Investments | March 31, 2016 |
| | Principal Amount (000) | | Description (1) | Optional Call Provisions (2) | | Ratings (3) | | Value | |
| | | | LONG-TERM INVESTMENTS – 98.1% | | | | | | |
| | | | MUNICIPAL BONDS – 98.1% | | | | | | |
| | | | Alabama – 1.5% | | | | | | |
| $ | 3,750 | | Birmingham, Alabama, General Obligation Bonds, Refunding Series 2006A, 5.000%, 4/01/22 (Pre-refunded 10/01/16) – NPFG Insured | 10/16 at 100.00 | | AA (4) | $ | 3,835,013 | |
| | | | Alaska – 0.3% | | | | | | |
| | 1,000 | | Northern Tobacco Securitization Corporation, Alaska, Tobacco Settlement Asset-Backed Bonds, Series 2006A, 5.000%, 6/01/32 | 6/16 at 100.00 | | B3 | | 932,620 | |
| | | | Arizona – 2.4% | | | | | | |
| | 2,500 | | Arizona Health Facilities Authority, Hospital Revenue Bonds, Catholic Healthcare West, Series 2011B-1&2, 5.250%, 3/01/39 | 3/21 at 100.00 | | A | | 2,792,225 | |
| | 600 | | Pima County Industrial Development Authority, Arizona, Revenue Bonds, Tucson Electric Power Company, Series 2010A, 5.250%, 10/01/40 | 10/20 at 100.00 | | A3 | | 673,398 | |
| | 2,250 | | Salt Verde Financial Corporation, Arizona, Senior Gas Revenue Bonds, Citigroup Energy Inc Prepay Contract Obligations, Series 2007, 5.000%, 12/01/37 | No Opt. Call | | BBB+ | | 2,759,490 | |
| | 215 | | Sedona Wastewater Municipal Property Corporation, Arizona, Excise Tax Revenue Bonds, Series 1998, 0.000%, 7/01/20 – NPFG Insured | No Opt. Call | | AA– | | 195,087 | |
| | 5,565 | | Total Arizona | | | | | 6,420,200 | |
| | | | California – 14.4% | | | | | | |
| | 1,000 | | Alameda Corridor Transportation Authority, California, Revenue Bonds, Refunding Subordinate Lien Series 2004A, 5.450%, 10/01/25 – AMBAC Insured | 10/17 at 100.00 | | BBB+ | | 1,062,660 | |
| | 11,000 | | Alhambra Unified School District, Los Angeles County, California, General Obligation Bonds, Capital Appreciation Series 2009B, 0.000%, 8/01/41 – AGC Insured | No Opt. Call | | AA | | 4,160,420 | |
| | 4,000 | | Arcadia Unified School District, Los Angeles County, California, General Obligation Bonds, Election 2006 Series 2007A, 0.000%, 8/01/33 – AGM Insured | 2/17 at 44.77 | | Aa1 | | 1,756,560 | |
| | 1,500 | | California County Tobacco Securitization Agency, Tobacco Settlement Asset-Backed Bonds, Los Angeles County Securitization Corporation, Series 2006A, 5.600%, 6/01/36 | 12/18 at 100.00 | | B | | 1,507,980 | |
| | 500 | | California State Public Works Board, Lease Revenue Refunding Bonds, Community Colleges Projects, Series 1998A, 5.250%, 12/01/16 | 6/16 at 100.00 | | A+ | | 502,065 | |
| | 60 | | California State, General Obligation Bonds, Series 1997, 5.000%, 10/01/18 – AMBAC Insured | 4/16 at 100.00 | | AA– | | 60,240 | |
| | 2,440 | | Eureka Unified School District, Humboldt County, California, General Obligation Bonds, Series 2002, 0.000%, 8/01/27 – AGM Insured | No Opt. Call | | AA | | 1,760,997 | |
| | 3,290 | | Folsom Cordova Unified School District, Sacramento County, California, General Obligation Bonds, School Facilities Improvement District 4, Series 2007A, 0.000%, 10/01/24 – NPFG Insured | No Opt. Call | | AA– | | 2,614,399 | |
| | 1,000 | | Golden State Tobacco Securitization Corporation, California, Tobacco Settlement Asset-Backed Bonds, Series 2007A-1, 5.125%, 6/01/47 | 6/17 at 100.00 | | B– | | 930,270 | |
| | 3,030 | | Grossmont Union High School District, San Diego County, California, General Obligation Bonds, Series 2006, 0.000%, 8/01/25 – NPFG Insured | No Opt. Call | | Aa3 | | 2,437,696 | |
| | 1,495 | | Huntington Beach Union High School District, Orange County, California, General Obligation Bonds, Series 2007, 0.000%, 8/01/33 – FGIC Insured | No Opt. Call | | Aa2 | | 818,617 | |
| | 1,160 | | Mount San Antonio Community College District, Los Angeles County, California, General Obligation Bonds, Election of 2008, Series 2013A, 0.000%, 8/01/43 (6) | 8/35 at 100.00 | | AA | | 893,954 | |
| | 450 | | M-S-R Energy Authority, California, Gas Revenue Bonds, Citigroup Prepay Contracts, Series 2009C, 6.500%, 11/01/39 | No Opt. Call | | A | | 639,900 | |
| | 1,195 | | Palmdale Elementary School District, Los Angeles County, California, General Obligation Bonds, Series 2003, 0.000%, 8/01/28 – AGM Insured | No Opt. Call | | AA | | 830,465 | |
| NXQ | Nuveen Select Tax-Free Income Portfolio 2 | |
| | Portfolio of Investments (continued) | March 31, 2016 |
| | Principal Amount (000) | | Description (1) | Optional Call Provisions (2) | | Ratings (3) | | Value | |
| | | | California (continued) | | | | | | |
| $ | 590 | | Palomar Pomerado Health Care District, California, Certificates of Participation, Series 2009, 6.750%, 11/01/39 | 11/19 at 100.00 | | Ba1 | $ | 660,889 | |
| | 4,620 | | Palomar Pomerado Health, California, General Obligation Bonds, Capital Appreciation, Election of 2004, Series 2007A, 0.000%, 8/01/24 – NPFG Insured | No Opt. Call | | AA– | | 3,690,410 | |
| | 4,400 | | Pittsburg Redevelopment Agency, California, Tax Allocation Bonds, Los Medanos Community Development Project, Series 1999, 0.000%, 8/01/29 – AMBAC Insured | No Opt. Call | | A+ | | 2,634,192 | |
| | 2,500 | | Placentia-Yorba Linda Unified School District, Orange County, California, Certificates of Participation, Series 2006, 0.000%, 10/01/34 – NPFG Insured (ETM) | No Opt. Call | | AA– (4) | | 1,577,350 | |
| | 2,755 | | Sacramento City Unified School District, Sacramento County, California, General Obligation Bonds, Series 2007, 0.000%, 7/01/25 – AGM Insured | No Opt. Call | | A1 | | 2,231,798 | |
| | | | San Joaquin Delta Community College District, California, General Obligation Bonds, Election 2004 Series 2008B: | | | | | | |
| | 1,000 | | 0.000%, 8/01/30 – AGM Insured | 8/18 at 50.12 | | AA | | 486,650 | |
| | 1,890 | | 0.000%, 8/01/31 – AGM Insured | 8/18 at 47.14 | | AA | | 865,034 | |
| | 6,025 | | Simi Valley Unified School District, Ventura County, California, General Obligation Bonds, Series 2007C, 0.000%, 8/01/30 | No Opt. Call | | AA | | 3,713,509 | |
| | 2,080 | | Tobacco Securitization Authority of Northern California, Tobacco Settlement Asset-Backed Bonds, Series 2005A-1, 5.500%, 6/01/45 | 6/16 at 100.00 | | B– | | 2,076,818 | |
| | 57,980 | | Total California | | | | | 37,912,873 | |
| | | | Colorado – 9.3% | | | | | | |
| | 500 | | Colorado Health Facilities Authority, Colorado, Revenue Bonds, Catholic Health Initiatives, Series 2009A, 5.500%, 7/01/34 | 7/19 at 100.00 | | A+ | | 561,340 | |
| | 1,975 | | Colorado Health Facilities Authority, Colorado, Revenue Bonds, Sisters of Charity of Leavenworth Health Services Corporation, Series 2010A, 5.000%, 1/01/40 | 1/20 at 100.00 | | AA– | | 2,187,214 | |
| | 1,000 | | Colorado Health Facilities Authority, Colorado, Revenue Bonds, Valley View Hospital Association, Series 2007, 5.250%, 5/15/42 | 5/17 at 100.00 | | A– | | 1,037,970 | |
| | 1,935 | | Denver City and County, Colorado, Airport System Revenue Bonds, Subordinate Lien Series 2013B, 5.000%, 11/15/43 | 11/23 at 100.00 | | A | | 2,201,121 | |
| | 2,230 | | Denver Convention Center Hotel Authority, Colorado, Revenue Bonds, Convention Center Hotel, Senior Lien Series 2006, 4.750%, 12/01/35 – SYNCORA GTY Insured | 11/16 at 100.00 | | BBB– | | 2,251,185 | |
| | 1,600 | | Denver, Colorado, Airport System Revenue Bonds, Refunding Series 2006A, 5.000%, 11/15/16 – NPFG Insured | No Opt. Call | | AA– | | 1,643,904 | |
| | | | E-470 Public Highway Authority, Colorado, Senior Revenue Bonds, Series 2000B: | | | | | | |
| | 5,140 | | 0.000%, 9/01/24 – NPFG Insured | No Opt. Call | | AA– | | 4,074,735 | |
| | 8,100 | | 0.000%, 9/01/29 – NPFG Insured | No Opt. Call | | AA– | | 5,210,891 | |
| | 4,475 | | 0.000%, 9/01/33 – NPFG Insured | No Opt. Call | | AA– | | 2,422,452 | |
| | 3,000 | | University of Colorado, Enterprise System Revenue Bonds, Series 2009B, 5.000%, 6/01/16 | No Opt. Call | | AA+ | | 3,023,580 | |
| | 29,955 | | Total Colorado | | | | | 24,614,392 | |
| | | | Connecticut – 0.8% | | | | | | |
| | 1,945 | | Connecticut Health and Educational Facilities Authority, Auction Rate Revenue Bonds, Yale University, Series 2007Z-2, 5.050%, 7/01/42 | 7/17 at 100.00 | | AAA | | 2,041,705 | |
| | | | Florida – 2.6% | | | | | | |
| | 1,685 | | Broward County, Florida, Professional Sports Facilities Tax and Revenue Bonds, Broward County Civic Arena Project, Refunding Series 2006A, 5.000%, 9/01/28 – AMBAC Insured | No Opt. Call | | AA | | 1,713,123 | |
| | 2,365 | | Citizens Property Insurance Corporation, Florida, High-Risk Account Senior Secured Bonds Series 2010A-1, 5.000%, 6/01/16 | No Opt. Call | | A+ | | 2,383,187 | |
| | 1,000 | | Hillsborough County Industrial Development Authority, Florida, Hospital Revenue Bonds, Tampa General Hospital, Series 2006, 5.250%, 10/01/41 | 10/16 at 100.00 | | A | | 1,016,090 | |
| | 1,500 | | Lakeland, Florida, Hospital System Revenue Bonds, Lakeland Regional Health, Series 2015, 5.000%, 11/15/45 | 11/24 at 100.00 | | A2 | | 1,676,220 | |
| | 6,550 | | Total Florida | | | | | 6,788,620 | |
| | Principal Amount (000) | | Description (1) | Optional Call Provisions (2) | | Ratings (3) | | Value | |
| | | | Illinois – 12.1% | | | | | | |
| $ | 1,615 | | Board of Trustees of Southern Illinois University, Housing and Auxiliary Facilities System Revenue Bonds, Series 1999A, 0.000%, 4/01/23 – NPFG Insured | No Opt. Call | | AA– | $ | 1,281,454 | |
| | 735 | | Chicago Board of Education, Illinois, General Obligation Bonds, Dedicated Revenues Series 2011A, 5.000%, 12/01/41 | 12/21 at 100.00 | | B+ | | 581,297 | |
| | 1,000 | | Chicago, Illinois, General Obligation Bonds, Project & Refunding Series 2006A, 4.625%, 1/01/31 – AGM Insured | 6/16 at 100.00 | | AA | | 1,001,010 | |
| | 1,515 | | Chicago, Illinois, General Obligation Bonds, Project & Refunding Series 2007C, 5.000%, 1/01/27 – NPFG Insured | No Opt. Call | | AA– | | 1,570,161 | |
| | 470 | | Illinois Finance Authority, Revenue Bonds, Palos Community Hospital, Series 2007A, 5.000%, 5/15/32 (Pre-refunded 5/15/17) – NPFG Insured | 5/17 at 100.00 | | AA– (4) | | 492,405 | |
| | 1,050 | | Illinois Finance Authority, Revenue Bonds, University of Chicago, Tender Option Bond Trust 2015-XF0248, 9.104%, 7/01/46 (Pre-refunded 7/01/17) (IF) (5) | 7/17 at 100.00 | | AA+ (4) | | 1,163,390 | |
| | 1,750 | | Illinois Finance Authority, Revenue Refunding Bonds, Silver Cross Hospital and Medical Centers, Series 2008A, 5.500%, 8/15/30 | 8/18 at 100.00 | | BBB+ | | 1,857,870 | |
| | 1,035 | | Illinois Finance Authority, Student Housing Revenue Bonds, Educational Advancement Fund Inc., University Center Project, Series 2006B, 5.000%, 5/01/25 | 11/16 at 100.00 | | BBB+ | | 1,050,256 | |
| | 2,190 | | Illinois State, General Obligation Bonds, Refunding Series 2012, 5.000%, 8/01/23 | No Opt. Call | | A– | | 2,465,590 | |
| | | | Metropolitan Pier and Exposition Authority, Illinois, Revenue Bonds, McCormick Place Expansion Project, Series 2002A: | | | | | | |
| | 6,350 | | 0.000%, 12/15/31 – NPFG Insured | No Opt. Call | | AA– | | 3,369,882 | |
| | 1,350 | | 0.000%, 6/15/35 – NPFG Insured | No Opt. Call | | AA– | | 590,180 | |
| | 5,000 | | 0.000%, 12/15/36 – NPFG Insured | No Opt. Call | | AA– | | 2,028,400 | |
| | 9,170 | | 0.000%, 6/15/39 – NPFG Insured | No Opt. Call | | AA– | | 3,253,883 | |
| | 5,045 | | Sauk Village, Illinois, General Obligation Alternate Revenue Source Bonds, Tax Increment, Series 2002A, 5.000%, 6/01/22 – RAAI Insured | 6/16 at 100.00 | | AA | | 5,046,109 | |
| | | | Sauk Village, Illinois, General Obligation Alternate Revenue Source Bonds, Tax Increment, Series 2002B: | | | | | | |
| | 1,060 | | 0.000%, 12/01/17 – RAAI Insured | No Opt. Call | | AA | | 991,068 | |
| | 1,135 | | 0.000%, 12/01/18 – RAAI Insured | No Opt. Call | | AA | | 1,018,572 | |
| | 2,000 | | Springfield, Illinois, Electric Revenue Bonds, Senior Lien Series 2007, 5.000%, 3/01/22 (Pre-refunded 3/01/17) – NPFG Insured | 3/17 at 100.00 | | AA– (4) | | 2,079,920 | |
| | 1,825 | | Springfield, Illinois, Electric Revenue Bonds, Senior Lien Series 2015, 5.000%, 3/01/28 | 3/25 at 100.00 | | A | | 2,188,723 | |
| | 44,295 | | Total Illinois | | | | | 32,030,170 | |
| | | | Indiana – 5.2% | | | | | | |
| | 1,600 | | Indiana Bond Bank, Special Program Bonds, Carmel Junior Waterworks Project, Series 2008B, 0.000%, 6/01/30 – AGM Insured | No Opt. Call | | AA | | 1,031,200 | |
| | 2,040 | | Indiana Finance Authority, Hospital Revenue Bonds, Indiana University Health Obligation Group, Refunding 2015A, 5.000%, 12/01/40 | 6/25 at 100.00 | | AA | | 2,361,239 | |
| | 170 | | Indiana Finance Authority, Tax-Exempt Private Activity Revenue Bonds, I-69 Section 5 Project, Series 2014, 5.250%, 9/01/40 (Alternative Minimum Tax) | 9/24 at 100.00 | | BBB | | 191,522 | |
| | 1,075 | | Indiana Health and Educational Facilities Financing Authority, Revenue Bonds, Ascension Health, Series 2006B-5, 5.000%, 11/15/36 | 11/16 at 100.00 | | AA+ | | 1,104,122 | |
| | 485 | | Indiana Health Facility Financing Authority, Revenue Bonds, Community Foundation of Northwest Indiana, Series 2007, 5.500%, 3/01/37 | 3/17 at 100.00 | | A+ | | 501,053 | |
| | 515 | | Indiana Health Facility Financing Authority, Revenue Bonds, Community Foundation of Northwest Indiana, Series 2007, 5.500%, 3/01/37 (Pre-refunded 3/01/17) | 3/17 at 100.00 | | N/R (4) | | 538,041 | |
| | 2,000 | | Indiana Municipal Power Agency, Power Supply Revenue Bonds, Series 2007A, 5.000%, 1/01/42 (Pre-refunded 1/01/17) – NPFG Insured | 1/17 at 100.00 | | AA– (4) | | 2,065,960 | |
| | 1,750 | | Indianapolis Local Public Improvement Bond Bank, Indiana, Airport Authority Project Revenue Bonds, Series 2006F, 5.000%, 1/01/17 – AMBAC Insured (Alternative Minimum Tax) | 7/16 at 100.00 | | A1 | | 1,769,915 | |
| NXQ | Nuveen Select Tax-Free Income Portfolio 2 | |
| | Portfolio of Investments (continued) | March 31, 2016 |
| | Principal Amount (000) | | Description (1) | Optional Call Provisions (2) | | Ratings (3) | | Value | |
| | | | Indiana (continued) | | | | | | |
| $ | 1,825 | | Indianapolis Local Public Improvement Bond Bank, Indiana, Waterworks Project Series 2009A, 5.500%, 1/01/38 – AGC Insured | 1/19 at 100.00 | | AA | $ | 2,047,723 | |
| | 1,895 | | Whiting Redevelopment District, Indiana, Tax Increment Revenue Bonds, Lakefront Development Project, Series 2010, 6.000%, 1/15/19 | No Opt. Call | | N/R | | 1,993,085 | |
| | 13,355 | | Total Indiana | | | | | 13,603,860 | |
| | | | Iowa – 1.7% | | | | | | |
| | 1,665 | | Iowa Finance Authority, Iowa, Midwestern Disaster Area Revenue Bonds, Iowa Fertilizer Company Project, Series 2013, 5.000%, 12/01/19 | No Opt. Call | | BB– | | 1,720,028 | |
| | 1,645 | | Iowa Tobacco Settlement Authority, Asset Backed Settlement Revenue Bonds, Series 2005C, 5.375%, 6/01/38 | 6/16 at 100.00 | | B+ | | 1,644,901 | |
| | 1,000 | | Iowa Tobacco Settlement Authority, Tobacco Asset-Backed Revenue Bonds, Series 2005B, 5.600%, 6/01/34 | 6/17 at 100.00 | | B+ | | 1,002,040 | |
| | 4,310 | | Total Iowa | | | | | 4,366,969 | |
| | | | Kansas – 0.4% | | | | | | |
| | 795 | | Lawrence, Kansas, Hospital Revenue Bonds, Lawrence Memorial Hospital, Refunding Series 2006, 4.875%, 7/01/36 | 7/16 at 100.00 | | A1 | | 802,489 | |
| | 305 | | Overland Park Development Corporation, Kansas, Second Tier Revenue Bonds, Overland Park Convention Center, Series 2007B, 5.125%, 1/01/22 – AMBAC Insured | 1/17 at 100.00 | | BB+ | | 307,413 | |
| | 1,100 | | Total Kansas | | | | | 1,109,902 | |
| | | | Kentucky – 1.3% | | | | | | |
| | 2,500 | | Kentucky Economic Development Finance Authority, Hospital Revenue Bonds, Baptist Healthcare System Obligated Group, Series 2011, 5.250%, 8/15/46 | 8/21 at 100.00 | | A+ | | 2,706,750 | |
| | 805 | | Kentucky Public Transportation Infrastructure Authority, First Tier Toll Revenue Bonds, Downtown Crossing Project, Convertible Capital Appreciation Series 2013C, 0.000%, 7/01/43 (6) | 7/31 at 100.00 | | Baa3 | | 635,789 | |
| | 3,305 | | Total Kentucky | | | | | 3,342,539 | |
| | | | Maryland – 1.5% | | | | | | |
| | | | Baltimore, Maryland, Senior Lien Convention Center Hotel Revenue Bonds, Series 2006A: | | | | | | |
| | 595 | | 5.000%, 9/01/32 – SYNCORA GTY Insured | 9/16 at 100.00 | | Ba1 | | 603,062 | |
| | 100 | | 5.250%, 9/01/39 – SYNCORA GTY Insured | 9/16 at 100.00 | | Ba1 | | 101,355 | |
| | 3,145 | | Maryland Health and Higher Educational Facilities Authority, Revenue Bonds, Western Maryland Health, Series 2006A, 4.500%, 1/01/21 (Pre-refunded 7/01/16) – NPFG Insured | 7/16 at 100.00 | | AA– (4) | | 3,176,419 | |
| | 3,840 | | Total Maryland | | | | | 3,880,836 | |
| | | | Massachusetts – 0.2% | | | | | | |
| | 500 | | Massachusetts Health and Educational Facilities Authority, Revenue Bonds, CareGroup Inc., Series 2008E-1 &2, 5.000%, 7/01/28 | 7/18 at 100.00 | | A– | | 542,220 | |
| | | | Michigan – 3.2% | | | | | | |
| | 355 | | Detroit Water and Sewerage Department, Michigan, Sewage Disposal System Revenue Bonds, Refunding Senior Lien Series 2012A, 5.250%, 7/01/39 | 7/22 at 100.00 | | A– | | 393,578 | |
| | 2,590 | | Detroit, Michigan, Sewer Disposal System Revenue Bonds, Second Lien, Series 2001E, 5.750%, 7/01/31 – BHAC Insured | 7/18 at 100.00 | | AA+ | | 2,822,323 | |
| | 2,500 | | Detroit, Michigan, Sewer Disposal System Revenue Bonds, Second Lien, Series 2006B, 5.000%, 7/01/33 – FGIC Insured | 7/16 at 100.00 | | AA– | | 2,514,325 | |
| | 2,060 | | Detroit, Michigan, Water Supply System Senior Lien Revenue Bonds, Series 2004A, 4.500%, 7/01/25 – NPFG Insured | 7/16 at 100.00 | | AA– | | 2,067,086 | |
| | 385 | | Michigan State Building Authority, Revenue Refunding Bonds, Facilities Program, Refunding Series 2015-I, 5.000%, 4/15/38 | 10/25 at 100.00 | | Aa2 | | 450,550 | |
| | 250 | | Royal Oak Hospital Finance Authority, Michigan, Hospital Revenue Bonds, William Beaumont Hospital, Refunding Series 2009V, 8.250%, 9/01/39 (Pre-refunded 9/01/18) | 9/18 at 100.00 | | Aaa | | 294,408 | |
| | 8,140 | | Total Michigan | | | | | 8,542,270 | |
| | Principal Amount (000) | | Description (1) | Optional Call Provisions (2) | | Ratings (3) | | Value | |
| | | | Minnesota – 2.1% | | | | | | |
| $ | 955 | | Minnesota Housing Finance Agency, Residential Housing Finance Bonds, Series 2007-I, 4.850%, 7/01/38 (Alternative Minimum Tax) | 7/16 at 100.00 | | AA+ | $ | 958,085 | |
| | 4,555 | | Minnesota State, General Obligation Bonds, Various Purpose Series 2013A, 5.000%, 8/01/16 | No Opt. Call | | AA+ | | 4,625,193 | |
| | 5,510 | | Total Minnesota | | | | | 5,583,278 | |
| | | | Missouri – 0.1% | | | | | | |
| | 270 | | Bi-State Development Agency of the Missouri-Illinois Metropolitan District, Mass Transit Sales Tax Appropriation Bonds, Refunding Combined Lien Series 2013A, 5.000%, 10/01/28 | 10/18 at 100.00 | | AA+ | | 296,177 | |
| | | | Nebraska – 0.2% | | | | | | |
| | 545 | | Douglas County Hospital Authority 3, Nebraska, Health Facilities Revenue Bonds, Nebraska Methodist Health System, Refunding Series 2015, 4.125%, 11/01/36 | 11/25 at 100.00 | | A– | | 567,781 | |
| | | | Nevada – 4.1% | | | | | | |
| | 1,325 | | Clark County Water Reclamation District, Nevada, General Obligation Water Bonds, Series 2009A, 5.250%, 7/01/38 | No Opt. Call | | AAA | | 1,486,968 | |
| | 1,250 | | Clark County, Nevada, Airport Revenue Bonds, Tender Option Bond Trust Series 11823, 19.547%, 1/01/18 (IF) | No Opt. Call | | A+ | | 2,023,900 | |
| | 1,000 | | Clark County, Nevada, Passenger Facility Charge Revenue Bonds, Las Vegas-McCarran International Airport, Series 2010A, 5.250%, 7/01/42 | 1/20 at 100.00 | | A+ | | 1,118,360 | |
| | 3,000 | | Las Vegas Valley Water District, Nevada, General Obligation Bonds, Refunding Series 2015, 5.000%, 6/01/34 | 12/24 at 100.00 | | Aa1 | | 3,581,070 | |
| | 2,500 | | North Las Vegas, Nevada, General Obligation Bonds, Series 2006, 5.000%, 5/01/36 – NPFG Insured | 5/16 at 100.00 | | AA– | | 2,499,900 | |
| | 9,075 | | Total Nevada | | | | | 10,710,198 | |
| | | | New Jersey – 3.0% | | | | | | |
| | 2,165 | | New Jersey Economic Development Authority, School Facilities Construction Financing Program Bonds, Refunding Series 2011GG, 5.000%, 9/01/22 | 3/21 at 100.00 | | A– | | 2,344,002 | |
| | 1,250 | | New Jersey Economic Development Authority, School Facility Construction Bonds, Series 2005K, 5.500%, 12/15/19 – AMBAC Insured | No Opt. Call | | A– | | 1,382,775 | |
| | 2,000 | | New Jersey Transportation Trust Fund Authority, Transportation System Bonds, Series 2012A, 5.000%, 6/15/42 | No Opt. Call | | A– | | 2,092,040 | |
| | 2,000 | | New Jersey Transportation Trust Fund Authority, Transportation System Bonds, Series 2015AA, 5.250%, 6/15/29 | 6/25 at 100.00 | | A– | | 2,231,760 | |
| | 7,415 | | Total New Jersey | | | | | 8,050,577 | |
| | | | New Mexico – 0.4% | | | | | | |
| | 1,000 | | New Mexico Mortgage Finance Authority, Multifamily Housing Revenue Bonds, St Anthony, Series 2007A, 5.250%, 9/01/42 (Alternative Minimum Tax) | 9/17 at 100.00 | | N/R | | 1,013,230 | |
| | | | New York – 4.6% | | | | | | |
| | 1,700 | | Dormitory Authority of the State of New York, FHA Insured Mortgage Hospital Revenue Bonds, Kaleida Health, Series 2006, 4.700%, 2/15/35 (Pre-refunded 8/15/16) | 8/16 at 100.00 | | N/R (4) | | 1,727,047 | |
| | 5,000 | | Dormitory Authority of the State of New York, State Personal Income Tax Revenue Bonds, Education Series 2006D, 5.000%, 3/15/36 (Pre-refunded 9/15/16) | 9/16 at 100.00 | | N/R (4) | | 5,103,449 | |
| | 500 | | Hudson Yards Infrastructure Corporation, New York, Revenue Bonds, Senior Fiscal 2012 Series 2011A, 5.250%, 2/15/47 | 2/21 at 100.00 | | A | | 570,145 | |
| | 1,805 | | Hudson Yards Infrastructure Corporation, New York, Revenue Bonds, Series 2006A, 5.000%, 2/15/47 – FGIC Insured | 2/17 at 100.00 | | A | | 1,860,775 | |
| | 1,250 | | Metropolitan Transportation Authority, New York, Transportation Revenue Bonds, Refunding Series 2012F, 5.000%, 11/15/26 | 11/22 at 100.00 | | AA– | | 1,514,500 | |
| | 1,135 | | Port Authority of New York and New Jersey, Special Project Bonds, JFK International Air Terminal LLC Project, Eighth Series 2010, 6.000%, 12/01/42 | 12/20 at 100.00 | | Baa1 | | 1,338,006 | |
| | 11,390 | | Total New York | | | | | 12,113,922 | |
| NXQ | Nuveen Select Tax-Free Income Portfolio 2 | |
| | Portfolio of Investments (continued) | March 31, 2016 |
| | Principal Amount (000) | | | Optional Call Provisions (2) | | Ratings (3) | | Value | |
| | | | Ohio – 3.4% | | | | | | |
| | | | Buckeye Tobacco Settlement Financing Authority, Ohio, Tobacco Settlement Asset-Backed Revenue Bonds, Senior Lien, Series 2007A-2: | | | | | | |
| $ | 2,155 | | 5.375%, 6/01/24 | 6/17 at 100.00 | | B– | $ | 2,055,482 | |
| | 2,475 | | 5.875%, 6/01/30 | 6/17 at 100.00 | | B– | | 2,365,085 | |
| | 875 | | 5.750%, 6/01/34 | 6/17 at 100.00 | | B– | | 820,225 | |
| | 2,680 | | 5.875%, 6/01/47 | 6/17 at 100.00 | | B– | | 2,536,593 | |
| | 1,105 | | Ohio Turnpike Commission, Turnpike Revenue Bonds, Infrastructure Project, Junior Lien Series 2013A-1, 5.000%, 2/15/48 | 2/23 at 100.00 | | A+ | | 1,246,860 | |
| | 9,290 | | Total Ohio | | | | | 9,024,245 | |
| | | | Oklahoma – 1.6% | | | | | | |
| | 1,000 | | Norman Regional Hospital Authority, Oklahoma, Hospital Revenue Bonds, Series 2005, 5.375%, 9/01/36 | 9/16 at 100.00 | | BBB– | | 1,011,210 | |
| | 2,905 | | Oklahoma Development Finance Authority, Revenue Bonds, Saint John Health System, Series 2007, 5.000%, 2/15/42 | 2/17 at 100.00 | | AA | | 2,992,731 | |
| | 95 | | Oklahoma Development Finance Authority, Revenue Bonds, Saint John Health System, Series 2007, 5.000%, 2/15/42 (Pre-refunded 2/15/17) | 2/17 at 100.00 | | N/R (4) | | 98,647 | |
| | 4,000 | | Total Oklahoma | | | | | 4,102,588 | |
| | | | Pennsylvania – 0.6% | | | | | | |
| | 1,500 | | Pennsylvania Turnpike Commission, Motor License Fund-Enhanced Subordinate Special Revenue Bonds, Series 2010B, 5.000%, 12/01/30 | 12/20 at 100.00 | | AA– | | 1,686,615 | |
| | | | Puerto Rico – 0.9% | | | | | | |
| | 1,035 | | Puerto Rico Housing Finance Authority, Capital Fund Program Revenue Bonds, Series 2003, 5.000%, 12/01/20 | 6/16 at 100.00 | | AA– | | 1,062,717 | |
| | 15,000 | | Puerto Rico Sales Tax Financing Corporation, Sales Tax Revenue Bonds, Series 2007A, 0.000%, 8/01/54 – AMBAC Insured | No Opt. Call | | Caa3 | | 1,210,500 | |
| | 16,035 | | Total Puerto Rico | | | | | 2,273,217 | |
| | | | South Dakota – 0.3% | | | | | | |
| | 600 | | South Dakota Health and Educational Facilities Authority, Revenue Bonds, Sanford Health, Series 2015, 5.000%, 11/01/35 | 11/25 at 100.00 | | A+ | | 691,992 | |
| | | | Texas – 11.1% | | | | | | |
| | 250 | | Central Texas Regional Mobility Authority, Revenue Bonds, Senior Lien Series 2011, 6.000%, 1/01/41 | 1/21 at 100.00 | | BBB+ | | 296,588 | |
| | 240 | | Central Texas Regional Mobility Authority, Revenue Bonds, Senior Lien, Series 2015A, 5.000%, 1/01/35 | 7/25 at 100.00 | | BBB+ | | 274,754 | |
| | 3,000 | | Fort Worth Independent School District, Tarrant County, Texas, General Obligation Bonds, Refunding Series 2006, 5.000%, 2/15/18 | No Opt. Call | | AAA | | 3,053,160 | |
| | 5,560 | | Grand Parkway Transportation Corporation, Texas, System Toll Revenue Bonds, First Tier Series 2013A, 5.500%, 4/01/53 | 10/23 at 100.00 | | BBB+ | | 6,276,624 | |
| | 1,160 | | Harris County Cultural Education Facilities Finance Corporation, Texas, Revenue Bonds, Houston Methodist Hospital System, Series 2015, 5.000%, 12/01/45 | 6/25 at 100.00 | | AA | | 1,338,652 | |
| | 675 | | Harris County Health Facilities Development Corporation, Texas, Hospital Revenue Bonds, Texas Children's Hospital, Series 1995, 5.500%, 10/01/16 – NPFG Insured (ETM) | No Opt. Call | | AA– (4) | | 690,694 | |
| | | | Harris County-Houston Sports Authority, Texas, Revenue Bonds, Junior Lien Series 2001H: | | | | | | |
| | 630 | | 0.000%, 11/15/24 – NPFG Insured | No Opt. Call | | AA– | | 468,292 | |
| | 12,480 | | 0.000%, 11/15/41 – NPFG Insured | 11/31 at 53.78 | | AA– | | 3,549,312 | |
| | 975 | | Houston, Texas, Airport System Revenue Bonds, Refunding Subordinate Lien Series 2007B, 5.000%, 7/01/25 – NPFG Insured | 7/17 at 100.00 | | AA– | | 1,022,687 | |
| | 575 | | Houston, Texas, Hotel Occupancy Tax and Special Revenue Bonds, Convention and Entertainment Project, Series 2001B, 0.000%, 9/01/24 – AMBAC Insured | No Opt. Call | | A2 | | 443,894 | |
| | Principal Amount (000) | | Description (1) | Optional Call Provisions (2) | | Ratings (3) | | Value | |
| | | | Texas (continued) | | | | | | |
| $ | 200 | | Leander Independent School District, Williamson and Travis Counties, Texas, General Obligation Bonds, Series 2008, 0.000%, 8/15/41 | 8/17 at 24.20 | | AAA | $ | 47,340 | |
| | 4,800 | | Leander Independent School District, Williamson and Travis Counties, Texas, General Obligation Bonds, Series 2008, 0.000%, 8/15/41 (Pre-refunded 8/15/17) | 8/17 at 24.20 | | N/R (4) | | 1,145,280 | |
| | 2,255 | | Love Field Airport Modernization Corporation, Texas, Special Facilities Revenue Bonds, Southwest Airlines Company, Series 2010, 5.250%, 11/01/40 | 11/20 at 100.00 | | Baa1 | | 2,539,626 | |
| | 1,025 | | North Texas Tollway Authority, System Revenue Bonds, Refunding First Tier, Series 2015B, 5.000%, 1/01/40 | 1/23 at 100.00 | | A | | 1,169,546 | |
| | 5,000 | | Texas Municipal Gas Acquisition and Supply Corporation III, Gas Supply Revenue Bonds, Series 2012, 5.000%, 12/15/26 | No Opt. Call | | A3 | | 5,770,449 | |
| | 2,000 | | Wylie Independent School District, Collin County, Texas, General Obligation Bonds, School Building Series 2010, 0.000%, 8/15/31 | No Opt. Call | | AAA | | 1,055,100 | |
| | 40,825 | | Total Texas | | | | | 29,141,998 | |
| | | | Utah – 0.8% | | | | | | |
| | 5,465 | | Utah Transit Authority, Sales Tax Revenue Bonds, Series 2007A, 0.000%, 6/15/36 | 6/17 at 38.77 | | AA– | | 2,093,423 | |
| | | | Virginia – 2.2% | | | | | | |
| | 1,500 | | Metropolitan Washington Airports Authority, Virginia, Dulles Toll Road Second Senior Lien Revenue Bonds, Series 2009C, 0.000%, 10/01/41 – AGC Insured | 10/26 at 100.00 | | AA | | 1,919,355 | |
| | | | Virginia Small Business Financing Authority, Senior Lien Revenue Bonds, Elizabeth River Crossing, Opco LLC Project, Series 2012: | | | | | | |
| | 1,000 | | 5.250%, 1/01/32 (Alternative Minimum Tax) | 7/22 at 100.00 | | BBB– | | 1,117,640 | |
| | 500 | | 6.000%, 1/01/37 (Alternative Minimum Tax) | 7/22 at 100.00 | | BBB– | | 584,570 | |
| | 1,010 | | 5.500%, 1/01/42 (Alternative Minimum Tax) | 7/22 at 100.00 | | BBB– | | 1,127,261 | |
| | 1,000 | | Virginia Small Business Financing Authority, Wellmont Health System Project Revenue Bonds, Series 2007A, 5.250%, 9/01/37 | 9/17 at 100.00 | | BBB+ | | 1,039,800 | |
| | 5,010 | | Total Virginia | | | | | 5,788,626 | |
| | | | Washington – 3.2% | | | | | | |
| | 4,000 | | Washington Health Care Facilities Authority, Revenue Bonds, Catholic Health Initiative, Series 2013A, 5.750%, 1/01/45 | 1/23 at 100.00 | | A+ | | 4,741,240 | |
| | 990 | | Washington Health Care Facilities Authority, Revenue Bonds, Fred Hutchinson Cancer Research Center, Series 2011A, 5.625%, 1/01/35 | 1/21 at 100.00 | | A | | 1,110,958 | |
| | 2,500 | | Washington State, General Obligation Motor Vehicle Fuel Tax Bonds, Series 2008D, 5.000%, 1/01/33 (Pre-refunded 1/01/18) | 1/18 at 100.00 | | AA+ (4) | | 2,684,575 | |
| | 7,490 | | Total Washington | | | | | 8,536,773 | |
| | | | Wisconsin – 2.6% | | | | | | |
| | 2,000 | | Wisconsin Health and Educational Facilities Authority, Revenue Bonds, Gundersen Lutheran, Series 2011A, 5.250%, 10/15/39 | 10/21 at 100.00 | | A+ | | 2,271,740 | |
| | 1,645 | | Wisconsin Health and Educational Facilities Authority, Revenue Bonds, Mercy Alliance, Inc., Series 2012, 5.000%, 6/01/39 | 6/22 at 100.00 | | A2 | | 1,806,062 | |
| | 1,500 | | Wisconsin Health and Educational Facilities Authority, Revenue Bonds, Wheaton Franciscan Healthcare System, Series 2006A, 5.250%, 8/15/31 (Pre-refunded 8/15/16) | 8/16 at 100.00 | | N/R (4) | | 1,526,445 | |
| | 1,000 | | Wisconsin State, General Fund Annual Appropriation Revenue Bonds, Refunding Series 2009A, 6.000%, 5/01/36 | 5/19 at 100.00 | | AA– | | 1,146,520 | |
| | 6,145 | | Total Wisconsin | | | | | 6,750,767 | |
| $ | 317,155 | | Total Municipal Bonds (cost $230,651,468) | | | | | 258,389,596 | |
| NXQ | Nuveen Select Tax-Free Income Portfolio 2 | |
| | Portfolio of Investments (continued) | March 31, 2016 |
| | Principal Amount (000) | | Description (1) | Coupon | | Maturity | | Ratings (3) | | Value | |
| | | | CORPORATE BONDS – 0.0% | | | | | | | | |
| | | | Transportation – 0.0% | | | | | | | | |
| $ | 328 | | Las Vegas Monorail Company, Senior Interest Bonds (7), (8) | 5.500% | | 7/15/19 | | N/R | $ | 9,848 | |
| | 88 | | Las Vegas Monorail Company, Senior Interest Bonds (7), (8) | 5.500% | | 7/15/55 | | N/R | | 2,620 | |
| $ | 416 | | Total Corporate Bonds (cost $37,260) | | | | | | | 12,468 | |
| | | | Total Long-Term Investments (cost $230,688,728) | | | | | | | 258,402,064 | |
| | | | Other Assets Less Liabilities – 1.9% | | | | | | | 5,128,006 | |
| | | | Net Assets – 100% | | | | | | $ | 263,530,070 | |
| (1) | All percentages shown in the Portfolio of Investments are based on net assets. |
| (2) | Optional Call Provisions (not covered by the report of independent registered public accounting firm): Dates (month and year) and prices of the earliest optional call or redemption. There may be other call provisions at varying prices at later dates. Certain mortgage-backed securities may be subject to periodic principal paydowns. |
| (3) | Ratings (not covered by the report of independent registered public accounting firm): Using the highest of Standard & Poor's Group ("Standard & Poor's"), Moody's Investors Service, Inc. ("Moody's") or Fitch, Inc. ("Fitch") rating. Ratings below BBB by Standard & Poor's, Baa by Moody's or BBB by Fitch are considered to be below investment grade. Holdings designated N/R are not rated by any of these national rating agencies. |
| (4) | Backed by an escrow or trust containing sufficient U.S. Government or U.S. Government agency securities, which ensure the timely payment of principal and interest. Certain bonds backed by U.S. Government or agency securities are regarded as having an implied rating equal to the rating of such securities. |
| (5) | Investment, or portion of investment, has been pledged to collateralize the net payment obligations for investments in inverse floating rate transactions. |
| (6) | Step-up coupon. The rate shown is the coupon as of the end of the reporting period. |
| (7) | Investment valued at fair value using methods determined in good faith by, or at the discretion of, the Board. For fair value measurement disclosure purposes, investment classified as Level 3. See Notes to Financial Statements, Note 2 – Investment Valuation and Fair Value Measurements for more information. |
| (8) | During January 2010, Las Vegas Monorail Company ("Las Vegas Monorail") filed for federal bankruptcy protection. During March 2012, Las Vegas Monorail emerged from federal bankruptcy with the acceptance of a reorganization plan assigned by the Federal Bankruptcy Court. Under the reorganization plan, the Fund surrendered its Las Vegas Monorail Project Revenue Bonds, First Tier, Series 2000 and in turn received two senior interest corporate bonds: the first with an annual coupon rate of 5.500% maturing on July 15, 2019 and the second with an annual coupon rate of 3.000% (5.500% after December 31, 2015) maturing on July 15, 2055. The Fund is not accruing income for either senior interest corporate bond. |
| (ETM) | Escrowed to maturity. |
| (IF) | Inverse floating rate investment. |
See accompanying notes to financial statements.
| NXR | | |
| | Nuveen Select Tax-Free Income Portfolio 3 | |
| | Portfolio of Investments | March 31, 2016 |
| | Principal | | | Optional Call | | | | | |
| | Amount (000) | | Description (1) | Provisions (2) | | Ratings (3) | | Value | |
| | | | LONG-TERM INVESTMENTS – 97.9% | | | | | | |
| | | | MUNICIPAL BONDS – 97.9% | | | | | | |
| | | | Alaska – 1.2% | | | | | | |
| $ | 2,675 | | Northern Tobacco Securitization Corporation, Alaska, Tobacco Settlement Asset-Backed Bonds, Series 2006A, 5.000%, 6/01/32 | 6/16 at 100.00 | | B3 | $ | 2,494,759 | |
| | | | California – 20.9% | | | | | | |
| | 12,500 | | Anaheim Public Financing Authority, California, Lease Revenue Bonds, Public Improvement Project, Series 1997C, 0.000%, 9/01/35 – AGM Insured | No Opt. Call | | AA | | 6,222,499 | |
| | 1,000 | | California County Tobacco Securitization Agency, Tobacco Settlement Asset-Backed Bonds, Los Angeles County Securitization Corporation, Series 2006A, 5.600%, 6/01/36 | 12/18 at 100.00 | | B | | 1,005,320 | |
| | 1,125 | | California County Tobacco Securitization Agency, Tobacco Settlement Asset-Backed Bonds, Sonoma County Tobacco Securitization Corporation, Series 2005, 5.000%, 6/01/26 | 6/16 at 100.00 | | B– | | 1,125,045 | |
| | 890 | | California Statewide Community Development Authority, Revenue Bonds, Methodist Hospital Project, Series 2009, 6.750%, 2/01/38 (Pre-refunded 8/01/19) | 8/19 at 100.00 | | N/R (4) | | 1,064,476 | |
| | 250 | | California Statewide Financing Authority, Tobacco Settlement Asset-Backed Bonds, Pooled Tobacco Securitization Program, Series 2002A, 5.625%, 5/01/29 | 6/16 at 100.00 | | BBB+ | | 254,178 | |
| | 2,275 | | Folsom Cordova Unified School District, Sacramento County, California, General Obligation Bonds, School Facilities Improvement District 4, Series 2007A, 0.000%, 10/01/28 – NPFG Insured | No Opt. Call | | AA– | | 1,520,906 | |
| | 3,370 | | Golden State Tobacco Securitization Corporation, California, Enhanced Tobacco Settlement Asset-Backed Revenue Bonds, Series 2005A, 0.000%, 6/01/28 – AMBAC Insured | No Opt. Call | | A+ | | 2,394,823 | |
| | | | Golden State Tobacco Securitization Corporation, California, Tobacco Settlement Asset-Backed Bonds, Series 2007A-1: | | | | | | |
| | 700 | | 4.500%, 6/01/27 | 6/17 at 100.00 | | B+ | | 708,624 | |
| | 2,090 | | 5.000%, 6/01/33 | 6/17 at 100.00 | | B– | | 2,059,800 | |
| | 4,055 | | Kern Community College District, California, General Obligation Bonds, Series 2003A, 0.000%, 3/01/28 – FGIC Insured | No Opt. Call | | Aa2 | | 2,880,713 | |
| | 1,160 | | Mount San Antonio Community College District, Los Angeles County, California, General Obligation Bonds, Election of 2008, Series 2013A, 0.000%, 8/01/43 (6) | 8/35 at 100.00 | | AA | | 893,954 | |
| | 11,985 | | Norwalk La Mirada Unified School District, Los Angeles County, California, General Obligation Bonds, Election of 2002, Series 2007C, 0.000%, 8/01/32 – AGM Insured | No Opt. Call | | AA | | 6,849,424 | |
| | 3,000 | | Palomar Pomerado Health, California, General Obligation Bonds, Capital Appreciation, Election of 2004, Series 2007A, 0.000%, 8/01/25 – NPFG Insured | No Opt. Call | | AA– | | 2,287,980 | |
| | 8,040 | | Placentia-Yorba Linda Unified School District, Orange County, California, Certificates of Participation, Series 2006, 0.000%, 10/01/34 – NPFG Insured (ETM) | No Opt. Call | | AA– (4) | | 5,072,757 | |
| | 1,500 | | Placer Union High School District, Placer County, California, General Obligation Bonds, Series 2004C, 0.000%, 8/01/32 – AGM Insured | No Opt. Call | | AA | | 864,150 | |
| | 8,000 | | Poway Unified School District, San Diego County, California, General Obligation Bonds, School Facilities Improvement District 2007-1, Election 2008 Series 2009A, 0.000%, 8/01/32 | No Opt. Call | | AA– | | 4,852,080 | |
| | 3,940 | | Rancho Mirage Redevelopment Agency, California, Tax Allocation Bonds, Combined Whitewater and 1984 Project Areas, Series 2003A, 0.000%, 4/01/35 – NPFG Insured | No Opt. Call | | AA– | | 1,868,624 | |
| | 1,030 | | Riverside Public Financing Authority, California, Tax Allocation Bonds, University Corridor, Series 2007C, 5.000%, 8/01/37 – NPFG Insured | 8/17 at 100.00 | | AA– | | 1,071,921 | |
| | 66,910 | | Total California | | | | | 42,997,274 | |
| | | | Colorado – 5.8% | | | | | | |
| | 1,540 | | Arkansas River Power Authority, Colorado, Power Revenue Bonds, Series 2006, 5.250%, 10/01/40 – SYNCORA GTY Insured | 10/16 at 100.00 | | BBB– | | 1,558,526 | |
| | 2,000 | | Colorado Health Facilities Authority, Colorado, Revenue Bonds, Sisters of Charity of Leavenworth Health Services Corporation, Series 2010A, 5.000%, 1/01/40 | 1/20 at 100.00 | | AA– | | 2,214,900 | |
| NXR | Nuveen Select Tax-Free Income Portfolio 3 | |
| | Portfolio of Investments (continued) | March 31, 2016 |
| | Principal | | | Optional Call | | | | | |
| | Amount (000) | | Description (1) | Provisions (2) | | Ratings (3) | | Value | |
| | | | Colorado (continued) | | | | | | |
| $ | 1,000 | | Colorado Health Facilities Authority, Colorado, Revenue Bonds, Valley View Hospital Association, Series 2007, 5.250%, 5/15/42 | 5/17 at 100.00 | | A– | $ | 1,037,970 | |
| | 1,935 | | Denver City and County, Colorado, Airport System Revenue Bonds, Subordinate Lien Series 2013B, 5.000%, 11/15/43 | 11/23 at 100.00 | | A | | 2,201,121 | |
| | 1,295 | | E-470 Public Highway Authority, Colorado, Senior Revenue Bonds, Series 2000B, 0.000%, 9/01/32 – NPFG Insured | No Opt. Call | | AA– | | 734,407 | |
| | 5,520 | | E-470 Public Highway Authority, Colorado, Toll Revenue Bonds, Series 2004B, 0.000%, 9/01/28 – NPFG Insured | 9/20 at 63.98 | | AA– | | 3,036,938 | |
| | 1,000 | | Park Creek Metropolitan District, Colorado, Senior Limited Property Tax Supported Revenue Bonds, Refunding Series 2015A, 5.000%, 12/01/33 | 12/25 at 100.00 | | BBB | | 1,153,100 | |
| | 14,290 | | Total Colorado | | | | | 11,936,962 | |
| | | | Connecticut – 0.6% | | | | | | |
| | 1,250 | | Connecticut Health and Educational Facilities Authority, Revenue Bonds, Yale University, Series 2007Z-1, 5.000%, 7/01/42 | 7/16 at 100.00 | | AAA | | 1,263,763 | |
| | | | District of Columbia – 0.0% | | | | | | |
| | 80 | | District of Columbia Tobacco Settlement Corporation, Tobacco Settlement Asset-Backed Bonds, Series 2001, 6.250%, 5/15/24 | 5/16 at 100.00 | | A1 | | 80,327 | |
| | | | Florida – 6.4% | | | | | | |
| | 1,000 | | Broward County, Florida, Professional Sports Facilities Tax and Revenue Bonds, Broward County Civic Arena Project, Refunding Series 2006A, 5.000%, 9/01/28 – AMBAC Insured | No Opt. Call | | AA | | 1,016,690 | |
| | 3,110 | | Florida State Board of Education, Public Education Capital Outlay Bonds, Refunding Series 2014C, 4.000%, 6/01/16 | No Opt. Call | | AAA | | 3,129,282 | |
| | 1,825 | | Florida State Turnpike Authority, Turnpike Revenue Bonds, Department of Transportation, Series 2010B, 5.000%, 7/01/16 | No Opt. Call | | AA | | 1,846,042 | |
| | 1,000 | | Hillsborough County Industrial Development Authority, Florida, Hospital Revenue Bonds, Tampa General Hospital, Series 2006, 5.250%, 10/01/41 | 10/16 at 100.00 | | A | | 1,016,090 | |
| | 2,500 | | JEA St. Johns River Power Park System, Florida, Revenue Bonds, 2012-Issue 2 Series 25, 5.000%, 10/01/16 | No Opt. Call | | Aa2 | | 2,557,125 | |
| | 3,400 | | Miami-Dade County, Florida, Special Obligation Bonds, Capital Asset Acquisition, Series 2007A, 5.000%, 4/01/23 – AMBAC Insured | 4/17 at 100.00 | | AA– | | 3,544,228 | |
| | 12,835 | | Total Florida | | | | | 13,109,457 | |
| | | | Georgia – 0.5% | | | | | | |
| | 1,020 | | Private Colleges and Universities Authority, Georgia, Revenue Bonds, Emory University, Refunding Series 2005A, 5.000%, 9/01/18 | No Opt. Call | | AA+ | | 1,024,070 | |
| | | | Illinois – 13.0% | | | | | | |
| | 3,900 | | Chicago Board of Education, Illinois, General Obligation Bonds, Series 1999A, 0.000%, 12/01/28 – FGIC Insured | No Opt. Call | | AA– | | 2,022,306 | |
| | 1,100 | | Chicago, Illinois, General Airport Revenue Bonds, O'Hare International Airport, Third Lien | 1/17 at 100.00 | | AA | | 1,135,651 | |
| | | | Series 2008B, 5.000%, 1/01/20 – AGM Insured | | | | | | |
| | 2,000 | | Chicago, Illinois, General Obligation Bonds, Project & Refunding Series 2006A, 4.625%, 1/01/31 – AGM Insured | 6/16 at 100.00 | | AA | | 2,002,020 | |
| | 260 | | Illinois Finance Authority, Revenue Bonds, Rehabilitation Institute of Chicago, Series 2013A, 6.000%, 7/01/43 | 7/23 at 100.00 | | A– | | 311,126 | |
| | 1,600 | | Illinois Finance Authority, Revenue Bonds, Resurrection Health Care System, Series 1999B, 5.000%, 5/15/24 – AGM Insured | 5/18 at 100.00 | | AA | | 1,719,280 | |
| | 1,050 | | Illinois Finance Authority, Revenue Bonds, University of Chicago, Tender Option Bond Trust 2015-XF0248, 9.104%, 7/01/46 (Pre-refunded 7/01/17) (IF) (5) | 7/17 at 100.00 | | AA+ (4) | | 1,163,390 | |
| | 1,500 | | Illinois Finance Authority, Revenue Refunding Bonds, Silver Cross Hospital and Medical Centers, Series 2008A, 5.500%, 8/15/30 | 8/18 at 100.00 | | BBB+ | | 1,592,460 | |
| | Principal | | | Optional Call | | | | | | |
| | Amount (000) | | Description (1) | Provisions (2) | | Ratings (3) | | | Value | |
| | | | Illinois (continued) | | | | | | | |
| $ | 750 | | Illinois Finance Authority, Student Housing Revenue Bonds, Educational Advancement Fund Inc., University Center Project, Series 2006B, 5.000%, 5/01/25 | 11/16 at 100.00 | | BBB+ | | $ | 761,055 | |
| | 1,500 | | Illinois Health Facilities Authority, Revenue Bonds, Evangelical Hospitals Corporation, Series 1992C, 6.250%, 4/15/22 (ETM) | No Opt. Call | | N/R (4) | | | 1,781,865 | |
| | 2,190 | | Illinois State, General Obligation Bonds, Refunding Series 2012, 5.000%, 8/01/23 | No Opt. Call | | A– | | | 2,465,590 | |
| | 1,000 | | Kankakee & Will Counties Community Unit School District 5, Illinois, General Obligation Bonds, Series 2006, 0.000%, 5/01/23 – AGM Insured | No Opt. Call | | Aa3 | | | 818,660 | |
| | | | Metropolitan Pier and Exposition Authority, Illinois, Revenue Bonds, McCormick Place Expansion Project, Series 2002A: | | | | | | | |
| | 2,500 | | 0.000%, 12/15/30 – NPFG Insured | No Opt. Call | | AA– | | | 1,393,350 | |
| | 4,775 | | 0.000%, 12/15/31 – NPFG Insured | No Opt. Call | | AA– | | | 2,534,045 | |
| | 5,000 | | 0.000%, 12/15/36 – NPFG Insured | No Opt. Call | | AA– | | | 2,028,400 | |
| | 2,000 | | 0.000%, 6/15/37 – NPFG Insured | No Opt. Call | | AA– | | | 788,960 | |
| | 2,000 | | Springfield, Illinois, Electric Revenue Bonds, Senior Lien Series 2007, 5.000%, 3/01/22 (Pre-refunded 3/01/17) – NPFG Insured | 3/17 at 100.00 | | AA– (4) | | | 2,079,920 | |
| | 1,400 | | Springfield, Illinois, Electric Revenue Bonds, Senior Lien Series 2015, 5.000%, 3/01/28 | 3/25 at 100.00 | | A | | | 1,679,020 | |
| | 310 | | University of Illinois, Health Services Facilities System Revenue Bonds, Series 2013, 6.000%, 10/01/42 | 10/23 at 100.00 | | A | | | 359,960 | |
| | 34,835 | | Total Illinois | | | | | | 26,637,058 | |
| | | | Indiana – 3.0% | | | | | | | |
| | 5,000 | | Indiana Finance Authority, State Revolving Fund Program Bonds, Series 2007A, 4.000%, 2/01/27 (Pre-refunded 2/01/17) | 2/17 at 100.00 | | AAA | | | 5,142,249 | |
| | 270 | | Indiana Finance Authority, Tax-Exempt Private Activity Revenue Bonds, I-69 Section 5 Project, Series 2014, 5.250%, 9/01/34 (Alternative Minimum Tax) | 9/24 at 100.00 | | BBB | | | 309,477 | |
| | 1,000 | | Zionsville Community Schools Building Corporation, Indiana, First Mortgage Bonds, Series 2005Z, 0.000%, 7/15/28 – AGM Insured | No Opt. Call | | AA | | | 730,080 | |
| | 6,270 | | Total Indiana | | | | | | 6,181,806 | |
| | | | Iowa – 2.5% | | | | | | | |
| | 2,745 | | Iowa Finance Authority, Health Facility Revenue Bonds, Care Initiatives Project, Series 2006A, 5.000%, 7/01/20 | 7/16 at 100.00 | | BB+ | | | 2,762,156 | |
| | 1,330 | | Iowa Finance Authority, Iowa, Midwestern Disaster Area Revenue Bonds, Iowa Fertilizer Company Project, Series 2013, 5.000%, 12/01/19 | No Opt. Call | | BB– | | | 1,373,957 | |
| | 950 | | Iowa Tobacco Settlement Authority, Tobacco Asset-Backed Revenue Bonds, Series 2005B, 5.600%, 6/01/34 | 6/17 at 100.00 | | B+ | | | 951,938 | |
| | 5,025 | | Total Iowa | | | | | | 5,088,051 | |
| | | | Kansas – 1.0% | | | | | | | |
| | | | Lawrence, Kansas, Hospital Revenue Bonds, Lawrence Memorial Hospital, Refunding Series 2006: | | | | | | | |
| | 1,425 | | 5.125%, 7/01/26 | 7/16 at 100.00 | | A1 | | | 1,440,476 | |
| | 700 | | 4.875%, 7/01/36 | 7/16 at 100.00 | | A1 | | | 706,594 | |
| | 2,125 | | Total Kansas | | | | | | 2,147,070 | |
| | | | Louisiana – 1.0% | | | | | | | |
| | 2,000 | | Louisiana State, Gasoline and Fuels Tax Revenue Bonds, Series 2006A, 5.000%, 5/01/41 (Pre-refunded 5/01/16) – AGM Insured | 5/16 at 100.00 | | AA (4) | | | 2,007,260 | |
| | | | Maryland – 0.3% | | | | | | | |
| | 550 | | Baltimore, Maryland, Senior Lien Convention Center Hotel Revenue Bonds, Series 2006A, 5.250%, 9/01/23 – SYNCORA GTY Insured | 9/16 at 100.00 | | Ba1 | | | 557,453 | |
| | | | Michigan – 2.5% | | | | | | | |
| | 355 | | Detroit Water and Sewerage Department, Michigan, Sewage Disposal System Revenue Bonds, Refunding Senior Lien Series 2012A, 5.250%, 7/01/39 | 7/22 at 100.00 | | A– | | | 393,578 | |
| NXR | Nuveen Select Tax-Free Income Portfolio 3 | |
| | Portfolio of Investments (continued) | March 31, 2016 |
| | Principal | | | Optional Call | | | | | | |
| | Amount (000) | | Description (1) | Provisions (2) | | Ratings (3) | | | Value | |
| | | | Michigan (continued) | | | | | | | |
| $ | 3,635 | | Detroit, Michigan, Sewer Disposal System Revenue Bonds, Second Lien, Series 2006B, 4.625%, 7/01/34 – FGIC Insured | 7/16 at 100.00 | | AA– | | $ | 3,648,413 | |
| | 700 | | Detroit, Michigan, Water Supply System Second Lien Revenue Refunding Bonds, Series 2006C, 5.000%, 7/01/33 – AGM Insured | No Opt. Call | | AA | | | 704,151 | |
| | 250 | | Royal Oak Hospital Finance Authority, Michigan, Hospital Revenue Bonds, William Beaumont Hospital, Refunding Series 2009V, 8.250%, 9/01/39 (Pre-refunded 9/01/18) | 9/18 at 100.00 | | Aaa | | | 294,408 | |
| | 4,940 | | Total Michigan | | | | | | 5,040,550 | |
| | | | Minnesota – 1.5% | | | | | | | |
| | 3,040 | | Minnesota State, General Obligation Bonds, Various Purpose Series 2013A, 5.000%, 8/01/16 | No Opt. Call | | AA+ | | | 3,086,846 | |
| | | | Missouri – 0.1% | | | | | | | |
| | 270 | | Bi-State Development Agency of the Missouri-Illinois Metropolitan District, Mass Transit Sales Tax Appropriation Bonds, Refunding Combined Lien Series 2013A, 5.000%, 10/01/28 | 10/18 at 100.00 | | AA+ | | | 296,177 | |
| | | | Montana – 0.8% | | | | | | | |
| | 1,440 | | Montana Facilities Finance Authority, Revenue Bonds, Sisters of Charity of Leavenworth Health Services Corporation, Camposite Deal Series 2010A, 4.750%, 1/01/40 | 1/20 at 100.00 | | AA– | | | 1,556,309 | |
| | | | Nevada – 1.8% | | | | | | | |
| | 1,000 | | Clark County, Nevada, Passenger Facility Charge Revenue Bonds, Las Vegas-McCarran International Airport, Series 2010A, 5.250%, 7/01/42 | 1/20 at 100.00 | | A+ | | | 1,118,360 | |
| | 2,500 | | North Las Vegas, Nevada, General Obligation Bonds, Series 2006, 5.000%, 5/01/36 – NPFG Insured | 5/16 at 100.00 | | AA– | | | 2,499,900 | |
| | 3,500 | | Total Nevada | | | | | | 3,618,260 | |
| | | | New Jersey – 2.6% | | | | | | | |
| | 2,000 | | New Jersey Economic Development Authority, Revenue Bonds, Motor Vehicle Surcharge, Series 2004A, 5.000%, 7/01/34 – NPFG Insured | 6/16 at 100.00 | | AA– | | | 2,016,840 | |
| | 305 | | New Jersey Health Care Facilities Financing Authority, Revenue Bonds, University Hospital Issue, Refunding Series 2015A, 5.000%, 7/01/28 – AGM Insured | 7/25 at 100.00 | | AA | | | 359,607 | |
| | 4,900 | | New Jersey Transportation Trust Fund Authority, Transportation System Bonds, Refunding Series 2006C, 0.000%, 12/15/28 – AMBAC Insured | No Opt. Call | | A– | | | 2,972,193 | |
| | 7,205 | | Total New Jersey | | | | | | 5,348,640 | |
| | | | New Mexico – 0.5% | | | | | | | |
| | 1,000 | | New Mexico Mortgage Finance Authority, Multifamily Housing Revenue Bonds, St Anthony, Series 2007A, 5.250%, 9/01/42 (Alternative Minimum Tax) | 9/17 at 100.00 | | N/R | | | 1,013,230 | |
| | | | New York – 4.1% | | | | | | | |
| | 1,025 | | Dormitory Authority of the State of New York, FHA Insured Mortgage Hospital Revenue Bonds, Kaleida Health, Series 2006, 4.700%, 2/15/35 (Pre-refunded 8/15/16) | 8/16 at 100.00 | | N/R (4) | | | 1,041,308 | |
| | 2,625 | | Dormitory Authority of the State of New York, State Personal Income Tax Revenue Bonds, Education Series 2006D, 5.000%, 3/15/36 (Pre-refunded 9/15/16) | 9/16 at 100.00 | | N/R (4) | | | 2,679,311 | |
| | 300 | | Hudson Yards Infrastructure Corporation, New York, Revenue Bonds, Series 2006A, 4.500%, 2/15/47 – NPFG Insured | 2/17 at 100.00 | | AA– | | | 307,761 | |
| | 1,250 | | Metropolitan Transportation Authority, New York, Transportation Revenue Bonds, Refunding Series 2012F, 5.000%, 11/15/26 | 11/22 at 100.00 | | AA– | | | 1,514,500 | |
| | 840 | | New York City Transitional Finance Authority, New York, Future Tax Secured Bonds, Fiscal Series 2007B, 4.750%, 11/01/27 (5) | 5/17 at 100.00 | | AAA | | | 875,750 | |
| | 1,660 | | New York City Transitional Finance Authority, New York, Future Tax Secured Bonds, Fiscal Series 2007B, 4.750%, 11/01/27 (Pre-refunded 5/01/17) | 5/17 at 100.00 | | N/R (4) | | | 1,733,389 | |
| | 265 | | Port Authority of New York and New Jersey, Special Project Bonds, JFK International Air Terminal LLC Project, Eighth Series 2010, 6.000%, 12/01/42 | 12/20 at 100.00 | | Baa1 | | | 312,398 | |
| | 7,965 | | Total New York | | | | | | 8,464,417 | |
| | Principal | | | Optional Call | | | | | | |
| | Amount (000) | | Description (1) | Provisions (2) | | Ratings (3) | | | Value | |
| | | | Ohio – 4.1% | | | | | | | |
| | | | Buckeye Tobacco Settlement Financing Authority, Ohio, Tobacco Settlement Asset-Backed Revenue Bonds, Senior Lien, Series 2007A-2: | | | | | | | |
| $ | 1,345 | | 5.375%, 6/01/24 | 6/17 at 100.00 | | B– | | $ | 1,282,888 | |
| | 1,465 | | 6.000%, 6/01/42 | 6/17 at 100.00 | | B– | | | 1,396,965 | |
| | 435 | | 5.875%, 6/01/47 | 6/17 at 100.00 | | B– | | | 411,723 | |
| | 3,720 | | Buckeye Tobacco Settlement Financing Authority, Ohio, Tobacco Settlement Asset-Backed Revenue Bonds, Senior Lien, Series 2007A-3, 6.250%, 6/01/37 | 6/22 at 100.00 | | B– | | | 3,659,624 | |
| | 1,475 | | Ohio Turnpike Commission, Turnpike Revenue Bonds, Infrastructure Project, Junior Lien Series 2013A-1, 5.000%, 2/15/48 | 2/23 at 100.00 | | A+ | | | 1,664,361 | |
| | 8,440 | | Total Ohio | | | | | | 8,415,561 | |
| | | | Pennsylvania – 1.8% | | | | | | | |
| | 2,435 | | Dauphin County Industrial Development Authority, Pennsylvania, Water Development Revenue Refunding Bonds, Dauphin Consolidated Water Supply Company, Series 1992B, 6.700%, 6/01/17 | No Opt. Call | | A– | | | 2,577,374 | |
| | 1,000 | | Pennsylvania Turnpike Commission, Motor License Fund-Enhanced Subordinate Special Revenue Bonds, Series 2010B, 5.000%, 12/01/30 | 12/20 at 100.00 | | AA– | | | 1,124,410 | |
| | 3,435 | | Total Pennsylvania | | | | | | 3,701,784 | |
| | | | Puerto Rico – 2.1% | | | | | | | |
| | 945 | | Puerto Rico Highway and Transportation Authority, Highway Revenue Bonds, Series 2007N, 5.250%, 7/01/31 – AMBAC Insured | No Opt. Call | | CC | | | 925,032 | |
| | | | Puerto Rico Sales Tax Financing Corporation, Sales Tax Revenue Bonds, Series 2007A: | | | | | | | |
| | 1,170 | | 0.000%, 8/01/40 – NPFG Insured | No Opt. Call | | AA– | | | 245,384 | |
| | 12,000 | | 0.000%, 8/01/41 – NPFG Insured | No Opt. Call | | AA– | | | 2,360,880 | |
| | 9,015 | | 0.000%, 8/01/54 – AMBAC Insured | No Opt. Call | | Caa3 | | | 727,511 | |
| | 23,130 | | Total Puerto Rico | | | | | | 4,258,807 | |
| | | | South Dakota – 0.2% | | | | | | | |
| | 400 | | South Dakota Health and Educational Facilities Authority, Revenue Bonds, Sanford Health, Series 2015, 5.000%, 11/01/35 | 11/25 at 100.00 | | A+ | | | 461,328 | |
| | | | Tennessee – 0.4% | | | | | | | |
| | 795 | | Chattanooga Health, Educational and Housing Facility Board, Tennessee, Hospital Revenue Bonds, Catholic Health Initiatives, Series 2013A, 5.250%, 1/01/45 | 1/23 at 100.00 | | A+ | | | 895,504 | |
| | | | Texas – 10.1% | | | | | | | |
| | 250 | | Central Texas Regional Mobility Authority, Revenue Bonds, Senior Lien Series 2011, 6.000%, 1/01/41 | 1/21 at 100.00 | | BBB+ | | | 296,588 | |
| | 85 | | Central Texas Regional Mobility Authority, Revenue Bonds, Senior Lien, Series 2015A, 5.000%, 1/01/34 | 7/25 at 100.00 | | BBB+ | | | 97,898 | |
| | 2,500 | | Fort Worth Independent School District, Tarrant County, Texas, General Obligation Bonds, Refunding Series 2006, 5.000%, 2/15/18 | No Opt. Call | | AAA | | | 2,544,300 | |
| | 4,640 | | Grand Parkway Transportation Corporation, Texas, System Toll Revenue Bonds, First Tier Series 2013A, 5.500%, 4/01/53 | 10/23 at 100.00 | | BBB+ | | | 5,238,049 | |
| | | | Harris County-Houston Sports Authority, Texas, Revenue Bonds, Junior Lien Series 2001H: | | | | | | | |
| | 1,405 | | 0.000%, 11/15/32 – NPFG Insured | 11/31 at 94.05 | | AA– | | | 726,062 | |
| | 2,510 | | 0.000%, 11/15/36 – NPFG Insured | 11/31 at 73.51 | | AA– | | | 998,428 | |
| | 2,235 | | Harris County-Houston Sports Authority, Texas, Revenue Bonds, Third Lien Series 2004A-3, 0.000%, 11/15/32 – NPFG Insured | 11/24 at 62.70 | | AA– | | | 1,007,046 | |
| | | | Harris County-Houston Sports Authority, Texas, Special Revenue Bonds, Refunding Senior Lien Series 2001A: | | | | | | | |
| | 3,045 | | 0.000%, 11/15/34 – NPFG Insured | 11/30 at 78.27 | | AA | | | 1,444,274 | |
| | 4,095 | | 0.000%, 11/15/38 – NPFG Insured | 11/30 at 61.17 | | AA | | | 1,500,531 | |
| | 2,255 | | Love Field Airport Modernization Corporation, Texas, Special Facilities Revenue Bonds, Southwest Airlines Company, Series 2010, 5.250%, 11/01/40 | 11/20 at 100.00 | | Baa1 | | | 2,539,626 | |
| NXR | Nuveen Select Tax-Free Income Portfolio 3 | |
| | Portfolio of Investments (continued) | March 31, 2016 |
| | Principal | | | Optional Call | | | | | | |
| | Amount (000) | | Description (1) | Provisions (2) | | Ratings (3) | | | Value | |
| | | | Texas (continued) | | | | | | | |
| $ | 290 | | North Texas Tollway Authority, System Revenue Bonds, Refunding First Tier Capital Appreciation Series 2008I, 6.200%, 1/01/42 – AGC Insured | 1/25 at 100.00 | | AA | | $ | 370,803 | |
| | 2,000 | | Texas Municipal Gas Acquisition and Supply Corporation III, Gas Supply Revenue Bonds, Series 2012, 5.000%, 12/15/32 | No Opt. Call | | A3 | | | 2,233,520 | |
| | 2,410 | | Texas Turnpike Authority, Central Texas Turnpike System Revenue Bonds, First Tier Series 2002A, 0.000%, 8/15/25 – AMBAC Insured | No Opt. Call | | A– | | | 1,871,582 | |
| | 27,720 | | Total Texas | | | | | | 20,868,707 | |
| | | | Utah – 1.0% | | | | | | | |
| | 5,465 | | Utah Transit Authority, Sales Tax Revenue Bonds, Series 2007A, 0.000%, 6/15/36 | 6/17 at 38.77 | | AA– | | | 2,093,423 | |
| | | | Virginia – 3.2% | | | | | | | |
| | 3,500 | | Chesapeake, Virginia, Transportation System Senior Toll Road Revenue Bonds, Capital Appreciation Series 2012B, 0.000%, 7/15/32 (6) | 7/28 at 100.00 | | BBB | | | 2,792,405 | |
| | 1,500 | | Virginia Public Building Authority, Public Facilities Revenue Bonds, Series 2009B, 5.000%, 8/01/17 | No Opt. Call | | AA+ | | | 1,587,360 | |
| | | | Virginia Small Business Financing Authority, Senior Lien Revenue Bonds, Elizabeth River Crossing, Opco LLC Project, Series 2012: | | | | | | | |
| | 500 | | 6.000%, 1/01/37 (Alternative Minimum Tax) | 7/22 at 100.00 | | BBB– | | | 584,570 | |
| | 1,510 | | 5.500%, 1/01/42 (Alternative Minimum Tax) | 7/22 at 100.00 | | BBB– | | | 1,685,311 | |
| | 7,010 | | Total Virginia | | | | | | 6,649,646 | |
| | | | Washington – 3.8% | | | | | | | |
| | 2,035 | | Energy Northwest, Washington, Electric Revenue Bonds, Columbia Generating Station – Nuclear Project 2, Series 2006C, 5.000%, 7/01/24 (Pre-refunded 7/01/16) | 7/16 at 100.00 | | Aa1 (4) | | | 2,057,751 | |
| | 990 | | Washington Health Care Facilities Authority, Revenue Bonds, Fred Hutchinson Cancer Research Center, Series 2011A, 5.625%, 1/01/35 | 1/21 at 100.00 | | A | | | 1,110,958 | |
| | 4,000 | | Washington Health Care Facilities Authority, Revenue Bonds, Providence Health & Services, Series 2012A, 5.000%, 10/01/32 | 10/22 at 100.00 | | AA | | | 4,669,640 | |
| | 7,025 | | Total Washington | | | | | | 7,838,349 | |
| | | | Wisconsin – 1.1% | | | | | | | |
| | 1,250 | | Wisconsin Health and Educational Facilities Authority, Revenue Bonds, Marshfield Clinic, Series 2012B, 5.000%, 2/15/32 | 2/22 at 100.00 | | A– | | | 1,412,725 | |
| | 770 | | Wisconsin, General Obligation Refunding Bonds, Series 2003-3, 5.000%, 11/01/26 | 6/16 at 100.00 | | AA | | | 773,065 | |
| | 2,020 | | Total Wisconsin | | | | | | 2,185,790 | |
| $ | 264,665 | | Total Municipal Bonds (cost $172,696,481) | | | | | | 201,318,638 | |
| | Principal | | | | | | | | | | | |
| | Amount (000) | | Description (1) | Coupon | | Maturity | | Ratings (3) | | | Value | |
| | | | CORPORATE BONDS – 0.0% | | | | | | | | | |
| | | | Transportation – 0.0% | | | | | | | | | |
| $ | 92 | | Las Vegas Monorail Company, Senior Interest Bonds (7), (8) | 5.500% | | 7/15/19 | | N/R | | $ | 2,775 | |
| | 25 | | Las Vegas Monorail Company, Senior Interest Bonds (7), (8) | 5.500% | | 7/15/55 | | N/R | | | 738 | |
| $ | 117 | | Total Corporate Bonds (cost $10,497) | | | | | | | | 3,513 | |
| | | | Total Long-Term Investments (cost $172,706,978) | | | | | | | | 201,322,151 | |
| | | | Other Assets Less Liabilities – 2.1% (9) | | | | | | | | 4,272,763 | |
| | | | Net Assets – 100% | | | | | | | $ | 205,594,914 | |
Investments in Derivatives as of March 31, 2016
Interest Rate Swaps outstanding:
| | | | | Fund | | | | | | Fixed Rate | | | | | | Unrealized | |
| | | Notional | | Pay/Receive | | Floating Rate | | Fixed Rate | | Payment | | Effective | | Termination | | Appreciation | |
| Counterparty | | Amount | | Floating Rate | | Index | | (Annualized) | | Frequency | | Date (10) | | Date | | (Depreciation) | |
| JPMorgan Chase Bank, N.A. | | $5,000,000 | | Receive | | USD-BMA | | 1.940 | % | Quarterly | | 6/29/16 | | 6/29/26 | | $(299,545) | |
| (1) | All percentages shown in the Portfolio of Investments are based on net assets. |
| (2) | Optional Call Provisions (not covered by the report of independent registered public accounting firm): Dates (month and year) and prices of the earliest optional call or redemption. There may be other call provisions at varying prices at later dates. Certain mortgage-backed securities may be subject to periodic principal paydowns. |
| (3) | Ratings (not covered by the report of independent registered public accounting firm): Using the highest of Standard & Poor's Group ("Standard & Poor's"), Moody's Investors Service, Inc. ("Moody's") or Fitch, Inc. ("Fitch") rating. Ratings below BBB by Standard & Poor's, Baa by Moody's or BBB by Fitch are considered to be below investment grade. Holdings designated N/R are not rated by any of these national rating agencies. |
| (4) | Backed by an escrow or trust containing sufficient U.S. Government or U.S. Government agency securities, which ensure the timely payment of principal and interest. Certain bonds backed by U.S. Government or agency securities are regarded as having an implied rating equal to the rating of such securities. |
| (5) | Investment, or portion of investment, has been pledged to collateralize the net payment obligations for investments in derivatives and/or inverse floating rate transactions. |
| (6) | Step-up coupon. The rate shown is the coupon as of the end of the reporting period. |
| (7) | Investment valued at fair value using methods determined in good faith by, or at the discretion of, the Board. For fair value measurement disclosure purposes, investment classified as Level 3. See Notes to Financial Statements, Note 2 – Investment Valuation and Fair Value Measurements for more information. |
| (8) | During January 2010, Las Vegas Monorail Company ("Las Vegas Monorail") filed for federal bankruptcy protection. During March 2012, Las Vegas Monorail emerged from federal bankruptcy with the acceptance of a reorganization plan assigned by the Federal Bankruptcy Court. Under the reorganization plan, the Fund surrendered its Las Vegas Monorail Project Revenue Bonds, First Tier, Series 2000 and in turn received two senior interest corporate bonds: the first with an annual coupon rate of 5.500% maturing on July 15, 2019 and the second with an annual coupon rate of 3.000% (5.500% after December 31, 2015) maturing on July 15, 2055. The Fund is not accruing income for either senior interest corporate bond. |
| (9) | Other assets less liabilities includes the unrealized appreciation (depreciation) of certain over-the-counter derivatives as presented on the Statement of Assets and Liabilities. The unrealized appreciation (depreciation) of exchange-cleared and exchange-traded derivatives is recognized as part of the cash collateral at brokers and/or the receivable or payable for variation margin as presented on the Statement of Assets and Liabilities, when applicable. |
| (10) | Effective date represents the date on which both the Fund and counterparty commence interest payment accruals on each contract. |
| (ETM) | Escrowed to maturity. |
| (IF) | Inverse floating rate investment. |
| USD-BMA | United States Dollar-Bond Market Association |
See accompanying notes to financial statements.
| NXC | | |
| | Nuveen California Select Tax-Free Income Portfolio | |
| | Portfolio of Investments | March 31, 2016 |
| | Principal | | | Optional Call | | | | | | |
| | Amount (000) | | Description (1) | Provisions (2) | | Ratings (3) | | | Value | |
| | | | LONG-TERM INVESTMENTS – 98.7% | | | | | | | |
| | | | MUNICIPAL BONDS – 98.7% | | | | | | | |
| | | | Consumer Staples – 4.3% | | | | | | | |
| $ | 75 | | California County Tobacco Securitization Agency, Tobacco Settlement Asset-Backed Bonds, Sonoma County Tobacco Securitization Corporation, Series 2005, 4.250%, 6/01/21 | 6/16 at 100.00 | | BBB+ | | $ | 75,017 | |
| | 185 | | California County Tobacco Securitization Agency, Tobacco Settlement Asset-Backed Revenue Bonds, Fresno County Tobacco Funding Corporation, Series 2002, 5.625%, 6/01/23 | 5/16 at 100.00 | | Aa1 | | | 185,078 | |
| | 1,450 | | Golden State Tobacco Securitization Corporation, California, Tobacco Settlement Asset-Backed Bonds, Series 2007A-1, 5.000%, 6/01/33 | 6/17 at 100.00 | | B– | | | 1,429,048 | |
| | 1,095 | | Golden State Tobacco Securitization Corporation, California, Tobacco Settlement Asset-Backed Bonds, Series 2007A-2, 5.300%, 6/01/37 | 6/22 at 100.00 | | B– | | | 1,092,295 | |
| | 1,500 | | Tobacco Securitization Authority of Northern California, Tobacco Settlement Asset-Backed Bonds, Series 2005A-1, 5.500%, 6/01/45 | 6/16 at 100.00 | | B– | | | 1,497,705 | |
| | 4,305 | | Total Consumer Staples | | | | | | 4,279,143 | |
| | | | Education and Civic Organizations – 3.1% | | | | | | | |
| | 195 | | California Educational Facilities Authority, Revenue Bonds, Santa Clara University, Series 2008A, 5.625%, 4/01/37 | 4/18 at 100.00 | | Aa3 | | | 212,306 | |
| | 160 | | California Municipal Finance Authority, Charter School Revenue Bonds, Rocketship Education Multiple Projects, Series 2014A , 7.250%, 6/01/43 | 6/22 at 102.00 | | N/R | | | 187,112 | |
| | 2,000 | | California State University, Systemwide Revenue Bonds, Series 2015A, 5.000%, 11/01/38 | 11/25 at 100.00 | | Aa2 | | | 2,386,100 | |
| | 250 | | California Statewide Communities Development Authority, School Facility Revenue Bonds, Alliance College-Ready Public Schools, Series 2011A, 7.000%, 7/01/46 | 7/21 at 100.00 | | BBB– | | | 282,448 | |
| | 2,605 | | Total Education and Civic Organizations | | | | | | 3,067,966 | |
| | | | Health Care – 5.4% | | | | | | | |
| | 115 | | California Health Facilities Financing Authority, Revenue Bonds, Lucile Salter Packard Children's Hospital, Series 2014A, 5.000%, 8/15/43 | 8/24 at 100.00 | | AA | | | 132,926 | |
| | 125 | | California Health Facilities Financing Authority, Revenue Bonds, Providence Health & Services, Series 2014A, 5.000%, 10/01/38 | 10/24 at 100.00 | | AA | | | 146,189 | |
| | 255 | | California Health Facilities Financing Authority, Revenue Bonds, Providence Health & Services, Series 2014B, 5.000%, 10/01/44 | 10/24 at 100.00 | | AA | | | 294,048 | |
| | 235 | | California Health Facilities Financing Authority, Revenue Bonds, Rady Children's Hospital – San Diego, Series 2011, 5.250%, 8/15/41 | 8/21 at 100.00 | | Aa3 | | | 264,711 | |
| | 425 | | California Statewide Community Development Authority, Revenue Bonds, Children's Hospital of Los Angeles, Series 2007, 5.000%, 8/15/47 | 8/17 at 100.00 | | BBB+ | | | 439,531 | |
| | 545 | | California Statewide Community Development Authority, Revenue Bonds, Kaiser Permanente System, Series 2001C, 5.250%, 8/01/31 | 8/16 at 100.00 | | A+ | | | 552,238 | |
| | 500 | | Palomar Pomerado Health Care District, California, Certificates of Participation, Series 2009, 6.625%, 11/01/29 | 11/19 at 100.00 | | Ba1 | | | 558,875 | |
| | 1,100 | | Palomar Pomerado Health Care District, California, Certificates of Participation, Series 2010, 6.000%, 11/01/41 | 11/20 at 100.00 | | Ba1 | | | 1,175,581 | |
| | 670 | | San Buenaventura, California, Revenue Bonds, Community Memorial Health System, Series 2011, 7.500%, 12/01/41 | 12/21 at 100.00 | | BB+ | | | 822,673 | |
| | 800 | | Upland, California, Certificates of Participation, San Antonio Community Hospital, Series 2011, 6.500%, 1/01/41 | 1/21 at 100.00 | | A– | | | 930,944 | |
| | 4,770 | | Total Health Care | | | | | | 5,317,716 | |
| | Principal | | | Optional Call | | | | | | |
| | Amount (000) | | Description (1) | Provisions (2) | | Ratings (3) | | | Value | |
| | | | Housing/Multifamily – 1.0% | | | | | | | |
| $ | 365 | | California Municipal Finance Authority, Mobile Home Park Revenue Bonds, Caritas Projects Series 2010A, 6.400%, 8/15/45 | 8/20 at 100.00 | | BBB | | $ | 404,117 | |
| | 395 | | California Municipal Finance Authority, Mobile Home Park Revenue Bonds, Caritas Projects Series 2012A, 5.500%, 8/15/47 | 8/22 at 100.00 | | BBB | | | 444,557 | |
| | | | California Municipal Finance Authority, Mobile Home Park Senior Revenue Bonds, Caritas Affordable Housing, Inc. Projects, Series 2014A: | | | | | | | |
| | 25 | | 5.250%, 8/15/39 | 8/24 at 100.00 | | BBB | | | 28,364 | |
| | 65 | | 5.250%, 8/15/49 | 8/24 at 100.00 | | BBB | | | 73,457 | |
| | 850 | | Total Housing/Multifamily | | | | | | 950,495 | |
| | | | Industrials – 1.1% | | | | | | | |
| | 1,015 | | California Pollution Control Financing Authority, Solid Waste Disposal Revenue Bonds, Republic Services Inc., Series 2002C, 5.250%, 6/01/23 (Mandatory put 12/01/17) (Alternative Minimum Tax) | No Opt. Call | | BBB+ | | | 1,069,759 | |
| | | | Tax Obligation/General – 33.7% | | | | | | | |
| | 1,000 | | California State, General Obligation Bonds, Various Purpose Refunding Series 2015, 5.000%, 8/01/34 | 8/25 at 100.00 | | AA– | | | 1,205,080 | |
| | 1,650 | | California State, General Obligation Bonds, Various Purpose Series 2009, 5.500%, 11/01/39 | 11/19 at 100.00 | | AA– | | | 1,901,873 | |
| | 1,965 | | California State, General Obligation Bonds, Various Purpose Series 2011, 5.000%, 10/01/41 | 10/21 at 100.00 | | AA– | | | 2,285,040 | |
| | 2,000 | | California State, General Obligation Bonds, Various Purpose Series 2012, 5.250%, 4/01/35 | 4/22 at 100.00 | | AA– | | | 2,374,500 | |
| | | | Golden West Schools Financing Authority, California, General Obligation Revenue Refunding Bonds, School District Program, Series 1999A: | | | | | | | |
| | 3,650 | | 0.000%, 8/01/16 – NPFG Insured | No Opt. Call | | AA– | | | 3,639,597 | |
| | 1,750 | | 0.000%, 2/01/17 – NPFG Insured | No Opt. Call | | AA– | | | 1,727,460 | |
| | 2,375 | | 0.000%, 8/01/17 – NPFG Insured | No Opt. Call | | AA– | | | 2,323,320 | |
| | 2,345 | | 0.000%, 2/01/18 – NPFG Insured | No Opt. Call | | AA– | | | 2,262,292 | |
| | | | Mountain View-Los Altos Union High School District, Santa Clara County, California, General Obligation Bonds, Capital Appreciation Series 1997C: | | | | | | | |
| | 1,015 | | 0.000%, 5/01/17 – NPFG Insured | No Opt. Call | | Aaa | | | 1,006,647 | |
| | 1,080 | | 0.000%, 5/01/18 – NPFG Insured | No Opt. Call | | Aaa | | | 1,056,294 | |
| | | | Palomar Pomerado Health, California, General Obligation Bonds, Convertible Capital Appreciation, Election 2004 Series 2010A: | | | | | | | |
| | 10,825 | | 0.000%, 8/01/34 | No Opt. Call | | A+ | | | 5,239,189 | |
| | 2,250 | | 0.000%, 8/01/35 | No Opt. Call | | A+ | | | 1,043,303 | |
| | 8,075 | | San Bernardino Community College District, California, General Obligation Bonds, Election of 2008 Series 2009B, 0.000%, 8/01/44 | No Opt. Call | | Aa2 | | | 2,610,890 | |
| | 1,000 | | San Diego Unified School District, San Diego County, California, General Obligation Bonds, Dedicated Unlimited Ad Valorem Property Tax, 2012 Election Series 2016F, 5.000%, 7/01/40 | 7/25 at 100.00 | | AAA | | | 1,193,430 | |
| | 4,250 | | West Hills Community College District, California, General Obligation Bonds, School Facilities Improvement District 3, 2008 Election Series 2011, 0.000%, 8/01/38 – AGM Insured (4) | 8/31 at 100.00 | | AA | | | 3,340,542 | |
| | 45,230 | | Total Tax Obligation/General | | | | | | 33,209,457 | |
| | | | Tax Obligation/Limited – 19.4% | | | | | | | |
| | 1,000 | | Bell Community Redevelopment Agency, California, Tax Allocation Bonds, Bell Project Area, Series 2003, 5.625%, 10/01/33 – RAAI Insured | 6/16 at 100.00 | | AA | | | 1,000,660 | |
| | 2,000 | | California State Public Works Board, Lease Revenue Bonds, Department of Corrections & Rehabilitation, Various Correctional Facilities Series 2013F, 5.250%, 9/01/33 | 9/23 at 100.00 | | A+ | | | 2,425,960 | |
| | 1,500 | | California State Public Works Board, Lease Revenue Bonds, Various Capital Projects, Series 2009-I, 6.375%, 11/01/34 | 11/19 at 100.00 | | A+ | | | 1,790,670 | |
| | 360 | | Chino Redevelopment Agency, California, Merged Chino Redevelopment Project Area Tax Allocation Bonds, Series 2006, 5.000%, 9/01/38 – AMBAC Insured | 9/16 at 101.00 | | A | | | 369,004 | |
| | 1,000 | | Fontana Public Financing Authority, California, Tax Allocation Revenue Bonds, North Fontana Redevelopment Project, Series 2005A, 5.000%, 10/01/32 – AMBAC Insured | 6/16 at 100.00 | | A | | | 1,003,120 | |
| NXC | Nuveen California Select Tax-Free Income Portfolio | |
| | Portfolio of Investments (continued) | March 31, 2016 |
| | Principal | | | Optional Call | | | | | | |
| | Amount (000) | | Description (1) | Provisions (2) | | Ratings (3) | | | Value | |
| | | | Tax Obligation/Limited (continued) | | | | | | | |
| $ | 270 | | Fontana Redevelopment Agency, San Bernardino County, California, Tax Allocation Bonds, Jurupa Hills Redevelopment Project, Refunding Series 1997A, 5.500%, 10/01/27 | 10/16 at 100.00 | | A | | $ | 276,380 | |
| | 3,000 | | Golden State Tobacco Securitization Corporation, California, Enhanced Tobacco Settlement Asset-Backed Revenue Bonds, Series 2015A, 5.000%, 6/01/40 | 6/25 at 100.00 | | A+ | | | 3,493,319 | |
| | 250 | | Inglewood Redevelopment Agency, California, Tax Allocation Bonds, Merged Redevelopment Project, Subordinate Lien Series 2007A-1, 5.000%, 5/01/23 – AMBAC Insured | 5/17 at 100.00 | | BBB+ | | | 257,043 | |
| | | | Irvine Unified School District, California, Special Tax Bonds, Community Facilities District Series 2006A: | | | | | | | |
| | 55 | | 5.000%, 9/01/26 | 9/16 at 100.00 | | N/R | | | 55,805 | |
| | 130 | | 5.125%, 9/01/36 | 9/16 at 100.00 | | N/R | | | 131,581 | |
| | 1,215 | | Los Angeles Community Redevelopment Agency, California, Lease Revenue Bonds, Manchester Social Services Project, Series 2005, 5.000%, 9/01/37 – AMBAC Insured | 6/16 at 100.00 | | A1 | | | 1,219,180 | |
| | 135 | | National City Community Development Commission, California, Tax Allocation Bonds, National City Redevelopment Project, Series 2011, 6.500%, 8/01/24 | 8/21 at 100.00 | | A | | | 170,103 | |
| | 1,000 | | Norco Redevelopment Agency, California, Tax Allocation Bonds, Project Area 1, Series 2009, 7.000%, 3/01/34 | 3/18 at 100.00 | | A+ | | | 1,110,580 | |
| | 50 | | Novato Redevelopment Agency, California, Tax Allocation Bonds, Hamilton Field Redevelopment Project, Series 2011, 6.750%, 9/01/40 | 9/21 at 100.00 | | BBB+ | | | 60,494 | |
| | 60 | | Patterson Public Finance Authority, California, Revenue Bonds, Community Facilities District 2001-1, Subordinate Lien Series 2013B , 5.875%, 9/01/39 | 9/23 at 100.00 | | N/R | | | 66,621 | |
| | | | Patterson Public Financing Authority, California, Revenue Bonds, Community Facilities District 2001-1, Senior Series 2013A: | | | | | | | |
| | 350 | | 5.250%, 9/01/30 | 9/23 at 100.00 | | N/R | | | 389,291 | |
| | 320 | | 5.750%, 9/01/39 | 9/23 at 100.00 | | N/R | | | 357,651 | |
| | 160 | | Rancho Santa Fe CSD Financing Authority, California, Revenue Bonds, Superior Lien Series 2011A, 5.750%, 9/01/30 | 9/21 at 100.00 | | A– | | | 184,318 | |
| | 30 | | Riverside County Redevelopment Agency, California, Tax Allocation Bonds, Jurupa Valley Project Area, Series 2011B, 6.500%, 10/01/25 | 10/21 at 100.00 | | A | | | 37,294 | |
| | 515 | | Sacramento City Financing Authority, California, Lease Revenue Refunding Bonds, Series 1993A, 5.400%, 11/01/20 – NPFG Insured | No Opt. Call | | AA– | | | 565,192 | |
| | 20 | | San Clemente, California, Special Tax Revenue Bonds, Community Facilities District 2006-1 Marblehead Coastal, Series 2015, 5.000%, 9/01/40 | 9/25 at 100.00 | | N/R | | | 22,651 | |
| | 1,365 | | San Diego County Regional Transportation Commission, California, Sales Tax Revenue Bonds, Refunding Series 2012A, 5.000%, 4/01/42 | 4/22 at 100.00 | | AAA | | | 1,586,062 | |
| | 65 | | San Francisco City and County Redevelopment Agency Successor Agency, California, Special Tax Bonds, Community Facilities District 7, Hunters Point Shipyard Phase One Improvements, Refunding Series 2014, 5.000%, 8/01/39 | No Opt. Call | | N/R | | | 71,323 | |
| | 25 | | San Francisco Redevelopment Finance Authority, California, Tax Allocation Revenue Bonds, Mission Bay North Redevelopment Project, Series 2011C, 6.750%, 8/01/41 | 2/21 at 100.00 | | A– | | | 30,284 | |
| | | | San Francisco Redevelopment Financing Authority, California, Tax Allocation Revenue Bonds, Mission Bay South Redevelopment Project, Series 2011D: | | | | | | | |
| | 25 | | 7.000%, 8/01/33 | 2/21 at 100.00 | | BBB+ | | | 30,101 | |
| | 30 | | 7.000%, 8/01/41 | 2/21 at 100.00 | | BBB+ | | | 36,121 | |
| | 615 | | San Jose Redevelopment Agency, California, Tax Allocation Bonds, Merged Area Redevelopment Project, Series 2006C, 5.000%, 8/01/25 – NPFG Insured | 8/17 at 100.00 | | AA– | | | 648,825 | |
| | 40 | | Signal Hill Redevelopment Agency, California, Project 1 Tax Allocation Bonds, Series 2011, 7.000%, 10/01/26 | 4/21 at 100.00 | | N/R | | | 47,762 | |
| | 360 | | Turlock Public Financing Authority, California, Tax Allocation Revenue Bonds, Series 2011, 7.500%, 9/01/39 | 3/21 at 100.00 | | A– | | | 449,784 | |
| | 1,000 | | Virgin Islands Public Finance Authority, Matching Fund Loan Notes Revenue Bonds, Series 2012A, 5.000%, 10/01/32 – AGM Insured | 10/22 at 100.00 | | AA | | | 1,110,950 | |
| | Principal | | | Optional Call | | | | | | |
| | Amount (000) | | Description (1) | Provisions (2) | | Ratings (3) | | | Value | |
| | | | Tax Obligation/Limited (continued) | | | | | | | |
| $ | 70 | | Yorba Linda Redevelopment Agency, Orange County, California, Tax Allocation Revenue Bonds, Yorba Linda Redevelopment Project, Subordinate Lien Series 2011A, 6.500%, 9/01/32 | 9/21 at 100.00 | | A– | | $ | 85,449 | |
| | 17,015 | | Total Tax Obligation/Limited | | | | | | 19,083,578 | |
| | | | Transportation – 6.7% | | | | | | | |
| | 530 | | Foothill/Eastern Transportation Corridor Agency, California, Toll Road Revenue Bonds, Refunding Junior Lien Series 2013C, 6.500%, 1/15/43 | 1/24 at 100.00 | | BB+ | | | 633,753 | |
| | | | Foothill/Eastern Transportation Corridor Agency, California, Toll Road Revenue Bonds, Refunding Series 2013A: | | | | | | | |
| | 1,000 | | 5.000%, 1/15/42 – AGM Insured | 1/24 at 100.00 | | AA | | | 1,111,520 | |
| | 1,170 | | 5.750%, 1/15/46 | 1/24 at 100.00 | | BBB– | | | 1,373,299 | |
| | 1,175 | | 6.000%, 1/15/53 | 1/24 at 100.00 | | BBB– | | | 1,385,960 | |
| | 800 | | Long Beach, California, Harbor Revenue Bonds, Series 2015D, 5.000%, 5/15/42 | 5/25 at 100.00 | | AA | | | 948,584 | |
| | 955 | | Port of Oakland, California, Revenue Bonds, Refunding Series 2012P, 5.000%, 5/01/31 (Alternative Minimum Tax) | No Opt. Call | | A+ | | | 1,094,745 | |
| | 5,630 | | Total Transportation | | | | | | 6,547,861 | |
| | | | U.S. Guaranteed – 11.3% (5) | | | | | | | |
| | 2,805 | | California Educational Facilities Authority, Revenue Bonds, Santa Clara University, Series 2008A, 5.625%, 4/01/37 (Pre-refunded 4/01/18) | 4/18 at 100.00 | | N/R (5) | | | 3,078,908 | |
| | 20 | | California Educational Facilities Authority, Revenue Bonds, University of Redlands, Series 2005A, 5.000%, 10/01/35 (Pre-refunded 5/02/16) | 5/16 at 100.00 | | A3 (5) | | | 20,081 | |
| | 405 | | California State Public Works Board, Lease Revenue Bonds, Department of Corrections, Calipatria State Prison, Series 1991A, 6.500%, 9/01/17 – NPFG Insured (ETM) | No Opt. Call | | AA– (5) | | | 425,586 | |
| | 540 | | Loma Linda, California, Hospital Revenue Bonds, Loma Linda University Medical Center, Series 2008A, 8.250%, 12/01/38 (Pre-refunded 12/01/17) | 12/17 at 100.00 | | BB+ (5) | | | 607,781 | |
| | 6,530 | | Merced Irrigation District, California, Certificates of Participation, Water and Hydroelectric Series 2008B, 0.000%, 9/01/23 (Pre-refunded 9/01/16) | 9/16 at 64.56 | | A (5) | | | 4,207,409 | |
| | 415 | | Pittsburg Redevelopment Agency, California, Tax Allocation Bonds, Los Medanos Community Development Project, Refunding Series 2008A, 6.500%, 9/01/28 (Pre-refunded 9/01/18) | 9/18 at 100.00 | | BBB– (5) | | | 472,195 | |
| | 225 | | San Mateo Union High School District, San Mateo County, California, Certificates of Participation, Phase 1, Series 2007A, 5.000%, 12/15/30 (Pre-refunded 12/15/17) – AMBAC Insured | 12/17 at 100.00 | | N/R (5) | | | 241,538 | |
| | 1,000 | | Santa Clara Valley Transportation Authority, California, Sales Tax Revenue Bonds, Series 2007A, 5.000%, 4/01/36 (Pre-refunded 4/01/17) – AMBAC Insured | 4/17 at 100.00 | | AA+ (5) | | | 1,044,270 | |
| | 1,000 | | Travis Unified School District, Solano County, California, Certificates of Participation, Series 2006, 5.000%, 9/01/26 (Pre-refunded 9/01/16) – FGIC Insured | 9/16 at 100.00 | | A3 (5) | | | 1,019,200 | |
| | 12,940 | | Total U.S. Guaranteed | | | | | | 11,116,968 | |
| | | | Utilities – 2.0% | | | | | | | |
| | 1,000 | | Imperial Irrigation District, California, Electric System Revenue Bonds, Refunding Series 2011A, 5.500%, 11/01/41 | 11/20 at 100.00 | | AA– | | | 1,155,130 | |
| | 645 | | Long Beach Bond Finance Authority, California, Natural Gas Purchase Revenue Bonds, Series 2007A, 5.500%, 11/15/37 | No Opt. Call | | A | | | 829,141 | |
| | 1,645 | | Total Utilities | | | | | | 1,984,271 | |
| | | | Water and Sewer – 10.7% | | | | | | | |
| | 1,000 | | Bay Area Water Supply and Conservation Agency, California, Revenue Bonds, Capital Cost Recovery Prepayment Program, Series 2013A, 5.000%, 10/01/34 | 4/23 at 100.00 | | AA– | | | 1,187,150 | |
| | | | California Pollution Control Financing Authority, Water Furnishing Revenue Bonds, Poseidon Resources Channelside LP Desalination Project, Series 2012: | | | | | | | |
| | 375 | | 5.000%, 7/01/37 (Alternative Minimum Tax) | No Opt. Call | | Baa3 | | | 414,285 | |
| | 1,160 | | 5.000%, 11/21/45 (Alternative Minimum Tax) | No Opt. Call | | Baa3 | | | 1,269,875 | |
| | 2,000 | | Escondido Joint Powers Financing Authority, California, Revenue Bonds, Water System Financing, Series 2012, 5.000%, 9/01/41 | 3/22 at 100.00 | | AA– | | | 2,323,140 | |
| | | | | | | | | | | |
| NXC | Nuveen California Select Tax-Free Income Portfolio | |
| | Portfolio of Investments (continued) | March 31, 2016 |
| | Principal | | | Optional Call | | | | | | |
| | Amount (000) | | Description (1) | Provisions (2) | | Ratings (3) | | | Value | |
| | | | Water and Sewer (continued) | | | | | | | |
| $ | 1,970 | | Los Angeles Department of Water and Power, California, Waterworks Revenue Bonds, Series 2014A, 5.000%, 7/01/44 | 7/24 at 100.00 | | AA+ | | $ | 2,317,350 | |
| | 1,500 | | Metropolitan Water District of Southern California, Water Revenue Refunding Bonds, Series 2015A, 5.000%, 7/01/40 | 7/25 at 100.00 | | AAA | | | 1,794,240 | |
| | 1,000 | | Santa Clara Valley Water District, California, Water System Revenue Bonds, Refunding Series 2016A, 5.000%, 6/01/31 | 12/25 at 100.00 | | Aa1 | | | 1,245,550 | |
| | 9,005 | | Total Water and Sewer | | | | | | 10,551,590 | |
| $ | 105,010 | | Total Long-Term Investments (cost $86,348,723) | | | | | | 97,178,804 | |
| | | | Other Assets Less Liabilities – 1.3% | | | | | | 1,314,857 | |
| | | | Net Assets – 100% | | | | | $ | 98,493,661 | |
| (1) | All percentages shown in the Portfolio of Investments are based on net assets. |
| (2) | Optional Call Provisions (not covered by the report of independent registered public accounting firm): Dates (month and year) and prices of the earliest optional call or redemption. There may be other call provisions at varying prices at later dates. Certain mortgage-backed securities may be subject to periodic principal paydowns. |
| (3) | Ratings (not covered by the report of independent registered public accounting firm): Using the highest of Standard & Poor's Group ("Standard & Poor's"), Moody's Investors Service, Inc. ("Moody's") or Fitch, Inc. ("Fitch") rating. Ratings below BBB by Standard & Poor's, Baa by Moody's or BBB by Fitch are considered to be below investment grade. Holdings designated N/R are not rated by any of these national rating agencies. |
| (4) | Step-up coupon. The rate shown is the coupon as of the end of the reporting period. |
| (5) | Backed by an escrow or trust containing sufficient U.S. Government or U.S. Government agency securities, which ensure the timely payment of principal and interest. Certain bonds backed by U.S. Government or agency securities are regarded as having an implied rating equal to the rating of such securities. |
| (ETM) | Escrowed to maturity. |
See accompanying notes to financial statements.
| NXN | | |
| | Nuveen New York Select Tax-Free Income Portfolio | |
| | Portfolio of Investments | March 31, 2016 |
| | Principal | | | Optional Call | | | | | | |
| | Amount (000) | | Description (1) | Provisions (2) | | Ratings (3) | | | Value | |
| | | | LONG-TERM INVESTMENTS – 97.5% | | | | | | | |
| | | | MUNICIPAL BONDS – 97.5% | | | | | | | |
| | | | Consumer Staples – 2.2% | | | | | | | |
| $ | 150 | | Nassau County Tobacco Settlement Corporation, New York, Tobacco Settlement Asset-Backed Bonds, Refunding Series 2006A-2, 5.250%, 6/01/26 | 6/16 at 100.00 | | B | | $ | 150,221 | |
| | 275 | | Nassau County Tobacco Settlement Corporation, New York, Tobacco Settlement Asset-Backed Bonds, Series 2006A-3, 5.000%, 6/01/35 | 6/16 at 100.00 | | B | | | 259,127 | |
| | | | TSASC Inc., New York, Tobacco Asset-Backed Bonds, Series 2006: | | | | | | | |
| | 290 | | 4.750%, 6/01/22 | 6/16 at 100.00 | | BBB– | | | 290,458 | |
| | 540 | | 5.000%, 6/01/26 | 6/16 at 100.00 | | BB– | | | 542,268 | |
| | 1,255 | | Total Consumer Staples | | | | | | 1,242,074 | |
| | | | Education and Civic Organizations – 23.6% | | | | | | | |
| | 100 | | Albany Industrial Development Agency, New York, Revenue Bonds, Albany Law School, Series 2007A, 5.000%, 7/01/31 | 7/17 at 100.00 | | BBB | | | 103,777 | |
| | 165 | | Albany Industrial Development Agency, New York, Revenue Bonds, Brighter Choice Charter Schools, Series 2007A, 5.000%, 4/01/37 | 4/17 at 100.00 | | B | | | 137,356 | |
| | 280 | | Buffalo and Erie County Industrial Land Development Corporation, New York, Revenue Bonds, Enterprise Charter School Project, Series 2011A, 7.500%, 12/01/40 | 12/20 at 100.00 | | B | | | 286,728 | |
| | | | Build New York City Resource Corporation, New York, Revenue Bonds, South Bronx Charter School for International Cultures and the Arts Project, Series 2013A: | | | | | | | |
| | 40 | | 5.000%, 4/15/33 | 4/23 at 100.00 | | BB+ | | | 41,806 | |
| | 55 | | 5.000%, 4/15/43 | 4/23 at 100.00 | | BB+ | | | 56,777 | |
| | 430 | | Dormitory Authority of the State of New York, General Revenue Bonds, Manhattan College, Series 2007A, 5.000%, 7/01/41 – RAAI Insured | 7/17 at 100.00 | | AA | | | 448,150 | |
| | 150 | | Dormitory Authority of the State of New York, General Revenue Bonds, Saint Johns University, Series 2013A, 5.000%, 7/01/44 | 7/23 at 100.00 | | A– | | | 169,515 | |
| | 1,000 | | Dormitory Authority of the State of New York, Housing Revenue Bonds, Fashion Institute of Technology, Series 2007, 5.250%, 7/01/34 – FGIC Insured | No Opt. Call | | AA– | | | 1,225,340 | |
| | | | Dormitory Authority of the State of New York, Lease Revenue Bonds, State University Dormitory Facilities, Series 2015A: | | | | | | | |
| | 20 | | 5.000%, 7/01/31 | No Opt. Call | | Aa3 | | | 24,216 | |
| | 25 | | 5.000%, 7/01/33 | No Opt. Call | | Aa3 | | | 29,972 | |
| | 1,000 | | 5.000%, 7/01/34 | 7/25 at 100.00 | | Aa3 | | | 1,193,430 | |
| | 405 | | Dormitory Authority of the State of New York, Revenue Bonds, Barnard College, Series 2007A, 5.000%, 7/01/37 – NPFG Insured | 7/17 at 100.00 | | AA– | | | 423,124 | |
| | 1,000 | | Dormitory Authority of the State of New York, Revenue Bonds, Columbia University, Series 2011A, 5.000%, 10/01/41 | 4/21 at 100.00 | | AAA | | | 1,156,250 | |
| | 605 | | Dormitory Authority of the State of New York, Revenue Bonds, Icahn School of Medicine at Mount Sinai, Series 2015A, 5.000%, 7/01/40 | 7/25 at 100.00 | | A– | | | 696,010 | |
| | 290 | | Dormitory Authority of the State of New York, Revenue Bonds, New York University, Series 2015A, 5.000%, 7/01/35 | No Opt. Call | | AA– | | | 344,784 | |
| | 1,800 | | Dormitory Authority of the State of New York, Revenue Bonds, Non State Supported Debt, Cornell University, Series 2010A, 5.000%, 7/01/40 | 7/20 at 100.00 | | Aa1 | | | 2,049,264 | |
| | 120 | | Dormitory Authority of the State of New York, Revenue Bonds, Saint Joseph's College, Series 2010, 5.250%, 7/01/35 | 7/20 at 100.00 | | Ba1 | | | 131,144 | |
| | 110 | | Hempstead Town Local Development Corporation, New York, Revenue Bonds, Adelphi University Project, Series 2013, 5.000%, 9/01/38 | 9/23 at 100.00 | | A– | | | 124,920 | |
| | 2,000 | | Monroe County Industrial Development Corporation, New York, Revenue Bonds, University of Rochester Project, Series 2011B, 5.000%, 7/01/41 | 7/21 at 100.00 | | AA– | | | 2,286,900 | |
| NXN | Nuveen New York Select Tax-Free Income Portfolio | |
| | Portfolio of Investments (continued) | March 31, 2016 |
| | Principal | | | Optional Call | | | | | | |
| | Amount (000) | | Description (1) | Provisions (2) | | Ratings (3) | | | Value | |
| | | | Education and Civic Organizations (continued) | | | | | | | |
| | | | New York City Industrial Development Agency, New York, PILOT Revenue Bonds, Queens Baseball Stadium Project, Series 2006: | | | | | | | |
| $ | 500 | | 5.000%, 1/01/31 – AMBAC Insured | 1/17 at 100.00 | | BB+ | | $ | 511,400 | |
| | 430 | | 4.750%, 1/01/42 – AMBAC Insured | 1/17 at 100.00 | | BB+ | | | 437,516 | |
| | 300 | | New York City Industrial Development Authority, New York, PILOT Revenue Bonds, Yankee Stadium Project, Series 2006, 4.750%, 3/01/46 – NPFG Insured | 9/16 at 100.00 | | AA– | | | 304,245 | |
| | 1,005 | | New York City Trust for Cultural Resources, New York, Revenue Bonds, Wildlife Conservation Society, Series 2014A, 5.000%, 8/01/32 | No Opt. Call | | AA– | | | 1,205,126 | |
| | 65 | | Seneca County Industrial Development Authority, New York, Revenue Bonds, New York Chiropractic College, Series 2007, 5.000%, 10/01/27 | 10/17 at 100.00 | | BBB+ | | | 68,102 | |
| | 11,895 | | Total Education and Civic Organizations | | | | | | 13,455,852 | |
| | | | Financials – 1.0% | | | | | | | |
| | 450 | | New York Liberty Development Corporation, Revenue Bonds, Goldman Sachs Headquarters Issue, Series 2005, 5.250%, 10/01/35 | No Opt. Call | | A | | | 564,282 | |
| | | | Health Care – 4.4% | | | | | | | |
| | 450 | | Dormitory Authority of the State of New York, FHA-Insured Mortgage Revenue Bonds, Montefiore Hospital, Series 2004, 5.000%, 8/01/29 – FGIC Insured | 6/16 at 100.00 | | AA– | | | 451,760 | |
| | 100 | | Dormitory Authority of the State of New York, Highland Hospital of Rochester Revenue Bonds, Series 2010, 5.200%, 7/01/32 | 7/20 at 100.00 | | A | | | 112,088 | |
| | | | Dormitory Authority of the State of New York, Orange Regional Medical Center Obligated Group Revenue Bonds, Series 2008: | | | | | | | |
| | 160 | | 6.500%, 12/01/21 | 12/18 at 100.00 | | Ba1 | | | 178,336 | |
| | 210 | | 6.125%, 12/01/29 | 12/18 at 100.00 | | Ba1 | | | 230,196 | |
| | 405 | | 6.250%, 12/01/37 | 12/18 at 100.00 | | Ba1 | | | 444,147 | |
| | 750 | | Dormitory Authority of the State of New York, Revenue Bonds, NYU Hospitals Center, Series 2011A, 6.000%, 7/01/40 | 7/20 at 100.00 | | A– | | | 865,170 | |
| | 240 | | Yonkers Industrial Development Agency, New York, Revenue Bonds, St. John's Riverside Hospital, Series 2001B, 7.125%, 7/01/31 | 6/16 at 100.00 | | BB– | | | 240,492 | |
| | 2,315 | | Total Health Care | | | | | | 2,522,189 | |
| | | | Housing/Multifamily – 0.5% | | | | | | | |
| | 275 | | New York State Housing Finance Agency, Affordable Housing Revenue, Series 2007A, 5.250%, 11/01/38 (Alternative Minimum Tax) | 11/17 at 100.00 | | Aa2 | | | 281,083 | |
| | | | Industrials – 3.6% | | | | | | | |
| | 40 | | Build New York City Resource Corporation, New York, Solid Waste Disposal Revenue Bonds, Pratt Paper NY, Inc. Project, Series 2014, 5.000%, 1/01/35 (Alternative Minimum Tax) | 1/25 at 100.00 | | N/R | | | 43,384 | |
| | 1,865 | | New York Liberty Development Corporation, New York, Liberty Revenue Bonds, 3 World Trade Center Project, Class 1 Series 2014, 5.000%, 11/15/44 | 11/24 at 100.00 | | N/R | | | 2,006,833 | |
| | 1,905 | | Total Industrials | | | | | | 2,050,217 | |
| | | | Long-Term Care – 0.6% | | | | | | | |
| | 100 | | Dormitory Authority of the State of New York, Non-State Supported Debt, Ozanam Hall of Queens Nursing Home Revenue Bonds, Series 2006, 5.000%, 11/01/31 | 11/16 at 100.00 | �� | Baa2 | | | 100,989 | |
| | 50 | | Dormitory Authority of the State of New York, Revenue Bonds, Providence Rest, Series 2005, 5.000%, 7/01/35 – ACA Insured | 6/16 at 100.00 | | N/R | | | 50,006 | |
| | 25 | | Suffolk County Industrial Development Agency, New York, Civic Facility Revenue Bonds, Special Needs Facilities Pooled Program, Series 2008-B1, 5.500%, 7/01/18 | 7/16 at 100.00 | | N/R | | | 20,299 | |
| | 165 | | Yonkers Industrial Development Agency, New York, Civic Facilities Revenue Bonds, Special Needs Facilities Pooled Program Bonds, Series 2008-C1, 5.500%, 7/01/18 | 7/16 at 101.00 | | N/R | | | 164,878 | |
| | 340 | | Total Long-Term Care | | | | | | 336,172 | |
| | Principal | | | Optional Call | | | | | | |
| | Amount (000) | | Description (1) | Provisions (2) | | Ratings (3) | | | Value | |
| | | | Tax Obligation/General – 2.2% | | | | | | | |
| $ | 515 | | New York City, New York, General Obligation Bonds, Fiscal 2008 Series D-1, 5.125%, 12/01/25 | 12/17 at 100.00 | | AA | | $ | 553,234 | |
| | 600 | | Yonkers, New York, General Obligation Bonds, Refunding Series 2011A, 5.000%, 10/01/24 – AGM Insured | 10/21 at 100.00 | | AA | | | 700,368 | |
| | 1,115 | | Total Tax Obligation/General | | | | | | 1,253,602 | |
| | | | Tax Obligation/Limited – 26.2% | | | | | | | |
| | 1,050 | | Dormitory Authority of the State of New York, State Personal Income Tax Revenue Bonds, General Purpose Series 2012D, 5.000%, 2/15/37 | No Opt. Call | | AAA | | | 1,232,585 | |
| | 1,000 | | Dormitory Authority of the State of New York, State Sales Tax Revenue Bonds, Series 2015B. Group A,B&C, 5.000%, 3/15/35 | 9/25 at 100.00 | | AAA | | | 1,209,360 | |
| | 1,375 | | Government of Guam, Business Privilege Tax Bonds, Refunding Series 2015D, 5.000%, 11/15/29 | No Opt. Call | | A | | | 1,620,479 | |
| | 2,000 | | Hudson Yards Infrastructure Corporation, New York, Revenue Bonds, Senior Fiscal 2012 Series 2011A, 5.750%, 2/15/47 | 2/21 at 100.00 | | A | | | 2,322,516 | |
| | 1,500 | | Hudson Yards Infrastructure Corporation, New York, Revenue Bonds, Series 2006A, 5.000%, 2/15/47 | 2/17 at 100.00 | | A | | | 1,546,350 | |
| | 600 | | New York City Transitional Finance Authority, New York, Building Aid Revenue Bonds, Fiscal Series 2007S-2, 5.000%, 1/15/28 – FGIC Insured | 1/17 at 100.00 | | AA | | | 618,678 | |
| | 1,000 | | New York City Transitional Finance Authority, New York, Building Aid Revenue Bonds, Fiscal Series 2015S-2, 5.000%, 7/15/40 | 7/25 at 100.00 | | AA | | | 1,174,340 | |
| | 1,000 | | New York City Transitional Finance Authority, New York, Future Tax Secured Bonds, Subordinate Fiscal 2013 Series I, 5.000%, 5/01/38 | 5/23 at 100.00 | | AAA | | | 1,171,970 | |
| | 450 | | New York City Transitional Finance Authority, New York, Future Tax Secured Bonds, Subordinate Fiscal 2014 Series D-1, 5.000%, 2/01/35 | 2/24 at 100.00 | | AAA | | | 532,733 | |
| | 1,000 | | New York City Transitional Finance Authority, New York, Future Tax Secured Revenue Bonds, Subordinate Series 2011-D1, 5.250%, 2/01/30 | 2/21 at 100.00 | | AAA | | | 1,176,990 | |
| | 535 | | New York City Transitional Finance Authority, New York, Future Tax Secured Revenue Bonds, Tender Option Bond Trust 2015-XF0080, 13.086%, 5/01/32 (IF) | 5/19 at 100.00 | | AAA | | | 709,715 | |
| | 570 | | New York State Thruway Authority, Highway and Bridge Trust Fund Bonds, Series 2005B, 5.500%, 4/01/20 – AMBAC Insured (UB) (4) | No Opt. Call | | AA+ | | | 669,716 | |
| | 845 | | Virgin Islands Public Finance Authority, Matching Fund Loan Notes Revenue Bonds, Series 2012A, 5.000%, 10/01/32 – AGM Insured | 10/22 at 100.00 | | AA | | | 938,753 | |
| | 12,925 | | Total Tax Obligation/Limited | | | | | | 14,924,185 | |
| | | | Transportation – 9.0% | | | | | | | |
| | 1,000 | | Metropolitan Transportation Authority, New York, Transportation Revenue Bonds, Series 2014B, 5.250%, 11/15/38 | 5/24 at 100.00 | | AA– | | | 1,192,070 | |
| | 250 | | New York Liberty Development Corporation, New York, Liberty Revenue Bonds, 4 World Trade Center Project, Series 2011, 5.000%, 11/15/44 | 11/21 at 100.00 | | A+ | | | 284,413 | |
| | 120 | | Port Authority of New York and New Jersey, Consolidated Revenue Bonds, One Hundred Forty Eighth Series 2008, Tender Option Bond Trust 2015-XF2178, 16.892%, 3/16/17 – AGM Insured (IF) | No Opt. Call | | AA | | | 148,512 | |
| | 1,500 | | Port Authority of New York and New Jersey, Consolidated Revenue Bonds, One Hundred Eighty-Forth Series 2014, 5.000%, 9/01/33 | 9/24 at 100.00 | | AA– | | | 1,793,070 | |
| | 1,000 | | Port Authority of New York and New Jersey, Consolidated Revenue Bonds, One Hundred Ninety-Fourth Series 2015, 5.250%, 10/15/55 | 10/25 at 100.00 | | AA– | | | 1,189,900 | |
| | | | Port Authority of New York and New Jersey, Special Project Bonds, JFK International Air Terminal LLC Project, Eighth Series 2010: | | | | | | | |
| | 290 | | 6.500%, 12/01/28 | 6/16 at 100.00 | | Baa1 | | | 292,883 | |
| | 215 | | 6.000%, 12/01/36 | 12/20 at 100.00 | | Baa1 | | | 254,287 | |
| | 4,375 | | Total Transportation | | | | | | 5,155,135 | |
| NXN | Nuveen New York Select Tax-Free Income Portfolio | |
| | Portfolio of Investments (continued) | March 31, 2016 |
| | Principal | | | Optional Call | | | | | | |
| | Amount (000) | | Description (1) | Provisions (2) | | Ratings (3) | | | Value | |
| | | | U.S. Guaranteed – 15.0% (5) | | | | | | | |
| $ | 1,000 | | Albany Industrial Development Agency, New York, Revenue Bonds, Saint Peter's Hospital, Series 2008A, 5.250%, 11/15/32 (Pre-refunded 11/15/17) | 11/17 at 100.00 | | N/R (5) | | $ | 1,074,060 | |
| | 30 | | Cattaraugus County Industrial Development Agency, New York, Revenue Bonds, St. Bonaventure University, Series 2006, 5.000%, 5/01/23 (Pre-refunded 5/01/16) | 5/16 at 100.00 | | BBB– (5) | | | 30,115 | |
| | 175 | | Dormitory Authority of the State of New York, Judicial Facilities Lease Revenue Bonds, Suffolk County Issue, Series 1986, 7.375%, 7/01/16 (ETM) | No Opt. Call | | Aaa | | | 177,770 | |
| | 1,595 | | Dormitory Authority of the State of New York, Revenue Bonds, Barnard College, Series 2007A, 5.000%, 7/01/37 (Pre-refunded 7/01/17) – NPFG Insured | 7/17 at 100.00 | | AA– (5) | | | 1,682,358 | |
| | 950 | | Dormitory Authority of the State of New York, Revenue Bonds, Memorial Sloan Kettering Cancer Center, Series 2006-1, 5.000%, 7/01/35 (Pre-refunded 7/01/16) | 7/16 at 100.00 | | AA (5) | | | 960,916 | |
| | 225 | | Erie County Industrial Development Agency, New York, Revenue Bonds, Orchard Park CCRC Inc. Project, Series 2006A, 6.000%, 11/15/36 (Pre-refunded 11/15/16) | 11/16 at 100.00 | | N/R (5) | | | 232,655 | |
| | | | Madison County Industrial Development Agency, New York, Civic Facility Revenue Bonds, Oneida Health System, Series 2007A: | | | | | | | |
| | 100 | | 5.250%, 2/01/27 (Pre-refunded 2/01/17) | 2/17 at 100.00 | | Aaa | | | 103,946 | |
| | 90 | | 5.500%, 2/01/32 (Pre-refunded 2/01/17) | 2/17 at 100.00 | | Aaa | | | 93,738 | |
| | 1,000 | | New York City, New York, General Obligation Bonds, Fiscal Series 2006J-1, 5.000%, 6/01/25 (Pre-refunded 6/01/16) | 6/16 at 100.00 | | N/R (5) | | | 1,007,590 | |
| | 745 | | New York City, New York, General Obligation Bonds, Fiscal 2008 Series D-1, 5.125%, 12/01/25 (Pre-refunded 12/01/17) | 12/17 at 100.00 | | N/R (5) | | | 799,564 | |
| | 425 | | New York State Thruway Authority, Highway and Bridge Trust Fund Bonds, Series 2007, 5.000%, 4/01/27 (Pre-refunded 10/01/17) | 10/17 at 100.00 | | AA+ (5) | | | 452,714 | |
| | 775 | | New York State Environmental Facilities Corporation, State Personal Income Tax Revenue Bonds, Series 2008A, 5.000% 12/15/26 (Pre-refunded 12/15/17) (UB) | 12/17 at 100.00 | | AAA | | | 832,249 | |
| | 1,000 | | New York State Urban Development Corporation, State Personal Income Tax Revenue Bonds, Tender Option Bond Trust 09-6W, 12.896%, 3/15/37
(Pre-refunded 3/01/17) (IF) (4) | 3/17 at 100.00 | | AAA | | | 1,127,190 | |
| | 8,110 | | Total U.S. Guaranteed | | | | | | 8,574,865 | |
| | | | Utilities – 8.1% | | | | | | | |
| | 550 | | Chautauqua County, New York, Industrial Development Agency, Exempt Facility Revenue Bonds, NRG Dunkirk Power Project, Series 2009, 5.875%, 4/01/42 | 2/20 at 100.00 | | Baa3 | | | 579,167 | |
| | 35 | | Guam Power Authority, Revenue Bonds, Series 2012A, 5.000%, 10/01/34 | 10/22 at 100.00 | | BBB | | | 38,348 | |
| | | | Long Island Power Authority, New York, Electric System General Revenue Bonds, Series 2006A: | | | | | | | |
| | 570 | | 5.000%, 12/01/23 – FGIC Insured | 6/16 at 100.00 | | AA– | | | 574,383 | |
| | 430 | | 5.000%, 12/01/25 – FGIC Insured | 6/16 at 100.00 | | AA– | | | 433,234 | |
| | 50 | | Long Island Power Authority, New York, Electric System General Revenue Bonds, Series 2014A, 5.000%, 9/01/44 | 9/24 at 100.00 | | A– | | | 57,348 | |
| | 400 | | Long Island Power Authority, New York, Electric System Revenue Bonds, Series 2011A, 5.000%, 5/01/38 | 5/21 at 100.00 | | A– | | | 442,416 | |
| | 865 | | Niagara Area Development Corporation, New York, Solid Waste Disposal Facility Revenue Refunding Bonds, Covanta Energy Project, Series 2012A, 5.250%, 11/01/42 (Alternative Minimum Tax) | No Opt. Call | | BB+ | | | 878,148 | |
| | 1,365 | | Utility Debt Securitization Authority, New York, Restructuring Bonds, Series 2013TE, 5.000%, 12/15/41 | 12/23 at 100.00 | | AAA | | | 1,608,011 | |
| | 4,265 | | Total Utilities | | | | | | 4,611,055 | |
| | Principal | | | Optional Call | | | | | | |
| | Amount (000) | | Description (1) | Provisions (2) | | Ratings (3) | | | Value | |
| | | | Water and Sewer – 1.1% | | | | | | | |
| $ | 200 | | Buffalo Municipal Water Finance Authority, New York, Water System Revenue Bonds, Refunding Series 2015A, 5.000%, 7/01/29 | 7/25 at 100.00 | | A | | $ | 240,876 | |
| | 275 | | New York City Municipal Water Finance Authority, New York, Water and Sewerage System Revenue Bonds, Tender Option Bond Trust 2015-XF0097, 17.048%, 12/15/31 (IF) | 6/18 at 100.00 | | AA+ | | | 371,052 | |
| | 475 | | Total Water and Sewer | | | | | | 611,928 | |
| $ | 49,700 | | Total Long-Term Investments (cost $51,493,664) | | | | | | 55,582,639 | |
| | Principal | | | Optional Call | | | | | | |
| | Amount (000) | | Description (1) | Provisions (2) | | Ratings (3) | | | Value | |
| | | | SHORT-TERM INVESTMENTS – 1.3% | | | | | | | |
| | | | MUNICIPAL BONDS – 1.3% | | | | | | | |
| | | | Education and Civic Organizations – 1.3% | | | | | | | |
| $ | 750 | | Syracuse Industrial Development Agency, Civic Facility Revenue, Syracuse University, Variable Rate Demand Obligations, Series 2005B, 0.400%, 12/01/35 (6) | 7/16 at 100.00 | | A-1+ | | $ | 750,000 | |
| $ | 750 | | Total Short-Term Investments (cost $750,000) | | | | | | 750,000 | |
| | | | Total Investments (cost $52,243,664) – 98.8% | | | | | | 56,332,639 | |
| | | | Floating Rate Obligations – (1.8)% | | | | | | (1,005,000 | ) |
| | | | Other Assets Less Liabilities – 3.0% | | | | | | 1,703,778 | |
| | | | Net Assets – 100% | | | | | $ | 57,031,417 | |
| (1) | All percentages shown in the Portfolio of Investments are based on net assets. |
| (2) | Optional Call Provisions (not covered by the report of independent registered public accounting firm): Dates (month and year) and prices of the earliest optional call or redemption. There may be other call provisions at varying prices at later dates. Certain mortgage-backed securities may be subject to periodic principal paydowns. |
| (3) | Ratings (not covered by the report of independent registered public accounting firm): Using the highest of Standard & Poor's Group ("Standard & Poor's"), Moody's Investors Service, Inc. ("Moody's") or Fitch, Inc. ("Fitch") rating. Ratings below BBB by Standard & Poor's, Baa by Moody's or BBB by Fitch are considered to be below investment grade. Holdings designated N/R are not rated by any of these national rating agencies. |
| (4) | Investment, or portion of investment, has been pledged to collateralize the net payment obligations for investments in inverse floating rate transactions. |
| (5) | Backed by an escrow or trust containing sufficient U.S. Government or U.S. Government agency securities, which ensure the timely payment of principal and interest. Certain bonds backed by U.S. Government or agency securities are regarded as having an implied rating equal to the rating of such securities. |
| (6) | Investment has maturity of more than one year, but has variable rate and demand features which qualify it as a short-term investment. The rate disclosed is that in effect as of the end of the reporting period. This rate changes periodically based on market conditions or a specified market index. |
| (ETM) | Escrowed to maturity. |
| (IF) | Inverse floating rate investment. |
| (UB) | Underlying bond of an inverse floating rate trust reflected as a financing transaction. See Notes to Financial Statements, Note 3 – Portfolio Securities and Investments in Derivatives, Inverse Floating Rate Securities for more information. |
See accompanying notes to financial statements.
| Statement of | | |
| | Assets and Liabilities | March 31, 2016 |
| | | Select | | Select | | Select | | California | | New York | |
| | | Tax-Free | | Tax-Free 2 | | Tax-Free 3 | | Select Tax-Free | | Select Tax-Free | |
| | | (NXP | ) | (NXQ | ) | (NXR | ) | (NXC | ) | (NXN | ) |
| Assets | | | | | | | | | | | | | | | | |
| Long-term investments, at value (cost $221,747,571, $230,688,728, $172,706,978, $86,348,723 and $51,493,664 respectively) | | $ | 253,790,946 | | $ | 258,402,064 | | $ | 201,322,151 | | $ | 97,178,804 | | $ | 55,582,639 | |
| Short-term investments, at value (cost $ —, $ —, $ —, $ — and $750,000, respectively) | | | — | | | — | | | — | | | — | | | 750,000 | |
| Cash | | | 1,331,145 | | | 3,403,303 | | | 654,562 | | | 666,882 | | | 1,252,298 | |
| Receivable for: | | | | | | | | | | | | | | | | |
| Interest | | | 2,361,194 | | | 2,597,468 | | | 1,987,516 | | | 1,019,502 | | | 764,502 | |
| Investments sold | | | — | | | — | | | 2,595,000 | | | — | | | — | |
| Other assets | | | 52,557 | | | 54,776 | | | 42,106 | | | 23,799 | | | 16,990 | |
| Total assets | | | 257,535,842 | | | 264,457,611 | | | 206,601,335 | | | 98,888,987 | | | 58,366,429 | |
| Liabilities | | | | | | | | | | | | | | | | |
| Floating rate obligations | | | — | | | — | | | — | | | — | | | 1,005,000 | |
| Unrealized depreciation on interest rate swaps | | | 443,326 | | | — | | | 299,545 | | | — | | | — | |
| Payable for: | | | | | | | | | | | | | | | | |
| Dividends | | | 707,258 | | | 756,179 | | | 570,238 | | | 315,952 | | | 172,086 | |
| Investments purchased | | | — | | | — | | | — | | | — | | | 100,682 | |
| Accrued expenses: | | | | | | | | | | | | | | | | |
| Management fees | | | 44,538 | | | 56,867 | | | 44,615 | | | 21,836 | | | 12,673 | |
| Professional fees | | | 24,044 | | | 24,091 | | | 23,873 | | | 23,555 | | | 23,498 | |
| Trustees fees | | | 47,647 | | | 49,817 | | | 36,925 | | | 18,140 | | | 11,155 | |
| Other | | | 41,368 | | | 40,587 | | | 31,225 | | | 15,843 | | | 9,918 | |
| Total liabilities | | | 1,308,181 | | | 927,541 | | | 1,006,421 | | | 395,326 | | | 1,335,012 | |
| Net assets | | $ | 256,227,661 | | $ | 263,530,070 | | $ | 205,594,914 | | $ | 98,493,661 | | $ | 57,031,417 | |
| Shares outstanding | | | 16,570,310 | | | 17,713,727 | | | 13,045,560 | | | 6,281,365 | | | 3,923,976 | |
| Net asset value ("NAV") per share outstanding | | $ | 15.46 | | $ | 14.88 | | $ | 15.76 | | $ | 15.68 | | $ | 14.53 | |
| Net assets consist of: | | | | | | | | | | | | | | | | |
| Shares, $0.01 par value per share | | $ | 165,703 | | $ | 177,137 | | $ | 130,456 | | $ | 62,814 | | $ | 39,240 | |
| Paid-in surplus | | | 230,107,428 | | | 246,289,462 | | | 179,537,045 | | | 87,485,116 | | | 53,843,090 | |
| Undistributed (Over-distribution of) net investment income | | | 1,618,764 | | | 592,060 | | | 1,241,908 | | | (19,828 | ) | | 39,249 | |
| Accumulated net realized gain (loss) | | | (7,264,283 | ) | | (11,241,925 | ) | | (3,630,123 | ) | | 135,478 | | | (979,137 | ) |
| Net unrealized appreciation (depreciation) | | | 31,600,049 | | | 27,713,336 | | | 28,315,628 | | | 10,830,081 | | | 4,088,975 | |
| Net assets | | $ | 256,227,661 | | $ | 263,530,070 | | $ | 205,594,914 | | $ | 98,493,661 | | $ | 57,031,417 | |
| Authorized shares | | | Unlimited | | | Unlimited | | | Unlimited | | | Unlimited | | | Unlimited | |
See accompanying notes to financial statements.
| Statement of | | |
| | Operations | Year Ended March 31, 2016 |
| | | Select | | Select | | Select | | California | | New York | |
| | | Tax-Free | | Tax-Free 2 | | Tax-Free 3 | | Select Tax-Free | | Select Tax-Free | |
| | | (NXP | ) | (NXQ | ) | (NXR | ) | (NXC | ) | (NXN | ) |
| Investment Income | | $ | 10,382,586 | | $ | 10,532,260 | | $ | 8,251,452 | | $ | 4,377,909 | | $ | 2,475,717 | |
| Expenses | | | | | | | | | | | | | | | | |
| Management fees | | | 518,416 | | | 662,813 | | | 516,655 | | | 254,570 | | | 149,027 | |
| Interest expense | | | — | | | — | | | — | | | — | | | 5,448 | |
| Custodian fees | | | 36,774 | | | 36,839 | | | 31,310 | | | 19,775 | | | 16,832 | |
| Trustees fees | | | 6,544 | | | 6,760 | | | 5,240 | | | 2,550 | | | 1,499 | |
| Professional fees | | | 29,166 | | | 29,949 | | | 28,441 | | | 25,784 | | | 25,555 | |
| Shareholder reporting expenses | | | 46,116 | | | 43,007 | | | 30,927 | | | 15,407 | | | 11,168 | |
| Shareholder servicing agent fees | | | 17,471 | | | 16,044 | | | 13,140 | | | 4,366 | | | 4,021 | |
| Stock exchange listing fees | | | 7,935 | | | 7,935 | | | 7,935 | | | 7,946 | | | 7,935 | |
| Investor relations expenses | | | 27,186 | | | 27,589 | | | 20,860 | | | 10,150 | | | 6,358 | |
| Other expenses | | | 16,376 | | | 16,642 | | | 14,595 | | | 11,488 | | | 11,064 | |
| Total expenses | | | 705,984 | | | 847,578 | | | 669,103 | | | 352,036 | | | 238,907 | |
| Net investment income (loss) | | | 9,676,602 | | | 9,684,682 | | | 7,582,349 | | | 4,025,873 | | | 2,236,810 | |
| Realized and Unrealized Gain (Loss) | | | | | | | | | | | | | | | | |
| Net realized gain (loss) from: | | | | | | | | | | | | | | | | |
| Investments | | | (897,748 | ) | | (476,182 | ) | | 493,045 | | | 145,143 | | | 21,067 | |
| Swaps | | | (2,455,336 | ) | | — | | | (1,439,664 | ) | | — | | | — | |
| Change in net unrealized appreciation (depreciation) of: | | | | | | | | | | | | | | | | |
| Investments | | | 5,838,255 | | | 4,461,815 | | | 4,776,566 | | | 1,041,495 | | | (48,449 | ) |
| Swaps | | | 2,088,861 | | | — | | | 1,319,464 | | | — | | | — | |
| Net realized and unrealized gain (loss) | | | 4,574,032 | | | 3,985,633 | | | 5,149,411 | | | 1,186,638 | | | (27,382 | ) |
| Net increase (decrease) in net assets from operations | | $ | 14,250,634 | | $ | 13,670,315 | | $ | 12,731,760 | | $ | 5,212,511 | | $ | 2,209,428 | |
See accompanying notes to financial statements.
| Statement of | |
| | Changes in Net Assets |
| | | | Select Tax-Free (NXP) | | Select Tax-Free 2 (NXQ) | | Select Tax-Free 3 (NXR) | |
| | | Year | | Year | | Year | | Year | | Year | | Year | |
| | | Ended | | Ended | | Ended | | Ended | | Ended | | Ended | |
| | | 3/31/16 | | 3/31/15 | | 3/31/16 | | 3/31/15 | | 3/31/16 | | 3/31/15 | |
| Operations | | | | | | | | | | | | | | | | | | | |
| Net investment income (loss) | | $ | 9,676,602 | | $ | 9,905,327 | | $ | 9,684,682 | | $ | 10,248,642 | | $ | 7,582,349 | | $ | 7,811,333 | |
| Net realized gain (loss) from: | | | | | | | | | | | | | | | | | | | |
| Investments | | | (897,748 | ) | | 807,667 | | | (476,182 | ) | | 505,853 | | | 493,045 | | | (190,676 | ) |
| Swaps | | | (2,455,336 | ) | | — | | | — | | | — | | | (1,439,664 | ) | | — | |
| Change in net unrealized appreciation (depreciation) of: | | | | | | | | | | | | | | | | | | | |
| Investments | | | 5,838,255 | | | 13,921,046 | | | 4,461,815 | | | 14,109,897 | | | 4,776,566 | | | 13,428,637 | |
| Swaps | | | 2,088,861 | | | (2,298,329 | ) | | — | | | — | | | 1,319,464 | | | (1,587,595 | ) |
| Net increase (decrease) in net assets from operations | | | 14,250,634 | | | 22,335,711 | | | 13,670,315 | | | 24,864,392 | | | 12,731,760 | | | 19,461,699 | |
| Distributions to Common Shareholders | | | | | | | | | | | | | | | | | | | |
| From net investment income | | | (9,319,144 | ) | | (10,190,742 | ) | | (9,521,129 | ) | | (10,552,069 | ) | | (7,289,860 | ) | | (7,961,707 | ) |
| From accumulated net realized gains | | | — | | | — | | | — | | | — | | | — | | | — | |
| Decrease in net assets applicable to common shares from distributions to common shareholders | | | (9,319,144 | ) | | (10,190,742 | ) | | (9,521,129 | ) | | (10,552,069 | ) | | (7,289,860 | ) | | (7,961,707 | ) |
| Capital Share Transactions | | | | | | | | | | | | | | | | | | | |
| Net proceeds from shares issued to shareholders due to reinvestment of distributions | | | — | | | — | | | — | | | — | | | — | | | — | |
| Net increase (decrease) in net assets applicable to common shares from capital share transactions | | | — | | | — | | | — | | | — | | | — | | | — | |
| Net increase (decrease) in net assets | | | 4,931,490 | | | 12,144,969 | | | 4,149,186 | | | 14,312,323 | | | 5,441,900 | | | 11,499,992 | |
| Net assets at the beginning of period | | | 251,296,171 | | | 239,151,202 | | | 259,380,884 | | | 245,068,561 | | | 200,153,014 | | | 188,653,022 | |
| Net assets at the end of period | | $ | 256,227,661 | | $ | 251,296,171 | | $ | 263,530,070 | | $ | 259,380,884 | | $ | 205,594,914 | | $ | 200,153,014 | |
| Undistributed (Over-distribution of) net investment income at the end of period | | $ | 1,618,764 | | $ | 1,295,658 | | $ | 592,060 | | $ | 459,787 | | $ | 1,241,908 | | $ | 952,063 | |
See accompanying notes to financial statements.
| | | California Select Tax-Free (NXC) | | New York Select Tax-Free (NXN) | |
| | | Year | | Year | | Year | | Year | |
| | | Ended | | Ended | | Ended | | Ended | |
| | | 3/31/16 | | 3/31/15 | | 3/31/16 | | 3/31/15 | |
| Operations | | | | | | | | | | | | | |
| Net investment income (loss) | | $ | 4,025,873 | | $ | 4,120,734 | | $ | 2,236,810 | | $ | 2,202,838 | |
| Net realized gain (loss) from: | | | | | | | | | | | | | |
| Investments | | | 145,143 | | | 268,393 | | | 21,067 | | | 179,673 | |
| Swaps | | | — | | | — | | | — | | | — | |
| Change in net unrealized appreciation (depreciation) of: | | | | | | | | | | | | | |
| Investments | | | 1,041,495 | | | 4,937,057 | | | (48,449 | ) | | 2,105,832 | |
| Swaps | | | — | | | — | | | — | | | — | |
| Net increase (decrease) in net assets from operations | | | 5,212,511 | | | 9,326,184 | | | 2,209,428 | | | 4,488,343 | |
| Distributions to Common Shareholders | | | | | | | | | | | | | |
| From net investment income | | | (4,087,892 | ) | | (4,297,578 | ) | | (2,166,034 | ) | | (2,251,577 | ) |
| From accumulated net realized gains | | | (107,389 | ) | | (696,581 | ) | | — | | | — | |
| Decrease in net assets applicable to common shares from distributions to common shareholders | | | (4,195,281 | ) | | (4,994,159 | ) | | (2,166,034 | ) | | (2,251,577 | ) |
| Capital Share Transactions | | | | | | | | | | | | | |
| Net proceeds from shares issued to shareholders due to reinvestment of distributions | | | 55,697 | | | 77,436 | | | — | | | — | |
| Net increase (decrease) in net assets applicable to common shares from capital share transactions | | | 55,697 | | | 77,436 | | | — | | | — | |
| Net increase (decrease) in net assets | | | 1,072,927 | | | 4,409,461 | | | 43,394 | | | 2,236,766 | |
| Net assets at the beginning of period | | | 97,420,734 | | | 93,011,273 | | | 56,988,023 | | | 54,751,257 | |
| Net assets at the end of period | | $ | 98,493,661 | | $ | 97,420,734 | | $ | 57,031,417 | | $ | 56,988,023 | |
| Undistributed (Over-distribution of) net investment income at the end of period | | $ | (19,828 | ) | $ | 42,191 | | $ | 39,249 | | $ | (27,673 | ) |
See accompanying notes to financial statements.
Selected data for a share outstanding throughout each period:
| | | | | Investment Operations | | Less Distributions | | | | | |
| | | Beginning
NAV | | Net
Investment
Income (Loss) | | Net
Realized/
Unrealized
Gain (Loss) | | Total | | From Net
Investment
Income | | From
Accumulated
Net Realized
Gains | | Total | | Ending
NAV | | Ending
Share
Price | |
| Select Tax-Free (NXP) | | | | | | | | | | | | | | | | | | | | | | | | | | | | |
| Year Ended 3/31: | | | | | | | | | | | | | | | | | | | | | | | | | | | | |
| 2016 | | $ | 15.17 | | $ | 0.58 | | $ | 0.27 | | $ | 0.85 | | $ | (0.56 | ) | $ | — | | $ | (0.56 | ) | $ | 15.46 | | $ | 14.89 | |
| 2015 | | | 14.43 | | | 0.60 | | | 0.76 | | | 1.36 | | | (0.62 | ) | | — | | | (0.62 | ) | | 15.17 | | | 14.51 | |
| 2014 | | | 15.03 | | | 0.66 | | | (0.62 | ) | | 0.04 | | | (0.64 | ) | | — | | | (0.64 | ) | | 14.43 | | | 13.48 | |
| 2013 | | | 14.55 | | | 0.69 | | | 0.48 | | | 1.17 | | | (0.69 | ) | | — | | | (0.69 | ) | | 15.03 | | | 14.63 | |
| 2012 | | | 13.58 | | | 0.73 | | | 0.96 | | | 1.69 | | | (0.72 | ) | | — | | | (0.72 | ) | | 14.55 | | | 14.57 | |
| | | | | | | | | | | | | | | | | | | | | | | | | | | | | |
| Select Tax-Free 2 (NXQ) | | | | | | | | | | | | | | | | | | | | | | | | | | | | |
| Year Ended 3/31: | | | | | | | | | | | | | | | | | | | | | | | | | | | | |
| 2016 | | | 14.64 | | | 0.55 | | | 0.23 | | | 0.78 | | | (0.54 | ) | | — | | | (0.54 | ) | | 14.88 | | | 14.13 | |
| 2015 | | | 13.83 | | | 0.58 | | | 0.83 | | | 1.41 | | | (0.60 | ) | | — | | | (0.60 | ) | | 14.64 | | | 13.94 | |
| 2014 | | | 14.38 | | | 0.62 | | | (0.54 | ) | | 0.08 | | | (0.63 | ) | | — | | | (0.63 | ) | | 13.83 | | | 13.12 | |
| 2013 | | | 13.89 | | | 0.65 | | | 0.47 | | | 1.12 | | | (0.63 | ) | | — | | | (0.63 | ) | | 14.38 | | | 13.99 | |
| 2012 | | | 12.89 | | | 0.66 | | | 0.98 | | | 1.64 | | | (0.64 | ) | | — | | | (0.64 | ) | | 13.89 | | | 13.63 | |
| (a) | Total Return Based on NAV is the combination of changes in NAV, reinvested dividend income at NAV and reinvested capital gains distributions at NAV, if any. The last dividend declared in the period, which is typically paid on the first business day of the following month, is assumed to be reinvested at the ending NAV. The actual reinvest price for the last dividend declared in the period may often be based on the Fund's market price (and not its NAV), and therefore may be different from the price used in the calculation. Total returns are not annualized. |
| | |
| | Total Return Based on Share Price is the combination of changes in the market price per share and the effect of reinvested dividend income and reinvested capital gains distributions, if any, at the average price paid per share at the time of reinvestment. The last dividend declared in the period, which is typically paid on the first business day of the following month, is assumed to be reinvested at the ending market price. The actual reinvestment for the last dividend declared in the period may take place over several days, and in some instances may not be based on the market price, so the actual reinvestment price may be different from the price used in the calculation. Total returns are not annualized. |
| | | | | | | | | Ratios/Supplemental Data | |
| | | Total Returns | | | | | Ratios to Average Net Assets | | | | |
| | | Based on
NAV | (a) | Based on
Share
Price | (a) | Ending
Net
Assets (000 | ) | Expenses | (b) | Net
Investment
Income (Loss | ) | Portfolio
Turnover
Rate | (c) |
| | | | | | | | | | | | | | | | | | | | |
| | | | | | | | | | | | | | | | | | | | |
| | | | 5.78 | % | | 6.82 | % | $ | 256,228 | | | 0.28 | % | | 3.88 | % | | 25 | % |
| | | | 9.52 | | | 12.42 | | | 251,296 | | | 0.32 | (d) | | 4.01 | (d) | | 28 | |
| | | | 0.38 | | | (3.37 | ) | | 239,151 | | | 0.29 | | | 4.60 | | | 40 | |
| | | | 8.16 | | | 5.14 | | | 249,134 | | | 0.28 | | | 4.64 | | | 24 | |
| | | | 12.72 | | | 15.72 | | | 240,691 | | | 0.31 | | | 5.18 | | | 19 | |
| | | | | | | | | | | | | | | | | | | | |
| | | | | | | | | | | | | | | | | | | | |
| | | | 5.46 | | | 5.46 | | | 263,530 | | | 0.33 | | | 3.76 | | | 23 | |
| | | | 10.32 | | | 11.00 | | | 259,381 | | | 0.37 | (d) | | 4.04 | (d) | | 19 | |
| | | | 0.73 | | | (1.51 | ) | | 245,069 | | | 0.34 | | | 4.58 | | | 23 | |
| | | | 8.20 | | | 7.29 | | | 254,694 | | | 0.33 | | | 4.54 | | | 19 | |
| | | | 12.97 | | | 15.32 | | | 245,784 | | | 0.35 | | | 4.94 | | | 20 | |
| (b) | The expense ratios reflect, among other things, the interest expense deemed to have been paid by the Fund on the floating rate certificates issued by the special purpose trusts for the self-deposited inverse floaters held by the Fund (as described in Note 3 – Portfolio Securities and Investments in Derivatives, Inverse Floating Rate Securities), where applicable, as follows: |
| Select Tax-Free (NXP) | | |
| Year Ended 3/31: | | |
| 2016 | — | % |
| 2015 | — | |
| 2014 | — | |
| 2013 | — | |
| 2012 | — | |
| Select Tax-Free 2 (NXQ) | | |
| Year Ended 3/31: | | |
| 2016 | — | % |
| 2015 | — | * |
| 2014 | — | * |
| 2013 | — | * |
| 2012 | — | * |
| (c) | Portfolio Turnover Rate is calculated based on the lesser of long-term purchases or sales (as disclosed in Note 5 – Investment Transactions) divided by the average long-term market value during the period. |
| | |
| (d) | During the fiscal year ended March 31, 2015, the Adviser voluntarily reimbursed the Fund for certain expenses incurred in connection with an equity shelf program. As a result, the Expenses and Net Investment Income (Loss) Ratios to Average Net Assets reflect this voluntary expense reimbursement. The Expenses and Net Investment Income (Loss) Ratios to Average Net Assets excluding this expense reimbursement from Adviser are as follows: |
| | Ratios to | |
| | Average Net Assets | |
| | | | Net Investment | |
| Select Tax-Free (NXP) | Expense | (b) | Income (Loss | ) |
| Year Ended 3/31: | | | | |
| 2015 | 0.35 | % | 3.98 | % |
| | Ratios to | |
| | Average Net Assets | |
| | | | Net Investment | |
| Select Tax-Free 2 (NXQ) | Expense | (b) | Income (Loss | ) |
| Year Ended 3/31: | | | | |
| 2015 | 0.40 | % | 4.01 | % |
| * | Rounds to less than 0.01%. |
See accompanying notes to financial statements.
Financial Highlights (continued)
Selected data for a share outstanding throughout each period:
| | | | | Investment Operations | | Less Distributions | | | | | |
| | | Beginning
NAV | | Net
Investment
Income (Loss) | | Net
Realized/
Unrealized
Gain (Loss) | | Total | | From Net
Investment
Income | | From
Accumulated
Net Realized
Gains | | Total | | Ending
NAV | | Ending
Share
Price | |
| Select Tax-Free 3 (NXR) | | | | | | | | | | | | | | | | | | | | | | | | | |
| Year Ended 3/31: | | | | | | | | | | | | | | | | | | | | | | | | | | | | |
| 2016 | | $ | 15.34 | | $ | 0.58 | | $ | 0.40 | | $ | 0.98 | | $ | (0.56 | ) | $ | — | | $ | (0.56 | ) | $ | 15.76 | | $ | 14.89 | |
| 2015 | | | 14.46 | | | 0.60 | | | 0.89 | | | 1.49 | | | (0.61 | ) | | — | | | (0.61 | ) | | 15.34 | | | 14.78 | |
| 2014 | | | 14.94 | | | 0.64 | | | (0.49 | ) | | 0.15 | | | (0.63 | ) | | — | | | (0.63 | ) | | 14.46 | | | 13.67 | |
| 2013 | | | 14.43 | | | 0.66 | | | 0.51 | | | 1.17 | | | (0.66 | ) | | — | | | (0.66 | ) | | 14.94 | | | 14.48 | |
| 2012 | | | 13.51 | | | 0.69 | | | 0.92 | | | 1.61 | | | (0.65 | ) | | (0.04 | ) | | (0.69 | ) | | 14.43 | | | 14.34 | |
| | | | | | | | | | | | | | | | | | | | | | | | | | | | | |
| California Select Tax-Free (NXC) | | | | | | | | | | | | | | | | | | | | | | | | | |
| Year Ended 3/31: | | | | | | | | | | | | | | | | | | | | | | | | | | | | |
| 2016 | | | 15.52 | | | 0.64 | | | 0.19 | | | 0.83 | | | (0.65 | ) | | (0.02 | ) | | (0.67 | ) | | 15.68 | | | 16.70 | |
| 2015 | | | 14.83 | | | 0.66 | | | 0.82 | | | 1.48 | | | (0.68 | ) | | (0.11 | ) | | (0.79 | ) | | 15.52 | | | 15.40 | |
| 2014 | | | 15.72 | | | 0.67 | | | (0.63 | ) | | 0.04 | | | (0.68 | ) | | (0.25 | ) | | (0.93 | ) | | 14.83 | | | 14.25 | |
| 2013 | | | 15.07 | | | 0.69 | | | 0.64 | | | 1.33 | | | (0.68 | ) | | — | | | (0.68 | ) | | 15.72 | | | 15.07 | |
| 2012 | | | 13.43 | | | 0.70 | | | 1.62 | | | 2.32 | | | (0.68 | ) | | — | | | (0.68 | ) | | 15.07 | | | 14.80 | |
| (a) | Total Return Based on NAV is the combination of changes in NAV, reinvested dividend income at NAV and reinvested capital gains distributions at net asset value, if any. The last dividend declared in the period, which is typically paid on the first business day of the following month, is assumed to be reinvested at the ending NAV. The actual reinvest price for the last dividend declared in the period may often be based on the Fund's market price (and not its NAV), and therefore may be different from the price used in the calculation. Total returns are not annualized. |
| | |
| | Total Return Based on Share Price is the combination of changes in the market price per share and the effect of reinvested dividend income and reinvested capital gains distributions, if any, at the average price paid per share at the time of reinvestment. The last dividend declared in the period, which is typically paid on the first business day of the following month, is assumed to be reinvested at the ending market price. The actual reinvestment for the last dividend declared in the period may take place over several days, and in some instances may not be based on the market price, so the actual reinvestment price may be different from the price used in the calculation. Total returns are not annualized. |
| | | | | | | Ratios/Supplemental Data | |
| | | Total Returns | | | | | Ratios to Average Net Assets | | | |
| | | | | | | | | | | | | | |
| | | Based on
NAV | (a) | Based on
Share
Price | (a) | Ending
Net
Assets (000 | ) | Expenses | (b) | Net
Investment
Income (Loss | ) | Portfolio
Turnover
Rate | (c) |
| | | | | | | | | | | | | | | | | | | | |
| | | | | | | | | | | | | | | | | | | | |
| | | | 6.56 | % | | 4.76 | % | $ | 205,595 | | | 0.34 | % | | 3.81 | % | | 22 | % |
| | | | 10.46 | | | 12.87 | | | 200,153 | | | 0.38 | (d) | | 3.99 | (d) | | 21 | |
| | | | 1.18 | | | (1.02 | ) | | 188,653 | | | 0.35 | | | 4.51 | | | 30 | |
| | | | 8.20 | | | 5.54 | | | 194,920 | | | 0.33 | | | 4.45 | | | 28 | |
| | | | 12.23 | | | 15.69 | | | 188,010 | | | 0.38 | | | 4.94 | | | 16 | |
| | | | | | | | | | | | | | | | | | | | |
| | | | | | | | | | | | | | | | | | | | |
| | | | 5.51 | | | 13.25 | | | 98,494 | | | 0.37 | | | 4.18 | | | 10 | |
| | | | 10.20 | | | 13.84 | | | 97,421 | | | 0.37 | | | 4.30 | | | 7 | |
| | | | 0.50 | | | 1.07 | | | 93,011 | | | 0.38 | | | 4.55 | | | 14 | |
| | | | 8.98 | | | 6.43 | | | 98,595 | | | 0.37 | | | 4.44 | | | 19 | |
| | | | 17.64 | | | 23.56 | | | 94,447 | | | 0.42 | | | 4.87 | | | 11 | |
| (b) | The expense ratios reflect, among other things, the interest expense deemed to have been paid by the Fund on the floating rate certificates issued by the special purpose trusts for the self-deposited inverse floaters held by the Fund (as described in Note 3 – Portfolio Securities and Investments in Derivatives, Inverse Floating Rate Securities), where applicable, as follows: |
| Select Tax-Free 3 (NXR) | | |
| Year Ended 3/31: | | |
| 2016 | — | % |
| 2015 | — | |
| 2014 | — | |
| 2013 | — | |
| 2012 | — | |
| California Select Tax-Free (NXC) | | |
| Year Ended 3/31: | | |
| 2016 | — | % |
| 2015 | — | |
| 2014 | 0.01 | |
| 2013 | 0.01 | |
| 2012 | 0.01 | |
| (c) | Portfolio Turnover Rate is calculated based on the lesser of long-term purchases or sales (as disclosed in Note 5 – Investment Transactions) divided by the average long-term market value during the period. |
| | |
| (d) | During the fiscal year ended March 31, 2015, the Adviser voluntarily reimbursed the Fund for certain expenses incurred in connection with an equity shelf program. As a result, the Expenses and Net Investment Income (Loss) Ratios to Average Net Assets reflect this voluntary expense reimbursement. The Expenses and Net Investment Income (Loss) Ratios to Average Net Assets excluding this expense reimbursement from Adviser are as follows: |
| | Ratios to | |
| | Average Net Assets | |
| | | Net Investment | |
| Select Tax-Free 3 (NXR) | Expenses(b) | Income (Loss) | |
| Year Ended 3/31: | | | |
| 2015 | 0.42% | 3.96 | % |
See accompanying notes to financial statements.
Financial Highlights (continued)
Selected data for a share outstanding throughout each period:
| | | | | Investment Operations | | Less Distributions | | | | | |
| | | Beginning
NAV | | Net
Investment
Income (Loss | ) | Net
Realized/
Unrealized
Gain (Loss | ) | Total | | From Net
Investment
Income | | From
Accumulated
Net Realized
Gains | | Total | | Ending
NAV | | Ending
Share
Price | |
| New York Select Tax-Free (NXN) | | | | | | | | | | | | | | | | | | | | | | | | | |
| Year Ended 3/31: | | | | | | | | | | | | | | | | | | | | | | | | | | | | |
| 2016 | | $ | 14.52 | | $ | 0.57 | | $ | (0.01 | ) | $ | 0.56 | | $ | (0.55 | ) | $ | — | | $ | (0.55 | ) | $ | 14.53 | | $ | 14.06 | |
| 2015 | | | 13.95 | | | 0.56 | | | 0.58 | | | 1.14 | | | (0.57 | ) | | — | | | (0.57 | ) | | 14.52 | | | 14.13 | |
| 2014 | | | 14.70 | | | 0.60 | | | (0.72 | ) | | (0.12 | ) | | (0.63 | ) | | — | * | | (0.63 | ) | | 13.95 | | | 13.41 | |
| 2013 | | | 14.59 | | | 0.63 | | | 0.19 | | | 0.82 | | | (0.65 | ) | | (0.06 | ) | | (0.71 | ) | | 14.70 | | | 14.87 | |
| 2012 | | | 13.71 | | | 0.66 | | | 0.86 | | | 1.52 | | | (0.64 | ) | | — | | | (0.64 | ) | | 14.59 | | | 14.10 | |
| (a) | Total Return Based on NAV is the combination of changes in NAV, reinvested dividend income at NAV and reinvested capital gains distributions at NAV, if any. The last dividend declared in the period, which is typically paid on the first business day of the following month, is assumed to be reinvested at the ending NAV. The actual reinvest price for the last dividend declared in the period may often be based on the Fund's market price (and not its NAV), and therefore may be different from the price used in the calculation. Total returns are not annualized. |
| | |
| | Total Return Based on Share Price is the combination of changes in the market price per share and the effect of reinvested dividend income and reinvested capital gains distributions, if any, at the average price paid per share at the time of reinvestment. The last dividend declared in the period, which is typically paid on the first business day of the following month, is assumed to be reinvested at the ending market price. The actual reinvestment for the last dividend declared in the period may take place over several days, and in some instances may not be based on the market price, so the actual reinvestment price may be different from the price used in the calculation. Total returns are not annualized. |
| | | | | | | | | Ratios/Supplemental Data | |
| | | Total Returns | | | | Ratios to Average Net Assets | | | |
| | | | | | | | | | | | | | |
| | | Based on
NAV | (a) | Based on
Share
Price | (a) | Ending
Net
Assets (000 | ) | Expenses | (b) | Net
Investment
Income (Loss | ) | Portfolio
Turnover
Rate | (c) |
| | | | | | | | | | | | | | | | | | | | |
| | | | | | | | | | | | | | | | | | | | |
| | | | 3.98 | % | | 3.63 | % | $ | 57,031 | | | 0.42 | % | | 3.97 | % | | 14 | % |
| | | | 8.31 | | | 9.84 | | | 56,988 | | | 0.43 | | | 3.92 | | | 16 | |
| | | | (0.69 | ) | | (5.46 | ) | | 54,751 | | | 0.43 | | | 4.35 | | | 26 | |
| | | | 5.66 | | | 10.60 | | | 57,684 | | | 0.39 | | | 4.27 | | | 23 | |
| | | | 11.25 | | | 13.05 | | | 57,170 | | | 0.50 | | | 4.62 | | | 19 | |
| (b) | The expense ratios reflect, among other things, the interest expense deemed to have been paid by the Fund on the floating rate certificates issued by the special purpose trusts for the self-deposited inverse floaters held by the Fund (as described in Note 3 – Portfolio Securities and Investments in Derivatives, Inverse Floating Rate Securities), where applicable, as follows: |
| New York Select Tax-Free (NXN) | | |
| Year Ended 3/31: | | |
| 2016 | 0.01 | % |
| 2015 | 0.01 | |
| 2014 | 0.01 | |
| 2013 | 0.01 | |
| 2012 | 0.01 | |
| (c) | Portfolio Turnover Rate is calculated based on the lesser of long-term purchases or sales (as disclosed in Note 5 – Investment Transactions) divided by the average long-term market value during the period. |
| * | Rounds to less than $0.01 per share. |
See accompanying notes to financial statements.
Notes to Financial Statements
1. General Information and Significant Accounting Policies
General Information
Fund Information
The funds covered in this report and their corresponding New York Stock Exchange ("NYSE") symbols are as follows (each a "Fund" and collectively, the "Funds"):
| | • | Nuveen Select Tax-Free Income Portfolio (NXP) ("Select Tax-Free (NXP)") |
| | • | Nuveen Select Tax-Free Income Portfolio 2 (NXQ) ("Select Tax-Free 2 (NXQ)") |
| | • | Nuveen Select Tax-Free Income Portfolio 3 (NXR) ("Select Tax-Free 3 (NXR)") |
| | • | Nuveen California Select Tax-Free Income Portfolio (NXC) ("California Select Tax-Free (NXC)") |
| | • | Nuveen New York Select Tax-Free Income Portfolio (NXN) ("New York Select Tax-Free (NXN)") |
The Funds are registered under the Investment Company Act of 1940, as amended, as diversified closed-end management investment companies. Select Tax-Free (NXP), Select Tax-Free 2 (NXQ), Select Tax-Free 3 (NXR), California Select Tax-Free (NXC) and New York Select Tax-Free (NXN) were organized as Massachusetts business trusts on January 29, 1992, March 30, 1992, May 28, 1992, March 30, 1992, and March 30, 1992, respectively.
The end of the reporting period for the Funds is March 31, 2016, and the period covered by these Notes to Financial Statements is the fiscal year ended March 31, 2016 (the "current fiscal period").
Investment Adviser
The Funds' investment adviser is Nuveen Fund Advisors, LLC (the "Adviser"), a wholly-owned subsidiary of Nuveen Investments, Inc. ("Nuveen"). Nuveen is an operating division of TIAA Global Asset Management. The Adviser is responsible for each Fund's overall investment strategy and asset allocation decisions. The Adviser has entered into sub-advisory agreements with Nuveen Asset Management, LLC, (the "Sub-Adviser"), a subsidiary of the Adviser, under which the Sub-Adviser manages the investment portfolios of the Funds.
Investment Objectives and Principal Investment Strategies
Each Fund seeks to provide current income and stable dividends, exempt from regular federal and designated state income taxes, where applicable, consistent with the preservation of capital by investing primarily in a portfolio of municipal obligations.
Significant Accounting Policies
Each Fund is an investment company and follows accounting and reporting guidance under Financial Accounting Standards Board (FASB) Accounting Standards Codification (ASC) Topic 946 "Financial Services – Investment Companies." The following is a summary of significant accounting policies followed by the Funds in the preparation of their financial statements in accordance with U.S. generally accepted accounting principles ("U.S. GAAP").
Investment Transactions
Investment transactions are recorded on a trade date basis. Realized gains and losses from investment transactions are determined on the specific identification method, which is the same basis used for federal income tax purposes. Investments purchased on a when-issued/delayed delivery basis may have extended settlement periods. Any investments so purchased are subject to market fluctuation during this period. The Funds have earmarked securities in their portfolios with a current value at least equal to the amount of the when-issued/delayed delivery purchase commitments.
As of the end of the reporting period, the Funds did not have any outstanding when-issued/delayed delivery purchase commitments.
Investment Income
Investment income, which reflects the amortization of premiums and accretion of discounts for financial reporting purposes, is recorded on an accrual basis. Investment income also reflects paydown gains and losses, if any.
Professional Fees
Professional fees presented on the Statement of Operations consist of legal fees incurred in the normal course of operations, audit fees, tax consulting fees and, in some cases, workout expenditures. Workout expenditures are incurred in an attempt to protect or enhance an investment or to pursue other claims or legal actions on behalf of Fund shareholders. If a refund is received for workout expenditures paid in a prior reporting period, such amounts will be recognized as "Legal fee refund" on the Statement of Operations.
Dividends and Distributions to Shareholders
Dividends from net investment income are declared monthly. Net realized capital gains and/or market discount from investment transactions, if any, are distributed to shareholders at least annually. Furthermore, capital gains are distributed only to the extent they exceed available capital loss carryforwards.
Distributions to shareholders of net investment income, net realized capital gains and/or market discount, if any, are recorded on the ex-dividend date. The amount and timing of distributions are determined in accordance with federal income tax regulations, which may differ from U.S. GAAP.
Indemnifications
Under the Funds' organizational documents, their officers and trustees are indemnified against certain liabilities arising out of the performance of their duties to the Funds. In addition, in the normal course of business, the Funds enter into contracts that provide general indemnifications to other parties. The Funds' maximum exposure under these arrangements is unknown as this would involve future claims that may be made against the Funds that have not yet occurred. However, the Funds have not had prior claims or losses pursuant to these contracts and expect the risk of loss to be remote.
Netting Agreements
In the ordinary course of business, the Funds may enter into transactions subject to enforceable International Swaps and Derivative Association, Inc. ("ISDA") master agreements or other similar arrangements ("netting agreements"). Generally, the right to offset in netting agreements allows each Fund to offset certain securities and derivatives with a specific counterparty as well as any collateral received or delivered to that counterparty based on the terms of the agreements. Generally, each Fund manages its cash collateral and securities collateral on a counterparty basis.
The Funds' investments subject to netting agreements as of the end of the reporting period, if any, are further described in Note 3 – Portfolio Securities and Investments in Derivatives.
Use of Estimates
The preparation of financial statements in conformity with U.S. GAAP requires management to make estimates and assumptions that affect the reported amounts of assets and liabilities at the date of the financial statements and the reported amounts of increases and decreases in net assets from operations during the reporting period. Actual results may differ from those estimates.
2. Investment Valuation and Fair Value Measurements
The fair valuation input levels as described below are for fair value measurement purposes.
Fair value is defined as the price that would be received upon selling an investment or transferring a liability in an orderly transaction to an independent buyer in the principal or most advantageous market for the investment. A three-tier hierarchy is used to maximize the use of observable market data and minimize the use of unobservable inputs and to establish classification of fair value measurements for disclosure purposes. Observable inputs reflect the assumptions market participants would use in pricing the asset or liability. Observable inputs are based on market data obtained from sources independent of the reporting entity. Unobservable inputs reflect the reporting entity's own assumptions about the assumptions market participants would use in pricing the asset or liability. Unobservable inputs are based on the best information available in the circumstances. The following is a summary of the three-tiered hierarchy of valuation input levels.
| | Level 1 – | Inputs are unadjusted and prices are determined using quoted prices in active markets for identical securities. |
| | Level 2 – | Prices are determined using other significant observable inputs (including quoted prices for similar securities, interest rates, prepayment speeds, credit risk, etc.). |
| | Level 3 – | Prices are determined using significant unobservable inputs (including management's assumptions in determining the fair value of investments). |
Prices of fixed income securities are provided by an independent pricing service approved by the Funds' Board of Trustees (the "Board"). The pricing service establishes a security's fair value using methods that may include consideration of the following: yields or prices of investments of comparable quality, type of issue, coupon, maturity and rating, market quotes or indications of value from security dealers, evaluations of anticipated cash flows or collateral, general market conditions and other information and analysis, including the obligor's credit characteristics considered relevant. These securities are generally classified as Level 2. In pricing certain securities, particularly less liquid and lower quality securities, the pricing service may consider information about a security, its issuer or market activity provided by the Adviser. These securities are generally classified as Level 2 or Level 3 depending on the priority of the significant inputs.
Prices of swap contracts are also provided by a pricing service approved by the Board using the same methods as described above and are generally classified as Level 2.
Certain securities may not be able to be priced by the pre-established pricing methods as described above. Such securities may be valued by the Board and/or its appointee at fair value. These securities generally include, but are not limited to, restricted securities (securities which may not be publicly sold without registration under the Securities Act of 1933, as amended) for which a pricing service is unable to provide a market price; securities whose trading has been formally suspended; debt securities that have gone into default and for which there is no current market quotation; a
Notes to Financial Statements (continued)
security whose market price is not available from a pre-established pricing source; a security with respect to which an event has occurred that is likely to materially affect the value of the security after the market has closed but before the calculation of a Fund's net asset value ("NAV") (as may be the case in non-U.S. markets on which the security is primarily traded) or make it difficult or impossible to obtain a reliable market quotation; and a security whose price, as provided by the pricing service, is not deemed to reflect the security's fair value. As a general principle, the fair value of a security would appear to be the amount that the owner might reasonably expect to receive for it in a current sale. A variety of factors may be considered in determining the fair value of such securities, which may include consideration of the following: yields or prices of investments of comparable quality, type of issue, coupon, maturity and rating, market quotes or indications of value from security dealers, evaluations of anticipated cash flows or collateral, general market conditions and other information and analysis, including the obligor's credit characteristics considered relevant. These securities are generally classified as Level 2 or Level 3 depending on the priority of the significant inputs. Regardless of the method employed to value a particular security, all valuations are subject to review by the Board and/or its appointee.
The inputs or methodologies used for valuing securities are not an indication of the risks associated with investing in those securities. The following is a summary of each Fund's fair value measurements as of the end of the reporting period:
| Select Tax-Free (NXP) | | | Level 1 | | | Level 2 | | | Level 3 | | | Total | |
| Long-Term Investments: | | | | | | | | | | | | | |
| Municipal Bonds* | | $ | — | | $ | 253,782,975 | | $ | — | | $ | 253,782,975 | |
| Corporate Bonds** | | | — | | | — | | | 7,971 | *** | | 7,971 | |
| Investments in Derivatives: | | | | | | | | | | | | | |
| Interest Rate Swaps**** | | | — | | | (443,326 | ) | | — | | | (443,326 | ) |
| Total | | $ | — | | $ | 253,339,649 | | $ | 7,971 | | $ | 253,347,620 | |
| | | | | | | | | | | | | | |
| Select Tax-Free 2 (NXQ) | | | | | | | | | | | | | |
| Long-Term Investments: | | | | | | | | | | | | | |
| Municipal Bonds* | | $ | — | | $ | 258,389,596 | | $ | — | | $ | 258,389,596 | |
| Corporate Bonds** | | | — | | | — | | | 12,468 | *** | | 12,468 | |
| Total | | $ | — | | $ | 258,389,596 | | $ | 12,468 | | $ | 258,402,064 | |
| | | | | | | | | | | | | | |
| Select Tax-Free 3 (NXR) | | | | | | | | | | | | | |
| Long-Term Investments: | | | | | | | | | | | | | |
| Municipal Bonds* | | $ | — | | $ | 201,318,638 | | $ | — | | $ | 201,318,638 | |
| Corporate Bonds** | | | — | | | — | | | 3,513*** | | | 3,513 | |
| Investments in Derivatives: | | | | | | | | | | | | | |
| Interest Rate Swaps**** | | | — | | | (299,545 | ) | | — | | | (299,545 | ) |
| Total | | $ | — | | $ | 201,019,093 | | $ | 3,513 | | $ | 201,022,606 | |
| | | | | | | | | | | | | | |
| California Select Tax-Free (NXC) | | | | | | | | | | | | | |
| Long-Term Investments*: | | | | | | | | | | | | | |
| Municipal Bonds | | $ | — | | $ | 97,178,804 | | $ | — | | $ | 97,178,804 | |
| | | | | | | | | | | | | | |
| New York Select Tax-Free (NXN) | | | | | | | | | | | | | |
| Long-Term Investments*: | | | | | | | | | | | | | |
| Municipal Bonds | | $ | — | | $ | 55,582,639 | | $ | — | | $ | 55,582,639 | |
| Short-Term Investments*: | | | | | | | | | | | | | |
| Municipal Bonds | | | — | | | 750,000 | | | — | | | 750,000 | |
| Total | | $ | — | | $ | 56,332,639 | | $ | — | | $ | 56,332,639 | |
| * | Refer to the Fund's Portfolio of Investments for state classifications. |
| ** | Refer to the Fund's Portfolio of Investments for industry classifications. |
| *** | Refer to the Fund's Portfolio of Investments for securities classified as Level 3. |
| **** | Represents net unrealized appreciation (depreciation) as reported in the Fund's Portfolio of Investments. |
The Board is responsible for the valuation process and has appointed the oversight of the daily valuation process to the Adviser's Valuation Committee. The Valuation Committee, pursuant to the valuation policies and procedures adopted by the Board, is responsible for making fair value determinations, evaluating the effectiveness of the Funds' pricing policies and reporting to the Board. The Valuation Committee is aided in its efforts by the Adviser's dedicated Securities Valuation Team, which is responsible for administering the daily valuation process and applying fair value methodologies as approved by the Valuation Committee. When determining the reliability of independent pricing services for investments owned by the Funds, the Valuation Committee, among other things, conducts due diligence reviews of the pricing services and monitors the quality of security prices received through various testing reports conducted by the Securities Valuation Team.
The Valuation Committee will consider pricing methodologies it deems relevant and appropriate when making a fair value determination, based on the facts and circumstances specific to the portfolio instrument. Fair value determinations generally will be derived as follows, using public or private market information:
| | (i) | | If available, fair value determinations shall be derived by extrapolating from recent transactions or quoted prices for identical or comparable securities. |
| | | | |
| | (ii) | | If such information is not available, an analytical valuation methodology may be used based on other available information including, but not limited to: analyst appraisals, research reports, corporate action information, issuer financial statements and shelf registration statements. Such analytical valuation methodologies may include, but are not limited to: multiple of earnings, discount from market value of a similar freely-traded security, discounted cash flow analysis, book value or a multiple thereof, risk premium/yield analysis, yield to maturity and/or fundamental investment analysis. |
The purchase price of a portfolio instrument will be used to fair value the instrument only if no other valuation methodology is available or deemed appropriate, and it is determined that the purchase price fairly reflects the instrument's current value.
For each portfolio security that has been fair valued pursuant to the policies adopted by the Board, the fair value price is compared against the last available and next available market quotations. The Valuation Committee reviews the results of such testing and fair valuation occurrences are reported to the Board.
3. Portfolio Securities and Investments in Derivatives
Portfolio Securities
Inverse Floating Rate Securities
Each Fund is authorized to invest in inverse floating rate securities. An inverse floating rate security is created by depositing a municipal bond (referred to as an "Underlying Bond"), typically with a fixed interest rate, into a special purpose tender option bond ("TOB") trust (referred to as the "TOB Trust") created by or at the direction of one or more Funds. In turn, the TOB Trust issues (a) floating rate certificates (referred to as "Floaters"), in face amounts equal to some fraction of the Underlying Bond's par amount or market value, and (b) an inverse floating rate certificate (referred to as an "Inverse Floater") that represents all remaining or residual interest in the TOB Trust. Floaters typically pay short-term tax-exempt interest rates to third parties who are also provided a right to tender their certificate and receive its par value, which may be paid from the proceeds of a remarketing of the Floaters, by a loan to the TOB Trust from a third party liquidity provider ("Liquidity Provider"), or by the sale of assets from the TOB Trust. The Inverse Floater is issued to a long term investor, such as one or more of the Funds. The income received by the Inverse Floater holder varies inversely with the short-term rate paid to holders of the Floaters, and in most circumstances the Inverse Floater holder bears substantially all of the Underlying Bond's downside investment risk and also benefits disproportionately from any potential appreciation of the Underlying Bond's value. The value of an Inverse Floater will be more volatile than that of the Underlying Bond because the interest rate is dependent on not only the fixed coupon rate of the Underlying Bond but also on the short-term interest paid on the Floaters, and because the Inverse Floater essentially bears the risk of loss (and possible gain) of the greater face value of the Underlying Bond.
The Inverse Floater held by a Fund gives the Fund the right to (a) cause the holders of the Floaters to tender their certificates at par (or slightly more than par in certain circumstances), and (b) have the trustee of the TOB Trust (the "Trustee") transfer the Underlying Bond held by the TOB Trust to the Fund, thereby collapsing the TOB Trust.
The Fund may acquire an Inverse Floater in a transaction where it (a) transfers an Underlying Bond that it owns to a TOB Trust created by a third party or (b) transfers an Underlying Bond that it owns, or that it has purchased in a secondary market transaction for the purpose of creating an Inverse Floater, to a TOB Trust created at its direction, and in return receives the Inverse Floater of the TOB Trust (referred to as a "self-deposited Inverse Floater"). A Fund may also purchase an Inverse Floater in a secondary market transaction from a third party creator of the TOB Trust without first owning the Underlying Bond (referred to as an "externally-deposited Inverse Floater").
An investment in a self-deposited Inverse Floater is accounted for as a "financing" transaction (i.e., a secured borrowing). For a self-deposited Inverse Floater, the Underlying Bond deposited into the TOB Trust is identified in the Fund's Portfolio of Investments as "(UB) – Underlying bond of an inverse floating rate trust reflected as a financing transaction," with the Fund recognizing as liabilities, labeled "Floating rate obligations" on the Statement of Assets and Liabilities, (a) the liquidation value of Floaters issued by the TOB Trust, and (b) the amount of any borrowings by the TOB Trust from a Liquidity Provider to enable the TOB Trust to purchase outstanding Floaters in lieu of a remarketing. In addition, the Fund recognizes in "Investment Income" the entire earnings of the Underlying Bond, and recognizes (a) the interest paid to the holders of the Floaters or on the TOB Trust's borrowings, and (b) other expenses related to remarketing, administration, trustee, liquidity and other services to a TOB Trust, as a component of "Interest expense" on the Statement of Operations.
In contrast, an investment in an externally-deposited Inverse Floater is accounted for as a purchase of the Inverse Floater and is identified in the Fund's Portfolio of Investments as "(IF) – Inverse floating rate investment." For an externally-deposited Inverse Floater, a Fund's Statement of Assets and Liabilities recognizes the Inverse Floater and not the Underlying Bond as an asset, and the Fund does not recognize the Floaters, or any related borrowings from a Liquidity Provider, as a liability. Additionally, the Fund reflects in "Investment Income" only the net amount of earnings on the Inverse Floater (net of the interest paid to the holders of the Floaters or the Liquidity Provider as lender, and the expenses of the Trust), and does not show the amount of that interest paid or the expenses of the TOB Trust as described above as interest expense on the Statement of Operations.
Notes to Financial Statements (continued)
Fees paid upon the creation of a TOB Trust for self-deposited Inverse Floaters and externally-deposited Inverse Floaters are recognized as part of the cost basis of the Inverse Floater and are capitalized over the term of the TOB Trust.
As of the end of the reporting period, the aggregate value of Floaters issued by each Fund's TOB Trust for self-deposited Inverse Floaters and externally-deposited Inverse Floaters was as follows:
| | | Select | | Select | | Select | | California | | New York | |
| | | Tax-Free | | Tax-Free 2 | | Tax-Free 3 | | Select Tax-Free | | Select Tax-Free | |
| Floating Rate Obligations Outstanding | | (NXP | ) | (NXQ | ) | (NXR | ) | (NXC | ) | (NXN | ) |
| Floating rate obligations: self-deposited Inverse Floaters | | $ | — | | $ | — | | $ | — | | $ | — | | $ | 1,005,000 | |
| Floating rate obligations: externally-deposited Inverse Floaters | | | 3,300,000 | | | 4,800,000 | | | 1,050,000 | | | — | | | 4,250,000 | |
| Total | | $ | 3,300,000 | | $ | 4,800,000 | | $ | 1,050,000 | | $ | — | | $ | 5,255,000 | |
During the current fiscal period, the average amount of Floaters (including any borrowings from a Liquidity Provider) outstanding, and the average annual interest rate and fees related to self-deposited Inverse Floaters, were as follows:
| | | Select | | Select | | Select | | California | | New York | |
| | | Tax-Free | | Tax-Free 2 | | Tax-Free 3 | | Select Tax-Free | | Select Tax-Free | |
| Self-Deposited Inverse Floaters | | (NXP | ) | (NXQ | ) | (NXR | ) | (NXC | ) | (NXN | ) |
| Average floating rate obligations outstanding | | $ | — | | $ | — | | $ | — | | $ | — | | $ | 1,005,000 | |
| Average annual interest rate and fees | | | — | % | | — | % | | — | % | | — | % | | 0.54 | % |
TOB Trusts are supported by a liquidity facility provided by a Liquidity Provider pursuant to which the Liquidity Provider agrees, in the event that Floaters are (a) tendered to the Trustee for remarketing and the remarketing does not occur, or (b) subject to mandatory tender pursuant to the terms of the TOB Trust agreement, to either purchase Floaters or to provide the Trustee with an advance from a loan facility to fund the purchase of Floaters by the TOB Trust. In certain circumstances, the Liquidity Provider may otherwise elect to have the Trustee sell the Underlying Bond to retire the Floaters that were tendered and not remarketed prior to providing such a loan. In these circumstances, the Liquidity Provider remains obligated to provide a loan to the extent that the proceeds of the sale of the Underlying Bond is not sufficient to pay the purchase price of the Floaters.
The size of the commitment under the loan facility for a given TOB Trust is at least equal to the balance of that TOB Trust's outstanding Floaters plus any accrued interest. In consideration of the loan facility, fee schedules are in place and are charged by the Liquidity Provider(s). Any loans made by the Liquidity Provider will be secured by the purchased Floaters held by the TOB Trust. Interest paid on any outstanding loan balances will be effectively borne by the Fund that owns the Inverse Floaters of the TOB Trust that has incurred the borrowing and may be at a rate that is greater than the rate that would have been paid had the Floaters been successfully remarketed.
As described above, any amounts outstanding under a liquidity facility are recognized as a component of "Floating rate obligations" on the Statement of Assets and Liabilities by the Fund holding the corresponding Inverse Floaters issued by the borrowing TOB Trust. As of the end of the reporting period, there were no loans outstanding under any such facility.
Each Fund may also enter into shortfall and forbearance agreements (sometimes referred to as a "recourse arrangement" or "credit recovery swap") (TOB Trusts involving such agreements are referred to herein as "Recourse Trusts"), under which a Fund agrees to reimburse the Liquidity Provider for the Trust's Floaters, in certain circumstances, for the amount (if any) by which the liquidation value of the Underlying Bond held by the TOB Trust may fall short of the sum of the liquidation value of the Floaters issued by the TOB Trust plus any amounts borrowed by the TOB Trust from the Liquidity Provider, plus any shortfalls in interest cash flows. Under these agreements, a Fund's potential exposure to losses related to or on an Inverse Floater may increase beyond the value of the Inverse Floater as a Fund may potentially be liable to fulfill all amounts owed to holders of the Floaters or the Liquidity Provider. Any such shortfall amount in the aggregate is recognized as "Unrealized depreciation on Recourse Trusts" on the Statement of Assets and Liabilities.
As of the end of the reporting period, each Fund's maximum exposure to the Floaters issued by Recourse Trusts for self-deposited Inverse Floaters and externally-deposited Inverse Floaters was as follows:
| | | | | | | | | California | | New York | |
| | | Select | | Select | | Select | | Select | | Select | |
| | | Tax-Free | | Tax-Free 2 | | Tax-Free 3 | | Tax-Free | | Tax-Free | |
| Floating Rate Obligations – Recourse Trusts | | | (NXP | ) | | (NXQ | ) | | (NXR | ) | | (NXC | ) | | (NXN | ) |
| Maximum exposure to Recourse Trusts: self-deposited Inverse Floaters | | $ | — | | $ | — | | $ | — | | $ | — | | $ | — | |
| Maximum exposure to Recourse Trusts: externally-deposited Inverse Floaters | | | 1,050,000 | | | 1,050,000 | | | 1,050,000 | | | — | | | 2,360,000 | |
| Total | | $ | 1,050,000 | | $ | 1,050,000 | | $ | 1,050,000 | | $ | — | | $ | 2,360,000 | |
Zero Coupon Securities
A zero coupon security does not pay a regular interest coupon to its holders during the life of the security. Income to the holder of the security comes from accretion of the difference between the original purchase price of the security at issuance and the par value of the security at maturity and is effectively paid at maturity. The market prices of zero coupon securities generally are more volatile than the market prices of securities that pay interest periodically.
Investments in Derivatives
In addition to the inverse floating rate securities in which each Fund invests, which are considered portfolio securities for financial reporting purposes, each Fund is authorized to invest in certain other derivative instruments such as futures, options and swap contracts. Each Fund limits its investments in futures, options on futures and swap contracts to the extent necessary for the Adviser to claim the exclusion from registration by the Commodity Futures Trading Commission as a commodity pool operator with respect to the Fund. The Funds record derivative instruments at fair value, with changes in fair value recognized on the Statement of Operations, when applicable. Even though the Funds' investments in derivatives may represent economic hedges, they are not considered to be hedge transactions for financial reporting purposes.
Interest Rate Swap Contracts
Interest rate swap contracts involve a Fund's agreement with the counterparty to pay or receive a fixed rate payment in exchange for the counterparty receiving or paying a variable rate payment. Forward interest rate swap contracts involve a Fund's agreement with a counterparty to pay, in the future, a fixed or variable rate payment in exchange for the counterparty paying the Fund a variable or fixed rate payment, the accruals for which begin at a specified date in the future (the "effective date").
The amount of the payment obligation for an interest rate swap is based on the notional amount and the termination date of the contract. Interest rate swap contracts do not involve the delivery of securities or other underlying assets or principal. Accordingly, the risk of loss with respect to the swap counterparty on such transactions is limited to the net amount of interest payments that the Fund is to receive.
Interest rate swap contracts are valued daily. Upon entering into an interest rate swap contract (and beginning on the effective date for a forward interest rate swap contract), the Fund accrues the fixed rate payment expected to be paid or received and the variable rate payment expected to be received or paid on the interest rate swap contracts on a daily basis, and recognizes the daily change in the fair value of the Fund's contractual rights and obligations under the contracts. For an over-the-counter ("OTC") swap that is not cleared through a clearing house ("OTC Uncleared"), the net amount recorded on these transactions, for each counterparty, is recognized on the Statement of Assets and Liabilities as a component of "Unrealized appreciation or depreciation on interest rate swaps (, net)."
Upon the execution of an OTC swap cleared through a clearing house ("OTC Cleared"), the Fund is obligated to deposit cash or eligible securities, also known as "initial margin," into an account at its clearing broker equal to a specified percentage of the contract amount. Cash deposited by the Fund to cover initial margin requirements on open swap contracts, if any, is recognized as a component of "Cash collateral at brokers" on the Statement of Assets and Liabilities. Investments in OTC Cleared swaps obligate the Fund and the clearing broker to settle monies on a daily basis representing changes in the prior day's "mark-to-market" of the swap contract. If the Fund has unrealized appreciation, the clearing broker will credit the Fund's account with an amount equal to the appreciation. Conversely, if the Fund has unrealized depreciation, the clearing broker will debit the Fund's account with an amount equal to the depreciation. These daily cash settlements are also known as "variation margin." Variation margin for OTC Cleared swaps is recognized as a receivable and/or payable for "Variation margin on swap contracts" on the Statement of Assets and Liabilities. Upon the execution of an OTC Uncleared swap, neither the Fund nor the counterparty is required to deposit initial margin as the trades are recorded bilaterally between both parties to the swap contract, and the terms of the variation margin are subject to a predetermined threshold negotiated by the Fund and the counterparty. Variation margin for OTC Uncleared swaps is recognized as a component of "Unrealized appreciation or depreciation on interest rate swaps (, net)" as described in the preceding paragraph.
The net amount of periodic payments settled in cash are recognized as a component of "Net realized gain (loss) from swaps" on the Statement of Operations, in addition to the net realized gain or loss recorded upon the termination of the swap contract. For tax purposes, payments expected to be received or paid on the swap contracts are treated as ordinary income or expense, respectively. Changes in the value of the swap contracts during the fiscal period are recognized as a component of "Change in net unrealized appreciation (depreciation) of swaps" on the Statement of Operations. In certain instances, payments are made or received upon entering into the swap contract to compensate for differences between the stated terms of the swap agreements and prevailing market conditions (credit spreads, currency exchange rates, interest rates, and other relevant factors). Payments received or made at the beginning of the measurement period, if any, are recognized as "Interest rate swaps premiums paid and/or received" on the Statement of Assets and Liabilities.
Notes to Financial Statements (continued)
During the current fiscal period, Select Tax-Free (NXP) and Select Tax-Free 3 (NXR) used forward interest rate swap contracts as part of their duration management in order to reduce their price volatility risk to movements in U.S. interest rates relative to their benchmarks.
The average notional amount of interest rate swap contracts outstanding during the current fiscal period was as follows:
| | | | Select | | | Select | |
| | | | Tax-Free | | | Tax-Free 3 | |
| | | | (NXP | ) | | (NXR | ) |
| Average notional amount of interest rate swap contracts outstanding* | | $ | 11,520,000 | | $ | 6,660,000 | |
* The average notional amount is calculated based on the outstanding notional at the beginning of the fiscal period and at the end of each fiscal quarter within the current fiscal period.
The following table presents the fair value of all swap contracts held by the Funds as of the end of the reporting period, the location of these instruments on the Statement of Assets and Liabilities and the primary underlying risk exposure.
| | | | | Location on the Statement of Assets and Liabilities | |
| Underlying | | Derivative | | Asset Derivatives | | (Liability) Derivatives | |
| Risk Exposure | | Instrument | | Location | | | | | Value | | Location | | | Value | |
| Select Tax-Free (NXP) | | | | | | | | | | | | | | | |
| Interest rate | | Swaps (OTC) | | — | | | | $ | — | | Unrealized depreciation on | | $ | (443,326 | ) |
| | | | | | | | | | | | interest rate swaps | | | | |
| Select Tax-Free 3 (NXR) | | | | | | | | | | | | | | | |
| Interest rate | | Swaps (OTC) | | — | | | | $ | — | | Unrealized depreciation on | | $ | (299,545 | ) |
| | | | | | | | | | | | interest rate swaps | | | | |
The following table presents the swap contracts subject to netting agreements and the collateral delivered related to those swap contracts as of the end of the reporting period.
| | | | | Gross | | Gross | | Amounts | | Net Unrealized | | | | | |
| | | | | Unrealized | | Unrealized | | Netted on | | Appreciation | | Collateral | | | |
| | | | | Appreciation on | | (Depreciation) on | | Statement of | | (Depreciation) on | | Pledged | | | |
| | | | | Interest Rate | | Interest Rate | | Assets and | | Interest Rate | | to (from | ) | Net | |
| Fund | | Counterparty | | Swaps | * | Swaps | * | Liabilities | | Swaps | | Counterparty | | Exposure | |
| Select Tax-Free (NXP) | | JPMorgan Chase Bank, N.A. | | $ | — | | $ | (443,326 | ) | $ | — | | $ | (443,326 | ) | $ | 443,326 | | $ | — | |
| Select Tax-Free 3 (NXR) | | JPMorgan Chase Bank, N.A. | | $ | — | | $ | (299,545 | ) | $ | — | | $ | (299,545 | ) | $ | 262,569 | | $ | (36,976 | ) |
* Represents gross unrealized appreciation (depreciation) for the counterparty as reported in the Fund's Portfolio of Investments.
The following table presents the amount of net realized gain (loss) and change in net unrealized appreciation (depreciation) recognized on swap contracts on the Statement of Operations during the current fiscal period, and the primary underlying risk exposure.
| | | | | | | | | Change in Net | |
| | | | | | | Net Realized | | Unrealized Appreciation | |
| | | Underlying | | Derivative | | Gain (Loss) from | | (Depreciation) of | |
| Fund | | Risk Exposure | | Instrument | | Swaps | | Swaps | |
| Select Tax-Free (NXP) | | | Interest rate | | | Swaps | | $ | (2,455,336 | ) | $ | 2,088,861 | |
| | | | | | | | | | | | | | |
| Select Tax-Free 3 (NXR) | | | Interest rate | | | Swaps | | $ | (1,439,664 | ) | $ | 1,319,464 | |
Market and Counterparty Credit Risk
In the normal course of business each Fund may invest in financial instruments and enter into financial transactions where risk of potential loss exists due to changes in the market (market risk) or failure of the other party to the transaction to perform (counterparty credit risk). The potential loss could exceed the value of the financial assets recorded on the financial statements. Financial assets, which potentially expose each Fund to counterparty credit risk, consist principally of cash due from counterparties on forward, option and swap transactions, when applicable. The extent of each Fund's exposure to counterparty credit risk in respect to these financial assets approximates their carrying value as recorded on the Statement of Assets and Liabilities.
Each Fund helps manage counterparty credit risk by entering into agreements only with counterparties the Adviser believes have the financial resources to honor their obligations and by having the Adviser monitor the financial stability of the counterparties. Additionally, counterparties may be required to pledge collateral daily (based on the daily valuation of the financial asset) on behalf of each Fund with a value approximately equal to the amount of any unrealized gain above a pre-determined threshold. Reciprocally, when each Fund has an unrealized loss, the Funds have instructed the custodian to pledge assets of the Funds as collateral with a value approximately equal to the amount of the unrealized loss above a pre-determined threshold. Collateral pledges are monitored and subsequently adjusted if and when the valuations fluctuate, either up or down, by at least the pre-determined threshold amount.
4. Fund Shares
Transactions in shares during the Funds' current and prior fiscal period were as follows:
| | | Select | | Select | | Select | |
| | | Tax-Free (NXP) | | Tax-Free 2 (NXQ) | | Tax-Free 3 (NXR) | |
| | | Year | | Year | | Year | | Year | | Year | | Year | |
| | | Ended | | Ended | | Ended | | Ended | | Ended | | Ended | |
| | | 3/31/16 | | 3/31/15 | | 3/31/16 | | 3/31/15 | | 3/31/16 | | 3/31/15 | |
| Shares issued to shareholders due to reinvestment of distributions | | | — | | | — | | | — | | | — | | | — | | | — | |
| | | California Select | | New York Select | |
| | | Tax-Free (NXC) | | Tax-Free (NXN) | |
| | | Year | | Year | | Year | | Year | |
| | | Ended | | Ended | | Ended | | Ended | |
| | | 3/31/16 | | 3/31/15 | | 3/31/16 | | 3/31/15 | |
| Shares issued to shareholders due to reinvestment of distributions | | | 3,614 | | | 5,022 | | | — | | | — | |
5. Investment Transactions
Long-term purchases and sales (including maturities but excluding derivative transactions, where applicable) during the current fiscal period were as follows:
| | | Select | | Select | | Select | | California | | New York | |
| | | Tax-Free | | Tax-Free 2 | | Tax-Free 3 | | Select Tax-Free | | Select Tax-Free | |
| | | (NXP | ) | (NXQ | ) | (NXR | ) | (NXC | ) | (NXN | ) |
| Purchases | | $ | 60,757,535 | | $ | 61,224,368 | | $ | 42,587,464 | | $ | 9,642,010 | | $ | 9,529,153 | |
| Sales and maturities | | | 65,967,946 | | | 57,366,956 | | | 46,411,885 | | | 13,306,296 | | | 7,578,074 | |
6. Income Tax Information
Each Fund is a separate taxpayer for federal income tax purposes. Each Fund intends to distribute substantially all of its net investment income and net capital gains to shareholders and to otherwise comply with the requirements of Subchapter M of the Internal Revenue Code applicable to regulated investment companies. Therefore, no federal income tax provision is required. Furthermore, each Fund intends to satisfy conditions that will enable interest from municipal securities, which is exempt from regular federal and designated state income taxes, to retain such tax-exempt status when distributed to shareholders of the Funds. Net realized capital gains and ordinary income distributions paid by the Funds are subject to federal taxation.
For all open tax years and all major taxing jurisdictions, management of the Funds has concluded that there are no significant uncertain tax positions that would require recognition in the financial statements. Open tax years are those that are open for examination by taxing authorities (i.e., generally the last four tax year ends and the interim tax period since then). Furthermore, management of the Funds is also not aware of any tax positions for which it is reasonably possible that the total amounts of unrecognized tax benefits will significantly change in the next twelve months.
The following information is presented on an income tax basis. Differences between amounts for financial statement and federal income tax purposes are primarily due to timing differences in recognizing taxable market discount, timing differences in recognizing certain gains and losses on investment transactions and the treatment of investments in inverse floating rate securities reflected as financing transactions, if any. To the extent that differences arise that are permanent in nature, such amounts are reclassified within the capital accounts as detailed below. Temporary differences do not require reclassification. Temporary and permanent differences do not impact the NAVs of the Funds.
As of March 31, 2016, the cost and unrealized appreciation (depreciation) of investments (excluding investments in derivatives, where applicable), as determined on a federal income tax basis, were as follows:
| | | Select | | Select | | Select | | California | | New York | |
| | | Tax-Free | | Tax-Free 2 | | Tax-Free 3 | | Select Tax-Free | | Select Tax-Free | |
| | | (NXP | ) | (NXQ | ) | (NXR | ) | (NXC | ) | (NXN | ) |
| Cost of investments | | $ | 220,074,744 | | $ | 229,580,725 | | $ | 170,956,672 | | $ | 86,299,848 | | $ | 51,221,986 | |
| Gross unrealized: | | | | | | | | | | | | | | | | |
| Appreciation | | $ | 34,237,926 | | $ | 29,322,120 | | $ | 30,859,037 | | $ | 10,881,661 | | $ | 4,129,523 | |
| Depreciation | | | (521,724 | ) | | (500,781 | ) | | (493,558 | ) | | (2,705 | ) | | (21,720 | ) |
| Net unrealized appreciation (depreciation) of investments | | $ | 33,716,202 | | $ | 28,821,339 | | $ | 30,365,479 | | $ | 10,878,956 | | $ | 4,107,803 | |
Notes to Financial Statements (continued)
Permanent differences, primarily due to taxable market discount and expiration of capital loss carryforwards, resulted in reclassifications among the Funds' components of net assets as of March 31, 2016, the Funds' tax year end, as follows:
| | | Select | | Select | | Select | | California | | New York | |
| | | Tax-Free | | Tax-Free 2 | | Tax-Free 3 | | Select Tax-Free | | Select Tax-Free | |
| | | (NXP | ) | (NXQ | ) | (NXR | ) | (NXC | ) | (NXN | ) |
| Paid-in-surplus | | $ | 1 | | $ | (7,597 | ) | $ | — | | $ | — | | $ | — | |
| Undistributed (Over-distribution of) net investment income | | | (34,352 | ) | | (31,280 | ) | | (2,644 | ) | | — | | | (3,854 | ) |
| Accumulated net realized gain (loss) | | | 34,351 | | | 38,877 | | | 2,644 | | | — | | | 3,854 | |
The tax components of undistributed net tax-exempt income, net ordinary income and net long-term capital gains as of March 31, 2016, the Funds' tax year end, were as follows:
| | | Select | | Select | | Select | | California | | New York | |
| | | Tax-Free | | Tax-Free 2 | | Tax-Free 3 | | Select Tax-Free | | Select Tax-Free | |
| | | (NXP | ) | (NXQ | ) | (NXR | ) | (NXC | ) | (NXN | ) |
Undistributed net tax-exempt income1 | | $ | 699,887 | | $ | 264,324 | | $ | 85,176 | | $ | 261,069 | | $ | 197,493 | |
Undistributed net ordinary income2 | | | — | | | 7,994 | | | — | | | — | | | 3,431 | |
| Undistributed net long-term capital gains | | | — | | | — | | | — | | | 135,478 | | | — | |
| 1 | Undistributed net tax-exempt income (on a tax basis) has not been reduced for the dividend declared on March 1, 2016, paid on April 1, 2016. |
| 2 | Net ordinary income consists of taxable market discount income and net short-term capital gains, if any. |
The tax character of distributions paid during the Funds' tax years ended March 31, 2016 and March 31, 2015, was designated for purposes of the dividends paid deduction as follows:
| | | Select | | Select | | Select | | California | | New York | |
| | | Tax-Free | | Tax-Free 2 | | Tax-Free 3 | | Select Tax-Free | | Select Tax-Free | |
| 2016 | | (NXP | ) | (NXQ | ) | (NXR | ) | (NXC | ) | (NXN | ) |
Distributions from net tax-exempt income3 | | $ | 9,246,154 | | $ | 9,538,842 | | $ | 7,319,179 | | $ | 4,115,952 | | $ | 2,166,034 | |
Distributions from net ordinary income2 | | | 106,131 | | | 8,857 | | | 16,341 | | | — | | | — | |
Distributions from net long-term capital gains4 | | | — | | | — | | | — | | | 107,389 | | | — | |
| | | Select | | Select | | Select | | California | | New York | |
| | | Tax-Free | | Tax-Free 2 | | Tax-Free 3 | | Select Tax-Free | | Select Tax-Free | |
| 2015 | | (NXP | ) | (NXQ | ) | (NXR | ) | (NXC | ) | (NXN | ) |
| Distributions from net tax-exempt income | | $ | 10,240,452 | | $ | 10,601,668 | | $ | 8,003,452 | | $ | 4,291,650 | | $ | 2,248,402 | |
Distributions from net ordinary income2 | | | 33,141 | | | 65,541 | | | 3,914 | | | 5,641 | | | 16,909 | |
| Distributions from net long-term capital gains | | | — | | | — | | | — | | | 696,581 | | | — | |
| 2 | Net ordinary income consists of taxable market discount income and net short-term capital gains, if any. |
| 3 | The Funds hereby designate these amounts paid during the fiscal year ended March 31, 2016, as Exempt Interest Dividends. |
| 4 | The Funds designate as long-term capital gain dividend, pursuant to the Internal Revenue Code Section 852(b)(3) the amount necessary to reduce earnings and profits of the Funds related to net capital gain to zero for the tax year ended March 31, 2016. |
As of March 31, 2016, the Funds' tax year end, the following Funds had unused capital loss carryforwards available for federal income tax purposes to be applied against future capital gains, if any. If not applied, the carryforwards will expire as shown in the following table. The losses not subject to expiration will be utilized first by a Fund.
| | | | Select | | | Select | | | Select | | | New York | |
| | | | Tax-Free | | | Tax-Free 2 | | | Tax-Free 3 | | | Select Tax-Free | |
| | | | (NXP | ) | | (NXQ | ) | | (NXR | ) | | (NXN | ) |
| Expiration: | | | | | | | | | | | | | |
| March 31, 2017 | | $ | — | | $ | 400,800 | | $ | — | | $ | — | |
| March 31, 2019 | | | — | | | 335,742 | | | — | | | — | |
| Not subject to expiration | | | 7,264,283 | | | 10,505,383 | | | 3,630,123 | | | 979,137 | |
| Total | | $ | 7,264,283 | | $ | 11,241,925 | | $ | 3,630,123 | | $ | 979,137 | |
During the Funds' tax year ended, March 31, 2016, New York Select Tax-Free (NXN) utilized $24,921 of its capital loss carryforward.
As of March 31, 2016, the Funds' tax year end, $7,597, of Select Tax-Free 2's (NXQ) capital loss carryforward expired.
7. Management Fees and Other Transactions with Affiliates
Management Fees
Each Fund's management fee compensates the Adviser for overall investment advisory and administrative services and general office facilities. The Sub-Adviser is compensated for its services to the Funds from the management fees paid to the Adviser.
Each Fund's management fee consists of two components – a fund-level fee, based only on the amount of assets within each individual Fund, and a complex-level fee, based on the aggregate amount of all eligible fund assets managed by the Adviser. This pricing structure enables Fund shareholders to benefit from growth in the assets within their respective Fund as well as from growth in the amount of complex-wide assets managed by the Adviser.
The annual Fund-level fee, payable monthly, for each Fund is calculated according to the following schedule:
| | | | Select Tax-Free 2 (NXQ) |
| | | | Select Tax-Free 3 (NXR) |
| | | | California Select Tax-Free (NXC) |
| | Select Tax-Free (NXP) | New York Select Tax-Free (NXN) |
| Average Daily Net Assets* | Fund-Level Fee | Fund-Level Fee |
| For the first $125 million | 0.0500 | % | 0.1000 | % |
| For the next $125 million | 0.0375 | | 0.0875 | |
| For the next $250 million | 0.0250 | | 0.0750 | |
| For the next $500 million | 0.0125 | | 0.0625 | |
The annual complex-level fee, payable monthly, for each Fund is calculated by multiplying the current complex-wide fee rate, determined according to the following schedule by the Fund's daily net assets:
| Complex-Level Managed Asset Breakpoint Level* | Effective Rate at Breakpoint Level |
| $55 billion | 0.2000 | % |
| $56 billion | 0.1996 | |
| $57 billion | 0.1989 | |
| $60 billion | 0.1961 | |
| $63 billion | 0.1931 | |
| $66 billion | 0.1900 | |
| $71 billion | 0.1851 | |
| $76 billion | 0.1806 | |
| $80 billion | 0.1773 | |
| $91 billion | 0.1691 | |
| $125 billion | 0.1599 | |
| $200 billion | 0.1505 | |
| $250 billion | 0.1469 | |
| $300 billion | 0.1445 | |
| * | For the complex-level fees, managed assets include closed-end fund assets managed by the Adviser that are attributable to certain types of leverage. For these purposes, leverage includes the funds' use of preferred stock and borrowings and certain investments in the residual interest certificates (also called inverse floating rate securities) in tender option bond (TOB) trusts, including the portion of assets held by a TOB trust that has been effectively financed by the trust's issuance of floating rate securities, subject to an agreement by the Adviser as to certain funds to limit the amount of such assets for determining managed assets in certain circumstances. The complex-level fee is calculated based upon the aggregate daily managed assets of all Nuveen funds that constitute "eligible assets." Eligible assets do not include assets attributable to investments in other Nuveen funds or assets in excess of a determined amount (orignally $2 billion) added to the Nuveen fund complex in connection with the Adviser's assumption of the management of the former First American Funds effective January 1, 2011. As of March 31, 2016, the complex-level fee for each Fund was 0.1632%. |
The Funds pay no compensation directly to those of its trustees who are affiliated with the Adviser or to its officers, all of whom receive remuneration for their services to the Funds from the Adviser or its affiliates. The Board has adopted a deferred compensation plan for independent trustees that enables trustees to elect to defer receipt of all or a portion of the annual compensation they are entitled to receive from certain Nuveen-advised funds. Under the plan, deferred amounts are treated as though equal dollar amounts had been invested in shares of select Nuveen-advised funds.
Notes to Financial Statements (continued)
Other Transactions with Affiliates
Each Fund is permitted to purchase or sell securities from or to certain other funds managed by the Adviser ("inter-fund trade") under specified conditions outlined in procedures adopted by the Board. These procedures have been designed to ensure that any inter-fund trade of securities by the Fund from or to another fund that is, or could be, considered an affiliate of the Fund under certain limited circumstances by virtue of having a common investment adviser (or affiliated investment adviser), common officer and/or common trustee complies with Rule 17a-7 of the 1940 Act. Further, as defined under these procedures, each inter-fund trade is effected at the current market price as provided by an independent pricing service. Unsettled inter-fund trades as of the end of the reporting period are recognized as a component of "Receivable for investments sold" and/or "Payable for investments purchased" on the Statement of Assets and Liabilities, when applicable.
During the current fiscal period, the following Fund engaged in inter-fund trades pursuant to these procedures as follows:
| | | | Select | |
| | | | Tax-Free | |
| | | | (NXP | ) |
| Purchases | | $ | 948,797 | |
| Sales | | | — | |
8. Borrowing Arrangements
Uncommitted Line of Credit
During the current fiscal period, the Funds participated in an unsecured bank line of credit ("Unsecured Credit Line") under which outstanding balances would bear interest at a variable rate. On December 31, 2015, California Select Tax Free (NXC) and New York Select Tax Free (NXN) utilized $479,308 and $161,666, respectively, of the Unsecured Credit Line each at an annualized interest rate of 1.68% on its respective outstanding balance. The remaining Funds in this report did not draw on this Unsecured Credit Line during the current fiscal period.
Committed Line of Credit
During the current fiscal period, the Funds, along with certain other funds managed by the Adviser ("Participating Funds"), have established a 364-day, $2.53 billion standby credit facility with a group of lenders, under which the Participating Funds may borrow for various purposes other than leveraging for investment purposes. A large portion of this facility's capacity (and its associated costs as described below) is currently dedicated for use by a small number of Participating Funds, which does not include any of the Funds covered by this shareholder report. The remaining capacity under the facility (and the corresponding portion of the facility's annual costs) is separately dedicated to most of the other open-end funds in the Nuveen fund family, along with a number of Nuveen closed-end funds, including all of the Funds covered by this shareholder report. The credit facility expires in July 2016 unless extended or renewed.
The credit facility has the following terms: a fee of 0.15% per annum on unused commitment amounts, and interest at a rate equal to the higher of (a) one-month LIBOR (London Inter-Bank Offered Rate) plus 1.25% per annum or (b) the Fed Funds rate plus 1.25% per annum on amounts borrowed. Participating Funds paid administration, legal and arrangement fees, which are recognized as a component of "Other expenses" on the Statement of Operations, and along with commitment fees, have been allocated among such Participating Funds based upon the relative proportions of the facility's aggregate capacity reserved for them and other factors deemed relevant by the Adviser and the Board of each Participating Fund.
During the current fiscal period, none of the Funds utilized this facility.
Additional Fund Information (Unaudited) |
| Board of Trustees | | | | | | | | | | |
| William Adams IV* | | Jack B. Evans | | William C. Hunter | | David J. Kundert | | John K. Nelson | | William J. Schneider |
| Thomas S. Schreier, Jr.** | | Judith M. Stockdale | | Carole E. Stone | | Terence J. Toth | | Margaret L. Wolff | | |
| | | | | | | | | | | |
| * | Interested Board Member. |
| ** | Interested Board Member and will retire from the Funds' Board of Trustees effective May 31,2016. |
| | | | | | | | | |
| | | | | | | | | |
| Fund Manager | | Custodian | | Legal Counsel | | Independent Registered | | Transfer Agent and |
| Nuveen Fund Advisors, LLC | | State Street Bank | | Chapman and Cutler LLP | | Public Accounting Firm | | Shareholder Services |
| 333 West Wacker Drive | | & Trust Company | | Chicago, IL 60603 | | KPMG LLP | | State Street Bank |
| Chicago, IL 60606 | | Boston, MA 02111 | | | | Chicago, IL 60601 | | & Trust Company |
| | | | | | | | | Nuveen Funds |
| | | | | | | | | P.O. Box 43071 |
| | | | | | | | | Providence, RI 02940-3071 |
| | | | | | | | | (800) 257-8787 |
| | | | | | | | | |
Quarterly Form N-Q Portfolio of Investments Information
Each Fund is required to file its complete schedule of portfolio holdings with the Securities and Exchange Commission (SEC) for the first and third quarters of each fiscal year on Form N-Q. You may obtain this information directly from the SEC. Visit the SEC on-line at http://www.sec.gov or in person at the SEC's Public Reference Room in Washington, D.C. Call the SEC toll-free at (800) SEC-0330 for room hours and operation.
Nuveen Funds' Proxy Voting Information
You may obtain (i) information regarding how each fund voted proxies relating to portfolio securities held during the most recent twelve-month period ended June 30, without charge, upon request, by calling Nuveen Investments toll-free at (800) 257-8787 or on Nuveen's website at www.nuveen.com and (ii) a description of the policies and procedures that each fund used to determine how to vote proxies relating to portfolio securities without charge, upon request, by calling Nuveen Investments toll free at (800) 257-8787. You may also obtain this information directly from the SEC. Visit the SEC on-line at http://www.sec.gov.
CEO Certification Disclosure
Each Fund's Chief Executive Officer (CEO) has submitted to the New York Stock Exchange (NYSE) the annual CEO certification as required by Section 303A.12(a) of the NYSE Listed Company Manual. Each Fund has filed with the SEC the certification of its CEO and Chief Financial Officer required by Section 302 of the Sarbanes-Oxley Act.
Share Repurchases
Each Fund intends to repurchase, through its open-market share repurchase program, shares of its own common stock at such times and in such amounts as is deemed advisable. During the period covered by this report, each Fund repurchased shares of its common stock as shown in the accompanying table. Any future repurchases will be reported to shareholders in the next annual or semi-annual report.
| | NXP | NXQ | NXR | NXC | NXN | |
| Shares repurchased | — | — | — | — | — | |
FINRA BrokerCheck
The Financial Industry Regulatory Authority (FINRA) provides information regarding the disciplinary history of FINRA member firms and associated investment professionals. This information as well as an investor brochure describing FINRA BrokerCheck is available to the public by calling the FINRA BrokerCheck Hotline number at (800) 289-9999 or by visiting www.FINRA.org.
Glossary of Terms Used in this Report (Unaudited) |
| ■ | Auction Rate Bond: An auction rate bond is a security whose interest payments are adjusted periodically through an auction process, which process typically also serves as a means for buying and selling the bond. Auctions that fail to attract enough buyers for all the shares offered for sale are deemed to have "failed," with current holders receiving a formula-based interest rate until the next scheduled auction. |
| | |
| ■ | Average Annual Total Return: This is a commonly used method to express an investment's performance over a particular, usually multi-year time period. It expresses the return that would have been necessary each year to equal the investment's actual cumulative performance (including change in NAV or market price and reinvested dividends and capital gains distributions, if any) over the time period being considered. |
| | |
| ■ | Duration: Duration is a measure of the expected period over which a bond's principal and interest will be paid, and consequently is a measure of the sensitivity of a bond's or bond fund's value to changes when market interest rates change. Generally, the longer a bond's or fund's duration, the more the price of the bond or fund will change as interest rates change. |
| | |
| ■ | Effective Leverage: Effective leverage is a fund's effective economic leverage, and includes both regulatory leverage (see leverage) and the leverage effects of certain derivative investments in the fund's portfolio. Currently, the leverage effects of Tender Option Bond (TOB) inverse floater holdings are included in effective leverage values, in addition to any regulatory leverage. |
| | |
| ■ | Forward Interest Rate Swap: A contractual agreement between two counterparties under which one party agrees to make periodic payments to the other for an agreed period of time based on a fixed rate, while the other party agrees to make periodic payments based on a floating rate of interest based on an underlying index. Alternatively, both series of cashflows to be exchanged could be calculated using floating rates of interest but floating rates that are based upon different underlying indexes. |
| | |
| ■ | Gross Domestic Product (GDP): The total market value of all final goods and services produced in a country/region in a given year, equal to total consumer, investment and government spending, plus the value of exports, minus the value of imports. |
| | |
| ■ | Inverse Floating Rate Securities: Inverse floating rate securities, also known as inverse floaters or tender option bonds (TOBs), are created by depositing a municipal bond, typically with a fixed interest rate, into a special purpose trust. This trust, in turn, (a) issues floating rate certificates typically paying short-term tax-exempt interest rates to third parties in amounts equal to some fraction of the deposited bond's par amount or market value, and (b) issues an inverse floating rate certificate (sometimes referred to as an "inverse floater") to an investor (such as a fund) interested in gaining investment exposure to a long-term municipal bond. The income received by the holder of the inverse floater varies inversely with the short-term rate paid to the floating rate certificates' holders, and in most circumstances the holder of the inverse floater bears substantially all of the underlying bond's downside investment risk. The holder of the inverse floater typically also benefits disproportionately from any potential appreciation of the underlying bond's value. Hence, an inverse floater essentially represents an investment in the underlying bond on a leveraged basis. |
| | |
| ■ | Leverage: Leverage is created whenever a fund has investment exposure (both reward and/or risk) equivalent to more than 100% of the investment capital. |
| | |
| ■ | Lipper California Municipal Debt Funds Classification Average: Calculated using the returns of all closed-end funds in this category. Lipper returns account for the effects of management fees and assume reinvestment of distributions, but do not reflect any applicable sales charges. |
| ■ | Lipper General and Insured Unleveraged Municipal Debt Funds Classification Average: Calculated using the returns of all closed-end funds in this category. Lipper returns account for the effects of management fees and assume reinvestment of distributions, but do not reflect any applicable sales charges. |
| | |
| ■ | Lipper New York Municipal Debt Funds Classification Average: Calculated using the returns of all closed-end funds in this category. Lipper returns account for the effects of management fees and assume reinvestment of distributions, but do not reflect any applicable sales charges. |
| | |
| ■ | Net Asset Value (NAV) Per Share: A fund's Net Assets is equal to its total assets (securities, cash, accrued earnings and receivables) less its total liabilities. NAV per share is equal to the fund's Net Assets divided by its number of shares outstanding. |
| | |
| ■ | Pre-Refunding: Pre-Refunding, also known as advanced refundings or refinancings, is a procedure used by state and local governments to refinance municipal bonds to lower interest expenses. The issuer sells new bonds with a lower yield and uses the proceeds to buy U.S. Treasury securities, the interest from which is used to make payments on the higher-yielding bonds. Because of this collateral, pre-refunding generally raises a bond's credit rating and thus its value. |
| | |
| ■ | Regulatory Leverage: Regulatory leverage consists of preferred shares issued by or borrowings of a fund. Both of these are part of a fund's capital structure. Regulatory leverage is subject to asset coverage limits set in the Investment Company Act of 1940. |
| | |
| ■ | S&P Municipal Bond California Index: An unleveraged, market value-weighted index designed to measure the performance of the tax-exempt, investment grade California municipal bond market. Index returns assume reinvestment of distributions, but do not reflect any applicable sales charges or management fees. |
| | |
| ■ | S&P Municipal Bond Index: An unleveraged, market value-weighted index designed to measure the performance of the tax-exempt, investment grade U.S. municipal bond market. Index returns assume reinvestment of distributions, but do not reflect any applicable sales charges or management fees. |
| | |
| ■ | S&P Municipal Bond New York Index: An unleveraged, market value-weighted index designed to measure the performance of the tax-exempt, investment grade New York municipal bond market. Index returns assume reinvestment of distributions, but do not reflect any applicable sales charges or management fees. |
| | |
| ■ | Total Investment Exposure: Total investment exposure is a fund's assets managed by the Adviser that are attributable to financial leverage. For these purposes, financial leverage includes a fund's use of preferred stock and borrowings and investments in the residual interest certificates (also called inverse floating rate securities) in tender option bond (TOB) trusts, including the portion of assets held by a TOB trust that has been effectively financed by the trust's issuance of floating rate securities. |
| | |
| ■ | Zero Coupon Bond: A zero coupon bond does not pay a regular interest coupon to its holders during the life of the bond. Income to the holder of the bond comes from accretion of the difference between the original purchase price of the bond at issuance and the par value of the bond at maturity and is effectively paid at maturity. The market prices of zero coupon bonds generally are more volatile than the market prices of bonds that pay interest periodically. |
| Reinvest Automatically, Easily and Conveniently | |
Nuveen makes reinvesting easy. A phone call is all it takes to set up your reinvestment account.
Nuveen Closed-End Funds Automatic Reinvestment Plan
Nuveen Closed-End Fund allows you to conveniently reinvest distributions in additional Fund shares. By choosing to reinvest, you'll be able to invest money regularly and automatically, and watch your investment grow through the power of compounding. Just like distributions in cash, there may be times when income or capital gains taxes may be payable on distributions that are reinvested. It is important to note that an automatic reinvestment plan does not ensure a profit, nor does it protect you against loss in a declining market.
Easy and convenient
To make recordkeeping easy and convenient, each month you'll receive a statement showing your total distributions, the date of investment, the shares acquired and the price per share, and the total number of shares you own.
How shares are purchased
The shares you acquire by reinvesting will either be purchased on the open market or newly issued by the Fund. If the shares are trading at or above net asset value at the time of valuation, the Fund will issue new shares at the greater of the net asset value or 95% of the then-current market price. If the shares are trading at less than net as -set value, shares for your account will be purchased on the open market. If the Plan Agent begins purchasing Fund shares on the open market while shares are trading below net asset value, but the Fund's shares subsequently trade at or above their net asset value before the Plan Agent is able to complete its purchases, the Plan Agent may cease open-market purchases and may invest the uninvested portion of the distribution in newly-issued Fund shares at a price equal to the greater of the shares' net asset value or 95% of the shares' market value on the last business day imme -diately prior to the purchase date. Distributions received to purchase shares in the open market will normally be invested shortly after the distribution payment date. No interest will be paid on distributions awaiting reinvestment. Because the market price of the shares may increase before purchases are completed, the average purchase price per share may exceed the market price at the time of valuation, resulting in the acquisition of fewer shares than if the distribution had been paid in shares issued by the Fund. A pro rata portion of any applicable brokerage commissions on open market purchases will be paid by Plan participants. These commissions usually will be lower than those charged on individual transactions.
Flexible
You may change your distribution option or withdraw from the Plan at any time, should your needs or situation change. You can reinvest whether your shares are registered in your name, or in the name of a brokerage firm, bank, or other nominee. Ask your investment advisor if his or her firm will participate on your behalf. Participants whose shares are registered in the name of one firm may not be able to transfer the shares to another firm and continue to participate in the Plan. The Fund reserves the right to amend or terminate the Plan at any time. Although the Fund reserves the right to amend the Plan to include a service charge payable by the participants, there is no direct service charge to participants in the Plan at this time.
Call today to start reinvesting distributions
For more information on the Nuveen Automatic Reinvestment Plan or to enroll in or withdraw from the Plan, speak with your financial advisor or call us at (800) 257-8787.
Board Members & Officers (Unaudited) | |
The management of the Funds, including general supervision of the duties performed for the Funds by the Adviser, is the responsibility of the Board of Trustees of the Funds. The number of trustees of the Funds is currently set at eleven. None of the trustees who are not "interested" persons of the Funds (referred to herein as "independent trustees") has ever been a director or employee of, or consultant to, Nuveen or its affiliates. The names and business addresses of the trustees and officers of the Funds, their principal occupations and other affiliations during the past five years, the number of portfolios each oversees and other directorships they hold are set forth below.
| | Name, | | | Position(s) Held | | Year First | | Principal | | Number |
| | Year of Birth | | | with the Funds | | Elected or | | Occupation(s) | | of Portfolios |
| | & Address | | | | | Appointed | | Including other | | in Fund Complex |
| | | | | | | and Term(1) | | Directorships | | Overseen by |
| | | | | | | | | During Past 5 Years | | Board Member |
| | | | | | | | | | | |
| Independent Board Members: | | | | | | |
| | | | | | | | | | | |
| ■ | WILLIAM J. SCHNEIDER
1944
333 W. Wacker Drive
Chicago, IL 6o6o6 | | | Chairman and
Board Member | | 1996
Class III | | Chairman of Miller-Valentine Partners, a real estate investment company; Board Member of Med-America Health System and WDPR Public Radio station; formerly, Senior Partner and Chief Operating Officer (retired (2004) of Miller-Valentine Group; formerly, Board member, Business Advisory Council of the Cleveland Federal Reserve Bank and University of Dayton Business School Advisory Council; past Chair and Director, Dayton Development Coalition. | | 189 |
| | | | | | | | | | | |
| ■ | JACK B. EVANS
1948
333 W. Wacker Drive
Chicago, IL 6o6o6 | | | Board Member | | 1999
Class III | | President, The Hall-Perrine Foundation, a private philanthropic corporation (since 1996); Director and Chairman, United Fire Group, a publicly held company; Director, The Gazette Company; Life Trustee of Coe College and the Iowa College Foundation; formerly, President Pro-Tem of the Board of Regents for the State of Iowa University System; formerly, Director, Alliant Energy; formerly, Director, Federal Reserve Bank of Chicago; formerly, President and Chief Operating Officer, SCI Financial Group, Inc., a regional financial services firm. | | 189 |
| | | | | | | | | | | |
| ■ | WILLIAM C. HUNTER
1948
333 W. Wacker Drive
Chicago, IL 6o6o6 | | | Board Member | | 2004
Class I | | Dean Emeritus, formerly, Dean, Tippie College of Business, University of Iowa (2006-2012); Director (since 2004) of Xerox Corporation; Director (since 2005), and past President (2010-2014) Beta Gamma Sigma, Inc., The International Business Honor Society; Director of Wellmark, Inc. (since 2009); formerly, Dean and Distinguished Professor of Finance, School of Business at the University of Connecticut (2003-2006); previously, Senior Vice President and Director of Research at the Federal Reserve Bank of Chicago (1995-2003); formerly, Director (1997-2007), Credit Research Center at Georgetown University. | | 189 |
| | | | | | | | | | | |
| ■ | DAVID J. KUNDERT
1942
333 W. Wacker Drive
Chicago, IL 6o6o6 | | | Board Member | | 2005
Class II | | Formerly, Director, Northwestern Mutual Wealth Management Company (2006-2013), retired (since 2004) as Chairman, JPMorgan Fleming Asset Management, President and CEO, Banc One Investment Advisors Corporation, and President, One Group Mutual Funds; prior thereto, Executive Vice President, Banc One Corporation and Chairman and CEO, Banc One Investment Management Group; Regent Emeritus, Member of Investment Committee, Luther College; member of the Wisconsin Bar Association; member of Board of Directors and Chair of Investment Committee, Greater Milwaukee Foundation; member of the Board of Directors (Milwaukee), College Possible; Board member of Milwaukee Repertory Theatre (since 2016). | | 189 |
Board Members & Officers (Unaudited) (continued)
| | Name, | | | Position(s) Held | | Year First | | Principal | | Number |
| | Year of Birth | | | with the Funds | | Elected or | | Occupation(s) | | of Portfolios |
| | & Address | | | | | Appointed | | Including other | | in Fund Complex |
| | | | | | | and Term(1) | | Directorships | | Overseen by |
| | | | | | | | | During Past 5 Years | | Board Member |
| | | | | | | | | | | |
| Independent Board Members (continued): | | | | | | |
| | | | | | | | | | | |
| ■ | JOHN K. NELSON
1962
333 W. Wacker Drive
Chicago, IL 6o6o6 | | | Board Member | | 2013
Class II | | Member of Board of Directors of Core12 LLC (since 2008), a private firm which develops branding, marketing and communications strategies for clients; Director of The Curran Center for Catholic American Studies (since 2009) and The President's Council, Fordham University (since 2010); formerly, senior external advisor to the financial services practice of Deloitte Consulting LLP (2012- 2014): formerly, Chairman of the Board of Trustees of Marian University (2010 as trustee, 2011-2014 as Chairman); formerly, Chief Executive Officer of ABN AMRO N.V. North America, and Global Head of its Financial Markets Division (2007-2008); prior senior positions held at ABN AMRO include Corporate Executive Vice President and Head of Global Markets-the Americas (2006- 2007), CEO of Wholesale Banking North America and Global Head of Foreign Exchange and Futures Markets (2001-2006), and Regional Commercial Treasurer and Senior Vice President Trading – North America (1996-2001); formerly, Trustee at St. Edmund Preparatory School in New York City. | | 189 |
| | | | | | | | | | | |
| ■ | JUDITH M. STOCKDALE
1947
333 W. Wacker Drive
Chicago, IL 6o6o6 | | | Board Member | | 1997
Class I | | Board Member, Land Trust Alliance (since 2013) and U.S. Endowment for Forestry and Communities (since 2013); formerly, Executive Director (1994-2012), Gaylord and Dorothy Donnelley Foundation; prior thereto, Executive Director, Great Lakes Protection Fund (1990-1994). | | 189 |
| | | | | | | | | | | |
| ■ | CAROLE E. STONE
1947
333 W. Wacker Drive
Chicago, IL 6o6o6 | | | Board Member | | 2007
Class I | | Director, Chicago Board Options Exchange, Inc. (since 2006); Director, C2 Options Exchange, Incorporated (since 2009); Director, CBOE Holdings, Inc. (since 2010); formerly, Commissioner, New York State Commission on Public Authority Reform (2005-2010). | | 189 |
| | | | | | | | | | | |
| ■ | TERENCE J. TOTH
1959
333 W. Wacker Drive
Chicago, IL 6o6o6 | | | Board Member | | 2008
Class II | | Managing Partner, Promus Capital (since 2008); Director, Fulcrum IT Service LLC (since 2010), Quality Control Corporation (since 2012) and LogicMark LLC (since 2012); member: Chicago Fellowship Board (since 2005), Catalyst Schools of Chicago Board (since 2008) and Mather Foundation Board (since 2012), and chair of its investment committee; formerly, Director, Legal & General Investment Management America, Inc. (2008-2013); formerly, CEO and President, Northern Trust Global Investments (2004-2007): Executive Vice President, Quantitative Management & Securities Lending (2000-2004); prior thereto, various positions with Northern Trust Company (since 1994); formerly, Member, Northern Trust Mutual Funds Board (2005-2007), Northern Trust Global Investments Board (2004-2007), Northern Trust Japan Board (2004-2007), Northern Trust Securities Inc. Board (2003-2007) and Northern Trust Hong Kong Board (1997-2004). | | 189 |
| | | | | | | | | | | |
| ■ | MARGARET L. WOLFF
1955
333 W. Wacker Drive
Chicago, IL 6o6o6 | | | Board Member | | 2016
Class I | | Member of the Board of Directors (since 2013) of Travelers Insurance Company of Canada and The Dominion of Canada General Insurance Company (each, a part of Travelers Canada, the Canadian operation of The Travelers Companies, Inc.); formerly, Of Counsel, Skadden, Arps, Slate, Meagher & Flom LLP (Mergers & Acquisitions Group) (2005-2014); Member of the Board of Trustees of New York- Presbyterian Hospital (since 2005); Member (since 2004) and Chair (since 2015) of the Board of Trustees of The John A. Hartford Foundation (a philanthropy dedicated to improving the care of older adults); formerly, Member (2005-2015) and Vice Chair (2011-2015) of the Board of Trustees of Mt. Holyoke College. | | 189 |
| | Name, | | | Position(s) Held | | Year First | | Principal | | Number |
| | Year of Birth | | | with the Funds | | Elected or | | Occupation(s) | | of Portfolios |
| | & Address | | | | | Appointed | | Including other | | in Fund Complex |
| | | | | | | and Term(1) | | Directorships | | Overseen by |
| | | | | | | | | During Past 5 Years | | Board Member |
| | | | | | | | | | | |
| Interested Board Members: | | | | | | |
| | | | | | | | | | | |
| ■ | WILLIAM ADAMS IV(2)
1955
333 W. Wacker Drive
Chicago, IL 6o6o6 | | | Board Member | | 2013
Class II | | Co-Chief Executive Officer and Co-President (since March 2016), formerly, Senior Executive Vice President, Global Structured Products (2010-2015) of Nuveen Investments, Inc.; Co-President of Nuveen Fund Advisors, LLC (since 2011); Co-Chief Executive Officer (since 2016), formerly, Senior Executive Vice President of Nuveen Securities, LLC; President (since 2011), of Nuveen Commodities Asset Management, LLC; Board Member of the Chicago Symphony Orchestra and of Gilda's Club Chicago; formerly, Executive Vice President, U.S. Structured Products, of Nuveen Investments, Inc. (1999-2010). | | 189 |
| | | | | | | | | | | |
| ■ | THOMAS S. SCHREIER, JR.(2)(3)
1962
333 W. Wacker Drive
Chicago, IL 6o6o6 | Board Member | | 2013
Class III | | Vice Chairman, Wealth Management of Nuveen Investments, Inc. (since 2011); Co-President of Nuveen Fund Advisors, LLC; Chairman of Nuveen Asset Management, LLC (since 2011); formerly, Co-Chief Executive Officer of Nuveen Securities, LLC (2011-2016); Member of Board of Governors and Chairman's Council of the Investment Company Institute; Director and Vice Chair of Allina Health and a member of its Finance, Audit and Investment Committees; Director of the Minneapolis Institute of Art; formerly, Chief Executive Officer (2000-2010) and Chief Investment Officer (2007-2010) of FAF Advisors, Inc.; formerly, President of First American Funds (2001-2010). | | 189 |
| | Name, | | | Position(s) Held | | Year First | | Principal | | Number |
| | Year of Birth | | | with the Funds | | Elected or | | Occupation(s) | | of Portfolios |
| | & Address | | | | | Appointed(4) | | During Past 5 Years | | in Fund Complex |
| | | | | | | | | | | Overseen |
| | | | | | | | | | | by Officer |
| | | | | | | | | | | |
| Officers of the Funds: | | | | | | |
| | | | | | | | | | | |
| ■ | GIFFORD R. ZIMMERMAN
1956
333 W. Wacker Drive
Chicago, IL 6o6o6 | | | Chief
Administrative
Officer | | 1988 | | Managing Director (since 2002), and Assistant Secretary of Nuveen Securities, LLC; Managing Director (since 2004) and Assistant Secretary (since 1994) of Nuveen Investments, Inc.; Managing Director (since 2002), Assistant Secretary (since 1997) and Co-General Counsel (since 2011) of Nuveen Fund Advisors, LLC; Managing Director, Assistant Secretary and Associate General Counsel of Nuveen Asset Management, LLC (since 2011); Managing Director and Assistant Secretary of Nuveen Investments Advisers, LLC (since 2002) and Symphony Asset Management LLC (since 2003); Vice President and Assistant Secretary of NWQ Investment Management Company, LLC (since 2002), Santa Barbara Asset Management, LLC (since 2006), and of Winslow Capital Management, LLC, (since 2010); Vice President and Assistant Secretary (since 2013), formerly, Chief Administrative Officer and Chief Compliance Officer (2006-2013) of Nuveen Commodities Asset Management, LLC; Chartered Financial Analyst. | | 190 |
| | | | | | | | | | | |
| ■ | CEDRIC H. ANTOSIEWICZ
1962
333 W. Wacker Drive
Chicago, IL 6o6o6 | | | Vice President | | 2007 | | Managing Director of Nuveen Securities, LLC. (since 2004); Managing Director of Nuveen Fund Advisors, LLC (since 2014). | | 83 |
| | | | | | | | | | | |
| ■ | MARGO L. COOK
1964
333 W. Wacker Drive
Chicago, IL 6o6o6 | | | Vice President | | 2009 | | Co-Chief Executive Officer and Co-President (since March 2016), formerly, Senior Executive Vice President of Nuveen Investments, Inc; Co-Chief Executive Officer (since 2015), previously, Executive Vice President (2013-2015) of Nuveen Securities, LLC; Senior Executive Vice President of Nuveen Fund Advisors, LLC (Executive Vice President since 2011); formerly, Managing Director of Nuveen Commodities Asset Management, LLC (2011-2016); Chartered Financial Analyst. | | 190 |
Board Members & Officers (Unaudited) (continued)
| | Name, | | | Position(s) Held | | Year First | | Principal | | Number |
| | Year of Birth | | | with the Funds | | Elected or | | Occupation(s) | | of Portfolios |
| | & Address | | | | | Appointed(4) | | During Past 5 Years | | in Fund Complex |
| | | | | | | | | | | Overseen |
| | | | | | | | | | | by Officer |
| | | | | | | | | | | |
| Officers of the Funds (continued): | | | | | | | |
| | | | | | | | | | | |
| ■ | LORNA C. FERGUSON
1945
333 W. Wacker Drive
Chicago, IL 6o6o6 | | | Vice President | | 1998 | | Managing Director (since 2004) of Nuveen Investments Holdings, Inc. | | 190 |
| | | | | | | | | | | |
| ■ | STEPHEN D. FOY
1954
333 W. Wacker Drive
Chicago, IL 6o6o6 | | | Vice President
and Controller | | 1998 | | Managing Director (since 2014), formerly, Senior Vice President (2013-2014) and Vice President (2005-2013) of Nuveen Fund Advisors, LLC; Chief Financial Officer of Nuveen Commodities Asset Management, LLC (since 2010); Managing Director (since 2016) of Nuveen Securities, LLC; Certified Public Accountant. | | 190 |
| | | | | | | | | | | |
| ■ | SHERRI A. HLAVACEK
1962
333 W. Wacker Drive
Chicago, IL 6o6o6 | | | Vice President
and Treasurer | | 2015 | | Executive Vice President (since 2015, formerly, Managing Director) and Controller of Nuveen Fund Advisors, LLC; Managing Director and Controller of Nuveen Commodities Asset Management, LLC; Executive Vice President (since 2015, formerly, Managing Director), Treasurer and Controller of Nuveen Asset Management, LLC; Executive Vice President, Principal Financial Officer (since 2015, formerly, Managing Director), Treasurer and Corporate Controller of Nuveen Investments, Inc.; Executive Vice President (since 2015, formerly, Managing Director), Treasurer and Corporate Controller of Nuveen Investments Advisers, LLC and Nuveen Investments Holdings, Inc.; Executive Vice President, (formerly,Managing Director), Chief Financial Officer and Corporate Controller of Nuveen Securities, LLC; Vice President, Controller and Treasurer of NWQ Investment Management Company, LLC; Vice President and Controller of Santa Barbara Asset Management, LLC, Tradewinds Global Investors, LLC, Symphony Asset Management LLC and Winslow Capital Management, LLC; Certified Public Accountant. | | 190 |
| | | | | | | | | | | |
| ■ | WALTER M. KELLY
197o
333 W. Wacker Drive
Chicago, IL 6o6o6 | | | Chief Compliance
Officer and
Vice President | | 2003 | | Senior Vice President (since 2008) of Nuveen Investment Holdings, Inc. | | 190 |
| | | | | | | | | | | |
| ■ | DAVID J. LAMB
1963
333 W. Wacker Drive
Chicago, IL 6o6o6 | | | Vice President | | 2015 | | Senior Vice President of Nuveen Investments Holdings, Inc. (since 2006), Vice President prior to 2006. | | 83 |
| | | | | | | | | | | |
| ■ | TINA M. LAZAR
1961
333 W. Wacker Drive
Chicago, IL 6o6o6 | | | Vice President | | 2002 | | Senior Vice President of Nuveen Investments Holdings, Inc. and Nuveen Securities, LLC. | | 190 |
| | | | | | | | | | | |
| ■ | KEVIN J. MCCARTHY
1966
333 W. Wacker Drive
Chicago, IL 6o6o6 | | | Vice President
and Secretary | | 2007 | | Executive Vice President, Secretary and General Counsel (since March 2016), formerly, Managing Director and Assistant Secretary of Nuveen Investments, Inc.; Executive Vice President (since March 2016), formerly, Managing Director and Assistant Secretary (since 2008) of Nuveen Securities, LLC; Executive Vice President and Secretary (since March 2016), formerly, Managing Director (2008-2016) and Assistant Secretary (2007-2016) and Co-General Counsel (since 2011) of Nuveen Fund Advisors, LLC; Executive Vice President and Secretary (since March 2016), formerly, Managing Director, Assistant Secretary (2011-2016) and Associate General Counsel (since 2011) of Nuveen Asset Management, LLC; Executive Vice President and Secretary of Nuveen Investments Advisers, LLC; Vice President (since 2007) and Secretary (since March 2016) of NWQ Investment Management Company, LLC, Symphony Asset Management LLC, Santa Barbara Asset Management, LLC, Winslow Capital Management, LLC (since 2010) and Tradewinds Global Investors, LLC (since 2016); Vice President (since 2010) and Secretary (since 2016), formerly, Assistant Secretary of Nuveen Commodities Asset Management, LLC. | | 190 |
| | Name, | | | Position(s) Held | | Year First | | Principal | | Number |
| | Year of Birth | | | with the Funds | | Elected or | | Occupation(s) | | of Portfolios |
| | & Address | | | | | Appointed(4) | | During Past 5 Years | | in Fund Complex |
| | | | | | | | | | | Overseen |
| | | | | | | | | | | by Officer |
| | | | | | | | | | | |
| Officers of the Funds (continued): | | | | | | |
| | | | | | | | | | | |
| ■ | KATHLEEN L. PRUDHOMME
1953
9o1 Marquette Avenue
Minneapolis, MN 554o2 | | | Vice President and
Assistant Secretary | | 2011 | | Managing Director, Assistant Secretary and Co-General Counsel (since 2011) of Nuveen Fund Advisors, LLC; Managing Director, Assistant Secretary and Associate General Counsel (since 2011) of Nuveen Asset Management, LLC; Managing Director and Assistant Secretary (since 2011) of Nuveen Securities, LLC; formerly, Deputy General Counsel, FAF Advisors, Inc. (2004-2010). | | 190 |
| | | | | | | | | | | |
| ■ | JOEL T. SLAGER
1978
333 W. Wacker Drive
Chicago, IL 6o6o6 | | | Vice President and
Assistant Secretary | | 2013 | | Fund Tax Director for Nuveen Funds (since 2013); previously, Vice President of Morgan Stanley Investment Management, Inc., Assistant Treasurer of the Morgan Stanley Funds (from 2010 to 2013). | | 190 |
| (1) | The Board of Trustees is divided into three classes, Class I, Class II, and Class III, with each being elected to serve until the third succeeding annual shareholders' meeting subsequent to its election or thereafter in each case when its respective successors are duly elected or appointed, except two board members are elected by the holders of Preferred Shares, when applicable, to serve until the next annual shareholders' meeting subsequent to its election or thereafter in each case when its respective successors are duly elected or appointed. The year first elected or appointed represents the year in which the board member was first elected or appointed to any fund in the Nuveen Complex. |
| (2) | "Interested person" as defined in the 1940 Act, by reason of his position with Nuveen Investments, Inc. and certain of its subsidiaries, which are affiliates of the Nuveen Funds. |
| (3) | Mr. Schreier will retire from the Funds' Board of Trustees effective May 31, 2016. |
| (4) | Officers serve one year terms through August of each year. The year first elected or appointed represents the year in which the Officer was first elected or appointed to any fund in the Nuveen Complex. |
Notes
Notes
Nuveen Investments:
Serving Investors for Generations
Since 1898, financial advisors and their clients have relied on Nuveen Investments to provide dependable investment solutions through continued adherence to proven, long-term investing principles. Today, we offer a range of high quality equity and fixed-income solutions designed to be integral components of a well-diversified core portfolio.
Focused on meeting investor needs.
Nuveen helps secure the long-term goals of individual investors and the advisors who serve them. As an operating division of TIAA Global Asset Management, Nuveen provides access to investment expertise from leading asset managers and solutions across traditional and alternative asset classes. Built on more than a century of industry leadership, Nuveen's teams of experts align with clients' specific financial needs and goals, demonstrating commitment to advisors and investors through market perspectives and wealth management and portfolio advisory services. Nuveen manages more than $229 billion in assets as of March 31, 2016.
Find out how we can help you.
To learn more about how the products and services of Nuveen Investments may be able to help you meet your financial goals, talk to your financial advisor, or call us at (800) 257-8787. Please read the information provided carefully before you invest. Investors should consider the investment objective and policies, risk considerations, charges and expenses of any investment carefully. Where applicable, be sure to obtain a prospectus, which contains this and other relevant information. To obtain a prospectus, please contact your securities representative or Nuveen Investments, 333 W. Wacker Dr., Chicago, IL 60606. Please read the prospectus carefully before you invest or send money.
Learn more about Nuveen Funds at: www.nuveen.com/cef
Distributed by Nuveen Investments, LLC | 333 West Wacker Drive | Chicago, IL 60606 | www.nuveen.com | |
EAN-B-0316D 16359-INV-Y-05/17