EXHIBIT 99.1 NASDAQ: LAYN WATER MINERAL ENERGY July 2013
Safe Harbor This presentation may contain forward-looking statements within the meaning of Section 27A of the Securities Act of 1933 and Section 21E of the Exchange Act of 1934. Such statements may include, but are not limited to, statements of plans and objectives, statements of future economic performance and statements of assumptions underlying such statements, and statements of management’s intentions, hopes, beliefs, expectations or predictions of the future. Forward-looking statements can often be identified by the use of forward-looking terminology, such as “should,” “intended,” “continue,” “believe,” “may,” “hope,” “anticipate,” “goal,” “forecast,” “plan,” “estimate” and similar words or phrases. Such statements are based on current expectations and are subject to certain risks, uncertainties and assumptions, including but not limited to: the outcome of the ongoing internal investigation into, among other things, the legality, under the FCPA and local laws, of certain payments to agents and other third parties interacting with government officials in certain countries in Africa relating to the payment of taxes and the importing of equipment (including any government enforcement action which could arise out of the matters under review or that the matters under review may have resulted in a higher dollar amount of payments or may have a greater financial or business impact than management currently anticipates), prevailing prices for various commodities, unanticipated slowdowns in the Company’s major markets, the availability of credit, the risks and uncertainties normally incident to the construction industry, the impact of competition, the effectiveness of operational changes expected to increase efficiency and productivity, worldwide economic and political conditions and foreign currency fluctuations that may affect worldwide results of operations. Should one or more of these risks or uncertainties materialize, or should underlying assumptions prove incorrect, actual results may vary materially and adversely from those anticipated, estimated or projected. These forward-looking statements are made as of the date of this presentation and the Company assumes no obligation to update such forward-looking statements or to update the reasons why actual results could differ materially from those anticipated in such forward-looking statements. 2
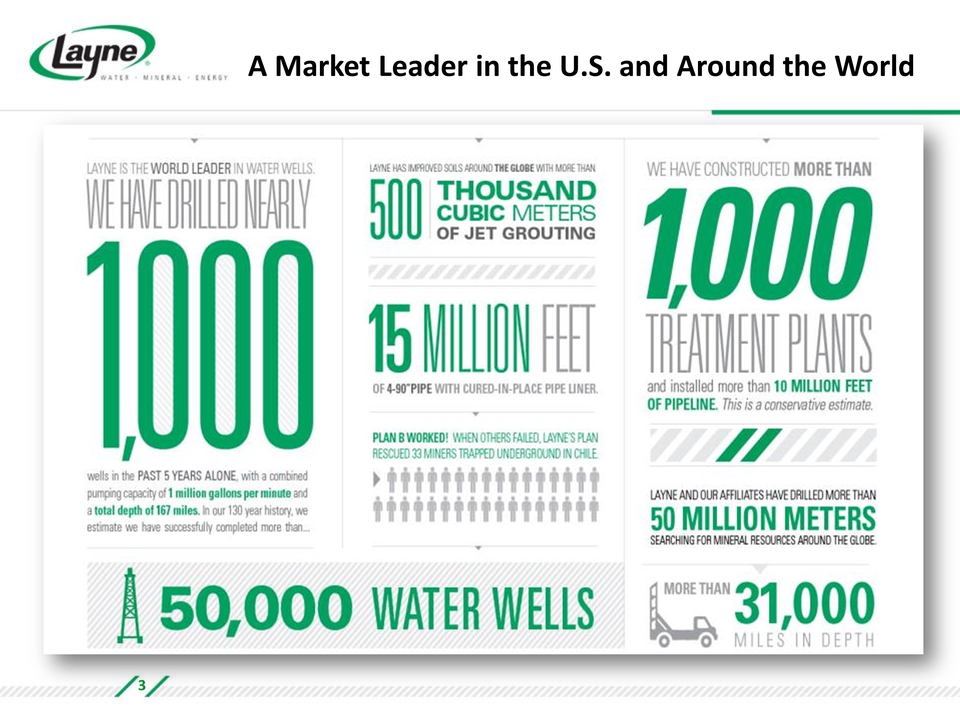
A Market Leader in the U.S. and Around the World 3
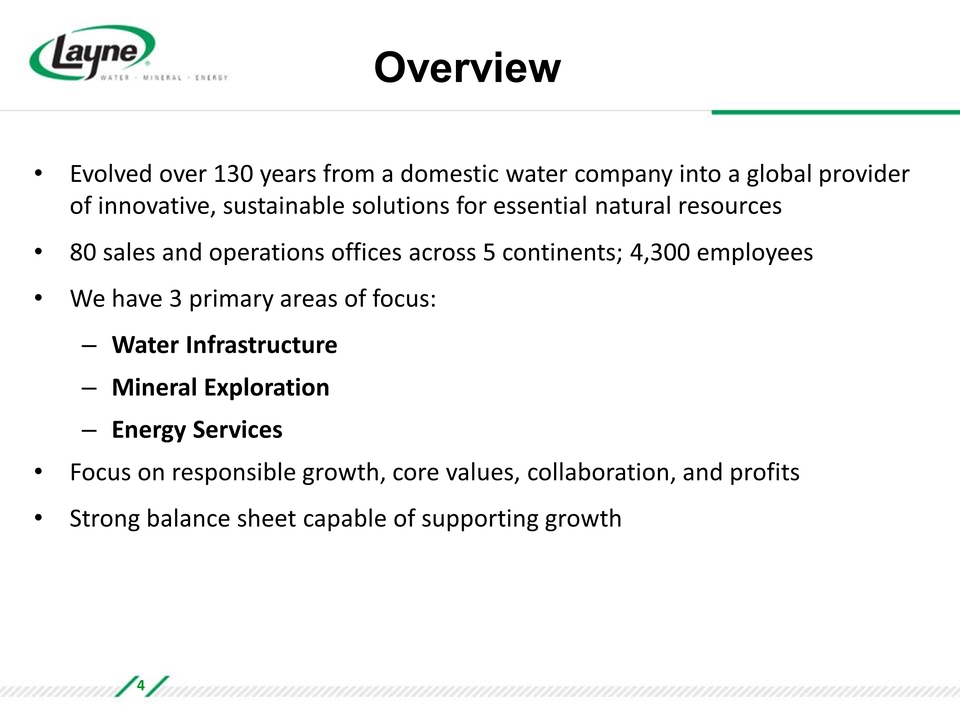
Overview Evolved over 130 years from a domestic water company into a global provider of innovative, sustainable solutions for essential natural resources 80 sales and operations offices across 5 continents; 4,300 employees We have 3 primary areas of focus: – Water Infrastructure – Mineral Exploration – Energy Services Focus on responsible growth, core values, collaboration, and profits Strong balance sheet capable of supporting growth 4
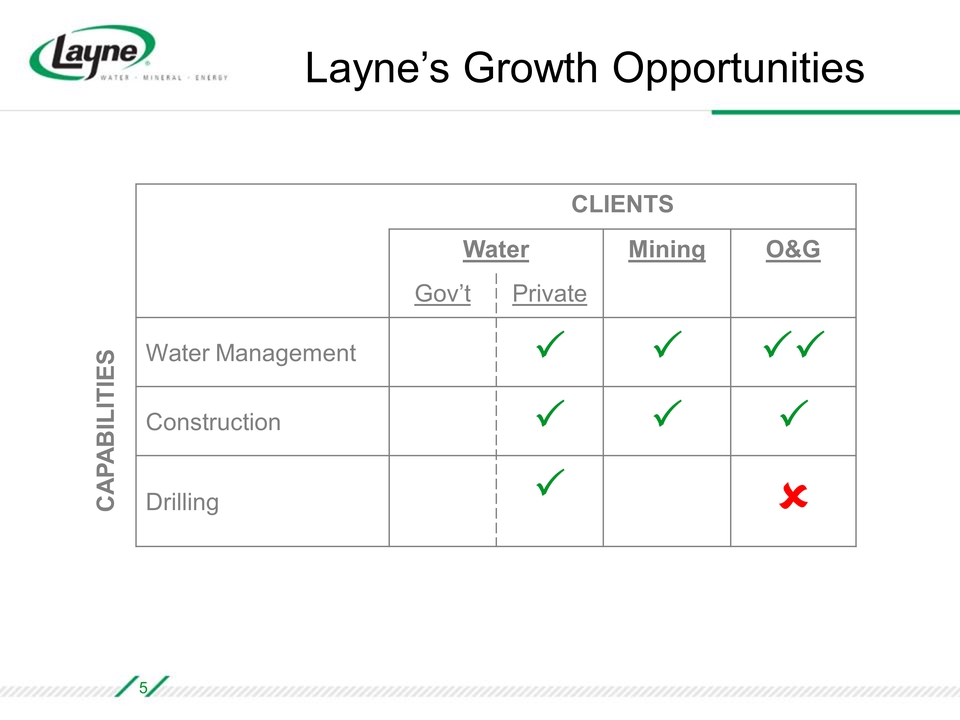
Layne’s Growth Opportunities CLIENTS Water Mining O&G Gov’t Private Water Management Construction Drilling CAPABILITIES 5
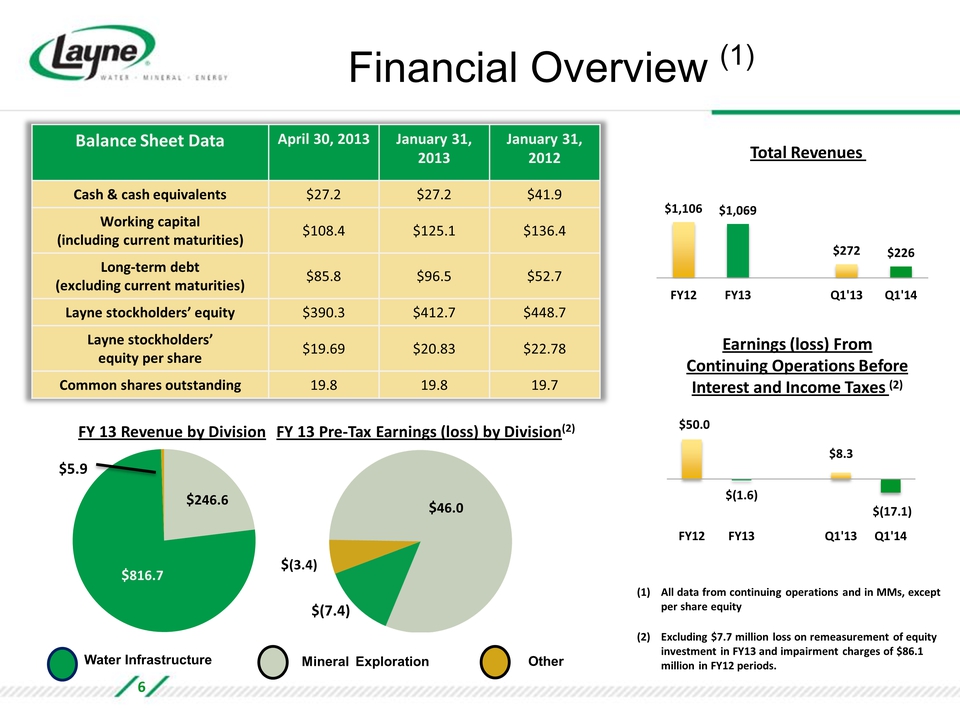
Financial Overview (1) Balance Sheet Data April 30, 2013 January 31, 2013 January 31, 2012 Cash & cash equivalents $27.2 $27.2 $41.9 Working capital (including current maturities) $108.4 $125.1 $136.4 Long-term debt (excluding current maturities) $85.8 $96.5 $52.7 Layne stockholders’ equity $390.3 $412.7 $448.7 Layne stockholders’ equity per share $19.69 $20.83 $22.78 Common shares outstanding 19.8 19.8 19.7 FY 13 Revenue by Division FY 13 Pre-Tax Earnings (loss) by Division(2) $816.7 $246.6 $5.9 $46.0 $(3.4) $(7.4) Water Infrastructure Mineral Exploration Other Total Revenues $1,106 $1,069 FY12 FY13 Q1'13 Q1'14 $272 $226 Earnings (loss) From Continuing Operations Before Interest and Income Taxes (2) $50.0 $(1.6) FY12 FY13 Q1'13 Q1'14 $8.3 $(17.1) (1) All data from continuing operations and in MMs, except per share equity (2) Excluding $7.7 million loss on remeasurement of equity investment in FY13 and impairment charges of $86.1 million in FY12 periods. 6
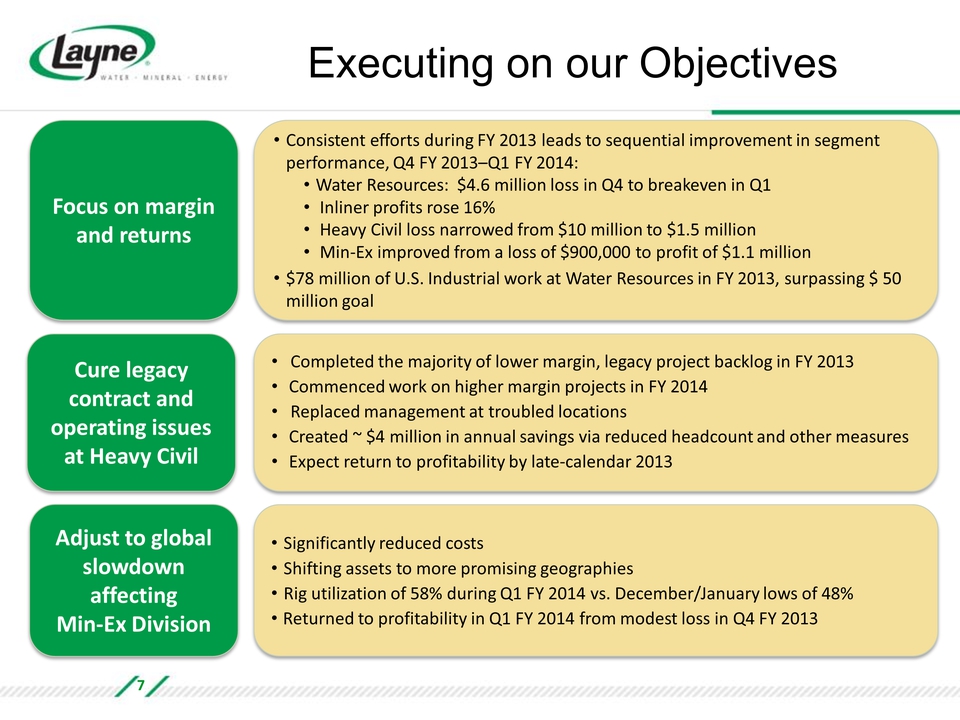
Executing on our Objectives Focus on margin and returns Consistent efforts during FY 2013 leads to sequential improvement in segment performance, Q4 FY 2013–Q1 FY 2014: Water Resources: $4.6 million loss in Q4 to breakeven in Q1 Inliner profits rose 16% Heavy Civil loss narrowed from $10 million to $1.5 million Min-Ex improved from a loss of $900,000 to profit of $1.1 million $78 million of U.S. Industrial work at Water Resources in FY 2013, surpassing $ 50 million goal Cure legacy contract and operating issues at Heavy Civil Completed the majority of lower margin, legacy project backlog in FY 2013 Commenced work on higher margin projects in FY 2014 Replaced management at troubled locations Created ~ $4 million in annual savings via reduced headcount and other measures Expect return to profitability by late-calendar 2013 Adjust to global slowdown affecting Min-Ex Division Significantly reduced costs Shifting assets to more promising geographies Rig utilization of 58% during Q1 FY 2014 vs. December/January lows of 48% Returned to profitability in Q1 FY 2014 from modest loss in Q4 FY 2013 7
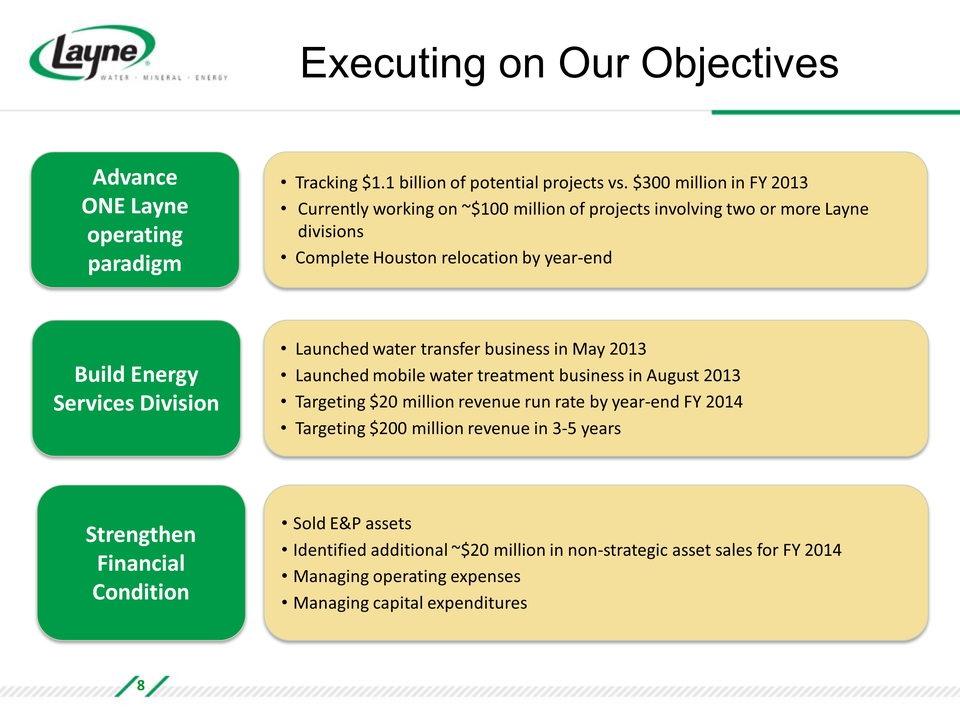
Executing on Our Objectives Advance ONE Layne operating paradigm Tracking $1.1 billion of potential projects vs. $300 million in FY 2013 Currently working on ~$100 million of projects involving two or more Layne divisions Complete Houston relocation by year-end Build Energy Services Division Launched water transfer business in May 2013 Launched mobile water treatment business in August 2013 Targeting $20 million revenue run rate by year-end FY 2014 Targeting $200 million revenue in 3-5 years Strengthen Financial Condition Sold E&P assets Identified additional ~$20 million in non-strategic asset sales for FY 2014 Managing operating expenses Managing capital expenditures 8
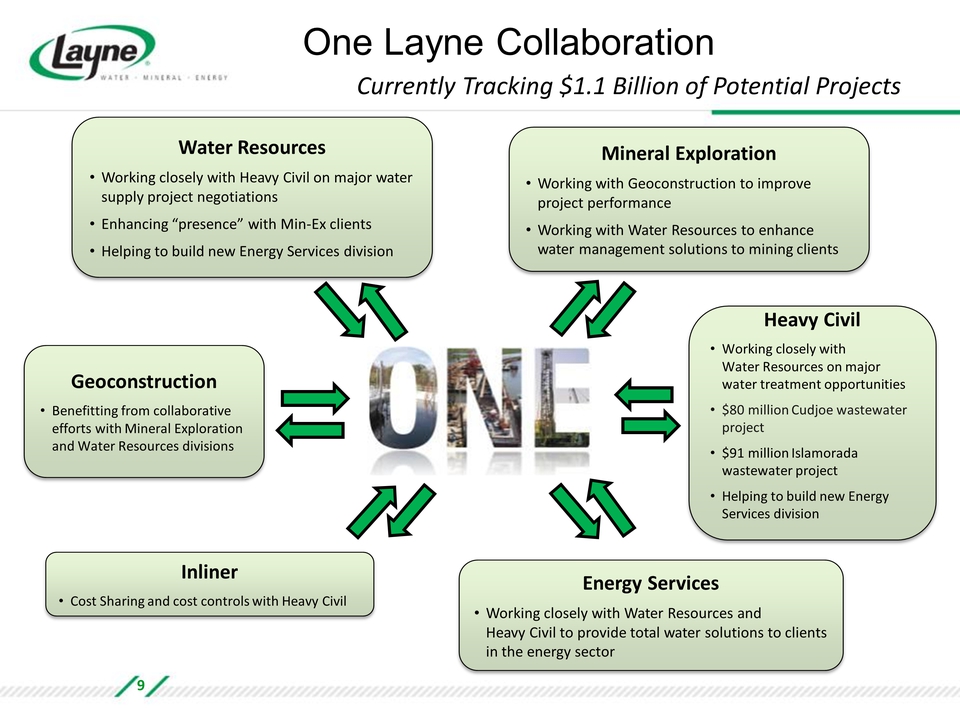
One Layne Collaboration Currently Tracking $1.1 Billion of Potential Projects Water Resources Working closely with Heavy Civil on major water supply project negotiations Enhancing “presence” with Min-Ex clients Helping to build new Energy Services division Geoconstruction Benefitting from collaborative efforts with Mineral Exploration and Water Resources divisions Inliner Cost Sharing and cost controls with Heavy Civil Energy Services Working closely with Water Resources and Heavy Civil to provide total water solutions to clients in the energy sector Heavy Civil Working closely with Water Resources on major water treatment opportunities $80 million Cudjoe wastewater project $91 million Islamorada wastewater project Helping to build new Energy Services division Mineral Exploration Working with Geoconstruction to improve project performance Working with Water Resources to enhance water management solutions to mining clients 9
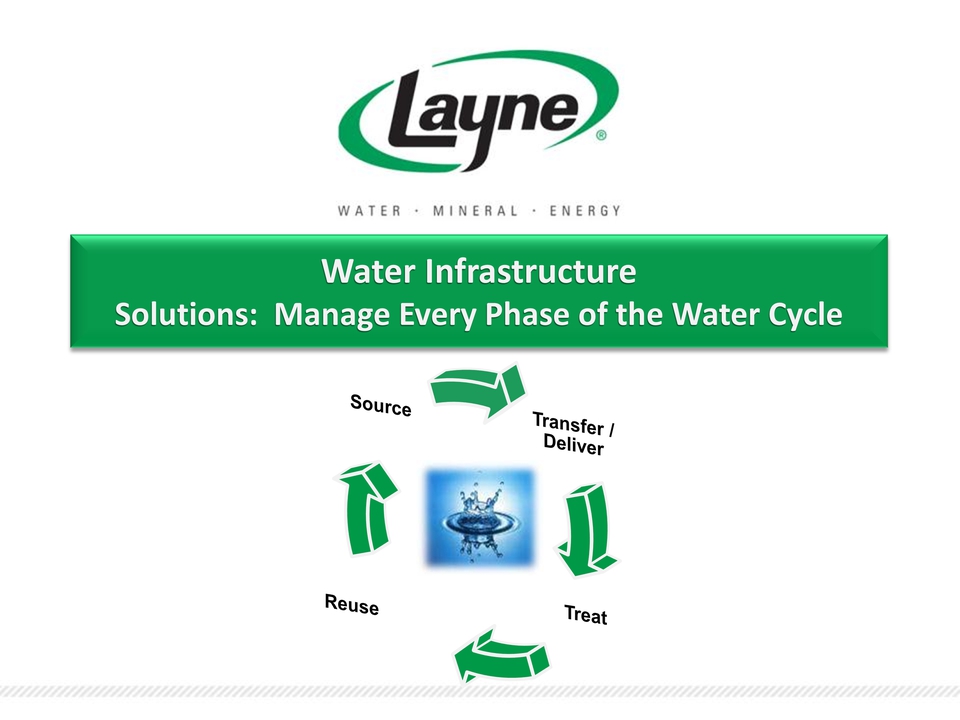
Water Infrastructure Solutions: Manage Every Phase of the Water Cycle Source Transfer/Deliver Treat Reuse
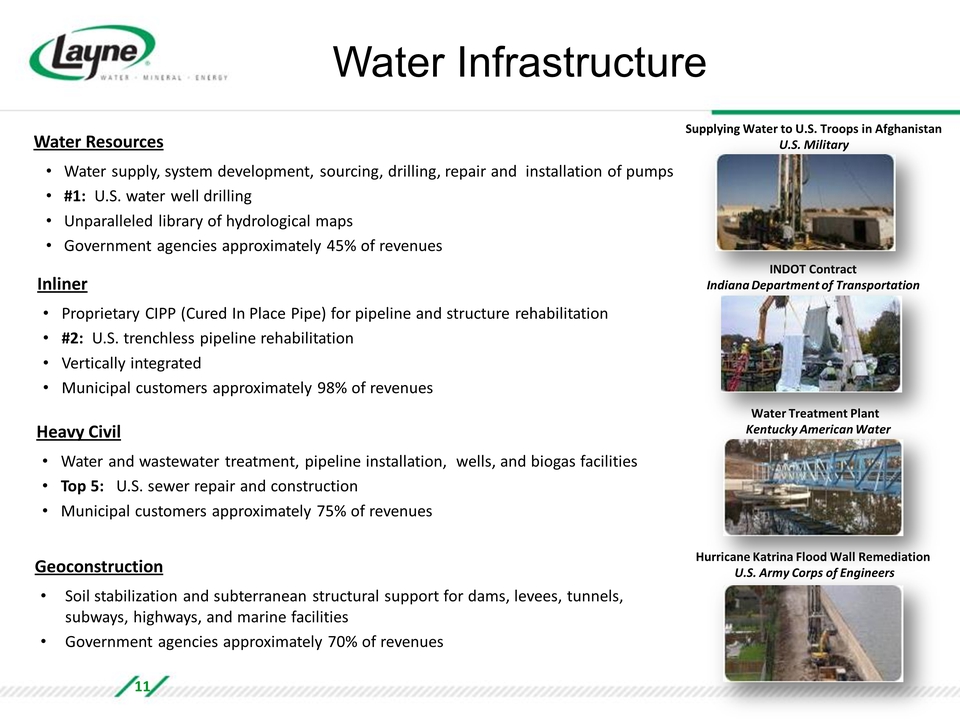
Water Infrastructure Water Resources Water supply, system development, sourcing, drilling, repair and installation of pumps #1: U.S. water well drilling Unparalleled library of hydrological maps Government agencies approximately 45% of revenues Inliner Proprietary CIPP (Cured In Place Pipe) for pipeline and structure rehabilitation #2: U.S. trenchless pipeline rehabilitation Vertically integrated Municipal customers approximately 98% of revenues Heavy Civil Water and wastewater treatment, pipeline installation, wells, and biogas facilities Top 5: U.S. sewer repair and construction Municipal customers approximately 75% of revenues Geoconstruction Soil stabilization and subterranean structural support for dams, levees, tunnels, subways, highways, and marine facilities Government agencies approximately 70% of revenues Supplying Water to U.S. Troops in Afghanistan U.S. Military INDOT Contract Indiana Department of Transportation Water Treatment Plant Kentucky American Water Hurricane Katrina Flood Wall Remediation U.S. Army Corps of Engineers 11
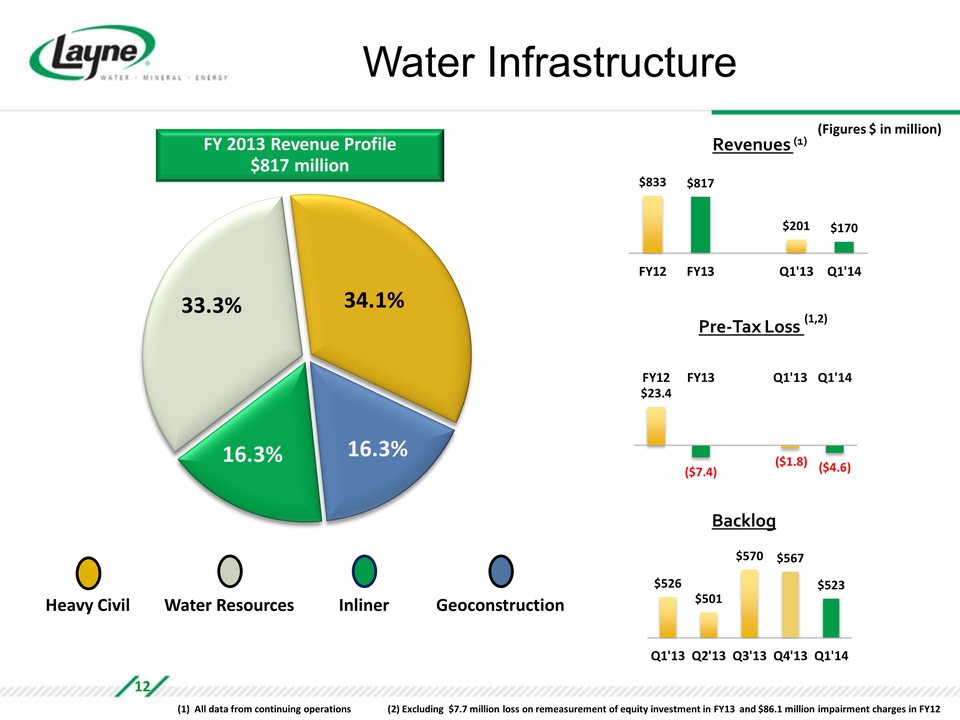
Water Infrastructure FY 2013 Revenue Profile $817 million 33.3% 34.1% 16.3% 16.3% Heavy Civil Water Resources Inliner Geoconstruction (Figures $ in million) Revenues (1) $833 $817 $201 $170 FY12 FY13 Q1'13 Q1'14 Pre-Tax Loss (1,2) $23.4 ($7.4) ($1.8) ($4.6) FY12 FY13 Q1'13 Q1'14 Backlog $526 $501 $570 $567 $523 Q1'13 Q2'13 Q3'13 Q4'13 Q1'14 (1) All data from continuing operations (2) Excluding $7.7 million loss on remeasurement of equity investment in FY13 and $86.1 million impairment charges in FY12 12
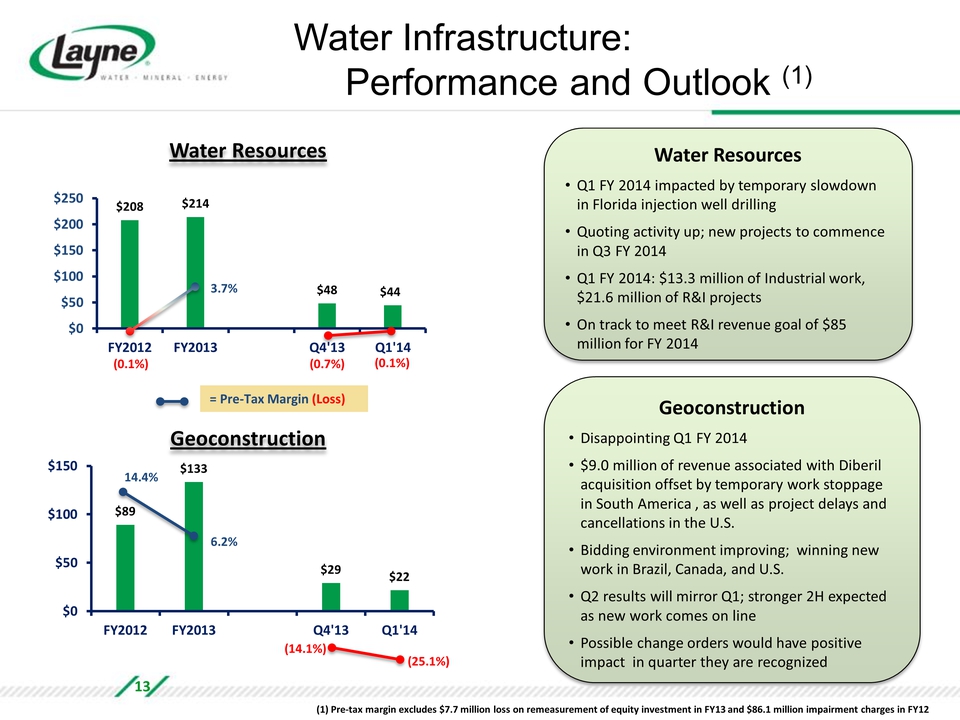
Water Infrastructure: Performance and Outlook (1) Water Resources $208 $214 (0.1%) 3.7% FY2012 FY2013 Q4'13 Q1'14 $48 $44 (0.7%) (0.1%) = Pre-Tax Margin (Loss) Geoconstruction $89 $133 14.4% 6.2% FY2012 FY2013 Q4'13 Q1'14 $29 $22 (14.1%) (25.1%) Water Resources Q1 FY 2014 impacted by temporary slowdown in Florida injection well drilling Quoting activity up; new projects to commence in Q3 FY 2014 Q1 FY 2014: $13.3 million of Industrial work, $21.6 million of R&I projects On track to meet R&I revenue goal of $85 million for FY 2014 Geoconstruction Disappointing Q1 FY 2014 $9.0 million of revenue associated with Diberil acquisition offset by temporary work stoppage in South America , as well as project delays and cancellations in the U.S. Bidding environment improving; winning new work in Brazil, Canada, and U.S. Q2 results will mirror Q1; stronger 2H expected as new work comes on line Possible change orders would have positive impact in quarter they are recognized (1) Pre-tax margin excludes $7.7 million loss on remeasurement of equity investment in FY13 and $86.1 million impairment charges in FY12 13
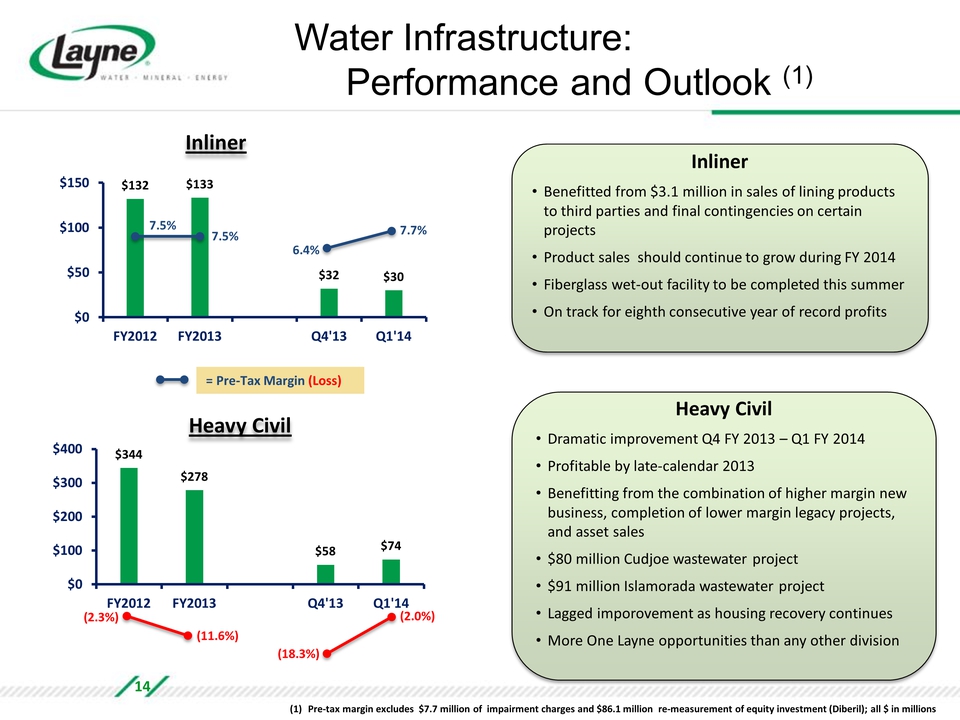
Water Infrastructure: Performance and Outlook (1) Inliner $132 $133 7.5% 7.5% FY2012 FY2013 Q4'13 Q1'14 $32 $30 6.4% 7.7% = Pre-Tax Margin (Loss) Heavy Civil $344 $278 (2.3%) (11.6%) FY2012 FY2013 Q4'13 Q1'14 $58 $74 (18.3%) (2.0%) Inliner Benefitted from $3.1 million in sales of lining products to third parties and final contingencies on certain projects Product sales should continue to grow during FY 2014 Fiberglass wet-out facility to be completed this summer On track for eighth consecutive year of record profits Heavy Civil Dramatic improvement Q4 FY 2013 – Q1 FY 2014 Profitable by late-calendar 2013 Benefitting from the combination of higher margin new business, completion of lower margin legacy projects, and asset sales $80 million Cudjoe wastewater project $91 million Islamorada wastewater project Lagged imporovement as housing recovery continues More One Layne opportunities than any other division (1) Pre-tax margin excludes $7.7 million of impairment charges and $86.1 million re-measurement of equity investment (Diberil); all $ in millions 14

Mineral Exploration Full Spectrum Mineral Exploration Drilling Services
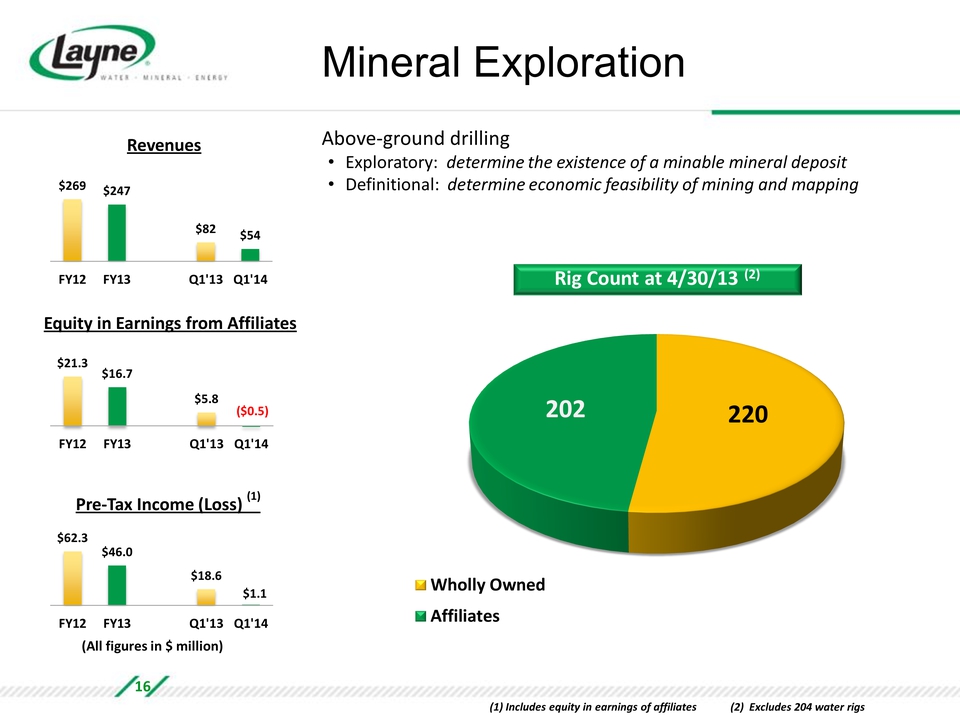
Mineral Exploration Above-ground drilling Exploratory: determine the existence of a minable mineral deposit Definitional: determine economic feasibility of mining and mapping Rig Count at 4/30/13 (2) 202 220 Affiliates Wholly Owned Revenues $269 $247 $82 $54 FY12 FY13 Q1'13 Q1'14 Equity in Earnings from Affiliates $21.3 $16.7 $5.8 ($0.5) FY12 FY13 Q1'13 Q1'14 Pre-Tax Income (Loss) (1) $62.3 $46.0 $18.6 $1.1 FY12 FY13 Q1'13 Q1'14 (All figures in $ million) (1) Includes equity in earnings of affiliates (2) Excludes 204 water rigs 16
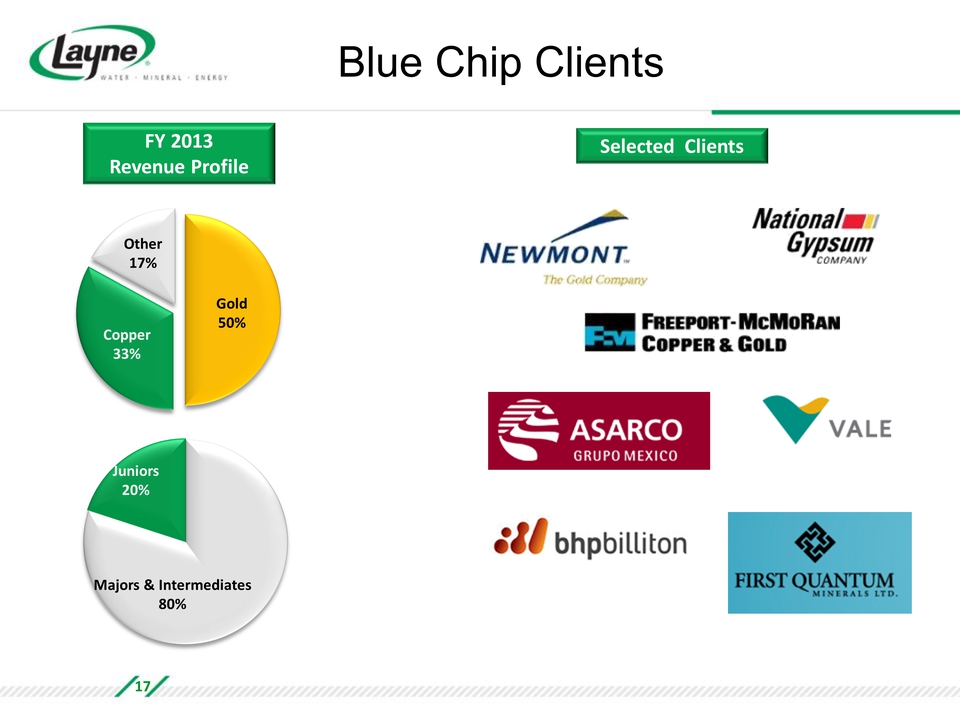
Blue Chip Clients FY 2013 Revenue Profile Copper 33% Gold 50% Other 17% Majors & Intermediates 80% Juniors 20% Selected Clients 17
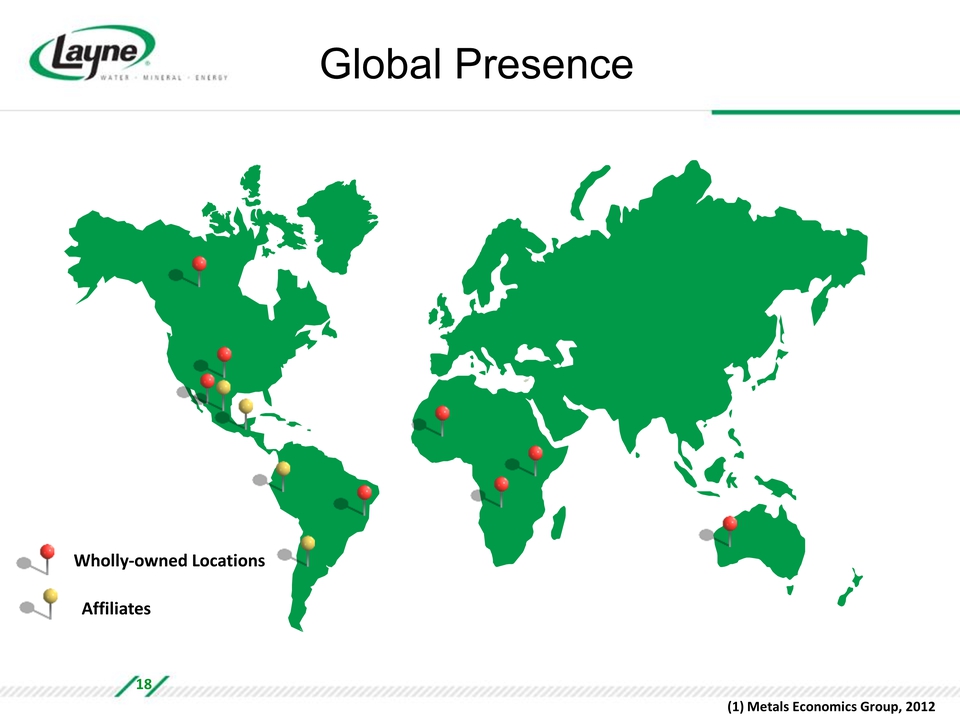
Global Presence Wholly-owned Locations Affiliates (1) Metals Economics Group, 2012 18
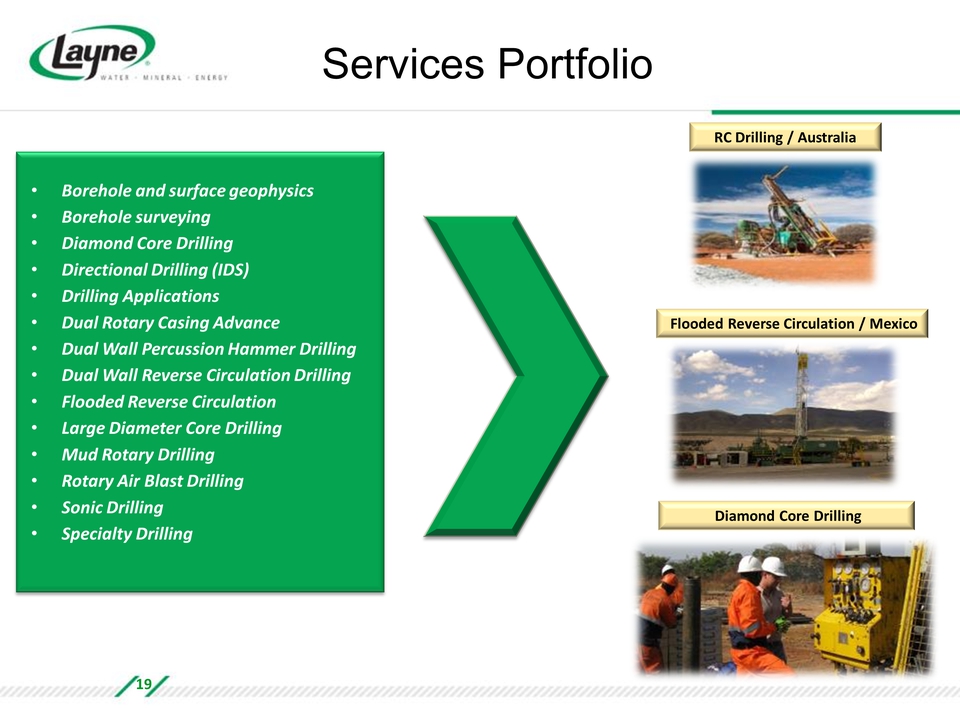
Services Portfolio Borehole and surface geophysics Borehole surveying Diamond Core Drilling Directional Drilling (IDS) Drilling Applications Dual Rotary Casing Advance Dual Wall Percussion Hammer Drilling Dual Wall Reverse Circulation Drilling Flooded Reverse Circulation Large Diameter Core Drilling Mud Rotary Drilling Rotary Air Blast Drilling Sonic Drilling Specialty Drilling RC Drilling / Australia Flooded Reverse Circulation / Mexico Diamond Core Drilling 19
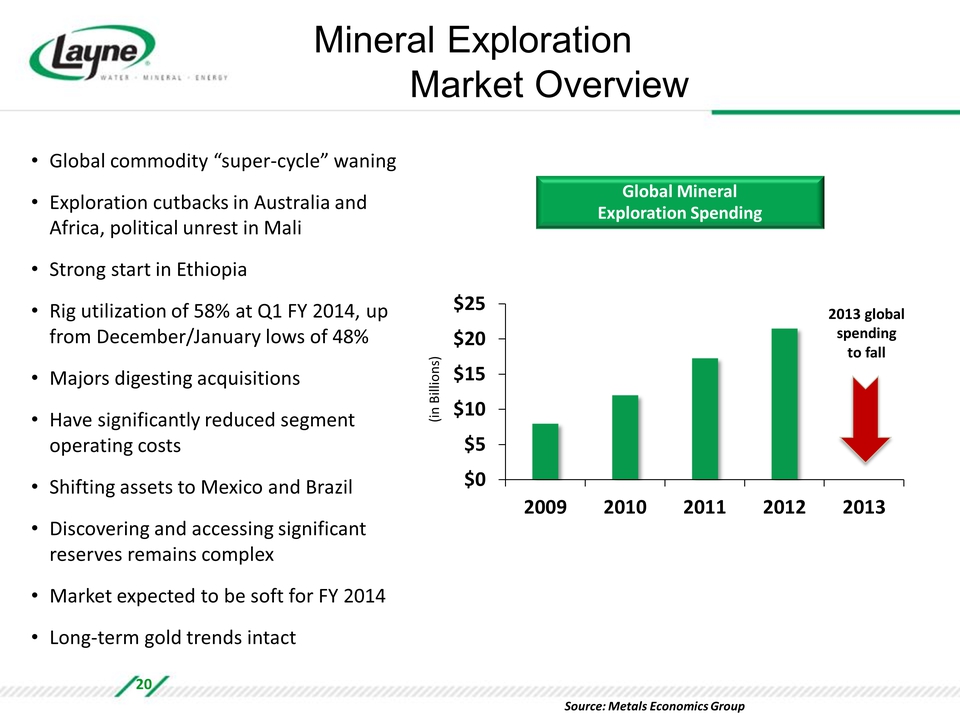
Mineral Exploration Market Overview Global commodity “super-cycle” waning Exploration cutbacks in Australia and Africa, political unrest in Mali Strong start in Ethiopia Rig utilization of 58% at Q1 FY 2014, up from December/January lows of 48% Majors digesting acquisitions Have significantly reduced segment operating costs Shifting assets to Mexico and Brazil Discovering and accessing significant reserves remains complex Market expected to be soft for FY 2014 Long-term gold trends intact Global Mineral Exploration Spending (in Billions) 2013 global spending to fall 2009 2010 2011 2012 2013 Source: Metals Economics Group 20
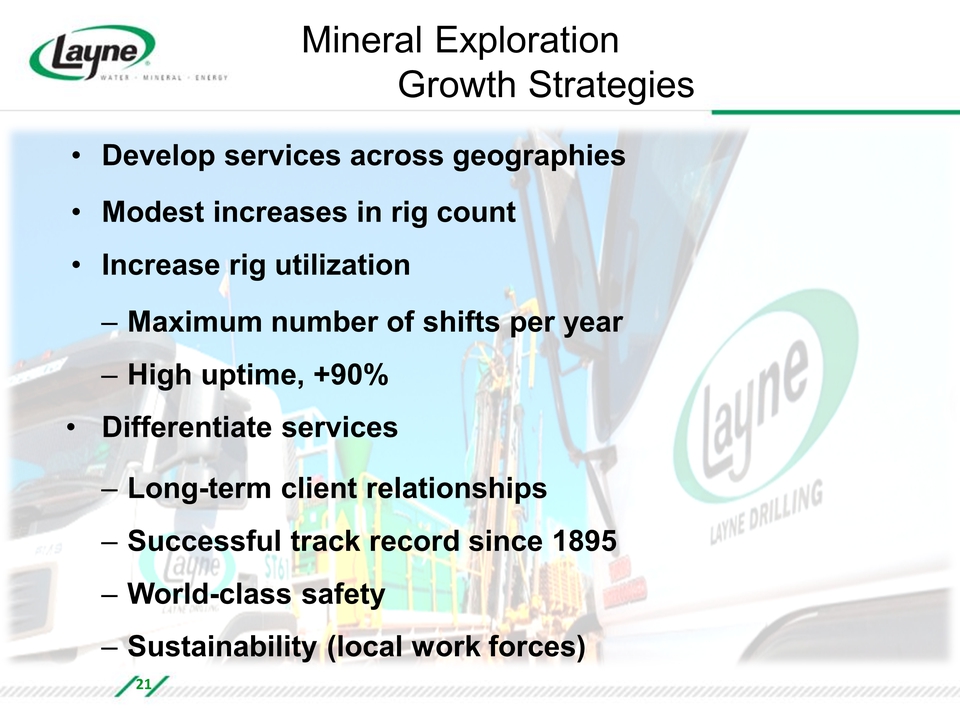
Mineral Exploration Growth Strategies Develop services across geographies Modest increases in rig count Increase rig utilization Maximum number of shifts per year High uptime, +90% Differentiate services Long-term client relationships Successful track record since 1895 World-class safety Sustainability (local work forces) 21
Energy Services An Evolving Focus
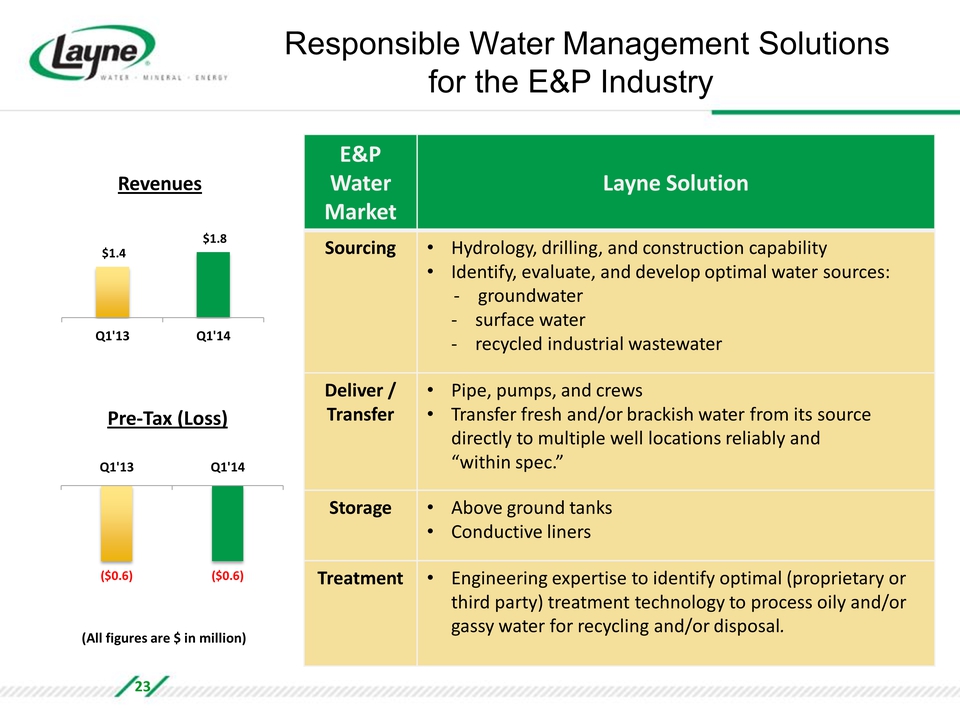
Responsible Water Management Solutions for the E&P Industry Revenues $1.4 $1.8 Q1'13 Q1'14 Pre-Tax (Loss) ($0.6) ($0.6) Q1'13 Q1'14 (All figures are $ in million) E&P Water Market Layne Solution Sourcing Hydrology, drilling, and construction capability Identify, evaluate, and develop optimal water sources: groundwater surface water recycled industrial wastewater Deliver / Transfer Pipe, pumps, and crews Transfer fresh and/or brackish water from its source directly to multiple well locations reliably and “within spec.” Storage Above ground tanks Conductive liners Treatment Engineering expertise to identify optimal (proprietary or third party) treatment technology to process oily and/or gassy water for recycling and/or disposal. 23
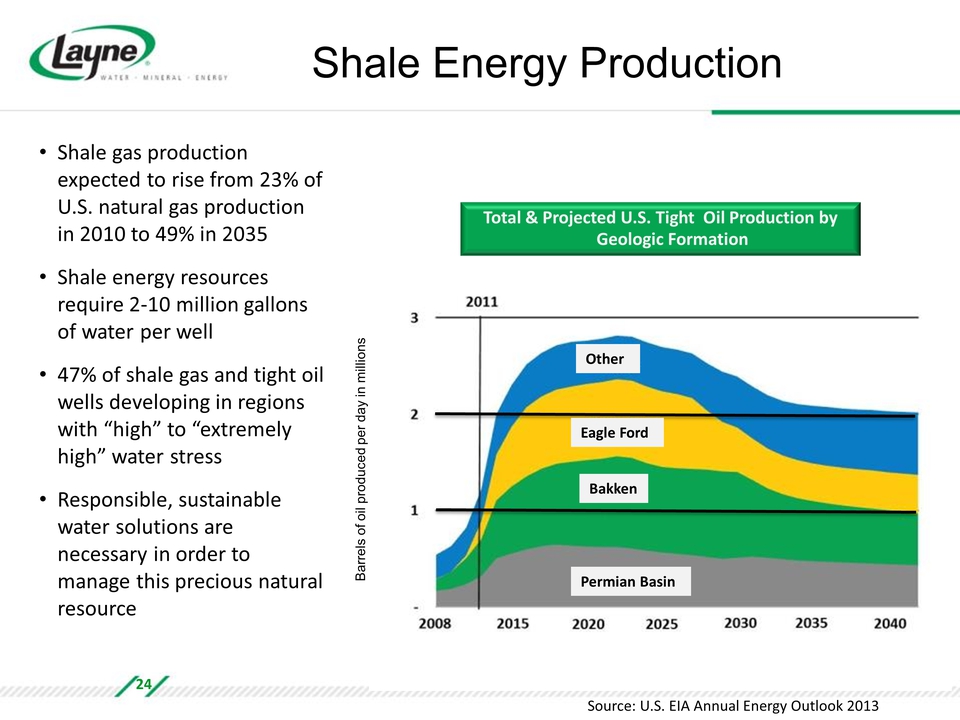
Shale Energy Production Total & Projected U.S. Tight Oil Production by Geologic Formation Shale gas production expected to rise from 23% of U.S. natural gas production in 2010 to 49% in 2035 Shale energy resources require 2-10 million gallons of water per well 47% of shale gas and tight oil wells developing in regions with “high” to “extremely high” water stress Responsible, sustainable water solutions are necessary in order to manage this precious natural resource Barrels of oil produced per day in millions 2011 Other Eagle Ford Bakken Permian Basin 2008 2015 2020 2025 2030 2035 2040 Source: U.S. EIA Annual Energy Outlook 2013 24
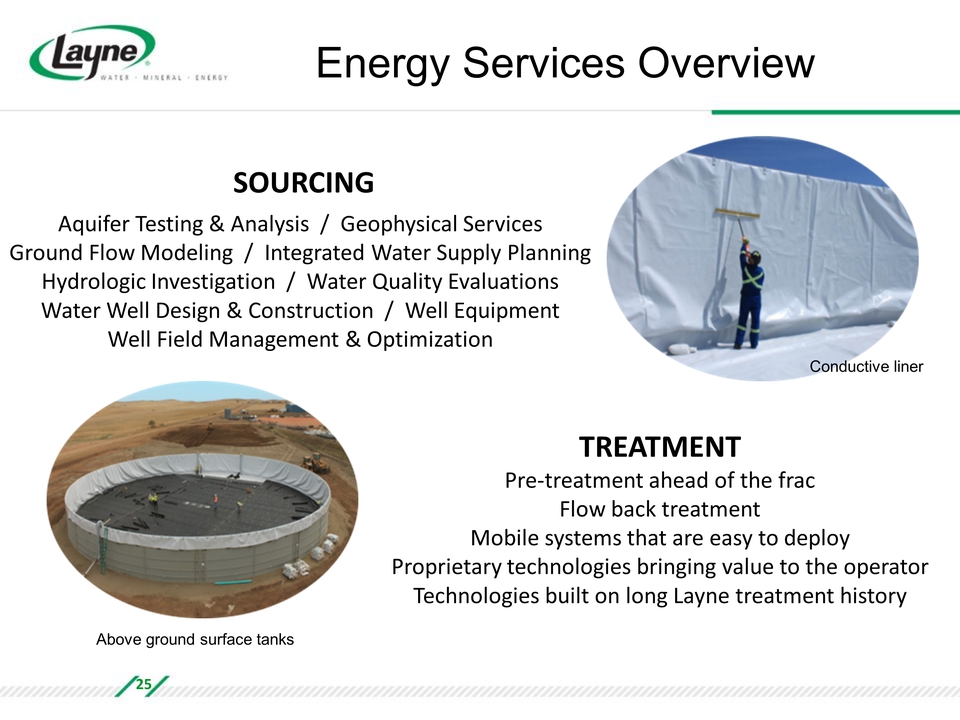
Energy Services Overview SOURCING Aquifer Testing & Analysis / Geophysical Services Ground Flow Modeling / Integrated Water Supply Planning Hydrologic Investigation / Water Quality Evaluations Water Well Design & Construction / Well Equipment Well Field Management & Optimization TREATMENT Pre-treatment ahead of the frac Flow back treatment Mobile systems that are easy to deploy Proprietary technologies bringing value to the operator Technologies built on long Layne treatment history Above ground surface tanks Conductive liner 25
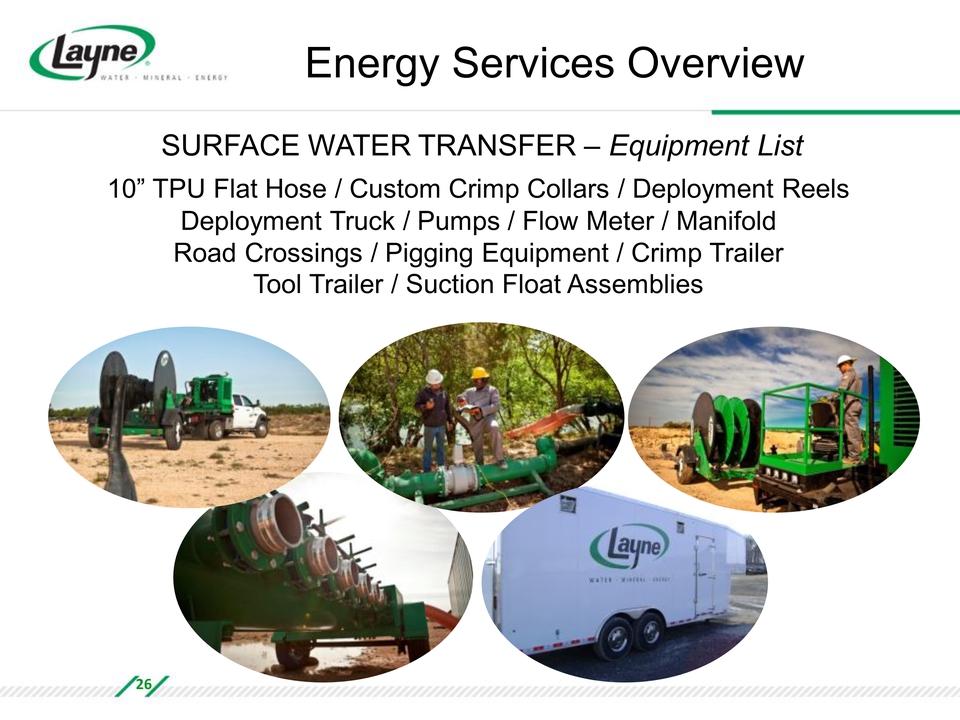
Energy Services Overview SURFACE WATER TRANSFER – Equipment List 10” TPU Flat Hose / Custom Crimp Collars / Deployment Reels Deployment Truck / Pumps / Flow Meter / Manifold Road Crossings / Pigging Equipment / Crimp Trailer Tool Trailer / Suction Float Assemblies 26
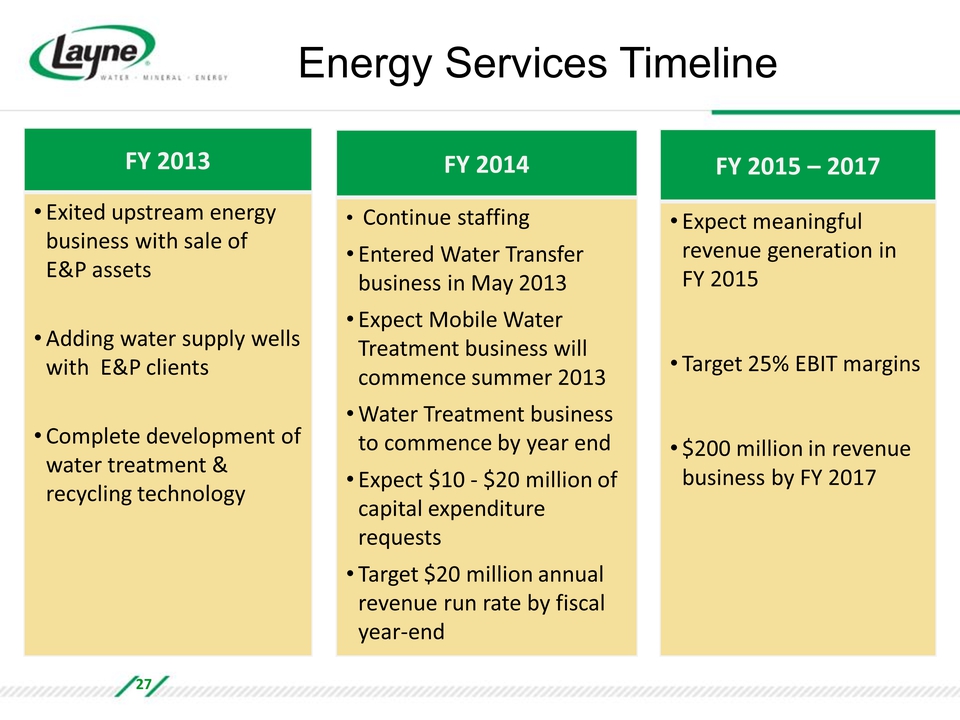
Energy Services Timeline FY 2013 Exited upstream energy business with sale of E&P assets Adding water supply wells with E&P clients Complete development of water treatment & recycling technology FY 2014 Continue staffing Entered Water Transfer business in May 2013 Expect Mobile Water Treatment business will commence summer 2013 Water Treatment business to commence by year end Expect $10 - $20 million of capital expenditure requests Target $20 million annual revenue run rate by fiscal year-end FY 2015 – 2017 Expect meaningful revenue generation in FY 2015 Target 25% EBIT margins $200 million in revenue business by FY 2017 27
Summary Layne has a long and successful history of managing our country’s water infrastructure We service and support the world’s largest mining companies globally We are now applying our knowledge of water management to energy clients by offering a unique “cradle to cradle” water management system with a particular focus on FRAC water solutions in some of the most drought effected areas in the country We provide solutions in extreme conditions such as repairing levies to protect New Orleans, providing drinking water for Coalition Forces in Afghanistan, to rescuing 33 trapped miners in Chile 28
Contact Us Layne Jim Easter, Chief Financial Officer 281.475.2694 jim.easter@layne.com www.layne.com The Equity Group Devin Sullivan, SVP 212.836.9608 dsullivan@equityny.com www.theequitygroup.com 29
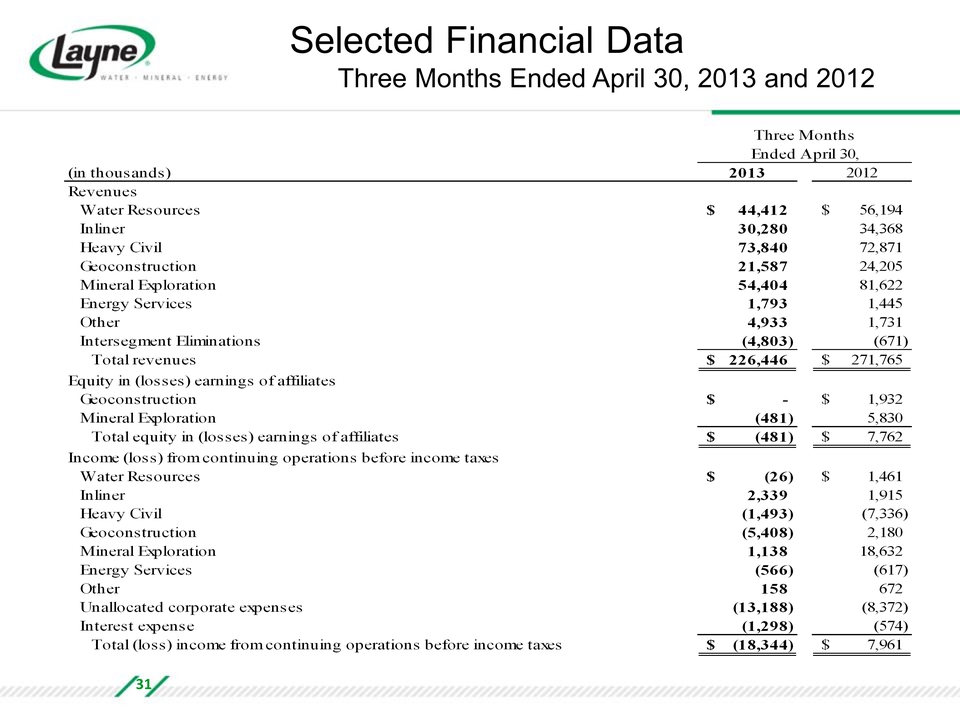
Selected Financial Data Three Months Ended April 30, 2013 and 2012 (in thousands) Three Months Ended April 30, 2013 2012 Revenues Water Resources $ 44,412 $ 56,194 Inliner 30,280 34,368 Heavy Civil 73,840 72,871 Geoconstruction 21,587 24,205 Mineral Exploration 54,404 81,622 Energy Services 1,793 1,445 Other 4,933 1,731 Intersegment Eliminations (4,803) (671) Total revenues $ 226,446 $ 271,765 Equity in (losses) earnings of affiliates Geoconstruction $ - $ 1,932 Mineral Exploration (481) 5,830 Total equity in (losses) earnings of affiliates $ (481) $ 7,762 Income (loss) from continuing operations before income taxes Water Resources $ (26) $ 1,461 Inliner 2,339 1,915 Heavy Civil (1,493) (7,336) Geoconstruction (5,408) 2,180 Mineral Exploration 1,138 18,632 Energy Services (566) (617) Other 158 672 Unallocated corporate expenses (13,188) (8,372) Interest expense (1,298) (574) Total (loss) income from continuing operations before income taxes $ (18,344) $ 7,961 31