UNITED STATES
SECURITIES AND EXCHANGE COMMISSION
WASHINGTON, D. C. 20549
FORM N-CSRS
Investment Company Act file number 811-06698
DWS Equity 500 Index Portfolio
(Exact Name of Registrant as Specified in Charter)
One South Street
Baltimore, MD 21202
(Address of principal executive offices) (Zip code)
Registrant’s Telephone Number, including Area Code: (212) 454-7190
Paul Schubert
345 Park Avenue
New York, NY 10154
(Name and Address of Agent for Service)
Date of fiscal year end: | 12/31 |
Date of reporting period: | 6/30/07 |
ITEM 1. REPORT TO STOCKHOLDERS
JUNE 30, 2007
Semiannual Report
to Shareholders
DWS Equity 500 Index Fund
Contents
click here Performance Summary
click here Information About Your Fund's Expenses
click here Portfolio Management Review
click here Portfolio Summary
DWS Equity 500 Index Fund
click here Financial Statements
click here Financial Highlights
click here Notes to Financial Statements
DWS Equity 500 Index Portfolio
click here Investment Portfolio
click here Financial Statements
click here Financial Highlights
click here Notes to Financial Statements
click here Account Management Resources
click here Privacy Statement
This report must be preceded or accompanied by a prospectus. To obtain a prospectus for any of our funds, refer to the Account Management Resources information provided in the back of this booklet. We advise you to consider the fund's objectives, risks, charges and expenses carefully before investing. The prospectus contains this and other important information about the fund. Please read the prospectus carefully before you invest.
Investments in mutual funds involve risk. Some funds have more risk than others. Derivatives may be more volatile and less liquid than traditional securities, and the fund could suffer losses on its derivatives positions. This fund is not sponsored, endorsed, sold, nor promoted by Standard & Poor's®, and Standard & Poor's makes no representation regarding the advisability of investing in the portfolio. Additionally, the fund may not be able to repllicate the S&P 500® Index closely enough to track its performance for several reasons, including the fund's cost to buy and sell securities, the flow of money into and out of the fund and the potential underperformance of stocks selected. Please read this fund's prospectus for specific information regarding its investments and risk profile.
DWS Scudder is part of Deutsche Asset Management, which is the marketing name in the US for the asset management activities of Deutsche Bank AG, Deutsche Bank Trust Company Americas, Deutsche Investment Management Americas Inc. and DWS Trust Company.
NOT FDIC/NCUA INSURED NO BANK GUARANTEE MAY LOSE VALUE NOT A DEPOSIT NOT INSURED BY ANY FEDERAL GOVERNMENT AGENCY
Performance Summary June 30, 2007
Institutional Class
All performance shown is historical, assumes reinvestment of all dividend and capital gain distributions, and does not guarantee future results. Investment return and principal value fluctuate with changing market conditions so that, when redeemed, shares may be worth more or less than their original cost. Current performance may be lower or higher than the performance quoted. Please visit www.dws-scudder.com for the Fund's most recent month-end performance.
The total annual fund operating expense ratio, gross of any fee waivers or expense reimbursements, as stated in the fee table of the prospectus dated May 1, 2007 is 0.21% for Institutional Class shares. Please see the Information About Your Fund's Expenses, the Financial Highlights and Notes to the Financial Statements (Note C, Related Parties) sections of this report for gross and net expense related disclosure for the period ended June 30, 2007.
To discourage short-term trading, the Fund imposes a 2% redemption fee on shareholders redeeming shares held less than 15 days, which has the effect of lowering total return.
Returns and rankings during all periods shown reflect a fee waiver and/or expense reimbursement. Without this waiver/reimbursement, returns and rankings would have been lower.
Performance figures do not reflect the deduction of taxes that a shareholder would pay on fund distributions or the redemption of fund shares. Returns and rankings may differ by share class.
Average Annual Total Returns as of 6/30/07 |
DWS Equity 500 Index Fund | 6-Month‡ | 1-Year | 3-Year | 5-Year | 10-Year |
Institutional Class | 6.97% | 20.56% | 11.62% | 10.63% | 7.03% |
S&P 500® Index+
| 6.96% | 20.59% | 11.68% | 10.71% | 7.13% |
Sources: Lipper Inc. and Deutsche Investment Management Americas Inc.
‡ Total returns shown for periods less than one year are not annualized.Net Asset Value and Distribution Information |
| Institutional Class |
Net Asset Value: 6/30/07
| $ 170.23 |
12/31/06
| $ 160.54 |
Distribution Information: Six Months as of 6/30/07:
Income Dividends | $ 1.47 |
Institutional Class Lipper Rankings — S&P 500 Index Objective Funds Category as of 6/30/07 |
Period | Rank | | Number of Funds Tracked | Percentile Ranking (%) |
1-Year
| 4 | of | 182 | 3 |
3-Year
| 10 | of | 164 | 7 |
5-Year
| 8 | of | 148 | 6 |
10-Year
| 4 | of | 59 | 7 |
Source: Lipper Inc. Rankings are historical and do not guarantee future results. Rankings are based on total returns with distributions reinvested. Rankings are for Institutional Class shares; other share classes may vary.
Growth of an Assumed $1,000,000 Investment |
[] DWS Equity 500 Index Fund — Institutional Class [] S&P 500 Index+ |
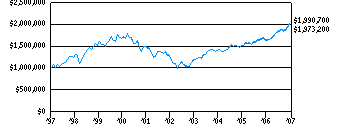 |
Yearly periods ended June 30 |
Comparative Results as of 6/30/07 |
DWS Equity 500 Index Fund | 1-Year | 3-Year | 5-Year | 10-Year |
Institutional Class | Growth of $1,000,000
| $1,205,600 | $1,390,700 | $1,657,000 | $1,973,200 |
Average annual total return
| 20.56% | 11.62% | 10.63% | 7.03% |
S&P 500 Index+
| Growth of $1,000,000
| $1,205,900 | $1,392,800 | $1,663,100 | $1,990,700 |
Average annual total return
| 20.59% | 11.68% | 10.71% | 7.13% |
The growth of $1,000,000 is cumulative.
The minimum initial investment for the Institutional Class is $1,000,000.
+ The Standard & Poor's 500 (S&P 500) Index is an unmanaged, capitalization-weighted index of 500 stocks. The index is designed to measure performance of the broad domestic economy through changes in the aggregate market value of 500 stocks representing all major industries. "Standard & Poor's," "S&P 500," "Standard & Poor's 500" and "500" are trademarks of The McGraw-Hill Companies Inc., and have been licensed for use by the Fund's investment advisor. Index returns assume reinvestment of dividends and, unlike Fund returns, do not reflect any fees or expenses. It is not possible to invest directly into an index.Class S
Class S shares are generally not available to new investors except under certain circumstances. (Please refer to the Fund's Statement of Additional Information.)
All performance shown is historical, assumes reinvestment of all dividend and capital gain distributions, and does not guarantee future results. Investment return and principal value fluctuate with changing market conditions so that, when redeemed, shares may be worth more or less than their original cost. Current performance may be lower or higher than the performance quoted. Please visit www.dws-scudder.com for the Fund's most recent month-end performance.
The total annual fund operating expense ratio, gross of any fee waivers or expense reimbursements, as stated in the fee table of the prospectus dated May 1, 2007 is 0.30% for Class S shares. Please see the Information About Your Fund's Expenses, the Financial Highlights and Notes to the Financial Statements (Note C, Related Parties) sections of this report for gross and net expense related disclosure for the period ended June 30, 2007.
To discourage short-term trading, the Fund imposes a 2% redemption fee on shareholders redeeming shares held less than 15 days, which has the effect of lowering total return.
Returns and rankings during all periods shown reflect a fee waiver and/or expense reimbursement. Without this waiver/reimbursement, returns and rankings would have been lower.
Performance figures do not reflect the deduction of taxes that a shareholder would pay on fund distributions or the redemption of fund shares. Returns and rankings may differ by share class.
On May 19, 2003, the Investment Class of the fund was issued in conjunction with the combination of Equity 500 Index Fund — Investment (the "Acquired fund") and the fund. The Acquired fund was, and the fund is, a feeder fund investing all of its investable assets in the same master portfolio, the DWS Equity 500 Index Portfolio. Returns shown prior to May 19, 2003 are the actual returns of the Acquired fund and for the period after May 19, 2003 are those of the fund's Investment Class. On October 20, 2006, Investment Class was renamed Class S.
Average Annual Total Returns as of 6/30/07 |
DWS Equity 500 Index Fund | 6-Month‡ | 1-Year | 3-Year | 5-Year | 10-Year |
Class S | 6.92% | 20.45% | 11.47% | 10.49% | 6.88% |
S&P 500 Index+
| 6.96% | 20.59% | 11.68% | 10.71% | 7.13% |
Sources: Lipper Inc. and Deutsche Investment Management Americas Inc.
‡ Total returns shown for periods less than one year are not annualized.Net Asset Value and Distribution Information |
| Class S |
Net Asset Value: 6/30/07
| $ 168.55 |
12/31/06
| $ 158.94 |
Distribution Information: Six Months as of 6/30/07:
Income Dividends | $ 1.36 |
Class S Lipper Rankings — S&P 500 Index Objective Funds Category as of 6/30/07 |
Period | Rank | | Number of Funds Tracked | Percentile Ranking (%) |
1-Year
| 22 | of | 182 | 13 |
3-Year
| 34 | of | 164 | 21 |
5-Year
| 32 | of | 148 | 21 |
10-Year
| 20 | of | 59 | 34 |
Source: Lipper Inc. Rankings are historical and do not guarantee future results. Rankings are based on total return with distributions reinvested. Rankings are for Class S shares; other share classes may vary.
Growth of an Assumed $10,000 Investment |
[] DWS Equity 500 Index Fund — Class S [] S&P 500 Index+ |
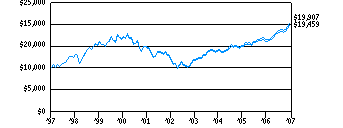 |
Yearly periods ended June 30 |
Comparative Results as of 6/30/07 |
DWS Equity 500 Index Fund | 1-Year | 3-Year | 5-Year | 10-Year |
Class S | Growth of $10,000
| $12,045 | $13,852 | $16,466 | $19,459 |
Average annual total return
| 20.45% | 11.47% | 10.49% | 6.88% |
S&P 500 Index+
| Growth of $10,000
| $12,059 | $13,928 | $16,631 | $19,907 |
Average annual total return
| 20.59% | 11.68% | 10.71% | 7.13% |
The growth of $10,000 is cumulative.
+ The Standard & Poor's 500 (S&P 500) Index is an unmanaged, capitalization-weighted index of 500 stocks. The index is designed to measure performance of the broad domestic economy through changes in the aggregate market value of 500 stocks representing all major industries. "Standard & Poor's," "S&P 500," "Standard & Poor's 500" and "500" are trademarks of The McGraw-Hill Companies Inc., and have been licensed for use by the Fund's investment advisor. Index returns assume reinvestment of dividends and, unlike Fund returns, do not reflect any fees or expenses. It is not possible to invest directly into an index.Information About Your Fund's Expenses
As an investor of the Fund, you incur two types of costs: ongoing expenses and transaction costs. Ongoing expenses include management fees and other Fund expenses. Examples of transaction costs include sales charges (loads), redemption fees and account maintenance fees, which are not shown in this section. The following tables are intended to help you understand your ongoing expenses (in dollars) of investing in the Fund and to help you compare these expenses with the ongoing expenses of investing in other mutual funds. In the most recent six-month period, the Fund limited these expenses; had it not done so, expenses would have been higher. The example in the table is based on an investment of $1,000 invested at the beginning of the six-month period and held for the entire period (January 1, 2007 to June 30, 2007).
The tables illustrate your Fund's expenses in two ways:
Actual Fund Return. This helps you estimate the actual dollar amount of ongoing expenses (but not transaction costs) paid on a $1,000 investment in the Fund using the Fund's actual return during the period. To estimate the expenses you paid over the period, simply divide your account value by $1,000 (for example, an $8,600 account value divided by $1,000 = 8.6), then multiply the result by the number in the "Expenses Paid per $1,000" line under the share class you hold.
Hypothetical 5% Fund Return. This helps you to compare your Fund's ongoing expenses (but not transaction costs) with those of other mutual funds using the Fund's actual expense ratio and a hypothetical rate of return of 5% per year before expenses. Examples using a 5% hypothetical fund return may be found in the shareholder reports of other mutual funds. The hypothetical account values and expenses may not be used to estimate the actual ending account balance or expenses you paid for the period.
Please note that the expenses shown in these tables are meant to highlight your ongoing expenses only and do not reflect any transaction costs. The "Expenses Paid per $1,000" line of the tables is useful in comparing ongoing expenses only and will not help you determine the relative total expense of owning different funds. If these transaction costs had been included, your costs would have been higher.
Expenses and Value of a $1,000 Investment for the six months ended June 30, 2007 |
Actual Fund Return* | Class S | Institutional Class |
Beginning Account Value 1/1/07
| $ 1,000.00 | $ 1,000.00 |
Ending Account Value 6/30/07
| $ 1,069.20 | $ 1,069.70 |
Expenses Paid per $1,000**
| $ 1.03 | $ .51 |
Hypothetical 5% Fund Return* | Class S | Institutional Class |
Beginning Account Value 1/1/07
| $ 1,000.00 | $ 1,000.00 |
Ending Account Value 6/30/07
| $ 1,023.80 | $ 1,024.30 |
Expenses Paid per $1,000**
| $ 1.00 | $ .50 |
* Expenses include amounts allocated proportionally from the master portfolio.** Expenses are equal to the Fund's annualized expense ratio for each share class, multiplied by the average account value over the period, multiplied by the number of days in the most recent six-month period, then divided by 365.Annualized Expense Ratios | Class S | Institutional Class |
DWS Equity 500 Index Fund
| .20% | .10% |
For more information, please refer to the Fund's prospectuses.
Portfolio Management Review
In the following interview, a team of portfolio managers from Northern Trust Investments, the fund's subadvisor, discusses the market environment and DWS Equity 500 Index Fund's performance for the six-month period ended June 30, 2007. The fund is a feeder fund that invests all of its assets in a master portfolio, the DWS Equity 500 Index Portfolio. The fund and the master portfolio have the same objective. The master portfolio is advised by Deutsche Investment Management Americas Inc. and subadvised by Northern Trust Investments, N.A.
Q: How would you describe the market environment over the last six months?
A: Except for a period of weakness in late February and early March, equity markets were generally strong during the first six months of 2007, despite moderation in economic growth. By the end of May, most indices were at or near their all-time highs; markets were volatile with no pronounced trend in June. The Russell 3000® Index, which is generally regarded as a good indicator of the broad stock market, returned 7.11% for the six-month period.1
1 The Russell 3000 Index measures the performance of the 3,000 largest US companies based on total market capitalization, which represents approximately 98% of the investable US equity market.Nearly all market sectors were strong over this period; returns of growth and value stocks and equities in various capitalization ranges were fairly close to one another. The Standard & Poor's 500® (S&P 500) Index returned 6.96%, and the Russell 1000® Index returned 7.18%; both of these indices measure performance of large-cap stocks.2 After a long period when small-cap stocks generally outperformed large-cap, the small-cap Russell 2000® Index returned 6.45%.3 Mid-cap stocks were stronger than either small-cap or large cap: The Russell MidCap™ Index returned 9.90% for the period.4
2 The Standard & Poor's (S&P) 500 Index is an unmanaged, capitalization-weighted index of 500 stocks. The index is designed to measure performance of the broad domestic economy through changes in the aggregate market value of 500 stocks representing all major industries.The Russell 1000 Index measures the performance of the 1,000 largest companies in the Russell 3000 Index, which represents approximately 92% of the total market capitalization of the Russell 3000 Index.Index returns assume reinvestment of dividends and, unlike fund returns, do not reflect any fees or expenses. It is not possible to invest directly into an index.3 The Russell 2000 Index measures the performance of the 2,000 smallest companies in the Russell 3000 Index, which represents approximately 8% of the total market capitalization of the Russell 3000 Index.4 The Russell Midcap Index measures the performance of the 800 smallest companies in the Russell 1000 Index, which represent approximately 25% of the total market capitalization of the Russell 1000 Index.The market's strength was quite broad, encompassing both growth and value stocks: The Russell 1000® Value Index had a return of 6.23%, while the Russell 1000® Growth Index returned 8.13%.5 Nine of the 10 industry sectors within the S&P 500 had positive returns; the one exception was financials, which was off less than 1%. The strongest sector was energy, followed by materials, telecommunications and industrials; all of these sectors posted double-digit returns.
5 The Russell 1000 Value Index is an unmanaged index that consists of those stocks in the Russell 1000 Index with lower price-to-book ratios and lower forecasted growth values.The Russell 1000 Growth Index is an unmanaged, capitalization-weighted index consisting of those stocks in the Russell 1000 Index that have greater-than-average growth orientation.Index returns assume reinvestment of dividends and, unlike fund returns, do not reflect any fees or expenses. It is not possible to invest directly into an index.Q: How did the fund perform during this period?
A: The fund's Institutional shares returned 6.97% for the six-month period ending June 30, 2007. Since the fund's investment strategy is to replicate, as closely as possible before the deduction of expenses, the performance of the S&P 500 Index, the fund's return is normally quite close to the return of the index, as it was for this period. (Past performance is no guarantee of future results. Please see pages 5 through 8 for the performance of other share classes and more complete performance information.)
Q: Which stocks had the greatest effect on performance?
A: Since the index is weighted by market capitalization, the largest stocks generally have the greatest impact on index returns, even when other stocks have the highest or lowest returns. Accordingly, several of the top contributors to performance are among the largest companies in the index. These include AT&T Inc., ExxonMobil Corp., Chevron Corp., Altria Group, Inc. and General Electric Co. Other stocks that contributed importantly to the return of the index were Apple Inc., which is benefiting from the popularity of the iPod and other innovative products, and Schlumberger Ltd., which reported extraordinarily strong first quarter earnings.
Several of the stocks that detracted from return were in the financial services sector; these include Citigroup, Inc., Bank of America Corp., Wachovia Corp. and Merrill Lynch & Co., Inc. Other negatives were Amgen, Inc. and Johnson & Johnson, both in the health care sector.
Q: What changes were made in the S&P 500 Index during the first half of 2007?
A: Standard & Poor's adjusts the composition of the S&P 500 Index to reflect changes in the relative size of companies and changes in corporate ownership. Most changes result from merger and acquisition activity, although some occur when a company is de-listed or shrinks to the point that it is moved to a different index. Additions are selected from companies that have reached a size that makes them appropriate for inclusion. During the first six months of 2007, there were 22 additions and 22 deletions to the index.
Among the additions during the period were Polo Ralph Lauren Corp.; Precision Castparts; Integrys Energy Group, Inc., formed by the merger of Peoples Energy and WPS Resources Corporation; CVS Caremark Corp., formed by the merger of CVS Corporation and Caremark Rx Inc.; Covidien Ltd. and Tyco Electronics, which were spun off from Tyco International; Discover Financial Services, a unit of Morgan Stanley that began trading on the New York Stock Exchange; and Kraft Foods, Inc., following the completion of its spin-off by Altria Group, Inc.
Stocks eliminated from the index include BellSouth Corp., acquired by AT&T; Equity Office Properties, acquired by Blackstone Group; Phelps Dodge, acquired by Freeport-McMoran Copper & Gold Inc.; MedImmune Inc., acquired by AstraZeneca PLC; and Sanmina-SCI Corp. and PMC-Sierra Inc., whose market values fell below the index's $4 billion requirement.
Q: Do you have other comments for shareholders?
A: For many investors, we believe that holding an index fund such as this one can be advantageous because it offers broad exposure to the equity market at a relatively low cost.
The views expressed in this report reflect those of the portfolio managers only through the end of the period of the report as stated on the cover. The management team's views are subject to change at any time based on market and other conditions and should not be construed as a recommendation. Past performance is no guarantee of future results.
Portfolio Summary
Asset Allocation | 6/30/07 | 12/31/06 |
| | |
Common Stocks | 100% | 100% |
Sector Diversification (As a % of Common Stocks) | 6/30/07 | 12/31/06 |
| | |
Financials | 21% | 22% |
Information Technology | 15% | 15% |
Health Care | 12% | 12% |
Industrials | 11% | 11% |
Energy | 11% | 10% |
Consumer Discretionary | 10% | 11% |
Consumer Staples | 9% | 9% |
Telecommunication Services | 4% | 3% |
Utilities | 4% | 4% |
Materials | 3% | 3% |
| 100% | 100% |
Asset allocation and sector diversification are subject to change.
Ten Largest Equity Holdings at June 30, 2007 (19.1% of Net Assets) |
1. ExxonMobil Corp.
Explorer and producer of oil and gas
| 3.5% |
2. General Electric Co.
Industrial conglomerate
| 2.9% |
3. AT&T, Inc.
Provider of communications services
| 1.9% |
4. Citigroup, Inc.
Provider of diversified financial services
| 1.9% |
5. Microsoft Corp.
Developer of computer software
| 1.8% |
6. Bank of America Corp.
Provider of commercial banking services
| 1.6% |
7. Procter & Gamble Co.
Manufacturer of diversified consumer products
| 1.4% |
8. Chevron Corp.
Operator of petroleum exploration, delivery and refining facilities
| 1.4% |
9. American International Group, Inc.
Provider of insurance services
| 1.4% |
10. Pfizer, Inc.
Manufacturer of prescription pharmaceuticals and non-prescription self-medications
| 1.3% |
Portfolio holdings are subject to change.
For more complete details about the Portfolio's investment portfolio, see page 31. A quarterly Fact Sheet is available upon request. Information concerning portfolio holdings of the Portfolio as of month end will be posted to www.dws-scudder.com on or after the last day of the following month. In addition, the Portfolio's top ten holdings and other information about the Fund is posted on www.dws-scudder.com as of the calendar quarter-end on or after the 15th day following quarter-end. Please see the Account Management Resources section for contact information.
Following the Fund's fiscal first and third quarter-end, a complete portfolio holdings listing is filed with the SEC on Form N-Q. The form will be available on the SEC's Web site at www.sec.gov, and it also may be reviewed and copied at the SEC's Public Reference Room in Washington, D.C. Information on the operation of the SEC's Public Reference Room may be obtained by calling (800) SEC-0330.
Financial Statements
Statement of Assets and Liabilities as of June 30, 2007 (Unaudited) |
Assets |
Investment in the DWS Equity 500 Index Portfolio, at value
| $ 2,933,461,709 |
Receivable for Fund shares sold
| 3,812,221 |
Other assets
| 36,797 |
Total assets
| 2,937,310,727 |
Liabilities |
Payable for Fund shares redeemed
| 4,239,285 |
Accrued expenses and other payables
| 338,987 |
Total liabilities
| 4,578,272 |
Net assets, at value | $ 2,932,732,455 |
Net Assets |
Net assets consist of:
Undistributed net investment income
| 1,334,926 |
Net unrealized appreciation (depreciation) on investments and futures
| 1,938,559,840 |
Accumulated net realized gain (loss)
| (252,733,748) |
Paid-in capital
| 1,245,571,437 |
Net assets, at value | $ 2,932,732,455 |
Net Asset Value |
Class S Net Asset Value, offering and redemption price(a) per share ($852,242,821 ÷ 5,056,330 outstanding shares of beneficial interest, $.001 par value, unlimited number of shares authorized)
| $ 168.55 |
Institutional Class Net Asset Value, offering and redemption price(a) per share ($2,080,489,634 ÷ 12,221,638 outstanding shares of beneficial interest, $.001 par value, unlimited number of shares authorized)
| $ 170.23 |
(a) Redemption price per share for shares held less than 15 days is equal to net asset value less a 2% redemption fee.The accompanying notes are an integral part of the financial statements.
Statement of Operations for the six months ended June 30, 2007 (Unaudited) |
Investment Income |
Income and expenses allocated from DWS Equity 500 Index Portfolio:
Dividends
| 26,988,798 |
Interest — Cash Management QP Trust
| 643,450 |
Interest
| 53,881 |
Expenses*
| (726,123) |
Total Income
| 26,960,006 |
Expenses:
Administration fee
| 1,431,890 |
Services to shareholders
| 584,311 |
Auditing
| 13,929 |
Legal
| 40,479 |
Trustees' fees and expenses
| 6,489 |
Reports to shareholders
| 50,551 |
Registration fees
| 16,453 |
Other
| 3,943 |
Total expenses before expense reductions
| 2,148,045 |
Expense reductions
| (1,022,659) |
Total expenses after expense reductions
| 1,125,386 |
Net investment income (loss) | 25,834,620 |
Realized and Unrealized Gain (Loss) on Investment Transactions |
Net realized gain (loss) allocated from DWS Equity 500 Index Portfolio:
Investments
| 10,175,206 |
Futures
| 1,923,164 |
| 12,098,370 |
Net unrealized appreciation (depreciation) allocated from DWS Equity 500 Index Portfolio during the period on:
Investments
| 156,690,261 |
Futures
| (46,083) |
| 156,644,178 |
Net gain (loss) on investment transactions | 168,742,548 |
Net increase (decrease) in net assets resulting from operations | $ 194,577,168 |
* For the six months ended June 30, 2007, the DWS Equity 500 Index Portfolio was reimbursed by the Advisor for fees in the amount of $755,323, of which $599,653 was allocated to this Fund on a pro-rated basis.The accompanying notes are an integral part of the financial statements.
Statement of Changes in Net Assets |
Increase (Decrease) in Net Assets | Six Months Ended June 30, 2007 (Unaudited) | Year Ended December 31, 2006 |
Operations:
Net investment income (loss)
| $ 25,834,620 | $ 48,188,383 |
Net realized gain (loss) on investment transactions
| 12,098,370 | (21,301,259) |
Net unrealized appreciation (depreciation) during the period on investment transactions
| 156,644,178 | 365,330,170 |
Net increase (decrease) in net assets resulting from operations
| 194,577,168 | 392,217,294 |
Distributions to shareholders from:
Net investment income:
Class S | (6,886,730) | (13,165,072) |
Institutional Class | (18,229,476) | (34,675,804) |
Fund share transactions:
Proceeds from shares sold
| 288,250,612 | 379,727,473 |
Reinvestment of distributions
| 23,990,873 | 45,642,550 |
Cost of shares redeemed
| (310,783,109) | (587,983,836) |
Redemption fees
| 11,301 | 9,809 |
Net increase (decrease) in net assets from Fund share transactions
| 1,469,677 | (162,604,004) |
Increase (decrease) in net assets | 170,930,639 | 181,772,414 |
Net assets at beginning of period
| 2,761,801,816 | 2,580,029,402 |
Net assets at end of period (includes undistributed net investment income of $1,334,926 and $616,512, respectively)
| $ 2,932,732,455 | $ 2,761,801,816 |
The accompanying notes are an integral part of the financial statements.
Financial Highlights
Class S+ Years Ended December 31, | 2007a | 2006 | 2005 | 2004 | 2003b |
Selected Per Share Data |
Net asset value, beginning of period | $ 158.94 | $ 139.85 | $ 135.69 | $ 124.93 | $ 106.22 |
Income (loss) from investment operations: Net investment income (loss)c | 1.42 | 2.56 | 2.21 | 2.27 | 1.07 |
Net realized and unrealized gain (loss) on investment transactions | 9.55 | 19.04 | 4.10 | 10.78 | 18.89 |
Total from investment operations | 10.97 | 21.60 | 6.31 | 13.05 | 19.96 |
Less distributions from: Net investment income | (1.36) | (2.51) | (2.15) | (2.29) | (1.25) |
Redemption fees
| .00*** | .00*** | .00*** | — | — |
Net asset value, end of period | $ 168.55 | $ 158.94 | $ 139.85 | $ 135.69 | $ 124.93 |
Total Return (%)d
| 6.92** | 15.58 | 4.70 | 10.57 | 18.88** |
Ratios to Average Net Assets and Supplemental Data |
Net assets, end of period ($ millions)
| 852 | 771 | 768 | 727 | 573 |
Ratio of expenses before expense reductions, including expenses allocated from DWS Equity 500 Index Portfolio (%)
| .30* | .33 | .36 | .36 | .36* |
Ratio of expenses after expense reductions, including expenses allocated from DWS Equity 500 Index Portfolio (%)
| .20* | .22 | .25 | .25 | .25* |
Ratio of net investment income (loss) (%)
| 1.73* | 1.73 | 1.62 | 1.77 | 1.52* |
a For the six months ended June 30, 2007 (Unaudited).
b For the period from May 19, 2003 (commencement of operations of Investment Class shares) to December 31, 2003.
c Based on average shares outstanding during period.
d Total return would have been lower had certain expenses not been reduced.
+ On October 20, 2006 Investment Class shares were renamed Class S shares.
* Annualized
** Not annualized
*** Amount is less than $.005.
|
Institutional Class Years Ended December 31, | 2007a | 2006 | 2005 | 2004 | 2003 | 2002 |
Selected Per Share Data |
Net asset value, beginning of period | $ 160.54 | $ 141.29 | $ 137.10 | $ 126.22 | $ 99.84 | $ 130.19 |
Income (loss) from investment operations: Net investment income (loss)b | 1.50 | 2.73 | 2.41 | 2.46 | 1.85 | 1.71 |
Net realized and unrealized gain (loss) on investment transactions | 9.66 | 19.28 | 4.16 | 10.93 | 26.33 | (30.42) |
Total from investment operations | 11.16 | 22.01 | 6.57 | 13.39 | 28.18 | (28.71) |
Less distributions from: Net investment income | (1.47) | (2.76) | (2.38) | (2.51) | (1.80) | (1.64) |
Redemption fees
| .00*** | .00*** | .00*** | — | — | — |
Net asset value, end of period | $ 170.23 | $ 160.54 | $ 141.29 | $ 137.10 | $ 126.22 | $ 99.84 |
Total Return (%)c
| 6.97** | 15.72 | 4.85 | 10.74 | 28.45 | (22.12) |
Ratios to Average Net Assets and Supplemental Data |
Net assets, end of period ($ millions)
| 2,080 | 1,991 | 1,812 | 1,828 | 1,982 | 1,394 |
Ratio of expenses before expense reductions, including expenses allocated from DWS Equity 500 Index Portfolio (%)
| .22* | .20 | .11 | .11 | .11 | .11 |
Ratio of expenses after expense reductions, including expenses allocated from DWS Equity 500 Index Portfolio (%)
| .10* | .10 | .10 | .10 | .10 | .10 |
Ratio of net investment income (loss) (%)
| 1.83* | 1.85 | 1.77 | 1.92 | 1.69 | 1.52 |
a For the six months ended June 30, 2007 (Unaudited).
b Based on average shares outstanding during the period.
c Total return would have been lower had certain expenses not been reduced.
* Annualized
** Not annualized
*** Amount is less than $.005.
|
Notes to Financial Statements (Unaudited)
A. Significant Accounting Policies
DWS Equity 500 Index Fund (the "Fund"), is a diversified series of DWS Institutional Funds (the "Trust") which is registered under the Investment Company Act of 1940, as amended, (the "1940 Act"), as an open-end management investment company organized as a Massachusetts business trust.
The Fund, a feeder fund, seeks to achieve its investment objective by investing all of its investable assets in a master portfolio, DWS Equity 500 Index Portfolio (the "Portfolio"), a diversified, open-end management investment company advised by Deutsche Investment Management Americas Inc. ("DIMA"), an indirect, wholly owned subsidiary of Deutsche Bank AG. On June 30, 2007, the Fund owned approximately 79% of the Portfolio.
The Fund offers two classes of shares: Institutional Class and Class S. Institutional Class and Class S shares are offered to a limited group of investors, and are not subject to initial or contingent deferred sales charges. Institutional shares have lower ongoing expenses than Class S shares.
Investment income, realized and unrealized gains and losses, and certain fund-level expenses and expense reductions, if any, are borne pro rata on the basis of relative net assets by the holders of both classes of shares, except that each class bears certain expenses unique to that class such as services to shareholders and certain other class specific expenses. Differences in class-level expenses may result in payment of different per share dividends by class. All shares of the Fund have equal rights with respect to voting subject to class-specific arrangements.
The Fund's financial statements are prepared in accordance with accounting principles generally accepted in the United States of America which require the use of management estimates. Actual results could differ from those estimates. The policies described below are followed consistently by the Fund in the preparation of its financial statements. The financial statements of the Portfolio, including the Investment Portfolio, are contained elsewhere in this report and should be read in conjunction with the Fund's financial statements.
Security Valuation. The Fund records its investment in the Portfolio at value, which reflects its proportionate interest in the net assets of the Portfolio. Valuation of the securities held by the Portfolio is discussed in the notes to the Portfolio's financial statements included elsewhere in this report.
In September 2006, the Financial Accounting Standards Board (FASB) released Statement of Financial Accounting Standards No. 157, "Fair Value Measurements" ("FAS 157"). FAS 157 defines fair value, establishes a framework for measuring fair value and expands disclosures about fair value measurements. FAS 157 is effective for fiscal years beginning after November 15, 2007. As of June 30, 2007, management does not believe the adoption of FAS 157 will impact the amounts reported in the financial statements, however, additional disclosures will be required about the inputs used to develop the measurements of fair value and the effect of certain of the measurements reported in the statement of operations for a fiscal period.
Federal Income Taxes. The Fund's policy is to comply with the requirements of the Internal Revenue Code, as amended, which are applicable to regulated investment companies, and to distribute all of its taxable income to its shareholders. Accordingly, the Fund paid no federal income taxes and no federal income tax provision was required.
At December 31, 2006, the Fund had a net tax basis capital loss carryforward of approximately $249,237,000, which may be applied against any realized net taxable capital gains of each succeeding year until fully utilized or until December 31, 2009 ($9,016,000), December 31, 2010 ($68,380,000), December 31, 2011 ($53,713,000), December 31, 2012 ($73,803,000), December 31, 2013 ($22,343,000) and December 31, 2014 ($21,982,000), the respective expiration dates, whichever occurs first, which may be subject to certain limitations under Sections 382-384 of the Internal Revenue Code.
In July 2006, FASB issued Interpretation No. 48 ("FIN 48"), "Accounting for Uncertainty in Income Taxes — an interpretation of FASB Statement No. 109" (the "Interpretation"). The Interpretation establishes for the Fund a minimum threshold for financial statement recognition of the benefit of positions taken in filing tax returns. Management has evaluated the application of FIN 48 and has determined there is no impact on the Fund's financial statements.
Distribution of Income and Gains. Net investment income of the Fund is declared and distributed to shareholders quarterly. Net realized gains from investment transactions, in excess of available capital loss carryforwards, would be taxable to the Fund if not distributed, and, therefore, will be distributed to shareholders at least annually.
The timing and characterization of certain income and capital gains distributions are determined annually in accordance with federal tax regulations which may differ from accounting principles generally accepted in the United States of America. As a result, net investment income (loss) and net realized gain (loss) on investment transactions for a reporting period may differ significantly from distributions during such period. Accordingly, the Fund may periodically make reclassifications among certain of its capital accounts without impacting the net asset value of the Fund.
The tax character of current year distributions will be determined at the end of the current fiscal year.
Redemption Fees. The Fund imposes a redemption fee of 2% of the total redemption amount on the Fund shares redeemed or exchanged within 15 days of buying them, either by purchase or exchange. This fee is assessed and retained by the Fund for the benefit of the remaining shareholders. The redemption fee is accounted for as an addition to paid-in capital.
Contingencies. In the normal course of business, the Fund may enter into contracts with service providers that contain general indemnification clauses. The Fund's maximum exposure under these arrangements is unknown as this would involve future claims that may be made against the Fund that have not yet been made. However, based on experience, the Fund expects the risk of loss to be remote.
Other. The Fund receives a daily allocation of the Portfolio's income, expenses and net realized and unrealized gains and losses in proportion to its investment in the Portfolio. Expenses directly attributed to a fund are charged to that fund, while expenses which are attributable to the Trust are allocated among the funds in the Trust on the basis of relative net assets.
B. Related Parties
Deutsche Investment Management Americas Inc. ("DIMA" or the "Advisor"), an indirect, wholly owned subsidiary of Deutsche Bank AG, is the Advisor for the Portfolio. Prior to January 1, 2007, Deutsche Asset Management Inc. ("DAMI"), an indirect, wholly owned subsidiary of Deutsche Bank AG, was the Advisor to the master Portfolio.
For the period from January 1, 2007 through September 30, 2007, DIMA has contractually agreed to waive all or a portion of its fees and reimburse or pay certain operating expenses of the Fund, including expenses allocated from the Portfolio (excluding certain expenses such as extraordinary expenses, taxes, brokerage, interest, proxy and organizational and offering expenses) to the extent necessary to maintain the operating expenses of the classes of the Fund as follows:
Class S
| .38% |
Institutional Class
| .40% |
For Institutional Class shares, effective October 1, 2006, the Advisor has voluntarily agreed to waive all or a portion of its fees and reimburse or pay certain operating expenses of the Fund, including expenses allocated from the Portfolio (excluding certain expenses such as extraordinary expenses, taxes, brokerage, interest, proxy and organizational and offering expenses) to the extent necessary to maintain the operating expenses at 0.10%.
Under this arrangement, during the six months ended June 30, 2007, DIMA waived $1,722 of other expenses for Institutional Class shares.
Administration Fee. Pursuant to the Administrative Services Agreement with DIMA, the Advisor provides most administrative services to the Fund. For all services provided under the Administrative Services Agreement, the Fund pays the Advisor an annual fee ("Administration Fee") of 0.10% of the Fund's average daily net assets, computed and accrued daily and payable monthly. For the six months ended June 30, 2007, the Advisor received an Administration Fee of $1,431,890, of which $862,783 was waived and $91,431 is unpaid.
Service Provider Fees. DWS Scudder Investments Service Company ("DWS-SISC"), an affiliate of the Advisor, is the transfer agent, dividend-paying agent and shareholder service agent for the Fund. Pursuant to a sub-transfer agency agreement among DWS-SISC and DST Systems, Inc. ("DST"), DWS-SISC has delegated certain transfer agent and dividend-paying agent functions to DST. DWS-SISC compensates DST out of the shareholder servicing fee it receives from the Fund. For the six months ended June 30, 2007, the amount charged to the Fund by DWS-SISC was as follows.
Services to Shareholders | Total Aggregated | Waived | Unpaid at June 30, 2007 |
Class S
| $ 66,216 | $ — | $ 11,823 |
Institutional Class
| 158,154 | 158,154 | — |
| $ 224,370 | $ 158,154 | $ 11,823 |
Typesetting and Filing Service Fees. Under an agreement with DIMA, DIMA is compensated for providing typesetting and certain regulatory filing services to the Fund. For the six months ended June 30, 2007, the amount charged to the Fund by DIMA included in the Statement of Operations under "reports to shareholders" aggregated $11,493, all of which has been paid.
Trustees' Fees and Expenses. As compensation for his or her services, each Independent Trustee receives an aggregated annual fee (plus reimbursement for reasonable out-of-pocket expenses incurred in connection with his or her attendance at board and committee meetings) from each fund in the Fund Complex for which he or she serves. In addition, the Chairperson of the Board and Chairperson of the Board receive additional compensation for their services. Payment of such fees and expenses is allocated among all such funds described above in direct proportion to their relative net assets.
C. Share Transactions
The following table summarizes share and dollar activity in the Fund:
| Six Months Ended June 30, 2007 | Year Ended December 31, 2006 |
| Shares | Dollars | Shares | Dollars |
Shares sold |
Class S
| 763,601 | $ 124,119,975 | 1,052,006* | $ 154,433,900* |
Institutional Class
| 995,107 | 164,130,637 | 1,522,226 | 225,293,573 |
| | $ 288,250,612 | | $ 379,727,473 |
Shares issued to shareholders in reinvestment of distributions |
Class S
| 39,040 | $ 6,432,368 | 82,457* | $ 12,261,672* |
Institutional Class
| 105,543 | 17,558,505 | 222,390 | 33,380,878 |
| | $ 23,990,873 | | $ 45,642,550 |
Shares redeemed |
Class S
| (598,431) | $ (98,069,765) | (1,775,882)* | $ (264,213,313)* |
Institutional Class
| (1,278,332) | (212,713,344) | (2,168,123) | (323,770,523) |
| | $ (310,783,109) | | $ (587,983,836) |
Redemption fees | $ 11,301 | | $ 9,809 |
Net increase (decrease) |
Class S
| 204,210 | $ 32,485,800 | (641,419)* | $ (97,510,346)* |
Institutional Class
| (177,682) | (31,016,123) | (423,507) | (65,093,658) |
| | $ 1,469,677 | | $ (162,604,004) |
* On October 20, 2006, Investment Class shares were renamed Class S shares.D. Regulatory Matters and Litigation
Regulatory Settlements. On December 21, 2006, Deutsche Asset Management ("DeAM") settled proceedings with the Securities and Exchange Commission ("SEC") and the New York Attorney General on behalf of Deutsche Asset Management, Inc. ("DAMI") and Deutsche Investment Management Americas Inc. ("DIMA"), the investment advisors to many of the DWS Scudder funds, regarding allegations of improper trading of fund shares at DeAM and at the legacy Scudder and Kemper organizations prior to their acquisition by DeAM in April 2002. These regulators alleged that although the prospectuses for certain funds in the regulators' view indicated that the funds did not permit market timing, DAMI and DIMA breached their fiduciary duty to those funds in that their efforts to limit trading activity in the funds were not effective at certain times. The regulators also alleged that DAMI and DIMA breached their fiduciary duty to certain funds by entering into certain market timing arrangements with investors. These trading arrangements originated in businesses that existed prior to the currently constituted DeAM organization, which came together as a result of various mergers of the legacy Scudder, Kemper and Deutsche fund groups, and all of the arrangements were terminated prior to the start of the regulatory investigations that began in the summer of 2003. No current DeAM employee approved these trading arrangements. Under the terms of the settlements, DAMI and DIMA neither admitted nor denied any wrongdoing.
The terms of the SEC settlement, which identified improper trading in the legacy Deutsche and Kemper mutual funds only, provide for payment of disgorgement in the amount of $17.2 million. The terms of the settlement with the New York Attorney General provide for payment of disgorgement in the amount of $102.3 million, which is inclusive of the amount payable under the SEC settlement, plus a civil penalty in the amount of $20 million. The total amount payable by DeAM, approximately $122.3 million, would be distributed to funds in accordance with a distribution plan to be developed by a distribution consultant. The funds' investment advisors do not believe these amounts will have a material adverse financial impact on them or materially affect their ability to perform under their investment management agreements with the DWS funds. The above-described amounts are not material to Deutsche Bank, and have already been reserved.
Among the terms of the settled orders, DeAM is subject to certain undertakings regarding the conduct of its business in the future, including: formation of a Code of Ethics Oversight Committee to oversee all matters relating to issues arising under the advisors' Code of Ethics; establishment of an Internal Compliance Controls Committee having overall compliance oversight responsibility of the advisors; engagement of an Independent Compliance Consultant to conduct a comprehensive review of the advisors' supervisory compliance and other policies and procedures designed to prevent and detect breaches of fiduciary duty, breaches of the Code of Ethics and federal securities law violations by the advisors and their employees; and commencing in 2008, the advisors shall undergo a compliance review by an independent third party.
In addition, DeAM is subject to certain further undertakings relating to the governance of the mutual funds, including that: at least 75% of the members of the Boards of Trustees/Directors overseeing the DWS Funds continue to be independent of DeAM; the Chairmen of the DWS Funds' Boards of Trustees/Directors continue to be independent of DeAM; DeAM maintain existing management fee reductions for certain funds for a period of five years and not increase management fees for these certain funds during this period; the funds retain a senior officer (or independent consultants, as applicable) responsible for assisting in the review of fee arrangements and monitoring compliance by the funds and the investment advisors with securities laws, fiduciary duties, codes of ethics and other compliance policies, the expense of which shall be borne by DeAM; and periodic account statements, fund prospectuses and the mutual funds' web site contain additional disclosure and/or tools that assist investors in understanding the fees and costs associated with an investment in the funds and the impact of fees and expenses on fund returns.
DeAM has also settled proceedings with the Illinois Secretary of State regarding market timing matters. The terms of the Illinois settlement provide for investor education contributions totaling approximately $4 million and a payment in the amount of $2 million to the Securities Audit and Enforcement Fund.
On September 28, 2006, the SEC and the National Association of Securities Dealers ("NASD") announced final agreements in which Deutsche Investment Management Americas Inc. ("DIMA"), Deutsche Asset Management, Inc. ("DAMI") and Scudder Distributors, Inc. ("SDI") (now known as DWS Scudder Distributors, Inc.) settled administrative proceedings regarding disclosure of brokerage allocation practices in connection with sales of the Scudder Funds' (now known as the DWS Scudder Funds) shares during 2001-2003. The agreements with the SEC and NASD are reflected in orders which state, among other things, that DIMA and DAMI failed to disclose potential conflicts of interest to the fund Boards and to shareholders relating to SDI's use of certain funds' brokerage commissions to reduce revenue sharing costs to broker-dealer firms with whom it had arrangements to market and distribute Scudder Fund shares. These directed brokerage practices were discontinued in October 2003.
Under the terms of the settlements, in which DIMA, DAMI and SDI neither admitted nor denied any of the regulators' findings, DIMA, DAMI and SDI agreed to pay disgorgement, prejudgment interest and civil penalties in the total amount of $19.3 million. The portion of the settlements distributed to the funds was approximately $17.8 million and was paid to the funds as prescribed by the settlement orders based upon the amount of brokerage commissions from each fund used to satisfy revenue sharing agreements with broker-dealers who sold fund shares. Based on the prescribed settlement order, the Portfolio was not entitled to a portion of the settlement.
As part of the settlements, DIMA, DAMI and SDI also agreed to implement certain measures and undertakings relating to revenue sharing payments including making additional disclosures in the fund Prospectuses or Statements of Additional Information, adopting or modifying relevant policies and procedures and providing regular reporting to the fund Boards.
Private Litigation Matters. The matters alleged in the regulatory settlements described above also serve as the general basis of a number of private class action lawsuits involving the DWS funds. These lawsuits name as defendants various persons, including certain DWS funds, the funds' investment advisors and their affiliates, and certain individuals, including in some cases fund Trustees/Directors, officers, and other parties. Each DWS fund's investment advisor has agreed to indemnify the applicable DWS funds in connection with these lawsuits, or other lawsuits or regulatory actions that may be filed making similar allegations.
Based on currently available information, the funds' investment advisors believe the likelihood that the pending lawsuits will have a material adverse financial impact on a DWS fund is remote and such actions are not likely to materially affect their ability to perform under their investment management agreements with the DWS funds.
(The following financial statements of the DWS Equity 500 Index Portfolio should be read in conjunction with the Fund's financial statements.)
Investment Portfolio as of June 30, 2007 (Unaudited)
|
Shares
| Value ($) |
| |
Common Stocks 99.2% |
Consumer Discretionary 10.1% |
Auto Components 0.2% |
Goodyear Tire & Rubber Co.* | 51,896 | 1,803,905 |
Johnson Controls, Inc. | 53,664 | 6,212,681 |
| 8,016,586 |
Automobiles 0.4% |
Ford Motor Co. | 531,985 | 5,011,299 |
General Motors Corp. | 162,171 | 6,130,064 |
Harley-Davidson, Inc. | 70,251 | 4,187,662 |
| 15,329,025 |
Distributors 0.1% |
Genuine Parts Co. | 46,778 | 2,320,189 |
Diversified Consumer Services 0.1% |
Apollo Group, Inc. "A"* | 38,783 | 2,266,091 |
H&R Block, Inc. | 88,582 | 2,070,161 |
| 4,336,252 |
Hotels Restaurants & Leisure 1.5% |
Carnival Corp. | 120,797 | 5,891,270 |
Darden Restaurants, Inc. | 35,880 | 1,578,361 |
Harrah's Entertainment, Inc. | 51,218 | 4,366,847 |
Hilton Hotels Corp. | 104,939 | 3,512,308 |
International Game Technology | 92,164 | 3,658,911 |
Marriott International, Inc. "A" | 90,664 | 3,920,311 |
McDonald's Corp. | 327,456 | 16,621,666 |
Starbucks Corp.* | 203,208 | 5,332,178 |
Starwood Hotels & Resorts Worldwide, Inc. | 57,512 | 3,857,330 |
Wendy's International, Inc. | 23,880 | 877,590 |
Wyndham Worldwide Corp.* | 55,814 | 2,023,816 |
Yum! Brands, Inc. | 144,082 | 4,714,363 |
| 56,354,951 |
Household Durables 0.6% |
Black & Decker Corp. | 17,952 | 1,585,341 |
Centex Corp. | 32,604 | 1,307,420 |
D.R. Horton, Inc. | 76,100 | 1,516,673 |
Fortune Brands, Inc. | 40,954 | 3,373,381 |
Harman International Industries, Inc. | 17,900 | 2,090,720 |
KB HOME | 20,972 | 825,668 |
Leggett & Platt, Inc. | 49,466 | 1,090,725 |
Lennar Corp. "A" | 37,400 | 1,367,344 |
Newell Rubbermaid, Inc. | 76,750 | 2,258,753 |
Pulte Homes, Inc. | 58,256 | 1,307,847 |
Snap-on, Inc. | 16,532 | 835,031 |
The Stanley Works | 19,953 | 1,211,147 |
Whirlpool Corp. | 21,777 | 2,421,603 |
| 21,191,653 |
Internet & Catalog Retail 0.2% |
Amazon.com, Inc.* | 83,812 | 5,733,579 |
IAC/InterActiveCorp.* | 60,600 | 2,097,366 |
| 7,830,945 |
Leisure Equipment & Products 0.2% |
Brunswick Corp. | 25,130 | 819,992 |
Eastman Kodak Co. | 78,031 | 2,171,602 |
Hasbro, Inc. | 43,502 | 1,366,398 |
Mattel, Inc. | 105,014 | 2,655,804 |
| 7,013,796 |
Media 3.3% |
CBS Corp. "B" | 202,254 | 6,739,103 |
Clear Channel Communications, Inc. | 136,863 | 5,176,159 |
Comcast Corp. "A"* | 849,090 | 23,876,411 |
Dow Jones & Co., Inc. | 16,722 | 960,679 |
E.W. Scripps Co. "A" | 22,900 | 1,046,301 |
Gannett Co., Inc. | 63,569 | 3,493,117 |
Interpublic Group of Companies, Inc.* | 120,295 | 1,371,363 |
McGraw-Hill Companies, Inc. | 96,074 | 6,540,718 |
Meredith Corp. | 10,838 | 667,621 |
New York Times Co. "A" | 39,773 | 1,010,234 |
News Corp. "A" | 635,200 | 13,472,592 |
Omnicom Group, Inc. | 91,336 | 4,833,501 |
The DIRECTV Group, Inc.* | 209,200 | 4,834,612 |
Time Warner, Inc. | 1,038,412 | 21,848,188 |
Tribune Co. | 21,831 | 641,831 |
Viacom, Inc. "B"* | 189,754 | 7,899,459 |
Walt Disney Co. | 543,564 | 18,557,275 |
| 122,969,164 |
Multiline Retail 1.1% |
Big Lots, Inc.* | 29,996 | 882,482 |
Dillard's, Inc. "A" | 17,468 | 627,625 |
Dollar General Corp. | 84,736 | 1,857,413 |
Family Dollar Stores, Inc. | 42,072 | 1,443,911 |
J.C. Penney Co., Inc. | 61,075 | 4,420,609 |
Kohl's Corp.* | 88,738 | 6,303,060 |
Macy's, Inc. | 125,450 | 4,990,401 |
Nordstrom, Inc. | 61,532 | 3,145,516 |
Sears Holdings Corp.* | 23,138 | 3,921,891 |
Target Corp. | 233,091 | 14,824,588 |
| 42,417,496 |
Specialty Retail 1.9% |
Abercrombie & Fitch Co. "A" | 24,300 | 1,773,414 |
AutoNation, Inc.* | 41,259 | 925,852 |
AutoZone, Inc.* | 13,608 | 1,859,125 |
Bed Bath & Beyond, Inc.* | 76,766 | 2,762,808 |
Best Buy Co., Inc. | 109,472 | 5,109,058 |
Circuit City Stores, Inc. | 38,733 | 584,094 |
Home Depot, Inc. | 541,499 | 21,307,986 |
Limited Brands, Inc. | 93,811 | 2,575,112 |
Lowe's Companies, Inc. | 412,874 | 12,671,103 |
Office Depot, Inc.* | 76,359 | 2,313,678 |
OfficeMax, Inc. | 20,178 | 792,995 |
RadioShack Corp. | 38,295 | 1,269,096 |
Staples, Inc. | 196,173 | 4,655,185 |
The Gap, Inc. | 145,458 | 2,778,248 |
The Sherwin-Williams Co. | 30,705 | 2,040,961 |
Tiffany & Co. | 37,016 | 1,964,069 |
TJX Companies, Inc. | 123,599 | 3,398,973 |
| 68,781,757 |
Textiles, Apparel & Luxury Goods 0.5% |
Coach, Inc.* | 101,000 | 4,786,390 |
Jones Apparel Group, Inc. | 29,960 | 846,370 |
Liz Claiborne, Inc. | 28,106 | 1,048,354 |
NIKE, Inc. "B" | 108,916 | 6,348,714 |
Polo Ralph Lauren Corp. | 16,700 | 1,638,437 |
VF Corp. | 24,240 | 2,219,899 |
| 16,888,164 |
Consumer Staples 9.2% |
Beverages 2.0% |
Anheuser-Busch Companies, Inc. | 208,480 | 10,874,317 |
Brown-Forman Corp. "B" | 21,878 | 1,598,844 |
Coca-Cola Co. | 549,935 | 28,767,100 |
Coca-Cola Enterprises, Inc. | 76,024 | 1,824,576 |
Constellation Brands, Inc. "A"* | 52,900 | 1,284,412 |
Molson Coors Brewing Co. "B" | 12,702 | 1,174,427 |
Pepsi Bottling Group, Inc. | 37,762 | 1,271,824 |
PepsiCo, Inc. | 447,050 | 28,991,192 |
| 75,786,692 |
Food & Staples Retailing 2.3% |
Costco Wholesale Corp. | 124,333 | 7,275,967 |
CVS Caremark Corp. | 420,491 | 15,326,897 |
Kroger Co. | 200,263 | 5,633,398 |
Safeway, Inc. | 120,307 | 4,094,048 |
SUPERVALU, Inc. | 55,891 | 2,588,871 |
Sysco Corp. | 168,390 | 5,555,186 |
Wal-Mart Stores, Inc. | 664,954 | 31,990,937 |
Walgreen Co. | 272,278 | 11,854,984 |
Whole Foods Market, Inc. | 40,100 | 1,535,830 |
| 85,856,118 |
Food Products 1.5% |
Archer-Daniels-Midland Co. | 178,353 | 5,901,701 |
Campbell Soup Co. | 54,209 | 2,103,851 |
ConAgra Foods, Inc. | 137,952 | 3,705,391 |
Dean Foods Co. | 35,200 | 1,121,824 |
General Mills, Inc. | 94,150 | 5,500,243 |
H.J. Heinz Co. | 88,654 | 4,208,405 |
Kellogg Co. | 68,034 | 3,523,481 |
Kraft Foods, Inc. "A" | 447,684 | 15,780,861 |
McCormick & Co., Inc. | 36,100 | 1,378,298 |
Sara Lee Corp. | 204,839 | 3,564,198 |
The Hershey Co. | 47,360 | 2,397,363 |
Tyson Foods, Inc. "A" | 69,600 | 1,603,584 |
Wm. Wrigley Jr. Co. | 60,202 | 3,329,773 |
| 54,118,973 |
Household Products 2.0% |
Clorox Co. | 41,132 | 2,554,297 |
Colgate-Palmolive Co. | 139,568 | 9,050,985 |
Kimberly-Clark Corp. | 124,307 | 8,314,895 |
Procter & Gamble Co. | 861,496 | 52,714,940 |
| 72,635,117 |
Personal Products 0.2% |
Avon Products, Inc. | 120,670 | 4,434,623 |
Estee Lauder Companies, Inc. "A" | 31,900 | 1,451,769 |
| 5,886,392 |
Tobacco 1.2% |
Altria Group, Inc. | 579,252 | 40,628,736 |
Reynolds American, Inc. | 46,990 | 3,063,748 |
UST, Inc. | 44,251 | 2,376,721 |
| 46,069,205 |
Energy 10.7% |
Energy Equipment & Services 2.1% |
Baker Hughes, Inc. | 87,073 | 7,325,452 |
BJ Services Co. | 80,028 | 2,275,996 |
ENSCO International, Inc. | 41,600 | 2,538,016 |
Halliburton Co. | 249,478 | 8,606,991 |
Nabors Industries Ltd.* | 80,538 | 2,688,358 |
National-Oilwell Varco, Inc.* | 48,400 | 5,045,216 |
Noble Corp. | 37,124 | 3,620,333 |
Rowan Companies, Inc. | 30,739 | 1,259,684 |
Schlumberger Ltd. | 326,544 | 27,736,647 |
Smith International, Inc. | 54,400 | 3,190,016 |
Transocean, Inc.* | 79,400 | 8,414,812 |
Weatherford International Ltd.* | 92,200 | 5,093,128 |
| 77,794,649 |
Oil, Gas & Consumable Fuels 8.6% |
Anadarko Petroleum Corp. | 124,768 | 6,486,688 |
Apache Corp. | 89,374 | 7,292,025 |
Chesapeake Energy Corp. | 115,900 | 4,010,140 |
Chevron Corp. | 596,856 | 50,279,149 |
ConocoPhillips | 452,309 | 35,506,257 |
CONSOL Energy, Inc. | 50,500 | 2,328,555 |
Devon Energy Corp. | 120,004 | 9,395,113 |
El Paso Corp. | 185,798 | 3,201,300 |
EOG Resources, Inc. | 66,000 | 4,821,960 |
ExxonMobil Corp. | 1,552,768 | 130,246,180 |
Hess Corp. | 75,165 | 4,431,728 |
Marathon Oil Corp. | 188,888 | 11,325,724 |
Murphy Oil Corp. | 46,200 | 2,746,128 |
Occidental Petroleum Corp. | 235,762 | 13,645,905 |
Peabody Energy Corp. | 72,300 | 3,497,874 |
Spectra Energy Corp. | 170,698 | 4,431,320 |
Sunoco, Inc. | 33,172 | 2,643,145 |
Valero Energy Corp. | 149,900 | 11,071,614 |
Williams Companies, Inc. | 163,523 | 5,170,597 |
XTO Energy, Inc. | 99,300 | 5,967,930 |
| 318,499,332 |
Financials 20.7% |
Capital Markets 3.7% |
Ameriprise Financial, Inc. | 68,108 | 4,329,626 |
Bank of New York Co., Inc.* | 207,431 | 8,595,941 |
Bear Stearns Companies, Inc. | 31,808 | 4,453,120 |
Charles Schwab Corp. | 277,597 | 5,696,291 |
E*TRADE Financial Corp.* | 111,300 | 2,458,617 |
Federated Investors, Inc. "B" | 23,300 | 893,089 |
Franklin Resources, Inc. | 42,671 | 5,652,627 |
Janus Capital Group, Inc. | 54,279 | 1,511,127 |
Legg Mason, Inc. | 35,900 | 3,531,842 |
Lehman Brothers Holdings, Inc. | 143,844 | 10,719,255 |
Mellon Financial Corp. | 111,701 | 4,914,844 |
Merrill Lynch & Co., Inc. | 241,404 | 20,176,546 |
Morgan Stanley | 289,664 | 24,297,016 |
Northern Trust Corp. | 54,505 | 3,501,401 |
State Street Corp. | 108,934 | 7,451,086 |
T. Rowe Price Group, Inc. | 74,052 | 3,842,558 |
The Goldman Sachs Group, Inc. | 112,269 | 24,334,306 |
| 136,359,292 |
Commercial Banks 3.8% |
BB&T Corp. | 149,818 | 6,094,596 |
Comerica, Inc. | 45,157 | 2,685,487 |
Commerce Bancorp, Inc. | 51,500 | 1,904,985 |
Compass Bancshares, Inc. | 34,900 | 2,407,402 |
Fifth Third Bancorp. | 154,491 | 6,144,107 |
First Horizon National Corp. | 34,091 | 1,329,549 |
Huntington Bancshares, Inc. | 100,196 | 2,278,457 |
KeyCorp. | 111,783 | 3,837,510 |
M&T Bank Corp. | 21,800 | 2,330,420 |
Marshall & Ilsley Corp. | 61,155 | 2,912,813 |
National City Corp. | 161,023 | 5,365,286 |
PNC Financial Services Group, Inc. | 95,361 | 6,825,940 |
Regions Financial Corp. | 202,919 | 6,716,619 |
SunTrust Banks, Inc. | 96,092 | 8,238,928 |
Synovus Financial Corp. | 88,021 | 2,702,245 |
US Bancorp. | 477,015 | 15,717,644 |
Wachovia Corp. | 524,351 | 26,872,989 |
Wells Fargo & Co. | 923,556 | 32,481,465 |
Zions Bancorp. | 25,256 | 1,942,439 |
| 138,788,881 |
Consumer Finance 0.9% |
American Express Co. | 330,843 | 20,240,975 |
Capital One Financial Corp. | 110,643 | 8,678,837 |
SLM Corp. | 110,865 | 6,383,606 |
| 35,303,418 |
Diversified Financial Services 5.0% |
Bank of America Corp. | 1,217,295 | 59,513,553 |
Chicago Mercantile Exchange Holdings, Inc. "A" | 9,500 | 5,076,420 |
CIT Group, Inc. | 53,800 | 2,949,854 |
Citigroup, Inc. | 1,347,460 | 69,111,223 |
JPMorgan Chase & Co. | 941,413 | 45,611,460 |
Moody's Corp. | 63,800 | 3,968,360 |
| 186,230,870 |
Insurance 4.7% |
ACE Ltd. | 88,528 | 5,534,771 |
Aflac, Inc. | 134,244 | 6,900,142 |
Allstate Corp. | 166,670 | 10,251,872 |
Ambac Financial Group, Inc. | 28,734 | 2,505,317 |
American International Group, Inc. | 710,248 | 49,738,667 |
Aon Corp. | 84,887 | 3,617,035 |
Assurant, Inc. | 27,700 | 1,632,084 |
Chubb Corp. | 110,058 | 5,958,540 |
Cincinnati Financial Corp. | 47,034 | 2,041,276 |
Genworth Financial, Inc. "A" | 114,800 | 3,949,120 |
Hartford Financial Services Group, Inc. | 85,146 | 8,387,732 |
Lincoln National Corp. | 77,674 | 5,510,970 |
Loews Corp. | 116,486 | 5,938,456 |
Marsh & McLennan Companies, Inc. | 149,632 | 4,620,636 |
MBIA, Inc. | 36,546 | 2,273,892 |
MetLife, Inc. | 203,411 | 13,115,941 |
Principal Financial Group, Inc. | 76,619 | 4,466,122 |
Progressive Corp. | 203,188 | 4,862,289 |
Prudential Financial, Inc. | 128,016 | 12,446,996 |
Safeco Corp. | 31,589 | 1,966,731 |
Torchmark Corp. | 26,610 | 1,782,870 |
Travelers Companies, Inc. | 182,075 | 9,741,013 |
Unum Group | 84,294 | 2,200,916 |
XL Capital Ltd. "A" | 49,232 | 4,149,765 |
| 173,593,153 |
Real Estate Investment Trusts 1.2% |
Apartment Investment & Management Co. "A" (REIT) | 27,300 | 1,376,466 |
Archstone-Smith Trust (REIT) | 65,700 | 3,883,527 |
AvalonBay Communities, Inc. (REIT) | 20,300 | 2,413,264 |
Boston Properties, Inc. (REIT) | 29,000 | 2,961,770 |
Developers Diversified Realty Corp. (REIT) | 35,000 | 1,844,850 |
Equity Residential (REIT) | 80,860 | 3,689,642 |
General Growth Properties, Inc. (REIT) | 67,200 | 3,558,240 |
Host Hotels & Resorts, Inc. (REIT) | 143,700 | 3,322,344 |
Kimco Realty Corp. (REIT) | 57,400 | 2,185,218 |
Plum Creek Timber Co., Inc. (REIT) | 51,624 | 2,150,656 |
ProLogis (REIT) | 68,000 | 3,869,200 |
Public Storage (REIT) | 28,930 | 2,222,403 |
Simon Property Group, Inc. (REIT) | 65,234 | 6,069,371 |
Vornado Realty Trust (REIT) | 39,300 | 4,316,712 |
| 43,863,663 |
Real Estate Management & Development 0.1% |
CB Richard Ellis Group, Inc. "A"* | 50,900 | 1,857,850 |
Thrifts & Mortgage Finance 1.3% |
Countrywide Financial Corp. | 158,044 | 5,744,899 |
Fannie Mae | 264,628 | 17,288,147 |
Freddie Mac | 188,031 | 11,413,482 |
Hudson City Bancorp, Inc. | 135,400 | 1,654,588 |
MGIC Investment Corp. | 22,463 | 1,277,246 |
Sovereign Bancorp, Inc. | 98,691 | 2,086,328 |
Washington Mutual, Inc. | 242,659 | 10,346,980 |
| 49,811,670 |
Health Care 11.6% |
Biotechnology 1.2% |
Amgen, Inc.* | 323,324 | 17,876,584 |
Biogen Idec, Inc.* | 78,371 | 4,192,849 |
Celgene Corp.* | 101,100 | 5,796,063 |
Genzyme Corp.* | 71,340 | 4,594,296 |
Gilead Sciences, Inc.* | 260,520 | 10,100,360 |
| 42,560,152 |
Health Care Equipment & Supplies 1.6% |
Bausch & Lomb, Inc. | 14,601 | 1,013,894 |
Baxter International, Inc. | 177,998 | 10,028,407 |
Becton, Dickinson & Co. | 66,892 | 4,983,454 |
Biomet, Inc. | 66,375 | 3,034,665 |
Boston Scientific Corp.* | 320,006 | 4,908,892 |
C.R. Bard, Inc. | 28,194 | 2,329,670 |
Hospira, Inc.* | 42,222 | 1,648,347 |
Medtronic, Inc. | 321,199 | 16,657,380 |
St. Jude Medical, Inc.* | 95,826 | 3,975,821 |
Stryker Corp. | 80,748 | 5,094,391 |
Varian Medical Systems, Inc.* | 35,100 | 1,492,101 |
Zimmer Holdings, Inc.* | 64,808 | 5,501,551 |
| 60,668,573 |
Health Care Providers & Services 2.2% |
Aetna, Inc. | 141,696 | 6,999,782 |
AmerisourceBergen Corp. | 52,648 | 2,604,497 |
Cardinal Health, Inc. | 109,868 | 7,761,076 |
CIGNA Corp. | 78,975 | 4,124,075 |
Coventry Health Care, Inc.* | 43,758 | 2,522,649 |
Express Scripts, Inc.* | 74,300 | 3,715,743 |
Humana, Inc.* | 45,751 | 2,786,693 |
Laboratory Corp. of America Holdings* | 32,600 | 2,551,276 |
Manor Care, Inc. | 20,409 | 1,332,504 |
McKesson Corp. | 80,215 | 4,784,023 |
Medco Health Solutions, Inc.* | 76,888 | 5,996,495 |
Patterson Companies, Inc.* | 38,600 | 1,438,622 |
Quest Diagnostics, Inc. | 43,902 | 2,267,538 |
Tenet Healthcare Corp.* | 132,748 | 864,189 |
UnitedHealth Group, Inc. | 367,624 | 18,800,291 |
WellPoint, Inc.* | 167,216 | 13,348,853 |
| 81,898,306 |
Health Care Technology 0.1% |
IMS Health, Inc. | 54,406 | 1,748,065 |
Life Sciences Tools & Services 0.3% |
Applera Corp. — Applied Biosystems Group | 50,235 | 1,534,177 |
Millipore Corp.* | 14,181 | 1,064,851 |
PerkinElmer, Inc. | 33,763 | 879,864 |
Thermo Fisher Scientific, Inc.* | 110,728 | 5,726,852 |
Waters Corp.* | 27,805 | 1,650,505 |
| 10,856,249 |
Pharmaceuticals 6.2% |
Abbott Laboratories | 429,422 | 22,995,548 |
Allergan, Inc. | 83,078 | 4,788,616 |
Barr Pharmaceuticals, Inc.* | 29,200 | 1,466,716 |
Bristol-Myers Squibb Co. | 533,736 | 16,844,708 |
Eli Lilly & Co. | 267,247 | 14,933,762 |
Forest Laboratories, Inc.* | 85,981 | 3,925,033 |
Johnson & Johnson | 802,601 | 49,456,273 |
King Pharmaceuticals, Inc.* | 65,875 | 1,347,802 |
Merck & Co., Inc. | 596,106 | 29,686,079 |
Mylan Laboratories, Inc. | 58,400 | 1,062,296 |
Pfizer, Inc. | 1,939,593 | 49,595,393 |
Schering-Plough Corp. | 402,352 | 12,247,595 |
Watson Pharmaceuticals, Inc.* | 27,807 | 904,562 |
Wyeth | 365,509 | 20,958,286 |
| 230,212,669 |
Industrials 11.3% |
Aerospace & Defense 2.6% |
Boeing Co. | 218,020 | 20,964,803 |
General Dynamics Corp. | 109,760 | 8,585,427 |
Goodrich Corp. | 34,238 | 2,039,215 |
Honeywell International, Inc. | 216,768 | 12,199,703 |
L-3 Communications Holdings, Inc. | 34,000 | 3,311,260 |
Lockheed Martin Corp. | 97,126 | 9,142,470 |
Northrop Grumman Corp. | 93,750 | 7,300,313 |
Precision Castparts Corp. | 37,400 | 4,538,864 |
Raytheon Co. | 120,723 | 6,505,763 |
Rockwell Collins, Inc. | 46,444 | 3,280,804 |
United Technologies Corp. | 272,440 | 19,324,169 |
| 97,192,791 |
Air Freight & Logistics 0.9% |
C.H. Robinson Worldwide, Inc. | 48,000 | 2,520,960 |
FedEx Corp. | 83,201 | 9,232,815 |
United Parcel Service, Inc. "B" | 292,570 | 21,357,610 |
| 33,111,385 |
Airlines 0.1% |
Southwest Airlines Co. | 214,191 | 3,193,588 |
Building Products 0.1% |
American Standard Companies, Inc. | 47,552 | 2,804,617 |
Masco Corp. | 108,105 | 3,077,749 |
| 5,882,366 |
Commercial Services & Supplies 0.5% |
Allied Waste Industries, Inc.* | 62,046 | 835,139 |
Avery Dennison Corp. | 25,631 | 1,703,949 |
Cintas Corp. | 37,366 | 1,473,341 |
Equifax, Inc. | 34,909 | 1,550,658 |
Monster Worldwide, Inc.* | 33,689 | 1,384,618 |
Pitney Bowes, Inc. | 60,685 | 2,841,272 |
R.R. Donnelley & Sons Co. | 59,521 | 2,589,759 |
Robert Half International, Inc. | 45,975 | 1,678,087 |
Waste Management, Inc. | 148,940 | 5,816,107 |
| 19,872,930 |
Construction & Engineering 0.1% |
Fluor Corp. | 24,204 | 2,695,600 |
Electrical Equipment 0.4% |
Cooper Industries Ltd. "A" | 49,302 | 2,814,651 |
Emerson Electric Co. | 217,740 | 10,190,232 |
Rockwell Automation, Inc. | 46,156 | 3,205,073 |
| 16,209,956 |
Industrial Conglomerates 4.0% |
3M Co. | 197,466 | 17,138,074 |
General Electric Co. | 2,817,365 | 107,848,732 |
Textron, Inc. | 34,427 | 3,790,757 |
Tyco International Ltd. | 539,829 | 18,240,822 |
| 147,018,385 |
Machinery 1.7% |
Caterpillar, Inc. | 178,868 | 14,005,364 |
Cummins, Inc. | 27,346 | 2,767,689 |
Danaher Corp. | 64,322 | 4,856,311 |
Deere & Co. | 62,396 | 7,533,693 |
Dover Corp. | 55,859 | 2,857,188 |
Eaton Corp. | 39,854 | 3,706,422 |
Illinois Tool Works, Inc. | 112,842 | 6,114,908 |
Ingersoll-Rand Co., Ltd. "A" | 84,054 | 4,607,840 |
ITT Corp. | 50,692 | 3,461,250 |
PACCAR, Inc. | 67,377 | 5,864,494 |
Pall Corp. | 35,310 | 1,623,907 |
Parker Hannifin Corp. | 31,568 | 3,090,823 |
Terex Corp.* | 28,100 | 2,284,530 |
| 62,774,419 |
Road & Rail 0.8% |
Burlington Northern Santa Fe Corp. | 97,986 | 8,342,528 |
CSX Corp. | 118,152 | 5,326,292 |
Norfolk Southern Corp. | 107,744 | 5,664,102 |
Ryder System, Inc. | 16,490 | 887,162 |
Union Pacific Corp. | 73,865 | 8,505,555 |
| 28,725,639 |
Trading Companies & Distributors 0.1% |
W.W. Grainger, Inc. | 19,862 | 1,848,159 |
Information Technology 15.3% |
Communications Equipment 2.7% |
Avaya, Inc.* | 114,655 | 1,930,790 |
Ciena Corp.* | 23,098 | 834,531 |
Cisco Systems, Inc.* | 1,677,464 | 46,717,372 |
Corning, Inc.* | 428,590 | 10,950,474 |
JDS Uniphase Corp.* | 59,839 | 803,638 |
Juniper Networks, Inc.* | 153,500 | 3,863,595 |
Motorola, Inc. | 634,896 | 11,237,659 |
QUALCOMM, Inc. | 452,254 | 19,623,301 |
Tellabs, Inc.* | 119,430 | 1,285,067 |
| 97,246,427 |
Computers & Peripherals 3.9% |
Apple, Inc.* | 235,978 | 28,798,755 |
Dell, Inc.* | 616,547 | 17,602,417 |
EMC Corp.* | 575,462 | 10,415,862 |
Hewlett-Packard Co. | 727,336 | 32,453,732 |
International Business Machines Corp. | 375,320 | 39,502,430 |
Lexmark International, Inc. "A"* | 26,557 | 1,309,526 |
NCR Corp.* | 48,398 | 2,542,831 |
Network Appliance, Inc.* | 101,409 | 2,961,143 |
QLogic Corp.* | 46,300 | 770,895 |
SanDisk Corp.* | 61,700 | 3,019,598 |
Sun Microsystems, Inc.* | 955,165 | 5,024,168 |
| 144,401,357 |
Electronic Equipment & Instruments 0.2% |
Agilent Technologies, Inc.* | 108,641 | 4,176,160 |
Jabil Circuit, Inc. | 49,375 | 1,089,706 |
Molex, Inc. | 38,386 | 1,151,964 |
Solectron Corp.* | 260,727 | 959,475 |
Tektronix, Inc. | 22,910 | 772,984 |
| 8,150,289 |
Internet Software & Services 1.4% |
eBay, Inc.* | 310,232 | 9,983,266 |
Google, Inc. "A"* | 59,600 | 31,193,448 |
VeriSign, Inc.* | 67,400 | 2,138,602 |
Yahoo!, Inc.* | 332,222 | 9,013,183 |
| 52,328,499 |
IT Services 1.1% |
Affiliated Computer Services, Inc. "A"* | 27,000 | 1,531,440 |
Automatic Data Processing, Inc. | 149,437 | 7,243,211 |
Cognizant Technology Solutions Corp. "A"* | 38,900 | 2,921,001 |
Computer Sciences Corp.* | 47,232 | 2,793,773 |
Convergys Corp.* | 38,140 | 924,514 |
Electronic Data Systems Corp. | 140,319 | 3,891,046 |
Fidelity National Information Services, Inc. | 43,900 | 2,382,892 |
First Data Corp. | 215,388 | 7,036,726 |
Fiserv, Inc.* | 47,050 | 2,672,440 |
Paychex, Inc. | 92,467 | 3,617,309 |
Unisys Corp.* | 95,484 | 872,724 |
Western Union Co. | 207,988 | 4,332,390 |
| 40,219,466 |
Office Electronics 0.1% |
Xerox Corp.* | 255,056 | 4,713,435 |
Semiconductors & Semiconductor Equipment 2.7% |
Advanced Micro Devices, Inc.* | 142,197 | 2,033,417 |
Altera Corp. | 99,343 | 2,198,461 |
Analog Devices, Inc. | 92,868 | 3,495,552 |
Applied Materials, Inc. | 379,535 | 7,541,360 |
Broadcom Corp. "A"* | 124,670 | 3,646,597 |
Intel Corp. | 1,591,982 | 37,825,492 |
KLA-Tencor Corp. | 53,985 | 2,966,476 |
Linear Technology Corp. | 69,306 | 2,507,491 |
LSI Corp.* | 212,555 | 1,596,288 |
Maxim Integrated Products, Inc. | 87,043 | 2,908,107 |
MEMC Electronic Materials, Inc.* | 61,300 | 3,746,656 |
Micron Technology, Inc.* | 191,549 | 2,400,109 |
National Semiconductor Corp. | 78,366 | 2,215,407 |
Novellus Systems, Inc.* | 33,982 | 964,069 |
NVIDIA Corp.* | 96,898 | 4,002,856 |
Teradyne, Inc.* | 56,058 | 985,500 |
Texas Instruments, Inc. | 399,848 | 15,046,280 |
Xilinx, Inc. | 91,313 | 2,444,449 |
| 98,524,567 |
Software 3.2% |
Adobe Systems, Inc.* | 158,304 | 6,355,906 |
Autodesk, Inc.* | 63,548 | 2,991,840 |
BMC Software, Inc.* | 56,469 | 1,711,011 |
CA, Inc. | 111,415 | 2,877,849 |
Citrix Systems, Inc.* | 48,214 | 1,623,365 |
Compuware Corp.* | 96,921 | 1,149,483 |
Electronic Arts, Inc.* | 83,706 | 3,960,968 |
Intuit, Inc.* | 93,566 | 2,814,465 |
Microsoft Corp. | 2,311,095 | 68,107,970 |
Novell, Inc.* | 93,782 | 730,562 |
Oracle Corp.* | 1,088,929 | 21,462,790 |
Symantec Corp.* | 252,406 | 5,098,601 |
| 118,884,810 |
Materials 3.1% |
Chemicals 1.6% |
Air Products & Chemicals, Inc. | 59,090 | 4,749,063 |
Ashland, Inc. | 15,704 | 1,004,271 |
Dow Chemical Co. | 259,191 | 11,461,426 |
E.I. du Pont de Nemours & Co. | 258,152 | 13,124,448 |
Eastman Chemical Co. | 22,786 | 1,465,823 |
Ecolab, Inc. | 48,442 | 2,068,473 |
Hercules, Inc.* | 31,830 | 625,459 |
International Flavors & Fragrances, Inc. | 21,416 | 1,116,630 |
Monsanto Co. | 147,484 | 9,961,069 |
PPG Industries, Inc. | 44,862 | 3,414,447 |
Praxair, Inc. | 87,628 | 6,308,340 |
Rohm & Haas Co. | 38,489 | 2,104,579 |
Sigma-Aldrich Corp. | 36,268 | 1,547,556 |
| 58,951,584 |
Construction Materials 0.1% |
Vulcan Materials Co. | 26,431 | 3,027,407 |
Containers & Packaging 0.2% |
Ball Corp. | 29,724 | 1,580,425 |
Bemis Co., Inc. | 29,230 | 969,851 |
Pactiv Corp.* | 37,449 | 1,194,249 |
Sealed Air Corp. | 43,772 | 1,357,808 |
Temple-Inland, Inc. | 29,062 | 1,788,185 |
| 6,890,518 |
Metals & Mining 0.9% |
Alcoa, Inc. | 244,551 | 9,911,652 |
Allegheny Technologies, Inc. | 26,079 | 2,735,166 |
Freeport-McMoRan Copper & Gold, Inc. | 103,499 | 8,571,787 |
Newmont Mining Corp. | 122,200 | 4,773,132 |
Nucor Corp. | 81,936 | 4,805,546 |
United States Steel Corp. | 30,792 | 3,348,630 |
| 34,145,913 |
Paper & Forest Products 0.3% |
International Paper Co. | 119,504 | 4,666,631 |
MeadWestvaco Corp. | 50,344 | 1,778,150 |
Weyerhaeuser Co. | 57,229 | 4,517,085 |
| 10,961,866 |
Telecommunication Services 3.7% |
Diversified Telecommunication Services 3.1% |
AT&T, Inc. | 1,697,530 | 70,447,495 |
CenturyTel, Inc. | 31,155 | 1,528,153 |
Citizens Communications Co. | 87,305 | 1,333,147 |
Embarq Corp. | 40,581 | 2,571,618 |
Qwest Communications International, Inc.* | 428,281 | 4,154,326 |
Verizon Communications, Inc. | 792,412 | 32,623,602 |
Windstream Corp. | 131,674 | 1,943,508 |
| 114,601,849 |
Wireless Telecommunication Services 0.6% |
ALLTEL Corp. | 94,736 | 6,399,417 |
Sprint Nextel Corp. | 792,428 | 16,411,184 |
| 22,810,601 |
Utilities 3.5% |
Electric Utilities 1.8% |
Allegheny Energy, Inc.* | 45,618 | 2,360,275 |
American Electric Power Co., Inc. | 108,915 | 4,905,532 |
Duke Energy Corp. | 341,496 | 6,249,377 |
Edison International | 88,390 | 4,960,447 |
Entergy Corp. | 55,009 | 5,905,216 |
Exelon Corp. | 182,938 | 13,281,299 |
FirstEnergy Corp. | 87,495 | 5,663,551 |
FPL Group, Inc. | 109,694 | 6,224,038 |
Pinnacle West Capital Corp. | 27,696 | 1,103,686 |
PPL Corp. | 104,648 | 4,896,480 |
Progress Energy, Inc. | 70,550 | 3,216,374 |
Southern Co. | 201,588 | 6,912,452 |
| 65,678,727 |
Gas Utilities 0.1% |
Nicor, Inc. | 12,537 | 538,088 |
Questar Corp. | 46,500 | 2,457,525 |
| 2,995,613 |
Independent Power Producers & Energy Traders 0.5% |
AES Corp.* | 182,850 | 4,000,758 |
Constellation Energy Group | 49,387 | 4,305,064 |
Dynegy, Inc. "A"* | 92,261 | 870,944 |
TXU Corp. | 130,450 | 8,779,285 |
| 17,956,051 |
Multi-Utilities 1.1% |
Ameren Corp. | 57,219 | 2,804,303 |
CenterPoint Energy, Inc. | 84,868 | 1,476,703 |
CMS Energy Corp. | 62,449 | 1,074,123 |
Consolidated Edison, Inc. | 67,816 | 3,059,858 |
Dominion Resources, Inc. | 102,218 | 8,822,436 |
DTE Energy Co. | 48,303 | 2,329,171 |
Integrys Energy Group, Inc. | 20,400 | 1,034,892 |
KeySpan Corp. | 48,375 | 2,030,782 |
NiSource, Inc. | 75,366 | 1,560,830 |
PG&E Corp. | 94,647 | 4,287,509 |
Public Service Enterprise Group, Inc. | 68,973 | 6,054,450 |
Sempra Energy | 71,090 | 4,210,661 |
TECO Energy, Inc. | 56,788 | 975,618 |
Xcel Energy, Inc. | 110,337 | 2,258,598 |
| 41,979,934 |
Total Common Stocks (Cost $2,455,816,375) | 3,666,843,398 |
| Principal Amount ($) | Value ($) |
| |
Government & Agency Obligations 0.1% |
US Treasury Bill, 4.95**, 8/9/2007 (a) (Cost $2,481,651) | 2,495,000 | 2,481,651 |
|
Shares
| Value ($) |
| |
Cash Equivalents 0.0% |
Cash Management QP Trust, 5.34% (b) (Cost $176,647) | 176,647 | 176,647 |
| % of Net Assets | Value ($) |
| |
Total Investment Portfolio (Cost $2,458,474,673)+ | 99.3 | 3,669,501,696 |
Other Assets and Liabilities, Net | 0.7 | 25,814,798 |
Net Assets | 100.0 | 3,695,316,494 |
* Non-income producing security** Annualized yield at time of purchase; not a coupon rate.+ The cost for federal income tax purposes was $2,652,953,606. At June 30, 2007, net unrealized appreciation for all securities based on tax cost was $1,016,548,090. This consisted of aggregate gross unrealized appreciation for all securities in which there was an excess of value over tax cost of $1,339,307,136 and aggregate gross unrealized depreciation for all securities in which there was an excess of tax cost over value of $322,759,046.(a) At June 30, 2007, this security has been pledged, in whole or in part, to cover initial margin requirements for open futures contracts.(b) Affiliated fund managed by Deutsche Investment Management Americas Inc. The rate shown is the annualized seven-day yield at period end.REIT: Real Estate Investment Trust
At June 30, 2007, open futures contracts purchased were as follows:
Futures | Expiration Date | Contracts | Aggregate Face Value ($) | Value ($) | Unrealized Depreciation ($) |
S&P 500 Index
| 9/20/2007 | 77 | 29,247,472 | 29,171,450 | (76,022) |
The accompanying notes are an integral part of the financial statements.
Financial Statements
Statement of Assets and Liabilities as of June 30, 2007 (Unaudited) |
Assets |
Investments:
Investments in securities, at value (cost $2,458,298,026) | $ 3,669,325,049 |
Investment in Cash Management QP Trust (cost $176,647) | 176,647 |
Total investments in securities, at value (cost $2,458,474,673)
| 3,669,501,696 |
Receivable for investments sold
| 27,388,873 |
Dividends receivable
| 3,982,467 |
Interest receivable
| 51,420 |
Other assets
| 118,442 |
Total assets
| 3,701,042,898 |
Liabilities |
Payable for investments purchased
| 5,458,172 |
Payable for daily variation margin on open futures contracts
| 37,033 |
Accrued investment management fee
| 33,866 |
Other accrued expenses and payables
| 197,333 |
Total liabilities
| 5,726,404 |
Net assets | $ 3,695,316,494 |
The accompanying notes are an integral part of the financial statements.
Statement of Operations for the six months ended June 30, 2007 (Unaudited) |
Investment Income |
Income:
Dividends
| $ 34,008,546 |
Interest — Cash Management QP Trust
| 810,121 |
Interest
| 67,909 |
Total Income
| 34,886,576 |
Expenses:
Investment management fee
| 902,098 |
Administration fee
| 541,260 |
Auditing
| 30,093 |
Legal
| 6,234 |
Services to shareholders
| 1,108 |
Custodian fees
| 59,385 |
Trustees' fees and expenses
| 59,972 |
Other
| 69,866 |
Total expenses before expense reductions
| 1,670,016 |
Expense reductions
| (755,323) |
Total expenses after expense reductions
| 914,693 |
Net investment income (loss) | 33,971,883 |
Realized and Unrealized Gain (Loss) on Investment Transactions |
Net realized gain (loss) from:
Investments
| 13,282,831 |
Futures
| 2,408,407 |
| 15,691,238 |
Net unrealized appreciation (depreciation) during the period on:
Investments
| 197,039,445 |
Futures
| (58,333) |
| 196,981,112 |
Net gain (loss) on investment transactions | 212,672,350 |
Net increase (decrease) in net assets resulting from operations | $ 246,644,233 |
The accompanying notes are an integral part of the financial statements.
Statement of Changes in Net Assets |
Increase (Decrease) in Net Assets | Six Months Ended June 30, 2007 (Unaudited) | Year Ended December 31, 2006 |
Operations:
Net investment income (loss)
| $ 33,971,883 | $ 64,166,503 |
Net realized gain (loss) on investment transactions
| 15,691,238 | (26,983,018) |
Net unrealized appreciation (depreciation) during the period on investment transactions
| 196,981,112 | 462,303,829 |
Net increase (decrease) in net assets resulting from operations
| 246,644,233 | 499,487,314 |
Capital transactions in shares of beneficial interest:
Proceeds from capital invested
| 358,706,228 | 524,365,956 |
Value of capital withdrawn
| (459,158,421) | (781,887,352) |
Net increase (decrease) in net assets from capital transactions in shares of beneficial interest
| (100,452,193) | (257,521,396) |
Increase (decrease) in net assets | 146,192,040 | 241,965,918 |
Net assets at beginning of period
| 3,549,124,454 | 3,307,158,536 |
Net assets at end of period
| $ 3,695,316,494 | $ 3,549,124,454 |
The accompanying notes are an integral part of the financial statements.
Financial Highlights
Years Ended December 31, | 2007a | 2006 | 2005 | 2004 | 2003 | 2002 |
Ratios to Average Net Assets and Supplemental Data |
Net assets, end of period ($ millions)
| 3,695 | 3,549 | 3,307 | 3,272 | 3,260 | 2,348 |
Ratio of expenses before expense reductions (%)
| .09* | .08 | .06 | .06 | .05 | .05 |
Ratio of expenses after expense reductions (%)
| .05* | .05 | .05 | .05 | .05 | .05 |
Ratio of net investment income (loss) (%)
| 1.88* | 1.90 | 1.82 | 1.97 | 1.74 | 1.56 |
Portfolio turnover rate (%)
| 3** | 4 | 9 | 7 | 8b | 19 |
Total investment return (%)c,d
| 6.99** | 15.72 | 4.90 | 10.79 | 28.50 | (22.02) |
a For the six months ended June 30, 2007 (Unaudited).
b Excludes portfolio securities delivered as a result of processing redemption in-kind transactions.
c Total investment return would have been lower had certain expenses not been reduced.
d Total investment return for the Portfolio was derived from the performance of the Institutional Class of DWS Equity 500 Index Fund.
* Annualized
** Not annualized
|
Notes to Financial Statements (Unaudited)
A. Significant Accounting Policies
DWS Equity 500 Index Portfolio (the "Portfolio") is registered under the Investment Company Act of 1940, as amended (the "1940 Act"), as a diversified open-end management investment company organized as a New York business trust.
The Portfolio's financial statements are prepared in accordance with accounting principles generally accepted in the United States of America which require the use of management estimates. Actual results could differ from those estimates. The policies described below are followed consistently by the Portfolio in the preparation of its financial statements.
Security Valuation. Investments are stated at value determined as of the close of regular trading on the New York Stock Exchange on each day the exchange is open for trading. Equity securities are valued at the most recent sale price or official closing price reported on the exchange (US or foreign) or over-the-counter market on which the security is traded most extensively. Securities for which no sales are reported are valued at the calculated mean between the most recent bid and asked quotations on the relevant market or, if a mean cannot be determined, at the most recent bid quotation.
Money market instruments purchased with an original or remaining maturity of sixty days or less, maturing at par, are valued at amortized cost. Investments in open-end investment companies and Cash Management QP Trust are valued at their net asset value each business day.
Securities and other assets for which market quotations are not readily available or for which the above valuation procedures are deemed not to reflect fair value are valued in a manner that is intended to reflect their fair value as determined in accordance with procedures approved by the Trustees.
In September 2006, the Financial Accounting Standards Board ("FASB") released Statement of Financial Accounting Standards No. 157, "Fair Value Measurements" ("FAS 157"). FAS 157 defines fair value, establishes a framework for measuring fair value and expands disclosures about fair value measurements. FAS 157 is effective for fiscal years beginning after November 15, 2007. As of June 30, 2007, management does not believe the adoption of FAS 157 will impact the amounts reported in the financial statements, however, additional disclosures will be required about the inputs used to develop the measurements of fair value and the effect of certain of the measurements reported in the statement of operations for a fiscal period.
Foreign Currency Transactions. The books and records of the Fund are maintained in US dollars. Investment securities and other assets and liabilities denominated in a foreign currency are translated into US dollars at the prevailing exchange rates at period end. Purchases and sales of investment securities, income and expenses are translated into US dollars at the prevailing exchange rates on the respective dates of the transactions.
Net realized and unrealized gains and losses on foreign currency transactions represent net gains and losses between trade and settlement dates on securities transactions, the disposition of forward foreign currency exchange contracts and foreign currencies, and the difference between the amount of net investment income accrued and the US dollar amount actually received. That portion of both realized and unrealized gains and losses on investments that results from fluctuations in foreign currency exchange rates is not separately disclosed but is included with net realized and unrealized gain/appreciation and loss/depreciation on investments.
Futures Contracts. A futures contract is an agreement between a buyer or seller and an established futures exchange or its clearinghouse in which the buyer or seller agrees to take or make a delivery of a specific amount of a financial instrument at a specified price on a specific date (settlement date). The Portfolio enters into future contracts to keep cash on hand to meet shareholder redemptions or other needs while maintaining exposure to the stock market.
Upon entering into a futures contract, the Portfolio is required to deposit with a financial intermediary an amount ("initial margin") equal to a certain percentage of the face value indicated in the futures contract. Subsequent payments ("variation margin") are made or received by the Portfolio dependent upon the daily fluctuations in the value of the underlying security and are recorded for financial reporting purposes as unrealized gains or losses by the Portfolio. When entering into a closing transaction, the Portfolio will realize a gain or loss equal to the difference between the value of the futures contract to sell and the futures contract to buy. Futures contracts are valued at the most recent settlement price.
Certain risks may arise upon entering into futures contracts, including the risk that an illiquid secondary market will limit the Portfolio's ability to close out a futures contract prior to the settlement date and that a change in the value of a futures contract may not correlate exactly with the changes in the value of the securities hedged.
Federal Income Taxes. The Portfolio is considered a partnership under the Internal Revenue Code, as amended. Therefore, no federal income tax provision is necessary.
Contingencies. In the normal course of business, the Portfolio may enter into contracts with service providers that contain general indemnification clauses. The Portfolio's maximum exposure under these arrangements is unknown as this would involve future claims that may be made against the Portfolio that have not yet been made. However, based on experience, the Portfolio expects the risk of loss to be remote.
Other. Investment transactions are accounted for on a trade date plus one basis for daily net asset value calculations. However, for financial reporting purposes, investment security transactions are reported on trade date. Interest income is recorded on the accrual basis. Dividend income is recorded on the ex-dividend date. Realized gains and losses from investment transactions are recorded on an identified cost basis.
The Portfolio makes a daily allocation of its net investment income and realized and unrealized gains and losses from securities, futures and foreign currency transactions to its investors in proportion to their investment in the Portfolio.
B. Purchases and Sales of Securities
During the six months ended June 30, 2007, purchases and sales of investment securities (excluding short-term investments) aggregated $104,094,726 and $159,637,299, respectively. Purchases and sales of US Treasury obligations aggregated $2,736,764 and $1,495,000, respectively.
C. Related Parties
Deutsche Investment Management Americas Inc. ("DIMA" or the "Advisor"), an indirect, wholly owned subsidiary of Deutsche Bank AG, is the Advisor for the Portfolio. Prior to January 1, 2007, Deutsche Asset Management Inc. ("DAMI"), an indirect wholly owned subsidiary of Deutsche Bank AG, was the Advisor for the Portfolio.
Management Agreement. Under the Investment Management Agreement, the Advisor directs the investments of the Portfolio in accordance with its investment objectives, policies and restrictions. The investment management fee payable under the Investment Management Agreement is equal to an annual rate of 0.05% of the Portfolio's average daily net assets, computed and accrued daily and payable monthly. Northern Trust Investments, N.A. ("NTI") serves as subadvisor to the Portfolio and is paid by the Advisor for its services. NTI is responsible for the day to day management of the Portfolio.
For the period January 1, 2007 through June 30, 2007, DIMA has voluntarily agreed to waive all or a portion of its investment management fee and reimburse or pay certain operating expenses of the Portfolio to the extent necessary to maintain the annual operating expenses of the Portfolio at 0.05% of average daily net assets (excluding certain expenses such as extraordinary expenses, taxes, brokerage, interest, proxy and organizational and offering expenses).
Accordingly, for the six months ended June 30, 2007, the Advisor waived a portion of its investment management fee pursuant to the Investment Management Agreement of $754,778 and charged $147,320, which was equivalent to an annual effective rate of 0.01% of the Portfolio's average daily net assets.
Administration Fee. Pursuant to the Administrative Services Agreement with DIMA, the Advisor provides most administrative services to the Portfolio. For all services provided under the Administrative Services Agreement, the Portfolio pays DIMA a fee ("Administration Fee") of 0.03% of the Portfolio's average daily net assets, computed and accrued daily and payable monthly. Accordingly, for the six months ended June 30, 2007, DIMA received an Administration Fee of $541,260, of which $92,233 is unpaid.
Trustees' Fees and Expenses. As compensation for his or her services, each Independent Trustee receives an aggregated annual fee, plus a fee for each meeting attended from each fund in the Fund Complex for which he or she serves. In addition, the Chairperson of the Board and the Chairperson of each committee of the Board receive additional compensation for their services. Payment of such fees and expenses is allocated among all such funds described above in direct proportion to their relative net assets.
Cash Management QP Trust. Pursuant to an Exemptive Order issued by the SEC, the Portfolio may invest in the Cash Management QP Trust (the "QP Trust") and other affiliated funds managed by the Advisor. The QP Trust seeks to provide as high a level of current income as is consistent with the preservation of capital and the maintenance of liquidity. The QP Trust does not pay its Advisor a management fee for the affiliated funds' investments in the QP Trust.
D. Line of Credit
The Portfolio and other affiliated funds (the ``Participants'') share in a $750 million revolving credit facility administered by JPMorgan Chase Bank N.A. for temporary or emergency purposes, including the meeting of withdrawal requests that otherwise might require the untimely disposition of securities. The Participants are charged an annual commitment fee which is allocated, based upon net assets, among each of the Participants. Interest is calculated at the Federal Funds Rate plus 0.35 percent. The Portfolio may borrow up to a maximum of 33 percent of its net assets under the agreement.
E. Fee Reductions
The Portfolio has entered into an arrangement with its custodian whereby credits realized as a result of uninvested cash balances are used to reduce a portion of the Portfolio's custodian expenses. During the six months ended June 30, 2007, the Portfolio's custodian fees were reduced by $545 for custody credits earned.
F. Regulatory Matters and Litigation
Regulatory Settlements. On December 21, 2006, Deutsche Asset Management ("DeAM") settled proceedings with the Securities and Exchange Commission ("SEC") and the New York Attorney General on behalf of Deutsche Asset Management, Inc. ("DAMI") and Deutsche Investment Management Americas Inc. ("DIMA"), the investment advisors to many of the DWS Scudder funds, regarding allegations of improper trading at DeAM and at the legacy Scudder and Kemper organizations prior to their acquisition by DeAM in April 2002. These regulators alleged that although the prospectuses for certain funds in the regulators' view indicated that the funds did not permit market timing, DAMI and DIMA breached their fiduciary duty to those funds in that their efforts to limit trading activity in the funds were not effective at certain times. The regulators also alleged that DAMI and DIMA breached their fiduciary duty to certain funds by entering into certain market timing arrangements with investors. These trading arrangements originated in businesses that existed prior to the currently constituted DeAM organization, which came together as a result of various mergers of the legacy Scudder, Kemper and Deutsche fund groups, and all of the arrangements were terminated prior to the start of the regulatory investigations that began in the summer of 2003. No current DeAM employee approved these trading arrangements. Under the terms of the settlements, DAMI and DIMA neither admit nor deny any wrongdoing.
The terms of the SEC settlement, which identified improper trading in the legacy Deutsche and Kemper mutual funds only, provide for payment of disgorgement in the amount of $17.2 million. The terms of the settlement with the New York Attorney General provide for payment of disgorgement in the amount of $102.3 million, which is inclusive of the amount payable under the SEC settlement, plus a civil penalty in the amount of $20 million. The total amount payable by DeAM, approximately $122.3 million, would be distributed to funds in accordance with a distribution plan to be developed by a distribution consultant. The funds' investment advisors do not believe these amounts will have a material adverse financial impact on them or materially affect their ability to perform under their investment management agreements with the DWS funds. The above-described amounts are not material to Deutsche Bank, and have already been reserved.
Among the terms of the settled orders, DeAM is subject to certain undertakings regarding the conduct of its business in the future, including: formation of a Code of Ethics Oversight Committee to oversee all matters relating to issues arising under the advisors' Code of Ethics; establishment of an Internal Compliance Controls Committee having overall compliance oversight responsibility of the advisors; engagement of an Independent Compliance Consultant to conduct a comprehensive review of the advisors' supervisory compliance and other policies and procedures designed to prevent and detect breaches of fiduciary duty, breaches of the Code of Ethics and federal securities law violations by the advisors and their employees; and commencing in 2008, the advisors shall undergo a compliance review by an independent third party.
In addition, DeAM is subject to certain further undertakings relating to the governance of the mutual funds, including that: at least 75% of the members of the Boards of Trustees/Directors overseeing the DWS Funds continue to be independent of DeAM; the Chairmen of the DWS Funds' Boards of Trustees/Directors continue to be independent of DeAM; DeAM maintain existing management fee reductions for certain funds for a period of five years and not increase management fees for these certain funds during this period; the funds retain a senior officer (or independent consultants, as applicable) responsible for assisting in the review of fee arrangements and monitoring compliance by the funds and the investment advisors with securities laws, fiduciary duties, codes of ethics and other compliance policies, the expense of which shall be borne by DeAM; and periodic account statements, fund prospectuses and the mutual funds' web site contain additional disclosure and/or tools that assist investors in understanding the fees and costs associated with an investment in the funds and the impact of fees and expenses on fund returns.
DeAM has also settled proceedings with the Illinois Secretary of State regarding market timing matters. The terms of the Illinois settlement provide for investor education contributions totaling approximately $4 million and a payment in the amount of $2 million to the Securities Audit and Enforcement Fund.
On September 28, 2006, the SEC and the National Association of Securities Dealers ("NASD") announced final agreements in which Deutsche Investment Management Americas Inc. ("DIMA"), Deutsche Asset Management, Inc. ("DAMI") and Scudder Distributors, Inc. ("SDI") (now known as DWS Scudder Distributors, Inc.) settled administrative proceedings regarding disclosure of brokerage allocation practices in connection with sales of the Scudder Funds' (now known as the DWS Scudder Funds) shares during 2001-2003. The agreements with the SEC and NASD are reflected in orders which state, among other things, that DIMA and DAMI failed to disclose potential conflicts of interest to the fund Boards and to shareholders relating to SDI's use of certain funds' brokerage commissions to reduce revenue sharing costs to broker-dealer firms with whom it had arrangements to market and distribute Scudder Fund shares. These directed brokerage practices were discontinued in October 2003.
Under the terms of the settlements, in which DIMA, DAMI and SDI neither admitted nor denied any of the regulators' findings, DIMA, DAMI and SDI agreed to pay disgorgement, prejudgment interest and civil penalties in the total amount of $19.3 million. The portion of the settlements distributed to the funds was approximately $17.8 million and was paid to the funds as prescribed by the settlement orders based upon the amount of brokerage commissions from each fund used to satisfy revenue sharing agreements with broker-dealers who sold fund shares. Based on the prescribed settlement order, the Portfolio was not entitled to a portion of the settlement.
As part of the settlements, DIMA, DAMI and SDI also agreed to implement certain measures and undertakings relating to revenue sharing payments including making additional disclosures in the fund Prospectuses or Statements of Additional Information, adopting or modifying relevant policies and procedures and providing regular reporting to the fund Boards.
Private Litigation Matters. The matters alleged in the regulatory settlements described above also serve as the general basis of a number of private class action lawsuits involving the DWS funds. These lawsuits name as defendants various persons, including certain DWS funds, the funds' investment advisors and their affiliates, and certain individuals, including in some cases fund Trustees/Directors, officers, and other parties. Each DWS fund's investment advisor has agreed to indemnify the applicable DWS funds in connection with these lawsuits, or other lawsuits or regulatory actions that may be filed making similar allegations.
Based on currently available information, the funds' investment advisors believe the likelihood that the pending lawsuits will have a material adverse financial impact on a DWS fund is remote and such actions are not likely to materially affect their ability to perform under their investment management agreements with the DWS funds.
Account Management Resources
For shareholders of Institutional Classes |
Automated Information Line | (800) 621-1048 Personalized account information, information on other DWS funds and services via touchtone telephone and for Classes A, B, and C only, the ability to exchange or redeem shares.
|
Web Site | www.dws-scudder.com View your account transactions and balances, trade shares, monitor your asset allocation, and change your address, 24 hours a day.
Obtain prospectuses and applications, blank forms, interactive worksheets, news about DWS funds, subscription to fund updates by e-mail, retirement planning information, and more.
|
For More Information | (800) 621-1048 To speak with a DWS Scudder service representative.
|
Written Correspondence | DWS Scudder PO Box 219151
Kansas City, MO 64121-9151
|
Proxy Voting | A description of the fund's policies and procedures for voting proxies for portfolio securities and information about how the fund voted proxies related to its portfolio securities during the 12-month period ended June 30 is available on our Web site — www.dws-scudder.com (click on "proxy voting"at the bottom of the page) — or on the SEC's Web site — www.sec.gov. To obtain a written copy of the fund's policies and procedures without charge, upon request, call us toll free at (800) 621-1048.
|
Principal Underwriter | If you have questions, comments or complaints, contact:
DWS Scudder Distributors, Inc. 222 South Riverside Plaza
Chicago, IL 60606-5808
(800) 621-1148
|
| Institutional Class |
Nasdaq Symbol | BTIIX
|
CUSIP Number | 23339C 206
|
Fund Number | 565
|
For shareholders of Class S |
Automated Information Line | (800) 728-3337 Personalized account information, the ability to exchange or redeem shares, and information on other DWS funds and services via touchtone telephone.
|
Web Site | www.dws-scudder.com |
| View your account transactions and balances, trade shares, monitor your asset allocation, and change your address, 24 hours a day.
Obtain prospectuses and applications, blank forms, interactive worksheets, news about DWS funds, subscription to fund updates by e-mail, retirement planning information, and more.
|
For More Information | (800) 728-3337 To speak with a DWS Scudder service representative.
|
Written Correspondence | DWS Scudder PO Box 219151
Kansas City, MO 64121-9151
|
Proxy Voting | A description of the fund's policies and procedures for voting proxies for portfolio securities and information about how the fund voted proxies related to its portfolio securities during the 12-month period ended June 30 is available on our Web site — www.dws-scudder.com (click on "proxy voting"at the bottom of the page) — or on the SEC's Web site — www.sec.gov. To obtain a written copy of the fund's policies and procedures without charge, upon request, call us toll free at (800) 621-1048.
|
Principal Underwriter | If you have questions, comments or complaints, contact:
DWS Scudder Distributors, Inc. 222 South Riverside Plaza
Chicago, IL 60606-5808
(800) 621-1148
|
| Class S |
Nasdaq Symbol | BTIEX
|
Fund Number | 815
|
Privacy Statement
This privacy statement is issued by DWS Scudder Distributors, Inc., Deutsche Investment Management Americas Inc., DeAM Investor Services, Inc., DWS Trust Company and the DWS Funds.
We never sell customer lists or individual client information. We consider privacy fundamental to our client relationships and adhere to the policies and practices described below to protect current and former clients' information. Internal policies are in place to protect confidentiality, while allowing client needs to be served. Only individuals who need to do so in carrying out their job responsibilities may access client information. We maintain physical, electronic and procedural safeguards that comply with federal and state standards to protect confidentiality. These safeguards extend to all forms of interaction with us, including the Internet.
In the normal course of business, clients give us nonpublic personal information on applications and other forms, on our websites, and through transactions with us or our affiliates. Examples of the nonpublic personal information collected are name, address, Social Security number and transaction and balance information. To be able to serve our clients, certain of this client information is shared with affiliated and nonaffiliated third party service providers such as transfer agents, custodians, and broker-dealers to assist us in processing transactions and servicing your account with us. In addition, we may disclose all of the information we collect to companies that perform marketing services on our behalf or to other financial institutions with which we have joint marketing agreements. The organizations described above that receive client information may only use it for the purpose designated by the DWS Scudder Companies listed above.
We may also disclose nonpublic personal information about you to other parties as required or permitted by law. For example, we are required or we may provide information to government entities or regulatory bodies in response to requests for information or subpoenas, to private litigants in certain circumstances, to law enforcement authorities, or any time we believe it necessary to protect the firm.
Questions on this policy may be sent to:
DWS Scudder
Attention: Correspondence — Chicago
P.O. Box 219415
Kansas City, MO 64121-9415
September 2006
 Notes
Notes

ITEM 2. | CODE OF ETHICS |
| |
| Not applicable. |
| |
ITEM 3. | AUDIT COMMITTEE FINANCIAL EXPERT |
| |
| Not applicable. |
| |
ITEM 4. | PRINCIPAL ACCOUNTANT FEES AND SERVICES |
| |
| Not applicable. |
ITEM 5. | AUDIT COMMITTEE OF LISTED REGISTRANTS |
| |
| Not Applicable |
| |
ITEM 6. | SCHEDULE OF INVESTMENTS |
| |
| Not Applicable |
| |
ITEM 7. | DISCLOSURE OF PROXY VOTING POLICIES AND PROCEDURES FOR CLOSED-END MANAGEMENT INVESTMENT COMPANIES |
| |
| Not applicable. |
| |
ITEM 8. | PORTFOLIO MANAGERS OF CLOSED-END MANAGEMENT INVESTMENT COMPANIES |
| |
| Not applicable. |
ITEM 9. | PURCHASES OF EQUITY SECURITIES BY CLOSED-END MANAGEMENT INVESTMENT COMPANY AND AFFILIATED PURCHASERS |
| |
| Not Applicable. |
ITEM 10. | SUBMISSION OF MATTERS TO A VOTE OF SECURITY HOLDERS |
| |
| The Committee on Independent Trustees/Directors selects and nominates Independent Trustees/Directors. Fund shareholders may submit nominees that will be considered by the committee when a Board vacancy occurs. Submissions should be mailed to: c/o Dawn-Marie Driscoll, PO Box 100176, Cape Coral, FL 33910. |
| |
ITEM 11. | CONTROLS AND PROCEDURES |
| |
| (a) The Chief Executive and Financial Officers concluded that the Registrant's Disclosure Controls and Procedures are effective based on the evaluation of the Disclosure Controls and Procedures as of a date within 90 days of the filing date of this report. |
| |
| (b) There have been no changes in the registrant's internal control over financial reporting that occurred during the registrant's last half-year (the registrant's second fiscal half-year in the case of the annual report) that has materially affected, or is reasonably likely to materially affect, the registrant's internal controls over financial reporting. |
| |
ITEM 12. | EXHIBITS |
| |
| (a)(1) Certification pursuant to Rule 30a-2(a) under the Investment Company Act of 1940 (17 CFR 270.30a-2(a)) is filed and attached hereto as Exhibit 99.CERT. |
| |
| (b) Certification pursuant to Rule 30a-2(b) under the Investment Company Act of 1940 (17 CFR 270.30a-2(b)) is furnished and attached hereto as Exhibit 99.906CERT. |
Form N-CSRS Item F
SIGNATURES
Pursuant to the requirements of the Securities Exchange Act of 1934 and the Investment Company Act of 1940, the registrant has duly caused this report to be signed on its behalf by the undersigned, thereunto duly authorized.
Registrant: | DWS Equity 500 Index Portfolio |
President
Pursuant to the requirements of the Securities Exchange Act of 1934 and the Investment Company Act of 1940, this report has been signed below by the following persons on behalf of the registrant and in the capacities and on the dates indicated.
Registrant: | DWS Equity 500 Index Portfolio |
President
Chief Financial Officer and Treasurer
