JUNE 30, 2012 Semiannual Report to Shareholders |
| |
| DWS S&P 500 Index Fund |
|
Contents
DWS S&P 500 Index Fund 9 Statement of Assets and Liabilities 10 Statement of Operations 11 Statement of Changes in Net Assets 16 Notes to Financial Statements 23 Information About Your Fund's Expenses DWS Equity 500 Index Portfolio 42 Statement of Assets and Liabilities 43 Statement of Operations 44 Statement of Changes in Net Assets 46 Notes to Financial Statements 52 Summary of Management Fee Evaluation by Independent Fee Consultant 56 Account Management Resources |
This report must be preceded or accompanied by a prospectus. To obtain a summary prospectus, if available, or prospectus for any of our funds, refer to the Account Management Resources information provided in the back of this booklet. We advise you to consider the fund's objectives, risks, charges and expenses carefully before investing. The summary prospectus and prospectus contain this and other important information about the fund. Please read the prospectus carefully before you invest.
Investing in derivatives entails special risks relating to liquidity, leverage and credit that may reduce returns and/or increase volatility. Various factors, including costs, cash flows and security selection, may cause the fund's performance to differ from that of the index. The fund may lend securities to approved institutions. Stocks may decline in value. See the prospectus for details.
This fund is not sponsored, endorsed, sold, nor promoted by Standard & Poor's®, and Standard & Poor's makes no representation regarding the advisability of investing in the portfolio.
DWS Investments is part of Deutsche Bank's Asset Management division and, within the U.S., represents the retail asset management activities of Deutsche Bank AG, Deutsche Bank Trust Company Americas, Deutsche Investment Management Americas Inc. and DWS Trust Company.
NOT FDIC/NCUA INSURED NO BANK GUARANTEE MAY LOSE VALUE NOT A DEPOSIT NOT INSURED BY ANY FEDERAL GOVERNMENT AGENCY
Performance Summary June 30, 2012 Average Annual Total Returns as of 6/30/12 |
| Unadjusted for Sales Charge | 6-Month‡ | 1-Year | 3-Year | 5-Year | 10-Year |
| Class A | 9.16% | 4.84% | 15.73% | -0.36% | 4.70% |
| Class B | 8.78% | 4.13% | 14.91% | -1.10% | 3.92% |
| Class C | 8.78% | 4.04% | 14.88% | -1.10% | 3.93% |
S&P 500® Index+ | 9.49% | 5.45% | 16.40% | 0.22% | 5.33% |
| Adjusted for the Maximum Sales Charge | | | | | |
Class A (max 4.50% load) | 4.25% | 0.12% | 13.97% | -1.28% | 4.22% |
Class B (max 4.00% CDSC) | 4.78% | 1.13% | 14.40% | -1.30% | 3.92% |
Class C (max 1.00% CDSC) | 7.78% | 4.04% | 14.88% | -1.10% | 3.93% |
S&P 500® Index+ | 9.49% | 5.45% | 16.40% | 0.22% | 5.33% |
| No Sales Charges | | | | | |
| Class S | 9.36% | 5.13% | 16.07% | -0.09% | 4.97% |
S&P 500® Index+ | 9.49% | 5.45% | 16.40% | 0.22% | 5.33% |
‡ Total returns shown for periods less than one year are not annualized.
Performance in the Average Annual Total Returns table above and the Growth of an Assumed $10,000 Investment line graph that follows is historical and does not guarantee future results. Investment return and principal fluctuate, so your shares may be worth more or less when redeemed. Current performance may differ from performance data shown. Please visit www.dws-investments.com for the Fund's most recent month-end performance. Fund performance includes reinvestment of all distributions. Unadjusted returns do not reflect sales charges and would have been lower if they had.
The gross expense ratios of the Fund, as stated in the fee table of the prospectus dated May 1, 2012 are 0.71%, 1.40%, 1.40% and 0.39% for Class A, Class B, Class C and Class S shares, respectively, and may differ from the expense ratios disclosed in the Financial Highlights tables in this report.
Index returns do not reflect any fees or expenses and it is not possible to invest directly into an index.
Performance figures do not reflect the deduction of taxes that a shareholder would pay on fund distributions or the redemption of fund shares.
Returns shown for Class A, B and C shares prior to their inception on February 18, 2005 are derived from the historical performance of Class S shares of DWS S&P 500 Index Fund and have been adjusted to reflect the higher total annual operating expenses of each specific class. Any difference in expenses will affect performance.
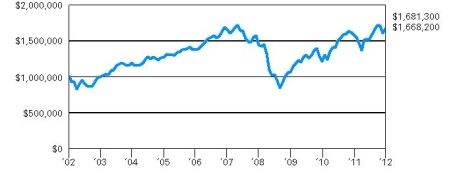
Growth of an Assumed $10,000 Investment (Adjusted for Maximum Sales Charge) |
|
|
| Yearly periods ended June 30 |
The Fund's growth of an assumed $10,000 investment is adjusted for the maximum sales charge of 4.50%. This results in a net initial investment of $9,550.
The growth of $10,000 is cumulative.
Performance of other share classes will vary based on the sales charges and the fee structure of those classes.
+ The Standard & Poor's 500 (S&P 500) Index is an unmanaged, capitalization-weighted index of 500 stocks. The index is designed to measure performance of the broad domestic economy through changes in the aggregate market value of 500 stocks representing all major industries. "Standard & Poor's," "S&P 500," "Standard & Poor's 500" and "500" are trademarks of The McGraw-Hill Companies Inc., and have been licensed for use by the Fund's investment advisor.
| Net Asset Value and Distribution Information | |
| | | Class A | | | Class B | | | Class C | | | Class S | |
Net Asset Value: 6/30/12 | | $ | 18.09 | | | $ | 18.07 | | | $ | 18.06 | | | $ | 18.13 | |
| 12/31/11 | | $ | 16.67 | | | $ | 16.65 | | | $ | 16.64 | | | $ | 16.70 | |
Distribution Information: Six Months as of 6/30/12: Income Dividends | | $ | .11 | | | $ | .04 | | | $ | .04 | | | $ | .13 | |
Morningstar Rankings — Large Blend Funds Category as of 6/30/12 |
| Period | Rank | | Number of Fund Classes Tracked | Percentile Ranking (%) |
Class A 1-Year | 320 | of | 1,731 | 19 |
| 3-Year | 403 | of | 1,539 | 26 |
| 5-Year | 566 | of | 1,346 | 42 |
Class B 1-Year | 467 | of | 1,731 | 27 |
| 3-Year | 625 | of | 1,539 | 41 |
| 5-Year | 822 | of | 1,346 | 61 |
Class C 1-Year | 491 | of | 1,731 | 29 |
| 3-Year | 634 | of | 1,539 | 41 |
| 5-Year | 820 | of | 1,346 | 61 |
Class S 1-Year | 245 | of | 1,731 | 14 |
| 3-Year | 290 | of | 1,539 | 19 |
| 5-Year | 453 | of | 1,346 | 34 |
| 10-Year | 327 | of | 838 | 39 |
Source: Morningstar, Inc. Rankings are historical and do not guarantee future results. Rankings are based on total return unadjusted for sales charges with distributions reinvested. If sales charges had been included, rankings might have been less favorable.
Subadvisor
Northern Trust Investments, Inc. ("NTI"), a subsidiary of Northern Trust Corporation, is the subadvisor for the fund.
Portfolio Manager
Brent Reeder, Senior Vice President of Northern Trust Investments, Inc.
Portfolio Manager of the fund. Joined the fund in 2007.
• Joined Northern Trust Investments, Inc. in 1993 and is responsible for the management of quantitative equity portfolios.
Portfolio Summary (Unaudited)


Ten Largest Equity Holdings at June 30, 2012 (20.5% of Net Assets) |
1. Apple, Inc. Manufacturer of personal computers and communication solutions | 4.3% |
2. Exxon Mobil Corp. Explorer and producer of oil and gas | 3.2% |
3. Microsoft Corp. Developer of computer software | 1.8% |
4. International Business Machines Corp. Manufacturer of computers and provider of information processing services | 1.8% |
5. General Electric Co. A diversified company provider of services to the technology, media and financial industries | 1.7% |
6. AT&T, Inc. An integrated telecommunications company | 1.7% |
7. Chevron Corp. Operator of petroleum exploration, delivery and refining facilities | 1.7% |
8. Johnson & Johnson Provider of health care products | 1.5% |
9. Wells Fargo & Co. A diversified financial company | 1.4% |
10. Coca-Cola Co. Bottler and distributor of soft drinks | 1.4% |
Portfolio holdings and characteristics are subject to change. For more complete details about the Portfolio's investment portfolio, see page 26. A quarterly Fact Sheet is available on www.dws-investments.com or upon request. Please see the Account Management Resources section on page 56 for contact information. |
Statement of Assets and Liabilities | as of June 30, 2012 (Unaudited) | |
| Assets | |
| Investment in the DWS Equity 500 Index Portfolio, at value | | $ | 721,901,546 | |
| Receivable for Fund shares sold | | | 964,806 | |
| Other assets | | | 41,720 | |
| Total assets | | | 722,908,072 | |
| Liabilities | |
| Cash overdraft | | | 2,540 | |
| Payable for Fund shares redeemed | | | 2,271,469 | |
| Accrued Trustees' fees | | | 1,552 | |
| Other accrued expenses and payables | | | 524,504 | |
| Total liabilities | | | 2,800,065 | |
| Net assets, at value | | $ | 720,108,007 | |
| Net Assets Consist of | |
| Undistributed net investment income | | | 1,170,452 | |
| Net unrealized appreciation (depreciation) on investments and futures | | | 172,985,714 | |
| Accumulated net realized gain (loss) | | | (38,580,544 | ) |
| Paid-in capital | | | 584,532,385 | |
| Net assets, at value | | $ | 720,108,007 | |
| Net Asset Value | |
Class A Net Asset Value and redemption price per share ($201,886,824 ÷ 11,158,940 outstanding shares of beneficial interest, $.01 par value, unlimited number of shares authorized) | | $ | 18.09 | |
| Maximum offering price per share (100 ÷ 95.50 of $18.09) | | $ | 18.94 | |
Class B Net Asset Value, offering and redemption price per share ($2,329,179 ÷ 128,923 outstanding shares of beneficial interest, $.01 par value, unlimited number of shares authorized) | | $ | 18.07 | |
Class C Net Asset Value, offering and redemption price per share ($21,325,579 ÷ 1,180,549 outstanding shares of beneficial interest, $.01 par value, unlimited number of shares authorized) | | $ | 18.06 | |
Class S Net Asset Value, offering and redemption price per share ($494,566,425 ÷ 27,277,463 outstanding shares of beneficial interest, $.01 par value, unlimited number of shares authorized) | | $ | 18.13 | |
The accompanying notes are an integral part of the financial statements.
| for the six months ended June 30, 2012 (Unaudited) | |
| Investment Income | |
Income and expenses allocated from DWS Equity 500 Index Portfolio: Dividends (net of foreign taxes withheld of $8,513) | | $ | 6,636,070 | |
| Interest | | | 464 | |
| Income distributions — Central Cash Management Fund | | | 4,813 | |
| Securities lending income, including income from Daily Assets Fund Institutional, net of borrower rebates | | | 129,161 | |
| Expenses | | | (288,618 | ) |
| Net investment income allocated from DWS Equity 500 Index Portfolio | | | 6,481,890 | |
Expenses: Administration fee | | | 307,516 | |
| Services to shareholders | | | 549,726 | |
| Distribution and service fees | | | 261,397 | |
| Professional fees | | | 23,938 | |
| Reports to shareholders | | | 38,228 | |
| Registration fees | | | 33,124 | |
| Trustees' fees and expenses | | | 2,854 | |
| Other | | | 3,919 | |
| Total expenses before expense reductions | | | 1,220,702 | |
| Expense reductions | | | (24,146 | ) |
| Total expenses after expense reductions | | | 1,196,556 | |
| Net investment income (loss) | | | 5,285,334 | |
| Realized and Unrealized Gain (Loss) | |
Net realized gain (loss) allocated from DWS Equity 500 Index Portfolio: Investments | | | 37,117,368 | |
| Futures | | | 1,359,212 | |
| | | | 38,476,580 | |
Change in net unrealized appreciation (depreciation) allocated from DWS Equity 500 Index Portfolio on: Investments | | | 6,976,606 | |
| Futures | | | 116,754 | |
| | | | 7,093,360 | |
| Net gain (loss) | | | 45,569,940 | |
| Net increase (decrease) in net assets resulting from operations | | $ | 50,855,274 | |
The accompanying notes are an integral part of the financial statements.
Statement of Changes in Net Assets | Increase (Decrease) in Net Assets | | Six Months Ended June 30, 2012 (Unaudited) | | | Year Ended December 31, 2011 | |
Operations: Net investment income (loss) | | $ | 5,285,334 | | | $ | 8,967,353 | |
Operations: Net investment income (loss) | | $ | 5,285,334 | | | $ | 8,967,353 | |
| Net realized gain (loss) | | | 38,476,580 | | | | 48,050,938 | |
| Change in net unrealized appreciation (depreciation) | | | 7,093,360 | | | | (47,198,785 | ) |
| Net increase (decrease) in net assets resulting from operations | | | 50,855,274 | | | | 9,819,506 | |
Distributions to shareholders from: Net investment income: Class A | | | (951,447 | ) | | | (1,614,031 | ) |
| Class B | | | (4,219 | ) | | | (9,383 | ) |
| Class C | | | (39,470 | ) | | | (86,730 | ) |
| Class S | | | (3,392,186 | ) | | | (7,177,588 | ) |
| Total distributions | | | (4,387,322 | ) | | | (8,887,732 | ) |
Fund share transactions: Proceeds from shares sold | | | 44,659,293 | | | | 66,688,567 | |
| Net assets acquired in tax-free reorganization* | | | 203,828,842 | | | | — | |
| Reinvestment of distributions | | | 4,202,928 | | | | 8,493,763 | |
| Payment for shares redeemed | | | (109,749,751 | ) | | | (105,642,229 | ) |
| Net increase (decrease) in net assets from Fund share transactions | | | 142,941,312 | | | | (30,459,899 | ) |
| Increase (decrease) in net assets | | | 189,409,264 | | | | (29,528,125 | ) |
| Net assets at beginning of period | | | 530,698,743 | | | | 560,226,868 | |
| Net assets at end of period (including undistributed net investment income of $1,170,452 and $272,440, respectively) | | $ | 720,108,007 | | | $ | 530,698,743 | |
* On April 27, 2012, DWS S&P 500 Plus Fund was acquired by the Fund through a tax-free reorganization (see Note D).
The accompanying notes are an integral part of the financial statements.
| | | | | | Years Ended December 31, | |
| Class A | | Six Months Ended 6/30/12 (Unaudited) | | | 2011 | | | 2010 | | | 2009 | | | 2008 | | | 2007 | |
| Selected Per Share Data | |
| Net asset value, beginning of period | | $ | 16.67 | | | $ | 16.67 | | | $ | 14.77 | | | $ | 11.96 | | | $ | 19.45 | | | $ | 18.78 | |
Income (loss) from investment operations: Net investment incomea | | | .14 | | | | .24 | | | | .22 | | | | .23 | | | | .28 | | | | .26 | |
| Net realized and unrealized gain (loss) | | | 1.39 | | | | .00 | *** | | | 1.90 | | | | 2.82 | | | | (7.51 | ) | | | .66 | |
| Total from investment operations | | | 1.53 | | | | .24 | | | | 2.12 | | | | 3.05 | | | | (7.23 | ) | | | .92 | |
Less distributions from: Net investment income | | | (.11 | ) | | | (.24 | ) | | | (.22 | ) | | | (.24 | ) | | | (.26 | ) | | | (.25 | ) |
| Net asset value, end of period | | $ | 18.09 | | | $ | 16.67 | | | $ | 16.67 | | | $ | 14.77 | | | $ | 11.96 | | | $ | 19.45 | |
Total Return (%)b,c | | | 9.16 | ** | | | 1.49 | | | | 14.47 | | | | 25.88 | | | | (37.45 | ) | | | 4.90 | |
| Ratios to Average Net Assets and Supplemental Data | |
| Net assets, end of period ($ millions) | | | 202 | | | | 110 | | | | 118 | | | | 110 | | | | 72 | | | | 95 | |
| Ratio of expenses before expense reductions, including expenses allocated from DWS Equity 500 Index Portfolio (%) | | | .70 | * | | | .71 | | | | .72 | | | | .70 | | | | .71 | | | | .72 | |
| Ratio of expenses after expense reductions, including expenses allocated from DWS Equity 500 Index Portfolio (%) | | | .67 | * | | | .67 | | | | .67 | | | | .62 | | | | .65 | | | | .64 | |
| Ratio of net investment income (%) | | | 1.58 | * | | | 1.43 | | | | 1.43 | | | | 1.81 | | | | 1.69 | | | | 1.33 | |
a Based on average shares outstanding during the period. b Total return does not reflect the effect of any sales charges. c Total return would have been lower had certain expenses not been reduced. * Annualized ** Not annualized *** Amount is less than $.005. | |
| | | | | | Years Ended December 31, | |
| Class B | | Six Months Ended 6/30/12 (Unaudited) | | | 2011 | | | 2010 | | | 2009 | | | 2008 | | | 2007 | |
| Selected Per Share Data | |
| Net asset value, beginning of period | | $ | 16.65 | | | $ | 16.64 | | | $ | 14.74 | | | $ | 11.94 | | | $ | 19.41 | | | $ | 18.74 | |
Income (loss) from investment operations: Net investment incomea | | | .07 | | | | .12 | | | | .10 | | | | .13 | | | | .15 | | | | .11 | |
| Net realized and unrealized gain (loss) | | | 1.39 | | | | .01 | | | | 1.90 | | | | 2.81 | | | | (7.48 | ) | | | .66 | |
| Total from investment operations | | | 1.46 | | | | .13 | | | | 2.00 | | | | 2.94 | | | | (7.33 | ) | | | .77 | |
Less distributions from: Net investment income | | | (.04 | ) | | | (.12 | ) | | | (.10 | ) | | | (.14 | ) | | | (.14 | ) | | | (.10 | ) |
| Net asset value, end of period | | $ | 18.07 | | | $ | 16.65 | | | $ | 16.64 | | | $ | 14.74 | | | $ | 11.94 | | | $ | 19.41 | |
Total Return (%)b | | | 8.78 | ** | | | .73 | | | | 13.66 | c | | | 24.87 | c | | | (37.90 | )c | | | 4.11 | c |
| Ratios to Average Net Assets and Supplemental Data | |
| Net assets, end of period ($ millions) | | | 2 | | | | 1 | | | | 2 | | | | 2 | | | | 2 | | | | 3 | |
| Ratio of expenses before expense reductions, including expenses allocated from DWS Equity 500 Index Portfolio (%) | | | 1.44 | * | | | 1.40 | | | | 1.46 | | | | 1.50 | | | | 1.52 | | | | 1.54 | |
| Ratio of expenses after expense reductions, including expenses allocated from DWS Equity 500 Index Portfolio (%) | | | 1.44 | * | | | 1.40 | | | | 1.43 | | | | 1.37 | | | | 1.42 | | | | 1.40 | |
| Ratio of net investment income (%) | | | .81 | * | | | .69 | | | | .67 | | | | 1.05 | | | | .93 | | | | .57 | |
a Based on average shares outstanding during the period. b Total return does not reflect the effect of any sales charges. c Total return would have been lower had certain expenses not been reduced. * Annualized ** Not annualized | |
| | | | | | Years Ended December 31, | |
| Class C | | Six Months Ended 6/30/12 (Unaudited) | | | 2011 | | | 2010 | | | 2009 | | | 2008 | | | 2007 | |
| Selected Per Share Data | |
| Net asset value, beginning of period | | $ | 16.64 | | | $ | 16.64 | | | $ | 14.74 | | | $ | 11.94 | | | $ | 19.41 | | | $ | 18.74 | |
Income (loss) from investment operations: Net investment incomea | | | .08 | | | | .12 | | | | .10 | | | | .13 | | | | .16 | | | | .11 | |
| Net realized and unrealized gain (loss) | | | 1.38 | | | | .00 | *** | | | 1.90 | | | | 2.81 | | | | (7.49 | ) | | | .66 | |
| Total from investment operations | | | 1.46 | | | | .12 | | | | 2.00 | | | | 2.94 | | | | (7.33 | ) | | | .77 | |
Less distributions from: Net investment income | | | (.04 | ) | | | (.12 | ) | | | (.10 | ) | | | (.14 | ) | | | (.14 | ) | | | (.10 | ) |
| Net asset value, end of period | | $ | 18.06 | | | $ | 16.64 | | | $ | 16.64 | | | $ | 14.74 | | | $ | 11.94 | | | $ | 19.41 | |
Total Return (%)b | | | 8.78 | ** | | | .76 | | | | 13.63 | c | | | 24.88 | c | | | (37.90 | )c | | | 4.11 | c |
| Ratios to Average Net Assets and Supplemental Data | |
| Net assets, end of period ($ millions) | | | 21 | | | | 12 | | | | 12 | | | | 10 | | | | 5 | | | | 7 | |
| Ratio of expenses before expense reductions, including expenses allocated from DWS Equity 500 Index Portfolio (%) | | | 1.35 | * | | | 1.40 | | | | 1.45 | | | | 1.47 | | | | 1.46 | | | | 1.50 | |
| Ratio of expenses after expense reductions, including expenses allocated from DWS Equity 500 Index Portfolio (%) | | | 1.35 | * | | | 1.40 | | | | 1.42 | | | | 1.37 | | | | 1.41 | | | | 1.40 | |
| Ratio of net investment income (%) | | | .89 | * | | | .70 | | | | .68 | | | | 1.05 | | | | .93 | | | | .56 | |
a Based on average shares outstanding during the period. b Total return does not reflect the effect of any sales charges. c Total return would have been lower had certain expenses not been reduced. * Annualized ** Not annualized *** Amount is less than $.005. | |
| | | | | | Years Ended December 31, | |
| Class S | | Six Months Ended 6/30/12 (Unaudited) | | | 2011 | | | 2010 | | | 2009 | | | 2008 | | | 2007 | |
| Selected Per Share Data | |
| Net asset value, beginning of period | | $ | 16.70 | | | $ | 16.70 | | | $ | 14.80 | | | $ | 11.99 | | | $ | 19.49 | | | $ | 18.81 | |
Income (loss) from investment operations: Net investment incomea | | | .16 | | | | .29 | | | | .26 | | | | .26 | | | | .32 | | | | .31 | |
| Net realized and unrealized gain (loss) | | | 1.40 | | | | .00 | *** | | | 1.90 | | | | 2.82 | | | | (7.51 | ) | | | .67 | |
| Total from investment operations | | | 1.56 | | | | .29 | | | | 2.16 | | | | 3.08 | | | | (7.19 | ) | | | .98 | |
Less distributions from: Net investment income | | | (.13 | ) | | | (.29 | ) | | | (.26 | ) | | | (.27 | ) | | | (.31 | ) | | | (.30 | ) |
| Net asset value, end of period | | $ | 18.13 | | | $ | 16.70 | | | $ | 16.70 | | | $ | 14.80 | | | $ | 11.99 | | | $ | 19.49 | |
| Total Return (%) | | | 9.36 | ** | | | 1.72 | | | | 14.81 | b | | | 26.14 | b | | | (37.25 | )b | | | 5.22 | b |
| Ratios to Average Net Assets and Supplemental Data | |
| Net assets, end of period ($ millions) | | | 495 | | | | 408 | | | | 428 | | | | 403 | | | | 343 | | | | 599 | |
| Ratio of expenses before expense reductions, including expenses allocated from DWS Equity 500 Index Portfolio (%) | | | .39 | * | | | .39 | | | | .42 | | | | .46 | | | | .44 | | | | .44 | |
| Ratio of expenses after expense reductions, including expenses allocated from DWS Equity 500 Index Portfolio (%) | | | .39 | * | | | .39 | | | | .39 | | | | .35 | | | | .39 | | | | .39 | |
| Ratio of net investment income (%) | | | 1.80 | * | | | 1.71 | | | | 1.70 | | | | 2.07 | | | | 1.95 | | | | 1.58 | |
a Based on average shares outstanding during the period. b Total return would have been lower had certain expenses not been reduced. * Annualized ** Not annualized *** Amount is less than $.005. | |
Notes to Financial Statements
A. Organization and Significant Accounting Policies
DWS S&P 500 Index Fund (the "Fund") is a diversified series of the DWS Institutional Funds (the "Trust"), which is registered under the Investment Company Act of 1940, as amended (the "1940 Act"), as an open-end management investment company organized as a Massachusetts business trust.
The Fund, a feeder fund, seeks to achieve its investment objective by investing all of its investable assets in a master portfolio, DWS Equity 500 Index Portfolio (the "Portfolio"), a diversified open-end management investment company registered under the 1940 Act and organized as a New York trust advised by Deutsche Investment Management Americas Inc. ("DIMA" or the "Advisor"), an indirect, wholly owned subsidiary of Deutsche Bank AG. A master/feeder fund structure is one in which a fund (a "feeder fund"), instead of investing directly in a portfolio of securities, invests most or all of its investment assets in a separate registered investment company (the "master fund") with substantially the same investment objective and policies as the feeder fund. Such a structure permits the pooling of assets of two or more feeder funds, preserving separate identities or distribution channels at the feeder fund level. On June 30, 2012, the Fund owned approximately 32% of the Portfolio.
The Fund offers multiple classes of shares which provide investors with different purchase options. Class A shares are offered to investors subject to an initial sales charge. Class B shares of the Fund are closed to new purchases, except exchanges or the reinvestment of dividends or other distributions. Class B shares were offered to investors without an initial sales charge and are subject to higher ongoing expenses than Class A shares and a contingent deferred sales charge payable upon certain redemptions. Class B shares automatically convert to Class A shares six years after issuance. Class C shares are offered to investors without an initial sales charge but are subject to higher ongoing expenses than Class A shares and a contingent deferred sales charge payable upon certain redemptions within one year of purchase. Class C shares do not automatically convert into another class. Class S shares are not subject to initial or contingent deferred sales charges and are generally not available to new investors except under certain circumstances.
Investment income, realized and unrealized gains and losses and certain fund-level expenses and expense reductions, if any, are borne pro rata on the basis of relative net assets by the holders of all classes of shares, except that each class bears certain expenses unique to that class such as distribution and services fees, services to shareholders and certain other class-specific expenses. Differences in class-level expenses may result in payment of different per share dividends by class. All shares of the Fund have equal rights with respect to voting subject to class-specific arrangements.
The Fund's financial statements are prepared in accordance with accounting principles generally accepted in the United States of America which require the use of management estimates. Actual results could differ from those estimates. The policies described below are followed consistently by the Fund in the preparation of its financial statements. The financial statements of the Portfolio, including the Investment Portfolio, are contained elsewhere in this report and should be read in conjunction with the Fund's financial statements.
Security Valuation. The Fund records its investment in the Portfolio at value, which reflects its proportionate interest in the net assets of the Portfolio. Valuation of the securities held by the Portfolio is discussed in the notes to the Portfolio's financial statements included elsewhere in this report.
Disclosure about the classification of fair value measurements is included in a table following the Portfolio's Investment Portfolio.
Federal Income Taxes. The Fund's policy is to comply with the requirements of the Internal Revenue Code, as amended, which are applicable to regulated investment companies, and to distribute all of its taxable income to its shareholders. Accordingly, the Fund paid no federal income taxes and no federal income tax provision was required.
Under the Regulated Investment Company Modernization Act of 2010, net capital losses may be carried forward indefinitely, and their character is retained as short-term and/or long-term. Previously, net capital losses were carried forward for eight years and treated as short-term losses. As a transition rule, the Act requires that post-enactment net capital losses be used before pre-enactment net capital losses.
At December 31, 2011, the Fund had a net tax basis capital loss carryforward of approximately $77,043,000 of pre-enactment losses, which may be applied against any realized net taxable capital gains of each succeeding year until fully utilized or until December 31, 2012 ($21,570,000), December 31, 2013 ($7,108,000), December 31, 2014 ($6,496,000), December 31, 2016 ($16,675,000), December 31, 2017 ($17,522,000) and December 31, 2018 ($7,672,000), the respective expiration dates, whichever occurs first.
The Fund has reviewed the tax positions for the open tax years as of December 31, 2011, and has determined that no provision for income tax is required in the Fund's financial statements. The Fund's federal tax returns for the prior three fiscal years remain open subject to examination by the Internal Revenue Service.
Distribution of Income and Gains. Net investment income of the Fund, is declared and distributed to shareholders quarterly. Net realized gains from investment transactions, in excess of available capital loss carryforwards, would be taxable to the Fund if not distributed, and, therefore, will be distributed to shareholders at least annually.
The timing and characterization of certain income and capital gain distributions are determined annually in accordance with federal tax regulations which may differ from accounting principles generally accepted in the United States of America. These differences primarily relate to futures contracts and certain securities sold at a loss. As a result, net investment income (loss) and net realized gain (loss) on investment transactions for a reporting period may differ significantly from distributions during such period. Accordingly, the Fund may periodically make reclassifications among certain of its capital accounts without impacting the net asset value of the Fund.
The tax character of current year distributions will be determined at the end of the current fiscal year.
Contingencies. In the normal course of business, the Fund may enter into contracts with service providers that contain general indemnification clauses. The Fund's maximum exposure under these arrangements is unknown as this would involve future claims that may be made against the Fund that have not yet been made. However, based on experience, the Fund expects the risk of loss to be remote.
Other. The Fund receives a daily allocation of the Portfolio's income, expenses and net realized and unrealized gains and losses in proportion to its investment in the Portfolio. Expenses directly attributed to a fund are charged to that fund, while expenses which are attributable to the Trust are allocated among the funds in the Trust on the basis of relative net assets.
B. Related Parties
Management Agreement. Under its Investment Management Agreement with the Fund, the Advisor serves as investment manager to the Fund. The Advisor receives a management fee from the Portfolio pursuant to the master/feeder structure noted above in Note A.
Pursuant to the Investment Management Agreement, the Fund pays no management fee to the Advisor so long as the Fund is a feeder fund that invests substantially all of its assets in the Portfolio. In the event the Board of Trustees determines it is in the best interests of the Fund to withdraw its investment from the Portfolio, the Advisor may become responsible for directly managing the assets of the Fund under the Investment Management Agreement. In such event, the Fund would pay the Advisor an annual fee of 0.15% of the Fund's average daily net assets, accrued daily and payable monthly.
The Advisor has voluntarily agreed to waive its fees and/or reimburse certain operating expenses of the Fund to the extent necessary to maintain the operating expenses (excluding certain expenses such as extraordinary expenses, taxes, brokerage and interest) for each class as follows:
| Class A | .67% |
| Class B | 1.47% |
| Class C | 1.47% |
| Class S | .47% |
This voluntary waiver or reimbursement may be terminated at any time at the option of the Advisor.
Administration Fee. Pursuant to an Administrative Services Agreement, DIMA provides most administrative services to the Fund. For all services provided under the Administrative Services Agreement, the Fund pays the Advisor an annual fee ("Administration Fee") of 0.10% of the Fund's average daily net assets, computed and accrued daily and payable monthly. For the six months ended June 30, 2012, the Administration Fee was $307,516, of which $57,665 is unpaid.
Service Provider Fees. DWS Investments Service Company ("DISC"), an affiliate of the Advisor, is the transfer agent, dividend-paying agent and shareholder service agent of the Fund. Pursuant to a sub-transfer agency agreement between DISC and DST Systems, Inc. ("DST"), DISC has delegated certain transfer agent, dividend-paying agent and shareholder service agent functions to DST. DISC compensates DST out of the shareholder servicing fee it receives from the Fund. For the six months ended June 30, 2012, the amounts charged to the Fund by DISC were as follows:
| Services to Shareholders | | Total Aggregated | | | Waived | | | Unpaid at June 30, 2012 | |
| Class A | | $ | 145,036 | | | $ | 24,146 | | | $ | 88,071 | |
| Class B | | | 1,100 | | | | — | | | | 568 | |
| Class C | | | 5,244 | | | | — | | | | 2,756 | |
| Class S | | | 302,182 | | | | — | | | | 124,081 | |
| | | $ | 453,562 | | | $ | 24,146 | | | $ | 215,476 | |
Distribution and Service Agreement. Under the Fund's Class B and C 12b-1 Plans, DWS Investments Distributors, Inc. ("DIDI"), a subsidiary of the Advisor, receives a fee ("Distribution Fee") of 0.75% of average daily net assets of each of Class B and C shares. In accordance with the Fund's Underwriting and Distribution Services Agreement, DIDI enters into related selling group agreements with various firms at various rates for sales of Class B and C shares. For the six months ended June 30, 2012, the Distribution Fee was as follows:
| Distribution Fee | | Total Aggregated | | | Unpaid at June 30, 2012 | |
| Class B | | $ | 6,282 | | | $ | 1,318 | |
| Class C | | | 57,855 | | | | 12,575 | |
| | | $ | 64,137 | | | $ | 13,893 | |
In addition, DIDI provides information and administrative services for a fee ("Service Fee") to Class A, B and C shareholders at an annual rate of up to 0.25% of average daily net assets for each such class. DIDI in turn has various agreements with financial services firms that provide these services and pays these fees based upon the assets of shareholder accounts the firms service. For the six months ended June 30, 2012, the Service Fee was as follows:
| Service Fee | | Total Aggregated | | | Unpaid at June 30, 2012 | | | Annualized Effective Rate | |
| Class A | | $ | 176,002 | | | $ | 91,559 | | | | .24 | % |
| Class B | | | 2,069 | | | | 1,105 | | | | .25 | % |
| Class C | | | 19,189 | | | | 9,568 | | | | .25 | % |
| | | $ | 197,260 | | | $ | 102,232 | | | | | |
Underwriting Agreement and Contingent Deferred Sales Charge. DIDI is the principal underwriter for the Fund. Underwriting commissions paid to DIDI in connection with the distribution of Class A shares for the six months ended June 30, 2012 aggregated $9,158.
In addition, DIDI receives any contingent deferred sales charge ("CDSC") from Class B share redemptions occurring within six years of purchase and Class C share redemptions occurring within one year of purchase. There is no such charge upon redemption of any share appreciation or reinvested dividends. The CDSC is based on declining rates ranging from 4% to 1% for Class B and 1% for Class C, of the value of the shares redeemed. For the six months ended June 30, 2012, the CDSC for Class B and C shares aggregated $1,872 and $255, respectively. A deferred sales charge of up to 1% is assessed on certain redemptions of Class A shares. For the six months ended June 30, 2012, DIDI received $3,089 for Class A shares.
Typesetting and Filing Service Fees. Under an agreement with DIMA, DIMA is compensated for providing typesetting and certain regulatory filing services to the Fund. For the six months ended June 30, 2012, the amount charged to the Fund by DIMA included in the Statement of Operations under "reports to shareholders" aggregated $14,330, all of which is unpaid.
Trustees' Fees and Expenses. The Fund paid retainer fees to each Trustee not affiliated with the Advisor, plus specified amounts to the Board Chairperson and to each committee Chairperson.
C. Share Transactions
The following table summarizes share and dollar activity in the Fund:
| | | Six Months Ended June 30, 2012 | | | Year Ended December 31, 2011 | |
| | | Shares | | | Dollars | | | Shares | | | Dollars | |
| Shares sold | |
| Class A | | | 1,351,622 | | | $ | 24,367,271 | | | | 1,772,678 | | | $ | 29,669,678 | |
| Class B | | | 1,686 | | | | 30,189 | | | | 4,440 | | | | 76,314 | |
| Class C | | | 142,207 | | | | 2,548,740 | | | | 171,599 | | | | 2,882,748 | |
| Class S | | | 982,634 | | | | 17,713,093 | | | | 2,011,748 | | | | 34,059,827 | |
| | | | | | | $ | 44,659,293 | | | | | | | $ | 66,688,567 | |
| Shares issued in tax-free reorganization* | |
| Class A | | | 4,591,013 | ** | | $ | 85,530,455 | ** | | | — | | | $ | — | |
| Class B | | | 60,005 | | | | 1,116,050 | | | | — | | | | — | |
| Class C | | | 469,468 | | | | 8,727,139 | | | | — | | | | — | |
| Class S | | | 5,805,817 | | | | 108,455,198 | | | | — | | | | — | |
| | | | | | | $ | 203,828,842 | | | | | | | $ | — | |
| Shares issued to shareholders in reinvestment of distributions | |
| Class A | | | 52,080 | | | $ | 938,617 | | | | 97,901 | | | $ | 1,593,468 | |
| Class B | | | 230 | | | | 4,136 | | | | 568 | | | | 9,164 | |
| Class C | | | 2,141 | | | | 38,537 | | | | 5,327 | | | | 85,847 | |
| Class S | | | 177,658 | | | | 3,221,638 | | | | 416,840 | | | | 6,805,284 | |
| | | | | | | $ | 4,202,928 | | | | | | | $ | 8,493,763 | |
| Shares redeemed | |
| Class A | | | (1,426,086 | ) | | $ | (27,109,205 | ) | | | (2,373,913 | ) | | $ | (40,029,931 | ) |
| Class B | | | (10,298 | ) | | | (203,324 | ) | | | (20,842 | ) | | | (357,845 | ) |
| Class C | | | (145,771 | ) | | | (2,784,337 | ) | | | (207,587 | ) | | | (3,480,680 | ) |
| Class S | | | (4,094,038 | ) | | | (79,652,885 | ) | | | (3,651,599 | ) | | | (61,773,773 | ) |
| | | | | | | $ | (109,749,751 | ) | | | | | | $ | (105,642,229 | ) |
| Net increase (decrease) | |
| Class A | | | 4,568,629 | | | $ | 83,727,138 | | | | (503,334 | ) | | $ | (8,766,785 | ) |
| Class B | | | 51,623 | | | | 947,051 | | | | (15,834 | ) | | | (272,367 | ) |
| Class C | | | 468,045 | | | | 8,530,079 | | | | (30,661 | ) | | | (512,085 | ) |
| Class S | | | 2,872,071 | | | | 49,737,044 | | | | (1,223,011 | ) | | | (20,908,662 | ) |
| | | | | | | $ | 142,941,312 | | | | | | | $ | (30,459,899 | ) |
* On April 27, 2012, DWS S&P 500 Plus Fund was acquired by the Fund through a tax-free reorganization (see Note D).
** On April 27, 2012, Class R shares of DWS S&P 500 Plus Fund converted into Class A shares of the Fund.
D. Acquisition of Assets
On April 27, 2012, the Fund acquired all of the net assets of DWS S&P 500 Plus Fund pursuant to a plan of reorganization approved by shareholders on April 16, 2012. The acquisition was accomplished by a tax-free exchange of 5,340,422 Class A shares, 86,606 Class B shares, 675,809 Class C shares, 1,091,801 of Class R shares (converted into Class A shares) and 8,188,815 Class S shares of DWS S&P 500 Plus Fund for 4,591,013 Class A shares, 60,005 Class B shares, 469,468 Class C shares and 5,805,817 Class S shares of DWS S&P 500 Index Fund, respectively, outstanding on April 27, 2012. DWS S&P 500 Plus Fund's net assets at that date, $203,828,842, including $60,535,843 of net unrealized appreciation, were combined with those of the Fund. The aggregate net assets of the Fund immediately before the acquisition were $588,808,565. The combined net assets of the Fund immediately following the acquisition were $792,637,407.
The financial statements reflect the operations of the Fund for the period prior to the acquisition and the combined fund for the period subsequent to the fund merger. Assuming the acquisition had been completed on January 1, 2012, the Fund's pro forma results of operations for the six months ended June 30, 2012, are as follows:
| Net investment income* | | $ | 6,247,966 | |
| Net gain (loss) on investments | | $ | 63,534,353 | |
| Net increase (decrease) in net assets resulting from operations | | $ | 69,782,319 | |
* Net investment income includes $117,984 of pro forma additional expenses, of which $52,437 is attributable to the expenses of the Portfolio.
Because the combined investment portfolios have been managed as a single integrated Fund since the acquisition was completed, it is not practicable to separate the amounts of revenue and earnings of DWS S&P 500 Plus Fund that have been included in the Fund's Statement of Operations since April 27, 2012.
Information About Your Fund's Expenses
As an investor of the Fund, you incur two types of costs: ongoing expenses and transaction costs. Ongoing expenses include management fees, distribution and service (12b-1) fees and other Fund expenses. Examples of transaction costs include sales charges (loads) and account maintenance fees, which are not shown in this section. The following tables are intended to help you understand your ongoing expenses (in dollars) of investing in the Fund and to help you compare these expenses with the ongoing expenses of investing in other mutual funds. In the most recent six-month period, Class A shares limited these expenses; had it not done so, expenses would have been higher. The example in the table is based on an investment of $1,000 invested at the beginning of the six-month period and held for the entire period (January 1, 2012 to June 30, 2012).
The tables illustrate your Fund's expenses in two ways:
•Actual Fund Return. This helps you estimate the actual dollar amount of ongoing expenses (but not transaction costs) paid on a $1,000 investment in the Fund using the Fund's actual return during the period. To estimate the expenses you paid over the period, simply divide your account value by $1,000 (for example, an $8,600 account value divided by $1,000 = 8.6), then multiply the result by the number in the "Expenses Paid per $1,000" line under the share class you hold.
•Hypothetical 5% Fund Return. This helps you to compare your Fund's ongoing expenses (but not transaction costs) with those of other mutual funds using the Fund's actual expense ratio and a hypothetical rate of return of 5% per year before expenses. Examples using a 5% hypothetical fund return may be found in the shareholder reports of other mutual funds. The hypothetical account values and expenses may not be used to estimate the actual ending account balance or expenses you paid for the period.
Please note that the expenses shown in these tables are meant to highlight your ongoing expenses only and do not reflect any transaction costs. The "Expenses Paid per $1,000" line of the tables is useful in comparing ongoing expenses only and will not help you determine the relative total expense of owning different funds. An account maintenance fee of $6.25 per quarter for Class S shares may apply for certain accounts whose balances do not meet the applicable minimum initial investment. This fee is not included in these tables. If it was, the estimate of expenses paid for Class S shares during the period would be higher, and account value during the period would be lower, by this amount.
Expenses and Value of a $1,000 Investment for the six months ended June 30, 2012 (Unaudited) | |
| Actual Fund Return* | | Class A | | | Class B | | | Class C | | | Class S | |
| Beginning Account Value 1/1/12 | | $ | 1,000.00 | | | $ | 1,000.00 | | | $ | 1,000.00 | | | $ | 1,000.00 | |
| Ending Account Value 6/30/12 | | $ | 1,091.60 | | | $ | 1,087.80 | | | $ | 1,087.80 | | | $ | 1,093.60 | |
| Expenses Paid per $1,000** | | $ | 3.48 | | | $ | 7.48 | | | $ | 7.01 | | | $ | 2.03 | |
| Hypothetical 5% Fund Return* | | Class A | | | Class B | | | Class C | | | Class S | |
| Beginning Account Value 1/1/12 | | $ | 1,000.00 | | | $ | 1,000.00 | | | $ | 1,000.00 | | | $ | 1,000.00 | |
| Ending Account Value 6/30/12 | | $ | 1,021.53 | | | $ | 1,017.70 | | | $ | 1,018.15 | | | $ | 1,022.92 | |
| Expenses Paid per $1,000** | | $ | 3.37 | | | $ | 7.22 | | | $ | 6.77 | | | $ | 1.96 | |
* Expenses include amounts allocated proportionally from the master portfolio.
** Expenses are equal to the Fund's annualized expense ratio for each share class, multiplied by the average account value over the period, multiplied by 182 (the number of days in the most recent six-month period), then divided by 366.
| Annualized Expense Ratios | Class A | Class B | Class C | Class S |
| DWS S&P 500 Index Fund | .67% | 1.44% | 1.35% | .39% |
For more information, please refer to the Fund's prospectuses.
(The following financial statements of the DWS Equity 500 Index Portfolio should be read in conjunction with the Fund's financial statements.)
Investment Portfolio as of June 30, 2012 (Unaudited) | | | Shares | | | Value ($) | |
| | | | |
| Common Stocks 97.7% | |
| Consumer Discretionary 10.7% | |
| Auto Components 0.2% | |
| BorgWarner, Inc.* (a) | | | 19,875 | | | | 1,303,601 | |
| Goodyear Tire & Rubber Co.* (a) | | | 46,396 | | | | 547,937 | |
| Johnson Controls, Inc. (a) | | | 120,601 | | | | 3,341,854 | |
| | | | | | | | 5,193,392 | |
| Automobiles 0.4% | |
| Ford Motor Co. (a) | | | 671,548 | | | | 6,440,145 | |
| Harley-Davidson, Inc. (a) | | | 41,382 | | | | 1,892,399 | |
| | | | | | | | 8,332,544 | |
| Distributors 0.1% | |
| Genuine Parts Co. (a) | | | 27,472 | | | | 1,655,188 | |
| Diversified Consumer Services 0.1% | |
| Apollo Group, Inc. "A"* | | | 18,883 | | | | 683,376 | |
| DeVry, Inc. (a) | | | 10,600 | | | | 328,282 | |
| H&R Block, Inc. (a) | | | 51,186 | | | | 817,952 | |
| | | | | | | | 1,829,610 | |
| Hotels, Restaurants & Leisure 1.9% | |
| Carnival Corp. | | | 79,579 | | | | 2,727,172 | |
| Chipotle Mexican Grill, Inc.* | | | 5,597 | | | | 2,126,580 | |
| Darden Restaurants, Inc. (a) | | | 22,280 | | | | 1,128,036 | |
| International Game Technology (a) | | | 50,064 | | | | 788,508 | |
| Marriott International, Inc. "A" (a) | | | 46,363 | | | | 1,817,430 | |
| McDonald's Corp. | | | 179,614 | | | | 15,901,228 | |
| Starbucks Corp. (a) | | | 133,701 | | | | 7,128,937 | |
| Starwood Hotels & Resorts Worldwide, Inc. | | | 34,293 | | | | 1,818,901 | |
| Wyndham Worldwide Corp. (a) | | | 25,314 | | | | 1,335,060 | |
| Wynn Resorts Ltd. | | | 14,000 | | | | 1,452,080 | |
| Yum! Brands, Inc. (a) | | | 81,431 | | | | 5,245,785 | |
| | | | | | | | 41,469,717 | |
| Household Durables 0.2% | |
| D.R. Horton, Inc. (a) | | | 49,800 | | | | 915,324 | |
| Harman International Industries, Inc. (a) | | | 13,100 | | | | 518,760 | |
| Leggett & Platt, Inc. (a) | | | 24,370 | | | | 514,938 | |
| Lennar Corp. "A" (a) | | | 28,300 | | | | 874,753 | |
| Newell Rubbermaid, Inc. | | | 51,450 | | | | 933,303 | |
| Pulte Group, Inc.* (a) | | | 63,374 | | | | 678,102 | |
| Whirlpool Corp. | | | 13,133 | | | | 803,214 | |
| | | | | | | | 5,238,394 | |
| Internet & Catalog Retail 1.0% | |
| Amazon.com, Inc.* | | | 63,567 | | | | 14,515,524 | |
| Expedia, Inc. (a) | | | 15,885 | | | | 763,592 | |
| Netflix, Inc.* (a) | | | 10,245 | | | | 701,475 | |
| Priceline.com, Inc.* (a) | | | 8,824 | | | | 5,863,725 | |
| TripAdvisor, Inc.* (a) | | | 17,485 | | | | 781,405 | |
| | | | | | | | 22,625,721 | |
| Leisure Equipment & Products 0.1% | |
| Hasbro, Inc. (a) | | | 21,685 | | | | 734,471 | |
| Mattel, Inc. | | | 59,014 | | | | 1,914,414 | |
| | | | | | | | 2,648,885 | |
| Media 3.3% | |
| Cablevision Systems Corp. (New York Group) "A" (a) | | | 39,073 | | | | 519,280 | |
| CBS Corp. "B" | | | 115,754 | | | | 3,794,416 | |
| Comcast Corp. "A" (a) | | | 475,963 | | | | 15,216,537 | |
| DIRECTV "A"* (a) | | | 115,610 | | | | 5,644,080 | |
| Discovery Communications, Inc. "A"* (a) | | | 44,646 | | | | 2,410,884 | |
| Gannett Co., Inc. (a) | | | 42,786 | | | | 630,238 | |
| Interpublic Group of Companies, Inc. | | | 78,995 | | | | 857,096 | |
| McGraw-Hill Companies, Inc. | | | 48,793 | | | | 2,195,685 | |
| News Corp. "A" (a) | | | 371,908 | | | | 8,289,829 | |
| Omnicom Group, Inc. (a) | | | 48,062 | | | | 2,335,813 | |
| Scripps Networks Interactive "A" (a) | | | 16,200 | | | | 921,132 | |
| Time Warner Cable, Inc. | | | 55,051 | | | | 4,519,687 | |
| Time Warner, Inc. (a) | | | 169,417 | | | | 6,522,555 | |
| Viacom, Inc. "B" | | | 93,253 | | | | 4,384,756 | |
| Walt Disney Co. (a) | | | 315,645 | | | | 15,308,783 | |
| Washington Post Co. "B" | | | 800 | | | | 299,056 | |
| | | | | | | | 73,849,827 | |
| Multiline Retail 0.8% | |
| Big Lots, Inc.* (a) | | | 11,396 | | | | 464,843 | |
| Dollar Tree, Inc.* | | | 40,800 | | | | 2,195,040 | |
| Family Dollar Stores, Inc. | | | 20,572 | | | | 1,367,627 | |
| J.C. Penney Co., Inc. (a) | | | 25,321 | | | | 590,233 | |
| Kohl's Corp. (a) | | | 42,325 | | | | 1,925,364 | |
| Macy's, Inc. | | | 73,350 | | | | 2,519,572 | |
| Nordstrom, Inc. (a) | | | 27,832 | | | | 1,382,972 | |
| Sears Holdings Corp.* (a) | | | 6,918 | | | | 413,005 | |
| Target Corp. (a) | | | 116,729 | | | | 6,792,460 | |
| | | | | | | | 17,651,116 | |
| Specialty Retail 2.0% | |
| Abercrombie & Fitch Co. "A" (a) | | | 15,600 | | | | 532,584 | |
| AutoNation, Inc.* (a) | | | 8,200 | | | | 289,296 | |
| AutoZone, Inc.* (a) | | | 4,690 | | | | 1,722,027 | |
| Bed Bath & Beyond, Inc.* (a) | | | 41,012 | | | | 2,534,541 | |
| Best Buy Co., Inc. (a) | | | 50,631 | | | | 1,061,226 | |
| CarMax, Inc.* (a) | | | 39,263 | | | | 1,018,482 | |
| GameStop Corp. "A" | | | 22,400 | | | | 411,264 | |
| Home Depot, Inc. (a) | | | 270,118 | | | | 14,313,553 | |
| Limited Brands, Inc. (a) | | | 43,240 | | | | 1,838,997 | |
| Lowe's Companies, Inc. | | | 207,656 | | | | 5,905,737 | |
| O'Reilly Automotive, Inc.* (a) | | | 22,200 | | | | 1,859,694 | |
| Ross Stores, Inc. | | | 39,802 | | | | 2,486,431 | |
| Staples, Inc. (a) | | | 119,774 | | | | 1,563,051 | |
| The Gap, Inc. (a) | | | 57,958 | | | | 1,585,731 | |
| Tiffany & Co. (a) | | | 22,016 | | | | 1,165,747 | |
| TJX Companies, Inc. | | | 130,798 | | | | 5,615,158 | |
| Urban Outfitters, Inc.* (a) | | | 19,661 | | | | 542,447 | |
| | | | | | | | 44,445,966 | |
| Textiles, Apparel & Luxury Goods 0.6% | |
| Coach, Inc. (a) | | | 50,953 | | | | 2,979,731 | |
| Fossil, Inc.* (a) | | | 9,009 | | | | 689,549 | |
| NIKE, Inc. "B" | | | 64,625 | | | | 5,672,783 | |
| Ralph Lauren Corp. | | | 11,700 | | | | 1,638,702 | |
| VF Corp. (a) | | | 15,540 | | | | 2,073,813 | |
| | | | | | | | 13,054,578 | |
| Consumer Staples 11.0% | |
| Beverages 2.7% | |
| Beam, Inc. | | | 27,654 | | | | 1,728,099 | |
| Brown-Forman Corp. "B" | | | 17,422 | | | | 1,687,321 | |
| Coca-Cola Co. (a) | | | 398,165 | | | | 31,132,521 | |
| Coca-Cola Enterprises, Inc. (a) | | | 54,224 | | | | 1,520,441 | |
| Constellation Brands, Inc. "A"* | | | 28,500 | | | | 771,210 | |
| Dr. Pepper Snapple Group, Inc. (a) | | | 36,897 | | | | 1,614,244 | |
| Molson Coors Brewing Co. "B" | | | 27,804 | | | | 1,156,924 | |
| Monster Beverage Corp.* | | | 27,091 | | | | 1,928,879 | |
| PepsiCo, Inc. (a) | | | 276,097 | | | | 19,509,014 | |
| | | | | | | | 61,048,653 | |
| Food & Staples Retailing 2.4% | |
| Costco Wholesale Corp. | | | 76,299 | | | | 7,248,405 | |
| CVS Caremark Corp. (a) | | | 226,191 | | | | 10,569,905 | |
| Kroger Co. | | | 98,427 | | | | 2,282,522 | |
| Safeway, Inc. (a) | | | 44,411 | | | | 806,060 | |
| Sysco Corp. (a) | | | 103,882 | | | | 3,096,722 | |
| Wal-Mart Stores, Inc. (a) | | | 304,671 | | | | 21,241,662 | |
| Walgreen Co. (a) | | | 152,108 | | | | 4,499,355 | |
| Whole Foods Market, Inc. (a) | | | 28,874 | | | | 2,752,270 | |
| | | | | | | | 52,496,901 | |
| Food Products 1.7% | |
| Archer-Daniels-Midland Co. | | | 116,026 | | | | 3,425,087 | |
| Campbell Soup Co. (a) | | | 31,970 | | | | 1,067,159 | |
| ConAgra Foods, Inc. | | | 74,478 | | | | 1,931,215 | |
| Dean Foods Co.* (a) | | | 33,400 | | | | 568,802 | |
| General Mills, Inc. | | | 114,728 | | | | 4,421,617 | |
| H.J. Heinz Co. (a) | | | 56,140 | | | | 3,052,893 | |
| Hormel Foods Corp. (a) | | | 25,300 | | | | 769,626 | |
| Kellogg Co. (a) | | | 43,234 | | | | 2,132,733 | |
| Kraft Foods, Inc. "A" | | | 312,629 | | | | 12,073,732 | |
| McCormick & Co., Inc. (a) | | | 24,100 | | | | 1,461,665 | |
| Mead Johnson Nutrition Co. (a) | | | 36,394 | | | | 2,930,081 | |
| The Hershey Co. | | | 26,760 | | | | 1,927,523 | |
| The JM Smucker Co. (a) | | | 19,757 | | | | 1,492,049 | |
| Tyson Foods, Inc. "A" (a) | | | 50,500 | | | | 950,915 | |
| | | | | | | | 38,205,097 | |
| Household Products 2.1% | |
| Clorox Co. (a) | | | 23,432 | | | | 1,697,883 | |
| Colgate-Palmolive Co. (a) | | | 84,102 | | | | 8,755,018 | |
| Kimberly-Clark Corp. | | | 69,009 | | | | 5,780,884 | |
| Procter & Gamble Co. (a) | | | 483,601 | | | | 29,620,561 | |
| | | | | | | | 45,854,346 | |
| Personal Products 0.1% | |
| Avon Products, Inc. | | | 77,597 | | | | 1,257,847 | |
| Estee Lauder Companies, Inc. "A" (a) | | | 39,700 | | | | 2,148,564 | |
| | | | | | | | 3,406,411 | |
| Tobacco 2.0% | |
| Altria Group, Inc. (a) | | | 359,648 | | | | 12,425,838 | |
| Lorillard, Inc. | | | 23,054 | | | | 3,041,975 | |
| Philip Morris International, Inc. | | | 301,175 | | | | 26,280,531 | |
| Reynolds American, Inc. (a) | | | 58,580 | | | | 2,628,485 | |
| | | | | | | | 44,376,829 | |
| Energy 10.6% | |
| Energy Equipment & Services 1.6% | |
| Baker Hughes, Inc. (a) | | | 77,438 | | | | 3,182,702 | |
| Cameron International Corp.* | | | 43,382 | | | | 1,852,845 | |
| Diamond Offshore Drilling, Inc. (a) | | | 12,130 | | | | 717,247 | |
| FMC Technologies, Inc.* (a) | | | 41,812 | | | | 1,640,285 | |
| Halliburton Co. | | | 162,568 | | | | 4,615,306 | |
| Helmerich & Payne, Inc. (a) | | | 19,252 | | | | 837,077 | |
| Nabors Industries Ltd.* | | | 52,938 | | | | 762,307 | |
| National Oilwell Varco, Inc. | | | 74,844 | | | | 4,822,947 | |
| Noble Corp.* (a) | | | 45,187 | | | | 1,469,933 | |
| Rowan Companies PLC "A"* (a) | | | 21,139 | | | | 683,424 | |
| Schlumberger Ltd. | | | 235,779 | | | | 15,304,415 | |
| | | | | | | | 35,888,488 | |
| Oil, Gas & Consumable Fuels 9.0% | |
| Alpha Natural Resources, Inc.* | | | 41,159 | | | | 358,495 | |
| Anadarko Petroleum Corp. | | | 88,148 | | | | 5,835,398 | |
| Apache Corp. | | | 68,543 | | | | 6,024,244 | |
| Cabot Oil & Gas Corp. (a) | | | 37,500 | | | | 1,477,500 | |
| Chesapeake Energy Corp. (a) | | | 116,689 | | | | 2,170,415 | |
| Chevron Corp. (a) | | | 348,750 | | | | 36,793,125 | |
| ConocoPhillips (a) | | | 223,709 | | | | 12,500,859 | |
| CONSOL Energy, Inc. (a) | | | 39,212 | | | | 1,185,771 | |
| Denbury Resources, Inc.* (a) | | | 67,818 | | | | 1,024,730 | |
| Devon Energy Corp. (a) | | | 71,009 | | | | 4,117,812 | |
| EOG Resources, Inc. | | | 47,411 | | | | 4,272,205 | |
| EQT Corp. (a) | | | 26,200 | | | | 1,405,106 | |
| Exxon Mobil Corp. (a) | | | 825,918 | | | | 70,673,803 | |
| Hess Corp. | | | 53,165 | | | | 2,310,019 | |
| Kinder Morgan, Inc. (a) | | | 89,289 | | | | 2,876,892 | |
| Marathon Oil Corp. | | | 124,818 | | | | 3,191,596 | |
| Marathon Petroleum Corp. (a) | | | 60,309 | | | | 2,709,080 | |
| Murphy Oil Corp. (a) | | | 33,918 | | | | 1,705,736 | |
| Newfield Exploration Co.* | | | 23,857 | | | | 699,249 | |
| Noble Energy, Inc. | | | 31,091 | | | | 2,637,139 | |
| Occidental Petroleum Corp. | | | 143,428 | | | | 12,301,820 | |
| Peabody Energy Corp. (a) | | | 47,631 | | | | 1,167,912 | |
| Phillips 66* | | | 110,604 | | | | 3,676,477 | |
| Pioneer Natural Resources Co. (a) | | | 21,800 | | | | 1,922,978 | |
| QEP Resources, Inc. (a) | | | 31,700 | | | | 950,049 | |
| Range Resources Corp. (a) | | | 27,742 | | | | 1,716,398 | |
| Southwestern Energy Co.* (a) | | | 61,136 | | | | 1,952,073 | |
| Spectra Energy Corp. | | | 115,173 | | | | 3,346,927 | |
| Sunoco, Inc. (a) | | | 19,172 | | | | 910,670 | |
| Tesoro Corp.* | | | 24,000 | | | | 599,040 | |
| Valero Energy Corp. | | | 97,801 | | | | 2,361,894 | |
| Williams Companies, Inc. | | | 110,598 | | | | 3,187,434 | |
| WPX Energy, Inc.* (a) | | | 34,674 | | | | 561,025 | |
| | | | | | | | 198,623,871 | |
| Financials 14.1% | |
| Capital Markets 1.8% | |
| Ameriprise Financial, Inc. | | | 38,686 | | | | 2,021,730 | |
| Bank of New York Mellon Corp. | | | 210,047 | | | | 4,610,532 | |
| BlackRock, Inc. | | | 22,732 | | | | 3,860,348 | |
| Charles Schwab Corp. (a) | | | 192,033 | | | | 2,482,987 | |
| E*TRADE Financial Corp.* | | | 45,476 | | | | 365,627 | |
| Federated Investors, Inc. "B" (a) | | | 15,200 | | | | 332,120 | |
| Franklin Resources, Inc. (a) | | | 25,376 | | | | 2,816,482 | |
| Invesco Ltd. | | | 80,150 | | | | 1,811,390 | |
| Legg Mason, Inc. | | | 20,800 | | | | 548,496 | |
| Morgan Stanley | | | 271,167 | | | | 3,956,327 | |
| Northern Trust Corp. (a) | | | 43,102 | | | | 1,983,554 | |
| State Street Corp. | | | 86,268 | | | | 3,851,003 | |
| T. Rowe Price Group, Inc. (a) | | | 45,476 | | | | 2,863,169 | |
| The Goldman Sachs Group, Inc. (a) | | | 86,665 | | | | 8,307,707 | |
| | | | | | | | 39,811,472 | |
| Commercial Banks 2.9% | |
| BB&T Corp. | | | 123,292 | | | | 3,803,558 | |
| Comerica, Inc. | | | 34,968 | | | | 1,073,867 | |
| Fifth Third Bancorp. | | | 161,289 | | | | 2,161,273 | |
| First Horizon National Corp. (a) | | | 46,813 | | | | 404,933 | |
| Huntington Bancshares, Inc. (a) | | | 154,101 | | | | 986,246 | |
| KeyCorp | | | 165,545 | | | | 1,281,318 | |
| M&T Bank Corp. (a) | | | 22,153 | | | | 1,829,173 | |
| PNC Financial Services Group, Inc. | | | 93,064 | | | | 5,687,141 | |
| Regions Financial Corp. | | | 254,468 | | | | 1,717,659 | |
| SunTrust Banks, Inc. | | | 93,162 | | | | 2,257,315 | |
| U.S. Bancorp. (a) | | | 335,055 | | | | 10,775,369 | |
| Wells Fargo & Co. | | | 938,537 | | | | 31,384,677 | |
| Zions Bancorp. (a) | | | 33,656 | | | | 653,600 | |
| | | | | | | | 64,016,129 | |
| Consumer Finance 0.9% | |
| American Express Co. (a) | | | 178,055 | | | | 10,364,581 | |
| Capital One Financial Corp. | | | 102,463 | | | | 5,600,628 | |
| Discover Financial Services | | | 93,833 | | | | 3,244,745 | |
| SLM Corp. | | | 86,290 | | | | 1,355,616 | |
| | | | | | | | 20,565,570 | |
| Diversified Financial Services 2.8% | |
| Bank of America Corp. | | | 1,902,515 | | | | 15,562,573 | |
| Citigroup, Inc. | | | 517,657 | | | | 14,188,978 | |
| CME Group, Inc. "A" (a) | | | 11,773 | | | | 3,156,459 | |
| IntercontinentalExchange, Inc.* | | | 12,648 | | | | 1,719,875 | |
| JPMorgan Chase & Co. | | | 672,050 | | | | 24,012,347 | |
| Leucadia National Corp. (a) | | | 35,200 | | | | 748,704 | |
| Moody's Corp. (a) | | | 34,000 | | | | 1,242,700 | |
| NYSE Euronext (a) | | | 45,100 | | | | 1,153,658 | |
| The NASDAQ OMX Group, Inc. | | | 21,100 | | | | 478,337 | |
| | | | | | | | 62,263,631 | |
| Insurance 3.5% | |
| ACE Ltd. | | | 60,185 | | | | 4,461,514 | |
| Aflac, Inc. | | | 82,427 | | | | 3,510,566 | |
| Allstate Corp. | | | 86,886 | | | | 3,048,830 | |
| American International Group, Inc.* (a) | | | 112,948 | | | | 3,624,501 | |
| Aon PLC | | | 57,224 | | | | 2,676,939 | |
| Assurant, Inc. (a) | | | 14,700 | | | | 512,148 | |
| Berkshire Hathaway, Inc. "B"* (a) | | | 310,561 | | | | 25,879,048 | |
| Chubb Corp. | | | 47,759 | | | | 3,477,810 | |
| Cincinnati Financial Corp. (a) | | | 28,954 | | | | 1,102,279 | |
| Genworth Financial, Inc. "A"* (a) | | | 91,000 | | | | 515,060 | |
| Hartford Financial Services Group, Inc. | | | 76,876 | | | | 1,355,324 | |
| Lincoln National Corp. (a) | | | 50,674 | | | | 1,108,240 | |
| Loews Corp. | | | 53,623 | | | | 2,193,717 | |
| Marsh & McLennan Companies, Inc. | | | 95,853 | | | | 3,089,342 | |
| MetLife, Inc. (a) | | | 187,267 | | | | 5,777,187 | |
| Principal Financial Group, Inc. (a) | | | 53,887 | | | | 1,413,456 | |
| Progressive Corp. (a) | | | 108,014 | | | | 2,249,932 | |
| Prudential Financial, Inc. | | | 83,495 | | | | 4,043,663 | |
| The Travelers Companies, Inc. (a) | | | 68,737 | | | | 4,388,170 | |
| Torchmark Corp. (a) | | | 17,065 | | | | 862,636 | |
| Unum Group | | | 49,894 | | | | 954,472 | |
| XL Group PLC | | | 53,732 | | | | 1,130,521 | |
| | | | | | | | 77,375,355 | |
| Real Estate Investment Trusts 2.1% | |
| American Tower Corp. (REIT) | | | 69,536 | | | | 4,861,262 | |
| Apartment Investment & Management Co. "A" (REIT) (a) | | | 21,686 | | | | 586,172 | |
| AvalonBay Communities, Inc. (REIT) | | | 16,889 | | | | 2,389,456 | |
| Boston Properties, Inc. (REIT) | | | 26,300 | | | | 2,850,131 | |
| Equity Residential (REIT) (a) | | | 53,460 | | | | 3,333,765 | |
| HCP, Inc. (REIT) (a) | | | 74,246 | | | | 3,277,961 | |
| Health Care REIT, Inc. (REIT) (a) | | | 36,872 | | | | 2,149,638 | |
| Host Hotels & Resorts, Inc. (REIT) (a) | | | 125,810 | | | | 1,990,314 | |
| Kimco Realty Corp. (REIT) | | | 74,300 | | | | 1,413,929 | |
| Plum Creek Timber Co., Inc. (REIT) (a) | | | 28,748 | | | | 1,141,296 | |
| Prologis, Inc. (REIT) (a) | | | 81,300 | | | | 2,701,599 | |
| Public Storage (REIT) (a) | | | 25,230 | | | | 3,643,464 | |
| Simon Property Group, Inc. (REIT) (a) | | | 53,695 | | | | 8,358,164 | |
| Ventas, Inc. (REIT) (a) | | | 50,961 | | | | 3,216,658 | |
| Vornado Realty Trust (REIT) | | | 32,610 | | | | 2,738,588 | |
| Weyerhaeuser Co. (REIT) (a) | | | 94,947 | | | | 2,123,015 | |
| | | | | | | | 46,775,412 | |
| Real Estate Management & Development 0.0% | |
| CBRE Group, Inc.* | | | 59,100 | | | | 966,876 | |
| Thrifts & Mortgage Finance 0.1% | |
| Hudson City Bancorp., Inc. (a) | | | 96,668 | | | | 615,775 | |
| People's United Financial, Inc. (a) | | | 62,075 | | | | 720,691 | |
| | | | | | | | 1,336,466 | |
| Health Care 11.7% | |
| Biotechnology 1.4% | |
| Alexion Pharmaceuticals, Inc.* (a) | | | 33,417 | | | | 3,318,308 | |
| Amgen, Inc. | | | 137,470 | | | | 10,040,809 | |
| Biogen Idec, Inc.* (a) | | | 42,298 | | | | 6,106,985 | |
| Celgene Corp.* | | | 77,409 | | | | 4,966,561 | |
| Gilead Sciences, Inc.* | | | 133,753 | | | | 6,858,854 | |
| | | | | | | | 31,291,517 | |
| Health Care Equipment & Supplies 1.7% | |
| Baxter International, Inc. | | | 97,077 | | | | 5,159,643 | |
| Becton, Dickinson & Co. | | | 35,571 | | | | 2,658,932 | |
| Boston Scientific Corp.* (a) | | | 251,443 | | | | 1,425,682 | |
| C.R. Bard, Inc. | | | 14,583 | | | | 1,566,797 | |
| CareFusion Corp.* | | | 40,477 | | | | 1,039,449 | |
| Covidien PLC (a) | | | 85,026 | | | | 4,548,891 | |
| DENTSPLY International, Inc. (a) | | | 25,400 | | | | 960,374 | |
| Edwards Lifesciences Corp.* (a) | | | 20,239 | | | | 2,090,689 | |
| Intuitive Surgical, Inc.* (a) | | | 6,997 | | | | 3,874,869 | |
| Medtronic, Inc. | | | 183,530 | | | | 7,108,117 | |
| St. Jude Medical, Inc. | | | 55,110 | | | | 2,199,440 | |
| Stryker Corp. (a) | | | 57,302 | | | | 3,157,340 | |
| Varian Medical Systems, Inc.* (a) | | | 19,300 | | | | 1,172,861 | |
| Zimmer Holdings, Inc. | | | 31,001 | | | | 1,995,224 | |
| | | | | | | | 38,958,308 | |
| Health Care Providers & Services 2.0% | |
| Aetna, Inc. | | | 61,295 | | | | 2,376,407 | |
| AmerisourceBergen Corp. (a) | | | 44,010 | | | | 1,731,794 | |
| Cardinal Health, Inc. | | | 61,779 | | | | 2,594,718 | |
| CIGNA Corp. | | | 50,513 | | | | 2,222,572 | |
| Coventry Health Care, Inc. (a) | | | 25,358 | | | | 806,131 | |
| DaVita, Inc.* (a) | | | 16,900 | | | | 1,659,749 | |
| Express Scripts Holding Co.* (a) | | | 141,877 | | | | 7,920,993 | |
| Humana, Inc. | | | 29,051 | | | | 2,249,709 | |
| Laboratory Corp. of America Holdings* (a) | | | 17,372 | | | | 1,608,821 | |
| McKesson Corp. | | | 41,467 | | | | 3,887,531 | |
| Patterson Companies, Inc. (a) | | | 16,300 | | | | 561,861 | |
| Quest Diagnostics, Inc. (a) | | | 28,502 | | | | 1,707,270 | |
| Tenet Healthcare Corp.* (a) | | | 69,748 | | | | 365,480 | |
| UnitedHealth Group, Inc. (a) | | | 183,018 | | | | 10,706,553 | |
| WellPoint, Inc. | | | 58,246 | | | | 3,715,512 | |
| | | | | | | | 44,115,101 | |
| Health Care Technology 0.1% | |
| Cerner Corp.* | | | 25,710 | | | | 2,125,189 | |
| Life Sciences Tools & Services 0.4% | |
| Agilent Technologies, Inc. | | | 61,857 | | | | 2,427,269 | |
| Life Technologies Corp.* | | | 31,765 | | | | 1,429,107 | |
| PerkinElmer, Inc. | | | 20,263 | | | | 522,786 | |
| Thermo Fisher Scientific, Inc. | | | 64,020 | | | | 3,323,278 | |
| Waters Corp.* (a) | | | 16,005 | | | | 1,271,917 | |
| | | | | | | | 8,974,357 | |
| Pharmaceuticals 6.1% | |
| Abbott Laboratories (a) | | | 277,800 | | | | 17,909,766 | |
| Allergan, Inc. | | | 54,424 | | | | 5,038,030 | |
| Bristol-Myers Squibb Co. (a) | | | 298,471 | | | | 10,730,032 | |
| Eli Lilly & Co. (a) | | | 180,380 | | | | 7,740,106 | |
| Forest Laboratories, Inc.* | | | 46,347 | | | | 1,621,681 | |
| Hospira, Inc.* (a) | | | 28,322 | | | | 990,704 | |
| Johnson & Johnson (a) | | | 484,961 | | | | 32,763,965 | |
| Merck & Co., Inc. (a) | | | 537,145 | | | | 22,425,804 | |
| Mylan, Inc.* (a) | | | 74,919 | | | | 1,601,019 | |
| Perrigo Co. (a) | | | 16,400 | | | | 1,934,052 | |
| Pfizer, Inc. | | | 1,322,233 | | | | 30,411,359 | |
| Watson Pharmaceuticals, Inc.* | | | 22,257 | | | | 1,646,795 | |
| | | | | | | | 134,813,313 | |
| Industrials 10.2% | |
| Aerospace & Defense 2.5% | |
| Boeing Co. | | | 132,221 | | | | 9,824,020 | |
| General Dynamics Corp. | | | 63,450 | | | | 4,185,162 | |
| Goodrich Corp. | | | 22,238 | | | | 2,822,002 | |
| Honeywell International, Inc. | | | 137,409 | | | | 7,672,918 | |
| L-3 Communications Holdings, Inc. (a) | | | 17,368 | | | | 1,285,406 | |
| Lockheed Martin Corp. (a) | | | 46,821 | | | | 4,077,173 | |
| Northrop Grumman Corp. | | | 44,831 | | | | 2,859,769 | |
| Precision Castparts Corp. | | | 25,528 | | | | 4,199,101 | |
| Raytheon Co. (a) | | | 58,862 | | | | 3,331,001 | |
| Rockwell Collins, Inc. (a) | | | 25,144 | | | | 1,240,856 | |
| Textron, Inc. (a) | | | 50,654 | | | | 1,259,765 | |
| United Technologies Corp. (a) | | | 160,862 | | | | 12,149,907 | |
| | | | | | | | 54,907,080 | |
| Air Freight & Logistics 1.0% | |
| C.H. Robinson Worldwide, Inc. (a) | | | 28,232 | | | | 1,652,419 | |
| Expeditors International of Washington, Inc. | | | 37,300 | | | | 1,445,375 | |
| FedEx Corp. | | | 55,560 | | | | 5,089,851 | |
| United Parcel Service, Inc. "B" (a) | | | 169,422 | | | | 13,343,677 | |
| | | | | | | | 21,531,322 | |
| Airlines 0.1% | |
| Southwest Airlines Co. (a) | | | 135,614 | | | | 1,250,361 | |
| Building Products 0.0% | |
| Masco Corp. (a) | | | 62,305 | | | | 864,170 | |
| Commercial Services & Supplies 0.4% | |
| Avery Dennison Corp. | | | 18,831 | | | | 514,840 | |
| Cintas Corp. | | | 19,766 | | | | 763,165 | |
| Iron Mountain, Inc. | | | 29,600 | | | | 975,616 | |
| Pitney Bowes, Inc. (a) | | | 34,985 | | | | 523,725 | |
| R.R. Donnelley & Sons Co. (a) | | | 30,361 | | | | 357,349 | |
| Republic Services, Inc. | | | 55,199 | | | | 1,460,566 | |
| Stericycle, Inc.* (a) | | | 15,400 | | | | 1,411,718 | |
| Waste Management, Inc. (a) | | | 81,307 | | | | 2,715,654 | |
| | | | | | | | 8,722,633 | |
| Construction & Engineering 0.1% | |
| Fluor Corp. | | | 30,450 | | | | 1,502,403 | |
| Jacobs Engineering Group, Inc.* | | | 23,500 | | | | 889,710 | |
| Quanta Services, Inc.* | | | 35,800 | | | | 861,706 | |
| | | | | | | | 3,253,819 | |
| Electrical Equipment 0.5% | |
| Cooper Industries PLC | | | 27,998 | | | | 1,908,904 | |
| Emerson Electric Co. (a) | | | 129,536 | | | | 6,033,787 | |
| Rockwell Automation, Inc. | | | 25,121 | | | | 1,659,493 | |
| Roper Industries, Inc. | | | 17,466 | | | | 1,721,798 | |
| | | | | | | | 11,323,982 | |
| Industrial Conglomerates 2.7% | |
| 3M Co. (a) | | | 122,678 | | | | 10,991,949 | |
| Danaher Corp. (a) | | | 101,134 | | | | 5,267,059 | |
| General Electric Co. (a) | | | 1,870,194 | | | | 38,974,843 | |
| Tyco International Ltd. | | | 82,032 | | | | 4,335,391 | |
| | | | | | | | 59,569,242 | |
| Machinery 1.8% | |
| Caterpillar, Inc. | | | 115,068 | | | | 9,770,424 | |
| Cummins, Inc. | | | 33,978 | | | | 3,292,808 | |
| Deere & Co. (a) | | | 70,278 | | | | 5,683,382 | |
| Dover Corp. (a) | | | 32,272 | | | | 1,730,102 | |
| Eaton Corp. (a) | | | 59,640 | | | | 2,363,533 | |
| Flowserve Corp. (a) | | | 9,992 | | | | 1,146,582 | |
| Illinois Tool Works, Inc. (a) | | | 84,560 | | | | 4,472,378 | |
| Ingersoll-Rand PLC | | | 52,514 | | | | 2,215,041 | |
| Joy Global, Inc. | | | 18,303 | | | | 1,038,329 | |
| PACCAR, Inc. (a) | | | 62,681 | | | | 2,456,468 | |
| Pall Corp. (a) | | | 20,310 | | | | 1,113,191 | |
| Parker Hannifin Corp. | | | 26,552 | | | | 2,041,318 | |
| Snap-on, Inc. (a) | | | 10,032 | | | | 624,492 | |
| Stanley Black & Decker, Inc. (a) | | | 29,888 | | | | 1,923,592 | |
| Xylem, Inc. (a) | | | 32,005 | | | | 805,566 | |
| | | | | | | | 40,677,206 | |
| Professional Services 0.1% | |
| Dun & Bradstreet Corp. (a) | | | 8,214 | | | | 584,590 | |
| Equifax, Inc. (a) | | | 22,009 | | | | 1,025,620 | |
| Robert Half International, Inc. (a) | | | 25,775 | | | | 736,392 | |
| | | | | | | | 2,346,602 | |
| Road & Rail 0.8% | |
| CSX Corp. (a) | | | 183,290 | | | | 4,098,364 | |
| Norfolk Southern Corp. | | | 57,463 | | | | 4,124,120 | |
| Ryder System, Inc. | | | 9,790 | | | | 352,538 | |
| Union Pacific Corp. (a) | | | 84,064 | | | | 10,029,676 | |
| | | | | | | | 18,604,698 | |
| Trading Companies & Distributors 0.2% | |
| Fastenal Co. (a) | | | 52,000 | | | | 2,096,120 | |
| W.W. Grainger, Inc. (a) | | | 10,709 | | | | 2,047,989 | |
| | | | | | | | 4,144,109 | |
| Information Technology 19.3% | |
| Communications Equipment 1.8% | |
| Cisco Systems, Inc. (a) | | | 945,886 | | | | 16,240,863 | |
| F5 Networks, Inc.* (a) | | | 13,910 | | | | 1,384,880 | |
| Harris Corp. (a) | | | 19,300 | | | | 807,705 | |
| JDS Uniphase Corp.* (a) | | | 43,039 | | | | 473,429 | |
| Juniper Networks, Inc.* | | | 94,334 | | | | 1,538,587 | |
| Motorola Solutions, Inc. (a) | | | 51,698 | | | | 2,487,191 | |
| QUALCOMM, Inc. | | | 302,386 | | | | 16,836,852 | |
| | | | | | | | 39,769,507 | |
| Computers & Peripherals 5.5% | |
| Apple, Inc.* | | | 165,111 | | | | 96,424,824 | |
| Dell, Inc.* | | | 262,678 | | | | 3,288,729 | |
| EMC Corp.* | | | 366,490 | | | | 9,393,139 | |
| Hewlett-Packard Co. | | | 349,175 | | | | 7,021,909 | |
| Lexmark International, Inc. "A" (a) | | | 13,757 | | | | 365,661 | |
| NetApp, Inc.* (a) | | | 64,109 | | | | 2,039,948 | |
| SanDisk Corp.* | | | 43,400 | | | | 1,583,232 | |
| Seagate Technology PLC | | | 66,820 | | | | 1,652,459 | |
| Western Digital Corp.* | | | 40,435 | | | | 1,232,459 | |
| | | | | | | | 123,002,360 | |
| Electronic Equipment, Instruments & Components 0.4% | |
| Amphenol Corp. "A" (a) | | | 28,330 | | | | 1,555,884 | |
| Corning, Inc. | | | 265,997 | | | | 3,439,341 | |
| FLIR Systems, Inc. (a) | | | 26,700 | | | | 520,650 | |
| Jabil Circuit, Inc. | | | 32,289 | | | | 656,435 | |
| Molex, Inc. (a) | | | 24,886 | | | | 595,771 | |
| TE Connectivity Ltd. (a) | | | 75,932 | | | | 2,422,990 | |
| | | | | | | | 9,191,071 | |
| Internet Software & Services 1.8% | |
| Akamai Technologies, Inc.* | | | 30,800 | | | | 977,900 | |
| eBay, Inc.* | | | 202,932 | | | | 8,525,173 | |
| Google, Inc. "A"* | | | 44,940 | | | | 26,068,346 | |
| VeriSign, Inc.* (a) | | | 28,600 | | | | 1,246,102 | |
| Yahoo!, Inc.* (a) | | | 214,333 | | | | 3,392,891 | |
| | | | | | | | 40,210,412 | |
| IT Services 3.8% | |
| Accenture PLC "A" (a) | | | 113,786 | | | | 6,837,401 | |
| Automatic Data Processing, Inc. (a) | | | 86,310 | | | | 4,804,014 | |
| Cognizant Technology Solutions Corp. "A"* | | | 54,222 | | | | 3,253,320 | |
| Computer Sciences Corp. | | | 28,543 | | | | 708,437 | |
| Fidelity National Information Services, Inc. | | | 40,939 | | | | 1,395,201 | |
| Fiserv, Inc.* (a) | | | 24,005 | | | | 1,733,641 | |
| International Business Machines Corp. | | | 203,700 | | | | 39,839,646 | |
| MasterCard, Inc. "A" | | | 18,700 | | | | 8,043,057 | |
| Paychex, Inc. (a) | | | 58,401 | | | | 1,834,375 | |
| SAIC, Inc. (a) | | | 45,632 | | | | 553,060 | |
| Teradata Corp.* | | | 29,508 | | | | 2,124,871 | |
| Total System Services, Inc. | | | 28,359 | | | | 678,631 | |
| Visa, Inc. "A" (a) | | | 87,901 | | | | 10,867,201 | |
| Western Union Co. | | | 109,496 | | | | 1,843,913 | |
| | | | | | | | 84,516,768 | |
| Office Electronics 0.1% | |
| Xerox Corp. | | | 238,526 | | | | 1,877,200 | |
| Semiconductors & Semiconductor Equipment 2.2% | |
| Advanced Micro Devices, Inc.* (a) | | | 103,697 | | | | 594,184 | |
| Altera Corp. | | | 56,944 | | | | 1,926,985 | |
| Analog Devices, Inc. (a) | | | 52,368 | | | | 1,972,703 | |
| Applied Materials, Inc. | | | 226,204 | | | | 2,592,298 | |
| Broadcom Corp. "A"* | | | 86,883 | | | | 2,936,645 | |
| First Solar, Inc.* (a) | | | 10,695 | | | | 161,067 | |
| Intel Corp. (a) | | | 888,409 | | | | 23,676,100 | |
| KLA-Tencor Corp. | | | 29,985 | | | | 1,476,761 | |
| Lam Research Corp.* (a) | | | 36,313 | | | | 1,370,453 | |
| Linear Technology Corp. (a) | | | 41,396 | | | | 1,296,937 | |
| LSI Corp.* | | | 101,955 | | | | 649,453 | |
| Microchip Technology, Inc. (a) | | | 34,800 | | | | 1,151,184 | |
| Micron Technology, Inc.* | | | 172,949 | | | | 1,091,308 | |
| NVIDIA Corp.* (a) | | | 109,843 | | | | 1,518,030 | |
| Teradyne, Inc.* (a) | | | 32,958 | | | | 463,389 | |
| Texas Instruments, Inc. | | | 201,115 | | | | 5,769,989 | |
| Xilinx, Inc. (a) | | | 45,803 | | | | 1,537,607 | |
| | | | | | | | 50,185,093 | |
| Software 3.7% | |
| Adobe Systems, Inc.* (a) | | | 88,044 | | | | 2,849,984 | |
| Autodesk, Inc.* (a) | | | 40,948 | | | | 1,432,771 | |
| BMC Software, Inc.* | | | 27,866 | | | | 1,189,321 | |
| CA, Inc. (a) | | | 62,515 | | | | 1,693,531 | |
| Citrix Systems, Inc.* | | | 32,714 | | | | 2,746,013 | |
| Electronic Arts, Inc.* | | | 56,006 | | | | 691,674 | |
| Intuit, Inc. | | | 52,530 | | | | 3,117,656 | |
| Microsoft Corp. | | | 1,320,060 | | | | 40,380,635 | |
| Oracle Corp. | | | 685,150 | | | | 20,348,955 | |
| Red Hat, Inc.* | | | 34,593 | | | | 1,953,813 | |
| Salesforce.com, Inc.* (a) | | | 24,000 | | | | 3,318,240 | |
| Symantec Corp.* (a) | | | 127,164 | | | | 1,857,866 | |
| | | | | | | | 81,580,459 | |
| Materials 3.3% | |
| Chemicals 2.3% | |
| Air Products & Chemicals, Inc. (a) | | | 37,518 | | | | 3,028,828 | |
| Airgas, Inc. | | | 12,450 | | | | 1,045,925 | |
| CF Industries Holdings, Inc. | | | 11,624 | | | | 2,252,034 | |
| Dow Chemical Co. (a) | | | 211,958 | | | | 6,676,677 | |
| E.I. du Pont de Nemours & Co. (a) | | | 165,345 | | | | 8,361,497 | |
| Eastman Chemical Co. (a) | | | 24,538 | | | | 1,235,979 | |
| Ecolab, Inc. (a) | | | 51,621 | | | | 3,537,587 | |
| FMC Corp. | | | 24,100 | | | | 1,288,868 | |
| International Flavors & Fragrances, Inc. (a) | | | 14,216 | | | | 779,037 | |
| Monsanto Co. | | | 94,166 | | | | 7,795,061 | |
| PPG Industries, Inc. | | | 27,162 | | | | 2,882,431 | |
| Praxair, Inc. (a) | | | 52,754 | | | | 5,735,942 | |
| Sigma-Aldrich Corp. (a) | | | 21,016 | | | | 1,553,713 | |
| The Mosaic Co. | | | 52,275 | | | | 2,862,579 | |
| The Sherwin-Williams Co. (a) | | | 15,305 | | | | 2,025,617 | |
| | | | | | | | 51,061,775 | |
| Construction Materials 0.0% | |
| Vulcan Materials Co. (a) | | | 21,976 | | | | 872,667 | |
| Containers & Packaging 0.1% | |
| Ball Corp. (a) | | | 27,148 | | | | 1,114,425 | |
| Bemis Co., Inc. (a) | | | 17,530 | | | | 549,390 | |
| Owens-Illinois, Inc.* | | | 30,200 | | | | 578,934 | |
| Sealed Air Corp. | | | 35,272 | | | | 544,600 | |
| | | | | | | | 2,787,349 | |
| Metals & Mining 0.7% | |
| Alcoa, Inc. (a) | | | 192,738 | | | | 1,686,457 | |
| Allegheny Technologies, Inc. | | | 18,179 | | | | 579,728 | |
| Cliffs Natural Resources, Inc. (a) | | | 25,533 | | | | 1,258,522 | |
| Freeport-McMoRan Copper & Gold, Inc. | | | 167,136 | | | | 5,694,323 | |
| Newmont Mining Corp. | | | 87,154 | | | | 4,227,841 | |
| Nucor Corp. (a) | | | 55,799 | | | | 2,114,782 | |
| Titanium Metals Corp. (a) | | | 13,400 | | | | 151,554 | |
| United States Steel Corp. (a) | | | 25,138 | | | | 517,843 | |
| | | | | | | | 16,231,050 | |
| Paper & Forest Products 0.2% | |
| International Paper Co. (a) | | | 76,912 | | | | 2,223,526 | |
| MeadWestvaco Corp. | | | 31,078 | | | | 893,493 | |
| | | | | | | | 3,117,019 | |
| Telecommunication Services 3.2% | |
| Diversified Telecommunication Services 3.0% | |
| AT&T, Inc. (a) | | | 1,035,315 | | | | 36,919,333 | |
| CenturyLink, Inc. (a) | | | 109,764 | | | | 4,334,580 | |
| Frontier Communications Corp. (a) | | | 171,410 | | | | 656,500 | |
| Verizon Communications, Inc. (a) | | | 501,809 | | | | 22,300,392 | |
| Windstream Corp. (a) | | | 107,001 | | | | 1,033,630 | |
| | | | | | | | 65,244,435 | |
| Wireless Telecommunication Services 0.2% | |
| Crown Castle International Corp.* (a) | | | 45,411 | | | | 2,663,809 | |
| MetroPCS Communications, Inc.* | | | 57,500 | | | | 347,875 | |
| Sprint Nextel Corp.* (a) | | | 535,314 | | | | 1,745,124 | |
| | | | | | | | 4,756,808 | |
| Utilities 3.6% | |
| Electric Utilities 2.1% | |
| American Electric Power Co., Inc. | | | 85,757 | | | | 3,421,704 | |
| Duke Energy Corp. (a) | | | 236,591 | | | | 5,455,788 | |
| Edison International | | | 57,974 | | | | 2,678,399 | |
| Entergy Corp. | | | 31,004 | | | | 2,104,862 | |
| Exelon Corp. | | | 150,164 | | | | 5,649,170 | |
| FirstEnergy Corp. (a) | | | 74,006 | | | | 3,640,355 | |
| NextEra Energy, Inc. (a) | | | 73,441 | | | | 5,053,475 | |
| Northeast Utilities (a) | | | 55,050 | | | | 2,136,491 | |
| Pepco Holdings, Inc. (a) | | | 41,000 | | | | 802,370 | |
| Pinnacle West Capital Corp. | | | 18,796 | | | | 972,505 | |
| PPL Corp. (a) | | | 102,714 | | | | 2,856,476 | |
| Progress Energy, Inc. | | | 52,050 | | | | 3,131,848 | |
| Southern Co. | | | 153,732 | | | | 7,117,792 | |
| Xcel Energy, Inc. | | | 86,137 | | | | 2,447,152 | |
| | | | | | | | 47,468,387 | |
| Gas Utilities 0.1% | |
| AGL Resources, Inc. | | | 21,773 | | | | 843,704 | |
| ONEOK, Inc. (a) | | | 35,686 | | | | 1,509,874 | |
| | | | | | | | 2,353,578 | |
| Independent Power Producers & Energy Traders 0.1% | |
| AES Corp.* (a) | | | 115,837 | | | | 1,486,189 | |
| NRG Energy, Inc.* | | | 37,844 | | | | 656,972 | |
| | | | | | | | 2,143,161 | |
| Multi-Utilities 1.3% | |
| Ameren Corp. | | | 42,719 | | | | 1,432,795 | |
| CenterPoint Energy, Inc. | | | 77,268 | | | | 1,597,130 | |
| CMS Energy Corp. (a) | | | 46,749 | | | | 1,098,602 | |
| Consolidated Edison, Inc. (a) | | | 51,994 | | | | 3,233,507 | |
| Dominion Resources, Inc. (a) | | | 100,901 | | | | 5,448,654 | |
| DTE Energy Co. | | | 29,603 | | | | 1,756,346 | |
| Integrys Energy Group, Inc. (a) | | | 13,400 | | | | 762,058 | |
| NiSource, Inc. (a) | | | 48,766 | | | | 1,206,959 | |
| PG&E Corp. (a) | | | 74,216 | | | | 3,359,758 | |
| Public Service Enterprise Group, Inc. (a) | | | 89,281 | | | | 2,901,633 | |
| SCANA Corp. (a) | | | 21,167 | | | | 1,012,629 | |
| Sempra Energy (a) | | | 42,496 | | | | 2,927,124 | |
| TECO Energy, Inc. (a) | | | 38,988 | | | | 704,123 | |
| Wisconsin Energy Corp. | | | 40,700 | | | | 1,610,498 | |
| | | | | | | | 29,051,816 | |
Total Common Stocks (Cost $1,580,238,072) | | | | 2,173,900,369 | |
| | | Principal Amount ($) | | | Value ($) | |
| | | | |
| Government & Agency Obligation 0.2% | |
| U.S. Treasury Obligation | |
| U.S. Treasury Bill, 0.135%**, 11/1/2012 (b) (Cost $5,212,595) | | | 5,215,000 | | | | 5,213,102 | |
| | | Shares | | | Value ($) | |
| | | | |
| Securities Lending Collateral 34.0% | |
| Daily Assets Fund Institutional, 0.24% (c) (d) (Cost $755,494,328) | | | 755,494,328 | | | | 755,494,328 | |
| | |
| Cash Equivalents 2.0% | |
| Central Cash Management Fund, 0.14% (c) (Cost $43,299,073) | | | 43,299,073 | | | | 43,299,073 | |
| | | % of Net Assets | | | Value ($) | |
| | | | |
Total Investment Portfolio (Cost $2,384,244,068)+ | | | 133.9 | | | | 2,977,906,872 | |
| Other Assets and Liabilities, Net | | | (33.9 | ) | | | (753,116,213 | ) |
| Net Assets | | | 100.0 | | | | 2,224,790,659 | |
* Non-income producing security.
** Annualized yield at time of purchase; not a coupon rate.
+ The cost for federal income tax purposes was $2,506,407,137. At June 30, 2012, net unrealized appreciation for all securities based on tax cost was $471,499,735. This consisted of aggregate gross unrealized appreciation for all securities in which there was an excess of value over tax cost of $826,722,808 and aggregate gross unrealized depreciation for all securities in which there was an excess of tax cost over value of $355,223,073.
(a) All or a portion of these securities were on loan (see Notes to Financial Statements). The value of all securities loaned at June 30, 2012 amounted to $755,464,961, which is 34.0% of net assets.
(b) At June 30, 2012, this security has been pledged, in whole or in part, to cover initial margin requirements for open futures contracts.
(c) Affiliated fund managed by Deutsche Investment Management Americas Inc. The rate shown is the annualized seven-day yield at period end.
(d) Represents collateral held in connection with securities lending. Income earned by the Fund is net of borrower rebates.
REIT: Real Estate Investment Trust
At June 30, 2012, open futures contracts purchased were as follows:
| Futures | Currency | Expiration Date | | Contracts | | | Notional Value ($) | | | Unrealized Appreciation ($) | |
| S&P 500 Index | USD | 9/20/2012 | | | 140 | | | | 47,474,000 | | | | 1,054,050 | |
| Currency Abbreviation |
| USD United States Dollar |
For information on the Portfolio's policy and additional disclosures regarding futures contracts, please refer to Note B in the accompanying Notes to Financial Statements.
Fair Value Measurements
Various inputs are used in determining the value of the Portfolio's investments. These inputs are summarized in three broad levels. Level 1 includes quoted prices in active markets for identical securities. Level 2 includes other significant observable inputs (including quoted prices for similar securities, interest rates, prepayment speeds and credit risk). Level 3 includes significant unobservable inputs (including the Portfolio's own assumptions in determining the fair value of investments). The inputs or methodology used for valuing securities are not necessarily an indication of the risk associated with investing in those securities.
The following is a summary of the inputs used as of June 30, 2012 in valuing the Portfolio's investments. For information on the Portfolio's policy regarding the valuation of investments, please refer to the Security Valuation section of Note A in the accompanying Notes to Financial Statements.
| Assets | | Level 1 | | | Level 2 | | | Level 3 | | | Total | |
| | |
| Common Stocks (e) | | $ | 2,173,900,369 | | | $ | — | | | $ | — | | | $ | 2,173,900,369 | |
| Government & Agency Obligation | | | — | | | | 5,213,102 | | | | — | | | | 5,213,102 | |
| Short-Term Investments (e) | | | 798,793,401 | | | | — | | | | — | | | | 798,793,401 | |
| Derivatives (f) | | | 1,054,050 | | | | — | | | | — | | | | 1,054,050 | |
| Total | | $ | 2,973,747,820 | | | $ | 5,213,102 | | | $ | — | | | $ | 2,978,960,922 | |
There have been no transfers between Level 1 and Level 2 fair value measurements during the period ended June 30, 2012.
(e) See Investment Portfolio for additional detailed categorizations.
(f) Derivatives include unrealized appreciation (depreciation) on futures contracts.
The accompanying notes are an integral part of the financial statements.
Statement of Assets and Liabilities | as of June 30, 2012 (Unaudited) | |
| Assets | |
Investments: Investments in non-affiliated securities, at value (cost $1,585,450,667) — including $755,464,961 of securities loaned | | $ | 2,179,113,471 | |
| Investment in Daily Assets Fund Institutional (cost $755,494,328)* | | | 755,494,328 | |
| Investment in Central Cash Management Fund (cost $43,299,073) | | | 43,299,073 | |
| Total investments in securities, at value (cost $2,384,244,068) | | | 2,977,906,872 | |
| Cash | | | 322,684 | |
| Receivable for investments sold | | | 1,933,628 | |
| Dividends receivable | | | 2,539,394 | |
| Interest receivable | | | 67,709 | |
| Receivable for variation margin on futures contracts | | | 1,226,083 | |
| Other assets | | | 23,926 | |
| Total assets | | | 2,984,020,296 | |
| Liabilities | |
| Payable upon return of securities loaned | | | 755,494,328 | |
| Payable for investments purchased | | | 3,510,847 | |
| Accrued management fee | | | 89,253 | |
| Accrued Trustees' fees | | | 7,926 | |
| Other accrued expenses and payables | | | 127,283 | |
| Total liabilities | | | 759,229,637 | |
| Net assets | | $ | 2,224,790,659 | |
* Represents collateral on securities loaned.
The accompanying notes are an integral part of the financial statements.
| for the six months ended June 30, 2012 (Unaudited) | |
| Investment Income | |
Income: Dividends (net of foreign taxes withheld of $33,037) | | $ | 23,264,424 | |
| Interest | | | 1,528 | |
| Income distributions — Central Cash Management Fund | | | 17,225 | |
| Securities lending income, including income from Daily Assets Fund Institutional, net of borrower rebates | | | 467,476 | |
| Total income | | | 23,750,653 | |
Expenses: Management fee | | | 546,824 | |
| Administration fee | | | 328,095 | |
| Custodian fee | | | 21,054 | |
| Professional fees | | | 50,809 | |
| Reports to shareholders | | | 3,944 | |
| Trustees' fees and expenses | | | 37,763 | |
| Insurance | | | 24,265 | |
| Other | | | 18,362 | |
| Total expenses | | | 1,031,116 | |
| Net investment income (loss) | | | 22,719,537 | |
| Realized and Unrealized Gain (Loss) | |
Net realized gain (loss) from: Investments | | | 132,562,029 | |
| Futures | | | 4,854,328 | |
| | | | 137,416,357 | |
Change in net unrealized appreciation (depreciation) on: Investments | | | 24,916,451 | |
| Futures | | | 416,978 | |
| | | | 25,333,429 | |
| Net gain (loss) | | | 162,749,786 | |
| Net increase (decrease) in net assets resulting from operations | | $ | 185,469,323 | |
The accompanying notes are an integral part of the financial statements.
Statement of Changes in Net Assets | Increase (Decrease) in Net Assets | | Six Months Ended June 30, 2012 (Unaudited) | | | Year Ended December 31, 2011 | |
Operations: Net investment income (loss) | | $ | 22,719,537 | | | $ | 47,668,506 | |
| Net realized gain (loss) | | | 137,416,357 | | | | 203,155,872 | |
| Change in net unrealized appreciation (depreciation) | | | 25,333,429 | | | | (209,311,273 | ) |
| Net increase (decrease) in net assets resulting from operations | | | 185,469,323 | | | | 41,513,105 | |
Capital transactions in shares of beneficial interest: Proceeds from capital invested | | | 485,461,996 | | | | 364,467,893 | |
| Value of capital withdrawn | | | (547,177,636 | ) | | | (829,346,703 | ) |
| Net increase (decrease) in net assets from capital transactions in shares of beneficial interest | | | (61,715,640 | ) | | | (464,878,810 | ) |
| Increase (decrease) in net assets | | | 123,753,683 | | | | (423,365,705 | ) |
| Net assets at beginning of period | | | 2,101,036,976 | | | | 2,524,402,681 | |
| Net assets at end of period | | $ | 2,224,790,659 | | | $ | 2,101,036,976 | |
The accompanying notes are an integral part of the financial statements.
| | | | | | Years Ended December 31, | |
| | | Six Months Ended 6/30/12 (Unaudited) | | | 2011 | | | 2010 | | | 2009 | | | 2008 | | | 2007 | |
| Ratios to Average Net Assets and Supplemental Data | |
| Net assets, end of period ($ millions) | | | 2,225 | | | | 2,101 | | | | 2,524 | | | | 2,479 | | | | 2,153 | | | | 3,409 | |
| Ratio of expenses before expense reductions (%) | | | .09 | * | | | .10 | | | | .10 | | | | .09 | | | | .10 | | | | .09 | |
| Ratio of expenses after expense reductions (%) | | | .09 | * | | | .10 | | | | .06 | | | | .05 | | | | .05 | | | | .05 | |
| Ratio of net investment income (%) | | | 2.08 | * | | | 1.99 | | | | 2.03 | | | | 2.38 | | | | 2.29 | | | | 1.91 | |
| Portfolio turnover rate (%) | | | 2 | ** | | | 3 | | | | 5 | | | | 9 | c | | | 6 | | | | 5 | |
Total investment return (%)b | | | 9.55 | ** | | | 2.09 | | | | 15.12 | a | | | 26.54 | a | | | (37.01 | )a | | | 5.54 | a |
a Total investment return would have been lower had certain expenses not been reduced. b Total investment return for the Portfolio was derived from the performance of the Institutional Class of DWS Equity 500 Index Fund. c Excludes portfolio securities delivered as a result of processing redemption in-kind transactions. * Annualized ** Not annualized | |
Notes to Financial Statements (Unaudited)
A. Organization and Significant Accounting Policies
DWS Equity 500 Index Portfolio (the "Portfolio") is registered under the Investment Company Act of 1940, as amended (the "1940 Act"), as a diversified open-end management investment company organized as a New York trust.
The Portfolio is a master fund; a master/feeder fund structure is one in which a fund (a "feeder fund"), instead of investing directly in a portfolio of securities, invests most or all of its investment assets in a separate registered investment company (the "master fund") with substantially the same investment objective and policies as the feeder fund. Such a structure permits the pooling of assets of two or more feeder funds, preserving separate identities or distribution channels at the feeder fund level. The Portfolio may have several feeder funds, including affiliated DWS feeder funds, with a significant ownership percentage of the Portfolio's net assets. Investment activities of these feeder funds could have a material impact on the Portfolio. As of June 30, 2012, DWS S&P 500 Index Fund and DWS Equity 500 Index Fund owned approximately 32% and 68%, respectively, of the Portfolio.
The Portfolio's financial statements are prepared in accordance with accounting principles generally accepted in the United States of America which require the use of management estimates. Actual results could differ from those estimates. The policies described below are followed consistently by the Portfolio in the preparation of its financial statements.
Security Valuation. Investments are stated at value determined as of the close of regular trading on the New York Stock Exchange on each day the exchange is open for trading.
Various inputs are used in determining the value of the Portfolio's investments. These inputs are summarized in three broad levels. Level 1 includes quoted prices in active markets for identical securities. Level 2 includes other significant observable inputs (including quoted prices for similar securities, interest rates, prepayment speeds, and credit risk). Level 3 includes significant unobservable inputs (including the Portfolio's own assumptions in determining the fair value of investments). The inputs or methodology used for valuing securities are not necessarily an indication of the risk associated with investing in those securities.
Equity securities are valued at the most recent sale price or official closing price reported on the exchange (U.S. or foreign) or over-the-counter market on which they trade and are categorized as Level 1 securities. Securities for which no sales are reported are valued at the calculated mean between the most recent bid and asked quotations on the relevant market or, if a mean cannot be determined, at the most recent bid quotation.
Money market instruments purchased with an original or remaining maturity of sixty days or less, maturing at par, are valued at amortized cost, which approximates value, and are categorized as Level 2. Investments in open-end investment companies are valued at their net asset value each business day and are categorized as Level 1.
Futures contracts are generally valued at the settlement prices established each day on the exchange on which they are traded and are categorized as Level 1.
Securities and other assets for which market quotations are not readily available or for which the above valuation procedures are deemed not to reflect fair value are valued in a manner that is intended to reflect their fair value as determined in accordance with procedures approved by the Board and are generally categorized as Level 3. In accordance with the Portfolio's valuation procedures, factors used in determining value may include, but are not limited to, the type of the security; the size of the holding; the initial cost of the security; the existence of any contractual restrictions on the security's disposition; the price and extent of public trading in similar securities of the issuer or of comparable companies; quotations or evaluated prices from broker-dealers and/or pricing services; information obtained from the issuer, analysts, and/or the appropriate stock exchange (for exchange-traded securities); an analysis of the company's or issuer's financial statements; an evaluation of the forces that influence the issuer and the market(s) in which the security is purchased and sold and with respect to debt securities; the maturity, coupon, creditworthiness, currency denomination and the movement of the market in which the security is normally traded. The value determined under these procedures may differ from published values for the same securities.
Securities Lending. The Portfolio lends securities to certain financial institutions. The Portfolio retains beneficial ownership of the securities it has loaned and continues to receive interest and dividends paid by the issuer of securities and to participate in any changes in their market value. The Portfolio requires the borrowers of the securities to maintain collateral with the Portfolio consisting of either cash or liquid, unencumbered assets having a value at least equal to the value of the securities loaned. When the collateral falls below specified amounts, the lending agent will use its best efforts to obtain additional collateral on the next business day to meet required amounts under the security lending agreement. The Portfolio may invest the cash collateral into a joint trading account in an affiliated money market fund pursuant to Exemptive Orders issued by the SEC. The Portfolio receives compensation for lending its securities either in the form of fees or by earning interest on invested cash collateral net of borrower rebates and fees paid to a lending agent. Either the Portfolio or the borrower may terminate the loan. There may be risks of delay and costs in recovery of securities or even loss of rights in the collateral should the borrower of the securities fail financially. The Portfolio is also subject to all investment risks associated with the reinvestment of any cash collateral received, including, but not limited to, interest rate, credit and liquidity risk associated with such investments.
Federal Income Taxes. The Portfolio is considered a partnership under the Internal Revenue Code, as amended. Therefore, no federal income tax provision is necessary.
It is intended that the Portfolio's assets, income and distributions will be managed in such a way that an investor in the Portfolio will be able to satisfy the requirements of Subchapter M of the Code, assuming that the investor invested all of its assets in the Portfolio.
The Portfolio has reviewed the tax positions for the open tax years as of December 31, 2011 and has determined that no provision for income tax is required in the Portfolio's financial statements. The Portfolio's federal tax returns for the prior three fiscal years remain open subject to examination by the Internal Revenue Service.
Contingencies. In the normal course of business, the Portfolio may enter into contracts with service providers that contain general indemnification clauses. The Portfolio's maximum exposure under these arrangements is unknown as this would involve future claims that may be made against the Portfolio that have not yet been made. However, based on experience, the Portfolio expects the risk of loss to be remote.
Other. Investment transactions are accounted for on a trade date plus one basis for daily net asset value calculations. However, for financial reporting purposes, investment transactions are reported on trade date. Interest income is recorded on the accrual basis. Dividend income is recorded on the ex-dividend date. Realized gains and losses from investment transactions are recorded on an identified cost basis and may include proceeds from litigation.
The Portfolio makes a daily allocation of its net investment income and realized and unrealized gains and losses from securities, futures and foreign currency transactions to its investors in proportion to their investment in the Portfolio.
B. Derivative Instruments
Futures Contracts. A futures contract is an agreement between a buyer or seller and an established futures exchange or its clearinghouse in which the buyer or seller agrees to take or make a delivery of a specific amount of a financial instrument at a specified price on a specific date (settlement date). For the six months ended June 30, 2012, the Portfolio invested in futures contracts to keep cash on hand to meet shareholder redemptions or other needs while maintaining exposure to the stock market.
Upon entering into a futures contract, the Portfolio is required to deposit with a financial intermediary cash or securities ("initial margin") in an amount equal to a certain percentage of the face value indicated in the futures contract. Subsequent payments ("variation margin") are made or received by the Portfolio dependent upon the daily fluctuations in the value and are recorded for financial reporting purposes as unrealized gains or losses by the Portfolio. Gains or losses are realized when the contract expires or is closed. Since all futures contracts are exchange traded, counterparty risk is minimized as the exchange's clearinghouse acts as the counterparty, and guarantees the futures against default.
Certain risks may arise upon entering into futures contracts, including the risk that an illiquid market will limit the Portfolio's ability to close out a futures contract prior to the settlement date and the risk that the futures contract is not well correlated with the security, index or currency to which it relates. Risk of loss may exceed amounts disclosed in the Statement of Assets and Liabilities.
A summary of the open futures contracts as of June 30, 2012 is included in a table following the Portfolio's Investment Portfolio. For the six months ended June 30, 2012, the investment in futures contracts purchased had a total notional value generally indicative of a range from approximately $44,154,000 to $55,426,000.
The following table summarizes the value of the Portfolio's derivative instruments held as of June 30, 2012 presented by primary underlying risk exposure:
| Asset Derivative | | Futures Contracts | |
| Equity Contracts (a) | | $ | 1,054,050 | |
(a) Includes cumulative appreciation of futures contracts as disclosed in the Investment Portfolio. Unsettled variation margin is disclosed separately within the Statement of Assets and Liabilities.
Additionally, the amount of unrealized and realized gains and losses on derivative instruments recognized in Portfolio earnings during the six months ended June 30, 2012 and the related location in the accompanying Statement of Operations is summarized in the following tables by primary underlying risk exposure:
| Realized Gain (Loss) | | Futures Contracts | |
| Equity Contracts (a) | | $ | 4,854,328 | |
The above derivative is located in the following Statement of Operations account:
(a) Net realized gain (loss) from futures
| Change in Net Unrealized Appreciation (Depreciation) | | Futures Contracts | |
| Equity Contracts (a) | | $ | 416,978 | |
The above derivative is located in the following Statement of Operations account:
(a) Change in net realized appreciation (depreciation) on futures
C. Purchases and Sales of Securities
During the six months ended June 30, 2012, purchases and sales of investment securities (excluding short-term investments) aggregated $50,191,667 and $284,245,507, respectively.
D. Related Parties
Deutsche Investment Management Americas Inc. ("DIMA" or the "Advisor"), an indirect, wholly owned subsidiary of Deutsche Bank AG, serves as the investment manager to the Portfolio.
Management Agreement. Under its Investment Management Agreement with the Portfolio, the Advisor determines the securities, instruments and other contracts relating to investments to be purchased, sold or entered into by the Portfolio or delegates such responsibility to the Portfolio's sub-advisor. Northern Trust Investments, Inc. ("NTI") serves as sub-advisor to the Portfolio and is paid by the Advisor for its services. NTI is responsible for the day-to-day management of the Portfolio.
The investment management fee payable under the Investment Management Agreement is equal to an annualized rate of 0.05% of the Portfolio's average daily net assets, computed and accrued daily and payable monthly.
Administration Fee. Pursuant to an Administrative Services Agreement, DIMA provides most administrative services to the Portfolio. For all services provided under the Administrative Services Agreement, the Portfolio pays the Advisor an annual fee ("Administration Fee") of 0.03% of the Portfolio's average daily net assets, computed and accrued daily and payable monthly. For the six months ended June 30, 2012, the Administration Fee was $328,095, of which $53,552 is unpaid.
Filing Service Fee. Under an agreement with DIMA, DIMA is compensated for providing certain regulatory filing services to the Portfolio. For the six months ended June 30, 2012, the amount charged to the Portfolio by DIMA included in the Statement of Operations under "reports to shareholders" aggregated $1,942, of which $1,676 is unpaid.
Trustees' Fees and Expenses. The Portfolio paid retainer fees to each Trustee not affiliated with the Advisor, plus specified amounts to the Board Chairperson and to each committee Chairperson.
Affiliated Cash Management Vehicle. The Portfolio may invest uninvested cash balances in Central Cash Management Fund, which is managed by the Advisor. The Portfolio indirectly bears its proportionate share of the expenses of Central Cash Management Fund. Central Cash Management Fund does not pay the Advisor an investment management fee. Central Cash Management Fund seeks a high level of current income consistent with liquidity and the preservation of capital.
E. Line of Credit
The Portfolio and other affiliated funds (the "Participants") share in a $375 million revolving credit facility provided by a syndication of banks. The Portfolio may borrow for temporary or emergency purposes, including the meeting of redemption requests that otherwise might require the untimely disposition of securities. The Participants are charged an annual commitment fee which is allocated based on net assets, among each of the Participants. Interest is calculated at a rate per annum equal to the sum of the Federal Funds Rate plus 1.25 percent plus if LIBOR exceeds the Federal Funds Rate the amount of such excess. The Portfolio may borrow up to a maximum of 33 percent of its net assets under the agreement. The Fund had no outstanding loans at June 30, 2012.
Summary of Management Fee Evaluation by Independent Fee Consultant
September 26, 2011
Pursuant to an Order entered into by Deutsche Investment Management Americas and affiliates (collectively, "DeAM") with the Attorney General of New York, I, Thomas H. Mack, have been appointed the Independent Fee Consultant for the DWS Funds (formerly the DWS Scudder Funds). My duties include preparing an annual written evaluation of the management fees DeAM charges the Funds, considering among other factors the management fees charged by other mutual fund companies for like services, management fees DeAM charges other clients for like services, DeAM's costs of supplying services under the management agreements and related profit margins, possible economies of scale if a Fund grows larger, and the nature and quality of DeAM's services, including fund performance. This report summarizes my evaluation for 2011, including my qualifications, the evaluation process for each of the DWS Funds, consideration of certain complex-level factors, and my conclusions. I served in substantially the same capacity in 2007, 2008, 2009 and 2010.
Qualifications
For more than 35 years I have served in various professional capacities within the investment management business. I have held investment analysis and advisory positions, including securities analyst, portfolio strategist and director of investment policy with a large investment firm. I have also performed business management functions, including business development, financial management and marketing research and analysis.
Since 1991, I have been an independent consultant within the asset management industry. I have provided services to over 125 client organizations, including investment managers, mutual fund boards, product distributors and related organizations. Over the past ten years I have completed a number of assignments for mutual fund boards, specifically including assisting boards with management contract renewal.
I hold a Master of Business Administration degree, with highest honors, from Harvard University and Master of Science and Bachelor of Science (highest honors) degrees from the University of California at Berkeley. I am an independent director and audit committee financial expert for two closed-end mutual funds and have served in various leadership and financial oversight capacities with non-profit organizations.
Evaluation of Fees for each DWS Fund
My work focused primarily on evaluating, fund-by-fund, the fees charged to each of the 109 mutual fund portfolios in the DWS Fund family. For each Fund, I considered each of the key factors mentioned above, as well as any other relevant information. In doing so I worked closely with the Funds' Independent Directors in their annual contract renewal process, as well as in their approval of contracts for several new funds (documented separately).
In evaluating each Fund's fees, I reviewed comprehensive materials provided by or on behalf of DeAM, including expense information prepared by Lipper Analytical, comparative performance information, profitability data, manager histories, and other materials. I also accessed certain additional information from the Lipper and Morningstar databases and drew on my industry knowledge and experience.
To facilitate evaluating this considerable body of information, I prepared for each Fund a document summarizing the key data elements in each area as well as additional analytics discussed below. This made it possible to consider each key data element in the context of the others.
In the course of contract renewal, DeAM agreed to implement a number of fee and expense adjustments requested by the Independent Directors which will favorably impact future fees and expenses, and my evaluation includes the effects of these changes.
Fees and Expenses Compared with Other Funds
The competitive fee and expense evaluation for each fund focused on two primary comparisons:
The Fund's contractual management fee (the advisory fee plus the administration fee where applicable) compared with those of a group of typically 12-15 funds in the same Lipper investment category (e.g. Large Capitalization Growth) having similar distribution arrangements and being of similar size.
The Fund's total expenses compared with a broader universe of funds from the same Lipper investment category and having similar distribution arrangements.
These two comparisons provide a view of not only the level of the fee compared with funds of similar scale but also the total expense the Fund bears for all the services it receives, in comparison with the investment choices available in the Fund's investment category and distribution channel. The principal figure-of-merit used in these comparisons was the subject Fund's percentile ranking against peers.
DeAM's Fees for Similar Services to Others
DeAM provided management fee schedules for all of its US domiciled fund and non-fund investment management accounts in any of the investment categories where there is a DWS Fund. These similar products included the other DWS Funds, non-fund pooled accounts, institutional accounts and sub-advisory accounts. Using this information, I calculated for each Fund the fee that would be charged to each similar product, at the subject Fund's asset level.
Evaluating information regarding non-fund products is difficult because there are varying levels of services required for different types of accounts, with mutual funds generally requiring considerably more regulatory and administrative types of service as well as having more frequent cash flows than other types of accounts. Also, while mutual fund fees for similar fund products can be expected to be similar, there will be some differences due to different pricing conditions in different distribution channels (e.g. retail funds versus those used in variable insurance products), differences in underlying investment processes and other factors.
Costs and Profit Margins
DeAM provided a detailed profitability analysis for each Fund. After making some adjustments so that the presentation would be more comparable to the available industry figures, I reviewed profit margins from investment management alone, from investment management plus other fund services (excluding distribution) provided to the Funds by DeAM (principally shareholder services), and DeAM profits from all sources, including distribution. A later section comments on overall profitability.
Economies of Scale
Economies of scale — an expected decline in management cost per dollar of fund assets as fund assets grow — are very rarely quantified and documented because of inherent difficulties in collecting and analyzing relevant data. However, in virtually every investment category that I reviewed, larger funds tend to have lower fees and lower total expenses than smaller funds. To see how each DWS Fund compares with this industry observation, I reviewed:
The trend in Fund assets over the last five years and the accompanying trend in total expenses. This shows if the Fund has grown and, if so, whether total expense (management fees as well as other expenses) have declined as a percent of assets.
Whether the Fund has break-points in its management fee schedule, the extent of the fee reduction built into the schedule and the asset levels where the breaks take effect, and in the case of a sub-advised Fund how the Fund's break-points compare with those of the sub-advisory fee schedule.
How the Fund's contractual fee schedule compares with trends in the industry data. To accomplish this, I constructed a chart showing how actual latest-fiscal-year contractual fees of the Fund and of other similar funds relate to average fund assets, with the subject Fund's contractual fee schedule superimposed.
Quality of Service — Performance
The quality-of-service evaluation focused on investment performance, which is the principal result of the investment management service. Each Fund's performance was reviewed over the past 1, 3, 5 and 10 years, as applicable, and compared with that of other funds in the same investment category and with a suitable market index.
In addition, I calculated and reviewed risk-adjusted returns relative to an index of similar mutual funds' returns and a suitable market index. The risk-adjusted returns analysis provides a way of determining the extent to which the Fund's return comparisons are mainly the product of investment value-added (or lack thereof) or alternatively taking considerably more or less risk than is typical in its investment category.
I also received and considered the history of portfolio manager changes for each Fund, as this provided an important context for evaluating the performance results.
Complex-Level Considerations
While this evaluation was conducted mainly at the individual fund level, there are some issues relating to the reasonableness of fees that can alternatively be considered across the whole fund complex:
I reviewed DeAM's profitability analysis for all DWS Funds, with a view toward determining if the allocation procedures used were reasonable and how profit levels compared with public data for other investment managers.
I considered whether DeAM and affiliates receive any significant ancillary or "fall-out" benefits that should be considered in interpreting the direct profitability results. These would be situations where serving as the investment manager of the Funds is beneficial to another part of the Deutsche Bank organization.
I considered how aggregated DWS Fund expenses had varied over the years, by asset class and in the context of trends in asset levels.
I reviewed the structure of the DeAM organization, trends in staffing levels, and information on compensation of investment management and other professionals compared with industry data.
Findings
Based on the process and analysis discussed above, which included reviewing a wide range of information from management and external data sources and considering among other factors the fees DeAM charges other clients, the fees charged by other fund managers, DeAM's costs and profits associated with managing the Funds, economies of scale, possible fall-out benefits, and the nature and quality of services provided, in my opinion the management fees charged the DWS Funds are reasonable.
Thomas H. Mack
President, Thomas H. Mack & Co., Inc.
Account Management Resources | |
| Automated Information Line | | The automated telephone system allows you to access personalized account information and obtain information on other DWS funds using either your voice or your telephone keypad. Certain account types within Classes A, B, C and S also have the ability to purchase, exchange or redeem shares using this system. For more information, contact your financial advisor. You may also access our automated telephone system or speak with a DWS Investments representative by calling the appropriate number below: For shareholders of Classes A, B and C: (800) 621-1048 For shareholders of Class S: (800) 728-3337 |
| Web Site | | www.dws-investments.com View your account transactions and balances, trade shares, monitor your asset allocation, and change your address, 24 hours a day. Obtain prospectuses and applications, blank forms, interactive worksheets, news about DWS funds, subscription to fund updates by e-mail, retirement planning information, and more. |
| Written Correspondence | | DWS Investments PO Box 219151 Kansas City, MO 64121-9151 |
| Proxy Voting | | The fund's policies and procedures for voting proxies for portfolio securities and information about how the fund voted proxies related to its portfolio securities during the 12-month period ended June 30 are available on our Web site — www.dws-investments.com (click on "proxy voting"at the bottom of the page) — or on the SEC's Web site — www.sec.gov. To obtain a written copy of the fund's policies and procedures without charge, upon request, call us toll free at (800) 621-1048. |
| Portfolio Holdings | | Following the fund's fiscal first and third quarter-end, a complete portfolio holdings listing is filed with the SEC on Form N-Q. This form will be available on the SEC's Web site at www.sec.gov, and it also may be reviewed and copied at the SEC's Public Reference Room in Washington, D.C. Information on the operation of the SEC's Public Reference Room may be obtained by calling (800) SEC-0330. The fund's portfolio holdings are also posted on www.dws-investments.com from time to time. Please see the fund's current prospectus for more information. |
| Principal Underwriter | | If you have questions, comments or complaints, contact: DWS Investments Distributors, Inc. 222 South Riverside Plaza Chicago, IL 60606-5808 (800) 621-1148 |
| Investment Management | | Deutsche Investment Management Americas Inc. ("DIMA" or the "Advisor"), which is part of Deutsche Asset Management, is the investment advisor for the fund. DIMA and its predecessors have more than 80 years of experience managing mutual funds and DIMA provides a full range of investment advisory services to both institutional and retail clients. DIMA is an indirect, wholly owned subsidiary of Deutsche Bank AG. Deutsche Bank AG is a major global banking institution engaged in a wide variety of financial services, including investment management, retail, private and commercial banking, investment banking and insurance. DWS Investments is the retail brand name in the U.S. for the asset management activities of Deutsche Bank AG and DIMA. As such, DWS is committed to delivering the investing expertise, insight and resources of this global investment platform to American investors. |
| | | Class A | Class B | Class C | Class S |
| Nasdaq Symbol | | SXPAX | SXPBX | SXPCX | SCPIX |
| CUSIP Number | | 23338J 749 | 23338J 731 | 23338J 723 | 23338J 699 |
| Fund Number | | 1001 | 1201 | 1301 | 2301 |
| FACTS | | What Does DWS Investments Do With Your Personal Information? |
| Why? | | Financial companies choose how they share your personal information. Federal law gives consumers the right to limit some but not all sharing. Federal law also requires us to tell you how we collect, share and protect your personal information. Please read this notice carefully to understand what we do. |
| What? | | The types of personal information we collect and share can include: • Social Security number • Account balances • Purchase and transaction history • Bank account information • Contact information such as mailing address, e-mail address and telephone number |
| How? | | All financial companies need to share customers' personal information to run their everyday business. In the section below, we list the reasons financial companies can share their customers' personal information, the reasons DWS Investments chooses to share and whether you can limit this sharing. |
| Reasons we can share your personal information | Does DWS Investments share? | Can you limit this sharing? |
For our everyday business purposes — such as to process your transactions, maintain your account(s), respond to court orders or legal investigations | Yes | No |
For our marketing purposes — to offer our products and services to you | Yes | No |
| For joint marketing with other financial companies | No | We do not share |
For our affiliates' everyday business purposes — information about your transactions and experiences | No | We do not share |
For our affiliates' everyday business purposes — information about your creditworthiness | No | We do not share |
| For non-affiliates to market to you | No | We do not share |
| Questions? | Call (800) 621-1048 or e-mail us at dws-investments.info@dws.com |
| Who we are |
| Who is providing this notice? | | DWS Investments Distributors, Inc.; Deutsche Investment Management Americas Inc.; DeAM Investor Services, Inc.; DWS Trust Company; the DWS Funds |
| What we do |
| How does DWS Investments protect my personal information? | | To protect your personal information from unauthorized access and use, we use security measures that comply with federal law. These measures include computer safeguards and secured files and buildings. |
| How does DWS Investments collect my personal information? | | We collect your personal information, for example. When you: • open an account • give us your contact information • provide bank account information for ACH or wire transactions • tell us where to send money • seek advice about your investments |
| Why can't I limit all sharing? | | Federal law gives you the right to limit only • sharing for affiliates' everyday business purposes — information about your creditworthiness • affiliates from using your information to market to you • sharing for nonaffiliates to market to you State laws and individual companies may give you additional rights to limit sharing. |
| Definitions |
| Affiliates | | Companies related by common ownership or control. They can be financial or non-financial companies. Our affiliates include financial companies with the DWS or Deutsche Bank ("DB") name, such as DB AG Frankfurt and DB Alex Brown. |
| Non-affiliates | | Companies not related by common ownership or control. They can be financial and non-financial companies. Non-affiliates we share with include account service providers, service quality monitoring services, mailing service providers and verification services to help in the fight against money laundering and fraud. |
| Joint marketing | | A formal agreement between non-affiliated financial companies that together market financial products or services to you. DWS Investments does not jointly market. |
Notes
Notes
Notes
Notes