UNITED STATES
SECURITIES AND EXCHANGE COMMISSION
WASHINGTON, D. C. 20549
FORM N-CSR
Investment Company Act file number: 811-06698
Deutsche Equity 500 Index Portfolio
(Exact Name of Registrant as Specified in Charter)
345 Park Avenue
New York, NY 10154-0004
(Address of Principal Executive Offices) (Zip Code)
Registrant’s Telephone Number, including Area Code: (212) 250-3220
Paul Schubert
60 Wall Street
New York, NY 10005
(Name and Address of Agent for Service)
| Date of fiscal year end: | 12/31 |
| Date of reporting period: | 12/31/2016 |
| ITEM 1. | REPORT TO STOCKHOLDERS |

December 31, 2016
Annual Report
to Shareholders
Deutsche Equity 500 Index Fund

Contents
Deutsche Equity 500 3 Letter to Shareholders 5 Portfolio Management Review 11 Performance Summary 13 Statement of Assets and Liabilities 14 Statement of Operations 16 Statements of Changes in Net Assets 17 Financial Highlights 19 Notes to Financial Statements 24 Report of Independent Registered Public Accounting Firm 25 Information About Your Fund's Expenses 26 Tax Information Deutsche Equity 500 Index Portfolio 28 Investment Portfolio 45 Statement of Assets and Liabilities 46 Statement of Operations 47 Statements of Changes in Net Assets 48 Financial Highlights 49 Notes to Financial Statements 56 Report of Independent Registered Public Accounting Firm
57 Advisory Agreement and Sub-Advisory Agreement Board Considerations and Fee Evaluation 62 Board Members and Officers 67 Account Management Resources |
This report must be preceded or accompanied by a prospectus. To obtain a summary prospectus, if available, or prospectus for any of our funds, refer to the Account Management Resources information provided in the back of this booklet. We advise you to consider the fund's objectives, risks, charges and expenses carefully before investing. The summary prospectus and prospectus contain this and other important information about the fund. Please read the prospectus carefully before you invest.
Investing in derivatives entails special risks relating to liquidity, leverage and credit that may reduce returns and/or increase volatility. Various factors, including costs, cash flows and security selection, may cause the fund’s performance to differ from that of the index. The fund may lend securities to approved institutions. Stocks may decline in value. See the prospectus for details.
This fund is not sponsored, endorsed, sold, nor promoted by Standard & Poor's®, and Standard & Poor's makes no representation regarding the advisability of investing in the portfolio.
Deutsche Asset Management represents the asset management activities conducted by Deutsche Bank AG or any of its subsidiaries.
NOT FDIC/NCUA INSURED NO BANK GUARANTEE MAY LOSE VALUE NOT A DEPOSIT NOT INSURED BY ANY FEDERAL GOVERNMENT AGENCY
Letter to Shareholders
Dear Shareholder:
Today’s low-return investment environment — punctuated by periods of short-term volatility and plenty of opinions in the financial media — can be a challenge for those of us just trying to keep our portfolios moving forward.
Let’s face it: a report about the obstacles to economic growth grabs more attention than an article about the slow, steady improvement of the economy. The fact is, we continue to see the U.S. economy remaining on a moderate expansionary path. Although net exports are still challenged by modest global growth, most metrics suggest the labor market here at home continues to heal, which, along with low interest rates, is supporting the consumer.
Is action necessary? Numerous studies have found that acting impulsively on negative financial news can actually reduce your overall investment returns over time. That’s because there is a good chance you’ll miss the gains to be achieved if the market or a specific security recovers from a brief setback. So, assuming you have built your portfolio based on long-term needs and an honest assessment of your risk tolerance, short-term fluctuations should not cause an extreme level of worry.
As a global asset manager with decades of experience in helping investors through multiple market cycles, we want you to know and trust that our global intelligence, expertise and resources are here to support you. As always, we appreciate the opportunity to help you meet your goals.
Best regards,

 |
Brian Binder President, Deutsche Funds |
Assumptions, estimates and opinions contained in this document constitute our judgment as of the date of the document and are subject to change without notice. Any projections are based on a number of assumptions as to market conditions and there can be no guarantee that any projected results will be achieved. Past performance is not a guarantee of future results.
Portfolio Management Review (Unaudited)
Market Overview and Fund Performance
All performance information below is historical and does not guarantee future results. Returns shown are for Institutional Class shares. Investment return and principal fluctuate, so your shares may be worth more or less when redeemed. Current performance may differ from performance data shown. Please visit deutschefunds.com for the most recent month-end performance of all share classes. Fund performance includes reinvestment of all distributions. Unadjusted returns do not reflect sales charges and would have been lower if they had. Please refer to pages 11 through 12 for more complete performance information.
Investment Strategy The fund seeks to provide investment results that, before expenses, correspond to the total return of common stocks publicly traded in the United States, as represented by the Standard & Poor’s 500® Composite Stock Price Index (S&P 500 Index). |
Deutsche Equity 500 Index Fund returned 11.55% during 2016. Since the fund’s investment strategy is to replicate the performance of the Standard & Poor’s 500® (S&P 500) Index, the fund’s return is normally close to that of the index. The S&P 500 Index returned 11.96% for the 12-month period ending December 31, 2016. This marked the eighth consecutive year of positive performance for the index, as well as the thirteenth year of positive returns out of the past 14. The difference in return between the fund and the index is typically driven by transaction costs and fund expenses.
U.S. large-cap stocks recovered from a difficult start to post a robust, double-digit gain in 2016. The initial weakness in market performance, which encompassed the first six weeks of the year, represented a continuation of the concerns about slowing global growth and falling commodity prices that had weighed on returns late in 2015. This challenging environment abruptly changed for the better in mid-February, however, thanks to the aggressive actions of the world’s central banks. The Bank of Japan and the European Central Bank each cut interest rates into negative territory, while the U.S. Federal Reserve Board (the Fed) issued a series of statements indicating it would maintain its gradual, data-dependent approach to monetary policy.
These developments fueled a swift improvement in investor sentiment, touching off a powerful rebound in U.S. equities. The rally subsequently gained steam through the spring and summer, as commodity prices recovered and market participants became more optimistic about the economic outlook. While the bull market temporarily lost momentum in September and October amid the elevated uncertainty that characterized the run-up to the U.S. election, the surprising result of the vote led to improving expectations regarding economic growth. Stocks surged in the final two months of the year as a result, gaining 3.70% and 1.98% in November and December, respectively.
Commodity-Sensitive Stocks Outperform
The index gained a significant boost from the strength of the energy sector, which staged a substantial recovery from its poor showing in 2015. The price of oil rose approximately 50% from its February low to its high in June, leading to upward revisions to energy companies’ earnings estimates. While the integrated giants Exxon Mobil Corp. and Chevron Corp. made the largest contributions to performance, the sector also benefited from having the vast majority of its individual stocks close in positive territory.
The gain in the price of oil was accompanied by similar recoveries in other commodities, including gold and industrial metals. This favorable trend led to strong performance for the materials sector, another notable laggard in 2015. Companies in the steel and diversified mining industries performed particularly well, as did the chemical producers Dow Chemical Co. and E. I. du Pont de Nemours & Co.

Financials Propelled by a Post-Election Rally
Financial stocks generated market-beating results in 2016, with broad-based gains across the category. Bank stocks such as JPMorgan Chase & Co. benefited from the prospect of rising interest rates in the year ahead, since this development would likely increase the margin between the rates at which banks borrow and lend. Insurance companies also gained ground, as rising rates would allow them to earn a higher return on their assets. Not least, investment banks, asset managers and exchange operators were aided by the combination of rising stock prices and increased trading activity. Financials delivered the bulk of their returns in the post-election rally, enabling the sector to close as the second-best performer in the S&P 500 Index.
Robust First-Half Returns for Dividend Stocks
Although the year ended with the markets anticipating multiple rate hikes in 2017, the outlook was quite different in the first half. The highly accommodative policies of the world’s central banks, together with the dovish commentary from the Fed, led to a sharp downturn in bond yields across the globe. By mid-year, in fact, a large swath of the global developed bond markets was actually trading with negative yields. This unusual development led income-oriented investors to look to higher-risk market segments as a way to earn more meaningful yields. Dividend stocks were a prime beneficiary of this shift, leading to outperformance for the utilities and telecommunications sectors in the first half. While both groups subsequently lost ground once investors began to anticipate a more active Fed in 2017, they nonetheless finished 2016 ahead of the index on the strength of their earlier outperformance.

Technology and Industrials Outpace the Broader Market
Strong gains for several mega-cap technology stalwarts helped propel the sector to a market-beating return. Apple, Inc., Microsoft Corp. and Facebook, Inc. all finished with double-digit gains, providing a meaningful boost to the sector as a whole. The tech sector was further aided by the outstanding returns for semiconductor companies, including NVIDIA Corp., QUALCOMM, Inc. and Texas Instruments, Inc., among many others. Technology stocks, in general, were aided by the backdrop of positive investor sentiment and the improving outlook for global growth.
| "U.S. large-cap stocks recovered from a difficult start to post a robust, double-digit gain in 2016." |
Favorable economic conditions also provided a tailwind for industrials. The sector further benefited from the improvement in oil prices, since many companies in the category generate a meaningful percentage of their revenues from the energy sector. The strongest contributions came from the transportation industry — highlighted by strength in railroad and package-delivery stocks — as well as the aerospace/defense group, which was aided by the uptrend in global defense spending.
Consumer Stocks, Real Estate and Health Care Lag
The consumer staples, consumer discretionary, real estate and health care sectors all finished behind the headline index return in 2016, with health care the only group to register a loss.
Health care stocks spent most of the period under pressure from concerns about increased regulation regarding their pricing practices, resulting in double-digit losses for a number of biotechnology and pharmaceutical stocks. Consumer staples, for its part, was caught up in the move away from defensive dividend payers in the second half of the year. Similarly, the high-yielding real estate sector — which produced hearty gains in the first half — lagged considerably from the end of July onward as investors began to factor in the possibility of less-favorable Fed policy in 2017.
Consumer discretionary stocks generated a high single-digit return, but the category nonetheless trailed the overall market. Weakness in certain auto-related, apparel and housing stocks accounted for the underperformance, offsetting better returns in the cable/media and travel-related areas.
Outlook and Positioning
The fund invested in equity index futures during the year, with the goal of keeping the fund’s exposures in line with those of the index. This strategy had a neutral impact on performance.
We continue to follow a passive strategy designed to provide returns that approximate those of the benchmark.
| Ten Largest Equity Holdings at December 31, 2016 (18.9% of Net Assets) | |
1. Apple, Inc. Designs, manufactures and markets personal computers and related computing and mobile communications devices | 3.1% |
2. Microsoft Corp. Develops, manufactures, licenses, sells and supports software products | 2.4% |
3. Alphabet, Inc. Holding company with subsidiaries that provide Web-based search, maps, hardware products and various software applications | 2.4% |
4. Exxon Mobil Corp. Explorer and producer of oil and gas | 1.9% |
5. Johnson & Johnson Provider of health care products | 1.6% |
6. Berkshire Hathaway, Inc. Holding company of insurance business and a variety of other businesses | 1.6% |
7. JPMorgan Chase & Co. Provider of global financial services | 1.6% |
8. Amazon.com, Inc. Online retailer that offers a wide range of products | 1.5% |
9. General Electric Co. Diversified technology, media and financial services company | 1.4% |
10. Facebook, Inc. Operates a social networking Web site | 1.4% |
Portfolio holdings and characteristics are subject to change. Deutsche Equity 500 Index Fund (the "Fund") is a feeder fund that invests substantially all of its assets in a "master portfolio," the Deutsche Equity 500 Index Portfolio (the "Portfolio"), and owns a pro rata interest in the Portfolio's net assets. The Asset Allocation, Sector Diversification and Ten Largest Equity Holdings at December 31, 2016 are based on the holdings of Deutsche Equity 500 Index Portfolio. For more complete details about the fund's investment portfolio, see page 28. A quarterly Fact Sheet is available on deutschefunds.com or upon request. Please see the Account Management Resources section on page 67 for contact information. | |
Subadvisor
Northern Trust Investments, Inc. ("NTI"), an indirect subsidiary of Northern Trust Corporation, is the subadvisor for the fund.
Portfolio Manager
Brent Reeder. Senior Vice President of Northern Trust Investments, Inc.
Portfolio Manager of the fund. Began managing the fund in 2007.
— Joined Northern Trust Investments, Inc. in 1993 and is responsible for the management of quantitative equity portfolios.
The views expressed reflect those of the portfolio management team only through the end of the period of the report as stated on the cover. The management team's views are subject to change at any time based on market and other conditions and should not be construed as a recommendation. Past performance is no guarantee of future results. Current and future portfolio holdings are subject to risk.
Terms to Know
The Standard & Poor’s 500 (S&P 500) Index is an unmanaged, capitalization-weighted index of 500 stocks. The index is designed to measure performance of the broad domestic economy through changes in the aggregate market value of 500 stocks representing all major industries. Index returns do not reflect any fees or expenses and it is not possible to invest directly into an index.
Contribution and detraction incorporate both a stock’s total return and its weighting in the index.
Consumer staples are the industries that manufacture and sell products such as food and beverages, prescription drugs and household products.
The consumer discretionary sector represents industries that produce goods and services that are not necessities in everyday life.
Performance Summary December 31, 2016 (Unaudited)
| Class S | 1-Year | 5-Year | 10-Year |
| Average Annual Total Returns as of 12/31/16 | |||
| No Sales Charges | 11.55% | 14.29% | 6.69% |
| S&P 500® Index† | 11.96% | 14.66% | 6.95% |
| Institutional Class | 1-Year | 5-Year | 10-Year |
| Average Annual Total Returns as of 12/31/16 | |||
| No Sales Charges | 11.60% | 14.34% | 6.76% |
| S&P 500® Index† | 11.96% | 14.66% | 6.95% |
Performance in the Average Annual Total Returns table above and the Growth of an Assumed $1,000,000 Investment line graph that follows is historical and does not guarantee future results. Investment return and principal fluctuate, so your shares may be worth more or less when redeemed. Current performance may differ from performance data shown. Please visit deutschefunds.com for the Fund's most recent month-end performance. Fund performance includes reinvestment of all distributions.
The gross expense ratios of the Fund, as stated in the fee table of the prospectus dated May 1, 2016 are 0.35% and 0.27% for Class S and Institutional Class shares, respectively, and may differ from the expense ratios disclosed in the Financial Highlights tables in this report.
Index returns do not reflect any fees or expenses and it is not possible to invest directly into an index.
Performance figures do not reflect the deduction of taxes that a shareholder would pay on fund distributions or the redemption of fund shares.
Generally accepted accounting principles require adjustments to be made to the net assets of the Fund at period end for financial reporting purposes only, and as such, the total return based on the unadjusted net asset value per share may differ from the total return reported in the financial highlights.
| Growth of an Assumed $1,000,000 Investment |
■ Deutsche Equity 500 Index Fund — Institutional Class ■ S&P 500 Index† |
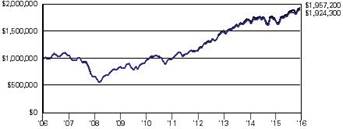 |
| Yearly periods ended December 31 |
The growth of $1,000,000 is cumulative.
The minimum initial investment for the Institutional Class is $1,000,000.
Performance of other share classes will vary based on the fee structure of those classes.
† The Standard & Poor's 500 (S&P 500) Index is an unmanaged, capitalization-weighted index of 500 stocks. The index is designed to measure performance of the broad domestic economy through changes in the aggregate market value of 500 stocks representing all major industries. "Standard & Poor's," "S&P 500," "Standard & Poor's 500" and "500" are trademarks of The McGraw-Hill Companies Inc., and have been licensed for use by the Fund's investment advisor.
| Class S | Institutional Class | |
| Net Asset Value | ||
| 12/31/16 | $ 207.59 | $ 210.06 |
| 12/31/15 | $ 207.73 | $ 209.98 |
| Distribution Information as of 12/31/16 | ||
| Income Dividends, Twelve Months | $ 4.06 | $ 4.21 |
| Capital Gain Distributions, Twelve Months | $ 20.00 | $ 20.00 |
Statement of Assets and Liabilities
| as of December 31, 2016 | |
| Assets | |
| Investment in the Deutsche Equity 500 Index Portfolio, at value | $ 791,858,974 |
| Receivable for Fund shares sold | 747,046 |
| Other assets | 14,997 |
| Total assets | 792,621,017 |
| Liabilities | |
| Payable for Fund shares redeemed | 2,128,277 |
| Accrued Trustees' fees | 998 |
| Other accrued expenses and payables | 291,710 |
| Total liabilities | 2,420,985 |
| Net assets, at value | $ 790,200,032 |
| Net Assets Consist of | |
| Undistributed net investment income | 11,593 |
| Net unrealized appreciation (depreciation) on investments | 640,053,357 |
| Accumulated net realized gain (loss) | 16,584,830 |
| Paid-in capital | 133,550,252 |
| Net assets, at value | $ 790,200,032 |
| Net Asset Value | |
Class S Net Asset Value, offering and redemption price per share ($415,927,037 ÷ 2,003,556 outstanding shares of beneficial interest, $.01 par value, unlimited number of shares authorized) | $ 207.59 |
Institutional Class Net Asset Value, offering and redemption price per share ($374,272,995 ÷ 1,781,766 outstanding shares of beneficial interest, $.01 par value, unlimited number of shares authorized) | $ 210.06 |
The accompanying notes are an integral part of the financial statements.
Statement of Operations
| for the year ended December 31, 2016 | |
| Investment Income | |
Income and expenses allocated from Deutsche Equity 500 Index Portfolio: Dividends (net of foreign taxes withheld of $62,080) | $ 18,457,556 |
| Interest | 1,641 |
| Income distributions — Deutsche Central Cash Management Government Fund | 44,151 |
| Securities lending income, net of borrower rebates | 72,797 |
| Expenses | (801,132) |
| Other income | 45,200 |
| Net investment income allocated from Deutsche Equity 500 Index Portfolio | 17,820,213 |
Expenses: Administration fee | 832,765 |
| Services to shareholders | 860,276 |
| Professional fees | 43,967 |
| Reports to shareholders | 67,634 |
| Registration fees | 46,291 |
| Trustees' fees and expenses | 4,821 |
| Other | 7,009 |
| Total expenses before expense reductions | 1,862,763 |
| Expense reductions | (389,285) |
| Total expenses after expense reductions | 1,473,478 |
| Net investment income (loss) | 16,346,735 |
| Realized and Unrealized Gain (Loss) | |
Net realized gain (loss) allocated from Deutsche Equity 500 Index Portfolio: Investments | 58,952,486 |
| Futures | 1,392,168 |
| 60,344,654 | |
Change in net unrealized appreciation (depreciation) allocated from Deutsche Equity 500 Index Portfolio on: Investments | 15,855,735 |
| Futures | (205,662) |
| 15,650,073 | |
| Net gain (loss) | 75,994,727 |
| Net increase (decrease) in net assets resulting from operations | $ 92,341,462 |
The accompanying notes are an integral part of the financial statements.
Statements of Changes in Net Assets
| Increase (Decrease) in Net Assets | Years Ended December 31, | |
| 2016 | 2015 | |
Operations: Net investment income (loss) | $ 16,346,735 | $ 16,952,466 |
| Net realized gain (loss) | 60,344,654 | 41,624,524 |
| Change in net unrealized appreciation (depreciation) | 15,650,073 | (45,146,571) |
| Net increase (decrease) in net assets resulting from operations | 92,341,462 | 13,430,419 |
Distributions to shareholders from: Net investment income: Class S | (7,828,562) | (6,806,255) |
| Institutional Class | (7,962,608) | (7,426,353) |
Realized gains: Class S | (36,724,966) | (28,569,689) |
| Institutional Class | (36,913,472) | (27,302,841) |
| Total distributions | (89,429,608) | (70,105,138) |
Fund share transactions: Proceeds from shares sold | 166,966,527 | 206,290,861 |
| Reinvestment of distributions | 76,729,888 | 60,476,585 |
| Payments for shares redeemed | (302,173,367) | (327,605,107) |
| Net increase (decrease) in net assets from Fund share transactions | (58,476,952) | (60,837,661) |
| Increase (decrease) in net assets | (55,565,098) | (117,512,380) |
| Net assets at beginning of period | 845,765,130 | 963,277,510 |
| Net assets at end of period (includes undistributed net investment income of $11,593 and $16,727, respectively) | $ 790,200,032 | $ 845,765,130 |
The accompanying notes are an integral part of the financial statements.
Financial Highlights
| Class S | Years Ended December 31, | |||||
| 2016 | 2015 | 2014 | 2013 | 2012 | ||
| Selected Per Share Data | ||||||
| Net asset value, beginning of period | $ 207.73 | $ 222.55 | $ 206.91 | $ 159.88 | $ 141.06 | |
Income (loss) from investment operations: Net investment incomea | 4.10 | 4.00 | 3.76 | 3.32 | 3.15 | |
| Net realized and unrealized gain (loss) | 19.82 | (1.51) | 23.16 | 47.28 | 18.88 | |
| Total from investment operations | 23.92 | 2.49 | 26.92 | 50.60 | 22.03 | |
Less distributions from: Net investment income | (4.06) | (3.37) | (4.09) | (3.57) | (3.21) | |
| Net realized gains | (20.00) | (13.94) | (7.19) | — | — | |
| Total distributions | (24.06) | (17.31) | (11.28) | (3.57) | (3.21) | |
| Net asset value, end of period | $ 207.59 | $ 207.73 | $ 222.55 | $ 206.91 | $ 159.88 | |
| Total Return (%) | 11.55b | 1.13b | 13.28b | 31.92 | 15.65 | |
| Ratios to Average Net Assets and Supplemental Data | ||||||
| Net assets, end of period ($ millions) | 416 | 429 | 422 | 417 | 359 | |
| Ratio of expenses before expense reductions, including expenses allocated from Deutsche Equity 500 Index Portfolio (%) | .36 | .35 | .32 | .31 | .30 | |
| Ratio of expenses after expense reductions, including expenses allocated from Deutsche Equity 500 Index Portfolio (%) | .30 | .30 | .31 | .31 | .30 | |
| Ratio of net investment income (%) | 1.94 | 1.81 | 1.74 | 1.80 | 2.03 | |
a Based on average shares outstanding during period. b Total return would have been lower had certain expenses not been reduced. | ||||||
| Institutional Class | Years Ended December 31, | |||||
| 2016 | 2015 | 2014 | 2013 | 2012 | ||
| Selected Per Share Data | ||||||
| Net asset value, beginning of period | $ 209.98 | $ 224.82 | $ 208.96 | $ 161.46 | $ 142.46 | |
Income (loss) from investment operations: Net investment incomea | 4.26 | 4.12 | 3.90 | 3.39 | 3.23 | |
| Net realized and unrealized gain (loss) | 20.03 | (1.49) | 23.41 | 47.80 | 19.09 | |
| Total from investment operations | 24.29 | 2.63 | 27.31 | 51.19 | 22.32 | |
Less distributions from: Net investment income | (4.21) | (3.53) | (4.26) | (3.69) | (3.32) | |
| Net realized gains | (20.00) | (13.94) | (7.19) | — | — | |
| Total distributions | (24.21) | (17.47) | (11.45) | (3.69) | (3.32) | |
| Net asset value, end of period | $ 210.06 | $ 209.98 | $ 224.82 | $ 208.96 | $ 161.46 | |
| Total Return (%) | 11.60b | 1.18b | 13.35b | 31.99 | 15.71 | |
| Ratios to Average Net Assets and Supplemental Data | ||||||
| Net assets, end of period ($ millions) | 374 | 417 | 541 | 702 | 1,023 | |
| Ratio of expenses before expense reductions, including expenses allocated from Deutsche Equity 500 Index Portfolio (%) | .28 | .27 | .26 | .25 | .25 | |
| Ratio of expenses after expense reductions, including expenses allocated from Deutsche Equity 500 Index Portfolio (%) | .25 | .25 | .25 | .25 | .25 | |
| Ratio of net investment income (%) | 1.99 | 1.84 | 1.79 | 1.84 | 2.06 | |
a Based on average shares outstanding during the period. b Total return would have been lower had certain expenses not been reduced. | ||||||
Notes to Financial Statements
A. Organization and Significant Accounting Policies
Deutsche Equity 500 Index Fund (the "Fund") is a diversified series of Deutsche Institutional Funds (the "Trust"), which is registered under the Investment Company Act of 1940, as amended, (the "1940 Act"), as an open-end management investment company organized as a Massachusetts business trust.
The Fund, a feeder fund, seeks to achieve its investment objective by investing all of its investable assets in a master portfolio, Deutsche Equity 500 Index Portfolio (the "Portfolio"), a diversified, open-end management investment company registered under the 1940 Act and organized as a New York trust advised by Deutsche Investment Management Americas Inc. ("DIMA" or the "Advisor"), an indirect, wholly owned subsidiary of Deutsche Bank AG. A master/feeder fund structure is one in which a fund (a "feeder fund"), instead of investing directly in a portfolio of securities, invests most or all of its investment assets in a separate registered investment company (the "master fund") with substantially the same investment objective and policies as the feeder fund. Such a structure permits the pooling of assets of two or more feeder funds, preserving separate identities or distribution channels at the feeder fund level. On December 31, 2016, the Fund owned approximately 47% of the Portfolio.
The Fund offers two classes of shares: Institutional Class and Class S. Class S shares are not subject to initial or contingent deferred sales charges and are only available to a limited group of investors. Institutional Class shares are not subject to initial or contingent deferred sales charges and are generally available only to qualified institutions.
Investment income, realized and unrealized gains and losses, and certain fund-level expenses and expense reductions, if any, are borne pro rata on the basis of relative net assets by the holders of both classes of shares, except that each class bears certain expenses unique to that class such as services to shareholders and certain other class specific expenses. Differences in class-level expenses may result in payment of different per share dividends by class. All shares of the Fund have equal rights with respect to voting subject to class-specific arrangements.
The Fund's financial statements are prepared in accordance with accounting principles generally accepted in the United States of America ("U.S. GAAP") which require the use of management estimates. Actual results could differ from those estimates. The Fund qualifies as an investment company under Topic 946 of Accounting Standards Codification of U.S. GAAP. The policies described below are followed consistently by the Fund in the preparation of its financial statements. The financial statements of the Portfolio, including the Investment Portfolio, are contained elsewhere in this report and should be read in conjunction with the Fund's financial statements.
Security Valuation. The Fund records its investment in the Portfolio at value, which reflects its proportionate interest in the net assets of the Portfolio. Valuation of the securities held by the Portfolio is discussed in the notes to the Portfolio's financial statements included elsewhere in this report.
Disclosure about the classification of fair value measurements is included in a table following the Portfolio's Investment Portfolio.
Federal Income Taxes. The Fund's policy is to comply with the requirements of the Internal Revenue Code, as amended, which are applicable to regulated investment companies, and to distribute all of its taxable income to its shareholders. Accordingly, the Fund paid no federal income taxes and no federal income tax provision was required.
The Fund has reviewed the tax positions for the open tax years as of December 31, 2016, and has determined that no provision for income tax and/or uncertain tax provisions is required in the Fund's financial statements. The Fund's federal tax returns for the prior three fiscal years remain open subject to examination by the Internal Revenue Service.
Distribution of Income and Gains. Distributions from net investment income of the Fund are declared and distributed to shareholders quarterly. Net realized gains from investment transactions, in excess of available capital loss carryforwards, would be taxable to the Fund if not distributed, and, therefore, will be distributed to shareholders at least annually. The Fund may also make additional distributions for tax purposes if necessary.
The timing and characterization of certain income and capital gain distributions are determined annually in accordance with federal tax regulations which may differ from accounting principles generally accepted in the United States of America. These differences primarily relate to investments in futures contracts and certain securities sold at a loss. As a result, net investment income (loss) and net realized gain (loss) on investment transactions for a reporting period may differ significantly from distributions during such period. Accordingly, the Fund may periodically make reclassifications among certain of its capital accounts without impacting the net asset value of the Fund.
At December 31, 2016, the Fund's components of distributable earnings on a tax basis were as follows:
| Undistributed ordinary income* | $ 110,373 |
| Undistributed net long-term capital gains | $ 15,937,538 |
At December 31, 2016, the tax character of distributions paid to shareholders by the Fund is summarized as follows:
| Years Ended December 31, | ||
| 2016 | 2015 | |
| Distributions from ordinary income* | $ 17,434,680 | $ 17,982,384 |
| Distributions from long-term capital gains | $ 71,994,928 | $ 52,122,754 |
* For tax purposes, short-term capital gain distributions are considered ordinary income distributions.
Contingencies. In the normal course of business, the Fund may enter into contracts with service providers that contain general indemnification clauses. The Fund's maximum exposure under these arrangements is unknown, as this would involve future claims that may be made against the Fund that have not yet been made. However, based on experience, the Fund expects the risk of loss to be remote.
Other. The Fund receives a daily allocation of the Portfolio's income, expenses and net realized and unrealized gains and losses in proportion to its investment in the Portfolio. Expenses directly attributed to a fund are charged to that fund, while expenses which are attributable to the Trust are allocated among the funds in the Trust on the basis of relative net assets.
B. Related Parties
Management Agreement. Under its Investment Management Agreement with the Fund, the Advisor serves as investment manager to the Fund. The Advisor receives a management fee from the Portfolio pursuant to the master/feeder structure noted above in Note A.
Pursuant to the Investment Management Agreement, the Fund pays no management fee to the Advisor so long as the Fund is a feeder fund that invests substantially all of its assets in the Portfolio. In the event the Board of Trustees determines it is in the best interests of the Fund to withdraw its investment from the Portfolio, the Advisor may become responsible for directly managing the assets of the Fund under the Investment Management Agreement. In such event, the Fund would pay the Advisor an annual fee (exclusive of any applicable waivers/reimbursements) of 0.05% of the Fund's average daily net assets, accrued daily and payable monthly.
For the period from January 1, 2016 through September 30, 2016, the Advisor had contractually agreed to waive its fees and/or reimburse fund expenses, including expenses of the Portfolio allocated to the Fund, to the extent necessary to maintain the total annual operating expenses (excluding certain expenses such as extraordinary expenses, taxes, brokerage and interest expense) of each class as follows:
| Class S | .30% |
| Institutional Class | .25% |
Effective October 1, 2016 through September 30, 2017, the Advisor has contractually agreed to waive its fees and/or reimburse fund expenses, including expenses of the Portfolio allocated to the Fund, to the extent necessary to maintain the total annual operating expenses (excluding certain expenses such as extraordinary expenses, taxes, brokerage and interest expense) of each class as follows:
| Class S | .29% |
| Institutional Class | .24% |
For the year ended December 31, 2016, fees waived and/or expenses reimbursed for each class are as follows:
| Class S | $ 267,449 |
| Institutional Class | 121,836 |
| $ 389,285 |
Administration Fee. Pursuant to an Administrative Services Agreement, DIMA provides most administrative services to the Fund. For all services provided under the Administrative Services Agreement, the Fund pays the Advisor an annual fee ("Administration Fee") of 0.10% of the Fund's average daily net assets, computed and accrued daily and payable monthly. For the year ended December 31, 2016, the Administration Fee was $832,765, of which $70,764 is unpaid.
Service Provider Fees. Deutsche AM Service Company ("DSC"), an affiliate of the Advisor, is the transfer agent, dividend-paying agent and shareholder service agent for the Fund. Pursuant to a sub-transfer agency agreement between DSC and DST Systems, Inc. ("DST"), DSC has delegated certain transfer agent, dividend-paying agent and shareholder service agent functions to DST. DSC compensates DST out of the shareholder servicing fee it receives from the Fund. For the year ended December 31, 2016, the amount charged to the Fund by DSC was as follows:
| Services to Shareholders | Total Aggregated | Unpaid at December 31, 2016 |
| Class S | $ 34,444 | $ 8,698 |
| Institutional Class | 17,241 | 4,570 |
| $ 51,685 | $ 13,268 |
Typesetting and Filing Service Fees. Under an agreement with DIMA, DIMA is compensated for providing typesetting and certain regulatory filing services to the Fund. For the year ended December 31, 2016, the amount charged to the Fund by DIMA included in the Statement of Operations under "Reports to shareholders" aggregated $21,774, of which $8,956 is unpaid.
Trustees' Fees and Expenses. The Fund paid retainer fees to each Trustee not affiliated with the Advisor, plus specified amounts to the Board Chairperson and Vice Chairperson and to each committee Chairperson.
C. Share Transactions
The following table summarizes share and dollar activity in the Fund:
| Year Ended December 31, 2016 | Year Ended December 31, 2015 | |||
| Shares | Dollars | Shares | Dollars | |
| Shares sold | ||||
| Class S | 466,088 | $ 98,191,608 | 614,858 | $ 135,648,899 |
| Institutional Class | 323,481 | 68,774,919 | 321,542 | 70,641,962 |
| $ 166,966,527 | $ 206,290,861 | |||
| Shares issued to shareholders in reinvestment of distributions | ||||
| Class S | 210,488 | $ 44,255,257 | 166,820 | $ 35,216,503 |
| Institutional Class | 152,690 | 32,474,631 | 117,958 | 25,260,082 |
| $ 76,729,888 | $ 60,476,585 | |||
| Shares redeemed | ||||
| Class S | (737,942) | $ (157,334,711) | (612,452) | $ (133,944,461) |
| Institutional Class | (679,362) | (144,838,656) | (862,662) | (193,660,646) |
| $ (302,173,367) | $ (327,605,107) | |||
| Net increase (decrease) | ||||
| Class S | (61,366) | $ (14,887,846) | 169,226 | $ 36,920,941 |
| Institutional Class | (203,191) | (43,589,106) | (423,162) | (97,758,602) |
| $ (58,476,952) | $ (60,837,661) | |||
Report of Independent Registered Public Accounting Firm
To the Board of Trustees of Deutsche Institutional Funds and Shareholders of Deutsche Equity 500 Index Fund:
In our opinion, the accompanying statement of assets and liabilities and the related statements of operations and of changes in net assets and the financial highlights present fairly, in all material respects, the financial position of Deutsche Equity 500 Index Fund (the "Fund") as of December 31, 2016, and the results of its operations, the changes in its net assets and the financial highlights for each of the periods indicated therein, in conformity with accounting principles generally accepted in the United States of America. These financial statements and financial highlights (hereafter referred to as "financial statements") are the responsibility of the Fund's management. Our responsibility is to express an opinion on these financial statements based on our audits. We conducted our audits of these financial statements in accordance with the standards of the Public Company Accounting Oversight Board (United States). Those standards require that we plan and perform the audit to obtain reasonable assurance about whether the financial statements are free of material misstatement. An audit includes examining, on a test basis, evidence supporting the amounts and disclosures in the financial statements, assessing the accounting principles used and significant estimates made by management, and evaluating the overall financial statement presentation. We believe that our audits, which included confirmation of securities as of December 31, 2016 by correspondence with the transfer agent, provide a reasonable basis for our opinion.
| Boston, Massachusetts February 24, 2017 | PricewaterhouseCoopers LLP |
Information About Your Fund's Expenses
As an investor of the Fund, you incur two types of costs: ongoing expenses and transaction costs. Ongoing expenses include management fees and other Fund expenses. Examples of transaction costs include sales charges (loads) and account maintenance fees, which are not shown in this section. The following tables are intended to help you understand your ongoing expenses (in dollars) of investing in the Fund and to help you compare these expenses with the ongoing expenses of investing in other mutual funds. In the most recent six-month period, the Fund limited these expenses; had it not done so, expenses would have been higher. The example in the table is based on an investment of $1,000 invested at the beginning of the six-month period and held for the entire period (July 1, 2016 to December 31, 2016).
The tables illustrate your Fund's expenses in two ways:
— Actual Fund Return. This helps you estimate the actual dollar amount of ongoing expenses (but not transaction costs) paid on a $1,000 investment in the Fund using the Fund's actual return during the period. To estimate the expenses you paid over the period, simply divide your account value by $1,000 (for example, an $8,600 account value divided by $1,000 = 8.6), then multiply the result by the number in the "Expenses Paid per $1,000" line under the share class you hold.
— Hypothetical 5% Fund Return. This helps you to compare your Fund's ongoing expenses (but not transaction costs) with those of other mutual funds using the Fund's actual expense ratio and a hypothetical rate of return of 5% per year before expenses. Examples using a 5% hypothetical fund return may be found in the shareholder reports of other mutual funds. The hypothetical account values and expenses may not be used to estimate the actual ending account balance or expenses you paid for the period.
Please note that the expenses shown in these tables are meant to highlight your ongoing expenses only and do not reflect any transaction costs. The "Expenses Paid per $1,000" line of the tables is useful in comparing ongoing expenses only and will not help you determine the relative total expense of owning different funds. Subject to certain exceptions, an account maintenance fee of $20.00 assessed once per calendar year for Class S shares may apply for accounts with balances less than $10,000. This fee is not included in these tables. If it was, the estimate of expenses paid for Class S shares during the period would be higher, and account value during the period would be lower, by this amount.
| Expenses and Value of a $1,000 Investment for the six months ended December 31, 2016 (Unaudited) | ||
| Actual Fund Return* | Class S | Institutional Class |
| Beginning Account Value 7/1/16 | $ 1,000.00 | $ 1,000.00 |
| Ending Account Value 12/31/16 | $ 1,076.40 | $ 1,076.60 |
| Expenses Paid per $1,000* | $ 1.57 | $ 1.30 |
| Hypothetical 5% Fund Return | Class S | Institutional Class |
| Beginning Account Value 7/1/16 | $ 1,000.00 | $ 1,000.00 |
| Ending Account Value 12/31/16 | $ 1,023.63 | $ 1,023.88 |
| Expenses Paid per $1,000* | $ 1.53 | $ 1.27 |
* Expenses include amounts allocated proportionally from the master portfolio.
** Expenses are equal to the Fund's annualized expense ratio for each share class, multiplied by the average account value over the period, multiplied by 184 (the number of days in the most recent six-month period), then divided by 366.
| Annualized Expense Ratios | Class S | Institutional Class |
| Deutsche Equity 500 Index Fund | .30% | .25% |
For more information, please refer to the Fund's prospectuses.
For an analysis of the fees associated with an investment in the Fund or similar funds, please refer to http://apps.finra.org/fundanalyzer/1/fa.aspx.
Tax Information (Unaudited)
The Fund paid distributions of $19.55 per share from net long-term capital gains during its year ended December 31, 2016.
Pursuant to Section 852 of the Internal Revenue Code, the Fund designates $91,498,000 as capital gain dividends for its year ended December 31, 2016.
For corporate shareholders, 59% of the ordinary dividends (i.e., income dividends plus short-term capital gains) paid during the Fund's fiscal year ended December 31, 2016, qualified for the dividends received deduction.
For federal income tax purposes, the Fund designates $15,680,000, or the maximum amount allowable under tax law, as qualified dividend income.
Please consult a tax advisor if you have questions about federal or state income tax laws, or on how to prepare your tax returns. If you have specific questions about your account please call (800) 728-3337.
(The following financial statements of the Deutsche Equity 500 Index Portfolio should be read in conjunction with the Fund's financial statements.)
Investment Portfolio as of December 31, 2016
| Shares | Value ($) | |
| Common Stocks 98.1% | ||
| Consumer Discretionary 11.8% | ||
| Auto Components 0.2% | ||
| BorgWarner, Inc. | 17,230 | 679,551 |
| Delphi Automotive PLC | 23,287 | 1,568,380 |
| Goodyear Tire & Rubber Co. | 22,166 | 684,264 |
| 2,932,195 | ||
| Automobiles 0.5% | ||
| Ford Motor Co. | 335,479 | 4,069,360 |
| General Motors Co. | 119,248 | 4,154,601 |
| Harley-Davidson, Inc. | 15,198 | 886,651 |
| 9,110,612 | ||
| Distributors 0.1% | ||
| Genuine Parts Co. | 12,878 | 1,230,364 |
| LKQ Corp.* | 26,412 | 809,528 |
| 2,039,892 | ||
| Diversified Consumer Services 0.0% | ||
| H&R Block, Inc. | 17,794 | 409,084 |
| Hotels, Restaurants & Leisure 1.5% | ||
| Carnival Corp. | 36,049 | 1,876,711 |
| Chipotle Mexican Grill, Inc.* | 2,481 | 936,131 |
| Darden Restaurants, Inc. | 10,576 | 769,087 |
| Marriott International, Inc. "A" | 27,521 | 2,275,436 |
| McDonald's Corp. | 71,374 | 8,687,643 |
| Royal Caribbean Cruises Ltd. | 14,390 | 1,180,556 |
| Starbucks Corp. | 125,104 | 6,945,774 |
| Wyndham Worldwide Corp. | 9,268 | 707,797 |
| Wynn Resorts Ltd. | 6,822 | 590,171 |
| Yum! Brands, Inc. | 29,958 | 1,897,240 |
| 25,866,546 | ||
| Household Durables 0.5% | ||
| D.R. Horton, Inc. | 29,284 | 800,332 |
| Garmin Ltd. (a) | 9,480 | 459,685 |
| Harman International Industries, Inc. | 5,995 | 666,404 |
| Leggett & Platt, Inc. | 11,483 | 561,289 |
| Lennar Corp. "A" | 16,737 | 718,520 |
| Mohawk Industries, Inc.* | 5,412 | 1,080,668 |
| Newell Brands, Inc. | 41,492 | 1,852,618 |
| PulteGroup, Inc. | 26,281 | 483,045 |
| Whirlpool Corp. | 6,464 | 1,174,961 |
| 7,797,522 | ||
| Internet & Direct Marketing Retail 2.3% | ||
| Amazon.com, Inc.* | 33,898 | 25,419,093 |
| Expedia, Inc. | 10,377 | 1,175,507 |
| Netflix, Inc.* | 36,884 | 4,566,239 |
| The Priceline Group, Inc.* | 4,241 | 6,217,560 |
| TripAdvisor, Inc.* | 9,823 | 455,493 |
| 37,833,892 | ||
| Leisure Products 0.1% | ||
| Hasbro, Inc. | 9,663 | 751,685 |
| Mattel, Inc. | 29,331 | 808,069 |
| 1,559,754 | ||
| Media 3.0% | ||
| CBS Corp. "B" | 33,672 | 2,142,213 |
| Charter Communications, Inc. "A"* | 18,611 | 5,358,479 |
| Comcast Corp. "A" | 204,835 | 14,143,857 |
| Discovery Communications, Inc. "A"* | 13,395 | 367,157 |
| Discovery Communications, Inc. "C"* | 18,949 | 507,454 |
| Interpublic Group of Companies, Inc. | 34,090 | 798,047 |
| News Corp. "A" | 31,997 | 366,686 |
| News Corp. "B" | 9,976 | 117,717 |
| Omnicom Group, Inc. | 20,257 | 1,724,073 |
| Scripps Networks Interactive "A" | 8,341 | 595,297 |
| TEGNA, Inc. | 18,619 | 398,260 |
| Time Warner, Inc. | 66,268 | 6,396,850 |
| Twenty-First Century Fox, Inc. "A" | 90,974 | 2,550,911 |
| Twenty-First Century Fox, Inc. "B" | 41,832 | 1,139,922 |
| Viacom, Inc. "B" | 29,850 | 1,047,735 |
| Walt Disney Co. | 125,821 | 13,113,065 |
| 50,767,723 | ||
| Multiline Retail 0.5% | ||
| Dollar General Corp. | 21,855 | 1,618,800 |
| Dollar Tree, Inc.* | 20,303 | 1,566,986 |
| Kohl's Corp. | 15,065 | 743,910 |
| Macy's, Inc. | 26,303 | 941,910 |
| Nordstrom, Inc. | 9,880 | 473,548 |
| Target Corp. | 48,304 | 3,488,998 |
| 8,834,152 | ||
| Specialty Retail 2.4% | ||
| Advance Auto Parts, Inc. | 6,331 | 1,070,699 |
| AutoNation, Inc.* | 5,814 | 282,851 |
| AutoZone, Inc.* | 2,480 | 1,958,679 |
| Bed Bath & Beyond, Inc. | 12,904 | 524,418 |
| Best Buy Co., Inc. | 23,471 | 1,001,507 |
| CarMax, Inc.* | 16,465 | 1,060,181 |
| Foot Locker, Inc. | 11,635 | 824,805 |
| Home Depot, Inc. | 104,701 | 14,038,310 |
| L Brands, Inc. | 20,651 | 1,359,662 |
| Lowe's Companies, Inc. | 74,765 | 5,317,287 |
| O'Reilly Automotive, Inc.* | 8,118 | 2,260,132 |
| Ross Stores, Inc. | 34,078 | 2,235,517 |
| Signet Jewelers Ltd. | 5,953 | 561,130 |
| Staples, Inc. | 55,992 | 506,728 |
| The Gap, Inc. | 18,959 | 425,440 |
| Tiffany & Co. | 9,158 | 709,104 |
| TJX Companies, Inc. | 56,027 | 4,209,308 |
| Tractor Supply Co. | 11,275 | 854,758 |
| Ulta Salon, Cosmetics & Fragrance, Inc.* | 5,039 | 1,284,643 |
| Urban Outfitters, Inc.* | 7,289 | 207,591 |
| 40,692,750 | ||
| Textiles, Apparel & Luxury Goods 0.7% | ||
| Coach, Inc. | 24,059 | 842,546 |
| Hanesbrands, Inc. | 32,460 | 700,162 |
| Michael Kors Holdings Ltd.* | 13,980 | 600,860 |
| NIKE, Inc. "B" | 114,811 | 5,835,843 |
| PVH Corp. | 6,926 | 625,002 |
| Ralph Lauren Corp. | 4,839 | 437,059 |
| Under Armour, Inc. "A"* (a) | 16,125 | 468,431 |
| Under Armour, Inc. "C"* | 16,174 | 407,100 |
| VF Corp. | 28,410 | 1,515,674 |
| 11,432,677 | ||
| Consumer Staples 9.2% | ||
| Beverages 2.0% | ||
| Brown-Forman Corp. "B" | 15,659 | 703,402 |
| Coca-Cola Co. | 333,579 | 13,830,185 |
| Constellation Brands, Inc. "A" | 15,276 | 2,341,964 |
| Dr. Pepper Snapple Group, Inc. | 15,717 | 1,425,060 |
| Molson Coors Brewing Co. "B" | 15,976 | 1,554,625 |
| Monster Beverage Corp.* | 34,846 | 1,545,072 |
| PepsiCo, Inc. | 123,241 | 12,894,706 |
| 34,295,014 | ||
| Food & Staples Retailing 2.1% | ||
| Costco Wholesale Corp. | 37,572 | 6,015,653 |
| CVS Health Corp. | 91,662 | 7,233,048 |
| Kroger Co. | 81,151 | 2,800,521 |
| Sysco Corp. | 43,252 | 2,394,863 |
| Wal-Mart Stores, Inc. | 129,432 | 8,946,340 |
| Walgreens Boots Alliance, Inc. | 73,556 | 6,087,495 |
| Whole Foods Market, Inc. | 27,374 | 842,024 |
| 34,319,944 | ||
| Food Products 1.6% | ||
| Archer-Daniels-Midland Co. | 49,454 | 2,257,575 |
| Campbell Soup Co. | 16,653 | 1,007,007 |
| Conagra Brands, Inc. | 35,744 | 1,413,675 |
| General Mills, Inc. | 50,843 | 3,140,572 |
| Hormel Foods Corp. | 23,219 | 808,253 |
| Kellogg Co. | 21,717 | 1,600,760 |
| Kraft Heinz Co. | 51,266 | 4,476,547 |
| McCormick & Co., Inc. | 9,840 | 918,367 |
| Mead Johnson Nutrition Co. | 15,881 | 1,123,740 |
| Mondelez International, Inc. "A" | 132,749 | 5,884,763 |
| The Hershey Co. | 11,983 | 1,239,402 |
| The JM Smucker Co. | 10,010 | 1,281,881 |
| Tyson Foods, Inc. "A" | 24,977 | 1,540,581 |
| 26,693,123 | ||
| Household Products 1.8% | ||
| Church & Dwight Co., Inc. | 22,248 | 983,139 |
| Clorox Co. | 11,070 | 1,328,621 |
| Colgate-Palmolive Co. | 76,368 | 4,997,522 |
| Kimberly-Clark Corp. | 30,787 | 3,513,413 |
| Procter & Gamble Co. | 229,997 | 19,338,148 |
| 30,160,843 | ||
| Personal Products 0.1% | ||
| Coty, Inc. "A" | 40,409 | 739,889 |
| Estee Lauder Companies, Inc. "A" | 19,097 | 1,460,729 |
| 2,200,618 | ||
| Tobacco 1.6% | ||
| Altria Group, Inc. | 167,614 | 11,334,059 |
| Philip Morris International, Inc. | 133,325 | 12,197,904 |
| Reynolds American, Inc. | 71,076 | 3,983,099 |
| 27,515,062 | ||
| Energy 7.4% | ||
| Energy Equipment & Services 1.2% | ||
| Baker Hughes, Inc. | 36,366 | 2,362,699 |
| FMC Technologies, Inc.* | 19,351 | 687,541 |
| Halliburton Co. | 74,432 | 4,026,027 |
| Helmerich & Payne, Inc. | 9,157 | 708,752 |
| National Oilwell Varco, Inc. | 32,559 | 1,219,009 |
| Schlumberger Ltd. | 119,631 | 10,043,022 |
| Transocean Ltd.* | 33,001 | 486,435 |
| 19,533,485 | ||
| Oil, Gas & Consumable Fuels 6.2% | ||
| Anadarko Petroleum Corp. | 48,050 | 3,350,526 |
| Apache Corp. | 32,623 | 2,070,582 |
| Cabot Oil & Gas Corp. | 40,023 | 934,937 |
| Chesapeake Energy Corp.* | 63,161 | 443,390 |
| Chevron Corp. | 162,267 | 19,098,826 |
| Cimarex Energy Co. | 8,171 | 1,110,439 |
| Concho Resources, Inc.* | 12,567 | 1,666,384 |
| ConocoPhillips | 106,521 | 5,340,963 |
| Devon Energy Corp. | 45,023 | 2,056,200 |
| EOG Resources, Inc. | 49,561 | 5,010,617 |
| EQT Corp. | 14,861 | 971,909 |
| Exxon Mobil Corp. | 356,433 | 32,171,643 |
| Hess Corp. | 22,875 | 1,424,884 |
| Kinder Morgan, Inc. | 165,078 | 3,418,765 |
| Marathon Oil Corp. | 72,868 | 1,261,345 |
| Marathon Petroleum Corp. | 45,379 | 2,284,833 |
| Murphy Oil Corp. | 13,687 | 426,076 |
| Newfield Exploration Co.* | 17,264 | 699,192 |
| Noble Energy, Inc. | 36,859 | 1,402,853 |
| Occidental Petroleum Corp. | 65,705 | 4,680,167 |
| ONEOK, Inc. | 18,116 | 1,040,040 |
| Phillips 66 | 38,064 | 3,289,110 |
| Pioneer Natural Resources Co. | 14,598 | 2,628,662 |
| Range Resources Corp. | 16,035 | 550,963 |
| Southwestern Energy Co.* | 41,852 | 452,839 |
| Spectra Energy Corp. | 60,308 | 2,478,056 |
| Tesoro Corp. | 10,019 | 876,162 |
| Valero Energy Corp. | 38,914 | 2,658,604 |
| Williams Companies, Inc. | 58,626 | 1,825,614 |
| 105,624,581 | ||
| Financials 14.5% | ||
| Banks 6.6% | ||
| Bank of America Corp. | 868,565 | 19,195,287 |
| BB&T Corp. | 69,727 | 3,278,564 |
| Citigroup, Inc. | 244,962 | 14,558,092 |
| Citizens Financial Group, Inc. | 43,995 | 1,567,542 |
| Comerica, Inc. | 14,813 | 1,008,913 |
| Fifth Third Bancorp. | 64,955 | 1,751,836 |
| Huntington Bancshares, Inc. | 93,275 | 1,233,096 |
| JPMorgan Chase & Co. | 307,546 | 26,538,144 |
| KeyCorp | 92,821 | 1,695,840 |
| M&T Bank Corp. | 13,324 | 2,084,273 |
| People's United Financial, Inc. | 27,023 | 523,165 |
| PNC Financial Services Group, Inc. | 41,813 | 4,890,448 |
| Regions Financial Corp. | 105,884 | 1,520,494 |
| SunTrust Banks, Inc. | 42,191 | 2,314,176 |
| U.S. Bancorp. | 137,285 | 7,052,330 |
| Wells Fargo & Co. | 388,516 | 21,411,117 |
| Zions Bancorp. | 17,349 | 746,701 |
| 111,370,018 | ||
| Capital Markets 2.8% | ||
| Affiliated Managers Group, Inc.* | 4,684 | 680,585 |
| Ameriprise Financial, Inc. | 13,581 | 1,506,676 |
| Bank of New York Mellon Corp. | 90,811 | 4,302,625 |
| BlackRock, Inc. | 10,439 | 3,972,457 |
| Charles Schwab Corp. | 103,639 | 4,090,631 |
| CME Group, Inc. | 29,147 | 3,362,107 |
| E*TRADE Financial Corp.* | 23,486 | 813,790 |
| Franklin Resources, Inc. | 29,805 | 1,179,682 |
| Intercontinental Exchange, Inc. | 51,148 | 2,885,770 |
| Invesco Ltd. | 35,063 | 1,063,811 |
| Moody's Corp. | 14,281 | 1,346,270 |
| Morgan Stanley | 123,882 | 5,234,015 |
| Nasdaq, Inc. | 9,760 | 655,091 |
| Northern Trust Corp. | 19,037 | 1,695,245 |
| S&P Global, Inc. | 22,251 | 2,392,873 |
| State Street Corp. | 31,145 | 2,420,589 |
| T. Rowe Price Group, Inc. | 20,894 | 1,572,482 |
| The Goldman Sachs Group, Inc. | 31,777 | 7,609,003 |
| 46,783,702 | ||
| Consumer Finance 0.8% | ||
| American Express Co. | 66,074 | 4,894,762 |
| Capital One Financial Corp. | 41,440 | 3,615,226 |
| Discover Financial Services | 33,873 | 2,441,905 |
| Navient Corp. | 26,331 | 432,618 |
| Synchrony Financial | 67,387 | 2,444,126 |
| 13,828,637 | ||
| Diversified Financial Services 1.6% | ||
| Berkshire Hathaway, Inc. "B"* | 163,183 | 26,595,565 |
| Leucadia National Corp. | 27,794 | 646,211 |
| 27,241,776 | ||
| Insurance 2.7% | ||
| Aflac, Inc. | 35,091 | 2,442,334 |
| Allstate Corp. | 31,650 | 2,345,898 |
| American International Group, Inc. | 83,888 | 5,478,725 |
| Aon PLC | 22,617 | 2,522,474 |
| Arthur J. Gallagher & Co. | 15,166 | 788,025 |
| Assurant, Inc. | 4,771 | 443,035 |
| Chubb Ltd. | 40,000 | 5,284,800 |
| Cincinnati Financial Corp. | 12,904 | 977,478 |
| Hartford Financial Services Group, Inc. | 32,470 | 1,547,196 |
| Lincoln National Corp. | 19,653 | 1,302,404 |
| Loews Corp. | 23,758 | 1,112,587 |
| Marsh & McLennan Companies, Inc. | 44,324 | 2,995,859 |
| MetLife, Inc. | 94,479 | 5,091,473 |
| Principal Financial Group, Inc. | 22,845 | 1,321,812 |
| Progressive Corp. | 49,890 | 1,771,095 |
| Prudential Financial, Inc. | 36,961 | 3,846,162 |
| The Travelers Companies, Inc. | 24,426 | 2,990,231 |
| Torchmark Corp. | 9,419 | 694,746 |
| Unum Group | 20,041 | 880,401 |
| Willis Towers Watson PLC | 11,054 | 1,351,683 |
| XL Group Ltd. | 23,158 | 862,867 |
| 46,051,285 | ||
| Health Care 13.4% | ||
| Biotechnology 2.7% | ||
| AbbVie, Inc. | 139,676 | 8,746,511 |
| Alexion Pharmaceuticals, Inc.* | 19,274 | 2,358,174 |
| Amgen, Inc. | 63,939 | 9,348,521 |
| Biogen, Inc.* | 18,701 | 5,303,230 |
| Celgene Corp.* | 66,627 | 7,712,075 |
| Gilead Sciences, Inc. | 113,232 | 8,108,544 |
| Regeneron Pharmaceuticals, Inc.* | 6,499 | 2,385,718 |
| Vertex Pharmaceuticals, Inc.* | 21,326 | 1,571,086 |
| 45,533,859 | ||
| Health Care Equipment & Supplies 2.4% | ||
| Abbott Laboratories | 126,587 | 4,862,207 |
| Baxter International, Inc. | 42,088 | 1,866,182 |
| Becton, Dickinson & Co. | 18,252 | 3,021,619 |
| Boston Scientific Corp.* | 117,088 | 2,532,613 |
| C.R. Bard, Inc. | 6,321 | 1,420,076 |
| Danaher Corp. | 52,325 | 4,072,978 |
| DENTSPLY SIRONA, Inc. | 19,660 | 1,134,972 |
| Edwards Lifesciences Corp.* | 18,380 | 1,722,206 |
| Hologic, Inc.* | 23,924 | 959,831 |
| Intuitive Surgical, Inc.* | 3,330 | 2,111,786 |
| Medtronic PLC | 118,024 | 8,406,850 |
| St. Jude Medical, Inc. | 24,559 | 1,969,386 |
| Stryker Corp. | 26,714 | 3,200,604 |
| The Cooper Companies, Inc. | 4,193 | 733,481 |
| Varian Medical Systems, Inc.* | 8,036 | 721,472 |
| Zimmer Biomet Holdings, Inc. | 17,221 | 1,777,207 |
| 40,513,470 | ||
| Health Care Providers & Services 2.6% | ||
| Aetna, Inc. | 30,168 | 3,741,134 |
| AmerisourceBergen Corp. | 14,379 | 1,124,294 |
| Anthem, Inc. | 22,650 | 3,256,391 |
| Cardinal Health, Inc. | 27,519 | 1,980,542 |
| Centene Corp.* | 14,691 | 830,188 |
| CIGNA Corp. | 22,072 | 2,944,184 |
| DaVita, Inc.* | 13,579 | 871,772 |
| Envision Healthcare Corp.* | 10,089 | 638,533 |
| Express Scripts Holding Co.* | 53,010 | 3,646,558 |
| HCA Holdings, Inc.* | 25,121 | 1,859,456 |
| Henry Schein, Inc.* | 6,919 | 1,049,682 |
| Humana, Inc. | 12,817 | 2,615,053 |
| Laboratory Corp. of America Holdings* | 8,860 | 1,137,447 |
| McKesson Corp. | 19,435 | 2,729,646 |
| Patterson Companies, Inc. | 6,861 | 281,507 |
| Quest Diagnostics, Inc. | 11,918 | 1,095,264 |
| UnitedHealth Group, Inc. | 81,812 | 13,093,192 |
| Universal Health Services, Inc. "B" | 7,709 | 820,083 |
| 43,714,926 | ||
| Health Care Technology 0.1% | ||
| Cerner Corp.* | 25,973 | 1,230,341 |
| Life Sciences Tools & Services 0.6% | ||
| Agilent Technologies, Inc. | 27,893 | 1,270,805 |
| Illumina, Inc.* | 12,627 | 1,616,761 |
| Mettler-Toledo International, Inc.* | 2,275 | 952,224 |
| PerkinElmer, Inc. | 9,240 | 481,866 |
| Thermo Fisher Scientific, Inc. | 33,957 | 4,791,333 |
| Waters Corp.* | 6,929 | 931,188 |
| 10,044,177 | ||
| Pharmaceuticals 5.0% | ||
| Allergan PLC* | 32,240 | 6,770,722 |
| Bristol-Myers Squibb Co. | 143,645 | 8,394,614 |
| Eli Lilly & Co. | 83,495 | 6,141,057 |
| Endo International PLC* | 17,821 | 293,512 |
| Johnson & Johnson | 233,811 | 26,937,365 |
| Mallinckrodt PLC* | 9,054 | 451,070 |
| Merck & Co., Inc. | 236,978 | 13,950,895 |
| Mylan NV* | 39,559 | 1,509,176 |
| Perrigo Co. PLC | 12,324 | 1,025,727 |
| Pfizer, Inc. | 521,567 | 16,940,496 |
| Zoetis, Inc. | 42,434 | 2,271,492 |
| 84,686,126 | ||
| Industrials 10.1% | ||
| Aerospace & Defense 2.2% | ||
| Arconic, Inc. | 37,716 | 699,255 |
| Boeing Co. | 49,330 | 7,679,694 |
| General Dynamics Corp. | 24,598 | 4,247,091 |
| L3 Technologies, Inc. | 6,646 | 1,010,923 |
| Lockheed Martin Corp. | 21,655 | 5,412,451 |
| Northrop Grumman Corp. | 15,145 | 3,522,424 |
| Raytheon Co. | 25,237 | 3,583,654 |
| Rockwell Collins, Inc. | 11,193 | 1,038,263 |
| Textron, Inc. | 23,218 | 1,127,466 |
| TransDigm Group, Inc. | 4,310 | 1,073,017 |
| United Technologies Corp. | 65,813 | 7,214,421 |
| 36,608,659 | ||
| Air Freight & Logistics 0.7% | ||
| C.H. Robinson Worldwide, Inc. | 12,174 | 891,867 |
| Expeditors International of Washington, Inc. | 15,495 | 820,615 |
| FedEx Corp. | 21,018 | 3,913,552 |
| United Parcel Service, Inc. "B" | 59,245 | 6,791,847 |
| 12,417,881 | ||
| Airlines 0.6% | ||
| Alaska Air Group, Inc. | 10,594 | 940,006 |
| American Airlines Group, Inc. | 44,542 | 2,079,666 |
| Delta Air Lines, Inc. | 63,302 | 3,113,825 |
| Southwest Airlines Co. | 52,909 | 2,636,984 |
| United Continental Holdings, Inc.* | 24,820 | 1,808,882 |
| 10,579,363 | ||
| Building Products 0.3% | ||
| Allegion PLC | 8,238 | 527,232 |
| Fortune Brands Home & Security, Inc. | 13,198 | 705,565 |
| Johnson Controls International PLC | 80,542 | 3,317,525 |
| Masco Corp. | 28,291 | 894,561 |
| 5,444,883 | ||
| Commercial Services & Supplies 0.3% | ||
| Cintas Corp. | 7,345 | 848,788 |
| Pitney Bowes, Inc. | 16,241 | 246,701 |
| Republic Services, Inc. | 19,824 | 1,130,959 |
| Stericycle, Inc.* | 7,472 | 575,643 |
| Waste Management, Inc. | 34,929 | 2,476,815 |
| 5,278,906 | ||
| Construction & Engineering 0.1% | ||
| Fluor Corp. | 11,982 | 629,295 |
| Jacobs Engineering Group, Inc.* | 10,252 | 584,364 |
| Quanta Services, Inc.* | 13,190 | 459,671 |
| 1,673,330 | ||
| Electrical Equipment 0.5% | ||
| Acuity Brands, Inc. | 3,776 | 871,728 |
| AMETEK, Inc. | 19,895 | 966,897 |
| Eaton Corp. PLC | 38,837 | 2,605,574 |
| Emerson Electric Co. | 55,263 | 3,080,912 |
| Rockwell Automation, Inc. | 11,024 | 1,481,626 |
| 9,006,737 | ||
| Industrial Conglomerates 2.5% | ||
| 3M Co. | 51,694 | 9,230,997 |
| General Electric Co. | 760,408 | 24,028,893 |
| Honeywell International, Inc. | 65,507 | 7,588,986 |
| Roper Technologies, Inc. | 8,721 | 1,596,641 |
| 42,445,517 | ||
| Machinery 1.5% | ||
| Caterpillar, Inc. | 50,296 | 4,664,451 |
| Cummins, Inc. | 13,254 | 1,811,424 |
| Deere & Co. | 24,862 | 2,561,781 |
| Dover Corp. | 13,359 | 1,000,990 |
| Flowserve Corp. | 11,407 | 548,106 |
| Fortive Corp. | 25,854 | 1,386,550 |
| Illinois Tool Works, Inc. | 27,148 | 3,324,544 |
| Ingersoll-Rand PLC | 22,211 | 1,666,714 |
| PACCAR, Inc. | 30,131 | 1,925,371 |
| Parker-Hannifin Corp. | 11,469 | 1,605,660 |
| Pentair PLC | 14,390 | 806,847 |
| Snap-on, Inc. | 4,958 | 849,157 |
| Stanley Black & Decker, Inc. | 12,954 | 1,485,694 |
| Xylem, Inc. | 15,431 | 764,143 |
| 24,401,432 | ||
| Professional Services 0.3% | ||
| Dun & Bradstreet Corp. | 3,237 | 392,713 |
| Equifax, Inc. | 10,291 | 1,216,705 |
| Nielsen Holdings PLC | 28,874 | 1,211,264 |
| Robert Half International, Inc. | 10,964 | 534,824 |
| Verisk Analytics, Inc.* | 13,355 | 1,084,025 |
| 4,439,531 | ||
| Road & Rail 0.9% | ||
| CSX Corp. | 80,533 | 2,893,551 |
| J.B. Hunt Transport Services, Inc. | 7,533 | 731,228 |
| Kansas City Southern | 9,250 | 784,862 |
| Norfolk Southern Corp. | 25,111 | 2,713,746 |
| Ryder System, Inc. | 4,475 | 333,119 |
| Union Pacific Corp. | 70,845 | 7,345,210 |
| 14,801,716 | ||
| Trading Companies & Distributors 0.2% | ||
| Fastenal Co. | 24,881 | 1,168,909 |
| United Rentals, Inc.* | 7,244 | 764,822 |
| W.W. Grainger, Inc. | 4,715 | 1,095,059 |
| 3,028,790 | ||
| Information Technology 20.4% | ||
| Communications Equipment 1.0% | ||
| Cisco Systems, Inc. | 431,466 | 13,038,903 |
| F5 Networks, Inc.* | 5,570 | 806,090 |
| Harris Corp. | 10,713 | 1,097,761 |
| Juniper Networks, Inc. | 32,700 | 924,102 |
| Motorola Solutions, Inc. | 14,270 | 1,182,840 |
| 17,049,696 | ||
| Electronic Equipment, Instruments & Components 0.4% | ||
| Amphenol Corp. "A" | 26,499 | 1,780,733 |
| Corning, Inc. | 81,781 | 1,984,825 |
| FLIR Systems, Inc. | 11,693 | 423,170 |
| TE Connectivity Ltd. | 30,543 | 2,116,019 |
| 6,304,747 | ||
| Internet Software & Services 4.2% | ||
| Akamai Technologies, Inc.* | 14,946 | 996,599 |
| Alphabet, Inc. "A"* | 25,448 | 20,166,268 |
| Alphabet, Inc. "C"* | 25,507 | 19,686,813 |
| eBay, Inc.* | 89,355 | 2,652,950 |
| Facebook, Inc. "A"* | 201,199 | 23,147,945 |
| VeriSign, Inc.* (a) | 7,815 | 594,487 |
| Yahoo!, Inc.* | 75,460 | 2,918,038 |
| 70,163,100 | ||
| IT Services 3.6% | ||
| Accenture PLC "A" | 53,312 | 6,244,435 |
| Alliance Data Systems Corp. | 5,012 | 1,145,242 |
| Automatic Data Processing, Inc. | 38,759 | 3,983,650 |
| Cognizant Technology Solutions Corp. "A"* | 52,147 | 2,921,796 |
| CSRA, Inc. | 12,748 | 405,896 |
| Fidelity National Information Services, Inc. | 28,196 | 2,132,745 |
| Fiserv, Inc.* | 18,639 | 1,980,953 |
| Global Payments, Inc. | 13,213 | 917,114 |
| International Business Machines Corp. | 74,365 | 12,343,846 |
| Mastercard, Inc. "A" | 81,803 | 8,446,160 |
| Paychex, Inc. | 27,642 | 1,682,845 |
| PayPal Holdings, Inc.* | 96,450 | 3,806,882 |
| Teradata Corp.* | 11,432 | 310,607 |
| Total System Services, Inc. | 14,218 | 697,109 |
| Visa, Inc. "A" | 160,512 | 12,523,146 |
| Western Union Co. | 41,665 | 904,964 |
| Xerox Corp. | 73,209 | 639,115 |
| 61,086,505 | ||
| Semiconductors & Semiconductor Equipment 3.3% | ||
| Analog Devices, Inc. | 26,486 | 1,923,413 |
| Applied Materials, Inc. | 92,886 | 2,997,431 |
| Broadcom Ltd. | 34,149 | 6,036,519 |
| First Solar, Inc.* | 6,966 | 223,539 |
| Intel Corp. | 407,315 | 14,773,315 |
| KLA-Tencor Corp. | 13,431 | 1,056,751 |
| Lam Research Corp. | 13,994 | 1,479,586 |
| Linear Technology Corp. | 20,641 | 1,286,966 |
| Microchip Technology, Inc. | 18,565 | 1,190,945 |
| Micron Technology, Inc.* | 89,530 | 1,962,498 |
| NVIDIA Corp. | 46,328 | 4,945,051 |
| Qorvo, Inc.* | 10,979 | 578,923 |
| QUALCOMM, Inc. | 126,938 | 8,276,357 |
| Skyworks Solutions, Inc. | 15,974 | 1,192,619 |
| Texas Instruments, Inc. | 85,896 | 6,267,831 |
| Xilinx, Inc. | 21,684 | 1,309,063 |
| 55,500,807 | ||
| Software 4.2% | ||
| Activision Blizzard, Inc. | 58,769 | 2,122,149 |
| Adobe Systems, Inc.* | 42,738 | 4,399,877 |
| Autodesk, Inc.* | 16,843 | 1,246,550 |
| CA, Inc. | 26,943 | 855,979 |
| Citrix Systems, Inc.* | 13,407 | 1,197,379 |
| Electronic Arts, Inc.* | 25,936 | 2,042,719 |
| Intuit, Inc. | 20,953 | 2,401,423 |
| Microsoft Corp. | 668,302 | 41,528,286 |
| Oracle Corp. | 257,599 | 9,904,682 |
| Red Hat, Inc.* | 15,261 | 1,063,692 |
| salesforce.com, Inc.* | 54,872 | 3,756,537 |
| Symantec Corp. | 53,577 | 1,279,955 |
| 71,799,228 | ||
| Technology Hardware, Storage & Peripherals 3.7% | ||
| Apple, Inc. | 458,323 | 53,082,970 |
| Hewlett Packard Enterprise Co. | 143,232 | 3,314,388 |
| HP, Inc. | 147,090 | 2,182,816 |
| NetApp, Inc. | 23,484 | 828,281 |
| Seagate Technology PLC | 25,319 | 966,426 |
| Western Digital Corp. | 24,540 | 1,667,493 |
| 62,042,374 | ||
| Materials 2.8% | ||
| Chemicals 2.0% | ||
| Air Products & Chemicals, Inc. | 18,691 | 2,688,140 |
| Albemarle Corp. | 9,671 | 832,480 |
| CF Industries Holdings, Inc. | 19,409 | 610,995 |
| Dow Chemical Co. | 96,372 | 5,514,406 |
| E.I. du Pont de Nemours & Co. | 74,715 | 5,484,081 |
| Eastman Chemical Co. | 12,651 | 951,482 |
| Ecolab, Inc. | 22,557 | 2,644,131 |
| FMC Corp. | 11,703 | 661,922 |
| International Flavors & Fragrances, Inc. | 6,828 | 804,543 |
| LyondellBasell Industries NV "A" | 28,728 | 2,464,288 |
| Monsanto Co. | 37,639 | 3,959,999 |
| PPG Industries, Inc. | 22,703 | 2,151,336 |
| Praxair, Inc. | 24,538 | 2,875,608 |
| The Mosaic Co. | 30,083 | 882,334 |
| The Sherwin-Williams Co. | 6,950 | 1,867,743 |
| 34,393,488 | ||
| Construction Materials 0.2% | ||
| Martin Marietta Materials, Inc. | 5,477 | 1,213,320 |
| Vulcan Materials Co. | 11,309 | 1,415,321 |
| 2,628,641 | ||
| Containers & Packaging 0.3% | ||
| Avery Dennison Corp. | 7,821 | 549,191 |
| Ball Corp. | 15,020 | 1,127,551 |
| International Paper Co. | 35,325 | 1,874,345 |
| Sealed Air Corp. | 16,599 | 752,599 |
| WestRock Co. | 21,581 | 1,095,667 |
| 5,399,353 | ||
| Metals & Mining 0.3% | ||
| Freeport-McMoRan, Inc.* | 107,784 | 1,421,671 |
| Newmont Mining Corp. | 45,646 | 1,555,159 |
| Nucor Corp. | 27,296 | 1,624,658 |
| 4,601,488 | ||
| Real Estate 2.8% | ||
| Equity Real Estate Investment Trusts (REITs) 2.8% | ||
| American Tower Corp. | 36,585 | 3,866,303 |
| Apartment Investment & Management Co. "A" | 13,314 | 605,121 |
| AvalonBay Communities, Inc. | 11,798 | 2,090,016 |
| Boston Properties, Inc. | 13,225 | 1,663,441 |
| Crown Castle International Corp. | 30,991 | 2,689,089 |
| Digital Realty Trust, Inc. | 13,665 | 1,342,723 |
| Equinix, Inc. | 6,135 | 2,192,710 |
| Equity Residential | 31,419 | 2,022,127 |
| Essex Property Trust, Inc. | 5,628 | 1,308,510 |
| Extra Space Storage, Inc. | 10,798 | 834,038 |
| Federal Realty Investment Trust | 6,160 | 875,398 |
| General Growth Properties, Inc. | 50,199 | 1,253,971 |
| HCP, Inc. | 40,232 | 1,195,695 |
| Host Hotels & Resorts, Inc. | 64,239 | 1,210,263 |
| Iron Mountain, Inc. | 21,064 | 684,159 |
| Kimco Realty Corp. | 36,590 | 920,604 |
| Mid-America Apartment Communities, Inc. | 9,756 | 955,308 |
| Prologis, Inc. | 45,436 | 2,398,566 |
| Public Storage | 12,821 | 2,865,493 |
| Realty Income Corp. | 22,242 | 1,278,470 |
| Simon Property Group, Inc. | 27,011 | 4,799,044 |
| SL Green Realty Corp. | 8,717 | 937,513 |
| The Macerich Co. | 10,382 | 735,461 |
| UDR, Inc. | 22,922 | 836,195 |
| Ventas, Inc. | 30,442 | 1,903,234 |
| Vornado Realty Trust | 14,785 | 1,543,110 |
| Welltower, Inc. | 31,168 | 2,086,074 |
| Weyerhaeuser Co. | 64,321 | 1,935,419 |
| 47,028,055 | ||
| Real Estate Management & Development 0.0% | ||
| CBRE Group, Inc. "A"* | 25,831 | 813,418 |
| Telecommunication Services 2.6% | ||
| Diversified Telecommunication Services | ||
| AT&T, Inc. | 527,854 | 22,449,631 |
| CenturyLink, Inc. | 47,015 | 1,118,017 |
| Frontier Communications Corp. (a) | 98,556 | 333,119 |
| Level 3 Communications, Inc.* | 25,065 | 1,412,663 |
| Verizon Communications, Inc. | 350,426 | 18,705,740 |
| 44,019,170 | ||
| Utilities 3.1% | ||
| Electric Utilities 1.9% | ||
| Alliant Energy Corp. | 19,531 | 740,030 |
| American Electric Power Co., Inc. | 42,286 | 2,662,327 |
| Duke Energy Corp. | 59,233 | 4,597,665 |
| Edison International | 28,005 | 2,016,080 |
| Entergy Corp. | 15,405 | 1,131,805 |
| Eversource Energy | 27,278 | 1,506,564 |
| Exelon Corp. | 79,363 | 2,816,593 |
| FirstEnergy Corp. | 36,606 | 1,133,688 |
| NextEra Energy, Inc. | 40,159 | 4,797,394 |
| PG&E Corp. | 43,478 | 2,642,158 |
| Pinnacle West Capital Corp. | 9,586 | 747,996 |
| PPL Corp. | 58,407 | 1,988,758 |
| Southern Co. | 84,180 | 4,140,814 |
| Xcel Energy, Inc. | 43,655 | 1,776,758 |
| 32,698,630 | ||
| Independent Power & Renewable Electricity Producers 0.1% | ||
| AES Corp. | 56,754 | 659,481 |
| NRG Energy, Inc. | 26,225 | 321,519 |
| 981,000 | ||
| Multi-Utilities 1.0% | ||
| Ameren Corp. | 20,875 | 1,095,103 |
| CenterPoint Energy, Inc. | 37,004 | 911,779 |
| CMS Energy Corp. | 23,914 | 995,301 |
| Consolidated Edison, Inc. | 26,204 | 1,930,711 |
| Dominion Resources, Inc. | 53,857 | 4,124,908 |
| DTE Energy Co. | 15,420 | 1,519,024 |
| NiSource, Inc. | 27,782 | 615,093 |
| Public Service Enterprise Group, Inc. | 43,507 | 1,909,087 |
| SCANA Corp. | 12,288 | 900,465 |
| Sempra Energy | 21,499 | 2,163,659 |
| WEC Energy Group, Inc. | 27,153 | 1,592,524 |
| 17,757,654 | ||
| Water Utilities 0.1% | ||
| American Water Works Co., Inc. | 15,306 | 1,107,542 |
| Total Common Stocks (Cost $716,577,245) | 1,656,119,427 | |
| Principal Amount ($) | Value ($) | |
| Government & Agency Obligation 0.1% | ||
| U.S. Treasury Obligation | ||
| U.S. Treasury Bill, 0.45%**, 3/2/2017 (b) (Cost $2,210,349) | 2,215,000 | 2,213,272 |
| Shares | Value ($) | |
| Securities Lending Collateral 0.1% | ||
| Government & Agency Securities Portfolio "Deutsche Government Cash Institutional Shares", 0.42% (c) (d) (Cost $1,767,755) | 1,767,755 | 1,767,755 |
| Cash Equivalents 0.0% | ||
| Deutsche Central Cash Management Government Fund, 0.49% (c) (Cost $15,263) | 15,263 | 15,263 |
| % of Net Assets | Value ($) | |
| Total Investment Portfolio (Cost $720,570,612)† | 98.3 | 1,660,115,717 |
| Other Assets and Liabilities, Net | 1.7 | 28,438,600 |
| Net Assets | 100.0 | 1,688,554,317 |
* Non-income producing security.
** Annualized yield at time of purchase; not a coupon rate.
† The cost for federal income tax purposes was $774,902,053. At December 31, 2016, net unrealized appreciation for all securities based on tax cost was $885,213,664. This consisted of aggregate gross unrealized appreciation for all securities in which there was an excess of value over tax cost of $960,940,787 and aggregate gross unrealized depreciation for all securities in which there was an excess of tax cost over value of $75,727,123.
(a) All or a portion of these securities were on loan. In addition, "Other Assets and Liabilities, Net" may include pending sales that are also on loan. The value of securities loaned at December 31, 2016 amounted to $1,723,022, which is 0.1% of net assets.
(b) At December 31, 2016 this security has been pledged, in whole or in part, to cover initial margin requirements for open futures contracts.
(c) Affiliated fund managed by Deutsche Investment Management Americas Inc. The rate shown is the annualized seven-day yield at period end.
(d) Represents collateral held in connection with securities lending. Income earned by the Portfolio is net of borrower rebates.
At December 31, 2016, open futures contracts purchased were as follows:
| Futures | Currency | Expiration Date | Contracts | Notional Value ($) | Unrealized Depreciation ($) |
| S&P 500 E-Mini Index | USD | 3/17/2017 | 256 | 28,623,360 | (187,303) |
| Currency Abbreviation |
| USD United States Dollar |
For information on the Portfolio's policy and additional disclosures regarding futures contracts, please refer to Note B in the accompanying Notes to Financial Statements.
Fair Value Measurements
Various inputs are used in determining the value of the Fund's investments. These inputs are summarized in three broad levels. Level 1 includes quoted prices in active markets for identical securities. Level 2 includes other significant observable inputs (including quoted prices for similar securities, interest rates, prepayment speeds and credit risk). Level 3 includes significant unobservable inputs (including the Portfolio's own assumptions in determining the fair value of investments). The level assigned to the securities valuations may not be an indication of the risk or liquidity associated with investing in those securities.
The following is a summary of the inputs used as of December 31, 2016 in valuing the Portfolio's investments. For information on the Portfolio's policy regarding the valuation of investments, please refer to the Security Valuation section of Note A in the accompanying Notes to Financial Statements.
| Assets | Level 1 | Level 2 | Level 3 | Total | |
| Common Stocks (e) | $ 1,656,119,427 | $ — | $ — | $ 1,656,119,427 | |
| Government & Agency Obligation | — | 2,213,272 | — | 2,213,272 | |
| Short-Term Investments (e) | 1,783,018 | — | — | 1,783,018 | |
| Total | $ 1,657,902,445 | $ 2,213,272 | $ — | $ 1,660,115,717 | |
| Liabilities | Level 1 | Level 2 | Level 3 | Total | |
| Derivatives (f) | |||||
| Futures Contracts | $ (187,303) | $ — | $ — | $ (187,303) | |
| Total | $ (187,303) | $ — | $ — | $ (187,303) | |
There have been no transfers between fair value measurement levels during the year ended December 31, 2016.
(e) See Investment Portfolio for additional detailed categorizations.
(f) Derivatives include unrealized appreciation (depreciation) on open futures contracts.
The accompanying notes are an integral part of the financial statements.
Statement of Assets and Liabilities
| as of December 31, 2016 | |
| Assets | |
Investments: Investments in non-affiliated securities, at value (cost $718,787,594) — including $1,723,022 of securities loaned | $ 1,658,332,699 |
| Investment in Government & Agency Securities Portfolio (cost $1,767,755)* | 1,767,755 |
| Investment in Deutsche Central Cash Management Government Fund (cost $15,263) | 15,263 |
| Total investments in securities, at value (cost $720,570,612) | 1,660,115,717 |
| Cash | 37,283 |
| Receivable for investments sold | 49,970,538 |
| Dividends receivable | 2,165,180 |
| Interest receivable | 9,116 |
| Other assets | 30,057 |
| Total assets | 1,712,327,891 |
| Liabilities | |
| Payable upon return of securities loaned | 1,767,755 |
| Line of credit loan payable | 21,650,000 |
| Payable for variation margin on futures contracts | 111,972 |
| Accrued management fee | 73,789 |
| Accrued Trustees' fees | 15,322 |
| Other accrued expenses and payables | 154,736 |
| Total liabilities | 23,773,574 |
| Net assets, at value | $ 1,688,554,317 |
* Represents collateral on securities loaned.
The accompanying notes are an integral part of the financial statements.
Statement of Operations
| for the year ended December 31, 2016 | |
| Investment Income | |
Income: Dividends (net of foreign taxes withheld of $127,793) | $ 38,026,530 |
| Interest | 3,364 |
| Income distributions — Deutsche Central Cash Management Government Fund | 90,826 |
| Securities lending income, net of borrower rebates | 149,731 |
| Other income | 94,513 |
| Total income | 38,364,964 |
Expenses: Management fee | 858,623 |
| Administration fee | 515,174 |
| Custodian fee | 22,856 |
| Professional fees | 102,662 |
| Reports to shareholders | 5,610 |
| Interest expense | 4,160 |
| Trustees' fees and expenses | 65,561 |
| Other | 76,079 |
| Total expenses | 1,650,725 |
| Net investment income (loss) | 36,714,239 |
| Realized and Unrealized Gain (Loss) | |
Net realized gain (loss) from: Investments | 122,414,108 |
| Futures | 2,854,958 |
| 125,269,066 | |
Change in net unrealized appreciation (depreciation) on: Investments | 31,651,724 |
| Futures | (422,442) |
| 31,229,282 | |
| Net gain (loss) | 156,498,348 |
| Net increase (decrease) in net assets resulting from operations | $ 193,212,587 |
The accompanying notes are an integral part of the financial statements.
Statements of Changes in Net Assets
| Years Ended December 31, | ||
| Increase (Decrease) in Net Assets | 2016 | 2015 |
Operations: Net investment income (loss) | $ 36,714,239 | $ 37,161,281 |
| Net realized gain (loss) | 125,269,066 | 83,367,618 |
| Change in net unrealized appreciation (depreciation) | 31,229,282 | (93,609,321) |
| Net increase (decrease) in net assets resulting from operations | 193,212,587 | 26,919,578 |
Capital transactions in shares of beneficial interest: Proceeds from capital invested | 73,617,486 | 344,866,466 |
| Value of capital withdrawn | (343,640,856) | (510,374,213) |
| Net increase (decrease) in net assets from capital transactions in shares of beneficial interest | (270,023,370) | (165,507,747) |
| Increase (decrease) in net assets | (76,810,783) | (138,588,169) |
| Net assets at beginning of period | 1,765,365,100 | 1,903,953,269 |
| Net assets at end of period | $ 1,688,554,317 | $ 1,765,365,100 |
The accompanying notes are an integral part of the financial statements.
Financial Highlights
Years Ended December 31, | ||||||
| 2016 | 2015 | 2014 | 2013 | 2012 | ||
| Ratios to Average Net Assets and Supplemental Data | ||||||
| Net assets, end of period ($ millions) | 1,689 | 1,765 | 1,904 | 2,018 | 2,100 | |
| Ratio of expenses (%) | .10 | .10 | .10 | .10 | .09 | |
| Ratio of net investment income (%) | 2.14 | 2.00 | 1.95 | 2.01 | 2.24 | |
| Portfolio turnover rate (%) | 3 | 3 | 2 | 3b | 4 | |
| Total investment return (%)a | 11.75 | 1.33 | 13.50 | 32.14 | 15.87 | |
a Total investment return for the Portfolio was derived from the performance of the Institutional Class of Deutsche Equity 500 Index Fund. b Excludes portfolio securities delivered as a result of processing redemption in-kind transactions. | ||||||
Notes to Financial Statements
A. Organization and Significant Accounting Policies
Deutsche Equity 500 Index Portfolio (the "Portfolio") is registered under the Investment Company Act of 1940, as amended (the "1940 Act"), as a diversified open-end management investment company organized as a New York trust.
The Portfolio is a master fund; a master/feeder fund structure is one in which a fund (a "feeder fund"), instead of investing directly in a portfolio of securities, invests most or all of its investment assets in a separate registered investment company (the "master fund") with substantially the same investment objective and policies as the feeder fund. Such a structure permits the pooling of assets of two or more feeder funds, preserving separate identities or distribution channels at the feeder fund level. The Portfolio has two affiliated Deutsche feeder funds, with a significant ownership percentage of the Portfolio's net assets. Investment activities of these feeder funds could have a material impact on the Portfolio. As of December 31, 2016, Deutsche S&P 500 Index Fund and Deutsche Equity 500 Index Fund owned approximately 53% and 47%, respectively, of the Portfolio.
The Portfolio's financial statements are prepared in accordance with accounting principles generally accepted in the United States of America ("U.S. GAAP") which require the use of management estimates. Actual results could differ from those estimates. The Fund qualifies as an investment company under Topic 946 of Accounting Standards Codification of U.S. GAAP. The policies described below are followed consistently by the Portfolio in the preparation of its financial statements.
Security Valuation. Investments are stated at value determined as of the close of regular trading on the New York Stock Exchange on each day the exchange is open for trading.
Various inputs are used in determining the value of the Portfolio's investments. These inputs are summarized in three broad levels. Level 1 includes quoted prices in active markets for identical securities. Level 2 includes other significant observable inputs (including quoted prices for similar securities, interest rates, prepayment speeds and credit risk). Level 3 includes significant unobservable inputs (including the Portfolio's own assumptions in determining the fair value of investments). The level assigned to the securities valuations may not be an indication of the risk or liquidity associated with investing in those securities.
Equity securities are valued at the most recent sale price or official closing price reported on the exchange (U.S. or foreign) or over-the-counter market on which they trade. Securities for which no sales are reported are valued at the calculated mean between the most recent bid and asked quotations on the relevant market or, if a mean cannot be determined, at the most recent bid quotation. Equity securities are generally categorized as Level 1.
Debt securities are valued at prices supplied by independent pricing services approved by the Portfolio's Board. Such services may use various pricing techniques which take into account appropriate factors such as yield, quality, coupon rate, maturity, type of issue, trading characteristics, prepayment speeds and other data, as well as broker quotes. If the pricing services are unable to provide valuations, debt securities are valued at the average of the most recent reliable bid quotations or evaluated prices, as applicable, obtained from broker-dealers. These securities are generally categorized as Level 2.
Investments in open-end investment companies are valued at their net asset value each business day and are categorized as Level 1.
Futures contracts are generally valued at the settlement prices established each day on the exchange on which they are traded and are categorized as Level 1.
Securities and other assets for which market quotations are not readily available or for which the above valuation procedures are deemed not to reflect fair value are valued in a manner that is intended to reflect their fair value as determined in accordance with procedures approved by the Board and are generally categorized as Level 3. In accordance with the Portfolio's valuation procedures, factors considered in determining value may include, but are not limited to, the type of the security; the size of the holding; the initial cost of the security; the existence of any contractual restrictions on the security's disposition; the price and extent of public trading in similar securities of the issuer or of comparable companies; quotations or evaluated prices from broker-dealers and/or pricing services; information obtained from the issuer, analysts, and/or the appropriate stock exchange (for exchange-traded securities); an analysis of the company's or issuer's financial statements; an evaluation of the forces that influence the issuer and the market(s) in which the security is purchased and sold; and with respect to debt securities, the maturity, coupon, creditworthiness, currency denomination and the movement of the market in which the security is normally traded. The value determined under these procedures may differ from published values for the same securities.
Securities Lending. Brown Brothers Harriman & Co., as lending agent, lends securities of the Portfolio to certain financial institutions under the terms of its securities lending agreement. During the term of the loans, the Portfolio continues to receive interest and dividends generated by the securities and to participate in any changes in their market value. The Portfolio requires the borrowers of the securities to maintain collateral with the Portfolio consisting of either cash or liquid, unencumbered assets having a value at least equal to the value of the securities loaned. When the collateral falls below specified amounts, the lending agent will use its best efforts to obtain additional collateral on the next business day to meet required amounts under the securities lending agreement. As of period end, any securities on loan were collateralized by cash. During the year ended December 31, 2016, the Portfolio invested the cash collateral into a joint trading account in affiliated money market funds managed by Deutsche Investment Management Americas Inc. As of December 31, 2016, the Portfolio invested the cash collateral in Government & Agency Securities Portfolio. Deutsche Investment Management Americas Inc. receives a management/administration fee (0.09% annualized effective rate as of December 31, 2016) on the cash collateral invested in Government & Agency Securities Portfolio. The Portfolio receives compensation for lending its securities either in the form of fees or by earning interest on invested cash collateral net of borrower rebates and fees paid to a lending agent. Either the Portfolio or the borrower may terminate the loan at any time, and the borrower, after notice, is required to return borrowed securities within a standard time period. There may be risks of delay and costs in recovery of securities or even loss of rights in the collateral should the borrower of the securities fail financially. If the Portfolio is not able to recover securities lent, the Portfolio may sell the collateral and purchase a replacement investment in the market, incurring the risk that the value of the replacement security is greater than the value of the collateral. The Portfolio is also subject to all investment risks associated with the reinvestment of any cash collateral received, including, but not limited to, interest rate, credit and liquidity risk associated with such investments.
As of December 31, 2016, the Portfolio had securities on loan, which were classified as common stock in the Investment Portfolio. The value of the related collateral exceeded the value of the securities loaned at period end. As of period end, the remaining contractual maturity of the collateral agreements were overnight and continuous.
Federal Income Taxes. The Portfolio is considered a partnership under the Internal Revenue Code, as amended. Therefore, no federal income tax provision is necessary.
It is intended that the Portfolio's assets, income and distributions will be managed in such a way that an investor in the Portfolio will be able to satisfy the requirements of Subchapter M of the Code, assuming that the investor invested all of its assets in the Portfolio.
The Portfolio has reviewed the tax positions for the open tax years as of December 31, 2016 and has determined that no provision for income tax and/or uncertain tax provisions is required in the Portfolio's financial statements. The Portfolio's federal tax returns for the prior three fiscal years remain open subject to examination by the Internal Revenue Service.
Contingencies. In the normal course of business, the Portfolio may enter into contracts with service providers that contain general indemnification clauses. The Portfolio's maximum exposure under these arrangements is unknown, as this would involve future claims that may be made against the Portfolio that have not yet been made. However, based on experience, the Portfolio expects the risk of loss to be remote.
Other. Investment transactions are accounted for on a trade date plus one basis for daily net asset value calculations. However, for financial reporting purposes, investment transactions are reported on trade date. Interest income is recorded on the accrual basis. Dividend income is recorded on the ex-dividend date net of foreign withholding taxes. Realized gains and losses from investment transactions are recorded on an identified cost basis. Proceeds from litigation payments, if any, are included in net realized gain (loss) from investments.
The Portfolio makes a daily allocation of its net investment income and realized and unrealized gains and losses from securities, futures and foreign currency transactions to its investors in proportion to their investment in the Portfolio.
B. Derivative Instruments
Futures Contracts. A futures contract is an agreement between a buyer or seller and an established futures exchange or its clearinghouse in which the buyer or seller agrees to take or make a delivery of a specific amount of a financial instrument at a specified price on a specific date (settlement date). For the year ended December 31, 2016, the Portfolio invested in futures contracts to keep cash on hand to meet shareholder redemptions or other needs while maintaining exposure to the stock market.
Upon entering into a futures contract, the Portfolio is required to deposit with a financial intermediary cash or securities ("initial margin") in an amount equal to a certain percentage of the face value indicated in the futures contract. Subsequent payments ("variation margin") are made or received by the Portfolio dependent upon the daily fluctuations in the value and are recorded for financial reporting purposes as unrealized gains or losses by the Portfolio. Gains or losses are realized when the contract expires or is closed. Since all futures contracts are exchange traded, counterparty risk is minimized as the exchange's clearinghouse acts as the counterparty, and guarantees the futures against default.
Certain risks may arise upon entering into futures contracts, including the risk that an illiquid market will limit the Portfolio's ability to close out a futures contract prior to the settlement date and the risk that the futures contract is not well correlated with the security, index or currency to which it relates. Risk of loss may exceed amounts disclosed in the Statement of Assets and Liabilities.
A summary of the open futures contracts as of December 31, 2016 is included in a table following the Portfolio's Investment Portfolio. For the year ended December 31, 2016, the investment in futures contracts purchased had a total notional value generally indicative of a range from approximately $28,623,000 to $43,316,000.
The following table summarizes the value of the Portfolio's derivative instruments held as of December 31, 2016 presented by primary underlying risk exposure:
| Liability Derivative | Futures Contracts |
| Equity Contracts (a) | $ (187,303) |
| (a) Includes cumulative depreciation of futures contracts as disclosed in the Investment Portfolio. Unsettled variation margin is disclosed separately within the Statement of Assets and Liabilities. | |
Additionally, the amount of unrealized and realized gains and losses on derivative instruments recognized in Portfolio earnings during the year ended December 31, 2016 and the related location in the accompanying Statement of Operations is summarized in the following tables by primary underlying risk exposure:
| Realized Gain (Loss) | Futures Contracts |
| Equity Contracts (a) | $ 2,854,958 |
The above derivative is located in the following Statement of Operations account: (a) Net realized gain (loss) from futures | |
| Change in Net Unrealized Appreciation (Depreciation) | Futures Contracts |
| Equity Contracts (a) | $ (422,442) |
The above derivative is located in the following Statement of Operations account: (a) Change in net unrealized appreciation (depreciation) on futures | |
C. Purchases and Sales of Securities
During the year ended December 31, 2016, purchases and sales of investment securities (excluding short-term investments) aggregated $56,181,326 and $270,027,361, respectively.
D. Related Parties
Deutsche Investment Management Americas Inc. ("DIMA" or the "Advisor"), an indirect, wholly owned subsidiary of Deutsche Bank AG, serves as the investment manager to the Portfolio.
Management Agreement. Under its Investment Management Agreement with the Portfolio, the Advisor determines the securities, instruments and other contracts relating to investments to be purchased, sold or entered into by the Portfolio or delegates such responsibility to the Portfolio's sub-advisor. Northern Trust Investments, Inc. ("NTI") serves as sub-advisor to the Portfolio and is paid by the Advisor for its services. NTI is responsible for the day-to-day management of the Portfolio.
The management fee payable under the Investment Management Agreement is equal to an annual rate (exclusive of any applicable waivers/reimbursments) of 0.05% of the Portfolio's average daily net assets, computed and accrued daily and payable monthly.
Administration Fee. Pursuant to an Administrative Services Agreement, DIMA provides most administrative services to the Portfolio. For all services provided under the Administrative Services Agreement, the Portfolio pays the Advisor an annual fee ("Administration Fee") of 0.03% of the Portfolio's average daily net assets, computed and accrued daily and payable monthly. For the year ended December 31, 2016, the Administration Fee was $515,174, of which $44,274 is unpaid.
Filing Service Fee. Under an agreement with DIMA, DIMA is compensated for providing certain regulatory filing services to the Portfolio. For the year ended December 31, 2016, the amount charged to the Portfolio by DIMA included in the Statement of Operations under "Reports to shareholders" aggregated $3,177, of which $482 is unpaid.
Trustees' Fees and Expenses. The Portfolio paid retainer fees to each Trustee not affiliated with the Advisor, plus specified amounts to the Board Chairperson and Vice Chairperson and to each committee Chairperson.
Affiliated Cash Management Vehicles. The Portfolio may invest uninvested cash balances in Deutsche Central Cash Management Government Fund and Deutsche Variable NAV Money Fund, affiliated money market funds which are managed by the Advisor. Each affiliated money market fund is managed in accordance with Rule 2a-7 under the 1940 Act, which governs the quality, maturity, diversity and liquidity of instruments in which a money market fund may invest. Deutsche Central Cash Management Government Fund seeks to maintain a stable net asset value, and Deutsche Variable NAV Money Fund maintains a floating net asset value. The Portfolio indirectly bears its proportionate share of the expenses of each affiliated money market fund in which it invests. Deutsche Central Cash Management Government Fund does not pay the Advisor an investment management fee. To the extent that Deutsche Variable NAV Money Fund pays an investment management fee to the Advisor, the Advisor will waive an amount of the investment management fee payable to the Advisor by the Portfolio equal to the amount of the investment management fee payable on the Portfolio's assets invested in Deutsche Variable NAV Money Fund.
E. Line of Credit
The Portfolio and other affiliated funds (the "Participants") share in a $400 million revolving credit facility provided by a syndication of banks. The Portfolio may borrow for temporary or emergency purposes, including the meeting of redemption requests that otherwise might require the untimely disposition of securities. The Participants are charged an annual commitment fee which is allocated based on net assets, among each of the Participants. Interest is calculated at a rate per annum equal to the sum of the Federal Funds Rate plus 1.25 percent plus if the one-month LIBOR exceeds the Federal Funds Rate, the amount of such excess. The Portfolio may borrow up to a maximum of 33 percent of its net assets under the agreement.
At December 31, 2016, the Portfolio had a $21,650,000 outstanding loan. Interest expense incurred on the borrowings was $4,160 for the year ended December 31, 2016. The average dollar amount of the borrowings was $8,272,000, the weighted average interest rate on these borrowings was 2.01% and the Portfolio had a loan outstanding for 9 days throughout the period. The borrowings were valued at cost, which approximates fair value.
Report of Independent Registered Public Accounting Firm
To the Board of Trustees and Holders of Beneficial Interest in Deutsche Equity 500 Index Portfolio:
In our opinion, the accompanying statement of assets and liabilities, including the investment portfolio, and the related statements of operations and of changes in net assets and the financial highlights present fairly, in all material respects, the financial position of Deutsche Equity 500 Index Portfolio (the "Portfolio") as of December 31, 2016, and the results of its operations, the changes in its net assets and the financial highlights for each of the periods indicated therein, in conformity with accounting principles generally accepted in the United States of America. These financial statements and financial highlights (hereafter referred to as "financial statements") are the responsibility of the Portfolio's management. Our responsibility is to express an opinion on these financial statements based on our audits. We conducted our audits of these financial statements in accordance with the standards of the Public Company Accounting Oversight Board (United States). Those standards require that we plan and perform the audit to obtain reasonable assurance about whether the financial statements are free of material misstatement. An audit includes examining, on a test basis, evidence supporting the amounts and disclosures in the financial statements, assessing the accounting principles used and significant estimates made by management, and evaluating the overall financial statement presentation. We believe that our audits, which included confirmation of securities as of December 31, 2016 by correspondence with the custodian, brokers and transfer agent, and the application of alternative auditing procedures where such confirmations had not been received, provide a reasonable basis for our opinion.
| Boston, Massachusetts February 24, 2017 | PricewaterhouseCoopers LLP |
Advisory Agreement and Sub-Advisory Agreement Board Considerations and Fee Evaluation
Deutsche Equity 500 Index Fund (the "Fund"), a series of Deutsche Institutional Funds, invests substantially all of its assets in Deutsche Equity 500 Index Portfolio (the "Portfolio") in order to achieve its investment objective. The Portfolio’s Board of Trustees approved the renewal of the Portfolio’s investment management agreement (the "Portfolio Agreement") with Deutsche Investment Management Americas Inc. ("DIMA") and the sub-advisory agreement (the "Sub-Advisory Agreement") between DIMA and Northern Trust Investments, Inc. ("NTI"), and the Fund’s Board of Trustees (which consists of the same members as the Board of Trustees of the Portfolio) approved the renewal of the Fund’s investment management agreement with DIMA (the "Fund Agreement" and together with the Portfolio Agreement and the Sub-Advisory Agreement, the "Agreements") in September 2016. The Portfolio’s Board of Trustees and the Fund’s Board of Trustees are collectively referred to as the "Board" or "Trustees."
In terms of the process that the Board followed prior to approving the Agreements, shareholders should know that:
— During the entire process, all of the Portfolio’s and the Fund’s Trustees were independent of DIMA and its affiliates (the "Independent Trustees").
— The Board met frequently during the past year to discuss fund matters and dedicated a substantial amount of time to contract review matters. Over the course of several months, the Board’s Contract Committee reviewed extensive materials received from DIMA, independent third parties and independent counsel. These materials included an analysis of performance, fees and expenses, and profitability from a fee consultant retained by the Independent Trustees (the "Fee Consultant"). The Board also received extensive information throughout the year regarding performance of the Portfolio and the Fund.
— The Independent Trustees regularly meet privately with counsel to discuss contract review and other matters. In addition, the Independent Trustees were advised by the Fee Consultant in the course of their review of the Portfolio’s and the Fund’s contractual arrangements and considered a comprehensive report prepared by the Fee Consultant in connection with their deliberations.
— In connection with reviewing the Agreements, the Board also reviewed the terms of the Fund’s distribution agreement, administrative services agreement, transfer agency agreement and other material service agreements.
— Based on its evaluation of the information provided, the Contract Committee presented its findings and recommendations to the Board. The Board then reviewed the Contract Committee’s findings and recommendations.
In connection with the contract review process, the Contract Committee and the Board considered the factors discussed below, among others. The Board also considered that DIMA and its predecessors have managed the Portfolio and the Fund since their inception, and the Board believes that a long-term relationship with a capable, conscientious advisor is in the best interests of the Portfolio and the Fund. The Board considered, generally, that shareholders chose to invest or remain invested in the Fund knowing that DIMA managed the Portfolio and the Fund, and that the Fund Agreement was approved by the Fund’s shareholders. DIMA is part of Deutsche Bank AG’s ("Deutsche Bank") Asset Management ("Deutsche AM") division. Deutsche AM is a global asset management business that offers a wide range of investing expertise and resources, including research capabilities in many countries throughout the world. Deutsche Bank has advised the Board that the U.S. asset management business continues to be a critical and integral part of Deutsche Bank, and that Deutsche Bank will continue to invest in Deutsche AM and seek to enhance Deutsche AM’s investment platform. Deutsche Bank also has confirmed its commitment to maintaining strong legal and compliance groups within the Deutsche AM division.
As part of the contract review process, the Board carefully considered the fees and expenses of each Deutsche fund overseen by the Board in light of the fund’s performance. In many cases, this led to the negotiation and implementation of expense caps. As part of these negotiations, the Board indicated that it would consider relaxing these caps in future years following sustained improvements in performance, among other considerations.
While shareholders may focus primarily on fund performance and fees, the Board considers these and many other factors, including the quality and integrity of DIMA’s and NTI’s personnel and such other issues as back-office operations, fund valuations, and compliance policies and procedures.
Nature, Quality and Extent of Services. The Board considered the terms of the Agreements, including the scope of advisory services provided under the Agreements. The Board noted that, under the Agreements, DIMA and NTI provide portfolio management services to the Portfolio and the Fund and that, pursuant to separate administrative services agreements, DIMA provides administrative services to the Portfolio and the Fund. The Board considered the experience and skills of senior management and investment personnel and the resources made available to such personnel. Throughout the course of the year, the Board also received information regarding DIMA’s oversight of sub-advisers, including NTI. The Board reviewed the Portfolio’s and the Fund’s performance over short-term and long-term periods and compared those returns to various agreed-upon performance measures, including market index(es) and a peer universe compiled using information supplied by Morningstar Direct ("Morningstar"), an independent fund data service. The Board also noted that it has put into place a process of identifying "Focus Funds" (e.g., funds performing poorly relative to a peer universe), and receives additional reporting from DIMA regarding such funds and, where appropriate, DIMA’s plans to address underperformance. The Board believes this process is an effective manner of identifying and addressing underperforming funds. Based on the information provided, the Board noted that for the one-, three- and five-year periods ended December 31, 2015, the Fund’s performance (Institutional Class shares) was in the 1st quartile of the applicable Morningstar universe (the 1st quartile being the best performers and the 4th quartile being the worst performers).
Fees and Expenses. The Board considered the Portfolio’s and the Fund’s investment management fee schedules, the Portfolio’s sub-advisory fee schedule, the Fund’s operating expenses and total expense ratios, and comparative information provided by Broadridge Financial Solutions, Inc. ("Broadridge") and the Fee Consultant regarding investment management fee rates paid to other investment advisors by similar funds (1st quartile being the most favorable and 4th quartile being the least favorable). With respect to management fees paid to other investment advisors by similar funds, the Board noted that the contractual fee rates paid by the Portfolio and the Fund, which include 0.03% and 0.10% fees paid to DIMA under the respective administrative services agreements, were equal to the median (2nd quartile) of the applicable Broadridge peer group (based on Broadridge data provided as of December 31, 2015). The Board noted that, although shareholders of the fund indirectly bear the Portfolio’s management fee, the Fund does not charge an additional investment management fee. With respect to the sub-advisory fee paid to NTI, the Board noted that the fee is paid by DIMA out of its fee and not directly by the Portfolio. The Board noted that the Fund’s Institutional Class shares total (net) operating expenses, which include Portfolio expenses allocated to the Fund, were expected to be higher than the median (3rd quartile) of the applicable Broadridge expense universe (based on Broadridge data provided as of December 31, 2015) ("Broadridge Universe Expenses"). The Board also reviewed data comparing each share class’s total (net) operating expenses to the applicable Broadridge Universe Expenses. The Board noted that the expense limitations agreed to by DIMA were expected to help the Fund’s total (net) operating expenses remain competitive. The Board considered the management fee rate as compared to fees charged by DIMA to comparable Deutsche U.S. registered funds ("Deutsche Funds") and considered differences between the Portfolio and the Fund and the comparable Deutsche Funds. The information requested by the Board as part of its review of fees and expenses also included information about institutional accounts (including any sub-advised funds and accounts) and funds offered primarily to European investors ("Deutsche Europe funds") managed by Deutsche AM. The Board noted that DIMA indicated that Deutsche AM does not manage any institutional accounts or Deutsche Europe funds comparable to the Portfolio and the Fund.
On the basis of the information provided, the Board concluded that management fees were reasonable and appropriate in light of the nature, quality and extent of services provided by DIMA and NTI.
Profitability. The Board reviewed detailed information regarding revenues received by DIMA under the Agreements. The Board considered the estimated costs and pre-tax profits realized by DIMA from advising the Deutsche Funds, as well as estimates of the pre-tax profits attributable to managing the Fund in particular. The Board also received information regarding the estimated enterprise-wide profitability of DIMA and its affiliates with respect to all fund services in totality and by fund. The Board and the Fee Consultant reviewed DIMA’s methodology in allocating its costs to the management of the Fund. Based on the information provided, the Board concluded that the pre-tax profits realized by DIMA in connection with the management of the Fund were not unreasonable. The Board also reviewed certain publicly available information regarding the profitability of certain similar investment management firms. The Board noted that while information regarding the profitability of such firms is limited (and in some cases is not necessarily prepared on a comparable basis), DIMA and its affiliates’ overall profitability with respect to the Deutsche Funds (after taking into account distribution and other services provided to the funds by DIMA and its affiliates) was lower than the overall profitability levels of most comparable firms for which such data was available. The Board did not consider the profitability of NTI with respect to the Fund. The Board noted that DIMA pays NTI’s fee out of its management fee, and its understanding that the Portfolio’s sub-advisory fee schedule was the product of an arm’s length negotiation with DIMA.
Economies of Scale. The Board considered whether there are economies of scale with respect to the management of the Portfolio and the Fund and whether the Portfolio and the Fund benefit from any economies of scale. In this regard, the Board observed that while the Portfolio’s and the Fund’s current investment management fee schedule does not include breakpoints, the Portfolio’s and the Fund’s fee schedule represents an appropriate sharing between the Portfolio and the Fund and DIMA of such economies of scale as may exist in the management of the Portfolio and the Fund at current asset levels.
Other Benefits to DIMA and NTI and Their Affiliates. The Board also considered the character and amount of other incidental benefits received by DIMA and NTI and their affiliates, including any fees received by DIMA for administrative services provided to the Portfolio and to the Fund. The Board also considered benefits to DIMA and NTI related to brokerage and soft-dollar allocations, including allocating brokerage to pay for research generated by parties other than the executing broker dealers, which pertain primarily to funds investing in equity securities, along with the incidental public relations benefits to DIMA and NTI related to Deutsche Funds advertising and cross-selling opportunities among DIMA products and services. The Board considered these benefits in reaching its conclusion that the Fund’s management fees were reasonable.
Compliance. The Board considered the significant attention and resources dedicated by DIMA to documenting and enhancing its compliance processes in recent years. The Board noted in particular (i) the experience, seniority and time commitment of the individuals serving as DIMA’s and the Fund’s chief compliance officers; (ii) the large number of DIMA compliance personnel; and (iii) the substantial commitment of resources by DIMA and its affiliates to compliance matters. The Board also considered the attention and resources dedicated by DIMA to the oversight of the investment sub-advisor’s compliance program and compliance with the applicable fund policies and procedures.
Based on all of the information considered and the conclusions reached, the Board unanimously determined that the continuation of the Agreements is in the best interests of the Portfolio and the Fund. In making this determination, the Board did not give particular weight to any single factor identified above. The Board considered these factors over the course of numerous meetings, certain of which were in executive session with only the Independent Trustees and counsel present. It is possible that individual Independent Trustees may have weighed these factors differently in reaching their individual decisions to approve the continuation of the Agreements.
Board Members and Officers
The following table presents certain information regarding the Board Members and Officers of the fund. Each Board Member's year of birth is set forth in parentheses after his or her name. Unless otherwise noted, (i) each Board Member has engaged in the principal occupation(s) noted in the table for at least the most recent five years, although not necessarily in the same capacity; and (ii) the address of each Independent Board Member is c/o Keith R. Fox, Deutsche Funds Board Chair, c/o Thomas R. Hiller, Ropes & Gray LLP, Prudential Tower, 800 Boylston Street, Boston, MA 02199-3600. Except as otherwise noted below, the term of office for each Board Member is until the election and qualification of a successor, or until such Board Member sooner dies, resigns, is removed or as otherwise provided in the governing documents of the fund. Because the fund does not hold an annual meeting of shareholders, each Board Member will hold office for an indeterminate period. The Board Members may also serve in similar capacities with other funds in the fund complex.
| Independent Board Members | |||
| Name, Year of Birth, Position with the Fund and Length of Time Served1 | Business Experience and Directorships During the Past Five Years | Number of Funds in Deutsche Fund Complex Overseen | Other Directorships Held by Board Member |
Keith R. Fox, CFA (1954) Chairperson since 2017,2 and Board Member since 1996 | Managing General Partner, Exeter Capital Partners (a series of private investment funds) (since 1986). Directorships: Progressive International Corporation (kitchen goods importer and distributor); The Kennel Shop (retailer); former Chairman, National Association of Small Business Investment Companies; former Directorships: BoxTop Media Inc. (advertising); Sun Capital Advisers Trust (mutual funds) (2011–2012) | 98 | — |
Kenneth C. Froewiss (1945) Vice Chairperson since 2017,2 Board Member since 2001, and Chairperson (2013– December 31, 2016) | Retired Clinical Professor of Finance, NYU Stern School of Business (1997–2014); Member, Finance Committee, Association for Asian Studies (2002–present); Director, Mitsui Sumitomo Insurance Group (US) (2004–present); prior thereto, Managing Director, J.P. Morgan (investment banking firm) (until 1996) | 98 | — |
John W. Ballantine (1946) Board Member since 1999 | Retired; formerly, Executive Vice President and Chief Risk Management Officer, First Chicago NBD Corporation/The First National Bank of Chicago (1996–1998); Executive Vice President and Head of International Banking (1995–1996); former Directorships: Director and former Chairman of the Board, Healthways, Inc.3 (population well-being and wellness services) (2003–2014); Stockwell Capital Investments PLC (private equity); First Oak Brook Bancshares, Inc. and Oak Brook Bank; Prisma Energy International
| 98 | Portland General Electric3 (utility company) (2003– present) |
Henry P. Becton, Jr. (1943) Board Member since 1990 | Vice Chair and former President, WGBH Educational Foundation. Directorships: Public Radio International; Public Radio Exchange (PRX); The Pew Charitable Trusts (charitable organization); former Directorships: Becton Dickinson and Company3 (medical technology company); Belo Corporation3 (media company); The PBS Foundation; Association of Public Television Stations; Boston Museum of Science; American Public Television; Concord Academy; New England Aquarium; Mass. Corporation for Educational Telecommunications; Committee for Economic Development; Public Broadcasting Service; Connecticut College; North Bennett Street School (Boston) | 98 | — |
Dawn-Marie Driscoll (1946) Board Member since 1987 | Emeritus Executive Fellow, Center for Business Ethics, Bentley University; formerly: President, Driscoll Associates (consulting firm); Partner, Palmer & Dodge (law firm) (1988–1990); Vice President of Corporate Affairs and General Counsel, Filene's (retail) (1978–1988). Directorships: Advisory Board, Center for Business Ethics, Bentley University; Trustee and former Chairman of the Board, Southwest Florida Community Foundation (charitable organization); former Directorships: ICI Mutual Insurance Company (2007–2015); Sun Capital Advisers Trust (mutual funds) (2007–2012), Investment Company Institute (audit, executive, nominating committees) and Independent Directors Council (governance, executive committees) | 98 | — |
Paul K. Freeman (1950) Board Member since 1993 | Consultant, World Bank/Inter-American Development Bank; Chair, Independent Directors Council; Investment Company Institute (executive and nominating committees); formerly, Chairman of Education Committee of Independent Directors Council; Project Leader, International Institute for Applied Systems Analysis (1998–2001); Chief Executive Officer, The Eric Group, Inc. (environmental insurance) (1986–1998); Directorships: Denver Zoo Foundation (December 2012–present); former Directorships: Prisma Energy International | 98 | — |
Richard J. Herring (1946) Board Member since 1990 | Jacob Safra Professor of International Banking and Professor, Finance Department, The Wharton School, University of Pennsylvania (since July 1972); Co-Director, Wharton Financial Institutions Center; formerly: Vice Dean and Director, Wharton Undergraduate Division (July 1995–June 2000); Director, Lauder Institute of International Management Studies (July 2000–June 2006) | 98 | Director, Aberdeen Singapore and Japan Funds (since 2007); Independent Director of Barclays Bank Delaware (since September 2010) |
William McClayton (1944) Board Member since 2004, and Vice Chairperson (2013– December 31, 2016) | Private equity investor (since October 2009); previously, Managing Director, Diamond Management & Technology Consultants, Inc. (global consulting firm) (2001–2009); Directorship: Board of Managers, YMCA of Metropolitan Chicago; formerly: Senior Partner, Arthur Andersen LLP (accounting) (1966–2001); Trustee, Ravinia Festival | 98 | — |
Rebecca W. Rimel (1951) Board Member since 1995 | President, Chief Executive Officer and Director, The Pew Charitable Trusts (charitable organization) (1994–present); formerly: Executive Vice President, The Glenmede Trust Company (investment trust and wealth management) (1983–2004); Board Member, Investor Education (charitable organization) (2004–2005); Trustee, Executive Committee, Philadelphia Chamber of Commerce (2001–2007); Director, Viasys Health Care3 (January 2007–June 2007); Trustee, Thomas Jefferson Foundation (charitable organization) (1994–2012) | 98 | Director, Becton Dickinson and Company3 (medical technology company) (2012– present); Director, BioTelemetry Inc.3 (health care) (2009– present) |
William N. Searcy, Jr. (1946) Board Member since 1993 | Private investor since October 2003; formerly: Pension & Savings Trust Officer, Sprint Corporation3 (telecommunications) (November 1989–September 2003); Trustee, Sun Capital Advisers Trust (mutual funds) (1998–2012) | 98 | — |
Jean Gleason Stromberg (1943) Board Member since 1997 | Retired. Formerly, Consultant (1997–2001); Director, Financial Markets U.S. Government Accountability Office (1996–1997); Partner, Norton Rose Fulbright, L.L.P. (law firm) (1978–1996); former Directorships: The William and Flora Hewlett Foundation (charitable organization) (2000–2015); Service Source, Inc. (nonprofit), Mutual Fund Directors Forum (2002–2004), American Bar Retirement Association (funding vehicle for retirement plans) (1987–1990 and 1994–1996) | 98 | — |
| Officers5 | |
| Name, Year of Birth, Position with the Fund and Length of Time Served6 | Business Experience and Directorships During the Past Five Years |
Brian E. Binder9 (1972) President and Chief Executive Officer, 2013–present | Managing Director4 and Head of US Product and Fund Administration, Deutsche Asset Management (2013–present); Director and President, Deutsche AM Service Company (since 2016); Director and Vice President, Deutsche AM Distributors, Inc. (since 2016); Director and President, DB Investment Managers, Inc. (since 2016); formerly, Head of Business Management and Consulting at Invesco, Ltd. (2010–2012) |
John Millette8 (1962) Vice President and Secretary, 1999–present | Director,4 Deutsche Asset Management; Chief Legal Officer and Secretary, Deutsche Investment Management Americas Inc. (2015–present); and Director and Vice President, Deutsche AM Trust Company (since 2016) |
Hepsen Uzcan7 (1974) Vice President, since 2016 Assistant Secretary, 2013–present | Director,4 Deutsche Asset Management |
Paul H. Schubert7 (1963) Chief Financial Officer, 2004–present Treasurer, 2005–present | Managing Director,4 Deutsche Asset Management, and Chairman, Director and President, Deutsche AM Trust Company (since 2013); Vice President, Deutsche AM Distributors, Inc. (since 2016); formerly, Director, Deutsche AM Trust Company (2004–2013) |
Caroline Pearson8 (1962) Chief Legal Officer, 2010–present | Managing Director,4 Deutsche Asset Management; Secretary, Deutsche AM Distributors, Inc.; and Secretary, Deutsche AM Service Company |
Scott D. Hogan8 (1970) Chief Compliance Officer, since 2016 | Director,4 Deutsche Asset Management |
Wayne Salit7 (1967) Anti-Money Laundering Compliance Officer, 2014–present | Director,4 Deutsche Asset Management; AML Compliance Officer, Deutsche AM Distributors, Inc.; formerly: Managing Director, AML Compliance Officer at BNY Mellon (2011–2014); and Director, AML Compliance Officer at Deutsche Bank (2004–2011) |
Paul Antosca8 (1957) Assistant Treasurer, 2007–present | Director,4 Deutsche Asset Management |
Diane Kenneally8 (1966) Assistant Treasurer, 2007–present | Director,4 Deutsche Asset Management |
1 The length of time served represents the year in which the Board Member joined the board of one or more Deutsche funds currently overseen by the Board.
2 Effective as of January 1, 2017.
3 A publicly held company with securities registered pursuant to Section 12 of the Securities Exchange Act of 1934.
4 Executive title, not a board directorship.
5 As a result of their respective positions held with the Advisor, these individuals are considered "interested persons" of the Advisor within the meaning of the 1940 Act. Interested persons receive no compensation from the fund.
6 The length of time served represents the year in which the officer was first elected in such capacity for one or more Deutsche funds.
7 Address: 60 Wall Street, New York, NY 10005.
8 Address: One Beacon Street, Boston, MA 02108.
9 Address: 222 South Riverside Plaza, Chicago, IL 60606.
The fund's Statement of Additional Information ("SAI") includes additional information about the Board Members. The SAI is available, without charge, upon request. If you would like to request a copy of the SAI, you may do so by calling the following toll-free number: (800) 728-3337.
Account Management Resources
| For More Information | The automated telephone system allows you to access personalized account information and obtain information on other Deutsche funds using either your voice or your telephone keypad. Certain account types within Class S also have the ability to purchase, exchange or redeem shares using this system. For more information, contact your financial advisor. You may also access our automated telephone system or speak with a Shareholder Service representative by calling: (800) 728-3337 |
| Web Site | deutschefunds.com View your account transactions and balances, trade shares, monitor your asset allocation, subscribe to fund and account updates by e-mail, and change your address, 24 hours a day. Obtain prospectuses and applications, blank forms, interactive worksheets, news about Deutsche funds, retirement planning information, and more. |
| Written Correspondence | Deutsche Asset Management PO Box 219151 |
| Proxy Voting | The fund's policies and procedures for voting proxies for portfolio securities and information about how the fund voted proxies related to its portfolio securities during the most recent 12-month period ended June 30 are available on our Web site — deutschefunds.com (click on "proxy voting"at the bottom of the page) — or on the SEC's Web site — sec.gov. To obtain a written copy of the fund's policies and procedures without charge, upon request, call us toll free at (800) 728-3337. |
| Portfolio Holdings | Following the fund's fiscal first and third quarter-end, a complete portfolio holdings listing is filed with the SEC on Form N-Q. This form will be available on the SEC's Web site at sec.gov, and it also may be reviewed and copied at the SEC's Public Reference Room in Washington, D.C. Information on the operation of the SEC's Public Reference Room may be obtained by calling (800) SEC-0330. The fund's portfolio holdings are also posted on deutschefunds.com from time to time. Please see the fund's current prospectus for more information. |
| Principal Underwriter | If you have questions, comments or complaints, contact: Deutsche AM Distributors, Inc. 222 South Riverside Plaza (800) 621-1148 |
| Investment Management | Deutsche Investment Management Americas Inc. ("DIMA" or the "Advisor"), which is part of Deutsche Asset Management, is the investment advisor for the fund. DIMA and its predecessors have more than 80 years of experience managing mutual funds and DIMA provides a full range of investment advisory services to both institutional and retail clients. DIMA is an indirect, wholly owned subsidiary of Deutsche Bank AG. Deutsche Bank AG is a major global banking institution engaged in a wide variety of financial services, including investment management, retail, private and commercial banking, investment banking and insurance. Deutsche Asset Management is the retail brand name in the U.S. for the asset management activities of Deutsche Bank AG and DIMA. Deutsche Asset Management is committed to delivering the investing expertise, insight and resources of this global investment platform to American investors. |
| Class S | Institutional Class | |
| Nasdaq Symbol | BTIEX | BTIIX |
| CUSIP Number | 25159R 205 | 25159R 106 |
| Fund Number | 815 | 565 |
Notes
Notes
Notes
Notes
Notes
Notes


December 31, 2016
Annual Report
to Shareholders
Deutsche S&P 500 Index Fund

Contents
Deutsche S&P 500 3 Letter to Shareholders 5 Portfolio Management Review 11 Performance Summary 13 Statement of Assets and Liabilities 14 Statement of Operations 16 Statements of Changes in Net Assets 17 Financial Highlights 20 Notes to Financial Statements 27 Report of Independent Registered Public Accounting Firm 28 Information About Your Fund's Expenses 29 Tax Information Deutsche Equity 500 Index Portfolio 31 Investment Portfolio 48 Statement of Assets and Liabilities 49 Statement of Operations 50 Statements of Changes in Net Assets 51 Financial Highlights 52 Notes to Financial Statements 59 Report of Independent Registered Public Accounting Firm
60 Advisory Agreement and Sub-Advisory Agreement Board Considerations and Fee Evaluation 65 Board Members and Officers 70 Account Management Resources |
This report must be preceded or accompanied by a prospectus. To obtain a summary prospectus, if available, or prospectus for any of our funds, refer to the Account Management Resources information provided in the back of this booklet. We advise you to consider the fund's objectives, risks, charges and expenses carefully before investing. The summary prospectus and prospectus contain this and other important information about the fund. Please read the prospectus carefully before you invest.
Investing in derivatives entails special risks relating to liquidity, leverage and credit that may reduce returns and/or increase volatility. Various factors, including costs, cash flows and security selection, may cause the fund’s performance to differ from that of the index. The fund may lend securities to approved institutions. Stocks may decline in value. See the prospectus for details.
This fund is not sponsored, endorsed, sold, nor promoted by Standard & Poor's®, and Standard & Poor's makes no representation regarding the advisability of investing in the portfolio.
Deutsche Asset Management represents the asset management activities conducted by Deutsche Bank AG or any of its subsidiaries.
NOT FDIC/NCUA INSURED NO BANK GUARANTEE MAY LOSE VALUE NOT A DEPOSIT NOT INSURED BY ANY FEDERAL GOVERNMENT AGENCY
Letter to Shareholders
Dear Shareholder:
Today’s low-return investment environment — punctuated by periods of short-term volatility and plenty of opinions in the financial media — can be a challenge for those of us just trying to keep our portfolios moving forward.
Let’s face it: a report about the obstacles to economic growth grabs more attention than an article about the slow, steady improvement of the economy. The fact is, we continue to see the U.S. economy remaining on a moderate expansionary path. Although net exports are still challenged by modest global growth, most metrics suggest the labor market here at home continues to heal, which, along with low interest rates, is supporting the consumer.
Is action necessary? Numerous studies have found that acting impulsively on negative financial news can actually reduce your overall investment returns over time. That’s because there is a good chance you’ll miss the gains to be achieved if the market or a specific security recovers from a brief setback. So, assuming you have built your portfolio based on long-term needs and an honest assessment of your risk tolerance, short-term fluctuations should not cause an extreme level of worry.
As a global asset manager with decades of experience in helping investors through multiple market cycles, we want you to know and trust that our global intelligence, expertise and resources are here to support you. As always, we appreciate the opportunity to help you meet your goals.
Best regards,

 |
Brian Binder President, Deutsche Funds |
Assumptions, estimates and opinions contained in this document constitute our judgment as of the date of the document and are subject to change without notice. Any projections are based on a number of assumptions as to market conditions and there can be no guarantee that any projected results will be achieved. Past performance is not a guarantee of future results.
Portfolio Management Review (Unaudited)
Market Overview and Fund Performance
All performance information below is historical and does not guarantee future results. Returns shown are for Class A shares, unadjusted for sales charges. Investment return and principal fluctuate, so your shares may be worth more or less when redeemed. Current performance may differ from performance data shown. Please visit deutschefunds.com for the most recent month-end performance of all share classes. Fund performance includes reinvestment of all distributions. Unadjusted returns do not reflect sales charges and would have been lower if they had. Please refer to pages 11 through 12 for more complete performance information.
Investment Strategy The fund seeks to provide investment results that, before expenses, correspond to the total return of common stocks publicly traded in the United States, as represented by the Standard & Poor’s 500® Composite Stock Price Index (S&P 500 Index). |
Deutsche S&P 500 Index Fund returned 11.18% during 2016. Since the fund’s investment strategy is to replicate the performance of the Standard & Poor’s 500® (S&P 500) Index, the fund’s return is normally close to that of the index. The S&P 500 Index returned 11.96% for the 12-month period ending December 31, 2016. This marked the eighth consecutive year of positive performance for the index, as well as the thirteenth year of positive returns out of the past 14. The difference in return between the fund and the index is typically driven by transaction costs and fund expenses.
U.S. large-cap stocks recovered from a difficult start to post a robust, double-digit gain in 2016. The initial weakness in market performance, which encompassed the first six weeks of the year, represented a continuation of the concerns about slowing global growth and falling commodity prices that had weighed on returns late in 2015. This challenging environment abruptly changed for the better in mid-February, however, thanks to the aggressive actions of the world’s central banks. The Bank of Japan and the European Central Bank each cut interest rates into negative territory, while the U.S. Federal Reserve Board (the Fed) issued a series of statements indicating it would maintain its gradual, data-dependent approach to monetary policy.
These developments fueled a swift improvement in investor sentiment, touching off a powerful rebound in U.S. equities. The rally subsequently gained steam through the spring and summer, as commodity prices recovered and market participants became more optimistic about the economic outlook. While the bull market temporarily lost momentum in September and October amid the elevated uncertainty that characterized the run-up to the U.S. election, the surprising result of the vote led to improving expectations regarding economic growth. Stocks surged in the final two months of the year as a result, gaining 3.70% and 1.98% in November and December, respectively.
Commodity-Sensitive Stocks Outperform
The index gained a significant boost from the strength of the energy sector, which staged a substantial recovery from its poor showing in 2015. The price of oil rose approximately 50% from its February low to its high in June, leading to upward revisions to energy companies’ earnings estimates. While the integrated giants Exxon Mobil Corp. and Chevron Corp. made the largest contributions to performance, the sector also benefited from having the vast majority of its individual stocks close in positive territory.
The gain in the price of oil was accompanied by similar recoveries in other commodities, including gold and industrial metals. This favorable trend led to strong performance for the materials sector, another notable laggard in 2015. Companies in the steel and diversified mining industries performed particularly well, as did the chemical producers Dow Chemical Co. and E. I. du Pont de Nemours & Co.
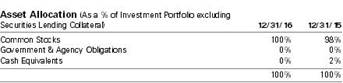
Financials Propelled by a Post-Election Rally
Financial stocks generated market-beating results in 2016, with broad-based gains across the category. Bank stocks such as JPMorgan Chase & Co. benefited from the prospect of rising interest rates in the year ahead, since this development would likely increase the margin between the rates at which banks borrow and lend. Insurance companies also gained ground, as rising rates would allow them to earn a higher return on their assets. Not least, investment banks, asset managers and exchange operators were aided by the combination of rising stock prices and increased trading activity. Financials delivered the bulk of their returns in the post-election rally, enabling the sector to close as the second-best performer in the S&P 500 Index.
Robust First-Half Returns for Dividend Stocks
Although the year ended with the markets anticipating multiple rate hikes in 2017, the outlook was quite different in the first half. The highly accommodative policies of the world’s central banks, together with the dovish commentary from the Fed, led to a sharp downturn in bond yields across the globe. By mid-year, in fact, a large swath of the global developed bond markets was actually trading with negative yields. This unusual development led income-oriented investors to look to higher-risk market segments as a way to earn more meaningful yields. Dividend stocks were a prime beneficiary of this shift, leading to outperformance for the utilities and telecommunications sectors in the first half. While both groups subsequently lost ground once investors began to anticipate a more active Fed in 2017, they nonetheless finished 2016 ahead of the index on the strength of their earlier outperformance.
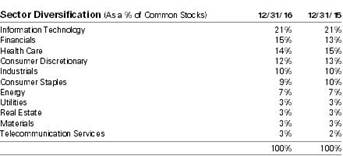
Technology and Industrials Outpace the Broader Market
Strong gains for several mega-cap technology stalwarts helped propel the sector to a market-beating return. Apple, Inc., Microsoft Corp. and Facebook, Inc. all finished with double-digit gains, providing a meaningful boost to the sector as a whole. The tech sector was further aided by the outstanding returns for semiconductor companies, including NVIDIA Corp., QUALCOMM, Inc. and Texas Instruments, Inc., among many others. Technology stocks, in general, were aided by the backdrop of positive investor sentiment and the improving outlook for global growth.
| "U.S. large-cap stocks recovered from a difficult start to post a robust, double-digit gain in 2016." |
Favorable economic conditions also provided a tailwind for industrials. The sector further benefited from the improvement in oil prices, since many companies in the category generate a meaningful percentage of their revenues from the energy sector. The strongest contributions came from the transportation industry — highlighted by strength in railroad and package-delivery stocks — as well as the aerospace/defense group, which was aided by the uptrend in global defense spending.
Consumer Stocks, Real Estate and Health Care Lag
The consumer staples, consumer discretionary, real estate and health care sectors all finished behind the headline index return in 2016, with health care the only group to register a loss.
Health care stocks spent most of the period under pressure from concerns about increased regulation regarding their pricing practices, resulting in double-digit losses for a number of biotechnology and pharmaceutical stocks. Consumer staples, for its part, was caught up in the move away from defensive dividend payers in the second half of the year. Similarly, the high-yielding real estate sector — which produced hearty gains in the first half — lagged considerably from the end of July onward as investors began to factor in the possibility of less-favorable Fed policy in 2017.
Consumer discretionary stocks generated a high single-digit return, but the category nonetheless trailed the overall market. Weakness in certain auto-related, apparel and housing stocks accounted for the underperformance, offsetting better returns in the cable/media and travel-related areas.
Outlook and Positioning
The fund invested in equity index futures during the year, with the goal of keeping the fund’s exposures in line with those of the index. This strategy had a neutral impact on performance.
We continue to follow a passive strategy designed to provide returns that approximate those of the benchmark.
| Ten Largest Equity Holdings at December 31, 2016 (18.9% of Net Assets) | |
1. Apple, Inc. Designs, manufactures and markets personal computers and related computing and mobile communications devices | 3.1% |
2. Microsoft Corp. Develops, manufactures, licenses, sells and supports software products | 2.4% |
3. Alphabet, Inc. Holding company with subsidiaries that provide Web-based search, maps, hardware products and various software applications | 2.4% |
4. Exxon Mobil Corp. Explorer and producer of oil and gas | 1.9% |
5. Johnson & Johnson Provider of health care products | 1.6% |
6. Berkshire Hathaway, Inc. Holding company of insurance business and a variety of other businesses | 1.6% |
7. JPMorgan Chase & Co. Provider of global financial services | 1.6% |
8. Amazon.com, Inc. Online retailer that offers a wide range of products | 1.5% |
9. General Electric Co. Diversified technology, media and financial services company | 1.4% |
10. Facebook, Inc. Operates a social networking Web site | 1.4% |
Portfolio holdings and characteristics are subject to change. Deutsche S&P 500 Index Fund (the "Fund") is a feeder fund that invests substantially all of its assets in a "master portfolio," the Deutsche Equity 500 Index Portfolio (the "Portfolio"), and owns a pro rata interest in the Portfolio's net assets. The Asset Allocation, Sector Diversification and Ten Largest Equity Holdings at December 31, 2016 are based on the holdings of Deutsche Equity 500 Index Portfolio. The above is based on the holdings of Deutsche Equity 500 Index Portfolio. For more complete details about the fund's investment portfolio, see page 31. A quarterly Fact Sheet is available on deutschefunds.com or upon request. Please see the Account Management Resources section on page 70 for contact information. | |
Subadvisor
Northern Trust Investments, Inc. ("NTI"), an indirect subsidiary of Northern Trust Corporation, is the subadvisor for the fund.
Portfolio Manager
Brent Reeder. Senior Vice President of Northern Trust Investments, Inc.
Portfolio Manager of the fund. Began managing the fund in 2007.
— Joined Northern Trust Investments, Inc. in 1993 and is responsible for the management of quantitative equity portfolios.
The views expressed reflect those of the portfolio management team only through the end of the period of the report as stated on the cover. The management team's views are subject to change at any time based on market and other conditions and should not be construed as a recommendation. Past performance is no guarantee of future results. Current and future portfolio holdings are subject to risk.
Terms to Know
The Standard & Poor’s 500 (S&P 500) Index is an unmanaged, capitalization-weighted index of 500 stocks. The index is designed to measure performance of the broad domestic economy through changes in the aggregate market value of 500 stocks representing all major industries. Index returns do not reflect any fees or expenses and it is not possible to invest directly into an index.
Contribution and detraction incorporate both a stock’s total return and its weighting in the index.
Consumer staples are the industries that manufacture and sell products such as food and beverages, prescription drugs and household products.
The consumer discretionary sector represents industries that produce goods and services that are not necessities in everyday life.
Performance Summary December 31, 2016 (Unaudited)
| Class A | 1-Year | 5-Year | 10-Year |
| Average Annual Total Returns as of 12/31/16 | |||
| Unadjusted for Sales Charge | 11.18% | 13.91% | 6.29% |
| Adjusted for the Maximum Sales Charge (max 4.50% load) | 6.18% | 12.87% | 5.80% |
| S&P 500® Index† | 11.96% | 14.66% | 6.95% |
| Class C | 1-Year | 5-Year | 10-Year |
| Average Annual Total Returns as of 12/31/16 | |||
| Unadjusted for Sales Charge | 10.44% | 13.14% | 5.53% |
| Adjusted for the Maximum Sales Charge (max 1.00% CDSC) | 10.44% | 13.14% | 5.53% |
| S&P 500® Index† | 11.96% | 14.66% | 6.95% |
| Class S | 1-Year | 5-Year | 10-Year |
| Average Annual Total Returns as of 12/31/16 | |||
| No Sales Charges | 11.52% | 14.26% | 6.60% |
| S&P 500® Index† | 11.96% | 14.66% | 6.95% |
Performance in the Average Annual Total Returns table above and the Growth of an Assumed $10,000 Investment line graph that follows is historical and does not guarantee future results. Investment return and principal fluctuate, so your shares may be worth more or less when redeemed. Current performance may differ from performance data shown. Please visit deutschefunds.com for the Fund's most recent month-end performance. Fund performance includes reinvestment of all distributions. Unadjusted returns do not reflect sales charges and would have been lower if they had.
The gross expense ratios of the Fund, as stated in the fee table of the prospectus dated May 1, 2016 are 0.64%, 1.32% and 0.34% for Class A, Class C and Class S shares, respectively, and may differ from the expense ratios disclosed in the Financial Highlights tables in this report.
Index returns do not reflect any fees or expenses and it is not possible to invest directly into an index.
Performance figures do not reflect the deduction of taxes that a shareholder would pay on fund distributions or the redemption of fund shares.
Generally accepted accounting principles require adjustments to be made to the net assets of the Fund at period end for financial reporting purposes only, and as such, the total return based on the unadjusted net asset value per share may differ from the total return reported in the financial highlights.
| Growth of an Assumed $10,000 Investment (Adjusted for Maximum Sales Charge) |
■ Deutsche S&P 500 Index Fund — Class A ■ S&P 500 Index† |
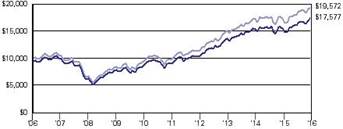 |
| Yearly periods ended December 31 |
The Fund's growth of an assumed $10,000 investment is adjusted for the maximum sales charge of 4.50%. This results in a net initial investment of $9,550.
The growth of $10,000 is cumulative.
Performance of other share classes will vary based on the sales charges and the fee structure of those classes.
† The Standard & Poor's 500 (S&P 500) Index is an unmanaged, capitalization-weighted index of 500 stocks. The index is designed to measure performance of the broad domestic economy through changes in the aggregate market value of 500 stocks representing all major industries. "Standard & Poor's," "S&P 500," "Standard & Poor's 500" and "500" are trademarks of The McGraw-Hill Companies Inc., and have been licensed for use by the Fund's investment advisor.
| Class A | Class C | Class S | |
| Net Asset Value | |||
| 12/31/16 | $ 26.69 | $ 26.64 | $ 26.75 |
| 12/31/15 | $ 25.20 | $ 25.15 | $ 25.25 |
| Distribution Information as of 12/31/16 | |||
| Income Dividends, Twelve Months | $ .42 | $ .23 | $ .49 |
| Capital Gain Distributions, Twelve Months | $ .90 | $ .90 | $ .90 |
Statement of Assets and Liabilities
| as of December 31, 2016 | |
| Assets | |
| Investment in the Deutsche Equity 500 Index Portfolio, at value | $ 896,695,343 |
| Receivable for Fund shares sold | 913,469 |
| Other assets | 13,819 |
| Total assets | 897,622,631 |
| Liabilities | |
| Payable for Fund shares redeemed | 1,586,545 |
| Accrued Trustees' fees | 1,185 |
| Other accrued expenses and payables | 606,817 |
| Total liabilities | 2,194,547 |
| Net assets, at value | $ 895,428,084 |
| Net Assets Consist of | |
| Undistributed net investment income | 13,127 |
| Net unrealized appreciation (depreciation) | 299,304,445 |
| Accumulated net realized gain (loss) | 7,544,066 |
| Paid-in capital | 588,566,446 |
| Net assets, at value | $ 895,428,084 |
| Net Asset Value | |
Class A Net Asset Value and redemption price per share ($191,651,327 ÷ 7,179,783 outstanding shares of beneficial interest, $.01 par value, unlimited number of shares authorized) | $ 26.69 |
| Maximum offering price per share (100 ÷ 95.50 of $26.69) | $ 27.95 |
Class C Net Asset Value, offering and redemption price (subject to contingent deferred sales charge) per share ($68,980,409 ÷ 2,589,189 outstanding shares of beneficial interest, $.01 par value, unlimited number of shares authorized) | $ 26.64 |
Class S Net Asset Value, offering and redemption price per share ($634,796,348 ÷ 23,728,802 outstanding shares of beneficial interest, $.01 par value, unlimited number of shares authorized) | $ 26.75 |
The accompanying notes are an integral part of the financial statements.
Statement of Operations
| for the year ended December 31, 2016 | |
| Investment Income | |
Income and expenses allocated from Deutsche Equity 500 Index Portfolio: Dividends (net of foreign taxes withheld of $65,713) | $ 19,568,974 |
| Interest | 1,723 |
| Income distributions — Deutsche Central Cash Management Government Fund | 46,675 |
| Securities lending income, net of borrower rebates | 76,934 |
| Expenses | (849,593) |
| Other income | 49,313 |
| Net investment income allocated from Deutsche Equity 500 Index Portfolio | 18,894,026 |
Expenses: Administration fee | 882,661 |
| Services to shareholders | 1,093,489 |
| Distribution and service fees | 1,112,675 |
| Professional fees | 46,929 |
| Reports to shareholders | 65,755 |
| Registration fees | 63,705 |
| Trustees' fees and expenses | 5,004 |
| Other | 8,888 |
| Total expenses before expense reductions | 3,279,106 |
| Expense reductions | (14,413) |
| Total expenses after expense reductions | 3,264,693 |
| Net investment income (loss) | 15,629,333 |
| Realized and Unrealized Gain (Loss) | |
Net realized gain (loss) allocated from Deutsche Equity 500 Index Portfolio: Investments | 63,461,622 |
| Futures | 1,462,790 |
| 64,924,412 | |
Change in net unrealized appreciation (depreciation) allocated from Deutsche Equity 500 Index Portfolio on: Investments | 15,795,989 |
| Futures | (216,780) |
| 15,579,209 | |
| Net gain (loss) | 80,503,621 |
| Net increase (decrease) in net assets resulting from operations | $ 96,132,954 |
The accompanying notes are an integral part of the financial statements.
Statements of Changes in Net Assets
| Increase (Decrease) in Net Assets | Years Ended December 31, | |
| 2016 | 2015 | |
Operations: Net investment income (loss) | $ 15,629,333 | $ 15,071,340 |
| Net realized gain (loss) | 64,924,412 | 41,743,094 |
| Change in net unrealized appreciation (depreciation) | 15,579,209 | (48,462,750) |
| Net increase (decrease) in net assets resulting from operations | 96,132,954 | 8,351,684 |
Distributions to shareholders from: Net investment income: Class A | (3,223,651) | (2,331,864) |
| Class B | — | (1,664) |
| Class C | (568,795) | (209,808) |
| Class S | (11,550,249) | (8,706,056) |
Realized gains: Class A | (6,323,649) | (6,171,077) |
| Class B | — | (7,461) |
| Class C | (2,218,247) | (1,604,958) |
| Class S | (20,679,968) | (17,528,211) |
| Total distributions | (44,564,559) | (36,561,099) |
Fund share transactions: Proceeds from shares sold | 114,650,050 | 138,575,605 |
| Reinvestment of distributions | 42,328,962 | 35,015,368 |
| Payment for shares redeemed | (205,089,404) | (188,905,365) |
| Net increase (decrease) in net assets from Fund share transactions | (48,110,392) | (15,314,392) |
| Increase (decrease) in net assets | 3,458,003 | (43,523,807) |
| Net assets at beginning of period | 891,970,081 | 935,493,888 |
| Net assets at end of period (including undistributed net investment income of $13,127 and $17,111, respectively) | $ 895,428,084 | $ 891,970,081 |
The accompanying notes are an integral part of the financial statements.
Financial Highlights
| Class A | Years Ended December 31, | |||||
| 2016 | 2015 | 2014 | 2013 | 2012 | ||
| Selected Per Share Data | ||||||
| Net asset value, beginning of period | $ 25.20 | $ 25.99 | $ 24.50 | $ 18.89 | $ 16.67 | |
Income (loss) from investment operations: Net investment incomea | .42 | .38 | .36 | .31 | .32 | |
| Net realized and unrealized gain (loss) | 2.39 | (.17) | 2.73 | 5.59 | 2.23 | |
| Total from investment operations | 2.81 | .21 | 3.09 | 5.90 | 2.55 | |
Less distributions from: Net investment income | (.42) | (.27) | (.38) | (.29) | (.31) | |
| Net realized gains | (.90) | (.73) | (1.22) | — | (.02) | |
| Total distributions | (1.32) | (1.00) | (1.60) | (.29) | (.33) | |
| Net asset value, end of period | $ 26.69 | $ 25.20 | $ 25.99 | $ 24.50 | $ 18.89 | |
| Total Return (%)b | 11.18c | .82 | 12.91c | 31.45 | 15.29c | |
| Ratios to Average Net Assets and Supplemental Data | ||||||
| Net assets, end of period ($ millions) | 192 | 219 | 233 | 233 | 203 | |
| Ratio of expenses before expense reductions, including expenses allocated from Deutsche Equity 500 Index Portfolio (%) | .61 | .64 | .65 | .67 | .68 | |
| Ratio of expenses after expense reductions, including expenses allocated from Deutsche Equity 500 Index Portfolio (%) | .61 | .64 | .65 | .67 | .67 | |
| Ratio of net investment income (%) | 1.63 | 1.47 | 1.40 | 1.44 | 1.73 | |
a Based on average shares outstanding during the period. b Total return does not reflect the effect of any sales charges. c Total return would have been lower had certain expenses not been reduced. | ||||||
| Class C | Years Ended December 31, | |||||
| 2016 | 2015 | 2014 | 2013 | 2012 | ||
| Selected Per Share Data | ||||||
| Net asset value, beginning of period | $ 25.15 | $ 25.95 | $ 24.47 | $ 18.86 | $ 16.64 | |
Income (loss) from investment operations: Net investment incomea | .24 | .21 | .18 | .17 | .19 | |
| Net realized and unrealized gain (loss) | 2.38 | (.18) | 2.73 | 5.59 | 2.23 | |
| Total from investment operations | 2.62 | .03 | 2.91 | 5.76 | 2.42 | |
Less distributions from: Net investment income | (.23) | (.10) | (.21) | (.15) | (.18) | |
| Net realized gains | (.90) | (.73) | (1.22) | — | (.02) | |
| Total distributions | (1.13) | (.83) | (1.43) | (.15) | (.20) | |
| Net asset value, end of period | $ 26.64 | $ 25.15 | $ 25.95 | $ 24.47 | $ 18.86 | |
| Total Return (%)b | 10.44 | .10 | 12.13 | 30.61 | 14.51 | |
| Ratios to Average Net Assets and Supplemental Data | ||||||
| Net assets, end of period ($ millions) | 69 | 58 | 51 | 44 | 25 | |
| Ratio of expenses including expenses allocated from Deutsche Equity 500 Index Portfolio (%) | 1.31 | 1.32 | 1.33 | 1.34 | 1.35 | |
| Ratio of net investment income (%) | .93 | .79 | .72 | .78 | 1.06 | |
a Based on average shares outstanding during the period. b Total return does not reflect the effect of any sales charges. | ||||||
| Class S | Years Ended December 31, | |||||
| 2016 | 2015 | 2014 | 2013 | 2012 | ||
| Selected Per Share Data | ||||||
| Net asset value, beginning of period | $ 25.25 | $ 26.05 | $ 24.56 | $ 18.93 | $ 16.70 | |
Income (loss) from investment operations: Net investment incomea | .49 | .46 | .44 | .38 | .36 | |
| Net realized and unrealized gain (loss) | 2.40 | (.18) | 2.73 | 5.61 | 2.25 | |
| Total from investment operations | 2.89 | .28 | 3.17 | 5.99 | 2.61 | |
Less distributions from: Net investment income | (.49) | (.35) | (.46) | (.36) | (.36) | |
| Net realized gains | (.90) | (.73) | (1.22) | — | (.02) | |
| Total distributions | (1.39) | (1.08) | (1.68) | (.36) | (.38) | |
| Net asset value, end of period | $ 26.75 | $ 25.25 | $ 26.05 | $ 24.56 | $ 18.93 | |
| Total Return (%) | 11.52 | 1.09 | 13.25 | 31.89 | 15.65 | |
| Ratios to Average Net Assets and Supplemental Data | ||||||
| Net assets, end of period ($ millions) | 635 | 615 | 651 | 602 | 485 | |
| Ratio of expenses including expenses allocated from Deutsche Equity 500 Index Portfolio (%) | .33 | .34 | .34 | .36 | .38 | |
| Ratio of net investment income (%) | 1.90 | 1.76 | 1.70 | 1.76 | 1.97 | |
| a Based on average shares outstanding during the period. | ||||||
Notes to Financial Statements
A. Organization and Significant Accounting Policies
Deutsche S&P 500 Index Fund (the "Fund") is a diversified series of the Deutsche Institutional Funds (the "Trust"), which is registered under the Investment Company Act of 1940, as amended (the "1940 Act"), as an open-end management investment company organized as a Massachusetts business trust.
The Fund, a feeder fund, seeks to achieve its investment objective by investing all of its investable assets in a master portfolio, Deutsche Equity 500 Index Portfolio (the "Portfolio"), a diversified open-end management investment company registered under the 1940 Act and organized as a New York trust advised by Deutsche Investment Management Americas Inc. ("DIMA" or the "Advisor"), an indirect, wholly owned subsidiary of Deutsche Bank AG. A master/feeder fund structure is one in which a fund (a "feeder fund"), instead of investing directly in a portfolio of securities, invests most or all of its investment assets in a separate registered investment company (the "master fund") with substantially the same investment objective and policies as the feeder fund. Such a structure permits the pooling of assets of two or more feeder funds, preserving separate identities or distribution channels at the feeder fund level. On December 31, 2016, the Fund owned approximately 53% of the Portfolio.
The Fund offers multiple classes of shares which provide investors with different purchase options. Class A shares are subject to an initial sales charge. Class B shares automatically converted to Class A shares on February 10, 2016 and are no longer offered. Class B shares were not subject to an initial sales charge and were subject to higher ongoing expenses than Class A shares and a contingent deferred sales charge payable upon certain redemptions. Class C shares are not subject to an initial sales charge but are subject to higher ongoing expenses than Class A shares and a contingent deferred sales charge payable upon certain redemptions within one year of purchase. Class C shares do not automatically convert into another class. Class S shares are not subject to initial or contingent deferred sales charges and are only available to a limited group of investors.
Investment income, realized and unrealized gains and losses and certain fund-level expenses and expense reductions, if any, are borne pro rata on the basis of relative net assets by the holders of all classes of shares, except that each class bears certain expenses unique to that class such as distribution and services fees, services to shareholders and certain other class-specific expenses. Differences in class-level expenses may result in payment of different per share dividends by class. All shares of the Fund have equal rights with respect to voting subject to class-specific arrangements.
The Fund's financial statements are prepared in accordance with accounting principles generally accepted in the United States of America ("U.S. GAAP") which require the use of management estimates. Actual results could differ from those estimates. The Fund qualifies as an investment company under Topic 946 of Accounting Standards Codification of U.S. GAAP. The policies described below are followed consistently by the Fund in the preparation of its financial statements. The financial statements of the Portfolio, including the Investment Portfolio, are contained elsewhere in this report and should be read in conjunction with the Fund's financial statements.
Security Valuation. The Fund records its investment in the Portfolio at value, which reflects its proportionate interest in the net assets of the Portfolio. Valuation of the securities held by the Portfolio is discussed in the notes to the Portfolio's financial statements included elsewhere in this report.
Disclosure about the classification of fair value measurements is included in a table following the Portfolio's Investment Portfolio.
Federal Income Taxes. The Fund's policy is to comply with the requirements of the Internal Revenue Code, as amended, which are applicable to regulated investment companies, and to distribute all of its taxable income to its shareholders. Accordingly, the Fund paid no federal income taxes and no federal income tax provision was required.
The Fund has reviewed the tax positions for the open tax years as of December 31, 2016, and has determined that no provision for income tax and/or uncertain tax provisions is required in the Fund's financial statements. The Fund's federal tax returns for the prior three fiscal years remain open subject to examination by the Internal Revenue Service.
Distribution of Income and Gains. Distributions from net investment income of the Fund are declared and distributed to shareholders quarterly. Net realized gains from investment transactions, in excess of available capital loss carryforwards, would be taxable to the Fund if not distributed, and, therefore, will be distributed to shareholders at least annually. The Fund may also make additional distributions for tax purposes if necessary.
The timing and characterization of certain income and capital gain distributions are determined annually in accordance with federal tax regulations which may differ from accounting principles generally accepted in the United States of America. These differences primarily relate to investments in futures contracts and certain securities sold at a loss. As a result, net investment income (loss) and net realized gain (loss) on investment transactions for a reporting period may differ significantly from distributions during such period. Accordingly, the Fund may periodically make reclassifications among certain of its capital accounts without impacting the net asset value of the Fund.
At December 31, 2016, the Fund's components of distributable earnings on a tax basis were as follows:
| Undistributed ordinary income* | $ 40,186 |
| Undistributed net long-term capital gains | $ 7,261,702 |
At December 31, 2016, the tax character of distributions paid to shareholders by the Fund is summarized as follows:
| Years Ended December 31, | ||
| 2016 | 2015 | |
| Distributions from ordinary income* | $ 15,812,609 | $ 15,301,459 |
| Distributions from long-term capital gains | $ 28,751,950 | $ 21,259,640 |
* For tax purposes, short-term capital gain distributions are considered ordinary income distributions.
Contingencies. In the normal course of business, the Fund may enter into contracts with service providers that contain general indemnification clauses. The Fund's maximum exposure under these arrangements is unknown, as this would involve future claims that may be made against the Fund that have not yet been made. However, based on experience, the Fund expects the risk of loss to be remote.
Other. The Fund receives a daily allocation of the Portfolio's income, expenses and net realized and unrealized gains and losses in proportion to its investment in the Portfolio. Expenses directly attributed to a fund are charged to that fund, while expenses which are attributable to the Trust are allocated among the funds in the Trust on the basis of relative net assets.
B. Related Parties
Management Agreement. Under its Investment Management Agreement with the Fund, the Advisor serves as investment manager to the Fund. The Advisor receives a management fee from the Portfolio pursuant to the master/feeder structure noted above in Note A.
Pursuant to the Investment Management Agreement, the Fund pays no management fee to the Advisor so long as the Fund is a feeder fund that invests substantially all of its assets in the Portfolio. In the event the Board of Trustees determines it is in the best interests of the Fund to withdraw its investment from the Portfolio, the Advisor may become responsible for directly managing the assets of the Fund under the Investment Management Agreement. In such event, the Fund would pay the Advisor an annual fee (exclusive of any applicable waivers/reimbursements) of 0.15% of the Fund's average daily net assets, accrued daily and payable monthly.
For the period from January 1, 2016 through September 30, 2016 (through February 10, 2016 for Class B shares), the Advisor had contractually agreed to waive its fees and/or reimburse fund expenses, including expenses of the Portfolio allocated to the Fund, to the extent necessary to maintain the total annual operating expenses (excluding certain expenses such as extraordinary expenses, taxes, brokerage and interest expense) of each class as follows:
| Class A | .61% |
| Class B | 1.36% |
| Class C | 1.36% |
| Class S | .36% |
Effective October 1, 2016 through September 30, 2017, the Advisor has contractually agreed to waive its fees and/or reimburse fund expenses, including expenses of the Portfolio allocated to the Fund, to the extent necessary to maintain the total annual operating expenses (excluding certain expenses such as extraordinary expenses, taxes, brokerage and interest expense) of each class as follows:
| Class A | .60% |
| Class C | 1.35% |
| Class S | .35% |
For the year ended December 31, 2016 (through February 10, 2016 for Class B shares), fees waived and/or expenses reimbursed for each class are as follows:
| Class A | $ 14,334 |
| Class B | 79 |
| $ 14,413 |
Administration Fee. Pursuant to an Administrative Services Agreement, DIMA provides most administrative services to the Fund. For all services provided under the Administrative Services Agreement, the Fund pays the Advisor an annual fee ("Administration Fee") of 0.10% of the Fund's average daily net assets, computed and accrued daily and payable monthly. For the year ended December 31, 2016, the Administration Fee was $882,661, of which $76,599 is unpaid.
Service Provider Fees. Deutsche AM Service Company ("DSC"), an affiliate of the Advisor, is the transfer agent, dividend-paying agent and shareholder service agent of the Fund. Pursuant to a sub-transfer agency agreement between DSC and DST Systems, Inc. ("DST"), DSC has delegated certain transfer agent, dividend-paying agent and shareholder service agent functions to DST. DSC compensates DST out of the shareholder servicing fee it receives from the Fund. For the year ended December 31, 2016 (through February 10, 2016 for Class B shares), the amounts charged to the Fund by DSC were as follows:
| Services to Shareholders | Total Aggregated | Unpaid at December 31, 2016 |
| Class A | $ 159,612 | $ 33,379 |
| Class B | 71 | — |
| Class C | 7,197 | 1,826 |
| Class S | 415,928 | 104,059 |
| $ 582,808 | $ 139,264 |
Distribution and Service Agreement. Under the Fund's Class B and C 12b-1 Plans, Deutsche AM Distributors, Inc. ("DDI"), a subsidiary of the Advisor, receives a fee ("Distribution Fee") of 0.75% of average daily net assets of each of Class B and C shares. In accordance with the Fund's Underwriting and Distribution Services Agreement, DDI enters into related selling group agreements with various firms at various rates for sales of Class B and C shares. For the year ended December 31, 2016 (through February 10, 2016 for Class B shares), the Distribution Fee was as follows:
| Distribution Fee | Total Aggregated | Unpaid at December 31, 2016 |
| Class B | $ 91 | $ — |
| Class C | 459,187 | 43,423 |
| $ 459,278 | $ 43,423 |
In addition, DDI provides information and administrative services for a fee ("Service Fee") to Class A, B and C shareholders at an annual rate of up to 0.25% of average daily net assets for each such class. DDI in turn has various agreements with financial services firms that provide these services and pays these fees based upon the assets of shareholder accounts the firms service. For the year ended December 31, 2016 (through February 10, 2016 for Class B shares), the Service Fee was as follows:
| Service Fee | Total Aggregated | Unpaid at December 31, 2016 | Annual Rate |
| Class A | $ 500,885 | $ 120,683 | .24% |
| Class B | 25 | — | .21% |
| Class C | 152,487 | 40,507 | .25% |
| $ 653,397 | $ 161,190 |
Underwriting Agreement and Contingent Deferred Sales Charge. DDI is the principal underwriter for the Fund. Underwriting commissions paid to DDI in connection with the distribution of Class A shares for the year ended December 31, 2016 aggregated $18,363.
In addition, DDI receives any contingent deferred sales charge ("CDSC") from Class B share redemptions occurring within six years of purchase and Class C share redemptions occurring within one year of purchase. There is no such charge upon redemption of any share appreciation or reinvested dividends. The CDSC is based on declining rates ranging from 4% to 1% for Class B and 1% for Class C, of the value of the shares redeemed. For the year ended December 31, 2016, the CDSC for Class C shares aggregated $22,007. A deferred sales charge of up to 1% is assessed on certain redemptions of Class A shares. For the year ended December 31, 2016, DDI received $7,156 for Class A shares.
Typesetting and Filing Service Fees. Under an agreement with DIMA, DIMA is compensated for providing typesetting and certain regulatory filing services to the Fund. For the year ended December 31, 2016, the amount charged to the Fund by DIMA included in the Statement of Operations under "Reports to shareholders" aggregated $22,930, of which $9,417 is unpaid.
Trustees' Fees and Expenses. The Fund paid retainer fees to each Trustee not affiliated with the Advisor, plus specified amounts to the Board Chairperson and Vice Chairperson and to each committee Chairperson.
C. Share Transactions
The following table summarizes share and dollar activity in the Fund:
| Year Ended December 31, 2016 | Year Ended December 31, 2015 | |||
| Shares | Dollars | Shares | Dollars | |
| Shares sold | ||||
| Class A | 1,987,537 | $ 50,333,325 | 2,513,467 | $ 65,140,639 |
| Class B | — | — | 1,167 | 28,824 |
| Class C | 796,400 | 20,446,892 | 674,313 | 17,459,484 |
| Class S | 1,700,968 | 43,869,833 | 2,153,371 | 55,946,658 |
| $ 114,650,050 | $ 138,575,605 | |||
| Shares issued to shareholders in reinvestment of distributions | ||||
| Class A | 341,886 | $ 9,127,030 | 326,523 | $ 8,310,447 |
| Class B | — | — | 290 | 7,495 |
| Class C | 99,881 | 2,674,505 | 69,463 | 1,760,801 |
| Class S | 1,141,345 | 30,527,427 | 977,027 | 24,936,625 |
| $ 42,328,962 | $ 35,015,368 | |||
| Shares redeemed | ||||
| Class A | (3,837,042) | $ (99,669,463) | (3,104,526) | $ (80,466,391) |
| Class B | (6,697)* | (155,375)* | (38,879) | (1,014,663) |
| Class C | (617,791) | (15,691,553) | (383,925) | (9,885,699) |
| Class S | (3,461,956) | (89,573,013) | (3,769,390) | (97,538,612) |
| $ (205,089,404) | $ (188,905,365) | |||
| Net increase (decrease) | ||||
| Class A | (1,507,619) | $ (40,209,108) | (264,536) | $ (7,015,305) |
| Class B | (6,697)* | (155,375)* | (37,422) | (978,344) |
| Class C | 278,490 | 7,429,844 | 359,851 | 9,334,586 |
| Class S | (619,643) | (15,175,753) | (638,992) | (16,655,329) |
| $ (48,110,392) | $ (15,314,392) | |||
* For the period from January 1, 2016 to February 10, 2016 (see Note A).
Report of Independent Registered Public Accounting Firm
To the Board of Trustees of Deutsche Institutional Funds and the Shareholders of Deutsche S&P 500 Index Fund:
In our opinion, the accompanying statement of assets and liabilities, and the related statements of operations and of changes in net assets and the financial highlights present fairly, in all material respects, the financial position of Deutsche S&P 500 Index Fund (the "Fund") as of December 31, 2016, and the results of its operations, the changes in its net assets and the financial highlights for each of the periods indicated therein, in conformity with accounting principles generally accepted in the United States of America. These financial statements and financial highlights (hereafter referred to as "financial statements") are the responsibility of the Fund's management. Our responsibility is to express an opinion on these financial statements based on our audits. We conducted our audits of these financial statements in accordance with the standards of the Public Company Accounting Oversight Board (United States). Those standards require that we plan and perform the audit to obtain reasonable assurance about whether the financial statements are free of material misstatement. An audit includes examining, on a test basis, evidence supporting the amounts and disclosures in the financial statements, assessing the accounting principles used and significant estimates made by management, and evaluating the overall financial statement presentation. We believe that our audits, which included confirmation of securities as of December 31, 2016 by correspondence with the transfer agent, provide a reasonable basis for our opinion.
| Boston, Massachusetts February 24, 2017 | PricewaterhouseCoopers LLP |
Information About Your Fund's Expenses
As an investor of the Fund, you incur two types of costs: ongoing expenses and transaction costs. Ongoing expenses include management fees, distribution and service (12b-1) fees and other Fund expenses. Examples of transaction costs include sales charges (loads) and account maintenance fees, which are not shown in this section. The following tables are intended to help you understand your ongoing expenses (in dollars) of investing in the Fund and to help you compare these expenses with the ongoing expenses of investing in other mutual funds. In the most recent six-month period, Class A shares limited these expenses; had it not done so, expenses would have been higher. The example in the table is based on an investment of $1,000 invested at the beginning of the six-month period and held for the entire period (July 1, 2016 to December 31, 2016).
The tables illustrate your Fund's expenses in two ways:
— Actual Fund Return. This helps you estimate the actual dollar amount of ongoing expenses (but not transaction costs) paid on a $1,000 investment in the Fund using the Fund's actual return during the period. To estimate the expenses you paid over the period, simply divide your account value by $1,000 (for example, an $8,600 account value divided by $1,000 = 8.6), then multiply the result by the number in the "Expenses Paid per $1,000" line under the share class you hold.
— Hypothetical 5% Fund Return. This helps you to compare your Fund's ongoing expenses (but not transaction costs) with those of other mutual funds using the Fund's actual expense ratio and a hypothetical rate of return of 5% per year before expenses. Examples using a 5% hypothetical fund return may be found in the shareholder reports of other mutual funds. The hypothetical account values and expenses may not be used to estimate the actual ending account balance or expenses you paid for the period.
Please note that the expenses shown in these tables are meant to highlight your ongoing expenses only and do not reflect any transaction costs. The "Expenses Paid per $1,000" line of the tables is useful in comparing ongoing expenses only and will not help you determine the relative total expense of owning different funds. Subject to certain exceptions, an account maintenance fee of $20.00 assessed once per calendar year for Classes A, C and S shares may apply for accounts with balances less than $10,000. This fee is not included in these tables. If it was, the estimate of expenses paid for Classes A, C and S shares during the period would be higher, and account value during the period would be lower, by this amount.
| Expenses and Value of a $1,000 Investment for the six months ended December 31, 2016 (Unaudited) | |||
| Actual Fund Return* | Class A | Class C | Class S |
| Beginning Account Value 7/1/16 | $ 1,000.00 | $ 1,000.00 | $ 1,000.00 |
| Ending Account Value 12/31/16 | $ 1,074.50 | $ 1,070.90 | $ 1,076.20 |
| Expenses Paid per $1,000** | $ 3.18 | $ 6.82 | $ 1.67 |
| Hypothetical 5% Fund Return* | Class A | Class C | Class S |
| Beginning Account Value 7/1/16 | $ 1,000.00 | $ 1,000.00 | $ 1,000.00 |
| Ending Account Value 12/31/16 | $ 1,022.07 | $ 1,018.55 | $ 1,023.53 |
| Expenses Paid per $1,000** | $ 3.10 | $ 6.65 | $ 1.63 |
* Expenses include amounts allocated proportionally from the master portfolio.
** Expenses are equal to the Fund's annualized expense ratio for each share class, multiplied by the average account value over the period, multiplied by 184 (the number of days in the most recent six-month period), then divided by 366.
| Annualized Expense Ratios | Class A | Class C | Class S |
| Deutsche S&P 500 Index Fund | .61% | 1.31% | .32% |
For more information, please refer to the Fund's prospectuses.
For an analysis of the fees associated with an investment in the Fund or similar funds, please refer to http://apps.finra.org/fundanalyzer/1/fa.aspx.
Tax Information (Unaudited)
The Fund paid distributions of $0.88 per share from net long-term capital gains during its year ended December 31, 2016.
Pursuant to Section 852 of the Internal Revenue Code, the Fund designates $38,218,000 as capital gain dividends for its year ended December 31, 2016.
For corporate shareholders, 89% of the ordinary dividends (i.e., income dividends plus short-term capital gains) paid during the Fund's fiscal year ended December 31, 2016, qualified for the dividends received deduction.
For federal income tax purposes, the Fund designates $17,753,000, or the maximum amount allowable under tax law, as qualified dividend income.
Please consult a tax advisor if you have any questions about federal and state income tax laws, or on how to prepare your tax returns. If you have specific questions about your account, please call (800) 728-3337.
(The following financial statements of the Deutsche Equity 500 Index Portfolio should be read in conjunction with the Fund's financial statements.)
Investment Portfolio as of December 31, 2016
| Shares | Value ($) | |
| Common Stocks 98.1% | ||
| Consumer Discretionary 11.8% | ||
| Auto Components 0.2% | ||
| BorgWarner, Inc. | 17,230 | 679,551 |
| Delphi Automotive PLC | 23,287 | 1,568,380 |
| Goodyear Tire & Rubber Co. | 22,166 | 684,264 |
| 2,932,195 | ||
| Automobiles 0.5% | ||
| Ford Motor Co. | 335,479 | 4,069,360 |
| General Motors Co. | 119,248 | 4,154,601 |
| Harley-Davidson, Inc. | 15,198 | 886,651 |
| 9,110,612 | ||
| Distributors 0.1% | ||
| Genuine Parts Co. | 12,878 | 1,230,364 |
| LKQ Corp.* | 26,412 | 809,528 |
| 2,039,892 | ||
| Diversified Consumer Services 0.0% | ||
| H&R Block, Inc. | 17,794 | 409,084 |
| Hotels, Restaurants & Leisure 1.5% | ||
| Carnival Corp. | 36,049 | 1,876,711 |
| Chipotle Mexican Grill, Inc.* | 2,481 | 936,131 |
| Darden Restaurants, Inc. | 10,576 | 769,087 |
| Marriott International, Inc. "A" | 27,521 | 2,275,436 |
| McDonald's Corp. | 71,374 | 8,687,643 |
| Royal Caribbean Cruises Ltd. | 14,390 | 1,180,556 |
| Starbucks Corp. | 125,104 | 6,945,774 |
| Wyndham Worldwide Corp. | 9,268 | 707,797 |
| Wynn Resorts Ltd. | 6,822 | 590,171 |
| Yum! Brands, Inc. | 29,958 | 1,897,240 |
| 25,866,546 | ||
| Household Durables 0.5% | ||
| D.R. Horton, Inc. | 29,284 | 800,332 |
| Garmin Ltd. (a) | 9,480 | 459,685 |
| Harman International Industries, Inc. | 5,995 | 666,404 |
| Leggett & Platt, Inc. | 11,483 | 561,289 |
| Lennar Corp. "A" | 16,737 | 718,520 |
| Mohawk Industries, Inc.* | 5,412 | 1,080,668 |
| Newell Brands, Inc. | 41,492 | 1,852,618 |
| PulteGroup, Inc. | 26,281 | 483,045 |
| Whirlpool Corp. | 6,464 | 1,174,961 |
| 7,797,522 | ||
| Internet & Direct Marketing Retail 2.3% | ||
| Amazon.com, Inc.* | 33,898 | 25,419,093 |
| Expedia, Inc. | 10,377 | 1,175,507 |
| Netflix, Inc.* | 36,884 | 4,566,239 |
| The Priceline Group, Inc.* | 4,241 | 6,217,560 |
| TripAdvisor, Inc.* | 9,823 | 455,493 |
| 37,833,892 | ||
| Leisure Products 0.1% | ||
| Hasbro, Inc. | 9,663 | 751,685 |
| Mattel, Inc. | 29,331 | 808,069 |
| 1,559,754 | ||
| Media 3.0% | ||
| CBS Corp. "B" | 33,672 | 2,142,213 |
| Charter Communications, Inc. "A"* | 18,611 | 5,358,479 |
| Comcast Corp. "A" | 204,835 | 14,143,857 |
| Discovery Communications, Inc. "A"* | 13,395 | 367,157 |
| Discovery Communications, Inc. "C"* | 18,949 | 507,454 |
| Interpublic Group of Companies, Inc. | 34,090 | 798,047 |
| News Corp. "A" | 31,997 | 366,686 |
| News Corp. "B" | 9,976 | 117,717 |
| Omnicom Group, Inc. | 20,257 | 1,724,073 |
| Scripps Networks Interactive "A" | 8,341 | 595,297 |
| TEGNA, Inc. | 18,619 | 398,260 |
| Time Warner, Inc. | 66,268 | 6,396,850 |
| Twenty-First Century Fox, Inc. "A" | 90,974 | 2,550,911 |
| Twenty-First Century Fox, Inc. "B" | 41,832 | 1,139,922 |
| Viacom, Inc. "B" | 29,850 | 1,047,735 |
| Walt Disney Co. | 125,821 | 13,113,065 |
| 50,767,723 | ||
| Multiline Retail 0.5% | ||
| Dollar General Corp. | 21,855 | 1,618,800 |
| Dollar Tree, Inc.* | 20,303 | 1,566,986 |
| Kohl's Corp. | 15,065 | 743,910 |
| Macy's, Inc. | 26,303 | 941,910 |
| Nordstrom, Inc. | 9,880 | 473,548 |
| Target Corp. | 48,304 | 3,488,998 |
| 8,834,152 | ||
| Specialty Retail 2.4% | ||
| Advance Auto Parts, Inc. | 6,331 | 1,070,699 |
| AutoNation, Inc.* | 5,814 | 282,851 |
| AutoZone, Inc.* | 2,480 | 1,958,679 |
| Bed Bath & Beyond, Inc. | 12,904 | 524,418 |
| Best Buy Co., Inc. | 23,471 | 1,001,507 |
| CarMax, Inc.* | 16,465 | 1,060,181 |
| Foot Locker, Inc. | 11,635 | 824,805 |
| Home Depot, Inc. | 104,701 | 14,038,310 |
| L Brands, Inc. | 20,651 | 1,359,662 |
| Lowe's Companies, Inc. | 74,765 | 5,317,287 |
| O'Reilly Automotive, Inc.* | 8,118 | 2,260,132 |
| Ross Stores, Inc. | 34,078 | 2,235,517 |
| Signet Jewelers Ltd. | 5,953 | 561,130 |
| Staples, Inc. | 55,992 | 506,728 |
| The Gap, Inc. | 18,959 | 425,440 |
| Tiffany & Co. | 9,158 | 709,104 |
| TJX Companies, Inc. | 56,027 | 4,209,308 |
| Tractor Supply Co. | 11,275 | 854,758 |
| Ulta Salon, Cosmetics & Fragrance, Inc.* | 5,039 | 1,284,643 |
| Urban Outfitters, Inc.* | 7,289 | 207,591 |
| 40,692,750 | ||
| Textiles, Apparel & Luxury Goods 0.7% | ||
| Coach, Inc. | 24,059 | 842,546 |
| Hanesbrands, Inc. | 32,460 | 700,162 |
| Michael Kors Holdings Ltd.* | 13,980 | 600,860 |
| NIKE, Inc. "B" | 114,811 | 5,835,843 |
| PVH Corp. | 6,926 | 625,002 |
| Ralph Lauren Corp. | 4,839 | 437,059 |
| Under Armour, Inc. "A"* (a) | 16,125 | 468,431 |
| Under Armour, Inc. "C"* | 16,174 | 407,100 |
| VF Corp. | 28,410 | 1,515,674 |
| 11,432,677 | ||
| Consumer Staples 9.2% | ||
| Beverages 2.0% | ||
| Brown-Forman Corp. "B" | 15,659 | 703,402 |
| Coca-Cola Co. | 333,579 | 13,830,185 |
| Constellation Brands, Inc. "A" | 15,276 | 2,341,964 |
| Dr. Pepper Snapple Group, Inc. | 15,717 | 1,425,060 |
| Molson Coors Brewing Co. "B" | 15,976 | 1,554,625 |
| Monster Beverage Corp.* | 34,846 | 1,545,072 |
| PepsiCo, Inc. | 123,241 | 12,894,706 |
| 34,295,014 | ||
| Food & Staples Retailing 2.1% | ||
| Costco Wholesale Corp. | 37,572 | 6,015,653 |
| CVS Health Corp. | 91,662 | 7,233,048 |
| Kroger Co. | 81,151 | 2,800,521 |
| Sysco Corp. | 43,252 | 2,394,863 |
| Wal-Mart Stores, Inc. | 129,432 | 8,946,340 |
| Walgreens Boots Alliance, Inc. | 73,556 | 6,087,495 |
| Whole Foods Market, Inc. | 27,374 | 842,024 |
| 34,319,944 | ||
| Food Products 1.6% | ||
| Archer-Daniels-Midland Co. | 49,454 | 2,257,575 |
| Campbell Soup Co. | 16,653 | 1,007,007 |
| Conagra Brands, Inc. | 35,744 | 1,413,675 |
| General Mills, Inc. | 50,843 | 3,140,572 |
| Hormel Foods Corp. | 23,219 | 808,253 |
| Kellogg Co. | 21,717 | 1,600,760 |
| Kraft Heinz Co. | 51,266 | 4,476,547 |
| McCormick & Co., Inc. | 9,840 | 918,367 |
| Mead Johnson Nutrition Co. | 15,881 | 1,123,740 |
| Mondelez International, Inc. "A" | 132,749 | 5,884,763 |
| The Hershey Co. | 11,983 | 1,239,402 |
| The JM Smucker Co. | 10,010 | 1,281,881 |
| Tyson Foods, Inc. "A" | 24,977 | 1,540,581 |
| 26,693,123 | ||
| Household Products 1.8% | ||
| Church & Dwight Co., Inc. | 22,248 | 983,139 |
| Clorox Co. | 11,070 | 1,328,621 |
| Colgate-Palmolive Co. | 76,368 | 4,997,522 |
| Kimberly-Clark Corp. | 30,787 | 3,513,413 |
| Procter & Gamble Co. | 229,997 | 19,338,148 |
| 30,160,843 | ||
| Personal Products 0.1% | ||
| Coty, Inc. "A" | 40,409 | 739,889 |
| Estee Lauder Companies, Inc. "A" | 19,097 | 1,460,729 |
| 2,200,618 | ||
| Tobacco 1.6% | ||
| Altria Group, Inc. | 167,614 | 11,334,059 |
| Philip Morris International, Inc. | 133,325 | 12,197,904 |
| Reynolds American, Inc. | 71,076 | 3,983,099 |
| 27,515,062 | ||
| Energy 7.4% | ||
| Energy Equipment & Services 1.2% | ||
| Baker Hughes, Inc. | 36,366 | 2,362,699 |
| FMC Technologies, Inc.* | 19,351 | 687,541 |
| Halliburton Co. | 74,432 | 4,026,027 |
| Helmerich & Payne, Inc. | 9,157 | 708,752 |
| National Oilwell Varco, Inc. | 32,559 | 1,219,009 |
| Schlumberger Ltd. | 119,631 | 10,043,022 |
| Transocean Ltd.* | 33,001 | 486,435 |
| 19,533,485 | ||
| Oil, Gas & Consumable Fuels 6.2% | ||
| Anadarko Petroleum Corp. | 48,050 | 3,350,526 |
| Apache Corp. | 32,623 | 2,070,582 |
| Cabot Oil & Gas Corp. | 40,023 | 934,937 |
| Chesapeake Energy Corp.* | 63,161 | 443,390 |
| Chevron Corp. | 162,267 | 19,098,826 |
| Cimarex Energy Co. | 8,171 | 1,110,439 |
| Concho Resources, Inc.* | 12,567 | 1,666,384 |
| ConocoPhillips | 106,521 | 5,340,963 |
| Devon Energy Corp. | 45,023 | 2,056,200 |
| EOG Resources, Inc. | 49,561 | 5,010,617 |
| EQT Corp. | 14,861 | 971,909 |
| Exxon Mobil Corp. | 356,433 | 32,171,643 |
| Hess Corp. | 22,875 | 1,424,884 |
| Kinder Morgan, Inc. | 165,078 | 3,418,765 |
| Marathon Oil Corp. | 72,868 | 1,261,345 |
| Marathon Petroleum Corp. | 45,379 | 2,284,833 |
| Murphy Oil Corp. | 13,687 | 426,076 |
| Newfield Exploration Co.* | 17,264 | 699,192 |
| Noble Energy, Inc. | 36,859 | 1,402,853 |
| Occidental Petroleum Corp. | 65,705 | 4,680,167 |
| ONEOK, Inc. | 18,116 | 1,040,040 |
| Phillips 66 | 38,064 | 3,289,110 |
| Pioneer Natural Resources Co. | 14,598 | 2,628,662 |
| Range Resources Corp. | 16,035 | 550,963 |
| Southwestern Energy Co.* | 41,852 | 452,839 |
| Spectra Energy Corp. | 60,308 | 2,478,056 |
| Tesoro Corp. | 10,019 | 876,162 |
| Valero Energy Corp. | 38,914 | 2,658,604 |
| Williams Companies, Inc. | 58,626 | 1,825,614 |
| 105,624,581 | ||
| Financials 14.5% | ||
| Banks 6.6% | ||
| Bank of America Corp. | 868,565 | 19,195,287 |
| BB&T Corp. | 69,727 | 3,278,564 |
| Citigroup, Inc. | 244,962 | 14,558,092 |
| Citizens Financial Group, Inc. | 43,995 | 1,567,542 |
| Comerica, Inc. | 14,813 | 1,008,913 |
| Fifth Third Bancorp. | 64,955 | 1,751,836 |
| Huntington Bancshares, Inc. | 93,275 | 1,233,096 |
| JPMorgan Chase & Co. | 307,546 | 26,538,144 |
| KeyCorp | 92,821 | 1,695,840 |
| M&T Bank Corp. | 13,324 | 2,084,273 |
| People's United Financial, Inc. | 27,023 | 523,165 |
| PNC Financial Services Group, Inc. | 41,813 | 4,890,448 |
| Regions Financial Corp. | 105,884 | 1,520,494 |
| SunTrust Banks, Inc. | 42,191 | 2,314,176 |
| U.S. Bancorp. | 137,285 | 7,052,330 |
| Wells Fargo & Co. | 388,516 | 21,411,117 |
| Zions Bancorp. | 17,349 | 746,701 |
| 111,370,018 | ||
| Capital Markets 2.8% | ||
| Affiliated Managers Group, Inc.* | 4,684 | 680,585 |
| Ameriprise Financial, Inc. | 13,581 | 1,506,676 |
| Bank of New York Mellon Corp. | 90,811 | 4,302,625 |
| BlackRock, Inc. | 10,439 | 3,972,457 |
| Charles Schwab Corp. | 103,639 | 4,090,631 |
| CME Group, Inc. | 29,147 | 3,362,107 |
| E*TRADE Financial Corp.* | 23,486 | 813,790 |
| Franklin Resources, Inc. | 29,805 | 1,179,682 |
| Intercontinental Exchange, Inc. | 51,148 | 2,885,770 |
| Invesco Ltd. | 35,063 | 1,063,811 |
| Moody's Corp. | 14,281 | 1,346,270 |
| Morgan Stanley | 123,882 | 5,234,015 |
| Nasdaq, Inc. | 9,760 | 655,091 |
| Northern Trust Corp. | 19,037 | 1,695,245 |
| S&P Global, Inc. | 22,251 | 2,392,873 |
| State Street Corp. | 31,145 | 2,420,589 |
| T. Rowe Price Group, Inc. | 20,894 | 1,572,482 |
| The Goldman Sachs Group, Inc. | 31,777 | 7,609,003 |
| 46,783,702 | ||
| Consumer Finance 0.8% | ||
| American Express Co. | 66,074 | 4,894,762 |
| Capital One Financial Corp. | 41,440 | 3,615,226 |
| Discover Financial Services | 33,873 | 2,441,905 |
| Navient Corp. | 26,331 | 432,618 |
| Synchrony Financial | 67,387 | 2,444,126 |
| 13,828,637 | ||
| Diversified Financial Services 1.6% | ||
| Berkshire Hathaway, Inc. "B"* | 163,183 | 26,595,565 |
| Leucadia National Corp. | 27,794 | 646,211 |
| 27,241,776 | ||
| Insurance 2.7% | ||
| Aflac, Inc. | 35,091 | 2,442,334 |
| Allstate Corp. | 31,650 | 2,345,898 |
| American International Group, Inc. | 83,888 | 5,478,725 |
| Aon PLC | 22,617 | 2,522,474 |
| Arthur J. Gallagher & Co. | 15,166 | 788,025 |
| Assurant, Inc. | 4,771 | 443,035 |
| Chubb Ltd. | 40,000 | 5,284,800 |
| Cincinnati Financial Corp. | 12,904 | 977,478 |
| Hartford Financial Services Group, Inc. | 32,470 | 1,547,196 |
| Lincoln National Corp. | 19,653 | 1,302,404 |
| Loews Corp. | 23,758 | 1,112,587 |
| Marsh & McLennan Companies, Inc. | 44,324 | 2,995,859 |
| MetLife, Inc. | 94,479 | 5,091,473 |
| Principal Financial Group, Inc. | 22,845 | 1,321,812 |
| Progressive Corp. | 49,890 | 1,771,095 |
| Prudential Financial, Inc. | 36,961 | 3,846,162 |
| The Travelers Companies, Inc. | 24,426 | 2,990,231 |
| Torchmark Corp. | 9,419 | 694,746 |
| Unum Group | 20,041 | 880,401 |
| Willis Towers Watson PLC | 11,054 | 1,351,683 |
| XL Group Ltd. | 23,158 | 862,867 |
| 46,051,285 | ||
| Health Care 13.4% | ||
| Biotechnology 2.7% | ||
| AbbVie, Inc. | 139,676 | 8,746,511 |
| Alexion Pharmaceuticals, Inc.* | 19,274 | 2,358,174 |
| Amgen, Inc. | 63,939 | 9,348,521 |
| Biogen, Inc.* | 18,701 | 5,303,230 |
| Celgene Corp.* | 66,627 | 7,712,075 |
| Gilead Sciences, Inc. | 113,232 | 8,108,544 |
| Regeneron Pharmaceuticals, Inc.* | 6,499 | 2,385,718 |
| Vertex Pharmaceuticals, Inc.* | 21,326 | 1,571,086 |
| 45,533,859 | ||
| Health Care Equipment & Supplies 2.4% | ||
| Abbott Laboratories | 126,587 | 4,862,207 |
| Baxter International, Inc. | 42,088 | 1,866,182 |
| Becton, Dickinson & Co. | 18,252 | 3,021,619 |
| Boston Scientific Corp.* | 117,088 | 2,532,613 |
| C.R. Bard, Inc. | 6,321 | 1,420,076 |
| Danaher Corp. | 52,325 | 4,072,978 |
| DENTSPLY SIRONA, Inc. | 19,660 | 1,134,972 |
| Edwards Lifesciences Corp.* | 18,380 | 1,722,206 |
| Hologic, Inc.* | 23,924 | 959,831 |
| Intuitive Surgical, Inc.* | 3,330 | 2,111,786 |
| Medtronic PLC | 118,024 | 8,406,850 |
| St. Jude Medical, Inc. | 24,559 | 1,969,386 |
| Stryker Corp. | 26,714 | 3,200,604 |
| The Cooper Companies, Inc. | 4,193 | 733,481 |
| Varian Medical Systems, Inc.* | 8,036 | 721,472 |
| Zimmer Biomet Holdings, Inc. | 17,221 | 1,777,207 |
| 40,513,470 | ||
| Health Care Providers & Services 2.6% | ||
| Aetna, Inc. | 30,168 | 3,741,134 |
| AmerisourceBergen Corp. | 14,379 | 1,124,294 |
| Anthem, Inc. | 22,650 | 3,256,391 |
| Cardinal Health, Inc. | 27,519 | 1,980,542 |
| Centene Corp.* | 14,691 | 830,188 |
| CIGNA Corp. | 22,072 | 2,944,184 |
| DaVita, Inc.* | 13,579 | 871,772 |
| Envision Healthcare Corp.* | 10,089 | 638,533 |
| Express Scripts Holding Co.* | 53,010 | 3,646,558 |
| HCA Holdings, Inc.* | 25,121 | 1,859,456 |
| Henry Schein, Inc.* | 6,919 | 1,049,682 |
| Humana, Inc. | 12,817 | 2,615,053 |
| Laboratory Corp. of America Holdings* | 8,860 | 1,137,447 |
| McKesson Corp. | 19,435 | 2,729,646 |
| Patterson Companies, Inc. | 6,861 | 281,507 |
| Quest Diagnostics, Inc. | 11,918 | 1,095,264 |
| UnitedHealth Group, Inc. | 81,812 | 13,093,192 |
| Universal Health Services, Inc. "B" | 7,709 | 820,083 |
| 43,714,926 | ||
| Health Care Technology 0.1% | ||
| Cerner Corp.* | 25,973 | 1,230,341 |
| Life Sciences Tools & Services 0.6% | ||
| Agilent Technologies, Inc. | 27,893 | 1,270,805 |
| Illumina, Inc.* | 12,627 | 1,616,761 |
| Mettler-Toledo International, Inc.* | 2,275 | 952,224 |
| PerkinElmer, Inc. | 9,240 | 481,866 |
| Thermo Fisher Scientific, Inc. | 33,957 | 4,791,333 |
| Waters Corp.* | 6,929 | 931,188 |
| 10,044,177 | ||
| Pharmaceuticals 5.0% | ||
| Allergan PLC* | 32,240 | 6,770,722 |
| Bristol-Myers Squibb Co. | 143,645 | 8,394,614 |
| Eli Lilly & Co. | 83,495 | 6,141,057 |
| Endo International PLC* | 17,821 | 293,512 |
| Johnson & Johnson | 233,811 | 26,937,365 |
| Mallinckrodt PLC* | 9,054 | 451,070 |
| Merck & Co., Inc. | 236,978 | 13,950,895 |
| Mylan NV* | 39,559 | 1,509,176 |
| Perrigo Co. PLC | 12,324 | 1,025,727 |
| Pfizer, Inc. | 521,567 | 16,940,496 |
| Zoetis, Inc. | 42,434 | 2,271,492 |
| 84,686,126 | ||
| Industrials 10.1% | ||
| Aerospace & Defense 2.2% | ||
| Arconic, Inc. | 37,716 | 699,255 |
| Boeing Co. | 49,330 | 7,679,694 |
| General Dynamics Corp. | 24,598 | 4,247,091 |
| L3 Technologies, Inc. | 6,646 | 1,010,923 |
| Lockheed Martin Corp. | 21,655 | 5,412,451 |
| Northrop Grumman Corp. | 15,145 | 3,522,424 |
| Raytheon Co. | 25,237 | 3,583,654 |
| Rockwell Collins, Inc. | 11,193 | 1,038,263 |
| Textron, Inc. | 23,218 | 1,127,466 |
| TransDigm Group, Inc. | 4,310 | 1,073,017 |
| United Technologies Corp. | 65,813 | 7,214,421 |
| 36,608,659 | ||
| Air Freight & Logistics 0.7% | ||
| C.H. Robinson Worldwide, Inc. | 12,174 | 891,867 |
| Expeditors International of Washington, Inc. | 15,495 | 820,615 |
| FedEx Corp. | 21,018 | 3,913,552 |
| United Parcel Service, Inc. "B" | 59,245 | 6,791,847 |
| 12,417,881 | ||
| Airlines 0.6% | ||
| Alaska Air Group, Inc. | 10,594 | 940,006 |
| American Airlines Group, Inc. | 44,542 | 2,079,666 |
| Delta Air Lines, Inc. | 63,302 | 3,113,825 |
| Southwest Airlines Co. | 52,909 | 2,636,984 |
| United Continental Holdings, Inc.* | 24,820 | 1,808,882 |
| 10,579,363 | ||
| Building Products 0.3% | ||
| Allegion PLC | 8,238 | 527,232 |
| Fortune Brands Home & Security, Inc. | 13,198 | 705,565 |
| Johnson Controls International PLC | 80,542 | 3,317,525 |
| Masco Corp. | 28,291 | 894,561 |
| 5,444,883 | ||
| Commercial Services & Supplies 0.3% | ||
| Cintas Corp. | 7,345 | 848,788 |
| Pitney Bowes, Inc. | 16,241 | 246,701 |
| Republic Services, Inc. | 19,824 | 1,130,959 |
| Stericycle, Inc.* | 7,472 | 575,643 |
| Waste Management, Inc. | 34,929 | 2,476,815 |
| 5,278,906 | ||
| Construction & Engineering 0.1% | ||
| Fluor Corp. | 11,982 | 629,295 |
| Jacobs Engineering Group, Inc.* | 10,252 | 584,364 |
| Quanta Services, Inc.* | 13,190 | 459,671 |
| 1,673,330 | ||
| Electrical Equipment 0.5% | ||
| Acuity Brands, Inc. | 3,776 | 871,728 |
| AMETEK, Inc. | 19,895 | 966,897 |
| Eaton Corp. PLC | 38,837 | 2,605,574 |
| Emerson Electric Co. | 55,263 | 3,080,912 |
| Rockwell Automation, Inc. | 11,024 | 1,481,626 |
| 9,006,737 | ||
| Industrial Conglomerates 2.5% | ||
| 3M Co. | 51,694 | 9,230,997 |
| General Electric Co. | 760,408 | 24,028,893 |
| Honeywell International, Inc. | 65,507 | 7,588,986 |
| Roper Technologies, Inc. | 8,721 | 1,596,641 |
| 42,445,517 | ||
| Machinery 1.5% | ||
| Caterpillar, Inc. | 50,296 | 4,664,451 |
| Cummins, Inc. | 13,254 | 1,811,424 |
| Deere & Co. | 24,862 | 2,561,781 |
| Dover Corp. | 13,359 | 1,000,990 |
| Flowserve Corp. | 11,407 | 548,106 |
| Fortive Corp. | 25,854 | 1,386,550 |
| Illinois Tool Works, Inc. | 27,148 | 3,324,544 |
| Ingersoll-Rand PLC | 22,211 | 1,666,714 |
| PACCAR, Inc. | 30,131 | 1,925,371 |
| Parker-Hannifin Corp. | 11,469 | 1,605,660 |
| Pentair PLC | 14,390 | 806,847 |
| Snap-on, Inc. | 4,958 | 849,157 |
| Stanley Black & Decker, Inc. | 12,954 | 1,485,694 |
| Xylem, Inc. | 15,431 | 764,143 |
| 24,401,432 | ||
| Professional Services 0.3% | ||
| Dun & Bradstreet Corp. | 3,237 | 392,713 |
| Equifax, Inc. | 10,291 | 1,216,705 |
| Nielsen Holdings PLC | 28,874 | 1,211,264 |
| Robert Half International, Inc. | 10,964 | 534,824 |
| Verisk Analytics, Inc.* | 13,355 | 1,084,025 |
| 4,439,531 | ||
| Road & Rail 0.9% | ||
| CSX Corp. | 80,533 | 2,893,551 |
| J.B. Hunt Transport Services, Inc. | 7,533 | 731,228 |
| Kansas City Southern | 9,250 | 784,862 |
| Norfolk Southern Corp. | 25,111 | 2,713,746 |
| Ryder System, Inc. | 4,475 | 333,119 |
| Union Pacific Corp. | 70,845 | 7,345,210 |
| 14,801,716 | ||
| Trading Companies & Distributors 0.2% | ||
| Fastenal Co. | 24,881 | 1,168,909 |
| United Rentals, Inc.* | 7,244 | 764,822 |
| W.W. Grainger, Inc. | 4,715 | 1,095,059 |
| 3,028,790 | ||
| Information Technology 20.4% | ||
| Communications Equipment 1.0% | ||
| Cisco Systems, Inc. | 431,466 | 13,038,903 |
| F5 Networks, Inc.* | 5,570 | 806,090 |
| Harris Corp. | 10,713 | 1,097,761 |
| Juniper Networks, Inc. | 32,700 | 924,102 |
| Motorola Solutions, Inc. | 14,270 | 1,182,840 |
| 17,049,696 | ||
| Electronic Equipment, Instruments & Components 0.4% | ||
| Amphenol Corp. "A" | 26,499 | 1,780,733 |
| Corning, Inc. | 81,781 | 1,984,825 |
| FLIR Systems, Inc. | 11,693 | 423,170 |
| TE Connectivity Ltd. | 30,543 | 2,116,019 |
| 6,304,747 | ||
| Internet Software & Services 4.2% | ||
| Akamai Technologies, Inc.* | 14,946 | 996,599 |
| Alphabet, Inc. "A"* | 25,448 | 20,166,268 |
| Alphabet, Inc. "C"* | 25,507 | 19,686,813 |
| eBay, Inc.* | 89,355 | 2,652,950 |
| Facebook, Inc. "A"* | 201,199 | 23,147,945 |
| VeriSign, Inc.* (a) | 7,815 | 594,487 |
| Yahoo!, Inc.* | 75,460 | 2,918,038 |
| 70,163,100 | ||
| IT Services 3.6% | ||
| Accenture PLC "A" | 53,312 | 6,244,435 |
| Alliance Data Systems Corp. | 5,012 | 1,145,242 |
| Automatic Data Processing, Inc. | 38,759 | 3,983,650 |
| Cognizant Technology Solutions Corp. "A"* | 52,147 | 2,921,796 |
| CSRA, Inc. | 12,748 | 405,896 |
| Fidelity National Information Services, Inc. | 28,196 | 2,132,745 |
| Fiserv, Inc.* | 18,639 | 1,980,953 |
| Global Payments, Inc. | 13,213 | 917,114 |
| International Business Machines Corp. | 74,365 | 12,343,846 |
| Mastercard, Inc. "A" | 81,803 | 8,446,160 |
| Paychex, Inc. | 27,642 | 1,682,845 |
| PayPal Holdings, Inc.* | 96,450 | 3,806,882 |
| Teradata Corp.* | 11,432 | 310,607 |
| Total System Services, Inc. | 14,218 | 697,109 |
| Visa, Inc. "A" | 160,512 | 12,523,146 |
| Western Union Co. | 41,665 | 904,964 |
| Xerox Corp. | 73,209 | 639,115 |
| 61,086,505 | ||
| Semiconductors & Semiconductor Equipment 3.3% | ||
| Analog Devices, Inc. | 26,486 | 1,923,413 |
| Applied Materials, Inc. | 92,886 | 2,997,431 |
| Broadcom Ltd. | 34,149 | 6,036,519 |
| First Solar, Inc.* | 6,966 | 223,539 |
| Intel Corp. | 407,315 | 14,773,315 |
| KLA-Tencor Corp. | 13,431 | 1,056,751 |
| Lam Research Corp. | 13,994 | 1,479,586 |
| Linear Technology Corp. | 20,641 | 1,286,966 |
| Microchip Technology, Inc. | 18,565 | 1,190,945 |
| Micron Technology, Inc.* | 89,530 | 1,962,498 |
| NVIDIA Corp. | 46,328 | 4,945,051 |
| Qorvo, Inc.* | 10,979 | 578,923 |
| QUALCOMM, Inc. | 126,938 | 8,276,357 |
| Skyworks Solutions, Inc. | 15,974 | 1,192,619 |
| Texas Instruments, Inc. | 85,896 | 6,267,831 |
| Xilinx, Inc. | 21,684 | 1,309,063 |
| 55,500,807 | ||
| Software 4.2% | ||
| Activision Blizzard, Inc. | 58,769 | 2,122,149 |
| Adobe Systems, Inc.* | 42,738 | 4,399,877 |
| Autodesk, Inc.* | 16,843 | 1,246,550 |
| CA, Inc. | 26,943 | 855,979 |
| Citrix Systems, Inc.* | 13,407 | 1,197,379 |
| Electronic Arts, Inc.* | 25,936 | 2,042,719 |
| Intuit, Inc. | 20,953 | 2,401,423 |
| Microsoft Corp. | 668,302 | 41,528,286 |
| Oracle Corp. | 257,599 | 9,904,682 |
| Red Hat, Inc.* | 15,261 | 1,063,692 |
| salesforce.com, Inc.* | 54,872 | 3,756,537 |
| Symantec Corp. | 53,577 | 1,279,955 |
| 71,799,228 | ||
| Technology Hardware, Storage & Peripherals 3.7% | ||
| Apple, Inc. | 458,323 | 53,082,970 |
| Hewlett Packard Enterprise Co. | 143,232 | 3,314,388 |
| HP, Inc. | 147,090 | 2,182,816 |
| NetApp, Inc. | 23,484 | 828,281 |
| Seagate Technology PLC | 25,319 | 966,426 |
| Western Digital Corp. | 24,540 | 1,667,493 |
| 62,042,374 | ||
| Materials 2.8% | ||
| Chemicals 2.0% | ||
| Air Products & Chemicals, Inc. | 18,691 | 2,688,140 |
| Albemarle Corp. | 9,671 | 832,480 |
| CF Industries Holdings, Inc. | 19,409 | 610,995 |
| Dow Chemical Co. | 96,372 | 5,514,406 |
| E.I. du Pont de Nemours & Co. | 74,715 | 5,484,081 |
| Eastman Chemical Co. | 12,651 | 951,482 |
| Ecolab, Inc. | 22,557 | 2,644,131 |
| FMC Corp. | 11,703 | 661,922 |
| International Flavors & Fragrances, Inc. | 6,828 | 804,543 |
| LyondellBasell Industries NV "A" | 28,728 | 2,464,288 |
| Monsanto Co. | 37,639 | 3,959,999 |
| PPG Industries, Inc. | 22,703 | 2,151,336 |
| Praxair, Inc. | 24,538 | 2,875,608 |
| The Mosaic Co. | 30,083 | 882,334 |
| The Sherwin-Williams Co. | 6,950 | 1,867,743 |
| 34,393,488 | ||
| Construction Materials 0.2% | ||
| Martin Marietta Materials, Inc. | 5,477 | 1,213,320 |
| Vulcan Materials Co. | 11,309 | 1,415,321 |
| 2,628,641 | ||
| Containers & Packaging 0.3% | ||
| Avery Dennison Corp. | 7,821 | 549,191 |
| Ball Corp. | 15,020 | 1,127,551 |
| International Paper Co. | 35,325 | 1,874,345 |
| Sealed Air Corp. | 16,599 | 752,599 |
| WestRock Co. | 21,581 | 1,095,667 |
| 5,399,353 | ||
| Metals & Mining 0.3% | ||
| Freeport-McMoRan, Inc.* | 107,784 | 1,421,671 |
| Newmont Mining Corp. | 45,646 | 1,555,159 |
| Nucor Corp. | 27,296 | 1,624,658 |
| 4,601,488 | ||
| Real Estate 2.8% | ||
| Equity Real Estate Investment Trusts (REITs) 2.8% | ||
| American Tower Corp. | 36,585 | 3,866,303 |
| Apartment Investment & Management Co. "A" | 13,314 | 605,121 |
| AvalonBay Communities, Inc. | 11,798 | 2,090,016 |
| Boston Properties, Inc. | 13,225 | 1,663,441 |
| Crown Castle International Corp. | 30,991 | 2,689,089 |
| Digital Realty Trust, Inc. | 13,665 | 1,342,723 |
| Equinix, Inc. | 6,135 | 2,192,710 |
| Equity Residential | 31,419 | 2,022,127 |
| Essex Property Trust, Inc. | 5,628 | 1,308,510 |
| Extra Space Storage, Inc. | 10,798 | 834,038 |
| Federal Realty Investment Trust | 6,160 | 875,398 |
| General Growth Properties, Inc. | 50,199 | 1,253,971 |
| HCP, Inc. | 40,232 | 1,195,695 |
| Host Hotels & Resorts, Inc. | 64,239 | 1,210,263 |
| Iron Mountain, Inc. | 21,064 | 684,159 |
| Kimco Realty Corp. | 36,590 | 920,604 |
| Mid-America Apartment Communities, Inc. | 9,756 | 955,308 |
| Prologis, Inc. | 45,436 | 2,398,566 |
| Public Storage | 12,821 | 2,865,493 |
| Realty Income Corp. | 22,242 | 1,278,470 |
| Simon Property Group, Inc. | 27,011 | 4,799,044 |
| SL Green Realty Corp. | 8,717 | 937,513 |
| The Macerich Co. | 10,382 | 735,461 |
| UDR, Inc. | 22,922 | 836,195 |
| Ventas, Inc. | 30,442 | 1,903,234 |
| Vornado Realty Trust | 14,785 | 1,543,110 |
| Welltower, Inc. | 31,168 | 2,086,074 |
| Weyerhaeuser Co. | 64,321 | 1,935,419 |
| 47,028,055 | ||
| Real Estate Management & Development 0.0% | ||
| CBRE Group, Inc. "A"* | 25,831 | 813,418 |
| Telecommunication Services 2.6% | ||
| Diversified Telecommunication Services | ||
| AT&T, Inc. | 527,854 | 22,449,631 |
| CenturyLink, Inc. | 47,015 | 1,118,017 |
| Frontier Communications Corp. (a) | 98,556 | 333,119 |
| Level 3 Communications, Inc.* | 25,065 | 1,412,663 |
| Verizon Communications, Inc. | 350,426 | 18,705,740 |
| 44,019,170 | ||
| Utilities 3.1% | ||
| Electric Utilities 1.9% | ||
| Alliant Energy Corp. | 19,531 | 740,030 |
| American Electric Power Co., Inc. | 42,286 | 2,662,327 |
| Duke Energy Corp. | 59,233 | 4,597,665 |
| Edison International | 28,005 | 2,016,080 |
| Entergy Corp. | 15,405 | 1,131,805 |
| Eversource Energy | 27,278 | 1,506,564 |
| Exelon Corp. | 79,363 | 2,816,593 |
| FirstEnergy Corp. | 36,606 | 1,133,688 |
| NextEra Energy, Inc. | 40,159 | 4,797,394 |
| PG&E Corp. | 43,478 | 2,642,158 |
| Pinnacle West Capital Corp. | 9,586 | 747,996 |
| PPL Corp. | 58,407 | 1,988,758 |
| Southern Co. | 84,180 | 4,140,814 |
| Xcel Energy, Inc. | 43,655 | 1,776,758 |
| 32,698,630 | ||
| Independent Power & Renewable Electricity Producers 0.1% | ||
| AES Corp. | 56,754 | 659,481 |
| NRG Energy, Inc. | 26,225 | 321,519 |
| 981,000 | ||
| Multi-Utilities 1.0% | ||
| Ameren Corp. | 20,875 | 1,095,103 |
| CenterPoint Energy, Inc. | 37,004 | 911,779 |
| CMS Energy Corp. | 23,914 | 995,301 |
| Consolidated Edison, Inc. | 26,204 | 1,930,711 |
| Dominion Resources, Inc. | 53,857 | 4,124,908 |
| DTE Energy Co. | 15,420 | 1,519,024 |
| NiSource, Inc. | 27,782 | 615,093 |
| Public Service Enterprise Group, Inc. | 43,507 | 1,909,087 |
| SCANA Corp. | 12,288 | 900,465 |
| Sempra Energy | 21,499 | 2,163,659 |
| WEC Energy Group, Inc. | 27,153 | 1,592,524 |
| 17,757,654 | ||
| Water Utilities 0.1% | ||
| American Water Works Co., Inc. | 15,306 | 1,107,542 |
| Total Common Stocks (Cost $716,577,245) | 1,656,119,427 | |
| Principal Amount ($) | Value ($) | |
| Government & Agency Obligation 0.1% | ||
| U.S. Treasury Obligation | ||
| U.S. Treasury Bill, 0.45%**, 3/2/2017 (b) (Cost $2,210,349) | 2,215,000 | 2,213,272 |
| Shares | Value ($) | |
| Securities Lending Collateral 0.1% | ||
| Government & Agency Securities Portfolio "Deutsche Government Cash Institutional Shares", 0.42% (c) (d) (Cost $1,767,755) | 1,767,755 | 1,767,755 |
| Cash Equivalents 0.0% | ||
| Deutsche Central Cash Management Government Fund, 0.49% (c) (Cost $15,263) | 15,263 | 15,263 |
| % of Net Assets | Value ($) | |
| Total Investment Portfolio (Cost $720,570,612)† | 98.3 | 1,660,115,717 |
| Other Assets and Liabilities, Net | 1.7 | 28,438,600 |
| Net Assets | 100.0 | 1,688,554,317 |
* Non-income producing security.
** Annualized yield at time of purchase; not a coupon rate.
† The cost for federal income tax purposes was $774,902,053. At December 31, 2016, net unrealized appreciation for all securities based on tax cost was $885,213,664. This consisted of aggregate gross unrealized appreciation for all securities in which there was an excess of value over tax cost of $960,940,787 and aggregate gross unrealized depreciation for all securities in which there was an excess of tax cost over value of $75,727,123.
(a) All or a portion of these securities were on loan. In addition, "Other Assets and Liabilities, Net" may include pending sales that are also on loan. The value of securities loaned at December 31, 2016 amounted to $1,723,022, which is 0.1% of net assets.
(b) At December 31, 2016 this security has been pledged, in whole or in part, to cover initial margin requirements for open futures contracts.
(c) Affiliated fund managed by Deutsche Investment Management Americas Inc. The rate shown is the annualized seven-day yield at period end.
(d) Represents collateral held in connection with securities lending. Income earned by the Portfolio is net of borrower rebates.
At December 31, 2016, open futures contracts purchased were as follows:
| Futures | Currency | Expiration Date | Contracts | Notional Value ($) | Unrealized Depreciation ($) |
| S&P 500 E-Mini Index | USD | 3/17/2017 | 256 | 28,623,360 | (187,303) |
| Currency Abbreviation |
| USD United States Dollar |
For information on the Portfolio's policy and additional disclosures regarding futures contracts, please refer to Note B in the accompanying Notes to Financial Statements.
Fair Value Measurements
Various inputs are used in determining the value of the Fund's investments. These inputs are summarized in three broad levels. Level 1 includes quoted prices in active markets for identical securities. Level 2 includes other significant observable inputs (including quoted prices for similar securities, interest rates, prepayment speeds and credit risk). Level 3 includes significant unobservable inputs (including the Portfolio's own assumptions in determining the fair value of investments). The level assigned to the securities valuations may not be an indication of the risk or liquidity associated with investing in those securities.
The following is a summary of the inputs used as of December 31, 2016 in valuing the Portfolio's investments. For information on the Portfolio's policy regarding the valuation of investments, please refer to the Security Valuation section of Note A in the accompanying Notes to Financial Statements.
| Assets | Level 1 | Level 2 | Level 3 | Total | |
| Common Stocks (e) | $ 1,656,119,427 | $ — | $ — | $ 1,656,119,427 | |
| Government & Agency Obligation | — | 2,213,272 | — | 2,213,272 | |
| Short-Term Investments (e) | 1,783,018 | — | — | 1,783,018 | |
| Total | $ 1,657,902,445 | $ 2,213,272 | $ — | $ 1,660,115,717 | |
| Liabilities | Level 1 | Level 2 | Level 3 | Total | |
| Derivatives (f) | |||||
| Futures Contracts | $ (187,303) | $ — | $ — | $ (187,303) | |
| Total | $ (187,303) | $ — | $ — | $ (187,303) | |
There have been no transfers between fair value measurement levels during the year ended December 31, 2016.
(e) See Investment Portfolio for additional detailed categorizations.
(f) Derivatives include unrealized appreciation (depreciation) on open futures contracts.
The accompanying notes are an integral part of the financial statements.
Statement of Assets and Liabilities
| as of December 31, 2016 | |
| Assets | |
Investments: Investments in non-affiliated securities, at value (cost $718,787,594) — including $1,723,022 of securities loaned | $ 1,658,332,699 |
| Investment in Government & Agency Securities Portfolio (cost $1,767,755)* | 1,767,755 |
| Investment in Deutsche Central Cash Management Government Fund (cost $15,263) | 15,263 |
| Total investments in securities, at value (cost $720,570,612) | 1,660,115,717 |
| Cash | 37,283 |
| Receivable for investments sold | 49,970,538 |
| Dividends receivable | 2,165,180 |
| Interest receivable | 9,116 |
| Other assets | 30,057 |
| Total assets | 1,712,327,891 |
| Liabilities | |
| Payable upon return of securities loaned | 1,767,755 |
| Line of credit loan payable | 21,650,000 |
| Payable for variation margin on futures contracts | 111,972 |
| Accrued management fee | 73,789 |
| Accrued Trustees' fees | 15,322 |
| Other accrued expenses and payables | 154,736 |
| Total liabilities | 23,773,574 |
| Net assets, at value | $ 1,688,554,317 |
* Represents collateral on securities loaned.
The accompanying notes are an integral part of the financial statements.
Statement of Operations
| for the year ended December 31, 2016 | |
| Investment Income | |
Income: Dividends (net of foreign taxes withheld of $127,793) | $ 38,026,530 |
| Interest | 3,364 |
| Income distributions — Deutsche Central Cash Management Government Fund | 90,826 |
| Securities lending income, net of borrower rebates | 149,731 |
| Other income | 94,513 |
| Total income | 38,364,964 |
Expenses: Management fee | 858,623 |
| Administration fee | 515,174 |
| Custodian fee | 22,856 |
| Professional fees | 102,662 |
| Reports to shareholders | 5,610 |
| Interest expense | 4,160 |
| Trustees' fees and expenses | 65,561 |
| Other | 76,079 |
| Total expenses | 1,650,725 |
| Net investment income (loss) | 36,714,239 |
| Realized and Unrealized Gain (Loss) | |
Net realized gain (loss) from: Investments | 122,414,108 |
| Futures | 2,854,958 |
| 125,269,066 | |
Change in net unrealized appreciation (depreciation) on: Investments | 31,651,724 |
| Futures | (422,442) |
| 31,229,282 | |
| Net gain (loss) | 156,498,348 |
| Net increase (decrease) in net assets resulting from operations | $ 193,212,587 |
The accompanying notes are an integral part of the financial statements.
Statements of Changes in Net Assets
| Years Ended December 31, | ||
| Increase (Decrease) in Net Assets | 2016 | 2015 |
Operations: Net investment income (loss) | $ 36,714,239 | $ 37,161,281 |
| Net realized gain (loss) | 125,269,066 | 83,367,618 |
| Change in net unrealized appreciation (depreciation) | 31,229,282 | (93,609,321) |
| Net increase (decrease) in net assets resulting from operations | 193,212,587 | 26,919,578 |
Capital transactions in shares of beneficial interest: Proceeds from capital invested | 73,617,486 | 344,866,466 |
| Value of capital withdrawn | (343,640,856) | (510,374,213) |
| Net increase (decrease) in net assets from capital transactions in shares of beneficial interest | (270,023,370) | (165,507,747) |
| Increase (decrease) in net assets | (76,810,783) | (138,588,169) |
| Net assets at beginning of period | 1,765,365,100 | 1,903,953,269 |
| Net assets at end of period | $ 1,688,554,317 | $ 1,765,365,100 |
The accompanying notes are an integral part of the financial statements.
Financial Highlights
Years Ended December 31, | ||||||
| 2016 | 2015 | 2014 | 2013 | 2012 | ||
| Ratios to Average Net Assets and Supplemental Data | ||||||
| Net assets, end of period ($ millions) | 1,689 | 1,765 | 1,904 | 2,018 | 2,100 | |
| Ratio of expenses (%) | .10 | .10 | .10 | .10 | .09 | |
| Ratio of net investment income (%) | 2.14 | 2.00 | 1.95 | 2.01 | 2.24 | |
| Portfolio turnover rate (%) | 3 | 3 | 2 | 3b | 4 | |
| Total investment return (%)a | 11.75 | 1.33 | 13.50 | 32.14 | 15.87 | |
a Total investment return for the Portfolio was derived from the performance of the Institutional Class of Deutsche Equity 500 Index Fund. b Excludes portfolio securities delivered as a result of processing redemption in-kind transactions. | ||||||
Notes to Financial Statements
A. Organization and Significant Accounting Policies
Deutsche Equity 500 Index Portfolio (the "Portfolio") is registered under the Investment Company Act of 1940, as amended (the "1940 Act"), as a diversified open-end management investment company organized as a New York trust.
The Portfolio is a master fund; a master/feeder fund structure is one in which a fund (a "feeder fund"), instead of investing directly in a portfolio of securities, invests most or all of its investment assets in a separate registered investment company (the "master fund") with substantially the same investment objective and policies as the feeder fund. Such a structure permits the pooling of assets of two or more feeder funds, preserving separate identities or distribution channels at the feeder fund level. The Portfolio has two affiliated Deutsche feeder funds, with a significant ownership percentage of the Portfolio's net assets. Investment activities of these feeder funds could have a material impact on the Portfolio. As of December 31, 2016, Deutsche S&P 500 Index Fund and Deutsche Equity 500 Index Fund owned approximately 53% and 47%, respectively, of the Portfolio.
The Portfolio's financial statements are prepared in accordance with accounting principles generally accepted in the United States of America ("U.S. GAAP") which require the use of management estimates. Actual results could differ from those estimates. The Fund qualifies as an investment company under Topic 946 of Accounting Standards Codification of U.S. GAAP. The policies described below are followed consistently by the Portfolio in the preparation of its financial statements.
Security Valuation. Investments are stated at value determined as of the close of regular trading on the New York Stock Exchange on each day the exchange is open for trading.
Various inputs are used in determining the value of the Portfolio's investments. These inputs are summarized in three broad levels. Level 1 includes quoted prices in active markets for identical securities. Level 2 includes other significant observable inputs (including quoted prices for similar securities, interest rates, prepayment speeds and credit risk). Level 3 includes significant unobservable inputs (including the Portfolio's own assumptions in determining the fair value of investments). The level assigned to the securities valuations may not be an indication of the risk or liquidity associated with investing in those securities.
Equity securities are valued at the most recent sale price or official closing price reported on the exchange (U.S. or foreign) or over-the-counter market on which they trade. Securities for which no sales are reported are valued at the calculated mean between the most recent bid and asked quotations on the relevant market or, if a mean cannot be determined, at the most recent bid quotation. Equity securities are generally categorized as Level 1.
Debt securities are valued at prices supplied by independent pricing services approved by the Portfolio's Board. Such services may use various pricing techniques which take into account appropriate factors such as yield, quality, coupon rate, maturity, type of issue, trading characteristics, prepayment speeds and other data, as well as broker quotes. If the pricing services are unable to provide valuations, debt securities are valued at the average of the most recent reliable bid quotations or evaluated prices, as applicable, obtained from broker-dealers. These securities are generally categorized as Level 2.
Investments in open-end investment companies are valued at their net asset value each business day and are categorized as Level 1.
Futures contracts are generally valued at the settlement prices established each day on the exchange on which they are traded and are categorized as Level 1.
Securities and other assets for which market quotations are not readily available or for which the above valuation procedures are deemed not to reflect fair value are valued in a manner that is intended to reflect their fair value as determined in accordance with procedures approved by the Board and are generally categorized as Level 3. In accordance with the Portfolio's valuation procedures, factors considered in determining value may include, but are not limited to, the type of the security; the size of the holding; the initial cost of the security; the existence of any contractual restrictions on the security's disposition; the price and extent of public trading in similar securities of the issuer or of comparable companies; quotations or evaluated prices from broker-dealers and/or pricing services; information obtained from the issuer, analysts, and/or the appropriate stock exchange (for exchange-traded securities); an analysis of the company's or issuer's financial statements; an evaluation of the forces that influence the issuer and the market(s) in which the security is purchased and sold; and with respect to debt securities, the maturity, coupon, creditworthiness, currency denomination and the movement of the market in which the security is normally traded. The value determined under these procedures may differ from published values for the same securities.
Securities Lending. Brown Brothers Harriman & Co., as lending agent, lends securities of the Portfolio to certain financial institutions under the terms of its securities lending agreement. During the term of the loans, the Portfolio continues to receive interest and dividends generated by the securities and to participate in any changes in their market value. The Portfolio requires the borrowers of the securities to maintain collateral with the Portfolio consisting of either cash or liquid, unencumbered assets having a value at least equal to the value of the securities loaned. When the collateral falls below specified amounts, the lending agent will use its best efforts to obtain additional collateral on the next business day to meet required amounts under the securities lending agreement. As of period end, any securities on loan were collateralized by cash. During the year ended December 31, 2016, the Portfolio invested the cash collateral into a joint trading account in affiliated money market funds managed by Deutsche Investment Management Americas Inc. As of December 31, 2016, the Portfolio invested the cash collateral in Government & Agency Securities Portfolio. Deutsche Investment Management Americas Inc. receives a management/administration fee (0.09% annualized effective rate as of December 31, 2016) on the cash collateral invested in Government & Agency Securities Portfolio. The Portfolio receives compensation for lending its securities either in the form of fees or by earning interest on invested cash collateral net of borrower rebates and fees paid to a lending agent. Either the Portfolio or the borrower may terminate the loan at any time, and the borrower, after notice, is required to return borrowed securities within a standard time period. There may be risks of delay and costs in recovery of securities or even loss of rights in the collateral should the borrower of the securities fail financially. If the Portfolio is not able to recover securities lent, the Portfolio may sell the collateral and purchase a replacement investment in the market, incurring the risk that the value of the replacement security is greater than the value of the collateral. The Portfolio is also subject to all investment risks associated with the reinvestment of any cash collateral received, including, but not limited to, interest rate, credit and liquidity risk associated with such investments.
As of December 31, 2016, the Portfolio had securities on loan, which were classified as common stock in the Investment Portfolio. The value of the related collateral exceeded the value of the securities loaned at period end. As of period end, the remaining contractual maturity of the collateral agreements were overnight and continuous.
Federal Income Taxes. The Portfolio is considered a partnership under the Internal Revenue Code, as amended. Therefore, no federal income tax provision is necessary.
It is intended that the Portfolio's assets, income and distributions will be managed in such a way that an investor in the Portfolio will be able to satisfy the requirements of Subchapter M of the Code, assuming that the investor invested all of its assets in the Portfolio.
The Portfolio has reviewed the tax positions for the open tax years as of December 31, 2016 and has determined that no provision for income tax and/or uncertain tax provisions is required in the Portfolio's financial statements. The Portfolio's federal tax returns for the prior three fiscal years remain open subject to examination by the Internal Revenue Service.
Contingencies. In the normal course of business, the Portfolio may enter into contracts with service providers that contain general indemnification clauses. The Portfolio's maximum exposure under these arrangements is unknown, as this would involve future claims that may be made against the Portfolio that have not yet been made. However, based on experience, the Portfolio expects the risk of loss to be remote.
Other. Investment transactions are accounted for on a trade date plus one basis for daily net asset value calculations. However, for financial reporting purposes, investment transactions are reported on trade date. Interest income is recorded on the accrual basis. Dividend income is recorded on the ex-dividend date net of foreign withholding taxes. Realized gains and losses from investment transactions are recorded on an identified cost basis. Proceeds from litigation payments, if any, are included in net realized gain (loss) from investments.
The Portfolio makes a daily allocation of its net investment income and realized and unrealized gains and losses from securities, futures and foreign currency transactions to its investors in proportion to their investment in the Portfolio.
B. Derivative Instruments
Futures Contracts. A futures contract is an agreement between a buyer or seller and an established futures exchange or its clearinghouse in which the buyer or seller agrees to take or make a delivery of a specific amount of a financial instrument at a specified price on a specific date (settlement date). For the year ended December 31, 2016, the Portfolio invested in futures contracts to keep cash on hand to meet shareholder redemptions or other needs while maintaining exposure to the stock market.
Upon entering into a futures contract, the Portfolio is required to deposit with a financial intermediary cash or securities ("initial margin") in an amount equal to a certain percentage of the face value indicated in the futures contract. Subsequent payments ("variation margin") are made or received by the Portfolio dependent upon the daily fluctuations in the value and are recorded for financial reporting purposes as unrealized gains or losses by the Portfolio. Gains or losses are realized when the contract expires or is closed. Since all futures contracts are exchange traded, counterparty risk is minimized as the exchange's clearinghouse acts as the counterparty, and guarantees the futures against default.
Certain risks may arise upon entering into futures contracts, including the risk that an illiquid market will limit the Portfolio's ability to close out a futures contract prior to the settlement date and the risk that the futures contract is not well correlated with the security, index or currency to which it relates. Risk of loss may exceed amounts disclosed in the Statement of Assets and Liabilities.
A summary of the open futures contracts as of December 31, 2016 is included in a table following the Portfolio's Investment Portfolio. For the year ended December 31, 2016, the investment in futures contracts purchased had a total notional value generally indicative of a range from approximately $28,623,000 to $43,316,000.
The following table summarizes the value of the Portfolio's derivative instruments held as of December 31, 2016 presented by primary underlying risk exposure:
| Liability Derivative | Futures Contracts |
| Equity Contracts (a) | $ (187,303) |
| (a) Includes cumulative depreciation of futures contracts as disclosed in the Investment Portfolio. Unsettled variation margin is disclosed separately within the Statement of Assets and Liabilities. | |
Additionally, the amount of unrealized and realized gains and losses on derivative instruments recognized in Portfolio earnings during the year ended December 31, 2016 and the related location in the accompanying Statement of Operations is summarized in the following tables by primary underlying risk exposure:
| Realized Gain (Loss) | Futures Contracts |
| Equity Contracts (a) | $ 2,854,958 |
The above derivative is located in the following Statement of Operations account: (a) Net realized gain (loss) from futures | |
| Change in Net Unrealized Appreciation (Depreciation) | Futures Contracts |
| Equity Contracts (a) | $ (422,442) |
The above derivative is located in the following Statement of Operations account: (a) Change in net unrealized appreciation (depreciation) on futures | |
C. Purchases and Sales of Securities
During the year ended December 31, 2016, purchases and sales of investment securities (excluding short-term investments) aggregated $56,181,326 and $270,027,361, respectively.
D. Related Parties
Deutsche Investment Management Americas Inc. ("DIMA" or the "Advisor"), an indirect, wholly owned subsidiary of Deutsche Bank AG, serves as the investment manager to the Portfolio.
Management Agreement. Under its Investment Management Agreement with the Portfolio, the Advisor determines the securities, instruments and other contracts relating to investments to be purchased, sold or entered into by the Portfolio or delegates such responsibility to the Portfolio's sub-advisor. Northern Trust Investments, Inc. ("NTI") serves as sub-advisor to the Portfolio and is paid by the Advisor for its services. NTI is responsible for the day-to-day management of the Portfolio.
The management fee payable under the Investment Management Agreement is equal to an annual rate (exclusive of any applicable waivers/reimbursments) of 0.05% of the Portfolio's average daily net assets, computed and accrued daily and payable monthly.
Administration Fee. Pursuant to an Administrative Services Agreement, DIMA provides most administrative services to the Portfolio. For all services provided under the Administrative Services Agreement, the Portfolio pays the Advisor an annual fee ("Administration Fee") of 0.03% of the Portfolio's average daily net assets, computed and accrued daily and payable monthly. For the year ended December 31, 2016, the Administration Fee was $515,174, of which $44,274 is unpaid.
Filing Service Fee. Under an agreement with DIMA, DIMA is compensated for providing certain regulatory filing services to the Portfolio. For the year ended December 31, 2016, the amount charged to the Portfolio by DIMA included in the Statement of Operations under "Reports to shareholders" aggregated $3,177, of which $482 is unpaid.
Trustees' Fees and Expenses. The Portfolio paid retainer fees to each Trustee not affiliated with the Advisor, plus specified amounts to the Board Chairperson and Vice Chairperson and to each committee Chairperson.
Affiliated Cash Management Vehicles. The Portfolio may invest uninvested cash balances in Deutsche Central Cash Management Government Fund and Deutsche Variable NAV Money Fund, affiliated money market funds which are managed by the Advisor. Each affiliated money market fund is managed in accordance with Rule 2a-7 under the 1940 Act, which governs the quality, maturity, diversity and liquidity of instruments in which a money market fund may invest. Deutsche Central Cash Management Government Fund seeks to maintain a stable net asset value, and Deutsche Variable NAV Money Fund maintains a floating net asset value. The Portfolio indirectly bears its proportionate share of the expenses of each affiliated money market fund in which it invests. Deutsche Central Cash Management Government Fund does not pay the Advisor an investment management fee. To the extent that Deutsche Variable NAV Money Fund pays an investment management fee to the Advisor, the Advisor will waive an amount of the investment management fee payable to the Advisor by the Portfolio equal to the amount of the investment management fee payable on the Portfolio's assets invested in Deutsche Variable NAV Money Fund.
E. Line of Credit
The Portfolio and other affiliated funds (the "Participants") share in a $400 million revolving credit facility provided by a syndication of banks. The Portfolio may borrow for temporary or emergency purposes, including the meeting of redemption requests that otherwise might require the untimely disposition of securities. The Participants are charged an annual commitment fee which is allocated based on net assets, among each of the Participants. Interest is calculated at a rate per annum equal to the sum of the Federal Funds Rate plus 1.25 percent plus if the one-month LIBOR exceeds the Federal Funds Rate, the amount of such excess. The Portfolio may borrow up to a maximum of 33 percent of its net assets under the agreement.
At December 31, 2016, the Portfolio had a $21,650,000 outstanding loan. Interest expense incurred on the borrowings was $4,160 for the year ended December 31, 2016. The average dollar amount of the borrowings was $8,272,000, the weighted average interest rate on these borrowings was 2.01% and the Portfolio had a loan outstanding for 9 days throughout the period. The borrowings were valued at cost, which approximates fair value.
Report of Independent Registered Public Accounting Firm
To the Board of Trustees and Holders of Beneficial Interest in Deutsche Equity 500 Index Portfolio:
In our opinion, the accompanying statement of assets and liabilities, including the investment portfolio, and the related statements of operations and of changes in net assets and the financial highlights present fairly, in all material respects, the financial position of Deutsche Equity 500 Index Portfolio (the "Portfolio") as of December 31, 2016, and the results of its operations, the changes in its net assets and the financial highlights for each of the periods indicated therein, in conformity with accounting principles generally accepted in the United States of America. These financial statements and financial highlights (hereafter referred to as "financial statements") are the responsibility of the Portfolio's management. Our responsibility is to express an opinion on these financial statements based on our audits. We conducted our audits of these financial statements in accordance with the standards of the Public Company Accounting Oversight Board (United States). Those standards require that we plan and perform the audit to obtain reasonable assurance about whether the financial statements are free of material misstatement. An audit includes examining, on a test basis, evidence supporting the amounts and disclosures in the financial statements, assessing the accounting principles used and significant estimates made by management, and evaluating the overall financial statement presentation. We believe that our audits, which included confirmation of securities as of December 31, 2016 by correspondence with the custodian, brokers and transfer agent, and the application of alternative auditing procedures where such confirmations had not been received, provide a reasonable basis for our opinion.
| Boston, Massachusetts February 24, 2017 | PricewaterhouseCoopers LLP |
Advisory Agreement and Sub-Advisory Agreement Board Considerations and Fee Evaluation
Deutsche S&P 500 Index Fund (the "Fund"), a series of Deutsche Institutional Funds, invests substantially all of its assets in Deutsche Equity 500 Index Portfolio (the "Portfolio") in order to achieve its investment objective. The Portfolio’s Board of Trustees approved the renewal of the Portfolio’s investment management agreement (the "Portfolio Agreement") with Deutsche Investment Management Americas Inc. ("DIMA") and the sub-advisory agreement (the "Sub-Advisory Agreement") between DIMA and Northern Trust Investments, Inc. ("NTI"), and the Fund’s Board of Trustees (which consists of the same members as the Board of Trustees of the Portfolio) approved the renewal of the Fund’s investment management agreement with DIMA (the "Fund Agreement" and together with the Portfolio Agreement and the Sub-Advisory Agreement, the "Agreements") in September 2016. The Portfolio’s Board of Trustees and the Fund’s Board of Trustees are collectively referred to as the "Board" or "Trustees."
In terms of the process that the Board followed prior to approving the Agreements, shareholders should know that:
— During the entire process, all of the Portfolio’s and the Fund’s Trustees were independent of DIMA and its affiliates (the "Independent Trustees").
— The Board met frequently during the past year to discuss fund matters and dedicated a substantial amount of time to contract review matters. Over the course of several months, the Board’s Contract Committee reviewed extensive materials received from DIMA, independent third parties and independent counsel. These materials included an analysis of performance, fees and expenses, and profitability from a fee consultant retained by the Independent Trustees (the "Fee Consultant"). The Board also received extensive information throughout the year regarding performance of the Portfolio and the Fund.
— The Independent Trustees regularly meet privately with counsel to discuss contract review and other matters. In addition, the Independent Trustees were advised by the Fee Consultant in the course of their review of the Portfolio’s and the Fund’s contractual arrangements and considered a comprehensive report prepared by the Fee Consultant in connection with their deliberations.
— In connection with reviewing the Agreements, the Board also reviewed the terms of the Fund’s Rule 12b-1 plan, distribution agreement, administrative services agreement, transfer agency agreement and other material service agreements.
— Based on its evaluation of the information provided, the Contract Committee presented its findings and recommendations to the Board. The Board then reviewed the Contract Committee’s findings and recommendations.
In connection with the contract review process, the Contract Committee and the Board considered the factors discussed below, among others. The Board also considered that DIMA and its predecessors have managed the Portfolio and the Fund since their inception, and the Board believes that a long-term relationship with a capable, conscientious advisor is in the best interests of the Portfolio and the Fund. The Board considered, generally, that shareholders chose to invest or remain invested in the Fund knowing that DIMA managed the Portfolio and the Fund. DIMA is part of Deutsche Bank AG’s ("Deutsche Bank") Asset Management ("Deutsche AM") division. Deutsche AM is a global asset management business that offers a wide range of investing expertise and resources, including research capabilities in many countries throughout the world. Deutsche Bank has advised the Board that the U.S. asset management business continues to be a critical and integral part of Deutsche Bank, and that Deutsche Bank will continue to invest in Deutsche AM and seek to enhance Deutsche AM’s investment platform. Deutsche Bank also has confirmed its commitment to maintaining strong legal and compliance groups within the Deutsche AM division.
As part of the contract review process, the Board carefully considered the fees and expenses of each Deutsche fund overseen by the Board in light of the fund’s performance. In many cases, this led to the negotiation and implementation of expense caps. As part of these negotiations, the Board indicated that it would consider relaxing these caps in future years following sustained improvements in performance, among other considerations.
While shareholders may focus primarily on fund performance and fees, the Board considers these and many other factors, including the quality and integrity of DIMA’s and NTI’s personnel and such other issues as back-office operations, fund valuations, and compliance policies and procedures.
Nature, Quality and Extent of Services. The Board considered the terms of the Agreements, including the scope of advisory services provided under the Agreements. The Board noted that, under the Agreements, DIMA and NTI provide portfolio management services to the Portfolio and the Fund and that, pursuant to separate administrative services agreements, DIMA provides administrative services to the Portfolio and the Fund. The Board considered the experience and skills of senior management and investment personnel and the resources made available to such personnel. Throughout the course of the year, the Board also received information regarding DIMA’s oversight of sub-advisers, including NTI. The Board reviewed the Portfolio’s and the Fund’s performance over short-term and long-term periods and compared those returns to various agreed-upon performance measures, including market index(es) and a peer universe compiled using information supplied by Morningstar Direct ("Morningstar"), an independent fund data service. The Board also noted that it has put into place a process of identifying "Focus Funds" (e.g., funds performing poorly relative to a peer universe), and receives additional reporting from DIMA regarding such funds and, where appropriate, DIMA’s plans to address underperformance. The Board believes this process is an effective manner of identifying and addressing underperforming funds. Based on the information provided, the Board noted that for the one-, three- and five-year periods ended December 31, 2015, the Fund’s performance (Class A shares) was in the 2nd quartile of the applicable Morningstar universe (the 1st quartile being the best performers and the 4th quartile being the worst performers).
Fees and Expenses. The Board considered the Portfolio’s and the Fund’s investment management fee schedules, the Portfolio’s sub-advisory fee schedule, the Fund’s operating expenses and total expense ratios, and comparative information provided by Broadridge Financial Solutions, Inc. ("Broadridge") and the Fee Consultant regarding investment management fee rates paid to other investment advisors by similar funds (1st quartile being the most favorable and 4th quartile being the least favorable). With respect to management fees paid to other investment advisors by similar funds, the Board noted that the contractual fee rates paid by the Portfolio and the Fund, which include 0.03% and 0.10% fees paid to DIMA under the respective administrative services agreements, were equal to the median (2nd quartile) of the applicable Broadridge peer group (based on Broadridge data provided as of December 31, 2015). The Board noted that, although shareholders of the Fund indirectly bear the Portfolio’s management fee, the Fund does not charge an additional investment management fee. With respect to the sub-advisory fee paid to NTI, the Board noted that the fee is paid by DIMA out of its fee and not directly by the Portfolio. The Board noted that the Fund’s Class A shares total (net) operating expenses (excluding 12b-1 fees), which include Portfolio expenses allocated to the Fund, were expected to be higher than the median (3rd quartile) of the applicable Broadridge expense universe (based on Broadridge data provided as of December 31, 2015, and analyzing Broadridge expense universe Class A (net) expenses less any applicable 12b-1 fees) ("Broadridge Universe Expenses"). The Board also reviewed data comparing each share class’s total (net) operating expenses to the applicable Broadridge Universe Expenses. The Board noted that the expense limitations agreed to by DIMA were expected to help the Fund’s total (net) operating expenses remain competitive. The Board considered the management fee rate as compared to fees charged by DIMA to comparable Deutsche U.S. registered funds ("Deutsche Funds") and considered differences between the Portfolio and the Fund and the comparable Deutsche Funds. The information requested by the Board as part of its review of fees and expenses also included information about institutional accounts (including any sub-advised funds and accounts) and funds offered primarily to European investors ("Deutsche Europe funds") managed by Deutsche AM. The Board noted that DIMA indicated that Deutsche AM does not manage any institutional accounts or Deutsche Europe funds comparable to the Portfolio and the Fund.
On the basis of the information provided, the Board concluded that management fees were reasonable and appropriate in light of the nature, quality and extent of services provided by DIMA and NTI.
Profitability. The Board reviewed detailed information regarding revenues received by DIMA under the Agreements. The Board considered the estimated costs and pre-tax profits realized by DIMA from advising the Deutsche Funds, as well as estimates of the pre-tax profits attributable to managing the Fund in particular. The Board also received information regarding the estimated enterprise-wide profitability of DIMA and its affiliates with respect to all fund services in totality and by fund. The Board and the Fee Consultant reviewed DIMA’s methodology in allocating its costs to the management of the Fund. Based on the information provided, the Board concluded that the pre-tax profits realized by DIMA in connection with the management of the Fund were not unreasonable. The Board also reviewed certain publicly available information regarding the profitability of certain similar investment management firms. The Board noted that while information regarding the profitability of such firms is limited (and in some cases is not necessarily prepared on a comparable basis), DIMA and its affiliates’ overall profitability with respect to the Deutsche Funds (after taking into account distribution and other services provided to the funds by DIMA and its affiliates) was lower than the overall profitability levels of most comparable firms for which such data was available. The Board did not consider the profitability of NTI with respect to the Fund. The Board noted that DIMA pays NTI’s fee out of its management fee, and its understanding that the Portfolio’s sub-advisory fee schedule was the product of an arm’s length negotiation with DIMA.
Economies of Scale. The Board considered whether there are economies of scale with respect to the management of the Portfolio and the Fund and whether the Portfolio and the Fund benefit from any economies of scale. In this regard, the Board observed that while the Portfolio’s and the Fund’s current investment management fee schedule does not include breakpoints, the Portfolio’s and the Fund’s fee schedule represents an appropriate sharing between the Portfolio and the Fund and DIMA of such economies of scale as may exist in the management of the Portfolio and the Fund at current asset levels.
Other Benefits to DIMA and NTI and Their Affiliates. The Board also considered the character and amount of other incidental benefits received by DIMA and NTI and their affiliates, including any fees received by DIMA for administrative services provided to the Portfolio and to the Fund and any fees received by an affiliate of DIMA for distribution services. The Board also considered benefits to DIMA and NTI related to brokerage and soft-dollar allocations, including allocating brokerage to pay for research generated by parties other than the executing broker dealers, which pertain primarily to funds investing in equity securities, along with the incidental public relations benefits to DIMA and NTI related to Deutsche Funds advertising and cross-selling opportunities among DIMA products and services. The Board considered these benefits in reaching its conclusion that the Fund’s management fees were reasonable.
Compliance. The Board considered the significant attention and resources dedicated by DIMA to documenting and enhancing its compliance processes in recent years. The Board noted in particular (i) the experience, seniority and time commitment of the individuals serving as DIMA’s and the Fund’s chief compliance officers; (ii) the large number of DIMA compliance personnel; and (iii) the substantial commitment of resources by DIMA and its affiliates to compliance matters. The Board also considered the attention and resources dedicated by DIMA to the oversight of the investment sub-advisor’s compliance program and compliance with the applicable fund policies and procedures.
Based on all of the information considered and the conclusions reached, the Board unanimously determined that the continuation of the Agreements is in the best interests of the Portfolio and the Fund. In making this determination, the Board did not give particular weight to any single factor identified above. The Board considered these factors over the course of numerous meetings, certain of which were in executive session with only the Independent Trustees and counsel present. It is possible that individual Independent Trustees may have weighed these factors differently in reaching their individual decisions to approve the continuation of the Agreements.
Board Members and Officers
The following table presents certain information regarding the Board Members and Officers of the fund. Each Board Member's year of birth is set forth in parentheses after his or her name. Unless otherwise noted, (i) each Board Member has engaged in the principal occupation(s) noted in the table for at least the most recent five years, although not necessarily in the same capacity; and (ii) the address of each Independent Board Member is c/o Keith R. Fox, Deutsche Funds Board Chair, c/o Thomas R. Hiller, Ropes & Gray LLP, Prudential Tower, 800 Boylston Street, Boston, MA 02199-3600. Except as otherwise noted below, the term of office for each Board Member is until the election and qualification of a successor, or until such Board Member sooner dies, resigns, is removed or as otherwise provided in the governing documents of the fund. Because the fund does not hold an annual meeting of shareholders, each Board Member will hold office for an indeterminate period. The Board Members may also serve in similar capacities with other funds in the fund complex.
| Independent Board Members | |||
| Name, Year of Birth, Position with the Fund and Length of Time Served1 | Business Experience and Directorships During the Past Five Years | Number of Funds in Deutsche Fund Complex Overseen | Other Directorships Held by Board Member |
Keith R. Fox, CFA (1954) Chairperson since 2017,2 and Board Member since 1996 | Managing General Partner, Exeter Capital Partners (a series of private investment funds) (since 1986). Directorships: Progressive International Corporation (kitchen goods importer and distributor); The Kennel Shop (retailer); former Chairman, National Association of Small Business Investment Companies; former Directorships: BoxTop Media Inc. (advertising); Sun Capital Advisers Trust (mutual funds) (2011–2012) | 98 | — |
Kenneth C. Froewiss (1945) Vice Chairperson since 2017,2 Board Member since 2001, and Chairperson (2013�� December 31, 2016) | Retired Clinical Professor of Finance, NYU Stern School of Business (1997–2014); Member, Finance Committee, Association for Asian Studies (2002–present); Director, Mitsui Sumitomo Insurance Group (US) (2004–present); prior thereto, Managing Director, J.P. Morgan (investment banking firm) (until 1996) | 98 | — |
John W. Ballantine (1946) Board Member since 1999 | Retired; formerly, Executive Vice President and Chief Risk Management Officer, First Chicago NBD Corporation/The First National Bank of Chicago (1996–1998); Executive Vice President and Head of International Banking (1995–1996); former Directorships: Director and former Chairman of the Board, Healthways, Inc.3 (population well-being and wellness services) (2003–2014); Stockwell Capital Investments PLC (private equity); First Oak Brook Bancshares, Inc. and Oak Brook Bank; Prisma Energy International
| 98 | Portland General Electric3 (utility company) (2003– present) |
Henry P. Becton, Jr. (1943) Board Member since 1990 | Vice Chair and former President, WGBH Educational Foundation. Directorships: Public Radio International; Public Radio Exchange (PRX); The Pew Charitable Trusts (charitable organization); former Directorships: Becton Dickinson and Company3 (medical technology company); Belo Corporation3 (media company); The PBS Foundation; Association of Public Television Stations; Boston Museum of Science; American Public Television; Concord Academy; New England Aquarium; Mass. Corporation for Educational Telecommunications; Committee for Economic Development; Public Broadcasting Service; Connecticut College; North Bennett Street School (Boston) | 98 | — |
Dawn-Marie Driscoll (1946) Board Member since 1987 | Emeritus Executive Fellow, Center for Business Ethics, Bentley University; formerly: President, Driscoll Associates (consulting firm); Partner, Palmer & Dodge (law firm) (1988–1990); Vice President of Corporate Affairs and General Counsel, Filene's (retail) (1978–1988). Directorships: Advisory Board, Center for Business Ethics, Bentley University; Trustee and former Chairman of the Board, Southwest Florida Community Foundation (charitable organization); former Directorships: ICI Mutual Insurance Company (2007–2015); Sun Capital Advisers Trust (mutual funds) (2007–2012), Investment Company Institute (audit, executive, nominating committees) and Independent Directors Council (governance, executive committees) | 98 | — |
Paul K. Freeman (1950) Board Member since 1993 | Consultant, World Bank/Inter-American Development Bank; Chair, Independent Directors Council; Investment Company Institute (executive and nominating committees); formerly, Chairman of Education Committee of Independent Directors Council; Project Leader, International Institute for Applied Systems Analysis (1998–2001); Chief Executive Officer, The Eric Group, Inc. (environmental insurance) (1986–1998); Directorships: Denver Zoo Foundation (December 2012–present); former Directorships: Prisma Energy International | 98 | — |
Richard J. Herring (1946) Board Member since 1990 | Jacob Safra Professor of International Banking and Professor, Finance Department, The Wharton School, University of Pennsylvania (since July 1972); Co-Director, Wharton Financial Institutions Center; formerly: Vice Dean and Director, Wharton Undergraduate Division (July 1995–June 2000); Director, Lauder Institute of International Management Studies (July 2000–June 2006) | 98 | Director, Aberdeen Singapore and Japan Funds (since 2007); Independent Director of Barclays Bank Delaware (since September 2010) |
William McClayton (1944) Board Member since 2004, and Vice Chairperson (2013– December 31, 2016) | Private equity investor (since October 2009); previously, Managing Director, Diamond Management & Technology Consultants, Inc. (global consulting firm) (2001–2009); Directorship: Board of Managers, YMCA of Metropolitan Chicago; formerly: Senior Partner, Arthur Andersen LLP (accounting) (1966–2001); Trustee, Ravinia Festival | 98 | — |
Rebecca W. Rimel (1951) Board Member since 1995 | President, Chief Executive Officer and Director, The Pew Charitable Trusts (charitable organization) (1994–present); formerly: Executive Vice President, The Glenmede Trust Company (investment trust and wealth management) (1983–2004); Board Member, Investor Education (charitable organization) (2004–2005); Trustee, Executive Committee, Philadelphia Chamber of Commerce (2001–2007); Director, Viasys Health Care3 (January 2007–June 2007); Trustee, Thomas Jefferson Foundation (charitable organization) (1994–2012) | 98 | Director, Becton Dickinson and Company3 (medical technology company) (2012– present); Director, BioTelemetry Inc.3 (health care) (2009– present) |
William N. Searcy, Jr. (1946) Board Member since 1993 | Private investor since October 2003; formerly: Pension & Savings Trust Officer, Sprint Corporation3 (telecommunications) (November 1989–September 2003); Trustee, Sun Capital Advisers Trust (mutual funds) (1998–2012) | 98 | — |
Jean Gleason Stromberg (1943) Board Member since 1997 | Retired. Formerly, Consultant (1997–2001); Director, Financial Markets U.S. Government Accountability Office (1996–1997); Partner, Norton Rose Fulbright, L.L.P. (law firm) (1978–1996); former Directorships: The William and Flora Hewlett Foundation (charitable organization) (2000–2015); Service Source, Inc. (nonprofit), Mutual Fund Directors Forum (2002–2004), American Bar Retirement Association (funding vehicle for retirement plans) (1987–1990 and 1994–1996) | 98 | — |
| Officers5 | |
| Name, Year of Birth, Position with the Fund and Length of Time Served6 | Business Experience and Directorships During the Past Five Years |
Brian E. Binder9 (1972) President and Chief Executive Officer, 2013–present | Managing Director4 and Head of US Product and Fund Administration, Deutsche Asset Management (2013–present); Director and President, Deutsche AM Service Company (since 2016); Director and Vice President, Deutsche AM Distributors, Inc. (since 2016); Director and President, DB Investment Managers, Inc. (since 2016); formerly, Head of Business Management and Consulting at Invesco, Ltd. (2010–2012) |
John Millette8 (1962) Vice President and Secretary, 1999–present | Director,4 Deutsche Asset Management; Chief Legal Officer and Secretary, Deutsche Investment Management Americas Inc. (2015–present); and Director and Vice President, Deutsche AM Trust Company (since 2016) |
Hepsen Uzcan7 (1974) Vice President, since 2016 Assistant Secretary, 2013–present | Director,4 Deutsche Asset Management |
Paul H. Schubert7 (1963) Chief Financial Officer, 2004–present Treasurer, 2005–present | Managing Director,4 Deutsche Asset Management, and Chairman, Director and President, Deutsche AM Trust Company (since 2013); Vice President, Deutsche AM Distributors, Inc. (since 2016); formerly, Director, Deutsche AM Trust Company (2004–2013) |
Caroline Pearson8 (1962) Chief Legal Officer, 2010–present | Managing Director,4 Deutsche Asset Management; Secretary, Deutsche AM Distributors, Inc.; and Secretary, Deutsche AM Service Company |
Scott D. Hogan8 (1970) Chief Compliance Officer, since 2016 | Director,4 Deutsche Asset Management |
Wayne Salit7 (1967) Anti-Money Laundering Compliance Officer, 2014–present | Director,4 Deutsche Asset Management; AML Compliance Officer, Deutsche AM Distributors, Inc.; formerly: Managing Director, AML Compliance Officer at BNY Mellon (2011–2014); and Director, AML Compliance Officer at Deutsche Bank (2004–2011) |
Paul Antosca8 (1957) Assistant Treasurer, 2007–present | Director,4 Deutsche Asset Management |
Diane Kenneally8 (1966) Assistant Treasurer, 2007–present | Director,4 Deutsche Asset Management |
1 The length of time served represents the year in which the Board Member joined the board of one or more Deutsche funds currently overseen by the Board.
2 Effective as of January 1, 2017.
3 A publicly held company with securities registered pursuant to Section 12 of the Securities Exchange Act of 1934.
4 Executive title, not a board directorship.
5 As a result of their respective positions held with the Advisor, these individuals are considered "interested persons" of the Advisor within the meaning of the 1940 Act. Interested persons receive no compensation from the fund.
6 The length of time served represents the year in which the officer was first elected in such capacity for one or more Deutsche funds.
7 Address: 60 Wall Street, New York, NY 10005.
8 Address: One Beacon Street, Boston, MA 02108.
9 Address: 222 South Riverside Plaza, Chicago, IL 60606.
The fund's Statement of Additional Information ("SAI") includes additional information about the Board Members. The SAI is available, without charge, upon request. If you would like to request a copy of the SAI, you may do so by calling the following toll-free number: (800) 728-3337.
Account Management Resources
| For More Information | The automated telephone system allows you to access personalized account information and obtain information on other Deutsche funds using either your voice or your telephone keypad. Certain account types within Classes A, C and S also have the ability to purchase, exchange or redeem shares using this system. For more information, contact your financial advisor. You may also access our automated telephone system or speak with a Shareholder Service representative by calling: (800) 728-3337 |
| Web Site | deutschefunds.com View your account transactions and balances, trade shares, monitor your asset allocation, subscribe to fund and account updates by e-mail, and change your address, 24 hours a day. Obtain prospectuses and applications, blank forms, interactive worksheets, news about Deutsche funds, retirement planning information, and more. |
| Written Correspondence | Deutsche Asset Management PO Box 219151 |
| Proxy Voting | The fund's policies and procedures for voting proxies for portfolio securities and information about how the fund voted proxies related to its portfolio securities during the most recent 12-month period ended June 30 are available on our Web site — deutschefunds.com (click on "proxy voting"at the bottom of the page) — or on the SEC's Web site — sec.gov. To obtain a written copy of the fund's policies and procedures without charge, upon request, call us toll free at (800) 728-3337. |
| Portfolio Holdings | Following the fund's fiscal first and third quarter-end, a complete portfolio holdings listing is filed with the SEC on Form N-Q. This form will be available on the SEC's Web site at sec.gov, and it also may be reviewed and copied at the SEC's Public Reference Room in Washington, D.C. Information on the operation of the SEC's Public Reference Room may be obtained by calling (800) SEC-0330. The fund's portfolio holdings are also posted on deutschefunds.com from time to time. Please see the fund's current prospectus for more information. |
| Principal Underwriter | If you have questions, comments or complaints, contact: Deutsche AM Distributors, Inc. 222 South Riverside Plaza (800) 621-1148 |
| Investment Management | Deutsche Investment Management Americas Inc. ("DIMA" or the "Advisor"), which is part of Deutsche Asset Management, is the investment advisor for the fund. DIMA and its predecessors have more than 80 years of experience managing mutual funds and DIMA provides a full range of investment advisory services to both institutional and retail clients. DIMA is an indirect, wholly owned subsidiary of Deutsche Bank AG. Deutsche Bank AG is a major global banking institution engaged in a wide variety of financial services, including investment management, retail, private and commercial banking, investment banking and insurance. Deutsche Asset Management is the retail brand name in the U.S. for the asset management activities of Deutsche Bank AG and DIMA. Deutsche Asset Management is committed to delivering the investing expertise, insight and resources of this global investment platform to American investors. |
| Class A | Class C | Class S | |
| Nasdaq Symbol | SXPAX | SXPCX | SCPIX |
| CUSIP Number | 25159R 700 | 25159R 882 | 25159R 874 |
| Fund Number | 1001 | 1301 | 2301 |
Notes
Notes
Notes

| ITEM 2. | CODE OF ETHICS |
As of the end of the period covered by this report, the registrant has adopted a code of ethics, as defined in Item 2 of Form N-CSR that applies to its Principal Executive Officer and Principal Financial Officer.
There have been no amendments to, or waivers from, a provision of the code of ethics during the period covered by this report that would require disclosure under Item 2.
A copy of the code of ethics is filed as an exhibit to this Form N-CSR. | |
| ITEM 3. | AUDIT COMMITTEE FINANCIAL EXPERT |
| The fund’s audit committee is comprised solely of trustees who are "independent" (as such term has been defined by the Securities and Exchange Commission ("SEC") in regulations implementing Section 407 of the Sarbanes-Oxley Act (the "Regulations")). The fund’s Board of Trustees has determined that there are several "audit committee financial experts" (as such term has been defined by the Regulations) serving on the fund’s audit committee including Mr. Paul K. Freeman, the chair of the fund’s audit committee. An “audit committee financial expert” is not an “expert” for any purpose, including for purposes of Section 11 of the Securities Act of 1933 and the designation or identification of a person as an “audit committee financial expert” does not impose on such person any duties, obligations or liability that are greater than the duties, obligations and liability imposed on such person as a member of the audit committee and board of directors in the absence of such designation or identification. | |
| ITEM 4. | PRINCIPAL ACCOUNTANT FEES AND SERVICES |
deutsche equity 500 index portfolio
form n-csr disclosure re: AUDIT FEES
The following table shows the amount of fees that PricewaterhouseCoopers, LLP (“PWC”), the Fund’s independent registered public accounting firm, billed to the Fund during the Fund’s last two fiscal years. The Audit Committee approved in advance all audit services and non-audit services that PWC provided to the Fund.
Services that the Fund’s Independent Registered Public Accounting Firm Billed to the Fund
| Fiscal Year Ended December 31, | Audit Fees Billed to Fund | Audit-Related Fees Billed to Fund | Tax Fees Billed to Fund | All Other Fees Billed to Fund |
| 2016 | $70,824 | $0 | $0 | $0 |
| 2015 | $66,824 | $0 | $0 | $0 |
The “All Other Fees Billed to Fund” were billed for services associated with foreign tax filings.
Services that the Fund’s Independent Registered Public Accounting Firm Billed to the Adviser and Affiliated Fund Service Providers
The following table shows the amount of fees billed by PWC to Deutsche Investment Management Americas Inc. (“DIMA” or the “Adviser”), and any entity controlling, controlled by or under common control with DIMA (“Control Affiliate”) that provides ongoing services to the Fund (“Affiliated Fund Service Provider”), for engagements directly related to the Fund’s operations and financial reporting, during the Fund’s last two fiscal years.
| Fiscal Year Ended December 31, | Audit-Related Fees Billed to Adviser and Affiliated Fund Service Providers | Tax Fees Billed to Adviser and Affiliated Fund Service Providers | All Other Fees Billed to Adviser and Affiliated Fund Service Providers |
| 2016 | $0 | $52,339 | $0 |
| 2015 | $0 | $30,661 | $0 |
The “Tax Fees Billed to the Advisor” were billed for services associated with foreign tax filings.
Non-Audit Services
The following table shows the amount of fees that PWC billed during the Fund’s last two fiscal years for non-audit services. The Audit Committee pre-approved all non-audit services that PWC provided to the Adviser and any Affiliated Fund Service Provider that related directly to the Fund’s operations and financial reporting. The Audit Committee requested and received information from PWC about any non-audit services that PWC rendered during the Fund’s last fiscal year to the Adviser and any Affiliated Fund Service Provider. The Committee considered this information in evaluating PWC’s independence.
| Fiscal Year Ended December 31, | Total (A) | Total Non-Audit Fees billed to Adviser and Affiliated Fund Service Providers (engagements related directly to the operations and financial reporting of the Fund) (B) | Total Non-Audit Fees billed to Adviser and Affiliated Fund Service Providers (all other engagements) (C) | Total of (A), (B) and (C) |
| 2016 | $0 | $52,339 | $0 | $52,339 |
| 2015 | $0 | $30,661 | $0 | $30,661 |
Audit Committee Pre-Approval Policies and Procedures. Generally, each Fund’s Audit Committee must pre approve (i) all services to be performed for a Fund by a Fund’s Independent Registered Public Accounting Firm and (ii) all non-audit services to be performed by a Fund’s Independent Registered Public Accounting Firm for the DIMA Entities with respect to operations and financial reporting of the Fund, except that the Chairperson or Vice Chairperson of each Fund’s Audit Committee may grant the pre-approval for non-audit services described in items (i) and (ii) above for non-prohibited services for engagements of less than $100,000. All such delegated pre approvals shall be presented to each Fund’s Audit Committee no later than the next Audit Committee meeting.
There were no amounts that were approved by the Audit Committee pursuant to the de minimis exception under Rule 2-01 of Regulation S-X.
According to the registrant’s principal Independent Registered Public Accounting Firm, substantially all of the principal Independent Registered Public Accounting Firm's hours spent on auditing the registrant's financial statements were attributed to work performed by full-time permanent employees of the principal Independent Registered Public Accounting Firm.
***
In connection with the audit of the 2015 and 2016 financial statements, the Fund entered into an engagement letter with PwC. The terms of the engagement letter required by PwC, and agreed to by the Fund’s Audit Committee, include a provision mandating the use of mediation and arbitration to resolve any controversy or claim between the parties arising out of or relating to the engagement letter or the services provided there-under.
***
In a letter provided to the Audit Committee pursuant to PCAOB Rule 3526 and dated July 19, 2016, PwC informed the Audit Committee that PwC had identified circumstances where PwC maintains lending relationships with owners of greater than 10% of the shares of certain investment companies within the “investment company complex” as defined under Rule 2-01(f)(14) of Regulation S-X. PwC informed the Audit Committee that these lending relationships are inconsistent with the SEC Staff’s interpretation of Rule 2-01(c)(l)(ii)(A) of Regulation S-X (referred to as the “Loan Rule”).
The Loan Rule specifically provides that an accounting firm would not be independent if it receives a loan from a lender that is a record or beneficial owner of more than ten percent of an audit client’s equity securities. For purposes of the Loan Rule, audit clients include the Fund as well as all registered investment companies advised by Deutsche Investment Management Americas Inc. (the “Adviser”), the Fund’s investment adviser, and its affiliates, including other subsidiaries of the Adviser’s parent company, Deutsche Bank AG (collectively, the “Deutsche Funds Complex”). PwC’s lending relationships effect PwC’s independence under the SEC Staff’s interpretation of the Loan Rule with respect to all investment companies in the Deutsche Funds Complex.
In its July 19, 2016 letter, PwC affirmed to the Audit Committee that, as of the date of the letter, PwC is an independent accountant with respect to the Fund, within the meaning of PCAOB Rule 3520. In its letter, PwC also informed the Audit Committee that, after evaluating the facts and circumstances and the applicable independence rules, PwC has concluded that with regard to its compliance with the independence criteria set forth in the rules and regulations of the SEC related to the Loan Rule, it believes that it remains objective and impartial despite matters that may ultimately be determined to be inconsistent with these criteria and therefore it can continue to serve as the Fund’s registered public accounting firm. PwC informed the Audit Committee that its conclusion was based on a number of factors, including, among others, PwC’s belief that the lenders are not able to impact the impartiality of PwC or assert any influence over the investment companies in the Deutsche Funds Complex whose shares the lenders own or the applicable investment company’s investment adviser; and the lenders receive no direct benefit from their ownership of the investment companies in the Deutsche Funds Complex in separate accounts maintained on behalf of their insurance contract holders. In addition, the individuals at PwC who arranged PwC’s lending relationships have no oversight of, or ability to influence, the individuals at PwC who conducted the audits of the Fund’s financial statements.
On June 20, 2016, the SEC Staff issued a “no-action” letter to another mutual fund complex (see Fidelity Management & Research Company et al., No-Action Letter) related to similar Loan Rule issues as those described above. In that letter, the SEC Staff confirmed that it would not recommend enforcement action against an investment company that relied on the audit services performed by an audit firm that was not in compliance with the Loan Rule in certain specified circumstances. The circumstances described in the no-action letter appear to be substantially similar to the circumstances that effected PwC’s independence under the Loan Rule with respect to the Fund. PwC confirmed to the Audit Committee that it meets the conditions of the no-action letter. In the no-action letter, the SEC Staff stated that the relief under the letter is temporary and will expire 18 months after the issuance of the letter.
| ITEM 5. | AUDIT COMMITTEE OF LISTED REGISTRANTS | |
| Not applicable | ||
| ITEM 6. | SCHEDULE OF INVESTMENTS | |
| Not applicable | ||
| ITEM 7. | DISCLOSURE OF PROXY VOTING POLICIES AND PROCEDURES FOR CLOSED-END MANAGEMENT INVESTMENT COMPANIES | |
| Not applicable | ||
| ITEM 8. | PORTFOLIO MANAGERS OF CLOSED-END MANAGEMENT INVESTMENT COMPANIES | |
| Not applicable | ||
| ITEM 9. | PURCHASES OF EQUITY SECURITIES BY CLOSED-END MANAGEMENT INVESTMENT COMPANY AND AFFILIATED PURCHASERS | |
| Not applicable | ||
| ITEM 10. | SUBMISSION OF MATTERS TO A VOTE OF SECURITY HOLDERS | |
| There were no material changes to the procedures by which shareholders may recommend nominees to the Fund’s Board. The primary function of the Nominating and Governance Committee is to identify and recommend individuals for membership on the Board and oversee the administration of the Board Governance Guidelines. Shareholders may recommend candidates for Board positions by forwarding their correspondence by U.S. mail or courier service to Keith R. Fox, Deutsche Funds Board Chair, c/o Thomas R. Hiller, Ropes & Gray LLP, Prudential Tower, 800 Boylston Street, Boston, MA 02199-3600. | ||
| ITEM 11. | CONTROLS AND PROCEDURES | |
| (a) | The Chief Executive and Financial Officers concluded that the Registrant’s Disclosure Controls and Procedures are effective based on the evaluation of the Disclosure Controls and Procedures as of a date within 90 days of the filing date of this report. | |
| (b) | There have been no changes in the registrant’s internal control over financial reporting that occurred during the second fiscal quarter of the period covered by this report that has materially affected, or is reasonably likely to materially affect, the registrant’s internal controls over financial reporting. | |
| ITEM 12. | EXHIBITS | |
| (a)(1) | Code of Ethics pursuant to Item 2 of Form N-CSR is filed and attached hereto as EX-99.CODE ETH. | |
| (a)(2) | Certification pursuant to Rule 30a-2(a) under the Investment Company Act of 1940 (17 CFR 270.30a-2(a)) is filed and attached hereto as Exhibit 99.CERT. | |
| (b) | Certification pursuant to Rule 30a-2(b) under the Investment Company Act of 1940 (17 CFR 270.30a-2(b)) is furnished and attached hereto as Exhibit 99.906CERT. | |
SIGNATURES
Pursuant to the requirements of the Securities Exchange Act of 1934 and the Investment Company Act of 1940, the registrant has duly caused this report to be signed on its behalf by the undersigned, thereunto duly authorized.
| Registrant: | Deutsche Equity 500 Index Portfolio |
| By: | /s/Brian E. Binder Brian E. Binder President |
| Date: | 3/1/2017 |
Pursuant to the requirements of the Securities Exchange Act of 1934 and the Investment Company Act of 1940, this report has been signed below by the following persons on behalf of the registrant and in the capacities and on the dates indicated.
| By: | /s/Brian E. Binder Brian E. Binder President |
| Date: | 3/1/2017 |
| By: | /s/Paul Schubert Paul Schubert Chief Financial Officer and Treasurer |
| Date: | 3/1/2017 |