UNITED STATES
SECURITIES AND EXCHANGE COMMISSION
WASHINGTON, D.C. 20549
FORM 6-K
Report of Foreign Issuer
Pursuant to Rule 13a-16 or 15d-16 of the
Securities Exchange Act of 1934
COMPANIA CERVECERIAS UNIDAS S.A.
(Exact name of Registrant as specified in its charter)
UNITED BREWERIES COMPANY, INC.
(Translation of Registrant’s name into English)
Republic of Chile
(Jurisdiction of incorporation or organization)
Vitacura 2670, 23rdfloor, Santiago, Chile
(Address of principal executive offices)
_________________________________________
Securities registered or to be registered pursuant to section 12(b) of the Act.
Indicate by check mark whether the registrant files or will file annual reports under cover of Form 20-F or Form 40-F.
Form 20-FXForm 40-F ___
Indicate by check mark whether the registrant by furnishing the information contained in this Form is also thereby furnishing the information to the Commission pursuant to Rule 12g3-2(b) under the Securities Exchange Act of 1934.
Yes ___ NoX

CCU REPORTS CONSOLIDATED FOURTH QUARTER 2011 RESULTS (1)
FOURTH QUARTER Net sales up 26.0%, EBIT(2) up41.6%, EBITDA(3) up33.2% Net profit(4) up 22.1% to CLP 141.3 per share YTD Net sales up15.7%, EBIT up17.7%, EBITDA up15.1% Net profit up 10.9% to CLP 385.4 per share |
FOURTH QUARTER BEFORE EXCEPTIONAL ITEMS (EI)(5) EBIT up41.5%, EBITDA up33.1% Net profit up 33.6% to CLP 154.6 per share YTD BEFORE EXCEPTIONAL ITEMS EBIT up 14.6%, EBITDAup12.6% Net profit up 10.3% to CLP 373.5 per share |
(Santiago, Chile, February 1, 2012)-- CCU announced today its consolidated financial results for the fourth quarter ended December 31, 2011(6).
CCU closed 2011 with an outstanding fourth quarter after a difficult first semester when increasing raw material costs, in addition to higher cost of fuel and energy, stressed the results.At the beginning of the year the Company took various actions in order to mitigate the adverse scenario’s effects, which included among others, earlier sales price adjustments, a renewed effort to control costs and expenses, acceleration of introducing new products and of theintegration of new businesses like cider in Argentina and Pernod Ricard products in Chile. All these actions begun to cause effects during the third quarter and allowed us to deliver the fourth quarter results we hereby present.
(1)Statements made in this press release that relate to CCU’s future performance or financial results are forward-looking statements, which involve known and unknown risks and uncertainties that could cause actual performance or results to materially differ. We undertake no obligation to update any of these statements. Persons reading this press release are cautioned not to place undue reliance on these forward-looking statements. These statements should be taken in conjunction with the additional information about risk and uncertainties set forth in CCU’s annual report on Form 20-F filed with the US Securities and Exchange Commission and in the annual report submitted to the SVS and available in our web page.
(2)EBIT stands for Earnings Before Interest and Taxes, and corresponds to profit before Taxes, Interests, Results of indexed units, Share of profits of associates and joint ventures and profits/(losses) on exchange rate differences.
(3)EBITDA represents EBIT plus depreciation and amortization. EBITDA is not a calculation based on IFRS principles. For more detail, please see full note before Exhibits.
(4)Net profit attributable to parent company shareholders as per IFRS.
(5)Exceptional items (EI), formerly Non recurring items (NRI).
(6)All the comments below refers to Q4’11 figures compared to Q4’10, under IFRS.Figures have been rounded in graphics, charts and exhibits and may not sum exactly the total.

We are pleased to communicate that the consolidated volume grew 10.0% in Q4’11, above the 4.5% consolidated volume growth in Q4’10. Organic growth(7) accounted for 6.9 percentage points out of the total growth of 10.0%. All segments contributed to this result: Spirits in Chile increased 19.4%, including 15.9 percentage points of non-organic growth (which represent 0.2 percentage points of the consolidated growth), Wines 10.9%, Beer Chile 8.4%, Non-alcoholic beverages 8.2% and Beer Argentina 2.8%. Also the non-organic growth corresponding to the cider and spirits in Argentina, contributed in 2.9 percentage points to the consolidated growth.
The described volume performance was coupled with an average price increase of 15.0% due mostly to price increases during the year in order to restore margins, but also due to changes towards a higher-end mix. The combined effect of higher volume and higher average price resulted in a 26.0% increase of Net sales and a 26.4% Gross profit increase, with a gross margin slightly above the one in Q4’10.
With regards to the 21.7% MSD&A(8) increase, more than three quarters is due to higher expenses in Argentina related to inflationary pressures, to exchange rates conversion and to the expenses of the cider business acquired at the end of December 2010. The MSD&A expenses in Chile increased 2.5% above inflation which is explained mostly by higher cost of distribution and expenses related to the overall better performance of the Company. As a percentage of Net sales, MSD&A decreases 121 bps on a consolidated basis; moreover, isolating the Argentine businesses, MSD&A decreases 252 bps.
The EBITDA increased 33.2%, and the EBITDA margin was 26.7%, which is 150 bps higher than the EBITDA margin in Q4’10.
The timely actions taken to restore the proper margins, together with a responsive market, and, consequently, the Q4’11 good results, give us the satisfaction of having accomplished a target that just after the first semester seemed difficult to reach.
_________________________
(7)Organic growth excludes sales from new endeavors of the last twelve months (cider and liquors in Argentina and Pernod Ricard in Chile).
(8)Marketing/Selling, Distribution and Administrative expenses (MSD&A).
CONSOLIDATED INCOME STATEMENT HIGHLIGHTS(Exhibits 1 & 2) |
NET SALES
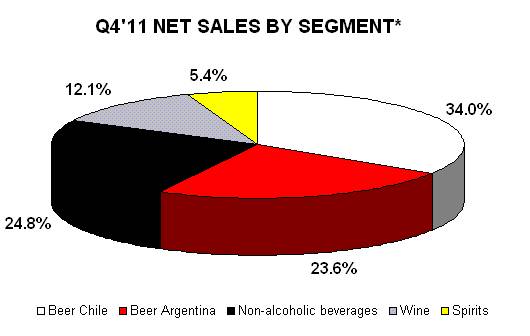
Q4’11 Total Net sales increased26.0% to CLP 315,857 million as a result of a 15.0% higher average price and 10.0% higher consolidated volumes. This volume growth is split into 6.9 percentage points of organic growth and 3.1 percentage points of non-organic growth, mostly cider and spirits in Argentina and spirits in Chile. Another positive contribution to the volume growth was the higher average temperature in the Center-South region in Chile compared with the previous year’s weather. Volumes increased in all segments: Spirits 19.4%, Wine 10.9%, Beer Chile 8.4%, Non-alcoholic beverages 8.2% and Beer Argentina 2.8%. Additionally, Argentina had non-organic sales of 148.9 MHls corresponding to the cider and spirits operation acquired in December 2010. The higher average price is mainly explained by a 37.1% increase in the average price of Beer in Argentina, affected also by F/X conversion and change in mix, an increase of 24.3% in Spirits due mostly to change in mix as we begun to distribute the Pernod Ricard products, 6.1% in Wine, 4.8% in Non-alcoholic beverages and 4.4% in Beer Chile.
2011 Accumulated Net sales increased 15.7% amounting to CLP969,551million, as a result of 6.4% higher consolidated volumes and 9.0% higher average prices.
* Percentage calculations exclude “Other/Eliminations”
Net sales by segment
| | | | | | |
| | Q4 (million CLP) |
| | 2011 | 2010 | % Chg. |
| Beer Chile | 102,912 | 32.6% | 91,060 | 36.3% | 13.0% |
| Beer Argentina | 71,546 | 22.7% | 50,687 | 20.2% | 41.2% |
| Non-alcoholic beverages | 75,158 | 23.8% | 66,424 | 26.5% | 13.1% |
| Wine | 36,479 | 11.5% | 31,634 | 12.6% | 15.3% |
| Spirits | 16,436 | 5.2% | 11,490 | 4.6% | 43.0% |
| Other/Eliminations | 13,326 | 4.2% | -571 | -0.2% | - |
| TOTAL | 315,857 | 100.0% | 250,725 | 100.0% | 26.0% |
| |
| | YTD (million CLP) |
| | 2011 | 2010 | % Chg. |
| Beer Chile | 313,017 | 32.3% | 287,981 | 34.4% | 8.7% |
| Beer Argentina | 198,181 | 20.4% | 156,363 | 18.7% | 26.7% |
| Non-alcoholic beverages | 248,509 | 25.6% | 223,476 | 26.7% | 11.2% |
| Wine | 138,348 | 14.3% | 132,293 | 15.8% | 4.6% |
| Spirits | 50,936 | 5.3% | 43,218 | 5.2% | 17.9% |
| Other/Eliminations | 20,560 | 2.1% | -5,072 | -0.6% | - |
| TOTAL | 969,551 | 100.0% | 838,258 | 100.0% | 15.7% |
GROSS PROFIT
Q4’11 Increased26.4% to CLP176,556 million as a result of26.0% higher Net sales, partially offset by25.4% higherCost of goods sold (COGS) which amounted to CLP139,301 million. As a percentage of Net sales, COGS decreased from44.3% in Q4’10 to44.1% in Q4’11. Consequently, the Gross profit as a percentage of Net sales increased from55.7% in Q4’10 to55.9% this quarter.
2011 Increased14.2% to CLP518,987million and, as a percentage of Net sales, the consolidated Gross profit decreased from54.2% to53.5% when compared to 2010.
EBIT ��
Q4’11 Increased41.6% to CLP71,994 million as a result of higher Gross profit, partially compensated by higherMarketing/Selling, Distribution and Administrative expenses (MSD&A).MSD&A expenses increased21.7% in Q4’11, to CLP109,602 million. MSD&A expenses, as a percentage of Net sales, decreased from35.9% in Q4’10 to34.7% in Q4’11. The increase in MSD&A is mostly explained by the cider operation acquired in late 2010, the inflationary pressures in Argentina and higher distribution costs. EBIT margin increased from20.3% in Q4’10 to22.8% in Q4’11. EBIT before Exceptional items increased41.5% to CLP 71,938 million and EBIT margin before Exceptional items increased from20.3% in Q4’10 to22.8% in Q4’11.
2011 Increased17.7% amounting to CLP190,760 million due to a higher positive Exceptional items effect this year and to a better 2011 outcome. The CLP 12,905 million positive Exceptional items, mostly due to the insurance settlement during 2011, almost doubled the CLP6,791 million for the sale of a site in Lima during 2010. The consolidated EBIT margin was19.7%, increasing 0.4 percentage pointswhen compared to 2010. The accumulated EBIT before Exceptional items increased14.6% and its margin decreased from18.5% in 2010 to18.3% in 2011.

* Percentage calculations exclude “Other/Eliminations”
EBIT and EBIT margin by segment
| | | | | | |
| | Q4 |
| | EBIT (million CLP) | EBIT margin |
| | 2011 | 2010 | % Chg | 2011 | 2010 |
| Beer Chile | 35,776 | 30,488 | 17.3% | 34.8% | 33.5% |
| Beer Argentina | 10,945 | 8,905 | 22.9% | 15.3% | 17.6% |
| Non-alcoholic beverages | 11,610 | 9,353 | 24.1% | 15.4% | 14.1% |
| Wine | 4,666 | 917 | 408.7% | 12.8% | 2.9% |
| Spirits | 1,721 | 1,573 | 9.4% | 10.5% | 13.7% |
| Other/Eliminations | 7,277 | -395 | NM | - | - |
| TOTAL | 71,994 | 50,842 | 41.6% | 22.8% | 20.3% |
| |
| | YTD |
| | EBIT (million CLP) | EBIT margin |
| | 2011 | 2010 | %Chg | 2011 | 2010 |
| Beer Chile | 99,412 | 85,295 | 16.6% | 31.8% | 29.6% |
| Beer Argentina | 25,129 | 22,028 | 14.1% | 12.7% | 14.1% |
| Non-alcoholic beverages | 36,318 | 32,364 | 12.2% | 14.6% | 14.5% |
| Wine | 16,890 | 10,256 | 64.7% | 12.2% | 7.8% |
| Spirits | 6,690 | 6,409 | 4.4% | 13.1% | 14.8% |
| Other/Eliminations | 6,321 | 5,698 | 10.9% | - | - |
| TOTAL | 190,760 | 162,049 | 17.7% | 19.7% | 19.3% |
EBITDA
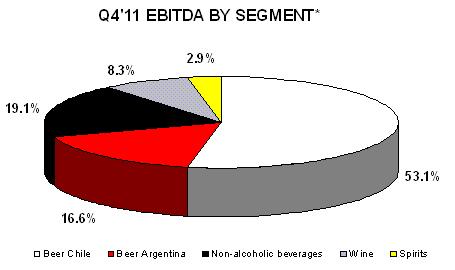
Q4’11 Increased33.2%, to CLP84,317million explained by higher Gross profit, partially compensated by higher MSD&A. The consolidated EBITDA margin increased from25.2% in Q4’10 to26.7% in Q4’11. EBITDA before Exceptional items increased33.1% to CLP84,261 million and EBITDA margin increased from 25.2% to 26.7%.
2011 Increased15.1% to CLP238,542million and the EBITDA margin decreased from24.7% in 2010 to24.6% in 2011. The accumulated EBITDA before Exceptional items increased12.6% to CLP225,637 million and the margin decreased from23.9% in 2010 to23.3% in 2011.
* Percentage calculations exclude “Other/Eliminations”
EBITDA and EBITDA margin by segment
| | | | | | |
| | Q4 |
| | EBITDA (million CLP) | EBITDA margin |
| | 2011 | 2010 | % Chg | 2011 | 2010 |
| Beer Chile | 39,834 | 35,565 | 12.0% | 38.7% | 39.1% |
| Beer Argentina | 12,431 | 10,179 | 22.1% | 17.4% | 20.1% |
| Non-alcoholic beverages | 14,362 | 11,967 | 20.0% | 19.1% | 18.0% |
| Wine | 6,241 | 2,533 | 146.4% | 17.1% | 8.0% |
| Spirits | 2,202 | 1,983 | 11.0% | 13.4% | 17.3% |
| Other/Eliminations | 9,247 | 1,076 | 759.7% | - | - |
| TOTAL | 84,317 | 63,303 | 33.2% | 26.7% | 25.2% |
| |
| | YTD |
| | EBITDA (million CLP) | EBITDA margin |
| | 2011 | 2010 | % Chg | 2011 | 2010 |
| Beer Chile | 115,577 | 101,041 | 14.4% | 36.9% | 35.1% |
| Beer Argentina | 30,480 | 26,879 | 13.4% | 15.4% | 17.2% |
| Non-alcoholic beverages | 46,746 | 41,982 | 11.3% | 18.8% | 18.8% |
| Wine | 23,308 | 16,727 | 39.3% | 16.8% | 12.6% |
| Spirits | 8,567 | 8,081 | 6.0% | 16.8% | 18.7% |
| Other/Eliminations | 13,865 | 12,540 | 10.6% | - | - |
| TOTAL | 238,542 | 207,250 | 15.1% | 24.6% | 24.7% |
ALL OTHER
Q4’11 In All other we include the following: Other gains/(losses) and Exchange rate differences, Result of indexed units, and Share of profits of associates and joint ventures. The total variation of these accounts, when compared to the same quarter last year, is a lower result of CLP1,013 million mainly explained by:
· Results of indexed units, which decreased CLP1,221 million, mainly due to 1.28% increase of the UF value in Q4’11 compared with 0.54% UF variation in Q4’10, applied to a lower UF liability since VSPT refinanced 50% of the long term bonds with USD and Euro denominated debt. (The UF is a monetary unit indexed to the CPI variation).
· Share of profits of associates and joint ventures, which decreased CLP138 million, mainly explained by lower results in FOODs Compañía de Alimentos CCU S.A., Cervecería Austral S.A. and Viña Valles de Chile S.A.(9).
These results were partially offset by:
· Other gains/(losses) and Exchange rate differences, which increased CLP300 million mostly due to gains related to hedges covering foreign exchange variations on taxes.
2011 The negative result decreased CLP3,389 million from a loss of CLP 14,457million to a loss of CLP11,068million, due mostly to higher profits in Other gains/(losses) and lower Net financing expenses.
INCOME TAX
Q4’11 Income tax increased CLP9,438 million mostly due to (a) higher profits coupled with a higher corporate income tax rate in Chile(10), (b) the effect of foreign exchange fluctuations on taxes compensated by a reverse sign entry in Other gains/(losses), (c) the settlement of a case with the Chilean IRS(11), and (d) higher profits in Argentina levied with a higher corporate income tax.
2011 Increased CLP17,234 million mainly due to the above explanations, a one-time loss in Aguas CCU-Nestlé taxes, and other prior year’s settlements.
_____________________
(9)The share of profits of Viñas Valles de Chile S.A. considers only the first two months of the fourth quarter. As of December 2011, Viñas Valles de Chile S.A. consolidates under the segment “Wines” after the split of its two main components: Tabalí and Leyda; the latter remained in VSPT.
(10)The corporate income tax rate in Chile was increased from 17% in 2010 to 20% in 2011 with the purpose of financing the reconstructions works after the 2010 earthquake.
(11)CLP 4,273 million considered as an Exceptional item.
MINORITY INTEREST
Q4’11 Increased CLP2,556 million to CLP4,630 million mostly due to the higher results in Viña San Pedro Tarapacá, Aguas CCU-Nestlé and to the new cider business in Argentina.
2011 Increased CLP2,813 million to CLP12,051 million mainly due to the higher results in Aguas CCU-Nestlé and in Viña San Pedro Tarapacá, the latter explained mainly by the effect of the insurance claim settlement.
NET PROFIT
Q4’11 Increased CLP8,146 million to CLP44,990 million due mostly to a higher EBIT partially compensated by lower Results of indexed units, a higher Minority interest, and higher Income tax. Net profit before Exceptional items increased 33.6% to CLP 49,227 million.
2011 Increased CLP12,052 million to CLP122,752 million due mostly to higher EBIT, better Other gains and lower Net financing expenses, partially compensated by lower Results of indexed units, higher Income tax and higher Minority interest. Net profit before Exceptional items increased 10.3% to CLP 118,972 million.
During 2011 CCU recorded the following Exceptional items at EBIT level: (a) the settlement of the insurance claims related to the February 27, 2010 earthquake in Chile generated a positive Exceptional item of CLP 13,289 million in 2011 to make up for the operational losses caused by the natural disaster, and (b) CLP 384 million severance paid related to the cider business in Argentina, for a net total of CLP 12,905 million. In 2010, we recorded an Exceptional item derived from the sale of a site in Lima which generated one-time profit before taxes of CLP 6,791 million.
The following schedules show the EBIT/EBITDA and EBIT/EBITDA margins YTD, both before Exceptional items:
| | | | | | |
| YTD AS OF DECEMBER | EBIT before EI (million CLP) | EBIT margin before EI |
| 2011 | 2010 | % Chg | 2011 | 2010 |
| Beer Chile | 94,083 | 85,295 | 10.3% | 30.1% | 29.6% |
| Beer Argentina | 25,129 | 22,028 | 14.1% | 12.7% | 14.1% |
| Non-alcoholic beverages | 35,083 | 32,364 | 8.4% | 14.1% | 14.5% |
| Wine | 10,422 | 10,256 | 1.6% | 7.5% | 7.8% |
| Spirits | 6,383 | 6,409 | -0.4% | 12.5% | 14.8% |
| Other/Eliminations | 6,755 | -1,093 | NM | - | - |
| TOTAL | 177,855 | 155,258 | 14.6% | 18.3% | 18.5% |
| |
| |
| YTD AS OF DECEMBER | EBITDA before EI (million CLP) | EBITDA margin before EI |
| 2011 | 2010 | % Chg | 2011 | 2010 |
| Beer Chile | 110,248 | 101,041 | 9.1% | 35.2% | 35.1% |
| Beer Argentina | 30,480 | 26,879 | 13.4% | 15.4% | 17.2% |
| Non-alcoholic beverages | 45,510 | 41,982 | 8.4% | 18.3% | 18.8% |
| Wine | 16,841 | 16,727 | 0.7% | 12.2% | 12.6% |
| Spirits | 8,260 | 8,081 | 2.2% | 16.2% | 18.7% |
| Other/Eliminations | 14,298 | 5,749 | 148.7% | - | - |
| TOTAL | 225,637 | 200,459 | 12.6% | 23.3% | 23.9% |
In addition, at Net profit level, we have considered CLP 4,273 million as an Exceptional item, due to a final tax settlement in December 31, 2011.
BUSINESS UNITS HIGHLIGHTS(Exhibits 3 & 4) |
Business segments are reflected in the same way that each Strategic Business Unit (SBU) is managed. Corporate shared services and distribution and logistics expenses have been allocated to each SBU based on Service Level Agreements. The non-allocated corporate overhead expenses, the result of the logistics subsidiary and the cider business in Argentina are included in “Other/Eliminations”.
Net sales increased13.0% to CLP 102,912 million as a result of8.4% higher sales volumes and 4.4% higher average prices.
EBIT increased17.3% to CLP 35,776 million, mainly as a result of higher Gross profit, partially compensated by higher MSD&A expenses. The Gross profit increase is explained by higher Net sales, partially compensated by higher COGS which increased 10.7% to CLP 38,282 million. The higher cost of raw material and energy explained mostly the higher COGS. As a percentage of Net sales, COGS decreased from 38.0% in Q4’10 to 37.2% in Q4’11. MSD&A expenses increased13.4% to CLP29,545 million mostly due to higher distribution and marketing expenses. As a percentage of Net sales, MSD&A increased from 28.6% to 28.7% in Q4’11. The EBIT margin increased from 33.5% to 34.8% in Q4’11.
EBITDA increased12.0% to CLP 39,834 million and the EBITDA margin was 38.7% or0.4 percentage points lower than in Q4’10.
Comments Pursuant an effective commercial strategy and higher average temperature during the quarter, the volumes increased significantly in Q4’11. All categories experienced growth in the upper single digits or above, highlighting the premium category which continues growing at a double digit rate. The higher average price is mainly due to the 7% price increase with inception on June 1, 2011.
Notwithstanding the positive mentioned growth figures in 2011, due to the market dynamics with aggressive competitive price pressures and growing imports, we lost some market share reaching an estimate of 80.2% for the full year.
Net sales measured in Chilean pesos, increased 41.2% to CLP 71,546 million, as a result of 2.8% higher sales volumes and 37.1% higher average prices, affected by F/X conversion, changes in mix, reposition of the Budweiser brand and price increases in order to partially compensate the higher costs and expenses.
EBIT measured in Chilean pesos, increased 22.9% to CLP 10,945 million in Q4’11, as a consequence of higher Gross profit, partially compensated by higher MSD&A. Gross profit increased due to higher Net sales, enough to compensate the higher
COGS, which increased30.2% to CLP26,165 million this quarter. The COGS increase is explained mainly by higher cost of raw material, higher personnel costs, and energy costs. As a percentage of Net sales, COGS decreased from39.6% to36.6% in Q4’11. As a consequence, the gross margin increased from 60.4% to 63.4%. MSD&A expenses increased56.8%, from CLP21,914 million to CLP34,351 million, due to inflationary pressures, unionization of sales personnel, higher marketing, distribution and sales taxes expenses. As a percentage of Net sales, MSD&A expenses increased from43.2% to48.0%. The EBIT margin decreased from17.6% in Q4’10 to15.3% in Q4’11 due to cost and expense pressures not fully compensated by higher prices.
EBITDA increased22.1% to CLP12,431 million this quarter and the EBITDA margin decreased from20.1% to17.4%.
Comments Sales prices were adjusted in mid-November 2011 in order to partially compensate for the inflationary cost pressures. Total volume grew 2.8%, where premium brands’ volumes increased at a double digit rate. The results in US dollars are as follows: EBIT increased 33,9% and EBITDA increased 31.5%, while the EBITDA margin decreased from 21.0% to 20.6% in Q4’11. These results exclude cider and spirits in Argentina which are presented in the column “Other/eliminations” and contributed with an EBIT of CLP 4,266 million and an EBITDA of CLP 4,404 million in Q4’11.
Net sales increased13.1% to CLP75,158 million due to higher volumes of 8.2% and 4.8% increase in the average price.
EBIT increased24.1% to CLP11,610million, due to higher Net sales offsetting the higher COGS and higher MSD&A expenses. COGS increased14.9% to CLP37,507 million mainly due to cost increases in raw material such as sugar and resin, as well as in energy and personnel costs. COGS, as a percentage of Net sales, increased from49.1% to49.9%. As a consequence, gross margin decreased from50.9% to50.1%. MSD&A increased6.0% to CLP26,051million mainly due to higher distribution expenses, while as a percentage of Net sales, MSD&A decreased from37.0% to34.7%. The EBIT margin increased from14.1% to15.4%.
EBITDA increased20.0% to CLP14,362 million and the EBITDA margin increased to19.1%,1.1 percentage points higher than in Q4’10.
CommentsVolumes had a good performance during the quarter following the industry growth. Water increased 17.3%, Nectars 12.0%, and Soft drinks 4.5%. The segment’s average price increased 4.8% during the quarter. The 8.2% consolidated volume increase, coupled with higher average prices allowed to dilute expenses and fixed costs, thus improving EBIT and EBITDA margins.
Net sales increased15.3% to CLP36,479 million due to an increase in volume of10.9% and a higher average price of 6.1% in CLP, excluding bulk wine. Chile exports volume increased 14.8% whereas the volumes in Argentina decreased 8.6%. Export prices in USD increased 1.4% in Chile and 7.5% in Argentina. The Chile domestic volume increased 9.6% and domestic average prices increased 2.3% as a result of a 2% price increase in November.
EBIT increased from CLP917 million to CLP4,666 million in Q4’11, due to higher Gross profit as a result of higher Net sales offsetting the increase in COGS and thesale of dispensable assets. COGS increased7.4% from CLP20,978 million to CLP22,527 million, however the cost per unit decreased 3.2%. As a percentage of Net sales, COGS decreased from66.3% to61.8%. Consequently, the gross margin increased from33.7% to38.2% in Q4’11. MSD&A increased10.6% to CLP10,882 million due mostly to expenses related to the better results. As a percentage of Net sales, MSD&A decreased from31.1% to29.8%. As a consequence, the EBIT margin increased from2.9% in Q4’10 to 12.8% in Q4’11.
EBITDA increased to CLP 6,241 million and the EBITDA margin increased from8.0% to 17.1%.
Comments VSPT has been focusing on discipline pricing, especially in the export markets, and brand building. This is in line with VSPT’s commercial strategy to improve long term profitability. The average price increased 6.1%, driven by Chile exports which increased in 8.2%. In addition, in November VSPT was selected by the American specialized magazine Wine Enthusiast as the New World Winery of the Year.
Net sales increased43.0% to CLP16,436millionas a resultof 24.3% higher average price and 19.4% higher volume, both positively affected by the distribution of Pernod Ricard products which started in July 2011.
EBIT increased9.4% from CLP1,573 million to CLP1,721 million, mainly due to higher Net sales, partially compensated by higher COGS and MSD&A. COGS increased73.2% from CLP6,093 million to CLP10,554 million, mostly due to the distribution of the Pernod Ricard products in the market which have both, a higher price and a higher cost per unit. As a percentage of Net sales, COGS increased from53.0% to64.2%. MSD&A expenses increased5.9% to CLP4,278 million, mostly due to higher distribution expenses in connection to the new product line and to the higher fuel cost. As a percentage of Net sales, MSD&A decreased from35.2% to26.0%. The EBIT margin decreased from13.7% to10.5%.
EBITDA increased11.0% from CLP1,983 million to CLP2,202 million, while the EBITDA margin decreased from17.3% to13.4%.
CommentsCPCh begun to distribute the Pernod Ricard products through the traditional channel starting July 1st, 2011. The increase in costs, MSD&A and revenue are explained principally by this new product line, as well as the drop in EBITDA margin since the distribution margin is lower than the margins of the traditional spirits produced by CPCh. Conversely, the ROCE is higher since it requires lower capital employed. In Q4’11 the Company subscribed a license contract to distribute the Bauzá premium pisco brand, which complements the company’s portfolio of premium brands. In addition, it acquired 49% of the licensor, Compañía Pisquera Bauzá.
Note: EBITDA represents EBIT plus depreciation and amortization. EBITDA is not a calculation based on generally accepted accounting principles. The amounts in the EBITDA calculation, however, are derived from amounts included in the historical statements of income data. EBITDA is presented as supplemental information because management believes that EBITDA is useful in assessing the Company’s operations. EBITDA is useful in evaluating the operating performance compared to that of other companies, as the calculation of EBITDA eliminates the effects of financing, income taxes and the accounting of capital spending, which items may vary for reasons unrelated to overall operating performance. When analyzing the operating performance, however, investors should use EBITDA in addition to, not as an alternative for, EBIT and net income. Investors should also note that CCU’s presentation of EBITDA may not be comparable to similarly titled measures used by other companies.
| | | | | | |
| Exhibit 1: Income Statement (Fourth Quarter 2011) | | | | |
| Q4 | 2011 | 2010 | 2011(1) | 2010(1) | VARIANCE % |
| (CLP million) | (CLP million) | (US$ million) | (US$ million) | |
| Core revenue | 310,052 | 245,230 | 597.2 | 472.3 | 26.4 |
| Other revenue | 5,805 | 5,495 | 11.2 | 10.6 | 5.6 |
| Interco sales revenue | 0 | 0 | 0.0 | 0.0 | - |
| Net sales | 315,857 | 250,725 | 608.4 | 482.9 | 26.0 |
| Cost of goods sold | (139,301) | (111,076) | (268.3) | (213.9) | 25.4 |
| % of net sales | 44.1 | 44.3 | 44.1 | 44.3 | |
| Gross profit | 176,556 | 139,649 | 340.1 | 269.0 | 26.4 |
| MSD&A(2) | (109,602) | (90,041) | (211.1) | (173.4) | 21.7 |
| % of net sales | 34.7 | 35.9 | 34.7 | 35.9 | |
| Other operating income/(expenses) | 4,984 | 1,234 | 9.6 | 2.4 | 303.8 |
| EBIT before Exceptional Items(3) | 71,938 | 50,842 | 138.6 | 97.9 | 41.5 |
| % of net sales | 22.8 | 20.3 | 22.8 | 20.3 | |
| Exceptional items | 56 | 0 | 0.1 | 0.0 | - |
| EBIT | 71,994 | 50,842 | 138.7 | 97.9 | 41.6 |
| % of net sales | 22.8 | 20.3 | 22.8 | 20.3 | |
| Net financing expenses | (2,096) | (2,142) | (4.0) | (4.1) | (2.1) |
| Share of profits of associates and joint ventures | 201 | 339 | 0.4 | 0.7 | (40.8) |
| Exchange rate differences | (429) | (262) | (0.8) | (0.5) | 64.0 |
| Results of indexed units | (2,285) | (1,064) | (4.4) | (2.0) | 114.7 |
| Other gains/(losses) | (333) | (801) | (0.6) | (1.5) | n/a |
| ALL OTHER | (4,943) | (3,930) | (9.5) | (7.6) | 25.8 |
| INCOME/(LOSS) BEFORE TAXES | 67,051 | 46,912 | 129.1 | 90.4 | 42.9 |
| Income tax(4) | (17,431) | (7,992) | (33.6) | (15.4) | 118.1 |
| NET PROFIT FOR THE PERIOD | 49,621 | 38,919 | 95.6 | 75.0 | 27.5 |
| |
| |
NET PROFIT before EI ATTRIBUTABLE TO:
PARENT COMPANY SHAREHOLDERS | | | | | |
| 49,227 | 36,845 | 94.8 | 71.0 | 33.6 |
| |
NET PROFIT ATTRIBUTABLE TO:
PARENT COMPANY SHAREHOLDERS | | | | | |
| 44,990 | 36,845 | 86.7 | 71.0 | 22.1 |
| MINORITY INTEREST | 4,630 | 2,075 | 8.9 | 4.0 | 123.2 |
| |
| Net profit attributable to Parent Company Shareholdersas % of net sales | 14.2 | 14.7 | 14.2 | 14.7 | |
| |
Earnings per share
Earnings per ADR | 141.3 | 115.7 | 0.3 | 0.2 | 22.1 |
| 706.3 | 578.4 | 1.4 | 1.1 | 22.1 |
| |
| EBITDA(5)before Exceptional items | 84,261 | 63,303 | 162.3 | 121.9 | 33.1 |
| % of net sales | 26.7 | 25.2 | 26.7 | 25.2 | |
| EBITDA | 84,317 | 63,303 | 162.4 | 121.9 | 33.2 |
| % of net sales | 26.7 | 25.2 | 26.7 | 25.2 | |
| | | | | | |
| OTHER INFORMATION | | | | | |
| Number of shares | 318,502,872 | 318,502,872 | 318,502,872 | 318,502,872 | |
| Shares per ADR | 5 | 5 | 5 | 5 | |
| |
| DEPRECIATION | 12,323 | 12,462 | 23.7 | 24.0 | (1.1) |
| Capital Expenditures | 33,582 | 16,239 | 64.7 | 31.3 | 106.8 |
(1) Exchange rate: US$1.00 = CLP 519,20
(2) MSD&A refers to Marketing selling, distribution and administrative expenses
(3) Exceptional Items (IE), formerly Non recurring items (NRI)
(4) CLP 4,273 million considered as an Exceptional item, due to a final tax settlement in December 31, 2011
(5) Please see full note in page before exhibits |
|
|
|
|
| | | | | | |
| Exhibit 2: Income Statement (Twelve Months ended on December 31, 2011) | | | |
| YTD AS OF DECEMBER | 2011 | 2010 | 2011(1) | 2010(1) | VARIANCE % |
| (CLP million) | (CLP million) | (US$ million) | (US$ million) | |
| Core revenue | 951,105 | 820,627 | 1,831.9 | 1,580.6 | 15.9 |
| Other revenue | 18,446 | 17,631 | 35.5 | 34.0 | 4.6 |
| Interco sales revenue | 0 | 0 | 0.0 | 0.0 | - |
| Net sales | 969,551 | 838,258 | 1,867.4 | 1,614.5 | 15.7 |
| Cost of goods sold | (450,563) | (383,813) | (867.8) | (739.2) | 17.4 |
| % of net sales | 46.5 | 45.8 | 46.5 | 45.8 | |
| Gross profit | 518,987 | 454,445 | 999.6 | 875.3 | 14.2 |
| MSD&A(2) | (348,363) | (300,659) | (671.0) | (579.1) | 15.9 |
| % of net sales | 35.9 | 35.9 | 35.9 | 35.9 | |
| Other operating income/(expenses) | 7,230 | 1,472 | 13.9 | 2.8 | 391.3 |
| EBIT before Exceptional Items(3) | 177,855 | 155,258 | 342.6 | 299.0 | 14.6 |
| % of net sales | 18.3 | 18.5 | 18.3 | 18.5 | |
| Exceptional items | 12,905 | 6,791 | 24.9 | 13.1 | 90.0 |
| EBIT | 190,760 | 162,049 | 367.4 | 312.1 | 17.7 |
| % of net sales | 19.7 | 19.3 | 19.7 | 19.3 | |
| Net financing expenses | (7,334) | (8,288) | (14.1) | (16.0) | (11.5) |
| Share of profits of associates and joint ventures | 1,069 | 966 | 2.1 | 1.9 | 10.7 |
| Exchange rate differences | (1,079) | (1,401) | (2.1) | (2.7) | n/a |
| Results of indexed units | (6,734) | (5,080) | (13.0) | (9.8) | 32.6 |
| Other gains/(losses) | 3,010 | (655) | 5.8 | (1.3) | n/a |
| ALL OTHER | (11,068) | (14,457) | (21.3) | (27.8) | (23.4) |
| INCOME/(LOSS) BEFORE TAXES | 179,693 | 147,593 | 346.1 | 284.3 | 21.7 |
| Income tax(4) | (44,890) | (27,656) | (86.5) | (53.3) | 62.3 |
| NET PROFIT FOR THE PERIOD | 134,802 | 119,937 | 259.6 | 231.0 | 12.4 |
| |
| |
NET PROFIT before EI ATTRIBUTABLE TO:
PARENT COMPANY SHAREHOLDERS | | | | | |
| 118,972 | 107,898 | 229.1 | 207.8 | 10.3 |
| |
NET PROFIT ATTRIBUTABLE TO:
PARENT COMPANY SHAREHOLDERS | | | | | |
| 122,752 | 110,700 | 236.4 | 213.2 | 10.9 |
| MINORITY INTEREST | 12,051 | 9,237 | 23.2 | 17.8 | 30.5 |
| |
| Net profit attributable to Parent Company Shareholders�� | | | | | |
| | 12.7 | 13.2 | 12.7 | 13.2 | |
| as % of net sales | | | | | |
| |
Earnings per share
Earnings per ADR | 385.4 | 347.6 | 0.7 | 0.7 | 10.9 |
| 1,927.0 | 1,737.8 | 3.7 | 3.3 | 10.9 |
| |
| EBITDA(5)before Exceptional items | 225,637 | 200,459 | 434.6 | 386.1 | 12.6 |
| % of net sales | 23.3 | 23.9 | 23.3 | 23.9 | |
| EBITDA | 238,542 | 207,250 | 459.4 | 399.2 | 15.1 |
| % of net sales | 24.6 | 24.7 | 24.6 | 24.7 | |
| | | | | | |
| OTHER INFORMATION | | | | | |
| Number of shares | 318,502,872 | 318,502,872 | 318,502,872 | 318,502,872 | |
| Shares per ADR | 5 | 5 | 5 | 5 | |
| |
| DEPRECIATION | 47,782 | 45,201 | 92.0 | 87.1 | 5.7 |
| Capital Expenditures | 77,847 | 64,396 | 149.9 | 124.0 | 20.9 |
(1) Exchange rate: US$1.00 = CLP 519,20
(2) MSD&A refers to Marketing selling, distribution and administrative expenses
(3) Exceptional Items (IE), formerly Non recurring items (NRI)
(4) CLP 4,273 million considered as an Exceptional item, due to a final tax settlement in December 31, 2011
(5) Please see full note in page before exhibits |
|
|
|
|
| | | | | | | | | | | | | | | |
| Exhibit 3: Segment Information - Fourth Quarter 2011 |
| Q4 | Beer Chile | Beer Argentina | Non-Alcoholic | Wines | Spirits | Other/eliminations | Total |
| (CLP million) | 2011 | 2010 | 2011 | 2010 | 2011 | 2010 | 2011 | 2010 | 2011 | 2010 | 2011 | 2010 | 2011 | 2010 |
| Core revenue | 101,642 | 89,861 | 69,885 | 49,592 | 73,707 | 64,985 | 35,110 | 29,819 | 16,287 | 10,974 | 13,421 | 0 | 310,052 | 245,230 |
| Other revenue | 1,064 | 964 | 1,640 | 1,077 | 257 | 359 | 1,361 | 1,806 | 90 | 108 | 1,393 | 1,179 | 5,805 | 5,495 |
| Interco sales revenue | 206 | 235 | 21 | 19 | 1,195 | 1,080 | 8 | 9 | 58 | 408 | (1,488) | (1,750) | 0 | 0 |
| Net sales | 102,912 | 91,060 | 71,546 | 50,687 | 75,158 | 66,424 | 36,479 | 31,634 | 16,436 | 11,490 | 13,326 | (571) | 315,857 | 250,725 |
| variance % | 13.0 | | 41.2 | | 13.1 | | 15.3 | | 43.0 | | | | 26.0 | |
| Cost of goods sold | (38,282) | (34,575) | (26,165) | (20,094) | (37,507) | (32,629) | (22,527) | (20,978) | (10,554) | (6,093) | (4,266) | 3,293 | (139,301) | (111,076) |
| % of net sales | 37.2 | 38.0 | 36.6 | 39.6 | 49.9 | 49.1 | 61.8 | 66.3 | 64.2 | 53.0 | | | 44.1 | 44.3 |
| Gross profit | 64,630 | 56,485 | 45,382 | 30,593 | 37,651 | 33,796 | 13,952 | 10,656 | 5,881 | 5,396 | 9,060 | 2,722 | 176,556 | 139,649 |
| MSD&A(1) | (29,545) | (26,063) | (34,351) | (21,914) | (26,051) | (24,581) | (10,882) | (9,838) | (4,278) | (4,040) | (4,494) | (3,604) | (109,602) | (90,041) |
| % of net sales | 28.7 | 28.6 | 48.0 | 43.2 | 34.7 | 37.0 | 29.8 | 31.1 | 26.0 | 35.2 | | | 34.7 | 35.9 |
| Other operating income/(expenses) | 691 | 66 | (86) | 226 | 10 | 139 | 1,596 | 99 | 118 | 217 | 2,655 | 487 | 4,984 | 1,234 |
| EBIT before Exceptional items(2) | 35,776 | 30,488 | 10,945 | 8,905 | 11,610 | 9,353 | 4,666 | 917 | 1,721 | 1,573 | 7,221 | (395) | 71,938 | 50,842 |
| variance % | 17.3 | | 22.9 | | 24.1 | | 408.7 | | 9.4 | | | | 41.5 | |
| % of net sales | 34.8 | 33.5 | 15.3 | 17.6 | 15.4 | 14.1 | 12.8 | 2.9 | 10.5 | 13.7 | | | 22.8 | 20.3 |
| Exceptional items | 0 | 0 | 0 | 0 | 0 | 0 | 0 | 0 | 0 | 0 | 56 | 0 | 56 | 0 |
| EBIT | 35,776 | 30,488 | 10,945 | 8,905 | 11,610 | 9,353 | 4,666 | 917 | 1,721 | 1,573 | 7,277 | (395) | 71,994 | 50,842 |
| variance % | 17.3 | | 22.9 | | 24.1 | | 408.7 | | 9.4 | | | | 41.6 | |
| % of net sales | 34.8 | 33.5 | 15.3 | 17.6 | 15.4 | 14.1 | 12.8 | 2.9 | 10.5 | 13.7 | | | 22.8 | 20.3 |
| EBITDA before Exceptional items | 39,834 | 35,565 | 12,431 | 10,179 | 14,362 | 11,967 | 6,241 | 2,533 | 2,202 | 1,983 | 9,191 | 1,076 | 84,261 | 63,303 |
| variance % | 12.0 | | 22.1 | | 20.0 | | 146.4 | | 11.0 | | | | 33.1 | |
| % of net sales | 38.7 | 39.1 | 17.4 | 20.1 | 19.1 | 18.0 | 17.1 | 8.0 | 13.4 | 17.3 | | | 26.7 | 25.2 |
| EBITDA | 39,834 | 35,565 | 12,431 | 10,179 | 14,362 | 11,967 | 6,241 | 2,533 | 2,202 | 1,983 | 9,247 | 1,076 | 84,317 | 63,303 |
| variance % | 12.0 | | 22.1 | | 20.0 | | 146.4 | | 11.0 | | 759.7 | | 33.2 | |
| % of net sales | 38.7 | 39.1 | 17.4 | 20.1 | 19.1 | 18.0 | 17.1 | 8.0 | 13.4 | 17.3 | | | 26.7 | 25.2 |
| |
| Q4 | Beer Chile | Beer Argentina(3) | Non- alcoholic(4) | Wine(5) | Spirits | Other/eliminations | Total |
| VOLUMES(HL) | 2011 | 2010 | 2011 | 2010 | 2011 | 2010 | 2011 | 2010 | 2011 | 2010 | 2011 | 2010 | 2011 | 2010 |
| SEGMENT VOLUME | 1,756,616 | 1,621,089 | 1,373,460 | 1,336,124 | 2,083,952 | 1,926,457 | 303,583 | 273,649 | 69,662 | 58,340 | 148,886 | - | 5,736,159 | 5,215,659 |
| variance % | 8.4 | | 2.8 | | 8.2 | | 10.9 | | 19.4 | | - | | 10.0 | |
| | | | | | SOFT DRINKS | CHILE DOMESTIC | | | | | | |
| | | | | | 1,329,810 | 1,271,995 | 143,867 | 131,322 | | | | | | |
| variance % | | | | | 4.5 | | 9.6 | | | | | | | |
| | | | | | NECTAR | CHILE EXPORTS | | | | | | |
| | | | | | 287,923 | 256,976 | 145,495 | 126,767 | | | | | | |
| variance % | | | | | 12.0 | | 14.8 | | | | | | | |
| | | | | | WATER | ARGENTINA | | | | | | |
| | | | | | 466,219 | 397,486 | 14,221 | 15,561 | | | | | | |
| variance % | | | | | 17.3 | | -8.6 | | | | | | | |
(1)MSD&A refers to Marketing selling, distribution and administrative expenses
(2)Exceptional Items (IE), formerly Non recurring items (NRI)
(3)Excludes exports to Chile of 4,954 Hl and 5,518 Hl in 2011 and 2010 respectively
(4)Includes soft drinks (sof drinks, tea, sports and energetic drinks), nectars and water (purified and mineral)
(5)Excludes bulk wine of 8,580 Hl and 28,043 Hl in 2011 and 2010 respectively |
|
|
|
|
| |
| Q4 | Beer Chile | Beer Argentina | Non-Alcoholic | Wines | Spirits | Other/eliminations | Total |
| AVE. PRICES (CLP/Hl) | 2011 | 2010 | 2011 | 2010 | 2011 | 2010 | 2011 | 2010 | 2011 | 2010 | 2011 | 2010 | 2011 | 2010 |
| SEGMENT AVE. PRICE | 57,862 | 55,433 | 50,882 | 37,116 | 35,369 | 33,733 | 115,654 | 108,967 | 233,804 | 188,096 | 90,145 | | 54,052 | 47,018 |
| variance % | 4.4 | | 37.1 | | 4.8 | | 6.1 | | 24.3 | | | | 15.0 | |
| | | | | | SOFT DRINKS | CHILE DOMESTIC | | PISCO | | | | |
| | | | | | 35,110 | 33,129 | 88,812 | 86,775 | | | | | | |
| variance % | | | | | 6.0 | | 2.3 | | | | | | | |
| | | | | | NECTAR | CHILE EXPORTS | | | | | | |
| | | | | | 47,332 | 44,780 | 136,510 | 126,118 | | | | | | |
| variance % | | | | | 5.7 | | 8.2 | | | | | | | |
| | | | | | WATER | ARGENTINA | | | | | | |
| | | | | | 28,719 | 28,525 | 173,566 | 156,404 | | | | | | |
| variance % | | | | | 0.7 | | 11.0 | | | | | | | |
| | | | | | | | | | | | | | | |
| Exhibit 4: Segment Information - Twelve Months ended on December 31, 2011 |
| YTD AS OF DECEMBER | Beer Chile | Beer Argentina | Non-Alcoholic | Wines | Spirits | Other/eliminations | Total |
| (CLP million) | 2011 | 2010 | 2011 | 2010 | 2011 | 2010 | 2011 | 2010 | 2011 | 2010 | 2011 | 2010 | 2011 | 2010 |
| Core revenue | 309,287 | 283,448 | 194,454 | 151,952 | 243,330 | 218,841 | 132,934 | 125,790 | 49,361 | 40,596 | 21,740 | 0 | 951,105 | 820,627 |
| Other revenue | 3,208 | 2,925 | 3,640 | 2,227 | 1,226 | 1,152 | 5,391 | 6,484 | 492 | 1,184 | 4,488 | 3,660 | 18,446 | 17,631 |
| Interco sales revenue | 522 | 1,608 | 87 | 2,184 | 3,953 | 3,483 | 24 | 19 | 1,083 | 1,438 | (5,669) | (8,732) | 0 | 0 |
| Net sales | 313,017 | 287,981 | 198,181 | 156,363 | 248,509 | 223,476 | 138,348 | 132,293 | 50,936 | 43,218 | 20,560 | (5,072) | 969,551 | 838,258 |
| variance % | 8.7 | | 26.7 | | 11.2 | | 4.6 | | 17.9 | | | | 15.7 | |
| Cost of goods sold | (122,417) | (113,816) | (77,601) | (66,543) | (126,415) | (108,666) | (89,850) | (83,876) | (29,153) | (22,622) | (5,128) | 11,710 | (450,563) | (383,813) |
| % of net sales | 39.1 | 39.5 | 39.2 | 42.6 | 50.9 | 48.6 | 64.9 | 63.4 | 57.2 | 52.3 | | | 46.5 | 45.8 |
| Gross profit | 190,600 | 174,165 | 120,580 | 89,820 | 122,095 | 114,810 | 48,498 | 48,417 | 21,783 | 20,596 | 15,432 | 6,638 | 518,987 | 454,445 |
| MSD&A(1) | (97,196) | (89,203) | (95,289) | (68,006) | (88,053) | (82,745) | (40,242) | (38,372) | (15,592) | (14,368) | (11,991) | (7,964) | (348,363) | (300,659) |
| % of net sales | 31.1 | 31.0 | 48.1 | 43.5 | 35.4 | 37.0 | 29.1 | 29.0 | 30.6 | 33.2 | | | 35.9 | 35.9 |
| Other operating income/(expenses) | 679 | 333 | (162) | 214 | 1,041 | 299 | 2,166 | 211 | 192 | 182 | 3,314 | 233 | 7,230 | 1,472 |
| EBIT before Exceptional items(2) | 94,083 | 85,295 | 25,129 | 22,028 | 35,083 | 32,364 | 10,422 | 10,256 | 6,383 | 6,409 | 6,755 | (1,093) | 177,855 | 155,258 |
| variance % | 10.3 | | 14.1 | | 8.4 | | 1.6 | | -0.4 | | | | 14.6 | |
| % of net sales | 30.1 | 29.6 | 12.7 | 14.1 | 14.1 | 14.5 | 7.5 | 7.8 | 12.5 | 14.8 | | | 18.3 | 18.5 |
| Exceptional items | 5,329 | 0 | 0 | 0 | 1,236 | 0 | 6,467 | 0 | 307 | 0 | (433) | 6,791 | 12,905 | 6,791 |
| EBIT | 99,412 | 85,295 | 25,129 | 22,028 | 36,318 | 32,364 | 16,890 | 10,256 | 6,690 | 6,409 | 6,321 | 5,698 | 190,760 | 162,049 |
| variance % | 16.6 | | 14.1 | | 12.2 | | 64.7 | | 4.4 | | 10.9 | | 17.7 | |
| % of net sales | 31.8 | 29.6 | 12.7 | 14.1 | 14.6 | 14.5 | 12.2 | 7.8 | 13.1 | 14.8 | | | 19.7 | 19.3 |
| EBITDA before Exceptional items | 110,248 | 101,041 | 30,480 | 26,879 | 45,510 | 41,982 | 16,841 | 16,727 | 8,260 | 8,081 | 14,298 | 5,749 | 225,637 | 200,459 |
| variance % | 9.1 | | 13.4 | | 8.4 | | 0.7 | | 2.2 | | 148.7 | | 12.6 | |
| % of net sales | 35.2 | 35.1 | 15.4 | 17.2 | 18.3 | 18.8 | 12.2 | 12.6 | 16.2 | 18.7 | | | 23.3 | 23.9 |
| EBITDA | 115,577 | 101,041 | 30,480 | 26,879 | 46,746 | 41,982 | 23,308 | 16,727 | 8,567 | 8,081 | 13,865 | 12,540 | 238,542 | 207,250 |
| variance % | 14.4 | | 13.4 | | 11.3 | | 39.3 | | 6.0 | | 10.6 | | 15.1 | |
| % of net sales | 36.9 | 35.1 | 15.4 | 17.2 | 18.8 | 18.8 | 16.8 | 12.6 | 16.8 | 18.7 | | | 24.6 | 24.7 |
| |
| YTD AS OF DECEMBER | Beer Chile | Beer Argentina(3) | Non- alcoholic(4) | Wine(5) | Spirits | Other/eliminations | Total |
| VOLUMES (HL) | 2011 | 2010 | 2011 | 2010 | 2011 | 2010 | 2011 | 2010 | 2011 | 2010 | 2011 | 2010 | 2011 | 2010 |
| TOTAL SEGMENT | 5,385,567 | 5,148,001 | 4,345,209 | 4,142,440 | 6,990,587 | 6,590,598 | 1,211,713 | 1,204,674 | 228,301 | 212,302 | 236,079 | - | 18,397,457 | 17,298,015 |
| variance % | 4.6 | | 4.9 | | 6.1 | | 0.6 | | 7.5 | | - | | 6.4 | |
| | | | | | SOFT DRINKS | CHILE DOMESTIC | | | | | | |
| | | | | | 4,509,575 | 4,342,187 | 578,961 | 570,312 | | | | | | |
| variance % | | | | | 3.9 | | 1.5 | | | | | | | |
| | | | | | NECTAR | CHILE EXPORTS | | | | | | |
| | | | | | 1,042,776 | 916,908 | 570,202 | 562,440 | | | | | | |
| variance % | | | | | 13.7 | | 1.4 | | | | | | | |
| | | | | | WATER | ARGENTINA | | | | | | |
| | | | | | 1,438,236 | 1,331,503 | 62,550 | 71,922 | | | | | | |
| variance % | | | | | 8.0 | | -13.0 | | | | | | | |
(1)MSD&A refers to Marketing selling, distribution and administrative expenses
(2)Exceptional Items (IE), formerly Non recurring items (NRI)
(3)Excludes exports to Chile of 12,585 Hl and 86,470 Hl in 2011 and 2010 respectively
(4)Includes soft drinks (sof drinks, tea, sports and energetic drinks), nectars and water (purified and mineral)
(5)Excludes bulk wine of 47,951 Hl and 84,709 Hl in 2011 and 2010 respectively |
|
|
|
|
| |
| YTD AS OF DECEMBER | Beer Chile | Beer Argentina | Non-Alcoholic | Wines | Spirits | Other/eliminations | Total |
| AVE. PRICES (CLP/Hl) | 2011 | 2010 | 2011 | 2010 | 2011 | 2010 | 2011 | 2010 | 2011 | 2010 | 2011 | 2010 | 2011 | 2010 |
| SEGMENT AVE. PRICE | 57,429 | 55,060 | 44,751 | 36,682 | 34,808 | 33,205 | 109,707 | 104,418 | 216,210 | 191,219 | 92,090 | | 51,698 | 47,441 |
| variance % | 4.3 | | 22.0 | | 4.8 | | 5.1 | | 13.1 | | - | | 9.0 | |
| | | | | | SOFT DRINKS | CHILE DOMESTIC | | | | | | |
| | | | | | 34,416 | 32,609 | 84,235 | 75,852 | | | | | | |
| variance % | | | | | 5.5 | | 11.1 | | | | | | | |
| | | | | | NECTAR | CHILE EXPORTS | | | | | | |
| | | | | | 45,826 | 44,281 | 130,427 | 128,077 | | | | | | |
| variance % | | | | | 3.5 | | 1.8 | | | | | | | |
| | | | | | WATER | ARGENTINA | | | | | | |
| | | | | | 28,051 | 27,523 | 156,520 | 145,893 | | | | | | |
| variance % | | | | | 1.9 | | 7.3 | | | | | | | |
| | | | | | |
| Exhibit 5: Balance Sheet | | | | | |
| | December 31
2011 | December 31
2010 | December 31
2011 | December 31
2010 | Variance
% |
|
| ASSETS | (CLP million) | (CLP million) | (US$ million)(1) | (US$ million)(1) | |
| Cash and cash equivalents | 177,664 | 151,614 | 342 | 292 | 17.2 |
| Other current assets | 364,881 | 294,668 | 703 | 568 | 23.8 |
| Total current assets | 542,546 | 446,282 | 1,045 | 860 | 21.6 |
| |
| PP&E (net) | 556,949 | 508,162 | 1,073 | 979 | 9.6 |
| Other non current assets | 198,996 | 197,245 | 383 | 380 | 0.9 |
| Total non current assets | 755,946 | 705,407 | 1,456 | 1,359 | 7.2 |
| Total assets | 1,298,491 | 1,151,689 | 2,501 | 2,218 | 12.7 |
| |
| LIABILITIES | | | | | |
| Short term financial debt | 76,105 | 12,822 | 147 | 25 | 493.6 |
| Other liabilities | 274,666 | 224,136 | 529 | 432 | 22.5 |
| Total current liabilities | 350,771 | 236,958 | 676 | 456 | 48.0 |
| |
| Long term financial debt | 170,955 | 220,145 | 329 | 424 | (22.3) |
| Other liabilities | 91,980 | 79,512 | 177 | 153 | 15.7 |
| Total non current liabilities | 262,935 | 299,657 | 506 | 577 | (12.3) |
| Total Liabilities | 613,706 | 536,615 | 1,182 | 1,034 | 14.4 |
| |
| EQUITY | | | | | |
| Paid-in capital | 231,020 | 231,020 | 445 | 445 | 0.0 |
| Other reserves | (35,174) | (37,119) | (68) | (71) | 0.0 |
| Retained earnings | 373,130 | 311,754 | 719 | 600 | 19.7 |
| |
| Net equity attributable to parent company shareholders | 568,976 | 505,655 | 1,096 | 974 | 12.5 |
| Minority interest | 115,810 | 109,419 | 223 | 211 | 5.8 |
| Total equity | 684,786 | 615,074 | 1,319 | 1,185 | 11.3 |
| Total equity and liabilities | 1,298,491 | 1,151,689 | 2,501 | 2,218 | 12.7 |
OTHER FINANCIAL INFORMATION
| | | | | | |
| Total financial debt | 247,061 | 232,967 | 476 | 449 | 6.0% |
| | | | | |
| Net debt(2) | 69,396 | 81,353 | 134 | 157 | -14.7% |
| | | | | |
| Liquidity ratio | 1.55 | 1.88 | | | |
| Financial Debt / Capitalization | 0.27 | 0.27 | | | |
| Net debt / EBITDA(2) | 0.29 | 0.39 | | | |
| (1) Exchange rate: US$ 1.00 = CLP 519.2 | | | | | |
| (2) Total financial debt minus cash & cash equivalents | | | | | |
| (3) Last 12 months of EBITDA | | | | | |
| | | | | |
Signatures
Pursuant to the requirements of the Securities Exchange Act of 1934, the registrant has duly caused this report to be signed on its behalf by the undersigned, thereunto duly authorized.
Compañía Cervecerías Unidas S.A.
(United Breweries Company, Inc.)
| |
| | /s/ Ricardo Reyes |
| | Chief Financial Officer |
| |
Date: February 03, 2012