UNITED STATES
SECURITIES AND EXCHANGE COMMISSION
WASHINGTON, D.C. 20549
FORM 20-F
REGISTRATION STATEMENT PURSUANT TO SECTION 12(b) OR (g) OF THE SECURITIES EXCHANGE ACT OF 1934
X ANNUAL REPORT PURSUANT TO SECTION 13 OR 15(d) OF THE SECURITIES EXCHANGE ACT OF 1934
For the fiscal year ended December 31, 2011
TRANSITION REPORT PURSUANT TO SECTION 13 OR 15 (d) OF THE SECURITIES EXCHANGE ACT OF 1934
For the transition period from _____________ to _____________
Commission file number 0-20486
COMPAÑIA CERVECERIAS UNIDAS S.A.
(Exact name of Registrant as specified in its charter)
UNITED BREWERIES COMPANY, INC.
(Translation of Registrant's name into English)
Republic of Chile
(Jurisdiction of incorporation or organization)
Vitacura 2670, Twenty-Third Floor, Santiago, Chile
(Address of principal executive offices)
Rosita Covarrubias,(562-427-3581), rosita@ccu.cl or rcovarr@ccu.cl
Vitacura 2670, Twenty-Third Floor, Santiago, Chile
(Name, Telephone, Email and/or Facsimile number and Address of Company Contact Person)
_________________________________________
Securities registered or to be registered pursuant to section 12(b) of the Act.
Name of each exchange
Title of each class on which registered
American Depositary Shares New York Stock Exchange
Representing Common Stock
Common Stock, without par value New York Stock Exchange*
__________
* Not for trading, but only in connection with the registration of American Depositary Shares which are evidenced by American Depositary Receipts
Securities registered or to be registered pursuant to Section 12(g) of the Act.
Not applicable
Securities for which there is a reporting obligation pursuant to Section 15(d) of the Act.
Not applicable
Indicate the number of outstanding shares of each of the issuer's classes of capital or common stock as of the close of the period covered by the annual report.
Common stock, with no par value: 318,502,872
Indicate by check mark if the registrant is a well-known seasoned issuer, as defined in Rule 405 of the Securities Act.
YES NO X
If this report is an annual or transition report, indicate by check mark if the registrant is not required to file reports pursuant to Section 13 or 15(d) of the Securities Exchange Act of 1934.
YES NO X
Indicate by check mark whether the registrant (1) has filed all reports required to be filed by Section 13 or 15 (d) of the Securities Exchange Act of 1934 during the preceding 12 months (or for such shorter period that the registrant was required to file such reports), and (2) has been subject to such filing requirements for the past 90 days.
YES X NO
Indicate by check mark whether the registrant has submitted electronically and posted on its corporate Web site, if any, every Interactive Data File required to be submitted and posted pursuant to Rule 405 of Regulation S-T (§232.405 of this chapter) during the preceding 12 months (or for such shorter period that the registrant was required to submit and post such files).
YES NO _____
Indicate by check mark whether the registrant is a large accelerated filer, an accelerated filer, or a non-accelerated filer. See definition of “accelerated filer and large accelerated filer” in Rule 12b-2 of the Exchange Act. (Check one):
Large accelerated filer X Accelerated filer Non-accelerated filer
Indicate by check mark which basis of accounting the registrant has used to prepare the financial statements included in this filing:
U.S. GAAP International Financial Reporting Standards as issued Other
by the International Accounting Standards Board X
If “Other” has been checked in response to the previous question, indicate by check mark which financial statement item the registrant has elected to follow.
ITEM 17 ITEM 18
If this is an annual report, indicate by check mark whether the registrant is a shell company (as defined in Rule 12b-2 of the Exchange Act).
YES NO X
Table of Contents
Page
| Introduction | i |
| Forward Looking Statements | ii |
| PART I | 3 |
ITEM 1: Identity of Directors, Senior Management and Advisers | 3 |
ITEM 2: Offer Statistics and Expected Timetable | 3 |
ITEM 3: Key Information | 3 |
ITEM 4: Information on the Company | 15 |
ITEM 4A: Unresolved Staff Comments | 65 |
ITEM 5: Operating and Financial Review and Prospects | 65 |
ITEM 6: Directors, Senior Management and Employees | 84 |
ITEM 7: Major Shareholders and Related Party Transactions | 94 |
ITEM 8: Financial Information | 100 |
ITEM 9: The Offer and Listing | 102 |
ITEM 10: Additional Information | 104 |
ITEM 11: Quantitative and Qualitative Disclosures About Market Risk | 118 |
ITEM 12: Description of Securities Other than Equity Securities | 122 |
| PART II | 124 |
ITEM 13: Defaults, Dividend Arrearages and Delinquencies | 124 |
ITEM 14: Material Modifications to the Rights of Security Holders and Use of Proceeds | 124 |
ITEM 15: Controls and Procedures | 124 |
ITEM 16A: Audit Committee Financial Expert | 125 |
ITEM 16B: Code of Ethics | 125 |
ITEM 16C: Principal Accountant Fees and Services | 125 |
ITEM 16D: Exemptions from the Listing Standards for Audit Committees | 126 |
ITEM 16E: Purchases of Equity Securities by the Issuer and Affiliated Purchasers | 126 |
ITEM 16F: Change in Registrant’s Certifying Accountants | 126 |
ITEM 16G: Corporate Governance | 126 |
ITEM 16H: Mine Safety Disclosure | 128 |
| PART III | 129 |
ITEM 17: Financial Statements | 129 |
ITEM 18: Financial Statements | 129 |
ITEM 19: Exhibits | 129 |
F-PAGES | F-1 |
Introduction
In this annual report on Form 20-F, all references to “we” “us” or “CCU” are to Compañía Cervecerías Unidas S.A., an open stock corporation (sociedad anónima abierta) organized under the laws of the Republic of Chile, and its consolidated subsidiaries. Chile is divided into regions, each of which is known by its roman number (e.g. “Region XI”). Our fiscal year ends on December 31st. The expression ‘’last three years’’ means the years 2009, 2010 and 2011. Unless otherwise specified, all references to “U.S. dollars” “dollars” “USD” or “US$” are to United States dollars, and references to “Chilean pesos” “pesos” “Ch$” or “CLP” are to Chilean pesos. We prepare our financial statements in accordance with International Financial Reporting Standards (“IFRS”) as issued by the International Accounting Standards Board (“IASB”). These are the Company’s second annual consolidated financial statements prepared in accordance with IFRS as issued by the IASB and IFRS 1 “First Time Adoption of International Financial Reporting Standards.” Until and including our financial statements for the year ended December 31, 2008, we prepared our consolidated financial statements in accordance with Chilean generally accepted accounting principles (“Chilean GAAP”), which differs in certain important respects from IFRS. Following the Company’s adoption of IFRS, as issued by the IASB, we are no longer required to reconcile our financial statements prepared in accordance with IFRS to US GAAP. See the notes to our consolidated financial statements included in pages F-1 through F-92 of this annual report. We use the metric system of weights and measures in calculating our operating and other data. The United States equivalent units of the most common metric units used by us are as shown below:
1 liter = 0.2642 gallons |
1 gallon = 3.7854 liters |
1 liter = 0.008522 US beer barrels | 1 US beer barrel = 117.34 liters |
1 liter = 0.1761 soft drinks unit cases (8 oz cans) | 1 soft drinks unit case (8 oz cans) = 5.6775 liters |
1 liter = 0.1174 beer unit cases (12 oz cans). | 1 beer unit case (12 oz cans) = 8.5163 liters |
1 hectoliter = 100 liters | 1 liter = 0.01 hectoliters |
1 US beer barrel = 31 gallons | 1 gallon = 0.0323 US beer barrels |
1 hectare = 2.4710 acres | 1 acre = 0.4047 hectares |
1 mile = 1.6093 kilometers | 1 kilometer = 0.6214 miles
|
This annual report contains various estimates made by us of market share data and related sales volume information. These estimates are based on statistics published or made available by A.C. Nielsen Chile S.A. (“Nielsen”) in the case of beer, soft drinks, water, wine, rum and pisco sales in Chile and beer in Argentina; the Asociación de Cerveceros de Chile (“Acechi”) in the case of beer sales in Chile for years prior to 2010; Inversiones Marco Polo Ltda. (“BBS”) in the case of imports in Chile; theCámara de la Industria Cervecera Argentina (Argentine Beer Industry Chamber, or “CICA”) in the case of beer sales in Argentina for years prior to 2010; theAsociación Nacional de Bebidas Refrescantes (National Association of Soft Drinks, or “ANBER”) in the case of soft drinks and water; competitors public information in the case of wine sales in Chile; and theAsociación de Viñas de Chile, A.G. (Wineries of Chile Association) in the case of Chilean wine exports. We believe that, due to the methodologies used, the statistics provided by these sources in some cases do not accurately reflect our market share or industry sales volumes. For example, the Nielsen sampling frame includes only the metropolitan areas of Chile and not the rural areas of the country, where we believe our beer and pisco market share is higher than in the metropolitan areas, due to our distribution system. Likewise, the sales of one of our Argentine competitors are not reflected in CICA’s statistics because this company is not a member of CICA. Similarly, data regarding the size of the Chilean soft drink and mineral water markets and market shares does not coincide with publicly available information of our sales volume and our competitors. As a consequence, we have revised the share estimates from the sources identified above for Chilean and Argentine beer sales, pisco, rum, soft drink and mineral water sales to reflect what we believe is a more accurate measure of market shares, taking into account:
· reports published by theInstituto Nacional de Estadísticas (the Chilean National Institute of Statistics, or the “INE”),
· our internal sales data,
· sales information filed publicly by our competitors, and
· import and export reports made available by Chilean and Argentine customs authorities.
i |
However, our revised estimates have not been confirmed by independent sources. Certain amounts, including percentage amounts, which appear in this annual report have been rounded and may not sum exactly to the totals shown. The amounts and/or percentages corresponding to prior years may differ from the ones originally filed due to new and more accurate available information.
Forward Looking Statements
This annual report contains “forward-looking statements” within the meaning of Section 27A of the Securities Act of 1933, as amended, which we refer to as the “Securities Act,” and Section 21E of the Securities and Exchange Act of 1934, which we refer to as the “Exchange Act.” These statements relate to analyses and other information, which are based on forecasts of future results and estimates of amounts not yet determinable. They also relate to our future prospects, development and business strategies.
These forward-looking statements are identified by the use of terms and phrases such as “anticipate;” “believes;” “could;” “expects;” “intends;” “may;” “plans;” “predicts;” “projects;” “will” and similar terms and phrases. We caution you that actual results could differ materially from those expected by us, depending on the outcome of certain factors, including, without limitation:
· our success in implementing our investment and capital expenditure program;
· the nature and extent of future competition in our principal marketing areas;
· the nature and extent of a global financial disruption and its consequences;
· political and economic developments in Chile, Argentina and other countries where we currently conduct business or may conduct business in the future, including other Latin American countries; and
· other factors discussed under “Risk factors” “Our business” and “Management’s discussion and analysis of financial condition and results of operations.”
You are cautioned not to place undue reliance on these forward-looking statements, which speak only as of the date of this annual report. We undertake no obligation to release publicly the result of any revisions to these forward-looking statements which may be made to reflect events or circumstances after the date of this annual report, including, without limitation, changes in our business strategy or planned capital expenditures, or to reflect the occurrence of unanticipated events.
ii |
PART I
ITEM 1: Identity of Directors, Senior Management and Advisers
Not applicable.
ITEM 2: Offer Statistics and Expected Timetable
Not applicable.
ITEM 3: Key Information
Selected Financial Data
The following table presents selected consolidated financial data as of December 31, for each of the last four years which has been derived from our consolidated financial statements prepared in accordance with IFRS and included elsewhere in this annual report. The financial data set forth below should be read in conjunction with the consolidated financial statements and related notesand “Item 5: Operating and Financial Review and Prospects” included elsewhere in this annual report.
| Year ended December 31, | ||||
IFRS | 2008 | 2009 | 2010 | 2011 | |
|
| (million of CLP) (1) |
| ||
1. Income Statement Data: |
|
|
|
| |
Net sales | 710,189 | 776,544 | 838,258 | 969,551 | |
EBIT | 123,990 | 137,382 | 162,049 | 190,760 | |
Net financing expenses | -4,797 | -10,367 | -8,288 | 7,334 | |
Results of indexed units | -15,626 | 4,190 | -5,080 | 6,734 | |
Other gains/(losses) | 1,563 | 21,925 | -655 | -3,010 | |
Income tax | -10,524 | -11,724 | -27,656 | 44,890 | |
|
|
|
|
| |
Net profit for the year: | 95,303 | 141,365 | 119,937 | 134,802 | |
Attributable to: |
|
|
|
| |
Equity holders of the Parent Company | 90,414 | 128,037 | 110,700 | 122,752 | |
Non controlling interest | 4,890 | 13,328 | 9,237 | 12,051 | |
|
|
|
|
| |
Basic and Diluted Income per share | 283.87 | 402.00 | 347.56 | 385.4 | |
Basic and Diluted Income per ADS (2) | 1,419.36 | 2,009.98 | 1,737.81 | 1,927.00 | |
Dividend per share (3) | 155.66 | 201.00 | 173.78 | 192.7 | |
Dividend per ADS in US$ (3) | 1.29 | 1.96 | 1.83 | 1.95 | |
Weighed average shares outstanding (000) | 318,503 | 318,503 | 318,503 | 318,503 | |
3
|
|
|
|
|
|
| |
|
|
| Year ended December 31, | ||||
|
| IFRS | 2008 | 2009 | 2010 | 2011 | |
|
|
| (millions of CLP ) (1) | ||||
| 2. Balance Sheet Data: |
|
|
|
| ||
|
| Total assets | 1,081,703 | 1,103,716 | 1,151,689 | 1,289,491 | |
|
| Total non-current liabilities | 235,954 | 284,374 | 299,657 | 262,935 | |
|
| Total debt (4) | 246,037 | 229,528 | 225,308 | 242,142 | |
|
| Capital stock | 231,020 | 231,020 | 231,020 | 231,020 | |
|
| Equity attributable to equity holders of the parent company | 443,865 | 462,230 | 505,655 | 568,976 | |
|
| Total shareholders' equity | 547,962 | 573,207 | 615,074 | 684,786 | |
| 3. Other Data |
|
|
|
| ||
|
| Sales volume (in millions of liters): |
|
|
|
| |
|
| Beer (Chile) | 516.8 | 507.2 | 514.8 | 538.6 | |
|
| Beer (Argentina) (5) | 363.6 | 391.6 | 414.2 | 434.5 | |
|
| Non-alcoholic beverages (6) | 577.7 | 600.0 | 659.1 | 699.1 | |
|
| Wine (7) | 91.8 | 110.2 | 120.5 | 121.2 | |
|
| Spirits | 21.1 | 19.9 | 21.2 | 22.8 | |
_________ |
|
|
|
| |||
(1) | Except shares outstanding, net earnings per share and per ADS and sales volume. | ||||||
(2) | Per ADS amounts are determined by multiplying per share amounts by 5, as one ADS is equal to 5 shares of Common Stock. | ||||||
(3) | Dividends per share are expressed in Chilean pesos as of payment dates. Dividends per ADS are expressed in U.S. dollars at the conversion rate in effect on the date on which payment is made. | ||||||
(4) | Includes short-term and long-term financial debt (bank loans, bonds and financial leasing). | ||||||
(5) | Excludes sales of cider and spirits in Argentina. | ||||||
(6) | Includes sales of soft drinks, nectars, mineral and purified water, isotonic and energy drinks, and ice tea in Chile. | ||||||
(7) | Includes sales of wine in Chile and Argentina.Excludes bulk wine sales. | ||||||
Exchange Rates.Prior to 1989, Chilean law permitted the purchase and sale of foreign currency only in those cases explicitly authorized by the Central Bank of Chile. The Central Bank Act, which was enacted in 1989, liberalized the rules that govern the ability to buy and sell foreign currency. The Central Bank Act now empowers the Central Bank of Chile to determine that certain purchases and sales of foreign currency specified by law must be carried out in the formal exchange market. The formal exchange market is formed by banks and other entities authorized by the Central Bank. All payments and distributions made to our holders of ADSs must be transacted in the formal exchange market.
In order to keep fluctuations in the average exchange rate within certain limits, the Central Bank of Chile has in the past intervened by buying or selling foreign currency on the formal exchange market. In September 1999, the Central Bank of Chile decided to limit its formal commitment to intervene and decided to exercise it only under extraordinary circumstances, which are to be announced in advance. The Central Bank of Chile also committed itself to provide periodic information about the levels of its international reserves.
On April 10, 2008, the Central Bank of Chile announced a program to buy US$8 billion in the local exchange market between April and December 2008. On March 24, 2009, the Central Bank of Chile published an agreement allowing the sale of dollars. On January 3, 2011, the Central Bank of Chile announced a program to buy US$12 billion starting January 5, 2011 with purchases of up to US$50 million per day.
The observed exchange rate is the average exchange rate at which commercial banks conduct authorized transactions on a given date, as certified by the Central Bank of Chile. The Central Bank of Chile generally carries out its transactions at the spot market rate. Authorized transactions by banks are now generally conducted at the spot market rate.
4
Purchases and sales of foreign exchange effected outside the formal exchange market are carried out in theMercado Cambiario Informal (the informal exchange market). The informal exchange market reflects the supply and demand for foreign currency. There are no limits imposed on the extent to which the rate of exchange in the informal exchange market can fluctuate above or below the observed exchange rate. On March 31, 2012, the average exchange rate in the informal exchange market was CLP487.50 per U.S. dollar and the U.S. dollar observed exchange rate was CLP485.76 per U.S. dollar, which is explained by the current excess of foreign currency.
The following table sets forth the low, high, average and period-end observed exchange rates for U.S. dollars for each of the indicated periods starting in 2007 as reported by the Central Bank of Chile. The Federal Reserve Bank of New York does not report a noon buying rate for Chilean pesos.
| Daily Observed Exchange Rate(1) | |||
| (CLP per USD) | |||
| Low(2) | High (2) | Average(3) | Period-end(4) |
2007 | 493.14 | 548.67 | 522.55 | 496.89 |
2008 | 431.22 | 676.75 | 522.35 | 636.45 |
2009 | 491.09 | 643.87 | 559.15 | 507.10 |
2010 | 468.01 | 549.17 | 510.22 | 468.01 |
2011 | 455.91 | 533.74 | 483.74 | 519.20 |
October 2011 | 490.29 | 533.74 | 510.09 | 490.29 |
November 2011 | 494.08 | 526.83 | 509.73 | 517.37 |
December 2011 | 508.67 | 522.62 | 517.26 | 519.20 |
January 2012 | 485.35 | 518.20 | 499.96 | 488.75 |
February 2012 | 475.29 | 487.73 | 480.89 | 476.27 |
March 2012 | 480.62 | 491.57 | 485.90 | 487.44 |
|
|
|
|
|
_________________________ |
|
| ||
Source: Central Bank of Chile |
|
|
| |
(1)Historical pesos. |
|
|
| |
(2)Rates shown are the actual low and high, on a day-by-day basis for each period. | ||||
(3)The average of monthly average rates during the period reported. | ||||
(4)Published on the first day after month(year) end |
| |||
Capitalization and Indebtedness
Not applicable.
Reasons for the Offer and Use of Proceeds
Not applicable.
Risk Factors
RISKS RELATING TO CHILE
We are substantially dependent on economic conditions in Chile, which may adversely impact our results of operations and financial condition.
We are predominantly engaged in business in Chile and 68.2% of our sales revenues in 2011 were generated from our Chilean operations, 23.8% came from operations in Argentina and 8.0% from exports out of Chile. Thus, our results of operations and financial condition are dependent to a large extent on the overall level of economic activity in Chile. The Chilean economy has experienced an average annual growth of 3.8% between 2007 and 2011, and 6.0% in 2011. In the past, slower economic growth in Chile has slowed down the rate of consumption of our products and adversely affected our profitability. Chile’s recent economic performance was affected in 2009 by the disruption in the global financial markets and in 2010 by an earthquake, and therefore the growth rate of the 2007-2011 period is not necessarily indicative of future performance.
5
Furthermore, Chile, as an emerging market economy, is more exposed to unfavorable conditions in the international markets which can possibly have a negative impact in the demand of our products as well as products of third parties with whom we conduct business. On August 5, 2011, Standard & Poor’s Ratings Group, Inc., or Standard & Poor’s, lowered its long term sovereign credit rating on the United States from AAA to AA+. In addition, significant concerns regarding the sovereign debt of numerous other countries have developed recently and required some of these countries to seek emergency financing. The downgrade of the U.S. credit rating and the ongoing European debt crisis have contributed to the instability in global financial markets. The sovereign debt crisis could adversely impact the financial health of the global banking system and lower consumer confidence, which could impact global financial markets and economic conditions in the United States and throughout the world. As a result, any combination of lower consumer confidence, disrupted global capital markets and/or reduced international economic conditions could have a negative impact on the Chilean economy and consequently on our business. VSPT, one of CCU’s affiliate, in 2011 exported 20.9% of its wine volume to Europe and 18.1% of Net sales were in euro currency. Therefore, the recent economic crisis in Europe may negatively affect our wine exports, which could have an adverse effect on our results.
The relative liquidity and volatility of Chilean securities markets may increase the price volatility of our ADSs and adversely impact a holder’s ability to sell any shares of our common stock withdrawn from our ADR facility.
The Chilean securities markets are substantially smaller, less liquid and more volatile than major securities markets in the United States. For example, the Santiago Stock Exchange, which is Chile’s principal stock exchange, had a market capitalization of approximately US$270.4 billion as of December 31, 2011, while The New York Stock Exchange (“NYSE”) had a market capitalization of approximately US$11.8 trillion and the NASDAQ National Market (“NASDAQ”) had a capitalization of approximately US$3.8 trillion as of the same date. In addition, the Chilean securities markets can be materially affected by developments in other emerging markets, particularly other countries in Latin America.
The lower liquidity and greater volatility of the Chilean markets relative to markets in the United States could increase the price volatility of the ADSs and may impair a holder’s ability to sell in the Chilean market shares of our common stock withdrawn from the ADR facility in the amount and at the price and time the holder wishes to do so. See “Item 9: The Offer and Listing.”
Chilean economic policies, currency fluctuations, exchange controls and currency devaluations may adversely affect the price of our ADSs.
The Chilean government’s economic policies and any future changes in the value of the Chilean peso relative to the U.S. dollar could adversely affect the dollar value of and the return on any investment in our ADSs. The Chilean peso has been subject to large nominal devaluations and appreciations in the past and may be subject to significant fluctuations in the future. For example, in the period from December 31, 2010 to December 31, 2011, the daily average value of the Chilean peso relative to the U.S. dollar increased by 5.2% in nominal terms, whereas the year end value decreased by 10.9% based on the observed exchange rate for U.S. dollars on those dates. See “Item 3: Key Information-Selected Financial Data-Exchange Rates.”
Chilean trading in the shares of our common stock underlying our ADSs is conducted in Chilean pesos. Cash distributions to be received by the depositary for the shares of our common stock underlying our ADSs will be denominated in Chilean pesos. The depositary will translate any Chilean pesos received by it to U.S. dollars at the then-prevailing exchange rate with the purpose of making dividend and other distribution payments for the ADSs. If the value of the Chilean peso declines relative to the U.S. dollar, the value of our ADSs and any distributions to holders of our ADSs received from the depositary may be adversely affected. See “Item 8: Financial Information – Dividend Policy and Dividends.”
6
We are subject to different corporate disclosure requirements and accounting standards than U.S. companies.
Although the securities laws of Chile which govern open stock corporations and publicly listed companies such as us, have as a principal objective promoting disclosure of all material corporate information to thepublic, Chilean disclosure requirements differ from those in the United States in certain important respects. In addition, although Chilean law imposes restrictions on insider trading and price manipulation, the Chilean securities market is not as highly regulated and supervised as the U.S. securities market. We have been subject to the periodic reporting requirements of the Exchange Act since our initial public offering of ADSs in September 1992.
RISKS RELATING TO ARGENTINA
We have significant operations in Argentina and economic conditions there have adversely affected our results of operations and may do so in the future.
In addition to our operations in Chile, we maintain substantial assets in Argentina and derive significant revenue from our operations in Argentina. In 2011, we derived CLP230,418 million, or 23.8%, of our revenues from our Argentinean operations, and, as of December 31, 2011, CLP182,005 million, or 14.2%, of our assets were located in Argentina. Because demand for soft drinks and beverage products usually is correlated to economic conditions prevailing in the local market, which in turn is dependent on the macroeconomic condition of the country, the financial condition and results of operations of our operations in Argentina are, to a considerable extent, dependent upon political and economic conditions prevailing in Argentina. From 1999 through 2002, Argentina suffered a prolonged recession, which culminated in an economic crisis. Although the economic situation in Argentina has improved since the 2002 Argentine financial crisis, we cannot assure you that economic conditions in Argentina will continue improving or that our business will not be materially affected if Argentine economic conditions were to deteriorate. See“Item 5: Operating and Financial Review and Prospects – Trend Information.”
The Argentine peso is subject to volatility which could adversely affect our results.
A devaluation of the Argentine peso may adversely affect our EBIT, as our revenues from our Argentine operations are impacted by the devaluation of the Argentine peso. In spite of the appreciation of the Argentine peso against the U.S. dollar in recent years, we cannot predict when it will be corrected and whether the Argentine economy will continue to recover or will face a recession, or what effect such a recession would have on our operations in Argentina. In 2009, the Company first reported its financial statements under IFRS, using the Argentine peso as the functional currency for our Argentine subsidiaries. They are calculated in said currency and translated into Chilean pesos for consolidation purposes.
Argentina’s legal regime and economy are susceptible to changes that could adversely affect our Argentinean operations.
The measures taken by the Argentine government to address the Argentine economic crisis of 2002, severely affected the Argentine financial system’s stability and have had a materially negative impact on its reputation. For example, On April 16, 2011, the Argentine government announced its intention to expropriate YPF, S.A. (“YPF”), the largest oil and gas company in Argentina, which is controlled by Repsol YPF, S.A., a Spanish integrated oil and gas company. The Argentine government submitted a bill to Congress to approve the expropriation of 51% of YPF’s capital stock. The nationalized capital stock would be distributed as follows: 49% to certain Argentine provinces and the reprincipaling 51% to the national government. Recently, Argentina has been increasing restrictions on foreign exchange transactions. If Argentina were to experience a new fiscal and economic crisis, the Argentine government could implement economic and political measures, which could adversely impact our business. The unpredictability, timing and scope of possible measures enacted by the Argentine government, including expropriations, higher taxes and exchange control measures, could adversely affect our Argentinean operations and our future results of operations.
Since January 2006, the Argentine government has adopted different methods to directly and indirectly regulate the prices of various consumer goods, including bottled beer, in an effort to slow inflation. Additionally, the present measures taken by the Argentine government to control the Trade Balance and the foreign exchange rate, have negatively impacted the free import of goods and the profit repatriation process. For example, a new Argentine procedure in place since 2011 with respect to imports, mandates that a company can import goods only if it can demonstrate a flow of exports to balance trading, mayaffect our Argentine operations as we regularly import raw materials and finished products into Argentina. We cannot assure you that these and other measures enacted by the Argentine government will not have an adverse effect on our Argentine operations.
7
RISKS RELATING TO OUR BUSINESS
Fluctuations in the cost of our raw materials may adversely impact our profitability if we are unable to pass those costs along to our customers.
We purchase malt, rice and hops for beer, sugar for soft drinks, grapes for wine and packaging material from local producers or in the international market. The prices of those commodities have experienced significant fluctuations over time and are determined by the global supply and demand for those commodities as well as other factors, such as fluctuations in exchange rates, over which we have no control.
Although we historically have been able to increase our selling prices in response to increases in raw material costs and thus have not sought to hedge our exposure to increases in raw material prices, we cannot assure you that our ability to recover increases in the cost of raw materials will continue in the future. If we are unable to increase our selling prices in response to increases in raw material costs, any future increases may reduce our margins, if we could not improve efficiencies to offset them.
We are controlled by one majority shareholder, whose interests may differ from those of holders of our ADSs and this shareholder may take actions which adversely affect the value of a holder’s ADSs or common stock.
As of March 31, 2012, Inversiones y Rentas S.A. (“IRSA”) a Chilean closed corporation, directly and indirectly owned 66.1% of our shares of common stock. Accordingly, IRSA has the power to control the election of most members of our board of directors and its interests may differ from those of the holders of our ADSs. IRSA also has a significant influence in determining the outcome of any corporate transaction or other matters submitted to our shareholders for approval, including mergers, consolidations, the sale of all or substantially all of our assets and going-private transactions. In addition, actions by IRSA with respect to the disposition of the shares of common stock that it owns, or the perception that such actions may occur, may adversely affect the trading prices of our ADSs or common stock.
Competition in the Chilean beer market may erode our market share and lower our profitability.
In 2011, our market share of the Chilean beer market by volume was approximately 80.2%. Our largest competitor in the Chilean beer market by volume is Cervecería Chile S.A. (“Cervecería Chile”), a subsidiary of Quilmes Industrial S.A. (“Quilmes”), the largest Argentine brewer and, a subsidiary of Companhia de Bebidas das Américas (“AmBev”) since January 2007. AmBev and Interbrew merged in 2004, creating Inbev N.V./S.A. which merged with Anheuser Busch Cos. Inc. on November 18, 2008, forming Anheuser-Busch InBev (“AB Inbev”). We estimate that Cervecería Chile had a market share by volume in Chile of approximately 14% in 2011. Often, Cervecería Chile has engaged in aggressive price discounting. If Cervecería Chile were to amplify its aggressive price discounting practice in the future, we cannot assure you, given the current environment, that any such discounting or other competitive activities will not have a material adverse impact on our profitability.
Additionally, if business conditions in the beer market continue to be relatively favorable in Chile, more enterprises may attempt to enter the Chilean beer market, either by producing beer locally or through imports. We expect that additional competitors could further erode our market share or lead to price discounting.
8
Our beer brands in Chile may face increased competition from other alcoholic beverages such as wine and spirits, as well as from non-alcoholic beverages such as soft drinks.
Beer consumption in Chile may be influenced by changes in domestic wine, spirits and/or other non-alcoholic beverages’ relative prices. Increases in domestic wine prices have tended to lead to increasesin beer consumption, while reductions in wine prices have tended to reduce or slow the growth of beer consumption. As a result of our lower market share in the Chilean wine, spirits and soft drinks markets as compared to our market share in the Chilean beer market, we expect that our profitability would be adversely affected if beverage consumers were to shift their consumption from beer to either wine, spirits or soft drinks.
Quilmes dominates the beer market in Argentina and we may not be able to maintain our current market share.
In Argentina, we face competition from Quilmes and from Cervecería Argentina S.A. Isenbeck (“CASA Isenbeck”), a former subsidiary of Warsteiner Brauerei Hans Cramer GmbH & Co. (“Warsteiner”), which was acquired by SABMiller plc on November 24, 2010. We estimate that in 2011 Quilmes had a market share of 74% and CASA Isenbeck had a market share of 3%. We estimate that our market share of the Argentine beer market was 22.9% in 2011. As a result of its dominant position in Argentina, Quilmes’ large size enables it to benefit from economies of scale in the production and distribution of beer throughout Argentina. Therefore, we cannot assure you that we will be able to grow or maintain our current market share of the Argentine beer market.
Consolidation in the beer industry may impact our market share.
In January 2007, AmBev assumed control of Quilmes. Additionally, on March 2004, AmBev and Interbrew announced an agreement to merge, creating the world’s largest brewer under the name InBev. Inbev and Anheuser-Busch merged in November 2008, creating AB Inbev, the world’s global beer leader. In Chile, Quilmes sells its beer through Cervecería Chile, which had a market share of approximately 14% in 2011, and in Argentina which had a market share of approximately 74% in 2011. As a consequence of the above referenced merger, the brand Budweiser whose production and distribution license contract was granted to Compañía Cervecerías Unidas Argentina S.A. (“CCU Argentina”) until 2025, belongs to our competitor. Cervecera CCU Chile Ltda. (“CCU Chile”) has a distribution contract until 2015 to distribute Budweiser in Chile. We cannot assure you that the contracts will be renewed.
In 2005, SABMiller plc merged with Grupo Empresarial Bavaria, a Colombian brewer with operations in Colombia, Peru, Ecuador and Panama, forming the then second-largest brewer in the world. In November 2010SABMiller Plc acquired CASA Isenbeck, the third-largest brewer in Argentina.
Consolidation in the beer industry has resulted in larger and more competitive participants, which could change the current market conditions under which we operate.
Restrictions in the gas supply from Argentina have increased our energy costs and higher oil prices have increased our distribution expenses.
Since 2005, the Argentine government has restricted gas exports to Chile due to domestic supply problems This has increased the cost of operating our beer production plants in Chile and Argentina, as well as our soft drinks plants in Chile. Additionally, these restrictions have increased electrical power costs related to these same gas restrictions. Because our boilers can work with gas or with alternative fuels, such as diesel oil or butane gas, we do not need additional investments. The Chilean government is presently implementing a strategy to diversify energy supply. The construction in Quintero of the first plant to process imported GNL (liquefied natural gas), which started its operation in August 2009, brought relief to the energy issue.
Oil price increases may reduce our margins if we are unable to improve efficiencies or increase our prices to offset them.
We depend upon the renewal of certain license agreements to maintain our current operations.
Most of our license agreements include certain conditions that must be met during their term, as well as provisions for their renewal at expiry date. We cannot assure you that such conditions will be fulfilled, and therefore that the agreements will be renewed, expire at end of term or undergo early termination. Termination of, or failure to renew our existing license agreements could have an adverse impact on our operations.
9
Increase in negotiation power of some clients.
In recent years, the Chilean supermarket industry has gone through a consolidation process, increasing the importance and purchasing power of a few supermarket chains. As a result, we may not be able to obtain favorable prices, which may adversely affect our sales and profitability. The importance of supermarkets is disclosed in each one of our business segments.
Dependence on a single supplier for some important raw materials.
In the case of glass bottles, both in Chile and Argentina, we purchase most of our bottles from a single local supplier. If we experience disruption with this or other suppliers, we will need to use suppliers outside each country. We cannot assure you that in such a case we will be able to obtain favorable prices or advantageous terms, which may adversely affect us.
Water supply is essential to the development of our businesses.
Water is an essential component for beer, soft drinks and mineral water. While we have adopted policies for the responsible and sustainable use of water, a failure in our water supply could negatively affect our sales and profitability.
The supply, production and logistics chain is key to the timely supply of our products to consumer centers.
Our supply, production and logistics chain is crucial for the delivery of our products to consumer centers. An interruption or a significant failure in this chain may negatively affect the Company’s results, if the failure is not quickly resolved. An interruption could be caused by various factors, such as strikes, riots or other factors which are beyond our control.
If we are unable to protect our information systems against data corruption, cyber-based attacks or network security breaches, our operations could be disrupted.
We are increasingly dependent on information technology networks and systems, including the Internet, to process, transmit and store electronic information. In particular, we depend on our information technology infrastructure for digital marketing activities and electronic communications among the Company and our clients, suppliers and also among our subsidiaries. Security breaches of this infrastructure can create system disruptions, shutdowns or unauthorized disclosure of confidential information. If we are unable to prevent such breaches, our operations could be disrupted, or we may suffer financial damage or loss because of lost or misappropriated information.
Possible restrictions on the sale and promotion of alcoholic beverages and other food products in Chile could adversely affect us.
Senators and congressmen from different political parties have submitted to the Chilean congress proposed bills to restrict the consumption, sale and promotion of alcoholic beverages. The principal modifications proposed in these bills are the incorporation of warnings on product labels of the possible dangers of excessive alcohol consumption on human health, similar to those required in the United States, restrictions on television advertising and a prohibition of alcoholic beverages at sports, cultural or related events.
On March 15, 2012 law 20,580 was enacted by the Chilean congress. This law amended the limit for blood alcohol content while driving reducing the limit from less than 0.5 gr/lt to less than 0.3 gr/lt., which is likely to negatively affect the consumption of alcoholic beverages and consequently our business.
If further proposed bills are passed, or other regulations restricting the sale of non-alcoholic beverages or sweet snacks are enacted, this could affect consumption of our products and, as a consequence, negatively impact our business.
10
Our production activities depend on our ability to comply with environmental regulations, which may become more stringent in the future and negatively affect our profitability.
The regulation of matters relating to the protection of the environment is not as well developed in Chile and Argentina as in the United States and certain other countries. Accordingly, we anticipate that additional laws and regulations will be enacted over time in these countries with respect to environmental matters. If public authorities issue new and stricter standards, or enforce or interpret existing laws and regulations in a more restrictive manner, we may be forced to make expenditures to comply with such new rules, which could result in higher overall production costs and negatively affect our profitability.
Our businesses are taxed with different duties, particularly with excise taxes on the consumption of alcoholic and non-alcoholic beverages.
The Argentine excise tax is 8.7% for beer and in Chile the excise taxes are 15% for beer and wine, 27% for spirits, and 13% for non-alcoholic beverages. An increase in the rate of these or any other tax could negatively affect our sales and profitability.
Chilean peso fluctuations may affect our profitability.
Because we purchase some of our supplies at prices set in U.S. dollars, and export wine in U.S. dollars, euros and pounds, we are exposed to foreign exchange risks that may adversely affect our financial condition and results of operations. Therefore, any future changes in the value of the Chilean peso against said currencies would affect the revenues of our wine export business, as well as the cost of several of our raw materials, especially in the beer and soft drink businesses where raw materials are purchased in U.S. dollars. The effect of the exchange rate variation on export revenues would have an inverse effect on the cost of raw materials expressed in Chilean peso terms.
Increases in commodity prices may affect our profitability.
A significant part of our raw materials are commodities whose prices are subject to volatility caused by market fluctuations. These price fluctuations may not keep pace with the market conditions in which we operate, thus we may have limited capacity to raise prices to offset increases in costs. If we are unable to increase prices to offset costs increases, our profitability may be adversely affected.
Catastrophic events in the markets in which we operate could have a material adverse effect on our financial condition.
Natural disasters, climate changes, terrorism, pandemic, strikes or other catastrophic events could impair our ability to manufacture, distribute or sell our products. Failure to take adequate steps to mitigate the likelihood or potential impact of such events, or to manage such events effectively if they occur, could adversely affect our sales volume, cost of raw materials, earnings and financial results. For example, on February 27, 2010, an 8.8 magnitude earthquake struck central Chile, followed by a subsequent tsunami. The earthquake epicenter was located 200 miles southwest of Santiago and 70 miles north of Concepción, Chile’s second largest city. A future earthquake, tsunami or other natural disaster could have a significant effect on our business, results of operations and financial condition. See “Item 5: Operating and Financial Review and Prospects—Overview—Impact of the February 27, 2010 Earthquake and Tsunami.”
If we are unable to maintain the image and quality of our products our financial results may suffer.
The image and quality of our products is essential for the success and growth of the Company. Problems with product quality could tarnish the reputation of our products and may adversely affect the Company’s revenues.
11
If we are unable to finance our operations we may be adversely affected.
A global liquidity crisis may eventually limit our ability to obtain the cash needed to fulfill our commitments. Sales could also be affected by a global disruption if consumption decreases sharply, placing stress on the Company’s cash position.
RISKS RELATING TO OUR ADSs
The price of our ADSs and the U.S. dollar value of any dividends will be affected by fluctuations in exchange conditions.
Our ADSs trade in U.S. dollars. Fluctuations in the exchange rate between Chilean and Argentine currencies and the U.S. dollar are likely to affect the market price of our ADSs. For example, since our financial statements are reported in Chilean pesos, a decline in the value of the Chilean peso against the dollar would reduce our earnings as reported in U.S. dollars. Any dividend we may pay in the future would be denominated in Chilean pesos. A decline in the value of the Chilean peso against the U.S. dollar would reduce the U.S. dollar equivalent of any such dividend. Additionally, in the event of a dividend or other distribution, if exchange rates fluctuate during any period of time when the ADS depositary cannot convert a foreign currency into dollars, a holder of our ADSs may lose some of the value of the distribution. Also, since dividends in Chile are subject to withholding taxes, which we retain until the following year when the exact amount to be paid is determined, if part of the retained amount is refunded to the shareholders, the amount received by holders of our ADSs would be subject to exchange rate fluctuations between the two dates.
A holder of ADSs may be subject to certain risks due to the fact that holders of our ADSs do not hold shares of our common stock directly.
In order to vote at shareholders’ meetings, if a holder is not registered on the books of the ADS depositary, the holder of our ADSs is required to transfer its ADSs for a certain number of days before a shareholders’ meeting into a blocked account established for that purpose by the ADS depositary. Any ADS transferred to this blocked account will not be available for transfer during that time. If a holder of our ADSs is registered on the books of the ADS depositary, it must give instructions to the ADS depositary not to transfer its ADSs during this period before the shareholders’ meeting. A holder of our ADSs must therefore receive voting materials from the ADS depositary sufficiently in advance in order to make these transfers or give these instructions. There can be no guarantee that a holder of our ADSs will receive voting materials in time to instruct the ADS depositary how to vote. It is possible that a holder of our ADSs will not have the opportunity to exercise a right to vote at all. Additionally, a holder of our ADSs may not receive copies of all reports from us or the ADS depositary. A holder of our ADSs may have to go to the ADS depositary’s offices to inspect any reports issued.
Controls on foreign investment and repatriation of investments in Chile may adversely impact a holder of our ADSs ability to obtain and dispose of the shares of our common stock underlying its ADRs.
Equity investments in Chile by persons who are not Chilean residents are generally subject to exchange control regulations that restrict the repatriation of investments and earnings from Chile. Our ADSs are subject to an ADR foreign investment contract among us, the depositary and the Central Bank of Chile which is intended to grant holders of our ADSs and the depositary access to Chile’s formal exchange market. See “Item 3: Key Information-Selected Financial Data-Exchange Rates.” Pursuant to current Chilean law, our ADR foreign investment contract may not be amended unilaterally by the Central Bank of Chile. However, we cannot assure you that additional Chilean restrictions applicable to holders of our ADSs, the disposition of underlying shares of our common stock or the repatriation of the proceeds from the disposition of the underlying common stock could not be imposed in the future, nor can we assess the duration or impact of the restrictions if imposed. If for any reason, including changes to our ADR foreign investment contract or Chilean law, the depositary is unable to convert Chilean pesos to U.S. dollars, investors would receive dividends or other distributions in Chilean pesos. Transferees of shares of our common stock withdrawn from the ADR facility will not be entitled to access the formal exchange marketunless the withdrawn shares are redeposited with the depositary. See “Item 10: Additional Information – Exchange Controls in Chile.”
12
A holder of our ADSs has the right to force us to purchase its underlying shares of our common stock pursuant to Chilean corporate law upon the occurrence of certain events may be limited.
In accordance with Chilean laws and regulations, any shareholder that votes against certain corporate actions or does not attend the meeting at which certain corporate actions are approved and communicates to the corporation its dissent in writing within the term established by law, may exercise a withdrawal right, tender its shares to the company and receive cash compensation for its shares, provided that the shareholder exercises its rights within the prescribed time periods. See “Item 10: Additional Information – Memorandum and Articles of Association – Rights, preferences and restrictions regarding shares.” In our case, the actions triggering a right of withdrawal include the approval of:
· our transformation into a different type of legal entity;
· our merger with and/or into another company;
· the transfer of 50% or more of our corporate assets, whether or not liabilities are also transferred, to be determined according to the balance sheet of the previous fiscal year or the proposal or amendment of any business plan that contemplates the transfer of assets exceeding said percentage; the disposition of 50% or more of the corporate assets of a subsidiary, which represents at least 20% of the assets of the corporation, as well as any disposition of shares which results in the parent company losing its status as controller;
· the granting of real or personal guarantees to secure third-party obligations exceeding 50% of the corporate assets except when the third party is a subsidiary of the company (in which case approval of the board of directors will suffice);
· the creation of preferences for a series of shares or the increase, extension or reduction in the already existing ones. In this case, only dissenting shareholders of the affected series shall have the right to withdraw;
· curing certain formal defects in our charter which otherwise would render it null and void or any modification of our by-laws that grant this right; and
· other cases provided for by statute or in our bylaws, if any.
In addition, shareholders may withdraw if a person becomes the owner of two-thirds or more of the outstanding shares of the corporation as a consequence of a share acquisition and such person does not make a tender offer for the remaining shares within 30 days from the date of such acquisition.
Minority shareholders are also granted the right to withdraw when the controller acquires more than 95% of the shares of an open stock corporation.
Our bylaws do not provide for additional circumstances under which shareholders may withdraw.
Because of the absence of legal precedent as to whether a shareholder that has voted both for and against a proposal, such as the depositary of our ADSs, may exercise withdrawal rights with respect to those shares voted against the proposal, there is doubt as to whether a holder of ADSs will be able to exercise withdrawal rights either directly or through the depositary for the shares of our common stock represented by its ADSs. Accordingly, for a holder of our ADSs to exercise its appraisal rights, it may be required to surrender its ADRs, withdraw the shares of our common stock represented by its ADSs, and vote the shares against the proposal.
13
Preemptive rights to purchase additional shares of our common stock may be unavailable to holders of our ADSs in certain circumstances and, as a result, their ownership interest in us may be diluted.
TheLey sobre Sociedades Anónimas N° 18,046 and theReglamento de Sociedades Anónimas, which we refer to in this document collectively as the “Chilean Corporations Act”, requires us, whenever we issue new shares for cash, to grant preemptive rights to all holders of shares of our common stock, including shares of our common stock represented by ADSs, giving those holders the right to purchase a sufficient
number of shares to maintain their existing ownership percentage. We may not be able to offer shares to holders of our ADSs pursuant to preemptive rights granted to our shareholders in connection with any future issuance of shares unless a registration statement under the Securities Act is effective with respect to those rights and shares, or an exemption from the registration requirements of the Securities Act is available.
We intend to evaluate at the time of any future offerings of shares of our common stock the costs and potential liabilities associated with any registration statement as well as the indirect benefits to us of enabling U.S. owners of our ADSs to exercise preemptive rights and any other factors that we consider appropriate at the time, and then make a decision as to whether to file such a registration statement. We cannot assure you that any registration statement would be filed.
To the extent a holder of our ADSs is unable to exercise its preemptive rights because a registration statement has not been filed, the depositary will attempt to sell the holder’s preemptive rights and distribute the net proceeds of the sale, net of the depositary’s fees and expenses, to the holder, provided that a secondary market for those rights exists and a premium can be recognized over the cost of the sale. A secondary market for the sale of preemptive rights can be expected to develop if the subscription price of the shares of our common stock upon exercise of the rights is below the prevailing market price of the shares of our common stock. Nonetheless, we cannot assure you that a secondary market in preemptive rights will develop in connection with any future issuance of shares of our common stock or that if a market develops, a premium can be recognized on their sale. Amounts received in exchange for the sale or assignment of preemptive rights relating to shares of our common stock will be taxable in Chile and the United States. See “Item 10: Additional Information – Taxation – Chilean Tax Considerations – Capital Gains” and “– United States Tax Considerations – Capital Gains.” If the rights cannot be sold, they will expire and a holder of our ADSs will not realize any value from the grant of the preemptive rights. In either case, equity interest in us will be diluted proportionately.
14
ITEM 4: Information on the Company
History and Development of the Company
Our current legal and commercial name is Compañía Cervecerías Unidas S.A.. We were incorporated in the Republic of Chile in 1902 as an open stock corporation, following the merger of two existing breweries, one of which traces its origins back to 1850, when Mr. Joaquín Plagemann founded one of the first breweries in Chile in the port of Valparaíso. By 1916, we owned and operated the largest brewing facilities in Chile. Our operations have also included the production and marketing of soft drinks since the beginning of the last century, the bottling and selling of mineral water products since 1960, the production and marketing of wine since 1994, the production and marketing of beer in Argentina since 1995, the production and marketing of pisco since 2003, the production and marketing of sweet snacks products since 2004 and the production and marketing of rum since 2007.
We are subject to a full range of governmental regulation and supervision generally applicable to companies engaged in business in Chile and Argentina. These regulations include labor laws, social security laws, public health, consumer protection and environmental laws, securities laws, and anti-trust laws. In addition, regulations exist to ensure healthy and safe conditions in facilities for the production and distribution of beverages and sweet snacks products.
Our principal executive offices are located at Vitacura 2670, Santiago, Chile. Our telephone number in Santiago is (56-2) 427-3000, our fax number is (56-2) 427-3333 and our website is www.ccu.cl. Our authorized representative in the United States is Puglisi & Associates, located at 850 Library Avenue, Suite 204, Newark, Delaware 19715, USA, telephone number (302) 738-6680 and fax number (302) 738-7210.
In 1986, IRSA, our current principal shareholder, acquired its controlling interest in us through purchases of common stock at an auction conducted by a receiver who had assumed control of us following the economic crisis in Chile in the early 80’s, which resulted in our inability to meet our obligations to our creditors. IRSA, at that time, was a joint venture between Quiñenco S.A. (“Quiñenco”) and the Schörghuber Group from Germany through its wholly owed subsidiary Finance Holding International B.V. (“FHI”) of the Netherlands.
To our knowledge, none of our common stock is currently owned by governmental entities. Our common stock is listed and traded on the principal Chilean stock exchanges. See “Item 7: Major Shareholders and Related Party Transactions.”
In September 1992, we issued 4,520,582 ADSs, each representing five shares of our common stock, in an international American Depositary Receipt (“ADR”) offering. The underlying ADSs were listed and traded on the NASDAQ, until March 25, 1999. Since that date, the ADSs have been listed and traded on the NYSE.
In 1994, we diversified our operations both in the domestic and international markets. In that year, we purchased a 48.4% interest in the Chilean wine producer Viña San Pedro S.A. (“VSP”, today, “VSPT”). Since December 31, 2008, that interest amounts to 50.0%. In November 1994, we and Buenos Aires Embotelladora S.A. (“BAESA”), (the PepsiCo bottler in Chile at that time) merged to create Embotelladoras Chilenas Unidas S.A. (“ECUSA”), for the production, bottling, distribution and marketing of soft drinks and mineral water products in Chile. In November 1999, we purchased BAESA’s interest in ECUSA and thereafter have controlled 100% of that company.
Through CCU Argentina, we began our expansion into Argentina by acquiring an interest in two Argentine breweries: 62.7% of the outstanding shares of Compañía Industrial Cervecera S.A. (“CICSA”), was acquired during January and February 1995 and 98.8% of the outstanding shares of Cervecería Santa Fe S.A. (“CSF”), was acquired in September 1995. In 1997, CCU Argentina increased its interest in CICSA to 97.2% and in CSF to 99.9% through the purchase of minority interests. In January 1998, we decided to merge these two breweries into one company operating under the name of CICSA. Following the merger, CCU Argentina’s interest in CICSA was 99.2%. In April 1998, CCU Argentina completed the purchase of the brands and assets of Cervecería Córdoba for US$8 million. After subsequent capital increases, the last one in June 2008, our interest in CCU Argentina reached 95.9%, with Anheuser-Busch Incorporated’s (“Anheuser-Busch”) interest at 4.1%.
15
In addition to our acquisitions in Argentina, we signed a license agreement with Anheuser-Busch in 1995 granting us the exclusive right to produce, market, sell and distribute the Budweiser beer brand in Argentina. In 2008 the license agreement was extended until December 31, 2025.
After a capital increase approved by our shareholders in October 1996, we raised approximately US$196 million between December 1996 and April 1999. Part of this capital expansion was accomplished between December 1996 and January 1997 through our second ADR offering in the international markets.
During 2000, VSPT, through its subsidiary Finca La Celia S.A. (“FLC”), acquired the winery Finca La Celia in Mendoza, Argentina, initiating its international expansion, allowing VSPT to include fine quality Argentine wines into its export product portfolio.
To increase our presence in the premium beer segment, we acquired in November 2000 a 50% stake in Cervecería Austral S.A., located in the city of Punta Arenas, with an annual production capacity of 6.1 million liters. Further, in May 2002, we acquired a 50% stake in Compañía Cervecera Kunstmann S.A., located in the city of Valdivia.
In February 2003, we began the sale of a new product for our beverage portfolio, pisco, under the brand Ruta Norte. Pisco is a grape spirit very popular in Chile that is produced in the northern part of the country and the southern part of Peru. Our pisco, at that time, was only produced in the Elqui Valley in Region IV of Chile and it was sold throughout the country by our beer division sales force. In March 2005, we entered into an association with the second-largest pisco producer at that time, Cooperativa Agrícola Control Pisquero de Elqui y Limarí Ltda. (“Control”). This new joint venture was named Compañía Pisquera de Chile S.A. (“CPCh”), to which the companies contributed principally with assets, commercial brands and – in the case of Control – also some financial liabilities. Currently we own 80% of CPCh and Control owns the remaining 20%.
On April 17, 2003, the Schörghuber Group, at the time an indirect owner of 30.8% of our ownership interest, gave Quiñenco, also at the time an indirect owner of 30.8% of our ownership interest, formal notice of its intent to sell 100% of its interest in FHI to Heineken Americas B.V., a subsidiary of Heineken International B.V. As a result of the sale, Quiñenco and Heineken Americas B.V., the latter through FHI, became the only two shareholders of IRSA, the owner of 61.6% of our equity at that time, each with a 50% interest in IRSA. Heineken International B.V. and FHI subsequently formed Heineken Chile Ltda., to hold the latter’s 50% interest in IRSA. Therefore, Quiñenco and Heineken Chile Ltda. are the only two current shareholders of IRSA, with a 50% equity each. On December 30, 2003, FHI merged into Heineken Americas B.V., which together with Heineken International B.V. remained as the only shareholders of Heineken Chile Ltda. At present IRSA owns, directly and indirectly, 66.11% of our equity.
In August 2003, VSPT formed Viña Tabalí S.A., a joint venture in equal parts with Sociedad Agrícola y Ganadera Río Negro Ltda., for the production of premium wines. This winery is located in the Limarí Valley, Chile’s northernmost winemaking region, which is noted for the production of outstanding wines. In January 2007, Viña Tabalí S.A. bought the assets of Viña Leyda, located in the Leyda Valley, a new winemaking region south of Casablanca Valley and close to the Pacific Ocean. Viña Leyda produces excellent wines that have won awards in different international contests. After this acquisition, Viña Tabalí S.A. changed its name to Viña Valles de Chile S.A.
In January 2004, we entered the sweet snacks business by means of a joint venture between our subsidiary ECUSA and Industria Nacional de Alimentos S.A, a subsidiary of Quiñenco, with a 50% interest each in Calaf S.A. (which has been renamed Foods Compañía de Alimentos S.A., or “Foods”), a corporation that acquired the trademarks, assets and know-how, among other things, of Calaf S.A.I.C. and Francisca Calaf S.A., traditional Chilean candy makers, renowned for more than a century.
In December 2006, we signed a joint venture agreement with Watt’s S.A. (“Watt’s”), a local fruit related company, under which we participate in equal parts in Promarca S.A. (“Promarca”). This new company owns the brands “Watt’s” “Ice Frut de Watt’s” “Yogu Yogu” and “Shake a Shake” in Chile. Promarca granted its subsidiaries, for an indefinite period, the exclusive licenses for the production and sale of the different product categories. Therefore, we now participate in new product categories such as 100% fruit juices and fruit, soy and dairy based beverages.
16
In May 2007, CPCh entered the rum market with our proprietary brand Sierra Morena and later, in 2008, added new rum brand extensions and introduced various pisco based cocktails. Its most successful one, Campanario Mango Sour, is now sold in some states in the U.S. market through Wal-mart stores under the name of “Carillon Mango.”
In December 2007, we entered into an agreement with Nestlé Chile S.A. and Nestlé Waters Chile S.A., the latter of which acquired a 20% interest in our subsidiary Aguas CCU-Nestlé Chile S.A. (“Aguas CCU”), the company through which we develop our bottled water business in Chile. As part of this new association, Aguas CCU introduced in 2008 the Nestlé Pure Life brand in Chile. Nestlé had a call option to increase its ownership in Aguas CCU by an additional 29.9%, which expired on June 5, 2009. On June 4, 2009 ECUSA received the notification from Nestlé Waters Chile S.A. exercising its irrevocable option to buy 29.9% of Aguas CCU equity, within the scope of the association contract. The completion of the deal represented a profit before taxes for ECUSA of CLP24,439 million. On September 30, 2009 in extraordinary shareholders’ meetings, Aguas CCU and Nestlé Waters Chile S.A. (“Waters Chile”) approved the merger of Waters Chile and Aguas CCU. The present shareholders of Aguas CCU are ECUSA (50.10%), Nestlé Chile S.A. (49.401%) and Comercializadora de Productos Nestlé S.A. (0.499%).
In April 2008, we bought the Argentine brewer ICSA after receiving the approval of the Argentine antitrust authorities. ICSA owns, among other assets, the Bieckert, Palermo and Imperial beer brands, which together represented approximately 5.8% of the Argentine beer market, and a brewery in Luján, Buenos Aires, with a nominal production capacity of 270 million liters per year.
In August 2008, Foods bought 50% of Alimentos Nutrabien S.A., a company specializing in muffins and other high quality home-made products. The Nutrabien brand complements our sweet snacks portfolio which includes the Calaf and Natur brands, the latter acquired in 2007. Moreover, with this acquisition we expanded the sweet snacks business from the traditional candy category to the nutritional cereal bars, cookies and muffins categories.
In November 2008, CCU and its affiliate VSP entered into a Merger Agreement with Compañía Chilena de Fósforos and its subsidiaries Terciados y Elaboración de Maderas S.A. and Viña Tarapacá S.A. (“VT”), in order to merge VT into VSP. Under the terms of the Merger Agreement, and prior to its execution, CCU had to acquire 25% of VT’s equity. Once all the legal requirements were fulfilled, the merger by absorption of VT by VSP was completed on December 9, 2008, with an effective date for accounting purposes of October 1, 2008. The affiliate was renamed Viña San pedro Tarapacá S.A. (“VSPT”).
In December 2010, our subsidiary Invex CCU Ltda. acquired a 4.04% equity interest in CCU Argentina from Anheuser-Busch Investment S.L. As a result, CCU became the sole equity holder of CCU Argentina. This transaction had no effect on the Budweiser brand production and distribution contract which expires in 2025 (in 2015 for the distribution of the brand in Chile).
In December 2010, CCU and CICSA entered into the cider business by acquiring, directly and indirectly, controlling interests in Sáenz Briones S.A. and Sidra La Victoria S.A., two Argentinian companies engaged in the cider business.
In December 2011 the joint venture Viña Valles de Chile S.A. (“VDC”) was split and the Viña Leyda assets remained in VDC. After a shares swap VDC became a 100% directly and indirectly controlled subsidiary of VSPT.
In December 2011 the subsuidiary Compañía Pisquera de Chile S.A. (“CPCh”) signed a licence agreement for the commercialization and distribution in Chile of the pisco brand Bauzá. In addition, CPCh acquired 49% of the licensor company Compañía Pisquera Bauzá S.A., owner of the brand in Chile.
17
CAPITAL EXPENDITURES
The capital expenditures figures for the last three years shown below reconcile to the Cash Flow as shown in the Consolidated Statements of Cash Flows.
Our capital expenditures for the last three years were CLP57,892 million, CLP64,396 million and CLP77,847 million, respectively, totaling CLP200,135 million, of which CLP74,989million were invested in our beer operations in Chile, CLP32,044 million in our Argentine beer operations, CLP41,573 million in our non-alcoholic beverages operations, CLP16,127 million in our wine operations, CLP3,152 million in our spiritsoperations and CLP32,249in other investments, mostly in warehouses and bottle molds, during the years mentioned above.
In recent years, our capital expenditures have been made primarily for the expansion of our production and bottling capacities, distribution chain enhancement, additional returnable bottles and crates, marketing assets (primarily coolers), environmental improvements and updating our management information systems, among others.
During 2009, capital expenditures in our Chile beer division were focused principally on capacity expansion, new packaging and cranes, improvements and new equipment acquisitions and marketing assets. In Argentina, our capital expenditures were primarily for marketing assets, new packaging and new equipment. Capital expenditures were incurred in our non-alcoholic beverage division mainly for new packaging, marketing assets and new equipment mostly dedicated to the water business. Regarding our wine operations, the merger with Viña Tarapacá in late 2008 required several equipment optimizations; capacity improvement, new technology on irrigation, new land and new barrels were the principal expenses. In our spirit business, the completion of the facility in Ovalle, Chile as well as environmental improvements and the equipment for the Mistral Ice Blend new category (flavored alcohol beverage) were the most relevant investments.
In 2010, a third of our capital expenditures were focused on our Chile beer division’s machinery and equipment in order to further increase its production capacity and to enhance the filtering and bottling proceses. In total, including packaging and marketing investments, approximately 45% of capital expenditures were focused on our Chile beer division. Significant amounts of our capital expenditures were also incurred in the non-alcoholic beverage division, representing approximately 24% of the total capital expenditures, principally focused on equipment, packaging and marketing assets. These investments were required to address the [sales] volume increase experienced in 2010. For the same reason, important investments were made in our Argentina beer division’s bottling and packaging, marketing assets and equipment.
During 2011 we dedicated 30% of our capital expenditure to the Chile beer division, with a significant amount invested in environmental enhancement in addition to the necessary investments in packaging and machinery and equipment. Packaging was also the principal item in which CCU invested in the Beer Argentina and Non alcoholic beverage divisions after dedicating the necessary resources to principaltain and increase the production capacity. The resources dedicated to enlarge our warehouses network amounted 10% of the total 2011 capital expenditure.
Our principal capital expenditures for the period 2009-2011 are displayed in the following table. See “Item 5: Operating and Financial Review and Prospects-Liquidity and Capital Resources- Capital Expenditures Commitments” for the period 2012-2015.
18
|
|
|
|
|
Business Unit | 2009 | 2010 | 2011 | |
(CLP million) | (CLP million) | (CLP million) | ||
Beer Chile | Machinery and equipment | 13,165 | 19,451 | 9,795 |
| Packaging | 6,888 | 5,517 | 4,265 |
| Marketing assets | 1,254 | 3,035 | 1,879 |
| Others | 1,247 | 927 | 7566 |
| Total | 22,554 | 28,930 | 23,505 |
|
|
|
|
|
Beer Argentina | Machinery and equipment | 2,023 | 3,408 | 3,247 |
| Packaging | 2,823 | 3,943 | 5,739 |
| Marketing assets | 569 | 1,066 | 1,619 |
| Others | 3,152 | 1,066 | 3,389 |
| Total | 8,567 | 9,483 | 13,994 |
|
|
|
|
|
Non-alcoholic | Machinery and equipment | 3,380 | 5,988 | 4,259 |
beverages(1) | Packaging | 4,694 | 4,732 | 5,929 |
| Marketing assets | 3,052 | 4,402 | 3,440 |
| Others | 341 | 225 | 1131 |
| Total | 11,467 | 15,347 | 14,759 |
|
|
|
|
|
Wine | Machinery and equipment | 1,126 | 1,192 | 3,666 |
| Facility improvement | 430 | 315 | 2824 |
| Packaging(2) | 1,405 | 1,542 | 1,088 |
| Others | 742 | 1,067 | 731 |
| Total | 3,703 | 4,115 | 8,309 |
|
|
|
|
|
Spirits | Machinery and equipment | 612 | 178 | 415 |
| Facility de-novo/improvement | 579 | 174 |
|
| Others | 103 | 476 | 615 |
| Total | 1,294 | 828 | 1030 |
|
|
|
|
|
Other | Casona project | - | - | 40 |
| Warehouses | 4,541 | 2,711 | 7,882 |
| Injection and blow molds | 3,382 | 2,982 | 5,742 |
| Other | 2,384 | - | 2586 |
| Total | 10,307 | 5,693 | 16,250 |
Total |
| 57,892 | 64,396 | 77,847 |
(1) Soft drinks, nectars, mineral water, purified water, sports beverages and tea |
| |||
(2) Barrels |
|
|
| |
Business Overview
Summary
We are mainly a diversified beverage company operating principally in Chile and Argentina. We are the largest brewing group in Chile, the second-largest brewing group in Argentina, the second-largest soft drink producer in Chile (after the largest Coca-Cola bottler in Chile), the largest mineral water and bottled nectar producers in Chile, the second-largest wine producer in Chile, the second-largest wine exporter and the largest pisco producer in Chile. We also participate in the purified water, rum and sweet snacks industries in Chile. Our beer and soft drink products include a wide range of proprietary, licensed and imported brands.
19
In 2011, we had consolidated net sales of CLP969,551 million broken down by segment as per the following schedule:
|
|
|
|
|
|
|
Net Sales breakdown | ||||||
|
|
|
|
|
|
|
| 2009 | 2010 | 2011 | |||
| (in CLP million) |
| (in CLP million) |
| (in CLP million) |
|
Beer Chile | 278,170 | 35.8% | 287,981 | 34.4% | 313,017 | 32.3% |
Beer Argentina | 137,296 | 17.7% | 156,363 | 18.7% | 198,181 | 20.4% |
Non-Alcoholic | 201,512 | 25.9% | 223,476 | 26.7% | 248,509 | 25.6% |
Wine | 124,726 | 16.1% | 132,293 | 15.8% | 138,348 | 14.3% |
Spirits | 38,830 | 5.0% | 43,218 | 5.2% | 50,936 | 5.3% |
Other/Eliminations | -3,988 | -0.5% | -5,072 | -0.6% | 20,560 | 2.1% |
Total | 776,544 | 100.0% | 838,258 | 100.0% | 969,551 | 100.0% |
Beer. We estimate that our share of the Chilean beer market by volume was approximately 85% in 2009, 83% in 2010 and 80% in 2011. Our line of beers in Chile includes a full range of super-premium, premium, medium-priced and popular-priced brands of alcoholic and non-alcoholic beer, which are primarily marketed under nine different proprietary brands and four licensed brands. Our flagship brand, Cristal, is Chile’s best selling beer, accounting for an estimated 44.9% of our 2011 beer sales by volume in Chile. We are the only brewery in Chile with a nationwide production and distribution network. In addition, we are the exclusive producer and distributor in Chile of Heineken beer, the exclusive distributor in Chile of imported Budweiser beer and the exclusive local producer and importer of Paulaner beer. We also distribute and produce, under license, Austral beer.
We entered the Argentine beer market in 1995 by acquiring two breweries and their brands, CICSA and CSF. Additionally, in 1998, we bought the brands and assets of Cervecería Córdoba. Under a joint venture agreement entered into with Anheuser-Busch in 1995, we began importing, selling and distributing Budweiser beer in Argentina in March 1996. We began production and distribution of locally produced Budweiser beer in Argentina in December 1996. In April 2008, we bought ICSA and as a result added to our portfolio the brands Palermo, Bieckert and Imperial. In addition, we are the exclusive producer and distributor in Argentina of Heineken beer and the exclusive distributor in Argentina of imported Corona, Kunstmann, Negra Modelo, Birra Moretti, Paulaner and Guinness beer brands. We estimate that our market share by volume of the Argentine beer market was approximately 22% in 2009, 23% in 2010, and 23% in 2011.
Non-alcoholic beverages. We produce and sell carbonated soft drinks, mineral water, purified water, nectars and juices, sports and energy drinks and tea products in Chile, including our proprietary brands and brands produced under license from PepsiCo, Schweppes Holdings Ltd., Promarca and Nestlé Chile S.A. The most relevant beverages in this segment are soft drinks: carbonated beverages (both cola and non-cola) and non carbonated beverages, mostly fruit juices in different degrees of concentration. We also produce various types of water products including mineral water (both, sparkling and still) and purified water. We estimate that our Chilean carbonated soft drinks market share by volume (which does not include nectars, tea, sports and energy drinks) was approximately 20% in 2009 and 21% in 2010 and 21% in 2011, and that our mineral water market share by volume, including HOD, was 62% in the three years.
20
Wine. We entered the Chilean wine industry in 1994 with the acquisition of a 48.4% interest in VSP (today VSPT), Chile’s third-largest player in the domestic market and second-largest wine exporter. After making subsequent investments and pursuant to the merger of VSP and VT, resulting in VSPT, our affiliate CCU Inversiones S.A. currently has a 50.01% interest in VSPT. VSPT is composed of nine different wineries in Chile and one in Argentina. During 2011 VSPT initiated the process of merging Bodega Tamari into Finca La Celia, both vineyards located in Mendoza, Argentina. The merger is in its final stage. In addition, in December 2011, Viña Valles de Chile, a former non-consolidating subsidiary, was split and VSPT remained 100% owner of the resulting new vineyard of the same name. Therefore, we began consolidating the resultsIn Argentina we have the capacity to reach 151,395 points of sales. Our sales and distribution network for our beer products consists of seven owned or leased warehouses, a direct sales force and 14 logistics of Viña Valles de Chile in December 2011. The wine group produces and markets a full range of wine products for both the domestic and export markets. We believe that in 2011, VSPT’s sales by volume amounted to approximately 25% of total measured domestic industry sales by volume and 12% of Chile’s total wine export sales by volume, excluding bulk wine, according to our estimates and those of the Wineries of Chile Association. VSPT’s principal vineyards are located in all principal viticulture Chilean valleys, including Maipo, Curicó, Casablanca, Leyda, Colchagua, Elqui, Cachapoal and Maule valleys. VSPT’s domestic wine products are distributed through our nationwide distribution system with dedicated sales forces in the major cities and its export products are sold in over 90 different countries through distribution agents.
Spirits. In February 2003, we began the sale of pisco, under the brand Ruta Norte. Pisco is a distilled wine spirit produced in the northern regions of Chile and the southern regions of Peru. In March 2005, we entered into an association with the second-largest pisco producer in Chile creating a new entity (CPCh) to which both companies contributed principally with assets and commercial brands. Currently we own 80% of CPCh. According to Nielsen numbers, CPCh in 2011 had 46.5% market share of the Chilean pisco industry. In May 2007, CPCh entered the rum category with the brand Sierra Morena. We ended the year 2011 with a rum market share of 18% according to Nielsen. In July 2011, CPCh begun the distribution of Pernod Ricard products through the traditional channels introducing, among other brands, Havana Club, Ballantine’s, Absolute, Chivas Regal, and Beefeter. In the last quarter of 2011 the Company entered into a license contract to distribute the Bauzá premium pisco brand, which complements the company’s portfolio of premium brands. In addition, it acquired 49% of the licensor, Compañía Pisquera Bauzá S.A..
Other businesses
Sweet snacks. In January 2004, we entered the sweet snacks business by means of a joint venture which currently is held by our subsidiary CCU Inversiones S.A. and Industria Nacional de Alimentos S.A., a subsidiary of Quiñenco.At the time, each partyacquired a 50% interest in Calaf S.A. (today Foods), a corporation that acquired the trademarks, assets and know-how, among other things, of Calaf S.A.I.C. and Francisca Calaf S.A., traditional Chilean candy makers that have been in business for more than a century. The Company bought the brand Natur in 2007 and 50% of Alimentos Nutrabien S.A. in 2008. The three brands (Calaf, Natur and Nutrabien) are consolidated in Chile and allowed us to target a variety of snacks to specific niches. We sell Food’s products using CCU’s network. ECUSA’s sales and logistics platform is used in the central part of the country and as of December 2011 Foods had a 21 people dedicated sales force to serve 27 supermarket chains representing over 1,000 sales points throughout the country. This marketing structure has the capacity to reach more than 100,000 clients. Our challenge for the next development stage is to leverage our distribution and selling strengths and to search for future growth opportunities.
Cider and other spirits. In December 2010, CICSA, our subsidiary in Argentina, acquired control of Sáenz Briones and Sidra La Victoria, entering the cider and spirits businesses in that country. These two operations are the largest in a very fragmented market and own traditional, well-recognized brands. The most important cider and spirits brands are Real, La Victoria, Saenz Briones 1888 and in spirits, El Abuelo. According to Nielsen, our cider market share was 34.5% in 2011.
Distribution Network. In Chile, we have an extensive and integrated distribution network for the sale and distribution of beer, soft drinks, mineral water, purified water, functional beverages, nectars, wine, pisco, rum and sweet snacks products with capacity to reach approximately 112,059 points of sale. The network includes a total of 21 owned or leased warehouses and a network of independent transportation companies handled by Transportes CCU. Sales are performed by category-specific sales forces and by Comercial CCU S.A. (“Comercial CCU”) which has a sales force of approximately 319 people who sell our products to approximately 34,472 customers in the North of Chile from Arica to Copiapó/Vallenar and in the mid-south area from Curicó/Talca through Coyhaique, except for Concepción and San Fernando City. In the far south of Chile, in Punta Arenas, Comercial Patagona does the selling for all products, reaching 698 customers. In the central parts of the country and the City of Concepción , there are dedicated sales forces that focus on single lines of products. Product distribution is carried out by Transportes CCU throughout the country or by Comercial Patagona in its territory.
21
operators reachingapproximately 92,097 customers plus 73 supermarket chains. Sales are doneby two independent bottlers in the south and north of Argentina.
Our Beer Business
Our historical core business, our Chilean beer operation, was first established in 1850. Since that date, our management believes we have played a leading role in the industry, with a business that in 1902, after the merger of different breweries, gave rise to our formation. In 1995, we began building our presence in Argentina through the acquisition of a majority interest in two Argentine brewing companies, CICSA and CSF.
Our Beer Business in Chile
Overview. We estimate that annual beer consumption in Chile was 674 million liters in 2011, or approximately 39 liters per capita. The following chart shows our estimates for total and per capita consumption levels for beer in Chile for the years 2007 - 2011:
|
|
|
| |
| Year | Total Sales Volume(1) | Per Capita(2) | |
|
| (in millions of liters) | (liters) | |
|
|
|
| |
| 2007 | 573 | 35 | |
| 2008 | 603 | 36 | |
| 2009 | 598 | 35 | |
| 2010 | 624 | 37 | |
| 2011 | 674 | 39 | |
|
|
|
| |
(1) Based on our sales data, competitors’ publicly available information, equity research analyst reports, import and export data from customs authorities.Includes microbreweries sales. | ||||
(2)Population estimated in accordance with Chile’s national census of April 2002. | ||||
We estimate that the total beer market increased by approximately 8.0% in terms of volume sold during 2011 as compared to 2010, after growing on average 4.2% per year between 2007 and 2011. We believe that the positive growth of the beer market in the period of five years (4.2% per year on average) is the result of the actions taken by us since 2001 to increase beer consumption in Chile with new products, new packaging and by consumption occasions, in addition to positive Chilean economic conditions. The market decrease in 2009 is primarily a result of the effects of the global financial crisis in Chile, which led to increased unemployment and decreased consumption. After the February 27, 2010 earthquake, the unemployment rate decreased from 9.1% to 7.1% thereby increasing consumption and resulting in a 4.4% total sales volume increase in the beer market. CCU’s sales volume grew only by 1.5%, less than the total market growth rate of 4.4%, due to the temporary lack of product supply after the Santiago brewery plant was damaged by the earthquake. Although we were able to resume production activities within a month after the earthquake, this period of inactivity gave an advantage to other market players. The 6.0% Chilean economic growth in 2011 and the consequent high employment rates are the basis for the vigorous beer industry increase.
There are three principal Chilean manufacturers: us, Cervecería Chile and Cervecería Austral whose principal brands of beer in Chile are Cristal, Becker and Austral, respectively. According to our estimates, during 2011, we and Cervecería Chile accounted for approximately 80% and 14% of total beer sales in Chile, respectively. In November 2000, we acquired a 50% stake in Cervecería Austral, located in the city of Punta Arenas. This brewery has an annual nominal production capacity of 7.1 million liters and had less than 1% market share during 2011. In October 2001, Cervecería Austral entered into a license agreement with our subsidiary, CCU Chile, to produce and sell our brand Cristal, and also any other brand, owned by or licensed to CCU Chile in the southern part of Chile. During 2003, Cervecería Austral began the production and sale of our brands Cristal, Escudo and Dorada 6.0. In May 2002, we acquired a 50% stake inCompañía Cervecera Kunstmann S.A., located in the city of Valdivia. In November 2006, we acquired additional shares of Kunstmann that allowed us to consolidate this subsidiary into our financial statements since that month. Sales of imported beer represent an estimate of 5% and Microbreweries account for 0.9% of the total beer industry volume in 2011.
22
Wholesale and retail beer prices are not regulated in Chile. Wholesale prices are subject to negotiation between the producer and the purchaser. Retailers determine retail prices to the final consumer. We believe that the key factors determining retailers’ prices include: national and/or local price promotions offered by the manufacturer, the nature of product consumption (on-premise or take-out), the type of packaging (returnable or non-returnable), the applicable tax structure, the desired profit margins and the geographical location of the retailer.
Beer Production and Marketing in Chile. The production, marketing and sales of beer in Chile are our principal activities, generating net sales of CLP278,170 million, CLP287,981 million and CLP313,017 million or 35.8%, 34.4% and 32.3% of our total net sales in the last three years, respectively. Our sales of beer by volume in Chile increased 4.6% in 2011 primarily as a result of consumption acceleration experienced in 2011 as a consequence of the 6.0% Chilean GDP growth and the high employment rates combined with an effective point of sales execution.
The following table shows our proprietary brands, brands produced under license and brands imported under license for the Chilean market:
|
|
|
|
Super-Premium | Premium | Special | Popular-priced |
beer brands | beer brands | beer brands | beer brands |
Royal Guard | Cristal | Lemon Stones | Dorada 6.0 |
Royal Light | Cristal Cer0,0° |
|
|
Heineken(1) | Cristal Black Lager |
|
|
Budweiser(2) | Escudo |
|
|
Paulaner(1) | Morenita |
|
|
Austral(1) |
|
|
|
Kunstmann |
|
|
|
D'olbek |
|
|
|
|
|
| |
(1) Produced under license | |||
(2) Imported |
|
|
|
Cristal is our principal and best selling beer brand in Chile. Cristal Cer0,0° was introducedin December 2008 and is an alcohol free beer with regular beer-like taste. Escudo, Chile’s second most popular beer, is targeted to young-adult consumers. Royal Guard is our single, proprietary, super-premium brand. Royal Light is a light beer extension of the Royal Guard line and contains a lower alcohol content. Morenita is a dark beer and Dorada 6.0 is a discount brand. Lemon Stones is a lemon flavored sweetened beer, with 2.5% alcohol content. Kunstmann is a specialty beer produced in a variety of flavors.
On April 28, 2003, we, through our subsidiaries CCU Chile and CCU Argentina, and Heineken Brouwerijen B.V. signed license and technical assistance agreements which provided us with the exclusive rights to produce, sell and distribute Heineken beer in Chile and Argentina commencing June 18, 2003. On October 12, 2011, we and Heineken International B.V. signed the Amended and Restated versions of the Trademark License Agreements, which provide us with the exclusive rights to produce, sell and distribute Heineken beer in Chile and Argentina, as of January 1, 2011. These agreements have an initial term of 10 years, and shall automatically be renewed each January 1 for a new period of ten years, unless either party gives notice of its decision not to renew, in which case the agreements will be in force until the last renewal period expires Heineken beer is the leading brand in the super-premium segment, the beer segment with the highest growth in Chile in recent years.
23
Additionally, we produce, bottle and distribute Paulaner beer under license from Paulaner Brauerei AG, which is controlled by the BrauHolding International GmbH Group, a joint venture between Heineken and the Schörghuber Group. The current Import and License agreement, executed in 1995, which supersedes all prior agreements, provides us with the exclusive right to produce in Chile super-premium beer under the Paulaner label and distribute in Chile a variety of additional imported Paulaner products. It has a five year term, beginning in May 1995, automatically renewable for successive five-year periods unless otherwise stated by any party. The Schörghuber Group was, until April 2003, one of the two beneficial shareholders of IRSA, our major shareholder.
In October 1996, we and Anheuser-Busch entered into an agreement granting us the exclusive right to distribute Budweiser beer in Chile. During 2004, we and Anheuser-Busch entered into a new distribution agreement, with a 12-year term, ending December 2015. See “Item 3: Key Information – Risk Factors.”
In October 2001, we signed a license agreement with Cervecería Austral S.A. for the production of the Austral brand by our beer division. This agreement has a fourteen-year term, automatically renewable for a seven-year term if certain conditions are fulfilled. This agreement can be extended for an additional seven-year period if both parties express this intention in writing.
In May 2002, we acquired a 50% ownership interest in Compañía Cervecera Kunstmann S.A., a microbrewery located in the southern city of Valdivia, with an annual production capacity of 3 million liters at that time. Since June 2003, our beer division began selling Kunstmann nationwide. In November 2006, we acquired additional shares of Kunstmann that allowed us to consolidate this subsidiary. Dolbek was introduced in February 2010 as part of the Kunstmann brewery portfolio.
Our investment in Cervecería Austral S.A., the production of the Austral brand by our beer division, the investment in Compañía Cervecera Kunstmann S.A., plus the production of Heineken beer since June 2003, are part of our strategy to increase our presence in the premium segment of the Chilean beer market.
Our beer products sold in Chile are bottled or packaged in returnable and non-returnable bottles, aluminum cans or stainless steel kegs at our production facilities in the Chilean cities of Santiago and Temuco, and in Antofagasta until July 2009. During the last three years we sold our beer products in Chile in the following containers:
Percentage of Total Beer Products Sold | |||
Container | 2009 | 2010 | 2011 |
|
|
|
|
Returnable(1) | 59% | 55% | 53% |
Non-returnable(2) | 37% | 40% | 42% |
Returnable kegs(3) | 4% | 4% | 4% |
Total | 100% | 100% | 100% |
|
|
|
|
(1) Returnable beer containers include glass bottles of various sizes. | |||
(2) Non-returnable beer containers include bottles and aluminum cans, both of assorted sizes. | |||
(3) Returnable kegs are stainless steel containers, which have a capacity of 20, 30 and 50 liters. | |||
Since July 2009 our beer production was centralized in the Santiago and Temuco plants. The Temuco plant commenced production in November 1999, replacing the closed Concepción and Osorno plants. For a more detailed discussion of our capital expenditure program, see “Capital Expenditures.”
Raw Materials and other Supplies. The principal raw materials used in our production of beer are malt, rice, water and hops. We obtain our supply of malt from local producers and from Argentina. We have long-term contracts signed with suppliers for malt supply. Rice is sourced from local and international suppliers in spot transactions and/or annual contract agreements. We pre-treat rice in order to ensure that it meets our standards of quality. We import hops mainly pursuant to contracts with international suppliers in the United States, which permit us to secure supplies for periods of up to four years.
24
Water is essential in the production of beer. We obtain all of our water from wells located at our plants and/or from public utilities. The water is treated at facilities located at our plants to remove impurities and to adjust the characteristics of the water before it is used in the production process.
We maintain testing facilities at each of our plants and factories where raw materials are tested. Additionally, samples of beer are analyzed at various stages of production to ensure product quality. Samples of Heineken beer are periodically sent to Holland to verify the quality of the product.
We generally purchase all of the glass bottles used in our beer packaging from the principal local glass supplier in Chile, Cristalerías Chile S.A. under three-year agreements. In addition, other sources, principally in Argentina, can be used, however no purchases were made from this country during 2011. During 2011, all of our requirements for aluminum cans were purchased from a global supplier, Rexam Chile S.A., but if price and delivery conditions are favorable, cans can be imported. During 2012, Rexam will increase its cans capacity in Chile. Our kegs used for draft beer, are purchased from various suppliers outside Chile. We obtain the labels for our beer products principally from local suppliers. Plastic caps are principally purchased from two suppliers in Chile. Crowns are currently imported from Brazil and Mexico.
Prices of principal raw materials used in beer production in Chile are tied to the U.S. dollar and have varied in Chilean pesos due to general commodity price fluctuations in international markets as well as to the variation of the Chilean peso against the U.S. dollar.
We believe that all of the contracts or other agreements between us and third-party suppliers, with respect to the supply of raw materials for beer products, contain standard and customary commercial terms and conditions. We do not believe we are dependent on any one supplier for a significant portion of our raw materials. During the past ten years, we have not experienced any material shortage or difficulties in obtaining adequate supplies of necessary raw materials at satisfactory prices, nor do we expect to do so in the future.
Sales, Transportation and Distribution. We distribute all of our beer products in Chile directly to retail, supermarket and wholesale customers. This system enables us to maintain a high frequency of contact with our customers, obtain more timely and accurate marketing-related information, and maintain good working relationships with our retail customers.
In October 2005, we launched Comercial CCU, a subsidiary responsible for a single sales force dedicated to selling our beverage and sweet snack products, in order to capture synergies and focus on sales execution. Originally, this plan was piloted in rural areas and small cities in southern Chile. As of 2008, the territory covered by Commercial CCU S.A. has expanded to include the north of Chile from Arica to Copiapó/Vallenar and the south, from Curicó to Coyaique except for the cities of Concepción and San Fernando.
In July 2002, Comercial Patagona Ltda. began selling all of our beer products in the country’s Region XII. Comercial Patagona Ltda. is a subsidiary of Cervecera Austral S.A. and is responsible for the sales and distribution of our products and those of Cervecera Austral in Chile’s extreme south.
After production, bottling and packaging, our beer is either stored at one of the three production facilities or transported to a network of 21 owned or leased warehouses that are located throughout Chile. Beer products are generally shipped from the region of production to the closest warehouse, allowing us to minimize our transportation and delivery costs.
As of December 31, 2011, we had more than 38,240 customers in Chile for our beer products – none of our customers accounted for more than 2% of our total beer sales by volume, with the exception of three large supermarket chains that represented in the aggregate 20% of our total beer sales by volume. During 2011, the Chilean supermarket industry continued to consolidate, increasing the importance and purchasing power of a few supermarket chains. We do not maintain any long-term contractual arrangements for the sale of beer with any of our customers in Chile.
In 2011, we had a dedicated sales force of approximately 187 salespeople, responsible for sales of our beer and other products in the territories not covered by Comercial CCU or Comercial Patagona. This sales force
25
Our customers make payment for our products either in cash at the time of delivery or in accordance with one of various credit arrangements. Payment on credit sales for beer is generally due 26 days from the date of delivery. Credit sales accounted for 33%, 33%, and 35% of our beer sales in Chile in the last three years. Losses on credit sales of beer in Chile have not been significant.
Beginning in October 2001, all of the warehouses and transportation companies used to store and deliver all our products are managed on a consolidated basis by our subsidiary Transportes CCU Ltda.
We distribute our beer products throughout Chile to:
· off-premise retail: small and medium-sized retail outlets, which in turn sell beer to consumers for take-out consumption;
· on-premise retail: retail establishments such as restaurants, hotels and bars for on-premise consumption;
· wholesalers; and
· supermarket chains.
In the last three years, the percentage mix of the above distribution channels for our beer products in Chile was as follows:
Percentage of Total Beer Products Sold | |||
Distribution Channels | 2009 | 2010 | 2011 |
|
|
|
|
Off-premise retail | 39% | 37% | 37% |
On-premise retail | 17% | 15% | 15% |
Wholesalers | 20% | 20% | 20% |
Supermarkets | 24% | 27% | 28% |
Total | 100% | 100% | 100% |
The following table sets forth our beer sales volume in Chile, by category, during each of the last five years:
|
|
|
|
|
|
Category | 2007 | 2008 | 2009 | 2010 | 2011 |
| (in millions of liters) | ||||
Super-premium | 46.2 | 55.6 | 59.2 | 67.8 | 77.8 |
Premium | 418.8 | 432.8 | 420 | 424.0 | 434.1 |
Special | 5.5 | 6.2 | 5.8 | 5.8 | 6.6 |
Medium-priced | 0 | 0 | 0 | 0 | 0 |
Popular-priced | 20.7 | 22.1 | 22.2 | 17.1 | 20.1 |
Total | 491.1 | 516.8 | 507.2 | 514.8 | 538.6 |
The above figures do not include export sales to third parties, which amounted to 1.5 and 0.4 in 2009 and 2010, respectively.
26
The following table sets forth the changes in the average price per liter to our customers for beer for the periods indicated:
|
| ||
| Beer Chile ( in CLP) | ||
|
|
|
|
| 2009 | 2010 | 2011 |
|
|
|
|
Avarage price per liter | 537.67 | 550.65 | 574.29 |
% growth | 6.0 | 2.4 | 4.3 |
Seasonality. As a result of the seasonality of the beer industry, our sales and production volumes are normally at their lowest in the second and third calendar quarters and at their highest in the first and fourth calendar quarters (i.e., those months corresponding to the holidays as well as the summer vacation season in Chile).
The following table shows our annual sales volume of beer in Chile, excluding exports, by quarter in the last three years:
|
|
|
|
Year | Quarter | Sales Volume | % of Annual |
(millions of liters) | Sales Volume | ||
|
|
|
|
2009 | 1st quarter | 150.7 | 29.7 |
| 2nd quarter | 94.7 | 18.7 |
| 3rd quarter | 102.2 | 20.1 |
| 4th quarter | 159.6 | 31.5 |
| Total | 507.2 | 100 |
|
|
|
|
2010 | 1st quarter | 139.0 | 27.0 |
| 2nd quarter | 104.5 | 20.3 |
| 3rd quarter | 109.2 | 21.2 |
4th quarter | 162.1 | 31.5 | |
| Total | 514.8 | 100 |
|
|
|
|
2011 | 1st quarter | 152.3 | 28.3 |
| 2nd quarter | 101.4 | 18.8 |
| 3rd quarter | 109.1 | 20.3 |
4th quarter | 175.7 | 32.6 | |
| Total | 538.6 | 100 |
Geographical Markets. Our principal beer production facility is located in Santiago. Santiago and the surrounding areas (referred to as the Metropolitan Region) account for approximately 40% of the population of Chile and accounted for approximately 37% of our beer sales by volume in 2011. We also have one additional beer production facility (Temuco) located in the southern region of the country. Until July 2009 we also operated a bottling facility in Antofagasta. Currently all of our brands are supplied and distributed from these two production facilities.
27
Competition. Our principal competitor in the beer business is Cervecería Chile (a subsidiary of Anheuser Busch InBev), which commenced operations in Chile during the second half of 1991, resulting in a loss of market share for us. Nevertheless, after experiencing a market share of 86% in both 1994 and 1995, wewere able to recapture our lost market share, reaching 90% market share in 2004. However, in 2005, Cervecería Chile launched a new product which negatively affected our market share, and in 2006, we had 86% market share which we maintained until 2008. Our market share dropped slightly in 2009 to 85%, dropped to 83% in 2010 and reached 80% in 2011. The drop in market share was a result of two principal factors: first, we experienced inventory issues for the period that followed the February 27, 2010 earthquake, which gave imported beers and our competitors an opportunity to increase their market share, and second, we have faced more aggressive competitive price pressures, and increased competition from imports and microbreweries in the market.
Our estimated share of the Chilean beer market over the last five years is as follows:
|
|
Year | Our Chilean Market Share for Beer (*) |
|
|
2007 | 86% |
2008 | 86% |
2009 | 85% |
2010 | 83% |
2011 | 80% |
|
|
(*) Includes beer sold directly by Austral and Kunstmann | |
Our competitor, Cervecería Chile has one production facility located in Santiago and distributes its products throughout the country. Cervecería Chile uses third-party distributors in both Region I in the north, and in the city of Castro in Region X to the south. During 2011, they supplemented their production by importing products from surrounding markets and from the United States. We estimate that the sales of Cervecería Chile’s brands of beer by volume accounted for approximately 13% of total beer sales in 2009 and in 2010, and 14% in 2011.
Despite the high cost of shipping beer to Chile and the competitive advantage inherent to domestic producers as a result of Chile’s returnable glass bottle system, imported beer is becoming a more significant component of the Chilean beer market, in particular in the one-way packaging segment, in part supported by a stronger Chilean currency and the low cost of freight. We estimate that imports and microbreweries accounted for 5.9% of total beer sales by volume during 2011.
Although there are currently no significant legal or regulatory barriers to entering the Chilean beer market, substantial investment would be required to establish or acquire production and distribution facilities and bottles for use in Chile’s proprietary returnable bottling system, and to establish a critical mass in sales volumes. Nevertheless, if long-term economic conditions in Chile continue to be favorable, other enterprises may be expected to attempt to enter the Chilean beer market. In addition, our beer brands in Chile may face increased competition from other alcoholic beverages, such as wine and spirits, as well as from non-alcoholic beverages such as soft drinks.
Our Beer Business in Argentina
Overview. In December 1994, we established CCU Argentina in order to develop a presence in the Argentine beer market. During January and February 1995, we, through CCU Argentina, acquired a 62.7% interest in CICSA, a brewery located in the city of Salta, 1,600 kilometers northwest of Buenos Aires. In September 1995, CCU Argentina expanded its operations by purchasing 98.8% of CSF, a brewery located 450 kilometers northwest of Buenos Aires in the city of Santa Fe.
In December 1995, we entered into a joint venture agreement pursuant to which Anheuser-Busch acquired a 4.4% interest in CCU Argentina. The agreement involved two kinds of contracts: an investment and a licensing contract. The licensing contract was extended until 2025 and grants CCU Argentina the exclusive right to produce, package, market, sell and distribute Budweiser beer in Argentina and Uruguay. In June 2008, after the last capital expansion, Anheuser-Busch reduced its interest in CCU Argentina to 4.04% and we increased our participation to 95.96%. In December 2010, our subsidiary Inversiones Invex CCU Ltda.acquired a 4.04% equity stake in CCU Argentina from Anheuser-Busch Investment, S.L. After the acquisition, CCU, through itssubsidiary Inversiones Invex CCU Ltda., became the sole equity holder of CCU Argentina.
28
In March 2004, AmBev and Interbrew announced an agreement to merge, creating the world’s largest brewer, InBev. This merger was closed in August 2004. In January 2007, AmBev assumed control of Quilmes, our competitor. Inbev and Anheuser Busch merged in November 2008, creating the world’s global beer leader. See “Item 3: Risk Factors.”
In January 1998, we merged two of our subsidiaries, CICSA and CSF. Currently both plants operate under the CICSA name. As a result of the merger of CICSA and CSF, CCU Argentina holds a 99.7% interest in CICSA.
In April 1998, CCU Argentina paid approximately US$8 million to acquire the brands and assets of Cervecería Córdoba. After the resolution of certain labor issues, we began the production of the Córdoba brand at our Santa Fe plant during mid 1998.
In April and June 2008, CICSA paid an aggregate amount of US$88 million to acquire ICSA. Among other assets, ICSA owns the Bieckert, Palermo and Imperial beer brands, and a brewery in Luján, Buenos Aires, which has a nominal production capacity of 270 million liters per year. Pursuant to the acquisition of ICSA in April 2008, it was merged with CICSA in July 2008.
On December 27, 2010,CICSAacquired equity interests inSaénz Briones S.A. andSidra La Victoria S.A. Through this transaction, CICSA became the controlling shareholder of these companies. These companies own the assets used in the production, packaging and marketing of cider and other spirits businesses in Argentina, which are marketed through several brands, including Sidra Real and Sidra La Victoria.
In 2011, we begun to export Schneider beer to Paraguay which represented 4.4% of our total beer volume sales in Argentina.
The Argentine Beer Market. The Argentine beer market is estimated by us to be almost three times the size of Chile’s. Traditionally, beer and wine have been the principal alcoholic beverages consumed in the country. We estimate that annual beer consumption in Argentina was 1,817 million liters, or approximately 44 liters per capita in 2011.
The table below sets forth our estimates of beer consumption in Argentina during each of the last five years:
|
|
|
Year | Volume | Per Capita(*) |
| (in millions of liters) | (liters) |
2007 | 1,579 | 40 |
2008 | 1,716 | 43 |
2009 | 1,719 | 43 |
2010 | 1,753 | 43 |
2011 | 1,817 | 44 |
(*) Population estimated in accordance with Argentina’s national census of 2001. | ||
We estimate that total beer consumption in Argentina increased at a four-year compounded annual growth rate of 3.6% between 2007 and 2011. During 2011, the Argentine beer market increased 3.7%, despite the 6.6% increase in GDP.
29
Since January 2006, the Argentine Government has adopted different methods to directly and indirectly regulate price increases of various consumer goods, including bottled beer, in an effort to slow inflation. Wholesale price increases are negotiated between the producer and the purchaser as a result of competitivesituations in the industry and government approval for each beer company. Prices to consumers are determined by the negotiated wholesale price, as impacted by the producer's product pricing strategy. In order to optimize its profit margins, the producer must carefully manage its product and channel mix and trade discounts.
Beer Production and Marketing in Argentina. Our beer operation in Argentina generated net sales of CLP156,363 million and CLP198,181 million representing 18.7% and 20.4% of our total net sales in 2010 and 2011, respectively. The increases during this period were the result of higher prices and volumes, as a consequence of a favorable economic environment in Argentina.
We produce and market super-premium, premium, medium-priced and popular-priced beer brands in Argentina. The following table shows our principal brands produced and imported under license in Argentina:
|
|
|
|
Super-premium | Premium | Medium-priced | Popular-priced |
beer brands | beer brands | beer brands | beer brands |
Heineken(1) | Budweiser(1) | Córdoba | Palermo |
Corona(2) | Salta |
| Bieckert |
Guinness(2) | Santa Fe |
|
|
Negra Modelo(2) | Schneider |
|
|
Paulaner(2) |
|
|
|
Imperial |
|
|
|
Kunstmann(2) | |||
Birra Moretti(2) | |||
Otro Mundo | |||
|
|
|
|
(1) Produced under license | |||
(2) Imported | |||
Schneider is our principal proprietary brand in Argentina, accounting for 22.4% of our Argentine sales volume in 2011. We began local production of Budweiser brand beer in December 1996. Budweiser beer represented 29.6% of our Argentine sales volume in 2011. Since February 2002, our Budweiser one-liter returnable bottle, the principal format in the market, has been priced at the same level as the leading brand in the market. In June 2003, we began selling locally produced Heineken beer. Our Schneider brand is sold in two varieties-regular lager and dark lager; the Salta brand is sold in regular and dark varieties, and the Santa Fe and Córdoba brands are sold only as regular lager. During 1997, we began to import Guinness beer from Ireland, making Argentina the only country in South America where Guinness draught is sold. During 2001, we began importing Corona beer from Mexico, and during 2005 and 2007, we also began importing Negra Modelo beer from Mexico and Paulaner beer from Germany. In April 2008, we bought the brands Imperial, Palermo and Bieckert along with the production facility in Luján and in October 2008, we started importing Kunstmann. In 2009, we introduced Otro Mundo and the Italian imported brand, Birra Moretti. During 2011, we exported 20.6 million liters of beer from Argentina to other countries, representing 4.7% of CCU Argentina’s beer sales volume.
30
Our beer products are bottled or packaged in returnable and non-returnable glass bottles, aluminum cans, or stainless steel kegs at our production facilities. During the last three year, we sold our beer products in Argentina in the following packaging formats:
|
|
|
|
|
|
| Percentage of Total Beer Products Sold |
| |||
| Container | 2009 | 2010 | 2011 |
|
| Returnable(1) | 89% | 85% | 83% |
|
| Non-returnable(2) | 10% | 14% | 16% |
|
| Returnable kegs(3) | 1% | 1% | 1% |
|
| Total | 100% | 100% | 100% |
|
|
|
|
|
|
|
(1) Returnable beer containers include glass bottles of various sizes. |
|
| |||
(2) Non-returnable beer containers include glass bottles and aluminum cans, both of assorted sizes. | |||||
(3) Returnable kegs refer to stainless steel containers in assorted sizes. | |||||
The license agreement between CCU Argentina and Anheuser-Busch, which provides CCU Argentina with the exclusive right to produce, package, market, sell and distribute Budweiser beer in Argentina and Uruguay, had an initial term of 20 years commencing in December 1995, which in March 2008, was extended to December 2025. Among other things, the license agreement includes provisions for both technical and marketing assistance from Anheuser-Busch. Under the license agreement, CCU Argentina is obligated to purchase certain raw materials from Anheuser-Busch or from suppliers approved by Anheuser-Busch. We began distribution of our locally produced Budweiser in December 1996. See “– Sales, Transportation and Distribution.” In addition, the license agreement is subject to certain specified market share targets and marketing expenditures. During the third quarter 2000, we and Anheuser-Busch signed an export agreement to supply Budweiser from Argentina to Paraguay, Chile and Brazil. In August 2003, the license agreement was modified, with regard to certain targets, to adjust it to the current economic situation of the Argentine market. See “Item 3: Risk Factors.”
On April 28, 2003, CCU Argentina and Heineken Brouwerijen B.V., a subsidiary of Heineken International B.V., signed license and technical assistance agreements which provide us with the exclusive rights to produce, sell and distribute Heineken beer in Argentina commencing June 18, 2003. On October 12, 2011, we and Heineken International signed the Amended and Restated versions of theTrademark License Agreements which provide us with the exclusive rights to produce, sell and distribute Heineken beer in Chile and Argentina, in force as of January 1, 2011. These agreements have an initial term of 10 years, and shall automatically be renewed each year (January 1) for a new period of ten years, unless any party gives notice of its decision not to renew, in which case the agreements will be in force until the last renewal period expires.Heineken beer is the second-largest brand in terms of volume in the super-premium segment in Argentina.
In October 2006, we signed a long-term contract with ICSA to brew, bottle and package beer in the former AmBev plant in Luján, near Buenos Aires, that was purchased by ICSA. In January 2007, we began brewing our local brands in this plant, obtaining enough production capacity to ensure future growth. In April 2008, we acquired ICSA, including the Luján plant and the brands Imperial, Bieckert and Palermo. ICSA also had a brewing contract agreement with AmBev and, under such contract CICSA brewed beer for AmBev during the peak demand season of 2008-2009.
Raw Materials and other Supplies. The principal raw materials used in the production of our beer products in Argentina are malt, corn syrup, water and hops. Rice is used in the production of Budweiser beer. During 2011, we continued obtaining malt and rice from regional suppliers, benefiting from lower costs as compared to imported materials. We obtain rice and malt from suppliers in Argentina and Uruguay, and malt and corn syrup from suppliers in Argentina.
31
Other raw materials are obtained from local and international suppliers in spot transactions and/or annual contracts. All purchased raw materials are tested in order to ensure that they meet our standards of quality.Water is essential in the production of beer. Our operation in Salta obtains all of its water from wells located at its plant, and the Santa Fe operation obtains all of its water from the Paraná river. The Luján operation obtains its water from the Napa Puelche, an underground sheet of water. The water is treated at facilities located at our plants to remove impurities and adjust the characteristics of the water before it is used in the production process.
We maintain testing facilities at each of our plants and factories in which raw materials are analyzed according to our standards. Additionally, samples of beer are analyzed at various stages of production to ensure product quality. Samples of Heineken and Budweiser beer are periodically sent to Holland and to Anheuser-Busch facilities in the United States, respectively, to verify the consistency and quality of the products.
We generally purchase all of our glass bottles from the principal national glass supplier in Argentina, Rigolleau/Cattorini, and from Saint Gobain in Brazil. During 2011, all of our requirements for aluminum cans were purchased from a local supplier, Rexam Argentina S.A. Kegs used for draft beer are purchased from various suppliers in Europe. Plastic storage and carrying crates, as well as the labels for beer products and crowns, are obtained from local and international suppliers.
Prices of principal raw materials used in beer production in Argentina have remained stable in dollar terms. However, from time to time, prices of agricultural products vary depending on demand and supply factors.
We believe that all contracts or other agreements between us and third-party suppliers, with respect to the supply of raw materials for beer products, contain standard and customary commercial terms and conditions. We do not believe we are dependent on any one supplier for a substantial portion of our raw materials in Argentina. We have not experienced any significant difficulties in obtaining adequate supplies of necessary raw materials and do not expect to in the future.
Sales, Transportation and Distribution. After production, bottling and packaging, our beer is either stored at the production facilities or transported to a network of six warehouses leased or owned by us. Beer products are generally shipped to those warehouses, which are located within the region in which the beer products are sold.
We have the capacity to reach 151,395 points of sale in Argentina with our direct and indirect sales force. More than half of our beer in Argentina is sold and distributed through third-party sales and distribution chains in the regions surrounding the cities of Santa Fé, Salta, Córdoba, Rosario and Buenos Aires. In recent years, we reduced the number of our distributors and replaced some of them with larger ones, among which there are currently three bottlers, one in the south, another in the north and the third in the northeastern region of Argentina. As of December 31, 2011, we had a direct sales force which sold our beer products to approximately 51,974 customers within the Salta, Santa Fé, Córdoba, Rosario, the Federal Capital and its outlying metropolitan area, in addition to 73 regional and national supermarket chains throughout the country. None of our customers individually accounted for more than 1.7% of our total beer sales by volume, with the exception of two large distributors that represented in the aggregate 25% of our total beer sales by volume.
Our Argentine beer customers either make payments for our products in cash at the time of delivery or through one of our various credit arrangements. Payment on credit sales is currently due 7 days from the date of delivery to wholesalers, and an average of 60 days of delivery to supermarkets. Credit sales accounted for 62%, 74% and 56% of our beer sales in Argentina in the last three years, respectively. Losses on credit sales of beer in Argentina have not been significant.
32
In Argentina, though most beer is sold to wholesalers, we also sell our products to retailers and supermarket chains. In the last three years, the percentage mix of the above distribution channels for our beer products in Argentina was as follows:
|
|
|
|
| Percentage of Total Beer Products Sold | ||
|
|
|
|
Distribution Channels | 2009 | 2010 | 2011 |
Wholesalers | 66% | 64% | 53% |
Retailers | 19% | 22% | 34% |
Supermarkets | 15% | 14% | 14% |
Total | 100% | 100% | 100% |
The following table sets forth our beer sales volume in Argentina by category during each of the last five years, including exports to other countries:
|
|
|
|
|
|
Category | 2007 | 2008 | 2009 | 2010 | 2011 |
| (in millions of liters) | ||||
Super-premium | 38.3 | 50.5 | 59.7 | 63.1 | 71.6 |
Premium | 109.5 | 127.1 | 148.1 | 164.5 | 170.6 |
Medium-priced | 104.6 | 106.8 | 106.0 | 108.5 | 114.6 |
Popular-priced | 1.1 | 81.7 | 77.8 | 78.1 | 77.8 |
Total | 253.5 | 366.1 | 391.6 | 414.2 | 434.6 |
The following table sets forth the changes in the average price per liter to our customers for beer for the periods indicated:
|
| ||
| Beer Argentina ( in CLP) | ||
|
|
|
|
| 2009 | 2010 | 2011 |
|
|
|
|
Avarage price per liter | 344.17 | 366.82 | 459.42 |
% growth | 15.9 | 6.6 | 25.2 |
33
Seasonality. As a result of the seasonality of the beer industry, our sales and production volumes are normally at their lowest in the second and third calendar quarters and at their highest in the first and fourth quarters (i.e., those months corresponding to the summer and holiday seasons in Argentina).The following table shows the annual sales volume of beer in Argentina, including exports, during each quarter in the last three years:
|
|
|
|
Year | Quarter | Sales Volume | % of Annual |
(millions of liters) | Sales Volume | ||
|
|
|
|
2009 | 1st quarter | 112.4 | 28.7 |
| 2nd quarter | 75.3 | 19.2 |
| 3rd quarter | 78.4 | 20 |
| 4th quarter | 125.5 | 32.1 |
| Total | 391.6 | 100 |
|
|
|
|
2010 | 1st quarter | 118.2 | 28.5 |
| 2nd quarter | 77.8 | 18.8 |
| 3rd quarter | 84.6 | 20.4 |
4th quarter | 133.6 | 32.3 | |
| Total | 414.2 | 100 |
|
|
|
|
2011 | 1st quarter | 126.4 | 29.1 |
| 2nd quarter | 82.8 | 19 |
| 3rd quarter | 88 | 20.3 |
4th quarter | 137.4 | 31.6 | |
| Total | 434.6 | 100 |
(*) Information for 2011 does not include exports to Chile.
Geographical Markets. Our beer production facilities in Argentina are located in Santa Fe, Salta and Luján.
|
|
|
Beer production facilities in Argentina 2011 | ||
|
|
|
Location | % of Argentina's population | % of sales volume CCU Argentina |
Santa Fe | 8.2 | 10.1 |
Salta and Jujuy | 4.9 | 6.1 |
Luján (Córdoba) | 8.5 | 9.0 |
Buenos Aires | 44.6 | 33.6 |
Competition. Since 2003, after the agreement between Quilmes and AmBev, the Argentine beer market consisted of three principal brewing groups: AmBev-Quilmes, us and SABMiller (owner of CASA Isenbeck). The principal proprietary brands of these companies are Quilmes, Schneider and CASA Isenbeck, respectively. In December 2006, ICSA, a new competitor, entered the Argentine beer market. ICSA began its operations at the former AmBev brewery in Luján producing three beer brands: Palermo, Bieckert and Imperial, which had previously belonged to Quilmes. These assets were sold by AmBev-Quilmes in response to requirements of the antitrust authorities in Argentina. In 2008, these assets were bought by CCU Argentina and subsequently merged into CICSA. In November 2010, SABMiller acquired CASA Isenbeck.
According to the information made public by our competitors and our estimates for CASA Isenbeck, the different brewing groups had the following market shares in 2011: AmBev-Quilmes, 74%; us, 23%; and SABMiller (Warsteiner until November 2010), 3%.
34
The following table shows our market share in the Argentine market over the past five years:
|
|
Our Argentine Market Share for Beer | |
|
|
Year | Estimated Market Share |
2007 | 16% |
2008 | 21% |
2009 | 22% |
2010 | 23% |
2011 | 23% |
|
|
(*) Includes beer sold directly by Austral and Kunstmann | |
Quilmes, the beer market leader in Argentina and our principal competitor, also has beer operations in Chile, Paraguay, Uruguay and Bolivia. As of December 31, 2011, Quilmes had five breweries in Argentina with an estimated total annual production capacity of 1.3 billion liters. Quilmes’ large size enables it to benefit from economies of scale in the production and distribution of beer throughout Argentina.
We estimate that Quilmes’ average market share in 2011 decreased to 74% from 82% market share in late 1994. At that time, Companhia Cervejaria Brahma, one of the two largest beer producers in Brazil, commenced production at its new brewery in Luján, near Buenos Aires, which at present belongs to CCU Argentina. In addition, Warsteiner (today SABMiller), a large German brewer, commenced production at its new brewery in Zárate, also near Buenos Aires, with an annual production capacity estimated to be approximately 140 million liters. Prior to commencing production in Argentina, Companhia Cervejaria Brahma and Warsteiner competed in the Argentine market with imported beer. In July 1999, the merger of Companhia Cervejaria Brahma and Companhia Antarctica Paulista was announced, creating AmBev. This merger was finally approved in March 2000, creating one of the largest beverage producers in the world.
In May 2002, AmBev and Quilmes announced that pursuant to an agreement between both parties, AmBev would transfer all of its beer assets in Argentina, Bolivia, Paraguay and Uruguay to Quilmes in exchange for 26.4 million new B shares of Quilmes. Additionally, according to the announcement AmBev would purchase from the controlling shareholders of Quilmes 230.92 million class A shares for US$346.4 million. Also the agreement stipulates that AmBev can purchase at the end of a seven-year period the remaining Quilmes shares owned by the current controlling group, the Bemberg family, with AmBev shares. The Bemberg family had the option to sell to AmBev their remaining class A shares during a period beginning with the end of the first year and ending with the seventh year after the agreement was announced. This option was exercised in April 2006. This transaction was approved by the Argentine antitrust authorities on January 13, 2003, subject to the condition that AmBev and Quilmes divest themselves of certain brands and the AmBev plant in Luján, near Buenos Aires, to a company currently not present in the Argentine beer market. On February 14, 2003, through our subsidiary CICSA, we filed a complaint before the Argentine federal courts in order to be eligible to participate in the acquisition of these assets. In February 2006, the Argentinean Supreme Court of Justice ruled against our complaint. In December 2006, the Argentine authorities approved the sale of these assets to ICSA, a company owned by local investors. On March 3, 2004, AmBev and Interbrew announced an agreement to merge the two companies, creating the world’s largest brewer under the name InBev. This merger was closed in August 2004. On November 18, 2008 Anheuser Busch and Inbev merged creating the global beer leader. Consolidation in the beer industry has resulted in larger and more competitive participants, which could change the current market conditions under which we operate. See “Item 3: Key Information-Risk Factors-Consolidation in the beer industry may impact our market share.”
Due to the high cost of shipping beer to Argentina and the competitive advantage inherent to domestic producers as a result of Argentina’s returnable glass bottle system, we estimate that imported beer sales accounted for less than 0.7% of the total sales volume in 2011.
35
Our beer brands in Argentina also face competition from other alcoholic beverages such as wine and spirits, as well as from non-alcoholic beverages, such as soft drinks.
Excise taxes for the beverage industry in Argentina have been subject to variations in the past. The last modification was in 1999 and has been applicable since January 2000. The following table shows current Argentine excise beverage taxes:
|
|
|
Product Type | 1999 Excise Taxes | Current Excise Taxes |
Non-Alcoholic Beverages |
|
|
Flavored soft drinks, mineral water and juices | 0%-4% | 4.17%-8.7% |
|
|
|
Alcoholic Beverages |
|
|
Beer | 4% | 8.7% |
Whisky | 12% | 25% |
10-29% alcohol content | 6% | 25% |
30% or more alcohol content | 8% | 25% |
Wine-cider | 6% | 0% |
Future changes in excise taxes in Argentina could adversely affect our sales volume, market share and EBIT margins.
Our Non-Alcoholic Beverage Business
Overview. We have produced and sold soft drinks in Chile since 1902. Prior to November 1994, we independently produced, bottled and distributed carbonated and non-carbonated soft drinks in Chile. Our line of soft drink products included our own proprietary brands, in addition to brands produced under license from Cadbury Schweppes plc. (currently Crush, Crush Light, Canada Dry Agua Tónica, Canada Dry Agua Tónica Light, Canada Dry Ginger Ale, Canada Dry Ginger Ale Light, Canada Dry Limón Soda and Canada Dry Limón Soda Light) and from PepsiCo (currently Pepsi, Pepsi Light, 7Up, 7Up light, Mirinda and Kem Slice). Under a similar licensing arrangement with Watt’s, a local fruit related company, we bottled and distributed Watt’s nectar products in Chile from 1977 until December 2006. At present Promarca, owned by us and Watt’s 50-50%, is the owner of the brand and we produce, bottle and distribute nectar products in bottles under Promarca’s license. In 2011 we introduced several new product offerings, including Frugo, a soft drink containing fruit juice, Watt’s Clear, a nectar with grapes and apple/raspberry flavoring, Pop from Bilz and Pap, Kem Xtreme Girl, the first zero-calory energy soft drink developed for women, Kem by Slice, Lipton Feel Green in two flavors and powder Gatorade. We have been in the bottled water business since 1960, and since December 2007 this business is conducted by Aguas CCU, which since June 2009 is 50.1% owned by us and 49.9% owned directly or indirectly by Nestlé Chile S.A. Under our two proprietary brand names, Cachantun and Porvenir, we bottled and nationally distribute mineral water from our own two natural sources located within the central region of Chile. In September 2008 we added the Nestlé Pure Life brand, a purified water of the highest quality standards produced and distributed under a license with Nestlé Chile S.A.. In addition, we distribute the imported brand Perrier. We also produce, bottle and/or distribute sports drinks (Gatorade) and tea (Lipton) under a license with PepsiCo and our own brand energy drinks (Kem Extreme) as well as energy drinks under a license with PepsiCo (imported SoBe Adrenaline Rush).
In November 1994, we merged our soft drink and mineral water businesses with the one owned by BAESA in Chile (PepsiCo’s bottler at that time) creating ECUSA for the production, bottling, distribution and marketing of soft drink and mineral water products in Chile. Thereafter, we began producing PepsiCo brands under license (currently Pepsi, Pepsi Light, Seven Up, Seven Up Light, Mirinda, Gatorade and Lipton Ice Tea). On November 29, 1999, we purchased 45% of ECUSA’s shares owned by BAESA for approximately CLP54,118 million. Since that date, we own 100% of ECUSA’s shares. However, we have had control of ECUSA since January 1998 after the shareholders agreement was amended. In January2001, ECUSA and Schweppes Holdings Ltd. signed an agreement to continue bottling Crush and Canada Dry brands. See “– Non-Alcoholic Beverage Production and Marketing in Chile.”
36
The Chilean Non-Alcoholic Beverage Market. Commercial soft drink production was first established in Chile by us in 1902, and mineral water production began in 1960. In July 1977 CCU signed a contract with Watt’s which enabled the Company to start the production and distribution of nectars under the same brand.
The soft drink market in Chile consists of both carbonated and non-carbonated beverages. The principal types of carbonated beverages are colas and non-colas. The principal non-carbonated beverages are fruit nectars and fruit juices, which are estimated to have accounted for approximately 15% of our total non-alcoholic beverage sales by revenues in 2011.
The table below sets forth our estimates of total and per capita consumption of non-alcoholic beverage in Chile during each of the last five years:
|
|
|
|
|
|
|
|
|
|
|
Non-Alcoholic Beverage Sales |
| |||||||||
| Volume(1) |
| Liters Per Capita(2) |
| ||||||
| (in millions of liters) |
|
|
| ||||||
Year | CarbonatedSoft Drinks | Nectars(3) | Mineral Water | Total |
| CarbonatedSoft Drinks | Nectars (3) | Mineral Water | Total |
|
|
| |||||||||
2007 | 1,940 | 255 | 174 | 2,369 |
| 117 | 15 | 10 | 143 |
|
2008 | 1,989 | 287 | 186 | 2,461 |
| 119 | 17 | 11 | 147 |
|
2009 | 1,953 | 296 | 183 | 2,432 |
| 115 | 17 | 11 | 143 |
|
2010 | 2,037 | 335 | 193 | 2,568 |
| 119 | 20 | 11 | 150 |
|
2011 | 2,070 | 379 | 206 | 2,654 |
| 120 | 22 | 12 | 154 |
|
|
|
|
|
|
|
|
|
|
|
|
(1) Based on our sales data, publicly available information from competitors, equity research analyst reports, information from Nielsen and ...... .... ..ANBER. | ||||||||||
(2) Population estimated in accordance with Chile’s national census of April 2002. |
| |||||||||
(3) Includes liquid juices, nectars, fruit beverages and artificial juices. |
| |||||||||
The following table sets forth our estimates as to the percentage of total carbonated soft drinks production in Chile, represented by each of the two principal categories of carbonated soft drinks during the last three years:
|
|
|
|
Type | 2009 | 2010 | 2011 |
|
|
|
|
Colas | 58% | 58% | 57% |
Non-colas | 42% | 42% | 43% |
Total | 100% | 100% | 100% |
Since the creation of the ECUSA joint venture in November 1994, the two principal soft drinks producer groups in Chile have been (i) the licensees of The Coca-Cola Company (“TCCC”), consisting of three companies with 14 bottling plants (subject to the approval of regulatory authorities, two of the companies, Andina and Coca Cola Polar, will merge in 2012) and (ii) us. Since August 1998, private labels have had an increasing participation in the industry which has declined in time and represented 2% of the total carbonated soft drink sales in Chile in 2011. Distribution of these brands is concentrated in the supermarket channel where they constituted a 10% market share in 2011. Additionally, discount brand producers have entered the market and represented 4% of the soft drinks market in 2011. Due to the strong presence of local producers, the high cost of transportation and the existing returnable bottle system that accounts for a large portion of soft drink sales volume, we believe that there is no significant market for imported soft drinks in Chile, which were estimated to represent less than 1% of all soft drinks sales by volume in 2011.
37
The bottled water market in Chile is comprised of both carbonated and non-carbonated mineral water, and purified water. As with the soft drink market, approximately 94% of all mineral water in Chile is processed and marketed by two entities, us and Vital Aguas S.A., a subsidiary of the three licensees companies of TCCC in Chile. Our mineral water products have been produced by ECUSA since November 1994. We had approximately 13% participation in the purified water market segment in 2011, according to Nielsen, after introducing Nestlé Pure Life at the end of September 2008.
Wholesale and retail prices of both soft drinks and water products are not regulated in Chile. We believe that the key factors determining retailers’ prices include any national and/or local price promotions offered by the manufacturer, the nature of product consumption (on-premise or take-out), the type of product packaging (returnable or non-returnable), the applicable tax structure, the desired profit margins and the geographical location of the retailer.
Our Non-alcoholic Beverage Production and Marketing in Chile. Our non-alcoholic beverageproduction and marketing in Chile generated net sales of CLP201,512 million, CLP223,476 million and CLP248,509 million or 25.9%, 26.7% and 25.6% of our total net sales, in the last three years, respectively.
38
The following table shows the soft drink and water brands produced and/or sold by us through ECUSA during 2011:
Brand
| Product | Category | Affiliation(1) |
Bilz | Soft Drink | Non-Cola Proprietary | CCU Proprietary |
Pap | Soft Drink | Non-Cola Proprietary | CCU Proprietary |
Bilz Light | Soft Drink | Non-Cola Proprietary | CCU Proprietary |
Pap Light | Soft Drink | Non-Cola Proprietary | CCU Proprietary |
Kem | Soft Drink | Non-Cola Proprietary | CCU Proprietary |
Kem Light | Soft Drink | Non-Cola Proprietary | CCU Proprietary |
Kem Xtreme
| Soft Drink | Functional | CCU Proprietary |
Kem Xtreme Girl
| Soft Drink | Functional | CCU Proprietary |
Pop | Soft Drink | Non-Cola Proprietary | CCU Proprietary |
Nobis | Soft Drink | Non-Cola Proprietary | CCU Proprietary |
Canada Dry Ginger Ale | Soft Drink | Non-Cola Licensed | Schweppes Holdings Ltd. |
Canada Dry Ginger Ale Light | Soft Drink | Non-Cola Licensed | Schweppes Holdings Ltd. |
Canada Dry Agua Tónica | Soft Drink | Non-Cola Licensed | Schweppes Holdings Ltd. |
Canada Dry Agua Tónica Light | Soft Drink | Non-Cola Licensed | Schweppes Holdings Ltd. |
Canada Dry Limón Soda | Soft Drink | Non-Cola Licensed | Schweppes Holdings Ltd. |
Canada Dry Limón Soda Light | Soft Drink | Non-Cola Licensed | Schweppes Holdings Ltd. |
Crush | Soft Drink | Non-Cola Licensed | Schweppes Holdings Ltd. |
Crush Light | Soft Drink | Non-Cola Licensed | Schweppes Holdings Ltd. |
Pepsi | Soft Drink | Cola Licensed | PepsiCo |
Pepsi Light | Soft Drink | Cola Licensed | PepsiCo |
Seven-Up | Soft Drink | Non-Cola Licensed | PepsiCo |
Seven-Up Light | Soft Drink | Non-Cola Licensed | PepsiCo |
Lipton Ice Tea | Ice Tea | Non-Cola Licensed | PepsiCo |
Mirinda | Soft Drink | Non-Cola Licensed | PepsiCo |
Gatorade | Isotonic | Functional | PepsiCo |
SoBe Adrenaline Rush | Energy | Functional | PepsiCo |
Kem Slice | Soft Drink | Non-Cola Licensed | PepsiCo |
Frugo | Soft Drink | Licensed | Promarca |
Watt’s | Nectars | Licensed | Promarca |
Watt’s Light | Nectars | Licensed | Promarca |
Watt’s Ice Frut | Nectars | Licensed | Promarca |
Watt's Soya
| Nectars | Licensed | Promarca |
Watt's Clear | Nectars | Licensed | Promarca |
Cachantun
| Mineral Water | Proprietary | Aguas CCU-Nestlé |
Mas de Cachantun
| Mineral Water | Proprietary | Aguas CCU-Nestlé |
Mas Woman
| Mineral Water | Proprietary | Águas CCU-Nestlé |
Porvenir
| Mineral Water | Proprietary | Aguas CCU-Nestlé |
Perrier
| Mineral Water | Licensed | Nestlé Waters M&D |
Glacier
| Purified Water | Proprietary | Aguas CCU-Nestlé |
Nestlé Pure Life
| Purified Water | Licensed | Nestlé S.A.&others |
(1) NOTE: CCU owns directly or indirectly 50% of Promarca and 50.1% of Aguas CCU. |
| ||
In 1994, ECUSA and Cadbury Schweppes plc (“Cadbury Schweppes”), the latter through its subsidiaries CS Beverages Ltd. and Canada Dry Corporation Ltd., entered into license agreements for all Cadbury Schweppes products. On December 11, 1998, TCCC announced an agreement with Cadbury Schweppes to acquire certain of the latter's international beverage brands, including those licensed to ECUSA, and in August 1999 the agreement was reported to have been consummated. In September 2000, after more than a year’s litigation, both in Chile (suits at civil courts and antitrust authorities) and England (arbitration under ICC rules), ECUSA and TCCC reached an agreement superseding ECUSA’s previous license contracts with CS Beverages Ltd. and Canada Dry Corporation Ltd. The new agreement, referred to as the“Bottler Contract,” was executed between ECUSA and Schweppes Holdings Ltd., concerning the Crush and Canada Dry brands, and was approved by the Chilean antitrust commission, thus putting an end to the proceeding regarding the Cadbury Schweppes brands issue and dismissing all complaints filed in consideration of the agreement. On January 15, 2009, the parties executed an amendment to the Bottler Contract which, among others, extended its duration until December 31, 2018 renewable for consecutive five-year periods provided that certain conditions are fulfilled.
39
In March 2006, ECUSA signed new exclusive bottling agreements with PepsiCo, Inc. and its subsidiary Seven-Up International, respectively, authorizing ECUSA to produce, sell and distribute Pepsi products in Chile. The contracts terminate on March 31, 2020.
Likewise, in March 2006, a new exclusive bottling agreement was executed between ECUSA and Stokely Van-Camp, Inc., a subsidiary of PepsiCo, Inc., authorizing ECUSA to bottle, sell and distribute Gatorade products in Chile, for an initial term ending on March 31, 2010, automatically renewable for successive two or three-year periods if certain conditions set forth in the contract are met. In August 2002, we began importing, selling and distributing Gatorade, the world’s number one isotonic drink. Since October 2006, we have been producing Gatorade locally.
In November 2007, ECUSA signed an exclusive bottling agreement with Pepsi Lipton International Limited, authorizing ECUSA to produce, sell and distribute ready to drink tea beverages in Chile. This agreement terminates on March 31, 2020.
In addition, ECUSA has been granted the exclusive license to produce and distribute our proprietary brands Bilz, Pap and Kem. This license agreement had an initial ten-year term commencing November 1994, and is automatically renewable for six additional five-year periods. The license agreement was renewed in 2004.
The license agreement for nectar products with Watt’s, which granted us exclusive production rights, was first signed in June 1977 and originally had a 33-year term. In February 1999, a new license agreement was signed allowing us to produce new flavors and bottle Watt’s nectars in non-returnable packaging (wide mouth glass and plastic bottles). A new license agreement between us and Watt’s was signed in July 2004. This new contract provided us with a ten-year license renewable automatically for three consecutive periods of three years if the conditions set forth in the contract are fulfilled at the date of renewal. In December 2006, we signed a joint venture agreement with Watt’s, under which we participate in equal parts in Promarca . This new company owns the brands “Watt’s”, “Ice Frut de Watt’s”, “Yogu Yogu” and “Shake a Shake” in Chile. Promarca granted its subsidiaries, for an indefinite period, the exclusive licenses for the production and sale of the different product categories.
In June 2003, we entered into the purified water business with our proprietary brand Glacier, increasing our water selection and reaching a larger amount of population with a more affordable product. The consumption of this product is currently concentrated in Antofagasta.
In October 2004, we relaunched Nobis, a traditional proprietary soft drink brand, to be used strategically against discount brands.
In February 2005, we launched a new Cachantun product, under the trademark Mas, a sugar free product made of mineral water, calcium and citric flavor, creating a new category of flavored water.
In December 2007, we entered into an agreement with Nestlé Chile S.A. and Nestlé Waters Chile S.A., the latter of which acquired a 20% interest in our subsidiary Aguas CCU, the company that owns the assets through which we develop our bottled water business in Chile. As part of this new association, Aguas CCU produces and sells the Nestlé Pure Life brand in Chile under a license contract of the same date, with an initial term of five years, renewable for successive periods of five years if certain conditions are met. Nestlé had a call option to increase its ownership in Aguas CCU by an additional 29.9%, which expired on June 5, 2009. On June 4, 2009 ECUSA received the notification from Nestlé Waters Chile S.A. exercising its irrevocable option to buy 29.9% of Aguas CCU equity, within the scope of the association contract. Since the materialization of the sale, ECUSA holds 50.1% of the participation in Aguas CCU. CCU owns directly or indirectly 99.94% of ECUSA’s equity.
Under each license agreement, we have the exclusive right to produce, sell and distribute the respective licensed products in Chile. Generally, under our license agreements, we are required to maintain certain standards of quality with respect to the production of licensed products, to achieve certain levels of marketing and, in certain cases, to fulfill minimum sales requirements. We believe that we are in compliance with the material requirements of all our license agreements.
40
During the last three years, we sold our non-alcoholic beverageproducts in the following packaging formats:
|
|
|
|
|
|
|
| Carbonated Soft Drinks, Nectars and Juices | Mineral and Purified Water | ||||
Container | 2009 | 2010 | 2011 | 2009 | 2010 | 2011 |
Returnable(1) | 36% | 0% | 0% | 6% | 0% | 0% |
Non-returnable(2) | 62% | 0% | 0% | 94% | 0% | 0% |
“Post-Mix”(3) | 2% | 0% | 0% | - | - | - |
Total | 100% | 100% | 100% | 100% | 100% | 100% |
|
|
|
|
|
|
|
(1) Returnable soft drink containers include both glass and plastic bottles of assorted sizes. Returnable water containers include glass bottles of assorted sizes and returnable 20-liter jugs. | ||||||
(2) Non-returnable soft drink containers include glass and plastic bottles, and aluminum cans of assorted sizes. Non-returnable water containers include plastic bottles and certain glass bottles of assorted sizes. | ||||||
(3) Post-mix cylinders are sold specifically to on-premise locations for fountain machines. | ||||||
We manufacture most of our returnable and non-returnable plastic bottles and obtain all of our glass bottles and cans from third-party suppliers. See “– Raw Materials” and “– Our Other Businesses”.
The following table shows the sales volume of our soft drinks and water by category during each of the last three years ( in millions of liters):
| Category | 2009 | 2010 | 2011 |
Colas |
|
|
| |
| Licensed | 84 | 85.3 | 85.1 |
Non-colas |
|
|
| |
| Proprietary | 184.6 | 207.5 | 213.6 |
| Licensed | 130 | 141.4 | 152.2 |
Nectars |
|
| ||
| Licensed | 78.5 | 91.7 | 104.3 |
Soft drinks total | 477.1 | 525.9 | 555.2 | |
Mineral water |
|
|
| |
| Proprietary | 113.6 | 118.8 | 126.7 |
| Licensed | - | - | - |
Purified water |
|
|
| |
| Proprietary | 5.1 | 6.1 | 6.3 |
| Licensed | 4.2 | 8.2 | 10.9 |
Total Water | 122.9 | 133.2 | 143.8 | |
Total Soft drinks and Water | 600 | 659.1 | 699.1 | |
41
The following table shows the sales volume of our soft drinks (carbonated and non-carbonated) by affiliation during each of the last three years (in millions of liters):
|
|
|
|
|
|
| Affiliation | 2009 | 2010 | 2011 |
|
| Soft drinks |
|
|
|
|
| Proprietary | 184.6 | 207.5 | 213.6 |
|
| Schweppes | 115.3 | 124.0 | 129.6 |
|
| PepsiCo | 98.7 | 102.7 | 107.7 |
|
| Promarca(1) | 78.5 | 91.7 | 104.3 |
|
| Water |
|
|
|
|
| Proprietary(2) | 118.7 | 124.9 | 133.0 |
|
| Nestlé Waters | 4.2 | 8.2 | 10.9 |
|
| Total | 600 | 659.1 | 699.1 |
|
|
|
|
|
|
|
(1) As of December 2009, we own 50% of the rights to the Watt’s brand (nectar), currently held through our......affiliate Promarca. | |||||
(2) As of December 2009 we own 50.1% of the rights to all the water brands held through the affiliate Aguas-CCU. | |||||
Raw Materials and other supplies. The principal raw materials used in the production of non-alcoholic beverages are water, sugar, flavoring concentrates and in the case of carbonated products, carbon dioxide gas. We generally purchase our sugar requirements from Empresas Iansa S.A., the sole producer of sugar in Chile, and from imports. We purchase flavoring concentrates for our licensed soft drink brands from the respective licensing companies. See “Our Soft Drinks and Mineral Water Production and Marketing in Chile.” Flavoring concentrates for our proprietary brands are purchased from third-party suppliers in Chile and Germany, which manufacture the concentrates under contract with us. We obtain carbon dioxide gas from Praxair.
We also require fruit pulp, juices, citric acid, other artificial and natural flavors, and chemical substances. Although water does not represent a major raw material cost, it is nonetheless essential in the production of soft drinks. We obtain all of our water from wells located at our plants and/or from public utilities. The water is treated at facilities located at our plants to remove impurities and adjust the characteristics of the water before it is added to the production process.
We own two mineral water sources in Chile from which the Cachantun and Porvenir brand mineral water products are obtained. These water sources are located in two areas near Santiago: Coinco and Casablanca, respectively. All of our mineral water products are bottled at their respective sources and distributed throughout the country. Purified water is produced with water pumped from our wells located in the plant.
We maintain testing facilities at each of our plants in order to analyze raw materials. Additionally, samples of soft drinks and water are inspected at various stages of production to ensure product quality.
We generally purchase the glass bottles used in packaging soft drinks and mineral water from the major supplier in Chile, Cristalerías Chile under a three-year agreement. Other sources, both local and international, can be used, however no imports of glass were made during 2011. While aluminum cans used in packaging of our soft drinks are generally purchased from Rexam, a global supplier with a factory in Chile. We manufacture most of our own plastic returnable and non-returnable bottles from imported polyethylene terephthalate resins (“PET”), which we purchase from various suppliers (USA, China, Mexico). We obtain the labels for our soft drinks and water products principally from local suppliers. Crowns are currently imported from Brazil and Mexico.
Prices of principal raw materials used in soft drink production in Chile are tied to the U.S. dollar and have varied in Chilean pesos because of general commodity price fluctuations in international markets as well as the variation of the Chilean peso against the U.S. dollar.
42
We believe that all of the contracts or other agreements between us and third party suppliers with respect to the supply of raw materials for soft drinks and water products contain standard and customary commercial terms and conditions. With the exception of soft drink concentrates purchased from Schweppes Holdings Ltd. and PepsiCo under the license agreements described under “Our Soft Drinks and Mineral Water Production and Marketing in Chile” we believe we are not dependent on any one supplier for a significant portion of our raw materials. Historically, we have experienced no significant difficulties in obtaining adequate supplies of necessary raw materials at satisfactory prices and expect that we will be able to continue to do so in the future.
Sales, Transportation and Distribution in Chile. We have the capacity to reach 101,747 customers with our direct sales force, as well as through Comercial CCU and Comercial Patagona. ECUSA, our non- alcoholic beverage subsidiary, manages its own sales force that is directly responsible for the exclusive servicing of soft drinks and water clients in all the cities in the center of Chile, Concepción and San Fernando, that is, in the territories not covered by Comercial CCU or Comercial Patagona. The ECUSA sales force of 367 salesmen as of December 2011, directly sells to approximately 61,583 customers. We had no single customer that accounted for more than 2% of our sales by volume, with the exception of four large supermarket chains that represented in the aggregate 26% of our sales by volume. During 2011, the Chilean supermarket industry continued to consolidate, increasing the importance and purchasing power of a few supermarket chains. We do not maintain any long-term contractual arrangements for the sale of soft drinks and/or mineral and purified water with any of our customers.
In October 2005, we launched Comercial CCU, the subsidiary in charge of a single sales force dedicated to selling all of our beverage and sweet snacks products, so as to capture synergies and focus on sales execution. As of 2008, the territory covered by Commercial CCU S.A. has expanded to include the north of Chile from Arica to Copiapó/Vallenar and the south, from Curicó to Coyhaique except for the cities of Concepción and San Fernando. SeeBusiness Overview-Summary-Distribution Network.
Our Chilean soft drinks and water customers make payments for our products either in cash at the time of delivery or in accordance with one of our credit arrangements. Payment on credit sales is generally due 30 days from the date of delivery. Credit sales accounted for 40%, 42% and 43% of ECUSA’s soft drink and water sales to third parties in Chile in the last three years, respectively. Losses on credit sales of soft drinks and mineral water in Chile have not been significant.
We distribute our soft drinks and mineral water products throughout Chile to:
· off-premise retail: small and medium-sized retail outlets, which in turn sell to consumers for take-out consumption;
· on-premise retail: retail establishments such as restaurants, hotels and bars for on-premise consumption;
· wholesalers; and
· supermarket chains.
In the last three years, the percentage mix of the above distribution channels for our carbonated soft drinks, nectars, and mineral and purified water products in Chile was as follows:
| Percentage of Non-Alcoholic Beverage | ||
| Products Sold | ||
Distribution Channels | 2009 | 2010 | 2011 |
Off-premise retail | 39% | 33% | 33% |
On-premise retail | 16% | 26% | 27% |
Wholesalers | 11% | 10% | 10% |
Supermarkets | 34% | 31% | 31% |
Total | 100% | 100% | 100% |
43
The following table sets forth the changes in the average price per liter to our customers for non alcoholic products for the periods indicated:
| Avarage price per liter | ||
| Non-Alcoholic Beverage Products | ||
| (in CLP per liter) | ||
| 2009 | 2010 | 2011 |
Carbonated Soft Drinks | 320.33 | 326.09 | 344.16 |
Nectars | 443.86 | 442.81 | 458.26 |
Mineral Water | 284.05 | 275.23 | 280.51 |
Total Average | 329.05 | 332.05 | 348.08 |
% growth | 3.7 | 0.9 | 4.8 |
Seasonality in Chile. Due to the seasonality of sales for both soft drinks and water products, our sales and production volumes are normally at their lowest in the second and third calendar quarters and at their highest in the first and fourth calendar quarters (i.e., those months corresponding to holidays and summer vacation season in Chile).
The following table shows our annual sales volume of soft drinks and water by quarter for the last three years:
|
|
|
|
|
Non-Alcoholic Beverage | ||||
Year | Quarter | Sales Volume | % of Annual |
|
| Sales Volume |
| ||
| (millions of liters) |
| ||
2009 | 1st quarter | 165.2 | 27.5 |
|
| 2nd quarter | 123.4 | 20.6 |
|
| 3rd quarter | 132 | 22 |
|
| 4th quarter | 179.4 | 29.9 |
|
| Total | 600 | 100 |
|
|
|
|
|
|
2010 | 1st quarter | 181.4 | 27.5 |
|
| 2nd quarter | 135.6 | 20.6 |
|
| 3rd quarter | 149.5 | 22.7 |
|
4th quarter | 192.6 | 29.2 |
| |
| Total | 659.1 | 100 |
|
|
|
|
|
|
2011 | 1st quarter | 188.2 | 26.9 |
|
| 2nd quarter | 142.3 | 20.4 |
|
| 3rd quarter | 160.2 | 22.9 |
|
4th quarter | 208.4 | 29.8 |
| |
| Total | 699.1 | 100 |
|
Competition in Chile.Our principal competitors in the soft drink business are companies, which produce, bottle and distribute soft drinks in Chile under licenses from TCCC and its affiliates. TCCC’s products are produced, bottled and distributed in Chile through three separate licensees which market soft drinks under the Coca-Cola, Coca-Cola Light, Coca-Cola Zero, Fanta, Fanta Light, Sprite, Sprite Zero, Quatro Light, Nordic Mist, Taí, Andina nectars and juices, and Kapo juice brand names. According to store audits conducted by Nielsen, Coca-Cola and related brands accounted for approximately 68% of total carbonated soft drink sales volume in 2011. However, calculations made by us are higher than the Nielsen estimates.
44
During 1998, a few supermarket chains began selling soft drinks products under private labels. Additionally, discount brand producers along with private labels represent approximately 7% of the soft drink market in 2011 according to Nielsen. Even though these brands are not a significant portion of the industry, their presence may increase in the future.
After the formation of ECUSA in 1994, our market share decreased as a consequence of increasing marketing activity on the part of our competitors and the entrance of private labels and discount brand producers to the market. However, according to Nielsen during 2011, our carbonated soft drink market share increased to approximately 24.8% and CCU’s estimate for the total non-alcoholic beverage market participation was 29.4%.
Our market share for our carbonated soft drink products over the last five years is presented in the following table based on store audits conducted by Nielsen and our own estimates. These Nielsen results are, for each year, higher than our own estimates.
|
|
|
Our Chilean Carbonated Soft Drink Market Share | ||
|
|
|
Year | Nielsen | Company Estimates (*) |
|
|
|
2007 | 23% | 19% |
2008 | 24% | 19% |
2009 | 24% | 20% |
2010 | 24% | 21% |
2011 | 25% | 21% |
|
|
|
(*) Based on our sales data, publicly available information from competitors, equity research analyst reports, information from Nielsen and ANBER. | ||
Our domestic competitors in the soft drinks business have benefited from both internationally recognized brand labels (especially with regard to the Coca-Cola product line) and a large number of local bottling companies distributing their products throughout Chile. As a result of the formation of ECUSA, we also similarly benefited from the internationally recognized Pepsi brand as well as our previous competitive strengths, which include a portfolio of nationally well-known brands and a nationwide distribution system. During 2002, we launched Bilz Light, Pap Light, Agua Tónica Light and Gatorade. In April 2003, we introduced to the market Kem Xtreme, a soft drink with a high level of caffeine. In September 2004, we launched Canada Dry Ginger Ale Light, and in October 2004, we re-launched Nobis, a traditional proprietary soft drink brand, to be used strategically against discount brands. In September 2006, we launched Canada Dry Limón Soda Light. In January 2007, we introduced two new products into the market: (i) Slice by Kem, a tropical fruit flavored soft drink, and (ii) SoBe Adrenaline Rush, an energy drink sold under PepsiCo license. In November 2007, we entered into a new product category, ice tea, with the brand Lipton Ice Tea, produced under the PepsiCo license. During 2008 we introduced Watt’s Soya from Promarca (50% owned by us), and Nestlé Pure Life, a well-known purified water brand, in order to place ourselves in a leading position in the healthy foods market. In 2009, the Company introduced Mas Woman from Cachantun, a mineral water in a variety of flavors targeted towards young healthy women. In addition, in the same year, the Company began to import the renowned mineral water Perrier. In 2011 we introduced several new product offerings including Pop from Bilz and Pap, Kem Xtreme Girl the first zero calorie energy soft drink developed specifically for women, Kem by Slice, Lipton Feel Green in two flavors and powder Gatorade.
Given the high percentage of soft drink sales volume in returnable containers coupled with the high cost of transportation to Chile, the market for imported soft drinks in Chile is not significant and accounted for less than 1% of total sales by volume in 2011. While there are no legal barriers to entry, we believe that the existing returnable bottle system and high transportation costs may continue to deter potential competitors from exporting soft drinks to Chile.
45
Fruit nectars under the trade name “Watt’s,”,a segment of our soft drink business, face competition from other liquid and powdered juices, which are provided by a variety of local companies. After seven yearssince the re-launch of Watt’s nectar, we have continuously been the market leader in the bottled category of nectars, with a market share of 56% during 2011, according to Nielsen. In 2011 we introduced several new product offerings, including Frugo a soft drink containing fruit juice, and Watt’s Clear a nectar with grapes and apple/raspberry flavoring.
Our principal competitor in the mineral water business is Vital S.A. (a subsidiary of Embotelladora Andina S.A., one of TCCC licensees in Chile). We estimate that our sales of Cachantun and Porvenir brand mineral waters accounted for approximately 58%, while those of Vital S.A. products accounted for approximately 35% of total mineral water sales by volume in 2011. Small domestic bottlers, private labels and discount brands, as well as imported mineral water products, comprise the remaining 7% sales volume.
The following chart shows estimates of our mineral water market share for the last five years based on store audits conducted by Nielsen and our own estimates. These Nielsen results are, for each year, higher than our own estimates.
|
|
|
Our Chilean Mineral Water Market Share | ||
|
|
|
Year | Nielsen | Company Estimates (*) |
|
|
|
2007 | 69% | 63% |
2008 | 66% | 61% |
2009 | 68% | 62% |
2010 | 67% | 62% |
2011 | 66% | 62% |
|
|
|
(*) Based on our sales data, publicly available information from competitors, equity research analyst reports, information from Nielsen and ANBER. Does not consider Glacier and/or Nestlé Pure Life purified water sales. | ||
Our Wine Business
Overview. We entered the Chilean wine market in October 1994 with the purchase of 48.4% of VSPT’s equity for approximately CLP17,470 million, thereby acquiring an interest in the third-largest winery in Chile (formerly VSP). During the first half of 1995, VSPT’s capital was increased by approximately CLP14,599 million, of which we contributed approximately CLP7,953 million. From August through October 1997, VSPT’s capital was increased again by approximately CLP11,872 million, of which we contributed approximately CLP6,617 million, plus approximately CLP191 million in additional shares bought during October 1997 in the local stock market. Furthermore, in October 1998 and during 1999, we purchased additional shares in VSPT through the local stock exchanges for an amount of approximately CLP5,526 million. From March through June 1999, VSPT’s capital was increased by approximately CLP17,464 million, of which we contributed approximately CLP10,797 million. Between November 2000 and March 2001, VSPT’s capital was increased by approximately CLP22,279 million, of which we contributed approximately CLP13,402 million. During October and November 2005, VSPT’s capital was increased by approximately CLP346 million. We did not participate in this capital increase. Between April and June 2007, VSPT’s capital was increased by approximately CLP13,692 million, of which we contributed approximately CLP5,311 million. On December 3, 2008, the extraordinary shareholders’ meetings of VSP and VT approved the merger of both companies. The merged company was named “Viña San Pedro Tarapacá S.A.” (VSPT), which began consolidating its financial statements with ours starting on October 1, 2008, with operations commencing on December 9, 2008. In December 2008, VSPT’s capital was increased, as a consequence of the merger by issuing 15,987,878,653 shares to be exchanged for the total number of shares issued by Viña Tarapacá at a ratio of 1,480.30828 new VSPT shares per each of the absorbed company. As of December 2011, our total ownership interest in VSPT was 50.01%.
46
We believe that having entered into the Chilean wine business provided us with the opportunity to further exploit our nationwide distribution system through the expansion of our beverage portfolio. We also believe that the development of our domestic wine business helps to reduce the seasonality of our sales, as wine sales in Chile tend to be stronger during the winter months when beer and soft drinks consumption decline.
The proceeds from VSPT’s capital increase during 1995 were used to reduce debt, expand capacity and add new hectares of vineyards in the Maipo Valley for producing premium red wines. Part of VSPT’s capital increase during 1997 was used to add new hectares of vineyards in Requinoa, Chépica and Molina during 1997, and in Pencahue during 1998. These purchases of land more than doubled the number of hectares of our vineyards. The winery also increased its total vinification and wine storage capacity in both tanks and barrels from 52.1 million liters at December 31, 1998, to 62.1 million liters at December 31, 2007, as well as its peak bottling and packaging capacity from 35,100 liters per hour in 1998 to 67,500 liters per hour at December 31, 2007. As a result of the merger with Viña Tarapacá in December 2008, the vinification and storage capacity grew by approximately 50%, to 52 and 92 million liters, respectively. Likewise, the bottling and packing capacity increased to 75,300 liters an hour in Chile. The capital increase in 1999, was used to pay debts related to the winery’s expansion process. The proceeds from VSPT’s capital increase during November 2000 and March 2001 were used to finance the winery’s acquisition of FLC, in Mendoza, Argentina, to plant the hectares of this new winery and improve its production facilities, as well as to refinance debt. The proceeds from VSPT’s 2007 capital increase were used mainly to acquire shares in Viña Altaïr S.A. and Viña Tabalí S.A. due to respective increases in the capital of both of these entities, to acquire from Château Dassault the remaining interest in Viña Altaïr S.A. and for working capital.
In December 2001, Viña Santa Helena (“VSH”) created its own commercial and productive winemaking operation, distinct from its parent, VSPT, under the Viña Santa Helena label in the Colchagua Valley.
In August 2003, VSPT formed Viña Tabalí S.A., a joint venture in equal parts with Sociedad Agrícola y Ganadera Río Negro Ltda. for the production of premium wines. This winery is located in the Limarí valley, Chile’s northernmost winemaking region, which is noted for the production of outstanding wines. In January 2007, Viña Tabalí S.A. acquired Viña Leyda, a boutique winery located in the Leyda Valley that produces well-regarded quality wines. Consequently, Viña Tabalí S.A. changed its name to Viña Valles de Chile S.A.
In October 2004, VSPT acquired the well-known Manquehuito Pop Wine brand, a sparkling fruit-flavored wine with low alcohol content, broadening its range of products.
In September 2007, VSPT bought a 50% interest in Viña Altaïr S.A. which belonged to Château Dassault, in line with our strategy of focusing on premium wines. As a consequence VSPT owns 100% of said company.
At VSPT’s Extraordinary Shareholders meeting held on July 7, 2005, the shareholders voted to increase the number of board members from 7 to 9 and approved a capital increase that will be partially used for stock option programs.
In December 2008, VSP and VT merged and created a new wine group, VSPT.VSPT is formed by the wineries San Pedro, Tarapacá, Santa Helena, Misiones de Rengo, Altaïr, Viña Mar, Casa Rivas, FLC, Bodega Tamarí, and Viña Valles de Chile (Viña Leyda and Viña Tabalí).These are all important and renowned cellars in Chile and Argentina, each with its own distinctive brands, and they represent the best wines these terrains can deliver. Since the merger, VSPT became the second-largest Chilean wine exporter and the third most important actor in the local market.
In September 2011, at the Board Meeting of VSPT, it was agreed to divide Viña Valles de Chile S.A. (VDC) whose owners were VSPT and Agrícola y Ganadero Río Negro Limitada (ARN), by equal parts. VDC had two major vineyards: Viña Tabalí and Viña Leyda. Through this agreement, VSPT remains the 100% owner of Viña Leyda (whose net assets remain within VDC) and ARN remains the 100% owner of Viña Tabalí. This transaction concluded on December 29, 2011, through a stock swap contract, and thereafter VDC became a subsidiary of VSPT with a percentage of direct and indirect participation of a 100%.
47
The Chilean Wine Market. We estimate that wine consumption in Chile amounted to approximately 13 liters per capita in 2011. Given that the Chilean wine industry is fragmented, no single wine producer accounts for the majority of production and/or sales.The leading wineries include, other than VSPT, ViñaConcha y Toro S.A. (“Concha y Toro”), Viña Santa Rita S.A. (“Santa Rita”) and Bodegas y Viñedos Santa Carolina S.A. (“Santa Carolina”). In addition, there are numerous medium-sized wineries, including Viña Undurraga S.A. (“Undurraga”), Cousiño Macul S.A. (“Cousiño Macul”), and Viña Cánepa y Cía. (“Cánepa”) and Viña Montes. All wineries, which sell wine products that comply with industry and tax regulations, make up Chile’s formal wine market. VSPT is a member of the formal wine market, as are most other principal wineries in Chile. The informal wine market is composed of many small wine producers. The Agricultural and Livestock Service (Servicio Agrícola Ganadero, or “SAG”) is the entity in charge of wine industry regulation and principally oversees inventory records and product quality. We estimate that the formal market wineries produced and sold approximately 224 million liters of wine during 2011.
The following chart shows our estimates for the formal wine market and per capita consumption levels for wine in Chile for the last five years:
|
|
| |
Year | Total Volume (1) | Per Capita(2) | |
| (in millions of liters) | (liters) | |
2007 | 244 | 15 | |
2008 | 230 | 14 | |
2009 | 228 | 13 | |
2010 | 227 | 13 | |
2011 | 224 | 13 | |
|
|
| |
Sources: Central Bank and the Wineries of Chile Association, competitors’ public information and Nielsen. | |||
(1) Includes wine sales from pisco producers in Regions III and IV of Chile. | |||
(2) Population estimated in accordance with Chile’s national census of April 2002. | |||
Wines in Chile can be segmented by product type. Chilean wineries produce and sell premium, varietal and popular-priced wines within the domestic market. Premium wines and many of the varietal wines are produced from high-quality grapes, aged and packaged in glass bottles. Popular-priced wines are usually produced using non-varietal grapes and are not aged. These products are generally sold in either cartons or jug packaging.
VSPT’s Production and Marketing. VSPT (formerly VSP) was founded in 1865. Its principal vineyards are located in Molina, approximately 200 kilometers south of Santiago. The VSPT estate in Molina is one of the largest single-site vineyards in Chile with an area of 1,200 hectares. As of December 31, 2011, VSPT’s vineyards covered an aggregate of 3,658 hectares in Chile, distributed among eleven different plantations. The winery also has 357 hectares under long-term lease. In Argentina, we have another 532 hectares located in the province of Mendoza.
VSPT is one of Chile’s largest producers and distributors of wine in terms of sales volume and net sales. In 2010 and 2011 our wine segment sales amounted to CLP132,293 million and CLP138,348 million, respectively, representing 15.8% and 14.3% of our total net sales, respectively.
48
The following chart indicates the breakdown of VSPT’s volume in the domestic and export markets, including sales from FLC and Tamarí in Argentina:
|
|
|
|
|
| Year | Domestic Volume | Export Volume | Total Volume (1) |
|
| (in millions of liters) | ||
| 2007 | 50.2 | 55.5 | 105.8 |
| 2008 | 50.7 | 50.3 | 101.0 |
| 2009 | 54.2 | 67.8 | 122.0 |
| 2010 | 60.0 | 70.0 | 130.0 |
| 2011 | 60.0 | 67.1 | 127.1 |
|
| |||
(1) Includes bulk sales exports in Chile and Argentina | ||||
VSPT is composed of nine different wineries in Chile and one in Argentina. During 2011 VSPT initiated the process to merge Bodega Tamari into Finca La Celia, both vineyards located in Mendoza, Argentina. The merge is in its final stage. In addition, on December 2011 Viña Valles de Chile, a former non-consolidating subsidiary, was split and VSPT remained 100% owner of the resulting new vineyard of the same name whose principal asset is Viña Leyda. Therefore, we began consolidating the results of Viña Valles de Chile in December 2011.
Viña Altair, Viña del Mar Casablanca, Viña Misiones de Rengo, Viñas Orgánicas SPT, Viña San Pedro Tarapacá, Viña Santa Helena, Viña Urmeneta, Viña Valles de Chile, Vitivinícola del Maipo in Chile, and Finca La Celia in Argentina, produce and market premium, varietal and popular-priced wines.The principal brands are set forth below:
Brand | Icon | Premium | Varietal | Popular-Priced |
Viña San Pedro Tarapacá |
|
|
|
|
Cabo de Hornos | X |
|
|
|
Tarapakay | X |
|
|
|
Kankana del Elqui |
| X |
|
|
Tierras Moradas |
| X |
|
|
1865 |
| X |
|
|
Gran Reserva Etiqueta Negra |
| X |
|
|
Tarapacá Gran Reserva |
| X |
|
|
Tarapacá Zavala |
| X |
|
|
Castillo de Molina |
| X |
|
|
Gran Tarapacá |
| X |
|
|
Tarapacá Terroir |
| X |
|
|
Las Encinas |
| X |
|
|
Tarapacá Reserva |
| X |
|
|
35 South Reserva |
| X |
|
|
35 South |
|
| X |
|
Urmeneta |
|
| X |
|
Gato Negro |
|
| X |
|
Tarapacá Varietal |
|
| X |
|
León de Tarapacá |
|
| X |
|
Gato |
|
|
| X |
Manquehuito Pop Wine |
|
|
| X |
Etiqueta Dorada |
|
|
| X |
49
|
| |||
Viña Santa Helena |
|
|
|
|
D.O.N (De origen Noble) | X |
|
|
|
Notas de Guarda |
| X |
|
|
Parras Viejas |
| X |
|
|
Vernus |
| X |
|
|
Selección del Directorio |
| X |
|
|
Santa Helena Reserva |
|
| X |
|
Santa Helena Varietal |
|
| X |
|
Siglo de Oro |
|
| X |
|
Gran Vino |
|
|
| X |
Viña Misiones de Rengo |
|
|
|
|
Misiones de Rengo Cuvée |
| X |
|
|
Misiones de Rengo Reserva |
| X |
|
|
Misiones de Rengo Varietal |
|
| X |
|
Viña Mar |
|
|
|
|
Viña Mar Reserva Especial |
| X |
|
|
Viña Mar Reserva |
| X |
|
|
Viña Mar Espumante |
| X |
|
|
Casa Rivas |
| X |
|
|
Viña Altaïr |
|
|
|
|
Altaïr | X |
|
|
|
Sideral |
| X |
|
|
Viña Leyda |
|
|
|
|
Leyda Lot | X |
|
|
|
Leyda Reserva |
| X |
|
|
Leyda Single Vinyard |
| X |
|
|
Bodega Tamarí |
|
|
|
|
Malbec Reserve |
| X |
|
|
Torrontes Reserva |
| X |
|
|
Malbec Varietal |
|
| X |
|
Finca la Celia |
|
|
|
|
Supremo |
| X |
|
|
La Celia |
| X |
|
|
La Consulta |
|
| X |
|
Furia |
|
|
| X |
Gato |
|
| X |
|
Magallanes |
|
| X |
|
The following table presents our breakdown of total sales volume in thousands of liters by category of VSPT’s Chilean wines during 2011:
|
|
|
|
Category | Domestic | Export | Total |
| (in thousands of liters) | ||
Premium | 3,231 | 8,504 | 11,736 |
Varietal | 5,660 | 44,181 | 49,841 |
Popular-Priced | 49,005 | 4,353 | 53,358 |
Bulk | 0 | 4,939 | 4,939 |
Total | 57,896 | 61,978 | 119,874 |
50
|
|
|
|
Category | Domestic | Export | Total |
| (in thousands of liters) | ||
Premium | 453 | 1,029 | 1,482 |
Varietal | 1,312 | 3,461 | 4,773 |
Popular-Priced | - | - | - |
Bulk | 347 | 622 | 969 |
Total | 2,112 | 5,112 | 7,224 |
As of December 31, 2011, VSPT’s storage capacity totaled 91.9 million liters and its peak bottling and packaging capacity totaled 72,600 liters per hour (excluding 3.4 million liters of storage capacity in Viña Valles de Chile S.A. which, as explained before, we began consolidating in December 2011).
Domestic Market. Our Chilean domestic wine is packaged in bottles, jugs, cartons, and bag-in-box containers at VSPT’s production facilities in Lontué, Molina and Isla de Maipo. The following chart shows our packaging mix for domestic wine sales for the last three years:
|
|
|
|
| Percentage of Total Domestic | ||
| Wine Sold in Chile | ||
Container | 2009 | 2010 | 2011 |
|
|
|
|
Carton | 67% | 68% | 63% |
Glass Bottles | 33% | 32% | 37% |
Bag-in-Box | 0% | 0% | 0% |
Total | 100% | 100% | 100% |
Beer is the principal substitute product for wine in Chile. In addition, our wine products may also compete with other alcoholic beverages, such as spirits (mainly pisco), and with non-alcoholic beverages, such as soft drinks and juices.
The average price for our domestic wine customers was CLP758.5 and CLP842.4 per liter in 2010 and 2011, respectively, experiencing a growth of 11.1%. Our wine price policy is mainly determined as a consequence of four factors: a) market prices, b) change in sales mix, c) inflation rate and d) desired profit margin in relation to costs of raw materials.
Export Market. According to industry sources, exports of Chilean wine increased from approximately 43 million liters in 1990 to 664 million liters in 2011, at a compounded annual growth rate of 13.9%. During 2010 and 2011, Chilean wine exports reached 733 million liters and 664 million liters, respectively. The 9.4% volume decrease from 2010 to 2011 was due to the shift of focus towards selected destination markets with better margins and competitive advantages. We believe that Chilean wine exports have grown steadily due to their comparatively low prices and positive international image, as well as due to external factors, such as low wine production in the Northern Hemisphere in certain years.
VSPT exported, 67.8 million liters 70.0 million liters and 67 million liters of wine in the last three years, respectively. During 2011, VSPT exported wine to more than 80 countries worldwide. Exports accounted for net sales of CLP86,505 million and CLP83,961 million in 2010 and 2011, respectively. In 2011, VSPT’s primary export markets included Brazil, the United States, Finland, Paraguay, China and Netherlands.
51
Most exported wine is sold in glass bottles, except for a certain quantity of unbranded wine that is occasionally sold in bulk, as well as the amount that is sold in bag-in-box containers. The following chart shows our packaging mix for export Chilean wine volume in the last three years:
| Percentage of Total Export | ||
| Wine Volume from Chile | ||
Container | 2009 | 2010 | 2011 |
|
|
|
|
Glass Bottles (1) | 72% | 77% | 80% |
Bulk | 17% | 12% | 8% |
Carton | 12% | 10% | 12% |
Total | 100% | 100% | 100% |
|
|
|
|
(1) Includes jugs. |
|
|
|
We experienced an increase of 1.8% from CLP1,280.8 per liter in 2010 to CLP1,304.3 in 2011 in the average price to our Chilean export wine customers mainly due to a stronger Chilean peso as compared to the exports destination countries’ currencies, given that the U.S. dollar export average price increased.
Raw Materials and other supplies. The principal raw materials and packaging materials that VSPT uses in its production process are purchased and harvested grapes, purchased wine, bottles, carton containers, corks and cardboard boxes. VSPT obtained approximately 54% of the grapes used for export wines from its own vineyards during 2011. Of the wine sold in the domestic market, 4% are grapes from our vineyards, 12% of grapes are purchased and vinified for us and the rest is purchased from third parties, tested to assure compliance with our quality standards and blended at the winery before packaging. In 2011, approximately 68% of the wine used in domestic sales was purchased from ten local producers: Corretajes Vinicola Patacon SPA, CPCh, Agro Comercial Metropolitana Ltda., Torres y Cía. Ltda., RR Wine LTDA, Viña Saavedra Ltda., Viñedos Errázuriz Ovalle S.A, Aguilera y Barrios Ltda., Vinícola Los Cerrillos y Cia Ltda., and Coop. Vitiv. Loncomilla Ltda. VSPT has various alternative sources of supply, which can be used when they are attractive. VSPT’s bottles are principally purchased from Cristalerías Chile and Saint Gobain; however, when prices have been favorable, VSPT has purchased bottles from other local and international suppliers. Carton containers are purchased either from Tetra Pak de Chile Comercial Ltda. or from SIG Combibloc Inc. and are assembled in VSPT’s own automated packing lines.
The prices of the principal raw materials used in the production of wine in Chile have experienced some recent volatility. In addition, from time to time, prices of grapes and wine can vary depending on fluctuations in demand and supply factors.
Domestic Sales, Transportation and Distribution. After production, bottling, and packaging, wine is either stored at the production facilities or transported to one of 21 warehouses. The warehouses are part of our warehouse network and are located throughout Chile. VSPT wines is distributed and sold in Chile through our sales and distribution network, under the same system and payment terms as all our other products. See “Item 4: Information on the Company- Business Overview-Summary-Distribution Network”
We distribute our wine products throughout Chile, in the territories not covered by Comercial CCU or Comercial Patagona, with our own sales force, to:
· off-premise retail: small and medium-sized retail outlets, which in turn sell wine to consumers for take-out consumption;
· on-premise retail: retail establishments such as restaurants, hotels and bars for on-premise consumption;
· wholesalers; and
· supermarket chains.
52
For the last three years, the percentage mix of the above distribution channels for our wine products in Chile was as follows:
| Percentage of Total Wine Products Sold | ||
|
|
|
|
Distribution Channels | 2009 | 2010 | 2011 |
|
|
|
|
Off-premise retail | 27% | 26% | 29% |
On-premise retail | 5% | 6% | 6% |
Wholesalers | 28% | 29% | 28% |
Supermarkets | 40% | 38% | 37% |
Total | 100% | 100% | 100% |
VSPT sales force of 144 salesmen as of December 2011, sells our wine products directly to approximately 7,596 customers, none of which accounted for more than 2% of our total wine sales by volume, with the exception of four supermarket chains that represented 30%. We do not maintain any long-term contractual arrangements for the sale of wine with any of our customers.
Export Sales, Transportation and Distribution. VSPT has a presence in more than 80 countries. In order to increase its presence in the international market, VSPT has distribution agreements with key distributors, such as Pernod Ricard in Sweden, Finland, Norway and Estonia, Shaw Ross International in the U.S., a subsidiary of Southern Wine and Spirits, a major wholesale distributor that has been recognized as the best U.S. distributor by Wine Enthusiast Magazine, DGS and Baarsma in Holland and Denner in Switzerland. In Canada we have distribution agreements with Diamonds Wines, in Korea with Keumyang, as well as agreements with other distributors. In France and Germany VSPT has distribution agreements with LGCF and with Direct Wines in the United Kingdom.
��
Geographical Markets. In Chile, Santiago and surrounding areas (referred to as the Metropolitan Region), which account for approximately 40% of the Chilean population, represented approximately 38% of total domestic sales of VSPT products by volume in 2011.
The following table provides the distribution of VSPT’s exports from Chile during 2011 by geographical markets:
|
|
| Percentage |
Market | Volume (1) | of Total Exports | |
| (thousands of liters) |
| |
|
|
|
|
Europe | 24,317 | 43% | |
Latin America | 17,348 | 30% | |
USA and Canada | 8,853 | 16% | |
Others | 6,502 | 11% | |
Total | 57,020 | 100% | |
(1) Excludes bulk exports |
|
| |
Competition. The wine industry is highly competitive in both the domestic and the export markets. VSPT’s domestic market share was approximately 25% in 2011. In Chile, VSPT competes directly against all other Chilean wineries. We believe that VSPT’s primary domestic competitors, Concha y Toro and Santa Rita, derive their relative competitive strengths from their wide portfolio of products, well-recognized brand names and established distribution networks. In 2011, Concha y Toro and Santa Rita had a market share of approximately 30% and 29%, respectively. VSPT also competes with Santa Carolina and numerous medium-sized wineries, including Undurraga and Cousiño Macul, and many small wine producers that make up Chile’s informal wine market.
Internationally, VSPT competes against Chilean producers as well as with wine producers from other parts of the world. According to information compiled by the Wineries of Chile Association, VSPT is the second-largest exporter of Chilean wines with a market share of approximately 12% in 2011, excluding bulk wine. Our other principal Chilean competitors, namely Concha y Toro, Santa Rita and Santa Carolina had market shares of 34%, 6% and 5%, respectively.
53
Our Spirits Business
Overview. In February 2003, we added a new product to our beverage portfolio, pisco, which began selling under the brand Ruta Norte, and was produced by our subsidiary Pisconor S.A. Pisco is a distilled wine spirit, very popular in Chile, produced exclusively in Region III and IV of Chile and in the southern regions of Peru.
In March 2005, we entered into an association agreement with the second-largest pisco producer in Chile, Control. A new entity, CPCh, was created, after Pisconor and Control contributed their assets and commercial brands. Currently we own 80% of CPCh and Control owns the remaining 20%.
In May 2007, CPCh entered the rum category, the second most consumed spirit in Chile and the then fastest growing spirit category. The alcohol to produce the rum is imported and we finish the production process locally. We sell rum under our proprietary brand “Sierra Morena”.
During 2008, we added several pisco and pisco based cocktail brands as well as new varieties of its rum brand to its portfolio.
In June 2010 CPCh purchased Fehrenberg, a small, but well-recognized spirits brand produced in Chile.
In July 2011 CPCh began the distribution of Pernod Ricard products (Chivas Regal, Ballantine’s, Havana Club, Beefeter and Absolut among others) through the traditional channel, that is exept supermarkets with centralized distribution. In December 2011, the subsidiary Compañía Pisquera de Chile S.A. (CPCh) signed a license agreement for the commercialization and distribution of the Bauzá brand of pisco in Chile. In addition, this transaction also considers the acquisition by CPCh of 49% of the licensor society Compañía Pisquera Bauzá S.A., owner of the brand Bauzá in Chile.
The Chilean Pisco and Rum Markets. Traditionally, beer, wine and pisco have been the principal alcoholic beverages consumed in Chile. We estimate that annual pisco consumption in Chile was 36 million liters, or approximately 2.1 liters per capita in 2011. In addition, we estimate that annual rum consumption in Chile was 23 million liters, or approximately 1.4 liter per capita during 2011.
The table below sets forth our estimates of pisco and rum consumption in Chile during each of the last five years:
|
|
|
|
|
Year | Total Pisco Sales Volume (1) | Pisco per Capita (2) | Total Rum Sales Volume (1) | Rum per Capita (2) |
| (in millions of liters) | (liters) | (in millions of liters) | (liters) |
|
|
|
|
|
2007 | 40.6 | 2.4 | 15.5 | 0.9 |
2008 | 38.0 | 2.3 | 20.2 | 1.2 |
2009 | 35.7 | 2.1 | 21.4 | 1.3 |
2010 | 35.8 | 2.1 | 23.9 | 1.4 |
2011 | 36.3 | 2.1 | 23.4 | 1.4 |
|
|
|
|
|
(1) Based on our sales data and information from Nielsen. Includes FAB in the case of pisco |
| |||
(2) Population estimated in accordance with Chile’s national census of April 2002. |
| |||
54
We estimate that total pisco consumption in Chile decreased at a four-year compounded annual growth rate of 2.8% between 2007 and 2011. During 2011, the pisco market increased 1.3%. We estimate that total rum consumption in Chile increased at a four-year compounded annual growth rate of 10.7% between 2007 and 2011. During 2011, the rum market decreased 2.1% from the prior year, as a result of changes in consumers’ preferences and wider selection of imported liquors due to a stronger Chilean peso.
Wholesale and retail prices of pisco are not regulated in Chile. Wholesale prices are subject to negotiation between the producer and the purchaser. Retailers establish the final consumer price. We believe that the key factors determining retailer prices include national and/or local price promotions offered by the producer, the nature of product consumption (on-premise or take-out), the applicable tax structure, the desired profit margins and the geographical location of the retailer.
Spirits Production and Marketing in Chile. Our production of spirits in Chile generated net sales of CLP43,218 million and CLP50,936 million representing 5.2% and 5.3% of our total net sales in 2010 and 2011, respectively. The increase experienced in 2011 is mainly due to the introduction of more premium beverages producing a higher value sales mix.
We produce and market ultra-premium, premium, medium-priced and popular-priced pisco brands in Chile, as well as premium and medium-priced rum. The following table shows our principal pisco brands:
|
|
|
|
|
Ultra premium | Premium | Medium-priced | Medium-priced | Popular-priced |
pisco brands | pisco brands | pisco brands | RTD brands | pisco brands |
Control | 3RRR | Campanario | Campanario Sour | La Serena |
Control C | Mistral | Ruta Norte | Campanario Sour Light |
|
Mistral Nobel | Mistral Creme | Mistral Ice | Campanario Pica |
|
Mistral Gran Nobel | Bauzá (1) | Mistral Ice Mango | Campanario Berries |
|
MOAI |
|
| Campanario Chirimoya |
|
Horcón Quemado |
|
| Campanario Cola de Mono |
|
|
|
| Campanario Dulce de Leche |
|
|
|
| Campanario Lúcuma |
|
|
|
| Campanario Mango |
|
|
|
| Campanario Melón Calameño |
|
|
|
| Campanario Melón Tuna |
|
|
|
| Campanario Piña Colada |
|
|
|
| Campanario Vaina |
|
|
|
| Ruta Sour |
|
|
|
| Ruta Sour Light |
|
|
|
| Ruta Sour Pica |
|
|
|
| Ruta Berries |
|
|
|
| Ruta Mango |
|
|
|
| Ruta Manzana |
|
|
|
| Ruta Pica |
|
|
|
| Ruta Piña Colada |
|
|
|
| Macerado |
|
(1) Distribution License |
|
|
| |
After the completion of the CPCh transaction with Control, we expanded our proprietary brand portfolio considerably, adding brands such as Campanario in the mainstream and cocktail categories (which accounts for 43% of our pisco sales), as well as Control C, Mistral Nobel and Tres Erres in the ultra-premium segment, Mistral in the premium segment and La Serena in the convenience category.
In the rum market, our proprietary brands are Cabo Viejo in the standard-priced segment, Sierra Morena Añejado in the medium-priced segment, Sierra Morena Extra Añejado in the premium segment and Sierra Morena Imperial in the ultra-premium segment.
55
In 2011, our spirits were produced at four plants which are located in Regions III and IV of Chile. The bottling process was done in the Ovalle plant bottling facility. Horcón Quemado and Fehrenberg are produced and bottled in a third-party plant.
Raw Materials and other supplies. The principal raw and packaging materials used in our production of pisco and rum are purchased grapes, purchased wine, cane alcohol, bottles, caps and cardboard boxes. Grapes are purchased under long-term contracts with members of Control. Nevertheless, various alternative sources of supply can be used when they are attractive. Cane alcohol is imported from Panamá and the Dominican Republic. We mainly purchase bottles from Cristalerías Chile and Cristalerías Toro. All of our spirits are bottled in non-returnable glass bottles at our production facilities.
The price of grapes, wine and alcohol used in pisco production has been volatile based on demand and supply factors.
We believe that all of the contracts or other agreements between us and third-party suppliers, with respect to the supply of raw materials for pisco and rum products, contain standard and customary commercial terms and conditions. With the exception of our long term contract with Control, we do not believe we are dependent on any one supplier for a significant portion of our important raw materials. During the past years, we have not experienced any material difficulties in obtaining adequate supplies of necessary raw materials at satisfactory prices, nor do we expect to in the future.
Sales, Transportation and Distribution. We have the capacity to reach 21,190 customers either directly through our dedicated sales force or through Comercial CCU’s sales force. As of December 31, 2011, our dedicated sales force of 94 salesmen served 9,330 customers in the territories where Comercial CCU and Comercial Patagona do not operate. This system enables us to maintain frequent contact with our customers, obtain more timely and accurate marketing-related information and maintain good working relationships with our retail customers. See “– Business Overview–Summary–Distribution Network.” None of our customers accounted for more than 3% of our total spirits sales by volume, with the exception of three large supermarket chains that represented in the aggregate 28% of total spirits sales. During 2011, the Chilean supermarket industry continued to consolidate, increasing the importance and purchasing power of a few supermarket chains. We do not maintain any long-term contractual arrangements for the sale of spirits with any of our customers in Chile.
Since 2003, after production, bottling and packaging, our spirits are either stored at one of our production facilities or transported to a network of 21 owned or leased warehouses which are located throughout Chile. These warehouses are part of CCU’s sales and distribution system.
Our customers make payment for our products either in cash at the time of delivery or in accordance with one of various credit arrangements. Payment on credit sales for spirits is generally due 51 days from the date of delivery. Credit sales accounted for 51% of our spirits sales in Chile in 2011. Losses on credit sales of spirits in Chile have not been significant.
We distribute our spirits throughout Chile to:
· supermarket chains,
· off-premise retail: small and medium-sized retail outlets, which in turn sell spirits to consumers for take-out consumption;
· on-premise retail: retail establishments such as restaurants, hotels and bars for on-premise consumption; and
· wholesalers.
56
In the last three years, the percentage of spirits sales attributable to each of these distribution channels in Chile was as follows:
Percentage of Total Spirits Sold | |||
|
|
|
|
Distribution Channels | 2009 | 2010 | 2011 |
Supermarkets | 40% | 41% | 38% |
Off-premise retail | 31% | 28% | 28% |
On-premise retail | 7% | 7% | 8% |
Wholesalers | 22% | 24% | 26% |
Total | 100% | 100% | 100% |
The following table sets forth our pisco sales volume, by category, during each of the last three years:
|
|
|
|
Category | 2009 | 2010 | 2011 |
| (in millions of liters) | ||
Ultra premium | 0.2 | 0.3 | 0.3 |
Premium | 5.9 | 6.6 | 7.5 |
Medium-priced | 2.9 | 2.6 | 2.3 |
Medium-priced mix(1) | 6.9 | 7.2 | 7.1 |
Popular-priced | 1.2 | 1.2 | 1.1 |
Total | 17.1 | 17.8 | 18.3 |
|
|
|
|
(1) Ice Blend, Sours and Cream cocktails |
|
|
|
The following table sets forth the changes in the average price per liter to our customers for spirits for the periods indicated:
|
| ||
| Spirits in Chile ( in CLP) | ||
|
|
|
|
| 2009 | 2010 | 2011 |
|
|
|
|
Average price per liter | 1,890.8 | 1,912.2 | 2,162.1 |
% growth | 5.2 | 1.1 | 13.1 |
Geographical Markets. Santiago and the surrounding areas (referred to as the Metropolitan Region) account for approximately 40% of the population of Chile and accounted for approximately 40.6% of our spirits sales by volume in 2011.
Competition. According to Nielsen figures, our share of the Chilean pisco market, over the last four years is as follows:
|
|
|
Year | Our Chilean Market Share for pisco (1) | |
| ||
2007 | 46% | |
2008 | 45% | |
2009 | 45% | |
2010 | 47% | |
2011 | 47% | |
(1) Source: Nielsen |
| |
57
Our principal competitor in the pisco business is Cooperativa Agrícola Pisquera Elqui Ltda. (“Capel"), which is the market leader. According to Nielsen numbers, we had 46.5% market share in 2011, although our internal estimate is somewhat higher (50.3%), including the Bauzá brand in the last bi-mester of 2011.
Our competitor Capel has nine production facilities located in Regions III and IV of Chile and distributes its products throughout the country. Capel uses its own sales force, as well as third-party distributors. Sales of Capel’s brands of pisco by volume accounted for approximately 53% of total pisco sales in 2009, 50% in 2010 and 50% in 2011, according to Nielsen figures. We estimate that Capel has an annual production capacity which allows it to process in excess of 105 million kilos of grapes, which almost doubles our grape processing capacity.
Pisco is a spirit that is produced only in the northern part of Chile and the southern part of Peru. For this reason, imported pisco is not a significant component of the Chilean pisco market. We estimate that imports accounted for less than 1% of total pisco sales by volume during 2011.
According to Nielsen calculations, our estimated average share of the Chilean rum market was 13% in 2009, 15.1% in 2010 and 17.7% in 2011. Our principal competitors by volume in the rum business are Mitjans S.A. and certain imported brands such as Pampero, Bacardi and Barceló.
Our Other Businesses
Plastic Bottles
Through our subsidiary Fábrica de Envases Plásticos S.A. (PLASCO), we own and operate a plastic factory in Renca which supplies most of the pre-forms, returnable and non-returnable bottles and closures, primarily used by us in the packaging of our soft drinks and water products. Additionally, PLASCO has bottle- blowing machines in ECUSA’s factory in Santiago and Antofagasta.
The manufacturing of both returnable and non-returnable plastic bottles involves a two-step process. The first step consists of an injection molding process, which manufactures pre-forms from PET resin. The second step involves blowing plastic bottles from the molded pre-forms. We purchase resin and complete the two-step process in order to fulfill the majority of our bottling requirements. In some cases, we purchase pre-forms manufactured by third-party suppliers and complete only the bottle-blowing step at our own facilities.
The manufacturing of plastic caps also involves a two-step process. The first step consists of a compress molding process, which manufactures caps from PP resin. The second step consists in the decoration of the plastic caps with an off set printing process.
Prices of principal raw materials required by our PLASCO subsidiary have been volatile during 2011. In addition, as in all other business segments, PLASCO’s energy costs had a significant increase.
In 2011, all pre-forms, returnable and non-returnable plastic bottle needs of ECUSA were supplied directly by PLASCO with the exception of five-liter bottles, which are bought by ECUSA in small quantities from third-party suppliers. During 2011, PLASCO sold 295million bottles. Of all bottles, approximately 91% were blown in PLASCO and manufactured with PLASCO pre-forms. The remaining 9% were produced with purchased pre-forms or purchased bottles. Our subsidiary also sold 123million pre-form.Of these,approximately 80% were manufactured by PLASCO and later blown into bottles by Aguas CCU-Nestlé Chile S.A.. The remaining 20% of pre-forms were produced and sold by PLASCO and blown in Ecusa with PLASCO bottle-blowing machines. PLASCO has, to date, not made any bottle sales to third parties. Plastic bottle and pre-form sales by volume increased from 393.1 million in 2010 to 417.6 million in 2011. During 2011 PLASCO sold 289.4 million of plastic caps (240 million in 2010).
PLASCO’s net sales of CLP30,453 million, EBIT of CLP2,566 million and net income of CLP1,433 million in 2011, represented an increase of 9.75 % and 13.6%, and a decrease of 20.3 %, respectively, over 2010.
58
Sweet Snacks
In January 2004, we entered the sweet snacks business by means of a joint venture between our subsidiary ECUSA (currently, this investment belongs to our subsidiary CCU Inversiones S.A.) and Empresas Lucchetti S.A. (currently, Industria Nacional de Alimentos S.A.), a subsidiary of Quiñenco, with a 50% interest each in Calaf S.A. (today, Foods), a corporation that acquired the trademarks, assets and know-how, among other things, of Calaf S.A.I.C. and Francisca Calaf S.A., traditional Chilean candy makers, renowned for more than a century. In August 2005, Calaf acquired the assets and know-how of Bortolaso S.A., a cookie factory with more than 50 years of existence in the country, enabling Calaf to increase its presence in the most important segment of the sweet snacks business. In October 2007, Calaf acquired the traditional cereal brand Natur, allowing Calaf to enter and commence growing in the quickly developing healthy foods category. In August 2008, Foods bought 50% of Alimentos Nutrabien S.A. the leading company in home-made sweet snacks products. The three brands –Calaf, Natur and Nutrabien– have niche products aimed at specific market segments. This niche segmentation along with enhancement in formula and raw materials, is expected to improve the company’s brand equity. We sell Foods’ products through CCU’s sales platform to 68,373 clients, with the potential to reach more than 110,000 clients and with a dedicated sales force that serves the supermarket chains.
Government Regulation
Government Regulation in Chile
We are subject to the full range of governmental regulation and supervision generally applicable to companies engaged in business in Chile. These regulations include labor laws, social security laws, public health, consumer protection, environmental laws, securities laws, and anti-trust laws. In addition, regulations exist to ensure healthy and safe conditions in facilities for the production, bottling, and distribution of beverages. As for environmental laws, see “– Environmental Matters.”
Regulations specifically concerning the production and distribution of “alcoholic beverages” are contained in Chilean Law N°18.455 and its Ordinance, which set the standards for human consumption of such beverages, by minutely describing the different types of alcohol; the minimum requirements that must be met by each class of beverage; raw materials and additives that may be used in their manufacture; their packaging and the information that must be provided by their labels; the procedure for their importation, among others.
Additional regulations concerning wine origin denominations are contained in Executive Decree N° 464 of the Ministry of Agriculture, dated December 14, 1994, which also laid out the wine-growing regions and set rules regarding grape varieties, vintage year, labeling and selling requirements. Pisco origin denominations, also applicable to us, are regulated in Executive Decree N° 521 dated May 27, 2000 of the Ministry of Agriculture and likewise contains provisions relating to pisco producing regions, raw material standards, manufacturing procedures, packaging and labeling.
The large-scale production of alcoholic beverages does not need any licenses or permits other than those required for the general run of commercial and industrial enterprises engaged in the manufacture of consumer commodities.
On January 19, 2004 Law N°19.925 was published, which amended and restated the Act on Sale and Consumption of Alcoholic Beverages (former Law N°17.105).
All establishments dealing in alcoholic beverages, whether wholesale or retail, require a special municipal license, the cost of which is fixed by the law and varies according to the nature of the outlet or point of sale (i.e. liquor store, tavern, restaurant, hotel, warehouse, etc.). We are in possession of all licenses necessary for our wholesale operations.Law N°19.925 set new opening and closing hours; limited geographical areas for the sale of alcohol; reduced the maximum number of licenses to be granted by zones and population; increased criminal liability for selling alcohol to persons under eighteen years of age; and tightened the restrictions, imposing prison sentences and higher fines, for violations formerly deemed lighter. One of its most important innovations isto forbid the sale of alcohol to minors at all outlets, and not just for on-premise drinking (the only exception retained is the case of children who are served meals when accompanied by their parents).
59
The regulatory agency for alcoholic beverages is the SAG.
The production, bottling and marketing of non-alcoholic beverages is subject to applicable sanitary legislation and regulations, particularly the Sanitary Code and the Food Ordinance (theReglamento Sanitario de los Alimentos).
Law N°19.937 which was enacted in February 2004, established a new structure and powers for the Sanitary Authority, became effective on January 1, 2005 and was fully operative by February 2006. TheServicios de Salud (“Health Services”) was replaced by the Ministry of Health’s Regional Offices, which constitute the new Sanitary Authorities, which inspected plants on a regular basis, taking samples for analysis, directing the adoption of new safety procedures and applying fines and other penalties for infringement of regulations.
The production and distribution of mineral water is also subject to special regulation. Mineral water may only be bottled directly from sources, which have been designated for such purpose by a Supreme Decree signed by the President of Chile. The competent Sanitary Authority provides a certification of the data necessary to achieve such a designation. All of our facilities have received the required designation.
Independently of the products manufactured or services provided in each plant or facility, the premises are also regularly inspected by the Sanitary Authorities, regarding sanitary and environmental conditions, labor safety, and related matters.
There are currently no material legal or administrative proceedings pending against us in Chile with respect to any regulatory matter. We believe that we are in compliance in all material respects with all applicable statutory and administrative regulations with respect to our businesses in Chile.
Government Regulation in Argentina
We are subject to the full range of governmental regulation and supervision generally applicable to companies engaged in business in Argentina, including social security laws, public health, consumer protection and environmental laws, securities laws and anti-trust laws.
National LawN°18,284 (the Argentine Food Code, or the “Code”) regulates the manufacturing and packaging of food and beverages. The Code provides specific standards with which manufacturing plants must comply and regulates the production of food and beverages mentioned in the Code. The Code also specifies the different methods in which beer may be bottled as well as the information to be provided on labels. National Law N° 24,788, enacted in March 1997, established the national minimum age requirements for the purchase of alcoholic beverages. Under this law the sale of alcoholic beverages is not permitted to persons under 18 years of age, and the health authorities of each province undertake the enforcement of the Code. In the Federal Capital and many provinces of Argentina, local law restricts the sale of alcoholic beverages, particularly between the hours of 11 p.m. and 8 a.m., and establishes harsh penalties for infringement.
The Argentine congress continues to consider proposed legislation to improve enforcement of drinking laws by limiting the hours permitted for the advertisement of alcohol products on radio and television as well as any content in such advertisement associating alcohol consumption with healthy activities.
There are currently no material legal or administrative proceedings pending against us in Argentina with respect to any regulatory matter. We believe that we are in compliance in all material respects with all applicable statutory and administrative regulations with respect to our business in Argentina.
60
Organizational Structure
Ownership Structure as of March 31, 2012
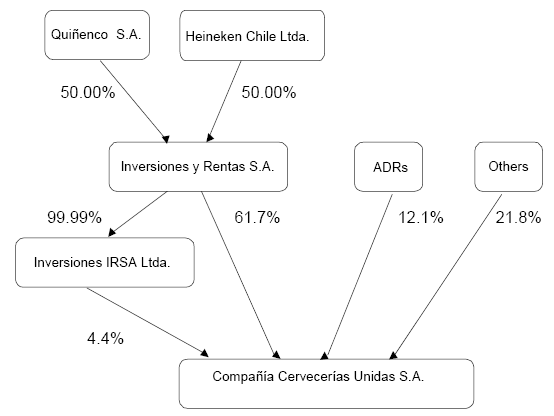
We are controlled by IRSA, which owns directly and indirectly 66.1% of the shares of our common stock. IRSA, since 1986, was a joint venture between Quiñenco and the Schörghuber Group through its wholly owed subsidiary FHI of the Netherlands. On April 2003, the Schörghuber Group sold FHI to Heineken Americas B.V., a subsidiary of Heineken International B.V. FHI and Heineken International B.V. formed Heineken Chile Ltda., through which 50% of IRSA shares are held. On December 30, 2003, FHI merged into Heineken Americas B.V. Currently, Quiñenco and Heineken Chile Ltda., a Chilean limited corporation controlled by Heineken Americas B.V., are the only shareholders of IRSA, each with a 50% equity interest.
Quiñenco is the holding company of one of Chile’s largest business conglomerates, with investments in various sectors of the Chilean economy. Quiñenco’s principal holdings include Banco de Chile (the second-largest bank in Chile), CSAV (the largest shipping company in America and one of the largest worldwide), ENEX (the second-largest retail fuel distributor) and Madeco S.A. (principal shareholder of French cable producer Nexans and leading manufacturer of flexible packaging, copper and aluminum-based products).
Heineken, the Dutch brewer, is one of the largest brewers in the world with 140 breweries in more than 70 countries and 64,252 employees worldwide. Heineken group beer volume was 164.6 million hectoliters during 2011, the principal brands being Heineken and Amstel.
The following table provides our significant subsidiaries as of March 2012:
Subsidiaries | Country | Ownership Interest |
CCU Chile | Chile | 100.00% |
CCU Argentina | Argentina | 100.00% |
ECUSA | Chile | 99.94% |
Aguas CCU-Nestlé | Chile | 50.10% |
VSPT | Chile | 50.01% |
CPCh | Chile | 80.00% |
61
Property, Plant and Equipment
Set forth below is information concerning our production facilities as of December 31, 2011, all of which are owned and operated by us or our subsidiaries:
| Nominal Installed | Utilized Capacity | Average Utilized | ||
| Monthly Production | During | Capacity | ||
| Capacity | Peak Month(1) | During 2011(2) | Facility Size(3) | |
| (in million liters) | (%) | (%) | (square meters) | |
| Beer Production Facilities | ||||
| Santiago | 54.3 | 96.6% | 72.3% | 151,781 |
| Temuco | 12.0 | 90.8% | 71.6% | 51,026 |
| Kunstmann | 0.9 | 90.5% | 70.1% | 5,019 |
| Chile Total | 67.2 | 95.5% | 72.1% | 207,826 |
| Santa Fe | 24.9 | 104.4% | 93.3% | 58,989 |
| Salta | 6.0 | 55.5% | 42.8% | 10,866 |
| Luján(4) | 28.4 | 77.7% | 55.3% | 113,869 |
| Argentina Total | 59.2 | 88.1% | 70.7% | 183,724 |
| Soft Drinks Production | ||||
| Santiago | 81.3 | 70.9% | 59.3% | 129,792 |
| Antofagasta | 17.7 | 28.0% | 15.9% | 36,789 |
| Total | 99.0 | 63.2% | 51.5% | 166,581 |
| Purified Water Production | ||||
| Santiago | 16.2 | 12.2% | 12.1% | 1,989 |
| Total | 16.2 | 12.2% | 12.1% | 1,989 |
| Mineral Water Production | ||||
| Coinco | 40.5 | 40.4% | 27.0% | 16,702 |
| Casablanca | 2.0 | 8.7% | 5.9% | 3,347 |
| Total | 42.5 | 38.9% | 26.0% | 20,050 |
(1) Based on the year ended December 31, 2011. Utilized Capacity During Peak Month is equal to production output as a percentage of Nominal Installed Production Capacity during our peak month for each respective plant.Nominal Installed Monthly Production Capacity is defined as production capacity for current product/packaging mix within 25 days per month and 3 shifts per day.The implicit slack (spare) capacity does not necessarily measure real slack capacity. We believe that real production capacity is less than the nominal installed production capacity as adjustments are required for real machinery performance, packaging mix, availability of raw materials and bottles, seasonality within the months and other factors. As a result, we believe that the peak monthly capacity utilization rates shown above understate real capacity utilization and that slack capacity is overstated. We estimate that during the peak month in 2011, the real slack capacity amounted to approximately 1.6 million liters in Chilean beer, 5.8 million liters in Argentine beer, 16.0 million liters in soft drinks , 14.2 million liters in purified water and 15.8 million liters in Chilean mineral water.
(2) Average Utilized Capacity during 2011 equals the plant’s total production output as a percentage of nominal installed annual production capacity in 2011. Nominal installed annual production capacity is calculated by multiplying the Nominal Installed Monthly Production Capacity by 11 months (on average, a one month period is required each year for maintenance and repairs). Given the seasonal nature of our beer production and sales, these figures underestimate capacity utilization during peak months.
(3) Facility size equals total built area including warehousing logistics activities.
(4) Includes Cider Production (Mendoza, Pilar and Cuidadela Plants).
Because these figures are calculated across various sku (products/packaging combination), the results correspond to averages and therefore, no investments decisions should be made based solely on these figures.
62
Our installed vinification and storage capacity is shown in the table below:
| Installed Vinification | Storage Capacity inTanks | Facility |
| Dinamic Capacity (1) | and Barrels | Size |
| (million liters) | (million liters) | (square meters) |
Wine Production Facilities |
|
|
|
Lontué | - | 12.9 | 24,709 |
Molina | 28.0 | 38.8 | 50,307 |
Totihue | 0.7 | 0.8 | 5,374 |
Santa Helena | 2.5 | 2.5 | 7,134 |
Tarapacá | 8.5 | 13.1 | 27,481 |
Viña Mar | 2.4 | 3.1 | 8,086 |
Casa Rivas | 2.4 | 3.0 | 4,315 |
Misiones de Rengo | 6.0 | 7.9 | 17,174 |
Chile Total | 50.5 | 82.1 | 144,580 |
|
|
|
|
Finca La Celia | 7.5 | 7.5 | 9,675 |
Tamarí | 2.0 | 2.3 | 3,418 |
Argentina Total | 9.5 | 9.8 | 13,093 |
|
|
|
|
(1): Considers on average two times utilization fermentation tank capacity. |
| ||
As of December 31, 2011, VSPT had a nominal filling capacity of 29,280 liters per hour at its Lontué plant, 26,820 liters per hour at its Molina plant, 9,000 liters per hour at its Tarapacá Plant, 1, 050 liters per hour at its Misiones de Rengo Plant and 1,500 liters per hour at its Viña Mar Plant. At FLC in Argentina, VSPT had a nominal filling capacity of 6,000 liters per hour.
Our installed spirits production capacity is shown in the table below:
| Installed Production | Facility Size | |
| Capacity (1) | (square meters) | |
| (million liters) | ||
| Spirits Production Facilities | ||
| Pisco Elqui | 1.20 | 12,032 |
| Sotaquí (2) | - | 12,078 |
| Monte Patria | 12.54 | 33,726 |
| Salamanca | 2.92 | 8,746 |
| Ovalle (3) | 33,974 | |
| Total | 16.7 | 100,556 |
(1): 26ºGL
(2): Sotaqui Planta, only produced wines.
(3): Ovalle Plant is a bottling.
As of December 31,2011, we had a nominal bottling capacity of 10,385 liters per hour at our Ovalle Plant (18,028 square meters).
For information regarding environmental matters, see “– Environmental Matters.”
63
Environmental Matters
Chile
Our operations are subject to both national and local regulations in Chile relating to the protection of the environment. Regarding human health, the fundamental law in Chile is the Health Code, which establishes minimum health standards and regulates air and water quality, as well as sanitary landfills. The local Sanitary Authority is the governmental entity in charge of the enforcement of these rules and has the faculty to impose fines.
The environmental framework is given by Law N°19,300, enacted in 1994, as amended, which includes not only environmental protection rules but also ones concerning the preservation of natural resources. Among other matters, it creates the environmental impact assessment system which requires any future project or major amendment of an existing activity that may affect the environment to evaluate the possible impacts, in order to fulfill related regulations and to implement mitigation, compensation and restoration measures. Our latest projects have been successfully submitted to this system, where the environmental national public entity, the National Environmental Commission (orComision Nacional del Medio Ambiente, or “CONAMA”), has given the respective authorizations.
The Law N°19,300 also creates a mechanism of point sources emission limits and environmental quality standards that are developed and detailed by specific regulations. In this sense, there is a special regulation for wastewater discharges into sewage system, and another regulation for wastewater discharges into superficial water bodies, in both cases pursuant to a schedule of deadlines. Over the years, CCU implemented specific action plans in each operation, optimizing those emissions and, based on the location and wastewater quality, invested in highly efficient treatment plants. Such plants are also designed to generate boiler-suitable biogas. In all material respects, we are in compliance with the Act and the regulations, having fulfilled at each relevant stage all requirements prescribed by them.
Through the enactment of Law N°20,417 in 2010 (amending Law N°19,300) a new Ministry of Environment was established, which will gradually replace the CONAMA. This new governmental body is now responsible for the development, implementation and enforcement of various instruments regarding environmental management in relation to standards, protection of natural resources, environmental education and pollution control, among other responsibilities.
Due to the high levels of air pollution in the Santiago metropolitan area, the Authorities have implemented a decontamination plan, which includes different levels of air quality, and certain measures that can be imposed to industries. In case of emergency situations, those companies comprising the industries classified as producing the highest emissions of particle and gas emissions must suspend their activities. In all material respects, we comply with current regulations applicable to both our beer and soft drink facilities in the Santiago metropolitan area.
There are currently no material legal or administrative proceedings pending against us in Chile with respect to any environmental matter. We believe that we are in compliance in all material respects with all applicable environmental regulations.
Argentina
New laws and regulations are being enacted in Argentina as a result of heightened community concerns for environmental issues. As a consequence, there are several statutes imposing obligations on companies regarding environmental matters at the federal, provincial, and municipal levels. On many occasions, private entities operating public utilities such as water supply and sewage, are in charge of controlling and enforcing those regulations. Many of these regulations have been recently enacted and little precedent exists as to their scope. All three of CCU’s breweries have been awarded theCertificado de Aptitud Ambiental (Environmental Aptitude Certificate) which is the principal document endorsing the companies environmental management in each provincial state.
64
In addition, according to CCU policy and environmental targets, CCU has obtained the ISO 14001:2004 certification for the Luján Plant, and established a plan to obtain the same certification for the Santa Fé Plant during 2011. Further, CCU is committed to obtaining the EcoSello certification for the Salta Plant in 2012.
The most important environmental statute in Argentina is the Hazardous Waste Act (Law N°24,051) which, although a federal law, has been strictly adhered to by fourteen of the twenty-three provinces. When certain federal tests indicate the need, the provisions of the Hazardous Waste Act are enforced. The application of the provisions of the Hazardous Waste Act depends upon the magnitude of the public health risk and whether those conditions exist in more than one province. Hazardous waste is defined so as to cover any residue that may cause harm, directly or indirectly, to human beings that may pollute the soil, water, atmosphere or the environment in general. Generally, claims involving hazardous waste give rise to strict liability in the event of damage to third parties. In addition, each province in which we operate facilities has enacted environmental legislation with broad and generic goals, as well as water codes and related agencies to regulate the use of water and the disposal of effluents in the water.
Over the last several years CCU Argentina has implemented a complete program for the treatment of its industrial waste, which involves the separation, collection, and reusing of the generated solid waste as well as a wastewater treatment plant. The waste program is part of our constant effort to improve environment-related conditions. The principal features of the plant are its productions of biogas which is used as boiler fuel, its minimum space requirements and its low electric power consumption.
The regulation of matters related to the protection of the environment is not as well developed in Argentina as in the United States and certain other countries. Accordingly, we anticipate that additional laws and regulations will be enacted over time with respect to environmental matters. While we believe that we will continue to be in compliance with all applicable environmental regulation, we cannot assure you that future legislative or regulatory developments will not impose restrictions on us, which could result in material adverse effects.
ITEM 4A: Unresolved Staff Comments
Not applicable.
ITEM 5: Operating and Financial Review and Prospects
Overview
We are a diversified beverage company operating principally in Chile and Argentina. We are the largest brewery in Chile, the second-largest brewery in Argentina, the second-largest soft drink producer in Chile (after the largest Coca-Cola bottler), the largest mineral water and bottled nectar producer in Chile, the second-largest purified water producer, the second-largest wine producer in Chile, the second-largest Chilean wine exporter and the largest pisco producer in Chile. We also participate in the sweet snacks, rum and other spirits industries in Chile. Our beer and soft drink products include a wide range of proprietary, licensed and imported brands.
We face certain key challenges and risks associated with our business. These risks include competition within the market place, managing operating costs and the integration and expansion of new products. We currently have approximately 80.2% of the Chilean beer market; however, competitors are investing in this market and launching new products, therefore, we must concentrate on competitive pricing and marketing strategies to maintain our market share. Operating costs are subject to variations depending on plant efficiency, product mix and production cycles, and also on US$ commodities prices and the rate of exchange from Chilean pesos to US$ or Euro. Our principal costs include cost of raw and packaging materials, distribution and marketing costs. We continue to sell and deliver new products to our customers, including products through new licensing agreements and new products through internal development.
65
The analysis of our results is based on financial statements prepared in accordance with IFRS as issued by the IASB. Since we adopted IFRS in 2009, only the three most recent years are considered in the discussion.
In 2011, we reached new historical records in sales volumes, net sales revenues and EBIT, obtaining an EBIT of CLP190,760 million. We had consolidated net sales of CLP969,551 million, of which 32.3% was accounted for by our beer sales in Chile, 20.4% by our beer sales in Argentina, 25.6% by our non-alcoholic beverages sales in Chile, 14.3% by wine sales, 5.3% by spirits sales and the remainder by sales of other products and/or consolidation eliminations. Our net sales revenues increased 15.7% over the prior year as we increased sales of existing products and had a higher average price per product. EBIT increased 17.7% as a result of a combination of higher gross profit, and the exceptional profit generated by the settlement of the insurance claims related to the February 27, 2010 earthquake in Chile, partially offset by higher expenses and a severance payment related to the cider business in Argentina acquired in December 2010. The net profit attributable to equity holders of the Parent Company increased 10.9% primarily due to higher EBIT, better Other gains and lower Net financing expenses, partially offset by lower Results of indexed units, higher Income tax and Non-controlling interest.
Impact of the February 27, 2010 Earthquake and Tsunami
On February 27, 2010, an 8.8 magnitude earthquake struck the central and south regions of Chile.The earthquake’s impact on CCU’s operations related primarily to damage to infrastructure, inventory destruction and business interruptions, which was adequately covered by our insurance policies. The recovery plan and controls put in place by CCU proved to be effective and brought operations back to normality with minimal unavoidable product supply interruption.
As of December 31, 2010, we had received a material portion of our total estimated losses in payouts under such policies in the amount of CLP21,722 million. In 2011 CCU received the final payment for the losses amounting to CLP21,896 million for a total amount of CLP43,618 million collected from insurance companies. This amount, received in compensation for the losses caused by the February 27, 2010 earthquake, had a CLP13,289 million positive exceptional effect on our 2011 financial results, most of which was recorded in the first quarter ended March 31, 2011 (such results were filed with the SEC pursuant to a Form 6-K on May 9, 2011).
As a result of the February 27, 2010 earthquake, legislation was passed raising the corporate income tax rate in order to pay for reconstruction following the earthquake, which had an adverse effect on our 2011 results. The new legislation increased the corporate tax rate from its previous rate of 17.0% to 20.0% for the income accrued in 2011. For the income accrued in 2012, the rate has decreased to 18.5% and it will further decrease to the prior rate of 17.0% in 2013.
Outlook. We had a successful 2011, particularly in light of the increasing costs of raw material, fuel and energy and the inflationary pressures in our Argetine operation. In early January, when the commodities price rally began, CCU implemented a contingency plan seeking to preserve margins by focusing on innovations, cost controls and earlier in the year price adjustments.
EBIT
The following discussion should be read in conjunction with our consolidated financial statements and the notes thereto included in this annual report. In the following discussion, Chilean peso amounts have been rounded to the nearest million pesos, unless otherwise indicated. Certain amounts (including percentage amounts) which appear herein have been rounded and may not sum exactly to the totals shown.
66
The following table presents the net sales and EBIT, and related percentage as a component of net sales, for each of our product segments:
| Year Ended December 31, | ||||||
| 2009 | 2010 | 2011 | ||||
| Net sales | (in millions of CLP, except percentages) | |||||
| Beer Chile Segment (1) | 278,170 | 35.80% | 287,981 | 34.40% | 313,017 | 32.28% |
| Beer Argentina Segment (1) | 137,296 | 17.70% | 156,363 | 18.60% | 198,181 | 20.44% |
| Non-alcoholic Beverages Segment (2) | 201,512 | 25.90% | 223,476 | 26.70% | 248,509 | 25.63% |
| Wine Segment (3) | 124,726 | 16.10% | 132,293 | 15.80% | 138,348 | 14.27% |
| Spirits Segment (4) | 38,830 | 5.00% | 43,218 | 5.10% | 50,936 | 5.25% |
| Other (5) | -3,988 | -0.50% | -5,072 | -0.60% | 20,560 | 2.12% |
| Total | 776,544 | 100.00% | 838,258 | 100.00% | 969,551 | 100.00% |
| EBIT | ||||||
| Beer Chile Segment (1) | 77,191 | 56.20% | 85,295 | 52.60% | 99,412 | 52.11% |
| Beer Argentina Segment (1) | 17,328 | 12.60% | 22,028 | 13.60% | 25,129 | 13.17% |
| Non-alcoholic Beverages Segment (2) | 24,686 | 18.00% | 32,364 | 20.00% | 36,318 | 19.04% |
| Wine Segment (3) | 12,220 | 8.90% | 10,256 | 6.30% | 16,890 | 8.85% |
| Spirits Segment (4) | 6,421 | 4.70% | 6,409 | 4.00% | 6,690 | 3.51% |
| Other (5) | -464 | -0.30% | 5,698 | 3.50% | 6,321 | 3.31% |
| Total | 137,382 | 100.00% | 162,049 | 100.00% | 190,760 | 100.00% |
(1) Includes sales of beer, beer by-products and other products such as malt, spent grain and yeast.
(2) Includes sales of carbonated and non-carbonated soft drinks, nectar, mineral and purified water, sports and energy drinks, tea and related merchandise.
(3) Includes sales of wine, by-products and other products such as labels and corks. (4) Includes sales of pisco, cocktails, rum and by-products.
(5) Includes the operating income of the plastic bottle and caps division, non recurring items and consolidation eliminations.
The following table presents EBIT in millions of pesos and as a percentage of net sales:
67
| Year Ended December 31, | ||||||
| 2009 | 2010 | 2011 | ||||
| (millions of CLP, except percentages and sales volume data) | ||||||
| Net sales | 776,544 | 100.00% | 838,258 | 100.00% | 969,551 | 100.00% |
| Cost of goods sold | -365,098 | -47.00% | -383,813 | -45.80% | -450,563 | -46.47% |
| Gross profit | 411,446 | 53.00% | 454,445 | 54.20% | 518,987 | 53.53% |
| Other operating income | -473 | -0.10% | 8,263 | 1.00% | 20,136 | 2.08% |
| MSD&A | -273,591 | -35.20% | -300,659 | -35.90% | -348,363 | -35.93% |
| EBIT | 137,382 | 17.70% | 162,049 | 19.30% | 190,760 | 19.68% |
| Net financing expenses | -10,367 | -1.30% | -8,288 | -1.00% | -7,334 | -0.76% |
| Results of indexed units | 4,190 | -0.50% | -5,080 | -0.60% | -6,734 | -0.69% |
| Exchange rate differences | -1,390 | -0.20% | -1,401 | -0.20% | -1,079 | -0.11% |
| Share of profits of associates & joint | 1,349 | 0.20% | 966 | 0.10% | 1069.311 | 0.11% |
| ventures | ||||||
| Other gains/(losses) | 21,925 | 2.80% | 655 | 0.10% | 3010.058 | 0.31% |
| Income before taxes | 153,089 | 19.70% | 147,593 | 17.60% | 179,693 | 18.53% |
| Income taxes | -11,724 | -1.50% | -27,656 | -3.30% | -44,890 | -4.63% |
| Net profit for the year | 141,365 | 18.20% | 119,937 | 14.30% | 134,802 | 13.90% |
| Attributable to: | ||||||
| Equity Holders of Parent Company | 128,037 | 16.50% | 110,700 | 13.20% | 122,752 | 12.66% |
| Non controlling interest | 13,328 | 1.70% | 9,237 | 1.10% | 12,051 | 1.24% |
| Sales volume (1): | ||||||
| Beer (Chile) (2) | 507.2 | 514.8 | 538.6 | |||
| Beer (Argentina) | 391.6 | 414.2 | 434.5 | |||
| Non-alcoholic beverages | 600.0 | 659.1 | 699.1 | |||
| Wine (3) | 122.0 | 128.5 | 121.2 | |||
| Spirits | 19.9 | 21.2 | 22.8 | |||
(1) In millions of liters.
(2) Free samples for promotions are considered in sales volume.
(3) Includes sales of wine in Argentina for the domestic market, which equaled 2.1 million liters in 2009, 2.9 million liters in 2010 and 2.1 million liters in 2011; wine exports from Argentina, totaling 7.0 million in 2009 and 5.8 million in 2010 and 5.1 million in 2011; and bulk sales export in Chile and Argentina of 11.5 million in 2009, 9.2 million in 2010 and 5.4 million in 2011.
FISCAL YEAR ENDED DECEMBER 31, 2011 COMPARED TO FISCAL YEAR ENDED DECEMBER 31, 20101
The major occurrences of the fiscal year ended 2011 were: (a) the sharp increase in the cost of raw materials, fuel and energy as a consequence of the increase in commodity prices; (b) the inflationary pressures experienced by our Argentine operations; (c) the innovations in the spirits segment with two new distribution contracts− one with Pernod Ricard for the distribution of all their brands through the traditional channels, and the other with Bauzá for the distribution of the Bauzá pisco brand in Chile; (d) the final payment received from the insurance companies as compensation for losses incurred as a aconsequence of the February 27, 2010 earthquake; (e) the continued strong acceleration of private consumption in 2011; and (f) increased competition affecting our Chilean beer operations, via price discounts and introduction of new brands particularly in the one-way packaging and premium products market, which affected positively the per capita consumption but had a negative impact on our market share .
Net Sales
Our net sales were CLP969,551 million in 2011 compared to CLP838,258 million in 2010, representing a 15.7% increase, primarily due to higher sales volumes and higher per unit prices in all segments. The net sales performance of each of our business segments during 2011 is described below:
1Segment analysis excludes “Other/eliminations” data.
68
Beer Chile: Our net sales of beer in Chile increased 8.7% to CLP313,017 million in 2011, from CLP287,981 million in 2010. Such increase resulted primarily from a 4.3% increase in unit price and a 4.6% increase in sales volume. Higher sales volumes were primarily a result of the domestic private consumption acceleration increasing the per capita consumption to 39.1 lt, as well as our effective sales execution. The higher per unit price of our products is a result of a 7% price increase effective June 1, 2011, and of a sales mix that included more premium beverages. A price increase earlier in the year was necessary to protect our margins after the sharp increase in costs due to the higher price of commodities affecting raw material, fuel and electricity.
Beer Argentina: Our net sales of beer in Argentina increased 26.7% to CLP198,181 million in 2011, from CLP156,363 million in 2010. This increase was due to 4.9% higher beer sales volume and 22.0% increase in per unit price, measured in Chilean pesos. The higher beer sales volume was a result of a slightly higher market share and better penetration of our products. Higher per unit prices were primarily a result of price increases implemented during 2011 to compensate for increased costs and expenses, as well as a higher percentage of premium products in our sales mix.
Non-alcoholic beverages: Our net sales of non-alcoholic beverages increased 11.2% to CLP248,509 million in 2011, from CLP223,476 million in 2010. This increase in sales was due to a 6.1% increase in sales volume and 4.8% increase in unit price, on average. Higher sales volume are a result of increases of 3.9%, 13.7% and 8.0% in carbonated soft drinks, nectars and water volumes, respectively, as a result of increased consumption (resulting in a higher per capita consumption), slightly higher market share, and effective sales execution. Unit price for carbonated soft drinks increased by 5.5%, nectars increased by 3.5% and waters by 1.9%.
Wine: Our net sales of wine increased 4.6% to CLP138,348 million in 2011, from CLP132,293 million in 2010. The increase in sales is due to a 0.6% increase in sales volume and a 5.1% increase in unit prices. The increase in sales volume was the result of a 1.5% increase in Chilean domestic volume and 1.4% increase in Chilean exports, which was partially offset by a 13.0% decrease in volume in Argentina. The increase in unit prices is due mostly to an increase in the average prices of domestic wine and Argentine wine, also expressed in Chilean pesos, which were 11.1% and 7.3% higher, respectively. In addition and despite the appreciation of the Chilean peso vis-à-vis the currencies of the exports’ destination countries, unit prices of Chilean exports, expressed in Chilean pesos were 1.8% higher than in 2010.
Spirits: Our net sales of spirits increased 17.9% to CLP50,936 million in 2011, from CLP43,218 million in 2010. This increase in sales is due to a 7.5% increase in sales volume and a 13.1% increase in per unit price due a sales mix that included more premium beverages. As of July 1, 2011 we began distributing the Pernod Ricard brands through traditional channels in Chile.
Cost of Goods Sold
Our cost of goods sold consists primarily of the cost of raw materials, packaging, labor costs for production personnel, depreciation of assets related to production, depreciation of returnable bottles, licensing fees, bottle breakage and costs of operating and principaltaining plants and equipment. Our cost of goods sold 2011 was CLP450,563 million compared to CLP383,813 million in 2010, a 17.4% increase from 2010. As a percentage of net sales, cost of goods sold was 46.5% in 2011 and 45.8% in 2010. Our cost of goods sold for each business segment during 2011 is described below:
Beer Chile: Our cost of goods sold for our Chilean beer segment increased 7.6% to CLP122,417 million in 2011, from CLP113,816 million in 2010. This increase was due to higher costs for some raw materials in U.S. dollars, higher cost of energy, and higher sales mix of premium and one-way products, which tend to have a higher production cost, partially compensated by a stronger Chilean currency. Cost of goods sold as a percentage of net sales decreased to 39.1% in 2011 from 39.5% in 2010.
Beer Argentina: Our cost of goods sold for our Argentine beer segment increased 16.6% to CLP77,601 million in 2011, from CLP66,543 million in 2010, due to inflationary cost pressures. Cost of goods sold as a percentage of net sales decreased from 42.6% in 2010 to 39.2% in 2011, primarily as a result of higher average sales prices.
69
Non-alcoholic beverages: Our cost of goods sold for our non-alcoholic beverage segment increased 16.3% to CLP126,415 million in 2011, from CLP108,666 million in 2010. This increase was due mostly to higher costs of raw material and energy. Cost of goods sold as a percentage of net sales increased from 48.6% in 2010 to 50.9% in 2011.
Wine: Our cost of goods sold for our wine segment increased 7.1% to CLP89,850 million in 2011, from CLP83,876 million in 2010. This increase was primarily a result of higher cost of wine used as raw material in 2011, due to the scarcity created by a colder than usual spring causing a poor vintage. Cost of goods sold as a percentage of net sales increased from 63.4% in 2010 to 64.9% in 2011.
Spirits: Our cost of goods sold for our spirits segment increased 28.9% to CLP29,153 million in 2011, from CLP22,622 million in 2010 as a result of an increase in the costs of raw materials driven by a higher percentage of premium brands in our mix of products and their higher cost. Cost of goods sold as a percentage of net sales increased from 52.3% in 2010 to 57.2% in 2011.
Gross Profit
Our gross profit increased 14.2% to CLP518,987 million in 2011, from CLP454,445 million in 2010. This increase was due to an increase in our sales above the increase in cost of goods sold. As a percentage of net sales, gross profit decreased to 53.5% in 2011 from 54.2% in 2010.
Marketing and Selling, Distribution and Administrative Expenses
Our marketing and selling, distribution and administrative expenses (“MSD&A”) primarily include advertising and promotional expenses, salaries of administrative personnel, maintenance, general expenses, transportation costs and services provided by third parties. Our MSD&A increased 15.9% to CLP348,363 million in 2011, from CLP300,659 million in 2010. As a percentage of net sales, our MSD&A remained at 35.9% in 2011. The MSD&A performance of each business segment during 2011 is described below:
Beer Chile: The MSD&A of our Chilean beer segment increased 9.0% to CLP97,196 million in 2011, from CLP89,203 million in 2010. The increase in MSD&A is primarily attributable to higher distribution expenses. As a percentage of net sales, our MSD&A increased slightly to 31.1% in 2011 from 31.0% in 2010.
Beer Argentina: The MSD&A of our Argentine beer segment increased 40.1% to CLP95,289 million in 2011, from CLP68,006 million in 2010. The increase in MSD&A is primarily due to higher distribution expenses, higher investment in marketing and higher personnel expenses, all related to inflationary pressures. As a percentage of net sales, our MSD&A increased to 48.1% in 2011 from 43.5% in 2010.
Non-alcoholic beverages: The MSD&A of our non-alcoholic beverage segment increased 6.4% to CLP88,053 million in 2011, from CLP82,745 million in 2010. This increase is primarily due to higher distribution expenses and other volume related expenses. As a percentage of net sales, our MSD&A for this segment decreased to 35.4% in 2011 from 37.0% in 2010, primarily as a result of the dilution of fixed expenses due to higher sale volumes.
Wine: The MSD&A of our wine segment increased 4.9% to CLP40,242 million in 2011, from CLP38,372 million in 2010. This increase in MSD&A is primarily related to better results. As a percentage of net sales, our MSD&A for this segment increased slightly to 29.1% in 2011 from 29.0% in 2010.
Spirits: The MSD&A of our spirits segment increased 8.5% to CLP15,592 million in 2011, from CLP14,368 million in 2010. This increase in MSD&A is primarily due to higher distribution expenses and other expenses related to higher sales and new businesses in 2011 compared to 2010. As a percentage of net sales, our MSD&A for this segment decreased to 30.6% in 2011 from 33.2% in 2010.
Other Operating Income/(expenses) and Exceptional items
The other operating income/(expenses) increased in 2011 resulting in a net income of CLP7,230 million in 2011, as compared to a net income of CLP1,472 million in 2010. With the exception of the Argentine beer segment, all segments contributed to the positive variance due primarily to the sale of disposable operating assets. During 2011 we recorded the following exceptional items at the EBIT level: (a) the settlement of the insurance claims related to the February 27, 2010 earthquake in Chile, which generated a profit of CLP13,289 million in 2011, offsetting the operational losses caused by the natural disaster, and (b) CLP384million severance paid related to the cider business in Argentina acquired in December 2010, for a net total of CLP12,905 million. The 2011 net amount compares to the CLP 6,791 million profit recorded in 2010 generated by the sale of physical property in Peru.
70
EBIT
Our EBIT increased 17.7% to CLP190,760 million in 2011, as compared to CLP162,049 million in 2010, including the described exceptional profit arising from insurance claims related to the February 27, 2010 earthquake. As a percentage of net sales, EBIT increased from 19.3% in 2010 to 19.7% in 2011. Excluding exceptional items, the EBIT would have increased 14.6% and, and as a percentage of net sales, would have decreased to 18.3% from 18.5% in 2010. The EBIT performance of each of our business segments during 2011 is described below:
Beer Chile: EBIT from our Chilean beer segment increased 16.6% to CLP99,412 million in 2011, from CLP85,295 million in 2010. Our EBIT margin for this segment increased from 29.6% in 2010 to 31.8% in 2011 or to 30.1% before exceptional items.
Beer Argentina: EBIT from our Argentine beer segment, measured in Chilean pesos, increased 14.1% to CLP25,129 million in 2011, from CLP22,028 million in 2010. The results of this business segment are affected by the fluctuation of the Chilean peso vis-à-vis the Argentine peso. Our EBIT margin for this segment decreased from 14.1% in 2010 to 12.7% in 2011.
Non-alcoholic beverages: EBIT from our non-alcoholic beverage segment increased 12.2% to CLP36,318 million in 2011, from CLP32,364 million in 2010. Our EBIT margin for this segment increased from 14.5% in 2010 to 14.6% in 2011 or decreased to 14.1% before exceptional items.
Wine: EBIT from our wine segment increased 64.7% to CLP16,890 million in 2011, from CLP10,256 million in 2010. Our EBIT margin for this segment increased from 7.8% in 2010 to 12.2% in 2011 or decreased to 7.5% before exceptional items.
Spirits: EBIT from our spirits segment increased 4.4% to CLP6,690 million in 2011, from CLP6,409 million in 2010. Our EBIT margin for this segment decreased from 14.8% in 2010 to 13.1% in 2011 or to 12.5% before exceptional items.
Net Financing Expenses
Our net financing expenses decreased 11.5% to CLP7,334 million in 2011 as compared to CLP8,288 million in 2010. This decrease is primarily due to a lower level of net financial debt in 2011.
Share of profits of associates and joint ventures
CCU has 50% participation in each of the following companies: Cervecería Austral S.A., Foods, Viña Valles de Chile S.A.2and Promarca. The share of the profit in the referred companies increased 10.7% to CLP1,069 million in 2011, from CLP966 million in 2010.
Result of indexed units and Exchange rate differences
The adjustment applied to our net liabilities due to Chilean inflation and foreign exchange fluctuations resulted in a net loss of CLP7,813 million in 2011, as compared to a net loss of CLP6,481 million in 2010. These results are due to the greater change in the UF3 value as of December 2011 (+3.9%) compared to the same period of 2010 (+2.4%) which increased the negative impact on our net UF denominated liabilities.
Other gains (losses) net
Our other gains increased from a net loss of CLP655 million in 2010 to a net gain of CLP3,010 million in 2011. The change is explained by gains related to hedges covering foreign exchange variations on taxes.
2The share of profits of Viñas Valles de Chile S.A. takes into account only the first eleven months of 2011. As of December 2011, Viñas Valles de Chile S.A. consolidates under the segment “Wines” after the split of its two principal components: Tabalí and Leyda; the latter remained in VSPT. See “Item4:Information on the Company−Business Overview−Our Wine Business−Overview.”
3The Unidad de Fomento (UF) is a monetary unit expressed in Chilean pesos, whose value is indexed to Chilean inflation.
71
Income taxes
Our income taxes for 2011 amounted to CLP44,890 million, translating into an effective consolidated tax rate of 24.9%. Income taxes in 2010 amounted to CLP 27,656 million translating into an effective consolidated tax rate of 18.7%. Income tax increased by CLP17,234 mainly due to (a) higher profits coupled with a higher corporate income tax rate in Chile (20% in 2011 compared with 17% in 2010), (b) the effect of foreign exchange fluctuations on taxes offset by a reverse sign entry in Other gains/(losses), (c) the settlement of a case with the Chilean tax authorities, (d) higher profits in Argentina coupled with a higher corporate income tax in Argentina, and (e) a one-time loss in Aguas CCU Nestlé taxes, and other prior year’s settlements.
Net profit of the year
Our net profit for 2011 increased 12.4% from CLP119,937 million in 2010 to CLP134,802 million in 2011, primarily as a result of a 14.6% EBIT increase before exceptional items, or a 17.7% increase after taking exceptional items into account, and a better result of “All other” captions, producing a 21.7% higher Income before taxes, partially offset by a 62.3% higher Income tax.
Net profit attributable to equity holders of parent company
Our Net profit attributable to equity holders of our parent company increased 10.9% from CLP110,700 million in 2010 to CLP122,752 million in 2011 for the reasons explained in the preceding paragraphs.
Net profit attributable to minority interest
Minority interest increased from CLP9,237 million in 2010 to CLP12,051 million in 2011. This increase was primarily due to better results in Aguas CCU-Nestlé and in Viña San Pedro Tarapacá, the latter explained mainly by the effect of the insurance claim settlement.
FISCAL YEAR ENDED DECEMBER 31, 2010 COMPARED TO FISCAL YEAR ENDED DECEMBER 31, 20094
The major occurrences of the fiscal year ended 2010 were: (a) the February 27, 2010 earthquake, which damaged our production capacity in our brewery located in Santiago and in some wineries and caused inventory losses in several different categories. As a result of the earthquake, an inevitable and temporary shortage in our supply of beer allowed our competitors to gain some market share, resulting in a 2.5% decrease in our market share. (b) The Chilean peso was on average 8.8% stronger than the U.S. dollar, setting a negative scenario for exports, though a positive one for buying commodities and other raw material imports. (c) Private consumption experienced a strong acceleration due to increasing employment rates after the February 27, 2010 earthquake. (d) increased competition in the one-way packaging and premium products market.
As of December 31, 2010, the earthquake had no net income statement effect, as the amount of the expenses and impairment of assets related to the earthquake were offset by identical amounts for insurance recoveries that were considered virtually certain under IAS 37. See Note 36 to the financial statements for further discussion.
Net Sales
Our net sales were CLP838,258 million in 2010, compared to CLP776,544 million in 2009, representing a 7.9% increase, primarily due to higher sales volumes and higher per unit prices in all segments. The net sales performance of each of our business segments during 2010 is described below:
Beer Chile: Our net sales of beer in Chile increased 3.5% to CLP287,981 million in 2010, from CLP278,170 million in 2009. Such increase resulted primarily from a 2.4% increase in unit price and a 1.5% increase in sales volume. Higher sales volumes, despite the initial negative impact of the February 27, 2010 earthquake in Chile, were primarily a result of the domestic private consumption acceleration, as well as the company’s proper sales execution. The higher per unit price of our products is a result of the price increase in premium and one-way packaging towards the end of 2010, and of a sales mix that included more premium beverages.
4Segment analysis excludes “Other/eliminations” data.
72
Beer Argentina: Our net sales of beer in Argentina increased 13.9% to CLP156,363 million in 2010, from CLP137,296 million in 2009. This increase was due to 5.8% higher beer sales volume and 6.6% increase in per unit price, measured in Chilean pesos. The higher beer sales volume was a result of a slightly higher market share and better penetration of our products. Higher per unit prices were primarily a result of price increases implemented during 2010 to compensate for increased costs and expenses, as well as a higher incidence of direct sales in our sales mix.
Non-alcoholic beverages: Our net sales of non-alcoholic beverages increased 10.9% to CLP223,476 million in 2010, from CLP201,512 million in 2009. This increase in sales was due to a 9.8% increase in sales volume and 0.9% increase in unit price, on average. Higher sales volume are a result of increases of 8.9%, 16.9% and 8.3% in carbonated soft drinks, nectars and water volumes, respectively, as a result of increased consumption after theFebruary 27, 2010 earthquake, slightly higher market share, and effective sales execution. Unit price for carbonated soft drinks increased by 1.8%, however unit price for nectars and water decreased by 0.2% and 3.1%, respectively.
Wine: Our net sales of wine increased 6.1% to CLP132,293 million in 2010, from CLP124,726 million in 2009. The increase in sales is due to a 9.3% increase in sales volume and a 0.5% decrease in unit prices. The increase in sales volume was the result of a 9.5% increase in Chilean domestic volume and 11.2% increase in Chilean exports, which was offset by a 5.4% decrease in volume in Argentina. The decrease in unit prices is due to 7.2% lower unit prices in Chilean exports, expressed in Chilean currency. Lower unit prices in Chilean exports are a result of the appreciation of the local currency vis-à-vis the currencies of the exports’ destination countries. Domestic wine and Argentine wine average prices, also expressed in Chilean pesos, were 11.9% and 4.8% higher, respectively.
Spirits: Our net sales of spirits increased 11.3% to CLP43,218 million in 2010, from CLP38,830 million in 2009. This increase in sales is due to a 6.7% increase in sales volume and a 1.2% increase in per unit price due a sales mix that included more premium beverages.
Cost of Goods Sold
Our cost of goods sold consists primarily of the cost of raw materials, packaging, labor costs for production personnel, depreciation of assets related to production, depreciation of returnable bottles, licensing fees, bottle breakage and costs of operating and maintaining plants and equipment. Our cost of goods sold in 2010 was CLP383,813 million, compared to CLP365,098 million in 2009. As a percentage of net sales, cost of goods sold was 45.8% in 2010 and 47.0% in 2009. Our cost of goods sold for each business segment during 2010 is described below:
Beer Chile: Our cost of goods sold for our Chilean beer segment decreased 0.3% to CLP113,816 million in 2010, from CLP114,108 million in 2009. This decrease was due to a stronger Chilean peso and lower costs for some raw materials in U.S. dollars, compensating for the higher sales mix of premium and one-way products, which tend to have a higher production cost. Cost of goods sold as a percentage of net sales decreased from 41.0% in 2009 to 39.5% in 2010.
Beer Argentina: Our cost of goods sold for our Argentine beer segment increased 8.8% to CLP66,543 million in 2010, from CLP61,154 million in 2009, due to inflationary costs pressures. Cost of goods sold as a percentage of net sales decreased from 44.5% in 2009 to 42.6% in 2010, primarily a result of higher average prices.
Non-alcoholic beverages: Our cost of goods sold for our non-alcoholic beverage segment increased 7.5% to CLP108,666 million in 2010, from CLP101,075 million in 2009. This increase was due to higher sales volume, given that the unitary cost of our goods was lower than in 2009. Cost of goods sold as a percentage of net sales decreased from 50.2% in 2009 to 48.6% in 2010.
Wine: Our cost of goods sold for our wine segment increased 7.7% to CLP83,876 million in 2010, from CLP77,855 million in 2009. This increase was primarily a result of higher cost of wine used as raw material in 2010, due to the scarcity created by the wine losses after the February 27, 2010 earthquake and a colder than usual spring. Cost of goods sold as a percentage of net sales increased from 62.4% in 2009 to 63.4% in 2010.
73
Spirits: Our cost of goods sold for our spirits segment increased 9.8f% to CLP22,622 million in 2010, from CLP20,602 million in 2009 as a result of an increase in the costs of raw materials driven by theFebruary 27, 2010earthquake. Cost of goods sold as a percentage of net sales decreased from 53.1% in 2009 to 52.3% in 2010.
Gross Profit
Our gross profit increased 10.5% to CLP454,445 million in 2010, from CLP411,446 million in 2009. This increase was due to an increase in our sales above the increase in cost of goods sold. As a percentage of net sales, gross profit increased from 53.0% in 2009 to 54.2% in 2010.
Marketing and Selling, Distribution and Administrative Expenses
Our marketing and selling, distribution and administrative expenses (“MSD&A”) primarily include advertising and promotional expenses, salaries of administrative personnel, maintenance, general expenses, transportation costs and services provided by third parties. Our MSD&A increased 9.9% in 2010 to CLP300,659 million, from CLP273,591 million in 2009. As a percentage of net sales, our MSD&A increased from 35.2% in 2009 to 35.9% in 2010. The MDA&A performance of each business segment during 2010 is described below:
Beer Chile: The MSD&A of our Chilean beer segment increased 3.6% to CLP89,203 million in 2010, from CLP86,072 million in 2009. The increase in MSD&A is primarily attributable to higher marketing and distribution expenses. The higher marketing expenses were related to image revamping of the Cristal brand, which started in 2009, the activities surrounding the 2010 Soccer World Cup in South Africa and the bicentennial celebration of Chile’s independence. As a percentage of net sales, our MSD&A increased from 30.9% in 2009 to 31.0% in 2010.
Beer Argentina: The MSD&A of our Argentine beer segment increased 15.6% to CLP68,006 million in 2010, from CLP58,814 million in 2009. The increase in MSD&A is primarily due to higher distribution expenses, higher investment in marketing and higher personnel expenses, all related to inflationary pressures. As a percentage of net sales, our MSD&A increased from 42.8% in 2009 to 43.5% in 2010.
Non-alcoholic beverages: The MSD&A of our non-alcoholic beverage segment increased 9.6% to CLP82,745 million in 2010, from CLP75,503 million in 2009. This increase is primarily due to higher distribution expenses. As a percentage of net sales, our MSD&A for this segment decreased from 37.5% in 2009 to 37.0% in 2010, primarily as a result of the dilution of fixed expenses due to higher sale volumes.
Wine: The MSD&A of our wine segment increased 9.5% to CLP38,372 million in 2010, from CLP35,055 million in 2009. This increase in MSD&A is primarily related to higher volumes. As a percentage of net sales, our MSD&A for this segment increased from 28.1% in 2009 to 29.0% in 2010.
Spirits: The MSD&A of our spirits segment decreased 21.7% to CLP14,368 million in 2010, from CLP11,802 million in 2009. This decrease in MSD&A is primarily due to higher marketing and distribution expenses, after bringing the marketing rate to historical normal levels. As a percentage of net sales, our MSD&A for this segment increased from 30.4% in 2009 to 33.2% in 2010.
Other Operating Income/(expenses)
The other operating income/(expenses) increased in 2010 resulting in a net income of CLP1,472 million, as compared to a net expense of CLP473 million in 2009. With the exception of the wine segment, all segments contributed to the positive variance. In 2010, we recorded a non-recurring profit of CLP6,791 million generated in the sale of a property in Perú, which was not allocated to any business segment.
EBIT
Our EBIT increased 18.0% in 2010 to CLP162,049 million, as compared to CLP137,382 million in 2009, including the described non-recurring profit. As a percentage of net sales, EBIT increased from 17.7% in 2009 to 19.3% in 2010. Excluding non-recurring profit, the EBIT would have increased 13.0% and, as a percentage of net sales, would have increased 0.8%. The EBIT performance of each of our business segments during 2010 is described below:
74
Beer Chile: TheEBIT from our Chilean beer segment increased 10.5% to CLP85,295 million in 2010, from CLP77,191 million in 2009. Our EBITmargin for this segment increased from 27.7% in 2009 to 29.6% in 2010.
Beer Argentina: TheEBIT from our Argentine beer segment, measured in Chilean pesos, increased 27.1% to CLP22,028 million in 2009, from CLP17,328 million in 2009. The results of this business segment are affected by the fluctuation of the Chilean peso vis-à-vis the Argentine peso, taking into account the Chilean peso as functional currency, when IFRS was adopted. Our EBITmargin for this segment increased from 12.6% in 2009 to 14.1% in 2010.
Non-alcoholic beverages: TheEBIT from our non-alcoholic beverage segment increased 31.1% to CLP32,364 million in 2010, from CLP24,686 million in 2009. Our EBITmargin for this segment increased from 12.3% in 2009 to 14.5% in 2010.
Wine: TheEBIT from our wine segment decreased 16.1% to CLP10,256 million in 2010, from CLP12,220 million in 2009. Our EBITmargin for this segment decreased from 9.8% in 2009 to 7.8% in 2010.
Spirits: TheEBIT from our spirits segment decreased 0.2% to CLP6,409 million in 2010, from CLP6,421 million in 2009. Our EBITmargin for this segment decreased from 16.5% in 2009 to 14.8% in 2010.
Net Financing Expenses
Our net financing expenses decreased 20.1% to CLP8,288 million in 2010 as compared to CLP10,367 million in 2009. This decrease is primarily due to a higher level of financial debt in 2009 as a result of the refinancing of a USD$100 million loan that was originally due in November 2009 and the acquisition of Viña Tarapacá. We improved our liquidity by offering local bonds in April 2009.
Share of profits of associates and joint ventures
CCU has 50% participation in each of the following companies: Cervecería Austral S.A., Foods, Viña Valles de Chile S.A. and Promarca. The share of the profit in the referred companies decreased 13.7% to CLP966 million in 2010, from CLP1,349 million in 2009.
Result of indexed units and Exchange rate differences
The adjustment units applied to our liabilities due to Chilean inflation and foreign exchange fluctuations resulted in a net loss of CLP6,481 million in 2010, as compared to a net profit of CLP2,800 million in 2009. These results are largely due to the effect of a negative 2.3% inflation rate in 2009, compared to a positive inflation rate of 3.0% in 2010, over the Company’s UF5denominated liabilities, despite the lower average UF liability balances held in 2010. A loss results from holding a net position of UF denominated liabilities during inflationary periods, or from holding foreign currency denominated liabilities in excess of foreign currency denominated assets during periods of devaluation of the Chilean peso.
Other gains (losses) net
Our other gains decreased from a net gain of CLP21,925 million in 2009 to a net loss of CLP655 million in 2010. The change is largely explained by the CLP24,439 million result before taxes generated from the sale of 29.9% of Aguas CCU in 2009.
Income taxes
Our income taxes for 2010 amounted to CLP27,656 million, translating into an effective consolidated tax rate of 18.7%. Income taxes in 2009 amounted to CLP11,724 million translating into an effective consolidated tax rate of 7.7%. In 2009, our effective consolidated tax rate was lower than the Chilean statutory rate of 17%, primarily due to a reduction in our income tax due to an investment restructuring and non-taxable income generation.
Net profit of the year
Our net profit for 2010 decreased 15.2% from CLP141,365 million in 2009 to CLP119,937 million in 2010, primarily as a result of the lack of the non-recurrent profit generated in 2009 due to the sale of 29.9% ofAguas CCU and the effect of a positive inflation rate in 2010 on our UF denominated net liabilities, as compared to the deflation experienced through 2009.
5The Unidad de Fomento (UF) is a monetary unit expressed in Chilean pesos, whose value is indexed to the Chilean inflation.
75
Net profit attributable to equity holders of parent company
Our net profit attributable to equity holders of our parent company decreased 13.5% from CLP128,037 million in 2009 to CLP110,700 million in 2010 for the reasons explained in the preceding paragraphs.
Net profit attributable to minority interest
Minority interest decreased from CLP13,328 million in 2009 to CLP9,237 million in 2010. This decrease was primarily due to lower results in Aguas CCU, VSPT and CPCh, partially compensated by better results in Cervecera Kunstmann S.A., and CCU Argentina, coupled with the decrease in our ownership stake of Aguas CCU.
Liquidity and Capital Resources
Our principal source of liquidity has been cash generated by our operating activities, which amounted to CLP150,844 million, CLP159,265 million and CLP167,370 million during 2009, 2010 and 2011, respectively.
Our cash flow from operations and working capital are our primary sources to meet both our short-term and long-term obligations. In the opinion of our management, they are sufficient to this end.
The principal component of cash flows generated by operating activities in 2011 were amounts collected from clients net of payment to suppliers of CLP425,149 million compared to CLP365,609 million in 2010 and CLP392,971 million in 2009.
Due to the damages caused by the earthquake of February 27, 2010, during 2011 and 2010 the Company received from its insurance company a total cash compensation of CLP43,617,835. Of this amount, CLP21,896,076 was received in 2011, of which CLP 15,506,731 was reflected in cash flows from operating activities, compared to CLP21,721,759 in 2010, and the remaining CLP6,389,345 was reflected in cash flows from investing activities.
In 2011, our cash flows used in financing activities totalled CLP65,238 million compared to CLP79,364 million in 2010 and CLP37,057 million in 2009. The principal components of cash flows used in financing activities consisted of dividends paid of CLP62,793 million (CLP72,371 million in 2010 and CLP 50,710 in 2009) and repayment of bank borrowings of CLP6,025 million (CLP7,038 million in 2010 and CLP97,608 million in 2009), partially offset by proceeds from short-term borrowings of CLP17,963 million (CLP8,571 million in 2010 and there were no proceeds from short-term borrowing in 2009), and the proceeds from long-term borrowings were CLP6,680 million in 2011, zero in 2010 and CLP 118,032 million in 2009.
In 2011, our cash used in investment activities totalled CLP76,240 million compared to CLP65,348 million in 2010 and CLP30,732 million in 2009. The principal components of cash used in investment activities in 2011 consisted of capital expenditures of CLP77,847 million (CLP64,396 million in 2010 and CLP57,892 million in 2009) and payments made to obtain control of subsidiaries or other businesses of CLP3,257 million (CLP10.646 million in 2010 and CLP1,037 million in 2009), partially offset by the proceeds from sale of assets of CLP932 (CLP11,162 million in 2010 primarily attributable to the one time cash flow of CLP10,953 million on the Peru site sale, sale profit net of tax was paid in Peru and CLP262 million in 2009).
There are no material restrictions, either legal or economic, that would limit our ability to transfer funds (i.e., dividends, loans, or advances) from our subsidiaries to us.
76
As of December 31, 2011, we had CLP123,827 million (CLP77,411 million in 2010 and CLP63,992 million in 2009 in cash, time deposits and marketable securities), which does not include CLP53,837 million (CLP74,203 million in 2010 and CLP73,362 million in 2009) corresponding to readjustable promissory notes issued by the Central Bank and purchased under resale agreements. Indebtedness, includingaccrued interest, amounted to CLP242,142 million as of December 31, 2011. Short-term indebtedness included:
•CLP66,489 million of short-term bank borrowings.
•CLP4,311 million of bonds payable.
•CLP480 million of financial lease obligations
As of December 31, 2011, long-term indebtedness, excluding the current portion, comprised:
•CLP7,600 million of long-term obligations to banks, and
•CLP147,663 million of long-term obligations to the public represented by bonds.
•CLP15,599 million of long-term financial lease obligations.
On April 2, 2009 the Company issued two series of notes for UF 3 million and UF 2 million for a total of CLP104,188 million in order to refinance a previous loan of CLP30.000 million and the US$100 million syndicated loan due in November 2009. The conditions of the bonds are as follows:
| “I” Series | “H” Series |
UF amount | 3 million | 2 million |
Term | 5 years | 21 years |
Duration | 4.63 years | 11.5 years |
Amortization | Bullet | Since year 11 |
Interest Rate | UF+3.00% | UF+4.25% |
As mentioned before, during the last quarter of 2009 we repaid a syndicated loan of US$100 million which had been converted into a fixed-rate UF loan through a cross-currency swap.
As of December 31, 2011, some of our outstanding debt instruments required that we maintain certain financial ratios. The most significant covenants required us to maintain a consolidated interest coverage ratio (the ratio of operating result (“EBIT”) plus depreciation and operating amortization to interest expenses) equal to or higher than 3.00 to 1.00; to maintain a consolidated leverage ratio (the ratio of adjusted liabilities to adjusted equity) equal or lower than 1.50 to 1.00 in CCU, 1.20 to 1.00 in VSPT and 2.00 to 1.00 in CPCh; a minimum consolidated equity of CLP312,516.75 million, of CLP83,337.8 million in VSPT and of UF770 thousand (CLP17,166 million as of Dec 31, 2011) in CPCh; and a maximum indebtedness ratio of less than 3.00 to 1:00 from financial liabilities (bank loans, notes, and leasing obligations) to EBITDA. Furthermore, we were required to maintain a ratio of our unpledged assets over our unsecured liabilities of at least 1.2. The definition of, and calculation mechanics for, all covenants were established when we first entered into these debt instruments, and were based on Chilean GAAP, which are no longer in use since the Company adopted IFRS, as issued by the IASB. For that reason, the Company in 2010 adapted, with the consent of its creditors, these requirements to the new accounting standards and principles.
At December 31, 2011, we met all our financial debt covenants and had a consolidated interest coverage ratio of 16.55 to 1, a consolidated leverage ratio of 0.79 to 1. The consolidated adjusted equity attributable to equity holders of the parent company as of December 31, 2011 was CLP610,923 million. Our indebtedness ratio was 1.06 and the ratio of unpledged assets over unsecured liabilities was 2.27, respectively.
None of our indebtedness, or that of our subsidiaries, contains any term that restricts our ability to pay dividends other than the requirement to maintain a minimum consolidated equity.
The following table summarizes debt obligations held by us as of December 31, 2011. The table presents principal payment obligations in millions of Chilean pesos by interest rate structure, financial instrument and currency, with their respective maturity dates and related weighted-average interest rates:
77
| Interest-Bearing Debts as of December 31, 2011 - Cash flow | |||||||||
| (in millions of CLP, except percentages) | |||||||||
| Contractual Maturity Date | |||||||||
| Fixed Rate | Averge Int.Rate | 2012 | 2013 | 2014 | 2015 | 2016 | Thereafter | TOTAL | |
| Ch$ (UF)(1) | Bonds | 3.7% | 8,481 | 8,362 | 74,128 | 6,131 | 6,011 | 89,435 | 192,548 |
| Ch$ (UF)(1) | Banks | 6.8% | 12,085 | 1,501 | 1,501 | 1,501 | 1,501 | 28,318 | 46,405 |
| US$ | Banks | 1.7% | 9,435 | 2,110 | 2,110 | 2,110 | 2,110 | - | 17,875 |
| Argentine pesos | Banks | 18.2% | 10,661 | 106 | - | - | - | - | 10,767 |
| TOTAL | 40,663 | 12,078 | 77,739 | 9,741 | 9,621 | 117,753 | 267,596 | ||
| Variable rate | Averge Int.Rate | 2012 | 2013 | 2014 | 2015 | 2016 | Thereafter | TOTAL | |
| US$ | Banks | 1.0% | 36,013 | - | - | - | - | - | 36,013 |
| TOTAL | 36,013 | - | - | - | - | - | 36,013 | ||
| (1) UF as of December 31, 2011 | |||||||||
To hedge our market risks, we hold debt obligations in various currencies and enter into derivatives contracts. See “Item 11: Quantitative Information about Market Risk.”
Our treasury policy is to invest in highly liquid financial instruments issued by first class financial institutions. Investments are made primarily in Chilean pesos and U.S. dollars. As of December 31, 2011, we had invested CLP154,315 million in Chilean peso related instruments.
The following table summarizes financial instruments, including time deposits, marketable securities and securities purchased pursuant to repurchase agreements, held by us as of December 31, 2011:
| Short-Term Financial Instruments (in millions of CLP) |
|
|
Time deposits | 100,478 |
Marketable securities | 0 |
Repos | 53,837 |
Total | 154,315 |
78
Capital Expenditures Commitments
Our plans for capital expenditures through 2015 period are displayed in the following table:
Business Unit | 2012 | 2013 | 2014 | 2015 | |
|
| (in millions of CLP) | |||
Beer Chile |
|
|
|
| |
| Machinery and equipment | 16,252 | 24,435 | 12,277 | 7,234 |
| Packaging | 5,321 | 8,125 | 4,799 | 4,838 |
| Marketing assets | 2,421 | 2,285 | 2,295 | 2,302 |
| Software and hardware | 458 | 101 | 101 | 88 |
| Others | 5,472 | 2,326 | 586 | 1,479 |
| Total | 29,924 | 37,272 | 20,058 | 15,940 |
|
|
|
|
|
|
Beer Argentina |
|
|
|
| |
| Machinery and equipment | 2,902 | 8,015 | 8,958 | 943 |
| Packaging | 7,264 | 8,661 | 4,649 | 5,823 |
| Marketing assets | 4,085 | 3,300 | 3,300 | 3,300 |
| Software and hardware | 807 | 471 | 61 | 61 |
| Others | 1,066 | 401 | 1,575 | 401 |
| Total | 16,124 | 20,849 | 18,543 | 10,528 |
|
|
|
|
|
|
Non alcoholic beverages |
|
|
|
| |
| Machinery and equipment | 5,627 | 17,992 | 10,676 | 15,523 |
| Packaging | 7,741 | 8,376 | 8,799 | 9,193 |
| Marketing assets | 4,453 | 4,834 | 4,495 | 4,286 |
| Software and hardware | 33 | 18 | 26 | 18 |
| Others | 2,455 | 3,004 | 1,206 | 13,564 |
| Total | 20,309 | 34,225 | 25,203 | 42,584 |
|
|
|
|
|
|
Wine |
|
|
|
| |
| Machinery and equipment | 3,704 | 7,495 | 3,910 | 3,099 |
| Packaging | 1,258 | 1,525 | 1,609 | 1,652 |
| Marketing assets | 36 | 66 | 77 | 88 |
| Software and hardware | 146 | 212 | 236 | 259 |
| Others | 3,637 | 3,662 | 3,327 | 3,272 |
| Total | 8,780 | 12,960 | 9,159 | 8,370 |
|
|
|
|
|
|
Spirits |
|
|
|
| |
| Machinery and equipment | 3,632 | 1,480 | 1,108 | 988 |
| Packaging | 0 | 0 | 0 | 0 |
| Marketing assets | 285 | 302 | 318 | 333 |
| Software and hardware | 27 | 20 | 20 | 20 |
| Others | 846 | 250 | 250 | 250 |
| Total | 4,790 | 2,053 | 1,695 | 1,592 |
|
|
|
|
|
|
Others | 37,024 | 31,602 | 18,181 | 19,769 | |
|
|
|
|
|
|
|
|
|
|
|
|
Total |
| 116,952 | 138,960 | 92,839 | 98,783 |
79
During the years 2012 through 2015, we plan to make capital expenditures mainly to adapt, update and increase production capacity, install new packaging lines, enhance environmental protection, optimize our distribution system and warehouse facilities, invest in additional returnable bottles and crates to replace obsolete inventories, adapt to new packaging formats and support industry volume growth. Capital expenditures are also focused on improving management information systems and making additional investments in marketing assets.
We review our capital investment program periodically and changes to the program are made as appropriate. Accordingly, we cannot assure you that we will make any of these proposed capital expenditures at the anticipated level or at all. In addition, we are analyzing the possibility of making acquisitions in the same or related beverage businesses, either in Chile or in other countries of South America’s southern cone. Our capital investment program is subject to revision from time to time due to changes in market conditions for our products, general economic conditions in Chile, Argentina and elsewhere, interest, inflation and foreign exchange rates, competitive conditions and other factors.
We expect to fund our capital expenditures through a combination of internally generated funds and long term indebtedness.
Contractual Obligations
The following table summarizes our known contractual obligations as of December 31, 2011:
| Payments due by period (unaudited, in millions of CLP) | ||||
Contractual Obligations | Total | Less than 1 year | 1-3 years | 3-5 years | More than 5 years |
Long-Term Debt Obligations | 267,729 | 75,116 | 86,816 | 16,361 | 89,435 |
Capital Lease Obligations(1) | 35,879 | 1,559 | 3,001 | 3,001 | 28,318 |
Operating Lease Obligations(2) | 99,055 | 40,818 | 48,568 | 4,100 | 5,568 |
Purchase Obligations(3) | 233,897 | 67,776 | 106,344 | 20,716 | 39,061 |
Total | 636,560 | 185,269 | 244,729 | 44,179 | 162,382 |
_______
(1) Includes our obligation to lease our new headquarter building (see Note [27] to the financial statements).
(2) Includes real state property, vineyards and warehouse leases, as well as marketing contracts.
(3) Includes raw material purchase contracts.
Off Balance Sheet Arrangements
We do not have any off-balance sheet arrangements involving any transactions, agreements or other contractual arrangements involving an unconsolidated entity under which we have:
· made guarantees;
· a retained or a contingent interest in transferred assets;
· an obligation under derivative instruments classified as equity; or
· any obligation arising out of a material variable interest in an unconsolidated entity that provides financing, liquidity, market risk or credit risk support to us, or that engages in leasing, hedging or research and development arrangements with us.
We record payments made under operating leases as expenses, and none of our operating lease obligations are reflected on our balance sheet. We have no other off-balance sheet arrangements. See Note 35 to our audited consolidated financial statements for a more detailed discussion of contingencies, including guarantees.
80
Research and Development
Innovation is the driver that allows CCU to meet a constantly evolving demand. Our research and development efforts to continuously satisfy the market introducing new products and brands, although significant, do not involve material expenditures, as we have a close relationship with the companies that own the brands subject to license contracts. Thus, development is focused on the development and enhancement of spirits, namely variants of pisco and rum. The relationship with the license owners is a constant resource in these matters as well as in the application of production best practices, providing access to the “state of the art” in the industry. In 2003, we entered into two technical agreements with Heineken International for assistance regarding all technical issues related to the production and bottling of Heineken Lager, one for Chile and the other one for Argentina. On October 12, 2011, we and Heineken International signed the Amended and Restated versions of theTrademark License Agreements which provide us with the exclusive rights to produce, sell and distribute Heineken beer in Chile and Argentina, in force as of January 1, 2011. These agreements have an initial term of 10 years, and shall automatically be renewed each year (January 1) for a new period of ten years, unless any party gives notice of its decision not to renew, in which case the agreements will be in force until the last renewal period expires.In May 2004, we entered into a technical assistance agreement with Heineken Technical Services B.V. for operational aspects of our breweries, with an initial term of one year, renewable for subsequent periods of one year each. See “Item 6: Directors, Senior Management and Employees” and “Item 7: Major Shareholders and Related Party Transactions.” The license agreement between CCU Argentina and Anheuser-Busch, signed in 1995, as amended, also provides us with both technical and marketing assistance for the production and marketing of Budweiser beer brand in Argentina. See “Item 4: Information on the Company – Our Business – Business Overview – Our Beer Business – Our Beer Business in Argentina – Beer Production and Marketing in Argentina.”
Critical Accounting Policies and Practices
A summary of our significant accounting policies is included in Note 2 to our audited consolidated financial statements, which are included in this annual report. The preparation of financial statements requires management to make estimates and assumptions that affect the amounts reported in the consolidated financial statements and accompanying notes. These estimates and assumptions are based on historical experiences, changes in the business environment and information collected from qualified external sources. However, actual results may differ from estimates under different conditions, sometimes materially. Critical accounting policies and estimates are defined as those that are both most important to the portrayal of our financial condition and results and/or require management’s subjective judgments. The most critical accounting polices and estimates are described below.
a) Property, plant, equipment and bottles:The key judgments we must make under the property and equipment policy include the estimation of the useful lives of our various asset types, expected residual values, the election to utilize primarily the straight-line method for recording depreciation, management’s judgment regarding appropriate capitalization or expensing of costs related to fixed assets, and the evaluation of potential impairments, if any.
Property and equipment are stated at cost and are depreciated using the straight-line method based on the estimated useful lives of the assets. In estimating the useful lives (residual values are considered) we have primarily relied upon actual experience with the same or similar types of equipment and recommendations from the manufacturers. Useful lives are based on the estimated amount of years an asset will be productive and are revised periodically to recognize potential impacts caused by new technologies, changes to maintenance procedures, changes in utilization of the equipment, and changing market prices of new and used equipment of the same or similar types.
Property and equipment assets are evaluated for possible impairment. Factors that would indicate potential impairment may include, but are not limited to, significant decreases in the market value of the long-lived asset(s), a significant change in the long-lived asset’s physical condition and operating or cash flow losses associated with the use of the long-lived asset. This process requires our estimate of future cash flows generated by each asset or group of assets. For any instance where this evaluation process indicatesimpairment, the appropriate asset’s carrying values are written down to net realizable value and the amount of the write-down is charged against the results of continuing operations.
81
Expenditures that substantially improve and/or increase the useful life of facilities and equipment are capitalized. Other maintenance or repair costs are charged income as incurred.
b) Goodwill, impairment of goodwill and intangible assets other than goodwill:Management exercises judgment in assessing goodwill and the useful lives of other intangible assets including commercial trademarks and software programs. Judgments are also exercised for assessing potential impairments for these kinds of assets. Goodwill is recorded as the excess of the purchase price of companies acquired over the fair value of identifiable net assets acquired and is accounted for at its cost value less accumulated impairment losses, if any. Goodwill in the acquisition of joint ventures is assessed for impairment as part of the investment, provided that there are signs indicating that the investment may be impaired. We annually review the recorded value of our goodwill, or sooner if changes in circumstances indicate that the carrying amount may exceed fair value. Recoverability of the carrying value of the asset is determined by comparing net book value, including goodwill, to fair value based on the estimated future net cash flows of the relevant assets. See Note 2.14 and 2.15.
c) Provisions for returns of bottles and containers: In Chile, returnable bottles are proprietary and are only given to customers in exchange for a deposit equivalent to a significant portion of the replacement cost of such bottles. The provisions for returns of bottles and containers (glass and plastic returnable bottle and craters) delivered to sales channels for selling and distributing products is determined by means of the outstanding bottles and containers estimated to be returned to the Company, based on yearly physical counts and historic experience, valued at the weighted average of the prior year deposits, plus the value of the deposits placed during the current year as per each kind of bottles and containers.
Such obligation is primarily disclosed in non-current liabilities as the estimated payment is beyond one year. Such liability is not discounted, since it is considered a payable on sight, with the original invoice and the return of the respective container, and it does not have adjustability or interest clauses of any kind in its origin.
The adjustment is based on an estimate that is carried out by counting the bottles held by customers and adding an estimate of the number of bottles in hands of the final consumers. This estimate is based on independent studies and historical information regarding the return of these bottles.
In Argentina, all companies use the same returnable bottles. Therefore, unlike in Chile where returnable bottles are proprietary, bottles in Argentina do not require a deposit, because bottles are provided to the customers using a contract on consignment. See Note 2.21.
d) Severance Indemnities: As of December 31, 2011, the liabilities for mandatory severance indemnities have been determined at their current actuarial value, based on the accrued cost of the benefit, using an annual discount interest rate of 7.7% in Chile and 26.6% in Argentina. The calculation also considers several assumptions such as the estimated years of service that the personnel will have at the date of their retirement, mortality rates and future salary increases.
e) Financial instruments: The Company recognizes a financial asset or liability in its balance sheet when it becomes subject to the contractual stipulations of a financial instrument. As of the date of the initial recognition, Management classifies its financial assets (i) at fair value through income and (ii) collectible credits and accounts, depending on the purpose for which the financial assets were acquired. The fair value of the instruments that are actively quoted in formal markets is determined by the quoted price as of the financial statements closing date. For those investments without an active market the fair value is determined using valuation techniques, among them (i) the use of recent market transactions, (ii) references to the current market value of another financial instrument of similar characteristics, (iii) discounted cash flows, and (iv) other valuation models. Financial assets are initially recognized at fair value. For those instruments not classified at fair value through income, any cost attributable to the transaction is recognized as part of the asset value.
82
These assets are valued at fair value and the income or losses originated by the fair value variation are recognized in the Consolidated Statement of Income.
The assets at fair value through income include financial assets held for trading, and financial assets classified as held for trading by the Company. Financial assets are classified as held for trading when acquired with the purpose of selling them within a short term. Derivative instruments are classified as held for trading, unless they are classified as hedge instruments.
The estimated losses from bad debts are determined by applying differentiated percentages, taking into account maturity factors, until reaching 100% of the balance in most of the debts older than 180 days, with the exception of those cases that in accordance with current policies, for which losses are estimated due to partial deterioration based on a case by case analysis.
Trend Information
The Chilean economy experienced a 6.0% increase in 2011 showing its largest expansion in over a decade. According to the statistics published by the Central Bank of Chile, as of March of 2012, the GDP growth for the year 2012 has been estimated at 4.4%. The inflation rate was 4.4% in 2011 and it is expected to be lower in 2012, reaching 3.2%, according to the same source. Unemployment was 7.2% on average, and decreased to 6.6% in December 2011. We cannot assure you that our products’ consumption will vary in the same proportion as the overall economic indicators, since there is no perfect correlation. The conditions in particular sectors of the economy may have different impact in our business. Factors such as competition and changes in relative prices among the various types of beverages can affect the consumption of our products. In particular, our beer brands in Chile may face increased competition from other brewers as well as from alcoholic beverages, such as wine and spirits, and non‑alcoholic beverages, such as soft drinks. Historically, beer consumption in Chile has been influenced by changes in domestic wine prices. Increases in domestic wine prices tend to increase beer consumption, while reductions in wine prices have reduced or slowed down the growth of beer consumption. For example, during 2005 beer consumption and wine prices increased significantly. However, in 2006, beer consumption grew significantly but wine prices decreased. In recent years, as a result of a smaller wine harvest and the higher international demand for Chilean wine, the price of bulk wine increased. Similarly, the price of soft drinks has decreased relative to the price of beer over the past few years due to lower packaging costs and the introduction of larger packaging formats, which may also affect further growth in beer consumption.
Since 2005, the Argentine government has restricted gas exports to Chile due to supply problems in that country. This situation has increased the costs of operating our beer production plants in Chile and Argentina, as well as our soft drinks plants in Chile. Additionally, it has increased electrical power costs related to these same gas restrictions. We do not need additional investments because our boilers can work with gas or with alternative fuels, such as diesel oil or butane gas. In addition, the new plant built in Quintero built process imported liquefied natural gas (“GNL”) started its operation in August 2009, bringing further relief to the energy issue. More investments seeking a diversified matrix of energy resources, mostly private, are in the process of materialization: GNL plants, hydroelectric plants and windmill plants.
After four years of recession in Argentina, the economy stabilized in 2003, as evidenced by significant increases in consumption and in the recovery of prices in the beer industry. This positive trend has continued, whereas inflation rate has become a burden. Nevertheless,further recovery in Argentina will depend on deep structural reforms in many areas, as well as the solution to the local energy crisis and an increase in investments to support current economic growth.
Revenues from CCU Argentina, in Chilean pesos, are also subject to the volatility of exchange rates of the Chilean peso and Argentine peso in any given period. This volatility may also affect the level of income reported from our foreign operations under IFRS. Restrictions imposed by the Argentine government to the repatriation of profits might delay the flow of cash from Argentina to Chile. There is a new ruling in Argentina with respect to imports which mandates that a company can import goods only if it can demonstrate a flow of exports to balance the trade situation. This rule affects our businesses as we regularly import raw materials and finished products.
83
ITEM 6: Directors, Senior Management and Employees
Directors and Senior Management
The following table sets forth certain information with respect to our executive officers and members of our board of directors, as of March 2011:
Directors | Position | Position Held Since | At CCU Since |
|
|
|
|
Guillermo Luksic(1) | Chairman of the Board and Director | September 1990 (Chairman) November 1986 (Director) | November 1986 |
John Nicolson | Vice Chairman of the Board and Director | November 2008 (Vice Chairman) October 2008 (Director) | October 2008 |
Andrónico Luksic(1) | Director | November 1986 | November 1986 |
Manuel José Noguera | Director | May 1987 | May 1987 |
Carlos Olivos(2) | Director | October 2003 | October 2003 |
Philippe Pasquet | Director | June 2003 | June 2003 |
Francisco Pérez(3) | Director | July 1998 | February 1991 |
Alberto Sobredo(2) | Director | April 2007 | April 2007 |
Jorge Luis Ramos(4) | Director | May 2011 | May 2011 |
|
|
|
|
Senior Management | Position | Position Held Since | At Company Since |
|
|
|
|
Patricio Jottar | Chief Executive Officer | July 1998 | July 1998 |
Marcela Achurra | Legal Affairs Manager | February 2005 | September 1995 |
Javier Bitar | Viña San Pedro Manager | January 2008 | May 2004 |
Marisol Bravo | Corporate Affairs and Public Relations Manager | June 1994 | July 1991 |
Rene van der Graaf(5) | CCU Chile Manager | August 2011 | August 2011 |
Pablo De Vescovi | Human Resources Manager | September 1998 | November 1994 |
Francisco Diharasarri | ECUSA Manager | October 2003 | June 1985 |
Roelf Duursema | General Comptroller | January 2005 | November 2004 |
Hugo Ovando | Cía. Pisquera de Chile Manager | April 2010 | September 1997 |
Armin Kunstmann | Chairman of Cía. Cervecera Kunstmann | May 2002 | November 2006 |
Dirk Leisewitz | Corporate Operations Manager | January 2005 | December 1987 |
Stephen Koljatic | Development Manager | April 2010 | September 2001 |
Ricardo Reyes | Chief Financial Officer | July 2005 | July 1996 |
Fernando Sanchis | CCU Argentina Manager | May 1995 | November 1994 |
(1) Mr. Guillermo Luksic and Mr. Andrónico Luksic are brothers. (2) The Shareholder’s Meeting held on April 11, 2012 renewed the Board members for a term of three years. The members are Messrs Guillermo Luksic, Andrónico Luksic, John Nicolson, Francisco Pérez, Philippe Pasquet, Manuel José Noguera, Jorge Luis Ramos, Carlos Molina and Vittorio Corbo. (3) Mr. Francisco Pérez was our Chief Executive Officer between 1991 and 1998. (4) Mr. Jorge Luis Ramos was designated on May 4, 2011, after the resignation of Mr. Giorgio Maschietto. (5) Mr Rene Van der Graaf assumed the position on August 3, 2011 after the resignation of Mr. Theodorus de Rond.
|
84
Guillermo Luksic (56), has served as our Chairman of the Board and Director since September 1990 and November 1986, respectively. He is currently Chairman of the Board of Directors of Quiñenco S.A., Cervecera CCU Chile Ltda, ECUSA, CCU Argentina S.A., Viña San Pedro Tarapacá S.A (VSPT), MadecoS.A. and Compañía Sud Americana de Vapores S.A., as well as a member of the board of directors of several other companies, including Inversiones y Rentas S.A. (IRSA), CICSA, Banco de Chile, LQ Inversiones Financieras S.A., Enex, Antofagasta plc. and Nexans. Mr. Luksic is an active member of Centro de Estudios Públicos, a Chilean think tank and member of the board of directors of Universidad Finis Terrae.
John Nicolson (58), has served as our Director since October 2008 and was appointed as Vice Chairman in November 2008. He is the Chairman of Inversiones y Rentas S.A. (IRSA) and member of the Board of Cervecera CCU Chile Ltda. and Compañía Pisquera de Chile S.A. He is currently President of Heineken Americas, having joined from Scottish&Newcastle following its acquisition by Heineken N.V. He is also a member of Heineken’s Executive Committee and a member of Edinburgh University’s Advisory Board. He received a degree in Marketing and Economics at the University of Strathclyde, Scotland, and also completed the Executive Program at Carnegie Mellon University, USA and the Directors’ Forum at London Business School, United Kingdom.
Andrónico Luksic (58), has served as our Director since November 1986. He is currently Chairman of the Board of SM Chile S.A., and Vice Chairman of the Board of Banco de Chile, Quiñenco and LQIF S.A., as well as member of the board of directors of several other companies and institutions , including Madeco S.A, Sociedad de Fomento Fabril (“SOFOFA”), Santiago Stock Exchange, and other. He serves on the International Business Leaders’ Advisory Council for the Mayor of Shanghai, where in 2011 he was appointed Vice Chairman. He is member of the Advisory Board of the Panamá Canal, of the Brookings Institution’s International Advisory Council, as well as a member of the Latin America Conservation Council of the Nature Conservancy. By appointment of the President of Chile, he is one of three Chilean representatives to the APEC Business Advisory Council (ABAC). He is also a trustee at Babson College and member of the International Advisory Council at the Blavatnik School of Government at the University of Oxford, among other reputed educational institutions.
Jorge Luis Ramos (59), has served as our Director since May 2011 after the resignation of Mr. Giorgio Maschietto. He is also currently a member of the board of directors of Viña San Pedro Tarapacá S.A (VSPT)., ECUSA, Cervecera CCU Chile Ltda., CCU Argentina S.A., CICSA, Compañía Pisquera de Chile S.A. (CPCh) and Inversiones y Rentas S.A. Mr. Ramos was appointed Deputy President for Heineken Americas in 2010. He joined FEMSA in 1996 and became CEO of FEMSA Cerveza in 2006, after serving two years as Co-CEO. Before joining FEMSA, Mr. Ramos held executive positions in various corporations and financial institutions, including Grupo ALFA and Santander. Mr. Ramos has a bachelor’s degree in Administration and Public Accounting from Tecnológico de Monterrey and an MBA degree from the University of Pennsylvania’s Wharton School of Business.
Manuel José Noguera (62), has served as our Director since May 1987. He is currently Chief Legal Counsel of Quiñenco and senior partner at the law firm Noguera, Larraín y Dulanto Ltda. He has been the legal advisor for the Luksic group for over 35 years. He is member of the board of Inversiones y Rentas S.A.(IRSA) . He is also legal advisor to the Board of Madeco S.A. He received his law degree from the Catholic University of Chile.
Carlos Olivos (70), has served as our Director since October 2003. He is currently senior partner at the law firm Guerrero, Olivos, Novoa y Errázuriz Ltda., as well as member of the board of directors of Banco Santander Santiago S.A. He was member of the International Bank for Reconstruction and Development’s (World Bank) legal department, Head of the Banco Central de Chile’s legal department and Chairman of the Board at the then Banco Osorno and Banco Santiago. He received his law degree from the University of Chile and his Master’s degree in Comparative Jurisprudence from New York University Law School.
Phillipe Pasquet (73), has served as our Director since June 2003. He has been working for Heineken since 1976. He is member of the board of directors of CCU Argentina S.A., CICSA, Viña San Pedro Tarapacá S.A. (VSPT), ECUSA, Cervecera CCU Chile Ltda, Compañía Pisquera de Chile S.A. (CPCh), Foods and Inversiones y Rentas S.A. (IRSA). He received degrees from theÉcole Supérieure de Commerce in Dijon, France, theInstitut International de Commerce in Paris, and theCentre Européen d’Education Permanente in Fontainebleau, France.
85
Francisco Pérez (54), has served as our Director since July 1998. He is Chief Executive Officer of Quiñenco since 1998. Prior to joining Quiñenco, he was our Chief Executive Officer between 1991 and 1998. He is member of the board of several companies, including Cervecera CCU Chile Ltda, CICSA, CCU Argentina S.A., ECUSA, Foods, Compañia Pisquera de Chile S.A. (CPCh), Inversiones y Rentas S.A. (IRSA), Madeco S.A., Banco de Chile, Banchile Corredores de Seguros S.A., LQ Inversiones Financieras S.A., Foods and Compañía Sudamericana de Vapores S.A.He received a degree in Business Administration from the Catholic University of Chile and a Master’s degree in Business Administration from the University of Chicago.
Alberto Sobredo (63), has served as our independent Director since April 2007 when he was appointed by the Pension Fund administrators. He held several positions at Coca Cola Gillette, Reckitt & Colman and Unilever, where he was President and CEO of Unilever Latin America until his retirement in January 2007. He received a Doctorate degree in Management Sciences from the University UADE in Argentina.
The Shareholder’s Meeting held on April 11, 2012 renewed the Board members for a term of three years. The current members are Messrs. Guillermo Luksic, Andrónico Luksic, John Nicolson, Philippe Pasquet, Francisco Pérez, Jorge Luis Ramos, Carlos Alberto Molina , Manuel José Noguera and Vittorio Corbo.
Carlos Alberto Molina(55), has over 25 years of management and strategic consulting experience. He joined Heineken through the acquisition of Femsa Cerveza and is currently responsible for Business Development for Heineken Americas. Mr. Molina was previously in charge of Planning and Strategy in Femsa Cerveza. He was also a board member of Kaiser in Brazil. Prior to that, Mr Molina was a Partner with Booz, Allen & Hamilton, a global business consulting firm. Mr. Molina is a Mexican citizen and has a BBA from the University of Houston; and an MBA from the University of Texas.
Vittorio Corbo (69) is a Senior Research Associate at the Centro de Estudios Públicos in Santiago, Chile and also Professor of Economics at the Pontificia Universidad Católica de Chile and at the Universidad de Chile. He is currently member of the Board of Banco Santander-España, Banco Santander Chile and Endesa-Chile. He is also Chairman of the Board of SURA Insurance-Chile and economic consultant to several large corporations. Mr. Corbo holds a commercial engineering degree (with distinction) from Unviversidad de Chile and a Ph.D. in economics from MIT.
Patricio Jottar (49), has served as our Chief Executive Officer since 1998. He is also currently a Director of CCU Argentina S.A., CICSA, ECUSA, Viña San Pedro Tarapacá S.A.(VSPT), Viña Valles de Chile S.A., Foods, Cervecería Austral S.A.Cervecera CCU Chile Ltda,, Aguas CCU-Nestlé Chile S.A, Promarca S.A., Transportes CCU Ltda. and Compañía Cervecera Kunstmann S.A.(CCK) and is Chairman of the Board of Compañía Pisquera de Chile S.A. (CPCh) and PLASCO. Prior to joining us, he was Chief Executive Officer of Santander Chile Holding. He received a degree in Business Administration from the Catholic University of Chile and a Master’s degree in Economics and Business Administration from the Instituto de Estudios Superiores de la Empresa, in Barcelona, Spain.
Marcela Achurra (46), is our Legal Affairs Manager and has been with us since 1995. She is also a Director of Aguas CCU-Nestlé Chile S.A. Prior to her current position, she was Legal Counsel of our subsidiary Viña San Pedro S.A. She received her law degree from the Catholic University of Chile.
Javier Bitar (46), is the General Manager of VSPT and has been with us since 2004. Additionally, he is member of the board of Viña Valles de Chile S.A., Viña Ältair S.A., Viña Misiones de Rengo S.A., Viña del Mar de Casablanca S.A., Viñas Orgánicas S.P.T. S.A., Viña Santa Helena S.A. and Transportes CCU Ltda, and Chairman of Viña Urmeneta S.A.. Prior to his current position, he was Chief Operating Officer of VSPT and General Manager of Viña Santa Helena. Prior to joining us, he was Senior Partner at Grupo Sur Consultores, a boutique consulting firm specializing in management consulting and business process design. He received Bachelor’s and Master’s degrees in Mathematical Engineering from the University of Chile and a diploma in Corporate Finance from the University Adolfo Ibáñez in Chile.
Marisol Bravo (52), is our Corporate Affairs and Public Relations Manager and has been with us since 1991. Prior to her current position, she was Head of Special Projects. Before joining us, she was Assistant Manager of Marketing at Citicorp Mutual Funds. She received a degree in Business Administration from the University of Chile.
86
Rene van der Graaf (47), is the General Manager of Cervecera CCU Chile Ltda and has been with us since August 2011. He is also currently a Director of Cervecería Austral S.A, PLASCO and Transportes CCU Ltda. He has been with Heineken NV since 1992 in senior marketing and sales roles, as well as HR and General Management roles. Before joining us he was General Manager of Brarudi S.A. (a joint venture between Heineken NV and the Government of Burundi), and prior to that, Commercial Director for the Asia Pacific region. He graduated (BBA) from the Amsterdam School of Business Administration and Economics, and completed senior management programs at INSEAD in France.
Pablo De Vescovi (59), is our Human Resources Manager and has been with us since 1994. Prior to serving in this capacity, he was Human Resources Manager of ECUSA. Before joining ECUSA he was the Human Resources Manager of Embotelladora Chile S.A. (“Embochile”), a former PepsiCo bottler, and Human Resources Vice President of The Chase Manhattan Bank in Chile. He received a degree in Business Administration from the Catholic University of Chile.
Francisco Diharasarri (51), is the General Manager of ECUSA and has been with us since 1985. Prior to his current position, he was General Manager of Cervecera CCU Chile Ltda, General Manager of ECUSA and General Manager of PLASCO. He is also currently Chairman of the Board of Aguas CCU-Nestlé Chile S.A, Foods and Alimentos Nutrabien S.A., and is also a member of the Board of CICSA, PLASCO, Transportes CCU Ltda, Promarca S.A.. He received a degree in Civil Engineering from the University of Chile.
Roelf Duursema (61), is our General Comptroller and has been with us since 2004. He is currently member of the Board of PLASCO and Transportes CCU Ltda. He has been working with Heineken since 1978, in different countries around the world, in marketing, sales, finance and information technology positions, as well as General Management. Prior to joining us he was the Director for Corporate Information Technology for the Heineken Group. He received a degree in Mechanical Engineering from the Technical University Delft in the Netherlands and a Master’s degree in Economics from the Erasmus University in Rotterdam.
Armin Kunstmann (59), is the Chairman of the Board of Compañía Cervecera Kunstmann S.A. (“CCK”) and of Cervecería Belga de la Patagonia. He has been with us since 2006. He started its original brewery in 1991, which later became CCK. He is currently Director of Levaduras Collico S.A., a yeast company, and of Austral Incuba, a new business development center of Universidad Austral from Valdivia, an important university in Southern Chile. Prior to his current position, he was General Manager of Levaduras Collico S.A. during 12 years. He received a degree in Chemical Civil Engineering and a Master’s degree in Chemical Engineering from the University Federico Santa María in Chile.
Hugo Ovando (42), is the General Manager of Compañía Pisquera de Chile S.A. (CPCh) and assumed the position as of April 30, 2010. He has been with us since 1997. He is also a director of Aguas CCU-Nestlé Chile Ltda, CICSA, PLASCO, Alimentos Nutrabien S.A., and Chairman of the Board of Comercial CCU S.A and Transportes CCU Ltda. Prior to these positions, he was Corporate Projects Manager and Investor Relations Manager and Development Manager. He received a degree in Business Administration from the Catholic University of Chile and a MBA from Babson College.
Stephen Koljatic (36) is our Corporate Development Manager since April 2010. He joined the Company in 2001 as Finance Manager in Karlovacka Brewery in Croatia. Between 2003 and 2005 he was Corporate Strategic Planning Manager and later in 2006 he became Finance Manager at Transportes CCU. In 2007 he joined Heineken’s Group Commerce in the Netherlands in the position of Global Sales & Distribution Development Manager until 2008. Prior to his current position he was Sales Manager at Comercial CCU, with responsibilities for northern Chile. Mr. Koljatic received his degree in Business Administration from the Catholic University of Chile in 1999 and an MBA from the same university in 2005.
Ricardo Reyes(57), is our Chief Financial Officer and he has been with us since 1996. He is currently a member of the Board of Comercial CCU S.A., PLASCO and Transportes CCU Ltda. Prior to his current position, he was the General Manager of VSPT between May 2004 and July 2005, and our Chief Financial Officer for almost 10 years. Prior to joining us, he worked 18 years at Esso Chile Petrolera, an Exxon affiliate, holding the positions of Operations Manager, Financial and Planning Manager, and Information System Manager. He received a degree in Civil Engineering from the Catholic University of Chile.
87
Fernando Sanchis (51), is the General Manager of CCU Argentina and has been with us since 1995. Prior to joining us, he was Chief Financial Officer of Embochile, a former PepsiCo bottler and held the same position at Uruguay’s PepsiCo’s bottler. He received an accounting degree from the Buenos Aires University of Argentina.
Our senior managers are full time employees, therefore, they do not perform business activities outside us. The principal business activities of our 2011 directors are summarized in the following table:
Directors | Business Activities |
|
|
Guillermo Luksic | Chairman of Quiñenco |
Jorge Luis Ramos | Director of Companies |
Andrónico Luksic | Vice Chairman of Banco de Chile |
Manuel José Noguera | Legal Counsel of Quiñenco |
Carlos Olivos | Senior Partner of Guerrero, Olivos, Novoa & Errázuriz (law firm) |
Philippe Pasquet | Director of Companies related to Heineken |
Francisco Pérez | Quiñenco’s CEO |
Alberto Sobredo | Director of Companies |
John Nicolson | President of Heineken Americas |
On January 13, 2003, the existing shareholders’ agreement was amended in order to allow the SchörghuberGroup to sell its interest in IRSA to Heineken Americas B.V., a subsidiary of Heineken International B.V. On April 17, 2003, the Schörghuber Group gave Quiñenco formal notice of the sale of its interest in IRSA to Heineken International B.V. Currently, Heineken Chile Ltda., a Chilean limited corporation controlled by Heineken Americas B.V., owns 50% of IRSA’s shares. As of December 31, 2005, IRSA’s primary shareholders’ agreement gives Quiñenco the right to propose to our board of directors the candidates for Chief Executive Officer, and to Heineken Chile Ltda. our General Comptroller and CCU Chile’s General Manager. On the other hand, under the agreement, neither Quiñenco nor Heineken Chile Ltda. can separately, directly or indirectly, buy or sell our shares.
Compensation
For the year ended December 31, 2011, the aggregate amount of compensation paid by us to all our directors was CLP2,091 million.
The Board of Directors’ compensation is determined by the shareholders at the annual general shareholders’ meeting. The Board’s compensation, approved at our shareholders’ meeting held on April 15, 2011, consists of an attendance fee per meeting of UF100 per board member and a fee that is twice as much for the Chairman, along with a profit-sharing amount equal to 3% of distributed dividends for all board members, proportionately (prior to 2008 this amount was 5% of distributed dividends). If distributed dividends exceed 50% of our liquid profits, the profit-sharing amount will be calculated over a maximum of 50% of our liquid profits. Additionally, board members who participate in the Business Committee receive UF17 for each meeting they attend. LawN°18,046 introduced a mandatory remuneration for the board members who are members of the Directors Committee, consisting of, at a minimum, one third of the remuneration a board member receives in such capacity. The rule was effective in 2010 and the Shareholders Meeting of April 15, 2011 approved that this remuneration was to be paid with UF34 for each meeting the board member attends a session and the remaining portion, up to the mandated one third, will be paid once the total amount of the compensation paid to the board member is known. Furthermore, board members who sit on the Audit Committee receive a monthly compensation of UF25. The described compensation package was also approved for 2012 in the shareholders’ meeting held on April 11, 2012.
In 2011, the total compensation paid by us and our subsidiaries to each of our directors for services rendered was as follows:
88
| Attendance | Dividend |
|
Director | Meetings fee(1) | Participation | Total |
| (CLP thousands) | ||
Guillermo Luksic | 28,492 | 199,813 | 228,306 |
John Nicolson | 17,438 | 184,499 | 201,937 |
Andrónico Luksic | 8,751 | 184,499 | 193,250 |
GiorgioMaschietto | 41,382 | 192,156 | 233,538 |
Jorge Luis Ramos | 48,070 |
| 48,070 |
Manuel José Noguera | 21,881 | 184,499 | 206,381 |
Carlos Olivos | 105,102 | 184,499 | 289,601 |
Philippe Pasquet | 94,231 | 192,156 | 286,387 |
Francisco Pérez | 156,184 | 184,499 | 340,683 |
Alberto Sobredo | 105,102 | 184,499 | 289,601 |
|
|
|
|
(1) Includes the remuneration for members of the Audit, Directors and Business Committees. | |||
For the year ended December 31, 2011, the aggregate amount of compensation paid to our senior managers, to other managers and to the principal executives, was CLP7,372 million. We do not and are not required under Chilean law to disclose to our shareholders or otherwise make public information as to the compensation of our individual senior managers.
We do not maintain any stock option, pension or retirement programs for our directors or senior managers.
Board Practices
We are managed by our board of directors which, in accordance with our bylaws (Estatutos), is formed by nine directors who are elected at the regular shareholders’ meeting. The entire board of directors is elected for three years and the last election of directors took place in April 2012. The board of directors may appoint replacements to fill any vacancies that occur during periods between annual shareholders’ meetings. If such vacancy occurs, the entire board of directors must be renewed at the next following shareholders’ meeting.On May 4, 2011, Mr. Giorgio Maschietto Montuschi resigned as director of the Company, and Mr. Jorge Luis Ramos Santos was appointed as director until April 11, 2012, the date of the next regularshareholders’ meeting, when the entire board of directors ought to be renewed.
Our senior managers are appointed by the board of directors and hold office at the discretion of the board of directors. There are regularly scheduled meetings of the board of directors once a month; extraordinary meetings are specially summoned by the Chairman at the request of any of the board of directors’ members. The board of directors does not have an executive committee. Nevertheless, we have a Business Committee consisting of certain board members which meets only on those occasions where it is necessary to review issues of special relevance which are later to be considered by the Board.
Directors Committee
The directors committee’s discussions, agreements, and organization are regulated, in every applicable matter, by the Chilean Corporations Act provisions relating to board of directors’ meetings. The directors committee shall inform the board of directors about the manner in which it will request information and about its resolutions.
In addition to the general liabilities imputable to any director, the directors that compose the directors committee shall, in the exercise of their duties, be jointly and severally liable for any damage caused to the corporation or the shareholders.
89
The directors committee shall be composed of three members, the majority of which shall be independent. Independent directors are those that would have been elected even if the votes cast in the director’s favor bythe controlling shareholder and its related persons had not been counted. However, a majority of directors related to the controlling shareholder is permissible if there are an insufficient number of independent directors. Should there be more than three directors entitled to participate in the directors committee, the board of directors shall elect the members of the directors committee by unanimous vote. Should the board of directors fail to reach an agreement, the matter shall be decided by drawing.
The Securities Market Law and the Chilean Corporations Act were further amended by Law
N° 20.382, effective January 1, 2010 (the “2010 amendment”).
Under the 2010 amendment, corporations whose market capitalization reaches or exceeds 1.5 millionUnidades de Fomento (as of March 31, 2012 approximately CLP33,800 million) andat least 12,5% of its outstanding shares with voting rights are in the possession of shareholders that individually control or possess less than10% of such shares, shall designate acomité de directores or “directors committee.” If the market capitalization or stock percentage falls below this threshold, the obligation to designate a directors committee no longer applies. However, corporations which do not meet these requirements may voluntarily assume the obligations concerning the directors committee, in which case they shall strictly follow the provisions of the amendment.
Pursuant to the 2010 amendment, the powers and duties of the directors committee are as follows:
· to examine the independent accountants’ reports, the balance sheets, and other financial statements submitted by the corporation’s managers or liquidators to the shareholders, and issue an opinion about them prior to their submission for shareholder approval;
· to propose to the board of directors, the independent accountants which the board must then propose to and the risk rating agencies which the board must inform to the shareholders annually. Should the board of directors disagree with the directors committee’s proposal, the board shall be entitled to make its own proposal, submitting both to the shareholders for their consideration;
· to examine the documentation concerning related party transactions of the company and its subsidiaries, and to produce a written report on such transactions. A copy of the report shall be delivered to the board, and shall be read at the board meeting in which the transaction is presented for approval or rejection;
· to examine the managers’, principal executive officers’ and employees remuneration policies and compensation plans;
· to prepare an annual report of the performance of its duties, including the principal recommendations to shareholders;
· to report to the board of directors the convenience of retaining or not the independent accounting firm to provide non-audit services, which are not prohibited by the Securities Market Law, if the nature of such services could impair the accountants independence from the company; and
· all other matters contemplated in our bylaws or entrusted to the directors committee by a shareholders’ meeting or the board of directors.
Regarding related party transactions mentioned in the third bullet point above, the 2010 amendmentintroduced a new Chapter XVI to the Chilean Corporation Act for open stock corporations and its subsidiaries, while dispositions of articles 44, 89 and 93, as amended, remain applicable only to closed corporations, which are not subsidiaries of an open stock corporation. See “Item 7: Major Shareholders andRelated Party Transactions.”
The directors committee shall be composed of three members, the majority of which shall be independent. Pursuant to the 2010 amendment, no person shall be considered independent who, at any time during the previous eighteen months, shall have incurred in any one of the following situations:
1.- Maintained any relationship, interest or economic, professional, credit or commercial dependence, of a nature and relevant volume, with the company, other companies of the financial conglomerate to which the company belongs, its comptroller, or principal executive officer of any one of them, or have been a director, manager, administrator, principal executive officer or advisor of such companies.
90
2.- Is a close relative (i.e., parents, father/mother in law, sisters, brothers, sisters/brothers in law), to any one of the persons referred to in the previous number.
3.- Was a director, manager, administrator or principal executive officer of non-profit organizations that received contributions or large donations from any individual referred to in number 1 above;
4.- Was a partner or shareholder that possessed or controlled, directly or indirectly, 10% or more of the company’s capital; a director; manager; administrator or principal executive officer of entities who had provided consulting or legal services, for relevant amounts, or of external audit, to the persons referred to in 1 above;
5.- Was a partner or shareholder who possessed or controlled, directly or indirectly, 10% or more of the company’s capital; a director; manager; administrator or principal executive officer of principal competitors, suppliers or clients of the company.
Should there be more than three directors entitled to participate in the directors committee, the board of directors shall elect the members of the directors committee by unanimous vote. Should the board of directors fail to reach an agreement, preference to be appointed to the committee shall be given to directors elected with the highest percentage of votes cast by shareholders that individually control or possess less than 10% of the companys shares. If there is only one independent director, such director shall appoint the other members of the committee among non independent directors. Such directors shall be entitled to exercise full powers as members of the committee. The Chairman of the board of directors shall not be entitled to be appointed as a member of the committee nor any of its subcommittees, unless he is an independent director.
To be elected as independent director, the candidates must be proposed by shareholders that represent 1% or more of the shares of the company, within 10 days prior to the date of the shareholders' meeting called to that end.
The candidate who obtains the highest votes shall be elected as independent director.
At the Shareholders meeting held on April 11, 2012 a new Board of Directors was appointed for a three year term. Mr. Vittorio Corbo was elected as independent director in accordance with article 50 bis of Corporation Act.
In the Board Meeting held on April 18, 2012, the independent director Mr. Vittorio Corbo , in accordance with the above-referenced law, appointed Messrs. Philippe Pasquet and Francisco Pérez as members of our Directors Committee, which is composed of the three directors above mentioned.
The members of the Directors Committee shall be remunerated. The amount of such remuneration shall be established annually by the shareholders, taking in consideration the duties that the directors’ committee members shall perform, which shall not be less than a third of the remuneration of a regular director. The remuneration of our directors committee members, as approved at the shareholders’ meeting of the company held on April 15, 2011, is 34Unidades de Fomento (as of March 31, 2012, approximately CLP766 thousand) per assistance to directors committee meeting plus the amount required to complete the remaining third of the remuneration of a regular director. The same remuneration package was approved for 2012, at the shareholders’ meeting of the company held on April 11, 2012.
The shareholders shall determine the budget of the directors committee and those of its advisors, which, pursuant to the 2010 amendment, shall not be less than the aggregate amount of the annual remuneration of the committee members. The directors committee shall be allowed to request the recruitment of professionals to fulfill its duties within the limits imposed by the budget. The activities of the directors committee, the annual report of the performance of its duties and its expenses, including its advisors’ expenses, shall be included in the annual report and conveyed to the shareholders. The budget of our directors committee and its advisors, approved at the shareholders’ meeting of the company held on April 15, 2011, shall be equal to the aggregate amount of the annual remuneration of the committee members.
91
Audit Committee. In accordance with provisions of the Securities Exchange Act of 1934, as amended (the “Exchange Act”), the Sarbanes-Oxley Act of 2002 (the “Sarbanes-Oxley Act”) and the corporate governance rules of the New York Stock Exchange (the “NYSE Rules”) applicable to us as a foreign private issuer with securities listed on a U.S. national exchange, we have an Audit Committee.
At the Board of Directors meeting of April 18, 2012, following the election of a new board at the Shareholders´ meeting, the Board of Directors appointed the following Directors to our Audit Committee: Messrs. Vittorio Corbo and Philippe Pasquet. Mr. Pasquet and Mr. Corbo meet the independence criteria under the Exchange Act and under the NYSE Rules.
The duties of the audit committee are:
| · | To be responsible for the hiring, remuneration and supervision of the work of public accounting firms hired to prepare or issue audit reports or review or certify such reports. The external auditors shall report directly to the audit committee regarding such matters. |
| · | Resolve disputes that arise between our administration and the external auditors with regard to financial reports. |
| · | Grant approval prior to the contracting of non-audit services provided by the external auditors. |
| · | Establish a procedure for receiving and responding to complaints received with regard to accounting, accounting controls or other auditing matters whereby employees may anonymously and confidentially report their concerns related to these matters. |
| · | Establish an annual budget for expenses and hiring of external consultants. |
The audit committee meets regularly and also holds meetings with our managers, our comptroller, and our internal and external auditors in order to discuss a variety of topics related to its duties.
Employees
Chile
As of December 31 of the last three years, we had a total of 4,375, 4,454 and 4,609 permanent employees in Chile, respectively. As of December 2011, 2,692 were represented by 48 labor unions. The average tenure of our permanent employees was approximately eight years.
The following table shows the breakdown of our employees by business segments:
Business | 2009 | 2010 | 2011 |
Beer | 705 | 655 | 644 |
Non-alcoholic beverages | 824 | 887 | 909 |
Wine(1) | 960 | 1,118 | 1,185 |
Transportes CCU | 794 | 817 | 882 |
Others(2) | 1,092 | 1,093 | 1,117 |
Total | 4,375 | 4,570 | 4,737 |
_________ |
|
|
|
( 1) Wine includes FLC personnel (116 in 2010 and 128 in 2011) | |||
(2) Includes our corporate, pisco, plastic and Comercial CCU divisions. | |||
Unionized employees represent approximately 58% of our total permanent workforce. Our management believes it generally has a good relationship with the labor unions representing our employees.
During 2011, 634 employees renewed their collective contracts, most of them for a period of two years. The contract renewals are expected to increase the unionized workforce costs between 2.5% and 3.5%.
92
All employees who are terminated for reasons other than misconduct are entitled by law to receive a severance payment. In the last three years, we made severance payments in the amounts of CLP4,540 million, CLP2,021 million and CLP3,706 million, respectively. Permanent employees are entitled to the basic payment, as required by law, of one month’s salary for each year, or six-month portion thereof, worked. This condition is subject to a limitation of a total payment of no more than 11 months’ pay for employees hired after August 14, 1981. Severance payments to employees hired before August 14, 1981 are not subject to this limitation. Our employees who are subject to collective bargaining agreements have a contractual benefit to receive a payment in case of resignation, consisting of a payment of one monthly base salary for each full year worked, not subject to a limitation on the total amount payable but subject to a limitation on the total number of employees who can claim the severance benefit during any one year. In 2011, we laid off 336 employees.
We do not maintain any pension fund or retirement program for our employees. Workers in Chile are subject to a national pension fund law which establishes a system of independent pension plans, administered byAdministradoras de Fondos de Pensiones (“AFPs”). We have no liability for the performance of the pension plans or any pension payments to be made to the employees.
In addition to our permanent work force, as of December 31, 2011, we had 286 temporary employees, who were hired for specific time periods to satisfy short-term needs.
Argentina
a)Beer Business
As of December 31 of the last three years, we had a total of 867, 920 and 1,021 permanent employees, respectively. As of December 31, 2011, 639 employees were represented by one labor union, which is member of the Argentine Beer Workers Federation (Federación Argentina de Trabajadores Cerveceros y Afines or “FATCA”). As of December 31, 2010, the average tenure of our employees in Argentina was approximately ten years. The 18.4% growth of our staff as of December 2011 is due to the hiring of a larger number of sales people to increase our direct sales.
Collective bargaining in Argentina is done on an industry-wide basis, rather than, as in Chile, on a company-by-company basis.
In Argentina, as in Chile, all employees who are terminated for reasons other than misconduct are entitled by law to receive a severance payment. We made severance payments in connection with our Argentine beer operations in the amounts of CLP209 million, CLP272 million and CLP189 million in the last three years, respectively. According to the Argentine Labor Law, employees who joined us before October 1998 are entitled to the basic payment as required by law of one month’s salary for each year or fraction thereof worked. This monthly amount cannot exceed three times the average monthly salary established under the applicable collective bargaining agreement and cannot be less than the equivalent of two monthly salaries of the employee.
In addition to our permanent work force, as of December 31, 2011, we had 294 temporary employees, who were hired for specific time periods to satisfy short-term needs.
b)Wine Business
As of December 31, 2011, Finca La Celia , the Argentine subsidiary of VSPT, had a total of 128 permanent employees, 76 of which were represented by one labor union. The average tenure of our employees was approximately four years. In addition to our permanent work force in FLC, we had 20 temporary employees, who were hired for specific time periods to satisfy short-term needs.
Share Ownership
Except as disclosed in “Item 7: Major Shareholders and Related Party Transactions – Major Shareholders,” as of March 31, 2012, our senior management and our board members in the aggregate owned less than one percent of the our shares.
93
We do not maintain stock option or other programs involving our employees in the capital of the Company.
ITEM 7: Major Shareholders and Related Party Transactions
Major Shareholders
Our only outstanding voting securities are our shares of our common stock. The following table sets forth information concerning the ownership of our common stock as of March 31, 2012, for each shareholder known to us to own more than 4% of the outstanding shares of our common stock and for all of our directors and executive officers as a group:
| Shareholder | Number of shares owned | % Ownership |
|
|
|
|
|
|
| Inversiones y Rentas S.A. | 196,421,725 | 61.67% |
|
| Inversiones IRSA Ltda. (1) | 14,146,707 | 4.44% |
|
| Our directors and executive | 62,368 | 0.02% |
|
| officers as a group(2) |
| ||
(1) Inversiones y Rentas S.A. owns 99.9999% of Inversiones IRSA Ltda.’s equity. | ||||
(2) Does not include the 210,568,432 shares of our common stock owned, directly and indirectly, by Inversiones y Rentas S.A., which is 50% beneficially owned by the Luksic family, as discussed below. Guillermo Luksic and Andrónico Luksic, our directors, are members of the Luksic family. | ||||
As of March 31, 2012, JPMorgan Chase Bank N.A. (“JPMorgan”), the Depositary for our ADR facility, was the record owner of 38,451,260 shares of our common stock (12.1% of the outstanding common stock) deposited in our ADR facility.
As of March 31, 2012, we had 4,599shareholders of record. To the best of our knowledge 21 shareholders are not Chilean, excluding ADR holders, and of those 21 non-Chilean shareholders, five are U.S. corporations with a total of 1,215,415 (0.4%) shares of common stock. Non-Chileans can also hold shares in custody of private banks, however this information is not publicly available, thus there are Five custodians we have included as part of the 21 non-chilean shareholders although we have no citizenship information. All shareholders have equal voting rights.
IRSA is a Chilean privately held corporation formed for the sole purpose of owning a controlling interest in us. IRSA is owned 50% by Quiñenco, which is a holding company of the Luksic Group, and 50% by Heineken Chile Ltda., a subsidiary of Heineken International. IRSA directly owns 196,421,725 shares of our common stock and indirectly, through Inversiones IRSA Ltda., 14,146,707 additional shares of our common stock. Inversiones IRSA Ltda. is a wholly-owned subsidiary of IRSA.
Related Party Transactions
The Chilean Corporations Act was amended by Law N°20.382, effective January 1, 2010, regarding, among others, related party transactions. The 2010 amendment introduced a new Chapter XVI for open stock corporations and its subsidiaries while dispositions of articles 44, 89 and 93 remain applicable only to closed corporations which are not subsidiaries of an open stock corporation.
Pursuant toChapter XVI ofthe Chilean Corporations Actreferred to above,a related party transaction shall be any and all negotiation, agreement or operation between the open stock corporation and any one of the following:
· One or more related persons pursuant to the Securities Market Law;
94
| · | A director, manager, administrator, principal executive officer or liquidator of the company, personally or acting on behalf of a person other than the company, or their respective spouses or close relatives (e.g. parents, father/mother in law, sisters, brothers, sisters/brothers in law); |
| · | Company or concern in which the persons referred to in b) are the owners, directly or indirectly through any other individual or corporation, of 10% or more of its capital; or of which any of the persons in b) are a director, manager, administrator, principal executive officer thereof; |
| · | Those contemplated by the bylaws or upon sufficient grounds determined by the directors committee, as the case may be, which can include subsidiaries that the company owns, directly or indirectly, at least 95% of its equity or capital stock; |
| · | Those in which the office of director, manager, administrator, principal executive officer o liquidator has been held by a director, manager administrator, principal executive officer or liquidator of the company within the prior 18 moths. |
Pursuant to the 2010 amendment, the following persons are currently considered under the Securities Market Law to be related persons:
| · | any entities within the financial conglomerate to which the company belongs; |
| · | corporate entities that have, with respect to us, the character of parent company, affiliated companies or subsidiary. Parent companies are those that control directly or indirectly more than 50% of the subsidiary’s voting stock (or participation, in the case of business organizations other than stock companies), or that may otherwise elect or appoint, or cause the election or appointment, of the majority of the directors or officers. Limited partnerships (sociedades en comandita) may likewise be a subsidiary of a corporation, whenever the latter has the power to direct or guide the administration of the general partner (gestor) thereof. For these purposes, affiliated companies are those where one of them, without actually controlling the other, owns directly or indirectly 10% or more of the latter’s voting stock (or equity, in the case of business organizations other than stock companies), or that may otherwise elect or appoint, or cause the election or appointment of at least one board member or manager; |
| · | persons who are directors, managers, administrators, principal executive officers or liquidators of us, and their spouses or their close relatives (i.e., parents, father/mother in law, sisters, brothers, sisters/brothers in law); as well as any other entity controlled by, directly or indirectly, any one of the above; and |
| · | any person who, whether acting alone or in agreement with others, may appoint at least one member of our management or controls 10% or more of our voting capital. |
The SVS may presume that any individual or corporate entity is related to a company if, because of relationships of equity, administration, kinship, responsibility or subordination, the person:
| · | whether acting alone or in agreement with others, has sufficient voting power to influence the company’s management; |
| · | creates conflicts of interest in doing business with the company; |
| · | in the case of a corporate entity, is influenced in its management by the company; or |
| · | holds an employment or position which affords the person access to non-public information about the company and its business, which renders the person capable of influencing the value of the company’s securities. |
However, a person shall not be considered to be related to a company by the mere fact of owning up to 5% of the company, or if the person is only an employee of the company without managerial responsibilities.
95
Additionally, pursuant to article 147 ofChapter XVI ofthe Chilean Corporations Act, an open stock corporation shall only be entitled to enter into a related party transaction when it is in the interest of and tothe benefit of the company, has a fair price, terms and conditions to those prevailing in the market at the time of its approval and comply with the requirements and procedures stated below:
1.- The directors, managers, administrators, principal executive officers or liquidators that have an interest or that take part in negotiations conducive to the execution of an operation with a related party of the open-stock corporation, shall report it immediately to the board of directors or whom the board designates. Those who breach this obligation will be jointly liable for damages caused to the company and its shareholders.
2.- Prior to the company’s consent to a related party transaction, it must be approved by the absolute majority of the members of the board of directors, with exclusion of the interested directors or liquidators, who nevertheless shall make public his/their opinion with respect to the transaction if it is so requested by the board of directors, which opinion shall be set forth in the minutes of the meeting. Likewise, the grounds of the decision and the reasons for excluding such directors from its adoption must also be recorded in the minutes.
3.- The resolutions of the board of directors approving a related party transaction shall be reported to the next following shareholders' meeting, including a reference to the directors who approved such transaction. A reference to the transaction is to be included in the notice of the respective shareholders' meeting.
4.- In the event that an absolute majority of the members of the board of directors should abstain from voting, the related party transaction shall only be executed if it is approved by the unanimous vote of the members of the board of directors not involved in such transaction, or if it is approved in a shareholders' extraordinary meeting by two thirds of the voting shares of the company.
5.- If a shareholders' extraordinary meeting is called to approve the transaction, the board of directors shall appoint at least one independent advisor who shall report to the shareholders the terms of the transaction, its effects and the potential impact for the company. In the report, the independent advisor shall include all the matters or issues the directors' committee may have expressly requested to be evaluated. The directors' committee of the company or in the absence of such committee, directors not involved in the transaction, shall be entitled to appoint an additional independent advisor, in the event they disagree with the appointment made by the board.
The reports of the independent advisors shall be made available to the shareholders by the board on the business day immediately following their receipt by the company, at the company’s business offices and on its internet site, for a period of at least 15 business days from the date the last report was received from the independent advisor, and such arrangement shall be communicated to the shareholders by means of a “Relevant Fact.”
The directors shall decide whether the transaction is in the best interest of the corporation, within five business days from the date the last report was received from the independent advisors.
6.- When the directors of the company must decide on a related party transaction, they must expressly state the relationship with the transaction counterparty or the interest involved. They shall also express their opinion on whether the transaction is in the best interest of the corporation, their objection or objections that the directors' committee may have expressed, as well as the conclusions of the reports of the advisors. The opinions of the directors shall be made available to the shareholders the day after they were received by the company, at the business offices of the company as well as on its internet site, and such arrangement shall be reported by the company as a “Relevant Fact.”
7.- Notwithstanding the applicable sanctions, any infringement of the above provisions will not affect the validity of the transaction, but it will grant the company or the shareholders the right to sue the related party involved in the transaction for reimbursement to the company of a sum equivalent to the benefits that the operation reported to the counterpart involved in the transaction, as well as indemnity for damages incurred. In this case, the defendant bears the burden of proof that the transaction complies with the requirements and procedures referred to above.
96
Notwithstanding the above, the following related party transactions may be executed without complying with the requirements and procedures above stated, prior authorization by the board:
1.- Transactions that do not involve a “material amount.” For this purpose, any transaction that is both greater than 2,000 Unidades de Fomento (as of March,31 2012, approximately ThCLP45,067) and in excess 1% of the corporation’s equity, or involving an amount in excess of 20,000 Unidades de Fomento (as of March 31, 2012, approximately ThCLP450,670) shall be deemed to involve a material amount. All transactions executed within a 12 month period that are similar or complementary to each other, with identical parties, including related parties, or objects, shall be deemed to be a single transaction.
2.- Transactions that pursuant to the company’s policy of usual practice as determined by its board of directors, are in the ordinary course of business of the company. Any agreement or resolution establishing or amending such policies shall be communicated as a “Relevant Fact” and made available to shareholders at the company’s business offices and on its internet site, and the transaction shall be reported as a “Relevant Fact,” if applicable.
3.- Transactions between legal entities in which the company possesses, directly or indirectly, at least 95% of the equity of the counterpart.
The usual practice policy adopted by the board of directors in the meeting held on January 13, 2010, as amended on July 6, 2011, remains available to shareholders at the company’s offices in Avda. Vitacura 2670, 26 floor, Santiago, Chile, and on the web site www.ccu.cl.
In the ordinary course of business, we engage in a variety of transactions with some of our affiliates and related parties. Financial information concerning these transactions is set forth in Note 16 to our consolidated financial statements.
Our corporate support units and strategic service units provide shared services to all the organization through service level agreements. Shared services are provided in a centralized manner to capture the synergies between the different units. Service level agreements are annual contracts specifying the services to be provided as well as the variables used to measure the levels of service and their prices. Service levels are evaluated directly by users three times a year.
Additionally, our logistic subsidiaries Transportes CCU Ltda. and Comercial CCU S.A. provide transportation warehousing and sales services on a consolidated basis to all of our strategic business units. These services are regulated by annual contracts specifying the services to be provided as well as the variables used to measure the levels of service and their prices. Service levels are evaluated directly by users three times a year.
We engage in a variety of transactions with affiliates of the Luksic Group and Heineken, the beneficial owners of IRSA, as well as with other shareholders of ours. Currently, Quiñenco and Heineken Chile Ltda., a Chilean limited corporation controlled by Heineken Americas B.V. are the only shareholders of IRSA, each with a 50% equity interest See “Item 4: Information on the Company – Organizational Structure.”
On November 30, 2005, we and Heineken International signed new versions of the license and technical assistance agreements which provide us with the exclusive rights to produce, sell and distribute Heineken beer in Chile and Argentina commencing June 18, 2003. These agreements have an initial term of 10 years beginning in June 2003, renewable for subsequent periods of five years. See “Item 4: Information on the Company – Business Overview – Our Beer Business in Chile – Beer Production and Marketing in Chile” and “Item 4: Information on the Company – Business Overview – Our Beer Business in Argentina – Beer Production and Marketing in Argentina.”
Alsosubject to the above license agreements, on April 24, 2006, through our subsidiary CCU Chile, we signed a brewing agreement with Heineken Brouwerijen B.V., which provides us with the right to produce and package Heineken lager at our local brewery and for its sale and distribution in Peru, Colombia and Ecuador by Heineken’s appointed Distributor. This agreement commenced on April 24, 2006 for one year renewable annually.
97
Additionally, a Technical Assistance Agreement was executed withHeineken Technical Services B.V. on May 4, 2005, whereby the latter was appointed, on a non-exclusive basis, as our technical advisor in respect of operational aspects of our breweries, including also special services regarding project engineering for extensions of the breweries’ capacity and construction of new plants, assistance in development of new products, production methods and distribution systems as well as advise on purchasing systems, among others. This agreement has an initial term of one year as from May 4, 2005, renewable for subsequent periods of one year each, unless either party gives not less than three months’ prior written notice to the other of its intention to terminate this agreement. This agreement has been renewed automatically.
On October 12, 2011, we and Heineken International signed the Amended and Restated versions of theTrademark License Agreements which provide us with the exclusive rights to produce, sell and distribute Heineken beer in Chile and Argentina, in force as of January 1, 2011. These agreements have an initial term of 10 years, and shall automatically be renewed each year (January 1) for a new period of ten years, unless any party gives notice of its decision not to renew, in which case the agreements will be in force until the last renewal period expires.
Finally, we entered into a Framework Agreement with Banco de Chile, a Quiñenco subsidiary, effective as from May 1, 2003, for the rendering of banking services to us and certain of our subsidiaries and affiliates, including, among others, payment to suppliers and shareholders, cashier service, transportation of valuables and payment of salaries. This agreement replaces prior agreements for the same purpose executed with Banco de A. Edwards, which merged into Banco de Chile as of January 1, 2002.
Since the establishment of our Directors Committee in 2001, as required by the Chilean Corporation Act, all related party contracts have been reviewed by it, and then approved by our board of directors, which approval also was a standard practice prior to the creation of the Directors Committee. Our principal related party contracts include rental of properties, the rendering of services and product sales.
Our principal transactions with related parties for the twelve-month period ended December 31, 2011, are detailed below:
98
Company | Relationship | Transaction | Amount (in millions of CLP) |
Heineken Brouwerijen B.V. | Parent company related | Products sale/ license/ technical assistance/ billed services | 3,305 |
Heineken Italia Spa. | Parent company related | Purchase of products/ advertising contribution | 107 |
Nestlé Waters Argentina S.A. | Subsidiary shareholder | Technical assistance | 30 |
Nestlé Waters S.A. | Subsidiary shareholder | Royalty | 67 |
Promarca S.A. | Joint venture | Royalty paid | 3,185 |
Cervecería Kunstmann Ltda. | Subsidiary shareholder | Product sales/billed services | 301 |
Comercial Patagona Ltda. | Joint venture subsidiary | Marketing services/products sale | 1,486 |
Cooperativa Agrícola Control Pisquero Ltda. | Subsidiary shareholder | Loan/grape acquisition | 4,946 |
Cervecería Austral S.A. | Joint venture | Products purchase and sale/ royalty paid and royalty charged | 3,150 |
Banco de Chile | Parent company related | Product sales/financial products and services | 179,282 |
Viña Valles de Chile S.A. | Joint venture until Dec'11 | Services/ product purchases and sales/remittances paid/received | 8,234 |
Foods Compañía de Alimentos CCU S.A. | Joint venture | Services/ product sales/ consignment sales/ interests/leased paid | 15,749 |
Alusa S.A. | Subsidiary related | Purchase of products | 758 |
Canal 13 S.P.A. | Parent company related | Advertising | 3,005 |
Banchile Corredores de Bolsa S.A. | Parent company related | Financial investments | 11,880 |
Soc. Agrícola y Ganadera Río Negro Ltda | Related to the controller | Recovery from division | 1,163 |
Viña Tabalí S.A. | Related to the controller | Expense recovery/recovery from division/invoices | 2,964 |
Compañía Pisquera Bauzá S.A. | Subsidiary associate | Royalty | 16 |
Comarca S.A. | Associate related | Access fee | 798 |
Lorenzo Bauzá Alvarez | Associate related | Purchase of shares | 15 |
Fondo de Inversión Privado Mallorca | Associate related | Purchase of shares | 1,437 |
Agroproductos Bauzá y Cía Ltda | Associate related | Purchase of shares | 573 |
See Note 16 to our consolidated financial statements for detailed information including also 2010 and 2009.
99
Interests of Experts and Counsel
Not applicable.
ITEM 8: Financial Information
Consolidated Statements and Other Financial Information
See “Item 18: Financial Statements and Exhibits” for the Company's Financial Statements and notes, audited by PricewaterhouseCoopers.
Wine Exports
We, through our subsidiary VSPT, exported wine to more than 80 countries in 2011. VSPT is the second-largest wine exporter in Chile. See “Item 4: Information on the Company–Business Overview–Our Wine Business.”
The following table presents our total wine exports by volume, in millions of Chilean pesos as of December of the last three years as percentage of total sales for the last three years:
| 2009 | 2010 | 2011 |
|
|
|
|
Exports (thousands of liters) | 67,804 | 69,994 | 67,071 |
% of total consolidated sales | 4.10% | 4.05% | 3.65% |
|
|
| |
Exports (CLP million) | 84,272 | 86,505 | 83,961 |
% of total consolidated sales | 10.70% | 10.30% | 8.66% |
Legal Proceedings
Nothing to report
Dividend Policy and Dividends
Our dividend policy is reviewed and established from time to time by our board of directors and reported to our regular shareholders’ meeting, which is generally held in April of each year. Each year our board of directors must submit its proposal for a final dividend for the preceding year for shareholder approval at the annual shareholders’ meeting. As required by the Chilean Corporations Act, unless otherwise decided by unanimous vote of the issued shares of our common stock, we must distribute a cash dividend in an amount equal to at least 30% of our net income for that year, after deducting any accumulated losses from previous years. Our board of directors has the authority to pay interim dividends during any one fiscal year, to be charged to the earnings for that year.
100
Our board of directors announced at our annual shareholders’ meeting held on April 15, 2011, its dividend policy for future periods, authorizing the distribution of cash dividends in an amount at least equal to 50% of our liquid profits under IFRS for the previous year. Our dividend policy is subject to change in the future due to changes in Chilean law, capital requirements, economic results and/or other factors. During our last annual shareholders’ meeting held on April 15, 2011, a dividend of CLP115,78103 per share of common stock was approved, in addition to the interim dividend of CLP58 per share of common stock distributed in January 7, 2011. Together, these dividend payments amounted to CLP55,350 million, representing 50.0% of 2010 the Income of the Year Attributable to Equity Holders of the Parent Company.The Board of Directors, in its meeting held on December 7, 2011, approved the distribution, with charge to year 2011’s profits, of an interim dividend of CLP61 per share of common stock(CLP305 per ADR), totaling CLP19,428,675,192,to be paid on January 6, 2012. Additionally, the Board of Directors, in its meeting held on March 6, 2012, resolved to propose to the next regular shareholders meeting, the distribution, with charge to year 2011’s profits, ofa final dividend of CLP131.70092 per share of common stock(CLP658.50460 per ADR).The proposal, representing a total payment of CLP 41,947,121,560, was approved and the final dividend was paid beginning April 20, 2012 onwards to the shareholders of record as of April 14, 2012.
Dividends are paid to shareholders of record as of the fifth business day, including Saturdays, preceding the date set for payment of the dividend. The holders of ADRs on the applicable record dates are entitled to dividends declared for each corresponding period.
The following table sets forth the amounts of interim and final dividends and the aggregate of such dividends per share of common stock and per ADS in respect of each of the years indicated:
Year ended December 31, | Interim | CLP Per share (1) | Interim | US$ Per ADS (2) | ||
Final (3) | Total | Final (3) | Total | |||
2007 | 47 | 102.20 | 149.20 | 0.48 | 1.13 | 1.61 |
2008 | 47 | 108.66 | 155.66 | 0.38 | 0.90 | 1.29 |
2009 | 60 | 141.00 | 201.00 | 0.61 | 1.35 | 1.96 |
2010 | 58 | 115.78 | 173.78 | 0.58 | 1.25 | 1.83 |
2011 | 61 | 131.70 | 192.70 | 0.60 | 1.35 | 1.95 |
(1) | Interim and final dividend amounts are expressed in historical pesos. | |||||
(2) | U.S. dollars per ADR dividend information serves reference purposes only as we pay all dividends in Chilean pesos. The Chilean peso amounts as shown here have been converted into U.S. dollars at the respective observed exchange rate in effect at each payment date. Note: The Federal Reserve Bank of New York does not report a noon buying rate for Chilean pesos. | |||||
(3) | The final dividend with respect to each year is declared and paid within the first five months of the subsequent year. | |||||
Pursuant to former Chapter XXVI of the Central Bank Foreign Exchange Regulations, replaced by Chapter XIV, a shareholder who was not a resident of Chile had to register as a foreign investor in order to have access to the Formal Exchange Market for remitting abroad any dividends, sales proceeds or other amounts accruing from shares in a Chilean company. See “Item 10: Additional Information–Exchange Controls–General Legislation and Regulations.” Under our foreign investment contract, the depositary, on behalf of ADR holders, will be granted access to the formal exchange market to convert cash dividends from pesos to dollars and to pay such dollars to ADR holders outside of Chile. Dividends received in respect of shares of Common Stock by holders, including holders of ADRs who are not Chilean residents, are subject to Chilean withholding tax. See “Item 10: Additional Information–Taxation.”
Significant Changes
These are the Company’s third annual consolidated financial statements prepared in accordance with IFRS, as issued by the IASB. Until and including our financial statements for the year ended December 31, 2008, we prepared our consolidated financial statements in accordance with Chilean GAAP, which differs in certain important aspects from accounting principles contained in IFRS. The effects of the transition to IFRS on the Company’s financial statements for the year ended December 31, 2008 are detailed in Note 4 to our consolidated annual financial statements included in the 2009 annual report.
101
ITEM 9: The Offer and Listing
Offer and Listing Details
For the periods indicated, the table below sets forth the reported high and low closing sales prices for the Common Stock on the Santiago Stock Exchange as well as the high and low sales prices of the ADSs as reported by the NYSE:
|
| Santiago Stock Exchange | NYSE | ||
|
| (per share of common stock) | (per ADS) | ||
|
|
|
|
|
|
|
| High | Low | High | Low |
|
| (CLP) | (CLP) | (US$) | (US$) |
Years |
|
|
|
| |
| 2007 | 4,280 | 3,040 | 45.80 | 26.91 |
| 2008 | 3,801 | 2,650 | 39.91 | 22.54 |
| 2009 | 4,102 | 3,167 | 39.94 | 25.93 |
| 2010 | 5,920 | 3,823 | 61.53 | 34.81 |
| 2011 | 6,800 | 4,720 | 63.70 | 48.00 |
| 2012 (through Mar. 31) | 7,699 | 6,015 | 79.14 | 60.24 |
2009 |
|
|
|
| |
| 1st quarter | 3,821 | 3167 | 31.44 | 25.93 |
| 2nd quarter | 3,996 | 3,265 | 36.00 | 27.75 |
| 3rd quarter | 3,898 | 3,554 | 36.96 | 32.00 |
| 4th quarter | 4,102 | 3,339 | 39.94 | 33.08 |
2010 |
|
|
|
| |
| 1st quarter | 4,270 | 3,823 | 42.89 | 34.81 |
| 2nd quarter | 5,045 | 3,920 | 47.49 | 37.69 |
| 3rd quarter | 5,920 | 4,680 | 59.95 | 42.56 |
| 4th quarter | 5,900 | 5,190 | 61.53 | 53.65 |
2011 |
|
|
|
| |
| 1st quarter | 5,759 | 4,900 | 60.99 | 51.40 |
| 2nd quarter | 5,800 | 5,350 | 61.70 | 55.85 |
| 3rd quarter | 5,600 | 4,720 | 60.44 | 48.04 |
| 4th quarter | 6,800 | 5,014 | 63.70 | 48.00 |
2012 |
|
|
|
| |
| 1st quarter | 7,699 | 6,015 | 79.14 | 60.24 |
Last six months |
|
|
|
| |
| October 2011 | 5,600 | 5,014 | 59.81 | 50.78 |
| November 2011 | 6,200 | 5,360 | 59.64 | 51.33 |
| December 2011 | 6,800 | 6,690 | 63.70 | 57.94 |
| January 2012 | 6,990 | 6,015 | 65.11 | 60.24 |
| February 2012 | 7,280 | 6,118 | 74.16 | 62.99 |
| March 2012 | 7,699 | 6,710 | 79.14 | 68.21 |
Significant trading suspensions of the Company's stock have not occurred in the last three years.
Plan of distribution
Not applicable
102
Markets
Our common stock is currently traded on the Santiago Stock Exchange, the Chile Electronic Stock Exchange and the Valparaíso Stock Exchange under the symbol “CCU.” The Santiago Stock Exchange accounted for approximately 92.3%, 93.2% and 90.7% of the trading volume of our common stock in Chile in the last three years, respectively. The remaining 7.7%, 6.8 and 9.3% respectively, was traded mainly on the Chile Electronic Stock Exchange. Shares of our common stock were traded in the United States on the NASDAQ stock exchange between September 24, 1992 and March 25, 1999 and on the NYSE since March 26, 1999, in the form of ADSs, under the symbol “CCU”, each representing five shares of our common stock, with ADSs in turn evidenced by ADRs. The ADSs are issued under the terms of a deposit agreement as amended dated September 1, 1992, among us, JPMorgan, as depositary, and the holders from time to time of the ADSs.
The trading volume of our ADSs in the NYSE in the last three years is as follows:
Year | Quarter | Traded Volume |
(thousands of ADS) | ||
|
|
|
2009 | 1st quarter | 2,093 |
| 2nd quarter | 3,212 |
| 3rd quarter | 2,602 |
| 4th quarter | 3,330 |
| Total | 11,237 |
|
|
|
2010 | 1st quarter | 2,799 |
| 2nd quarter | 5,705 |
| 3rd quarter | 4,378 |
| 4th quarter | 3,168 |
| Total | 16,051 |
|
|
|
2011 | 1st quarter | 2,701 |
| 2nd quarter | 2,475 |
| 3rd quarter | 2,810 |
| 4th quarter | 2,418 |
| Total | 10,404 |
Selling Shareholders
Not applicable.
Dilution
Not applicable.
Expenses of the Issue
Not applicable.
103
ITEM 10: Additional Information
Share Capital
Not applicable.
Memorandum and Articles of Association
Provided below is a summary of certain material information found in our bylaws and provisions of Chilean law. This summary is not exhaustive. For more information relating to the items discussed in this summary, the reader is encouraged to read our updated bylaws, available in our website at www.ccu.cl.
Registration and corporate purposes. We are a public corporation (sociedad anónima abierta) organized by means of a public deed dated January 8, 1902, executed before the notary public of Valparaíso, Mr. Pedro Flores, and our existence was approved by Supreme Decree N° 889 of the Treasury Department, dated March 19, 1902, both of which were recorded on the reverse of folio 49, N° 45 of Valparaíso’s Registry of Commerce for 1902, and published in Chile’s Official Gazette on March 24, 1902. We are recorded on March 8, 1982, at Chile’s Securities Registry of the SVS under N° 0007.
The last amendment to our articles of association, which moved the domicile of the corporation from Valparaíso to Santiago City, and the complete, revised and updated text of the corporation’s bylaws were set forth in a public deed dated 4 June 2001, executed before the notary public of Valparaíso, María Ester Astorga, an extract of which was recorded on the reverse of folio 474 N° 363 of the Valparaíso Registry of Commerce for 2001, published in the Official Gazette on June 13, 2001, and recorded at the Registry of Commerce of Santiago on folio 18.149, N° 14.600 for the year 2001.
Under Article 4 of our bylaws, the corporation’s principal purpose is to produce, manufacture and market alcoholic and non-alcoholic beverages, to manufacture containers and packaging, and to provide transportation services, among other businesses.
Directors. Under the Chilean law regarding corporations (the “Chilean Corporations Act”), a corporation may not enter into a contract or agreement in which a director has a direct or indirect interest without prior approval by the board of directors, and then only if it inures to the benefit of the company, is terms and conditions similar to those prevailing in the market at the time of its approval, and complies with the requirements and procedures stated in Chapter XVI of the Chilean Corporation Act regarding Related Party Transactions. See “Item 7: Major Shareholders and Related Party Transactions.”
The amount of any director’s remuneration is established each year by the annual shareholders’ meeting. Directors are forbidden, unless previously and duly authorized thereto by the board of directors, to borrow or otherwise make use of corporate money or assets for their own benefit or that of their spouses, certain relatives or related persons. These rules can only be modified by law.
It is not necessary to hold shares to be elected director, and there is no age limit established for the retirement of directors.
Rights, preferences and restrictions regarding shares. At least 30% of our net profits for each fiscal year is required to be distributed as dividend in cash to our shareholders, unless our shareholders unanimously decide otherwise. Any remaining profits may be used to establish a reserve fund (that may be capitalized at any time, amending the corporate bylaws by the vote of a majority of the voting stock issued), or to pay future dividends.
Compulsory minimum dividends, i.e., at least thirty percent of our net profits for each fiscal year, become due thirty days after the date on which the annual shareholders' meeting has approved the distribution of profits in the fiscal year. Any additional dividends approved by our shareholders become due on the date set by our shareholders or our board of directors.
104
Accrued dividends that corporations fail to pay or make available to their shareholders within certain periods are to be adjusted from the date on which those dividends became due and that of actual payment. Overdue dividends will accrue yearly interest established for adjustable operations over the same period.
Dividends and other cash benefits unclaimed by shareholders after five years from the date on which they became due will become the property of the Chilean Fire Department.
We have only one class of shares and there are therefore no preferences or limitations on the voting rights of shareholders. Each of our shareholders is entitled to one vote per share. In annual shareholders’ meetings, resolutions are made by a simple majority of those present, provided legal quorums are met. A special or extraordinary meeting generally requires an absolute majority, in other words, 50% plus one of the shares entitled to vote; however, the Chilean Corporations Act provides that in order to carry certain motions, a two thirds majority of the outstanding voting stock is necessary.
Our directors are elected every three years and their terms are not staggered. Our shareholders may accumulate their votes in favor of just one person or distribute their votes to more than one person. In addition, by unanimous agreement of our shareholders present and entitled to vote, the vote may be omitted and the election made by acclamation.
In the event of liquidation, the Chilean Corporations Act provides that corporations may carry out distributions to shareholders on account of a reimbursement of capital only after the payment of corporate indebtedness.
There are no redemption or sinking fund provisions applicable to us, nor are there any liabilities to our shareholders relating to future capital calls by us.
Under Chilean law, certain provisions affect any existing or prospective holder of securities as a result of the shareholder owning a substantial number of shares. The Securities Market Law, as modified by the 2010 amendment, establishes that (a) any person who, directly or indirectly, owns 10% or more of the subscribed capital of an open stock corporation (the “majority shareholders”) or that, as a consequence of an acquisition of shares, attains such percentage, and (b) as well as directors, liquidators, principal executive officers, administrators and managers of such corporations, regardless of the number of shares they possess, either directly or indirectly, must report any purchase or sale of shares to the SVS and to each of the stock exchanges in Chile where such corporation has securities listed, the day immediately following the execution of the transaction, through the technological means authorized by the SVS. This obligation shall also apply to the acquisition or sale of contracts or securities, the price or result of which is dependant on or is conditioned by, in whole or in a relevant part, to the fluctuation or evolution of the price of such shares. In addition, majority shareholders must inform the SVS and the stock exchanges with respect to whether the purchase is aimed at acquiring control of the corporation or just as a financial investment.
The Securities Market Law also provides that when one or more persons intend to take over a corporation subject to oversight by the SVS, they must give prior public notice. This notice must include the price to be offered per share and the conditions of the proposed transaction, including the expected manner of acquiring the shares.
Finally, Chapter XXV of the Securities Market Law was enacted on December 20, 2000, to ensure that controlling shareholders share with minority shareholders the benefits of a change of control, by requiring that certain share acquisitions be made pursuant to a tender offer.
Article 199 bis of the Securities Market Law was introduced by the 2010 amendment, extending the obligation to make a tender offer for the remaining outstanding shares to any person, or group of persons with a joint performance agreement, that, as a consequence of the acquisition of shares, becomes the owner of two-thirds or more of the issued shares with voting rights of a corporation. Such tender offer must be effected within 30 days from the date of such acquisition.
105
The Chilean Corporations Act provides shareholders with preemptive rights. The Act requires that options to purchase stock representing capital increases in corporations and debentures duly convertible into stock of the issuing corporation, or any other securities extending future rights over such stock, must be offered preferably, at least once, to existing shareholders, in proportion to the number of shares owned by them. A corporation must distribute any bonus stock in the same manner.
The Chilean Corporations Act also provides shareholders with the right to withdraw from a corporation in certain situations. Unless there is an ongoing bankruptcy proceeding, if a shareholders’ meeting approves any of the following matters, as modified by the 2010 amendment, dissenting shareholders will be automatically entitled to withdraw from the corporation upon payment by the corporation of the market value of their shares:
| · | our transformation into a different type of legal entity, |
| · | our transformation into a different type of legal entity, |
| · | the disposition of 50% or more of the corporate assets, whether or not liabilities are also transferred, to be determined according to the balance sheet of the previous fiscal year, or the proposal or amendment of any business plan that contemplates the transfer of assets exceeding said percentage; the disposition of 50% or more of the corporate assets of a subsidiary, which represents at least 20% of the assets of the corporation, as well as any disposition of shares which results in the parent company losing its status as controller |
| · | the granting of real or personal guarantees to secure third-party obligations exceeding 50% of the corporate assets, except when the third party is a subsidiary of the company (in which case approval of the board of directors will suffice) |
| · | the creation of preferences for a series of shares or the increase, extension or reduction in the already existing ones. In this case, only dissenting shareholders of the affected series shall have the right to withdraw, |
| · | curing certain formal defects in the corporate charter which otherwise would render it null and void or any modification of its bylaws that should grant this right, and |
| · | other cases provided for by statute or in our bylaws, if any. |
In addition, shareholders may withdraw if a person becomes the owner of two-thirds or more of the outstanding shares of the corporation as a consequence of a share acquisition and such person does not make a tender offer for the remaining shares within 30 days from the date of such acquisition.
Minority shareholders are also granted the right to withdraw when the controlling shareholder acquires more than 95% of the shares of an open stock corporation.
Our bylaws do not provide for additional circumstances under which shareholders may withdraw.
Action necessary to change the rights of holders of stock. Rights of stockholders are established by law and pursuant to the bylaws of a corporation. For certain modifications of shareholders’ rights, the law requires a special majority, such as the creation, increase, extension, reduction or suppression of preferred stock, which may be adopted only with the consent of at least two-thirds of the affected series. Consequently any other impairment of rights not specifically regulated needs only an absolute majority (more than 50%) of the stock entitled to vote. However, the waiver of the shareholders’ right to receive no less than 30% of the net profits accrued in any fiscal year (the “minimum dividend”) requires the unanimous vote of all stockholders. The above notwithstanding, no decision of the shareholders’ meeting can deprive a shareholder of any part of the stock that he owns.
Our bylaws do not contemplate additional conditions in connection with matters described in this subsection.
Shareholders’ meetings. Our annual shareholders' meetings are to be held during the first four months of each year. During the meetings, determinations are made relating to particular matters, which matters may or may not be specifically indicated in the summons for such meeting.
106
The quorum for a shareholders' meeting is established by the presence, in person or by proxy, of shareholders representing at least an absolute majority of our issued voting stock; if a quorum is not present at the first meeting, the meeting can be reconvened and upon the meeting being reconvened, shareholders present at the reconvened meeting are deemed to constitute a quorum regardless of the percentage of the voting stock represented. In that case, decisions will be made by the absolute majority of stock with voting rights present or otherwise represented. The following matters are specifically reserved for annual meetings:
| · | review of our state of affairs and of the reports of external auditors, and the approval or rejection of the annual report, balance sheet, financial statements and records submitted by our officers or liquidators; |
| · | distribution of profits of the respective fiscal year, including the distribution of dividends; |
| · | election or revocation of regular and alternate board members, liquidators and external auditors; and |
| · | determination of the remuneration of the board members, directors committee remuneration and budget, designation of the newspaper were summons for meetings shall be published and, in general,any other matter to be dealt with by the annual meeting being of corporate interest and not specifically reserved to extraordinary shareholders' meetings. |
Extraordinary shareholders' meetings may be held at any time, when required by corporate necessity. During extraordinary meetings, determinations are made relating to any matter which the law or the Company's bylaws reserve for consideration by such extraordinary meetings, which matters shall be expressly set forth in the relevant summon. Whenever in an extraordinary shareholders' meeting determinations relating to matters specifically reserved to annual meetings must be made, the operation and decisions of such extraordinary meeting will follow the requirements applicable to annual meetings. The following matters, as modified by 2010 amendment, are specifically reserved for extraordinary meetings:
| · | dissolution of the corporation; |
| · | transformation, merger or spin-off of the corporation and amendments to its bylaws; |
| · | issuance of bonds or debentures convertible into stock; |
| · | the disposition of 50% or more of the corporate assets, whether or not liabilities are also transferred, to be determined according to the balance sheet of the previous fiscal year, or the proposal or amendment of any business plan that contemplates the transfer of assets exceeding said percentage, the disposition of 50% or more of the corporate assets of a subsidiary, which represents at least 20% of the assets of the corporation, as well as any disposition of shares which results in the parent company losing its status of controlling shareholder; and |
| · | guarantees of third parties' obligations, except when these third parties are subsidiary companies (in which case approval of the board of directors will suffice). |
In addition to the above, annual and extraordinary shareholders' meetings must be called by the board of directors in the following circumstances:
| · | when requested by shareholders representing at least 10% of issued stock with voting rights; and |
| · | when required by the SVS, notwithstanding its right to call such meeting directly. |
Only holders of stock recorded in the Register of Shareholders of open stock corporations at least five business days, including Saturdays, before the date of the pertinent meeting may participate with the right to be heard and vote in shareholders' meetings. Directors and officers other than shareholders may participate in shareholders' meetings with the right to be heard.
Shareholders may be represented at meetings by other individuals, regardless of whether or not those persons are shareholders themselves. A proxy must be conferred in writing, and for the total number of shares held by the shareholder and entitled to vote in accordance with the previous paragraph.
Limitations on the right to own securities. The right to own any kind of property is guaranteed by the Chilean Constitution, and the Chilean Corporations Act does not contain any general limitation regarding the right to own securities. There are, however, certain limitations on the right of foreigners to own securities of Chilean corporations, but only for certain special types of companies. We are not affected by these limitations, and our bylaws do not contain limitations or restrictions in this regard.
107
Article 14 of the Chilean Corporations Act forbids public corporations from including in their bylaws any provisions restricting the free transferability of stock. However, shareholders may enter into a private agreement on this matter, but, in order for these agreements to be effective against the company and third parties, they must be recorded by the corporation and thus made available to any interested third parties. See “Item 6: Directors, Senior Management and Employees–Directors and Senior Management.”
Takeover defenses. Our bylaws do not contain any provisions that would have the effect of delaying, deferring or preventing a change in control of us and that would operate only with respect to a merger, acquisition or corporate restructuring involving us (or any of our subsidiaries).
Ownership threshold. Our bylaws do not contain any ownership threshold above which shareholder ownership must be disclosed. For a description of the ownership thresholds mandated by Chilean law, see “– Rights, preferences and restrictions regarding shares.”
Our bylaws do not impose any conditions that are more stringent than those required by law for effecting changes in our capital.
Material Contracts
Not applicable.
Exchange Controls
General Legislation and Regulations. The Central Bank of Chile is responsible for, among other things, monetary policies and exchange controls in Chile. See “Item 3. Key Information – Selected Financial Data – Exchange Rate.” Foreign investments can be registered with the Foreign Investment Committee under Decree Law No. 600 – registration which grants the investor access to the Formal Exchange Market– or with the Central Bank of Chile under Chapter XIV of the Central Bank Foreign Exchange Regulations.
Effective April 19, 2001, the Central Bank of Chile abrogated the then existing Chapter XXVI of the Central Bank Foreign Exchange Regulations (“Chapter XXVI”), which addressed issuance of ADSs by a Chilean company, and issued an entirely new set of Foreign Exchange Regulations (the April 19th Regulations”), virtually eliminating all the restrictions and limitations that had been in force up to that date. The April 19th Regulations were based upon the general principle that foreign exchange transactions can be made freely in Chile by any person, notwithstanding the power conferred by law to the Central Bank of Chile of imposing certain restrictions and limitations to such transactions.
With the issuance of the above Regulations, the approval by the Central Bank of Chile required for access to the Formal Exchange Market was replaced with the requirement of disclosure of the relevant transactions to the Central Bank of Chile. However, some foreign exchange transactions, notably foreign loans, capital investment or deposits, continued to be subject to the requirement of being effected through the Formal Exchange Market. The April 19th Regulations reduced the time needed to effect foreign exchange transactions by foreign investors in Chile.
The April 19th Regulations, among others, eliminated the following restrictions:
| · | prior authorization by the Central Bank of Chile for the entry of capital in connection with foreign loans, investment, capital contribution, bonds and ADRs; |
| · | prior authorization by the Central Bank of Chile for the remittance of capital in connection with repatriation of capital, dividends and other benefits related to capital contributions and investment, and prepayment of foreign loans; |
| · | minimum risk classification restrictions and terms for the issuance of bonds; |
| · | restrictions on the issuance of ADRs. Therefore, the rules established under Chapter XXVI of the previous Foreign Exchange Regulations are no longer applicable; and |
| · | Mandatory Reserve deposits for foreign capitals. |
108
On January 23, 2002, the Central Bank of Chile issued an entirely new set of Foreign Exchange Regulations, effective as from March 1, 2002, replacing April 19th Regulations (“The New Rules”). The New Rules preserve the general principle established in the April 19th Regulations of freedom in foreign exchange transactions, simplified procedures to reduce the time needed to effect foreign exchange transactions by foreign investors in Chile, and introduced several new provisions.
Pursuant to the New Rules, Chilean entities are now allowed, under Chapter XIV, which governs credits, deposits, investments and capital contribution from abroad, to:(i) dispose of such foreign currency allocated abroad, executing any of the transactions contemplated in Chapter XIV, without the need of delivering it into Chile, subject to the obligation of reporting said transaction to the Central Bank of Chile; and (ii) capitalize any liability expressed in foreign currency and acquired abroad.
According to the New Rules, foreign exchange transactions made pursuant to Chapter XIV, executed before April 19, 2001, shall continue to be subject to the regulations in effect at the time of the transactions, unless the interested parties elect the applicability of the New Rules, expressly waiving the applicability of the provisions which would otherwise govern them.
Notwithstanding the above, foreign exchange transactions contemplated in Chapter XIV, executed before March 1, 2002 according to the regulations of the Central Bank of Chile in force at the time of their execution, may be reported to the Central Bank pursuant to the provisions contained in the New Rules.
Therefore, notwithstanding the April 19th Regulations and the New Rules, Chapter XXVI remains in force with respect to our ADR facility, as referred to below.
Our ADRs. A Foreign Investment Contract was entered into among the Central Bank of Chile, us and the Depositary pursuant to Article 47 of the Central Bank Act and Chapter XXVI. See “–General Legislation and Regulations.” According to Chilean law, a contract is ruled by the law in force at the time of its execution. Therefore, our Foreign Investment Contract is ruled by the foreign exchange regulations in force before April 19, 2001, among which is Chapter XXVI. Absent the Foreign Investment Contract, under Chilean exchange controls in force until April 19, 2001, investors would not have been granted access to the Formal Exchange Market for the purpose of converting Chilean pesos to U.S. dollars and repatriating from Chile amounts received in respect of deposited Shares or Shares withdrawn from deposit on surrender of ADRs (including amounts received as cash dividends and proceeds from the sale in Chile of the underlying Shares and any rights with respect thereto). In December 1999, amendments were introduced to Chapter XXVI whereby, among other things, the Central Bank of Chile was authorized to reject applications under such regulations without expression of cause. In reviewing such applications, the Central Bank of Chile was required to take into account the situation of the balance of payments and the stability of the capital account. However, the Central Bank of Chile was authorized to impose certain conditions on the applicants prior to resolving the applications. In April 2000, Chapter XXVI was again amended in order to incorporate, in addition to shares issued by Chilean corporations, quotes of investment funds as eligible to be converted into ADSs. Chapter XXVI did not require delivery of a new application in case of the entry of U.S. dollars intended for the acquisition of shares not subscribed by the shareholders or by the transferees of the options to subscribe the shares.
109
Under Chapter XXVI and our Foreign Investment Contract, the Central Bank of Chile agreed to grant to the Depositary, on behalf of ADR holders, and to any non-Chilean resident investor who withdrew Shares of our common stock upon surrender of ADRs (such Shares being referred to herein as “Withdrawn Shares”) access to the Formal Exchange Market to convert Chilean pesos to U.S. dollars (and to remitsuch dollars outside of Chile) in respect of Shares of our common stock represented by ADSs or Withdrawn Shares, including amounts received as (a) cash dividends, (b) proceeds from the sale in Chile of Withdrawn Shares (subject to receipt by the Central Bank of Chile of a certificate from the holder of the Withdrawn Shares (or from an institution authorized by the Central Bank of Chile) that such holder’s residence and domicile were outside Chile and a certificate from a Chilean stock exchange (or from a brokerage or securities firm established in Chile) that such Withdrawn Shares had been sold on a Chilean exchange), (c) proceeds from the sale in Chile of pre-emptive rights to subscribe for and purchase additional Shares of our common stock, (d) proceeds from the liquidation, merger or consolidation of the Company and (e) other distributions, including, without limitation, those resulting from any recapitalization, as a result of holding Shares represented by ADSs or Withdrawn Shares. Access to the Formal Exchange Market in the case of (a), (b), (c) and (d) above would be available for only five working days following the sale of the shares on the stock exchange. Transferees of Withdrawn Shares would not be entitled to any of the foregoing rights under Chapter XXVI unless the Withdrawn Shares were redeposited with the Custodian. Investors receiving Withdrawn Shares in exchange for ADRs would have the right to redeposit such Shares in exchange for ADRs, provided that certain conditions to redeposit were satisfied. For a description of the Formal Exchange Market, see “Item 3: Key Information – Selected Financial Data – Exchange Rates.” Alternatively, according to the amendments introduced to Chapter XXVI in December 1999, in case of Withdrawn Shares and their subsequent sale on a stock exchange, the Chilean peso proceeds obtained thereby could be converted into U.S. dollars in a market different from the Formal Exchange Market within five business days from the date of the sale.
Chapter XXVI provided that access to the Formal Exchange Market in connection with the sale of Withdrawn Shares or distributions thereon would be conditioned upon receipt by the Central Bank of Chile of a certification by the Depositary or the Custodian, as the case might have been, that such Shares had been withdrawn in exchange for delivery of the pertinent ADRs and receipt of a waiver of the benefits of our Foreign Investment Contract with respect thereto (except in connection with the proposed sale of the Shares) until such Withdrawn Shares were redeposited. Chapter XXVI also provided that access to the Formal Exchange Market in connection with dividend payments was conditioned on certification by us to the Central Bank of Chile that a dividend payment had been made. The provision contained in Chapter XXVI that established that access to the Formal Exchange Market in connection with dividend payments was conditioned on certification by us to the Central Bank of Chile that any applicable tax had been withheld was eliminated on November 23, 2000.
Chapter XXVI and our Foreign Investment Contract provided that a person who brought foreign currency into Chile, including U.S. dollars, to purchase Shares entitled to the benefit of our Foreign Investment Contract was required to convert such foreign currency into Chilean pesos on the same date and had five banking business days within which to invest in Shares in order to receive the benefit of our Foreign Investment Contract. If such person decided within such period not to acquire Shares, such person could access the Formal Exchange Market to reacquire foreign currency, provided that the applicable request was presented to the Central Bank of Chile within seven banking days of the initial conversion into pesos. Shares acquired as described above could be deposited in exchange for ADRs and receive the benefit of our Foreign Investment Contract, subject to receipt by the Central Bank of Chile of a certificate from the Depositary that such deposit had been effected and that the related ADRs had been issued and receipt by the Custodian of a declaration from the person making such deposit waiving the benefit of our Foreign Investment Contract with respect to the deposited Shares.
Chapter XXVI required foreign investors acquiring shares or securities in Chile to maintain a mandatory reserve (the “Mandatory Reserve”) for one year in the form of a non-interest bearing U.S. dollar deposit with the Central Bank, or to pay to the Central Bank a non-refundable fee (the “Fee”). Such reserve requirement was imposed with respect to investments made by foreign investors to acquire shares or securities in the secondary market, but did not apply to capital contributions made for purposes of paying-in capital for a newly created company or increasing the capital of an existing company. As of June 1, 1999, the Mandatory Reserve was not applied to foreign investments made for purposes of acquiring shares of a stock corporation, provided that the investor was entitled to the benefit of Chapter XXVI, and that such acquisition was consummated in accordance with the provisions of Chapter XXVI. On September 17, 1998, the Central Bank of Chile reduced the Mandatory Reserve to 0%.
110
Access to the Formal Exchange Market under any of the circumstances described above was not automatic. Pursuant to Chapter XXVI, such access required approval of the Central Bank of Chile based on a request therefore presented through a banking institution established in Chile within five business days from the occurrence of any of the events described in letters (a), (b), (c) and (d) above. Pursuant to our Foreign Investment Contract, if the Central Bank of Chile had not acted on such request within seven banking days, the request would be deemed approved.
In 2009, the Central Bank of Chile adopted a new policy regarding the surrender of ADR’s in exchange for underlying shares, acquired by Chilean companies in joint tender offers, effected both in the national and the international stock market, which have been declared successful.
Pursuant to such policy, the depositary or custodian shall be entitled to effect such exchange, prior to the end of the term of the ADRs Program, subject to the following conditions:
a) Simultaneously with the request for approval submitted to the Central Bank of Chile, the parties to a foreign investment contract shall agree on its termination provided that the following prior conditions are meet: (i) a complete and timely exchange of the outstanding ADRs has been effected by the depositary (ii) underlying shares of certificates not exchanged according to the program agreed upon to that end are sold in a Chilean stock market, and the proceeds remitted to the respective ADRs holders; complying with the reporting obligation to the regulatory authorities and to the market in general.
b) The foreign investment contract shall be deemed in full force and effect with respect to the remaining ADR holders, with domicile and residence abroad, until certificates of the fulfillment of such conditions issued by the custodian and the depositary are submitted to the Central Bank of Chile. In addition to the Termination Agreement, a public deed expressly evidencing the above shall be executed by the parties.
The Chilean investor shall be subject to the exchange regulations in force at the time of the tender offers as well as the terms of authorization issued by the Central Bank of Chile to this end.
Under current Chilean law, our foreign investment contract cannot be amended unilaterally by the Central Bank of Chile. We cannot assure you, however, that new restrictions applicable to the holders of ADRs, the disposition of underlying Shares or the repatriation of the proceeds from such disposition will not be reinstated in the future by the Central Bank of Chile, nor can there be any assessment of the possible duration or impact of such restrictions.
Taxation
Chilean Tax Considerations
The following discussion is based on certain Chilean income tax laws presently in force, including Rulings N°324 of January 29, 1990, and N°3708 of October 1, 1999 of the Chilean Internal Revenue Service and other applicable regulations and rulings. The discussion summarizes the principal Chilean income tax consequences of an investment in the ADSs or shares of common stock by an individual who is not domiciled in or a resident of Chile or a legal entity that is not organized under the laws of Chile and does not have a permanent establishment located in Chile which we refer to as a foreign holder. For purposes of Chilean law, an individual holder is a resident of Chile if he or she has resided in Chile for more than six consecutive months in one calendar year or for a total of more than six months, whether consecutive or not, in two consecutive tax years. An individual holder is domiciled in Chile if he or she resides in Chile with the purpose of staying in Chile (such purpose to be evidenced by circumstances such as the acceptance of employment within Chile or the relocation of his or her family to Chile). This discussion is not intended as tax advice to any particular investor, which can be rendered only in light of that investor’s particular tax situation. Neither is it intended to be a comprehensive description of all the tax considerations that may be relevant to a decision to purchase, own or dispose of shares or ADSs and does address all of the tax consequences that may be relevant to specific holders in light of their particular circumstances. Holders of shares and ADSsare advised to consult their own tax advisors concerning the Chilean or other tax consequences relating to the ownership of shares or ADSs.
111
Under Chilean law, provisions contained in statutes such as tax rates applicable to foreign holders, the computation of taxable income for Chilean purposes and the manner in which Chilean taxes are imposed and collected may be amended only by another statute. In addition, the Chilean tax authorities issue rulings and regulations of either general or specific application interpreting the provisions of Chilean tax law. Chilean taxes may not be assessed retroactively against taxpayers who act in good faith relying on such rulings and regulations, but Chilean tax authorities may change said rulings and regulations prospectively. There is no general income tax treaty in force between Chile and the United States.
Cash dividends and Other Distributions. Cash dividends paid by us with respect to the ADSs or shares of common stock held by a foreign holder will be subject to a 35.0% Chilean withholding tax, which is withheld and paid over by us, which we refer to as the Chilean withholding tax. A credit against the Chilean withholding tax is available based on the level of corporate income tax, or first category tax, actually paid by us on the taxable income to which the dividend is imputed; however, this credit does not reduce the Chilean withholding tax on a one-for-one basis because it also increases the base on which the Chilean withholding tax is imposed. In addition, distribution of book income in excess of retained taxable income is subject to the Chilean withholding tax, but such distribution is not eligible for the credit. Under Chilean income tax law, for purposes of determining the level of the first category tax that has been paid by us, dividends generally are assumed to have been paid out of our oldest retained taxable profits. Presently, the first category tax rate is 20.0%. Whether the first category tax is imposed or not, the effective overall combined rate of Chilean taxes imposed with respect to our distributed profits would be 35.0%. Nevertheless, in the case that the retained taxable profits or exempted profits as of December 31 of the year preceding a dividend are not sufficient to attribute to such dividend, we will make a withholding of 35.0% of the amount that exceeds those retained taxable or exempted profits. In case such withholding is determined to be excessive before the end of the year, there will be rights to file for the reimbursement of the excess withholding.
The foregoing tax consequences apply to cash dividends paid by us. Dividend distributions made in property (other than shares of common stock) will be subject to the same Chilean tax rules as cash dividends.
Capital Gain. Gain realized on the sale, exchange or other disposition by a foreign holder of ADSs (or ADRs evidencing ADSs) will not be subject to Chilean taxation, provided that such disposition occurs outside Chile or that it is performed under the rules of Title XXIV of the Chilean Securities Market Law, as amended by Law N° 19,601, dated January 18, 1999. The deposit and withdrawal of shares of common stock in exchange for ADRs will not be subject to any Chilean taxes.
Gain recognized on a sale or exchange of shares of common stock (as distinguished from sales or exchanges of ADSs representing such shares of common stock) by a foreign holder will be subject to both the first category tax and the Chilean withholding tax (the former being creditable against the latter) if (1) the foreign holder has held such shares of common stock for less than one year since exchanging ADSs for the shares of common stock, (2) the foreign holder acquired and disposed of the shares of common stock in the ordinary course of its business or as a regular trader of stock or (3) the sale is made to a company in which the foreign holder holds an interest (10.0% or more of the shares in the case of open stock corporations). In all other cases, gain on the disposition of shares of common stock will be subject only to the first category tax levied as a sole tax. However, if it is impossible to determine the taxable capital gain, a 5.0% withholding will be imposed on the total amount to be remitted abroad without any deductions as a provisional payment of the total tax due.
The tax basis of shares of common stock received in exchange for ADSs will be the acquisition value of such shares. The valuation procedure set forth in the deposit agreement, which has been approved by the Chilean Internal Revenue Service pursuant Ruling Nº 324 of 1990, values shares of common stock that are being exchanged at the highest price at which they trade on the Santiago Stock Exchange on the date of the exchange, generally will determine the acquisition value for this purpose. Consequently, the conversion of ADSs into shares of common stock and sale of such shares of common stock for the value established under the deposit agreement will not generate a capital gain subject to taxation in Chile.
112
In the case where the sale of the shares is made on a day that is different than the date in which the exchange is recorded, capital gains subject to taxation in Chile may be generated. However, following Ruling N° 3708 of the Chilean Internal Revenue Service, we will include in the deposit agreements a provision whereby the capital gain that may be generated if the exchange date is different than the date in which the shares received in exchange for ADSs are sold, will not be subject to taxation. Such provision states that in the event that the exchanged shares are sold by the ADS holders in a Chilean stock exchange on the same day in which the exchange is recorded in the shareholders’ registry of the issuer or within two business days prior to the date on which the sale is recorded in the shareholders’ registry, the acquisition price of such exchanged shares shall be the price registered in the invoice issued by the stock broker that participated in the sale transaction.
The distribution and exercise of preemptive rights relating to the shares of common stock will not be subject to Chilean taxation. Amounts received for the assignment of preemptive rights relating to the shares will be subject to both the first category tax and the Chilean withholding tax (the former being creditable against the latter to the extent described above).
The Chilean Internal Revenue Service has not enacted any rule nor issued any ruling about the applicability of the norms explained below (referred to as Laws Nº 19,738 and Nº 19,768) to the foreign holders of ADRs.
To the extent that our shares are actively traded on a Chilean stock exchange, foreign institutional investors who acquire our shares may benefit from a tax exemption included in an amendment to the Chilean Income Tax Law, Law Nº 19,738 published on June 19, 2001. The amendment established an exemption for the payment of income tax by foreign institutional investors, such as mutual funds, pension funds and others, that obtain capital gains in the sales through a Chilean stock exchange, a tender offer or any other system authorized by the Superintendency of Securities and Insurance, of shares of publicly traded corporations that are significantly traded in stock exchanges.
A foreign institutional investor is an entity that is either:
· a fund that makes public offers of its shares in a country which public debt has been rated investment grade by an international risk classification agency qualified by the Superintendency of Securities and Insurance;
· a fund that is registered with a regulatory entity of a country which public debt has been rated investment grade by an international risk classification agency qualified by the Superintendency of Securities and Insurance, provided that the investments in Chile, including securities issued abroad that represent Chilean securities, held by the fund represent less than 30.0% of its share value;
· a fund that holds investments in Chile that represent less than 30.0% of its share value, provided that it proves that no more that 10.0% of its share value is directly or indirectly owned by Chilean residents;
· a pension fund that is exclusively formed by individuals that receive their pension on account of capital accumulated in the fund;
· a fund regulated by Law Nº 18,657, or the Foreign Capital Investment Funds Law, in which case all holders of its shares must reside abroad or be qualified as local institutional investors; or
· another kind of institutional foreign investor that complies with the characteristics defined by a regulation with the prior report of the Superintendency of Securities and Insurance and the Chilean Internal Revenue Service.
In order to be entitled to the exemption, foreign institutional investors, during the time in which they operate in Chile must:
113
| · | be organized abroad and not be domiciled in Chile; |
| · | not participate, directly or indirectly, in the control of the issuers of the securities in which it invests and not hold, directly or indirectly, 10.0% or more of such companies’ capital or profits; |
| · | execute an agreement in writing with a Chilean bank or securities broker in which the intermediary is responsible for the execution of purchase and sale orders and for the verification, at the time of the respective remittance, that such remittances relate to capital gains that are exempt from income tax in Chile or, if they are subject to income tax, that the applicable withholdings have been made; and |
| · | register in a special registry with the Chilean Internal Revenue Service. |
| · | on a local stock exchange or any other stock exchange authorized by the Superintendency of Securities and Insurance or in a tender offer process according to Title XXV of the Chilean Securities Market Law, so long as the shares (a) were purchased on a public stock exchange or in a tender offer process pursuant to Title XXV of the Chilean Securities Market Law, (b) are newly issued shares issued in a capital increase of the corporation, or (c) were the result of the exchange of convertible bonds (in which case the option price is considered to be the price of the shares). In this case, gains exempted from Chilean taxes shall be calculated using the criteria set forth in the Chilean Income Tax Law; or |
| · | within 90 days after the shares would have ceased to be significantly traded on stock exchange. In such case, the gains exempted from Chilean taxes on capital gains will be up to the average price per share of the last 90 days. Any gains above the average price will be subject to the first category tax. |
Other Chilean Taxes. No Chilean inheritance, gift or succession taxes apply to the transfer or disposition of the ADSs by a foreign holder but such taxes generally will apply to the transfer at death or by a gift of shares of common stock by a foreign holder. No Chilean stamp, issue, registration or similar taxes or duties apply to foreign holders of ADSs or shares of common stock.
Withholding Tax Certificates. Upon request, we will provide to foreign holders appropriate documentation evidencing the payment of the Chilean withholding tax. We will also inform when the withholding was excessive in order to allow the filing for the reimbursement of taxes.
United States Tax Considerations
The following is a summary of certain United States federal income tax consequences of the ownership of shares of Common Stock or ADSs by an investor that is a U.S. Holder (as defined below) that holds the shares of Common Stock or ADSs as capital assets. This summary does not purport to address all material tax consequences of the ownership of Common Stock or ADSs, and does not take into account the specific circumstances of any particular investors (such as tax-exempt entities, certain insurance companies, broker-dealers, traders in securities that elect to mark to market, investors liable for alternative minimum tax, investors that actually or constructively own 10% or more of the voting stock of the Company, investors that hold Common Stock or ADSs as part of a straddle or a hedging or conversion transaction or U.S. Holders (as defined below) whose functional currency is not the U.S. dollar), some of which may be subject to special rules. This summary is based on the tax laws of the United States (including the Internal Revenue Code of 1986, as amended, its legislative history, existing and proposed regulations thereunder, published rulings and court decisions) as in effect on the date hereof, all of which are subject to change (or changes in interpretation), possibly with retroactive effect.
114
For purposes of this discussion, a “U.S. Holder” is any beneficial owner of shares of Common Stock or ADSs that is (i) a citizen or resident of the United States, (ii) a corporation or partnership organized under the laws of the United States or any State, (iii) an estate whose income is subject to United States federal income tax regardless of its source or (iv) a trust if a United States court can exercise primary supervision over the trust's administration and one or more United States persons are authorized to control all substantial decisions of the trust. The discussion does not address any aspects of United States taxation other than federal income taxation. Investors are urged to consult their tax advisors regarding the United States federal, state and local and other tax consequences of owning and disposing of Common Stock and ADSs.
In general, assuming that the representations of the Depositary are true and that each obligation in the Deposit Agreement and any related agreement will be performed in accordance with its terms, for United States federal income tax purposes, holders of ADRs evidencing ADSs will be treated as the owners of the shares of Common Stock represented by those ADSs, and exchanges of shares of Common Stock for ADSs, and ADSs for shares of Common Stock will not be subject to United States federal income tax.
Cash Dividends and Other Distributions. Under the United States federal income tax laws, and subject to the passive foreign investment company (“PFIC”) rules discussed below, U.S. Holders will include in gross income the gross amount of any dividend paid before reduction for any net withholding (i.e., after taking into account any Chilean First-Category Tax creditable against Chilean Withholding Tax) by the Company out of its current or accumulated earnings and profits (as determined for United States federal income tax purposes) as ordinary income when the dividend is actually or constructively received by the U.S. Holder, in the case of shares of Common Stock, or by the Depositary, in the case of ADSs. The dividend will not be eligible for the dividends-received deduction. Subject to a holder's satisfaction of certain holding period requirements, dividends included in income by a non-corporate U.S. holder during the period ending on December 31, 2008 are subject to tax at a maximum rate of 15% if the dividends are paid by a domestic corporation or “qualified foreign corporation.” A qualified foreign corporation generally includes a foreign corporation if (i) its shares (or ADSs) are readily tradable on an established securities market in the U.S. or (ii) it is eligible for benefits under a comprehensive U.S. income tax treaty, provided that (a) the corporation was not, in the year prior to the year in which the dividend was paid, and is not, in the year in which the dividend is paid, a passive foreign investment company, or (b) for dividends paid prior to the 2005 tax year, a foreign personal holding company or foreign investment company. We believe that we should be treated as a qualified foreign corporation with respect to dividend payments to our ADS holders and, therefore, dividends paid to an individual U.S. holder of ADSs should be taxed at a maximum rate of 15%. However, you should be aware that the requirements to be treated as qualified foreign corporation are not entirely clear and further guidance from the Internal Revenue Service may be forthcoming that could affect this conclusion. U.S. holders of Ordinary Shares directly, rather than through ADSs, should consult their own tax advisor about whether the 15% maximum rate applies to dividends they receive. The amount of the dividend distribution includible in income of a U.S. Holder will be the U.S. dollar value of the Chilean peso payments made, determined at the spot Chilean peso/U.S. dollar rate on the date such dividend distribution is includible in the income of the U.S. Holder, regardless of whether the payment is in fact converted into U.S. dollars. Generally, any gain or loss resulting from currency exchange fluctuations during the period from the date the dividend payment is includible in income to the date such payment is converted into U.S. dollars will be treated as ordinary foreign exchange gain or loss. Such gain or loss will generally be from sources within the United States for foreign tax credit limitation purposes. Subject to certain generally applicable limitations, the net amount of any Chilean Withholding Tax (after reduction for the credit for Chilean First-Category Tax) paid over to Chile will be creditable against the U.S. Holder 's United States federal income tax liability. For foreign tax credit limitation purposes, the dividend will be income from sources outside the United States. In the case of U.S. individuals, if the reduced rate of tax on dividends applies to such holder, such limitations and restrictions will appropriately take into account the rate differential under rules similar to section 904(b)(2)(B) of the Internal Revenue Code. The rules governing foreign tax credits are complex and U.S. Holders should consult their tax advisors regarding their application to the particular circumstances of such holder.
Pro rata distributions of shares of Common Stock or preemptive rights generally are not subject to United States federal income tax. The basis of the new shares of Common Stock or preemptive rights (if such rights are exercised or sold) generally will be determined by allocating the U.S. Holder's adjusted basis in the old shares between the old shares and the new shares or preemptive rights received, based on their relative fair market values on the date of distribution (except that the basis of the preemptive rights will be zero if thefair market value of the rights is less than 15% of the fair market value of the old shares at the time of distribution, unless the U.S. Holder irrevocably elects to allocate basis between the old shares and the preemptive rights). The holding period of a U.S. Holder for the new shares or preemptive rights will include the U.S. Holder's holding period for the old shares with respect to which the new shares or preemptive rights were issued. In other circumstances, distributions of Common Stock or preemptive rights may be treated as taxable dividends.
115
Capital Gains.U.S. Holders will not recognize gain or loss on deposits or withdrawals of shares of Common Stock in exchange for ADSs or on the exercise of preemptive rights. U.S. Holders will recognize capital gain or loss on the sale or other disposition of ADSs or shares of Common Stock (or preemptive rights with respect to such shares) held by the U.S. Holder or by the Depositary equal to the difference between the amount realized and the U.S. Holder's tax basis in the ADSs or shares. Any gain recognized by a U.S. Holder generally will be treated as United States source income. Consequently, in the case of a disposition of shares of Common Stock or preemptive rights (which, unlike a disposition of ADSs, will be taxable in Chile), the U.S. Holder may not be able to claim the foreign tax credit for Chilean tax imposed on the gain unless it appropriately can apply the credit against tax due on other income from foreign sources. Loss generally would be treated as United States source loss. With respect to sales occurring on or after May 6, 2003, but before January 1, 2009, the long-term capital gain tax rate for an individual U.S. Holder is 15%. For sales occurring before May 6, 2003, or after December 31, 2008, under current law the long-term capital gain rate for an individual U.S. Holder is 20%.
PFIC Rules.CCU believes that it should not be treated as a passive foreign investment company (a “PFIC”) for United States federal income tax purposes, although this conclusion is subject to some uncertainty because definitive asset values for non publicly-traded or illiquid assets may be unavailable. This conclusion is also a factual determination made annually and thus may be subject to change.
In general, the Company will be a PFIC with respect to a U.S. Holder if for any taxable year in which the U.S. Holder held the Company's ADSs or shares of Common Stock, either (i) at least 75% of the gross income of the Company for the taxable year is passive income or (ii) at least 50% of the value (determined on the basis of a quarterly average) of the Company 's assets is attributable to assets that produce or are held for the production of passive income. For this purpose, passive income generally includes dividends, interest, royalties, rents (other than certain rents and royalties derived in the active conduct of a trade or business), annuities and gains from assets that produce passive income. If a foreign corporation owns at least 25% by value of the stock of another corporation, the foreign corporation is treated for purposes of the PFIC tests as owning its proportionate share of the assets of the other corporation, and as receiving directly its proportionate share of the other corporation's income. If the Company is treated as a PFIC, a U.S. Holder would be subject to special rules with respect to (a) any gain realized on the sale or other disposition of shares of Common Stock or ADSs and (b) any “excess distribution” by the Company to the U.S. Holder (generally, any distributions to the U.S. Holder in respect of the shares of Common Stock or ADSs during a single taxable year that are greater than 125% of the average annual distributions received by the U.S. Holder in respect of the shares of Common Stock or ADSs during the three preceding taxable years or, if shorter, the U.S. Holder 's holding period for the shares or ADSs). Under these rules, (i) the gain or excess distribution would be allocated ratably over the U.S. Holder 's holding period for the shares of Common Stock or ADSs, (ii) the amount allocated to the taxable year in which the gain or excess distribution was realized would be taxable as ordinary income, (iii) the amount allocated to each prior year, with certain exceptions, would be subject to tax at the highest tax rate in effect for that year and (iv) the interest charge generally applicable to underpayments of tax would be imposed in respect of the tax attributable to each such year.
Special rules apply with respect to the calculation of the amount of the foreign tax credit with respect to excess distributions by a PFIC.
If the Company is treated as a PFIC, a U.S. Holder may be able to make a mark-to-market election if the Company's stock is treated as regularly traded on a registered national securities exchange or other exchange to the extent permitted by the IRS. If the election is made, the PFIC rules described above will not apply. Instead, in general, the electing U.S. Holder will be required to include as ordinary income each year the excess, if any, of the fair market value of the shares of Common Stock or ADSs at the end of the taxable year over the U.S. Holder's adjusted tax basis in the shares or ADSs. The electing U.S. Holder will also beallowed to take an ordinary loss in respect of the excess, if any, of the adjusted tax basis in the shares of Common Stock or ADSs over their fair market value at the end of the taxable year (but only to the extent of the net amount of income previously included as a result of the mark-to-market election). An electing U.S. Holder's tax basis in the shares of Common Stock or ADSs will be adjusted to reflect any such income or loss amounts.
116
Alternatively, a U.S. Holder of shares or ADSs in a PFIC can sometimes avoid the rules described above by electing to treat the company as a “qualified electing fund” under section 1295 of the Internal Revenue Code. This option will not be available to U.S. Holders because the Company does not intend to comply with the requirements necessary to permit a U.S. Holder to make this election. U.S. Holders should consult their own tax advisors concerning the U.S. federal income tax consequences of holding shares or ADSs if the Company is considered a passive foreign investment company in any taxable year.
Information Reporting and Backup Withholding. Dividends in respect of the Shares or ADSs and proceeds from the sale, exchange, or redemption of the Shares or ADSs may be subject to information reporting to the United States Internal Revenue Service and a backup withholding tax (currently, at a 28% rate) may apply unless the U.S. Holder furnishes a correct taxpayer identification number or certificate of foreign status or is otherwise exempt from backup withholding. Generally, a U.S. Holder will provide such certification on Form W-9 and a non-U.S. Holder will provide such certification on Form W-8BEN.
Dividends and Paying Agents
Not applicable.
Statement by Experts
Not applicable.
Documents on Display
The documents concerning us, which are referred to in this annual report, may be inspected at our principal offices at Vitacura 2670, Twenty Third Floor, Santiago, Chile.
Subsidiary Information
Not applicable.
117
ITEM 11: Quantitative and Qualitative Disclosures About Market Risk
The following discussion about our risk management activities includes “forward-looking statements” that involve risk and uncertainties. Actual results could differ materially from those projected in the forward-looking statements.
We face primary market risk exposures in three categories: interest rate fluctuations, exchange rate fluctuations and commodity price fluctuations. We periodically review our exposure to the three principal sources of risk described above and determine at our senior management level how to minimize the impact on our operations of commodity price, foreign exchange and interest rate changes. As part of this review process, we periodically evaluate opportunities to enter into hedging mechanisms to mitigate such risks.
The market risk sensitive instruments referred to below are entered into only for purposes of hedging our risks and are not used for trading purposes.
Qualitative Information About Market Risk
Interest Rate Sensitivity
The interest rate risk is mainly originated by our financing sources. The principal exposure is related to LIBOR variable interest rates indexed obligations.
As of December 31, 2011, we had a total CLP51,998 million in debt indexed to LIBOR (CLP32,785 million as of December 31, 2010). Consequently, as of December 31, 2011, our financing structure consists (without taking into account the cross currency swaps effects) of approximately 21% (15% in 2010) debt with variable interest rates, and 79% (85% in 2010) debt with fixed interest rates.
To manage the interest rate risk, we have an interest rate administration policy that intends to reduce the volatility of its financial expenses, and to maintain an ideal percentage of its debt in fixed rate instruments. The financial position is mainly set by the use of short-term and long-term debt, as well as derivative instruments such as cross-currency interest rate swaps.
As of December 31, 2011, after considering the effect of interest rates and currency swaps, 98% (100% in 2010) of our long-term debt has fixed interest rates.
The terms and conditions of the Company’s obligations as of December 31, 2011, including exchange rates, interest rates, maturities and effective interest rates are detailed in Note 27to our audited financial statements included elsewhere in this annual report.
Commodity and Raw Material Price Sensitivity
The principal commodity price sensitivity faced by us is the variation of: 1) barley and malt supply for the production of beer, 2) concentrates sugar and plastic resin for the production and packaging of soft drinks, and 3) bulk wine and grapes for the manufacturing of wine and spirits.
Barley and malt. In Chile, we obtain our supply of barley and malt from local producers and in the international market. Long term supply agreements are entered into with local producers, where the barley price is set annually according to the market price, which is used to determine the malt price as per the agreements’ algorithms. The purchases and commitments expose the Company to risk regarding the fluctuation of commodity prices.
During 2011, we purchased 24,300 tons of malt (30,052 tons in 2010) and 12,000 tons of barley (27,000 tons in 2010). CCU Argentina acquires malt only from local producers. This raw material accounts for approximately 29% of the beer direcy cost. See “Item 4: Information on the Company – Business Overview – Our Beer Business – Our Beer Business in Chile – Raw Materials” and “Item 4: Information on the Company– Business Overview – Our Beer Business – Our Beer Business in Argentina – Raw Materials.” We do not hedge these transactions. Rather, we negotiate yearly contracts with malt suppliers.
118
Concentrates, sugar and plastic resin. The principal raw material used in the production of non-alcoholic beverages are concentrates, which are mainly acquired from licensees, sugar and plastic resin for the manufacturing of plastic bottles and containers. We generally purchase our sugar requirements from Empresas Iansa S.A., the sole producer of sugar in Chile as well as from imports. Plastic resin is also imported. The Company is exposed to price fluctuations risks with regards to these raw materials, which jointly represent 55% of the direct cost of the non-alcoholic beverages. See “Item 4: Information on the Company – Business Overview – Our Soft Drinks and Mineral Water Business – Our Soft Drinks and Mineral Water Business in Chile – Raw Materials.” We do not hedge these transactions.
Grapes and wine. The principal raw materials used by our wine subsidiary VSPT in the production of wine are its own harvested grape as well as purchased grapes and wine. VSPT obtains approximately 47% of the grapes used for export wines from its own vineyards, thereby reducing grape price volatility and ensuring quality consistency. Approximately 90% of the wine or grape supply for the production of the wine sold in the domestic market is purchased from third parties. During 2011, the subsidiary purchased 65% of the necessary grapes and wine on the basis of yearly contracts at fixed prices from third parties. Spot transactions for wine are executed from time to time depending on additional wine needs. During the last three years VSPT bought grapes and wine in Chile in the amount of CLP15,733 million, CLP32,255 million and CLP38,705 million, respectively. See “Item 4: Information on the Company – Business Overview – Our Wine Business – Raw Materials.”
Exchange Rate Sensitivity
We are exposed to exchange rate risks originated by: a) our net exposure of foreign currency assets and liabilities, b) exports sales, c) the purchase of raw material, products and capital investments effected in foreign currencies, or indexed to such currencies, and d) the net investment of subsidiaries in Argentina. Our greatest exchange rate risk exposure is the variation of the Chilean peso as compared to the US dollar, euro, sterling pound and Argentine peso.
As of December 31, 2011, we maintained in Chile foreign currency obligations amounting to CLP78,153 (CLP52,560 million in 2011), mostly denominated in U.S. dollars. Foreign currency obligations accruing variable interests (CLP51,998 million in 2011 and CLP32,785 million in 2010) represent 21% (15% in 2010) of the total such obligations. The remaining 79% (85% in 2010) is denominated in inflation-indexed Chilean pesos. The CLP78,152 million foreign currency obligations include loans for US$ 70 million (CLP36,381 million in 2011 and CLP32,785 million in 2010) which are hedged by currency and interest rate hedge agreements, converting such debts in fixed interest rate inflation-adjusted obligations in Chilean pesos. In addition, we maintain foreign currency assets for CLP43,099 million (CLP25,050 million in 2010) that mainly correspond to exports accounts receivable.
Regarding the Argentine subsidiaries operations, the liability net exposure in U.S. dollars and other currencies amounts to CLP2,199 million (CLP5,245 million in 2010).
To protect the value of the foreign currency assets and liabilities net position of our Chilean operations, we enter into derivative agreements (currency forwards) to hedge against any variation in the Chilean peso as compared to other currencies.
As of December 31, 2011, our assets (liabilities) net exposure in foreign currencies, after the use of derivative instruments, amounted to CLP1,789 million (CLP1,533 million in 2010).
Of our total sales, both in Chile and Argentina, 9% (11% in 2010) correspond to export sales made in foreign currencies, mainly U.S. dollars, euro, sterling pound, and of the total costs, 60% (61% in 2010) correspond to raw material and product purchases in foreign currencies, or indexed to such currencies. We do not actively hedge the eventual variations in the expected cash flows from such transactions.
119
On the other hand, we are exposed to exchange rate movements related to the conversion from Argentine pesos to Chilean pesos in the income, assets and liabilities of our subsidiaries in Argentina. We do not actively hedge the risks related to the subsidiaries conversion, the effects of which are recorded in Equity. As of December 31, 2011, the net investment in Argentine subsidiaries amounted to CLP94,073 million (CLP86,527 million in 2010).
Quantitative Information About Market Risk
Interest Rate Sensitivity
Most of our debt is at a fixed interest rate, so it is not exposed to fluctuations in interest rates. While we have a US$70 million variable rate loan we have entered into a cross-currency swap to mitigate the interest rate risk associated with this loan. As of December 31, 2011, our interest-bearing debt amounted to CLP247,061 million (see note 27 to the consolidated financial statements),79% of which was fixed debt and 21% was variable-rate debt.
The following table summarizes debt obligations with interest rates by maturity date, the related weighted-average interest rates and fair values:
Interest-Bearing Debts as of December 31, 2011 |
| |||||||||||||||
(in millions of CLP, except percentages) |
| |||||||||||||||
|
|
|
|
|
|
|
|
|
|
|
|
|
|
|
|
|
|
|
| Contractual Maturity Date |
|
|
|
|
| ||||||||
|
|
| 2012 |
| 2013 |
| 2014 |
| 2015 |
| 2016 |
| Thereafter |
| Total | Fair Value |
Interest bearing liabilities |
|
|
|
|
|
|
|
|
|
|
|
|
|
|
| |
Fixed rate |
|
|
|
|
|
|
|
|
|
|
|
|
|
|
|
|
CLP | Bonds and Banks | 14,976 |
| 3,230 |
| 69,845 |
| 3,108 |
| 3,108 |
| 83,970 |
| 178,238 | 173,913 | |
| Interest rate |
| 5.2% |
| 4.2% |
| 3.1% |
| 4.1% |
| 4.1% |
| 4.7% |
| 4.0% |
|
|
|
|
|
|
|
|
|
|
|
|
|
|
|
|
|
|
US$ |
|
| 9,435 |
|
|
|
|
|
|
|
|
|
|
| 9,435 | 9,435 |
| Average interest rate | 1.7% |
|
|
|
|
|
|
|
|
|
|
| 1.7% |
| |
|
|
|
|
|
|
|
|
|
|
|
|
|
|
|
|
|
Argentine pesos |
| 10,661 |
|
|
|
|
|
|
|
|
|
|
| 10,661 | 10,661 | |
| Average interest rate | 18.2% |
|
|
|
|
|
|
|
|
|
|
| 18.2% |
| |
|
|
|
|
|
|
|
|
|
|
|
|
|
|
|
|
|
|
|
|
|
|
|
|
|
|
|
|
|
|
|
|
|
|
Variable rate |
|
|
|
|
|
|
|
|
|
|
|
|
|
|
|
|
US$ |
|
| 36,381 |
|
|
|
|
|
|
|
|
|
|
| 36,381 | 35,755 |
| Average interest rate | Libor + 0.27% |
|
|
|
|
|
|
|
|
|
|
| |||
|
|
|
|
|
|
|
|
|
|
|
|
|
|
|
|
|
Non interest bearing liabilities |
|
|
|
|
|
|
|
|
|
|
|
|
|
| ||
Derivate Contract |
|
|
|
|
|
|
|
|
|
|
|
|
|
|
| |
Cross Currency Swap: |
|
|
|
|
|
|
|
|
|
|
|
|
|
|
| |
Receive US$ at Libor + 0.27 |
| 36,602 |
|
|
|
|
|
|
|
|
|
|
| 36,602 | 36,602 | |
Pay CLP (UF) at 2.75% |
| 40,909 |
|
|
|
|
|
|
|
|
|
|
| 40,909 | 40,909 | |
Forwards |
|
| 405 |
|
|
|
|
|
|
|
|
|
|
| 405 | 405 |
(1) A UF (Unidad de Fomento) is a daily indexed, peso-demonimated monetary unit. The UF is set daily in advance based on the previous month’s inflation rate.
(2) Bonds issued in the Chilean market.
(3) Includes the US$70 million loans that are hedged through cross-currency interest rate swap agreements.
Commodity Price Sensitivity
The major commodity price sensitivity faced by us is the variation of malt prices.
The following table summarizes information about our malt, barley, sugar and bulk wine inventories and futures contracts that are sensitive to changes in commodity prices, mainly malt prices. For inventories, the table presents the carrying amount and fair value of the inventories and contracts as of December 31, 2011. For these contracts the table presents the notional amount in tons, the weighted average contract price, and the total dollar contract amount by expected maturity date.
120
Commodity Price Sensitivity as of December 31, 2011
| Carrying Amount | Fair Value | |||||
On Balance Sheet Position |
|
|
|
|
|
|
|
Malt inventory (millions of CLP) | CLP8,938 |
|
|
|
|
| 9,020 |
Bulk wine inventory - raw material | 27,667 |
|
|
|
|
| 31,687 |
|
|
|
|
|
|
|
|
| Expected Maturity | Fair Value | |||||
| 2012 | 2013 | 2014 | 2015 | 2016 | Thereafter |
|
Purchase Contracts |
|
|
|
|
|
|
|
Malt: |
|
|
|
|
|
|
|
Fixed Purchase Volume (tons) | 32,250 | 27,440 | 32,982 | 33,973 | 14,250 | - |
|
Weighted Average Price (US$ per ton) (*) | 615 | 615 | 615 | 615 | 615 | - |
|
Contract Amount (thousands of US$) | US$19,834 | 16,876 | 20,284 | 20,893 | 8,764 | - | 87,355 |
Sugar: |
|
|
|
|
|
|
|
Fixed Purchase Volume (tons) | 60,500 | 60,500 | - | - | - | - |
|
Weighted Average Price (US$ per ton) (*) | 757 | 757 | - | - | - | - |
|
Contract Amount (thousands of US$) | US$45,799 | 45,799 | - | - | - | - | 99,704 |
Grapes: |
|
|
|
|
|
|
|
Fixed Purchase Volume (tons) | 19,124 | 17,237 | 8,408 | 7,807 | 3,351 | 4,680 |
|
Weighted Average Price (CLP per kg) (*) | 199 | 197 | 219 | 198 | 260 | 433 |
|
Contract Amount (millions of CLP) | CLP3,801 | 3,398 | 1,845 | 1,548 | 873 | 2,025 | 19,417 |
Wine: |
|
|
|
|
|
|
|
Fixed Purchase Volume (million liters) | 3,250 | 3,250 | - | - | - | - |
|
Weighted Average Price (CLP per liter) (*) | 220 | 220 | - | - | - | - |
|
Contract Amount (millions of CLP) | CLP716 | 716 | - | - | - | - | 1,625 |
_________
(*) Weighted average price estimation is calculated based on expected market prices. Prices to be paid by us are adjusted based on current market conditions.
As of December 31, 2011 we had malt purchase contracts for US$118.4 million, compared with US$114.2 million as of December 31, 2010.
Exchange Rate Sensitivity
The major exchange rate risk faced by us is the variation of the Chilean peso against the U.S. dollar.
On November 23, 2007, the Cayman Islands Branch of Compañía Cervecerías Unidas S.A. entered into a US$70 million, five-year unsecured, loan agreement. This credit agreement has a variable interest rate of LIBOR + 0.27% in U.S. dollars. The amortization of the loan will be done in one payment at the maturity date. Interest payments are made on a semi-annual basis. To avoid the exchange and interest risks of this credit, we entered into a cross-currency interest rate swap agreement for the total amount of this loan. As a consequence, we replaced the risk of LIBOR fluctuations for this credit agreement with a fixed rate of 2.75% in UF.
A portion of our subsidiaries operating revenue and assets and liabilities are in currencies that differ from our functional currency. However, since some of their operating revenues and expenses are in the same currency, this can create a partial natural hedge. In the case of our subsidiary VSPT, occasionally there exist short-term timing differences related to invoicing and cash collection which can generate currency exposure. We have entered into short-term US dollar currency forward contracts to mitigate this risk.
121
The following table summarizes our debt obligations, cash and cash equivalents, accounts receivable and derivative contracts in foreign currencies as of December 31, 2011 in million Chilean pesos, according to their maturity date, weighted-average interest rates and fair values:
Exchange Rate Sensitivity as of December 31, 2011 |
| ||||||||||||||||
(in millions of CLP, except percentages and exchange rate) |
| ||||||||||||||||
|
|
|
|
|
|
|
|
|
|
|
|
|
|
|
|
|
|
|
|
|
| Contractual Maturity Date |
|
|
|
|
| ||||||||
|
|
|
| 2012 |
| 2013 |
| 2014 |
| 2015 |
| 2016 |
| Thereafter |
| Total | Fair Value |
Debt Obligations |
|
|
|
|
|
|
|
|
|
|
|
|
|
|
|
| |
Variable rate (US$) |
|
|
|
|
|
|
|
|
|
|
|
|
|
|
|
| |
Short and medium term (1) |
|
| 36,381 |
| - |
| - |
| - |
| - |
| - |
| 36,381 | 35,755 | |
| Average int.rate |
| Libor + 0.27% |
|
|
|
|
|
|
|
|
|
|
| Libor + 0.27% |
| |
Fixed rate (US$) |
|
|
|
|
|
|
|
|
|
|
|
|
|
|
|
| |
Short term |
|
|
| 9,435 |
|
|
|
|
|
|
|
|
|
|
| 9,435 | 9,435 |
| Interest rate |
|
| 1.7% |
|
|
|
|
|
|
|
|
|
|
| 1.7% |
|
Fixed rate (Argentina $) |
|
|
|
|
|
|
|
|
|
|
|
|
|
|
|
| |
Short term |
|
|
| 10,661 |
|
|
|
|
|
|
|
|
|
|
| 10,661 | 10,661 |
| Interest rate |
|
| 18.2% |
|
|
|
|
|
|
|
|
|
|
| 18.2% |
|
|
|
|
|
|
|
|
|
|
|
|
|
|
|
|
|
|
|
Cash and Cash Equivalents |
|
|
|
|
|
|
|
|
|
|
|
|
|
|
|
| |
US$ |
|
|
| 2,686 |
|
|
|
|
|
|
|
|
|
|
| 2,686 | 2,686 |
Others |
|
|
| 1,079 |
|
|
|
|
|
|
|
|
|
|
| 1,079 | 1,079 |
TOTAL |
|
|
| 3,765 |
|
|
|
|
|
|
|
|
|
|
| 3,765 | 3,765 |
|
|
|
|
|
|
|
|
|
|
|
|
|
|
|
|
|
|
Accounts Receivables |
|
|
|
|
|
|
|
|
|
|
|
|
|
|
|
| |
US$ |
|
|
| 19,274 |
|
|
|
|
|
|
|
|
|
|
| 19,274 | 19,274 |
EUR |
|
|
| 7,961 |
|
|
|
|
|
|
|
|
|
|
| 7,961 | 7,961 |
Others |
|
|
| 42,196 |
|
|
|
|
|
|
|
|
|
|
| 42,196 | 42,196 |
TOTAL |
|
|
| 69,431 |
|
|
|
|
|
|
|
|
|
|
| 69,431 | 69,431 |
|
|
|
|
|
|
|
|
|
|
|
|
|
|
|
|
|
|
|
|
|
|
|
|
|
|
|
|
|
|
|
|
|
|
|
|
|
|
|
| Contractual Maturity Date |
|
|
|
|
| ||||||||
|
|
| Notional | 2012 |
| 2013 |
| 2014 |
| 2015 |
| 2016 |
| Thereafter |
| Total | Fair Value |
|
|
| amount |
|
|
|
|
|
|
|
|
|
|
|
|
|
|
Derivate Contracts (in |
|
|
|
|
|
|
|
|
|
|
|
|
|
|
|
| |
thousand of US$) |
|
|
|
|
|
|
|
|
|
|
|
|
|
|
|
| |
Receive Ch$/pay US$ |
| US$80,951 | US$80,951 |
|
|
|
|
|
|
|
|
|
|
| US$80,951 | US$80,287 | |
Receive US$/pay Ch$ |
|
| US$70,000 |
|
|
|
|
|
|
|
|
|
|
| US$70,000 | US$71,834 | |
(1) This debt takes into account US$ loans that are hedged through cross-currency interest rate swap agreements which convert the entire US$ debt to CLP debt (UF1,850,175).
ITEM 12: Description of Securities Other than Equity Securities
12.D.3. Depositary Fees and Charges
JP Morgan Chase Bank N.A. (JP Morgan) is the depositary of CCU shares in accordance with the deposit agreement, dated September 1, 1992, entered into by and among CCU, Morgan Guaranty Trust Company of New York, currently JPMorgan, as depositary, and all owners from time to time of ADSs issued by CCU (“Deposit Agreement”).
122
Pursuant to the Deposit Agreement, holders of our ADSs may have to pay to JP Morgan, either directly or indirectly, fees or charges up to the amounts set forth in the table below.
Service | Fee |
Issuance of ADSs | US$5 per each 100 ADSs issued
|
Cancellation of ADSs | US$5 per each 100 ADSs canceled
|
ADS holders will also be responsible to pay certain fees and expenses incurred by the depositary bank and certain taxes and governmental charges such as: stock transfer or other taxes and other governmental charges; cable, telex and facsimile transmission and delivery charges incurred upon the transfer of securities; transfer or registration fees for the registration of transfers charged by the registrar and transfer agent; or expenses incurred for converting foreign currency into U.S. dollars.
12.D.4. Depositary Payments
In 2011, the following reimbursements were made by JPMorgan, pursuant to the corresponding tax retention, in connection with our ADR program:
Expenses | US$ amount (*)
|
Documents Edgard and filing 20F legal review FASB fee PCAOB fee NYSE annual Fee Teleconferencing 20F auditing fees Conferences and Non-deal road show
Total
(*) includes 30% tax retention | 2.0 49.7 0.6 3.7 38.0 1.0 27.8 27.2
150.0
|
|
|
123
PART II
ITEM 13: Defaults, Dividend Arrearages and Delinquencies
Not applicable.
ITEM 14: Material Modifications to the Rights of Security Holders and Use of Proceeds
Not applicable.
ITEM 15: Controls and Procedures
(a)Controls and Procedures. The Company’s management, with the participation of the Chief Executive Officer and Chief Financial Officer, conducted an evaluation of the effectiveness of our disclosure controls and procedures as of December 31, 2011. Based on this evaluation, the Chief Executive Officer and Chief Financial Officer concluded that the disclosure controls and procedures were effective as of December 31, 2011.
Disclosure controls and procedures means controls and other procedures that are designed to ensure that information required to be disclosed by us in the reports that we file or submit under the Exchange Act is recorded, processed, summarized and reported, within the time periods required and that such information required to be disclosed by us in the reports that we file or submit under the Exchange Act is accumulated and communicated to our management, including our Chief Executive Officer and Chief Financial Officer, as appropriate to allow timely decisions regarding required disclosures.
(b)Management’s Annual Report on Internal Control over Financial Reporting. Our management, including our CEO and CFO, are responsible for establishing and maintaining adequate internal control over financial reporting and has assessed the effectiveness of our internal control over financial reporting as of December 31, 2011 based on the criteria established in “Internal Control – Integrated Framework” issued by the Committee of Sponsoring Organizations of the Treadway Commission (“COSO”) and, based on such criteria, our management has concluded that, as of December 31, 2011 our internal control over financial reporting is effective.
Our internal control over financial reporting is a process designed to provide reasonable assurance regarding the reliability of financial reporting and the preparation of financial statements for external purposes in accordance with IFRS. Our internal control over financial reporting includes those policies and procedures that (i) pertain to the maintenance of records that, in reasonable detail, accurately and fairly reflect the transactions and dispositions of our assets; (ii) provide reasonable assurance that transactions are recorded as necessary to permit preparation of financial statements in accordance with IFRS, and that our receipts and expenditures are being made only in accordance with authorizations of our management and directors; and (iii) provide reasonable assurance regarding prevention or timely detection of unauthorized acquisition, use or disposition of our assets that could have a material effect on the financial statements.
Because of its inherent limitations, internal control over financial reporting may not prevent or detect misstatements. Also, projections of any evaluation of the effectiveness of internal control to future periods are subject to the risk that controls may become inadequate because of changes in conditions, and that the degree of compliance with the policies or procedures may deteriorate.
124
The effectiveness of our internal control over financial reporting as of December 31, 2011 has been audited by PricewaterhouseCoopers, an independent registered public accounting firm, as stated in their report which appears herein.
(c)Attestation Report of the Registered Public Accounting Firm. See page F-2 of our audited consolidated financial statements.
(d)Changes in Internal Control over Financial Reporting. There has been no change in our internal control over financial reporting during 2011 that has materially affected, or is reasonably likely to materially affect, our internal control over financial reporting.
(e)Whistle-blowing procedure. We have a whistle-blowing procedure which allows any employee of CCU, of its associates or any person, to communicate to a designated person questionable practices or activities that constitute a breach of accounting procedures, internal controls, audit matters and the Code of Business Conduct.
ITEM 16A: Audit Committee Financial Expert
In the Board of Directors meeting of April 18, 2012, after the election of a new board at the Shareholders´ meeting, the Board of Directors appointed the following members to our Audit Committee: Messrs. Vittorio Corbo and Philippe Pasquet. Mr. Pasquet and Mr. Corbo meet the independence criteria contained in the Exchange Act and the NYSE Rules.
We do not have an audit committee financial expert serving on our Audit Committee, as such term is defined under Item 407 of Regulation S-K. We do not have an audit committee financial expert because we are not required to appoint one under Chilean law.
ITEM 16B: Code of Ethics
We have adopted a Code of Business Conduct that applies to all of our executive officers and employees. Our Code of Business Conduct is available on our website at www.ccu.cl. Our code of ethics was updated in August 2010 and no waivers, either explicit or implicit, of provisions of the code of ethics have been granted to the Chief Executive Officer, Chief Financial Officer or Chief Accounting Officer.
ITEM 16C: Principal Accountant Fees and Services
The following table sets forth the fees billed to us by our independent auditors, PricewaterhouseCoopers, during the fiscal years ended December 31, 2010 and 2011:
| 2010 | 2011 |
| (millions of CLP) (millions of CLP ) | |
Audit Fees | 293 | 230 |
Audit-Related Fees | 82 | 24 |
Tax Fees | 0 | 0 |
All Other Fees | 20 | 27 |
Total Fees | 396 | 280 |
125
“Audit fees” in the above table are the aggregate fees billed by PricewaterhouseCoopers in connection with the review and audit of our semi-annual and annual consolidated financial statements, as well as the review of other fillings. “Audit-related fees” are the aggregate fees billed by PricewaterhouseCoopers for assurance and related services that are reasonably related to the performance of the audit or review of our financial statements or that are traditionally performed by the external auditor, and include consultations regarding the Sarbanes-Oxley Act and due diligence related to transactions. “Tax fees” are fees billed by PricewaterhouseCoopers associated with the issuance of certificates for tax and legal compliance purposes. “All Other Fees” are mostly related to environmental matters in 2011 and IFRS matters in 2010.
Audit Committee Pre-Approval Policies and Procedures
Since July 2005, our audit committee pre-approves all audit and non-audit services provided by our independent auditor pursuant to Sarbanes-Oxley Act of 2002 and pre-approves all audit services provided by any other public accounting firm.
ITEM 16D: Exemptions from the Listing Standards for Audit Committees
Not applicable.
ITEM 16E: Purchases of Equity Securities by the Issuer and Affiliated Purchasers
Not applicable.
ITEM 16F: Change in Registrant’s Certifying Accountants
During the years ended December 31, 2009, 2010 and 2011 and through the date of this Annual Report, the principal independent accountant engaged to audit our financial statements, PricewaterhouseCoopers (“PWC”), has not resigned, indicated that it has declined to stand for re-election after the completion of its current audit or been dismissed. For each of the years ended December 31, 2009, 2010 and 2011, PWC has not expressed reliance on another accountant or accounting firm in its report on our audited annual financial statements for such periods.
During the years ended December 31, 2009, 2010 and 2011 and through the date of this Annual Report, we have not engaged a new independent accountant as either the principal accountant to auditour financial statements, or as an independent accountant to audit a significant subsidiary and on whom the principal accountant is expected to express reliance in its report.
ITEM 16G: Corporate Governance
General summary of significant differences with regard to corporate government standards
The following paragraphs provide a brief, general summary of significant differences between corporate government practices followed by us pursuant to our home-country rules and those applicable to U.S. domestic issuers under NYSE listing standards.
Composition of the board of directors; independence. The NYSE listing standards provide that listed companies must have a majority of independent directors and that certain board committees must consist solely of independent directors. Under NYSE rule 303A.02, a director qualifies as independent only if the board affirmatively determines that such director has no material relationship with the company, either directly or indirectly. In addition, the NYSE listing standards enumerate a number of relationships that preclude independence.
126
Under the amendment to the Chilean Corporations Act, in effect as of January 1, 2010, an open-stock corporation must have at least one independent director (out of a minimum of seven directors) when its market capitalization reaches or exceeds 1.5 million Unidades de Fomento (as of March 31, 2012 approximately CLP33,800 million) and at least 12,5% of its outstanding shares with voting rights are in the possession of shareholders that individually control or possess less than 10% of such shares. In addition, the Chilean Corporation Act enumerates a number of relationships that preclude independence. The Chilean law also establishes a number of principles of general applicability designed to avoid conflicts of interests and to establish standards for related party transactions. Specifically, directors elected by a group or class of shareholders have the same duties to the company and to the other shareholders as the rest of the directors, and all transactions with the company in which a director has an interest, must be in the interest of and for the benefit of the company, compare in price, terms and conditions to those prevailing in the market at the time of its approval and comply with the requirements and procedures set forth in Chapter XVI of the Chilean Corporation Act. See “Item 7: Major Shareholders and Related Party Transactions.”
Furthermore, such transactions must be reviewed by the directors committee (as defined below); they require prior approval by the board of directors and must be disclosed at the next meeting of shareholders, unless such transactions fall within one the exemptions contemplated by the Chilean Corporations Act and, if applicable, included in the usual practice policy approved by the board of directors. See “Item 7: Major Shareholders and Related Party Transactions.” Pursuant to NYSE rule 303A.00, we may follow Chilean practices and are not required to have a majority of independent directors.
Committees.The NYSE listing standards require that listed companies have a Nominating/Corporate Governance Committee, a Compensation Committee and an Audit Committee. Each of these committees must consist solely of independent directors and must have a written charter that addresses certain matters specified by the listing standards.
Under Chilean law, the only board committee that is required is the directors committee (comité de directores), composed of three members, such committee having a direct responsibility to (a) review the company’s financial statements and the independent auditors’ report and issue an opinion on such financial statements and report prior to their submission for shareholders’ approval, (b) make recommendations to the board of directors with respect to the appointment of independent auditors and risk rating agencies, (c) review related party transactions, and issue a report on such transactions, (d) review the managers, principal executive officers’ and employees’ compensation policies and plans and (e) to prepare an annual report of the performance of its duties, including the principal recommendations to shareholders; (f) report to the board of directors the convenience of retaining non-audit services from its external auditors, if the nature of such services could impair their independence; and (g) perform other duties as defined by the company’s bylaws, by the general shareholders’ meeting or by the board.
Requirements to be deemed an independent director are set forth in “Item 6: Directors, Senior Management and Employees. Board Practices - Directors Committee.
Pursuant to NYSE Rule 303A.06, we must have an audit committee that satisfies the requirements of Rule 10A-3 under the Exchange Act by July 31, 2005. In the meeting held on February 3, 2010, our board of directors agreed to increase from three to four the number of members of the audit committee, and to appoint Mr. Philippe Pasquet as the fourth member. Therefore, the members of our audit committee were, as of March 31, 2011, Messrs. Giorgio Maschietto, Carlos Olivos, Alberto Sobredo and Philippe Pasquet, all of them meet the independence criteria contained in the Exchange Act and the NYSE Rule.
Shareholder approval of equity-compensation plans. Under NYSE listing standards, shareholders must be given the opportunity to vote on all equity-compensation plans and material revisions thereto, with limited exemptions. An “equity-compensation plan” is a plan or other arrangement that provides for the delivery of equity securities of the listed company to any employee, director or other service provider as compensation for services.
127
Under Chilean law, if previously approved by shareholders at an extraordinary shareholders’ meeting, up to ten percent of a capital increase in a publicly traded company may be set aside to fund equity-compensation plans for the company’s employees and/or for the employees of the company’s subsidiaries. Pursuant to NYSE rule 303A.00, as a foreign private issuer, we may follow Chilean practices and are not required to comply with the NYSE listing standards with respect to shareholder approval of equity-compensation plans.
Corporate Governance Guidelines. The NYSE listing standards provide that listed companies must adopt and disclose corporate governance guidelines with regard to (a) director qualifications standards; (b) director responsibilities; (c) director access to management and independent advisors; (d) director compensation; (e) director orientation and continuing education; (f) management succession; and (g) annual performance evaluation of the board.
Chilean law does not require that such corporate governance guidelines be adopted. Director responsibilities and access to management and independent advisors are directly provided for by applicable law. Director compensation is determined by the annual meeting of shareholders pursuant to applicable law. As a foreign private issuer, we may follow Chilean practices and are not required to adopt and disclose corporate governance guidelines.
Code of Business Conduct. The NYSE listing standards require that listed companies adopt and disclose a code of business conduct and ethics for directors, officers and employees, and promptly disclose any waivers of the code for directors or executive officers.
We have adopted a code of business conduct that applies generally to all of our executive officers and employees. A copy of the code of business conduct, as amended, is available in our website at www.ccu.cl.
Manual of Information of Interest to the Market. In 2008, the Superintendency of Securities and Insurance (Superintendencia de Valores y Seguros, or “SVS”) promulgated new rules which require public companies to adopt a manual regarding disclosure of information of interest to the market, board members and executives shares transactions and black out periods for such transactions. This manual applies to our directors, the directors of our subsidiaries, our executive officers, some of our employees which may be in possession of confidential, reserved or privileged information of interest, and to our advisors. The manual took effect on June 1, 2008. A copy of themanual regarding disclosure of information of interest to the market, as amended on March 18, 2010, is available in our website at www.ccu.cl.
Executive Sessions. To empower non-management directors to serve as a more effective check on management, NYSE listing standards provide that non-management directors of each company must meet at regularly scheduled executive sessions without management.
Under Chilean law, the office of director is not legally compatible with that of a company officer in publicly traded companies. The board of directors exercises its functions as a collective body and may partially delegate its powers to executive officers, attorneys, a director or a board commission of the company, and for specific purposes to other persons. As a foreign private issuer, we may follow Chilean practices and are not required to comply with the NYSE listing standard for executive sessions.
Certification Requirements. Under NYSE listing standards, Section 303A.12(a) provides that each listed company CEO must certify to the NYSE each year that he or she is not aware of any violation by the company of NYSE corporate governance listing standards and Section 303A.12(b) provides that each listed company CEO must promptly notify the NYSE in writing after any executive officer of the listed company becomes aware of any material non-compliance with any applicable provisions of Section 303A.
As a foreign private issuer, we must comply with Section 303A.12(b) of the NYSE listing standards, but we are not required to comply with 303A.12(a).
ITEM 16H: Mine Safety Disclosure
Not applicable.
128
PART III
ITEM 17: Financial Statements
The Company has responded to Item 18 in lieu of responding to this item.
ITEM 18: Financial Statements
See Annex for the Financial Statements
ITEM 19: Exhibits
Index to Exhibits
1.1 Company by-laws (incorporated by reference to Exhibit 1.1 of Compañía Cervecerías Unidas S.A. Annual Report on Form 20-F for the year ended December 31, 2001, filed on June 28, 2002).
8.1 Compañía Cervecerías Unidas S.A. significant subsidiaries (incorporated by reference to Exhibit 8.1 of Compañía Cervecerías Unidas S.A. Annual Report on Form 20-F for the year ended December 31, 2003, filed on June 24, 2004).
12.1 Certification of Chief Executive Officer of Compañía Cervecerías Unidas S.A. pursuant to Section 302 of the Sarbanes-Oxley Act of 2002.
12.2 Certification of Chief Financial Officer of Compañía Cervecerías Unidas S.A. pursuant to Section 302 of the Sarbanes-Oxley Act of 2002.
13.1 Certification of Chief Executive Officer of Compañía Cervecerías Unidas S.A. pursuant to Section 906 of the Sarbanes-Oxley Act of 2002.
13.2 Certification of Chief Financial Officer of Compañía Cervecerías Unidas S.A. pursuant to Section 906 of the Sarbanes-Oxley Act of 2002.
Index to Financial Statements and Schedules
| Page | |
Report of Independent Registered Public Accounting Firm | F-2 |
Consolidated Statement of Financial Position at December 31, 2011, 2010 and 2009 | F-6 |
Consolidated Statement of Income for each of the three years in the period endedDecember 31, 2011 | F-8 |
Statement of Changes in Equity | F-10 |
Consolidated Statement of Cash Flow for each of the three years in the period endedDecember 31, 2011 | F-11 |
Notes to the consolidated financial statements | F-12 |
129

A WORLD OF FLAVOURS
COMPAÑÍA CERVECERÍAS UNIDAS S.A. AND SUBSIDIARIES
CONSOLIDATED FINANCIAL STATEMENTS (Figures expressed in thousands of Chilean pesos)
for the year ended as of December 31, 2011 |
F - 1
|


Report of Independent Registered Public Accounting Firm
To the Board of Directors and Shareholders of Compañía Cervecerías Unidas S.A.
In our opinion, the accompanying consolidated balance sheets and the related consolidated statements of income, comprehensive income, shareholders’ equity and cash flows present fairly, in all material respects, the financial position of Compañía Cervecerías Unidas S.A. and its subsidiaries at December 31, 2011 and 2010 and the results of their operations and their cash flows for each of the three years in the period ended December 31, 2011 in conformity with International Financial Reporting Standards as issued by the International Accounting Standards Board. Also in our opinion, the Company maintained, in all material respects, effective internal control over financial reporting as of December 31, 2011, based on criteria established inInternal Control - Integrated Framework issued by the Committee of Sponsoring Organizations of the Treadway Commission (COSO). The Company's management is responsible for these financial statements, for maintaining effective internal control over financial reporting and for its assessment of the effectiveness of internal control over financial reporting, included in Management’s Report on Internal Control over Financial Reporting. Our responsibility is to express opinions on these financial statements and on the Company's internal control over financial reporting based on our integrated audits. We conducted our audits in accordance with the standards of the Public Company Accounting Oversight Board (United States). Those standards require that we plan and perform the audits to obtain reasonable assurance about whether the financial statements are free of material misstatement and whether effective internal control over financial reporting was maintained in all material respects. Our audits of the financial statements included examining, on a test basis, evidence supporting the amounts and disclosures in the financial statements, assessing the accounting principles used and significant estimates made by management, and evaluating the overall financial statement presentation. Our audit of internal control over financial reporting included obtaining an understanding of internal control over financial reporting, assessing the risk that a material weakness exists, and testing and evaluating the design and operating effectiveness of internal control based on the assessed risk. Our audits also included performing such other procedures as we considered necessary in the circumstances. We believe that our audits provide a reasonable basis for our opinions.
A company’s internal control over financial reporting is a process designed to provide reasonable assurance regarding the reliability of financial reporting and the preparation of financial statements for external purposes in accordance with generally accepted accounting principles. A company’s internal control over financial reporting includes those policies and procedures that (i) pertain to the maintenance of records that, in reasonable detail, accurately and fairly reflect the transactions and dispositions of the assets of the company; (ii) provide reasonable assurance that transactions are recorded as necessary to permit preparation of financial statements in accordance with generally accepted accounting principles, and that receipts and expenditures of the company are being made only in accordance with authorizations of management and directors of the company; and (iii) provide reasonable assurance regarding prevention or timely detection of unauthorized acquisition, use, or disposition of the company’s assets that could have a material effect on the financial statements.
F - 2
|

Because of its inherent limitations, internal control over financial reporting may not prevent or detect misstatements. Also, projections of any evaluation of effectiveness to future periods are subject to the risk that controls may become inadequate because of changes in conditions, or that the degree of compliance with the policies or procedures may deteriorate.

F - 3
|
INDEX
INDEX | 4 | |
CONSOLIDATED STATEMENT OF FINANCIAL POSITION | 6 | |
CONSOLIDATED STATEMENT OF INCOME | 8 | |
CONSOLIDATED STATEMENT OF COMPREHENSIVE INCOME | 9 | |
STATEMENT OF CHANGES IN EQUITY | 10 | |
CONSOLIDATED STATEMENT OF CASH FLOW | 11 | |
NOTE 1 GENERAL INFORMATION | 12 | |
NOTE 2 SUMMARY OF SIGNIFICANT ACCOUNTING POLICIES | 16 | |
| 2.1 | Basis of preparation | 16 |
| 2.2 | Basis of consolidation | 17 |
| 2.3 | Financial information as per operating segments | 18 |
| 2.4 | Foreign currency and unidad de fomento (Adjustable unit) | 18 |
| 2.5 | Cash and cash equivalents | 19 |
| 2.6 | Financial instruments | 19 |
| 2.7 | Financial asset impairment | 21 |
| 2.8 | Inventories | 21 |
| 2.9 | Other non-financial assets | 21 |
| 2.10 | Property, plant and equipment | 22 |
| 2.11 | Leases | 22 |
| 2.12 | Investment property | 22 |
| 2.13 | Biological assets | 23 |
| 2.14 | Intangible assets other than goodwill | 23 |
| 2.15 | Goodwill | 23 |
| 2.16 | Impairment of non-current assets other different than goodwill | 24 |
| 2.17 | Assets of a disposal group held for sale | 24 |
| 2.18 | Income tax and deferred taxes | 24 |
| 2.19 | Employees benefits | 25 |
| 2.20 | Provisions | 25 |
| 2.21 | Provisions for returns of bottles and containers | 25 |
| 2.22 | Revenue recognition | 26 |
| 2.23 | Commercial agreements with distributors and supermarket chains | 26 |
| 2.24 | Cost of sales of products | 26 |
| 2.25 | Other expenses by function | 27 |
| 2.26 | Distribution expenses | 27 |
| 2.27 | Administration expenses | 27 |
| 2.28 | Environment | 27 |
NOTE 3 ESTIMATES AND APPLICATION OF PROFESSIONAL JUDGMENT | 27 | |
NOTE 4 ACCOUNTING CHANGES | 28 | |
NOTE 5 RISK ADMINISTRATION | 28 | |
NOTE 6 FINANCIAL INSTRUMENTS | 34 | |
NOTE 7 FINANCIAL INFORMATION AS PER OPERATING SEGMENTS | 40 | |
NOTE 8 BUSINESS COMBINATIONS | 46 | |
NOTE 9 NET SALES | 47 | |
NOTE 10 NATURE OF THE COSTS AND EXPENSES | 47 | |
NOTE 11 FINANCIAL RESULTS | 48 | |
F - 4
|
NOTE 12 OTHER INCOME BY FUNCTION | 48 |
NOTE 13 OTHER GAIN AND LOSS | 49 |
NOTE 14 CASH AND CASH EQUIVALENTS | 49 |
NOTE 15 ACCOUNTS RECEIVABLES – TRADE AND OTHER RECEIVABLES | 51 |
NOTE 16 ACCOUNTS AND TRANSACTIONS WITH RELATED COMPANIES | 54 |
NOTE 17 INVENTORIES | 59 |
NOTE 18 OTHER NON-FINANCIAL ASSETS | 60 |
NOTE 19 INVESTMENTS ACCOUNTED BY THE EQUITY METHOD | 60 |
NOTE 20 INTANGIBLE ASSETS (NET) | 63 |
NOTE 21 GOODWILL | 64 |
NOTE 22 PROPERTY, PLANT AND EQUIPMENT | 65 |
NOTE 23 INVESTMENT PROPERTY | 67 |
NOTE 24 ASSETS OF DISPOSAL GROUP HELD FOR SALE | 68 |
NOTE 25 BIOLOGICAL ASSETS | 68 |
NOTE 26 INCOME TAXES AND DEFERRED TAXES | 69 |
NOTE 27 OTHER FINANCIAL LIABILITIES | 72 |
NOTE 28 ACCOUNTS PAYABLE – TRADE AND OTHER PAYABLES | 82 |
NOTE 29 PROVISIONS | 82 |
NOTE 30 OTHER NON-FINANCIAL LIABILITIES | 83 |
NOTE 31 EMPLOYEE BENEFITS | 83 |
NOTE 32 NON-CONTROLLING INTERESTS | 87 |
NOTE 33 COMMON SHAREHOLDERS’ EQUITY | 87 |
NOTE 34 EFFECTS OF CHANGES IN EXCHANGE RATE CURRENCY | 90 |
NOTE 35 CONTINGENCIES AND COMMITMENTS | 94 |
NOTE 36 ENVIRONMENT | 96 |
NOTE 37 SUBSEQUENT EVENTS | 97 |
F - 5
Compañía Cervecerías Unidas S.A. ConsolidatedStatement of Financial Position (Assets) |
|
CONSOLIDATED STATEMENT OF FINANCIAL POSITION
| ASSETS | Notes | As of December31, 2011 | As ofDecember 31,2010 |
| ThCh$ | ThCh$ | ||
| Current Assets | |||
| Cash and cash aquivalent | 14 | 177,664,378 | 151,614,300 |
| Other financial assets | 6 | 3,943,959 | 2,328,952 |
| Other non-financial assets | 18 | 11,565,924 | 9,489,913 |
| Accounts receivable-trade and other receivables | 15 | 193,065,162 | 153,013,546 |
| Accounts receivable from related companies | 16 | 9,984,206 | 6,833,634 |
| Inventories | 17 | 128,535,184 | 108,353,258 |
| Taxes receivables | 26 | 17,277,288 | 14,150,987 |
| Total current assets different from assets of disposal group held for sale | 542,036,101 | 445,784,590 | |
| Assets of disposal group held for sale | 24 | 509,675 | 497,324 |
| Total assets of disposal group held for sale | 509,675 | 497,324 | |
| Total current assets | 542,545,776 | 446,281,914 | |
| Non-current assets | |||
| Other financial assets | 6 | 194,669 | 15,813 |
| Other non-financial assets | 18 | 2,996,836 | 8,826,744 |
| Accounts receivable from related companies | 16 | 418,922 | 444,685 |
| Investment accounted by equity method | 19 | 39,923,677 | 42,596,043 |
| Intangible assets other than goodwill | 20 | 41,173,260 | 34,982,221 |
| Goodwill | 21 | 69,441,207 | 67,761,406 |
| Property, plant and equipment (net) | 22 | 556,949,110 | 508,162,219 |
| Biological assets | 25 | 18,320,548 | 16,668,630 |
| Investment property | 23 | 7,720,575 | 7,403,275 |
| Deferred tax assets | 26 | 18,806,779 | 18,546,061 |
| Total non-current assets | 755,945,583 | 705,407,097 | |
| Total Assets | 1,298,491,359 | 1,151,689,011 | |
|
The accompanying notes 1 to 37 are an integral part of these consolidated financial statements. |
F - 6
Compañía Cervecerías Unidas S.A. ConsolidatedStatement of Financial Position (Liabilities and Equity) (Figures expressed in thousands of Chilean pesos) |
|
CONSOLIDATED STATEMENT OF FINANCIAL POSITION
| LIABILITIES AND EQUITY | Notes | As of December31, 2011 | As ofDecember 31,2010 |
| LIABILITIES | ThCh$ | ThCh$ | |
| Current Liabilities | |||
| Other financial liabilities | 27 | 76,105,061 | 12,821,855 |
| Accounts payable-trade and other payables | 28 | 165,553,288 | 135,391,623 |
| Accounts payable- to related companies | 16 | 8,811,500 | 7,428,103 |
| Other short-term provisions | 29 | 1,169,126 | 992,811 |
| Tax liabilities | 26 | 16,761,406 | 8,290,713 |
| Employee benefits provisons | 31 | 13,906,409 | 11,069,052 |
| Other non-financial liabilities | 30 | 68,463,924 | 60,963,923 |
| Total current Liabilities | 350,770,714 | 236,958,080 | |
| Non-current Liabilities | |||
| Other financial liabilities | 27 | 170,955,440 | 220,145,167 |
| Accounts payable to related companies | 16 | 2,484,790 | 620,868 |
| Other long-term provisions | 29 | 13,824,021 | 11,139,891 |
| Deferred tax liabilities | 26 | 60,147,021 | 53,454,015 |
| Employee benefits provisions | 31 | 15,523,711 | 14,297,403 |
| Total non-current Liabilities | 262,934,983 | 299,657,344 | |
| Total Liabilities | 613,705,697 | 536,615,424 | |
| EQUITY | |||
| Equity attributable to equity holders of the parent | 33 | ||
| Paid-in capital | 231,019,592 | 231,019,592 | |
| Other reserves | (35,173,607) | (37,119,228) | |
| Retained earnings | 373,129,952 | 311,754,155 | |
| Subtotal equity attributable to equity holders of the parent | 568,975,937 | 505,654,519 | |
| Non-controlling interests | 32 | 115,809,725 | 109,419,068 |
| Total Shareholders' Equity | 684,785,662 | 615,073,587 | |
| Total Liabilities and Shareholders' Equity | 1,298,491,359 | 1,151,689,011 | |
The accompanying notes 1 to 37 are an integral part of these consolidated financial statements. |
F - 7
Compañía Cervecerías Unidas S.A. Consolidated Statement of Income (Figures expressed in thousands of Chilean pesos)
|
|
CONSOLIDATED STATEMENT OF INCOME
| CONSOLIDATED STATEMENT OF INCOME | Notes | For the years ended December 31, | ||
| 2011 | 2010 | 2009 | ||
| ThCh$ | ThCh$ | ThCh$ | ||
| Net Sales | 9 | 969,550,671 | 838,258,327 | 776,544,195 |
| Cost of Sales | 10 | (450,563,274) | (383,812,866) | (365,098,371) |
| Gross Margin | 518,987,397 | 454,445,461 | 411,445,824 | |
| Other income by function | 12 | 21,312,287 | 2,432,003 | 2,362,077 |
| Distribution costs | 10 | (150,071,122) | (129,079,325) | (110,020,778) |
| Administrative expenses | 10 | (77,095,019) | (63,995,182) | (67,833,191) |
| Other expenses by function | 10 | (122,373,310) | (108,544,472) | (98,571,931) |
| Other gains (losses) | 13 | 3,010,058 | 6,136,250 | 21,924,632 |
| Financial income | 11 | 7,076,849 | 2,380,886 | 2,075,957 |
| Financial costs | 11 | (14,410,911) | (10,668,587) | (12,442,847) |
| Equity and income of joint venture | 19 | 1,069,311 | 966,122 | 1,349,144 |
| Foreign currency exchange differences | 11 | (1,078,604) | (1,400,700) | (1,390,069) |
| Result as per adjustment units | 11 | (6,734,379) | (5,079,737) | 4,190,023 |
| Income before taxes | 179,692,557 | 147,592,719 | 153,088,841 | |
| Income taxes | 26 | (44,890,356) | (27,656,049) | (11,723,673) |
| Income from continued activities | 134,802,201 | 119,936,670 | 141,365,168 | |
| Net income attributable to: | ||||
| Equity holders of the parent | 122,751,594 | 110,699,515 | 128,037,473 | |
| Non-controlling interests | 32 | 12,050,607 | 9,237,155 | 13,327,695 |
| Net income of year | 134,802,201 | 119,936,670 | 141,365,168 | |
| Net income per share (Chilean pesos) from: | ||||
| Continuing operations | 385.40 | 347.56 | 402.00 | |
| Discontinued operations | - | - | - | |
| Diluted earnings per share (Chilean pesos) from: | ||||
| Continuing operations | 385.40 | 347.56 | 402.00 | |
| Discontinued operations | - | - | - | |
The accompanying notes 1 to 37 are an integral part of these consolidated financial statements.
These cosolidated financial statement include an exceptional Items as describe in Note 7, 12 and 13.
F - 8
Compañía Cervecerías Unidas S.A. Consolidated Statement of Comprehensive Income (Figures expressed in thousands of Chilean pesos) |
|
CONSOLIDATED STATEMENT OF COMPREHENSIVE INCOME
| CONSOLIDATED STATEMENT OF COMPREHENSIVE INCOME | Notes | For the years ended December 31, | ||
| 2011 | 2010 | 2009 | ||
| ThCh$ | ThCh$ | ThCh$ | ||
| Net Income | 134,802,201 | 119,936,670 | 141,365,168 | |
| Other income and expenses charged or credited againts equity | ||||
| Cash flow hedge | 33 | (239,524) | (429,445) | (6,507,854) |
| Exchange differences of foreign subsidiaries | 33 | 2,372,063 | (11,900,089) | (34,738,644) |
| Income tax related to other income components and expense charged or | 33 | 42,580 | 79,447 | 1,106,335 |
| credited against equity | ||||
| Total other comprehensive income and expense | 2,175,119 | (12,250,087) | (40,140,163) | |
| Comprehensive income and expense | 136,977,320 | 107,686,583 | 101,225,005 | |
| Comprehensive income and expense originated by: | ||||
| Equity holders of the parent (1) | 124,757,085 | 99,349,765 | 90,646,599 | |
| Non-controlling interests | 12,220,235 | 8,336,818 | 10,578,406 | |
| Comprehensive income and expense | 136,977,320 | 107,686,583 | 101,225,005 | |
| (1) Corresponds to the income (loss) for the year in case no income or expenses have been recorded directly against shareholders´s equity. | ||||
The accompanying notes 1 to 37 are an integral part of these consolidated financial statements.
These cosolidated financial statement include an exceptional Items as describe in Note 7, 12 and 13.
F - 9
Compañía Cervecerías Unidas S.A. Statement of Changes in Equity (Figures expressed in thousands of Chilean pesos) |
|
STATEMENT OF CHANGES IN EQUITY
| STATEMENT OF CHANGES IN EQUITY | Paid-in Capital | Other Reserves | Retained earnings | Equity attributable toequity holders of theparent | Non-controlling interest | Total Shareholder's Equity | |||
| Common Stock | Shares premium | Currency translation difference | Hedge reserves | Other reserves | |||||
| ThCh$ | ThCh$ | ThCh$ | ThCh$ | ThCh$ | ThCh$ | ThCh$ | ThCh$ | ThCh$ | |
| Balance as of January 1, 2009 | 215,540,419 | 15,479,173 | 15,817,197 | 6,363,663 | (10,016,131) | 200,680,243 | 443,864,564 | 104,097,806 | 547,962,370 |
| Changes | |||||||||
| Final dividends (1) | - | - | - | - | - | (8,263,070) | (8,263,070) | - | (8,263,070) |
| Interim dividends (2) | - | - | - | - | - | (19,110,172) | (19,110,172) | - | (19,110,172) |
| Interim dividends according to policy (3) | - | - | - | - | - | (44,908,565) | (44,908,565) | - | (44,908,565) |
| Other increases (decreases) in Equity | - | - | - | - | 31,700 | (31,511) | 189 | (3,699,240) | (3,699,051) |
| Comprehensive income and expense | - | - | (31,989,355) | (5,401,519) | - | 128,037,473 | 90,646,599 | 10,578,406 | 101,225,005 |
| Total changes in equity | - | - | (31,989,355) | (5,401,519) | 31,700 | 55,724,155 | 18,364,981 | 6,879,166 | 25,244,147 |
| AS OF DECEMBER 31, 2009 | 215,540,419 | 15,479,173 | (16,172,158) | 962,144 | (9,984,431) | 256,404,398 | 462,229,545 | 110,976,972 | 573,206,517 |
| Balance as of January 1, 2010 | 215,540,419 | 15,479,173 | (16,172,158) | 962,144 | (9,984,431) | 256,404,398 | 462,229,545 | 110,976,972 | 573,206,517 |
| Changes | |||||||||
| Interim dividends (2) | - | - | - | - | - | (18,473,167) | (18,473,167) | - | (18,473,167) |
| Interim dividends according to policy (3) | - | - | - | - | - | (36,876,591) | (36,876,591) | - | (36,876,591) |
| Other increases (decreases) in Equity | - | - | - | - | (575,033) | - | (575,033) | (9,894,722) | (10,469,755) |
| Comprehensive income and expense | - | - | (10,999,752) | (349,998) | - | 110,699,515 | 99,349,765 | 8,336,818 | 107,686,583 |
| Total changes in equity | - | - | (10,999,752) | (349,998) | (575,033) | 55,349,757 | 43,424,974 | (1,557,904) | 41,867,070 |
| AS OF DECEMBER 31, 2010 | 215,540,419 | 15,479,173 | (27,171,910) | 612,146 | (10,559,464) | 311,754,155 | 505,654,519 | 109,419,068 | 615,073,587 |
| Balance as of January 1, 2011 | 215,540,419 | 15,479,173 | (27,171,910) | 612,146 | (10,559,464) | 311,754,155 | 505,654,519 | 109,419,068 | 615,073,587 |
| Changes | |||||||||
| Interim dividends (2) | - | - | - | - | - | (19,428,675) | (19,428,675) | - | (19,428,675) |
| Interim dividends according to policy (3) | - | - | - | - | - | (41,947,122) | (41,947,122) | - | (41,947,122) |
| Effect business combination | - | - | - | - | - | - | - | 4,382,116 | 4,382,116 |
| Other increases (decreases) in Equity | - | - | - | - | (59,870) | - | (59,870) | (10,211,694) | (10,271,564) |
| Comprehensive income and expense | - | - | 2,133,205 | (127,714) | - | 122,751,594 | 124,757,085 | 12,220,235 | 136,977,320 |
| Total changes in equity | - | - | 2,133,205 | (127,714) | (59,870) | 61,375,797 | 63,321,418 | 6,390,657 | 69,712,075 |
| AS OF DECEMBER 31, 2011 | 215,540,419 | 15,479,173 | (25,038,705) | 484,432 | (10,619,334) | 373,129,952 | 568,975,937 | 115,809,725 | 684,785,662 |
| (1) Related to the difference between the dividends effectively paid and the provision established (50% as per current policies) at the closing date of the preceeding year. | |||||||||
The accompanying notes 1 to 37 are an integral part of these consolidated financial statements.
F - 10
Compañía Cervecerías Unidas S.A. Consolidated Statement of Cash Flow (Figures expressed in thousands of Chilean pesos) |
|
CONSOLIDATED STATEMENT OF CASH FLOW
| CONSOLIDATED STATEMENT OF CASH FLOW | Note | For the years ended December 31, | ||
| 2011 | 2010 | 2009 | ||
| ThCh$ | ThCh$ | ThCh$ | ||
| Net cash flows from (used in) operational activities | ||||
| Collection classes: | ||||
| Proceeds from goods sold and services rendered | 1,096,972,292 | 1,109,343,102 | 1,049,098,622 | |
| Other proceeds from operating activities | 20,524,955 | 21,054,319 | 15,092,344 | |
| Types of payments: | ||||
| Payments of operating activities | (671,823,189) | (743,733,742) | (656,127,896) | |
| Payments of salaries | (104,241,713) | (88,440,973) | (79,161,980) | |
| Other payments for operating activities | (147,127,916) | (130,673,513) | (139,937,632) | |
| Dividends received | 1,710,625 | 1,147,778 | 951,045 | |
| Interest paid | (12,022,016) | (9,214,835) | (9,377,031) | |
| Interest received | 6,748,317 | 1,056,066 | 3,297,780 | |
| Income tax reimbursed (paid) | (32,307,744) | (19,438,054) | (1,360,477) | |
| Other cash movements | 14 | 8,936,842 | 18,165,032 | (31,630,325) |
| Net cash flows from (used in) operational activities | 167,370,453 | 159,265,180 | 150,844,450 | |
| Cash flows from (used in) investing activities | ||||
| Proceeds from sale and investment in a subsidiary | 14 | - | - | 29,874,428 |
| Cash flows used for control of subsidiaries or other businesses | 14 | (3,257,272) | (10,646,456) | (1,036,500) |
| Cash flow used in the purchase of associates | 19 | (2,456,489) | - | - |
| Proceeds from sale of property, plant and equipment | 931,714 | 11,162,012 | 262,461 | |
| Acquisition of property, plant and equipment | (77,846,927) | (64,396,164) | (57,892,476) | |
| Others cash movements | 14 | 6,389,344 | (1,467,752) | (1,939,974) |
| Net cash flows from (used in) investing activities | (76,239,630) | (65,348,360) | (30,732,061) | |
| Cash flows from (used in) financing activities | ||||
| Proceeds from term loans | 14 | 6,680,256 | - | 118,031,844 |
| Proceeds from short-term loans | 17,963,056 | 8,570,740 | - | |
| Total amount from loans | 24,643,312 | 8,570,740 | 118,031,844 | |
| Loans to related entities | 2,722,942 | - | - | |
| Loan payments | (6,024,782) | (7,038,439) | (97,608,004) | |
| Payments of finance lease liabilities | (1,520,235) | (1,476,189) | (1,455,592) | |
| Payments of loan to related entities | (7,169,295) | (3,341,762) | (1,482,778) | |
| Dividends paid | (62,793,418) | (72,370,536) | (50,709,762) | |
| Others cash movements | 14 | (15,096,775) | (3,707,315) | (3,832,556) |
| Net cash flows from (used in) financing activities | (65,238,251) | (79,363,501) | (37,056,848) | |
| Net Increase (Decrease) in cash and cash equivalents, before the effect ofchanges in exchange rate | 25,892,572 | 14,553,319 | 83,055,541 | |
| Effects of changes in exchange rates on cash and cash equivalents | 157,506 | (292,688) | (1,001,857) | |
| Cash and cash equivalents, initial balance | 151,614,300 | 137,353,669 | 55,299,985 | |
| Cash and cash equivalents, final balance 14 | 177,664,378 | 151,614,300 | 137,353,669 | |
The accompanying notes 1 to 37 are an integral part of these consolidated financial statements.
F - 11
Compañía Cervecerías Unidas S.A. Notes to the Consolidated Financial Statements |
|
Note 1General Information
Compañía Cervecerías Unidas S.A. (CCU, or the Company or the Parent Company) was incorporated in Chile as an open stock company, and it is registered in the Securities Record of the Superintendencia de Valores y Seguros de Chile (Local Superintendence of Equity Securities, SVS) under Nº 0007, consequently, the Company is subject to Regulation by the SVS. The Company’s shares are quoted in Chile on the Santiago Stock Exchange, Electronic Stock Exchange and Valparaíso Stock Exchange. The Company is also registered with the United States of America Securities and Exchange Commission (SEC) and it quotes its American Depositary Shares (ADS) on the New York Stock Exchange (NYSE). One ADS is equivalent to 5 ordinary shares.
Through its subsidiaries, CCU produces, bottles, sells and distributes beverages. It is a multi-category company that participates in businesses such as beer, wine, spirits, cider and non-alcoholic beverages, such as soft drinks, nectars and waters. In the beer business it participates in the Chilean and Argentine markets, as well as in the wine business, where it exports to over 86 countries. Argentina is also involved in the business of cider and in the rest of the businesses the Company participates only in the Chilean market. Additionally, through the joint business Foods Compañía de Alimentos CCU S.A. (Foods) it participates in the ready-to-eat market. CCU, either directly or through its subsidiaries, sells goods or provide services to other business units such as plastic bottles and caps, shared services management, logistics, distribution of finished products and marketing services.
The Company is the largest producer, bottler and distributor of beer in Chile. CCU’s beer production and distribution includes a wide range of brands in the super premium, premium, mainstream as well as popular-priced segments, which are marketed under seven proprietary brands (or brand extensions) being the main Cristal, Escudo and Royal Guard. The main brand distributed and/or produced under license is Heineken. Beer manufacturing in Chile is carried out at the Santiago, Temuco and Valdivia plants.
The Company is the second largest beer producer in the Argentine market, with three production facilities in the cities of Salta, Santa Fé and Luján. In Argentina the Company produces and/or distributes Heineken and Budweiser beer under license, as well as proprietary brands, such as: Salta, Santa Fé, Schneider and Palermo. The Company also imports and distributes, among others, beers Negra Modelo, Corona, Guinness and Paulaner.
The Company is also a wine producer in Chile, through its subsidiary Viña San Pedro Tarapacá S.A. (“VSPT”), the second largest wine exporter in Chile, and the third largest winery in the domestic market. VSPT produces and markets ultra-premium, reserve, varietal and popular-priced wines under the brand families Viña San Pedro, Viña Tarapacá, Viña Santa Helena, Viña Misiones de Rengo, Viña Mar, Casa Rivas, Viña Altaïr, Viña Leyda, Tamarí and Finca La Celia, the two latter of Argentine origin.
The Company, through its subsidiary Embotelladora Chilenas Unidas S.A. (“ECUSA”) is one of the largest non-alcoholic beverage producers in Chile, including: soft drinks, mineral and purified water, nectars, tea, sports and energetic drink. It is bottler and distributor in Chile under its proprietary brands and of those brands produced under license. The proprietary brands include Bilz and Pap in the category of soft drinks; Cachantún and Porvenir in waters, which are operated by our subsidiary Aguas CCU-Nestlé Chile S.A. The brands under license include PepsiCo (Pepsi, Seven Up, Lipton Tea and Gatorade), Schweppes Holding Limited (Orange Crush and Canada Dry), Nestlé S.A. (Nestlé Pure Life and Perrier) and Promarca (Watts). The Company’s soft drinks, purified waters and nectar products are produced at two facilities located in Santiago and Antofagasta; its mineral waters are bottled at two plants in the central region of the country: Coinco and Casablanca.
The Company, through its subsidiary Compañía Pisquera de Chile S.A. (“CPCh”), is one of the largest pisco producers in Chile, and it also participates in the rum and ready-to-drink cocktail businesses. Company-owned brands include: Control C, Mistral and Campanario in pisco and Sierra Morena in rum. CPCh also sells and distributes Bauzá and Pernod Ricard’s products including the brands Pisco Bauzá and Havana Club, Chivas Regal and Absolut Vodka, respectively.
F - 12
Compañía Cervecerías Unidas S.A. Notes to the Consolidated Financial Statements December 31, 2011 |
|
The detail of the described licenses situation appears below:
| Main brands under license | |
| Licenses | Validity Date |
| Watt's rigid packaging, except carton | Indefinite |
| Pisco Bauzá | Indefinite |
| Budweiser for Argentina and Uruguay | December 2025 |
| Pepsi, Seven Up and Té Lipton | March 2020 |
| Crush, Canada Dry (Ginger Ale, Agua Tónica and Limón Soda) | December 2018 |
| Budweiser for Chile | December 2015 |
| Austral | September 2015 |
| Negra Modelo and Corona for Argentina | December 2014 |
| Heineken for Chile and Argentina (1) | Rolling Contract |
| Nestlé Pure Life (2) | December 2012 |
| Gatorade (3) | March 2012 |
(1) License for 10 years renewable every year automatically under identical conditions (Rolling Contract), unless notice of non-renewal.
(2) Renewable License for periods of five years, subject to compliance with the conditions agreed in the contract.
(3) Renewable License for 2 or 3 year period, subject to compliance with the conditions agreed in the contract.
The Company’s address and main office is located in Santiago city, at Avenida Vitacura Nº 2,670, Las Condes district and its tax identification number (Rut) is 90,413,000-1.
As of December 31, 2011 the Company had a total 5,758 employees according to the following detail:
| Number of employees | ||
| Parent Company | Consolidated | |
| Main Executives | 74 | 249 |
| Professionals and Techniciens | 267 | 1,529 |
| Workers | 55 | 3,980 |
| Total | 396 | 5,758 |
Compañía Cervecerías Unidas S.A. is under the control of Inversiones y Rentas S.A. (IRSA), which is the direct and indirect owner of 66.1% of the Company’ shares. IRSA is currently a joint venture between Quiñenco S.A. and Heineken Chile Limitada, a company controlled by Heineken Americas B.V, both with a 50% equity participation.
F - 13
Compañía Cervecerías Unidas S.A. Notes to the Consolidated Financial Statements December 31, 2011 |
|
The consolidated financial statements include the following significant subsidiaries direct and indirect and where the percentage of participation represents the economic interests at the consolidated level:
| Subsidiary | TAX ID | Country of origin | Functional currency | Share percentage direct and indirect | |||
| As of December 31, 2011 | As of December 31, 2010 | ||||||
| Direct | Indirect | Total | Total | ||||
| Cervecera CCU Chile Ltda. | 96.989.120-4 | Chile | Chilean peso | 99,7500 | 0,2499 | 99,9999 | 99,9999 |
| Embotelladoras Chilenas Unidas S.A. | 99.501.760-1 | Chile | Chilean peso | 96,8291 | 3,1124 | 99,9415 | 99,9415 |
| Cía. Cervecerías Unidas Argentina S.A.(1) | 0-E | Argentina | Argentinean peso | - | 99,9907 | 99,9907 | 99,9900 |
| Viña San Pedro Tarapacá S.A. (2) | 91.041.000-8 | Chile | Chilean peso | - | 49,9920 | 49,9920 | 49,9917 |
| Compañía Pisquera de Chile S.A. (3) | 99.586.280-8 | Chile | Chilean peso | 46,0000 | 34,0000 | 80,0000 | 80,0000 |
| Transportes CCU Limitada | 79.862.750-3 | Chile | Chilean peso | 98,0000 | 2,0000 | 100,0000 | 100,0000 |
| CCU Investments Limited | 0-E | Islas Cayman | Chilean peso | 99,9999 | 0,0001 | 100,0000 | 100,0000 |
| Inversiones INVEX DOS CCU Limitada | 76.126.311-0 | Chile | Chilean peso | 99,0000 | 0,9997 | 99,9997 | - |
| Financiera CRECCU S.A. | 76.041.227-9 | Chile | Chilean peso | 99,9602 | 0,0398 | 100,0000 | 99,9972 |
| Fábrica de Envases Plásticos S.A. | 86.150.200-7 | Chile | Chilean peso | 90,9100 | 9,0866 | 99,9966 | 99,9966 |
| Southem Breweries Establishment | 0-E | Vaduz-Liechtenstein | Chilean peso | 50,0000 | 49,9950 | 99,9950 | 99,9950 |
| Comercial CCU S.A. | 99.554.560-8 | Chile | Chilean peso | 50,0000 | 49,9862 | 99,9862 | 99,9859 |
| CCU Inversiones S.A. | 76.593.550-4 | Chile | Chilean peso | 98,8396 | 1,1328 | 99,9724 | 99,9719 |
| Millahue S.A. | 91.022.000-4 | Chile | Chilean peso | 99,9621 | - | 99,9621 | 99,9621 |
| Aguas CCU-Nestlé Chile S.A. (4) | 76.003.431-2 | Chile | Chilean peso | - | 50,0707 | 50,0707 | 50,0707 |
| Compañía Cervecera Kunstmann S.A. | 96.981.310-6 | Chile | Chilean peso | 50,0007 | - | 50,0007 | 50,0007 |
F - 14
Compañía Cervecerías Unidas S.A. Notes to the Consolidated Financial Statements December 31, 2011 |
|
In addition to the table presented above, below are the percentages of participation with right to vote, in each of the subsidiaries to December 31, 2011 and 2010, respectively. We note that each shareholder has one vote per share which owns or represents. The percentage of participation with voting power represents the sum of the direct participation and indirect participation via a subsidiary.
| Subsidiary | Rut | Country of origin | Functional currency | Share percentage with voting rights | |
| As of December 31, 2011 | As of December 31, 2010 | ||||
| % | % | ||||
| Cervecera CCU Chile Ltda. | 96.989.120-4 | Chile | Chilean peso | 100,0000 | 100,0000 |
| Embotelladoras Chilenas Unidas S.A. | 99.501.760-1 | Chile | Chilean peso | 99,9426 | 99,9426 |
| Cía. Cervecerías Unidas Argentina S.A.(1) | 0-E | Argentina | Argentinean peso | 100,0000 | 100,0000 |
| Viña San Pedro Tarapacá S.A. (2) | 91.041.000-8 | Chile | Chilean peso | 50,0058 | 50,0058 |
| Compañía Pisquera de Chile S.A. (3) | 99.586.280-8 | Chile | Chilean peso | 80,0000 | 80,0000 |
| Transportes CCU Limitada | 79.862.750-3 | Chile | Chilean peso | 100,0000 | 100,0000 |
| CCU Investments Limited | 0-E | Islas Cayman | Chilean peso | 100,0000 | 100,0000 |
| Inversiones INVEX DOS CCU Limitada | 76.126.311-0 | Chile | Chilean peso | 100,0000 | - |
| Financiera CRECCU S.A. | 76.041.227-9 | Chile | Chilean peso | 100,0000 | 100,0000 |
| Fábrica de Envases Plásticos S.A. | 86.150.200-7 | Chile | Chilean peso | 100,0000 | 100,0000 |
| Southem Breweries Establishment | 0-E | Vaduz-Liechtenstein | Chilean peso | 100,0000 | 100,0000 |
| Comercial CCU S.A. | 99.554.560-8 | Chile | Chilean peso | 100,0000 | 100,0000 |
| CCU Inversiones S.A. | 76.593.550-4 | Chile | Chilean peso | 99,9729 | 99,9723 |
| Millahue S.A. | 91.022.000-4 | Chile | Chilean peso | 99,9621 | 99,9621 |
| Aguas CCU-Nestlé Chile S.A. (4) | 76.003.431-2 | Chile | Chilean peso | 50,1000 | 50,1000 |
| Compañía Cervecera Kunstmann S.A. | 96.981.310-6 | Chile | Chilean peso | 50,0007 | 50,0007 |
The main movements in the ownership of the subsidiaries included in these financial statements are as follows:
(1) Compañía Cervecerías Unidas Argentina S.A. (CCU Argentina)
As explained in Note 8, on December 27, 2010, the subsidiary Compañía Industrial Cervecera S.A. (CICSA), entered in the business of cider by acquiring control of the companies Doña Aída S.A. and Don Enrique Pedro S.A. whose also own of the productive and trading companies Sáenz Briones & Cía. S.A.I.C. and C. and Sidra La Victoria S.A. Later, on April 6 and September 20, 2011, CICSA acquired the remaining shares of these companies, and as a consequence, CICSA became 100% owner in both subsidiaries. During December 2011, CICSA sold 5% of Doña Aída S.A. y Don Enrique Pedro S.A. to CCU Argentina.
On December 20, 2010, the Company, through its subsidiary Inversiones Invex CCU Limitada, acquired the 4.0353% of the stake Anheuser-Busch Investments, S.L. had in the subsidiary CCU Argentina, As a consequence the Company became 100% owner of the before mentioned subsidiaries. During March 2011, Inversiones Invex CCU Limitada sold 5% of CCU Argentina to Inversiones Invex Dos CCU Limitada.
(2)Viña Valles de Chile S.A.
As explained in Note 19, on December 29, 2011, it was concluded, through a stock swap contract, the division of the joint venture Viña Valles de Chile S.A. (VDC). As a result of this division the net assets of Viña Leyda remained in VDC and this latter company became a subsidiary of Viña San Pedro Tarapaca S.A. with a percentage of direct and indirect participation of a 100%.
F - 15
Compañía Cervecerías Unidas S.A. Notes to the Consolidated Financial Statements
|
|
(3) Compañía Pisquera de Chile S.A.
On December 2, 2011, the subsidiary Compañía Pisquera de Chile S.A. (CPCh) signed a licence agreement for the commercialization and distribution of brand of pisco Bauzá in Chile. In addition, this transaction also considers the acquisition by CPCh of 49% of the licensor society Compañía Pisquera Bauzá S.A., owner of the brand Bauzá in Chile.(See Note 19).
(4) Aguas CCU-Nestlé Chile S.A.
On June 4, 2009 Nestlé Waters Chile S.A. notified ECUSA its decision of exercising its irrevocable option to purchase an additional 29.9% of Aguas CCU-Nestlé Chile S.A. shares. Upon exercise of the option ECUSA recognized a gain on the sale of minority interest of ThCh$ 24,439,025, presented under Other gains in the Statement of Income(Note 13).
This purchase and sale operation was effected on July 9, 2009, through the payment of ThCh$ 29,874,428 for the purchase of the shares (Ch$ 9.48763 per share).
On September 30, 2009, at an Extraordinary Shareholders Meeting, Aguas CCU-Nestlé Chile S.A. (Aguas CCU) and Nestlé Waters Chile S.A. (Waters Chile), the merger by incorporation of Aguas CCU into Waters Chile was approved, resulting in the later being the controlling entity. Waters Chile was a holding company whose sole assets were its 49.401% interest in Aguas CCU.
As a consequence of the above, the shareholders of the merged company are Embotelladoras Chilenas Unidas S.A., Nestlé Chile S.A. and Comercializadora de Productos Nestlé S.A., with a 50.100%, a 49.401% and a 0.499% share respectively. The merger was recorded as from September 30, 2009, and no accounting effects were generated for its shareholders.
During the Ordinary Shareholders Meeting of Nestlé Waters Chile S.A. held on July 8, 2009, the Shareholders approved the change of the name Nestlé Waters Chile S.A. to Aguas CCU-Nestlé Chile S.A.
Note 2 Summary of significant accounting policies
Significant accounting policies adopted for the preparation of these consolidated financial statements are described below:
2.1 Basis of preparation
The accompanying consolidated financial statements have been prepared and are in compliance with the International Financial Reporting Standards (IFRS), issued by the International Accounting Standard Board (IASB) which have been applied uniformly to the periods presented.
The consolidated financial statements cover the following periods: Statement of Financial Position as of December 31, 2011 and 2010, Statement of changes in Equity, Statement of Income, Statement of Comprehensive Income and Statement of Cash Flow for the years ended December 31, 2011, 2010 and 2009.
The amounts shown in the attached financial statements are expressed in thousands of Chilean pesos, which is the Company’s functional currency. All amounts have been rounded to thousand pesos, except when otherwise indicated.
The consolidated financial statements have been prepared on the historical basis, as modified by the revaluation of financial assets and financial liabilities (including derivative instruments) at fair value through profit and loss.
The preparation of the consolidated financial statements in accordance with IFRS requires the use of certain significant accounting critical estimates. It also requires that management use its professional judgment in the process of applying the Company’s accounting policies. SeeNote 3 for disclosure of significant accounting estimates and judgments.
At the date of issuance of these consolidated financial statements Amendments, Improvements and Interpretations to the existing standards have been published which have come into force during the financial year 2011 and the Company has adopted and implemented as appropriate. These were made mandatory from the following dates:
F - 16
Compañía Cervecerías Unidas S.A. Notes to the Consolidated Financial Statements
|
|
| New Standard Improvements and Amendments | Mandatory for years beginning in: | ||
| IFRIC 14 Amendment | Prepayments of in a minimum level of funding requeriment | January 1, 2011 | |
| IAS 24 Revised | Related Party Disclosures | January 1, 2011 | |
| IFRS 7 | Financial Instruments: Disclosures | July 1, 2011 | |
The adoption of these standards, as per their mandatory application date, had no significant impact on the consolidated financial statements.
Also, at the date of issuance of these consolidated financial statements, Amendments, Improvements and Interpretations to the existing standards have been published, which are not yet effective and the Company has not early adopted. The following standards are required to be applied as from the dates indicated below:
| New Standard Improvements and Amendments | Mandatory for years beginning in: | |
| Amendment IAS 12 | Deferred tax | January 1, 2012 |
| Amendment IAS 1 | Presentation of Financial Statements | July 1, 2012 |
| Amendment IFRS 7 | Disclosures - Offsetting Financial Assets and Financial Liabilities | January 1, 2013 |
| IFRS 10 | Consolidation of Finantial Statements | January 1, 2013 |
| IFRS 11 | Joint Arrangements | January 1, 2013 |
| IFRS 12 | Disclosure of Interest in Other Entities | January 1, 2013 |
| IFRS 13 | Fair Value Measurement | January 1, 2013 |
| Amendment IAS 19 | Employee Benefits | January 1, 2013 |
| Amendment IAS 27 | Separete Financial Statements | January 1, 2013 |
| Improvement IAS 28 | Investments in Associates and Join Ventures | January 1, 2013 |
| IFRS 9 | Financial instruments: Classification and Measurement | January 1, 2015 |
The Company estimates that the adoption of the aforedescribed Standards, Amendments and Interpretations will not have a material impact on the consolidated financial statements of the group at their initial application.
2.2 Basis of consolidation
Subsidiaries
Subsidiaries are the entities over which the Company is empowered to direct financial and operational policies, which is generally the result of ownership of over half the voting rights. Subsidiaries are consolidated as from the date on which the control was transferred to the Company, and they are excluded from consolidation as of the date of termination of such control.
The acquisition method is used for the accounting of acquisition of subsidiaries. The acquisition cost is the fair value of the assets delivered, of the equity instruments issued and of the liabilities incurred or assumed as of the exchange date. The identifiable assets acquired, as well as the identifiable liabilities and contingencies assumed in a business combination are initially valued at their fair value on the acquisition date, independently from the scope of minority interests.Goodwill is initially measured as the excess of the aggregate of the consideration transferred and the fair value of non controlling interest over the net identifiable assets acquired and liabilities assumed. If this consideration is lower than the fair value of the net assets of the subsidiary acquired, the difference is recognized in profit or loss.
Transaction
Inter-company transactions, balances and unrealized gains from transactions between the Group’s entities are eliminated during consolidation. Unrealized losses are also eliminated, unless the transaction provides evidence of an impairment of the asset transferred. Whenever necessary to ensure uniformity with the policies adopted by the Company, the subsidiaries’ accounting policies are amended.
F - 17
Compañía Cervecerías Unidas S.A. Notes to the Consolidated Financial Statements
|
|
Non-controlling Interest
The non-controlling interest is presented in the Equity section of the Statement of Financial Position. The net income attributable to equity holder of the parent and the non-controlling interest are each disclosed separately in the Consolidated Statement of Income after net income.
Investments accounted by the equity method
Joint ventures and associates
The company maintains investments in joint venture and they correspond to a contractual agreement by which two or more parties carry out an economic activity that is subject to a joint control, and normally involves the establishment of a separate entity in which each party has a share, based on a shareholders’ agreement. In addition the Company maintains investments in associates which are defined as those entities that investor has no significant influence and is not a subsidiary or is a joint venture.
The Company accounts for its participation in joint ventures and associates using the equity method. The financial statements of the joint ventures and associates, in which the Company participates, are prepared for the same year, using accounting policies consistent with those of the Company. Adjustments are made to conform any different accounting policies that may exist.
Whenever the Company contributes or sells assets to the companies under joint control or associate, any part of the income or loss originated by the transaction is recognized based on how the asset is realized. Whenever the Company purchases assets of such companies, it does not recognize its share in the income or loss of the joint venture or associate as regards to such transaction until the asset is sold or realized.
2.3 Financial information as per operating segments
The Company’s operating segments are formed by the assets and resources intended to supply products that are subject to risks and benefits different from those of other operating segments, and that normally correspond to subsidiaries that develop such business activities and which EBIT (Earnings Before Interest and Taxes) and EBITDA (Earnings Before Interest, Taxes, Depreciation and Amortization) are regularly reviewed by its respective the Board of Directors of the respective subsidiaries and by the Board of Directors, in order to make decisions on the resources to be allotted to the segments and to appraise their performance(See Note 7).
The segments performance is appraised according to several indicators, of which EBIT, EBITDA, EBITDA margin (EBITDA’s % as compared to total income), the volume and Sales Income are the most important. Sales between segments are carried out at arm’s length and the net sales information as per geographical location is based on the producing and selling entity location.
2.4 Foreign currency and unidad de fomento (Adjustable unit)
Presentation and functional currency
The Company uses the Chilean peso ($ or CLP) as its functional currency and for the presentation of its financial statements. The functional currency has been determined considering the economic environment in which the Company carries out its operations and the currency in which the main cash flows are generated. The functional currency of the Argentine subsidiaries is the Argentine peso.
Transactions and balances
Transactions in foreign currency and adjustable units (“Unidad de Fomento” or “UF”) are initially recorded at the exchange rate of the corresponding currency or adjustable unit as of the date on which the transaction occurs. The Unidad de Fomento (UF) is a Chilean inflation-indexed, peso-denominated monetary unit. The UF rate is set daily in advance based on changes in the previous month’s inflation rate. At the close of each Balance Sheet the monetary assets and liabilities denominated in foreign currencies and adjustable units are translated into Chilean pesos at the exchange rate of the corresponding currency or adjustable unit. The exchange difference arising, both from the liquidation of foreign currency transactions, as well as from the valuation of foreign currency monetary assets and liabilities, is included in statement of income, in the Exchange Rate Difference caption, while the difference arising from the changes in adjustable units are recorded in the statement of income as per Adjusment Units.
F - 18
Compañía Cervecerías Unidas S.A. Notes to the Consolidated Financial Statements
|
|
For consolidation purposes, the assets and liabilities of the subsidiaries whose functional currency is different from the Chilean peso are translated into Chilean pesos by using the exchange rates valid as of the date of the financial statements, and the exchange differences originated by the translation of the assets and liabilities are recorded in Equity Reserve, under the Currency Translation Reserves item. The income and expense are translated at the monthly average exchange rate for the corresponding terms, since there have not been significant fluctuations in the exchange rate during each month.
The exchange rates of the main foreign currencies and adjustment units used in the preparation of the consolidated financial statements as of December, 2011, 2010 and 2009 are as follows:
| Chilean Pesos as per unit of foreign currency or adjustable unit | As ofDecember 31,2011 | As ofDecember 31,2010 | As ofDecember 31,2009 | |
| Ch$ | Ch$ | Ch$ | ||
| Foreign currencies | ||||
| US Dollar | USD | 519.20 | 468.01 | 507.10 |
| Euro | EUR | 672.97 | 621.53 | 726.82 |
| Argentine Peso | ARS | 120.63 | 117.71 | 133.48 |
| Canadian Dollar | CAD | 511.12 | 467.87 | 481.12 |
| Sterling Pound | GBP | 805.21 | 721.01 | 814.49 |
| Swiss Franc | CHF | 553.64 | 499.37 | 489.10 |
| Australian Dollar | AUD | 531.80 | 474.56 | 453.09 |
| Danish Krone | DKK | 90.53 | 83.39 | 97.69 |
| Japanese Yen | JPY | 6.74 | 5.73 | 5.48 |
| Brazilian Real | BRL | 278.23 | 281.31 | 290.94 |
| Adjustment Units | ||||
| Unidad de fomento * | UF | 22,294.03 | 21,455.55 | 20,942.88 |
* The Unidad de Fomento (UF) is a Chilean inflation-indexed, peso-denominated monetary unit. The UF rate is set daily in advance based on changes in the previous month´s inflation rate.
2.5 Cash and cash equivalents
Cash and cash equivalents includes cash available, bank balances, time deposits at financial entities, investments in mutual funds and financial instruments acquired under re-sale agreements, as well as short-term investments with a high liquidity, normally with an original maturity of up to three months.
2.6 Financial instruments
Financial assets
The Company recognizes a financial asset in its consolidated statement of financial position according to the following:
As of the date of the initial recognition, Management classifies its financial assets (i) at fair value through profit and loss and (ii) collectible credits and accounts, depending on the purpose for which the financial assets were acquired. For those instruments not classified at fair value through income, any cost attributable to the transaction is recognized as part of the asset value.
The fair value of the instruments that are actively quoted in formal markets is determined by the quoted price as of the financial statement closing date. For those investments without an active market the fair value is determined using valuation techniques, among them (i) the use of recent market transactions, (ii) references to the current market value of another financial instrument of similar characteristics, (iii) discounted cash flow, and (iv) other valuation models.
After the initial recognition, the Company values the financial assets as described below:
Financial assets at fair value through profit and loss
These assets are valued at fair value and the income or losses originated by the fair value variation are recognized in the Consolidated Statement of Income.
F - 19
Compañía Cervecerías Unidas S.A. Notes to the Consolidated Financial Statements
|
|
The assets at fair value through profit and loss include financial assets classified as held for trading by the Company. Financial assets are classified as held for trading when acquired with the purpose of selling them within a short term. Derivative instruments are classified as held for trading unless they are classified as hedge instruments.
Accounts receivable
The accounts receivables correspond to financial assets with fixed or determinable payments that are not traded in an active market. The trade receivable credits or accounts are recognized according to the invoice value.
The estimated losses from bad debts are determined by applying differentiated percentages, taking into account maturity factors, until reaching a 100% of the balance in most of the debts older than 180 days, with the exception of those cases that in accordance with current policies, losses are estimated due to partial deterioration based on a case by case analysis.
The current trade receivable credits and accounts are initially recognized at their nominal value and are not discounted because they do not differ significantly from its fair value. The Company has determined that the calculation of the amortized cost is not materiality different from the invoiced amount, because the transaction does not have significant associated costs.
Financial liabilities
The Company recognizes a financial liability in its consolidated statement of financial position according to the following:
Debts and financial liabilities that accrue interests
Loans and financial obligations accruing interest are initially recognized at the fair value of the resources obtained, less costs incurred directly attributable to the transaction. After initial recognition, loans and obligations accruing interest are valued at their amortized cost. The difference between the net amount received and the value to be paid is recognized in the Consolidated Statement of Income during the term of the loan, using the effective interest rate method.
Interest paid and accrued related to debts and obligations used in the financing of its operations appear under financial expense.
Loans and obligations accruing interest with a maturity within the next twelve month period are classified as current liabilities, unless the Company has the unconditional right to defer the payment of the obligation for at least a twelve month period after the financial statement closing date.
Trade accounts payable and other payables
Accounts payable and other accounts payable are initially recognized at their nominal value, because they do not differ significantly from fair value. The Company has determined that no significant difference exist from not calculating amortized cost using the effective interest method.
Derivative Instruments
All derivative financial instruments are initially recognized as of the date of the agreement, and then revalued at their fair value as of the date of the financial statements. Gains and losses resulting from the fair value measurement are recorded in the Statement of Income as gain or losses due to fair value of financial instruments, unless the derivative instrument qualifies, is designated and be effective as a hedging instrument.
In order to classify a derivative as a hedging instrument for accounting purposes, the Company documents (i) as of the transaction date or at designation time, the relationship or correlation between the hedging instrument and the hedged item, as well as the risk management purposes and strategies, (ii) the assessment, both at designation date as well as on a continuing basis, whether the instrument used is effective to offset changes in fair value or in the cash flow of the hedged item. A hedge is considered effective when changes in the fair value or in the cash flow of the underlying directly attributable to the risk hedged are offset with the changes in fair value, or in the cash flow of the hedging instrument with effectiveness between 80% to 125%.
Derivative instruments classified as hedges are accounted for as cash flow hedges.
F - 20
Compañía Cervecerías Unidas S.A. Notes to the Consolidated Financial Statements
|
|
The total fair value hedging derivatives are classified as assets or financial liabilities in Other non-current if the maturity of the hedged item is more than 12 months and as other assets or current liabilities if the remaining maturity of the hedged item is less than 12 months. The effect on results of these instruments can be viewed in Other gains (losses) of the Consolidated Statements of Income.
The effective portion of the change in the fair value of derivative instruments that are designated and qualified as cash flow hedges is initially recognized in Cash Flow Hedge Reserve, in a separate component of Equity. The income or loss related to the ineffective portion is immediately recognized in the statement of income. The amounts accumulated in Equity are reclassified in Income during the same period in which the corresponding hedged item is reflected in the Statement of Income. When a cash flow hedge ceases to comply with the hedge accounting criteria, any accumulated income or loss existing in Equity remains in Equity and is recognized when the expected transaction is finally recognized in the Statement of Income. When it is estimated that an expected transaction will not occur, the accumulated gain or loss recorded in Equity is immediately recognized in the Statement of Income.
2.7 Financial asset impairment
At each financial statement date the Company assesses if a financial asset or financial group of assets is impaired.
The Company assesses impairment of accounts receivable collectively, grouping the financial assets according to similar risk characteristics, which indicate the debtor’s capacity to comply with their obligations under the conditions agreed upon. When there is objective evidence that a loss due to impairment has been incurred in the accounts receivable, the loss amount is recognized in the Consolidated Statement of Income, under the Administration Expense item.
In the event that during subsequent periods the impairment loss amount decreases and such decrease may be objectively related to an event occurring after impairment recognition, the impairment loss previously recognized is reversed.
Any subsequent impairment reversal is recognized in Income provided that the book value of the asset does not exceed its value as of the date the impairment was recognized.
2.8 Inventories
Inventories are stated at the lower of cost (acquisition or production cost) and net realizable value. The production cost of finished products and of products under processing includes raw material, direct labor, indirect manufacturing expenses based on a normal operational capacity and other costs incurred to place the products at the locations and in the conditions necessary for sale, net of discounts attributable to inventories.
The net realizable value is the estimated sale price in the normal course of business, less marketing and distribution expenses. When market conditions cause the production cost to be higher than its net realizable value, an allowance for asset’s deterioration is registered for the difference in value. This allowance for asset’s deterioration also includes amounts related to obsolete items due to a low turnover, technical obsolescence and products withdrawn from the market.
The inventories and cost of products sold is determined using the FIFO (First in First Out) method. The Company estimates that most of the inventories have a turnover of less than a year.
The materials and raw materials purchased from third parties are valued at their acquisition cost; once used, they are incorporated in finished products using the FIFO methodology.
Costs associated with agricultural activities (winery) are deferred up to the harvest date, at which such time they become part of inventory cost for subsequent processes.
2.9 Other non-financial assets
Other non-financial assets mainly include disbursements related to commercial advertising preparation that is in process but has not yet been shown, advances to property, plant and equipment suppliers and current and non-current advertising agreements.
F - 21
Compañía Cervecerías Unidas S.A. Notes to the Consolidated Financial Statements
|
|
2.10 Property, plant and equipment
Property, plant and equipment are recorded at their historic cost, less accumulated depreciation and impairment losses. The cost includes both the disbursements directly attributable to the asset acquisition or construction, as well as the financing interest directly related to certain qualified assets, which are capitalized during the construction or acquisition period, as long as these assets qualify for these purposes considering the period necessary to complete and prepare the assets to be operative. Disbursements after the purchase or acquisition are only capitalized when it is likely that the future economic benefits associated to the investment flow towards the Company, and costs may be reasonably measured. Subsequent disbursements related to repairs and maintenance are recorded as expense when incurred.
Property, plant and equipment depreciation, including the assets under financial lease, is calculated on a straight line basis over the estimated useful life of the fixed assets, taking into account their estimated residual value. When an asset is formed by significant components with different useful lives, each part is separately depreciated. The Property, plant and equipment useful lives and residual values estimates are reviewed and adjusted at each financial statement closing date, if necessary.
Property, plant and equipment estimated useful lives are as follows:
| Type of Assets | Number of years |
| Land | Indefinite |
| Buildings and Construction | 20 to 60 |
| Machinery and equipment | 10 to 25 |
| Furniture and accesories | 5 to 10 |
| Other equipment (coolers and mayolicas) | 5 to 8 |
| Bottles and containers | 3 to 12 |
Gain and losses resulting from the sale of properties, plants and equipment, are calculated comparing their book values against the related sales proceeds and are included in the Consolidated Statement of Income.
When the book value of an item of Property, plant and equipment exceeds its recoverable amount, it is immediately reduced to its recoverable amount (See Note 2.16).
2.11 Leases
Lease agreements are classified as financial leases when the agreement transfers to the Company substantially all the risks and benefits inherent to the asset ownership, according to International Accounting Standard No. 17 “Leases”. For those agreements that qualify as financial leases, at the initial date an asset and a liability are recognized at a value equivalent to the lower between the fair value the asset and the present value of future lease payments. Later, lease payments are allocated between the financial expense and the obligation reduction, so that a constant interest rate on the obligation balance is obtained.
Lease agreements that do not qualify as financial leases are classified as operating leases. Lease payments of operating leases are charged to income on a straight line basis over the life of the lease.
2.12 Investment property
Investment property consists of land held by the Company with the purpose of generating appreciation, and not to be used in the normal course of business, and it is recorded at historic cost less impairment loss, if any. Investment property depreciation is calculated on a straight line basis over the estimated useful life of such property, taking into account their estimated residual value of such property.
F - 22
Compañía Cervecerías Unidas S.A. Notes to the Consolidated Financial Statements
|
|
2.13 Biological assets
Biological assets held by Viña San Pedro Tarapacá S.A. (VSPT or the Company) and its subsidiaries consist in vines under formation and under production. The harvested grapes are used for the later production of wines.
Vines under production are valued at the historic cost, less depreciation and any impairment loss. Agricultural production (grapes) resulting from the vines under production is valued at its cost value when harvested.
Depreciation of under production vines is recorded on a straight-line basis, and it is based on the 25-years estimated production useful life, which is periodically assessed. Vines under formation are not depreciated until they start production.
Costs incurred in acquiring and planting new vines are capitalized.
The Company uses the amortized historical cost to value its biological assets, on that basis management considers that it represents a reasonable approximation of fair value.
2.14 Intangible assets other than goodwill
Commercial Trademarks
The Company’s commercial trademarks correspond to intangible assets with an indefinite useful life that are presented at their historic cost, less any impairment loss. The Company believes that through marketing investments trademarks maintain their value, consequently they are considered as having an indefinite useful life and they are not amortizable. Such assets are subject to impairment tests on a yearly basis, or when factors exist indicating a likely loss of value(Note 2.16).
Software Programs
Software Programs licenses acquired are capitalized at the value of the costs incurred for their acquisition and preparation for the use of the specific programs. Such costs are amortized over their estimated useful lives (4 to 7 years). The maintenance costs of the software programs are recognized as expense of the year during which they are incurred.
Research and development
The research and development expense is recognized as an expense in the period incurred.
Water Rights
The Water Rights acquired by the Company correspond to the existing exploitation rights of water from natural sources, and they were recorded at their attributed cost as of the transition date. Given that such rights are perpetual they are not amortizable, nevertheless they are annually subject to impairment assessment, or when factors exist that indicate a likely loss of value.
2.15 Goodwill
Goodwill represents the excess of cost of a business combination over the Company’s share in the fair value of identifiable assets, liabilities and contingent liabilities as of the acquisition date, and it is accounted for at its cost value less accumulated impairment losses. Goodwill related to joint venture acquisitions is included in the investment accounting value.
For the purposes of impairment tests, goodwill is assigned to the Cash Generating Units (CGU) that are expected to benefit from the synergies of a business combination. Each unit or group of units (CGU -See Note 21) represents the lowest level inside the Company at which goodwill is monitored for internal administration purposes, which is not larger than a business segment. The cash generating units to which the goodwill is assigned are tested for impairment annually or with a higher frequency, when there are signs indicating that a cash generating unit could experience impairment, or some of the significant market conditions have changed.
Goodwill in the acquisition of joint ventures is assessed for impairment as part of the investment, provided that there are signs indicating that the investment may be impaired.
F - 23
Compañía Cervecerías Unidas S.A. Notes to the Consolidated Financial Statements
|
|
An impairment loss is recognized for the amount that the book value of the cash generating unit exceeds its recoverable value, the recoverable value being the highest between the fair value of the cash generating unit, less costs to sell and its value in use.
An impairment loss is first assigned in goodwill to reduce its book value, and then to other assets in the cash generating unit. A recognized impairment loss is not reversed in the following years.
2.16 Impairment of non-current assets other different than goodwill
The Company annually assesses the existence of impairment indicators on non-current assets. When indicators exist, the Company estimates the recoverable amount of the impaired asset. In case it is not possible to estimate the recoverable amount of the impaired asset at an individual level, the Company estimates the recoverable amount of the cash generating unit to which the asset belongs.
The recoverable amount is defined as the highest between the fair value, less cost to sell and the value in use. The use value is determined by estimating future cash flows associated with the asset or with the cash generating unit, discounted from its current value by using interest rates before taxes, which reflect the time value of money and the specific risks of the asset. In the event the asset book value exceeds its recoverable amount, the Company records an impairment loss in the Statement of Income.
The Company annually assesses if impairment indicators of non-current assets for which impairment losses were recorded during prior years have disappeared or decreased. In the event of such a situation, the recoverable amount of the specific asset is recalculated and its book value increased, if necessary. Such increase is recognized in the Statement of Income as reversal of impairment losses. The increase in the value of the previously impaired asset is recognized only when it is originated by changes in the assumptions used to calculate the recoverable amount. The asset amount increase resulting from the reversal of the impairment loss is limited to the amount that would have been recorded had impairment not occurred.
2.17 Assets of a disposal group held for sale
Property, plant and equipment expected to be recovered primarily through sale rather than through continuing use, for which active sale negotiations have begun and it is estimated that they will be sold within twelve months following the closing date are classified as assets of a disposal group held for sale.
These assets are measured at the lower of their book value and the estimated fair value, less costs to sell. From the moment in which the assets are classified as assets of a disposal group held for sale they are no longer depreciated.
2.18 Income tax and deferred taxes
Income tax is composed by the legal obligations and the deferred taxes recognized according to International Accounting Standard Nº 12 – Income Taxes. Income tax is recognized in the Statement of Income, except when it is related to entries directly recorded in Equity, in which case the tax effect is also recognized in Equity.
Income Tax Obligation
Income tax obligations are recognized in the financial statements on the basis of the best estimates of the taxable profits as of the financial statement closing date, and the income tax rate valid as of that date in the countries where the Company operates, which are Chile and Argentina.
Deferred Tax
Deferred taxes are those the Company expects to pay or to recover in the future, due to temporary differences between the book value of assets and liabilities (carrying amount for financial reporting purposes) and the corresponding tax basis of such assets and liabilities used to determine the profits subject to taxes. Deferred tax assets and liabilities are generally recognized for all temporary differences, and they are calculated at the rates that will be valid on the date the liabilities are paid or the assets realized.
Deferred tax is recognized for temporary differences arising from investments in subsidiaries and associates, except in those cases where the Company is able to control the date on which temporary differences will be reversed, and it is likelythat they will not be reverted in the foreseeable future. Deferred tax assets, including those originated by tax losses are recognized provided it is likely that in the future there are taxable profits against which deductible temporary differences may be charged, as well as unused tax losses.
F - 24
Compañía Cervecerías Unidas S.A. Notes to the Consolidated Financial Statements
|
|
Deferred tax assets and liabilities are offset when there exists a legal right to offset tax assets against tax liabilities, and the deferred tax is related to the same taxable entity and the same taxing authority.
2.19 Employees benefits
Employees Vacation
The Company accrues the expense associated with staff vacation when the employee earns the benefit.
Employees Bonuses
The Company recognizes a liability and an expense for bonuses when it’s contractually obligated, it is estimated that, depending on the income requirement at a given date, bonus will be paid out at the end of the year.
Severance Indemnity
The Company recognizes a liability for the payment of irrevocable severance indemnities, originated by the collective and individual agreements entered into with employees. Such obligation is determined based on the actuarial value of the accrued cost of the benefit, a method which considers several factors in the calculation, such as estimates of future continuance, mortality rates, future salary increases and discount rates. The determined value is shown at its present value by using the accrued benefits for years of service method. The discount rates are determined by reference to market interest rates curves. The current losses and gains originated by the valuation of the liabilities subject to such plans are directly recorded in Income.
2.20 Provisions
Provisions are recognized when: (i) the Company has a current obligation, legal or implicit, as a result of past events, (ii) it is probable that monetary resources will be required to settle the obligation and (iii) the amounts can be reasonably established. The amounts recognized as provisions as of financial statements closing date, are Management´s best estimates, and consider the necessary disbursements to liquidate the obligation.
The concepts by which the Company establishes provisions against Income correspond to civil, labor and taxation proceedings that could affect the Company. Additionally, the liability generated by the bottles and containers deposits is considered as a provision(Note 29).
2.21 Provisions for returns of bottles and containers
In Chile, the provisions for returns of bottles and containers (glass and plastic returnable bottle and craters) delivered to sales channels for selling and distributing products is determined by means of the outstanding bottles and containers estimated to be returned to the Company, based on yearly physical counts and historic experience, valued at the weighted average of the prior year deposits, plus the value of the deposits placed during the current year as per each kind of bottles and containers.
Such obligation is mainly disclosed in non-current liabilities as the estimated payment is beyond one year. Such liability is not discounted, since it is considered a payable on sight, with the original invoice and the return of the respective container, and it does not have adjustability or interest clauses of any kind in its origin.
The adjustment is based on an estimate that is carried out by counting the bottles held by customers and adding an estimate of the number of bottles in hands of the final consumers. This estimate is based on independent studies and historical information regarding the return of these bottles.
In Argentina, all companies use the same returnable bottles and do not require a deposit, because bottles are provided to the customers using a contract on consignment.
F - 25
Compañía Cervecerías Unidas S.A. Notes to the Consolidated Financial Statements
|
|
2.22 Revenue recognition
Revenues are recognized when it is likely that economic benefits flow to the Company and can be measured reliably. Income is measured at the fair value of the economic benefits received or to be received, and they are presented net of valued added taxes, specific taxes, returns, discounts and rebates.
Sales of goods are recognized after the Company has transferred to buyer all the risks and benefits inherent in the ownership of such goods, and it does not hold the right to dispose of them; in general, this means that sales are recorded at the transfer of risks and benefits to clients, pursuant to the terms agreed in the commercial agreements.
Sale of products in the domestic market
The Company obtains its revenues mainly from the sales, both in Chile and Argentina, of beers, soft drinks, mineral waters, purified water, nectars, wines, cider and spirits, products that are distributed through retail establishments, wholesale distributors and supermarket chains. None of them act as commercial agents of the Company. Such sales income in the domestic markets, net of the value added tax, specific taxes, returns, discounts and rebates to clients, are recognized when products are delivered, together with the transfer of all risks and benefits related to them.
Exports
In general, the Company´s delivery conditions for sale are basis for revenue recognition related to exports.
The structure of income recognition is based on the grouping of Incoterms, mainly in the following groups:
• "FOB (Free on Board) shipping point", by which buyer organizes and pays for transportation, consequently the sales occur and revenue is recognized upon the delivery of merchandise to the transporter hired by buyer.
• “CIF (Cost, Insurance & Freight) and similar", by which the Company organizes and pays for external transportation and some other expenses, although CCU ceases being responsible for the merchandise after delivering it to the maritime or air company in accordance with the relevant term. The sales occur and revenue is recognized upon the delivery of the merchandise at the port of destination.
In the event of discrepancies between the commercial agreements and delivery conditions those established in the agreements shall prevail.
2.23 Commercial agreements with distributors and supermarket chains
The Company enters into commercial agreements with its clients, distributors and supermarkets through which they establish: (i) volume discounts and other client variables, (ii) promotional discounts that correspond to an additional rebate on the price of the products sold by reason of commercial initiatives development (temporary promotions), (iii) services payment and rendering of counter-services (advertising and promotion agreements, use of preferential spaces and others) and (iv) shared advertising, which corresponds to the Company’s participation in advertising campaigns, promotion magazines and opening of new sales locations.
Volume discounts and promotional discounts are recognized as a reduction in the sales price of the products sold. Shared advertising contributions are recognized when the advertising activities agreed upon with the distributor have been carried out, and they are recorded as marketing expenses incurred, under Other expenses by function.
The commitments with distributors or importers in the exports area are recognized on the basis of existing trade agreements.
2.24 Cost of sales of products
The costs of sales include the production cost of the products sold and other costs incurred to place the inventories in the locations and under the conditions necessary for the sale. Such costs mainly include raw material costs, packing costs, production staff labor costs, production-related assets depreciation, returnable bottles depreciation, license payments and operational cost and plant and equipment maintenance costs.
F - 26
Compañía Cervecerías Unidas S.A. Notes to the Consolidated Financial Statements
|
|
2.25 Other expenses by function
Other expenses by function include, mainly advertising and promotion expenses, depreciation of assets sold, selling expenses, marketing costs (sets, signs, neon signs at client’s facilities) and marketing and sales staff remuneration and compensations.
2.26 Distribution expenses
Distribution costs include all the necessary costs to deliver products to clients.
2.27 Administration expenses
Administration expenses include the support units staff remuneration and compensation, depreciation of offices, equipment, facilities and furniture used for these functions, non-current assets amortization and other general and administration expenses.
2.28 Environment
Environmental liabilities are recorded based on the current interpretation of environmental laws and regulations, or when an obligation is likely to occur and the amount of such liability can be calculated reliably.
Disbursements related to environmental protection are charged to the Consolidated Statements of Income as incurred, except, investments in infrastructure designed to comply with environmental requirements, are recorded following the accounting policies for property, plant and equipment .
Note 3Estimates and application of professional judgment
Financial statement preparation requires estimates and assumptions from Management affecting the amounts included in the consolidated financial statements and their related notes. The estimates made and the assumptions used by the Company are based on the historical experience, the changes in the industry and the information supplied by external qualified sources. Nevertheless, final results could differ from the estimates under certain conditions.
Significant estimates and accounting policies are defined as those that are important to correctly reflect the Company’s financial position and income, and/or those that require a high judgment level by Management.
The main estimates and professional judgments are related to the following concepts:
• The valuation of goodwill acquired to determine the existence of losses due to potential impairment(Note 2.15 and Note 21).
• The valuation of commercial trademarks to determine the existence of potential losses due to potential impairment (Note 2.14 and Note 20).
• The assumptions used in the current calculation of liabilities and obligations to employees(Note 2.19 and Note 31).
• Useful life of property, plant and equipment (Note 2.10 and Note 22), biological assets (Note 2.13 and Note 25) and intangibles (software programs) (Note 2.14 and Note 20).
• The assumptions used for the calculation of financial instrument fair value(Note 2.6 and Note 6).
• The occurrence likelihood and the liabilities amount in an uncertain or contingent manner(Note 2.20, Note 29,
Such estimates are based on the best available information on the events analyzed to date of these consolidated financial statements.
However, it is possible that events that may occur in the future result in adjustments to such estimates, which would be done prospectively.
F - 27
Compañía Cervecerías Unidas S.A. Notes to the Consolidated Financial Statements
|
|
Note 4Accounting changes
During the year ended on December 31, 2011, there have been no changes in the use of accounting principles or relevant changes in any accounting estimates with regard to the previous years that have affected these consolidated financial statements.
Note 5 Risk Administration
Risk administration
In those companies without a significant non-controlling interest, the Company’s Administration and Finance Officer provides a centralized service for the group’s companies to obtain financing and administration of exchange rate, interest rate, liquidity, inflation, raw material and loan risks. Such activity operates according to a policies and procedures framework, which is regularly reviewed to comply with the purpose of administrating the risk originated by the business needs.
In those companies with a significant non-controlling interest (VSPT, CPCH, Aguas CCU-Nestlé and Cervecera Kunstmann) each Administration and Finance Officer exercises such responsibility. When necessary, the Board of Directors has the final responsibility for establishing and reviewing the risk administration structure, as well as for the review of the significant changes made to the risk administration policies, receiving information related to their activities.
According to the financial risk policies, the Company uses derivative instruments only for the purpose of covering exposures to the interest rate and exchange rate risks originated by the Company’s operations and its financing sources. The Company does not acquire derivative facilities with speculative or investment purposes nevertheless, some derivatives are not treated as hedge for accounting purposes because they do not qualify as such. Transactions with derivative instruments are exclusively carried out by staff under the Finance Management and the Internal Audit Management regularly reviews the control environment of this function. The relationship with Credit Rating Agencies and the monitoring of financial restrictions (covenants) are also administered by the Finance Management.
The Company’s main risk exposure is related to the exchange rates, interest rates, inflation and raw material prices (commodities), client’s accounts receivable and liquidity. For the purpose of containing the risk originated by such exposures, several financial instruments are used.
For each of the following, where applicable, the sensitivity analysis developed are for illustrative purposes, since in practice the sensitized variables rarely change without affecting each other and without affecting other factors that were considered as constants.
Exchange rate risk
The Company is exposed to exchange rate risks originated by: a) its net exposure to foreign currency assets and liabilities, b) exports sales, c) the purchase of raw material, products and capital investments effected in foreign currencies, or indexed in such currencies, and d) the net investment of subsidiaries in Argentina. The Company’s greatest exchange rate exposure is the variation of the Chilean peso as compared to the US dollar, euro, sterling pound and Argentine peso.
As of December 31, 2011, the Company maintained foreign currency obligations amounting to ThCh$ 78,152,511 (ThCh$ 52,560,458 in 2010), mostly denominated in US dollars. Foreign currency obligations accruing variable interest (ThCh$ 51,998,403 in 2011 and ThCh$ 32,785,328 in 2010) represent 21% (15% in 2010) of the total of such obligations. The remaining 79% (85% in 2010) is denominated in inflation-indexed Chilean pesos (see inflation risk section). The ThCh$ 78,152,511 foreign currency obligations include loans for US$ 70 million (ThCh$ 36,381,447 in 2011 and ThCh$ 32,785,328 in 2010) which are hedged by currency and interest rate hedge agreements, converting such debts in fixed interest rate inflation-adjusted obligations in Chilean pesos. In addition, the Company maintains foreign currency assets for ThCh$ 43,099,381 (ThCh$ 25,049,513 in 2010) that mainly correspond to exports accounts receivable.
Regarding the Argentine subsidiaries operations, the liability net exposure in US dollars and other currencies amounts to ThCh$ 2,199,284 (ThCh$ 5,245,182 in 2010).
To protect the value of the foreign currency assets and liabilities net position of its Chilean operations, the Company enters into derivative agreements (currency forwards) to ease any variation in the Chilean peso as compared to other currencies.
F - 28
Compañía Cervecerías Unidas S.A. Notes to the Consolidated Financial Statements
|
|
As of December 31, 2011, the Company’s assets (liabilities) net exposure in foreign currencies in Chile, after the use of derivative instruments, is a liability amounted to ThCh$ 1,789,322 (ThCh$ 1,532,631 in 2010).
Of the Company’s total sales, both in Chile and Argentina, 9% (11% in 2010) corresponds to export sales made in foreign currencies, mainly US dollars, euro, pound sterling, and of the total costs 60% (61% in 2010) corresponds to raw material and products purchased in foreign currencies, or indexed to such currencies. The Company does not hedge the eventual variations in the expected cash flows from such transactions.
On the other hand, the Company is exposed to the exchange rate movements related to the conversion from Argentine pesos to Chilean pesos of the income, assets and liabilities of its subsidiaries in Argentina. The Company does not hedge the risks related to the subsidiaries conversion, which effects are recorded in Equity.
As of December 31, 2011, the net investment in Argentine subsidiaries amounted to ThCh$ 94,073,030 (ThCh$ 86,527,472 in 2010).
Exchange rate sensitivity analysis
The exchange rate differences effect recognized in the Consolidated Statement of Income for the year ended as of December 31, 2011, related to the foreign currency denominated assets and liabilities, was a loss of ThCh$ 1,078,604 (ThCh$ 1,400,700 in 2010 and ThCh$ 1,390,069 in 2009). Considering the exposure as of December 31, 2011, and assuming a 10% increase or decrease in the exchange rate, and maintaining constant all the rest of the variables, such as interest rates, it is estimated that the effect over the Company’s income would be income (loss) after taxes of ThCh$ 143,146 (income (loss) of ThCh$ 127,208 in 2010 and 48,101 in 2009).
Considering that approximately 9% of the Company’ sales relates to export sales carried out in Chile, in currencies different from the Chilean peso, and that in Chile approximately 56% (57% in 2010 and 60% in 2009) of the costs are indexed to the US dollar, and assuming that the Chilean peso will be appreciated or (depreciated) by 10% as compared to the set of foreign currencies, when maintaining constant the rest of the variables the hypothetical effect on the Company’s income would be income (loss) after taxes of ThCh$ 8,807,019 (income (loss) from ThCh$ 5,623,470 in 2010 and ThCh$ 4,977,427 in 2009).
The net investment maintained in subsidiaries that operate in Argentina amounts to ThCh$ 94,073,030 as of December 31, 2011 (ThCh$ 86,527,472 in 2010). Assuming a 10% increase or decrease in the Argentine peso exchange rate as compared to the Chilean peso, and maintaining constant all the rest of the variables, the aforesaid increase (decrease) would hypothetically result in income (loss) of ThCh$ 9,407,303 (income (loss) ThCh$ 8,652,747 in 2010 and ThCh$ 8,608,943 in 2009) recorded as a credit (charge) against equity.
Interest rates risk
The interest rate risk is mainly originated by the Company’s financing sources. The main exposure is related to LIBOR variable interest rate indexed obligations.
As of December 31, 2011, the Company had a total ThCh$ 51,998,403 in debt indexed to LIBOR (ThCh$ 32,785,328 as of December 31, 2010). Consequently, as of December 31, 2011, the company’s financing structure is made up (without considering the effects of cross currency swaps effect) of approximately 21% (15% in 2010) debt with variable interest rates, and 79% (85% in 2010) debt with fixed interest rates.
To administer the interest rate risk, the Company has an interest rate administration policy that intends to reduce the volatility of its financial expense, and to maintain an ideal percentage of its debt in fixed rates instruments. The financial position is mainly set by the use of short-term and long-term debt, as well as derivative instruments such as cross currency interest rate swaps.
As of December 31, 2011, after considering the effect of interest rates and currency swaps, approximately 98% (100% in 2010) of the Company’s long-term debt has fixed interest rates.
The terms and conditions of the Company’s obligations as of December 31, 2011, including exchange rates, interest rates, maturities and effective interest rates are detailed inNote 27.
F - 29
Compañía Cervecerías Unidas S.A. Notes to the Consolidated Financial Statements
|
|
Interest rates sensitivity analysis
The total financial expense recognized in the Consolidated Statement of Income for the twelve month ended period as of December 31, 2011, related to short-term and long-term debts amounted to ThCh$ 14,410,911 (ThCh$ 10,668,587 in 2010 and ThCh$ 12,442,847 in 2009). Whereas only 2% of total debt (net of derivatives) is subject to variable interest rate, assuming an increase or decrease in interest rates in pesos and U.S. dollars of approximately 100 basis points, and keeping all other variables constant, such as the exchange rate, the increase (decrease) above hypothetically result in a loss (gain) of ThCh$ 57,374 (at December 31, 2010 and 2009 we were 100% covered against rate fluctuations interest) in the Consolidated Statement of Income.
Inflation risk
The Company maintains a series of Unidad de Fomento* (UF) indexed agreements with third parties, as well as UF indexed financial debt, which means that the Company is exposed to the UF fluctuations, generating increases in the value of the agreements and inflation adjustable liabilities, in the event it experiences growth. This risk is mitigated by the fact that the Company’s policy is to maintain its unit income in UF constant, according to the conditions allowed by the market.
* The Unidad de Fomento (UF) is a Chilean inflation-indexed, peso-denominated monetary unit. The UF rate is set daily based on changes in the previous month´s inflation rate.
Inflation sensitivity analysis
The income for total adjustment unit recognized in the consolidated statement of comprehensive income for the twelve month ended as of December 31, 2011, related to UF indexed short-term and long-term debt, and resulted in a loss ThCh$ 6,734,379 (ThCh$ 5,079,737 in 2010 and a profit of ThCh$ 4,190,023 in 2009). Assuming a reasonably possible increase (decrease) of the Unidad de Fomento by approximately 3% and maintaining constant all the rest of the variables, such as interest rates, the aforementioned increase (decrease) would hypothetically result in a loss (income) of ThCh$ 6,132,818 (ThCh$ 6,288,142 in 2010 and ThCh$ 6,661,378 in 2009) in the Consolidated Statement of Income.
Raw material price risk
The main exposure to the raw material price variation is related to the barley and malt supply for the production of beer, concentrates, sugar and plastic containers used in the production of soft drinks, bulk wine and grapes for the manufacturing of wine and spirits.
Barley and malt
In Chile the Company obtains its barley and malt supply from local producers and from the international market. Long-term supply agreements are entered into with local producers, where the barley price is set annually according to the market prices, which is used to determine the malt price according to the agreements. The purchases and commitments made expose the Company to a raw material price fluctuation risk. During 2011 the Company purchased 12,000 tons (27,000 tons in 2010) of barley and 24,300 tons (30,052 tons in 2010) of malt. On the other hand, CCU Argentina acquires the whole demand of malt from local producers. Such raw material represents approximately 29% (29% in 2010 and 30% in 2009) of the beer direct cost.
Concentrates, Sugar and plastic containers
The main raw materials used in the production of non-alcoholic beverages are concentrates, which are mainly acquired from licensees, sugar and plastic resin for the manufacturing of plastic bottles and containers. The Company is exposed to price fluctuation risks of these raw materials, which jointly represent 55% (52% in 2010 and 61% in 2009) of the direct cost of non-alcoholic beverages. The Company does not carry out hedging activities over these raw material purchases.
Grapes and wine
The main raw materials used by the subsidiary VSPT for wine production are its own production grapes and third-party grapes and wine. Approximately 47% (48% in 2010) of the export wine supply comes from its own vineyards, thus reducing the effect of price volatility and ensuring the products quality consistence. Approximately 90% (92% in 2010 and 95% in 2009) of the wine or grape supply for the wine for local market is acquired from third parties.
F - 30
Compañía Cervecerías Unidas S.A. Notes to the Consolidated Financial Statements
|
|
During 2011, the subsidiary VSPT acquired 65% (57% in 2010) of the necessary grapes and wine from third parties through fixed price agreements. In addition, it also occasionally effects spot price (or cash price) transactions, depending on its needs.
Raw material price sensitivity Analysis
The total direct cost in the consolidated statement of income for 2011 amounts to ThCh$ 372,626,307 (ThCh$ 275,058,113 in 2010 and ThCh$ 261,973,067 in 2009). Assuming a reasonably possible increase (decrease) in the direct cost of each segment of 8% and maintaining constant all the rest of the variables, such as exchange rates, the aforesaid increase (decrease) would hypothetically result into a loss (income) of ThCh$ 6,783,393 (ThCh$ 6,175,942 in 2010 and ThCh$ 6,181,816 in 2009) for Beer Chile, ThCh$ 4,867,084 (ThCh$ 3,510,028 in 2010 and ThCH$ 3,221,765 in 2009) for Beer Argentina, ThCh$ 7,655,225 (ThCh$ 6,581,027 in 2010 and ThCH$ 6,104,023 in 2009) for non-alcoholic beverages, ThCh$ 6,076,016 (ThCh$ 5,607,456 in 2010 and ThCh$ 5,100,349 in 2009) for Wines and ThCh$ 1,825,378
(ThCh$ 1,368,445 in 2010 and ThCH$ 1,283,360 in 2009) for Spirits.
Credit risk
The credit risk to which the Company is exposed is mainly originated by a) the commercial accounts receivable maintained with retail clients, wholesale distributors and supermarket chains of domestic markets; b) accounts receivable from exports; and c) financial facilities maintained with Banks and financial institutions, such as sight deposits, mutual funds investments, facilities acquired under resale commitment and derivative financial facilities.
Domestic market
The credit risk related to commercial collectible accounts of domestic markets is administered by the Loan and Collection Administration Officer, and it is monitored by the Loan Committee of each business unit. The Company has a wide client base that is subject to the policies, procedures and controls established by the Company. The loan limits are established for all clients on the basis of an internal qualification and payment performance. The pending for payment commercial accounts receivable are regularly monitored. In addition, the Company acquires loan insurances covering 90% of the individually significant accounts receivable balances, a coverage that as of December 31, 2011, amounts to 84% (83% as of December 31, 2010) of the total accounts receivable.
Overdue but not impaired commercial accounts receivable correspond to clients that show delays of less than 18.1 days (18.3 days in 2010).
As of December 31, 2011, the Company had approximately 811 clients (694 clients as of December 31, 2010) indebted in over Ch$ 10 million each that together represent approximately 85% (84% in 2010) of the total commercial accounts receivable. There were 194 clients (171 clients as of December 31, 2010) with balances over Ch$ 50 million each, representing approximately 74% (73% in 2010) of the total accounts receivable. The 92% (92% in 2010) of such accounts receivable are covered by the aforesaid loan insurance, or by mortgage guarantees.
The Company believes that no additional credit risk provisions are needed to the individual and collective provisions determined at December 31, 2011, since as mentioned above a large percentage of these are covered by insurance.
Exports market
The loan risk related to accounts receivable for exports is administered by VSPT Head of Loan and Collection, and it is monitored by VSPT Administration and Finance Officer. The Company has a large client base, in over eighty countries, which are subject to the policies, procedures and controls established by the Company. In addition, the Company acquires loan insurance covering 98% (96% in 2010) of the individually significant accounts receivable, a coverage that as of December 31, 2011, amounts to 81% (80% in 2010) of the total accounts receivable. Pending payment of commercial accounts receivable are regularly monitored. Apart from the loan insurance, the fact of having diversified sales in different countries decreases the loan risk.
As of December 31, 2011, there were 78 clients (62 clients in 2010) indebted for over Ch$ 65 million each, which represent 88% (84% in 2010) of the total accounts receivable of the export market.
Overdue but not impaired commercial accounts receivable correspond to clients that show delays of less than 28 days (44 days in 2010).
F - 31
Compañía Cervecerías Unidas S.A. Notes to the Consolidated Financial Statements
|
|
The Company estimates that no loan risk provisions are necessary in addition to the individual and collective provisions determined as of December 31, 2011. See analysis of accounts receivables maturities and losses due to impairment of accounts receivables (Note 15).
The Company has policies limiting the counterparty loan risk exposure as regards financial institutions, and such exposures are frequently monitored. Consequently, the Company does not have loan risk concentrations with financial institutions that should be considered significant as of December 31, 2011.
F - 32
Compañía Cervecerías Unidas S.A. Notes to the Consolidated Financial Statements
|
|
Liquidity risk
The Company administers liquidity risk at a consolidated level, the cash flows originated by its operational activities being the main liquidity source. Additionally, the Company has the ability to issue debt and equity instruments in the capital market according to their needs.
To manage short-term liquidity, the Company considers projected cash flows for a twelve months moving period and maintains cash and cash equivalents available to meet its obligations.
Based on the current operational performance and its liquidity position, the Company estimates that the cash flows originated by operating activities and the cash available shall be sufficient to finance working capital, capital investments, interest payments, dividend payments and debt payment requirements for the next 12-month period and the foreseeable future.
A summary of the Company’s financial liabilities and financial liabilities originated by derivatives with their maturities as of December 31, 2011 and 2010, based on the non discounted contractual cash flows appears below:
| As of December 31, 2011 | Book value | Contractual flows maturities | |||
| Less than 1year | Between 1 and5 years | More than 5years | Total | ||
| ThCh$ | ThCh$ | ThCh$ | ThCh$ | ThCh$ | |
| Financial Liabilities | |||||
| Bank borrowings | 74,089,495 | 66,634,850 | 8,546,233 | - | 75,181,083 |
| Bonds payable | 151,973,634 | 8,481,485 | 94,631,248 | 89,435,285 | 192,548,018 |
| Financial leases obligations | 16,078,576 | 1,558,994 | 6,002,130 | 28,318,094 | 35,879,218 |
| Sub-Total | 242,141,705 | 76,675,329 | 109,179,611 | 117,753,379 | 303,608,319 |
| Derivative financial liabilities | |||||
| Liability coverage | 4,513,397 | 5,649,112 | 97,631 | - | 5,746,743 |
| Derivative hedge liabilities | 405,399 | 626,632 | - | - | 626,632 |
| Sub-Total | 4,918,796 | 6,275,744 | 97,631 | - | 6,373,375 |
| Total | 247,060,501 | 82,951,073 | 109,277,242 | 117,753,379 | 309,981,694 |
View current and non current book value in Note 6.
| As of December 31, 2010 | Book value | Contractual flows maturities | |||
| Less than 1year | Between 1 and5 years | More than 5years | Total | ||
| ThCh$ | ThCh$ | ThCh$ | ThCh$ | ThCh$ | |
| Financial Liabilities | |||||
| Bank borrowings | 48,551,296 | 6,535,438 | 43,994,210 | - | 50,529,648 |
| Bonds payable | 160,899,845 | 9,489,737 | 97,994,944 | 100,066,247 | 207,550,928 |
| Financial leases obligations | 15,856,614 | 1,494,201 | 5,152,353 | 29,329,197 | 35,975,751 |
| Sub-Total | 225,307,755 | 17,519,376 | 147,141,507 | 129,395,444 | 294,056,327 |
| Derivative financial liabilities | |||||
| Liability coverage | 6,275,325 | 751,978 | 7,335,018 | - | 8,086,996 |
| Derivative hedge liabilities | 1,383,942 | 1,383,942 | - | - | 1,383,942 |
| Sub-Total | 7,659,267 | 2,135,920 | 7,335,018 | - | 9,470,938 |
| Total | 232,967,022 | 19,655,296 | 154,476,525 | 129,395,444 | 303,527,265 |
View current and non current book value in Note 6.
F - 33
Compañía Cervecerías Unidas S.A. Notes to the Consolidated Financial Statements
|
|
Note 6Financial Instruments
Financial instruments categories
The following are the book values of each financial instrument category at the closing of each year:
| As of December 31, 2011 | As of December 31, 2010 | |||
| Current | Non current | Current | Non current | |
| ThCh$ | ThCh$ | ThCh$ | ThCh$ | |
| Cash and cash equivalents | 177,664,378 | - | 151,614,300 | - |
| Other financial assets | 3,943,959 | 194,669 | 2,328,952 | 15,813 |
| Accounts receivable trade and other receivable (net) | 193,065,162 | - | 153,013,546 | - |
| Accounts receivable from related companies | 9,984,206 | 418,922 | 6,833,634 | 444,685 |
| Total financial assets | 384,657,705 | 613,591 | 313,790,432 | 460,498 |
| Bank borrowings | 66,488,280 | 7,601,215 | 5,829,482 | 42,721,814 |
| Bonds payable | 4,311,026 | 147,662,608 | 5,086,821 | 155,813,024 |
| Financial leases obligations | 479,928 | 15,598,648 | 431,007 | 15,425,607 |
| Derivatives | 405,399 | - | 1,383,942 | - |
| Derivative hedge liabilities | 4,420,428 | 92,969 | 90,603 | 6,184,722 |
| Total Other non-financial liabilities (*) | 76,105,061 | 170,955,440 | 12,821,855 | 220,145,167 |
| Account payable - trade and other payable | 165,553,288 | - | 135,391,623 | - |
| Accounts payable to related entities | 8,811,500 | 2,484,790 | 7,428,103 | 620,868 |
| Total financial liabilities | 250,469,849 | 173,440,230 | 155,641,581 | 220,766,035 |
| (*) See Note 27 Others financial liabilities. | ||||
F - 34
Compañía Cervecerías Unidas S.A. Notes to the Consolidated Financial Statements
|
|
Financial instruments fair value
The following tables show the fair values, based on the financial instrument categories, as compared to the book value included in the consolidated statements of financial position:
a) Composition of financial assets and liabilities:
| As of December 31, 2011 | As of December 31, 2010 | |||
| Book Value | Fair Value | Book Value | Fair Value | |
| ThCh$ | ThCh$ | ThCh$ | ThCh$ | |
| Cash and cash equivalents | 177,664,378 | 177,664,378 | 151,614,300 | 151,614,300 |
| Other financial assets | 4,138,628 | 4,138,628 | 2,344,765 | 2,344,765 |
| Accounts receivable trade and other receivable (net) | 193,065,162 | 193,065,162 | 153,013,546 | 153,013,546 |
| Accounts receivable from related companies | 10,403,128 | 10,403,128 | 7,278,319 | 7,278,319 |
| Total financial assets | 385,271,296 | 385,271,296 | 314,250,930 | 314,250,930 |
| Bank borrowings | 74,089,495 | 73,841,032 | 48,551,296 | 49,574,990 |
| Bonds payable | 151,973,634 | 145,222,665 | 160,899,845 | 166,550,557 |
| Financial leases obligations | 16,078,576 | 18,197,614 | 15,856,614 | 19,906,919 |
| Derivatives | 405,399 | 405,399 | 1,383,942 | 1,383,942 |
| Derivative hedge liabilities | 4,513,397 | 4,513,397 | 6,275,325 | 6,275,325 |
| Total Other non-financial liabilities | 247,060,501 | 242,180,107 | 232,967,022 | 243,691,733 |
| Accounts payable - trade and others payable | 165,553,288 | 165,553,288 | 135,391,623 | 135,391,623 |
| Accounts payable to related companies | 11,296,290 | 11,296,290 | 8,048,971 | 8,048,971 |
| Total financial liabilities | 423,910,079 | 419,029,685 | 376,407,616 | 387,132,327 |
The book value of current accounts receivable, cash and cash equivalent and other financial assets and liabilities approximate fair value due to the short-term nature of such facilities, and in the case of accounts receivable, due to the fact that any collection loss is already reflected in the impairment loss provisions.
The fair value of non derivative financial assets and liabilities that are not quoted in active markets is estimated through the use of discounted cash flows calculated on market variables observed as of the date of the financial statements. The fair value of derivative instruments is estimated through the discount of future cash flows, determined according to information observed in the market, or to variables and prices obtained from third parties.
b) Financial instruments as per category:
| As of December 31, 2011 | Fair value withchanges inincome | Cash and cashequivaletnsand Loans andaccountsreceivables | Hedgederivatives | Total |
| ThCh$ | ThCh$ | ThCh$ | ThCh$ | |
| Assets | ||||
| Derivative financial instruments | 2,607,349 | - | 396,459 | 3,003,808 |
| Marketable securities and Investment in other companies | 1,134,820 | - | - | 1,134,820 |
| Total Others financial assets | 3,742,169 | - | 396,459 | 4,138,628 |
| Cash and cash equivalents | - | 177,664,378 | - | 177,664,378 |
| Accounts receivable trade and other receivable (net) | - | 193,065,162 | - | 193,065,162 |
| Accounts receivable from to related companies | - | 10,403,128 | - | 10,403,128 |
| Total | 3,742,169 | 381,132,668 | 396,459 | 385,271,296 |
F - 35
Compañía Cervecerías Unidas S.A. Notes to the Consolidated Financial Statements
|
|
| As of December 31, 2011 | Fair value withchanges inincome | Hedgederivatives | Financialliabilitiesmeasured atamortized cost | Total |
| ThCh$ | ThCh$ | ThCh$ | ThCh$ | |
| Liabilities | ||||
| Bank borrowings | - | - | 74,089,495 | 74,089,495 |
| Bonds payable | - | - | 151,973,634 | 151,973,634 |
| Financial leases obligations | - | - | 16,078,576 | 16,078,576 |
| Derivative financial instruments | 405,399 | 4,513,397 | - | 4,918,796 |
| Total Others financial liabilities | 405,399 | 4,513,397 | 242,141,705 | 247,060,501 |
| Accounts payable - trade and other payable | - | - | 165,553,288 | 165,553,288 |
| Accounts payable to related entities | - | - | 11,296,290 | 11,296,290 |
| Total | 405,399 | 4,513,397 | 418,991,283 | 423,910,079 |
| As of December 31, 2010 | Fair value withchanges inincome | Cash and cashequivaletns and Loans and accountsreceivables | Hedgederivatives | Total |
| ThCh$ | ThCh$ | ThCh$ | ThCh$ | |
| Assets | ||||
| Derivative financial instruments | 968,785 | - | - | 968,785 |
| Marketable securities and Investment in other companies | 1,375,980 | - | - | 1,375,980 |
| Total others financial assets | 2,344,765 | - | - | 2,344,765 |
| Cash and cash equivalents | - | 151,614,300 | - | 151,614,300 |
| Accounts receivable trade and other receivable (net) | - | 153,013,546 | - | 153,013,546 |
| Accounts receivable from related companies | - | 7,278,319 | - | 7,278,319 |
| Total | 2,344,765 | 311,906,165 | - | 314,250,930 |
| As of December 31, 2010 | Fair value withchanges inincome | Hedge derivatives | Financialliabilitiesmeasured atamortized cost | Total |
| ThCh$ | ThCh$ | ThCh$ | ThCh$ | |
| Liabilities | ||||
| Bank borrowings | - | - | 48,551,296 | 48,551,296 |
| Bonds payable | - | - | 160,899,845 | 160,899,845 |
| Financial leases obligations | - | - | 15,856,614 | 15,856,614 |
| Derivative financial instruments | 1,383,942 | 6,275,325 | 7,659,267 | |
| Total others financial liabilities | 1,383,942 | 6,275,325 | 225,307,755 | 232,967,022 |
| Accounts payable - trade and other payable | - | - | 135,391,623 | 135,391,623 |
| Accounts payable to related entities | - | - | 8,048,971 | 8,048,971 |
| Total | 1,383,942 | 6,275,325 | 368,748,349 | 376,407,616 |
F - 36
Compañía Cervecerías Unidas S.A. Notes to the Consolidated Financial Statements
|
|
Derivative Instruments
The detail of maturities, number of derivative agreements, contracted nominal amounts, fair values and the classification of such derivative instruments as per type of agreement at the closing of each year is as follows:
| As of December 31, 2011 | As of December 31, 2010 | |||||||
| Number Agreements | Nominal thousand | Asset | Liability | Number Agreements | Nominal thousand | Asset | Liability | |
| ThCh$ | ThCh$ | ThCh$ | ThCh$ | |||||
| Cross currencyinterest rate swapsUSD/EURO | 1 | 4,461 | 201,928 | - | - | - | - | - |
| Less than a year | 1 | 4,461 | 201,928 | - | - | - | - | - |
| Between 1 and 5 years | - | - | - | - | - | - | - | - |
| More than 5 years | - | - | - | - | - | - | - | - |
| Cross currencyinterest rate swapsUSD/EURO | 1 | 4,476 | 194,531 | 35,005 | - | - | - | - |
| Less than a year | - | 40 | - | 35,005 | - | - | - | - |
| Between 1 and 5 years | 1 | 4,436 | 194,531 | - | - | - | - | - |
| More than 5 years | - | - | - | - | - | - | - | - |
| Cross currencyinterest rate swapsUSD/UF | 1 | 70,089 | - | 4,306,834 | 1 | 70,053 | - | 6,275,325 |
| Less than a year | 1 | 70,089 | - | 4,306,834 | - | 53 | - | 90,603 |
| Between 1 and 5 years | - | - | - | - | 1 | 70,000 | - | 6,184,722 |
| More than 5 years | - | - | - | - | - | - | - | - |
| Cross interest rateswaps USD/USD | 1 | 10,091 | - | 171,558 | - | - | - | - |
| Less than a year | - | 91 | - | 78,590 | - | - | - | - |
| Between 1 and 5 years | 1 | 10,000 | - | 92,968 | - | - | - | - |
| More than 5 years | - | - | - | - | - | - | - | - |
| Forwards USD | 23 | 59,609 | 2,532,570 | 390,213 | 21 | 55,776 | 556,773 | 1,237,761 |
| Less than a year | 23 | 59,609 | 2,532,570 | 390,213 | 21 | 55,776 | 556,773 | 1,237,761 |
| Between 1 and 5 years | - | - | - | - | - | - | - | - |
| More than 5 years | - | - | - | - | - | - | - | - |
| Forwards Euro | 9 | (57) | 67,807 | 8,406 | 12 | (4,425) | 347,900 | 145,922 |
| Less than a year | 9 | (57) | 67,807 | 8,406 | 12 | (4,425) | 347,900 | 145,922 |
| Between 1 and 5 years | - | - | - | - | - | - | - | - |
| More than 5 years | - | - | - | - | - | - | - | - |
| Forwards CAD | 4 | 2,480 | 3,642 | 6,545 | 5 | (2,230) | 12,979 | - |
| Less than a year | 4 | 2,480 | 3,642 | 6,545 | 5 | (2,230) | 12,979 | - |
| Between 1 and 5 years | - | - | - | - | - | - | - | - |
| More than 5 years | - | - | - | - | - | - | - | - |
| Forwards GBP | 4 | 1,438 | 3,330 | 235 | 3 | (1,145) | 51,133 | 259 |
| Less than a year | 4 | 1,438 | 3,330 | 235 | 3 | (1,145) | 51,133 | 259 |
| Between 1 and 5 years | - | - | - | - | - | - | - | - |
| More than 5 years | - | - | - | - | - | - | - | - |
| Total investmentderivative instrument | 44 | 3,003,808 | 4,918,796 | 42 | 968,785 | 7,659,267 | ||
Such derivative agreements have been entered into as a hedge of exchange rate risk exposure. In the case of forwards, the Company does not comply with the formal requirements for them to be classified as hedging instruments; consequently their effects are recorded in Income, in Other gain (loss), separately from the hedged item.
F - 37
Compañía Cervecerías Unidas S.A. Notes to the Consolidated Financial Statements
|
|
In the case of Cross Currency Interest Rate Swaps and Cross Interest Rate Swap, these qualify as cash flow hedges of the flows related to the liability of the loan from BBVA S.A. New York Branch and the loans from Banco de Chile, disclosed inNote 27.
| As of December 31, 2011 | |||||||
| Entity | Nature of risks covered | Rights | Obligations | Fair value of net asset (liabilities) | Maturity | ||
| Currency | ThCh$ | Currency | ThCh$ | ThCh$ | |||
| Banco BBVA | Interest rate flow and exchange rate in loans | USD | 36,602,431 | UF | 40,909,265 | (4,306,834) | 11.23.2012 |
| Banco de Chile | Interest rate flow and exchange rate in loans | USD | 2,318,851 | EUR | 2,116,924 | 201,928 | 07.11.2012 |
| Banco de Chile | Interest rate flow and exchange rate in loans | USD | 2,341,092 | EUR | 2,181,566 | 159,526 | 07.11.2016 |
| Banco de Chile | Interest rate flow in loans | USD | 5,278,465 | USD | 5,450,024 | (171,558) | 07.07.2016 |
| As of December 31, 2010 | |||||||
| Entity | Nature of risks covered | Rights | Obligations | Fair value of net asset (liabilities) | Maturity | ||
| Currency | ThCh$ | Currency | ThCh$ | ThCh$ | |||
| Banco BBVA | Interest rate flow and exchange rate in loans | USD | 33,197,990 | UF | 39,473,315 | (6,275,325) | 11.23.2012 |
The Consolidated Statement of Other Comprehensive Income includes under the caption cash flow hedge, for the years ended December 31, 2011, 2010 and 2009, a debit after income taxes of ThCh$ 239,524, ThCh$ 429,445 and ThCh$ 6,507,854, respectively, relating to the fair value of the Cross Currency Interest Swap derivative instruments.
Fair value hierarchies
The financial instruments recorded at fair value in the Statement of Financial Position are classified as follows, depending on the method to obtain their fair value:
Level 1 Fair value obtained through direct reference to quoted prices, without any adjustment.
Level 2 Fair value obtained through the use of valuation models accepted in the market and based on prices different from those of Level 1, which may be directly or indirectly observed as of the measurement date (adjusted prices).
Level 3 Fair value obtained through internally developed models or methodologies that use information which may not be observed, or which is illiquid.
F - 38
Compañía Cervecerías Unidas S.A. Notes to the Consolidated Financial Statements
|
|
At the closing of each year, the Company determined the fair value for its financial facilities recorded at fair value in the Statement of Financial Position, as follows:
| As of December 31, 2011 | Recorded FairValue | Fair Value Hierarchy | ||
| ThCh$ | Level 1 | Level 2 | Level 3 | |
| ThCh$ | ThCh$ | ThCh$ | ||
| Derivative financial instruments | 2,607,349 | - | 2,607,349 | |
| Market securities and investments in other companies | 1,134,820 | 1,134,820 | - | |
| Derivative hedge assets | 298,415 | 298,415 | ||
| Fair value financial assets | 4,040,584 | 1,134,820 | 2,905,764 | |
| Derivative hedge liabilities | 4,513,397 | - | 4,513,397 | |
| Derivative financial instruments | 405,399 | - | 405,399 | |
| Fair value financial liabilities | 4,918,796 | - | 4,918,796 | |
| As of December 31, 2010 | Recorded FairValue | Fair Value Hierarchy | ||
| ThCh$ | Level 1 | Level 2 | Level 3 | |
| ThCh$ | ThCh$ | ThCh$ | ||
| Derivative financial instruments | 968,785 | - | 968,785 | |
| Market securities and investments in other companies | 1,375,980 | 1,375,980 | - | |
| Fair value financial assets | 2,344,765 | 1,375,980 | 968,785 | |
| Derivative hedge liabilities | 6,275,325 | - | 6,275,325 | |
| Derivative financial instruments | 1,383,942 | - | 1,383,942 | |
| Fair value financial liabilities | 7,659,267 | - | 7,659,267 | |
During year ended as of December 31, 2011, the Company has not made any significant instrument transfer between levels 1 and 2.
Credit Quality of financial assets
The Company uses two credit assessment systems for its clients: a) clients with loan insurance are assessed according to the external risk criteria (trade reports, non-compliance and protested documents that are available in the local market), payment capability and equity situation required by the insurance company to grant a loan coverage; b) the rest of the clients are assessed through an ABC risk model, which considers internal risk (non-compliance and protested documents), external risk (trade reports, non-compliance and protested documents that are available in the local market) and payment capacity and equity situation. The uncollectible rate during the last two years has not been significant.
F - 39
Compañía Cervecerías Unidas S.A. Notes to the Consolidated Financial Statements
|
|
Note 7Financial Information as per operating segments
The Company’s operations are presented in six operating segments. The corporate expense is presented separately. The accounting policies used for each segment are the same as those used in the Consolidated Financial Statements described inNote 2.3.
| Segment | Operations included in the segments |
| Beer Chile | Cervecera CCU Chile Ltda. and Compañía Cervecera Kunstmann S.A. |
| Beer Argentina | CCU Argentina S.A. |
| Non alcoholic | Embotelladoras Chilenas Unidas S.A. , Aguas CCU-Nestlé Chile S.A. and Vending CCU Ltda. |
| Wine | Viña San Pedro Tarapacá S.A. |
| Spirits | Compañía Pisquera de Chile S.A. |
| Others (*) | UES, UAC andCider. |
| (*) UES: Strategic Service Units:: Transportes CCU Limitada, Comercial CCU S.A. and Fábrica de Envases Plásticos S.A. | |
| UAC: Corporate Support Units located in the Parent Company. | |
| Cider: It corresponds to the result of the period of the business of cider. | |
| In addition this segment presents the elimination of transactions between segments. | |
The Company’s operations are carried out in Chile and Argentina, the latter includes exclusively segments of beers and wines. The rest of the segments operate only in Chile. For the specific case of Cider, whose operations are carried out in Argentina, this is included in the Other segment.
The Company does not have clients representing more than 10% of consolidated revenues.
The segment’s evaluations are made based on EBIT, EBITDA level. For this purpose, the Consolidated Statement of Income information showing such information by segment is included below:
F - 40
Compañía Cervecerías Unidas S.A. Notes to the Consolidated Financial Statements
|
|
Information as per operating segments for the year ended as of December 31, 2011 and 2010:
| Beer Chile | Beer Argentina | Non alcoholic | Wines | Spirits | Others | Total | ||||||||
| 2011 | 2010 | 2011 | 2010 | 2011 | 2010 | 2011 | 2010 | 2011 | 2010 | 2011 | 2010 | 2011 | 2010 | |
| M$ | M$ | M$ | M$ | M$ | M$ | M$ | M$ | M$ | M$ | M$ | M$ | M$ | M$ | |
| Sales revenue external customers | 309,286,574 | 283,448,500 | 194,453,595 | 151,951,892 | 243,329,756 | 218,841,014 | 132,933,733 | 125,789,685 | 49,360,939 | 40,596,038 | 21,740,476 | - | 951,105,073 | 820,627,129 |
| Other income | 3,208,076 | 2,924,908 | 3,640,113 | 2,227,059 | 1,226,330 | 1,152,031 | 5,390,734 | 6,483,603 | 492,143 | 1,183,682 | 4,488,202 | 3,659,915 | 18,445,598 | 17,631,198 |
| Sales revenue between segments | 521,953 | 1,607,870 | 87,375 | 2,184,291 | 3,953,248 | 3,482,580 | 23,820 | 19,228 | 1,082,518 | 1,437,904 | (5,668,914) | (8,731,873) | - | - |
| Net sales | 313,016,603 | 287,981,278 | 198,181,083 | 156,363,242 | 248,509,334 | 223,475,625 | 138,348,287 | 132,292,516 | 50,935,600 | 43,217,624 | 20,559,764 | (5,071,958) | 969,550,671 | 838,258,327 |
| Cost of Sales | (122,416,520) | (113,816,292) | (77,601,026) | (66,542,994) | (126,414,761) | (108,665,906) | (89,849,938) | (83,875,956) | (29,153,030) | (22,621,716) | (5,127,999) | 11,709,998 | (450,563,274) | (383,812,866) |
| Gross Margin | 190,600,083 | 174,164,986 | 120,580,057 | 89,820,248 | 122,094,573 | 114,809,719 | 48,498,349 | 48,416,560 | 21,782,570 | 20,595,908 | 15,431,765 | 6,638,040 | 518,987,397 | 454,445,461 |
| Distribution costs, administrative and other | ||||||||||||||
| expenses by function | (97,195,786) | (89,203,343) | (95,288,612) | (68,006,318) | (88,053,382) | (82,744,870) | (40,241,921) | (38,371,656) | (15,591,794) | (14,368,401) | (11,991,456) | (7,964,195) | (348,362,951) | (300,658,783) |
| Other operating income (expenses) | 678,693 | 332,914 | (162,038) | 214,423 | 1,041,356 | 299,155 | 2,165,898 | 210,669 | 192,244 | 181,860 | 3,314,260 | 232,786 | 7,230,413 | 1,471,807 |
| EBIT before exceptional items (EI) | 94,082,990 | 85,294,557 | 25,129,407 | 22,028,353 | 35,082,547 | 32,364,004 | 10,422,326 | 10,255,573 | 6,383,020 | 6,409,367 | 6,754,569 | (1,093,369) | 177,854,859 | 155,258,485 |
| Exceptional items (EI) (3) | 5,328,789 | - | - | - | 1,235,685 | - | 6,467,220 | - | 307,071 | - | (433,391) | 6,790,933 | 12,905,374 | 6,790,933 |
| EBIT (1) | 99,411,779 | 85,294,557 | 25,129,407 | 22,028,353 | 36,318,232 | 32,364,004 | 16,889,546 | 10,255,573 | 6,690,091 | 6,409,367 | 6,321,178 | 5,697,564 | 190,760,233 | 162,049,418 |
| Other income (loss) | - | - | - | - | - | - | - | - | - | - | - | - | 3,010,058 | (654,683) |
| Net financial expense | - | - | - | - | - | - | - | - | - | - | - | - | (7,334,062) | (8,287,701) |
| Equity and income of joint venture | - | - | - | - | - | - | - | - | - | - | - | - | 1,069,311 | 966,122 |
| Foreign currency exchange differences | - | - | - | - | - | - | - | - | - | - | - | - | (1,078,604) | (1,400,700) |
| Results as per adjustment units | - | - | - | - | - | - | - | - | - | - | - | - | (6,734,379) | (5,079,737) |
| Income before taxes | - | - | - | - | - | - | - | - | - | - | - | - | 179,692,557 | 147,592,719 |
| Income taxes | - | - | - | - | - | - | - | - | - | - | - | - | (44,890,356) | (27,656,049) |
| Income of year | - | - | - | - | - | - | - | - | - | - | - | - | 134,802,201 | 119,936,670 |
| Non-controlling interests | - | - | - | - | - | - | - | - | - | - | - | - | 12,050,607 | 9,237,155 |
| Net income attributable to equity holders of the | - | - | - | - | - | - | - | - | - | - | - | - | 122,751,594 | 110,699,515 |
| Depreciation and amortization | 16,165,010 | 15,746,565 | 5,350,126 | 4,850,511 | 10,427,300 | 9,617,800 | 6,418,774 | 6,471,661 | 1,877,002 | 1,671,960 | 7,543,793 | 6,842,322 | 47,782,005 | 45,200,819 |
| EBITDA before EI | 110,248,000 | 101,041,122 | 30,479,533 | 26,878,864 | 45,509,847 | 41,981,804 | 16,841,100 | 16,727,234 | 8,260,022 | 8,081,327 | 14,298,362 | 5,748,953 | 225,636,864 | 200,459,304 |
| EBITDA (2) | 115,576,789 | 101,041,122 | 30,479,533 | 26,878,864 | 46,745,532 | 41,981,804 | 23,308,320 | 16,727,234 | 8,567,093 | 8,081,327 | 13,864,971 | 12,539,886 | 238,542,238 | 207,250,237 |
(1) EBIT ("Earnings Before Interest and Taxes") (For management purposes we have defined as earnings before other gains (losses) net, financial expenses net, equity and income of joint ventures, foreign currency exchange differences, result as per adjustment units and income taxes). | ||||||||||||||
| (2) EBITDA ("Earnings Before Interests, Taxes, Depreciation and Amortization ). It is used for the calculation of EBITDA, EBIT plus depreciation and amortization. | ||||||||||||||
(3) The Company has considered this result as a Exceptional items (EI) related to earthquake insurance compensation for an amount of ThCh$ 13,289,481 (Note 12) and restructuring charges of cider business in Argentina for an amount of ThCh$ 384,107, both figures for the year 2011 and ThCh$. | ||||||||||||||
| 6,790,933 for the year 2010, related to the sale of land in Perú (Note 13). | ||||||||||||||
F - 41
Compañía Cervecerías Unidas S.A. Notes to the Consolidated Financial Statements
|
|
Information as per operating segments for the year ended as of December 31, 2010 and 2009:
| Beer Chile | Beer Argentina | Non alcoholic | Wines | Spirits | Others | Total | ||||||||
| 2010 | 2009 | 2010 | 2009 | 2010 | 2009 | 2010 | 2009 | 2010 | 2009 | 2010 | 2009 | 2010 | 2009 | |
| M$ | M$ | M$ | M$ | M$ | M$ | M$ | M$ | M$ | M$ | M$ | M$ | M$ | M$ | |
| Sales revenue external customers | 283,448,500 | 272,681,157 | 151,951,892 | 134,771,072 | 218,841,014 | 197,432,198 | 125,789,685 | 115,725,508 | 40,596,038 | 37,624,654 | - | - | 820,627,129 | 758,234,589 |
| Other income | 2,924,908 | 3,189,008 | 2,227,059 | 2,452,704 | 1,152,031 | 945,367 | 6,483,603 | 8,977,697 | 1,183,682 | 661,456 | 3,659,915 | 2,083,374 | 17,631,198 | 18,309,606 |
| Sales revenue between segments | 1,607,870 | 2,299,537 | 2,184,291 | 71,989 | 3,482,580 | 3,134,026 | 19,228 | 22,674 | 1,437,904 | 543,508 | (8,731,873) | (6,071,734) | - | - |
| Net sales | 287,981,278 | 278,169,702 | 156,363,242 | 137,295,765 | 223,475,625 | 201,511,591 | 132,292,516 | 124,725,879 | 43,217,624 | 38,829,618 | (5,071,958) | (3,988,360) | 838,258,327 | 776,544,195 |
| Cost of Sales | (113,816,292) | (114,107,969) | (66,542,994) | (61,153,726) | (108,665,906) | (101,075,448) | (83,875,956) | (77,855,019) | (22,621,716) | (20,602,427) | 11,709,998 | 9,696,218 | (383,812,866) | (365,098,371) |
| Gross Margin | 174,164,986 | 164,061,733 | 89,820,248 | 76,142,039 | 114,809,719 | 100,436,143 | 48,416,560 | 46,870,860 | 20,595,908 | 18,227,191 | 6,638,040 | 5,707,858 | 454,445,461 | 411,445,824 |
| Distribution costs, administrative and other | ||||||||||||||
| expenses by function | (89,203,343) | (86,071,964) | (68,006,318) | (58,814,012) | (82,744,870) | (75,502,932) | (38,371,656) | (35,054,774) | (14,368,401) | (11,802,296) | (7,964,195) | (6,344,883) | (300,658,783) | (273,590,861) |
| Other operating income (expenses) | 332,914 | (798,416) | 214,423 | 97 | 299,155 | (246,916) | 210,669 | 403,512 | 181,860 | (4,288) | 232,786 | 173,049 | 1,471,807 | (472,962) |
| EBIT before exceptional items (EI) | 85,294,557 | 77,191,353 | 22,028,353 | 17,328,124 | 32,364,004 | 24,686,295 | 10,255,573 | 12,219,598 | 6,409,367 | 6,420,607 | (1,093,369) | (463,976) | 155,258,485 | 137,382,001 |
| Exceptional items (EI) (3) | - | - | - | - | - | - | - | - | - | - | 6,790,933 | - | 6,790,933 | - |
| EBIT (1) | 85,294,557 | 77,191,353 | 22,028,353 | 17,328,124 | 32,364,004 | 24,686,295 | 10,255,573 | 12,219,598 | 6,409,367 | 6,420,607 | 5,697,564 | (463,976) | 162,049,418 | 137,382,001 |
| Other income (loss) | - | - | - | - | - | - | - | - | - | - | - | - | (654,683) | 21,924,632 |
| Net financial expense | - | - | - | - | - | - | - | - | - | - | - | - | (8,287,701) | (10,366,890) |
| Equity and income of joint venture | - | - | - | - | - | - | - | - | - | - | - | - | 966,122 | 1,349,144 |
| Foreign currency exchange differences | - | - | - | - | - | - | - | - | - | - | - | - | (1,400,700) | (1,390,069) |
| Results as per adjustment units | - | - | - | - | - | - | - | - | - | - | - | - | (5,079,737) | 4,190,023 |
| Income before taxes | - | - | - | - | - | - | - | - | - | - | - | - | 147,592,719 | 153,088,841 |
| Income taxes | - | - | - | - | - | - | - | - | - | - | - | - | (27,656,049) | (11,723,673) |
| Income of year | - | - | - | - | - | - | - | - | - | - | - | 119,936,670 | 141,365,168 | |
| Non-controlling interests | - | - | - | - | - | - | - | - | - | - | - | - | 9,237,155 | 13,327,695 |
| Net income attributable to equity holders of the | - | - | - | - | - | - | - | - | - | - | - | 110,699,515 | 128,037,473 | |
| Depreciation and amortization | 15,746,565 | 14,946,151 | 4,850,511 | 4,615,108 | 9,617,800 | 9,688,911 | 6,471,661 | 6,880,886 | 1,671,960 | 1,800,489 | 6,842,322 | 6,199,604 | 45,200,819 | 44,131,149 |
| EBITDA before EI | 101,041,122 | 92,137,504 | 26,878,864 | 21,943,232 | 41,981,804 | 34,375,206 | 16,727,234 | 19,100,484 | 8,081,327 | 8,221,096 | 5,748,953 | 5,735,628 | 200,459,304 | 181,513,150 |
| EBITDA (2) | 101,041,122 | 92,137,504 | 26,878,864 | 21,943,232 | 41,981,804 | 34,375,206 | 16,727,234 | 19,100,484 | 8,081,327 | 8,221,096 | 12,539,886 | 5,735,628 | 207,250,237 | 181,513,150 |
| (1) EBIT ("Earnings Before Interest and Taxes") (For management purposes we have defined as earnings before other gains (losses) net, financial expenses net, equity and income of joint ventures, foreign currency exchange differences, result as per adjustment units and income taxes). | ||||||||||||||
| (2) EBITDA ("Earnings Before Interests, Taxes, Depreciation and Amortization ). It is used for the calculation of EBITDA, EBIT plus depreciation and amortization. | ||||||||||||||
| (3) The Company has considered this result as a Exceptional items (EI) related for the sale of land in Perú for an amount of ThCh$ 6,790,933 (Note 13). | ||||||||||||||
F - 42
Compañía Cervecerías Unidas S.A. Notes to the Consolidated Financial Statements
|
|
Sales information by geographic location
| Net sales as per geographical location | For the years ended December 31, | |||
| 2011 | 2010 | 2009 | ||
| ThCh$ | ThCh$ | ThCh$ | ||
| Chile | 739,131,946 | 671,601,022 | 627,135,185 | |
| Argentina | 230,418,725 | 166,657,305 | 149,409,010 | |
| Total | 969,550,671 | 838,258,327 | 776,544,195 | |
See distribution as per domestic and exports revenues in Note 9.
Depreciation and amortization as per segment
| Property, plant and equipment depreciation and amortization of software | For the years ended December 31, | ||
| 2011 | 2010 | 2009 | |
| ThCh$ | ThCh$ | ThCh$ | |
| Beer Chile | 16,165,010 | 15,746,565 | 14,946,151 |
| Beer Argentina | 5,350,126 | 4,850,511 | 4,615,108 |
| Non alcoholic | 10,427,300 | 9,617,800 | 9,688,911 |
| Wine | 6,418,774 | 6,471,661 | 6,880,886 |
| Spirits | 1,877,002 | 1,671,960 | 1,800,489 |
| Others (1) | 7,543,793 | 6,842,322 | 6,199,604 |
| Total | 47,782,005 | 45,200,819 | 44,131,149 |
| (1) Other includes depreciation and amortization corresponding to the Corporate Support Units, Strategic Service Units and Cider. | |||
Capital expenditures as per segment
| Capital expenditures (property, plant and equipment and software additions) | For the years ended December 31, | ||
| 2011 | 2010 | 2009 | |
| ThCh$ | ThCh$ | ThCh$ | |
| Beer Chile | 23,504,694 | 28,929,985 | 22,554,263 |
| Beer Argentina | 13,994,020 | 9,483,055 | 8,566,565 |
| Non alcoholic | 14,758,599 | 15,347,030 | 11,466,838 |
| Wine | 8,309,162 | 4,115,074 | 3,703,568 |
| Spirits | 1,030,063 | 828,196 | 1,294,402 |
| Others (2) | 16,250,389 | 5,692,824 | 10,306,840 |
| Total | 77,846,927 | 64,396,164 | 57,892,476 |
| (2) Other includes the capital investments corresponding to the Corporate Support Units, Strategic Service Units and Cider. | |||
F - 43
Compañía Cervecerías Unidas S.A. Notes to the Consolidated Financial Statements
|
|
Assets as per segment
| Assets as per segment | As ofDecember 31,2011 | As ofDecember 31,2010 |
| ThCh$ | ThCh$ | |
| Beer Chile | 289,961,747 | 283,666,385 |
| Beer Argentina | 127,759,978 | 123,738,441 |
| Non alcoholic | 175,730,472 | 167,448,887 |
| Wine | 270,024,508 | 258,176,118 |
| Spirits | 58,743,558 | 48,361,326 |
| Others (3) | 376,271,096 | 270,297,854 |
| Total | 1,298,491,359 | 1,151,689,011 |
| (3) Other includes goodwill and the assets corresponding to the Corporate Support Units, Strategic Service Units and Cider. | ||
Assets as per geographic location
| Assets as per geographical location | As ofDecember 31,2011 | As ofDecember 31,2010 | |
| ThCh$ | ThCh$ | ||
| Chile | 1,116,486,265 | 1,008,847,847 | |
| Argentina | 182,005,094 | 142,841,164 | |
| Total | 1,298,491,359 | 1,151,689,011 | |
F - 44
Compañía Cervecerías Unidas S.A. Notes to the Consolidated Financial Statements
|
|
Segment’s additional information
The Consolidated Statement of Income classified according to the Company’s operations management is as follows:
| Consolidated statement of income | Notes | For the years ended December 31, | ||
| 2011 | 2010 | 2009 | ||
| ThCh$ | ThCh$ | ThCh$ | ||
| Net Sales | 9 | 969,550,671 | 838,258,327 | 776,544,195 |
| Cost of Sales | 10 | (450,563,274) | (383,812,866) | (365,098,371) |
| Gross Margin | 518,987,397 | 454,445,461 | 411,445,824 | |
| Other operational income | 12 | 8,022,806 | 2,432,003 | 2,362,077 |
| Distribution expenses | 10 | (150,071,122) | (129,079,325) | (110,020,778) |
| Administrative expenses | 10 | (77,095,019) | (63,995,182) | (67,833,191) |
| Other operational expenses | 10 | (121,989,203) | (108,544,472) | (98,571,931) |
| EBIT before Exceptional items | 177,854,859 | 155,258,485 | 137,382,001 | |
| Exceptional Items (EI) (2) | 12 - 13 | 12,905,374 | 6,790,933 | - |
| EBIT (1) | 190,760,233 | 162,049,418 | 137,382,001 | |
| Financial income | 11 | 7,076,849 | 2,380,886 | 2,075,957 |
| Financial costs | 11 | (14,410,911) | (10,668,587) | (12,442,847) |
| Equity and income of joint venture | 19 | 1,069,311 | 966,122 | 1,349,144 |
| Foreign currency exchange differences | 11 | (1,078,604) | (1,400,700) | (1,390,069) |
| Result as per adjustment units | 11 | (6,734,379) | (5,079,737) | 4,190,023 |
| Other gains (losses) net | 12 | 3,010,058 | (654,683) | 21,924,632 |
| Income before taxes | 179,692,557 | 147,592,719 | 153,088,841 | |
| Income taxes | 26 | (44,890,356) | (27,656,049) | (11,723,673) |
| Net income of year | 134,802,201 | 119,936,670 | 141,365,168 | |
| Net income attributable to: | ||||
| Equity holders of the parent | 122,751,594 | 110,699,515 | 128,037,473 | |
| Non-controlling interests | 32 | 12,050,607 | 9,237,155 | 13,327,695 |
| Net income of year | 134,802,201 | 119,936,670 | 141,365,168 | |
| Income (loss) per share basic (Chilean pesos) from: | ||||
| Continuing operations | 385.40 | 347.56 | 402.00 | |
| Discontinued operations | - | - | - | |
| Income (loss) per share basic (Chilean pesos) from: | ||||
| Continuing operations | 385.40 | 347.56 | 402.00 | |
| Discontinued operations | - | - | - | |
| Depreciation and Amortization | 47,782,005 | 45,200,819 | 44,131,149 | |
| EBITDA before EI | 225,636,864 | 200,459,304 | 181,513,150 | |
| EBITDA (1) | 238,542,238 | 207,250,237 | 181,513,150 | |
| (1) See definition of EBIT and EBITDA in information as per operating segment. | ||||
| (2) The Company has considered this result as a Exceptional items (EI) related to earthquake insurance compensation for an amount of ThCh$ 13,289,481 (Note 12) and restructuring charges of cider business in Argentina for an amount of ThCh$ 384,107, both figures for the year 2011 and ThCh$ 6,790,933 for the year2010, related to the sale of land in Perú (Note 13). | ||||
F - 45
Compañía Cervecerías Unidas S.A. Notes to the Consolidated Financial Statements
|
|
Information as per segments of joint ventures and associates
The Company’s Management reviews the financial position and the operating results of all its joint ventures and associates described inNote 19. The information that appears below relates to 100% joint ventures and associates: Compañía Pisquera Bauzá S.A. (spirits), Valles de Chile S.A. (wine segment), Cervecería Austral S.A. (beer segment), Foods Compañía de Alimentos CCU S.A. (foods segment) and Promarca S.A. (other segment), represents the figures that have not been consolidated in the Company’s financial statements, since joint ventures and associates are accounted for under the equity method, as explained inNote 2.2.
The figures for each entity are as follows, at base 100%:
| As of December 31, 2011 | As of December 31, 2010 | As of December 31, 2009 | |||||||
| Compañía Pisquera Bauzá S.A. | Cervecería Austral S.A. | Foods S.A. and Promarca S.A. | Valles de Chile S.A. | Cervecería Austral S.A. | Foods S.A. and Promarca S.A. | Valles de Chile S.A. | Cervecería Austral S.A. | Foods S.A. and Promarca S.A. | |
| Net sales | 5,249,831 | 6,742,979 | 23,332,849 | 5,102,297 | 6,178,320 | 21,729,663 | 4,604,576 | 5,206,879 | 20,596,495 |
| Operating results | (1,611,372) | 319,065 | 3,813,555 | (931,429) | 348,364 | 2,809,759 | (191,416) | 248,974 | 3,052,972 |
| Income of year | (1,251,395) | 260,699 | 3,153,507 | (970,088) | 304,816 | 2,380,465 | (124,803) | 200,320 | 2,620,599 |
| Capital expenditures | 281,811 | 549,905 | 493,417 | 1,013,222 | 668,497 | 1,200,822 | 716,758 | 295,362 | 977,520 |
| Depreciation and amortization | (625,161) | (312,912) | (659,741) | (540,138) | (233,909) | (555,992) | (426,263) | (251,325) | (531,004) |
| Current assets | - | 3,010,585 | 9,987,888 | 6,119,442 | 3,482,610 | 8,409,881 | 5,865,166 | 3,346,631 | 9,090,226 |
| Non-current assets | - | 3,864,213 | 60,740,383 | 13,533,153 | 3,368,334 | 59,119,807 | 13,000,582 | 2,774,576 | 58,570,068 |
| Current liabilities | - | 1,088,820 | 12,333,624 | 4,642,625 | 1,217,929 | 9,063,611 | 2,830,014 | 865,205 | 8,114,932 |
| Non-current liabilities | - | 237,356 | 367,666 | 481,547 | 202,739 | 263,752 | 537,223 | 130,540 | 423,955 |
(1) See Note 19.
Note 8Business Combinations
a) Doña Aída S.A. and Don Enrique Pedro S.A.
Year 2010 Acquisitions
On December 27, 2010, the following acquisitions of shares were executed through the subsidiary Compañía Industrial Cervecera S.A. (CICSA): (a) 71.456% of the shares and voting rights of Doña Aida S.A., which also owns 49.777% of Sáenz Briones & Cía. S.A.I.C. y C; (b) 71.467% of the shares and voting rights of Don Enrique Pedro S.A., which also owns 99.968% of Sidra La Victoria S.A., and (c) 0.4377% of the shares and voting rights of Sáenz Briones & Cía. S.A.I.C. y C., as a consequence CICSA became 50.215% owner of this last company.
Year 2011 Acquisitions
On April 6, 2011, CICSA made an additional purchase of shares of 14.272% of Doña Aída S.A. and 14.2667% of Don Enrique Pedro S.A., through its subsidiary Compañía Industrial Cervecera S.A. (CICSA). As a consequence, CICSA became the owner of 85.728% and 85.734%, respectively, of the before mentioned subsidiaries.
Later, on September 20, 2011, CICSA, acquired the remaining percentage of the equity rights of Doña Aída S.A. and Don Enrique Pedro S.A. As a consequence CICSA became the owner of 100% of those subsidiaries. During December 2011, CICSA sold 5% of Doña Aida S.A. and Don Enrique Pedro S.A to CCU Argentina.
The Company disbursed for this transaction a total amount of ThCh$ 9,157,728 (ThCh$ 3,023,219 in 2011 and ThCh$ 6,134,509 in 2010). Because of at December 31, 2010, the Company was in the process of assessing the fair values, that amount was classified under Other non-financial assets (See Note 18).
At the date of issue of these consolidated financial statements, fair valuesof assets, liabilities and contingent liabilities have been determinated, generating, among others, goodwill and intangible assets (See Note 20 and 21).
It is expected that the acquisition of these companies increase their productive capacities, through the expansion of their productive assets, growth in market share, through the various brands marketed and participation in local and foreign markets, as well as operational improvements as a result of synergies obtained in the operational and administrative functions.
F - 46
Compañía Cervecerías Unidas S.A. Notes to the Consolidated Financial Statements
|
|
b) Viña Valles de Chile S.A. and Compañía Pisquera Bauzá S.A.
On the other hand, as described inNote 19, in the month of December 2011, Viña Valles de Chile S.A. became a subsidiary of Viña San Pedro Tarapacá S.A. At the same time, Compañía Pisquera Bauzá S.A. was constituted as an associate of Compañía Pisquera de Chile S.A.
Note 9 Net Sales
Net sales distributed between domestic and export, are as follows:
| For the years ended December 31, | |||
| 2011 | 2010 | 2009 | |
| ThCh$ | ThCh$ | ThCh$ | |
| Sales to domestic clients | 877,824,070 | 749,160,413 | 687,040,509 |
| Exports sales | 91,726,601 | 89,097,914 | 89,503,686 |
| Total | 969,550,671 | 838,258,327 | 776,544,195 |
Note 10 Nature of the costs and expenses
Operational costs and expenses grouped by natural classification are as follows:
| For the years ended December 31, | |||
| 2011 | 2010 | 2009 | |
| ThCh$ | ThCh$ | ThCh$ | |
| Raw material cost | 327,626,307 | 275,058,113 | 261,973,067 |
| Materials and maintenance expenses | 25,709,929 | 23,901,442 | 23,545,492 |
| Salaries (staff expenses) (1) | 114,803,745 | 99,874,443 | 93,524,543 |
| Transportation and distribution | 123,422,050 | 103,311,030 | 90,667,340 |
| Advertising and promotion expenses | 70,028,455 | 63,734,869 | 57,815,013 |
| Lease expense | 8,345,266 | 6,825,701 | 6,002,388 |
| Energy expenses | 25,932,251 | 19,796,334 | 18,375,333 |
| Depreciation and amortizations | 47,782,005 | 45,200,819 | 44,131,149 |
| Other expense | 56,452,717 | 47,729,094 | 45,489,946 |
| Total | 800,102,725 | 685,431,845 | 641,524,271 |
| (1) SeeNote 31 Employee benefits. | |||
F - 47
Compañía Cervecerías Unidas S.A. Notes to the Consolidated Financial Statements
|
|
Note 11 Financial results
The financial income composition for the years ended as of December 31, 2011, 2010 and 2009, is as follows:
| Financial Results | For the years ended December 31, | ||
| 2011 | 2010 | 2009 | |
| ThCh$ | ThCh$ | ThCh$ | |
| Financial income | 7,076,849 | 2,380,886 | 2,075,957 |
| Financial cost | (14,410,911) | (10,668,587) | (12,442,847) |
| Foreign currency exchange differences | (1,078,604) | (1,400,700) | (1,390,069) |
| Result as per adjustment units | (6,734,379) | (5,079,737) | 4,190,023 |
| Total | (15,147,045) | (14,768,138) | (7,566,936) |
Note 12Other income by function
The detail of other income by function items is as follows:
| For the years ended December 31, | |||
| 2011 | 2010 | 2009 | |
| ThCh$ | ThCh$ | ThCh$ | |
| Earthquake insurance compensation (1) | 13,289,481 | - | - |
| Others | 8,022,806 | 2,432,003 | 2,362,077 |
| Total | 21,312,287 | 2,432,003 | 2,362,077 |
(1) Earthquake insurance compensation
As of December 31, 2010 the insurance claim process related to the damages caused by the earthquake of February 27, 2010, was still ongoing. The final liquidator´s report and its subsequent ratification by the parties were pending.
As of December 31, 2010, the recovery of ThCh$ 27,315,436 related to the recorded book value of assets damaged and expenses incurred was considered to be virtually certain under IAS 37 by the Company.
Of this amount, ThCh$ 21,721,759 was received in cash from the insurance company at December 31, 2010 and reflected in cash flow from operating activities. Additionally, ThCh$ 5,593,677 was recorded as an account receivable based on a confirmation from the insurance company, amount that was collected in the year 2011, when the insurance claims process was completed. At the date of such final settlement the total amount of the book value of the damaged assets and expenses incurred was ThCh$ 30,188,980, receiving a total compensation for ThCh$ 43.617.835, of which ThCh$ 21,896,076 was received during the year 2011 (See Note 14).
As a result of it, a net positive effect of ThCh$ 13,289,481 was recorded in the statement of income during the year ended December 31, 2011. This result, which is an exceptional item one, includes compensation for the following:
1. ThCh$ 8,481,854 as compensation for a) the excess of net selling price over the cost basis for finished goods destroyed in the earthquake, and b) business interruption.
2. ThCh$ 4,807,627 as compensation for the excess of the replacement value over the cost basis for machinery and equipment.
F - 48
Compañía Cervecerías Unidas S.A. Notes to the Consolidated Financial Statements
|
|
Note 13Other Gain and Loss
The detail of other gain (loss) items is as follows:
| Other Income (loss) | For the years ended December 31, | ||||
| 2011 | 2010 | 2009 | |||
| ThCh$ | ThCh$ | ThCh$ | |||
| Result from sale of interest in subsidiary (*) | - | - | 24,439,025 | ||
| Result on sale of land (Perú) (**) | - | 6,790,933 | - | ||
| Results derivative contracts | 2,459,262 | (1,048,194) | (2,845,237) | ||
| Marketable securities to market value | (227,034) | 392,018 | 321,629 | ||
| Others | 777,830 | 1,493 | 9,215 | ||
| Total | 3,010,058 | 6,136,250 | 21,924,632 | ||
| (*) | As mentioned inNote 1, number 4, a profit was recognized for the sale of 29.9% of the shares of Aguas CCU Nestlé Chile S.A. | ||||
| (**) | For purposes of financial information as per operating segment (Note 7), the Company has considered these results as Exceptional Item (EI). | ||||
Note 14 Cash and cash equivalents
Cash and cash equivalent balances were as follows:
| As ofDecember 31,2011 | As ofDecember 31,2010 | As of December 31,2009 | |
| ThCh$ | ThCh$ | ThCh$ | |
| Cash and cash equivalents | 136,754 | 2,839,227 | 11,310,763 |
| Overnight deposits | 308,625 | 399,249 | 367,965 |
| Bank balances | 22,904,299 | 26,083,147 | 14,470,651 |
| Time deposits | 100,478,008 | 45,788,575 | 21,891,688 |
| Investments in mutual funds | 22 | 2,301,316 | 15,950,635 |
| Securities purchased under resale agreements | 53,836,670 | 74,202,786 | 73,361,967 |
| Total | 177,664,378 | 151,614,300 | 137,353,669 |
The currency composition of cash and cash equivalents at December 31, 2011, is as follows:
| As of December 31, 2011 | Chilean peso | Unidad deFomento | US Dollar | Euro | Argentine peso | Others | Totales |
| ThCh$ | ThCh$ | ThCh$ | ThCh$ | ThCh$ | ThCh$ | ThCh$ | |
| Cash and cash equivalents | 136,711 | - | 43 | - | - | - | 136,754 |
| Overnight deposits | 308,625 | - | - | - | - | - | 308,625 |
| Bank balances | 19,139,424 | - | 2,685,721 | 141,146 | 936,632 | 1,376 | 22,904,299 |
| Time deposits | 81,514,956 | 18,963,052 | - | - | - | - | 100,478,008 |
| Investments in mutual funds | - | - | - | - | 22 | - | 22 |
| Securities purchased under resale agreements | 53,836,670 | - | - | - | - | - | 53,836,670 |
| Total | 154,936,386 | 18,963,052 | 2,685,764 | 141,146 | 936,654 | 1,376 | 177,664,378 |
F - 49
Compañía Cervecerías Unidas S.A. Notes to the Consolidated Financial Statements
|
|
The currency composition of cash and cash equivalents at December 31, 2010, is as follows:
| As of December 31, 2010 | Chilean peso | Unidad deFomento | US Dollar | Euro | Argentine peso | Others | Totales |
| ThCh$ | ThCh$ | ThCh$ | ThCh$ | ThCh$ | ThCh$ | ThCh$ | |
| Cash and cash equivalents | 2,838,888 | - | 339 | - | - | - | 2,839,227 |
| Overnight deposits | 399,249 | - | - | - | - | - | 399,249 |
| Bank balances | 17,586,208 | - | 375,541 | 1,361,211 | 6,736,375 | 23,812 | 26,083,147 |
| Time deposits | 31,145,809 | 14,642,766 | - | - | - | - | 45,788,575 |
| Investments in mutual funds | 2,301,316 | - | - | - | - | - | 2,301,316 |
| Securities purchased under resale agreements | 74,202,786 | - | - | - | - | - | 74,202,786 |
| Total | 128,474,256 | 14,642,766 | 375,880 | 1,361,211 | 6,736,375 | 23,812 | 151,614,300 |
The composition of cash and cash equivalents at December 31, 2009, is as follows:
| As of December 31, 2009 | Chilean peso | Unidad deFomento | US Dollar | Euro | Argentine peso | Others | Totales |
| ThCh$ | ThCh$ | ThCh$ | ThCh$ | ThCh$ | ThCh$ | ThCh$ | |
| Cash and cash equivalents | 11,310,332 | - | 431 | - | - | - | 11,310,763 |
| Overnight deposits | 367,965 | - | - | - | - | - | 367,965 |
| Bank balances | 11,895,727 | - | 272,742 | 313,236 | 1,912,042 | 76,904 | 14,470,651 |
| Time deposits | 19,229,841 | 2,661,847 | - | - | - | - | 21,891,688 |
| Investments in mutual funds | 15,950,635 | - | - | - | - | - | 15,950,635 |
| Securities purchased under resale agreements | 73,361,967 | - | - | - | - | - | 73,361,967 |
| Total | 132,116,467 | 2,661,847 | 273,173 | 313,236 | 1,912,042 | 76,904 | 137,353,669 |
The total accumulated cash flow accrued by business combinations as of December 31, 2011, 2010 and 2009, amounts to:
| As of December 31, | |||
| 2011 | 2010 | 2009 | |
| ThCh$ | ThCh$ | ThCh$ | |
| Total paid for business acquisitions: | |||
| Amount paid in cash and cash equivalent for business acquisitions | (3,257,272) | (10,646,456) | (1,036,500) |
| Total | (3,257,272) | (10,646,456) | (1,036,500) |
As of December 31, 2011, in the Consolidated Statement of Cash Flow, in Operational Activities, under the heading “Other cash movements” the total amount of ThCh$ 8,936,842, includes the amount of ThCh$ 15,506,731 related to the final compensation received by losses of inventories and interruption of the operational activities (ThCh$ 21,721,759 in 2010 related to partial compensation).
In addition, as of December 31, 2011, in Investing Activities, under the heading "Other cash movements" the amount shown of ThCh$ 6,389,344, is related to the final compensation received for destruction of machinery and equipment from the insurance companies related to the earthquake (See Note 12).
Therefore, cash included in the cash flow statement in 2011 related to the earthquake as mentioned in the previous two paragraphs, is ThCh$ 21,896,076 (See Note 12).
Also, on July 2009, the Company received ThCh$ 29,874,428 as payment in cash for the sale of 29.9% of shares of Aguas CCU-Nestlé Chile S.A. and reduce their participation in Aguas CCU-Nestlé Chile S.A. to a 50.1% (See Note 1 number 1). This is presented within the Cash Flow Statement under the item “Proceeds from sale of and investment in a subsidiary”.
Additionally, as of December 31, 2011, within “Cash Flow from Financing Activities”, under the heading “Other cash movements" for a total amount of ThCh$ 15,096,775, is forming part ThCh$ 11,268,125 corresponding to the prepayment of the Serie A Bonds (See Note 27). Besides, as of December 31, 2009, under the heading Proceeds from long term loans” is presented as part of the balance the followings items:
F - 50
Compañía Cervecerías Unidas S.A. Notes to the Consolidated Financial Statements
|
|

· On March 15, 2009, the Company recorded in the Securities Record the issue of 20-year term bonds Series H and I for a total UF2,000,000 and UF 3,000,000 (equivalents to ThCh$ 41,624,936 and ThCh$ 62,437,405), respectively, which were placed on April 2, 2009.
· On May 14, 2009, the subsidiaries of VSPT, Viña Misiones de Rengo, Viña del Mar Viña of Casablanca and Viña Santa Helena, signed credits totaling US$ 3 million, equivalent to ThCh $ 9,874,584 with Banco BICE, with maturity date of May 15, 2013. This amount is presented under the item "Proceeds from bank borrowings and issuance of bonds”.
Note 15 Accounts receivables – Trade and other receivables
The accounts receivable trade and other balances were as follows:
| As of December31, 2011 | As ofDecember 31,2010 | |
| ThCh$ | ThCh$ | |
| Accounts receivables | ||
Beer Chile | 33,319,709 | 31,588,865 |
Beer Argentina | 23,602,951 | 14,205,072 |
Non alcoholic | 25,403,484 | 24,368,168 |
Wine | 40,814,420 | 30,684,126 |
Spirits | 11,875,387 | 8,985,926 |
Others | 49,338,299 | 30,937,831 |
| Other accounts receivable (*) | 13,426,269 | 16,152,609 |
| Impairment loss estimate | (4,715,357) | (3,909,051) |
| Total | 193,065,162 | 153,013,546 |
(*) At December 31, 2010, under this item is recorded the net balance of the account receivable from insurance companies for claims related to the earthquake for an amount of ThCh$ 5,593,677 (See Note 12).
The Company’s accounts receivable are denominated in the following currencies:
| As of December31, 2011 | As ofDecember 31,2010 | |
| ThCh$ | ThCh$ | |
| Chilean peso | 123,527,287 | 115,544,263 |
| Argentine peso | 39,724,238 | 17,152,025 |
| US Dollar | 19,274,307 | 12,752,647 |
| Euro | 7,960,667 | 5,771,899 |
| Unidad de Fomento | 106,795 | 37,630 |
| Other Currencies | 2,471,868 | 1,755,082 |
| Total | 193,065,162 | 153,013,546 |
F - 51
Compañía Cervecerías Unidas S.A. Notes to the Consolidated Financial Statements
|
|
The detail of the accounts receivable maturities as of December 31, 2011, is as follows:
| Total | CurrentBalance | Overdue Balances | ||||
| 0 to 3 months | 3 to 6 month | 6 to 12 month | More than 12months | |||
| ThCh$ | ThCh$ | ThCh$ | ThCh$ | ThCh$ | ThCh$ | |
| Accounts receivables: | ||||||
Beer Chile | 33,319,709 | 30,729,737 | 1,521,732 | 235,703 | 243,458 | 589,079 |
Beer Argentina | 23,602,951 | 20,520,177 | 1,376,919 | 270,681 | 1,304,511 | 130,663 |
Non alcoholic | 25,403,484 | 22,845,949 | 793,297 | 447,871 | 530,796 | 785,571 |
Wine | 40,814,420 | 34,339,230 | 5,420,555 | 211,730 | 294,281 | 548,624 |
Spirits | 11,875,387 | 10,987,890 | 643,236 | 37,580 | 54,540 | 152,141 |
Others | 49,338,300 | 43,428,364 | 3,634,253 | 1,048,766 | 482,523 | 744,394 |
| Other accounts receivable | 13,426,268 | 13,426,268 | - | - | - | - |
| Sub Total | 197,780,519 | 176,277,615 | 13,389,992 | 2,252,331 | 2,910,109 | 2,950,472 |
| Impairment loss estimate | (4,715,357) | - | (176,712) | (324,185) | (1,800,777) | (2,413,683) |
| Total | 193,065,162 | 176,277,615 | 13,213,280 | 1,928,146 | 1,109,332 | 536,789 |
The detail of the accounts receivable maturities as of December 31, 2010, is as follows:
| Total | CurrentBalance | Overdue Balances | ||||
| 0 to 3 months | 3 to 6 month | 6 to 12 month | More than 12months | |||
| ThCh$ | ThCh$ | ThCh$ | ThCh$ | ThCh$ | ThCh$ | |
| Accounts receivables: | ||||||
Beer Chile | 31,588,865 | 28,945,990 | 1,358,970 | 348,002 | 387,029 | 548,874 |
Beer Argentina | 14,205,072 | 11,738,479 | 950,187 | 513,231 | 610,436 | 392,739 |
Non alcoholic | 24,368,168 | 21,322,465 | 1,571,943 | 381,107 | 283,906 | 808,747 |
Wine | 30,684,126 | 25,316,859 | 4,068,585 | 566,918 | 315,246 | 416,518 |
Spirits | 8,985,926 | 8,151,340 | 541,473 | 117,940 | 17,142 | 158,031 |
Others (1) | 30,937,831 | 27,634,401 | 2,327,578 | 108,292 | 190,915 | 676,645 |
| Other accounts receivable | 16,152,609 | 16,152,609 | - | - | - | - |
| Sub Total | 156,922,597 | 139,262,143 | 10,818,736 | 2,035,490 | 1,804,674 | 3,001,554 |
| Impairment loss estimate | (3,909,051) | - | (116,756) | (344,907) | (936,916) | (2,510,472) |
| Total | 153,013,546 | 139,262,143 | 10,701,980 | 1,690,583 | 867,758 | 491,082 |
| (1) Mainly include Comercial CCU which makes sales multiclass on behalf of Cervecera CCU Chile, ECCUSA, CPCH, VSPT and FOODS. | ||||||
The Company markets its products through retail, wholesale clients, chains and supermarkets.
As of December 31, 2011, the accounts receivable from the three most important supermarket chains in Chile and Argentina represent 36,6% (38.1% in 2010) of the total accounts receivable.
As indicated in the Risk management note (Note 5), for Credit Risk purposes, the Company acquires credit insurance policies to cover approximately 90% of the accounts receivable balances. For this reason, management estimates that it does not require establishing allowances for further deterioration, in addition to those already constituted based on an aging analysis of these balances.
Regarding amounts aged more than 6 months and for which no allowances have been constituted, they correspond mainly to amounts already covered by the credit insurance policies.
In addition, there are amounts overdue within ranges for which, in accordance with current policies are only partially impaired for based on a case by case analysis.
F - 52
Compañía Cervecerías Unidas S.A. Notes to the Consolidated Financial Statements
|
|
The movement of the impairment losses provision for accounts receivable is as follows:
| As of December31, 2011 | As ofDecember 31,2010 | |
| ThCh$ | ThCh$ | |
| Balance at the beginning | 3,909,051 | 3,911,557 |
| Impairment estimate for accounts receivable | 1,517,832 | 884,890 |
| Uncollectible accounts | (851,981) | (777,617) |
| Estimates resulting from business combinations | 125,849 | - |
| Effect of translation into presentation currency | 14,606 | (109,779) |
| Total | 4,715,357 | 3,909,051 |
F - 53
Compañía Cervecerías Unidas S.A. Notes to the Consolidated Financial Statements
|
|
Note 16 Accounts and transactions with related companies
Transactions between the Company and its subsidiaries relates to standard operations as regards purpose and conditions. Such transactions have been eliminated during the consolidation process and they are not detailed in this note.
The amounts indicated as transactions in the following table related to trade operations with related companies, which are effected at arm’s length as regards price and payment conditions. There are neither uncollectible estimates decreasing accounts receivable, nor guarantees related to the same.
Conditions of the balances and transactions with related companies:
(1) They related to business operations agreed upon in Chilean pesos, of those companies not under a current trade account agreement, that do not accrue interest and which payment condition is, generally, 30 days.
(2) They related to business operations agreed upon in Chilean pesos. The remaining balance accrues interest at 90-days active bank rate (TAB) plus an annual spread. Such interests shall be paid or charged against the trade current account.
(3) They related to business operations in foreign currency, not covered by a current trade account, that do not accrue interest and which payment condition is, generally, 30 days and are presented at the closing exchange rate.
(4) It relates to an agreement between the subsidiary Compañía Pisquera de Chile S.A. with Cooperativa Agrícola Control Pisquero de Elqui and Limarí Ltda. due to differences resulting from the contributions made by the latter. It establishes a 3% annual interest over capital, with annual payments to be made in eight real and successive installments of
UF 1,124 each. Maturities correspond to February 28 of each year, as from 2007 and a UF 9,995 bullet with maturity on February 28, 2014.
(5) It relates to an advanced payment of the price received for the future purchase and sale of part of the industrial facility under development. The balance is not subject to interest.
(6) It relates to an agreement between the subsidiary Compañía Pisquera de Chile S.A. with Comarca S.A. related to the payment of the access fee for the distribution of products. The pending amount is agreed at two quotes of UF 17,888. Maturities correspond to November 2, 2012 and December 2, 2013, respectively.
(7) It relates to an agreement between the subsidiary Compañía Pisquera de Chile S.A. with Inversiones y Asesorías Monterroso Limitada y Otros, related to the acquisition of 49% of the associated Compañía Pisquera Bauzá S.A. The outstanding balance at December 31, 2011, corresponds to a single quote for UF 65,832 with maturity on December 1, 2013.
The transaction schedule includes all the transactions made with related parties.
The detail of the accounts receivable and payable from related companies as of December 31, 2011 and 2010, is as follows:
F - 54
Compañía Cervecerías Unidas S.A. Notes to the Consolidated Financial Statements
|
|
Accounts receivable from related parties
Current:
| TAX ID | Company | Country of origin | Ref. | Relationship | Transaction | Currency | As of December 31, | |
| 2011 ThCh$ | 2010 ThCh$ | |||||||
| 96.919.980-7 | Cervecería Austral S.A. | Chile | (1) | Joint venture | Sales of products | CLP | 129,348 | 150,555 |
| 96.919.980-7 | Cervecería Austral S.A. | Chile | (1) | Joint venture | Sales of products | USD | 14,693 | - |
| 77.755.610-K | Comercial Patagona Ltda. | Chile | (1) | Subsidiaria de Joint venture | Sales of products | CLP | 310,926 | 240,605 |
| 77.755.610-K | Comercial Patagona Ltda. | Chile | (1) | Subsidiaria de Joint venture | Lease crane | CLP | 1,087 | 494 |
| 99.542.980-2 | Foods Compañía de Alimentos CCU S.A. | Chile | (1) | Joint venture | Sales of products | CLP | 107,568 | - |
| 99.542.980-2 | Foods Compañía de Alimentos CCU S.A. | Chile | (1) | Joint venture | Transport service | CLP | 601,752 | 409,510 |
| 99.542.980-2 | Foods Compañía de Alimentos CCU S.A. | Chile | (2) | Joint venture | Remittance received | CLP | 5,058,893 | 3,267,816 |
| 99.542.980-2 | Foods Compañía de Alimentos CCU S.A. | Chile | (2) | Joint venture | Interests | CLP | 148,306 | 68,118 |
| 99.542.980-2 | Foods Compañía de Alimentos CCU S.A. | Chile | (1) | Joint venture | Sale services | CLP | 80,865 | 81,327 |
| 99.542.980-2 | Foods Compañía de Alimentos CCU S.A. | Chile | (1) | Joint venture | Shared services | CLP | 154,324 | 162,454 |
| 0-E | Anheuser Busch International, Inc. | Estados Unidos | (3) | Subsidiary Shareholdes | Sales of products | USD | - | 876,183 |
| 0-E | Anheuser Busch Latin America Development Corporation | Estados Unidos | (3) | Subsidiary Shareholdes | Marketing services | $ARG | - | 2,643 |
| 76.736.010-K | Promarca S.A. | Chile | (1) | Joint venture | Marketing services | CLP | 87,772 | 31,299 |
| 81.805.700-8 | Cooperativa Agrícola Control Pisquero de Elqui y Limarí Ltda. | Chile | (4) | Subsidiary Shareholdes | Purchase advance | CLP | 870,529 | 764,956 |
| 77.051.330-8 | Cervecería Kunstmann Ltda. | Chile | (1) | Subsidiary Shareholdes | Sales of products | CLP | 104,600 | 85,430 |
| 0-E | Heineken Brouwerijen B.V. | Holanda | (3) | Parent company related | Sales of products | Euros | 218,853 | 250,275 |
| 0-E | Heineken Italia Spa. | Italia | (3) | Parent company related | Marketing services | Euros | 16,689 | 21,907 |
| 0-E | Compañía Cervecera del Trópico | Mexico | (3) | Subsidiary related | Marketing services | USD | - | 201,045 |
| 0-E | Cervecería de Panamá S.A. | Panamá | (3) | Subsidiary related | Sales of products | USD | - | 5,287 |
| 96.427.000-7 | Inversiones y Rentas S.A. | Chile | (1) | Parent company related | Sales of products | CLP | 8,111 | - |
| 99.531.920-9 | Viña Valles de Chile S.A. | Chile | (1) | Joint venture until Dec. 2011 | Sales of products | CLP | - | 102,661 |
| 91.705.000-7 | Quiñenco S.A. | Chile | (1) | Parent company related | Sales of products | CLP | - | 1,596 |
| 97.004.000-5 | Banco de Chile | Chile | (1) | Parent company related | Sales of products | CLP | 85,302 | 24,435 |
| 79.903.790-4 | Soc. Agrícola y Ganadera Rio Negro Ltda. | Chile | (1) | Related to the controller | Sales of products | CLP | 452 | 12,697 |
| 91.021.000-9 | Madeco S.A. | Chile | (1) | Parent company related | Sales of products | CLP | 1,784 | 575 |
| 90.081.000-8 | Compañía Chilena de Fósforos S.A. | Chile | (1) | Subsidiary Shareholdes | Sales of products | CLP | 568 | 71,314 |
| 81.981.500-3 | Terc. y Elaboración de Maderas S.A. | Chile | (1) | Parent company related | Sales of products | CLP | - | 452 |
| 76.115.132-0 | Canal 13 S.P.A | Chile | (1) | Parent company related | Advertising | CLP | 142,430 | - |
| 76.178.803-5 | Viña Tabalí S.A. | Chile | (1) | Related to the controller | Recovery of expenses by division | CLP | 1,838,797 | - |
| 76.175.016-K | Compañía Pisquera Bauza S.A. | Chile | (1) | Associate of Subsidiary | Services Rendered | CLP | 557 | - |
| Totales | 9,984,206 | 6,833,634 | ||||||
Non Current:
| TAX ID | Company | Country of origin | Ref. | Relationship | Transaction | Currency | As of December 31, | |
| 2011 | 2010 | |||||||
| ThCh$ | ThCh$ | |||||||
| 81.805.700-8 | Cooperativa Agrícola Control Pisquero de Elqui y Limarí Ltda. | Chile | (4) | Subsidiary Shareholdess | Loan | UF | 418,922 | 444,685 |
| Totales | 418,922 | 444,685 | ||||||
F - 55
Compañía Cervecerías Unidas S.A. Notes to the Consolidated Financial Statements
|
|
Accounts payable to related parties
Current:
| TAX ID | Company | Country of origin | Ref. | Relationship | Transaction | Currency | As of December 31, | |
| 2011 | 2010 | |||||||
| ThCh$ | ThCh$ | |||||||
| 96.919.980-7 | Cervecería Austral S.A. | Chile | (1) | Joint venture | Purchase of products | CLP | 526,248 | 632,185 |
| 77.755.610-K | Comercial Patagona Ltda. | Chile | (1) | Subsidiary of joint venture | Marketing services | CLP | 39,169 | 35,981 |
| 99.542.980-2 | Foods Compañía de Alimentos CCU S.A. | Chile | (1) | Joint venture | Purchase of products | CLP | 402,300 | 403,555 |
| 99.542.980-2 | Foods Compañía de Alimentos CCU S.A. | Chile | (1) | Joint venture | Rebate | CLP | 234 | 62,002 |
| 99.542.980-2 | Foods Compañía de Alimentos CCU S.A. | Chile | (1) | Joint venture | Consignation sales | CLP | 507,310 | 445,504 |
| 81.805.700-8 | Cooperativa Agrícola Control Pisquero de Elqui y Limarí Ltda. | Chile | (1) | Subsidiary Shareholdes | Purchase of products | CLP | 154,955 | 149,306 |
| 77.051.330-8 | Cervecería Kunstmann Ltda. | Chile | (1) | Subsidiary Shareholdes | Purchase of products | CLP | 12,483 | 9,456 |
| 76.736.010-K | Promarca S.A. | Chile | (1) | Joint venture | License | CLP | 810,188 | 1,335,435 |
| 79.903.790-4 | Soc.Agrícola y Ganadera Rio Negro Ltda. | Chile | (1) | Related to the controller | Recovery from division | CLP | 1,163,160 | - |
| 0-E | Anheuser Busch Latin America Development Corporation | Estados Unidos | (3) | Subsidiary Shareholdes | License and technical assistance | $ARG | - | 971,839 |
| 0-E | Anheuser Busch International, Inc | Estados Unidos | (3) | Subsidiary Shareholdes | Purchase of products | USD | - | 5,906 |
| 0-E | Heineken Brouwerijen B.V. | Holanda | (3) | Parent company related | License and technical assistance | Euros | 3,047,871 | 3,174,000 |
| 97.004.000-5 | Heineken Italia SPA. | Italia | (1) | Joint venture | Purchase of products | CLP | 26,227 | - |
| 90.081.000-8 | Compañía Chilena de Fósforos S.A. | Chile | (1) | Subsidiary Shareholdes | Purchase of products | CLP | - | 51 |
| 99.531.920-9 | Viña Valles de Chile S.A. | Chile | (1) | Joint venture until Dec. 2011 | Purchase of products | CLP | - | 72,830 |
| 76.178.803-5 | Viña Tabalí S.A. | Chile | (1) | Related to the controller | Recovery from division | CLP | 1,127,054 | - |
| 0-E | Cervecería Modelo S.A. | Mexico | (3) | Subsidiary related | Purchase of products | USD | - | 42,081 |
| 0-E | Cía. Cervecera del Trópico | Mexico | (3) | Subsidiary related | Purchase of products | USD | - | 84,186 |
| 78.105.460-7 | Alimentos Nutrabien S.A. | Chile | (1) | Parent company related | Purchase of products | CLP | 5,938 | - |
| 96.908.430-9 | Telefónica del Sur Servicios Intermedios S.A. | Chile | (1) | Parent company related | Telephony services | CLP | - | 3,786 |
| 87.938.700-0 | Agroproductos Bauza y Cía Ltda. | Chile | (1) | Related Associate | Purchase of products | CLP | 572,859 | - |
| 76.175.016-K | Compañía Pisquera Bauza S.A. | Chile | (1) | Associate of Subsidiary | Royalty | CLP | 15,860 | - |
| 76.029.691-0 | Comarca S.A. | Chile | (6) | Related Associate | Access Fee | UF | 398,796 | - |
| 97.004.000-5 | Banco de Chile | Chile | (1) | Parent company related | Services of invoicing | CLP | 605 | - |
| 92.048.000-4 | Sudamericana Agencias Aereas y Marítima S.A. | Chile | (1) | Related to the controller | Transportation services | CLP | 83 | - |
| 99.505.690-9 | Blue Two Chile S.A. | Chile | (1) | Parent company related | Telephony services | CLP | 161 | - |
| Totales | 8,811,500 | 7,428,103 | ||||||
Non Current:
| TAX ID | Company | Country of origin | Ref. | Relationship | Transaction | Currency | As of December 31, | |
| 2011 | 2010 | |||||||
| ThCh$ | ThCh$ | |||||||
| 99.542.980-2 | Foods Compañía de Alimentos CCU S.A. | Chile | (5) | Joint Venture | Purchase of land | CLP | 610,093 | 610,093 |
| 81.805.700-8 | Cooperativa Agrícola Control Pisquero de Elqui y Limarí Ltda. | Chile | (4) | Subsidiary Shareholdes | Purchase of products | CLP | 8,241 | 10,775 |
| 76.029.691-0 | Comarca S.A. | Chile | (6) | Related Associate | Access Fee | UF | 398,796 | - |
| 2.011.044-9 | Lorenzo Bauza Alvarez | Chile | (7) | Related Associate | Purchase of shares | UF | 15,421 | - |
| 76.024.758-8 | Inversiones y Asesorías Monterroso Ltda. | Chile | (7) | Related Associate | Purchase of shares | UF | 2,966 | - |
| 76.024.756-1 | Inversiones y Asesorías El Salto Ltda. | Chile | (7) | Related Associate | Purchase of shares | UF | 2,966 | - |
| 76.024.774-K | Inversiones y Asesorías La Abadesa Ltda. | Chile | (7) | Related Associate | Purchase of shares | UF | 2,966 | - |
| 76.023.031-6 | Inversiones y Asesorías Buena Esperanza Ltda. | Chile | (7) | Related Associate | Purchase of shares | UF | 2,966 | - |
| 76.024.767-7 | Inversiones y Asesorías Capital y Rentas Ltda. | Chile | (7) | Related Associate | Purchase of shares | UF | 2,966 | - |
| 76.173.468-7 | Fondo de Inversión Privado Mallorca | Chile | (7) | Related Associate | Purchase of shares | UF | 1,437,410 | - |
| Totales | 2,484,790 | 620,868 | ||||||
F - 56
Compañía Cervecerías Unidas S.A. Notes to the Consolidated Financial Statements
|
|
Most significant transactions and effects on results:
The following are the most significant transactions with related entities that are not subsidiaries of the Company and their effect on the Statement of Income:
| TAX ID | Company | Country of origin | Relationship | Transaction | 2011 | 2010 | 2009 | |||
| Amounts | (Charges) /Credits(Effect on Income) | Amounts | (Charges) /Credits(Effect on Income) | Amounts | (Charges) /Credits(Effect on Income) | |||||
| ThCh$ | ThCh$ | ThCh$ | ThCh$ | ThCh$ | ThCh$ | |||||
| 0-E | Anheuser Busch Internacional, Inc (*) | Estados Unidos | Subsidiary Shareholdes | Purchase of products | - | - | 631,897 | - | 156,210 | - |
| 0-E | Anheuser Busch Internacional, Inc (*) | Estados Unidos | Subsidiary Shareholdes | Sales of products | - | - | 3,882,262 | 1,389,186 | 4,234,646 | 1,706,825 |
| 0-E | Anheuser Busch Latin America Development Corporation | Estados Unidos | Subsidiary related | License and technical assistance | - | - | 3,193,553 | (3,193,553) | 2,598,574 | (2,598,574) |
| 0-E | Cervecería Modelo S.A. | México | Subsidiary related | License and technical assistance | - | - | 178,699 | (178,699) | 165,501 | (165,501) |
| 0-E | Cervecería Modelo S.A. | México | Subsidiary related | Purchase of products | - | - | 166,645 | - | - | - |
| 0-E | Cervecería del Trópico | México | Subsidiary related | Advertising contribution | - | - | 624,076 | 624,076 | 115,166 | 115,166 |
| 0-E | Cervecería del Trópico | México | Subsidiary related | Purchase of products | - | - | 2,129,564 | - | 2,291,434 | - |
| 0-E | Heineken Brouwerijen B.V | Holanda | Parent company related | Billed service | 55,993 | (55,993) | - | - | - | - |
| 0-E | Heineken Brouwerijen B.V | Holanda | Parent company related | Sales of products | - | - | 176,616 | 30,750 | 144,600 | 144,600 |
| 0-E | Heineken Brouwerijen B.V | Holanda | Parent company related | Purchase of products | - | - | 192,095 | - | - | - |
| 0-E | Heineken Brouwerijen B.V | Holanda | Parent company related | Sales of products | 1,206,474 | 458,460 | 944,793 | 359,021 | 677,341 | 265,946 |
| 0-E | Heineken Brouwerijen B.V | Holanda | Parent company related | License and technical assistance | 2,042,868 | (2,042,868) | 2,008,841 | (2,008,841) | 1,710,108 | (1,710,108) |
| 0-E | Heineken Italia Spa. | Italia | Parent company related | Advertising contribution | 16,689 | 16,689 | 58,043 | 58,043 | - | - |
| 0-E | Heineken Italia Spa. | Italia | Parent company related | Purchase of products | 90,266 | - | 33,196 | - | - | - |
| 0-E | Nestle Waters Argentina S.A. | Italia | Subsidiary Shareholdes | Technical assistance | 30,497 | (30,497) | 30,513 | (30,513) | 32,965 | (32,965) |
| 0-E | Nestle Waters S.A. | Italia | Subsidiary Shareholdes | Royalty | 67,137 | (67,137) | 98,972 | (98,972) | 56,699 | (56,699) |
| 90.703.000-8 | Nestle Chile S.A. | Italia | Subsidiary Shareholdes | Dividends paid | 2,829,774 | - | 6,345,689 | - | 630,404 | - |
| 76.736.010-k | Promarca S.A. | Chile | Joint venture | Royalty Paid | 3,185,155 | (3,185,155) | 2,268,106 | (2,268,106) | 1,195,439 | (1,195,439) |
| 77.051.330-8 | Cerveceria Kunstmann Ltda | Chile | Subsidiary Shareholdes | Sales of products | 216,971 | 161,919 | 212,063 | 169,650 | 173,967 | 139,174 |
| 77.051.330-8 | Cerveceria Kunstmann Ltda | Chile | Subsidiary Shareholdes | Services of invoicing | 83,672 | 62,442 | 54,308 | 54,308 | 104,183 | 104,183 |
| 77.755.610-k | Comercial Patagona Ltda. | Chile | Subsidiary Joint venture | Marketing services | 147,493 | (147,493) | 96,714 | (96,714) | 76,418 | (76,418) |
| 77.755.610-k | Comercial Patagona Ltda. | Chile | Subsidiary Joint venture | Sales of products | 1,338,141 | 548,638 | 1,149,652 | 528,840 | 702,648 | 289,851 |
| 81.805.700-8 | Coop.Agr.Control Pisquero Ltda. | Chile | Subsidiary Shareholdes | Loan | 23,684 | 9,056 | 23,519 | 8,643 | 23,514 | 9,495 |
| 81.805.700-8 | Coop.Agr.Control Pisquero Ltda. | Chile | Subsidiary Shareholdes | Dividends paid | 740,121 | - | 533,449 | - | 367,229 | - |
| 81.805.700-8 | Coop.Agr.Control Pisquero Ltda. | Chile | Shares of subsidiary | Grape purchase | 4,922,212 | - | 4,296,838 | - | 4,660,216 | - |
| 90.081.000-8 | Compañía Chilena de Fosforo | Chile | Subsidiary Shareholders | Dividends paid | 3,000,006 | - | 1,573,852 | - | 177,590 | - |
| 96.427.000-7 | Inversiones y Rentas S.A. | Chile | Parent company related | Dividends paid | 34,134,370 | - | 39,480,557 | - | 30,575,169 | - |
| 96.919.980-7 | Cervecería Austral S.A. | Chile | Joint venture | Sales of products | 447,818 | 424,866 | 381,857 | 362,286 | 397,714 | 265,021 |
| 96.919.980-7 | Cervecería Austral S.A. | Chile | Joint venture | Royalty paid | 216,856 | 216,856 | 75,374 | 75,374 | 135,837 | (135,837) |
| 96.919.980-7 | Cervecería Austral S.A. | Chile | Joint venture | Royalty charged | 192,628 | (192,628) | 267,303 | (267,303) | 489,737 | (489,737) |
| 96.919.980-7 | Cervecería Austral S.A. | Chile | Joint venture | Purchase of products | 2,293,195 | - | 1,933,687 | - | 757,572 | - |
| 97.004.000-5 | Banco de Chile | Chile | Parent company related | Services | 119,388 | (119,388) | 181,178 | (181,178) | 128,927 | (128,927) |
| 97.004.000-5 | Banco de Chile | Chile | Parent company related | Sales of products | 37,984 | 15,574 | 44,191 | 11,048 | 30,126 | 18,075 |
| 97.004.000-5 | Banco de Chile | Chile | Parent company related | Derivatives | 35,101,844 | (87,148) | 2,125,909 | (102,486) | 1,586,430 | 81,863 |
| 97.004.000-5 | Banco de Chile | Chile | Parent company related | Investments | 143,679,043 | 935,070 | 127,401,011 | 246,018 | 80,031,416 | 250,000 |
| 97.004.000-5 | Banco de Chile | Chile | Parent company related | Leasing Pay | 343,386 | 49,424 | 335,218 | 61,266 | 329,712 | 73,152 |
| 99.531.920-9 | Viña Valles de Chile S.A. | Chile | Joint venture until Dec. 2011 | Billing of services | 157,332 | - | 22,957 | 22,957 | 32,310 | 32,310 |
| 99.531.920-9 | Viña Valles de Chile S.A. | Chile | Joint venture until Dec. 2011 | Sales of products | 21,935 | 21,935 | 5,639 | 871 | 6,581 | 3,955 |
| 99.531.920-9 | Viña Valles de Chile S.A. | Chile | Joint venture until Dec. 2011 | Purchase of products | 89,744 | 13,862 | 235,885 | - | 285,107 | - |
| 99.531.920-9 | Viña Valles de Chile S.A. | Chile | Joint venture until Dec. 2011 | Remittance paid | 5,241,975 | - | 3,341,762 | - | 1,409,800 | - |
| 99.531.920-9 | Viña Valles de Chile S.A. | Chile | Joint venture until Dec. 2011 | Remittance received | 2,722,942 | - | 3,397,762 | - | 1,372,762 | - |
| 99.542.980-2 | Foods Compañía de Alimentos CCU.S.A | Chile | Joint venture | Interests | 344,180 | 344,180 | 164,004 | 164,004 | 93,199 | 93,199 |
| 99.542.980-2 | Foods Compañía de Alimentos CCU.S.A | Chile | Joint venture | Lease paid | 1,809,630 | 335,715 | - | 41,033,604 | - | |
| 99.542.980-2 | Foods Compañía de Alimentos CCU.S.A | Chile | Joint venture | Services | 2,476,491 | 2,476,491 | 2,574,378 | 2,574,378 | 1,705,216 | 1,705,216 |
| 99.542.980-2 | Foods Compañía de Alimentos CCU.S.A | Chile | Joint venture | Services | 68,058 | (68,058) | 103,177 | (103,177) | 159,811 | (159,811) |
| 99.542.980-2 | Foods Compañía de Alimentos CCU.S.A | Chile | Joint venture | Consignment sales | 10,302,926 | - | 9,956,650 | - | 9,262,382 | - |
| 99.542.980-2 | Foods Compañía de Alimentos CCU.S.A | Chile | Joint venture | Sales of products | 747,865 | 344,018 | 672,683 | 309,434 | 921,784 | 424,021 |
| 84.898.000-5 | Alusa S.A. | Chile | Subsidiary related | Purchase of products | 757,722 | 969,567 | - | 846,150 | - | |
| 76.115.132-0 | Canal 13 S.P.A | Chile | Parent company related | Adverstising | 3,004,581 | (2,765,844) | - | - | - | - |
| 96.657.690-7 | Inversiones Punta Brava S.A. | Chile | Parent company related | Services paid | 8,491 | (8,491) | - | - | - | - |
| 99.571.220-8 | Banchile Corredores de Bolsa S.A. | Chile | Parent company related | Investments | 11,880,000 | 19,486 | 60,840,500 | 30,042 | 128,667,350 | 44,516 |
| 79.903.790-4 | Soc. Agrícola y Ganadera Rio Negro Ltda. | Chile | Related to the controller | Recovery from division | 1,163,161 | - | 85,868 | - | - | - |
| 76.178.803-5 | Viña Tabalí S.A. | Chile | Related to the controller | Recovery of expenses by division | 1,753,549 | - | - | - | - | - |
| 76.178.803-5 | Viña Tabalí S.A. | Chile | Related to the controller | Recovery from division | 1,127,054 | - | - | - | - | - |
| 76.178.803-5 | Viña Tabalí S.A. | Chile | Related to the controller | Collected invoices | 83,878 | 83,878 | - | - | - | - |
| 81.805.700-8 | Compañía Pisquera Bauza S.A. | Chile | Associate of Subsidiary | Royalty | 15,860 | - | - | - | - | - |
| 76.029.691-0 | Comarca S.A. | Chile | Related Associate | Access Fee | 797,592 | - | - | - | - | - |
| 2.011.044-9 | Lorenzo Bauza Alvarez | Chile | Related Associate | Purchase of shares | 15,421 | - | - | - | - | - |
| 76.024.758-8 | Inversiones y Asesorías Monterroso Ltda. | Chile | Related Associate | Purchase of shares | 2,966 | - | - | - | - | - |
| 76.024.756-1 | Inversiones y Asesorías El Salto Ltda. | Chile | Related Associate | Purchase of shares | 2,966 | - | - | - | - | - |
| 76.024.774-K | Inversiones y Asesorías La Abadesa Ltda. | Chile | Related Associate | Purchase of shares | 2,966 | - | - | - | - | - |
| 76.023.031-6 | Inversiones y Asesorías Buena Esperanza Ltda. | Chile | Related Associate | Purchase of shares | 2,966 | - | - | - | - | - |
| 76.024.767-7 | Inversiones y Asesorías Capital y Rentas Ltda. | Chile | Related Associate | Purchase of shares | 2,966 | - | - | - | - | - |
| 76.173.468-7 | Fondo de Inversión Privado Mallorca | Chile | Related Associate | Purchase of shares | 1,437,410 | - | - | - | - | - |
| 87.938.700-0 | Agroproductos Bauza y Cía Ltda. | Chile | Related Associate | Purchase of products | 572,859 | - | - | - | - | - |
F - 57
Compañía Cervecerías Unidas S.A. Notes to the Consolidated Financial Statements
|
|
Remuneration of the Management key employees
The Company is managed by a Board of Directors with 9 members, who are in office for a 3-year term, and they may be re-elected.
The Board was appointed at the General Shareholders Meeting held on April 20, 2009. The Chairman and the Vice Chairman, as well as the members of the Directors Committee, the Audit Committee and the Business Committee were appointed in subsequent board meetings. On May 4, 2011, Mr. Giorgio Maschietto Montuschi resigned as Director of the Company, and was replaced by Jorge Luis Ramos at Board Meeting held on the same date.
As agreed at the General Shareholders Meeting held on April 15, 2011, the directors’ remuneration consists in a per diem for their attendance at each meeting of UF100 per Director, and twice that amount for the Chairman. Additionally, 3% of the total distributable dividend will be distributed proportionally to each Director. In case the distributed dividends exceed 50% the net profits, the Board of Directors’ share shall be calculated over a maximum 50% of such profits. In addition, those directors that are members of the Directors Committee and the Business Committee receive a per diem of UF 34 and UF 17, respectively, for each session they attend. The Directors that are members of the Audit Committee receive a monthly per diem of UF 25.
According to the above, as of December 31, 2011, the Directors received ThCh$ 2,317,754 (ThCh$ 2,416,295 in 2010) in per diems and shares. In addition, ThCh$ 107,298 (ThCh$ 110,355 in 2010) were paid in compensation for gains sharing to the main executives of the Parent Company.
The following is the total remuneration received by the top officers of the parent company during the years ended as of December 31, 2011 and 2010:
| As of December 31 | ||
| 2011 | 2010 | |
| M$ | M$ | |
| Salaries | 4,891,983 | 4,541,653 |
| Employees’ short-term benefits | 1,629,514 | 2,107,174 |
| Employments termination benefits | 850,733 | 237,740 |
| Total | 7,372,230 | 6,886,567 |
The Company grants annual bonuses, voluntary and variable, to the top officers, which are not subject to an agreement and are decided on the basis of the compliance with individual and corporate goals, and depending on the year results.
F - 58
Compañía Cervecerías Unidas S.A. Notes to the Consolidated Financial Statements
|
|
Note 17Inventories
The inventory balances were as follows:
| As ofDecember 31,2011 | As ofDecember 31,2010 | |
| ThCh$ | ThCh$ | |
| Finished products | 34,799,800 | 27,181,274 |
| In process products | 1,046,718 | 823,273 |
| Agricultural exploitation | 5,981,943 | 5,609,586 |
| Raw material | 79,194,053 | 71,305,263 |
| In transit raw material | 5,704,060 | 1,082,695 |
| Materials and products | 3,681,613 | 3,525,501 |
| Realizable net value estimate and obsolescence | (1,873,003) | (1,174,334) |
| Total | 128,535,184 | 108,353,258 |
The Company wrote down a total of ThCh$ 398,673, ThCh$ 337,866 and ThCh$ 366,867 relating to inventory shrinkage and obsolescence for the years ended December 31, 2011, 2010 and 2009, respectively.
Additionally, an estimation for impairment of inventories include amounts of obsolescence related to low turnover, technical obsolescence and / or product recalls from the market.
Movement above estimate is as follows:
| As ofDecember 31,2011 | As ofDecember 31,2010 | As ofDecember 31,2009 | |
| ThCh$ | ThCh$ | ThCh$ | |
| Initial balance | (1,174,334) | (1,437,917) | (889,810) |
| Inventories write-down estimation | (956,163) | (873,093) | (733,629) |
| Inventories recognised as an expense | 561,531 | 1,136,676 | 185,522 |
| Business combination effect | (304,037) | - | - |
| Total | (1,873,003) | (1,174,334) | (1,437,917) |
For the year ended December 31, 2010 all inventories destroyed by the earthquake of February 27, 2010, have been written off.
As of December 31, 2011 and 2010, the Company does not have any inventory pledged to guarantee financial obligations.
F - 59
Compañía Cervecerías Unidas S.A. Notes to the Consolidated Financial Statements
|
|
Note 18 Other non-financial assets
The Company maintained the following other non-financial assets:
| As ofDecember 31,2011 | As ofDecember 31,2010 | |
| ThCh$ | ThCh$ | |
| Insurance paid | 2,583,431 | 1,852,346 |
| Advertising | 4,468,713 | 4,673,793 |
| Advances to suppliers | 3,461,077 | 2,210,643 |
| Guarantees paid | 248,928 | 236,733 |
| Consumables | 386,503 | 396,592 |
| Dividends receivable | 1,505,396 | 1,349,773 |
| Recoverable taxes | 1,157,505 | 1,062,954 |
| Cost of subsidiary acquired (1) | - | 6,134,509 |
| Other | 751,207 | 399,314 |
| Total | 14,562,760 | 18,316,657 |
| Current | 11,565,924 | 9,489,913 |
| Non current | 2,996,836 | 8,826,744 |
| Total | 14,562,760 | 18,316,657 |
| (1)See Note 8 Business combination, letter a). |
Note 19Investments accounted by the equity method
Joint ventures and Associates
As of December 31, 2011 and 2010, the Company has a direct interest until of 50% in the following companies: Cervecería Austral S.A.; Foods Compañía de Alimentos CCU S.A.; Viña Valles de Chile S.A., Compañía Pisquera Bauzá S.A. and Promarca S.A.
The share value of the investments in joint ventures and associates is as follows:
| As ofDecember 31,2011 | As ofDecember 31,2010 | |
| ThCh$ | ThCh$ | |
| Cervecería Austral S.A. (1) | 4,669,081 | 4,608,402 |
| Foods Compañía de Alimentos CCU S.A. (2) | 12,849,839 | 13,040,648 |
| Promarca S.A. (3) | 17,683,016 | 17,682,781 |
| Viña Valles de Chile S.A. (4) | - | 7,264,212 |
| Compañía Pisquera Bauzá S.A. (5) | 4,721,741 | - |
| Total | 39,923,677 | 42,596,043 |
F - 60
Compañía Cervecerías Unidas S.A. Notes to the Consolidated Financial Statements
|
|
The above mentioned values include the goodwill generated through the acquisition of the following joint ventures, which are presented net of any impairment loss:
| As ofDecember 31,2011 | As ofDecember 31,2010 | |
| ThCh$ | ThCh$ | |
| Cervecería Austral S.A. | 1,894,770 | 1,894,770 |
| Promarca S.A. | 1,519,364 | 1,519,364 |
| Total | 3,414,134 | 3,414,134 |
The results accrued in joint ventures and associates are as follows:
| For the years ended December 31, | |||
| 2011 | 2010 | 2009 | |
| ThCh$ | ThCh$ | ThCh$ | |
| Cervecería Austral S.A. | 130,255 | 155,732 | 103,311 |
| Foods Compañía de Alimentos CCU S.A. | (190,810) | (354,338) | 51,364 |
| Promarca S.A. | 1,767,564 | 1,649,772 | 1,256,871 |
| Viña Valles de Chile S.A. | (637,698) | (485,044) | (62,402) |
| Compañía Pisquera Bauzá S.A. | - | - | - |
| Total | 1,069,311 | 966,122 | 1,349,144 |
The changes of the investment in joint ventures and associates during such periods were as follows:
| For the years ended December 31, | |||
| 2011 | 2010 | 2009 | |
| ThCh$ | ThCh$ | ThCh$ | |
| Beginning balance | 42,596,043 | 43,284,760 | 42,341,048 |
| Investments in joint ventures | 4,721,741 | - | 1,036,500 |
| Participation in the joint ventures profit/loss | 1,069,311 | 966,122 | 1,349,144 |
| Business combination (1) | (6,626,514) | - | - |
| Dividends | (1,837,463) | (1,649,773) | (1,444,566) |
| Other changes | 559 | (5,066) | 2,634 |
| Total | 39,923,677 | 42,596,043 | 43,284,760 |
(1) This amount is related by the business combination done in Viña Valles de Chile S.A., in which this company ceased to be a joint venture and became a subsidiary of VSPT.
F - 61
Compañía Cervecerías Unidas S.A. Notes to the Consolidated Financial Statements
|
|
Following are the significant matters regarding the investments accounted by the equity method:
(1) Cervecería Austral S.A.
It is a closed stock company that operates a beer manufacturing facility in the southern end of Chile, being the southern most breweries in the world.
(2)Foods Compañía de Alimentos CCU S.A.
It is a closed stock company devoted to the production and marketing of food products, like cookies and other baked goods, caramels, candy and cereal, among others.
(3)Promarca S.A.
It is a closed stock company with its main activity brings the acquisition, development and administration of trademarks and their corresponding licenses to their operators.
As per an agreement between New Ecusa S.A. and Watt's S.A. dated December 22, 2006, a clause was agreed establishing that if the products manufactured with the trademarks acquired increase their percentage of income during a three year term, New Ecusa S.A. shall pay an additional price for the rights of the acquired trademarks. Having been verified the above condition, at December 31, 2009 payment was made in January 2010 for an amount to ThCh$ 1,513,922.
At December 31, 2011, Promarca S.A. recorded a profit of ThCh$ 3,535,127 (ThCh$ 3,299,547 in 2010), which in accordance with the Company´s policies is 100% distributable.
The companies aforementioned in paragraphs (1) to (3) are jointly controlled entities as a consequence of a controlling agreement between the investors and the Company. The Controlling agreement establishes the terms and conditions for the joint action of the different participating investors, as regards obtaining and maintaining the control, and to the agreements adopted at these companies Shareholders Meetings and Board of Directors.
(4) Viña Valles de Chile S.A.
It is a closed stock company, devoted to the production of Premium wines of the Tabalí and Leyda vineyards.
On September 6, 2011, at the Board Meeting of Viña San Pedro Tarapacá S.A. (VSPT), it was agreed to divide Viña Valles de Chile S.A. (VDC) whose owners were VSPT and Agrícola y Ganadero Río Negro Limitada (ARN), by equal parts. VDC had two major vineyards: Viña Tabalí and Viña Leyda, each located in unique valleys, prominent within the national wine industry and recognized internationally. Viña Tabalí has a winery and vineyards located in the Limarí Valley; and, Viña Leyda has vineyards and its operations in of Leyda Valley. Through this agreement, VSPT remains the 100% owner of Viña Leyda (whose net assets remain within VDC) and ARN remains the 100% owner of Viña Tabalí. This transaction concluded on December 29, 2011, through a stock swap contract, and therefore from this date VDC became a subsidiary of VSPT with a percentage of direct and indirect participation of a 100%. From the month of December it is included in the consolidation of these Financial Statements.
(5) Compañía Pisquera Bauzá S.A.
On December 2, 2011, the subsidiary Compañía Pisquera de Chile S.A. (CPCh) signed a licence agreement for the commercialization and distribution of brand of pisco Bauzá in Chile. In addition, this transaction considers, also, the acquisition by CPCh of 49% of the licensor society Compañía Pisquera Bauzá S.A, owner of the brand Bauzá in Chile, and the family Bauzá hold 51% of that company and the whole of productive assets, which continue linked to the production of pisco Bauzá, thus maintaining its quality, origin and premium character. The total cost of this transaction as of December 31, 2011, was ThCh$ 4.721.741 and the total disbursement was ThCh$ 2,456,489. At the date of issuance of these consolidated financial statements the Company is in the process of assessing the fair values.
F - 62
Compañía Cervecerías Unidas S.A. Notes to the Consolidated Financial Statements
|
|
The summarized financial information of the main items in the financial statements of the aforesaid companies as of December 31, 2011, 2010 and 2009, appears in detail inNote 7.
The Company does not have contingent liabilities related to joint ventures and associates as of December 31, 2011.
Note 20 Intangible Assets (net)
The intangible assets movement during the years ended as of December 31, 2010 and 2011, was as follows:
| Trademarks | Softwareprograms | Water rights | Distribution rights | Total | |
| ThCh$ | ThCh$ | ThCh$ | ThCh$ | ThCh$ | |
| As of January 1, 2010 | |||||
| Historic Cost | 30,713,542 | 12,754,248 | 603,166 | - | 44,070,956 |
| Accumulated amortization | - | (10,765,505) | - | - | (10,765,505) |
| Book Value | 30,713,542 | 1,988,743 | 603,166 | - | 33,305,451 |
| As of December 31, 2010 | |||||
| Additions | 193,768 | 3,729,733 | 53,809 | - | 3,977,310 |
| Amortization | - | (1,000,282) | - | - | (1,000,282) |
| Conversion effect | (1,266,728) | (33,530) | - | - | (1,300,258) |
| Book Value | 29,640,582 | 4,684,664 | 656,975 | - | 34,982,221 |
| As of January 1, 2011 | |||||
| Historic Cost | 29,640,582 | 16,450,451 | 656,975 | - | 46,748,008 |
| Accumulated amortization | - | (11,765,787) | - | - | (11,765,787) |
| Book Value | 29,640,582 | 4,684,664 | 656,975 | - | 34,982,221 |
| As of December 31, 2011 | |||||
| Additions | 29,110 | 1,434,863 | 47,993 | 519,200 | 2,031,166 |
| Additions by business combination | 5,070,578 | - | - | - | 5,070,578 |
| fx differences | - | - | - | (6,082) | (6,082) |
| Amortization | - | (1,028,169) | - | (123,718) | (1,151,887) |
| Conversion effect | 235,276 | 11,988 | - | - | 247,264 |
| Book Value | 34,975,546 | 5,103,346 | 704,968 | 389,400 | 41,173,260 |
| As of December 31, 2011 | |||||
| Historic Cost | 34,975,546 | 17,897,302 | 704,968 | 519,200 | 54,097,016 |
| Accumulated amortization | - | (12,793,956) | - | (129,800) | (12,923,756) |
| Book Value | 34,975,546 | 5,103,346 | 704,968 | 389,400 | 41,173,260 |
The Company does not maintain any pledge or restriction on intangible assets.
The detail of the Trademarks appears below:
| Trademarks | As of December31, 2011 | As of December31, 2010 | As of December31, 2009 |
| ThCh$ | ThCh$ | ThCh$ | |
| Commercial brands Argentinean beers | 9,694,493 | 9,459,217 | 10,723,991 |
| Commercial brands Argentinean cider | 3,975,088 | - | - |
| Commercial brands Chilean beers | 304,518 | 286,518 | 286,518 |
| Commercial brands Spirits | 1,244,748 | 1,233,638 | 1,039,870 |
| Commercial brands wines | 19,756,699 | 18,661,209 | 18,663,163 |
| 34,975,546 | 29,640,582 | 30,713,542 |
Management has not seen any evidence of impairment of Intangible assets.
F - 63
Compañía Cervecerías Unidas S.A. Notes to the Consolidated Financial Statements
|
|
Note 21 Goodwill
The goodwill movements during the years ended as of December 31, 2010 and 2011, was as follows:
| Goodwill | |
| ThCh$ | |
| As of January 1, 2010 | |
| Historic Cost | 70,170,118 |
| Book Value | 70,170,118 |
| As of December 31, 2010 | |
| Conversion effect | (2,408,712) |
| Book Value | 67,761,406 |
| As of January 1, 2011 | |
| Historic Cost | 67,761,406 |
| Book Value | 67,761,406 |
| As of December 31, 2011 | |
| Additions by business combination | 1,232,417 |
| Conversion effect | 447,384 |
| Book Value | 69,441,207 |
| As of December 31, 2011 | |
| Historic Cost | 69,441,207 |
| Accumulated amortization | - |
| Book Value | 69,441,207 |
The Company does not maintain any pledge or restriction on goodwill.
Goodwill from investments acquired in business combinations is assigned as of the acquisition date to the Cash Generating Units (CGU), or group of CGUs that it is expected will benefit from the business combination synergies. The book value of the goodwill of the investments assigned to the CGUs inside the Company segments are:
| Segment | Cash Generating Unit | As of December31, 2011 | As ofDecember 31,2010 |
| (CGU) | ThCh$ | ThCh$ | |
| Beer Argentina | CCU Argentina S.A. y filiales | 18,435,573 | 17,988,189 |
| Cider Argentina | CCU Argentina S.A. y filiales | 1,232,417 | - |
| Non alcoholic | Embotelladora Chilenas Unidas S.A. | 7,563,763 | 7,563,763 |
| Wines | Viña San Pedro Tarapacá S.A. | 32,400,266 | 32,400,266 |
| Spirits | Compañía Pisquera de Chile S.A. | 9,808,549 | 9,808,549 |
| Others | 639 | 639 | |
| Total | 69,441,207 | 67,761,406 |
Goodwill assigned to the CGU is submitted to impairment tests annually or with a higher frequency in case there are indications that any of the CGU could experience impairment. The recoverable amount of each CGU is determined as the higher of value in use or fair value less costs to sell. To determine the value in use, the Company has used cash flow projections over a 5-year span, based on the budgets and projections reviewed by the Management for the same term. The rates used to discount the projected cash flows reflect the market assessment of the specific risks related to the corresponding CGU. The discount rates have been estimated on the basis of the weighted average cost of capital (WACC).
The Company has not seen any evidence of impairment of goodwill.
F - 64
Compañía Cervecerías Unidas S.A. Notes to the Consolidated Financial Statements
|
|
Note 22 Property, plant and equipment
The movement of Property, plant and equipment as of December 31, 2010 and 2011, is as follows:
| Land, buildings andcontruction | Machinery andequipment | Bottles andcontainers | Other Equipment | Assets undercontruction | Furniture,accesories andvehicles | Total | |
| ThCh$ | ThCh$ | ThCh$ | ThCh$ | ThCh$ | ThCh$ | ThCh$ | |
| As of January 1, 2010 | |||||||
| Historic Cost | 347,615,660 | 271,197,195 | 182,468,162 | 67,898,564 | 59,814,674 | 29,823,432 | 958,817,687 |
| Accumulated depreciation | (88,274,446) | (175,697,695) | (127,883,066) | (56,995,219) | - | (19,715,951) | (468,566,377) |
| Book Value | 259,341,214 | 95,499,500 | 54,585,096 | 10,903,345 | 59,814,674 | 10,107,481 | 490,251,310 |
| As of December 31, 2010 | |||||||
| Additions | - | - | - | - | 70,066,196 | - | 70,066,196 |
| Conversion effect historic cost | (2,523,957) | (4,084,318) | (2,142,520) | (1,022,320) | (23,888) | (162,783) | (9,959,786) |
| Transfers | 15,442,636 | 16,933,869 | 17,497,263 | 8,603,937 | (65,152,398) | 6,674,693 | - |
| Divestitures | (215,284) | (647,930) | (95,896) | (479,286) | - | (208,408) | (1,646,804) |
| Depreciation | (8,198,928) | (15,865,324) | (13,203,508) | (2,551,754) | - | (4,376,894) | (44,196,408) |
| Conversion effect depreciation | 226,855 | 1,616,938 | 865,818 | 809,715 | - | 128,385 | 3,647,711 |
| Book Value | 264,072,536 | 93,452,735 | 57,506,253 | 16,263,637 | 64,704,584 | 12,162,474 | 508,162,219 |
| As of December 31, 2010 | |||||||
| Historic Cost | 360,319,055 | 283,398,816 | 197,727,009 | 75,000,895 | 64,704,584 | 36,126,934 | 1,017,277,293 |
| Accumulated depreciation | (96,246,519) | (189,946,081) | (140,220,756) | (58,737,258) | - | (23,964,460) | (509,115,074) |
| Book Value | 264,072,536 | 93,452,735 | 57,506,253 | 16,263,637 | 64,704,584 | 12,162,474 | 508,162,219 |
| As of December 31, 2011 | |||||||
| Additions | - | - | - | - | 81,526,929 | - | 81,526,929 |
| Additions by business combination | 10,720,900 | 3,746,048 | 590,195 | - | 228,728 | 204,575 | 15,490,446 |
| Additions of depreciation accumulated by business combination | (3,002) | (16,435) | (12,961) | - | - | (1,098) | (33,496) |
| Conversion effect historic cost | 482,882 | 812,518 | 500,295 | 215,911 | 8,660 | 33,347 | 2,053,613 |
| Transfers | 18,918,012 | 28,950,367 | 19,380,432 | 6,803,547 | (77,883,015) | 3,830,657 | - |
| Divestitures | (482,799) | (333,174) | (105) | (20,906) | - | (86,693) | (923,677) |
| Write off | (3,854) | (1,884,743) | (47,375) | (54,180) | - | (1,471) | (1,991,623) |
| Depreciation | (7,923,464) | (17,085,489) | (13,140,353) | (3,390,393) | - | (5,048,769) | (46,588,468) |
| Conversion effect depreciation | (44,820) | (318,269) | (193,232) | (167,045) | - | (23,467) | (746,833) |
| Book Value | 285,736,391 | 107,323,558 | 64,583,149 | 19,650,571 | 68,585,886 | 11,069,555 | 556,949,110 |
| As of December 31, 2011 | |||||||
| Historic Cost | 389,954,196 | 314,689,832 | 218,150,451 | 81,945,267 | 68,585,886 | 40,107,349 | 1,113,432,981 |
| Accumulated depreciation | (104,217,805) | (207,366,274) | (153,567,302) | (62,294,696) | - | (29,037,794) | (556,483,871) |
| Book Value | 285,736,391 | 107,323,558 | 64,583,149 | 19,650,571 | 68,585,886 | 11,069,555 | 556,949,110 |
F - 65
Compañía Cervecerías Unidas S.A. Notes to the Consolidated Financial Statements
|
|
The balance of the land at the end of each year is as follows:
| As ofDecember 31,2011 | As ofDecember 31,2010 | |
| ThCh$ | ThCh$ | |
| Land | 157,235,851 | 152,001,990 |
| Total | 157,235,851 | 152,001,990 |
The costs of capitalized interest as of December 31, 2011, amount to ThCh$ 331,320 (ThCh$ 810,725 in 2010).
Due to the nature of the Company’s businesses, the asset values do not consider an estimate for the cost of dismantling, withdrawal or rehabilitation.
The Company does not maintain pledges or restrictions over property, plant and equipment items, except for the land and building under finance lease.
Management has not seen any evidence of impairment of Property, plant and equipment in 2011 and 2010.
For the year ended December 31, 2010, all Property, plant and equipment destroyed by the earthquake of February 27, 2010, were written off.
Assets under finance lease:
The book value of land and buildings relates to finance lease agreements for the parent company and subsidiaries. Such assets will not be owned by the Company until the corresponding purchase options are exercised.
| As ofDecember 31,2011 | As ofDecember 31,2010 | |
| ThCh$ | ThCh$ | |
| Lands | 1,840,483 | 1,704,170 |
| Buildings | 9,879,886 | 9,849,554 |
| Machinery and equipment | 1,276,529 | 1,065,189 |
| Total | 12,996,898 | 12,618,913 |
Note 27,letter b) includes the detail of the lease agreements, and it also reconciles the total amount of the future minimum lease payments and their current value as regards such assets, the purchase options originated at Compañía Cervecera Kunstmann S.A. and CCU S.A.
F - 66
Compañía Cervecerías Unidas S.A. Notes to the Consolidated Financial Statements
|
|
Note 23 Investment Property
Changes in the movement of the investment property during the years ended of December 31, 2010 and 2011, is as follows:
| Land | Buildings | Total | |
| ThCh$ | ThCh$ | ThCh$ | |
| As of January 1, 2010 | |||
| Historic Cost | 15,231,442 | 60,121 | 15,291,563 |
| Depreciation | - | (255) | (255) |
| Book Value | 15,231,442 | 59,866 | 15,291,308 |
| As of December 31, 2010 | |||
| Additions | 5,018 | 497,101 | 502,119 |
| Disposals (1) | (7,992,603) | - | (7,992,603) |
| Depreciation | - | (4,129) | (4,129) |
| Conversion effect | (393,420) | - | (393,420) |
| Book Value | 6,850,437 | 552,838 | 7,403,275 |
| As of December 31, 2010 | |||
| Historic Cost | 6,850,437 | 557,222 | 7,407,659 |
| Depreciation | - | (4,384) | (4,384) |
| Book Value | 6,850,437 | 552,838 | 7,403,275 |
| As of December 31, 2011 | |||
| Additions | 136,265 | 136,573 | 272,838 |
| Additions (cost) from business combinations | 3,533 | 108,374 | 111,907 |
| Additions (depreciation) from business combinations | - | (9,379) | (9,379) |
| Disposals | (3,533) | (98,995) | (102,528) |
| Depreciation | - | (41,650) | (41,650) |
| Conversion effect | 73,197 | 12,915 | 86,112 |
| Book Value | 7,059,899 | 660,676 | 7,720,575 |
| As of December 31, 2011 | |||
| Historic Cost | 7,059,899 | 713,568 | 7,773,467 |
| Accumulated depreciation | - | (52,892) | (52,892) |
| Book Value | 7,059,899 | 660,676 | 7,720,575 |
Investment property include twenty one lands properties situated in Chile, which are maintained for appreciation purposes, with three of them being leased and generating ThCh$ 3,938 revenue during year 2011 (ThCh$ 3,815 in 2010). Besides, there are two lands in Argentina, which are leased and generated an income for ThCh$ 174,922 for year 2011 (ThCh$ 45,690 in 2010). In addition, the expenses associated with such investment properties amount to ThCh$ 107,813 for the year ended as of December 31, 2011 (ThCh$ 92,080 in 2010).
The values associated to the investment properties maintained by the Company as of December 31, 2011 are valued within the market value for properties with the same characteristics.
Management has not seen any evidence of impairment of Investment property.
The Company does not maintain any pledge or restriction over investment property items.
(1) On July 2, 2010, the Company disposed of property located in Perú, which cost value amounted to ThCh$ 7,992,603. This sale generated a net profit of ThCh$ 6,790,933.
F - 67
Compañía Cervecerías Unidas S.A. Notes to the Consolidated Financial Statements
|
|
Note 24Assets of disposal group held for sale
During the last quarter of 2009, the Board of Tamarí S.A. authorized the sale of fixed assets which includes the winery with facilities for processing and storage of wines as well as of acres that surround it and the guest house. This decision is based primarily on the advantage of consolidating the operations of processing and packaging of wines from the Wine Group subsidiaries VSPT facilities in Finca La Celia, generating significant synergies for the Group.
During the year 2010, the Company hired a specialist broker for such assets. Subsequently, on December 13, 2011, a sales reservation contract was signed for all of the assets, and the formalization of this is expected to occur during the first semester of the year 2012.
As described inNote 2.17, non-current assets held for sale have been recorded at the lower of book value and estimated sale value December 31, 2011.
At December 31, 2011 and 2010, the items of assets held for sale are the following:
| Assets of disposal group held for sale | As ofDecember 31,2011 | As ofDecember 31,2010 |
| ThCh$ | ThCh$ | |
| Land | 125,692 | 122,646 |
| Contructions | 231,283 | 225,678 |
| Machinerys | 152,700 | 149,000 |
| Total | 509,675 | 497,324 |
Note 25 Biological Assets
The Company, through its subsidiaries Viña San Pedro Tarapacá S.A., has biological assets corresponding to vines that produce grapes. The vines are segmented into those under formation and those under production, and they are grown both in leased and owned land.
The grapes harvested from these vines are used in the manufacturing of wine under the Company´s own brands, which is marketed both in the domestic market and abroad.
As of December 31, 2011, the Company maintained approximately 4,358, of which 4,226 hectares are for vines in production stage. Of the total hectares mentioned above, 4,043 correspond to own land and 315 to leased land.
The vines under formation are recorded at historic cost, and only start being depreciated when they are transferred to the production phase, which occurs three years after plantation, when they start producing grapes commercially (in volumes that justify their production-oriented handling and later harvest).
During 2011 the production plant vines allowed to harvest a total of approximately 45.7 million kilos of grapes (41.9 million in 2010).
As part of the risk administration activities, the subsidiaries use insurance agreements for the damage caused by nature or other to their biological assets. In addition, either productive or under formation vines are not affected by title restrictions of any kind, nor have they been pledged as a guarantee for financial liabilities.
Under production vines depreciation is carried out on a linear basis and it is based on the 25-years estimated production useful life, which is periodically assessed. Vines under formation are not depreciated until they start production.
The costs incurred for acquiring and planting new vines are capitalized.
The Company uses the amortized historical cost to value its biological assets, the basis that management considers that it represents a reasonable approximation to fair value.
There is no evidence of impairment on the biological assets held by the Company.
F - 68
Compañía Cervecerías Unidas S.A. Notes to the Consolidated Financial Statements
|
|
The movement of biological assets during the years ended December 31, 2010 and 2011, is as follows:
| Biological Assets | UnderProductionVines | Training vines | Total |
| ThCh$ | ThCh$ | ThCh$ | |
| As of January 1, 2010 | |||
| Historic Cost | 25,394,428 | 870,248 | 26,264,676 |
| Accumulated depreciation | (9,364,041) | - | (9,364,041) |
| Book Value | 16,030,387 | 870,248 | 16,900,635 |
| As of December 31, 2010 | |||
| Additions | 50,137 | 758,254 | 808,391 |
| Depreciation | (935,795) | - | (935,795) |
| Conversion effect | (104,601) | - | (104,601) |
| Book Value | 15,040,128 | 1,628,502 | 16,668,630 |
| As of December 31, 2010 | |||
| Historic Cost | 25,339,964 | 1,628,502 | 26,968,466 |
| Accumulated depreciation | (10,299,836) | - | (10,299,836) |
| Book Value | 15,040,128 | 1,628,502 | 16,668,630 |
| As of December 31, 2011 | |||
| Additions | - | 595,752 | 595,752 |
| Additions (cost) from business combinations | 1,000,156 | 1,134,892 | 2,135,048 |
| Additions (depreciation) from business combinations | (30,238) | - | (30,238) |
| Historic cost conversion effect | 27,643 | - | 27,643 |
| Transfers | 831,726 | (831,726) | - |
| Depreciation | (1,066,891) | - | (1,066,891) |
| Depreciation conversion effect | (9,396) | - | (9,396) |
| Book Value | 15,793,128 | 2,527,420 | 18,320,548 |
| As of December 31, 2011 | |||
| Historic Cost | 27,199,489 | 2,527,420 | 29,726,909 |
| Accumulated depreciation | (11,406,361) | - | (11,406,361) |
| Book Value | 15,793,128 | 2,527,420 | 18,320,548 |
Note 26 Income taxes and deferred taxes
Tax accounts receivable
The detail of the taxes receivables is the following:
| As of December31, 2011 | As of December31, 2010 | |
| ThCh$ | ThCh$ | |
| Refundable tax previous year | 1,041,453 | 6,543,992 |
| Taxes under claim | 7,724,642 | 1,767,365 |
| Argentinean tax credits | 1,945,063 | 1,224,330 |
| Monthly provisions | 4,752,691 | 1,371,633 |
| Payment of absorbed profit provision | 33,037 | - |
| Other credits | 1,780,402 | 3,243,667 |
| Total | 17,277,288 | 14,150,987 |
F - 69
Compañía Cervecerías Unidas S.A. Notes to the Consolidated Financial Statements
|
|

Taxes accounts payable
The detail of taxes payable taxes is as follows:
| As of December 31, 2011 | As of December 31, 2010 | |
| ThCh$ | ThCh$ | |
| First category tax | 13,544,710 | 5,699,684 |
| Monthly provisional payments - payable | 2,831,294 | 1,776,423 |
| Article Nº21 unique tax | 93,844 | 87,917 |
| Estimated minimum gain Argentine subsidiaries tax | 288,714 | 332,846 |
| Others | 2,844 | 393,843 |
| Total | 16,761,406 | 8,290,713 |
Tax expense
The detail of the income tax and deferred tax expense for the years ended as of December 31, 2011, 2010 and 2009, is as follows:
| For the years ended December 31, | |||
| 2011 | 2010 | 2009 | |
| ThCh$ | ThCh$ | ThCh$ | |
| Expense (income) as per deferred tax related to the origin andreversal of temporary differences | (5,411,324) | (3,197,956) | (3,007,001) |
| Adjust the previous year | (664,434) | (504,509) | 169,221 |
| Effect of change in tax rate (1) | 649,805 | (513,863) | - |
| Benefit originated by tax losses | (170,372) | (239,683) | 8,605,661 |
| Total income (loss) from deferred taxes | (5,596,325) | (4,456,011) | 5,767,881 |
| Current tax expense | (33,566,408) | (20,508,353) | (17,019,939) |
| Adjustments as regards prior period (2) | (5,727,623) | (182,300) | (471,615) |
| Income tax payment in other countries | - | (2,509,385) | - |
| (Loss) Income from income tax | (44,890,356) | (27,656,049) | (11,723,673) |
| (1) The amount recorded for ThCh$ 649,805 is related to a change in tax rate, based on a modified tax in Chile. This change in tax rate istemporary, and raises the rate of 17% to 20% for year 2011 and 18.5% for year 2012, returning to 17% in year 2013. | |||
| (2) At December 31, 2011, this amount includes ThCh$ 4,273,112 that relate to a final settlement of tax (See Note 35). | |||
The deferred taxes related to items charged or credited directly to Consolidated Statements of Comprehensive Income are as follows:
| For the years ended December 31, | |||
| 2011 | 2010 | 2009 | |
| ThCh$ | ThCh$ | ThCh$ | |
| Net income from cash flow hedge | 42,580 | 79,447 | 1,106,335 |
| Charge (credit) to equity | 42,580 | 79,447 | 1,106,335 |
Effective Rate
The Company’s income tax expense as of December 31, 2011, 2010 and 2009, represents 24.6%, 18.7% and 7.6%, respectively of income before taxes. The following is reconciliation between such effective tax rate and the statutory tax rate valid in Chile.
F - 70
Compañía Cervecerías Unidas S.A. Notes to the Consolidated Financial Statements
|
|
| For the years ended December 31, | ||||||
| 2011 | 2010 | 2009 | ||||
| ThCh$ | Rate % | ThCh$ | Rate % | ThCh$ | Rate % | |
| Income before taxes | 179,692,557 | 147,592,719 | 153,088,841 | |||
| Income tax using the statutory rate | (35,938,511) | 20.0 | (25,090,762) | 17.0 | (26,025,103) | 17.0 |
| Adjustments to reach the effective rate | ||||||
| Tax effects of reorganizations | 94,319 | 0.0 | 562,285 | (0.4) | 10,123,491 | (6.6) |
| Income Tax paid abroad | - | 0.0 | (2,509,385) | 1.7 | - | 0.0 |
| Income not taxable (untaxed expenses) (net) | (319,420) | 0.1 | 4,127,667 | (2.4) | 7,242,552 | (4.8) |
| Effect of change in tax rate | 649,805 | (0.3) | (513,863) | 0.3 | - | 0.0 |
| Effect of tax rates in Argentina | (2,984,492) | 1.6 | (3,545,182) | 2.4 | (2,762,219) | 1.8 |
| Adjustments as regards prior year | (6,392,057) | 3.5 | (686,809) | 0.1 | (302,394) | 0.2 |
| Income tax, as reported | (44,890,356) | 24.9 | (27,656,049) | 18.7 | (11,723,673) | 7.6 |
Deferred taxes
Deferred tax assets and liabilities included in the Balance Sheet were as follows:
| As of December31, 2011 | As of December31, 2010 | |
| ThCh$ | ThCh$ | |
| Deferred tax assets | ||
| Accounts receivable impairment provision | 899,648 | 776,207 |
| Employee benefits and others expenses non taxable | 3,906,748 | 6,603,109 |
| Inventory impairment provision | 320,967 | 325,217 |
| Severance indemnity | 2,821,309 | 2,604,771 |
| Inventory valuation | 1,607,006 | 649,737 |
| Derivatives agreement | 905,378 | 1,143,979 |
| Amortization of intangible | 618,085 | 530,797 |
| Other assets | 2,742,310 | 1,144,770 |
| Tax loss carryforwards | 4,985,328 | 4,767,474 |
| Total assets from deferred taxes | 18,806,779 | 18,546,061 |
| Deferred taxes liabilities | ||
| Fixed assets depreciation | 23,991,932 | 18,366,135 |
| Deposit for Bottles and containers | 3,654,545 | 3,479,816 |
| Capitalized software expense | 403,187 | 600,232 |
| Agricultural operation expense | 2,143,585 | 2,584,797 |
| Derivatives agreements | 666,730 | 72,386 |
| Manufacturing indirect activation costs | 1,665,763 | 1,465,751 |
| Intangible | 5,090,102 | 3,654,733 |
| Lands | 22,105,313 | 20,535,997 |
| Other liabilities | 425,864 | 2,694,168 |
| Total liabilities from deferred taxes | 60,147,021 | 53,454,015 |
| Total | (41,340,242) | (34,907,954) |
No deferred taxes have been recorded for the temporary differences between the tax and accounting value generated by investments in subsidiaries, consequently a deferred tax is neither recognized for the Translation Adjustments or investments in Joint Ventures and Associates.
In accordance with current tax laws in Chile, taxable losses do not expire and can be applied indefinitely. Regarding Argentina, taxable losses expire after 5 years.
F - 71
Compañía Cervecerías Unidas S.A. Notes to the Consolidated Financial Statements
|
|
| Analisys of the deferred tax movement during the year | Deferred Taxes |
| ThCh$ | |
| As of January 1, 2010 | (26,673,153) |
| Deferred taxes from tax loss carryforwards absortion | (4,445,375) |
| Convertion effect | 512,100 |
| Charge to income tax deferred | (4,456,011) |
| Deferred taxes against equity | 79,447 |
| Other movements of deferred taxes | 75,038 |
| Fiscal year movement | (8,234,801) |
| As of December 31, 2010 | (34,907,954) |
| As of December 31, 2011 | |
| Deferred taxes from tax loss carryforwards absortion | (776,857) |
| Charge to income tax deferred | (5,596,325) |
| Convertion effect | (107,593) |
| Deferred taxes against equity | 42,580 |
| Other movements of deferred taxes | 5,907 |
| Fiscal year movement | (6,432,288) |
| As of December 31, 2011 | (41,340,242) |
Note 27 Other financial liabilities
Debts and financial liabilities that accrue interest, classified as per type of obligation and their classification in the consolidated balance sheet were as follows:
| As ofDecember 31,2011 | As of December31, 2010 | |
| ThCh$ | ThCh$ | |
| Bank borrowings (*) | 74,089,495 | 48,551,296 |
| Bonds payable (*) | 151,973,634 | 160,899,845 |
| Financial leases obligations | 16,078,576 | 15,856,614 |
| Derivatives (**) | 405,397 | 1,383,942 |
| Liability coverage (**) | 4,513,399 | 6,275,325 |
| Total | 247,060,501 | 232,967,022 |
| Current | 76,105,061 | 12,821,855 |
| Non current | 170,955,440 | 220,145,167 |
| Total | 247,060,501 | 232,967,022 |
(*) SeeNote5.
(**) SeeNote 6.
F - 72
Compañía Cervecerías Unidas S.A. Notes to the Consolidated Financial Statements
|
|
The maturities and interest rates of such obligations were as follows:
As of December 31, 2011:
| Debtor tax ID | Company | Debtor country | Lending party tax ID | Creditor name | Creditor country | Currency | Undiscounting amounts according to maturity | Amortization rate | Interest Rate | |||||
| 0 to 3 months | 3 months to 1year | Over 1 year to 3years | Over 3 years to 5years | Over 5 years | Total | |||||||||
| ThCh$ | ThCh$ | ThCh$ | ThCh$ | ThCh$ | ThCh$ | % | ||||||||
| Bank borrowings | ||||||||||||||
| O-E | FINCA LA CELIA S.A. | ARGENTINA | O-E | Banco San Juan | ARGENTINA | USD | - | 52,527 | - | - | - | 52,527 | At maturity | 3.50 |
| O-E | FINCA LA CELIA S.A. | ARGENTINA | O-E | Banco San Juan | ARGENTINA | USD | - | 52,527 | - | - | - | 52,527 | At maturity | 3.50 |
| O-E | FINCA LA CELIA S.A. | ARGENTINA | O-E | Banco San Juan | ARGENTINA | USD | - | 52,527 | - | - | - | 52,527 | At maturity | 3.50 |
| O-E | FINCA LA CELIA S.A. | ARGENTINA | O-E | Banco San Juan | ARGENTINA | USD | - | 52,378 | - | - | - | 52,378 | At maturity | 3.50 |
| O-E | FINCA LA CELIA S.A. | ARGENTINA | O-E | Banco San Juan | ARGENTINA | USD | - | 52,378 | - | - | - | 52,378 | At maturity | 3.50 |
| O-E | FINCA LA CELIA S.A. | ARGENTINA | O-E | Banco San Juan | ARGENTINA | USD | - | 52,378 | - | - | - | 52,378 | At maturity | 3.50 |
| O-E | FINCA LA CELIA S.A. | ARGENTINA | O-E | Banco Santander Rio | ARGENTINA | USD | 183,560 | - | - | - | - | 183,560 | At maturity | 3.00 |
| O-E | FINCA LA CELIA S.A. | ARGENTINA | O-E | Banco Santander Rio | ARGENTINA | USD | 106,133 | - | - | - | - | 106,133 | At maturity | 3.00 |
| O-E | FINCA LA CELIA S.A. | ARGENTINA | O-E | Banco Santander Rio | ARGENTINA | USD | 78,469 | - | - | - | - | 78,469 | At maturity | 3.00 |
| O-E | FINCA LA CELIA S.A. | ARGENTINA | O-E | Banco Supervielle | ARGENTINA | USD | - | 131,164 | - | - | - | 131,164 | At maturity | 6.50 |
| O-E | FINCA LA CELIA S.A. | ARGENTINA | O-E | Banco Patagonia | ARGENTINA | USD | 56,747 | - | - | - | - | 56,747 | At maturity | 3.00 |
| O-E | FINCA LA CELIA S.A. | ARGENTINA | O-E | Banco San Juan | ARGENTINA | USD | 50,308 | - | - | - | - | 50,308 | At maturity | 3.50 |
| O-E | FINCA LA CELIA S.A. | ARGENTINA | O-E | Banco San Juan | ARGENTINA | USD | 32,110 | - | - | - | - | 32,110 | At maturity | 3.50 |
| O-E | FINCA LA CELIA S.A. | ARGENTINA | O-E | Banco San Juan | ARGENTINA | USD | 53,955 | - | - | - | - | 53,955 | At maturity | 3.50 |
| O-E | FINCA LA CELIA S.A. | ARGENTINA | O-E | Banco Supervielle | ARGENTINA | USD | - | 131,286 | - | - | - | 131,286 | At maturity | 11.00 |
| O-E | FINCA LA CELIA S.A. | ARGENTINA | O-E | Fondo para la Transformación y Crec. | ARGENTINA | $ARG | 11,308 | - | - | - | - | 11,308 | Semiannual | 6.00 |
| O-E | FINCA LA CELIA S.A. | ARGENTINA | O-E | Fondo para la Transformación y Crec. | ARGENTINA | $ARG | - | - | 16,963 | - | - | 16,963 | Semiannual | 6.00 |
| O-E | FINCA LA CELIA S.A. | ARGENTINA | O-E | Banco Patagonia | ARGENTINA | $ARG | 55,447 | - | - | - | - | 55,447 | At maturity | 15.00 |
| O-E | FINCA LA CELIA S.A. | ARGENTINA | O-E | BNA | ARGENTINA | $ARG | 844 | - | - | - | - | 844 | At maturity | 12.00 |
| 91.041.000-8 | VIÑA SAN PEDRO TARAPACA S.A. (1) | CHILE | 97.004.000-5 | Banco de Chile | CHILE | USD | - | 2,316,269 | - | - | - | 2,316,269 | At maturity | 1.18 |
| 91.041.000-8 | VIÑA SAN PEDRO TARAPACA S.A. (1) | CHILE | 97.004.000-5 | Banco de Chile | CHILE | USD | - | 20,573 | 1,151,612 | 1,151,612 | - | 2,323,797 | At maturity | 1.86 |
| 91.041.000-8 | VIÑA SAN PEDRO TARAPACA S.A. | CHILE | 97.030.000-7 | Bnaco del Estado de Chile | CHILE | USD | - | 5,737,443 | - | - | - | 5,737,443 | At maturity | 1.00 |
| 91.041.000-8 | VIÑA SAN PEDRO TARAPACA S.A. (2) | CHILE | 97.004.000-5 | Banco de Chile | CHILE | USD | - | 47,447 | 2,596,000 | 2,596,000 | - | 5,239,447 | At maturity | 1.86 |
| O-E | COMPAÑÍA INDUSTRIAL CERVECERA S A | ARGENTINA | O-E | Banco Citibank | ARGENTINA | $ARG | - | 1,333,618 | - | - | - | 1,333,618 | At maturity | 15.25 |
| O-E | COMPAÑÍA INDUSTRIAL CERVECERA S A | ARGENTINA | O-E | Banco Frances | ARGENTINA | $ARG | - | 2,442,369 | - | - | - | 2,442,369 | At maturity | 15.25 |
| O-E | CCU CAYMAN BRANCH | ISLAS CAIMAN | O-E | BBVA S.A. New York Branch | E.E U.U. | USD | - | 36,381,447 | - | - | - | 36,381,447 | At maturity | 0.98 |
| 99.586.280-8 | COMPAÑÍA PISQUERA DE CHILE (V.A.) | CHILE | 96.563.620-K | Banco Raboinvestments Chile S.A | CHILE | CLP | 224,333 | 9,961,114 | - | - | - | 10,185,447 | At maturity | 5.75 |
| O-E | SIDRA LA VICTORIA S.A. | ARGENTINA | O-E | Banco HSBC | ARGENTINA | $ARG | - | 25,997 | - | - | - | 25,997 | At maturity | 17.00 |
| O-E | SIDRA LA VICTORIA S.A. | ARGENTINA | O-E | Banco Citibank | ARGENTINA | $ARG | - | 615,058 | - | - | 615,058 | At maturity | 18.00 | |
| O-E | SIDRA LA VICTORIA S.A. | ARGENTINA | O-E | Banco HSBC | ARGENTINA | $ARG | - | - | 14,751 | - | 14,751 | At maturity | 17.00 | |
| O-E | SIDRA LA VICTORIA S.A. | ARGENTINA | O-E | Banco Frances | ARGENTINA | $ARG | 102,206 | - | - | 102,206 | At maturity | 26.00 | ||
| O-E | SIDRA LA VICTORIA S.A. | ARGENTINA | O-E | Banco Macro | ARGENTINA | $ARG | 492,420 | - | - | 492,420 | At maturity | 21.00 | ||
| O-E | SIDRA LA VICTORIA S.A. | ARGENTINA | O-E | Banco Patagonia | ARGENTINA | $ARG | 273,308 | - | - | - | - | 273,308 | At maturity | 26.00 |
| O-E | SIDRA LA VICTORIA S.A. | ARGENTINA | O-E | Banco HSBC | ARGENTINA | $ARG | 243,846 | - | - | - | - | 243,846 | At maturity | 26.00 |
| O-E | SAENZ BRIONES & CIA. S.A.C.I. | ARGENTINA | O-E | Banco HSBC | ARGENTINA | $ARG | - | 64,475 | - | - | - | 64,475 | At maturity | 20.00 |
| O-E | SAENZ BRIONES & CIA. S.A.C.I. | ARGENTINA | O-E | Banco Provincia | ARGENTINA | $ARG | 498,363 | - | - | - | - | 498,363 | At maturity | 13.75 |
| O-E | SAENZ BRIONES & CIA. S.A.C.I. | ARGENTINA | O-E | Banco Citibank | ARGENTINA | $ARG | - | 3,065,669 | - | 3,065,669 | At maturity | 18.00 | ||
| O-E | SAENZ BRIONES & CIA. S.A.C.I. | ARGENTINA | O-E | Banco HSBC | ARGENTINA | $ARG | - | - | 74,278 | - | 74,278 | At maturity | 17.00 | |
| O-E | SAENZ BRIONES & CIA. S.A.C.I. | ARGENTINA | O-E | Banco Patagonia | ARGENTINA | $ARG | 24,308 | - | - | - | - | 24,308 | At maturity | 26.00 |
| O-E | SAENZ BRIONES & CIA. S.A.C.I. | ARGENTINA | O-E | Banco Santander Rio | ARGENTINA | $ARG | 356,120 | - | - | - | - | 356,120 | At maturity | 25.00 |
| O-E | SAENZ BRIONES & CIA. S.A.C.I. | ARGENTINA | O-E | Banco HSBC | ARGENTINA | $ARG | 488,065 | - | - | - | - | 488,065 | At maturity | 26.00 |
| O-E | SAENZ BRIONES & CIA. S.A.C.I. | ARGENTINA | O-E | Banco Macro | ARGENTINA | $ARG | 567,785 | - | - | - | - | 567,785 | At maturity | 21.00 |
| Subtotal | 3,899,635 | 62,588,644 | 3,853,604 | 3,747,612 | - | 74,089,495 | ||||||||
F - 73
Compañía Cervecerías Unidas S.A. Notes to the Consolidated Financial Statements
|
|
| Debtor tax ID | Company | Debtor country | Registration or ID No. Instrument | Creditor country | Currency | Undiscounting amounts according to maturity | Amortization rate | Interest Rate | ||||||
| 0 to 3 months | 3 months to 1year | Over 1 year to 3years | Over 3 years to 5years | Over 5 years | Total | |||||||||
| ThCh$ | ThCh$ | ThCh$ | ThCh$ | ThCh$ | ThCh$ | % | ||||||||
| Bonds payable | ||||||||||||||
| 91.041.000-8 | VIÑA SAN PEDRO TARAPACA S.A. | CHILE | 415 13/06/2005 BONO SERIE A | CHILE | UF | 605,661 | 408,231 | 1,648,221 | 1,651,641 | 7,231,565 | 11,545,319 | Semiannual | 3.80 | |
| 90.413.000-1 | CCU S.A. | CHILE | 388 18/10/2004 BONO SERIE E | CHILE | UF | - | 2,208,592 | 4,244,319 | 4,275,343 | 17,659,247 | 28,387,501 | Semiannual | 4.00 | |
| 90.413.000-1 | CCU S.A. | CHILE | 573 23/03/2009 BONO SERIE H | CHILE | UF | 535,162 | - | - | - | 44,337,147 | 44,872,309 | Semiannual | 4.25 | |
| 90.413.000-1 | CCU S.A. | CHILE | 572 23/03/2009 BONO SERIE I | CHILE | UF | 553,380 | - | 66,615,125 | - | - | 67,168,505 | At maturity | 3.00 | |
| Sub-total | 1,694,203 | 2,616,823 | 72,507,665 | 5,926,984 | 69,227,959 | 151,973,634 | ||||||||
| ||||||||||||||
| Debtor tax ID | Company | Debtor country | Lending party tax ID | Creditor name | Creditor country | Currency | Undiscounting amounts according to maturity | Amortization ate | Interest Rate | |||||
| 0 to 3 months | 3 months to 1year | Over 1 year to 3years | Over 3 ears to 5ears | Over 5 ears | Total | |||||||||
| ThCh$ | ThCh$ | ThCh$ | ThCh$ | ThCh$ | ThCh$ | % | ||||||||
| Financial leases obligations | ||||||||||||||
| 96.981.310-6 | COMPAÑÍA CERVECERA KUNSTMANN S.A. | CHILE | 97.004.000-5 | Banco de Chile | CHILE | UF | 81,323 | 233,240 | 231,505 | 184,772 | 11,133 | 741,973 | Monthly | 5.80 |
| 96.981.310-6 | COMPAÑÍA CERVECERA KUNSTMANN S.A. | CHILE | 97.015.000-5 | Banco Santander Chile | CHILE | UF | 21,793 | 67,778 | 112,976 | - | - | 202,547 | Monthly | 7.20 |
| 90.413.000-1 | CCU S.A. | CHILE | 99.012.000-5 | Consorcio Nacional de Seguros S.A. | CHILE | UF | 16,906 | 52,487 | 209,715 | 92,415 | 14,712,397 | 15,083,920 | Monthly | 7.07 |
| 76.077.848-6 | CERVECERA BELGA DE LA PATAGONIA S.A. | CHILE | 97.015.000-5 | Banco Santander Chile | CHILE | UF | 1,600 | 4,800 | 12,801 | 12,801 | 18,134 | 50,136 | Monthly | 6.27 |
| Subtotal | 121,622 | 358,305 | 566,997 | 289,988 | 14,741,664 | 16,078,576 | ||||||||
| Total | 5,715,460 | 65,563,772 | 76,928,266 | 9,964,584 | 83,969,623 | 242,141,705 | ||||||||
(1) This obligation is hedged by a Cross Currency Interest Rate Swap agreement(Note 6).
(2)This obligation is hedged by a Cross Currency Rate Swap (Note 6).
F - 74
Compañía Cervecerías Unidas S.A. Notes to the Consolidated Financial Statements
|
|
As of December 31, 2010:
| Debtor tax ID | Company | Debtor country | Lending party tax ID | Creditor name | Creditor country | Currency | Undiscounting amounts according to maturity | Amortization rate | Interest Rate | |||||
| 0 to 3 months | 3 months to 1year | Over 1 year to 3years | Over 3 years to 5years | Over 5 years | Total | |||||||||
| ThCh$ | ThCh$ | ThCh$ | ThCh$ | ThCh$ | ThCh$ | % | ||||||||
| Bank borrowings | ||||||||||||||
| O-E | FINCA LA CELIA S.A | ARGENTINA | O-E | Banco Patagonia | ARGENTINA | USD | 187,761 | - | - | - | - | 187,761 | At maturity | 3.50 |
| O-E | FINCA LA CELIA S.A | ARGENTINA | O-E | Banco San Juan | ARGENTINA | USD | 352,904 | - | - | - | - | 352,904 | At maturity | 3.00 |
| O-E | FINCA LA CELIA S.A | ARGENTINA | O-E | Banco Patagonia | ARGENTINA | USD | 164,290 | - | - | - | - | 164,290 | At maturity | 3.50 |
| O-E | FINCA LA CELIA S.A | ARGENTINA | O-E | Banco Patagonia | ARGENTINA | USD | - | 196,982 | - | - | - | 196,982 | At maturity | 2.50 |
| O-E | FINCA LA CELIA S.A | ARGENTINA | O-E | Banco San Juan | ARGENTINA | USD | - | 71,440 | - | - | - | 71,440 | At maturity | 3.50 |
| O-E | FINCA LA CELIA S.A | ARGENTINA | O-E | Banco San Juan | ARGENTINA | USD | - | 46,940 | - | - | - | 46,940 | At maturity | 3.50 |
| O-E | FINCA LA CELIA S.A | ARGENTINA | O-E | Banco Supervielle | ARGENTINA | USD | - | 238,885 | - | - | - | 238,885 | At maturity | 3.75 |
| O-E | FINCA LA CELIA S.A | ARGENTINA | O-E | Banco Patagonia | ARGENTINA | USD | 118,836 | - | - | - | - | 118,836 | At maturity | 3.25 |
| O-E | FINCA LA CELIA S.A | ARGENTINA | O-E | Banco Santander Rio | ARGENTINA | USD | 165,985 | - | - | - | - | 165,985 | At maturity | 3.00 |
| O-E | FINCA LA CELIA S.A | ARGENTINA | O-E | Banco Santander Rio | ARGENTINA | USD | 165,715 | - | - | - | - | 165,715 | At maturity | 3.00 |
| O-E | FINCA LA CELIA S.A | ARGENTINA | O-E | Fondo para la Transformación y Crec. | ARGENTINA | $ARG | - | 27,587 | - | - | - | 27,587 | Semiannual | 6.00 |
| O-E | COMPAÑÍA INDUSTRIAL CERVECERA S A | ARGENTINA | O-E | Banco Citibank | ARGENTINA | $ARG | - | 3,780,240 | - | - | - | 3,780,240 | At maturity | 14.60 |
| 96.981.310-6 | COMPAÑÍA CERVECERA KUNSTMANN S.A. | CHILE | 97.006.000-6 | Banco Crédito e Inversiones | CHILE | UF | 37,603 | 25,354 | - | - | - | 62,957 | Monthly | 4.29 |
| O-E | CCU CAYMAN BRANCH (1) | ISLAS CAIMAN | O-E | BBVA S.A. New York Branch | E.E U.U. | USD | - | 24,628 | 32,760,700 | - | - | 32,785,328 | At maturity | 0.72 |
| 99.586.280-8 | CIA PISQUERA DE CHILE (V.A.) | CHILE | 96.563.620-K | Banco Raboinvestments Chile S.A | CHILE | $CH | 224,332 | - | 9,961,114 | - | - | 10,185,446 | At maturity | 5.75 |
| Subtotal | 1,417,426 | 4,412,056 | 42,721,814 | - | - | 48,551,296 | ||||||||
| Debtor tax ID | Company | Debtor country | Registration or ID No. Instrument | Creditor country | Currency | Undiscounting amounts according to maturity | Amortization rate | Interest Rate | ||||||
| 0 to 3 months | 3 months to 1year | Over 1 year to 3years | Over 3 years to 5years | Over 5 years | Total | |||||||||
| ThCh$ | ThCh$ | ThCh$ | ThCh$ | ThCh$ | ThCh$ | % | ||||||||
| Bonds payable | ||||||||||||||
| 91.041.000-8 | VIÑA SAN PEDRO TARAPACA S.A. | CHILE | 415 13/06/2005 BONO SERIE A | CHILE | UF | 1,210,894 | 784,654 | 3,169,358 | 3,175,689 | 15,509,550 | 23,850,145 | Semiannual | 3.80 | |
| 90.413.000-1 | CCU S.A. | CHILE | 388 18/10/2004 BONO SERIE E | CHILE | UF | - | 2,127,657 | 4,070,733 | 4,099,285 | 19,055,408 | 29,353,083 | Semiannual | 4.00 | |
| 90.413.000-1 | CCU S.A. | CHILE | 573 23/03/2009 BONO SERIE H | CHILE | UF | 518,606 | - | - | - | 42,654,142 | 43,172,748 | Semiannual | 4.25 | |
| 90.413.000-1 | CCU S.A. | CHILE | 572 23/03/2009 BONO SERIE I | CHILE | UF | 445,010 | - | - | 64,078,859 | - | 64,523,869 | At maturity | 3.00 | |
| Sub-total | 2,174,510 | 2,912,311 | 7,240,091 | 71,353,833 | 77,219,100 | 160,899,845 | ||||||||
| Debtor tax ID | Company | Debtor country | Lending party tax ID | Creditor name | Creditor country | Currency | Undiscounting amounts according to maturity | Amortization rate | Interest Rate | |||||
| 0 to 3 months | 3 months to 1year | Over 1 year to 3years | Over 3 years to 5years | Over 5 years | Total | |||||||||
| ThCh$ | ThCh$ | ThCh$ | ThCh$ | ThCh$ | ThCh$ | % | ||||||||
| Financial leases obligations | ||||||||||||||
| 96.981.310-6 | COMPAÑÍA CERVECERA KUNSTMANN S.A. | CHILE | 97.004.000-5 | Banco de Chile | CHILE | UF | 74,754 | 213,657 | 410,580 | 237,517 | 65,971 | 1,002,479 | Monthly | 5.80 |
| 96.981.310-6 | COMPAÑÍA CERVECERA KUNSTMANN S.A. | CHILE | 97.015.000-5 | Banco Santander Chile | CHILE | UF | 19,519 | 60,705 | 178,828 | 16,100 | - | 275,152 | Monthly | 7.20 |
| 90.413.000-1 | CCU S.A. | CHILE | 99.012.000-5 | Consorcio Nacional de Seguros S.A. | CHILE | UF | 15,194 | 47,176 | 138,291 | 130,320 | 14,248,002 | 14,578,983 | Monthly | 7.07 |
| Subtotal | 109,467 | 321,538 | 727,699 | 383,937 | 14,313,973 | 15,856,614 | ||||||||
| Total | 3,701,403 | 7,645,905 | 50,689,604 | 71,737,770 | 91,533,073 | 225,307,755 | ||||||||
(1) This obligation is hedged by a Cross Currency Interest Rate Swap(Note 6).
F - 75
Compañía Cervecerías Unidas S.A. Notes to the Consolidated Financial Statements
|
|
See detail of bank borrowings, financial leases obligations and bonds payable fair value inNote 6.
The effective rates of bond obligations as of December 31, 2011 and 2010, were as follows:
| Bonds Serie | A | 3.96% | |
| Bonds Serie | E | 4.52% | |
| Bonds Serie | H | 4.26% | |
| Bonds Serie | I | 3.18% | |
The debts and financial liabilities are stated in several currencies and they accrue fixed and variable interest rates. The details of such obligations classified as per currency and interest type (excluding the effect of cross currency interest rate swap agreements) are as follows:
| As of December 31, 2011 | As of December 31, 2010 | |||
| Fixed Interest Rate | Variable Interest Rate | Fixed Interest Rate | Variable Interest Rate | |
| ThCh$ | ThCh$ | ThCh$ | ThCh$ | |
| United States dollar | 1,138,447 | 51,998,403 | 1,709,737 | 32,785,328 |
| Chilean pesos | 10,185,447 | - | 10,185,447 | - |
| Argentine pesos | 10,767,200 | - | 3,807,827 | - |
| Unidades de fomento | 168,052,208 | - | 176,819,416 | - |
| Total | 190,143,302 | 51,998,403 | 192,522,427 | 32,785,328 |
The terms and conditions of the interest accruing obligations as of December 31, 2011, were as follows:
a) Bank Borrowings
BBVA New York – Bank Loans
On November 23, 2007, the Company obtained, through its Cayman Islands agency, a bank loan from the Cayman Islands branch of BBVA bank, for a total 70 million United States dollars at a 5 year term, with maturity on November 23, 2012.
This loan accrues interest at a compound floating rate dollar Libor plus 180 days and a fixed margin of 0.27%. The Company amortizes interest semi-annually, and the capital amortization consists of a single payment at the end of the established term.
The exchange rate and the interest rate risk to which the Company is exposed as a result of this syndicated loan is mitigated by the use of currency swap and USD-CLP rates (Cross Currency Swap) agreements. For a detail of the Company’s hedge strategies(see Note 5 and Note 6).
This credit obliges the Company to comply with specific requirements and financial ratios in relation to its consolidated financial statements, which by agreement of the parties, after adapting them in order to update certain references and accommodating them the new accounting rules for IFRS, are the followings:
(a) Maintain a Financial Expense Coverage, measured at the end of each quarter and retroactively for periods of 12 months, not less than 3, and calculated as the ratio between EBITDA and Financial Costs account. EBITDA is defined as: (i) the sum of Gross Margin and Other income by function accounts; (ii) less Distribution costs, Administrative expenses and Other expenses by function accounts; and (iii) plus Depreciation and Amortization recorded in the Note Nature of the costs and expenses.
(b) Maintain a Debt Ratio less than or equal to 3, calculated as financial debts plus short and long term debt obligations with related parties divided by EBITDA. Financial Debt is regarded as the sum of Bank Loans, Bonds payable and Finance lease obligations included in Note Other financial liabilities of the Consolidated Financial Statements.
F - 76
Compañía Cervecerías Unidas S.A. Notes to the Consolidated Financial Statements
|
|
(c) Maintain at the end of each quarter a minimum consolidated Equity of ThCh$ 312,516,750, meaning Equity Attributable to Equity Holders of the Parent plus the Dividends provisioned account, according to policy included in the Statement of Changes in Equity.
As of December 31, 2011 and 2010, the Company was in compliance with the financial covenants and specific requirements for this bank loan.
Raboinvestment Chile S.A. (Raboinvestment) – Bank Loans
On August 12, 2010, the subsidiary Compañía Pisquera de Chile S.A. renegotiated a syndicated loan with banks BCI, BBVA and Raboinvestment Chile S.A. (Raboinvestment) where BCI and BBVA ceded and transferred their respective shares of the credit to Raboinvestment. On the same date CPCh and Raboinvestment signed an agreement acknowledging the debt and rescheduling of the total outstanding debt, for the capital of that syndicated loan for an amount of ThCh$ 9,961,114, which will be paid to Raboinvestment in a single quota, maturity on August 12, 2012.
This loan accrues interest at an annual fixed rate of 5.75%. The Company amortizes interests semi-annually and to be paid on August 12 and February 12, of each year.
CPCh product of this obligation must meet certain reporting obligations in addition to complying with the following financial ratios, as measured by the balance sheet and audited annual financial statements as of December 31, during the last 12 months:
(a) Maintain a Financial Expense Coverage not less than 3, calculated as the relationship between Gross Margin less Marketing costs, Distribution and Administration expenses, plus Other income by function, less Other expenses by function, plus Depreciation and Amortization, divided by Financial costs.
(b) Maintain a debt ratio of no more than 2, measured as Total liabilities divided by Equity.
(c) Maintain a Equity higher than UF 770,000.
In addition, this loan obliges CPCh to comply with certain restrictions of affirmative nature, such as to maintain insurance, to maintain the ownership of essential assets, and also to comply with certain restrictions, such as not to merge or split, etc. except as allowed, and not to pledge, mortgage or grant any kind of encumbrance or real right over any fixed asset with an individual accounting value higher than UF 10,000, except under the terms established by the agreement, among other.
As of December 31, 2011 and 2010, the Company was in compliance with the financial covenants and specific requirements of this loan.
Banco de Chile – Bank Loans
a. On July 11, 2011, the subsidiary Viña San Pedro Tarapacá S.A. signed a bank loan with Banco de Chile for a total of US$ 4,436,000, for a period of one year, maturing on July 11, 2012.
This loan accrues interest at a compound floating rate Libor plus 180 days plus a fixed margin. The subsidiary amortizes interest semi-annually, and capital amortization consists of a single payment at the end of the established term.
This debt was changed to Euros and a fixed interest rate, by hiring a currency swap and interest rate swap (Cross Currency Interest Rate Swap) agreements. For details of the Company`s hedge strategies seeNote 6.
b. On July 11, 2011, the subsidiary Viña San Pedro Tarapacá S.A. signed a bank loan with Banco de Chile for a total of US$ 4,436,000, for a period of five years, maturing on July 11, 2016.
This loan accrues interest at a compound floating rate Libor plus 180 days plus a fixed margin. The subsidiary amortizes interest semi-annually, and capital amortization consists of a single payment at the end of the established term.
This debt was changed to Euros and a fixed interest rate, by hiring a currency swap and interest rate swap (Cross Currency Interest Rate Swap) agreements. For details of the Company`s hedge strategies seeNote 6.
c. On July 7, 2011, the subsidiary Viña San Pedro Tarapacá S.A. signed a bank loan with Banco de Chile for a total of US$ 10,000,000, for a period of five years, maturiting on July 7, 2016.
F - 77
Compañía Cervecerías Unidas S.A. Notes to the Consolidated Financial Statements
|
|
This loan accrues interest at a compound floating rate Libor plus 180 days plus a fixed margin. The subsidiary amortizes interest semi-annually, and capital amortization consists of a single payment at the end of the established term.
The interest rate risk to which the subsidiary is exposed as result of this loan is mitigated by the use of cross interest rate swap agreements (interest rate fixed). For details of the Company`s hedge strategies seeNote 6.
The aforementioned loans oblige the Company to comply with the same covenants in Series A Bond as indicated in letter c) obligations with the public in this Note.
Banco Estado – Bank Loans
On July 18, 2011, the subsidiary Viña San Pedro Tarapacá S.A. signed a bank loan with Banco de Chile for a total of US$ 11,000,000, for a period of one year, maturing on July 18, 2012.
This loan accrues interest at a compound floating rate Libor plus 180 days plus a fixed margin. The subsidiary amortizes interest semi-annually, and capital amortization consists of a single payment at the end of the established term.
This loan obliges the Company to comply with the same covenants in Series A Bond as indicated in letter c) obligations with the public in this Note.
b) Financial Lease Obligations
The most significant financial lease agreements are as follows:
CCU S.A.
In December, 2004, the Company sold a piece of land previously classified as investment property. As part of the transaction, the Company leased eleven floors of a building under construction on the mentioned piece of land.
The building was completed during 2007, and on June 28, 2007, the Company entered into a 25-years lease agreement with Compañía de Seguros de Vida Consorcio Nacional de Seguros S.A., for a total amount of UF 688,635.63, with an annual interest rate of 7.07%. The current value of the agreement amounted to ThCh$ 10,403,632 as of December 31, 2007. The agreement also grants CCU the right or option to acquire the assets contained in the agreement (real estate, furniture and facilities) as from month 68 of the lease. The lease rentals committed are according to the conditions prevailing in the market. For Chilean GAAP purposes, in 2004 the Company recognized a ThCh$ 3,108,950 gain for the building portion not leased by the Company, and a ThCh$ 2,260,851 liability deferred through completion of the building, when the Company recorded the transaction as financial lease.
Compañía Cervecera Kunstmann S.A
The lease agreements are as follows:
Type | Institution | ContractDate | Amount(UF) | Number ofquotas | AnualInterest | Purchaseoption (UF) |
Production plant | Banco Chile | 04/19/2005 | 20,489 | 168 | 8.30% | 302 |
Land Lote 2 C | Banco Chile | 06/26/2007 | 7,716 | 121 | 5.80% | 85 |
Land Lote 2 D | Banco Chile | 03/25/2008 | 15,000 | 97 | 4.30% | 183 |
Grain cooker | Banco Chile | 08/31/2008 | 43,969 | 61 | 4.13% | 800 |
Inspector level of filling, capping, pasteurization and packaging line | Banco Santander-Chile | 01/12/2009 | 14,077 | 61 | 7.16% | 276 |
Rinser-Filler-Capping Machine | Banco Santander-Chile | 02/03/2009 | 5,203 | 61 | 7.34% | 102 |
Land Lote 13F1 | Banco Santander-Chile | 12/01/2009 | 2,116 | 119 | 6.27% | 26 |
F - 78
Compañía Cervecerías Unidas S.A. Notes to the Consolidated Financial Statements
|
|
The following is a detail of future payments and the current value of the financial lease obligations as of December 31, 2011:
| Lease Minimum Future Payments | As of December 31, 2011 | ||
| Gross Amount | Interest | Current Value | |
| ThCh$ | ThCh$ | ThCh$ | |
| Less than one year | 1,558,994 | 1,079,067 | 479,927 |
| Between one and five year | 6,002,130 | 5,145,145 | 856,985 |
| Over five years | 28,318,096 | 13,576,432 | 14,741,664 |
| Total | 35,879,220 | 19,800,644 | 16,078,576 |
c) Bonds Payable
Series A Bonds – Subsidiary Viña San Pedro Tarapacá S.A.
On June 13, 2005, the subsidiary Viña San Pedro Tarapacá S.A. recorded in the Securities Record a bond issue for a total UF 1,500,000 at a 20-years term with maturity on July 15, 2025. Such issue was placed in the local market on July 20, 2005, with a premium amounting to ThCh$ 227,378. This obligation accrues interest at a fixed annual rate of 3.8% and amortizes interest and capital semi-annually.
On December 17, 2010, took place the Board of Bondholders Serie A, which decided to modify the issued Contract of such bonds in order to update certain references and adapt it to the new IFRS accounting standards. The amendment of the issued Contract is dated December 21, 2010 and has the repertory No. 35739-2010 in the Notary of Ricardo San Martín Urrejola. Because of these changes, the commitment of this subsidiary is to comply with certain financial ratios that will be calculated only on the Consolidated Financial Statements. These financial ratios and other conditions are as follows:
(a) Control over subsidiaries representing at least 30% of the consolidated EBITDA of the issuer. EBITDA is defined as: (i) the sum of Gross Margin and Other income by function accounts; (ii) less Distribution costs, Administrative expenses and Other expenses by function accounts; and (iii) plus Depreciation and Amortization recorded in the Note Nature of the costs and expenses.
(b) Not to enter into investments in instruments issued by related parties different from its subsidiaries.
(c) Neither sells nor transfers essential assets that jeopardize the continuance of its current purpose.
(d) Maintain at the end of each quarter an indebtedness ratio measured over the consolidated financial statements not higher than 1.2, defined as the ratio of Total Adjusted Liabilities and Total Adjusted Equity. The Total Adjusted Liabilities is defined as Total Liabilities less Dividends provisioned, according to policy contained in the Statement of Changes in Equity, plus the amount of all guarantees, debts or obligations of third parties not within the liabilities and outside the Issuer or its subsidiaries that are cautioned by real guarantees granted by the Issuer or its subsidiaries. Total Adjusted Equity is defined as Total Equity plus Dividends provisioned, according to policy contained in the Statement of Changes in Equity.
(e) Maintain a Financial Expense Coverage measured at the end of each quarter and retroactively for periods of 12 months, not less than 3, calculated as the ratio of EBITDA (as defined in paragraph (a)) and Financial Costs account.
(f) Maintain at the end of each quarter a minimum equity of ThCH$ 83,337,800, meaning Equity Attributable to Equity Holders of the Parent plus the Dividends provisioned account, according to policy included in the Statement of Changes in Equity. This requirement will increase in the amount resulting from each revaluation of property, plant and equipment to be perform by the Issuer.
On July 21, 2011 the subsidiary made a partial prepayment for 750 Series A Bonds (of the 1,500 issued) equivalent to
UF 513,750, according to Section Twelve of Clause Four for the Issue Contract Bond issued by public deed dated April 28, 2005.
F - 79
Compañía Cervecerías Unidas S.A. Notes to the Consolidated Financial Statements
|
|
Additionally, the subsidiary recognized in the Consolidated Income Statement an expenditure of ThCh$ 103,735, for expenses associated with the issuance of this debt.
As of December 31, 2011 and 2010, the Company was in compliance with the financial covenants required for this public issue.
Series E Bonds – CCU S.A.
On October 18, 2004, under number 388 the Company recorded in the Securities Record the issue of 20-year term public bonds for a total UF 2,000,000 with maturity on December 1, 2024. This issue was placed in the local market on December 1, 2004, with a discount amounting to ThCh$ 897,857. This obligation accrues interests at a fixed annual rate of 4.0%, and it amortizes interest and capital semi-annually.
On December 17, 2010, took place the Board of Bondholders Serie A, which decided to modify the issued Contract of those bonds in order to update certain references and adapt it to the new IFRS accounting standards. The amendment of the issued Contract is dated December 21, 2010 and has the repertory No. 35738-2010 in the Notary of Ricardo San Martín Urrejola. Because of these changes, the commitment of the Company is to comply with certain financial ratios that will be calculated only on the Consolidated Financial Statements. These financial ratios and other conditions are as follows:
(a) Maintain at the end of each quarter an indebtedness ratio measured over the consolidated financial statements not higher than 1.5, defined as the ratio of Total Adjusted Liabilities and Total Adjusted Equity. Total Adjusted Liabilities is defined as Total Liabilities less Dividends provisioned, according to policy included in the Statement of Changes in Equity, plus the amount of all guarantees granted by the Issuer or its subsidiaries that are cautioned by real guarantees, except as noted in the contract. Total Adjusted Equity is defined as Total Equity plus Dividends provisioned, according to policy included in the Statement of Changes in Equity.
(b) Maintain a Financial Expense Coverage measured at the end of each quarter and retroactively for periods of 12 months, not less than 3, calculated as the ratio of EBITDA and Financial Costs account. EBITDA is defined as: (i) the sum of Gross Margin and Other income by function accounts; (ii) less Distribution costs, Administrative expenses and Other expenses by function accounts; and (iii) plus Depreciation and Amortization recorded on the Note Nature of the costs and expenses.
(c) Maintain at the end of each quarter, assets free of liens for an amount equal to at least 1.2, defined as the ratio of Total Assets free of lien and Total Adjusted Liabilities free of lien. Is defined as Total Assets free of lien are defined as Total Assets less assets pledged as collateral for cautioned obligations of third parties. Total Adjusted Liabilities free of lien are defined as Total Liabilities less Dividends provisioned according to policy contained in the Statement of Changes in Equity.
(d) Maintain at the end of each quarter a minimum equity of ThCh$ 312,516,750, meaning Equity Attributable to Equity Holders of the Parent plus the Dividends provisioned account, according to policy contained in the Statement of Changes in Equity. This requirement will increase in the amount resulting from each revaluation of property, plant and equipment to be perform by the Issuer.
(e) To maintain, either directly or indirectly, ownership over more than 50% of the subscribed and paid-up shares and over the voting rights of the following companies: Cervecera CCU Chile Limitada, Embotelladoras Chilenas Unidas S.A. and Viña San Pedro Tarapaca S.A., except in the cases and under the terms established in the agreement.
(f) To maintain, either directly or through a subsidiary, ownership of the trademark "CRISTAL", denominative for beer class 32 of the international classifier, and not to transfer its use, except to its subsidiaries.
(g) Not to make investments in facilities issued by related parties, except in the cases and under the terms established in the agreement.
(h) Neither sell nor transfer assets from the issuer and its subsidiaries representing over 25% of the assets total of the consolidated financial statements.
As of December 31, 2011 and 2010, the Company was in compliance with the financial covenants required for this public issue.
F - 80
Compañía Cervecerías Unidas S.A. Notes to the Consolidated Financial Statements
|
|
Series H and I Bonds – CCU S.A.
On March 23, 2009, the Company recorded in the Securities Record the issue of bonds Series H and I for a combined total of UF 5 million, 10 and 30 years terms, respectively. Emissions of both series were placed in the local market on April 2, 2009. The issuance of the Bond I was UF 3 million with maturity on March 15, 2014, with a discount amounting to ThCh$ 413,181, accrues interest at an annual fixed rate of 3.0%, with amortize interest semi-annually and excluding the capital (bullet). The issuance of the Bond H was UF 2 million with maturity on March 15, 2030, with a discount amounting to ThCh$ 156,952, accrues interest at an annual fixed rate of 4.25%, with amortizes interest and capital semi-annually.
By deed dated December 27, 2010 issued in the Notary of Ricardo San Martín Urrejola, under repertoires No. 36446-2010 and 36447-2010, were amended Issue Contract Series H and I, respectively, in order to update certain references and to adapt to the new IFRS accounting rules.
The current issue was subscribed with Banco Santander Chile as representative of the bond holders and as paying bank, and it requires that the Company complies with the following financial indicators on its consolidated financial statements and other specific requirements:
(a) Maintain at the end of each quarter an indebtedness ratio measured over the consolidated financial statements not higher than 1.5, defined as the ratio of Total Adjusted Liabilities and Total Adjusted Equity. The Total Adjusted Liabilities are defined as Total Liabilities less Dividends provisioned, according to policy included in the Statement of Changes in Equity, plus the amount of all guarantees, debts or obligations of third parties not within the liability and outside the Issuer or its subsidiaries that are cautioned by real guarantees granted by the Issuer or its subsidiaries. Total Adjusted Equity is defined as Total Equity plus Dividends provisioned account, according to policy included in the Statement of Changes in Equity.
(b) Maintain a Financial Expense Coverage measured at the end of each quarter and retroactively for periods of 12 months, not less than 3, calculated as the ratio of EBITDA and Financial Costs account. EBITDA is defined as: (i) the sum of Gross Margin and Other income by function accounts; (ii) less Distribution costs, Administrative expenses and Other expenses by function accounts; and (iii) plus Depreciation and Amortization recorded on the Note Nature of the cost and expenses.
(c) Maintain at the end of each quarter, assets free of liens for an amount equal to, at least, 1.2, defined as the ratio of Total Assets free of lien and Financial Debt free of lien. Total Assets free of lien are defined as Total Assets less assets pledged as collateral for cautioned obligations of third parties. Financial Debt free of lien is defined as the sum of lines Bank Loans, Bonds payable and Finance lease obligations contained in Note Other financial liabilities of the Consolidated Financial Statements.
(d) Maintain at the end of each quarter a minimum equity of ThCh$ 312,516,750, meaning Equity Attributable to Equity Holders of the Parent plus the Dividends provisioned account, according to policy included in the Statement of Changes in Equity. This requirement will increase in the amount resulting from each revaluation of property, plant and equipment to be perform by the Issuer.
(e) To maintain, either directly or indirectly, ownership over more than 50% of the subscribed and paid-up shares and over the voting rights of the following companies: Cervecera CCU Chile Limitada and Embotelladoras Chilenas Unidas S.A.
(f) Maintain a nominal installed capacity for the production manufacturing of beer and soft drinks, equal or higher altogether than 15.9 million hectoliters a year, except in the cases and under the terms of the contract.
(g) To maintain, either directly or through a subsidiary, ownership of the trademark "CRISTAL", denominative for beer class 32 of the international classifier, and not to transfer its use, except to its subsidiaries.
(h) Not to make investments in facilities issued by related parties, except in the cases and under the terms established in the agreement.
As of December 31, 2011 and 2010 the Company was in compliance with the financial covenants required for this public issue.
As December 31, 2011, the SVS had formalized the changes to the registration of the aforementioned four series of bonds.
F - 81
Compañía Cervecerías Unidas S.A. Notes to the Consolidated Financial Statements
|
|
Note 28 Accounts payable – trade and other payables
As of December 31, 2011 and 2010, the total Accounts payable-trade and other payables were as follows:
| As of December 31, 2011 | As of December 31, 2010 | |
| ThCh$ | ThCh$ | |
| Suppliers | 133,112,087 | 112,196,621 |
| Notes payable | 1,065,122 | 722,748 |
| Withholding payable | 31,376,079 | 22,472,254 |
| Total | 165,553,288 | 135,391,623 |
| Current | 165,553,288 | 135,391,623 |
| Non-current | - | - |
| Total | 165,553,288 | 135,391,623 |
Note 29Provisions
As of December 31, 2011 and 2010, the total provisions recorded in the consolidated statement of financial position were as follows:
| As of December 31, 2011 | As of December 31, 2010 | |
| ThCh$ | ThCh$ | |
| Litigation | 1,624,479 | 1,220,844 |
| Deposit for bottles | 11,908,708 | 10,911,858 |
| Others | 1,459,960 | - |
| Total | 14,993,147 | 12,132,702 |
| Current | 1,169,126 | 992,811 |
| Non-current | 13,824,021 | 11,139,891 |
| Total | 14,993,147 | 12,132,702 |
The following was the change in provisions during the year ended December 31, 2010 and 2011:
| Litigation | Deposit for Bottles | Others | Total | |
| ThCh$ | ThCh$ | ThCh$ | ThCh$ | |
| As of January 1, 2010 | 981,662 | 9,704,826 | - | 10,686,488 |
| As of December 31, 2010 | ||||
| Incorporated | 2,584,701 | 8,811,622 | - | 11,396,323 |
| Used | (1,931,487) | (7,604,590) | - | (9,536,077) |
| Released | (248,827) | - | - | (248,827) |
| Conversion effect | (165,205) | - | - | (165,205) |
| As of December 31, 2010 | 1,220,844 | 10,911,858 | - | 12,132,702 |
| As of December 31, 2011 | ||||
| Incorporated | 1,257,890 | 5,862,338 | 1,459,960 | 8,580,188 |
| Used | (869,774) | (4,865,488) | - | (5,735,262) |
| Conversion effect | 15,519 | - | - | 15,519 |
| As of December 31, 2011 | 1,624,479 | 11,908,708 | 1,459,960 | 14,993,147 |
F - 82
Compañía Cervecerías Unidas S.A. Notes to the Consolidated Financial Statements
|
|
The maturities of provisions at December 31, 2011, were as follows:
| Litigation | Deposit forBottles (1) | Others | Total | |
| ThCh$ | ThCh$ | ThCh$ | ThCh$ | |
| Less than one year | 1,169,126 | - | - | 1,169,126 |
| Between two and five years | 401,258 | - | 1,459,960 | 1,861,218 |
| Over five years | 54,095 | 11,908,708 | - | 11,962,803 |
| Total | 1,624,479 | 11,908,708 | 1,459,960 | 14,993,147 |
| (1) Given the nature of the risks covered by such provisions, it is not possible to determine a reasonable payment calendar. | ||||
Litigation
The detail on the main litigation proceedings to which the Company is exposed at a consolidated level is described inNote 35.
Management believes that according to the development of such proceedings up to this date, the provisions established over the background on a case by basis adequately cover the eventual adverse effects that could arise from the mentioned proceedings.
Note 30Other non-financial liabilities
As of December 31, 2011 and 2010, the total Other non-financial liabilities were as follows:
| As ofDecember 31,2011 | As ofDecember 31,2010 | |
| ThCh$ | ThCh$ | |
| Parent dividend provisioned by the board | 19,428,675 | 18,473,167 |
| Parent dividend provisioned according to policy | 41,947,122 | 36,876,591 |
| Outstanding parent dividends agreed | 603,611 | 483,065 |
| Subsidiaries dividends according to policy | 6,226,706 | 5,115,776 |
| Others | 257,810 | 15,324 |
| Total | 68,463,924 | 60,963,923 |
| Current | 68,463,924 | 60,963,923 |
| Non-current | - | - |
| Total | 68,463,924 | 60,963,923 |
Note 31 Employee Benefits
The Company grants short term, and employment termination benefits as part of its compensation policies.
The parent company and its subsidiaries maintain collective agreements with their employees, which establish the compensation and/or short–term and long-term benefits for their staff, the main features of which are described below:
i. Short-term benefits are, in general, based on combined plans or agreements, designed to compensate benefits received, such as of paid vacation, annual performance bonuses and compensation through annuities.
ii. Long-term benefits are plans or agreements mainly intended to cover the post-employment benefits generated at the end of the labour relationship, be it by voluntary resignation or death of personnel hired.
The cost of such benefits is charged against income, in the “Staff Expense” item.
F - 83
Compañía Cervecerías Unidas S.A. Notes to the Consolidated Financial Statements
|
|
As of December 31, 2011 and 2010, the total staff benefits recorded in the consolidated statement of financial position is as follows:
| Employees Benefits | As of December31, 2011 | As ofDecember 31,2010 |
| ThCh$ | ThCh$ | |
| Short term benefits | 13,898,602 | 10,599,390 |
| Employment termination benefits | 15,531,518 | 14,767,065 |
| Total | 29,430,120 | 25,366,455 |
| Current | 13,906,409 | 11,069,052 |
| Non-current | 15,523,711 | 14,297,403 |
| Total | 29,430,120 | 25,366,455 |
The following is a detail of the Short-term and Severance Indemnity.
Employees’ Bonuses
Short-term benefits are mainly comprised of recorded vacation (on accruals basis) and bonuses and share compensation. Such benefits are recorded when the obligation is accrued, and they are usually paid within a 12-month period, consequently they are not discounted.
As of December 31, 2011 and 2010, the provisions recorded as a result of services granted and unpaid are as follows:
| Short-Term Employees Benefits | As of December31, 2011 | As ofDecember 31,2010 |
| ThCh$ | ThCh$ | |
| Vacation | 5,837,134 | 4,894,374 |
| Bonus and compensation | 8,061,468 | 5,705,016 |
| Total | 13,898,602 | 10,599,390 |
The Company records the staff vacation cost on an accrual basis.
Severance Indemnity
The Company records a liability for the payment of an irrevocable severance indemnity, originated by collective and individual agreements entered into with some groups of employees. Such obligation is determined by means of the current value of the benefit accrued cost, a method that considers several factors for the calculation, such as estimates of future continuance, mortality rates, future salary increases and discount rates. The so-determined value is presented at the current value by using the severance benefits accrued method. The discount rates are determined by reference to market interest rates curves for high quality entrepreneurial bonds, with an average duration equivalent to the estimated terms for the payment of such severance, plus the Central Bank estimated inflation, and the margin applicable to companies with a rating equivalent to AA or higher. The discount rate in Chile was 7.7% and in Argentina 26.6%, for each year ended as of December 31, 2011 and 2010, respectively.
F - 84
Compañía Cervecerías Unidas S.A. Notes to the Consolidated Financial Statements
|
|
As of December 31, 2011 and 2010, the benefits recorded for severance indemnity are as follows:
| Severance Indemnity | As of December31, 2011 | As ofDecember 31,2010 | |
| ThCh$ | ThCh$ | ||
| Current | 7,807 | 469,662 | |
| Non-current | 15,523,711 | 14,297,403 | |
| Total | 15,531,518 | 14,767,065 | |
The change in the severance indemnity during the year ended as of December 31, 2010 and 2011, was as follows:
| Severance Indemnity | SeveranceIndemnity |
| ThCh$ | |
| Initial Balance | 13,089,182 |
| Balance as of January 1, 2010 | 13,089,182 |
| As of December 31, 2010 | |
| Current cost of service | 533,870 |
| Interest cost | 973,827 |
| Actuarial (Gain) loss | 101,357 |
| Paid-up benefits | (888,833) |
| Past service cost | 482,816 |
| Others | 474,846 |
| As of December 31, 2010 | 14,767,065 |
| As of December 31, 2011 | |
| Current cost of service | 615,619 |
| Interest cost | 1,212,321 |
| Actuarial (Gain) loss | 610,428 |
| Paid-up benefits | (1,692,390) |
| Past service cost | 407,893 |
| From business combinations | 51,392 |
| Others | (440,810) |
| As of December 31, 2011 | 15,531,518 |
The figures recorded in the consolidated statement of income as of December 31, 2011, 2010 and 2009, were as follows:
| Expense recognized for severance indemnity | For the years ended December 31, | ||
| 2011 | 2010 | 2009 | |
| ThCh$ | ThCh$ | ThCh$ | |
| Current cost of service | 615,619 | 533,870 | 522,041 |
| Interest cost | 1,212,321 | 973,827 | 1,073,826 |
| Past service cost | 407,893 | 482,816 | 78,038 |
| Actuarial (Gain) loss | 610,428 | 101,357 | (1,679,152) |
| Non-provided paid benefits | 2,013,319 | 1,140,911 | 3,277,025 |
| Other | (393,603) | 437,814 | 660,940 |
| Total expense recognized in consolidated statement of income | 4,465,977 | 3,670,595 | 3,932,718 |
F - 85
Compañía Cervecerías Unidas S.A. Notes to the Consolidated Financial Statements
|
|
Actuarial Assumptions
As mentioned inNote 2.19 – Employees’ Benefits, the severance payment obligation is recorded at its actuarial value. The main actuarial assumptions used for the calculation of the severance indemnity obligation as of December 31, 2011 and 2010, were as follows:
| Actuarial Assumptions | Chile | Argentina | ||||
| As of December 31, | As of December 31, | |||||
| 2011 | 2010 | 2011 | 2010 | |||
| Mortality table | RV-2004 | RV-2004 | GAM '83 | n/a | ||
| Annual interest rate | 7.7% | 7.7% | 26.6% | 13.90% | ||
| Voluntary retirement rotation rate | 1.0% | 1.0% | n/a | n/a | ||
| Company s needs rotation rate, | 0.5% | 0.5% | n/a | n/a | ||
| Salary increase | 3.7% | 3.7% | 21.2% | 8.00% | ||
| Estimated retirement age for | Officers | 60 | 60 | 60 | 60 | |
| Other | Male | 65 | 65 | 65 | 65 | |
| Female | 60 | 60 | 60 | 60 | ||
Sensitivity Analysis
The Following is a sensitivity analysis based on increased (decreased) in 1 percent in the discount rate:
| Sensitivity Analysis | As of December31, 2011 | As ofDecember 31,2010 | |
| ThCh$ | ThCh$ | ||
| 1% increase in the Discount Rate (Gain) | 1,321,827 | 1,280,121 | |
| 1% decrease in the Discount Rate (Loss) | (1,556,424) | (1,497,811) | |
| Total | (234,597) | (217,690) | |
Staff Expense
The amounts recorded in the consolidated statement of income for the years ended as of December 31, 2011, 2010 and 2009, were as follows:
| Staff Expense | For the years ended December 31, | |||
| 2011 | 2010 | 2009 | ||
| ThCh$ | ThCh$ | ThCh$ | ||
| Salaries | 81,614,738 | 72,614,896 | 68,576,822 | |
| Employees short-term benefits | 13,261,746 | 10,447,030 | 9,439,549 | |
| Employments termination benefits | 4,465,977 | 3,670,595 | 3,932,718 | |
| Other staff expense | 15,461,284 | 13,141,922 | 11,575,454 | |
| Total (1) | 114,803,745 | 99,874,443 | 93,524,543 | |
| (1)See Note 10. | ||||
F - 86
Compañía Cervecerías Unidas S.A. Notes to the Consolidated Financial Statements
|
|
Note 32Non-controlling Interests
The detail of Non-controlling Interests is the following:
a) Equity
| Equity | As ofDecember 31,2011 | As ofDecember 31,2010 | |
| ThCh$ | ThCh$ | ||
| Viña San Pedro Tarapacá S.A. | 93,480,376 | 93,126,416 | |
| Aguas CCU-Nestlé Chile S.A. | 10,330,598 | 9,205,225 | |
| Compañía Pisquera de Chile S.A. | 4,467,618 | 4,269,100 | |
| Compañía Cervecera Kunstmann S.A. | 2,938,659 | 2,487,370 | |
| Saenz Briones & Cía. S.A. | 4,232,200 | - | |
| Sidra La Victoria S.A. | 1,499 | - | |
| Others | 358,775 | 330,957 | |
| Total | 115,809,725 | 109,419,068 | |
b) Result
| Result | For the years ended December 31, | ||
| 2011 | 2010 | 2009 | |
| ThCh$ | ThCh$ | ThCh$ | |
| Viña San Pedro Tarapacá S.A. | 6,659,574 | 3,828,056 | 5,245,563 |
| Aguas CCU-Nestlé Chile S.A. | 3,614,682 | 3,233,336 | 6,091,256 |
| Compañía Pisquera de Chile S.A. | 958,959 | 918,065 | 961,369 |
| Compañía Cervecerías Unidas Argentina S.A. | - | 420,387 | 398,695 |
| Compañía Cervecera Kunstmann S.A. | 899,089 | 769,924 | 555,671 |
| Doña Aida S.A. | (75,903) | - | - |
| Don Enrique Pedro S.A. | (41,817) | - | - |
| Saenz Briones & Cía. S.A. | (30,920) | - | - |
| Sidra La Victoria S.A. | 223 | - | - |
| Others | 66,720 | 67,387 | 75,141 |
| Total | 12,050,607 | 9,237,155 | 13,327,695 |
Note 33Common Shareholders’ Equity
Subscribed and paid-up Capital
As of December 31, 2011 and 2010, the Company’s capital shows a balance of ThCh$ 215,540,419, consisting of a total 318,502,872 shares without face value, entirely subscribed and paid-up. The Company has issued only one series of common shares, without any preemptive rights. Such common shares are registered for trading at the Santiago and Chile Stock Exchanges, and at the New York Stock Exchange /NYSE), evidenced by ADS (American Depositary Shares), with an equivalence of five shares per ADS.
The Company has not issued any shares or convertible instruments during the period, thus changing the number of outstanding shares as of December 31, 2011 and 2010.
F - 87
Compañía Cervecerías Unidas S.A. Notes to the Consolidated Financial Statements
|
|
Capital Management
The main purpose, when managing shareholder’s capital, is to maintain an adequate credit risk profile and a healthy capital ratio, allowing the access of the Company to the capitals market for the development of its medium and long term purposes and, at the same time, to maximize shareholder’s return.
Consolidated Statement of Comprehensive Income
As of December 31, 2009, 2010 and 2011, the detail of the comprehensive income and expense of the term is as follows:
| Other Income and expense charged or credited against net equity | Gross Balance | Tax | Net Balance |
| ThCh$ | ThCh$ | ThCh$ | |
| Cash flow hedge | (6,507,854) | 1,106,335 | (5,401,519) |
| Conversion differences of subsidiaries abroad | (34,738,644) | - | (34,738,644) |
| Total comprehensive income as of December 31, 2009 | (41,246,498) | 1,106,335 | (40,140,163) |
| Other Income and expense charged or credited against net equity | Gross Balance | Tax | Net Balance |
| ThCh$ | ThCh$ | ThCh$ | |
| Cash flow hedge | (429,445) | 79,447 | (349,998) |
| Conversion differences of subsidiaries abroad | (11,900,089) | - | (11,900,089) |
| Total comprehensive income as of December 31, 2010 | (12,329,534) | 79,447 | (12,250,087) |
| Other Income and expense charged or credited against net equity | Gross Balance | Tax | Net Balance |
| ThCh$ | ThCh$ | ThCh$ | |
| Cash flow hedge | (239,524) | 42,580 | (196,944) |
| Conversion differences of subsidiaries abroad | 2,372,063 | - | 2,372,063 |
| Total comprehensive income as of December 31, 2011 | 2,132,539 | 42,580 | 2,175,119 |
Income per share
The basic income per share is calculated as the ratio between the net income (loss) of the term corresponding to shares holders and the weighted average number of valid outstanding shares during such term.
As of December 31, 2011, 2010 and 2009, the information used for the calculation of the income as per each basic and diluted share is as follows:
| Income per share | For the years ended December 31, | ||
| 2011 | 2010 | 2009 | |
| Equity holders of the controlling company (ThCh$) | 122,751,594 | 110,699,515 | 128,037,473 |
| Weighted average number of shares | 318,502,872 | 318,502,872 | 318,502,872 |
| Basic and diluted income per share (in Chilean pesos)) | 385.40 | 347.56 | 402.00 |
| Equity holders of the controlling company (ThCh$) | 122,751,594 | 110,699,515 | 128,037,473 |
| Weighted average number of shares | 318,502,872 | 318,502,872 | 318,502,872 |
| Basic and diluted income per share (in Chilean pesos) | 385.40 | 347.56 | 402.00 |
As of December 31, 2011, 2010 and 2009, the Company has not issued any convertible or other kind of instruments creating diluting effects.
F - 88
Compañía Cervecerías Unidas S.A. Notes to the Consolidated Financial Statements
|
|
Distributable net Income
Regarding Circular No 1945 from the SVS on November 4, 2009, the Board of Directors agreed that the net distributable profit for the year 2011 will be that reflected in the financial statements attributable to equity holders of the parents, without adjusting it. The above agreement remains in effect for the year ended December 31, 2011.
Dividends
The Company’s dividend policy consists in annually distributing at least 50% of the net distributable profit of the year.
As of December 31, 2011, 2010 and 2009, the Company has distributed the following dividends, either interim or final:
| Dividend Nº | Payment Date | Type of Dividend | Dividends per Share | Related to FY |
| 236 | 01/09/2009 | Interim | 47.00000 | 2008 |
| 237 | 04/28/2009 | Final | 108.66083 | 2008 |
| 238 | 01/08/2010 | Interim | 60.00000 | 2009 |
| 239 | 04/28/2010 | Final | 140.99893 | 2009 |
| 240 | 01/07/2011 | Interim | 58.00000 | 2010 |
| 241 | 04/27/2011 | Final | 115.78103 | 2010 |
On April 20, 2009, at the General Shareholders Meeting it was agreed to pay the final Dividend No. 237, amounting to ThCh$ 34,608,786 corresponding to $ 108.66083 per share. This dividend was paid on April 28, 2009.
On April 20, 2010, at the General Shareholders Meeting it was agreed to pay the final Dividend No. 239, amounting to ThCh$ 44,908,564 corresponding to $ 140.99893 per share. This dividend was paid on April 28, 2010.
On April 15, 2011, at the General Shareholders Meeting it was agreed to pay the final Dividend No. 241, amounting to ThCh$ 36,876,591 corresponding to $ 115.78103 per share. This dividend was paid on April 21, 2011.
Other Reserves
The reserves that are a part of the Company’s equity are as follows:
Currency Translation Reserves: This reserve is mainly originated by the translation of foreign subsidiarie’s financial statements which functional currency is different from the consolidated financial statements presentation currency. As of December 31, 2011, it amounts to a negative reserve of ThCh$ 25,038,705 (ThCh$ 27,171,910 in 2010).
Hedge reserve: This reserve is originated by the hedge accounting application of financial liabilities used as such. The reserve is reversed at the end of the agreement’s extraction, or when the operation ceases qualifying as hedge accounting, whichever is first. The reserve effects are transferred to income. As of December 31, 2011, it amounts to a positive reserve of ThCh$ 484,432 (ThCh$ 612,146 in 2010), net of deferred taxes.
Other reserves: As of December 31, 2011 and 2010, the amount is a negative reserve of ThCh$ 10,619,334 and ThCh$ 10,559,464, respectively. Such reserves relate mainly to the following concepts:
- Adjustment due to re-assessment of fixed assets carried out in 1979.
- Price level restatement of paid-up capital registered as of December 31, 2008, according to Circular Letter Nª456 by the SVS.
- Difference in purchase of shares.
F - 89
Compañía Cervecerías Unidas S.A. Notes to the Consolidated Financial Statements
|
|
Effects of changes in exchange rate currency
Current assets are openings in the following currencies:
| CURRENT ASSETS | As of December31, 2011 | As of December31, 2010 | |
| ThCh$ | ThCh$ | ||
| Current assets | |||
| Cash and cash equivalent | 177,664,378 | 151,614,300 | |
| CLP | 154,936,386 | 128,474,256 | |
| U.F. | 18,963,052 | 14,642,766 | |
| USD | 2,685,764 | 375,880 | |
| Euros | 141,146 | 1,361,211 | |
| $ARG | 936,654 | 6,736,375 | |
| Others currencys | 1,376 | 23,812 | |
| Other financial assets | 3,943,959 | 2,328,952 | |
| CLP | 1,134,681 | 1,360,168 | |
| USD | 2,734,498 | 556,771 | |
| Euros | 67,807 | 347,900 | |
| Others currencys | 6,973 | 64,113 | |
| Other non-financial assets | 11,565,924 | 9,489,913 | |
| CLP | 8,462,639 | 7,861,261 | |
| U.F. | 14,447 | - | |
| $ARG | 3,088,838 | 1,628,652 | |
| Accounts receivable - trade and other receivable | 193,065,162 | 153,013,546 | |
| CLP | 123,527,287 | 115,544,263 | |
| U.F. | 106,795 | 37,630 | |
| USD | 19,274,307 | 12,752,647 | |
| Euros | 7,960,667 | 5,771,899 | |
| $ARG | 39,724,238 | 17,152,025 | |
| Others currencys | 2,471,868 | 1,755,082 | |
| Accounts receivable from related companies | 9,984,206 | 6,833,634 | |
| CLP | 9,733,971 | 5,473,651 | |
| USD | 14,693 | 1,082,515 | |
| Euros | 235,542 | 274,825 | |
| $ARG | - | 2,643 | |
| Inventories | 128,535,184 | 108,353,258 | |
| CLP | 100,880,743 | 93,995,861 | |
| USD | 5,494,936 | 670,307 | |
| Euros | 146,591 | 12,551 | |
| $ARG | 22,012,914 | 13,674,539 | |
| Tax receivables | 17,277,288 | 14,150,987 | |
| CLP | 15,259,072 | 12,782,715 | |
| $ARG | 2,018,216 | 1,368,272 | |
| Non-current assets held for sale | 509,675 | 497,324 | |
| $ARG | 509,675 | 497,324 | |
| Total current assets | 542,545,776 | 446,281,914 | |
| |||
| CLP | 413,934,779 | 365,492,175 | |
| U.F. | 19,084,294 | 14,680,396 | |
| USD | 30,204,198 | 15,438,120 | |
| Euros | 8,551,753 | 7,768,386 | |
| $ARG | 68,290,535 | 41,059,830 | |
| Others currencys | 2,480,217 | 1,843,007 | |
| Total current assets by currency | 542,545,776 | 446,281,914 | |
F - 90
Compañía Cervecerías Unidas S.A. Notes to the Consolidated Financial Statements
|
|
Non-Current assets are openings in the following currencies:
| NON-CURRENT ASSETS | As of December31, 2011 | As of December31, 2010 |
| ThCh$ | ThCh$ | |
| Non-current assets | ||
| Other financial assets | 194,669 | 15,813 |
| CLP | - | 15,813 |
| USD | 194,531 | - |
| Euros | 138 | - |
| Other non-financial assets | 2,996,836 | 8,826,744 |
| CLP | 1,460,245 | 1,468,499 |
| $ARG | 1,536,591 | 7,358,245 |
| Accounts receivable from related companies | 418,922 | 444,685 |
| U.F. | 418,922 | 444,685 |
| Investments accounted for using the equity method | 39,923,677 | 42,596,043 |
| CLP | 39,833,401 | 42,507,692 |
| $ARG | 90,276 | 88,351 |
| Intangible assets different than goodwill | 41,173,260 | 34,982,221 |
| CLP | 26,882,760 | 25,025,624 |
| $ARG | 14,290,500 | 9,956,597 |
| Goodwill | 69,441,207 | 67,761,406 |
| CLP | 49,746,692 | 49,746,692 |
| $ARG | 19,694,515 | 18,014,714 |
| Property, plant and equipment (net) | 556,949,110 | 508,162,219 |
| CLP | 486,464,956 | 456,891,076 |
| USD | 567,815 | - |
| Euros | 1,100,868 | - |
| $ARG | 68,815,471 | 51,271,143 |
| Biological assets | 18,320,548 | 16,668,630 |
| CLP | 17,616,373 | 15,933,919 |
| $ARG | 704,175 | 734,711 |
| Investment property | 7,720,575 | 7,403,275 |
| CLP | 3,960,500 | 3,961,703 |
| $ARG | 3,760,075 | 3,441,572 |
| Deferred tax assets | 18,806,779 | 18,546,061 |
| CLP | 16,687,592 | 16,984,107 |
| $ARG | 2,119,187 | 1,561,954 |
| Total non-current assets | 755,945,583 | 705,407,097 |
| CLP | 642,652,519 | 612,535,125 |
| U.F. | 418,922 | 444,685 |
| USD | 762,346 | - |
| Euros | 1,101,006 | - |
| $ARG | 111,010,790 | 92,427,287 |
| Total non-current assets by currency | 755,945,583 | 705,407,097 |
F - 91
Compañía Cervecerías Unidas S.A. Notes to the Consolidated Financial Statements
|
|
Current liabilities are openings in the following currencies:
| CURRENT LIABILITIES | As of December 31, 2011 | As of December 31, 2010 | ||
| Until 90 days | More the 91 daysuntil 1 year | Until 90 days | More the 91 daysuntil 1 year | |
| ThCh$ | ThCh$ | ThCh$ | ThCh$ | |
| Other financial liabilities | 10,541,287 | 65,563,774 | 5,175,949 | 7,645,906 |
| CLP | 224,334 | 9,961,114 | 224,333 | - |
| U.F. | 1,815,825 | 2,975,128 | 2,412,184 | 3,259,204 |
| USD | 5,336,917 | 45,080,344 | 2,393,251 | 578,875 |
| Euros | 43,411 | - | 145,922 | - |
| $ARG | 3,114,020 | 7,547,188 | - | 3,807,827 |
| Others currencys | 6,780 | - | 259 | - |
| Account payable - trade and other payable | 164,800,312 | 752,976 | 134,435,972 | 955,651 |
| CLP | 109,606,185 | 750,794 | 104,623,152 | 59,024 |
| USD | 12,106,547 | 25 | 4,982,099 | 896,627 |
| Euros | 4,777,796 | 2,157 | 2,646,568 | - |
| $ARG | 38,147,313 | - | 22,184,153 | - |
| Others currencys | 162,471 | - | - | - |
| Accounts payable to related companies | 8,811,500 | - | 7,428,103 | - |
| CLP | 5,364,833 | - | 4,484,829 | - |
| USD | 398,796 | - | 132,173 | - |
| Euros | 3,047,871 | - | 1,839,262 | - |
| $ARG | - | - | 971,839 | - |
| Other short-term provisons | 1,169,126 | - | 992,811 | - |
| CLP | 510,179 | - | 521,913 | - |
| $ARG | 658,947 | - | 470,898 | - |
| Tax liabilities | - | 16,761,406 | - | 8,290,713 |
| CLP | - | 11,404,311 | - | 3,686,080 |
| $ARG | - | 5,357,095 | - | 4,604,633 |
| Employee benefits provisions | - | 13,906,409 | - | 11,069,052 |
| CLP | - | 10,441,633 | - | 8,778,564 |
| $ARG | - | 3,464,776 | - | 2,290,488 |
| Other non-financial liabilities | 68,463,924 | - | 60,963,923 | - |
| CLP | 68,427,789 | - | 60,928,224 | - |
| $ARG | 36,135 | - | 35,699 | - |
| Total current liabilities | 253,786,149 | 96,984,565 | 208,996,758 | 27,961,322 |
| CLP | 184,133,320 | 32,557,852 | 170,782,451 | 12,523,668 |
| U.F. | 1,815,825 | 2,975,128 | 2,412,184 | 3,259,204 |
| USD | 17,842,260 | 45,080,369 | 7,507,523 | 1,475,502 |
| Euros | 7,869,078 | 2,157 | 4,631,752 | - |
| $ARG | 41,956,415 | 16,369,059 | 23,662,589 | 10,702,948 |
| Others currencys | 169,251 | - | 259 | - |
| Total current liabilities by currency | 253,786,149 | 96,984,565 | 208,996,758 | 27,961,322 |
F - 92
Compañía Cervecerías Unidas S.A. Notes to the Consolidated Financial Statements
|
|
Non-Current liabilities are openings in the following currencies:
| NON-CURRENT LIABILITIES | As of December 31, 2011 | As of December 31, 2010 | ||||
| More than 1 yearuntil 3 years | More than 3 yearuntl 5 years | More than 5 years | More than 1 yearuntil 3 years | More than 3 yearuntl 5 years | More than 5 years | |
| ThCh$ | ThCh$ | ThCh$ | ThCh$ | ThCh$ | ThCh$ | |
| Other financial liabilities | 77,021,234 | 9,964,584 | 83,969,622 | 56,874,325 | 71,737,770 | 91,533,072 |
| CLP | - | - | - | 9,961,114 | - | - |
| U.F. | 73,074,662 | 6,216,972 | 83,969,622 | 7,967,789 | 71,737,770 | 91,533,072 |
| USD | 3,840,580 | 3,747,612 | - | 38,945,422 | - | - |
| $ARG | 105,992 | - | - | - | - | - |
| Accounts payable to related companies | 2,484,790 | - | - | 620,868 | - | - |
| CLP | 618,333 | - | - | 620,868 | - | - |
| U.F. | 1,866,457 | - | - | - | - | - |
| Other long term provisions | 1,169,125 | 401,258 | 12,253,638 | 992,811 | 125,478 | 10,021,602 |
| CLP | 1,169,125 | - | 12,213,553 | 992,811 | - | 10,021,602 |
| $ARG | - | 401,258 | 40,085 | - | 125,478 | - |
| Deferred tax liabilities | 15,121,523 | 5,796,332 | 39,229,166 | 15,563,890 | 4,484,989 | 33,405,136 |
| CLP | 14,366,464 | 5,292,960 | 30,939,827 | 14,653,559 | 4,072,425 | 29,034,159 |
$ARG | 755,059 | 503,372 | 8,289,339 | 910,331 | 412,564 | 4,370,977 |
| Employee benefits provisons | - | - | 15,523,711 | - | - | 14,297,403 |
| CLP | - | - | 14,255,670 | - | - | 13,444,819 |
| $ARG | - | - | 1,268,041 | - | - | 852,584 |
| Total non-current liabilities | 95,796,672 | 16,162,174 | 150,976,137 | 74,051,894 | 76,348,237 | 149,257,213 |
| CLP | 16,153,922 | 5,292,960 | 57,409,050 | 26,228,352 | 4,072,425 | 52,500,580 |
| U.F. | 74,941,119 | 6,216,972 | 83,969,622 | 7,967,789 | 71,737,770 | 91,533,072 |
| USD | 3,840,580 | 3,747,612 | - | 38,945,422 | - | - |
| $ARG | 861,051 | 904,630 | 9,597,465 | 910,331 | 538,042 | 5,223,561 |
| Total non-current liabilities by currency | 95,796,672 | 16,162,174 | 150,976,137 | 74,051,894 | 76,348,237 | 149,257,213 |
F - 93
Compañía Cervecerías Unidas S.A. Notes to the Consolidated Financial Statements
|
|
Note 34 Contingencies and Commitments
Operating lease agreements
The total amount of the Company’s obligations to third parties relating to lease agreements that may not be terminated was as follows:
| Lease Agreements not to be terminated | As ofDecember 31,2011 | |
| ThCh$ | ||
| Within 1 year | 40,817,531 | |
| Between 1 and 5 years | 52,668,773 | |
| Over 5 years | 5,568,255 | |
| Total | 99,054,559 | |
Purchase and supply agreements
The total amount of the Company’s obligations to third parties relating to purchase and supply agreements as of December 31, 2011 was as follows:
| Purchase and supply agreementsistros | Purchase andsupplyagreements | Purchase andcontractrelated to wineand grape | |
| ThCh$ | ThCh$ | ||
| Within 1 year | 63,259,924 | 4,516,549 | |
| Between 1 and 5 years | 118,680,340 | 8,379,682 | |
| Over 5 years | 37,035,299 | 2,025,351 | |
| Total | 218,975,563 | 14,921,582 | |
Capital investment commitments
As of December 31, 2011, the Company had capital investment commitments related to Property, plant and equipment and intangibles (software) for an approximate amount of ThCh$ 113,331,371.
Litigation
The following are the most significant proceedings faced by the Company and its subsidiaries, including all those presenting at least a minimum occurrence likelihood, and which the potential loss contingency amounts are higher than ThCh$ 25,000. Those loss contingencies for which an estimate cannot be made have also been considered.
F - 94
Compañía Cervecerías Unidas S.A. Notes to the Consolidated Financial Statements
|
|
Proceedings and claim
| Company | Court | Number | Field | Step Procedure | Estimatedmaximumlosscontingency |
| Compañía Cervecerías UnidasS.A. (CCU) | 14º JuzgadoCivil deSantiago | 1293-2005 | Annulment claim of damageindemnification for sharetransfer. | Pending judgement appeals.Also pending incident ofexecution of the sentence. | ThCh$ 501,113 |
| Embotelladoras Chilenas UnidasS.A. | 1º Juzgado deLetras de SanAntonio | 0005-2011 | Claim of supposedunjustified layoff and collectof service payment | Judgement that fined theCompany. Pending appealunification of the sentence inSupreme Court | ThCh$ 60,000 |
| Embotelladoras Chilenas UnidasS.A. | 2º Juzgadodel Trabajo deSantiago | 2273-2010 | Claim for difference payment ofcompensation (UnionCUSA) | The case was referred to debtcollection RIT C-1991 - 2011,who appeal to the Court oforigin be forwarded all thebackground necessary topractice the determination ofhow much is due to each partie.Pending determination of thefinal amount of the fined to becharged. | Indeterminate |
| Cervecera CCU Chile Limitada | 1º Juzgadodel Trabajo deSantiago | 1335-2010 | Salary discount (CPI)Union brewer CCU) | In the tribunal of laborcolletction and welfare systemof Santiago, RIT C-4013-2010,in order to practice thecorresponding determination ofof the final amount of the finedto be charge. | Indeterminate |
| Viña San Pedro Tarapacá S.A. | 1º Juzgado deLetras delTrabajo deSantiago | 655-2009 | Interpretation of collective bargaining agreement,iscountsillegal remuneration andrestitution of the amountsdiscounted. | The Court of Appealsrejected the appeal forannulmentbrought by VSPT. Unfavorabletrial ended VSPT. The case wassent to Juzgado de CobranzaLaboral y Previsional who shallsettlement practice. Pending thedetermination of final amount ofthe fined to be charge. | Indeterminate |
| Compañía Industrial CerveceraS.A. (CICSA) | First instancein Argentina | Claim for supposed suddentermination of a dsitributionagreement. | Chamber Case appealed by theactor. | US$ 52,000 | |
| Compañía Industrial CerveceraS.A. (CICSA) | Secondinstance inArgentina | Claim for supposed failure tocumply of a plant saleagreement. | Presented final determination ofthe debt amount to the tribunal.To date was not approved bythe Court. Once approved, it willbeging the partial unfavourablejudgment to CICSA . | US$ 218,000 | |
| Compañía Industrial CerveceraS.A. (CICSA) | First instancein Argentina | Claim for alleged suddentermination of dsitributionagreement termination. | The complainant asked forpreventing seizure of a CICSA'splant located in Salta province.It granted by the tribunal. On03.12.09 we were notified of thetermination of proving periodand on 04.08.09 we presentedthe verbal allegation. Thedossier is to sentence to bepronounce. | US$ 57,000 | |
| Compañía Industrial CerveceraS.A. (CICSA) | First instancein Argentina | Labour trial for layoff | In proving period (must be paidcontributions) | US$ 91,000 | |
| Compañía Industrial CerveceraS.A. (CICSA) | City Council´s AdministrativeClaim related to publicity andmerchandising rates. | The process is in administrationstage, depending on the results,the Company will determinewether continue arguing injudicial instances or not. | US$ 1,270,000 | ||
F - 95
Compañía Cervecerías Unidas S.A. Notes to the Consolidated Financial Statements
|
|
The Company and its subsidiaries have established provisions to allow for such contingencies for a total ThCh$ 1,624,479 and ThCh$ 1,220,844 as of December 31, 2011 and 2010, respectively.
Tax processes
The Company was notified in May 2011, by the Internal Revenue Service ("IRS") of Liquidation of taxes and a Resolution related to the years 2009 and 2010 for an amount of ThCh$ 18,731,744 and ThCh$ 613,901, respectively.
In July 2011, the Company filed with the IRS two requests designed to nullify those acts (Revisión de la Actuación Fiscalizadora or "RAF").
In December 2011, the Company received an answer for both requests accepting the final resolution of the IRS to the RAF, which meant a disbursement of ThCh$ 4,273,112.
At the date of issue of these consolidated financial statements, there are no other material tax processes.
Guarantees
As of December 31, 2011, the subsidiary Viña San Pedro Tarapacá S.A. (VSPT) has not granted direct guarantees as part of its common financing operations. Nevertheless, its VSPT has entered into indirect guarantees as joint guarantors of financing operations by Finca La Celia subsidiary, in the Republic of Argentina.
A summary of the main terms of the guarantees granted appears below:
Banco Patagonia, Banco San Juan
The subsidiary Finca la Celia maintains financial debt with local banks in Argentina, guaranteed by VSPT through stand-by letters issued by Banco Estado of Chile, according to the following detail:
| Institution | Amount | Due date |
| Banco Patagonia | USD 500 mil | March 31, 2012 |
The mentioned stand-by letters were issued by VSPT according to the maturity of the financial debts negotiated with the Argentine banks, and they are within the financing policy framework approved by VSPT Board of Directors on January 29, 2009.
Note 35Environment
Major Environmental costs accrued as of December 31, 2011, in the Industrial Units of CCU S.A. are distributed as follows:
- IRL Expenses: 45.0%.
These expenses are mainly related to the maintenance and control of the treatment plants of Industrial Liquid Residues (IRL).
- SR Expenses: 34.0%.
These expenses are related to the handling and disposal of Solid Residues (SR), including dangerous (Respel) and recyclable residues. The disposal does not correspond to a landfill.
- Gas Emission Expenses: 1.2%.
They are related to the calibration and verification of instruments for monitoring and operating the stationary sources of industrial gas emissions (Mainly industrial boilers and electric generators) to provide compliance to rules and regulations in the field.
- Other Environmental Expenses: 19.8%
F - 96
Compañía Cervecerías Unidas S.A. Notes to the Consolidated Financial Statements
|
|
They are related to the verification and compliance of ISO 22000 Food Safety, ISO 14000 Environmental Management and ISO 18000 OHSAS Security and Health Job, which are in different implementation and/or certification renewal stages in different industrial plants or deposits. The implementation of these three international standards is a corporate goal of CCU SA.
The most relevant investments made during the year 2011, are as follows:
- Improvement of the IRL Treatments Plants in Santiago of CCU Chile. Currently at the stage of start-up at full load for expected June 2012 (UF 289,108).
- Improvement of the treatment Plant Liquid Industrial Waste (ILW) of CPCH Ovalle, that currently at the stage of start-up (UF 14,608).
- Construction of a new deep on the ground in ECUSA plant and infrastructure casino renewal by regulatory requirement (UF 9,213).
- Investments in energy recovery and uncultivated sites and plants in Santiago of Chile CCU in 2011(UF 7,875).
- Equipment and facilities for washing of trucks in distribution center of CCU Chile S.A. (UF 5,554).
- Prevention of emergencies and fires, storage related substances and energy efficiency in VSPT plants, made in 2011 (UF 5,384).
Investments principally related to the risk prevention, proyect FEI y FES (UF 5.325) of CPCH.
- Investments related to treatment plants of IRL in Molina, Santa Helena and Tabalí’s plants, made during year 2011 (UF 3,301).
The main disbursements of the year, detailed by projects, are the following:
| Company that made the disbursement | Project | Disbursment incurred during the year | |||||
| As of December 31, 2011 | As of December 31, 2010 | ||||||
| Expenditure | Investment | Committed amount in future periods | Estimated date completion of disbursements | Expenses | Investment | ||
| ThCh$ | ThCh$ | ThCh$ | ThCh$ | ThCh$ | |||
| CCU Chile | Disposal of Industrial Solid, Liquid and others Residues | 824,775 | 6,642,350 | 706,374 | 12-2012 | 556,341 | 5,876,566 |
| Cia Industrial Cervecera S.A. | Disposal of Industrial Solid, Liquid and others Residues | 1,077,125 | 628,460 | 469,376 | 12-2012 | 673,956 | 192,803 |
| Cía. Pisquera de Chile Ltda. | Disposal of Industrial Solid, Liquid and others Residues | 189,550 | 444,387 | 205,414 | 12-2012 | 193,275 | 534,864 |
| Transportes CCU Ltda. | Disposal of Industrial Solid, Liquid and others Residues | 205,475 | 120,665 | 19,415 | 12-2012 | 140,960 | 268,610 |
| VSPT | Disposal of Industrial Solid, Liquid and others Residues | 443,888 | 200,000 | 81,183 | 06-2012 | 290,381 | 168,285 |
| Otros | Disposal of Industrial Solid, Liquid and others Residues | 483,080 | 292,141 | 266,987 | 12-2012 | 353,037 | 81,888 |
Note 36Subsequent Events
A. The Consolidated Financial Statements of CCU S.A. has been approved on February 1, 2012.
B. There are no others subsequent events between the closing date and the filing date of these Financial Statements that could significantly affect their interpretation.
F - 97
Signatures
The registrant hereby certifies that it meets all of the requirements for filing on Form 20-F and that it has duly caused and authorized the undersigned to sign this annual report on its behalf.
Compañía Cervecerías Unidas S.A.
(United Breweries Company, Inc.)
/s/ Patricio Jottar | |
| Chief Executive Officer | |
Date: April 27, 2012