The Aquila Narragansett Tax-Free Income Fund (the “Fund”) seeks to provide the highest level of double tax-free income possible, as is consistent with preservation of capital, while staying within self-imposed quality restraints. The Fund strives to accomplish this by constructing a diversified investment portfolio of investment grade Rhode Island municipal securities. As an extra measure of credit protection to shareholders, most securities owned by the Fund are insured in an attempt to provide for the timely payment of principal and interest when due. A maximum average maturity profile of less than 12 years has been maintained for the Fund’s portfolio with the goal to produce a reasonable level of income return with relatively high stability for the Fund’s share price. We intend to maintain a similar profile going forward. As of the end of the Fund’s fiscal year, March 31, 2013, the portfolio had an average maturity of 10 years.
As a matter of course we look at the underlying rating(s) when buying bonds for the portfolio as well as diversifying the income stream. Insurance continues to play a diminished a role as fewer companies issue policies and many issuers forego the extra cost. In fact, few issues have come to market with insurance during the past year. As a result, we continue to provide a greater degree of diversification in the portfolio and have improved the overall credit quality. While higher credit quality should provide a greater level of comfort to our shareholders, as your locally-based portfolio managers, we continually seek to remain in touch with the locally-based projects and live in the cities and towns in which we are investing. This should be of additional assurance to you, our shareholders that we intend to continue to provide value for you, as we navigate our way through the many changes occurring in our state.
Fund Performance
The Fund’s Class Y Shares returned 4.24% on a total return basis for the twelve months ended March 31, 2013. This was above the total return for the Barclays Capital Quality Intermediate Municipal Bond Index of 3.85% for the same period. The Fund outperformed its benchmark for a number of reasons which include extending maturity/ duration during the year, overall credit quality, and, what we believe to be, a more favorable outlook for Rhode Island bonds. During the year we were able to purchase a number of new municipal bonds that allowed us to extend maturity and duration taking advantage of a steeper municipal bond curve. The impact was higher income, higher yields and an average maturity at the lower end of our target of 10 years. We were beneficiaries of a Fund that has average credit quality below that of the benchmark. While we have been increasing the underlying credit quality of the portfolio, lower quality investment grade bonds provided better returns over the past year as most investors purchased lower quality bonds in order to increase income. Fund performance also benefitted from a number of issues that were pre-refunded, which shortened the portfolio and increased the quality of the portfolio. With recent legislative and structural changes throughout the state, Rhode Island bonds have been viewed more favorably than just a few short years ago, a result of which are the rates at which communities have borrowed. The orderly exit of the City of Central Falls from Chapter 9 bankruptcy, as well as the credit-favorable negotiations between some major cities in the state with their unions and retirees, have given bond investors confidence that all obligations will be paid as scheduled.
1 | Aquila Narragansett Tax-Free Income Fund
MANAGEMENT DISCUSSION (continued)
Municipal Market
Municipal bonds extended their performance both for 2012 and through the first quarter of 2013 besting most of the investment grade indices. Despite discussions around eliminating or phasing- out of the tax-exemption, municipals steadily outperformed similar U.S. Treasury securities over the past 15 months. The municipal market has had a few challenges including potential tax treatment changes at the end of 2012 as a result of the fiscal cliff, pension and other post-employment benefits (“OPEB”) underfunding at the state and local levels, and a few high profile bankruptcies. Despite concerns over a possible phase-out of tax exemption on municipal bond interest, the market still offered considerable value to bondholders as spreads as a percentage of U.S. Treasury securities remain elevated for most of the year. Investors that stayed the course were rewarded through higher performance and higher after-tax income. Concerns surrounding underfunding of pension and OPEBs, while not completely resolved, have lessened as steps have been taken to address the underfunding. Many state and local budgets have been cut while making their annual required contributions. Negotiations with collective bargaining units and retirees in some cases surrounding contributions, benefits, and expected pension payments have taken place in an attempt to ensure future funding can be made. A number of bankruptcies continue to make their way through the courts at the federal and state level, the overhang from which has caused some jitters in the market. While the bankruptcy of Central Falls appears to be a model for an orderly Chapter 9 bankruptcy, others that are revenue-related and not general obligations of a city, involve additional parties and issues and can take much longer to resolve. Unfortunately, these are issues the municipal market must now take in stride and have become part of the municipal landscape.
U.S. Economy
The U.S. economy has continued to move along with resolve, posting slow but steady progress over the year. Real Gross Domestic Product (“GDP”) growth for 2012 was 2.2% which was expectedly better than Japan and the Eurozone. This figure includes considerable drag from a drawdown in inventories and significant cuts in government spending. These impacts may front-end load Q1 2013 and push real GDP growth above a 3% annualized pace. While the unemployment rate has been steadily declining, unemployment remains a significant drag on the economy. The most recent reports have shown the workforce shrinking as discouraged workers have dropped out of the workforce. The impact has been a falling unemployment rate, but fewer people working. One of the highlights has been the rebounding residential housing market. Prices of homes have firmed in almost all of the major markets and mortgage rates continue at low levels providing opportunity and value for potential homebuyers. This may bode well for state and local governments who are in need of additional tax revenues to support infrastructure and other essential programs, particularly given the potential for additional fiscal drag on sequester-related spending cuts.
2 | Aquila Narragansett Tax-Free Income Fund
MANAGEMENT DISCUSSION (continued)
The Federal Reserve (the “Fed”) has continued to orchestrate its monetary policy without interruption. The introduction of QE3+ towards the end of 2012 sent the message that sustainability of the program was confirmed. The Fed also laid the groundwork for the end of the program by adding specific quantitative targets that would signal the approximate time when accommodative policy would shift. While consensus appears to be with Fed tightening beginning sometime in 2015, preliminary steps for the unwinding of Quantitative Easing could begin as early as 2014.
Rhode Island Economy
The Rhode Island economy has shown some steady progress throughout the past year as most local economic indicators improved during the second half of 2012. That being said, employment in the state has lagged the rest of the country for most of the past year, but has shown improvement during the past couple of months. The state still ranks near the bottom with an unemployment rate in March of 9.1%, but has shown job gains in four of the last five months. Business and Professional Services added 1,600 jobs in March, marking its highest level of employment in 23 years. As we head into the beginning of the tourist season the state should see a boost in both employment and perhaps a continued drop in the unemployment rate. The Construction and Manufacturing sectors also added 300 jobs during March, respectively. Twin River recently announced the expected hiring of an additional 600 full- and part-time employees during the summer when it begins its table games operations. Twin River expects about 85 percent of the new hires will be from Rhode Island. However, challenging times still lie ahead for the Ocean State. A number of larger companies have laid off or announced the moving of operations to another state. Hasbro recently announced it had laid off one-third of the 123 Rhode Island workers it planned to cut as part of a larger workforce reduction. MetLife also announced it will move nearly 250 jobs over a three-year period to North Carolina, a result of consolidating operations. While challenging, Rhode Island continues to reinvent itself by working to attract new businesses and industries to the state. Cities and towns in the state have rationalized their operations and are working to manage long term liabilities and have made progress to ensure future fiscal stability. While it is still too early to see any results, Rhode Island has been a leader in this regard and appears to have set an example for other states.
Outlook & Strategy
While we have always tried to balance a steady net asset value (“NAV”), or Sharp price, and income, the low interest rate environment has proven challenging. While we are concerned with an eventual rise in interest rates, we have been careful to structure the portfolio in such a way that we believe we can take advantage of the steepening yield curve. We also have a fair amount of bonds coming due within the next 5 years that should help stabilize the NAV in a rising interest rate environment, but also allow us to take advantage of higher income through higher yields. We have purchased some higher coupon bonds with some lower dollar premiums which provide a higher current income and also will help preserve portfolio value when interest rates eventually rise. We have been careful not to extend our average maturity beyond the 10 to 12 year range, or our modified duration much beyond five years.
3 | Aquila Narragansett Tax-Free Income Fund
MANAGEMENT DISCUSSION (continued)
Our purchases during the past year have added some new issuers to the portfolio. We have been able to add some names by way of public school bonds issued through the Rhode Island Health and Educational Building Corporation which serves as a conduit for cities and towns. These bonds, for the most part, ultimately have taxpayer backing of the issuing community so the credit rating of the underlying community is used. We have been purchasing larger blocks of bonds in order to provide a higher degree of liquidity and lessen the number of portfolio holdings. We have been fortunate to be able to structure a number of new maturities to include sinking fund provisions, which lessens credit risk by incorporating a relatively quicker return of principal as the bonds approach their final maturity date. This structure also shortens duration and lessens the interest rate risk. This is important since we are no longer required to purchase insured bonds but will continue to purchase them where we feel value exists.
Given the current Federal and Rhode Island income tax rates, we believe the Aquila Narragansett Tax-Free Income Fund presently produces an attractive yield for Rhode Island residents when compared to taxable fixed-income securities.
We further believe that having available to the Fund a locally-based investment manager, with extensive knowledge and experience in the Rhode Island municipal market continues to add considerable value to your Fund’s portfolio and provides a distinct benefit to Fund shareholders.
Citizens Investment Advisors, the Fund’s investment Sub-Adviser, intends to continue to oversee the portfolio with a strong emphasis on achieving what we believe to be a balance between share price stability, acceptable double tax-free income, and high standards of credit quality.
Performance data represents past performance, but does not guarantee future results. Investment return and principal value will fluctuate; shares, when redeemed, may be worth more or less than their original cost; current performance may be lower or higher than the data presented.
NOT FDIC INSURED – NO BANK GUARANTEE – MAY LOSE VALUE
4 | Aquila Narragansett Tax-Free Income Fund
PERFORMANCE REPORT
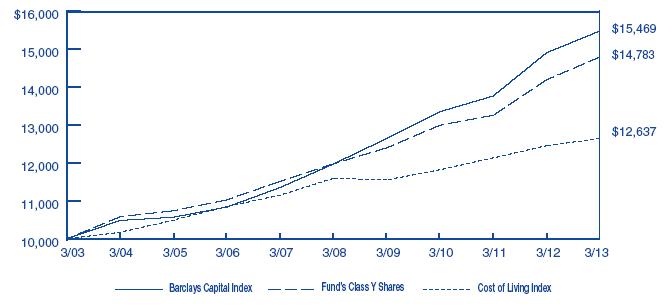
The following graph illustrates the value of $10,000 invested in the Class Y shares of Aquila Narragansett Tax-Free Income Fund for the 10-year period ended March 31, 2013 as compared with the Barclays Capital Quality Intermediate Municipal Bond Index (the “Barclays Capital Index”) and the Consumer Price Index (a cost of living index). The performance of each of the other classes is not shown in the graph but is included in the table below. It should be noted that the Barclays Capital Index does not include any operating expenses nor sales charges, and being nationally oriented, does not reflect state-specific bond market performance.
| | | Average Annual Total Return | |
| | | for periods ended March 31, 2013 | |
| | | | | | | | | | | | Since | |
| Class and Inception Date | | 1 Year | | | 5 Years | | | 10 Years | | | Inception | |
| Class A since 9/10/92 | | | | | | | | | | | | |
| With Maximum Sales Charge | | | (0.11 | )% | | | 3.32 | % | | | 3.40 | % | | | 4.81 | % |
| Without Sales Charge | | | 4.08 | | | | 4.17 | | | | 3.83 | | | | 5.02 | |
| | | | | | | | | | | | | | | | | |
| Class C since 5/01/96 | | | | | | | | | | | | | | | | |
| With CDSC* | | | 2.18 | | | | 3.29 | | | | 2.95 | | | | 3.79 | |
| Without CDSC | | | 3.21 | | | | 3.29 | | | | 2.95 | | | | 3.79 | |
| | | | | | | | | | | | | | | | | |
| Class I since 11/04/98 | | | | | | | | | | | | | | | | |
| No Sales Charge | | | 3.92 | | | | 4.02 | | | | 3.71 | | | | 4.12 | |
| | | | | | | | | | | | | | | | | |
| Class Y since 5/01/96 | | | | | | | | | | | | | | | | |
| No Sales Charge | | | 4.24 | | | | 4.31 | | | | 3.99 | | | | 4.90 | |
| | | | | | | | | | | | | | | | | |
| Barclays Capital Index | | | 3.85 | | | | 5.27 | | | | 4.46 | | | 5.29 | (Class A) |
| | | | | | | | | | | | | | | 5.13 | (Class C & Y) |
| | | | | | | | | | | | | | | 4.82 | (Class I) |
Total return figures shown for the Fund reflect any change in price and assume all distributions within the period were invested in additional shares. The rates of return will vary and the principal value of an investment will fluctuate with market conditions. Shares, if redeemed, may be worth more or less than their original cost. A portion of each class’s income may be subject to Federal and state income taxes. Past performance is not predictive of future investment results.
* CDSC = 1% contingent deferred sales charge imposed on redemptions made within the first 12 months after purchase.
5 | Aquila Narragansett Tax-Free Income Fund
REPORT OF INDEPENDENT REGISTERED PUBLIC ACCOUNTING FIRM
To the Board of Trustees and Shareholders of
Aquila Narragansett Tax-Free Income Fund:
We have audited the accompanying statement of assets and liabilities, including the schedule of investments, of Aquila Narragansett Tax-Free Income Fund as of March 31, 2013 and the related statements of operations for the period ended March 31, 2013 and the year ended June 30, 2012, and the statements of changes in net assets for the period ended March 31, 2013 and for each of the two years in the period ended June 30, 2012, and the financial highlights for the period ended March 31, 2013 and for each of the five years in the period ended June 30, 2012. These financial statements and financial highlights are the responsibility of the Fund’s management. Our responsibility is to express an opinion on these financial statements and financial highlights based on our audits.
We conducted our audits in accordance with the standards of the Public Company Accounting Oversight Board (United States). Those standards require that we plan and perform the audit to obtain reasonable assurance about whether the financial statements and financial highlights are free of material misstatement. The Fund is not required to have, nor were we engaged to perform, an audit of the Fund’s internal control over financial reporting. Our audits included consideration of internal control over financial reporting as a basis for designing audit procedures that are appropriate in the circumstances, but not for the purpose of expressing an opinion on the effectiveness of the Fund’s internal control over financial reporting. Accordingly, we express no such opinion. An audit also includes examining, on a test basis, evidence supporting the amounts and disclosures in the financial statements. Our procedures included confirmation of securities owned as of March 31, 2013, by correspondence with the custodian. An audit also includes assessing the accounting principles used and significant estimates made by management, as well as evaluating the overall financial statement presentation. We believe that our audits provide a reasonable basis for our opinion.
In our opinion, the financial statements and financial highlights referred to above present fairly, in all material respects, the financial position of Aquila Narragansett Tax-Free Income Fund as of March 31, 2013, the results of its operations for the period ended March 31, 2013 and the year ended June 30, 2012, the changes in its net assets for the period ended March 31, 2013 and for each of the two years in the period ended June 30, 2012, and the financial highlights for the period ended March 31, 2013 and for each of the five years in the period ended June 30, 2012, in conformity with accounting principles generally accepted in the United States of America.
TAIT, WELLER & BAKER LLP
Philadelphia, Pennsylvania
May 29, 2013
6 | Aquila Narragansett Tax-Free Income Fund
AQUILA NARRAGANSETT TAX-FREE INCOME FUND
SCHEDULE OF INVESTMENTS
MARCH 31, 2013
| | | | | Rating | | | |
| | | | | Moody’s, S&P | | | |
| Principal | | | | and Fitch | | | |
| Amount | | General Obligation Bonds (23.9%) | | (unaudited) | | Value | |
| | |
| | | Bristol, Rhode Island | | | | | |
| $ | 2,200,000 | | 4.000%, 02/15/26 AGC Insured | | Aa2/AA-/NR | | $ | 2,381,478 | |
| | 2,500,000 | | 4.375%, 02/15/29 AGC Insured | | Aa2/AA-/NR | | | 2,720,050 | |
| | | | Coventry, Rhode Island | | | | | | |
| | 500,000 | | 3.375%, 11/01/21 AGMC Insured | | A1/NR/NR | | | 520,230 | |
| | | | Cranston, Rhode Island | | | | | | |
| | 250,000 | | 5.000%, 02/15/22 AGMC Insured | | | | | | |
| | | | (pre-refunded) | | Aa3/AA-/AA- | | | 260,295 | |
| | 250,000 | | 5.000%, 02/15/24 AGMC Insured | | | | | | |
| | | | (pre-refunded) | | Aa3/AA-/AA- | | | 260,295 | |
| | 2,455,000 | | 4.625%, 07/01/25 AGMC Insured | | A2/AA-/NR | | | 2,650,860 | |
| | 990,000 | | 4.750%, 07/01/28 AGMC Insured | | A2/AA-/NR | | | 1,062,013 | |
| | 1,000,000 | | 4.250%, 04/01/18 NPFG Insured | | A2/A/A | | | 1,067,790 | |
| | 1,000,000 | | 4.250%, 04/01/19 NPFG Insured | | A2/A/A | | | 1,063,280 | |
| | 1,000,000 | | 4.300%, 04/01/20 NPFG Insured | | A2/A/A | | | 1,057,850 | |
| | 1,000,000 | | 4.500%, 04/01/23 NPFG Insured | | A2/A/A | | | 1,048,210 | |
| | 1,500,000 | | 4.500%, 04/01/26 NPFG Insured | | A2/A/A | | | 1,558,305 | |
| | 750,000 | | 4.300%, 07/01/30 2010 Series A | | | | | | |
| | | | AGMC Insured | | A2/AA-/A | | | 797,947 | |
| | 500,000 | | 4.375%, 02/01/33 2012 Series | | | | | | |
| | | | A AGMC Insured | | A2/AA-/A | | | 519,845 | |
| | | | Cumberland, Rhode Island | | | | | | |
| | 1,000,000 | | 4.250%, 08/01/17 AGMC Insured | | A1/AA-/NR | | | 1,111,250 | |
| | 600,000 | | 4.250%, 08/01/18 AGMC Insured | | A1/AA-/NR | | | 674,022 | |
| | 250,000 | | 4.000%, 02/01/14 NPFG/ FGIC | | | | | | |
| | | | Insured | | A1/A/NR | | | 250,605 | |
| | 250,000 | | 4.000%, 02/01/15 NPFG/ FGIC | | | | | | |
| | | | Insured | | A1/A/NR | | | 250,465 | |
| | 250,000 | | 4.000%, 02/01/16 NPFG/ FGIC | | | | | | |
| | | | Insured | | A1/A/NR | | | 250,430 | |
| | 250,000 | | 4.100%, 02/01/17 NPFG/ FGIC | | | | | | |
| | | | Insured | | A1/A/NR | | | 250,423 | |
| | 250,000 | | 4.150%, 02/01/18 NPFG/ FGIC | | | | | | |
| | | | Insured | | A1/A/NR | | | 250,393 | |
| | 500,000 | | 4.250%, 11/01/27 Series 2011 A | | NR/A/NR | | | 524,165 | |
| | 500,000 | | 4.625%, 11/01/31 Series 2011 A | | NR/A/NR | | | 528,440 | |
| | | | East Providence, Rhode Island Refunding | | | | | | |
| | 2,500,000 | | 4.550%, 05/15/30 AGMC Insured | | A2/AA-/NR | | | 2,639,800 | |
7 | Aquila Narragansett Tax-Free Income Fund
AQUILA NARRAGANSETT TAX-FREE INCOME FUND
SCHEDULE OF INVESTMENTS (continued)
MARCH 31, 2013
| | | | | Rating | | | |
| | | | | Moody’s, S&P | | | |
| Principal | | | | and Fitch | | | |
| Amount | | General Obligation Bonds (continued) | | (unaudited) | | Value | |
| | |
| | | Hopkinton, Rhode Island | | | | | |
| $ | 500,000 | | 4.375%, 08/15/31 | | Aa3/NR/NR | | $ | 543,960 | |
| | | | Lincoln, Rhode Island | | | | | | |
| | 1,000,000 | | 4.500%, 08/01/24 NPFG Insured | | Aa2/NR/AA | | | 1,088,500 | |
| | 1,775,000 | | 4.500%, 08/01/25 NPFG Insured | | Aa2/NR/AA | | | 1,924,899 | |
| | 2,000,000 | | 4.500%, 08/01/26 NPFG Insured | | Aa2/NR/AA | | | 2,158,140 | |
| | | | North Providence, Rhode Island | | | | | | |
| | 500,000 | | 4.700%, 09/15/14 AGMC Insured | | A2/AA-/NR | | | 501,225 | |
| | 500,000 | | 3.650%, 10/15/14 AGMC Insured | | A2/AA-/NR | | | 505,765 | |
| | 2,225,000 | | 3.625%, 07/15/15 AGMC Insured | | A2/AA-/NR | | | 2,320,475 | |
| | 500,000 | | 3.750%, 10/15/15 AGMC Insured | | A2/AA-/NR | | | 506,490 | |
| | 250,000 | | 4.000%, 10/15/17 AGMC Insured | | A2/AA-/NR | | | 253,200 | |
| | | | Pawtucket, Rhode Island | | | | | | |
| | 910,000 | | 4.000%, 04/15/14 AMBAC Insured | | Baa2/NR/BBB- | | | 911,829 | |
| | 1,950,000 | | 4.500%, 07/15/26 AGC Insured | | A3/NR/NR | | | 2,072,616 | |
| | 1,500,000 | | 4.750%, 07/15/29 AGC Insured | | A3/NR/NR | | | 1,592,685 | |
| | | | Providence, Rhode Island | | | | | | |
| | 500,000 | | 5.000%, 07/15/14 AGMC Insured | | A2/AA-/BBB | | | 526,620 | |
| | 1,500,000 | | 5.000%, 01/15/23 AGMC Insured | | | | | | |
| | | | Series 2010 A Refunding | | A2/AA-/NR | | | 1,710,150 | |
| | 1,500,000 | | 5.000%, 01/15/26 AGMC Insured | | | | | | |
| | | | Series 2010 A Refunding | | A2/AA-/NR | | | 1,670,445 | |
| | 975,000 | | 3.625%, 01/15/29 Series A AGMC | | | | | | |
| | | | Insured | | A2/AA-/BBB | | | 961,681 | |
| | 2,510,000 | | 3.750%, 01/15/30 Series A AGMC | | | | | | |
| | | | Insured | | A2/AA-/BBB | | | 2,485,201 | |
| | 1,000,000 | | 750%, 01/15/32 Series A AGMC | | | | | | |
| | | | Insured | | A2/AA-/BBB | | | 980,110 | |
| | | | Rhode Island State & Providence | | | | | | |
| | | | Plantations Consolidated Capital | | | | | | |
| | | | Development Loan | | | | | | |
| | 2,000,000 | | 4.500%, 02/01/17 NPFG Insured | | | | | | |
| | | | (pre-refunded) | | Aa2/AA/AA | | | 2,070,400 | |
| | 1,750,000 | | 3.250%, 10/15/31 Series B | | Aa2/AA/AA | | | 1,702,347 | |
| | | | Warwick, Rhode Island | | | | | | |
| | 1,000,000 | | 4.000%, 08/01/16 AGMC Insured | | | | | | |
| | | | Series 2008 | | Aa3/AA-/NR | | | 1,092,780 | |
8 | Aquila Narragansett Tax-Free Income Fund
AQUILA NARRAGANSETT TAX-FREE INCOME FUND
SCHEDULE OF INVESTMENTS (continued)
MARCH 31, 2013
| | | | | Rating | | | |
| | | | | Moody’s, S&P | | | |
| Principal | | | | and Fitch | | | |
| Amount | | General Obligation Bonds (continued) | | (unaudited) | | Value | |
| | |
| | | Warwick, Rhode Island (continued) | | | | | |
| | 1,015,000 | | 4.000%, 08/01/17 AGMC Insured | | | | | |
| | | | Series 2008 | | Aa3/AA-/NR | | $ | 1,128,142 | |
| | 905,000 | | 4.250%, 01/15/18 Syncora Guarantee, | | | | | | |
| | | | Inc. Insured | | Aa3/AA-/NR | | | 974,893 | |
| | | | West Warwick, Rhode Island | | | | | | |
| | 500,000 | | 4.875%, 03/01/16 AMBAC Insured | | Baa1/NR/BBB+ | | | 501,530 | |
| | 670,000 | | 5.000%, 03/01/17 AMBAC Insured | | Baa1/NR/BBB+ | | | 672,104 | |
| | 700,000 | | 5.050%, 03/01/18 AMBAC Insured | | Baa1/NR/BBB+ | | | 702,240 | |
| | 735,000 | | 5.100%, 03/01/19 AMBAC Insured | | Baa1/NR/BBB+ | | | 737,381 | |
| | 1,900,000 | | 4.625%, 04/01/26 AGC Insured | | A3/NR/NR | | | 2,081,336 | |
| | 1,400,000 | | 4.750%, 04/01/29 AGC Insured | | A3/NR/NR | | | 1,522,290 | |
| | | | Westerly, Rhode Island | | | | | | |
| | 900,000 | | 4.000%, 07/01/17 NPFG Insured | | Aa2/AA/NR | | | 983,556 | |
| | 900,000 | | 4.000%, 07/01/18 NPFG Insured | | Aa2/AA/NR | | | 985,068 | |
| | | | Woonsocket, Rhode Island | | | | | | |
| | 550,000 | | 4.250%, 03/01/25 AMBAC Insured | | B2/NR/B | | | 439,813 | |
| | | | Total General Obligation Bonds | | | | | 62,006,312 | |
| | |
| | | | Revenue Bonds (73.6%) | | | | | | |
| | |
| | | | Development Revenue Bonds (4.8%) | | | | | | |
| | | | Providence, Rhode Island Redevelopment | | | | | | |
| | | | Agency Revenue Refunding Public | | | | | | |
| | | | Safety Building Project | | | | | | |
| | 2,000,000 | | 4.750%, 04/01/22 AMBAC Insured | | | | | | |
| | | | Series A | | Baa2/BBB-/NR | | | 2,042,020 | |
| | 1,000,000 | | 5.000%, 04/01/28 AMBAC Insured | | | | | | |
| | | | Series A | | Baa2/BBB-/NR | | | 1,010,210 | |
| | | | Rhode Island Certificates of Participation | | | | | | |
| | | | (Central Power Plant) | | | | | | |
| | 1,000,000 | | 4.000%, 10/01/20 Series D AGMC | | | | | | |
| | | | Insured | | Aa3/AA-/AA- | | | 1,063,830 | |
| | | | Rhode Island Certificates of Participation | | | | | | |
| | | | (Kent County Court House Project) | | | | | | |
| | 250,000 | | 5.000%, 10/01/22 NPFG Insured | | | | | | |
| | | | Series 2004 A | | Aa3/AA-/AA- | | | 264,835 | |
| | | | Rhode Island Convention Center | | | | | | |
| | | | Authority Revenue Refunding | | | | | | |
| | 2,000,000 | | 5.000%, 05/15/21 AGMC Insured | | Aa3/AA-/NR | | | 2,128,420 | |
9 | Aquila Narragansett Tax-Free Income Fund
AQUILA NARRAGANSETT TAX-FREE INCOME FUND
SCHEDULE OF INVESTMENTS (continued)
MARCH 31, 2013
| | | | | Rating | | | |
| | | | | Moody’s, S&P | | | |
| Principal | | | | and Fitch | | | |
| Amount | | Revenue Bonds (continued) | | (unaudited) | | Value | |
| | |
| | | Development Revenue Bonds (continued) | | | | | |
| | | Rhode Island Convention Center | | | | | |
| | | Authority Revenue Refunding | | | | | |
| | | (continued) | | | | | |
| $ | 4,000,000 | | 5.000%, 05/15/23 AGMC Insured | | | | | |
| | | | Series 2005 A | | Aa3/AA-/NR | | $ | 4,220,080 | |
| | 1,500,000 | | 5.500%, 05/15/27 AGMC Insured | | | | | | |
| | | | Series A | | Aa3/AA-/AA- | | | 1,691,115 | |
| | | | Total Development Revenue Bonds | | | | | 12,420,510 | |
| | | | | | | | | | |
| | | | Higher Education Revenue Bonds (23.0%) | | | | | | |
| | | | Rhode Island Health & Education | | | | | | |
| | | | Building Corp., Brown University | | | | | | |
| | 2,500,000 | | 4.750%, 09/01/33 Series 2003 A | | Aa1/AA+/NR | | | 2,529,075 | |
| | 1,000,000 | | 4.750%, 09/01/37 Series 2003 A | | Aa1/AA+/NR | | | 1,010,810 | |
| | | | Rhode Island Health & Education | | | | | | |
| | | | Building Corp., Bryant University | | | | | | |
| | 1,115,000 | | 4.500%, 12/01/27 Series 2011 | | A2/A/NR | | | 1,197,644 | |
| | 1,455,000 | | 4.750%, 12/01/29 Series 2011 | | A2/A/NR | | | 1,578,486 | |
| | 1,000,000 | | 5.000%, 12/01/30 Series 2011 | | A2/A/NR | | | 1,106,470 | |
| | 1,425,000 | | 5.000%, 12/01/31 Series 2011 | | A2/A/NR | | | 1,567,799 | |
| | | | Rhode Island Health & Education | | | | | | |
| | | | Building Corp., Higher Educational | | | | | | |
| | | | Facilities | | | | | | |
| | 1,010,000 | | 3.625%, 09/15/14 Series 2003 B NPFG | | | | | | |
| | | | Insured | | Baa2/NR/NR | | | 1,014,585 | |
| | 1,050,000 | | 4.000%, 09/15/15 Series 2003 B NPFG | | | | | | |
| | | | Insured | | Baa2/NR/NR | | | 1,061,718 | |
| | 1,040,000 | | 4.000%, 09/15/16 Series 2003 B NPFG | | | | | | |
| | | | Insured | | Baa2/NR/NR | | | 1,046,968 | |
| | 600,000 | | 3.625%, 09/15/14 Series 2003 C NPFG | | | | | | |
| | | | Insured | | Baa2/NR/NR | | | 602,856 | |
| | 500,000 | | 4.000%, 09/15/15 Series 2003 C NPFG | | | | | | |
| | | | Insured | | Baa2/NR/NR | | | 505,805 | |
| | 500,000 | | 4.000%, 09/15/16 Series 2003 C NPFG | | | | | | |
| | | | Insured | | Baa2/NR/NR | | | 503,575 | |
| | 5,000,000 | | 5.000%, 09/15/30 AGMC Insured | | A1/NR/NR | | | 5,505,250 | |
10 | Aquila Narragansett Tax-Free Income Fund
AQUILA NARRAGANSETT TAX-FREE INCOME FUND
SCHEDULE OF INVESTMENTS (continued)
MARCH 31, 2013
| | | | | Rating | | | |
| | | | | Moody’s, S&P | | | |
| Principal | | | | and Fitch | | | |
| Amount | | Revenue Bonds (continued) | | (unaudited) | | Value | |
| | |
| | | Higher Education Revenue Bonds | | | | | |
| | | (continued) | | | | | |
| | | Rhode Island Health & Education | | | | | |
| | | Building Corp., Johnson & Wales | | | | | |
| | | University | | | | | |
| $ | 465,000 | | 5.500%, 04/01/15 Series 1999 A NPFG | | | | | |
| | | | Insured | | Baa2/NR/NR | | $ | 500,266 | |
| | 900,000 | | 5.500%, 04/01/16 Series 1999 A NPFG | | | | | | |
| | | | Insured | | Baa2/NR/NR | | | 991,386 | |
| | 785,000 | | 5.500%, 04/01/17 Series 1999 A NPFG | | | | | | |
| | | | Insured | | Baa2/NR/NR | | | 881,626 | |
| | 500,000 | | 5.250%, 04/01/14 Series 2003 Syncora | | | | | | |
| | | | Guarantee, Inc. Insured | | NR/NR/NR* | | | 501,620 | |
| | 2,000,000 | | 4.000%, 04/01/14 Series 2003 Syncora | | | | | | |
| | | | Guarantee, Inc. Insured | | NR/NR/NR* | | | 2,004,740 | |
| | 1,500,000 | | 5.000%, 04/01/29 NPFG Insured | | Baa2/NR/NR | | | 1,500,840 | |
| | | | Rhode Island Health & Educational | | | | | | |
| | | | Building Corp., Higher Education | | | | | | |
| | | | Facility, New England Institute of | | | | | | |
| | | | Technology | | | | | | |
| | 3,000,000 | | 4.750%, 03/01/30 Series 2010 A | | NR/A/A+ | | | 3,245,580 | |
| | | | Rhode Island Health & Educational | | | | | | |
| | | | Building Corp., Higher Education | | | | | | |
| | | | Facility, Rhode Island School of Design | | | | | | |
| | 5,000,000 | | 4.000%, 06/01/31 2012 Series A | | A1/NR/A+ | | | 5,115,450 | |
| | 1,750,000 | | 3.125%, 08/15/25 AGMC Insured | | | | | | |
| | | | Series B | | A1/AA-/NR | | | 1,750,665 | |
| | 2,115,000 | | 3.500%, 08/15/29 AGMC Insured | | | | | | |
| | | | Series B | | A1/AA-/NR | | | 2,116,607 | |
| | 1,000,000 | | 3.500%, 08/15/30 AGMC Insured | | | | | | |
| | | | Series B | | A1/AA-/NR | | | 993,530 | |
| | 1,310,000 | | 5.625%, 08/15/22 Syncora Guarantee, | | | | | | |
| | | | Inc. Insured Series D (pre-refunded). | | A1/NR/NR | | | 1,382,063 | |
| | 900,000 | | 5.000%, 08/15/23 Syncora Guarantee, | | | | | | |
| | | | Inc. Insured Series D (pre-refunded). | | A1/NR/NR | | | 957,906 | |
| | 3,000,000 | | 3.500%, 06/01/29 Series 2012 | | A1/NR/A+ | | | 2,967,000 | |
11 | Aquila Narragansett Tax-Free Income Fund
AQUILA NARRAGANSETT TAX-FREE INCOME FUND
SCHEDULE OF INVESTMENTS (continued)
MARCH 31, 2013
| | | | | Rating | | | |
| | | | | Moody’s, S&P | | | |
| Principal | | | | and Fitch | | | |
| Amount | | Revenue Bonds (continued) | | (unaudited) | | Value | |
| | |
| | | Higher Education Revenue Bonds | | | | | |
| | | (continued) | | | | | |
| | | Rhode Island Health & Educational | | | | | |
| | | Building Corp., Higher Education | | | | | |
| | | Facility, University of Rhode Island | | | | | |
| | | Auxiliary Enterprise | | | | | |
| $ | 2,000,000 | | 5.000%, 09/15/30 Series 2010 B | | | | | |
| | | | AGMC Insured | | A1/AA-/NR | | $ | 2,229,900 | |
| | | | Rhode Island Health & Educational | | | | | | |
| | | | Building Corp., University of | | | | | | |
| | | | Rhode Island | | | | | | |
| | 800,000 | | 5.000%, 09/15/23 Series 2003 C | | | | | | |
| | | | Refunding NPFG Insured | | Baa2/NR/NR | | | 804,824 | |
| | 1,000,000 | | 4.500%, 09/15/26 Series 2005 G | | | | | | |
| | | | Refunding AMBAC Insured | | Aa3/A+/NR | | | 1,041,660 | |
| | | | Rhode Island Health & Education | | | | | | |
| | | | Facilities Authority, Providence | | | | | | |
| | | | College | | | | | | |
| | 1,000,000 | | 4.250%, 11/01/14 Syncora Guarantee, | | | | | | |
| | | | Inc. Insured (pre-refunded) | | A2/NR/NR | | | 1,023,310 | |
| | 2,500,000 | | 4.375%, 11/01/15 Syncora Guarantee, | | | | | | |
| | | | Inc. Insured (pre-refunded) | | A2/NR/NR | | | 2,560,100 | |
| | 2,500,000 | | 4.500%, 11/01/16 Syncora Guarantee, | | | | | | |
| | | | Inc. Insured (pre-refunded) | | A2/NR/NR | | | 2,561,900 | |
| | 1,000,000 | | 4.500%, 11/01/17 Syncora Guarantee, | | | | | | |
| | | | Inc. Insured (pre-refunded) | | A2/NR/NR | | | 1,024,760 | |
| | 1,000,000 | | 5.000%, 11/01/24 Syncora Guarantee, | | | | | | |
| | | | Inc. Insured Series 2003 A | | | | | | |
| | | | (pre-refunded) | | A2/NR/NR | | | 1,027,640 | |
| | 1,500,000 | | 4.000%, 11/01/31 | | A2/A/NR | | | 1,539,450 | |
| | | | Rhode Island State Economic | | | | | | |
| | | | Development Corp., University of | | | | | | |
| | | | Rhode Island | | | | | | |
| | 750,000 | | 4.900%, 11/01/13 Series 1999 AGMC | | | | | | |
| | | | Insured | | A2/NR/NR | | | 752,205 | |
| | 750,000 | | 5.000%, 11/01/14 Series 1999 AGMC | | | | | | |
| | | | Insured | | A2/NR/NR | | | 752,257 | |
| | | | Total Higher Education Revenue Bonds | | | | | 59,458,326 | |
12 | Aquila Narragansett Tax-Free Income Fund
AQUILA NARRAGANSETT TAX-FREE INCOME FUND
SCHEDULE OF INVESTMENTS (continued)
MARCH 31, 2013
| | | | | Rating | | | |
| | | | | Moody’s, S&P | | | |
| Principal | | | | and Fitch | | | |
| Amount | | Revenue Bonds (continued) | | (unaudited) | | Value | |
| | |
| | | Hospital Revenue Bonds (3.7%) | | | | | |
| | | Rhode Island Health & Education | | | | | |
| | | Building Corp., Lifespan Obligation | | | | | |
| $ | 2,500,000 | | 5.000%, 05/15/20 Series A AGMC | | | | | |
| | | | Insured | | A2/AA-/NR | | $ | 2,720,725 | |
| | 5,000,000 | | 5.000%, 05/15/26 Series A AGMC | | | | | | |
| | | | Insured | | A2/AA-/NR | | | 5,321,350 | |
| | 1,500,000 | | 5.250%, 05/15/26 NPFG Insured | | Baa1/NR/NR | | | 1,501,395 | |
| | | | Total Hospital Revenue Bonds | | | | | 9,543,470 | |
| | |
| | | | Housing Revenue Bonds (9.1%) | | | | | | |
| | | | Rhode Island Housing & Mortgage | | | | | | |
| | | | Finance Corp. Home Funding | | | | | | |
| | 3,195,000 | | 4.000%, 10/01/25 Series 2010 #3 | | Aa2/NR/NR | | | 3,317,464 | |
| | 2,250,000 | | 4.100%, 04/01/28 Series 2010 #3 | | Aa2/NR/NR | | | 2,321,820 | |
| | 1,530,000 | | 4.050%, 10/01/26 2011 Series 4 | | Aa2/NR/NR | | | 1,614,456 | |
| | 995,000 | | 4.200%, 10/01/28 2011 Series 4 | | Aa2/NR/NR | | | 1,048,889 | |
| | 1,345,000 | | 3.050%, 10/01/28 Series 5 | | Aa2/NR/NR | | | 1,310,850 | |
| | 1,600,000 | | 3.350%, 10/01/33 Series 5 | | Aa2/NR/NR | | | 1,578,944 | |
| | 2,360,000 | | 3.450%, 04/01/35 Series 5 | | Aa2/NR/NR | | | 2,289,035 | |
| | | | Rhode Island Housing & Mortgage | | | | | | |
| | | | Finance Corp. Multi-Family Housing | | | | | | |
| | 2,500,000 | | 4.625%, 10/01/25 Series 2010 A | | Aaa/NR/NR | | | 2,647,675 | |
| | 1,475,000 | | 3.250%, 10/01/27 Series 1B | | Aa2/NR/NR | | | 1,468,244 | |
| | 2,000,000 | | 5.000%, 10/01/30 Series 2010 A | | Aaa/NR/NR | | | 2,095,860 | |
| | 2,400,000 | | 3.625%, 10/01/32 Series 1B | | Aa2/NR/NR | | | 2,388,360 | |
| | 1,500,000 | | 3.900%, 10/01/37 Series 1B | | Aa2/NR/NR | | | 1,490,625 | |
| | | | Total Housing Revenue Bonds | | | | | 23,572,222 | |
| | |
| | | | Public School Revenue Bonds (18.9%) | | | | | | |
| | | | Providence, Rhode Island Public | | | | | | |
| | | | Building Authority, School Projects | | | | | | |
| | 500,000 | | 5.500%, 12/15/14 Series 1996 B NPFG | | | | | | |
| | | | Insured | | Baa2/NR/NR | | | 501,755 | |
| | 500,000 | | 5.500%, 12/15/15 Series 1996 B NPFG | | | | | | |
| | | | Insured | | Baa2/NR/NR | | | 501,630 | |
| | 1,000,000 | | 5.250%, 12/15/14 Series 1998 A | | | | | | |
| | | | AGMC Insured | | A2/AA-/NR | | | 1,003,200 | |
| | 685,000 | | 5.000%, 12/15/18 Series 1998 A | | | | | | |
| | | | AGMC Insured | | A2/AA-/NR | | | 686,740 | |
13 | Aquila Narragansett Tax-Free Income Fund
AQUILA NARRAGANSETT TAX-FREE INCOME FUND
SCHEDULE OF INVESTMENTS (continued)
MARCH 31, 2013
| | | | | Rating | | | |
| | | | | Moody’s, S&P | | | |
| Principal | | | | and Fitch | | | |
| Amount | | Revenue Bonds (continued) | | (unaudited) | | Value | |
| | |
| | | Public School Revenue Bonds (continued) | | | | | |
| | | Providence, Rhode Island Public | | | | | |
| | | Building Authority, School Projects | | | | | |
| | | (continued) | | | | | |
| | 500,000 | | 5.125%, 12/15/14 Series | | | | | |
| | | | 1999 A AMBAC Insured | | Baa2/BBB-/NR | | $ | 501,015 | |
| | 250,000 | | 5.250%, 12/15/15 Series | | | | | | |
| | | | 1999 A AMBAC Insured | | Baa2/BBB-/NR | | | 250,485 | |
| | 1,500,000 | | 5.250%, 12/15/17 Series | | | | | | |
| | | | 1999 A AMBAC Insured | | Baa2/BBB-/NR | | | 1,503,060 | |
| | 1,000,000 | | 5.250%, 12/15/19 Series | | | | | | |
| | | | 1999 A AMBAC Insured | | Baa2/BBB-/NR | | | 1,001,750 | |
| | 1,000,000 | | 4.000%, 12/15/13 Series | | | | | | |
| | | | 2003 A NPFG Insured | | Baa2/BBB-/NR | | | 1,002,370 | |
| | 1,505,000 | | 4.000%, 12/15/14 Series | | | | | | |
| | | | 2003 A NPFG Insured | | Baa2/BBB-/NR | | | 1,507,965 | |
| | 1,570,000 | | 4.000%, 12/15/15 Series | | | | | | |
| | | | 2003 A NPFG Insured | | Baa2/BBB-/NR | | | 1,572,873 | |
| | 1,630,000 | | 4.000%, 12/15/16 Series 2003 A NPFG | | | | | | |
| | | | Insured | | Baa2/BBB-/NR | | | 1,632,559 | |
| | 3,000,000 | | 4.500%, 05/15/27 Series A AGMC | | | | | | |
| | | | Insured | | A2/AA-/NR | | | 3,144,480 | |
| | 3,000,000 | | 4.500%, 05/15/28 Series 2007 A | | | | | | |
| | | | AGMC Insured | | A2/AA-/NR | | | 3,128,010 | |
| | 2,000,000 | | 4.500%, 05/15/26 Series 2007 A | | | | | | |
| | | | AGMC Insured | | A2/AA-/NR | | | 2,105,000 | |
| | 3,000,000 | | 4.500%, 05/15/27 Series 2007 B | | | | | | |
| | | | AGMC Insured | | A2/AA-/NR | | | 3,132,720 | |
| | 3,000,000 | | 4.500%, 05/15/28 Series 2007 C | | | | | | |
| | | | AGMC Insured | | A2/AA-/NR | | | 3,116,310 | |
| | | | Rhode Island Certificates of Participation | | | | | | |
| | | | (School for the Deaf Project) | | | | | | |
| | 1,000,000 | | 5.500%, 04/01/27 Series C 2009 AGC | | | | | | |
| | | | Insured | | Aa3/AA-/AA- | | | 1,116,460 | |
| | 500,000 | | 5.625%, 04/01/29 Series C 2009 AGC | | | | | | |
| | | | Insured | | Aa3/AA-/AA- | | | 557,290 | |
| | | | Rhode Island Health & Education | | | | | | |
| | | | Building Corp., Public School | | | | | | |
| | | | Financing Program - Chariho | | | | | | |
| | | | Regional School District | | | | | | |
| | 1,000,000 | | 5.000%, 05/15/26 Series 2011B | | Aa3/NR/NR | | | 1,110,370 | |
14 | Aquila Narragansett Tax-Free Income Fund
AQUILA NARRAGANSETT TAX-FREE INCOME FUND
SCHEDULE OF INVESTMENTS (continued)
MARCH 31, 2013
| | | | | Rating | | | |
| | | | | Moody’s, S&P | | | |
| Principal | | | | and Fitch | | | |
| Amount | | Revenue Bonds (continued) | | (unaudited) | | Value | |
| | |
| | | Public School Revenue Bonds (continued) | | | | | |
| | | Rhode Island Health & Education | | | | | |
| | | Building Corp., Public School | | | | | |
| | | Financing Program, East Greenwich | | | | | |
| $ | 1,150,000 | | 3.125%, 05/15/28 | | Aa1/AA+/NR | | $ | 1,149,287 | |
| | 1,600,000 | | 3.250%, 05/15/29 | | Aa1/AA+/NR | | | 1,607,504 | |
| | 1,650,000 | | 3.375%, 05/15/30 | | Aa1/AA+/NR | | | 1,666,120 | |
| | 1,200,000 | | 3.500%, 05/15/31 | | Aa1/AA+/NR | | | 1,218,732 | |
| | | | Rhode Island Health & Education | | | | | | |
| | | | Building Corp., Public School | | | | | | |
| | | | Financing Program, City of East | | | | | | |
| | | | Providence | | | | | | |
| | 1,000,000 | | 3.375%, 05/15/27 Series B | | Aa3/NR/NR | | | 970,920 | |
| | 1,000,000 | | 3.625%, 05/15/32 Series B | | Aa3/NR/NR | | | 956,640 | |
| | | | Rhode Island Health & Education | | | | | | |
| | | | Building Corp., Public School | | | | | | |
| | | | Financing Program | | | | | | |
| | 1,000,000 | | 5.000%, 05/15/17 Series 2006 A | | | | | | |
| | | | AGMC Insured | | A2/AA-/NR | | | 1,105,200 | |
| | 500,000 | | 5.000%, 05/15/20 Series 2007 A | | | | | | |
| | | | AGMC Insured | | Aa3/NR/NR | | | 557,725 | |
| | 500,000 | | 5.000%, 05/15/17 Series 2008 A | | | | | | |
| | | | AGMC Insured | | Aa3/NR/NR | | | 565,750 | |
| | 1,000,000 | | 4.250%, 05/15/21 Series 2007 B | | | | | | |
| | | | AGMC Insured | | A2/AA-/NR | | | 1,068,440 | |
| | 1,500,000 | | 4.250%, 05/15/21 Series A AGMC | | | | | | |
| | | | Insured | | Aa3/NR/NR | | | 1,618,575 | |
| | 2,000,000 | | 4.375%, 05/15/22 Series A AGMC | | | | | | |
| | | | Insured | | Aa3/NR/NR | | | 2,160,040 | |
| | 3,000,000 | | 4.500%, 05/15/25 Series A AGMC | | | | | | |
| | | | Insured | | Aa3/NR/NR | | | 3,223,680 | |
| | 2,000,000 | | 4.750%, 05/15/29 Series A AGMC | | | | | | |
| | | | Insured | | Aa3/NR/NR | | | 2,117,080 | |
| | | | Total Public School Revenue Bonds | | | | | 49,061,735 | |
| | |
| | | | Student Loan Revenue (0.4%) | | | | | | |
| | | | State of Rhode Island Student Loan | | | | | | |
| | | | Authority | | | | | | |
| | 1,000,000 | | 4.750%, 12/01/23 Senior Series 2010 B | | NR/A+/A | | | 1,055,930 | |
15 | Aquila Narragansett Tax-Free Income Fund
AQUILA NARRAGANSETT TAX-FREE INCOME FUND
SCHEDULE OF INVESTMENTS (continued)
MARCH 31, 2013
| | | | | Rating | | | |
| | | | | Moody’s, S&P | | | |
| Principal | | | | and Fitch | | | |
| Amount | | Revenue Bonds (continued) | | (unaudited) | | Value | |
| | |
| | | Transportation Revenue Bonds (6.0%) | | | | | |
| | | Rhode Island State Economic | | | | | |
| | | Development Corp., Airport Revenue | | | | | |
| $ | 540,000 | | 4.625%, 07/01/26 AGC Insured | | | | | |
| | | | Series B | | Aa3/AA-/A- | | $ | 572,837 | |
| | 1,000,000 | | 5.000%, 07/01/18 AGC Insured | | | | | | |
| | | | Series C | | Aa3/AA-/A- | | | 1,137,940 | |
| | 1,500,000 | | 5.000%, 07/01/22 NPFG Insured | | | | | | |
| | | | Series C | | A3/BBB+/A- | | | 1,574,250 | |
| | | | Rhode Island State Economic | | | | | | |
| | | | Development Corp., Motor Fuel Tax | | | | | | |
| | | | Revenue (Rhode Island Department | | | | | | |
| | | | of Transportation) | | | | | | |
| | 1,000,000 | | 4.000%, 06/15/15 Series A AMBAC | | | | | | |
| | | | Insured | | A2/A+/A | | | 1,004,440 | |
| | 1,000,000 | | 4.000%, 06/15/18 Series 2006A | | | | | | |
| | | | AMBAC Insured | | A2/A+/A | | | 1,042,380 | |
| | 2,385,000 | | 4.700%, 06/15/23 Series 2003A | | | | | | |
| | | | AMBAC Insured | | A2/A+/A | | | 2,392,036 | |
| | | | Rhode Island State Economic | | | | | | |
| | | | Development Corp., (Rhode Island | | | | | | |
| | | | Airport Corp. Intermodal Facility | | | | | | |
| | | | Project) | | | | | | |
| | 1,000,000 | | 4.250%, 07/01/17 CIFG Assurance | | | | | | |
| | | | North America, Inc. Insured | | Baa1/BBB+/NR | | | 1,058,990 | |
| | | | Rhode Island Economic Development | | | | | | |
| | | | Corp. (Rhode Island Department of | | | | | | |
| | | | Transportation) | | | | | | |
| | 1,500,000 | | 5.250%, 06/15/21 AGC Insured | | Aa3/AA-/A+ | | | 1,769,460 | |
| | | | Rhode Island State Turnpike & Bridge | | | | | | |
| | | | Authority | | | | | | |
| | 1,600,000 | | 4.625%, 12/01/27 Series 2010 A | | NR/A-/A | | | 1,742,416 | |
| | 2,000,000 | | 5.125%, 12/01/35 Series 2010 A | | NR/A-/A | | | 2,189,920 | |
| | 1,000,000 | | 5.000%, 12/01/35 Series 2010 A | | NR/A-/A | | | 1,086,680 | |
| | | | Total Transportation Revenue Bonds | | | | | 15,571,349 | |
| | |
| | | | Water and Sewer Revenue Bonds (7.2%) | | | | | | |
| | | | Bristol County, Rhode Island Water | | | | | | |
| | | | Authority | | | | | | |
| | 1,000,000 | | 3.500%, 12/01/13 Series 2004 | | | | | | |
| | | | Refunding A NPFG Insured | | Baa2/NR/NR | | | 1,011,110 | |
16 | Aquila Narragansett Tax-Free Income Fund
AQUILA NARRAGANSETT TAX-FREE INCOME FUND
SCHEDULE OF INVESTMENTS (continued)
MARCH 31, 2013
| | | | | Rating | | | |
| | | | | Moody’s, S&P | | | |
| Principal | | | | and Fitch | | | |
| Amount | | Revenue Bonds (continued) | | (unaudited) | | Value | |
| | |
| | | Water and Sewer Revenue Bonds | | | | | |
| | | (continued) | | | | | |
| | | Bristol County, Rhode Island Water | | | | | |
| | | Authority (continued) | | | | | |
| $ | 1,000,000 | | 3.500%, 12/01/14 Series 2004 | | | | | |
| | | | Refunding A NPFG Insured | | Baa2/NR/NR | | $ | 1,020,740 | |
| | | | Narragansett, Rhode Island Bay | | | | | | |
| | | | Commission Wastewater System | | | | | | |
| | 365,000 | | 5.000%, 08/01/27 Series 2003 A NPFG | | | | | | |
| | | | Insured | | Baa2/AA-/NR | | | 390,291 | |
| | 1,000,000 | | 5.000%, 02/01/32 Series 2007 A NPFG | | | | | | |
| | | | Insured | | NR/AA-/NR | | | 1,088,780 | |
| | 4,230,000 | | 5.000%, 08/01/35 Series A NPFG | | | | | | |
| | | | Insured | | Baa2/AA-/NR | | | 4,478,386 | |
| | | | Rhode Island Clean Water Protection | | | | | | |
| | | | Finance Agency | | | | | | |
| | 295,000 | | 4.600%, 10/01/13 Series A AMBAC | | | | | | |
| | | | Insured | | Aaa/NR/NR | | | 295,888 | |
| | 325,000 | | 4.750%, 10/01/14 Series A AMBAC | | | | | | |
| | | | Insured | | Aaa/NR/NR | | | 326,001 | |
| | 1,545,000 | | 4.750%, 10/01/18 Series A AMBAC | | | | | | |
| | | | Insured | | Aaa/NR/NR | | | 1,549,589 | |
| | 760,000 | | 5.400%, 10/01/15 1993 Series A NPFG | | | | | | |
| | | | Insured | | Aaa/NR/NR | | | 810,768 | |
| | 500,000 | | 4.750%, 10/01/20 1999 Series A | | | | | | |
| | | | AMBAC Insured | | Aaa/NR/NR | | | 501,415 | |
| | | | Rhode Island Clean Water Finance | | | | | | |
| | | | Agency, Water Pollution Control | | | | | | |
| | | | Bonds | | | | | | |
| | 310,000 | | 5.000%, 10/01/18 Series B NPFG | | | | | | |
| | | | Insured | | Aaa/AAA/NR | | | 310,980 | |
| | 4,765,000 | | 4.375%, 10/01/21 Series 2002 B NPFG | | | | | | |
| | | | Insured | | Aaa/AAA/AAA | | | 4,776,484 | |
| | | | Rhode Island Water Resources Board | | | | | | |
| | | | Public Drinking Water Protection | | | | | | |
| | 1,500,000 | | 4.000%, 03/01/14 Series 2002 NPFG | | | | | | |
| | | | Insured | | Baa2/NR/NR | | | 1,502,655 | |
| | 595,000 | | 4.250%, 03/01/15 Series 2002 NPFG | | | | | | |
| | | | Insured | | Baa2/NR/NR | | | 596,089 | |
| | | | Total Water and Sewer Revenue Bonds | | | | | 18,659,176 | |
17 | Aquila Narragansett Tax-Free Income Fund
AQUILA NARRAGANSETT TAX-FREE INCOME FUND
SCHEDULE OF INVESTMENTS (continued)
MARCH 31, 2013
| | | | | Rating | | | | |
| | | | | Moody’s, S&P | | | | |
| Principal | | | | and Fitch | | | | |
| Amount | | Revenue Bonds (continued) | | (unaudited) | | | Value | |
| | |
| | | Other Revenue Bonds (0.5%) | | | | | | |
| | | State of Rhode Island Depositors | | | | | | |
| | | Economic Protection Corp. | | | | | | |
| $ | 500,000 | | 6.000%, 08/01/17 NPFG Insured | | | | | | |
| | | | ETM | | NR/NR/NR* | | | $ | 542,740 | |
| | 250,000 | | 5.750%, 08/01/21 Series A AGMC | | | | | | | |
| | | | Insured ETM | | NR/NR/NR* | | | | 326,498 | |
| | 215,000 | | 6.375%, 08/01/22 Series A NPFG | | | | | | | |
| | | | Insured ETM | | NR/NR/AAA | | | | 294,673 | |
| | 965,000 | | Total Other Revenue Bonds | | | | | | 1,163,911 | |
| | |
| | | | Total Revenue Bonds | | | | | | 190,506,629 | |
| | |
| | | | Total Investments (cost $243,168,501- | | | | | | | |
| | | | note 4) | | | 97.5 | % | | | 252,512,941 | |
| | | | Other assets less liabilities | | | 2.5 | | | | 6,411,208 | |
| | | | Net Assets | | | 100.0 | % | | $ | 258,924,149 | |
| | |
| | * | | Any security not rated (“NR”) by any of the Nationally Recognized Statistical Rating Organizations (“NRSRO” or “Credit Rating Agency”) has been determined by the Investment Sub-Adviser to have sufficient quality to be ranked in the top four credit ratings if a credit rating were to be assigned by a NRSRO. | | | | | |
| | |
| | | | | | | | | | Percent of | |
| | | | Portfolio Distribution By Quality Rating (unaudited) | | | Investments† | |
| | | | Aaa of Moody’s or AAA of S&P or Fitch | | | | | | | 5.3 | % |
| | | | Pre-refunded bonds††/Escrowed to maturity bonds | | | | | | | 5.7 | |
| | | | Aa of Moody’s or AA of S&P or Fitch | | | | | | | 53.8 | |
| | | | A of Moody’s or S&P or Fitch | | | | | | | 21.1 | |
| | | | Baa of Moody’s or BBB of S&P or Fitch | | | | | | | 12.9 | |
| | | | B of Moody’s or B of Fitch | | | | | | | 0.2 | |
| | | | Not Rated* | | | | | | | 1.0 | |
| | | | | | | | | | | 100.0 | % |
18 | Aquila Narragansett Tax-Free Income Fund
AQUILA NARRAGANSETT TAX-FREE INCOME FUND
SCHEDULE OF INVESTMENTS (continued)
MARCH 31, 2013
| † | Where applicable, calculated using the highest rating of the three NRSROs. |
| | |
| †† | Pre-refunded bonds are bonds for which U.S. Government Obligations usually have been placed in escrow to retire the bonds at their earliest call date. |
| | |
| | PORTFOLIO ABBREVIATIONS: AGC - Assured Guaranty Corp AGMC - Assured Guaranty Municipal Corp. AMBAC - American Municipal Bond Assurance Corp. CIFG - CDC IXIS Financial Guaranty ETM - Escrowed to Maturity FGIC - Financial Guaranty Insurance Co. NPFG - National Public Finance Guarantee NR - Not Rated |
See accompanying notes to financial statements.
19 | Aquila Narragansett Tax-Free Income Fund
AQUILA NARRAGANSETT TAX-FREE INCOME
FUND STATEMENT OF ASSETS AND LIABILITIES
MARCH 31, 2013
| ASSETS | | | |
| Investments at value (cost $243,168,501) | | $ | 252,512,941 | |
| Cash | | | 2,771,242 | |
| Interest receivable | | | 3,271,881 | |
| Receivable for Fund shares sold | | | 1,001,500 | |
| Other assets | | | 10,425 | |
| Total assets | | | 259,567,989 | |
| LIABILITIES | | | | |
| Dividends payable | | | 253,621 | |
| Payable for Fund shares redeemed | | | 224,033 | |
| Management fee payable | | | 81,260 | |
| Distribution and service fees payable | | | 5,983 | |
| Accrued expenses | | | 78,943 | |
| Total liabilities | | | 643,840 | |
| NET ASSETS | | $ | 258,924,149 | |
| Net Assets consist of: | | | | |
| Capital Stock - Authorized 80,000,000 shares, par value $0.01 | | | | |
| per share | | $ | 239,959 | |
| Additional paid-in capital | | | 249,437,011 | |
| Net unrealized appreciation on investments (note 4) | | | 9,344,440 | |
| Accumulated net realized loss on investments | | | (165,978 | ) |
| Undistributed net investment income | | | 68,717 | |
| | | $ | 258,924,149 | |
| | | | | |
| CLASS A | | | | |
| Net Assets | | $ | 143,148,020 | |
| Capital shares outstanding | | | 13,266,792 | |
| Net asset value and redemption price per share | | $ | 10.79 | |
| Maximum offering price per share (100/96 of $10.79) | | $ | 11.24 | |
| | | | | |
| CLASS C | | | | |
| Net Assets | | $ | 22,176,897 | |
| Capital shares outstanding | | | 2,055,541 | |
| Net asset value and offering price per share | | $ | 10.79 | |
| Redemption price per share (*a charge of 1% is imposed on the | | | | |
| redemption proceeds, or on the original price, whichever is | | | | |
| lower, if redeemed during the first 12 months after purchase) | | $ | 10.79 | * |
| | | | | |
| CLASS I | | | | |
| Net Assets | | $ | 266,552 | |
| Capital shares outstanding | | | 24,715 | |
| Net asset value, offering and redemption price per share | | $ | 10.79 | |
| | | | | |
| CLASS Y | | | | |
| Net Assets | | $ | 93,332,680 | |
| Capital shares outstanding | | | 8,648,811 | |
| Net asset value, offering and redemption price per share | | $ | 10.79 | |
See accompanying notes to financial statements.
20 | Aquila Narragansett Tax-Free Income Fund
AQUILA NARRAGANSETT TAX-FREE INCOME FUND
STATEMENTS OF OPERATIONS
| | | Nine Months Ended | | | Year Ended | |
| | | March 31, 2013† | | | June 30, 2012 | |
| | |
| Investment Income: | | | | | | |
| | |
| Interest income | | $ | 7,620,922 | | | $ | 10,241,144 | |
| | | | | | | | | |
| Expenses: | | | | | | | | |
| | |
| Management fees (note 3) | | | 952,303 | | | | 1,232,675 | |
| Distribution and service fees (note 3) | | | 328,218 | | | | 460,215 | |
| Legal fees | | | 165,503 | | | | 115,235 | |
| Trustees’ fees and expenses (note 8) | | | 92,586 | | | | 118,947 | |
| Transfer and shareholder servicing | | | | | | | | |
| agent fees (note 3) | | | 84,891 | | | | 117,803 | |
| Shareholders’ reports and proxy | | | | | | | | |
| statements | | | 34,814 | | | | 43,573 | |
| Auditing and tax fees | | | 19,100 | | | | 23,500 | |
| Custodian fees (note 6) | | | 15,115 | | | | 26,765 | |
| Fund accounting fees | | | 14,839 | | | | 19,781 | |
| Insurance | | | 8,778 | | | | 10,115 | |
| Registration fees and dues | | | 7,338 | | | | 17,387 | |
| Chief compliance officer services (note 3) | | | 4,148 | | | | 4,936 | |
| Miscellaneous | | | 39,293 | | | | 43,280 | |
| Total expenses | | | 1,766,926 | | | | 2,234,212 | |
| Management fees waived (note 3) | | | (247,598 | ) | | | (383,096 | ) |
| Expenses paid indirectly (note 6) | | | (1,567 | ) | | | (259 | ) |
| Net expenses | | | 1,517,761 | | | | 1,850,857 | |
| Net investment income | | | 6,103,161 | | | | 8,390,287 | |
| | |
| Realized and Unrealized Gain (Loss) on Investments: | | | | | | | | |
| | |
| Net realized gain (loss) from securities | | | | | | | | |
| transactions | | | (86,421 | ) | | | 238,542 | |
| Change in unrealized appreciation on | | | | | | | | |
| investments | | | 167,096 | | | | 5,891,931 | |
| Net realized and unrealized gain (loss) on | | | | | | | | |
| investments | | | 80,675 | | | | 6,130,473 | |
| Net change in net assets resulting from | | | | | | | | |
| operations | | $ | 6,183,836 | | | $ | 14,520,760 | |
| † | Effective December 1, 2012, the Fund changed its fiscal year end from June 30 to March 31. The information presented is for the period July 1, 2012 to March 31, 2013. |
See accompanying notes to financial statements.
21 | Aquila Narragansett Tax-Free Income Fund
AQUILA NARRAGANSETT TAX-FREE INCOME FUND
STATEMENTS OF CHANGES IN NET ASSETS
| | | Nine Months Ended | | | Year Ended | | | Year Ended | |
| | | March 31, 2013† | | | June 30, 2012 | | | June 30, 2011 | |
| | |
| OPERATIONS: | | | | | | | | | |
| Net investment income | | $ | 6,103,161 | | | $ | 8,390,287 | | | $ | 8,926,839 | |
| Net realized gain (loss) from | | | | | | | | | | | | |
| securities transactions | | | (86,421 | ) | | | 238,542 | | | | 309,501 | |
| Change in unrealized appreciation | | | | | | | | | | | | |
| on investments | | | 167,096 | | | | 5,891,931 | | | | (3,966,060 | ) |
| Change in net assets from | | | | | | | | | | | | |
| operations | | | 6,183,836 | | | | 14,520,760 | | | | 5,270,280 | |
| | |
| DISTRIBUTIONS TO SHAREHOLDERS (note 9): | | | | | | | | | |
| Class A Shares: | | | | | | | | | | | | |
| Net investment income | | | (3,525,480 | ) | | | (5,165,290 | ) | | | (5,691,791 | ) |
| | |
| Class C Shares: | | | | | | | | | | | | |
| Net investment income | | | (387,652 | ) | | | (606,886 | ) | | | (738,571 | ) |
| | |
| Class I Shares: | | | | | | | | | | | | |
| Net investment income | | | (6,471 | ) | | | (9,248 | ) | | | (9,714 | ) |
| | |
| Class Y Shares: | | | | | | | | | | | | |
| Net investment income | | | (2,170,436 | ) | | | (2,592,898 | ) | | | (2,507,629 | ) |
| Change in net assets from | | | | | | | | | | | | |
| distributions | | | (6,090,039 | ) | | | (8,374,322 | ) | | | (8,947,705 | ) |
| | |
| CAPITAL SHARE TRANSACTIONS (note 7): | | | | | | | | | |
| Proceeds from shares sold | | | 30,389,104 | | | | 42,222,021 | | | | 59,761,681 | |
| Reinvested dividends and | | | | | | | | | | | | |
| distributions | | | 2,660,956 | | | | 3,521,913 | | | | 4,080,843 | |
| Cost of shares redeemed | | | (23,572,063 | ) | | | (44,244,636 | ) | | | (43,872,777 | ) |
| Change in net assets from | | | | | | | | | | | | |
| capital share transactions | | | 9,477,997 | | | | 1,499,298 | | | | 19,969,747 | |
| | |
| Change in net assets | | | 9,571,794 | | | | 7,645,736 | | | | 16,292,322 | |
| | |
| NET ASSETS: | | | | | | | | | | | | |
| Beginning of period | | | 249,352,355 | | | | 241,706,619 | | | | 225,414,297 | |
| | |
| End of period* | | $ | 258,924,149 | | | $ | 249,352,355 | | | $ | 241,706,619 | |
| | |
| *Includes undistributed net | | | | | | | | | | | | |
| investment income of: | | $ | 68,717 | | | $ | 55,589 | | | $ | 48,055 | |
| † | Effective December 1, 2012, the Fund changed its fiscal year end from June 30 to March 31. The information presented is for the period July 1, 2012 to March 31, 2013. |
See accompanying notes to financial statements.
22 | Aquila Narragansett Tax-Free Income Fund
AQUILA NARRAGANSETT TAX-FREE INCOME FUND
NOTES TO FINANCIAL STATEMENTS
MARCH 31, 2013
1. Organization
Aquila Narragansett Tax-Free Income Fund (the “Fund”) (from inception until October 18, 2012, the Fund operated under the name Narragansett Insured Tax-Free Income Fund), a non-diversified, open-end investment company, was organized on January 22, 1992 as a Massachusetts business trust and commenced operations on September 10, 1992. The Fund is authorized to issue 80,000,000 shares and, since its inception to May 1, 1996, offered only one class of shares. On that date, the Fund began offering two additional classes of shares, Class C and Class Y Shares. All shares outstanding prior to that date were designated as Class A Shares and are sold at net asset value plus a sales charge of varying size (depending upon a variety of factors) paid at the time of purchase and bear a distribution fee. Class C Shares are sold at net asset value with no sales charge payable at the time of purchase but with a level charge for service and distribution fees for six years thereafter. Class C Shares automatically convert to Class A Shares after six years. Class Y Shares are sold only through authorized financial institutions acting for investors in a fiduciary, advisory, agency, custodial or similar capacity, and are not offered directly to retail customers. Class Y Shares are sold at net asset value with no sales charge, no redemption fee, no contingent deferred sales charge (“CDSC”) and no distribution fee. On October 31, 1997, the Fund established Class I Shares which are offered and sold only through financial intermediaries and are not offered directly to retail customers. Class I Shares are sold at net asset value with no sales charge and no redemption fee or CDSC, although a financial intermediary may charge a fee for effecting a purchase or other transaction on behalf of its customers. Class I Shares carry a distribution and a service fee. All classes of shares represent interests in the same portfolio of investments and are identical as to rights and privileges but differ with respect to the effect of sales charges, the distribution and/or service fees borne by each class, expenses specific to each class, voting rights on matters affecting a single class and the exchange privileges of each class. On December 1, 2012, the Board of Trustees approved a change in the Fund’s fiscal and tax year end from June to March.
2. Significant Accounting Policies
The following is a summary of significant accounting policies followed by the Fund in the preparation of its financial statements. The policies are in conformity with accounting principles generally accepted in the United States of America for investment companies.
| a) | Portfolio valuation: Municipal securities which have remaining maturities of more than 60 days are valued each business day based upon information provided by a nationally prominent independent pricing service and periodically verified through other pricing services. In the case of securities for which market quotations are readily available, securities are valued by the pricing service at the mean of bid and asked quotations. If a market quotation or a valuation from the pricing service is not readily available, the security is valued at fair value determined in good faith under procedures established by and under the general supervision of the Board of Trustees. Securities which mature in 60 days or less are generally valued at amortized cost iftheir term to maturity at purchase is 60 days or less, or by amortizing their unrealized appreciation or depreciation on the 61st day prior to maturity, if their term to maturity at purchase exceeds 60 days. |
23 | Aquila Narragansett Tax-Free Income Fund
AQUILA NARRAGANSETT TAX-FREE INCOME FUND
NOTES TO FINANCIAL STATEMENTS (continued)
MARCH 31, 2013
| b) | Fair value measurements: The Fund follows a fair value hierarchy that distinguishes between market data obtained from independent sources (observable inputs) and the Fund’s own market assumptions (unobservable inputs). These inputs are used in determining the value of the Fund’s investments and are summarized in the following fair value hierarchy: |
Level 1 – Unadjusted quoted prices in active markets for identical assets or liabilities that the Fund has the ability to access.
Level 2 – Observable inputs other than quoted prices included in Level 1 that are observable for the asset or liability, either directly or indirectly. These inputs may include quoted prices for the identical instrument on an inactive market, prices for similar instruments, interest rates, prepayment speeds, credit risk, yield curves, default rates and similar data.
Level 3 – Unobservable inputs for the asset or liability, to the extent relevant observable inputs are not available, representing the Fund’s own assumptions about the assumptions a market participant would use in valuing the asset or liability, based on the best information available.
The inputs or methodology used for valuing securities are not an indication of the risk associated with investing in those securities
The following is a summary of the valuation inputs, representing 100% of the Fund’s investments, used to value the Fund’s net assets as of March 31, 2013:
| Valuation Inputs | | | Investments in Securities | |
| Level 1 – Quoted Prices | | $ | — | |
Level 2 – Other Significant Observable Inputs — Municipal Bonds* | | | 252,512,941 | |
| Level 3 – Significant Unobservable Inputs | | | — | |
| Total | | $ | 252,512,941 | |
* See schedule of investments for a detailed listing of securities.
| c) | Subsequent events: In preparing these financial statements, the Fund has evaluated events and transactions for potential recognition or disclosure through the date these financial statements were issued. |
| d) | Securities transactions and related investment income: Securities transactions are recorded on the trade date. Realized gains and losses from securities transactions are reported on the identified cost basis. Interest income is recorded daily on the accrual basis and is adjusted for amortization of premium and accretion of original issue and market discount. |
24 | Aquila Narragansett Tax-Free Income Fund
AQUILA NARRAGANSETT TAX-FREE INCOME FUND
NOTES TO FINANCIAL STATEMENTS (continued)
MARCH 31, 2013
| e) | Federal income taxes: It is the policy of the Fund to continue to qualify as a regulated investment company by complying with the provisions of the Internal Revenue Code applicable to certain investment companies. The Fund intends to make distributions of income and securities profits sufficient to relieve it from all, or substantially all, Federal income and excise taxes. |
Management has reviewed the tax positions for each of the open tax years (2010-2012) or expected to be taken in the Fund’s 2013 tax returns and has concluded that there are no significant uncertain tax positions that would require recognition in the financial statements
| f) | Multiple class allocations: All income, expenses (other than class-specific expenses), and realized and unrealized gains or losses are allocated daily to each class of shares based on the relative net assets of each class. Class-specific expenses, which include distribution and service fees and any other items that are specifically attributed to a particular class, are also charged directly to such class on a daily basis. |
| g) | Use of estimates: The preparation of financial statements in conformity with accounting principles generally accepted in the United States of America requires management to make estimates and assumptions that affect the reported amounts of assets and liabilities and disclosure of contingent assets and liabilities at the date of the financial statements and the reported amounts of increases and decreases in net assets from operations during the reporting period. Actual results could differ from those estimates. |
| h) | Reclassification of capital accounts: Accounting principles generally accepted in the United States of America require that certain components of net assets relating to permanent differences be reclassified between financial and tax reporting. On March 31, 2013, the Fund decreased additional paid-in capital by $6 and increased undistributed net investment income by $6. These reclassifications have no effect on net assets or net asset value per share. |
| i) | Accounting pronouncement: In January 2013, the Financial Accounting Standards Board (“FASB”) issued Accounting Standards Update (“ASU”) No. 2013-01 Clarifying the Scope of Disclosures about Offsetting Assets and Liabilities. This update gives additional clarification to the FASB ASU No. 2011-11 Disclosures about Offsetting Assets and Liabilities. The amendments in this ASU require an entity to disclose information about offsetting and related arrangements to enable users of its financial statements to understand the effect of those arrangements on its financial position. The ASU is effective for annual reporting periods beginning on or after January 1, 2013, and interim periods within those annual periods. The guidance requires retrospective application for all comparative periods presented. Management expects ASU 2013-01 to have no impact on the financial statement disclosures. |
25 | Aquila Narragansett Tax-Free Income Fund
AQUILA NARRAGANSETT TAX-FREE INCOME FUND
NOTES TO FINANCIAL STATEMENTS (continued)
MARCH 31, 2013
3. Fees and Related Party Transactions
a) Management Arrangements:
Aquila Investment Management LLC (the “Manager”), a wholly-owned subsidiary of Aquila Management Corporation, the Fund’s founder and sponsor, serves as the Manager for the Fund under an Advisory and Administration Agreement with the Fund. The portfolio management of the Fund has been delegated to a Sub-Adviser as described below. Under the Advisory and Administration Agreement, the Manager provides all administrative services to the Fund, other than those relating to the day-to-day portfolio management. The Manager’s services include providing the office of the Fund and all related services as well as overseeing the activities of the Sub-Adviser and managing relationships with all the various support organizations to the Fund such as the shareholder servicing agent, custodian, legal counsel, fund accounting agent, auditor and distributor. For its services, the Manager is entitled to receive a fee which is payable monthly and computed as of the close of business each day at the annual rate of 0.50 of 1% on the Fund’s net assets.
Citizens Investment Advisors, a department of RBS Citizens, N.A. (the “Sub-Adviser”), serves as the Investment Sub-Adviser for the Fund under a Sub-Advisory Agreement between the Manager and the Sub-Adviser. Under this agreement, the Sub-Adviser continuously provides, subject to oversight of the Manager and the Board of Trustees of the Fund, the investment program of the Fund and the composition of its portfolio, arranges for the purchases and sales of portfolio securities, and provides for daily pricing of the Fund’s portfolio. For its services, the Sub-Adviser is entitled to receive a fee from the Manager which is payable monthly and computed as of the close of business each day at the annual rate of 0.23% on the Fund’s net assets.
The Manager has contractually undertaken to waive fees and/or reimburse Fund expenses so that total Fund expenses will not exceed 0.83% for Class A Shares, 1.68% for Class C Shares, 0.98% for Class I Shares or 0.68% for Class Y Shares. These expense limitations are in effect until October 31, 2013. Prior to October 31, 2013, the Manager may not terminate the arrangement without the approval of the Board of Trustees. For the nine months ended March 31, 2013, the Fund incurred management fees of $952,303 of which $247,598 was waived. For the year ended June 30, 2012, the Fund incurred management fees of $1,232,675 of which $383,096 was waived.
Under a Compliance Agreement with the Manager, the Manager is compensated by the Fund for Chief Compliance Officer related services provided to enable the Fund to comply with Rule 38a-1 of the Investment Company Act of 1940.
Specific details as to the nature and extent of the services provided by the Manager and the Sub-Adviser are more fully defined in the Fund’s Prospectus and Statement of Additional Information.
26 | Aquila Narragansett Tax-Free Income Fund
AQUILA NARRAGANSETT TAX-FREE INCOME FUND
NOTES TO FINANCIAL STATEMENTS (continued)
MARCH 31, 2013
b) Distribution and Service Fees:
The Fund has adopted a Distribution Plan (the “Plan”) pursuant to Rule 12b-1 (the “Rule”) under the Investment Company Act of 1940. Under one part of the Plan, with respect to Class A Shares, the Fund is authorized to make distribution fee payments to broker-dealers or others (“Qualified Recipients”) selected by Aquila Distributors, Inc. (“the Distributor”), including, but not limited to, any principal underwriter of the Fund with which the Distributor has entered into written agreements contemplated by the Rule and which have rendered assistance in the distribution and/or retention of the Fund’s shares or servicing of shareholder accounts. The Fund makes payment of this distribution fee at the annual rate of 0.15% of the Fund’s average net assets represented by Class A Shares. For the nine months ended March 31, 2013, distribution fees on Class A Shares amounted to $164,171, of which the Distributor retained $5,142. For the year ended June 30, 2012, distribution fees on Class A Shares amounted to $225,566, of which the Distributor retained $6,392.
Under another part of the Plan, the Fund is authorized to make payments with respect to Class C Shares to Qualified Recipients which have rendered assistance in the distribution and/or retention of the Fund’s Class C Shares or servicing of shareholder accounts. These payments are made at the annual rate of 0.75% of the Fund’s average net assets represented by Class C Shares. For the nine months ended March 31, 2013, these payments amounted to $122,719 and for the year ended June 30, 2012, amounted to $175,564. In addition, under a Shareholder Services Plan, the Fund is authorized to make service fee payments with respect to Class C Shares to Qualified Recipients for providing personal services and/or maintenance of shareholder accounts. These payments are made at the annual rate of 0.25% of the Fund’s average net assets represented by Class C Shares. For the nine months ended March 31, 2013, these payments amounted to $40,906 and for the year ended June 30, 2012, amounted to $58,521. For the three months ended March 31, 2013, the total of these payments with respect to Class C Shares amounted to $163,625, of which the Distributor retained $38,760. For the year ended June 30, 2012, the total of these payments with respect to Class C Shares amounted to $234,085, of which the Distributor retained $49,323.
Under another part of the Plan, the Fund is authorized to make payments with respect to Class I Shares to Qualified Recipients. Class I payments, under the Plan, may not exceed, for any fiscal year of the Fund a rate (currently 0.20%) set from time to time by the Board of Trustees of not more than 0.25% of the average annual net assets represented by the Class I Shares. In addition, the Fund has a Shareholder Services Plan under which it may pay service fees (currently 0.15%) of not more than 0.25% of the average annual net assets of the Fund represented by Class I Shares. That is, the total payments under both plans will not exceed 0.50% of such net assets. For the nine months ended March 31, 2013, these payments were made at the average annual rate of 0.35% of such net assets amounting to $739 of which $422 related to the Plan and $317 related to the Shareholder Services Plan. For the year ended June 30, 2012, these payments were made at the average annual rate of 0.35% of such net assets amounting to $987 of which $564 related to the Plan and $423 related to the Shareholder Services Plan.
Specific details about the Plans are more fully defined in the Fund’s Prospectus and Statement of Additional Information.
27 | Aquila Narragansett Tax-Free Income Fund
AQUILA NARRAGANSETT TAX-FREE INCOME FUND
NOTES TO FINANCIAL STATEMENTS (continued)
MARCH 31, 2013
Under a Distribution Agreement, the Distributor serves as the exclusive distributor of the Fund’s shares. Through agreements between the Distributor and various brokerage and advisory firms (“intermediaries”), the Fund’s shares are sold primarily through the facilities of these intermediaries having offices within Rhode Island, with the bulk of any sales commissions inuring to such intermediaries. For the nine months ended March 31, 2013, total commissions on sales of Class A Shares amounted to $283,199, of which the Distributor received $24,470. For the year ended June 30, 2012, total commissions on sales of Class A Shares amounted to $389,429, of which the Distributor received $45,513.
4. Purchases and Sales of Securities
During the nine months ended March 31, 2013, purchases of securities and proceeds from the sales of securities aggregated $32,526,204 and $19,323,359, respectively.
At March 31, 2013, the aggregate tax cost for all securities was $243,099,784. At March 31, 2013, the aggregate gross unrealized appreciation for all securities in which there is an excess of value over tax cost amounted to $10,096,634 and aggregate gross unrealized depreciation for all securities in which there is an excess of tax cost over value amounted to $683,477 for a net unrealized appreciation of $9,413,157.
5. Portfolio Orientation
Since the Fund invests principally and may invest entirely in double tax-free municipal obligations of issuers within Rhode Island, it is subject to possible risks associated with economic, political, or legal developments or industrial or regional matters specifically affecting Rhode Island and whatever effects these may have upon Rhode Island issuers’ ability to meet their obligations.
The Fund is also permitted to invest in U.S. territorial municipal obligations meeting comparable quality standards and providing income which is exempt from both regular Federal and Rhode Island income taxes. The general policy of the Fund is to invest in such securities only when comparable securities of Rhode Island issuers are not available in the market. At March 31, 2013, the Fund had all of its net assets invested in the securities of Rhode Island issuers.
6. Expenses
The Fund has negotiated an expense offset arrangement with its custodian wherein it receives credit toward the reduction of custodian fees and other Fund expenses whenever there are uninvested cash balances. The Statement of Operations reflects the total expenses before any offset, the amount of offset and the net expenses.
28 | Aquila Narragansett Tax-Free Income Fund
AQUILA NARRAGANSETT TAX-FREE INCOME FUND
NOTES TO FINANCIAL STATEMENTS (continued)
MARCH 31, 2013
7. Capital Share Transactions
Transactions in Capital Shares of the Fund were as follows:
| | | | | | Year Ended | | | Year Ended | |
| | | March 31, 2013 | | | June 30, 2012 | | | June 30, 2011 | |
| SHARES | | | | | | | | | |
| Class A Shares: | | | | | | | | | |
| Shares sold | | | 998,617 | | | | 1,513,351 | | | | 2,069,666 | |
| Reinvested distributions | | | 171,297 | | | | 243,137 | | | | 293,027 | |
| Shares redeemed | | | (1,421,064 | ) | | | (2,516,350 | ) | | | (2,261,505 | ) |
| Net change | | | (251,150 | ) | | | (759,862 | ) | | | 101,188 | |
| Class C Shares: | | | | | | | | | | | | |
| Shares sold | | | 211,834 | | | | 427,311 | | | | 1,073,689 | |
| Reinvested distributions | | | 25,240 | | | | 36,465 | | | | 42,990 | |
| Shares redeemed | | | (135,578 | ) | | | (829,745 | ) | | | (893,747 | ) |
| Net change | | | 101,496 | | | | (365,969 | ) | | | 222,932 | |
| Class I Shares: | | | | | | | | | | | | |
| Shares sold | | | – | | | | – | | | | 2 | |
| Reinvested distributions | | | 595 | | | | 863 | | | | 920 | |
| Shares redeemed | | | (2,279 | ) | | | (651 | ) | | | (697 | ) |
| Net change | | | (1,684 | ) | | | 212 | | | | 225 | |
| Class Y Shares: | | | | | | | | | | | | |
| Shares sold | | | 1,582,970 | | | | 1,995,072 | | | | 2,464,854 | |
| Reinvested distributions | | | 47,488 | | | | 48,102 | | | | 49,482 | |
| Shares redeemed | | | (609,200 | ) | | | (782,101 | ) | | | (1,037,059 | ) |
| Net change | | | 1,021,258 | | | | 1,261,073 | | | | 1,477,277 | |
| Total transactions in | | | | | | | | | | | | |
| Fund shares | | | 869,920 | | | | 135,454 | | | | 1,801,622 | |
| DOLLARS | | | | | | | | | | | | |
| Class A Shares: | | | | | | | | | | | | |
| Proceeds from shares sold | | $ | 10,873,175 | | | $ | 16,195,459 | | | $ | 22,007,849 | |
| Reinvested distributions | | | 1,863,120 | | | | 2,605,830 | | | | 3,095,077 | |
| Cost of shares redeemed | | | (15,461,948 | ) | | | (26,960,476 | ) | | | (23,643,293 | ) |
| Net change | | | (2,725,653 | ) | | | (8,159,187 | ) | | | 1,459,633 | |
| Class C Shares: | | | | | | | | | | | | |
| Proceeds from shares sold | | | 2,302,611 | | | | 4,569,106 | | | | 11,445,248 | |
| Reinvested distributions | | | 274,530 | | | | 390,714 | | | | 453,549 | |
| Cost of shares redeemed | | | (1,471,760 | ) | | | (8,890,179 | ) | | | (9,385,248 | ) |
| Net change | | | 1,105,381 | | | | (3,930,359 | ) | | | 2,513,549 | |
| Class I Shares: | | | | | | | | | | | | |
| Proceeds from shares sold | | | – | | | | – | | | | 20 | |
| Reinvested distributions | | | 6,471 | | | | 9,248 | | | | 9,714 | |
| Cost of shares redeemed | | | (24,779 | ) | | | (6,973 | ) | | | (7,356 | ) |
| Net change | | | (18,308 | ) | | | 2,275 | | | | 2,378 | |
| Class Y Shares: | | | | | | | | | | | | |
| Proceeds from shares sold | | | 17,213,318 | | | | 21,457,456 | | | | 26,308,564 | |
| Reinvested distributions | | | 516,835 | | | | 516,121 | | | | 522,503 | |
| Cost of shares redeemed | | | (6,613,576 | ) | | | (8,387,008 | ) | | | (10,836,880 | ) |
| Net change | | | 11,116,577 | | | | 13,586,569 | | | | 15,994,187 | |
| Total transactions in | | | | | | | | | | | | |
| Fund shares | | $ | 9,477,997 | | | $ | 1,499,298 | | | $ | 19,969,747 | |
29 | Aquila Narragansett Tax-Free Income Fund
AQUILA NARRAGANSETT TAX-FREE INCOME FUND
NOTES TO FINANCIAL STATEMENTS (continued)
MARCH 31, 2013
8. Trustees’ Fees and Expenses
At March 31, 2013 there were 7 Trustees, one of whom is affiliated with the Manager and is not paid any fees. The total amount of Trustees’ service fees (for carrying out their responsibilities) and attendance fees paid during the nine months ended March 31, 2013 was $68,009 and for the year ended June 30, 2012 was $94,704. Attendance fees are paid to those in attendance at regularly scheduled quarterly Board Meetings and meetings of the Independent Trustees held prior to each quarterly Board Meeting, as well as additional meetings (such as Audit, Nominating, Shareholder and special meetings). Trustees are reimbursed for their expenses such as travel, accommodations and meals incurred in connection with attendance at Board Meetings and the Annual Meeting of Shareholders. For the nine months ended March 31, 2013, such meeting-related expenses amounted to $24,577 and for the year ended June 30, 2012, amounted to $24,243.
9. Securities Traded on a When-Issued Basis
The Fund may purchase or sell securities on a when-issued basis. When-issued transactions arise when securities are purchased or sold by the Fund with payment and delivery taking place in the future in order to secure what is considered to be an advantageous price and yield to the Fund at the time of entering into the transaction. Beginning on the date the Fund enters into a when-issued transaction, cash or other liquid securities are segregated in an amount equal to or greater than the value of the when-issued transaction. These transactions are subject to market fluctuations and their current value is determined in the same manner as for other securities.
10. Income Tax Information and Distributions
The Fund declares dividends daily from net investment income and makes payments monthly. Net realized capital gains, if any, are distributed annually and are taxable. These distributions are paid in additional shares at the net asset value per share, in cash, or in a combination of both, at the shareholder’s option.
The Fund intends to maintain, to the maximum extent possible, the tax-exempt status of interest payments received from portfolio municipal securities in order to allow dividends paid to shareholders from net investment income to be exempt from regular Federal and State of Rhode Island income taxes. Due to differences between financial statement reporting and Federal income tax reporting requirements, distributions made by the Fund may not be the same as the Fund’s net investment income, and/or net realized securities gains. Further, a small portion of the dividends may, under some circumstances, be subject to taxes at ordinary income rates. As a result of the passage of the Regulated Investment Company Act of 2010 (“the Act”), losses incurred in this fiscal year and beyond retain their character as short-term or long-term, have no expiration date and are utilized before capital losses incurred prior to the enactment of the Act.
At March 31, 2013, the Fund had a capital loss carryover of $73,498 acquired in the acquisition of Ocean State Tax-Exempt Fund, which expires on June 30, 2016. This carryover is available to offset future net realized gains on securities transactions to the extent provided for in the Internal Revenue Code. At March 31, 2013, the Fund had post October loss deferrals of $92,480 which will be recognized in the following year.
30 | Aquila Narragansett Tax-Free Income Fund
AQUILA NARRAGANSETT TAX-FREE INCOME FUND
NOTES TO FINANCIAL STATEMENTS (continued)
MARCH 31, 2013
The tax character of distributions:
| | | Nine Months Ended | | | Year Ended June 30, | |
| | | March 31, 2013 | | | 2012 | | | 2011 | |
| Net tax-exempt income | | $ | 6,090,039 | | | $ | 8,366,991 | | | $ | 8,945,624 | |
| Ordinary income | | | – | | | | 7,331 | | | | 2,081 | |
| | | $ | 6,090,039 | | | $ | 8,374,322 | | | $ | 8,947,705 | |
As of March 31, 2013, the components of distributable earnings on a tax basis were as follows:
| Undistributed tax-exempt income | | $ | 253,621 | |
| Accumulated net realized loss | | | (73,498 | ) |
| Unrealized appreciation | | | 9,413,157 | |
| Other temporary differences | | | (346,101 | ) |
| | | $ | 9,247,179 | |
The difference between book basis and tax basis unrealized appreciation and undistributed income is due to the timing difference in recognizing dividends paid and the amortization of discount securities.
11. Ongoing Development
Beginning in December 2007, the three major credit rating agencies (Standard & Poor’s, Moody’s and Fitch) downgraded or eliminated ratings of the municipal bond insurance companies due to loss of capital from investments in subprime mortgages. Only a few insurers are now deemed to be investment grade. Thus, while certain bonds have insurance, some are no longer rated based upon the ratings of their insurers. Furthermore, because the ability of many of the Fund’s insurers to pay claims has been downgraded, the protection of such insurance has been diminished, and there is no assurance that some of them may be relied upon for payment.
12. Recent Development
The city of Central Falls emerged from Chapter 9 bankruptcy in late October after just over two years in Receivership and Chapter 9 bankruptcy. Providence averted recent fiscal and budgetary concerns as a result of negotiations between the mayor and the city’s unions, retirees, and large not-for-profit institutions. And, other cities and towns throughout the state are also beginning to address pension and other post-employment benefit shortfall concerns as well.
31 | Aquila Narragansett Tax-Free Income Fund
AQUILA NARRAGANSETT TAX-FREE INCOME FUND
FINANCIAL HIGHLIGHTS
For a share outstanding throughout each period
| | | | | | Class A | |
| | | Nine Months | | | Year Ended June 30, | |
| | | 3/31/13 Ended† | | | 2012 | | | 2011 | | | 2010 | | | 2009 | | | 2008 | |
| Net asset value, beginning of period | | $ | 10.78 | | | $ | 10.51 | | | $ | 10.64 | | | $ | 10.44 | | | $ | 10.39 | | | $ | 10.37 | |
| Income (loss) from investment operations: | | | | | | | | | | | | | | | | | | | | | | | | |
Net investment income(1) | | | 0.26 | | | | 0.37 | | | | 0.39 | | | | 0.39 | | | | 0.38 | | | | 0.38 | |
| Net gain (loss) on securities (both | | | | | | | | | | | | | | | | | | | | | | | | |
| realized and unrealized) | | | 0.02 | | | | 0.27 | | | | (0.13 | ) | | | 0.20 | | | | 0.06 | | | | 0.03 | |
| Total from investment operations | | | 0.28 | | | | 0.64 | | | | 0.26 | | | | 0.59 | | | | 0.44 | | | | 0.41 | |
| Less distributions (note 9): | | | | | | | | | | | | | | | | | | | | | | | | |
| Dividends from net investment income | | | (0.27 | ) | | | (0.37 | ) | | | (0.39 | ) | | | (0.39 | ) | | | (0.39 | ) | | | (0.39 | ) |
| Distributions from capital gains | | | – | | | | – | | | | – | | | | – | | | | – | | | | – | |
| Total distributions | | | (0.27 | ) | | | (0.37 | ) | | | (0.39 | ) | | | (0.39 | ) | | | (0.39 | ) | | | (0.39 | ) |
| Net asset value, end of period | | $ | 10.79 | | | $ | 10.78 | | | $ | 10.51 | | | $ | 10.64 | | | $ | 10.44 | | | $ | 10.39 | |
| Total return (not reflecting sales charge) | | | 2.53 | %(2) | | | 6.15 | % | | | 2.48 | % | | | 5.71 | % | | | 4.30 | % | | | 4.00 | % |
| Ratios/supplemental data | | | | | | | | | | | | | | | | | | | | | | | | |
| Net assets, end of period (in millions) | | $ | 143 | | | $ | 146 | | | $ | 150 | | | $ | 151 | | | $ | 134 | | | $ | 105 | |
| Ratio of expenses to average net assets | | | 0.77 | %(3) | | | 0.71 | % | | | 0.62 | % | | | 0.59 | % | | | 0.60 | % | | | 0.64 | % |
| Ratio of net investment income to | | | | | | | | | | | | | | | | | | | | | | | | |
| average net assets | | | 3.22 | %(3) | | | 3.45 | % | | | 3.68 | % | | | 3.63 | % | | | 3.68 | % | | | 3.63 | % |
| Portfolio turnover rate | | | 8 | %(2) | | | 11 | % | | | 9 | % | | | 3 | % | | | 6 | % | | | 3 | % |
| | |
| The expense and net investment income ratios without the effect of the contractual expense cap were (note 3): | |
| | |
| Ratio of expenses to average net assets | | | 0.90 | %(3) | | | 0.87 | % | | | 0.84 | % | | | 0.87 | % | | | 0.90 | % | | | 0.97 | % |
| Ratio of net investment income to | | | | | | | | | | | | | | | | | | | | | | | | |
| average net assets | | | 3.09 | %(3) | | | 3.29 | % | | | 3.46 | % | | | 3.35 | % | | | 3.38 | % | | | 3.29 | % |
| | |
The expense ratios after giving effect to the contractual expense cap and expense offset for uninvested cash balances were (note 3): | |
| | | | | | | | | | | | | | | | | | | | | | | | | |
| Ratio of expenses to average net assets | | | 0.77 | %(3) | | | 0.71 | % | | | 0.62 | % | | | 0.59 | % | | | 0.59 | % | | | 0.63 | % |
___________________
| (1) | Per share amounts have been calculated using the daily average shares method. |
| † | Effective December 1, 2012, the Fund changed its fiscal year end from June 30 to March 31.The information presented is for the period July 1, 2012 to March 31, 2013. |
See accompanying notes to financial statements.
32 | Aquila Narragansett Tax-Free Income Fund
AQUILA NARRAGANSETT TAX-FREE INCOME FUND
FINANCIAL HIGHLIGHTS (continued)
For a share outstanding throughout each period
| | | | | | Class C | |
| | | Nine Months | | | Year Ended June 30, | |
| | | 3/31/13 Ended† | | | 2012 | | | 2011 | | | 2010 | | | 2009 | | | 2008 | |
| Net asset value, beginning of period | | $ | 10.78 | | | $ | 10.51 | | | $ | 10.64 | | | $ | 10.44 | | | $ | 10.39 | | | $ | 10.37 | |
| Income (loss) from investment operations: | | | | | | | | | | | | | | | | | | | | | | | | |
Net investment income(1) | | | 0.19 | | | | 0.28 | | | | 0.30 | | | | 0.29 | | | | 0.29 | | | | 0.29 | |
| Net gain (loss) on securities (both | | | | | | | | | | | | | | | | | | | | | | | | |
| realized and unrealized) | | | 0.02 | | | | 0.27 | | | | (0.13 | ) | | | 0.21 | | | | 0.06 | | | | 0.03 | |
| Total from investment operations | | | 0.21 | | | | 0.55 | | | | 0.17 | | | | 0.50 | | | | 0.35 | | | | 0.32 | |
| Less distributions (note 9): | | | | | | | | | | | | | | | | | | | | | | | | |
| Dividends from net investment income | | | (0.20 | ) | | | (0.28 | ) | | | (0.30 | ) | | | (0.30 | ) | | | (0.30 | ) | | | (0.30 | ) |
| Distributions from capital gains | | | – | | | | – | | | | – | | | | – | | | | – | | | | – | |
| Total distributions | | | (0.20 | ) | | | (0.28 | ) | | | (0.30 | ) | | | (0.30 | ) | | | (0.30 | ) | | | (0.30 | ) |
| Net asset value, end of period | | $ | 10.79 | | | $ | 10.78 | | | $ | 10.51 | | | $ | 10.64 | | | $ | 10.44 | | | $ | 10.39 | |
| Total return (not reflecting sales charge) | | | 1.88 | %(2) | | | 5.25 | % | | | 1.62 | % | | | 4.81 | % | | | 3.42 | % | | | 3.12 | % |
| Ratios/supplemental data | | | | | | | | | | | | | | | | | | | | | | | | |
| Net assets, end of period (in millions) | | $ | 22 | | | $ | 21 | | | $ | 24 | | | $ | 22 | | | $ | 12 | | | $ | 11 | |
| Ratio of expenses to average net assets | | | 1.62 | %(3) | | | 1.57 | % | | | 1.47 | % | | | 1.44 | % | | | 1.45 | % | | | 1.51 | % |
| Ratio of net investment income to | | | | | | | | | | | | | | | | | | | | | | | | |
| average net assets | | | 2.37 | %(3) | | | 2.60 | % | | | 2.83 | % | | | 2.75 | % | | | 2.82 | % | | | 2.76 | % |
| Portfolio turnover rate | | | 8 | %(2) | | | 11 | % | | | 9 | % | | | 3 | % | | | 6 | % | | | 3 | % |
| | |
| The expense and net investment income ratios without the effect of the contractual expense cap were (note 3): | |
| | |
| Ratio of expenses to average net assets | | | 1.75 | %(3) | | | 1.72 | % | | | 1.69 | % | | | 1.72 | % | | | 1.75 | % | | | 1.82 | % |
| Ratio of net investment income to | | | | | | | | | | | | | | | | | | | | | | | | |
| average net assets | | | 2.24 | %(3) | | | 2.45 | % | | | 2.61 | % | | | 2.47 | % | | | 2.52 | % | | | 2.45 | % |
| | |
The expense ratios after giving effect to the contractual expense cap and expense offset for uninvested cash balances were (note 3): | |
| | | | | | | | | | | | | | | | | | | | | | | | | |
| Ratio of expenses to average net assets | | | 1.62 | %(3) | | | 1.57 | % | | | 1.47 | % | | | 1.44 | % | | | 1.44 | % | | | 1.48 | % |
___________________
| (1) | Per share amounts have been calculated using the daily average shares method. |
| † | Effective December 1, 2012, the Fund changed its fiscal year end from June 30 to March 31.The information presented is for the period July 1, 2012 to March 31, 2013. |
See accompanying notes to financial statements.
33 | Aquila Narragansett Tax-Free Income Fund
AQUILA NARRAGANSETT TAX-FREE INCOME FUND
FINANCIAL HIGHLIGHTS (continued)
For a share outstanding throughout each period
| | | | | | Class I | |
| | | Nine Months | | | Year Ended June 30, | |
| | | 3/31/13 Ended† | | | 2012 | | | 2011 | | | 2010 | | | 2009 | | | 2008 | |
| Net asset value, beginning of period | | $ | 10.78 | | | $ | 10.51 | | | $ | 10.63 | | | $ | 10.44 | | | $ | 10.39 | | | $ | 10.37 | |
| Income (loss) from investment operations: | | | | | | | | | | | | | | | | | | | | | | | | |
Net investment income(1) | | | 0.25 | | | | 0.35 | | | | 0.37 | | | | 0.37 | | | | 0.37 | | | | 0.37 | |
| Net gain (loss) on securities (both | | | | | | | | | | | | | | | | | | | | | | | | |
| realized and unrealized) | | | 0.01 | | | | 0.27 | | | | (0.12 | ) | | | 0.19 | | | | 0.06 | | | | 0.03 | |
| Total from investment operations | | | 0.26 | | | | 0.62 | | | | 0.25 | | | | 0.56 | | | | 0.43 | | | | 0.40 | |
| Less distributions (note 9): | | | | | | | | | | | | | | | | | | | | | | | | |
| Dividends from net investment income | | | (0.25 | ) | | | (0.35 | ) | | | (0.37 | ) | | | (0.37 | ) | | | (0.38 | ) | | | (0.38 | ) |
| Distributions from capital gains | | | – | | | | – | | | | – | | | | – | | | | – | | | | – | |
| Total distributions | | | (0.25 | ) | | | (0.35 | ) | | | (0.37 | ) | | | (0.37 | ) | | | (0.38 | ) | | | (0.38 | ) |
| Net asset value, end of period | | $ | 10.79 | | | $ | 10.78 | | | $ | 10.51 | | | $ | 10.63 | | | $ | 10.44 | | | $ | 10.39 | |
| Total return (not reflecting sales charge) | | | 2.41 | %(2) | | | 5.99 | % | | | 2.42 | % | | | 5.45 | % | | | 4.17 | % | | | 3.84 | % |
| Ratios/supplemental data | | | | | | | | | | | | | | | | | | | | | | | | |
| Net assets, end of period (in millions) | | $ | 0.3 | | | $ | 0.3 | | | $ | 0.3 | | | $ | 0.3 | | | $ | 0.3 | | | $ | 0.5 | |
| Ratio of expenses to average net assets | | | 0.93 | %(3) | | | 0.87 | % | | | 0.78 | % | | | 0.74 | % | | | 0.74 | % | | | 0.81 | % |
| Ratio of net investment income to | | | | | | | | | | | | | | | | | | | | | | | | |
| average net assets | | | 3.07 | %(3) | | | 3.29 | % | | | 3.25 | % | | | 3.49 | % | | | 3.54 | % | | | 3.47 | % |
| Portfolio turnover rate | | | 8 | %(2) | | | 11 | % | | | 9 | % | | | 3 | % | | | 6 | % | | | 3 | % |
| | |
| The expense and net investment income ratios without the effect of the contractual expense cap were (note 3): | |
| | |
| Ratio of expenses to average net assets | | | 1.06 | %(3) | | | 1.02 | % | | | 1.00 | % | | | 1.02 | % | | | 1.04 | % | | | 1.12 | % |
| Ratio of net investment income to | | | | | | | | | | | | | | | | | | | | | | | | |
| average net assets | | | 2.94 | %(3) | | | 3.14 | % | | | 3.30 | % | | | 3.20 | % | | | 3.24 | % | | | 3.16 | % |
| | |
The expense ratios after giving effect to the contractual expense cap and expense offset for uninvested cash balances were (note 3): | |
| | |
| Ratio of expenses to average net assets | | | 0.93 | %(3) | | | 0.87 | % | | | 0.78 | % | | | 0.74 | % | | | 0.73 | % | | | 0.77 | % |
___________________
| (1) | Per share amounts have been calculated using the daily average shares method. |
| † | Effective December 1, 2012, the Fund changed its fiscal year end from June 30 to March 31.The information presented is for the period July 1, 2012 to March 31, 2013. |
See accompanying notes to financial statements.
34 | Aquila Narragansett Tax-Free Income Fund
AQUILA NARRAGANSETT TAX-FREE INCOME FUND
FINANCIAL HIGHLIGHTS (continued)
For a share outstanding throughout each period
| | | | | | Class Y | |
| | | Nine Months | | | Year Ended June 30, | |
| | | 3/31/13 Ended† | | | 2012 | | | 2011 | | | 2010 | | | 2009 | | | 2008 | |
| Net asset value, beginning of period | | $ | 10.78 | | | $ | 10.51 | | | $ | 10.64 | | | $ | 10.44 | | | $ | 10.39 | | | $ | 10.37 | |
| Income (loss) from investment operations: | | | | | | | | | | | | | | | | | | | | | | | | |
Net investment income(1) | | | 0.28 | | | | 0.38 | | | | 0.40 | | | | 0.40 | | | | 0.40 | | | | 0.40 | |
| Net gain (loss) on securities (both | | | | | | | | | | | | | | | | | | | | | | | | |
| realized and unrealized) | | | – | | | | 0.27 | | | | (0.13 | ) | | | 0.20 | | | | 0.05 | | | | 0.03 | |
| Total from investment operations | | | 0.28 | | | | 0.65 | | | | 0.27 | | | | 0.60 | | | | 0.45 | | | | 0.43 | |
| Less distributions (note 9): | | | | | | | | | | | | | | | | | | | | | | | | |
| Dividends from net investment income | | | (0.27 | ) | | | (0.38 | ) | | | (0.40 | ) | | | (0.40 | ) | | | (0.40 | ) | | | (0.41 | ) |
| Distributions from capital gains | | | – | | | | – | | | | – | | | | – | | | | – | | | | – | |
| Total distributions | | | (0.27 | ) | | | (0.38 | ) | | | (0.40 | ) | | | (0.40 | ) | | | (0.40 | ) | | | (0.41 | ) |
| Net asset value, end of period | | $ | 10.79 | | | $ | 10.78 | | | $ | 10.51 | | | $ | 10.64 | | | $ | 10.44 | | | $ | 10.39 | |
| Total return (not reflecting sales charge) | | | 2.65 | %(2) | | | 6.31 | % | | | 2.64 | % | | | 5.86 | % | | | 4.46 | % | | | 4.16 | % |
| Ratios/supplemental data | | | | | | | | | | | | | | | | | | | | | | | | |
| Net assets, end of period (in millions) | | $ | 93 | | | $ | 82 | | | $ | 67 | | | $ | 52 | | | $ | 50 | | | $ | 45 | |
| Ratio of expenses to average net assets | | | 0.62 | %(3) | | | 0.57 | % | | | 0.47 | % | | | 0.44 | % | | | 0.45 | % | | | 0.51 | % |
| Ratio of net investment income to | | | | | | | | | | | | | | | | | | | | | | | | |
| average net assets | | | 3.37 | %(3) | | | 3.59 | % | | | 3.83 | % | | | 3.78 | % | | | 3.83 | % | | | 3.75 | % |
| Portfolio turnover rate | | | 8 | %(2) | | | 11 | % | | | 9 | % | | | 3 | % | | | 6 | % | | | 3 | % |
| | |
| The expense and net investment income ratios without the effect of the contractual expense cap were (note 3): | |
| | |
| Ratio of expenses to average net assets | | | 0.75 | %(3) | | | 0.72 | % | | | 0.69 | % | | | 0.72 | % | | | 0.75 | % | | | 0.82 | % |
| Ratio of net investment income to | | | | | | | | | | | | | | | | | | | | | | | | |
| average net assets | | | 3.24 | %(3) | | | 3.43 | % | | | 3.61 | % | | | 3.49 | % | | | 3.53 | % | | | 3.44 | % |
| | |
The expense ratios after giving effect to the contractual expense cap and expense offset for uninvested cash balances were (note 3): | |
| | | | | | | | | | | | | | | | | | | | | | | | | |
| Ratio of expenses to average net assets | | | 0.62 | %(3) | | | 0.57 | % | | | 0.47 | % | | | 0.44 | % | | | 0.44 | % | | | 0.47 | % |
___________________
| (1) | Per share amounts have been calculated using the daily average shares method. |
| † | Effective December 1, 2012, the Fund changed its fiscal year end from June 30 to March 31.The information presented is for the period July 1, 2012 to March 31, 2013. |
See accompanying notes to financial statements.
35 | Aquila Narragansett Tax-Free Income Fund
Additional Information (unaudited)
| | | | | | | Number of | | |
| | | Positions | | | | Portfolios | | |
| | | Held with | | | | in Fund | | |
| Name, | | Fund and | | Principal | | Complex(4) | | Other Directorships |
Address(2) | | Length of | | Occupation(s) | | Overseen | | Held by Trustee |
| and Year of Birth | | Service(3) | | During Past 5 Years | | by Trustee | | During Past 5 Years |
Interested Trustees(5) | | | | | | | | |
| | | | | | | | | |
Diana P. Herrmann New York, NY (1958) | | Trustee since 2005 and President since 1998 | | Vice Chair and Chief Executive Officer of Aquila Management Corporation, Founder and Sponsor of the Aquila Group of Funds(6) and parent of Aquila Investment Management LLC, Manager, since 2004, President since 1997, Chief Operating Officer, 1997-2008, a Director since 1984, Secretary since 1986 and previously its Executive Vice President, Senior Vice President or Vice President, 1986-1997; Chief Executive Officer and Vice Chair since 2004, President and Manager since 2003, and Chief Operating Officer (2003-2008), of the Manager; Chair, Vice Chair, President, Executive Vice President and/ or Senior Vice President of funds in the Aquila Group of Funds since 1986; Director of the Distributor since 1997; Governor, Investment Company Institute (the U.S. mutual fund industry trade organization dedicated to protecting shareholder interests and educating the public about investing) for various periods since 2004, and head of its Small Funds Committee, 2004-2009; active in charitable and volunteer organizations. | | 11 | | ICI Mutual Insurance Company, a Risk Retention Group (2006-2009 and since 2010); Vice Chair and Trustee of Pacific Capital Funds of Cash Assets Trust (three Aquila money-market funds) 2004-2012 |
| | | | | | | | | |
John J. Partridge Providence, RI (1940) | | Trustee since 2008 | | Founding Partner, Partridge Snow & Hahn LLP, a law firm, Providence, Rhode Island, since 1988, Senior Counsel, since January 1, 2007; Assistant Secretary –Advisor to the Board, Aquila Narragansett Tax-Free Income Fund, 2005-2008, Trustee 2002-2005; director or trustee of various educational, civic and charitable organizations, including Ocean State Charities Trust, Memorial Hospital of Rhode Island, and The Pawtucket Foundation. | | 5 | | None |
36 | Aquila Narragansett Tax-Free Income Fund
| | | | | | | Number of | | |
| | | Positions | | | | Portfolios | | |
| | | Held with | | | | in Fund | | |
| Name, | | Fund and | | Principal | | Complex(4) | | Other Directorships |
Address(2) | | Length of | | Occupation(s) | | Overseen | | Held by Trustee |
| and Year of Birth | | Service(3) | | During Past 5 Years | | by Trustee | | During Past 5 Years |
| | | | | | | | | |
| Non-interested Trustees | | | | | | | | |
| | | | | | | | | |
David A. Duffy North Kingstown, RI (1939) | | Chair of the Board since 2009 and Trustee since 1995 | | Retired Founder and Chairman of Duffy & Shanley, Inc., a marketing communications firm, 1973-2003; past Chairman of the Rhode Island Convention Center Authority, 2003-2011; past National Chairman, National Conference for Community & Justice (NCCJ); past Vice Chair, Providence College Board of Trustees; officer or director of numerous civic and non-profit organizations including Rhode Island Hospital. | | 2 | | Delta Dental of Rhode Island |
| | | | | | | | | |
Thomas A. Christopher Danville, KY (1947) | | Trustee since 2009 | | Senior partner of Robinson, Hughes & Christopher, C.P.A.s, P.S.C., since 1977; Chairman of the Board, A Good Place for Fun, Inc., a sports facility, since 1987 President, 1987-2012; Director, Sunrise Children’s Services Inc., since 2010; Director, Global Outreach International, since 2011; currently or formerly active with various professional and community organizations. | | 5 | | None |
| | | | | | | | | |
Anne J. Mills Scottsdale, AZ (1938) | | Trustee since 2009 | | President, Loring Consulting Company since 2001; Vice President for Business Management and CFO, Ottawa University, 1992-2001, 2006-2009; IBM Corporation, 1965-1991; currently active with various charitable, educational and religious organizations. | | 5 | | None |
37 | Aquila Narragansett Tax-Free Income Fund
| | | | | | | Number of | | |
| | | Positions | | | | Portfolios | | |
| | | Held with | | | | in Fund | | |
| Name, | | Fund and | | Principal | | Complex(4) | | Other Directorships |
Address(2) | | Length of | | Occupation(s) | | Overseen | | Held by Trustee |
| and Year of Birth | | Service(3) | | During Past 5 Years | | by Trustee | | During Past 5 Years |
| | | | | | | | | |
James R. Ramsey Louisville, KY (1948) | | Trustee since 2004 | | President, University of Louisville since November 2002; Professor of Economics, University of Louisville, 1999-present; Kentucky Governor’s Senior Policy Advisor and State Budget Director, 1999-2002; Vice Chancellor for Finance and Administration, the University of North Carolina at Chapel Hill, 1998 to 1999; previously Vice President for Finance and Administration at Western Kentucky University, State Budget Director for the Commonwealth of Kentucky, Chief State Economist and Executive Director for the Office of Financial Management and Economic Analysis for the Commonwealth of Kentucky, Adjunct Professor at the University of Kentucky, Associate Professor at Loyola University-New Orleans and Assistant Professor at Middle Tennessee State University. | | 2 | | Community Bank and Trust, Pikeville, KY and Texas Roadhouse Inc. |
| | | | | | | | | |
Laureen L. White North Kingstown, RI (1959) | | Trustee since 2005 | | President, Greater Providence Chamber of Commerce, since 2005, Executive Vice President 2004-2005 and Senior Vice President, 1989-2002; Executive Counselor to the Governor of Rhode Island for Policy and Communications, 2003-2004. | | 2 | | None |
38 | Aquila Narragansett Tax-Free Income Fund
| | | Positions | | |
| | | Held with | | |
| Name, | | Fund and | | |
Address(2) | | Length of | | |
| and Year of Birth | | Service(3) | | Principal Occupation(s) During Past 5 Years |
| |
Trustees Emeritus(7) | | | | |
| | | | | |
Vernon R. Alden Boston, MA (1923) | | Trustee Emeritus since 2006 | | Retired; former director or trustee of various Fortune 500 companies, including Colgate-Palmolive and McGraw Hill; formerly President of Ohio University and Associate Dean of the Harvard University Graduate School of Business Administration; Trustee, Aquila Narragansett Tax-Free Income Fund, 1992-2006, Tax-Free Trust of Oregon, 1988-2001, Hawaiian Tax-Free Trust, 1989-2001, and Pacific Capital Funds of Cash Assets Trust (three Aquila money-market funds, consisting of Pacific Capital Cash Assets Trust, Pacific Capital Tax-Free Cash Assets Trust and Pacific Capital U.S. Government Securities Cash Assets Trust), 1989-2001; Trustee Emeritus, Aquila Narragansett Tax-Free Income Fund and Tax-Free Trust of Oregon since 2006; member of several Japan-related advisory councils, including Chairman of the Japan Society of Boston; trustee of various cultural, educational and civic organizations. |
| | | | | |
Theodore T. Mason Hastings-on-Hudson, NY (1935) | | Trustee Emeritus since 2011; Trustee 2009-2011 | | Executive Director, East Wind Power Partners LTD since 1994 and Louisiana Power Partners, 1999-2003; Assistant Treasurer, Fort Schuyler Maritime Alumni Association, Inc., successor to Alumni Association of SUNY Maritime College, since 2010 (Treasurer, 2004-2009, President, 2002-2003, First Vice President, 2000-2001, Second Vice President, 1998-2000) and director of the same organization since 1997; Director, STCM Management Company, Inc., 1973-2004; twice national officer of Association of the United States Navy (formerly Naval Reserve Association), Commanding Officer of four naval reserve units and Captain, USNR (Ret); Vice President and director, The Navy League of the United States New York Council since 2012 and director since 2002; trustee, The Maritime Industry Museum at Fort Schuyler, 2000-2004; and Fort Schuyler Maritime Foundation, Inc., successor to the Maritime College at Fort Schuyler Foundation, Inc., since 2000; Trustee, Hawaiian Tax-Free Trust since 1984 and Chair since 2004; Trustee Aquila Three Peaks High Income Fund since 2006; Trustee Emeritus, Churchill Tax-Free Fund of Kentucky and Narragansett Insured Tax-Free Income Fund since 2011; Trustee, 1987-2011 and 2009-2011, respectively; Trustee of Pacific Capital Funds of Cash Assets Trust (three Aquila money-market funds, consisting of Pacific Capital Cash Assets Trust (1984-2012), Pacific Capital Tax-Free Cash Assets Trust (1988-2012), and Pacific Capital U.S. Government Securities Cash Assets Trust (1988-2012)) and Chair of the Board of each, 2004-2012. |
| | | | | |
William J. Nightingale Rowayton, CT (1929) | | Trustee Emeritus since 2009 | | Retired; formerly Chairman, founder (1975) and Senior Advisor until 2000 of Nightingale & Associates, L.L.C., a general management consulting firm focusing on interim management, divestitures, turnaround of troubled companies, corporate restructuring and financial advisory services; Trustee of Churchill Tax-Free Fund of Kentucky,1993-2007; Trustee of Aquila Narragansett Tax-Free Income Fund, 1992-2009, and Chair of the Board, 2005-2009. |
39 | Aquila Narragansett Tax-Free Income Fund
| | | Positions | | |
| | | Held with | | |
| Name, | | Fund and | | |
Address(2) | | Length of | | |
| and Year of Birth | | Service(3) | | Principal Occupation(s) During Past 5 Years |
| |
| Officers | | | | |
| | | | | |
Charles E.Childs, III New York, NY (1957) | | Executive Vice President since 2003 and Secretary since 2011 | | Executive Vice President of all funds in the Aquila Group of Funds and the Manager and the Manager’s parent since 2003; Chief Operating Officer of the Manager and the Manager’s parent since 2008; Secretary of all funds in the Aquila Group of Funds since 2011; formerly Senior Vice President, corporate development, Vice President, Assistant Vice President and Associate of the Manager’s parent since 1987; Executive Vice President, Senior Vice President, Vice President or Assistant Vice President of the Aquila money-market funds, 1988-2012; Director of the Distributor since 2012. |
| | | | | |
Marie E. Aro Denver, CO (1955) | | Senior Vice President since 2010 | | Co-President of the Distributor since 2010, Vice President, 1993-1997; Senior Vice President, Aquila Three Peaks Opportunity Growth Fund since 2004; Senior Vice President, Tax-Free Trust of Arizona since 2010 and Vice President, 2004-2010; Senior Vice President, Aquila Three Peaks High Income Fund since 2006; Senior Vice President, Churchill Tax-Free Fund of Kentucky, Hawaiian Tax-Free Trust, Aquila Narragansett Tax-Free Income Fund, Tax-Free Fund For Utah, Tax-Free Fund of Colorado and Tax-Free Trust of Oregon since 2010; Vice President, INVESCO Funds Group, 1998-2003. |
| | | | | |
Stephen J. Caridi New York, NY (1961) | | Senior Vice President since 1998 | | Vice President of the Distributor since 1995; Vice President, Hawaiian Tax-Free Trust since 1998; Senior Vice President, Narragansett Insured Tax-Free Income Fund since 1998, Vice President 1996-1997; Senior Vice President, Tax-Free Fund of Colorado 2004-2009; Vice President, Aquila Three Peaks Opportunity Growth Fund since 2006. |
| | | | | |
Paul G. O’Brien Charlotte, NC (1959) | | Senior Vice President since 2010 | | Co-President, Aquila Distributors, Inc. since 2010, Managing Director, 2009-2010; Senior Vice President of Aquila Three Peaks High Income Fund, Aquila Three Peaks Opportunity Growth Fund, and each of the Aquila Municipal Bond Funds since 2010; held various positions to Senior Vice President and Chief Administrative Officer of Evergreen Investments Services, Inc., 1997-2008; Mergers and Acquisitions Coordinator for Wachovia Corporation, 1994-1997. |
| | | | | |
Randall S. Fillmore New York, NY (1960) | | Chief Compliance Officer since 2012 | | Chief Compliance Officer of each fund in the Aquila Group of Funds, the Manager and the Distributor since 2012; Managing Director, Fillmore & Associates, 2009-2012; Fund and Adviser Chief Compliance Officer (2002-2009), Senior Vice President - Broker Dealer Compliance (2004-2009), Schwab Funds Anti Money Laundering Officer and Identity Theft Prevention Officer (2004-2009), Vice President - Internal Audit (2000-2002), Charles Schwab Corporation; National Director, Information Systems Risk Management - Consulting Services (1999-2000), National Director, Investment Management Audit and Business Advisory Services (1992-1999), Senior Manager, Manager, Senior and Staff Roles (1983-1992), PricewaterhouseCoopers LLP. |
40 | Aquila Narragansett Tax-Free Income Fund
| | | Positions | | |
| | | Held with | | |
| Name, | | Fund and | | |
Address(2) | | Length of | | |
| and Year of Birth | | Service(3) | | Principal Occupation(s) During Past 5 Years |
| |
Joseph P. DiMaggio New York, NY (1956) | | Chief Financial Officer since 2003 and Treasurer since 2000 | | Chief Financial Officer of each fund in the Aquila Group of Funds since 2003 and Treasurer since 2000. |
| | | | | |
Yolonda S. Reynolds New York, NY (1960) | | Assistant Treasurer since 2010 | | Assistant Treasurer of each fund in the Aquila Group of Funds since 2010; Director of Fund Accounting for the Aquila Group of Funds since 2007; Investment Accountant, TIAA-CREF, 2007; Senior Fund Accountant, JP Morgan Chase, 2003-2006. |
| | | | | |
Lori A. Vindigni New York, NY (1966) | | Assistant Treasurer since 2000 | | Assistant Treasurer of each fund in the Aquila Group of Funds since 2000; Assistant Vice President of the Manager or its predecessor and current parent since 1998; Fund Accountant for the Aquila Group of Funds, 1995-1998. |
___________________
(1) The Fund’s Statement of Additional Information includes additional information about the Trustees and officers and is available, without charge, upon request by calling 800-437-1020 (toll-free) or by visiting www.aquilafunds.com or the EDGAR Database at the SEC’s internet site at www.sec.gov.
(2) The mailing address of each Trustee and officer is c/o Aquila Narragansett Tax-Free Income Fund, 380 Madison Avenue, Suite 2300, New York, NY 10017.
(3) Each Trustee holds office until the next annual meeting of shareholders or until his or her successor is elected and qualifies. The term of office of each officer is one year.
(4) Includes certain Aquila-sponsored funds that are dormant and have no public shareholders.
(5) Ms. Herrmann is an interested person of the Fund as an officer of the Fund, as a director, officer and shareholder of the Manager’s corporate parent, as an officer and Manager of the Manager, and as a shareholder and director of the Distributor. Ms. Herrmann is the daughter of Lacy B. Herrmann, the Founder and former Trustee, Chairman and Chairman Emeritus of the Fund. Mr. Partridge is deemed an interested person of the Fund as a senior counsel of a law firm that performs legal services for RBS Citizens, N.A., of which the Sub-Adviser is a department.
(6) The “Aquila Group of Funds” includes: Tax-Free Trust of Arizona, Tax-Free Fund of Colorado, Hawaiian Tax-Free Trust, Churchill Tax-Free Fund of Kentucky, Tax-Free Trust of Oregon, Aquila Narragansett Tax-Free Income Fund (Rhode Island) and Tax-Free Fund For Utah, each of which is a tax-free municipal bond fund and are called the “Aquila Municipal Bond Funds”; Aquila Three Peaks Opportunity Growth Fund, which is an equity fund; and Aquila Three Peaks High Income Fund, which is a high-income corporate bond fund.
(7) A Trustee Emeritus may attend Board meetings but has no voting power.
41 | Aquila Narragansett Tax-Free Income Fund
Analysis of Expenses (unaudited)
As a shareholder of the Fund, you may incur two types of costs: (1) transaction costs, including front-end sales charges with respect to Class A shares or contingent deferred sales charges (“CDSC”) with respect to Class C shares; and (2) ongoing costs, including management fees; distribution and/or service (12b-1) fees; and other Fund expenses. The table below is intended to help you understand your ongoing costs (in dollars) of investing in the Fund and to compare these costs with the ongoing costs of investing in other mutual funds.
The table below is based on an investment of $1,000 invested on October 1, 2012 and held for the six months ended March 31, 2013.
Actual Expenses
This table provides information about actual account values and actual expenses. You may use the information provided in this table, together with the amount you invested, to estimate the expenses that you paid over the period. To estimate the expenses you paid on your account, divide your ending account value by $1,000 (for example, an $8,600 ending account value divided by $1,000 = 8.6), then multiply the result by the number under the heading “Expenses Paid During the Period”.
Six months ended March 31, 2013
| | Actual | | | |
| | Total Return | Beginning | Ending | Expenses |
| | Without | Account | Account | Paid During |
| | Sales Charges(1) | Value | Value | the Period(2) |
| Class A | 0.68% | $1,000.00 | $1,006.80 | $3.95 |
| Class C | 0.25% | $1,000.00 | $1,002.50 | $8.19 |
| Class I | 0.60% | $1,000.00 | $1,006.00 | $4.75 |
| Class Y | 0.75% | $1,000.00 | $1,007.50 | $3.20 |
| (1) | Assumes reinvestment of all dividends and capital gain distributions, if any, at net asset value and does not reflect the deduction of the applicable sales charges with respect to Class A shares or the applicable CDSC with respect to Class C shares. Total return is not annualized, as it may not be representative of the total return for the year. |
| (2) | Expenses are equal to the annualized expense ratio of 0.79%, 1.64%, 0.95% and 0.64% for the Fund’s Class A, C, I and Y shares, respectively, multiplied by the average account value over the period, multiplied by 182/365 (to reflect the one-half year period). |
42 | Aquila Narragansett Tax-Free Income Fund
Analysis of Expenses (unaudited) (continued)
Hypothetical Example for Comparison Purposes
The table below provides information about hypothetical account values and hypothetical expenses based on the actual expense ratio and an assumed rate of return of 5.00% per year before expenses, which is not the Fund’s actual return. The hypothetical account values and expenses may not be used to estimate the actual ending account balance or expenses you paid for the period. You may use the information provided in this table to compare the ongoing costs of investing in the Fund and other mutual funds. To do so, compare this 5.00% hypothetical example relating to the Fund with the 5.00% hypothetical examples that appear in the shareholder reports of other mutual funds.
Please note that the expenses shown in the table below are meant to highlight your ongoing costs only and do not reflect any transactional costs with respect to Class A shares. The example does not reflect the deduction of CDSC with respect to Class C shares. Therefore, the table is useful in comparing ongoing costs only, and will not help you determine the relative total costs of owning different mutual funds. In addition, if these transaction costs were included, your costs would have been higher.
Six months ended March 31, 2013
| | Hypothetical | | | |
| | Annualized | Beginning | Ending | Expenses |
| | Total | Account | Account | Paid During |
| | Return | Value | Value | the Period(1) |
| Class A | 5.00% | $1,000.00 | $1,020.99 | $3.97 |
| Class C | 5.00% | $1,000.00 | $1,016.75 | $8.25 |
| Class I | 5.00% | $1,000.00 | $1,020.19 | $4.77 |
| Class Y | 5.00% | $1,000.00 | $1,021.74 | $3.22 |
| (1) | Expenses are equal to the annualized expense ratio of 0.79%, 1.64%, 0.95% and 0.64% for the Trust’s Class A, C, I and Y shares, respectively, multiplied by the average account value over the period, multiplied by 182/365 (to reflect the one-half year period). |
43 | Aquila Narragansett Tax-Free Income Fund
Information Available (unaudited)
Much of the information that the funds in the Aquila Group of Funds produce is automatically sent to you and all other shareholders. Specifically, you are routinely sent your Fund’s entire list of portfolio securities twice a year in the semi-annual and annual reports you receive. Additionally, under Fund policies, the Manager publicly discloses the complete schedule of the Fund’s portfolio holdings, as of each calendar quarter, generally by the 15th day after the end of each calendar quarter. Such information remains accessible until the next schedule is made publicly available. You may obtain a copy of the Fund’s portfolio holdings schedule for the most recently completed period by visiting the Fund’s website at www.aquilafunds.com. The Fund may also disclose other portfolio holdings as of a specified date (currently the Fund discloses its five largest holdings and/or sector holdings by value as of the close of the last business day of each calendar month in a posting to its website on approximately the 5th business day following the month end). This information remains on the website until the next such posting. Whenever you wish to see a listing of your Fund’s portfolio other than in your shareholder reports, please check our website at www. aquilafunds.com or call us at 1-800-437-1020.
The Fund additionally files a complete list of its portfolio holdings with the SEC for the first and third quarters of each fiscal year on Form N-Q. Forms N-Q are available free of charge on the SEC website at www.sec.gov. You may also review or, for a fee, copy the forms at the SEC’s Public Reference Room in Washington, D.C. or by calling 1-800-SEC-0330.
Proxy Voting Record (unaudited)
During the 12 month period ended June 30, 2012, the Fund did not hold any portfolio securities for which the Fund was entitled to participate in proxy voting. Applicable regulations require us to inform you that the Fund’s proxy voting information is available on the SEC website at www.sec.gov.
Federal Tax Status of Distributions (unaudited)
This information is presented in order to comply with a requirement of the Internal Revenue Code. No action on the part of shareholders is required.
For the fiscal year ended March 31, 2013, $6,090,039 of dividends paid by Aquila Narragansett Tax-Free Income Fund, constituting 100% of total dividends paid during fiscal 2013, were exempt-interest dividends.
Prior to February 15, 2013, shareholders were mailed the appropriate tax form(s) which contained information on the status of distributions paid for the 2012 calendar year.
44 | Aquila Narragansett Tax-Free Income Fund
PRIVACY NOTICE (unaudited)
Aquila Narragansett Tax-Free Income Fund
Our Privacy Policy. In providing services to you as an individual who owns or is considering investing in shares of the Fund, we collect certain non-public personal information about you. Our policy is to keep this information strictly safeguarded and confidential, and to use or disclose it only as necessary to provide services to you or as otherwise permitted by law. Our privacy policy applies equally to former shareholders and persons who inquire about the Fund.
Information We Collect. ”Non-public personal information” is personally identifiable financial information about you as an individual or your family. The kinds of non-public personal information we have about you may include the information you provide us on your share purchase application or in telephone calls or correspondence with us, and information about your fund transactions and holdings, how you voted your shares and the account where your shares are held.
Information We Disclose. We disclose non-public personal information about you to companies that provide necessary services to us, such as the Fund’s transfer agent, distributor, investment adviser or sub-adviser, if any, as permitted or required by law, or as authorized by you. Any other use is strictly prohibited. We do not sell information about you or any of our fund shareholders to anyone.
Non-California Residents: We also may disclose some of this information to another fund in the Aquila Group of Funds (or its service providers) under joint marketing agreements that permit the funds to use the information only to provide you with information about other funds in the Aquila Group of Funds or new services we are offering that may be of interest to you.
California Residents Only: In addition, unless you “opt-out” of the following disclosures using the form that was mailed to you under separate cover, we may disclose some of this information to another fund in the Aquila Group of Funds (or its service providers) under joint marketing agreements that permit the funds to use the information only to provide you with information about other funds in the Aquila Group of Funds or new services we are offering that may be of interest to you.
How We Safeguard Your Information. We restrict access to non-public personal information about you to only those persons who need it to provide services to you or who are permitted by law to receive it. We maintain physical, electronic and procedural safeguards to protect the confidentiality of all non-public personal information we have about you.
If you have any questions regarding our Privacy Policy, please contact us at 1-800-437-1020.
Aquila Investment Management LLC
Aquila Distributors, Inc.
This Privacy Policy also has been adopted by Aquila Investment Management LLC and Aquila Distributors, Inc. and applies to all non-public information about you that each of these companies may obtain in connection with services provided to the Fund or to you as a shareholder of the Fund.
45 | Aquila Narragansett Tax-Free Income Fund
Founders
Lacy B. Herrmann (1929-2012)
Aquila Management Corporation, Sponsor
Manager
AQUILA INVESTMENT MANAGEMENT LLC
380 Madison Avenue, Suite 2300
New York, New York 10017
Investment Sub-Adviser
CITIZENS INVESTMENT ADVISORS,
A DEPARTMENT OF RBS CITIZENS, N. A.
One Citizens Plaza
Providence, Rhode Island 02903
Board of Trustees
David A. Duffy, Chair
Thomas A. Christopher
Diana P. Herrmann
Anne J. Mills
John J. Partridge
James R. Ramsey
Laureen L. White
Officers
Diana P. Herrmann, President
Charles E. Childs, III, Executive Vice President and Secretary
Marie E. Aro, Senior Vice President
Stephen J. Caridi, Senior Vice President
Paul G. O’Brien, Senior Vice President
Randall S. Fillmore, Chief Compliance Officer
Joseph P. DiMaggio, Chief Financial Officer and Treasurer
Distributor
AQUILA DISTRIBUTORS, INC.
380 Madison Avenue, Suite 2300
New York, New York 10017
Transfer and Shareholder Servicing Agent
BNY MELLON
4400 Computer Drive
Westborough, Massachusetts 01581
Custodian
JPMORGAN CHASE BANK, N.A.
1111 Polaris Parkway
Columbus, Ohio 43240
Independent Registered Public Accounting Firm
TAIT, WELLER & BAKER LLP
1818 Market Street, Suite 2400
Philadelphia, Pennsylvania 19103
Further information is contained in the Prospectus,
which must precede or accompany this report.
(a) As of March 31, 2013 (the end of the reporting period) the Trust has adopted a code of ethics that applies to the Trust's principal executive officer(s)and principal financial officer(s) and persons performing similar functions ("Covered Officers") as defined in the Aquila Group of Funds Code of Ethics for Principal Executive and Senior Financial Officers under Section 406 of the Sarbanes-Oxley Act of 2002, as amended;
(f)(1) Pursuant to Item 10(a)(1), a copy of the Trust's Code of Ethics that applies to the Trust's principal executive officer(s) and principal financial officer(s) and persons performing similar functions is included as an exhibit to its annual report on this Form N-CSR;
(f)(2) The text of the Trust's Code of Ethics that applies to the Trust's principal executive officer(s) and principal financial officer(s) and persons performing similar functions has been posted on its Internet website which can be found at the Trust's Internet address at aquilafunds.com.
| ITEM 3. | AUDIT COMMITTEE FINANCIAL EXPERT. |
a)(1)(i) The Registrant's board of trustees has determined that Ms. Anne J. Mills, a member of its audit committee, is an audit committee financial expert. Ms. Mills is 'independent' as such term is defined in Form N-CSR.
| ITEM 4. | PRINCIPAL ACCOUNTANT FEES AND SERVICES. |
a) Audit Fees - The aggregate fees billed for professional services rendered by the principal accountant for the audit of the Registrant's annual financial statements were $18,500 in 2012 and $15,700 in 2013.
b) Audit Related Fees - There were no amounts billed for audit-related fees over the past two years.
c) Tax Fees - The Registrant was billed by the principal accountant $3,400 and $3,400 in 2012 and 2013, respectively, for return preparation and tax compliance.
d) All Other Fees - There were no additional fees paid for audit and non-audit services other than those disclosed in a) thorough c) above.
e)(1) Currently, the audit committee of the Registrant pre-approves audit services and fees on an engagement-by-engagement basis
e)(2) None of the services described in b) through d) above were approved by the audit committee pursuant to paragraph (c)(7)(i)(C) of Rule 2-01 of Regulation S-X, all were pre-approved on an engagement-by-engagement basis.
f) No applicable.
g) There were no non-audit services fees billed by the Registrant's accountant to the Registrant's investment adviser or distributor over the past two years
h) Not applicable.
| ITEM 5. | AUDIT COMMITTEE OF LISTED REGISTRANTS. |
Not applicable.
| ITEM 6. | SCHEDULE OF INVESTMENTS. |
Included in Item 1 above
| ITEM 7. | DISCLOSURE OF PROXY VOTING POLICIES AND PROCEDURES FORCLOSED-END MANAGEMENT INVESTMENT COMPANIES. |
Not applicable.
| ITEM 8. | PORTFOLIO MANAGERS OF CLOSED-END MANAGEMENT INVESTMENT COMPANIES. |
Not applicable.
| ITEM 9. | PURCHASES OF EQUITY SECURITIES BY CLOSED-END MANAGEMENT INVESTMENTCOMPANY AND AFFILIATED PURCHASERS. |
Not applicable.
| ITEM 10. | SUBMISSION OF MATTERS TO A VOTE OF SECURITY HOLDERS. |
The Board of Directors of the Registrant has adopted a Nominating Committee Charter which provides that the Nominating Committee (the 'Committee') may consider and evaluate nominee candidates properly submitted by shareholders if a vacancy among the Independent Trustees of the Registrant occurs and if, based on the Board's then current size, composition and structure, the Committee determines that the vacancy should be filled. The Committee will consider candidates submitted by shareholders on the same basis as it considers and evaluates candidates recommended by other sources. A copy of the qualifications and procedures that must be met or followed by shareholders to properly submit a nominee candidate to the Committee may be obtained by submitting a request in writing to the Secretary of the Registrant.
ITEM 11. | CONTROLS AND PROCEDURES. |
(a) Based on their evaluation of the registrant's disclosure controls and procedures (as defined in Rule 30a-2(c) under the Investment Company Act of 1940) as of a date within 90 days of the filing of this report, the registrant's chief financial and executive officers have concluded that the disclosure controls and procedures of the registrant are appropriately designed to ensure that information required to be disclosed in the registrant's reports that are filed under the Securities Exchange Act of 1934 are accumulated and communicated to registrant's management, including its principal executive officer(s) and principal financial officer(s), to allow timely decisions regarding required disclosure and is recorded, processed, summarized and reported, within the time periods specified in the rules and forms adopted by the Securities and Exchange Commission.
(b) There have been no significant changes in registrant's internal controls or in other factors that could significantly affect registrant's internal controls subsequent to the date of the most recent evaluation, including no significant deficiencies or material weaknesses that required corrective action.
(a)(1) Aquila Group of Funds Code of Ethics for Principal Executive and Senior Financial Officers under Section 406 of the Sarbanes-Oxley Act of 2002, as amended.
(a)(2) Certifications of principal executive officer and principal financial officer as required by Rule 30a-2(a) under the Investment Company Act of 1940.
(b) Certifications of principal executive officer and principal financial officer as required by Rule 30a-2(b) under the Investment Company Act of 1940.
SIGNATURES
Pursuant to the requirements of the Securities Exchange Act of 1934 and the Investment Company Act of 1940, the registrant has duly caused this report to be signed on its behalf by the undersigned thereunto duly authorized.
AQUILA NARRAGANSETT TAX-FREE INCOME FUND
(formerly, NARRAGANSETT INSURED TAX-FREE INCOME FUND)
| By: | /s/ Diana P. Herrmann | |
| | President and Trustee June 3, 2013 | |
| | | |
| | | |
| By: | /s/ Joseph P. DiMaggio | |
| | Chief Financial Officer and Treasurer June 3, 2013 | |
Pursuant to the requirements of the Securities Exchange Act of 1934 and the Investment Company Act of 1940, this report has been signed below by the following persons on behalf of the registrant and in the capacities and on the dates indicated.
| By: | /s/ Diana P. Herrmann | |
| | Diana P. Herrmann President and Trustee June 3, 2013 | |
| | | |
| | | |
| By: | /s/ Joseph P. DiMaggio | |
| | Joseph P. DiMaggio Chief Financial Officer and Treasurer June 3, 2013 | |
AQUILA NARRAGANSETT TAX-FREE INCOME FUND
(formerly, NARRAGANSETT INSURED TAX-FREE INCOME FUND)
EXHIBIT INDEX
(a)(1) Aquila Group of Funds Code of Ethics for Principal Executive and Senior Financial Officers under Section 406 of the Sarbanes-Oxley Act of 2002, as amended.
(a) (2) Certifications of principal executive officer and principal financial officer as required by Rule 30a-2(a) under the Investment Company Act of 1940.
(b) Certification of chief executive officer and chief financial officer as required by Rule 30a-2(b) of the Investment Company Act of 1940.