Consideration should be given to the risks of investing, including: potential loss of value, market risk, interest rate risk, credit risk, and geographic concentration. Past performance does not guarantee future stability. Investment return and principal value will fluctuate so that an investor's shares, when redeemed, may be worth more or less than their original cost. For certain investors, some dividends may be subject to Federal and state taxes.
Narragansett Insured Tax-Free Income Fund (the “Fund”) seeks to provide the highest level of double tax-free income possible while staying within self-imposed quality restraints. The Fund strives to accomplish this by purchasing mostly municipal securities rated AAA by a nationally-renowned credit rating service. As an extra measure of credit protection to shareholders, most securities owned by the Fund are insured to provide for the timely payment of principal and interest when due. A maximum average maturity profile of less than 12 years has been maintained and will continue to be sought for the Fund’s portfolio in order to produce a reasonable level of income return with relatively high stability for the Fund’s share price. At the June 30, 2010 fiscal year end, the portfolio had an average maturity of 9.4 years.
Equity market performance has been choppy on a monthly basis for the first half of the year as the U.S. economy slowly pulls its way out of recession. Despite the modest recovery, major U.S. equity markets have not fared quite so well as concerns about a double-dip recession, the Gulf Oil Spill, and a faltering European Union have weighed heavily on all equity markets. As of June 30, 2010 the Dow Jones Industrials, S&P 500, and NASDAQ indices, after showing some positive gains during the first quarter, have given back more and have posted year-to-date returns of -5.00%, -6.65%, and -6.62%, respectively. International stock markets have fared worse as the Europe, Australasia, and Far East (EAFE) index fell by 12.84% year-to-date considerably lagging all major U.S. markets. The latest jobs data shows tha t job gains and related components have moderated while the unemployment rate nationally has trended downward to 9.5% for June. Should the additional hiring of workers continue to slow at this pace, Gross Domestic Product growth may continue to trend lower suggesting an even more moderate recovery which may continue to frustrate consumers, politicians, and Federal Reserve (Fed) policy makers.
Despite the amount of monetary and fiscal stimulus that has been introduced, inflation continues to decrease and concerns of deflation have entered economic discussions. Our main concern as a fixed income portfolio manager is despite the economic backdrop, where is the value? We have sought to continue to add value by moving out along the yield curve to take advantage of higher yields while striving to maintain the stability of the Net Asset Value should interest rates begin to move higher. We still believe that there is value in the municipal bond market as the anticipation of increasing Federal and state income taxes will keep a higher demand for municipal bonds despite the challenging economic and budgetary times for most U.S. states.
Rhode Island has not been without its challenges. During the second quarter of 2010, the City of Central Falls filed for Receivership in State Superior Court, an end-around to filing for Federal Chapter 9 Bankruptcy which was not allowed under Rhode Island law. As many municipalities throughout the country anticipated the outcome, the State was able to quietly resolve the issue. The state now has a more orderly and proactive process by which to handle the fiscal issues of cities and towns before they become crises. We believe that this process will reflect positively on the state and will help to create and maintain added measures of fiscal discipline particularly given the continued high unemployment rate in the state.
The Fed has maintained the Federal Funds target rate at 0.00% - 0.25% and expects this range to be supported for some time. The yield curve remains relatively steep; however, absolute rates are hitting new lows as the recent flight to quality driven by the Euro zone debacle and fears of deflation are driving demand. Recent consumer inflation and producer prices have dropped to where inflation has been negligible, and in some recent cases negative, causing policymakers concern with the prospects of deflation. At this point the monetary and fiscal stimulus has helped bring the economy out of recession and we can expect some fits and starts along the way. While we are not calling for a double-dip recession, we believe recent economic data suggest slowing growth for the remainder of the year. Should additional concerns of double-dip and/or deflation arise, we would expect the Fed to play an active role once again to ensure an economic recovery.
Performance for the Fund for the year ended June 30, 2010 was 5.71% (total return without sales charges) and below the 6.94% return of the Barclays Capital Quality Intermediate Municipal Bond Index. Returns during this period for the Dow, S&P 500, and NASDAQ were 18.14%, 13.92%, and 15.36%, respectively. Municipal yields have come down slowly in response to Treasuries and are currently above historical levels suggesting additional value may be had in the sector. Returns remained steadily positive for the year as investors took advantage of higher municipal yields relative to other fixed income instruments throughout the period.
As has always been the case, it is most important to look at the underlying rating(s) when buying bonds for your Fund’s portfolio. Insurance is a secondary factor that can provide additional liquidity and safety to ensure timely payment of interest and the ultimate payment of principal. As a single-state municipal bond fund it is also important to continue to diversify revenue sources from issuers, as opportunities exist. We continue to strive to expand our holdings to include quality names and revenue sources enhancing the value of your Fund.
As your locally-based portfolio managers we know the city, town, or project in which we are investing. This should be of additional comfort to you, our shareholders, particularly during these uncertain times. Management believes that having available to the Fund such a locally-based investment manager, with extensive knowledge and experience in the Rhode Island municipal market continues to add considerable value to your Fund’s portfolio and provides a distinct benefit to Fund shareholders.
Given the current Federal and Rhode Island income tax rates, we believe Narragansett Insured Tax-Free Income Fund presently produces an attractive yield for Rhode Island residents when compared to taxable fixed-income securities.
Citizens Investment Advisors, your Fund’s Investment Sub-Adviser, intends to continue to oversee the portfolio with a strong emphasis on achieving a balance between share price stability, acceptable double tax-free income return, and the highest standards of credit quality.
Performance data represents past performance, but does not guarantee future results. Investment return and principal value will fluctuate; shares, when redeemed, may be worth more or less than their original cost; current performance may be lower or higher than the data presented.
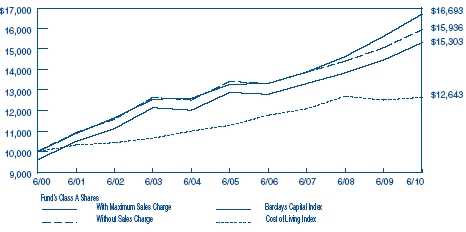
The following graph illustrates the value of $10,000 invested in the Class A shares of Narragansett Insured Tax-Free Income Fund for the 10-year period ended June 30, 2010 as compared with the Barclays Capital Quality Intermediate Municipal Bond Index (the “Barclays Capital Index”) (formerly known as the Lehman Brothers Quality Intermediate Municipal Bond Index) and the Consumer Price Index (a cost of living index). The performance of each of the other classes is not shown in the graph but is included in the table below. It should be noted that the Barclays Capital Index does not include any operating expenses nor sales charges, and being nationally oriented, does not reflect state specific bond market performance.
Total return figures shown for the Fund reflect any change in price and assume all distributions within the period were invested in additional shares. Returns for Class A shares are calculated with and without the effect of the initial 4% maximum sales charge. Returns for Class C shares are calculated with and without the effect of the 1% contingent deferred sales charge (CDSC), imposed on redemptions made within the first 12 months after purchase. Class Y and Class I shares are sold without any sales charge. The rates of return will vary and the principal value of an investment will fluctuate with market conditions. Shares, if redeemed, may be worth more or less than their original cost. A portion of each class’s income may be subject to Federal and state income taxes. Past performance is not predictive of future investment resu lts.
To the Board of Trustees and Shareholders of Narragansett Insured Tax-Free Income Fund:
We have audited the accompanying statement of assets and liabilities, including the schedule of investments, of Narragansett Insured Tax-Free Income Fund as of June 30, 2010 and the related statement of operations for the year then ended, the statements of changes in net assets for each of the two years in the period then ended, and the financial highlights for each of the five years in the period then ended. These financial statements and financial highlights are the responsibility of the Fund’s management. Our responsibility is to express an opinion on these financial statements and financial highlights based on our audits.
We conducted our audits in accordance with the standards of the Public Company Accounting Oversight Board (United States). Those standards require that we plan and perform the audit to obtain reasonable assurance about whether the financial statements and financial highlights are free of material misstatement. The Fund is not required to have, nor were we engaged to perform, an audit of the Fund’s internal control over financial reporting. Our audits included consideration of internal control over financial reporting as a basis for designing audit procedures that are appropriate in the circumstances, but not for the purpose of expressing an opinion on the effectiveness of the Fund’s internal control over financial reporting. Accordingly, we express no such opinion. An audit also includes examin ing, on a test basis, evidence supporting the amounts and disclosures in the financial statements. Our procedures included confirmation of securities owned as of June 30, 2010, by correspondence with the custodian. An audit also includes assessing the accounting principles used and significant estimates made by management, as well as evaluating the overall financial statement presentation. We believe that our audits provide a reasonable basis for our opinion.
In our opinion, the financial statements and financial highlights referred to above present fairly, in all material respects, the financial position of Narragansett Insured Tax-Free Income Fund as of June 30, 2010, the results of its operations for the year then ended, the changes in its net assets for each of the two years in the period then ended, and the financial highlights for each of the five years in the period then ended, in conformity with accounting principles generally accepted in the United States of America.
| NARRAGANSETT INSURED TAX-FREE INCOME FUND | |
| SCHEDULE OF INVESTMENTS | |
| JUNE 30, 2010 | |
| | |
| | | | | Rating | | | |
| | | | | Moody’s, S&P | | | |
| Principal | | | | and Fitch | | | |
| Amount | | General Obligation Bonds (38.7%) | | (unaudited) | | Value | |
| | | Bristol, Rhode Island | | | | | |
| $ | 2,200,000 | | 4.000%, 02/15/26 AGMC Insured | | Aa2/AAA/NR | | $ | 2,258,014 | |
| | 2,500,000 | | 4.375%, 02/15/29 AGMC Insured | | Aa2/AAA/NR | | | 2,593,450 | |
| | | | Coventry, Rhode Island | | | | | | |
| | 550,000 | | 5.000%, 11/01/16 AMBAC Insured | | Aa2/NR/NR | | | 574,216 | |
| | 550,000 | | 5.000%, 11/01/17 AMBAC Insured | | Aa2/NR/NR | | | 572,599 | |
| | | | Cranston, Rhode Island | | | | | | |
| | 1,000,000 | | 4.250%, 04/01/18 NPFG Insured | | A1/A/A | | | 1,048,170 | |
| | 1,000,000 | | 4.250%, 04/01/19 NPFG Insured | | A1/A/A | | | 1,039,150 | |
| | 1,000,000 | | 4.300%, 04/01/20 NPFG Insured | | A1/A/A | | | 1,032,800 | |
| | 250,000 | | 5.000%, 02/15/22 AGMC Insured | | Aa3/AAA/AA- | | | 261,132 | |
| | 1,000,000 | | 4.500%, 04/01/23 NPFG Insured | | A1/A/A | | | 1,038,330 | |
| | 250,000 | | 5.000%, 02/15/24 AGMC Insured | | Aa3/AAA/AA- | | | 259,162 | |
| | 2,455,000 | | 4.625%, 07/01/25 AGMC Insured | | Aa3/AAA/NR | | | 2,550,500 | |
| | 1,500,000 | | 4.500%, 04/01/26 NPFG Insured | | A1/A/A | | | 1,522,635 | |
| | 990,000 | | 4.750%, 07/01/28 AGMC Insured | | Aa3/AAA/NR | | | 1,020,512 | |
| | | | Cumberland, Rhode Island | | | | | | |
| | 250,000 | | 4.000%, 02/01/14 NPFG FGIC Insured | | A1/A/NR | | | 264,653 | |
| | 250,000 | | 4.000%, 02/01/15 NPFG FGIC Insured | | A1/A/NR | | | 261,308 | |
| | 250,000 | | 4.000%, 02/01/16 NPFG FGIC Insured | | A1/A/NR | | | 259,462 | |
| | 250,000 | | 4.100%, 02/01/17 NPFG FGIC Insured | | A1/A/NR | | | 259,513 | |
| | 1,000,000 | | 4.250%, 08/01/17 AGMC Insured | | Aa3/AAA/NR | | | 1,091,730 | |
| | 250,000 | | 4.150%, 02/01/18 NPFG FGIC Insured | | A1/A/NR | | | 259,315 | |
| | 600,000 | | 4.250%, 08/01/18 AGMC Insured | | Aa3/AAA/NR | | | 653,388 | |
| | 1,255,000 | | 5.000%, 10/01/18 NPFG Insured | | A1/A/NR | | | 1,285,020 | |
| | 1,040,000 | | 5.200%, 10/01/21 NPFG Insured | | A1/A/NR | | | 1,064,835 | |
| | | | East Providence, Rhode Island Refunding | | | | | | |
| | 2,500,000 | | 4.550%, 05/15/30 AGMC Insured | | Aa3/AAA/NR | | | 2,474,075 | |
| | | | Lincoln, Rhode Island | | | | | | |
| | 1,000,000 | | 4.500%, 08/01/24 NPFG Insured | | Aa2/NR/AA | | | 1,065,490 | |
| | 1,775,000 | | 4.500%, 08/01/25 NPFG Insured | | Aa2/NR/AA | | | 1,879,228 | |
| | 2,000,000 | | 4.500%, 08/01/26 NPFG Insured | | Aa2/NR/AA | | | 2,107,340 | |
| | | | New Shoreham, Rhode Island | | | | | | |
| | 245,000 | | 4.000%, 11/15/15 AMBAC Insured | | NR/AA/NR | | | 255,420 | |
| | 255,000 | | 4.250%, 11/15/16 AMBAC Insured | | NR/AA/NR | | | 265,271 | |
| | 270,000 | | 4.250%, 11/15/17 AMBAC Insured | | NR/AA/NR | | | 280,247 | |
| NARRAGANSETT INSURED TAX-FREE INCOME FUND | |
| SCHEDULE OF INVESTMENTS (continued) | |
| JUNE 30, 2010 | |
| | |
| | | | | Rating | | | |
| | | | | Moody’s, S&P | | | |
| Principal | | | | and Fitch | | | |
| Amount | | General Obligation Bonds (continued) | | (unaudited) | | Value | |
| | | New Shoreham, Rhode Island (continued) | | | | | |
| $ | 910,000 | | 4.800%, 04/15/18 AMBAC Insured | | NR/AA/NR | | $ | 943,188 | |
| | 285,000 | | 4.500%, 11/15/18 AMBAC Insured | | NR/AA/NR | | | 296,702 | |
| | 1,105,000 | | 5.000%, 04/15/22 AMBAC Insured | | NR/AA/NR | | | 1,146,183 | |
| | | | Newport, Rhode Island | | | | | | |
| | 1,000,000 | | 4.500%, 11/01/15 AMBAC Insured (pre-refunded) | | Aa2/NR/NR | | | 1,063,150 | |
| | 1,000,000 | | 4.750%, 11/01/18 AMBAC Insured (pre-refunded) | | Aa2/NR/NR | | | 1,066,440 | |
| | 800,000 | | 5.000%, 11/01/20 AMBAC Insured (pre-refunded) | | Aa2/NR/NR | | | 855,776 | |
| | | | North Kingstown, Rhode Island | | | | | | |
| | 500,000 | | 3.750%, 10/01/12 NPFG FGIC Insured | | Aa2/AA/NR | | | 531,355 | |
| | | | North Providence, Rhode Island | | | | | | |
| | 500,000 | | 4.700%, 09/15/14 AGMC Insured | | Aa3/AAA/NR | | | 517,490 | |
| | 500,000 | | 3.650%, 10/15/14 AGMC Insured | | Aa3/AAA/NR | | | 527,320 | |
| | 500,000 | | 3.750%, 10/15/15 AGMC Insured | | Aa3/AAA/NR | | | 522,735 | |
| | 250,000 | | 4.000%, 10/15/17 AGMC Insured | | Aa3/AAA/NR | | | 258,840 | |
| | | | Pawtucket, Rhode Island | | | | | | |
| | 250,000 | | 4.400%, 09/15/10 AMBAC Insured | | A1/NR/NR | | | 251,353 | |
| | 910,000 | | 4.000%, 04/15/14 AMBAC Insured | | A1/NR/A | | | 943,015 | |
| | 1,950,000 | | 4.500%, 07/15/26 AGMC Insured | | Aa3/NR/NR | | | 2,020,239 | |
| | 1,500,000 | | 4.750%, 07/15/29 AGMC Insured | | Aa3/NR/NR | | | 1,561,425 | |
| | | | Providence, Rhode Island | | | | | | |
| | 700,000 | | 5.500%, 01/15/11 AGMC Insured | | Aa3/AAA/NR | | | 702,086 | |
| | 500,000 | | 5.000%, 07/15/14 AGMC Insured | | Aa3/AAA/AA- | | | 567,475 | |
| | 1,000,000 | | 5.000%, 01/15/16 FGIC Insured (pre-refunded) | | A1/A/AA- | | | 1,034,400 | |
| | 1,000,000 | | 5.000%, 01/15/17 FGIC Insured (pre-refunded) | | A1/A/AA- | | | 1,034,400 | |
| | 1,000,000 | | 5.000%, 01/15/18 FGIC Insured (pre-refunded) | | A1/A/AA- | | | 1,034,400 | |
| | | | State of Rhode Island | | | | | | |
| | 4,000,000 | | 5.000%, 08/01/14 Series A NPFG FGIC Insured | | Aa2/AA/AA | | | 4,157,080 | |
| | 2,000,000 | | 5.000%, 08/01/12 Series B NPFG Insured | | Aa2/AA/AA | | | 2,172,040 | |
| | 1,000,000 | | 5.000%, 06/01/14 Series B NPFG FGIC Insured | | | | | | |
| | | | (pre-refunded) | | Aa2/AA/AA | | | 1,041,970 | |
| | 2,000,000 | | 5.000%, 08/01/15 Series B NPFG FGIC Insured | | Aa2/AA/AA | | | 2,070,920 | |
| | 1,000,000 | | 5.250%, 11/01/11 Series C NPFG Insured | | Aa2/AA/AA | | | 1,062,660 | |
| | 3,000,000 | | 5.000%, 09/01/18 Series C NPFG Insured | | | | | | |
| | | | (pre-refunded) | | Aa2/AA/AA | | | 3,190,590 | |
| NARRAGANSETT INSURED TAX-FREE INCOME FUND | |
| SCHEDULE OF INVESTMENTS (continued) | |
| JUNE 30, 2010 | |
| | |
| | | | | Rating | | | |
| | | | | Moody’s, S&P | | | |
| Principal | | | | and Fitch | | | |
| Amount | | General Obligation Bonds (continued) | | (unaudited) | | Value | |
| | | State of Rhode Island (continued) | | | | | |
| $ | 2,000,000 | | 5.000%, 09/01/19 Series C NPFG Insured | | | | | |
| | | | (pre-refunded) | | Aa2/AA/AA | | $ | 2,127,060 | |
| | 1,500,000 | | 5.000%, 09/01/20 Series C NPFG Insured | | | | | | |
| | | | (pre-refunded) | | Aa2/AA/AA | | | 1,595,295 | |
| | 2,000,000 | | 4.500%, 02/01/17 NPFG Insured | | Aa2/AA/AA | | | 2,134,340 | |
| | 2,000,000 | | 5.250%, 11/01/17 FGIC Insured (pre-refunded) | | Aa2/AA/AA | | | 2,211,420 | |
| | | | Warwick, Rhode Island | | | | | | |
| | 250,000 | | 4.000%, 07/15/11 AMBAC Insured | | Aa2/AA-/NR | | | 258,673 | |
| | 250,000 | | 4.125%, 07/15/13 AMBAC Insured | | Aa2/AA-/NR | | | 264,070 | |
| | 665,000 | | 4.250%, 07/15/14 AMBAC Insured | | Aa2/AA-/NR | | | 699,021 | |
| | 700,000 | | 4.375%, 07/15/15 AMBAC Insured | | Aa2/AA-/NR | | | 732,263 | |
| | 1,000,000 | | 4.000%, 08/01/16 AGMC Insured Series 2008 | | Aa2/AAA/NR | | | 1,095,780 | |
| | 770,000 | | 4.600%, 07/15/17 AMBAC Insured | | Aa2/AA-/NR | | | 798,174 | |
| | 1,015,000 | | 4.000%, 08/01/17 AGMC Insured Series 2008 | | Aa2/AAA/NR | | | 1,108,268 | |
| | 905,000 | | 4.250%, 01/15/18 Syncora Guarantee, Inc. Insured | | Aa2/AA-/NR | | | 965,997 | |
| | 810,000 | | 4.700%, 07/15/18 AMBAC Insured | | Aa2/AA-/NR | | | 842,036 | |
| | 1,000,000 | | 5.000%, 01/15/19 NPFG FGIC Insured | | Aa2/AA-/NR | | | 1,026,600 | |
| | 855,000 | | 4.750%, 07/15/19 AMBAC Insured | | Aa2/AA-/NR | | | 882,813 | |
| | 500,000 | | 5.000%, 01/15/20 NPFG FGIC Insured | | Aa2/AA-/NR | | | 512,925 | |
| | | | West Warwick, Rhode Island | | | | | | |
| | 500,000 | | 4.875%, 03/01/16 AMBAC Insured | | A1/NR/BBB+ | | | 523,245 | |
| | 670,000 | | 5.000%, 03/01/17 AMBAC Insured | | A1/NR/BBB+ | | | 699,152 | |
| | 700,000 | | 5.050%, 03/01/18 AMBAC Insured | | A1/NR/BBB+ | | | 729,631 | |
| | 735,000 | | 5.100%, 03/01/19 AMBAC Insured | | A1/NR/BBB+ | | | 764,878 | |
| | 1,900,000 | | 4.625%, 04/01/26 AGMC Insured | | Aa3/NR/NR | | | 1,998,173 | |
| | 1,400,000 | | 4.750%, 04/01/29 AGMC Insured | | Aa3/NR/NR | | | 1,461,992 | |
| | | | Westerly, Rhode Island | | | | | | |
| | 900,000 | | 4.000%, 07/01/17 NPFG Insured | | Aa2/AA/NR | | | 963,756 | |
| | 900,000 | | 4.000%, 07/01/18 NPFG Insured | | Aa2/AA/NR | | | 954,549 | |
| | | | Woonsocket, Rhode Island | | | | | | |
| | 655,000 | | 4.450%, 12/15/12 NPFG FGIC Insured | | Ba1/NR/BBB- | | | 663,024 | |
| | 685,000 | | 4.550%, 12/15/13 NPFG FGIC Insured | | Ba1/NR/BBB- | | | 690,316 | |
| | 550,000 | | 4.250%, 03/01/25 AMBAC Insured | | Ba1/NR/BBB- | | | 554,131 | |
| | | | Total General Obligation Bonds | | | | | 87,327,779 | |
| NARRAGANSETT INSURED TAX-FREE INCOME FUND | |
| SCHEDULE OF INVESTMENTS (continued) | |
| JUNE 30, 2010 | |
| | |
| | | | | Rating | | | |
| | | | | Moody’s, S&P | | | |
| Principal | | | | and Fitch | | | |
| Amount | | Revenue Bonds (59.4%) | | (unaudited) | | Value | |
| | | Development Revenue Bonds (10.0%) | | | | | |
| | | Providence, Rhode Island Redevelopment Agency | | | | | |
| | | Revenue Refunding Public Safety Building Project | | | | | |
| $ | 2,000,000 | | 4.750%, 04/01/22 AMBAC Insured Series A | | A2/A-/NR | | $ | 2,027,800 | |
| | 1,000,000 | | 5.000%, 04/01/28 Series A AMBAC Insured | | A2/A-/NR | | | 1,002,430 | |
| | | | Rhode Island Convention Center Authority Revenue | | | | | | |
| | | | Refunding | | | | | | |
| | 2,000,000 | | 5.000%, 05/15/21 AGMC Insured | | Aa3/AAA/AA | | | 2,146,740 | |
| | 1,500,000 | | 5.500%, 05/15/27 AGMC Insured Series A | | Aa3/AAA/AA- | | | 1,634,805 | |
| | | | Rhode Island State Economic Development Corp. | | | | | | |
| | | | Airport Revenue | | | | | | |
| | 540,000 | | 4.625%, 07/01/26 AGMC Insured Series B | | Aa3/AAA/A | | | 550,292 | |
| | 1,670,000 | | 5.000%, 07/01/13 NPFG Insured Series C | | A2/A/A | | | 1,807,942 | |
| | 1,000,000 | | 5.000%, 07/01/18 AGMC Insured Series C | | Aa3/AAA/A | | | 1,105,180 | |
| | 1,500,000 | | 5.000%, 07/01/22 NPFG Insured Series C | | A2/A/A | | | 1,561,005 | |
| | | | Rhode Island State Economic Development Corp. | | | | | | |
| | | | Motor Fuel Tax Revenue (Rhode Island | | | | | | |
| | | | Department of Transportation) | | | | | | |
| | 1,000,000 | | 4.000%, 06/15/15 Series A AMBAC Insured | | A1/A+/A+ | | | 1,031,070 | |
| | 500,000 | | 3.750%, 06/15/13 Series 2003A AMBAC Insured | | A1/A+/A+ | | | 524,285 | |
| | 2,385,000 | | 4.700%, 06/15/23 Series 2003A AMBAC Insured | | A1/A+/A+ | | | 2,416,291 | |
| | 1,000,000 | | 4.000%, 06/15/18 Series 2006A AMBAC Insured | | A1/A+/A+ | | | 1,016,390 | |
| | | | Rhode Island State Economic Development Corp., | | | | | | |
| | | | (Rhode Island Airport Corp. Intermodal Facility | | | | | | |
| | | | Project) | | | | | | |
| | 1,000,000 | | 4.250%, 07/01/17 CIFG Assurance North America, | | | | | | |
| | | | Inc. Insured | | Baa1/BBB+/NR | | | 1,006,830 | |
| | | | Rhode Island Economic Development Corp. (Rhode | | | | | | |
| | | | Island Department of Transportation) | | | | | | |
| | 1,500,000 | | 5.250%, 06/15/21 AGMC Insured | | Aa2/AAA/AA- | | | 1,706,190 | |
| | | | Rhode Island State Economic Development Corp., | | | | | | |
| | | | University of Rhode Island | | | | | | |
| | 750,000 | | 4.800%, 11/01/11 Series 1999 AGMC Insured | | Aa3/NR/NR | | | 755,235 | |
| | 750,000 | | 4.900%, 11/01/12 Series 1999 AGMC Insured | | Aa3/NR/NR | | | 755,205 | |
| NARRAGANSETT INSURED TAX-FREE INCOME FUND | |
| SCHEDULE OF INVESTMENTS (continued) | |
| JUNE 30, 2010 | |
| | |
| | | | | Rating | | | |
| | | | | Moody’s, S&P | | | |
| Principal | | | | and Fitch | | | |
| Amount | | Revenue Bonds (continued) | | (unaudited) | | Value | |
| | | Development Revenue Bonds (continued) | | | | | |
| | | Rhode Island State Economic Development Corp., | | | | | |
| | | University of Rhode Island (continued) | | | | | |
| $ | 750,000 | | 4.900%, 11/01/13 Series 1999 AGMC Insured | | Aa3/NR/NR | | $ | 755,183 | |
| | 750,000 | | 5.000%, 11/01/14 Series 1999 AGMC Insured | | Aa3/NR/NR | | | 755,205 | |
| | | | Total Development Revenue Bonds | | | | | 22,558,078 | |
| | | | | | | | | | |
| | | | Higher Education Revenue Bonds (25.4%) | | | | | | |
| | | | Rhode Island Health & Education Building Corp., | | | | | | |
| | | | Brown University | | | | | | |
| | 2,000,000 | | 5.250%, 09/01/17 Series 2001 A NPFG Insured | | Aa1/AA+/NR | | | 2,081,600 | |
| | 2,500,000 | | 4.750%, 09/01/33 Series 2003 A | | Aa1/AA+/NR | | | 2,537,875 | |
| | | | Rhode Island Health & Education Building Corp., | | | | | | |
| | | | Bryant College | | | | | | |
| | 1,000,000 | | 5.125%, 06/01/19 AMBAC Insured | | A2/A/NR | | | 1,038,990 | |
| | 230,000 | | 5.000%, 12/01/21 AMBAC Insured | | A2/A/NR | | | 235,469 | |
| | | | Rhode Island Health & Education Building Corp., | | | | | | |
| | | | Higher Educational Facilities | | | | | | |
| | 1,010,000 | | 3.625%, 09/15/14 Series 2003 B NPFG Insured | | Baa1/A/NR | | | 1,028,422 | |
| | 1,050,000 | | 4.000%, 09/15/15 Series 2003 B NPFG Insured | | Baa1/A/NR | | | 1,070,454 | |
| | 1,040,000 | | 4.000%, 09/15/16 Series 2003 B NPFG Insured | | Baa1/A/NR | | | 1,051,138 | |
| | 600,000 | | 3.625%, 09/15/14 Series 2003 C NPFG Insured | | Baa1/A/NR | | | 610,944 | |
| | 500,000 | | 4.000%, 09/15/15 Series 2003 C NPFG Insured | | Baa1/A/NR | | | 509,740 | |
| | 500,000 | | 4.000%, 09/15/16 Series 2003 C NPFG Insured | | Baa1/A/NR | | | 505,355 | |
| | 1,500,000 | | 4.250%, 05/15/21 Series A AGMC Insured | | Aa3/NR/NR | | | 1,525,005 | |
| | 1,500,000 | | 4.375%, 05/15/22 Series A AGMC Insured | | Aa3/NR/NR | | | 1,525,395 | |
| | 5,000,000 | | 5.000%, 09/15/30 AGMC Insured | | Aa3/NR/NR | | | 5,189,800 | |
| | | | Rhode Island Health & Education Building Corp., | | | | | | |
| | | | Johnson & Wales University | | | | | | |
| | 465,000 | | 5.500%, 04/01/15 Series 1999 A NPFG Insured | | Baa1/A/NR | | | 497,066 | |
| | 900,000 | | 5.500%, 04/01/16 Series 1999 A NPFG Insured | | Baa1/A/NR | | | 958,554 | |
| | 785,000 | | 5.500%, 04/01/17 Series 1999 A NPFG Insured | | Baa1/A/NR | | | 834,337 | |
| NARRAGANSETT INSURED TAX-FREE INCOME FUND | |
| SCHEDULE OF INVESTMENTS (continued) | |
| JUNE 30, 2010 | |
| | |
| | | | | Rating | | | |
| | | | | Moody’s, S&P | | | |
| Principal | | | | and Fitch | | | |
| Amount | | Revenue Bonds (continued) | | (unaudited) | | Value | |
| | | Higher Education Revenue Bonds (continued) | | | | | |
| | | Rhode Island Health & Education Building Corp., | | | | | |
| | | Johnson & Wales University (continued) | | | | | |
| $ | 1,360,000 | | 4.000%, 04/01/12 Series 2003 Syncora | | | | | |
| | | | Guarantee, Inc. Insured | | NR/NR/NR* | | $ | 1,377,490 | |
| | 3,210,000 | | 4.000%, 04/01/13 Series 2003 Syncora | | | | | | |
| | | | Guarantee, Inc. Insured | | NR/NR/NR* | | | 3,258,118 | |
| | 500,000 | | 5.250%, 04/01/14 Series 2003 Syncora | | | | | | |
| | | | Guarantee, Inc. Insured | | NR/NR/NR* | | | 521,685 | |
| | 2,000,000 | | 4.000%, 04/01/14 Series 2003 Syncora | | | | | | |
| | | | Guarantee, Inc. Insured | | NR/NR/NR* | | | 2,016,940 | |
| | 1,500,000 | | 5.000%, 04/01/29 NPFG Insured | | Baa1/A/NR | | | 1,416,195 | |
| | | | Rhode Island Health & Educational Building Corp., | | | | | | |
| | | | Higher Education Facility, New England Institute | | | | | | |
| | | | of Technology | | | | | | |
| | 3,000,000 | | 4.750%, 03/01/30 Series 2010 A | | NR/A/A+ | | | 2,969,580 | |
| | | | Rhode Island Health & Educational Building Corp., | | | | | | |
| | | | Higher Education Facility, Rhode Island School | | | | | | |
| | | | of Design | | | | | | |
| | 250,000 | | 4.400%, 06/01/15 NPFG Insured | | A1/A/NR | | | 259,213 | |
| | 585,000 | | 4.600%, 06/01/17 NPFG Insured | | A1/A/NR | | | 604,328 | |
| | 505,000 | | 4.700%, 06/01/18 Series 2001 NPFG Insured | | A1/A/NR | | | 521,488 | |
| | 280,000 | | 4.750%, 06/01/19 Series 2001 NPFG Insured | | A1/A/NR | | | 288,884 | |
| | 1,310,000 | | 5.625%, 08/15/22 Syncora Guarantee, Inc. | | | | | | |
| | | | Insured Series D | | A1/NR/NR | | | 1,388,836 | |
| | 900,000 | | 5.000%, 08/15/23 Syncora Guarantee, Inc. | | | | | | |
| | | | Insured Series D | | A1/NR/NR | | | 927,900 | |
| | 1,000,000 | | 5.000%, 06/01/31 NPFG Insured | | A1/A/NR | | | 1,012,060 | |
| | | | Rhode Island Health & Educational Building Corp., | | | | | | |
| | | | Higher Education Facility, University of Rhode | | | | | | |
| | | | Island Auxiliary Enterprise | | | | | | |
| | 2,000,000 | | 5.000%, 09/15/30 Series 2010 B AGMC Insured | | Aa3/AAA/NR | | | 2,075,920 | |
| NARRAGANSETT INSURED TAX-FREE INCOME FUND | |
| SCHEDULE OF INVESTMENTS (continued) | |
| JUNE 30, 2010 | |
| | |
| | | | | Rating | | | |
| | | | | Moody’s, S&P | | | |
| Principal | | | | and Fitch | | | |
| Amount | | Revenue Bonds (continued) | | (unaudited) | | Value | |
| | | Higher Education Revenue Bonds (continued) | | | | | |
| | | Rhode Island Health & Educational Building Corp., | | | | | |
| | | Higher Education Facility, Roger Williams | | | | | |
| | | University | | | | | |
| $ | 500,000 | | 5.125%, 11/15/11 AMBAC Insured | | NR/NR/NR* | | $ | 506,355 | |
| | 1,000,000 | | 5.125%, 11/15/14 Series 1996 S AMBAC Insured | | NR/NR/NR* | | | 1,012,710 | |
| | 1,000,000 | | 5.000%, 11/15/18 Series 1996 S AMBAC Insured | | NR/NR/NR* | | | 1,003,790 | |
| | 500,000 | | 5.000%, 11/15/24 AMBAC Insured | | NR/NR/NR* | | | 500,575 | |
| | | | Rhode Island Health & Educational Building Corp., | | | | | | |
| | | | University of Rhode Island | | | | | | |
| | 300,000 | | 5.200%, 09/15/16 Series 2000 B AMBAC Insured | | | | | | |
| | | | (pre-refunded) | | NR/A+/NR | | | 305,811 | |
| | 800,000 | | 5.000%, 09/15/23 Series 2003 C Refunding NPFG | | | | | | |
| | | | Insured | | Baa1/A/NR | | | 811,240 | |
| | 1,200,000 | | 4.000%, 09/15/11 Series 2005 G AMBAC Insured | | Aa3/A+/NR | | | 1,238,316 | |
| | 1,200,000 | | 4.125%, 09/15/12 Series 2005 G AMBAC Insured | | Aa3/A+/NR | | | 1,267,644 | |
| | 1,200,000 | | 4.125%, 09/15/13 Series 2005 G AMBAC Insured | | Aa3/A+/NR | | | 1,279,968 | |
| | 1,000,000 | | 4.500%, 09/15/26 Series 2005 G Refunding | | | | | | |
| | | | AMBAC Insured | | Aa3/A+/NR | | | 1,002,700 | |
| | | | Rhode Island Health & Education Facilities Authority, | | | | | | |
| | | | Providence College | | | | | | |
| | 1,000,000 | | 4.250%, 11/01/14 Syncora Guarantee, Inc. Insured | | A2/NR/NR | | | 1,067,900 | |
| | 2,500,000 | | 4.375%, 11/01/15 Syncora Guarantee, Inc. Insured | | A2/NR/NR | | | 2,648,350 | |
| | 2,500,000 | | 4.500%, 11/01/16 Syncora Guarantee, Inc. Insured | | A2/NR/NR | | | 2,626,425 | |
| | 1,000,000 | | 4.500%, 11/01/17 Syncora Guarantee, Inc. Insured | | A2/NR/NR | | | 1,043,480 | |
| | 1,000,000 | | 5.000%, 11/01/24 Syncora Guarantee, Inc. Insured | | | | | | |
| | | | Series 2003 A | | A2/NR/NR | | | 1,035,460 | |
| | | | Total Higher Education Revenue Bonds | | | | | 57,189,505 | |
| | |
| | | | Hospital Revenue Bonds (3.1%) | | | | | | |
| | | | Rhode Island Health & Education Building Corp., | | | | | | |
| | | | Lifespan Obligation | | | | | | |
| | 2,500,000 | | 5.000%, 05/15/20 Series A AGMC Insured | | Aa3/AAA/NR | | | 2,633,300 | |
| | 2,500,000 | | 5.000%, 05/15/26 Series A AGMC Insured | | Aa3/AAA/NR | | | 2,558,425 | |
| | 1,900,000 | | 5.250%, 05/15/26 NPFG Insured | | A3/A/NR | | | 1,904,389 | |
| | | | Total Hospital Revenue Bonds | | | | | 7,096,114 | |
| NARRAGANSETT INSURED TAX-FREE INCOME FUND | |
| SCHEDULE OF INVESTMENTS (continued) | |
| JUNE 30, 2010 | |
| | |
| | | | | Rating | | | |
| | | | | Moody’s, S&P | | | |
| Principal | | | | and Fitch | | | |
| Amount | | Revenue Bonds (continued) | | (unaudited) | | Value | |
| | | Housing Revenue Bonds (0.5%) | | | | | |
| | | Rhode Island Housing & Mortgage Finance Corp. | | | | | |
| | | Homeowner Opportunity | | | | | |
| $ | 1,000,000 | | 3.750%, 10/01/13 Series 50-A NPFG Insured | | Aa2/AA+/NR | | $ | 1,046,860 | |
| | |
| | | | Lease Revenue Bonds (1.3%) | | | | | | |
| | | | Rhode Island Certificates of Participation (Central | | | | | | |
| | | | Power Plant) | | | | | | |
| | 1,000,000 | | 4.000%, 10/01/20 Series D AGMC Insured | | Aa3/AAA/AA- | | | 1,036,860 | |
| | | | Rhode Island Certificates of Participation (Kent | | | | | | |
| | | | County Court House Project) | | | | | | |
| | 250,000 | | 5.000%, 10/01/22 NPFG Insured Series 2004 A | | Aa3/AA-/AA- | | | 263,925 | |
| | | | Rhode Island Certificates of Participation (School | | | | | | |
| | | | for the Deaf Project) | | | | | | |
| | 1,000,000 | | 5.500%, 04/01/27 Series C 2009 AGMC Insured | | Aa3/AAA/AA- | | | 1,070,010 | |
| | 500,000 | | 5.625%, 04/01/29 Series C 2009 AGMC Insured | | Aa3/AAA/AA- | | | 534,265 | |
| | | | Total Lease Revenue Bonds | | | | | 2,905,060 | |
| | |
| | | | Pollution Control Revenue Bonds (3.0%) | | | | | | |
| | | | Rhode Island Clean Water Finance Agency, Water | | | | | | |
| | | | Pollution Control Bonds | | | | | | |
| | 1,800,000 | | 5.000%, 10/01/18 Series 2002 B NPFG Insured | | Aaa/AA/NR | | | 1,915,416 | |
| | 4,765,000 | | 4.375%, 10/01/21 Series 2002 B NPFG Insured | | Aaa/AA/NR | | | 4,915,908 | |
| | | | Total Pollution Control Revenue Bonds | | | | | 6,831,324 | |
| | |
| | | | Secondary School Revenue Bonds (8.5%) | | | | | | |
| | | | Providence, Rhode Island Public Building Authority, | | | | | | |
| | | | School Projects | | | | | | |
| | 500,000 | | 5.500%, 12/15/14 Series 1996 B NPFG Insured | | A2/A/NR | | | 501,490 | |
| | 500,000 | | 5.500%, 12/15/15 Series 1996 B NPFG Insured | | A2/A/NR | | | 501,490 | |
| | 1,000,000 | | 5.250%, 12/15/14 Series 1998 A AGMC Insured | | Aa3/AAA/NR | | | 1,012,800 | |
| | 685,000 | | 5.000%, 12/15/18 Series 1998 A AGMC Insured | | Aa3/AAA/NR | | | 690,151 | |
| | 500,000 | | 5.125%, 12/15/14 Series 1999 A AMBAC Insured | | A2/A-/NR | | | 509,760 | |
| | 250,000 | | 5.250%, 12/15/15 Series 1999 A AMBAC Insured | | A2/A-/NR | | | 254,435 | |
| | 1,500,000 | | 5.250%, 12/15/17 Series 1999 A AMBAC Insured | | A2/A-/NR | | | 1,519,260 | |
| | 1,000,000 | | 5.250%, 12/15/19 Series 1999 A AMBAC Insured | | A2/A-/NR | | | 1,006,440 | |
| | 1,395,000 | | 4.000%, 12/15/12 Series 2003 A NPFG Insured | | A2/A/NR | | | 1,455,041 | |
| NARRAGANSETT INSURED TAX-FREE INCOME FUND | |
| SCHEDULE OF INVESTMENTS (continued) | |
| JUNE 30, 2010 | |
| | |
| | | | | Rating | | | |
| | | | | Moody’s, S&P | | | |
| Principal | | | | and Fitch | | | |
| Amount | | Revenue Bonds (continued) | | (unaudited) | | Value | |
| | | Secondary School Revenue Bonds (continued) | | | | | |
| | | Providence, Rhode Island Public Building Authority, | | | | | |
| | | School Projects (continued) | | | | | |
| $ | 1,450,000 | | 4.000%, 12/15/13 Series 2003 A NPFG Insured | | A2/A/NR | | $ | 1,501,533 | |
| | 1,505,000 | | 4.000%, 12/15/14 Series 2003 A NPFG Insured | | A2/A/NR | | | 1,543,016 | |
| | 1,570,000 | | 4.000%, 12/15/15 Series 2003 A NPFG Insured | | A2/A/NR | | | 1,595,183 | |
| | 1,630,000 | | 4.000%, 12/15/16 Series 2003 A NPFG Insured | | A2/A/NR | | | 1,645,077 | |
| | 150,000 | | 5.500%, 12/15/13 series 2006 B NPFG Insured | | A2/A/NR | | | 150,447 | |
| | | | Rhode Island Health & Education Building Corp., | | | | | | |
| | | | Public School Financing | | | | | | |
| | 1,000,000 | | 5.000%, 05/15/17 Series 2006 A AGMC Insured | | Aa3/AAA/AA | | | 1,080,990 | |
| | 500,000 | | 5.000%, 05/15/20 Series 2007 A AGMC Insured | | Aa3/NR/NR | | | 536,215 | |
| | 1,000,000 | | 4.250%, 05/15/21 Series 2007 B AGMC Insured | | Aa3/AAA/NR | | | 1,011,830 | |
| | 500,000 | | 5.000%, 05/15/17 Series 2008 A AGMC Insured | | Aa3/NR/NR | | | 553,060 | |
| | 2,000,000 | | 4.750%, 05/15/29 Series A AGMC Insured | | Aa3/NR/NR | | | 2,007,700 | |
| | | | Total Secondary School Revenue Bonds | | | | | 19,075,918 | |
| | |
| | | | Transportation Revenue Bonds (0.7%) | | | | | | |
| | | | Rhode Island State Turnpike & Bridge Authority | | | | | | |
| | | | Revenue | | | | | | |
| | 1,600,000 | | 4.625%, 12/01/27 Series 2010A | | NR/A-/A | | | 1,611,120 | |
| | |
| | | | Water and Sewer Revenue Bonds (5.9%) | | | | | | |
| | | | Bristol County, Rhode Island Water Authority | | | | | | |
| | 750,000 | | 5.250%, 07/01/17 Series 1997 A NPFG Insured | | Baa1/A/NR | | | 752,107 | |
| | 1,000,000 | | 3.500%, 12/01/13 Series 2004 Refunding A NPFG | | | | | | |
| | | | Insured | | Baa1/A/NR | | | 1,041,050 | |
| | 1,000,000 | | 3.500%, 12/01/14 Series 2004 Refunding A NPFG | | | | | | |
| | | | Insured | | Baa1/A/NR | | | 1,032,140 | |
| | | | Kent County, Rhode Island Water Authority | | | | | | |
| | 500,000 | | 4.000%, 07/15/12 Series 2002 A NPFG Insured | | Baa1/A/NR | | | 531,035 | |
| | 1,055,000 | | 4.150%, 07/15/14 Series 2002 A NPFG Insured | | Baa1/A/NR | | | 1,098,297 | |
| | | | Narragansett, Rhode Island Bay Commission | | | | | | |
| | | | Wastewater System Revenue | | | | | | |
| | 365,000 | | 5.000%, 08/01/27 Series 2003 A NPFG Insured | | Baa1/AA-/NR | | | 379,549 | |
| | 1,000,000 | | 5.000%, 02/01/32 Series 2007 A NPFG Insured | | NR/AA-/NR | | | 1,025,270 | |
| NARRAGANSETT INSURED TAX-FREE INCOME FUND | |
| SCHEDULE OF INVESTMENTS (continued) | |
| JUNE 30, 2010 | |
| | |
| | | | | Rating | | | |
| | | | | Moody’s, S&P | | | |
| Principal | | | | and Fitch | | | |
| Amount | | Revenue Bonds (continued) | | (unaudited) | | Value | |
| | | Water and Sewer Revenue Bonds (continued) | | | | | |
| | | Rhode Island Clean Water Protection Finance | | | | | |
| | | Agency | | | | | |
| $ | 295,000 | | 4.600%, 10/01/13 Series A AMBAC Insured | | Aaa/NR/NR | | $ | 295,696 | |
| | 325,000 | | 4.750%, 10/01/14 Series A AMBAC Insured | | Aaa/NR/NR | | | 325,800 | |
| | 1,545,000 | | 4.750%, 10/01/18 Series A AMBAC Insured | | Aaa/NR/NR | | | 1,548,801 | |
| | 1,250,000 | | 5.400%, 10/01/15 1993 Series A NPFG Insured | | Aaa/A/NR | | | 1,374,362 | |
| | 500,000 | | 4.750%, 10/01/20 1999 Series A AMBAC Insured | | Aaa/NR/NR | | | 501,230 | |
| | 735,000 | | 5.125%, 10/01/11 1999 Series C NPFG Insured | | Aaa/NR/NR | | | 736,999 | |
| | | | Rhode Island Water Resources Board Public | | | | | | |
| | | | Drinking Water Protection | | | | | | |
| | 1,500,000 | | 4.000%, 03/01/14 Series 2002 NPFG Insured | | Baa1/A/NR | | | 1,549,245 | |
| | 595,000 | | 4.250%, 03/01/15 Series 2002 NPFG Insured | | Baa1/AA-/NR | | | 610,768 | |
| | 405,000 | | 4.250%, 03/01/15 Series 2002 NPFG Insured | | | | | | |
| | | | (pre-refunded) | | NR/A/NR | | | 430,313 | |
| | | | Total Water and Sewer Revenue Bonds | | | | | 13,232,662 | |
| | |
| | | | Other Revenue Bonds (1.1%) | | | | | | |
| | | | State of Rhode Island Depositors Economic | | | | | | |
| | | | Protection Corp. | | | | | | |
| | 235,000 | | 6.550%, 08/01/10 NPFG Insured ETM | | NR/A/NR | | | 235,985 | |
| | 250,000 | | 5.750%, 08/01/21 Series A AGMC Insured ETM | | NR/NR/NR* | | | 309,815 | |
| | 215,000 | | 6.375%, 08/01/22 Series A NPFG Insured ETM | | NR/A/AAA | | | 280,624 | |
| | 500,000 | | 6.000%, 08/01/17 Series 1992 B NPFG Insured ETM | | NR/A/NR | | | 549,180 | |
| | 1,045,000 | | 5.250%, 08/01/21 Series 1993 B NPFG Insured ETM | | | | | | |
| | | | (pre-refunded) | | NR/A/NR | | | 1,072,640 | |
| | | | Total Other Revenue Bonds | | | | | 2,448,244 | |
| | |
| | | | Total Revenue Bonds | | | | | 133,994,885 | |
| | |
| | | | Total Investments (cost $214,071,191-note 4) | | 98.2% | | | 221,322,664 | |
| | | | Other assets less liabilities | | 1.8 | | | 4,091,633 | |
| | | | Net Assets | | 100.0% | | $ | 225,414,297 | |
NARRAGANSETT INSURED TAX-FREE INCOME FUND
SCHEDULE OF INVESTMENTS (continued)
JUNE 30, 2010
| * | Any security not rated (NR) by any of the approved credit rating services has been determined by the Investment Sub-Adviser to have sufficient quality to be ranked in the top four credit ratings if a credit rating were to be assigned by a credit rating service. |
| | | Percent of |
| Portfolio Distribution By Quality Rating | | Investment † |
| Aaa of Moody’s or AAA of S&P | | | 23.0 | % |
| Pre-refunded bonds††/Escrowed to maturity bonds | | | 8.8 | |
| Aa of Moody’s or AA of S&P or Fitch | | | 27.0 | |
| A of Moody’s or S&P or Fitch | | | 35.3 | |
| Baa of Moody’s or BBB of S&P or Fitch | | | 1.3 | |
| Not Rated* | | | 4.6 | |
| | | | 100.0 | % |
| † | Calculated using the highest rating of the three rating services. |
| †† | Pre-refunded bonds are bonds for which U.S. Government Obligations have been placed in escrow to retire the bonds at their earliest call date. |
PORTFOLIO ABBREVIATIONS: AGMC - Assured Guaranty Municipal Corp. AMBAC - American Municipal Bond Assurance Corp. CIFG - CDC IXIS Financial Guaranty ETM - Escrowed to Maturity FGIC - Financial Guaranty Insurance Co. NPFG - National Public Finance Guarantee NR - Not Rated |
See accompanying notes to financial statements.
| NARRAGANSETT INSURED TAX-FREE INCOME FUND | |
| STATEMENT OF ASSETS AND LIABILITIES | |
| JUNE 30, 2010 | |
| | |
| ASSETS | | | |
| Investments at value (cost $214,071,191) | | $ | 221,322,664 | |
| Cash | | | 1,745,378 | |
| Interest receivable | | | 2,598,711 | |
| Receivable for Fund shares sold | | | 285,087 | |
| Other assets | | | 1,956 | |
| Total assets | | | 225,953,796 | |
| LIABILITIES | | | | |
| Dividends payable | | | 229,500 | |
| Payable for Fund shares redeemed | | | 163,567 | |
| Management fee payable | | | 42,240 | |
| Distribution and service fees payable | | | 1,232 | |
| Accrued expenses | | | 102,960 | |
| Total liabilities | | | 539,499 | |
| NET ASSETS | | $ | 225,414,297 | |
| Net Assets consist of: | | | | |
| Capital Stock - Authorized 80,000,000 shares, par value $0.01 per share | | $ | 211,889 | |
| Additional paid-in capital | | | 218,615,020 | |
| Net unrealized appreciation on investments (note 4) | | | 7,251,473 | |
| Accumulated net realized loss on investments | | | (627,260 | ) |
| Distributions in excess of net investment income | | | (36,825 | ) |
| | | $ | 225,414,297 | |
| | |
| CLASS A | | | | |
| Net Assets | | $ | 150,814,460 | |
| Capital shares outstanding | | | 14,176,616 | |
| Net asset value and redemption price per share | | $ | 10.64 | |
| Maximum offering price per share (100/96 of $10.64 adjusted to nearest cent) | | $ | 11.08 | |
| | |
| CLASS C | | | | |
| Net Assets | | $ | 22,307,069 | |
| Capital shares outstanding | | | 2,097,082 | |
| Net asset value and offering price per share | | $ | 10.64 | |
| Redemption price per share (*a charge of 1% is imposed on the redemption | | | | |
| proceeds of the shares, or on the original price, whichever is lower, if redeemed | | | | |
| during the first 12 months after purchase) | | $ | 10.64 | * |
| | |
| CLASS I | | | | |
| Net Assets | | $ | 276,062 | |
| Capital shares outstanding | | | 25,962 | |
| Net asset value, offering and redemption price per share | | $ | 10.63 | |
| CLASS Y | | | | |
| Net Assets | | $ | 52,016,706 | |
| Capital shares outstanding | | | 4,889,203 | |
| Net asset value, offering and redemption price per share | | $ | 10.64 | |
See accompanying notes to financial statements.
NARRAGANSETT INSURED TAX-FREE INCOME FUND
STATEMENT OF OPERATIONS
YEAR ENDED JUNE 30, 2010
| Investment Income: | | | | | | |
| | |
| Interest income | | | | | $ | 8,915,441 | |
| | | | | | | | |
| Expenses: | | | | | | | |
| | |
| Management fee (note 3) | | $ | 1,057,155 | | | | | |
| Distribution and service fees (note 3) | | | 386,050 | | | | | |
| Transfer and shareholder servicing agent fees (note 3) | | | 113,904 | | | | | |
| Trustees’ fees and expenses (note 8) | | | 108,145 | | | | | |
| Legal fees (note 3) | | | 90,417 | | | | | |
| Shareholders’ reports and proxy statements | | | 35,764 | | | | | |
| Fund accounting fees | | | 19,783 | | | | | |
| Auditing and tax fees | | | 18,500 | | | | | |
| Custodian fees (note 6) | | | 17,042 | | | | | |
| Registration fees and dues | | | 14,341 | | | | | |
| Insurance | | | 10,710 | | | | | |
| Chief compliance officer (note 3) | | | 4,504 | | | | | |
| Miscellaneous | | | 37,449 | | | | | |
| Total expenses | | | 1,913,764 | | | | | |
| | |
| Management fee waived (note 3) | | | (598,503 | ) | | | | |
| Expenses paid indirectly (note 6) | | | (642 | ) | | | | |
| Net expenses | | | | | | | 1,314,619 | |
| Net investment income | | | | | | | 7,600,822 | |
| | |
| Realized and Unrealized Gain (Loss) on Investments: | | | | | | | | |
| | |
| Net realized gain (loss) from securities transactions | | | 127,977 | | | | | |
| Change in unrealized appreciation on investments | | | 3,708,634 | | | | | |
| | |
| Net realized and unrealized gain (loss) on investments | | | | | | | 3,836,611 | |
| Net change in net assets resulting from operations | | | | | | $ | 11,437,433 | |
See accompanying notes to financial statements.
| NARRAGANSETT INSURED TAX-FREE INCOME FUND | |
| STATEMENTS OF CHANGES IN NET ASSETS | |
| | |
| | |
| | | Year Ended | | | Year Ended | |
| | | June 30, 2010 | | | June 30, 2009 | |
| OPERATIONS: | | | | | | |
| Net investment income | | $ | 7,600,822 | | | $ | 6,782,172 | |
| Net realized gain (loss) from securities transactions | | | 127,977 | | | | 132,126 | |
| Change in unrealized appreciation on investments | | | 3,708,634 | | | | 1,940,606 | |
| Change in net assets from operations | | | 11,437,433 | | | | 8,854,904 | |
| | |
| DISTRIBUTIONS TO SHAREHOLDERS (note 9): | | | | | | | | |
| Class A Shares: | | | | | | | | |
| Net investment income | | | (5,222,294 | ) | | | (4,658,407 | ) |
| | |
| Class C Shares: | | | | | | | | |
| Net investment income | | | (476,630 | ) | | | (316,526 | ) |
| | |
| Class I Shares: | | | | | | | | |
| Net investment income | | | (9,617 | ) | | | (11,043 | ) |
| | |
| Class Y Shares: | | | | | | | | |
| Net investment income | | | (1,947,340 | ) | | | (1,876,092 | ) |
| Change in net assets from distributions | | | (7,655,881 | ) | | | (6,862,068 | ) |
| | |
| CAPITAL SHARE TRANSACTIONS (note 7): | | | | | | | | |
| Proceeds from shares sold | | | 49,485,057 | | | | 34,987,531 | |
| Net asset value of shares issued in connection | | | | | | | | |
| with acquisition (note 11) | | | – | | | | 18,325,315 | |
| Reinvested dividends and distributions | | | 3,579,625 | | | | 3,073,562 | |
| Cost of shares redeemed | | | (27,464,816 | ) | | | (24,715,396 | ) |
| Change in net assets from capital share transactions | | | 25,599,866 | | | | 31,671,012 | |
| Change in net assets | | | 29,381,418 | | | | 33,663,848 | |
| | |
| NET ASSETS: | | | | | | | | |
| Beginning of period | | | 196,032,879 | | | | 162,369,031 | |
| | |
| End of period* | | $ | 225,414,297 | | | $ | 196,032,879 | |
| | |
| * Includes distributions in excess of net investment income and | | | | | | | | |
| undistributed net investment income of: | | $ | (36,825 | ) | | $ | 18,574 | |
See accompanying notes to financial statements.
NARRAGANSETT INSURED TAX-FREE INCOME FUND
NOTES TO FINANCIAL STATEMENTS
JUNE 30, 2010
1. Organization
Narragansett Insured Tax-Free Income Fund (the “Fund”), a non-diversified, open-end investment company, was organized on January 22, 1992 as a Massachusetts business trust and commenced operations on September 10, 1992. The Fund is authorized to issue 80,000,000 shares and, since its inception to May 1, 1996, offered only one class of shares. On that date, the Fund began offering two additional classes of shares, Class C and Class Y Shares. All shares outstanding prior to that date were designated as Class A Shares and are sold at net asset value plus a sales charge (of varying size depending upon a variety of factors) paid at the time of purchase and bear a distribution fee. Class C Shares are sold at net asset value with no sales charge payable at the time of purchase but with a level charge for service and distribution fees for six years thereafter. Class C Shares automatically convert to Class A Shares after six years. Class Y Shares are sold only through institutions acting for investors in a fiduciary, advisory, agency, custodial or similar capacity, and are not offered directly to retail customers. Class Y Shares are sold at net asset value with no sales charge, no redemption fee, no contingent deferred sales charge (“CDSC”) and no distribution fee. On October 31, 1997, the Fund established Class I Shares which are offered and sold only through financial intermediaries and are not offered directly to retail customers. Class I Shares are sold at net asset value with no sales charge and no redemption fee or CDSC, although a financial intermediary may charge a fee for effecting a purchase or other transaction on behalf of its customers. Class I Shares may carry a distribution and a service fee. All classes of shares represent interests in the same portfolio of investments and are i dentical as to rights and privileges but differ with respect to the effect of sales charges, the distribution and/or service fees borne by each class, expenses specific to each class, voting rights on matters affecting a single class and the exchange privileges of each class.
2. Significant Accounting Policies
The following is a summary of significant accounting policies followed by the Fund in the preparation of its financial statements. The policies are in conformity with accounting principles generally accepted in the United States of America for investment companies.
| a) | Portfolio valuation: Municipal securities which have remaining maturities of more than 60 days are valued each business day based upon information provided by a nationally prominent independent pricing service and periodically verified through other pricing services. In the case of securities for which market quotations are readily available, securities are valued by the pricing service at the mean of bid and asked quotations. If market quotations or a valuation from the pricing service is not readily available, the security is valued at fair value determined in good faith under procedures established by and under the general supervision of the Board of Trustees. Securities which mature in 60 days or less are valued at amortized cost if their term to maturity at purchase is 60 da ys or less, or by amortizing their unrealized appreciation or depreciation on the 61st day prior to maturity, if their term to maturity at purchase exceeds 60 days. |
| b) | Fair Value Measurements: The Fund follows a fair value hierarchy that distinguishes between market data obtained from independent sources (observable inputs) and the Fund’s own market assumptions (unobservable inputs). These inputs are used in determining the value of the Fund’s investments and are summarized in the following fair value hierarchy. |
NARRAGANSETT INSURED TAX-FREE INCOME FUND
NOTES TO FINANCIAL STATEMENTS (continued)
JUNE 30, 2010
Level 1 – Unadjusted quoted prices in active markets for identical assets or liabilities that the Fund has the ability to access.
Level 2 – Observable inputs other than quoted prices included in Level 1 that are observable for the asset or liability, either directly or indirectly. These inputs may include quoted prices for the identical instrument on an inactive market, prices for similar instruments, interest rates, prepayment speeds, credit risk, yield curves, default rates and similar data.
Level 3 – Unobservable inputs for the asset or liability, to the extent relevant observable inputs are not available, representing the Fund’s own assumptions about the assumptions a market participant would use in valuing the asset or liability, and would be based on the best information available.
The inputs or methodology used for valuing securities are not an indication of the risk associated with investing in those securities
The following is a summary of the valuation inputs, representing 100% of the Fund’s investments, used to value the Fund’s net assets as of June 30, 2010:
| Valuation Inputs | | | Investments in Securities | |
| Level 1 – Quoted Prices | | $ | — | |
| Level 2 – Other Significant Observable Inputs — | | | | |
| Municipal Bonds* | | | 221,322,664 | |
| Level 3 – Significant Unobservable Inputs | | | — | |
| Total | | $ | 221,322,664 | |
* See schedule of investments for a detailed listing of securities.
| c) | Subsequent events: In preparing these financial statements, the Fund has evaluated events and transactions for potential recognition or disclosure through the date these financial statements were issued. There were no events or transactions that occurred during the period that materially impacted the amounts or disclosures in the Fund’s financial statements. |
| d) | Securities transactions and related investment income: Securities transactions are recorded on the trade date. Realized gains and losses from securities transactions are reported on the identified cost basis. Interest income is recorded on the accrual basis and is adjusted for amortization of premium and accretion of original issue and market discount. |
| e) | Federal income taxes: It is the policy of the Fund to continue to qualify as a regulated investment company by complying with the provisions of the Internal Revenue Code applicable to certain investment companies. The Fund intends to make distributions of income and securities profits sufficient to relieve it from all, or substantially all, Federal income and excise taxes. |
Management has reviewed the tax positions for each of the open tax years (2007-2009) and has concluded that there are no significant uncertain tax positions that would require recognition in the financial statements
| f) | Multiple class allocations: All income, expenses (other than class-specific expenses), and realized and unrealized gains or losses are allocated daily to each class of shares based on the relative net assets of each class. Class-specific expenses, which include distribution and service fees and any other items that are specifically attributed to a particular class, are also charged directly to such class on a daily basis. |
NARRAGANSETT INSURED TAX-FREE INCOME FUND
NOTES TO FINANCIAL STATEMENTS (continued)
JUNE 30, 2010
| g) | Use of estimates: The preparation of financial statements in conformity with accounting principles generally accepted in the United States of America requires management to make estimates and assumptions that affect the reported amounts of assets and liabilities and disclosure of contingent assets and liabilities at the date of the financial statements and the reported amounts of increases and decreases in net assets from operations during the reporting period. Actual results could differ from those estimates. |
| h) | Accounting pronouncement: In January 2010, the Financial Accounting Standards Board (“FASB”) issued Accounting Standards Update “Improving Disclosures about Fair Value Measurements” (“ASU”). The ASU requires enhanced disclosures about a) transfers into and out of Levels 1 and 2, and b) purchases, sales, issuances, and settlements on a gross basis relating to Level 3 measurements. The first disclosure is effective for the first reporting period beginning after December 15, 2009, and for interim periods within those fiscal years. There were no significant transfers into and out of Levels 1 and 2 during the current period presented. |
The second disclosure will become effective for fiscal years beginning after December 15, 2010, and for interim periods within those fiscal years. Management is currently evaluating the impact this disclosure may have on the Fund’s financial statements.
3. Fees and Related Party Transactions
a) Management Arrangements:
Aquila Investment Management LLC (the “Manager”), a wholly-owned subsidiary of Aquila Management Corporation, the Fund’s founder and sponsor, serves as the Manager for the Fund under an Advisory and Administration Agreement with the Fund. The portfolio management of the Fund has been delegated to a Sub-Adviser as described below. Under the Advisory and Administration Agreement, the Manager provides all administrative services to the Fund, other than those relating to the day-to-day portfolio management. The Manager’s services include providing the office of the Fund and all related services as well as overseeing the activities of the Sub-Adviser and managing relationships with all the various support organizations to the Fund such as the shareholder servicing agent, custodian, legal counsel, fund accounting agent, auditor and distributor. For its services, the Manager is entitled to receive a fee which is payable monthly and computed as of the close of business each day at the annual rate of 0.50% on the Fund’s average net assets.
Citizens Investment Advisors, a department of RBS Citizens, N.A. (the “Sub-Adviser”), serves as the Investment Sub-Adviser for the Fund under a Sub-Advisory Agreement between the Manager and the Sub-Adviser. Under this agreement, the Sub-Adviser continuously provides, subject to oversight of the Manager and the Board of Trustees of the Fund, the investment program of the Fund and the composition of its portfolio, arranges for the purchases and sales of portfolio securities, and provides for daily pricing of the Fund’s portfolio. For its services, the Sub-Adviser is entitled to receive a fee from the Manager which is payable monthly and computed as of the close of business each day at the annual rate of 0.23% on the Fund’s average net assets.
NARRAGANSETT INSURED TAX-FREE INCOME FUND
NOTES TO FINANCIAL STATEMENTS (continued)
JUNE 30, 2010
For the year ended June 30, 2010, the Fund incurred management fees of $1,057,155 of which $598,503 was waived. The Manager has contractually undertaken to waive fees and/or reimburse Fund expenses during the period July 1, 2009 through October 31, 2010 so that total Fund expenses would not exceed 0.82% for Class A Shares, 1.67% for Class C Shares, 1.00% for Class I Shares or 0.67% for Class Y Shares. A similar contractual undertaking is expected to be in place through the period ended October 31, 2011.
Under a Compliance Agreement with the Manager, the Manager is compensated for Chief Compliance Officer related services provided to enable the Fund to comply with Rule 38a-1 of the Investment Company Act of 1940.
Specific details as to the nature and extent of the services provided by the Manager and the Sub-Adviser are more fully defined in the Fund’s Prospectus and Statement of Additional Information. b) Distribution and Service Fees:
The Fund has adopted a Distribution Plan (the “Plan”) pursuant to Rule 12b-1 (the “Rule”) under the Investment Company Act of 1940. Under one part of the Plan, with respect to Class A Shares, the Fund is authorized to make distribution fee payments to broker-dealers or others (“Qualified Recipients”) selected by Aquila Distributors, Inc. (“the Distributor”), including, but not limited to, any principal underwriter of the Fund with which the Distributor has entered into written agreements contemplated by the Rule and which have rendered assistance in the distribution and/or retention of the Fund’s shares or servicing of shareholder accounts. The Fund makes payment of this distribution fee at the annual rate of 0.15% of the Fund’s average net assets represented by Class A Shares. For the year ended June 30, 2010, distribution fees on Class A Shares amounted to $214,276, of which the Distributor retained $5,146.
Under another part of the Plan, the Fund is authorized to make payments with respect to Class C Shares to Qualified Recipients which have rendered assistance in the distribution and/or retention of the Fund’s Class C Shares or servicing of shareholder accounts. These payments are made at the annual rate of 0.75% of the Fund’s average net assets represented by Class C Shares and for the year ended June 30, 2010, amounted to $128,419. In addition, under a Shareholder Services Plan, the Fund is authorized to make service fee payments with respect to Class C Shares to Qualified Recipients for providing personal services and/or maintenance of shareholder accounts. These payments are made at the annual rate of 0.25% of the Fund’s average net assets represented by Class C Shares and for the year ended June 30, 2010, amounted to $42,807. The total of these payments with respect to Class C Shares amounted to $171,226, of which the Distributor retained $25,156.
Under another part of the Plan, the Fund is authorized to make payments with respect to Class I Shares to Qualified Recipients. Class I payments, under the Plan, may not exceed, for any fiscal year of the Fund a rate (currently 0.20%) set from time to time by the Board of Trustees of not more than 0.25% of the average annual net assets represented by the Class I Shares. In addition, the Fund has a Shareholder Services Plan under which it may pay service fees (currently 0.15%) of not more than 0.25% of the average annual net assets of the Fund represented by Class I Shares. That is, the total payments under both plans will not exceed 0.50% of such net assets. For the year ended June 30, 2010, these payments were made at the average annual rate of 0.35% of such net assets amounting to $958 of which $548 related to the Plan and $410 related to the Shareholder Services Plan.
NARRAGANSETT INSURED TAX-FREE INCOME FUND
NOTES TO FINANCIAL STATEMENTS (continued)
JUNE 30, 2010
Specific details about the Plans are more fully defined in the Fund’s Prospectus and Statement of Additional Information.
Under a Distribution Agreement, the Distributor serves as the exclusive distributor of the Fund’s shares. Through agreements between the Distributor and various brokerage and advisory firms (“intermediaries”), the Fund’s shares are sold primarily through the facilities of intermediaries having offices within Rhode Island, with the bulk of any sales commissions inuring to such intermediaries. For the year ended June 30, 2010, total commissions on sales of Class A Shares amounted to $567,789, of which the Distributor received $48,538.
c) Other Related Party Transactions:
For the year ended June 30, 2010, the Fund incurred $88,944 of legal fees allocable to Butzel Long PC, counsel to the Fund, for legal services in conjunction with the Fund’s ongoing operations. The Secretary of the Fund is Of Counsel to that firm.
4. Purchases and Sales of Securities
During the year ended June 30, 2010, purchases of securities and proceeds from the sales of securities aggregated $31,505,711 and $7,101,831, respectively.
At June 30, 2010, the aggregate tax cost for all securities was $214,038,191. At June 30, 2010, the aggregate gross unrealized appreciation for all securities in which there is an excess of value over tax cost amounted to $7,412,370 and aggregate gross unrealized depreciation for all securities in which there is an excess of tax cost over value amounted to $127,897 for a net unrealized appreciation of $7,284,473.
5. Portfolio Orientation
Since the Fund invests principally and may invest entirely in double tax-free municipal obligations of issuers within Rhode Island, it is subject to possible risks associated with economic, political, or legal developments or industrial or regional matters specifically affecting Rhode Island and whatever effects these may have upon Rhode Island issuers’ ability to meet their obligations. However, to mitigate against such risks, the Fund has chosen to have at least 80% of net assets and possibly the entire portfolio insured as to timely payment of principal and interest when due by nationally prominent municipal bond insurance companies. At June 30, 2010, the Fund had 97% of its net assets invested in securities that were insured. While such insurance protects against credit risks with portfolio secur ities, it does not insure against market risk of fluctuations in the Fund’s share price and income return (see note 12).
The Fund is also permitted to invest in U.S. territorial municipal obligations meeting comparable quality standards and providing income which is exempt from both regular Federal and Rhode Island income taxes. The general policy of the Fund is to invest in such securities only when comparable securities of Rhode Island issuers are not available in the market. At June 30, 2010, the Fund had all of its net assets invested in Rhode Island municipal issues.
NARRAGANSETT INSURED TAX-FREE INCOME FUND
NOTES TO FINANCIAL STATEMENTS (continued)
JUNE 30, 2010
6. Expenses
The Fund has negotiated an expense offset arrangement with its custodian wherein it receives credit toward the reduction of custodian fees and other Fund expenses whenever there are uninvested cash balances. The Statement of Operations reflects the total expenses before any offset, the amount of offset and the net expenses.
| 7. Capital Share Transactions | |
| | |
| Transactions in Capital Shares of the Fund were as follows: | |
| | |
| | | Year Ended | | | Year Ended | |
| | | June 30, 2010 | | | June 30, 2009 | |
| | | Shares | | | Amount | | | Shares | | | Amount | |
| Class A Shares: | | | | | | | | | | | | |
| Proceeds from shares sold | | | 2,304,233 | | | $ | 24,438,632 | | | | 1,706,352 | | | $ | 17,704,511 | |
| Shares issued in acquisition* | | | – | | | | – | | | | 1,856,329 | | | | 18,325,315 | |
| Reinvested distributions | | | 276,834 | | | | 2,935,287 | | | | 251,861 | | | | 2,620,356 | |
| Cost of shares redeemed | | | (1,243,581 | ) | | | (13,220,381 | ) | | | (1,113,426 | ) | | | (11,518,205 | ) |
| Net change | | | 1,337,486 | | | | 14,153,538 | | | | 2,701,116 | | | | 27,131,977 | |
| Class C Shares: | | | | | | | | | | | | | | | | |
| Proceeds from shares sold | | | 1,204,217 | | | | 12,757,795 | | | | 391,685 | | | | 4,081,253 | |
| Reinvested distributions | | | 23,427 | | | | 248,476 | | | | 12,753 | | | | 132,607 | |
| Cost of shares redeemed | | | (262,836 | ) | | | (2,785,279 | ) | | | (347,338 | ) | | | (3,595,851 | ) |
| Net change | | | 964,808 | | | | 10,220,992 | | | | 57,100 | | | | 618,009 | |
| Class I Shares: | | | | | | | | | | | | | | | | |
| Proceeds from shares sold | | | 4 | | | | 40 | | | | – | | | | – | |
| Reinvested distributions | | | 907 | | | | 9,617 | | | | 1,064 | | | | 11,043 | |
| Cost of shares redeemed | | | (694 | ) | | | (7,361 | ) | | | (27,004 | ) | | | (282,093 | ) |
| Net change | | | 217 | | | | 2,296 | | | | (25,940 | ) | | | (271,050 | ) |
| Class Y Shares: | | | | | | | | | | | | | | | | |
| Proceeds from shares sold | | | 1,157,925 | | | | 12,288,590 | | | | 1,285,732 | | | | 13,201,767 | |
| Reinvested distributions | | | 36,406 | | | | 386,245 | | | | 29,805 | | | | 309,556 | |
| Cost of shares redeemed | | | (1,080,774 | ) | | | (11,451,795 | ) | | | (902,759 | ) | | | (9,319,247 | ) |
| Net change | | | 113,557 | | | | 1,223,040 | | | | 412,778 | | | | 4,192,076 | |
| Total transactions in Fund | | | | | | | | | | | | | | | | |
| shares | | | 2,416,068 | | | $ | 25,599,866 | | | | 3,145,054 | | | $ | 31,671,012 | |
* See note 11.
NARRAGANSETT INSURED TAX-FREE INCOME FUND
NOTES TO FINANCIAL STATEMENTS (continued)
JUNE 30, 2010
8. Trustees’ Fees and Expenses
At June 30, 2010 there were 8 Trustees, one of whom is affiliated with the Manager and is not paid any fees. The total amount of Trustees’ service fees (for carrying out their responsibilities) and attendance fees paid during the year ended June 30, 2010 was $88,060. Attendance fees are paid to those in attendance at regularly scheduled quarterly Board Meetings and meetings of the Independent Trustees held prior to each quarterly Board Meeting, as well as additional meetings (Audit, Nominating, Shareholder and special meetings). Trustees are reimbursed for their expenses such as travel, accommodations, and meals incurred in connection with attendance at Board Meetings and the Annual Meeting of Shareholders. For the year ended June 30, 2010, such meeting-related expenses amounted to $20,085.
9. Securities Traded on a When-Issued Basis
The Fund may purchase or sell securities on a when-issued basis. When-issued transactions arise when securities are purchased or sold by the Fund with payment and delivery taking place in the future in order to secure what is considered to be an advantageous price and yield to the Fund at the time of entering into the transaction. Beginning on the date the Fund enters into a when-issued transaction, cash or other liquid securities are segregated in an amount equal to or greater than the value of the when-issued transaction. These transactions are subject to market fluctuations and their current value is determined in the same manner as for other securities.
10. Income Tax Information and Distributions
The Fund declares dividends daily from net investment income and makes payments monthly. Net realized capital gains, if any, are distributed annually and are taxable. These distributions are paid in additional shares at the net asset value per share, in cash, or in a combination of both, at the shareholder’s option.
The Fund intends to maintain, to the maximum extent possible, the tax-exempt status of interest payments received from portfolio municipal securities in order to allow dividends paid to shareholders from net investment income to be exempt from regular Federal and State of Rhode Island income taxes. However, due to differences between financial statement reporting and Federal income tax reporting requirements, distributions made by the Fund may not be the same as the Fund’s net investment income, and/or net realized securities gains. In this regard, the Fund decreased distributions in excess of net investment income in the amount of $340 and increased accumulated realized loss in the amount of $340 at June 30, 2010. This adjustment had no impact on the Fund’s aggregate net assets at June 30, 201 0. Further, a small portion of the dividends may, under some circumstances, be subject to taxes at ordinary income rates.
At June 30, 2010, the Fund had a capital loss carryover of $559,995 of which $116,837 expires on June 30, 2015 and $443,158 expires on June 30, 2016. The Fund acquired $468,864 capital loss carryover related to the acquisition of Ocean State Tax-Exempt Fund. This carryover is available to offset future net realized gains on securities transactions to the extent provided for in the Internal Revenue Code. To the extent that this loss is used to offset future realized capital gains, it is probable the gains so offset will not be distributed.
NARRAGANSETT INSURED TAX-FREE INCOME FUND
NOTES TO FINANCIAL STATEMENTS (continued)
JUNE 30, 2010
| | Tax character of distributions: | |
| | | |
| | | | Year Ended June 30, | |
| | | | 2010 | | | 2009 | |
| | Net tax-exempt income | | $ | 7,655,881 | | | $ | 6,771,698 | |
| | Ordinary income | | | – | | | | 90,370 | |
| | | | $ | 7,655,881 | | | $ | 6,862,068 | |
As of June 30, 2010, the components of distributable earnings on a tax basis were as follows:
| | Undistributed tax-exempt income | | $ | 159,674 | | |
| | Accumulated net realized loss | | | (559,995 | ) | |
| | Unrealized appreciation | | | 7,284,474 | | |
| | Other temporary differences | | | (296,765 | ) | |
| | | | $ | 6,587,388 | | |
The difference between book basis and tax basis unrealized appreciation is attributable primarily to premium/discount adjustments. The difference between book basis and tax basis undistributed income is due to the timing difference in recognizing dividends paid.
11. Transfer of Net Assets Transaction
On October 17, 2008, the Fund acquired the assets and liabilities of Ocean State Tax-Exempt Fund (“Ocean State”) pursuant to an agreement and plan of reorganization approved by the shareholders of Ocean State. Total shares issued by the Fund and total net assets of Ocean State and the Fund on the date of the transfer were as follows:
| | | Shares Issued by | | Total Nets Assets | | Total Net Assets |
| Acquired Fund | | the Fund | | of Ocean State | | of the Fund |
| Ocean State | | 1,856,329 | | $18,325,315 | | $176,365,957 |
The total net assets of the Ocean State portfolio before acquisition included unrealized appreciation of $133,026 and accumulated net realized loss of $468,864. Total net assets of the Fund immediately after the transfer were $194,691,272. The transaction was structured to qualify as a tax-free reorganization under the Internal Revenue Code of 1986, as amended.
12. Ongoing Development
The three major rating agencies (Standard & Poor’s, Moody’s and Fitch) have downgraded or eliminated ratings of the majority of the municipal bond insurance companies since December 2007 due to loss of capital from investments in subprime mortgages. As such, only the ratings of Assured Guaranty Municipal Corp. (formerly FSA) and National Public Finance (formerly MBIA) are now deemed to be investment grade. Some insurance companies, such as AMBAC, have had their ratings withdrawn by the rating agencies. Thus while certain bonds still have insurance, they are no longer rated based upon the ratings of their issuers.
| NARRAGANSETT INSURED TAX-FREE INCOME FUND |
| FINANCIAL HIGHLIGHTS |
For a share outstanding throughout each period
See accompanying notes to financial statements.