Exhibit 99.1
1Q 2019 Earnings Release April 24, 2019 posco
1Q 2019 Earnings Release â”, April 24, 2019 Disclaimer This presentation was prepared and circulated to release the informations regarding the company’s business performance to shareholders and investors prior to the completion of auditing for the period of the first quarter of 2019. As figures in this presentation are based on unaudited financial statements, certain contents may be subject to modification in the course of auditing process. This presentation contains certain forward-looking statements relating to the business, financial performance and results of thecompany and/or the industry in which it operates. The forward-looking statements set forth herein concern future circumstances and results and other statements that not historical facts, and are solely opinions and forecasts which are uncertain and subject to risks. Therefore, the recipients of this presentation shall be aware of that the forward-looking statements set forth herein may not correspond to the actual business performance of the company due to changes and risks in business environments and conditions. The sole purpose of this presentation is to assist persons in deciding whether they wish to proceed with certain investments to the company. The company does not make any representation or warranty, expressly or impliedly, as to the accuracy and completeness of this presentation or of the information contained herein and shall not have any liability for the informations contained in this presentation.
1Q 2019 Earnings Release â”, April 24, 2019 Contents 1Q 2019Business Performance 2019 Business Plan Appendix
1Q 2019 Business Performance —Parent Performance—Consolidated Performance—Subsidiary Performance 1Q 2019 Earnings Release â”, April 24, 2019
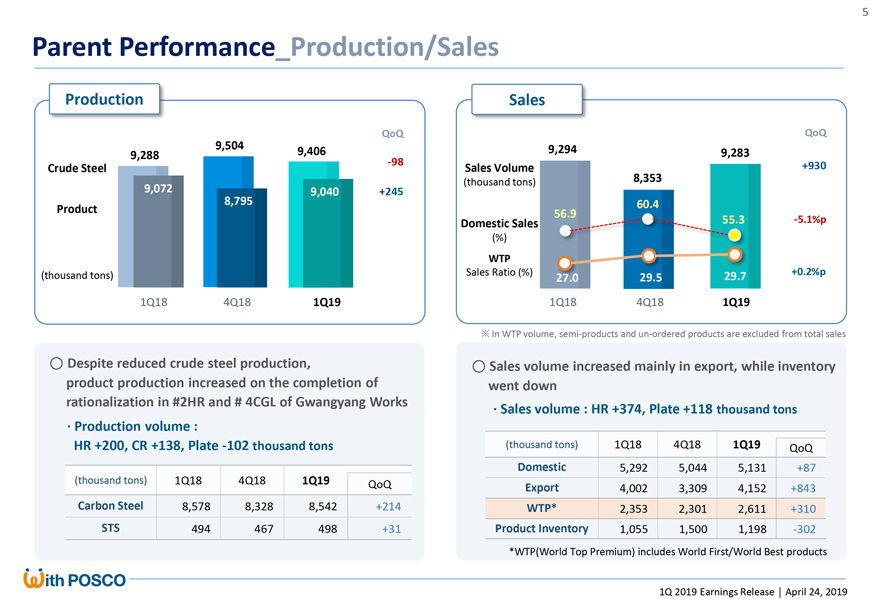
Parent Performance_Production/Sales Production Sales QoQ QoQ 9,504 9,294 9,288 9,406 9,283-98 +930 Crude Steel Sales Volume (thousand tons) 8,353 9,072 9,040 +245 8,795 60.4 Product 56.9 Domestic Sales .3-5.1%p (%) WTP (thousand tons) Sales Ratio (%) 29.7 +0.2%p 29.5 1Q18 4Q18 1Q19 1Q18 4Q18 1Q19 ? In WTP volume, semi-products andun-ordered products are excluded from total sales â—‹ Despite reduced crude steel production, â—‹ Sales volume increased mainly in export, while inventory product production increased on the completion of went down rationalization in #2HR and # 4CGL of Gwangyang Works ·Sales volume : HR +374, Plate +118 thousand tons ·Production volume : HR +200, CR +138, Plate-102 thousand tons (thousand tons) 1Q18 4Q18 1Q19 QoQ Domestic 5,292 5,044 5,131 +87 (thousand tons) 1Q18 4Q18 1Q19 QoQ Export 4,002 3,309 4,152 +843 Carbon Steel 8,578 8,328 8,542 +214 WTP* 2,353 2,301 2,611 +310 STS 494 467 498 +31 Product Inventory 1,055 1,500 1,198-302 *WTP(World Top Premium) includes World First/World Best products 1Q 2019 Earnings Release â”, April 24, 2019
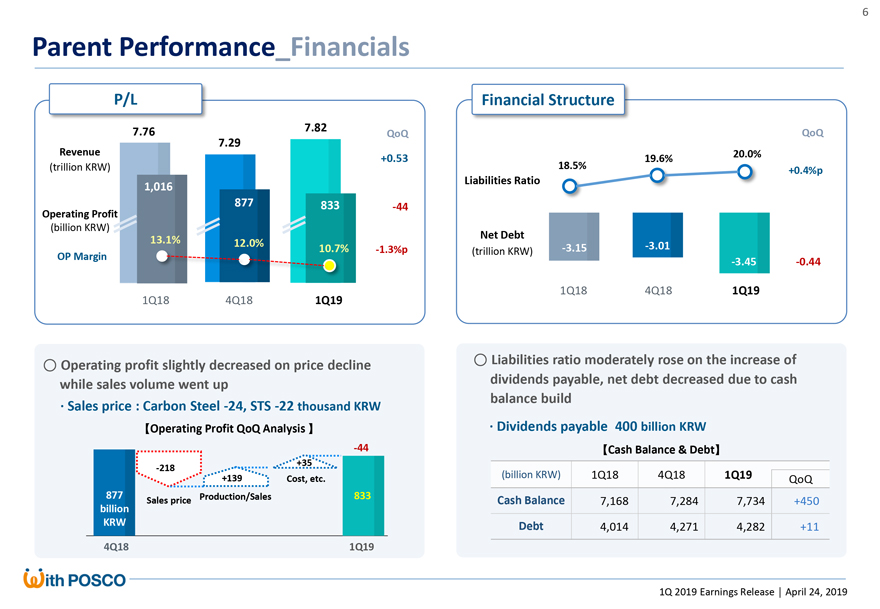
1Q 2019 Earnings Release â”, April 24, 2019 Parent Performance_Financials P/L Financial Structure â—‹Liabilities ratio moderately rose on the increase of dividends payable, net debt decreased due to cash balance build-3.01-3.45 7.76 7.29 7.82 Revenue Operating Profit (billion KRW) 18.5% 19.6% 20.0% 1Q18 4Q18 1Q19 1,016 877 833 +0.53 â—‹Operating profit slightly decreased on price declinewhile sales volume went up 13.1% 12.0% 10.7% OP Margin ·Sales price: Carbon Steel-24, STS-22 thousand KRW +139-44 Production/Sales-218 Sales price Cost, etc. +35 833 877 billion KRW 4Q18 1Q19-44-3.15 1Q18 4Q18 1Q19 Liabilities Ratio Net Debt(billion KRW) 1Q18 4Q181Q19 QoQ CashBalance7,1687,2847,734+450 Debt4,0144,2714,282+11
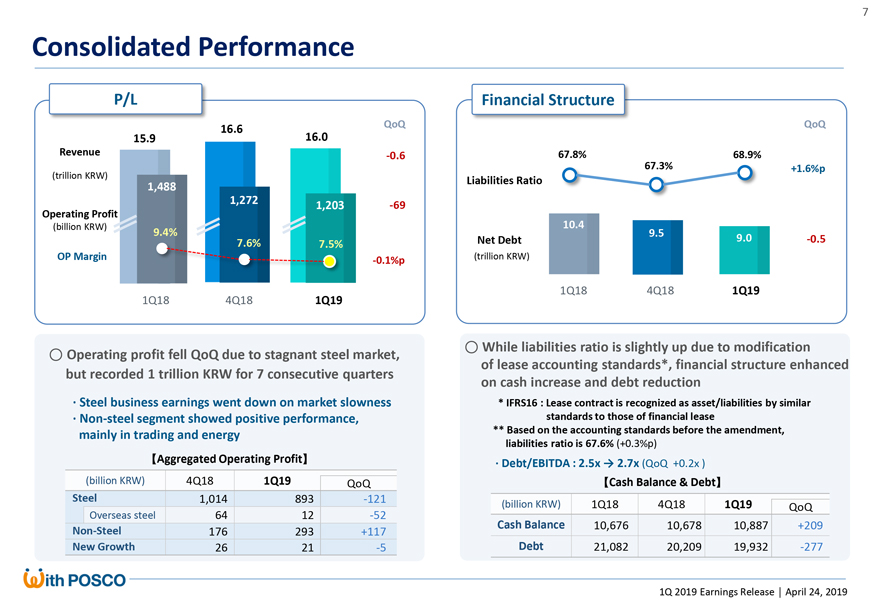
1Q 2019 Earnings Release â”, April 24, 2019 9.5 9.0 15.9 16.6 16.0 67.8% 67.3% 68.9% 1Q18 4Q18 1Q19 1,488 1,272 1,203-0.6 9.4% 7.6% 7.5%-69 10.4 Net Debt Consolidated Performance â—‹While liabilities ratio is slightly up due to modification of lease accounting standards*, financial structure enhanced on cash increase anddebt reduction â—‹Operating profit fell QoQ due to stagnant steel market,but recorded 1 trillion KRW for 7 consecutive quarters ·Steel business earnings went down on market slowness·Non-steel segment showed positive performance, mainly in trading and energy * IFRS16 : Lease contract is recognized as asset/liabilities by similar standards to those of financial lease ** Based on the accounting standards before the amendment, liabilities ratio is 67.6% (+0.3%p) Cash Balance & Debt (billion KRW) 1Q18 4Q181Q19 QoQ CashBalance 10,676 10,67810,887+209 Debt 21,082 20,20919,932-277
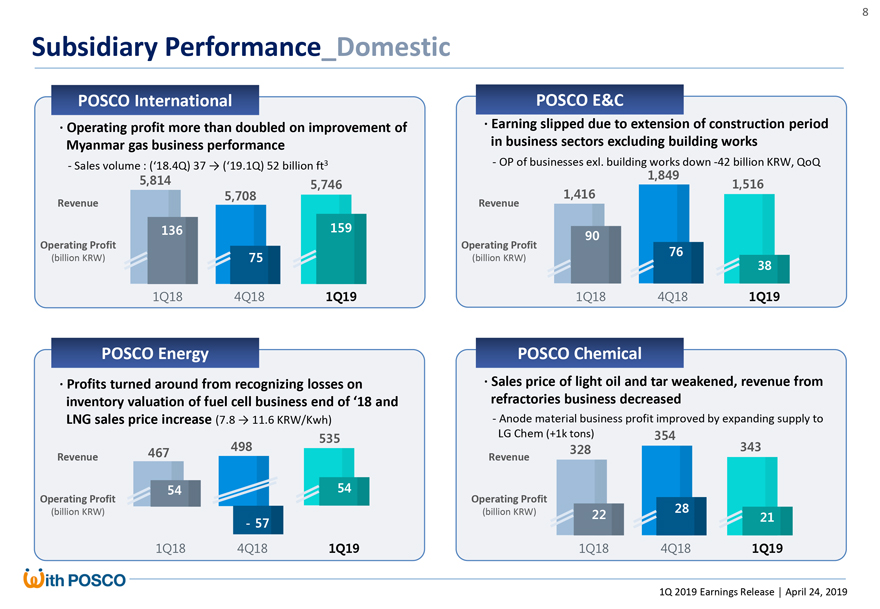
1Q 2019 Earnings Release â”, April 24, 2019 Subsidiary Performance_Domestic POSCO E&C POSCO International POSCO Energy POSCO Chemical · Operatingprofit more than doubled on improvement of Myanmar gas business performance -Sales volume : (‘18.4Q) 37 → (‘19.1Q) 52 billion ft3 Revenue Operating Profit (billion KRW) 5,814 5,708 5,746 1Q18 4Q18 1Q19 136 75 159 1,416 1,849 1,516 1Q18 4Q18 1Q19 90 76 38 328 354 343 1Q18 4Q18 1Q19 22 28 21 · Earning slipped due to extension of construction periodin business sectors excluding building works-OP of businesses exl. building works down-42 billion KRW, QoQ · Profits turned around from recognizing losses on inventory valuation of fuel cell business end of ‘18 and LNG sales price increase (7.8 → 11.6 KRW/Kwh) · Sales price of light oiland tar weakened, revenue from refractories business decreased -Anode material business profit improved by expanding supply toLG Chem (+1k tons) 467 498 535 1Q18 4Q18 1Q19 54-57 54 Revenue Operating Profit (billion KRW) Revenue Operating Profit (billion KRW) Revenue Operating Profit (billion KRW) 8
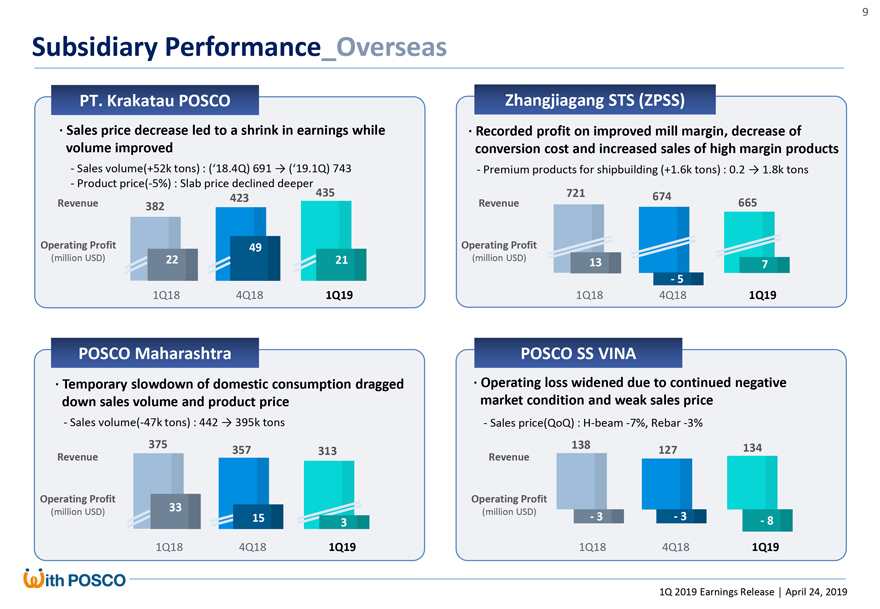
1Q 2019 Earnings Release â”, April 24, 2019 Subsidiary Performance_Overseas ZhangjiagangSTS (ZPSS) PT. Krakatau POSCO POSCO Maharashtra POSCO SS VINA · Sales price decrease led to a shrink in earnings whilevolume improved -Sales volume(+52k tons): (‘18.4Q) 691 → (‘19.1Q)743-Productprice(-5%): Slab price declined deeper · Temporary slowdown of domestic consumption draggeddownsales volume and product price -Salesvolume(-47k tons) : 442 → 395k tons · Recorded profit on improved mill margin, decrease of conversion cost and increased sales of high margin products -Premium products for shipbuilding (+1.6k tons) : 0.2 → 1.8k tons · Operating loss widened due to continued negative market condition and weak sales price -Sales price(QoQ) :H-beam-7%, Rebar-3% 382 423 435 1Q18 4Q18 1Q19 22 49 21 138 127 134 1Q18 4Q18 1Q19-3-3-8 375 357 313 1Q18 4Q18 1Q19 33 15 3 721 674 665 1Q18 4Q18 1Q19-5 7 13 Revenue Operating Profit (million USD) Revenue Operating Profit (million USD) Revenue Operating Profit (million USD) Revenue Operating Profit (million USD) 9
1Q 2019 Earnings Release â”, April 24, 2019 2019 Business Plan
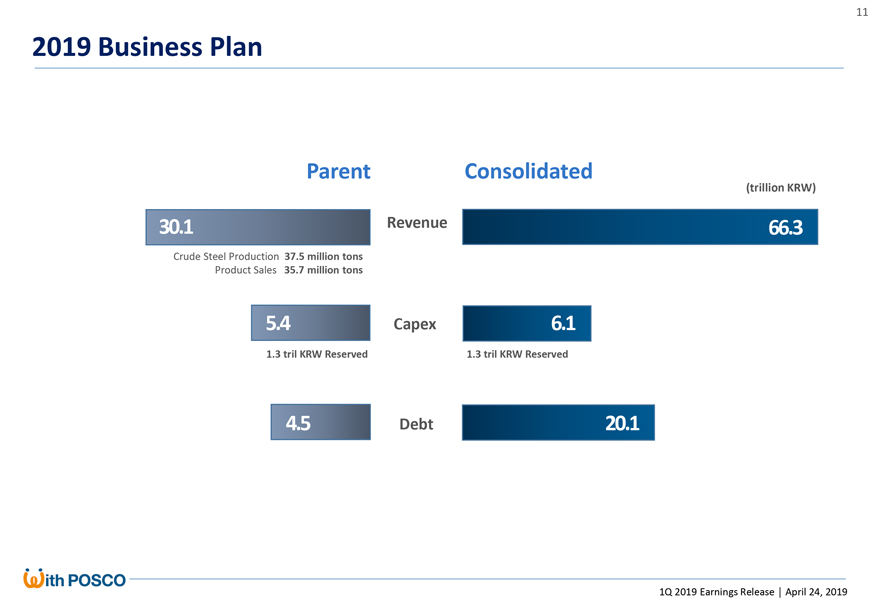
1Q 2019 Earnings Release â”, April 24, 2019 2019 Business Plan Parent Consolidated Revenue Crude Steel Production 37.5 million tons Product Sales 35.7 million tons 30.1 5.4 4.5 6.1 20.1 66.3 1.3 tril KRW Reserved (trillion KRW) Capex Debt 1.3 tril KRW Reserved 11
1Q 2019 Earnings Release â”, April 24, 2019 ?Appendix Market & Outlook Summarized F/S Parent ï,§Summarized F/S_Consolidated -Global Steel Demand -Domestic Steel Demand-Raw Materials Outlook
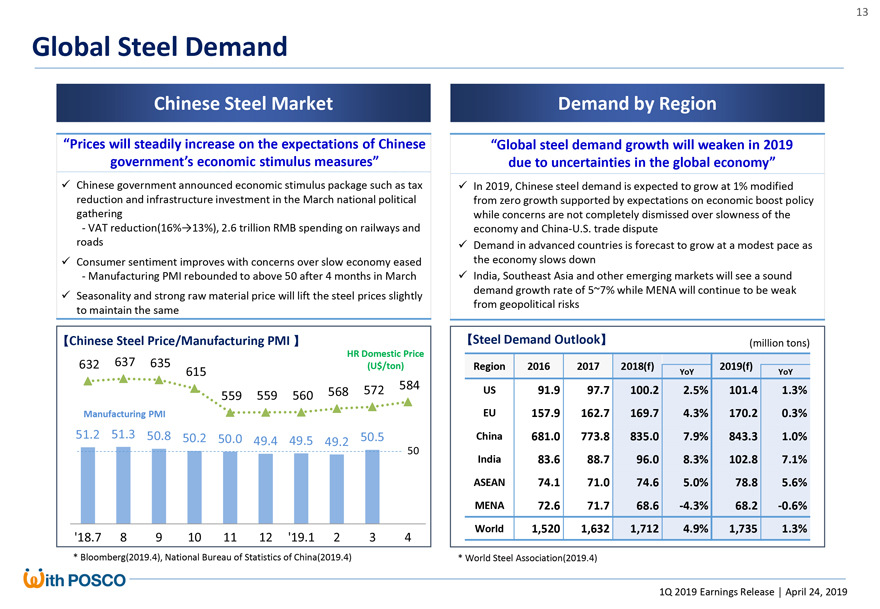
1Q 2019 Earnings Release â”, April 24, 2019 Global Steel Demand Chinese Steel Market Demand by Region “Prices will steadily increase on the expectations of Chinese government’s economic stimulus measures” “Global steel demand growth will weaken in 2019 due to uncertainties in the global economy” * Bloomberg(2019.4), National Bureau of Statistics of China(2019.4) (million tons) * World Steel Association(2019.4) Region 2016 2017 2018(f) 2019(f) YoY YoY US 91.9 97.7 100.2 2.5% 101.4 1.3% EU 157.9 162.7 169.7 4.3% 170.2 0.3% China 681.0 773.8 835.0 7.9% 843.3 1.0% India 83.6 88.7 96.0 8.3% 102.8 7.1% ASEAN 74.1 71.0 74.6 5.0% 78.8 5.6% MENA 72.6 71.7 68.6 -4.3% 68.2 -0.6% World 1,520 1,632 1,712 4.9% 1,735 1.3%
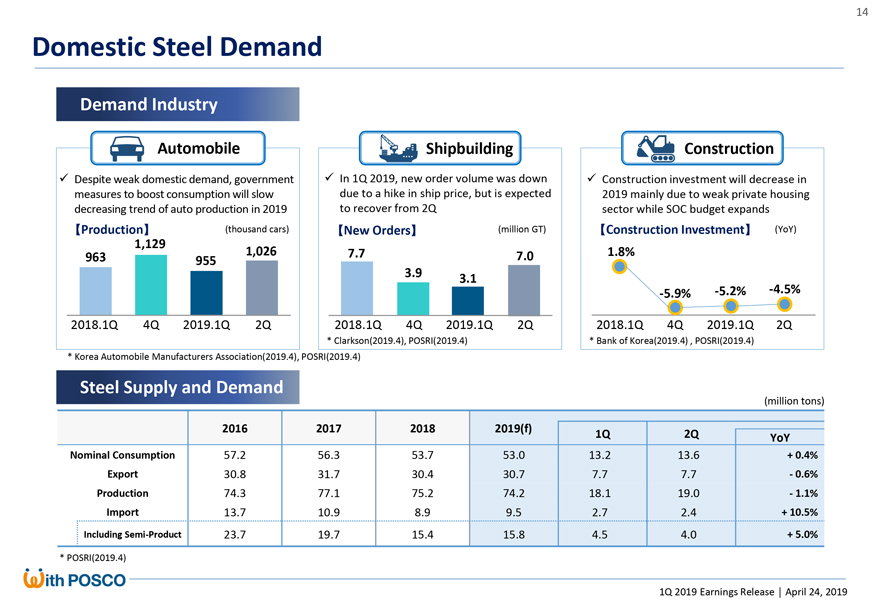
1Q 2019 Earnings Release â”, April 24, 2019 Domestic Steel Demand Demand Industry Steel Supply and Demand (million tons) Shipbuilding Construction Automobile In 1Q 2019, new order volume was down due to ahike in ship price, but is expected to recover from 2Q Construction investment will decrease in 2019 mainly due to weak private housing sector whileSOC budget expands * Korea Automobile Manufacturers Association(2019.4), POSRI(2019.4) * Clarkson(2019.4), POSRI(2019.4) * Bank of Korea(2019.4) , POSRI(2019.4) Despite weak domestic demand, government measures to boost consumption will slow decreasing trend of auto production in 2019 Production (thousand cars) New Orders (million GT) 7.0 7.7 3.9 3.1 1.8%-5.9%-5.2% 【Construction Investment (YoY)-4.5% 963 1,129 955 1,026 2018.1Q 4Q 2019.1Q 2Q 2018.1Q 4Q 2019.1Q 2Q 2018.1Q 4Q 2019.1Q 2Q * POSRI(2019.4)2016 2017 20182019(f) 1Q2Q YoY NominalConsumption57.256.353.753.013.213.6+ 0.4% Export30.831.730.430.77.77.7-0.6% Production74.377.175.274.218.119.0-1.1% Import13.710.98.99.52.72.4+ 10.5% Including Semi-Product23.719.715.415.84.54.0+ 5.0%
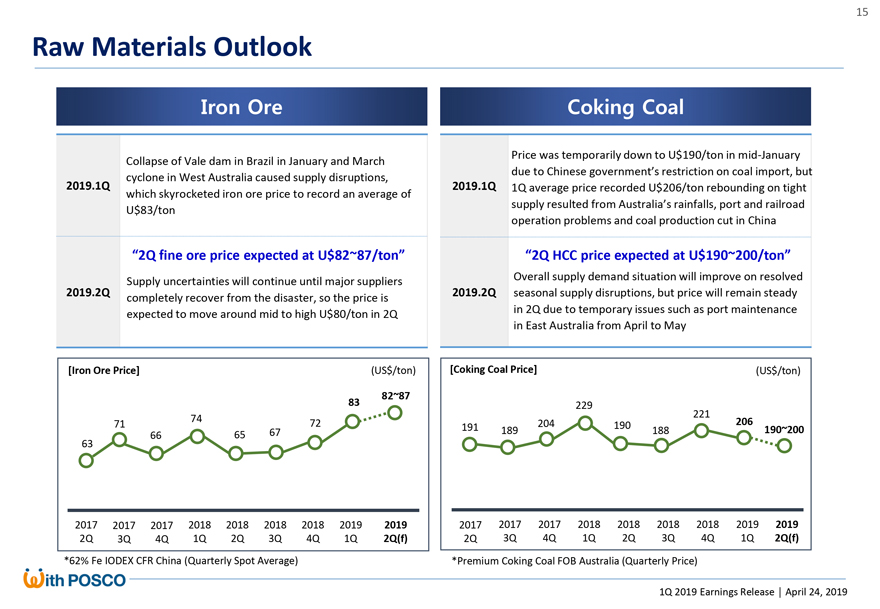
Raw Materials Outlook Iron Ore Collapse of Vale dam in Brazil in January and March cyclone in West Australia caused supply disruptions, 2019.1Q which skyrocketed iron ore price to record an average of U$83/ton “2Q fine ore price expected at U$82~87/ton” Supply uncertainties will continue until major suppliers 2019.2Q completely recover from the disaster, so the price is expected to move around mid to high U$80/ton in 2Q Coking Coal Price was temporarily down to U$190/ton inmid-January due to Chinese government’s restriction on coal import, but 2019.1Q 1Q average price recorded U$206/ton rebounding on tight supply resulted from Australia’s rainfalls, port and railroad operation problems and coal production cut in China “2Q HCC price expected at U$190~200/ton” Overall supply demand situation will improve on resolved 2019.2Q seasonal supply disruptions, but price will remain steady in 2Q due to temporary issues such as port maintenance in East Australia from April to May [Iron Ore Price] (US$/ton) [Coking Coal Price] (US$/ton) 82~87 83 229 221 74 206 71 72 191 204 190 67 189 188 190~200 63 66 65 2017 2017 2017 2018 2018 2018 2018 2019 2019 2017 2017 2017 2018 2018 2018 2018 2019 2019 2Q 3Q 4Q 1Q 2Q 3Q 4Q 1Q 2Q(f) 2Q 3Q 4Q 1Q 2Q 3Q 4Q 1Q 2Q(f) *62% Fe IODEX CFR China (Quarterly Spot Average) *Premium Coking Coal FOB Australia (Quarterly Price) 1Q 2019 Earnings Release â”, April 24, 2019
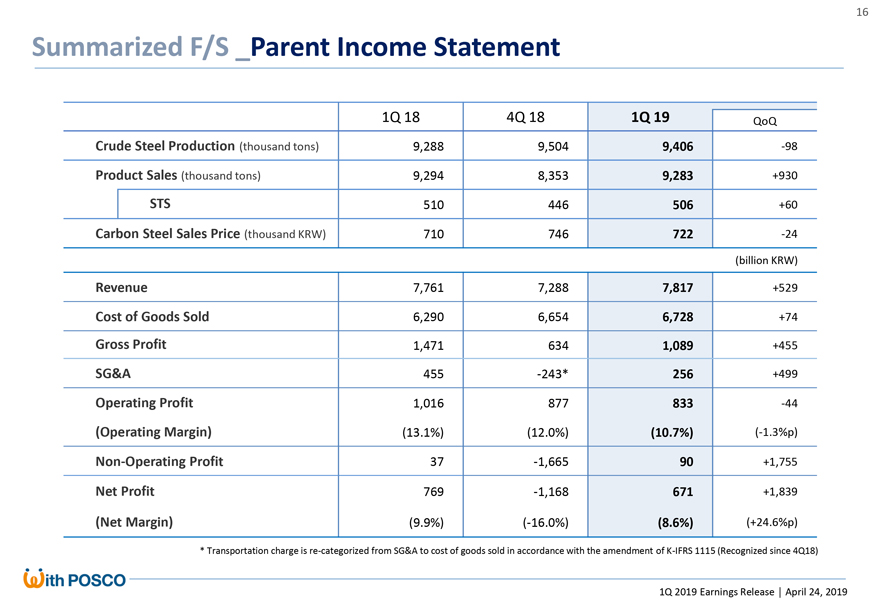
Summarized F/S _Parent Income Statement 1Q 18 4Q 18 1Q 19 QoQ Crude Steel Production (thousand tons) 9,288 9,504 9,406-98 Product Sales (thousand tons) 9,294 8,353 9,283 +930 STS 510 446 506 +60 Carbon Steel Sales Price (thousand KRW) 710 746 722-24 (billion KRW) Revenue 7,761 7,288 7,817 +529 Cost of Goods Sold 6,290 6,654 6,728 +74 Gross Profit 1,471 634 1,089 +455 SG&A 455-243* 256 +499 Operating Profit 1,016 877 833-44 (Operating Margin) (13.1%) (12.0%) (10.7%)(-1.3%p)Non-Operating Profit 37-1,665 90 +1,755 Net Profit 769-1,168 671 +1,839 (Net Margin) (9.9%)(-16.0%) (8.6%) (+24.6%p) * Transportation charge isre-categorized from SG&A to cost of goods sold in accordance with the amendment ofK-IFRS 1115 (Recognized since 4Q18) 1Q 2019 Earnings Release â”, April 24, 2019
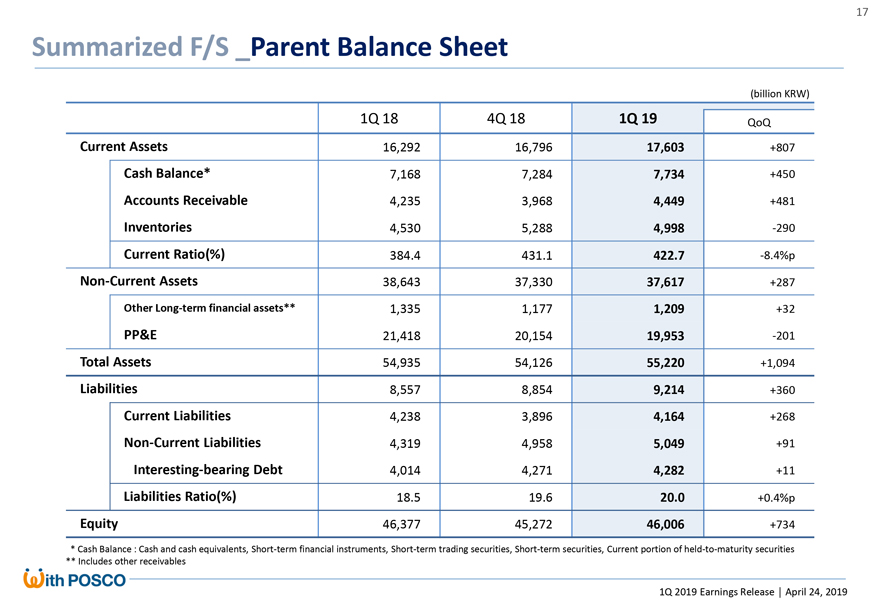
Summarized F/S _Parent Balance Sheet (billion KRW) 1Q 18 4Q 18 1Q 19 QoQ Current Assets 16,292 16,796 17,603 +807 Cash Balance* 7,168 7,284 7,734 +450 Accounts Receivable 4,235 3,968 4,449 +481 Inventories 4,530 5,288 4,998-290 Current Ratio(%) 384.4 431.1 422.7-8.4%pNon-Current Assets 38,643 37,330 37,617 +287 Other Long-term financial assets** 1,335 1,177 1,209 +32 PP&E 21,418 20,154 19,953-201 Total Assets 54,935 54,126 55,220 +1,094 Liabilities 8,557 8,854 9,214 +360 Current Liabilities 4,238 3,896 4,164 +268Non-Current Liabilities 4,319 4,958 5,049 +91 Interesting-bearing Debt 4,014 4,271 4,282 +11 Liabilities Ratio(%) 18.5 19.6 20.0 +0.4%p Equity 46,377 45,272 46,006 +734 * Cash Balance : Cash and cash equivalents, Short-term financial instruments, Short-term trading securities, Short-term securities, Current portion ofheld-to-maturity securities ** Includes other receivables 1Q 2019 Earnings Release â”, April 24, 2019
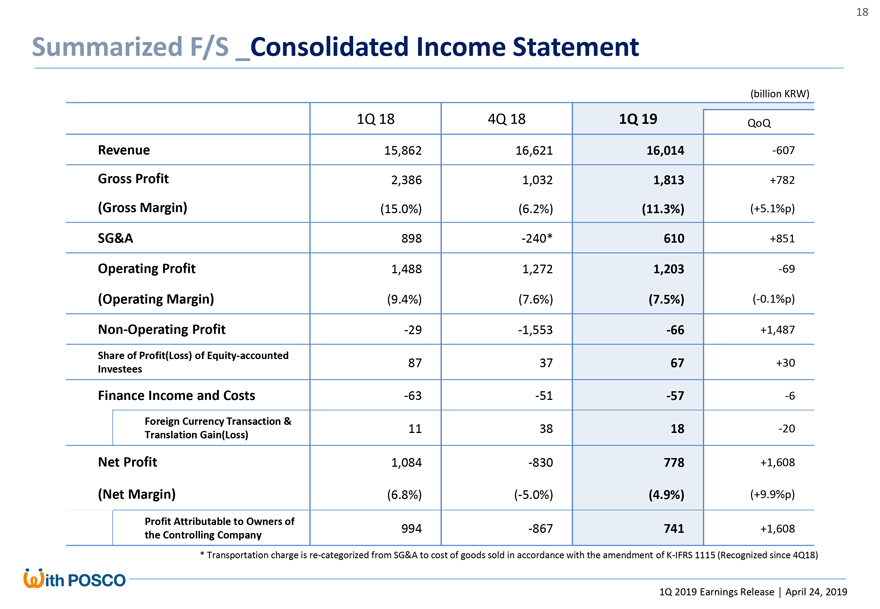
Summarized F/S _Consolidated Income Statement (billion KRW) 1Q 18 4Q 18 1Q 19 QoQ Revenue 15,862 16,621 16,014-607 Gross Profit 2,386 1,032 1,813 +782 (Gross Margin) (15.0%) (6.2%) (11.3%) (+5.1%p) SG&A 898-240* 610 +851 Operating Profit 1,488 1,272 1,203-69 (Operating Margin) (9.4%) (7.6%) (7.5%)(-0.1%p)Non-Operating Profit-29-1,553-66 +1,487 Share of Profit(Loss) of Equity-accounted 87 37 67 +30 Investees Finance Income and Costs-63-51-57-6 Foreign Currency Transaction & 11 38 18-20 Translation Gain(Loss) Net Profit 1,084-830 778 +1,608 (Net Margin) (6.8%)(-5.0%) (4.9%) (+9.9%p) Profit Attributable to Owners of 994-867 741 +1,608 the Controlling Company * Transportation charge isre-categorized from SG&A to cost of goods sold in accordance with the amendment ofK-IFRS 1115 (Recognized since 4Q18) 1Q 2019 Earnings Release â”, April 24, 2019
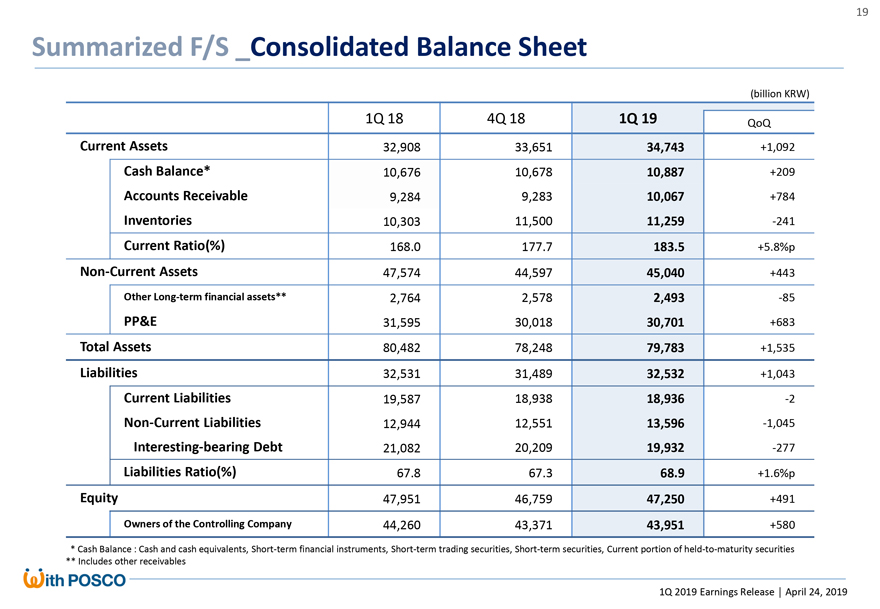
Summarized F/S _Consolidated Balance Sheet (billion KRW) 1Q 18 4Q 18 1Q 19 QoQ Current Assets 32,908 33,651 34,743 +1,092 Cash Balance* 10,676 10,678 10,887 +209 Accounts Receivable 9,284 9,283 10,067 +784 Inventories 10,303 11,500 11,259-241 Current Ratio(%) 168.0 177.7 183.5 +5.8%pNon-Current Assets 47,574 44,597 45,040 +443 Other Long-term financial assets** 2,764 2,578 2,493-85 PP&E 31,595 30,018 30,701 +683 Total Assets 80,482 78,248 79,783 +1,535 Liabilities 32,531 31,489 32,532 +1,043 Current Liabilities 19,587 18,938 18,936-2Non-Current Liabilities 12,944 12,551 13,596-1,045 Interesting-bearing Debt 21,082 20,209 19,932-277 Liabilities Ratio(%) 67.8 67.3 68.9 +1.6%p Equity 47,951 46,759 47,250 +491 Owners of the Controlling Company 44,260 43,371 43,951 +580 * Cash Balance : Cash and cash equivalents, Short-term financial instruments, Short-term trading securities, Short-term securities, Current portion ofheld-to-maturity securities ** Includes other receivables 1Q 2019 Earnings Release â”, April 24, 2019