Exhibit 99.1
3Q 2019 Earnings Release October 24, 2019
Disclaimer This presentation was prepared and circulated to release the informations regarding the company’s business performance to shareholders and investors prior to the completion of auditing for the period of the third quarter of 2019. As figures in this presentation are based on unaudited financial statements, certain contents may be subject to modification in the course of auditing process. This presentation contains certain forward-looking statements relating to the business, financial performance and results of the company and/or the industry in which it operates. The forward-looking statements set forth herein concern future circumstances and results and other statements that not historical facts, and are solely opinions and forecasts which are uncertain and subject to risks. Therefore, the recipients of this presentation shall be aware of that the forward-looking statements set forth herein may not correspond to the actual business performance of the company due to changes and risks in business environments and conditions. The sole purpose of this presentation is to assist persons in deciding whether they wish to proceed with certain investments to the company. The company does not make any representation or warranty, expressly or impliedly, as to the accuracy and completeness of this presentation or of the information contained herein and shall not have any liability for the informations contained in this presentation.
Contents 3Q 2019 Business Performance—Parent Performance—Consolidated Performance—Subsidiary Performance 3Q 2019 Earnings Release â”, October 24, 2019
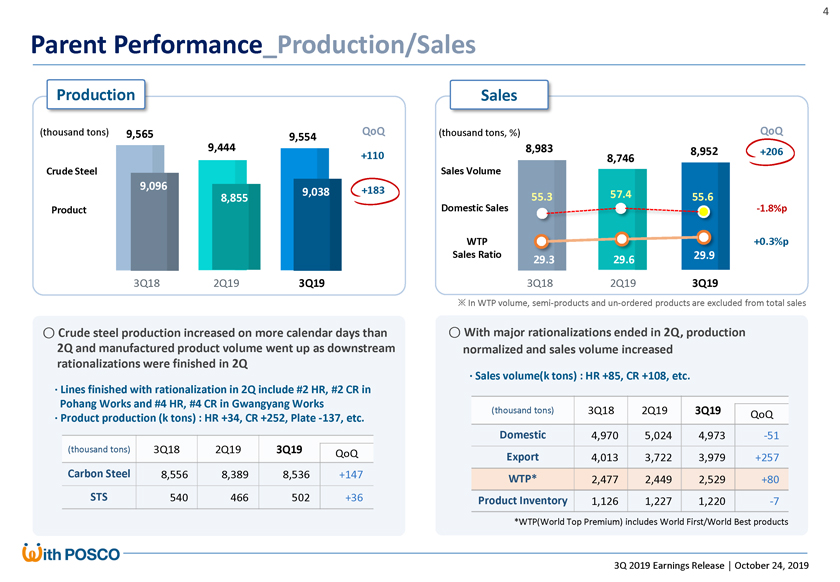
Parent Performance_Production/Sales Production Sales (thousand tons) 9,565 QoQ (thousand tons, %) QoQ 9,554 9,444 8,983 8,952 +206 +110 8,746 Crude Steel Sales Volume 9,096 +183 9,038 57.4 8,855 55.3 55.6 Product Domestic Sales-1.8%p WTP +0.3%p Sales Ratio 29.9 29.3 29.6 3Q18 2Q19 3Q19 3Q18 2Q19 3Q19 ? In WTP volume, semi-products andun-ordered products are excluded from total sales â—‹ Crude steel production increased on more calendar days than â—‹ With major rationalizations ended in 2Q, production 2Q and manufactured product volume went up as downstream normalized and sales volume increased rationalizations were finished in 2Q ·Sales volume(k tons) : HR +85, CR +108, etc. ·Lines finished with rationalization in 2Q include #2 HR, #2 CR in Pohang Works and #4 HR, #4 CR in Gwangyang Works (thousand tons) 3Q18 2Q19 3Q19 QoQ · Product production (k tons) : HR +34, CR +252, Plate-137, etc. Domestic 4,970 5,024 4,973-51 (thousand tons) 3Q18 2Q19 3Q19 QoQ Export 4,013 3,722 3,979 +257 Carbon Steel 8,556 8,389 8,536 +147 WTP* 2,477 2,449 2,529 +80 STS 540 466 502 +36 Product Inventory 1,126 1,227 1,220-7 *WTP(World Top Premium) includes World First/World Best products 3Q 2019 Earnings Release â”, October 24, 2019
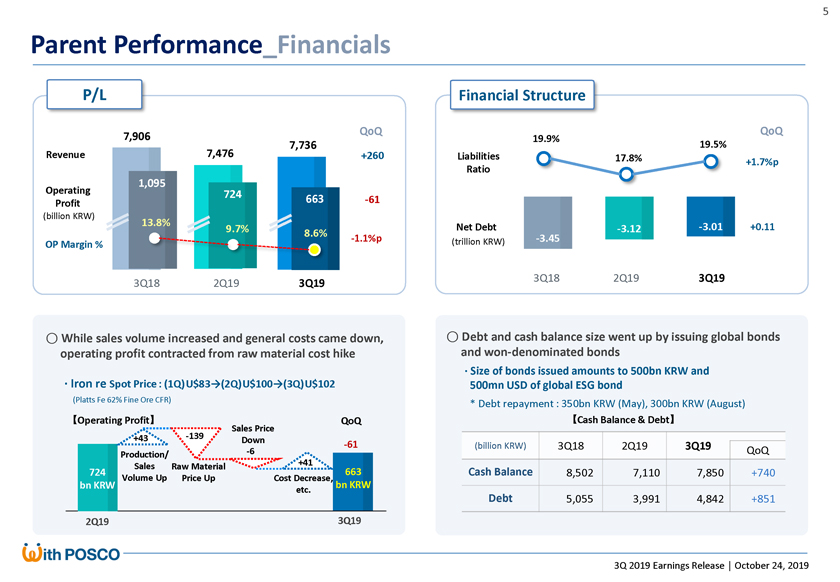
Parent Performance_Financials P/L Financial Structure QoQ QoQ 7,906 7,736 19.9% 19.5% Revenue 7,476 +260 Liabilities 17.8% +1.7%p Ratio 1,095 Operating 724 663 Profit-61 (billion KRW) 13.8% 9.7% Net Debt-3.12-3.01 +0.11 8.6%-1.1%p (trillion KRW)-3.45 OP Margin % 3Q18 2Q19 3Q19 3Q18 2Q19 3Q19 â—‹ While sales volume increased and general costs came down, â—‹ Debt and cash balance size went up by issuing global bonds operating profit contracted from raw material cost hike andwon-denominated bonds ·Size of bonds issued amounts to 500bn KRW and ·Iron re Spot Price : (1Q)U$83→(2Q)U$100→(3Q)U$102 500mn USD of global ESG bond (Platts Fe 62% Fine Ore CFR) * Debt repayment : 350bn KRW (May), 300bn KRW (August) Operating Profit QoQ Cash Balance & Debt-139 Sales Price +43 Down-61 (billion KRW) 3Q18 2Q19 3Q19 Production/-6 QoQ Sales +41 Raw Material 724 663 Cash Balance 8,502 7,110 7,850 +740 Volume Up Price Up Cost Decrease, bn KRW bn KRW etc. Debt 5,055 3,991 4,842 +851 2Q19 3Q19 3Q 2019 Earnings Release â”, October 24, 2019

Consolidated Performance P/L Financial Structure 16,411 QoQ QoQ 16,321 69.2% 15,988-333 Revenue Liabilities Ratio 65.0% 65.7% +0.7%p 1,531 Operating 1,069 1,040-29 Profit (billion KRW) 10.3 9.3% 6.5% 6.5% Net Debt 9.2 9.1-0.1 (—) OP Margin % (trillion KRW) 3Q18 2Q19 3Q19 3Q18 2Q19 3Q19 â—‹ Overcoming the slowdown in the steel market and delayed â—‹ Debt and cash balance expanded mainly by POSCO’s newly recovery of demand industries, quarterly consolidated OP recorded higher than 1tn KRW for 9 consecutive quarters, mainly supported issued bonds by strong performance ofglobal&infra(non-steel) business segments ·Cash balance (+688bn KRW) : POSCO +740, Int’l-62, etc. ·Posted weaker earnings in steel segment as higher raw material costs ·Debt (+656bn KRW) : POSCO +851,P-Energy-215, etc. squeezed mill margin·Global&Infra(non-steel) earnings improved led byP-International,P-E&C andP-Energy Aggregated Operating Profit Cash (billion KRW) Balance & Debt 2Q19 3Q19 QoQ Steel 805 710-95 (billion KRW) 3Q18 2Q19 3Q19 QoQ Overseas steel 38 8-30 Cash Balance 11,723 10,021 10,709 +688 Global&Infra 299 322 +23 Debt 22,069 19,199 19,855 +656 New Growth 15 26 +11 3Q 2019 Earnings Release â”, October 24, 2019
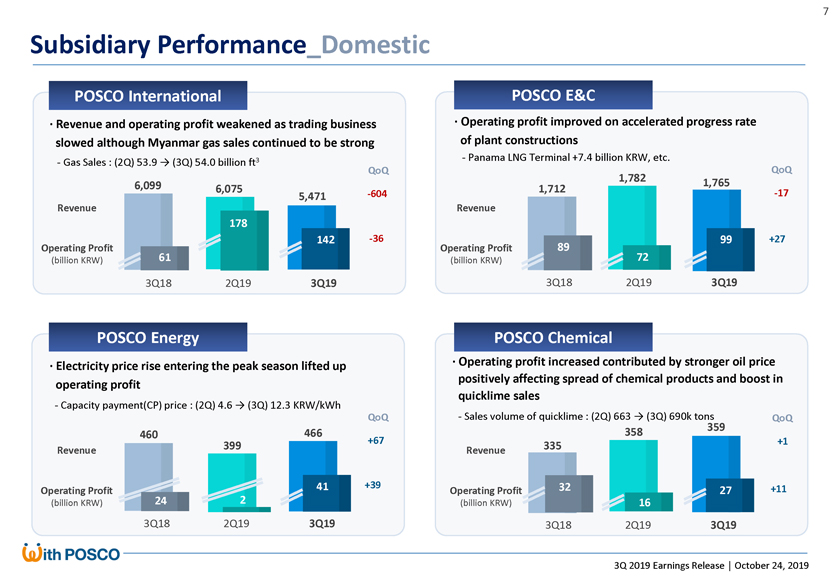
Subsidiary Performance_Domestic POSCO International POSCO E&C · Revenue and operating profit weakened as trading business · Operating profit improved on accelerated progress rate slowed although Myanmar gas sales continued to be strong of plant constructions 3—Panama LNG Terminal +7.4 billion KRW, etc.—Gas Sales : (2Q) 53.9 → (3Q) 54.0 billion ft QoQ 1,782 QoQ 6,099 1,765 6,075 1,712-17 5,471-604 Revenue Revenue 178 142-36 89 99 +27 Operating Profit Operating Profit 72 (billion KRW) 61 (billion KRW) 3Q18 2Q19 3Q19 3Q18 2Q19 3Q19 POSCO Energy POSCO Chemical · Electricity price rise entering the peak season lifted up · Operating profit increased contributed by stronger oil price positively affecting spread of chemical products and boost in operating profit—Capacity payment(CP) price : (2Q) 4.6 → (3Q) 12.3 KRW/kWh quicklime sales QoQ—Sales volume of quicklime : (2Q) 663 → (3Q) 690k tons QoQ 359 460 466 +67 358 399 335 +1 Revenue Revenue 41 +39 32 +11 Operating Profit Operating Profit 27 (billion KRW) 24 2 (billion KRW) 16 3Q18 2Q19 3Q19 3Q18 2Q19 3Q19 3Q 2019 Earnings Release â”, October 24, 2019
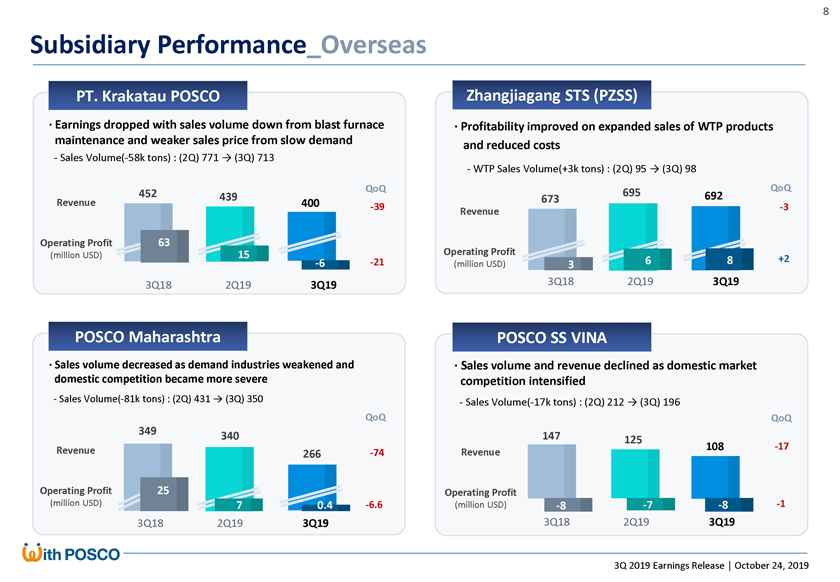
Subsidiary Performance_Overseas PT. Krakatau POSCO Zhangjiagang STS (PZSS) · Earnings dropped with sales volume down from blast furnace · Profitability improved on expanded sales of WTP products maintenance and weaker sales price from slow demand and reduced costs—SalesVolume(-58k tons) : (2Q) 771 → (3Q) 713—WTP Sales Volume(+3k tons) : (2Q) 95 → (3Q) 98 QoQ 695 QoQ 452 439 692 Revenue 400-39 673-3 Revenue Operating Profit 63 (million USD) 15 Operating Profit-6-21 6 8 +2 (million USD) 3 3Q18 2Q19 3Q19 3Q18 2Q19 3Q19 POSCO Maharashtra POSCO SS VINA · Sales volume decreased as demand industries weakened and · Sales volume and revenue declined as domestic market domestic competition became more severe competition intensified—SalesVolume(-81k tons) : (2Q) 431 → (3Q) 350—SalesVolume(-17k tons) : (2Q) 212 → (3Q) 196 QoQ QoQ 349 340 147 125 108-17 Revenue 266-74 Revenue Operating Profit 25 Operating Profit (million USD) 7 0.4-6.6 (million USD)-8-7-8-1 3Q18 2Q19 3Q19 3Q18 2Q19 3Q19 3Q 2019 Earnings Release â”, October 24, 2019
Appendix Market & Outlook—Global Steel Demand—Domestic Steel Demand—Raw Materials Outlook Summarized F/S_Parent Summarized F/S_Consolidated 2019 Business Outlook 3Q 2019 Earnings Release”, October 24, 2019
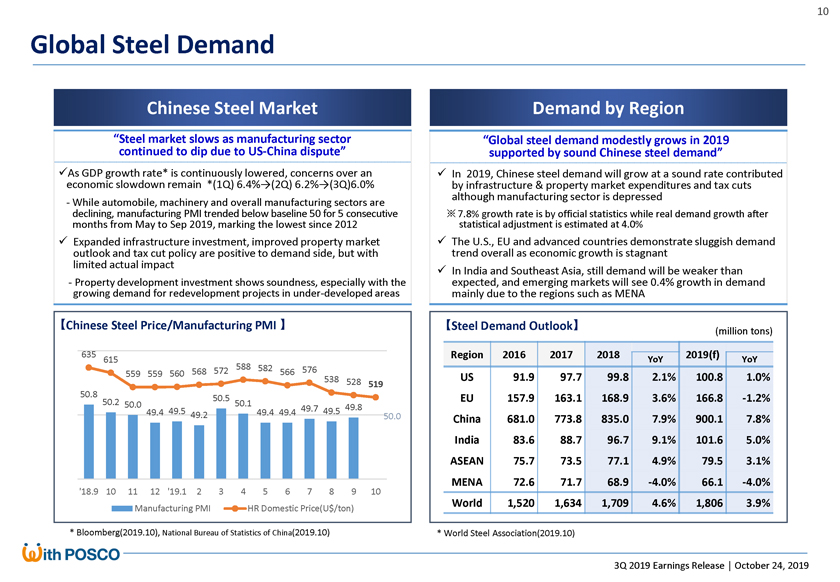
Global Steel Demand Chinese Steel Market Demand by Region “Steel market slows as manufacturing sector “Global steel demand modestly grows in 2019 continued to dip due toUS-China dispute” supported by sound Chinese steel demand” As GDP growth rate* is continuously lowered, concerns over an  In 2019, Chinese steel demand will grow at a sound rate contributed economic slowdown remain *(1Q) 6.4%→(2Q) 6.2%→(3Q)6.0% by infrastructure & property market expenditures and tax cuts although manufacturing sector is depressed—While automobile, machinery and overall manufacturing sectors are declining, manufacturing PMI trended below baseline 50 for 5 consecutive ? 7.8% growth rate is by official statistics while real demand growth after months from May to Sep 2019, marking the lowest since 2012 statistical adjustment is estimated at 4.0%  Expanded infrastructure investment, improved property market The U.S., EU and advanced countries demonstrate sluggish demand outlook and tax cut policy are positive to demand side, but with trend overall as economic growth is stagnant limited actual impact In India and Southeast Asia, still demand will be weaker than—Property development investment shows soundness, especially with the expected, and emerging markets will see 0.4% growth in demand growing demand for redevelopment projects in under-developed areas mainly due to the regions such as MENA 【Chinese Steel Price/Manufacturing PMI Steel Demand Outlook (million tons) 635 Region 2016 2017 2018 2019(f) 615 588 YoY YoY 568 572 582 576 559 559 560 566 538 US 91.9 97.7 99.8 2.1% 100.8 1.0% 528 519 50.8 50.5 EU 157.9 163.1 168.9 3.6% 166.8-1.2% 50.2 50.0 50.1 49.7 49.8 49.4 49.5 49.4 49.4 49.5 49.2 50.0 China 681.0 773.8 835.0 7.9% 900.1 7.8% India 83.6 88.7 96.7 9.1% 101.6 5.0% ASEAN 75.7 73.5 77.1 4.9% 79.5 3.1% MENA 72.6 71.7 68.9-4.0% 66.1-4.0% ‘18.9 10 11 12 ‘19.1 2 3 4 5 6 7 8 9 10 World 1,520 1,634 1,709 4.6% 1,806 3.9% Manufacturing PMI HR Domestic Price(U$/ton) * Bloomberg(2019.10), National Bureau of Statistics of China(2019.10) * World Steel Association(2019.10) 3Q 2019 Earnings Release â”, October 24, 2019
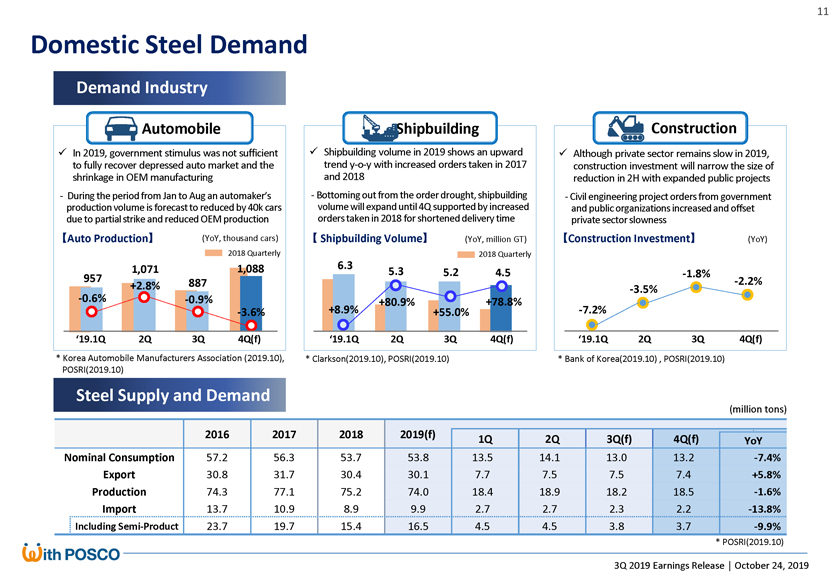
Domestic Steel Demand Demand Industry Automobile Shipbuilding Construction  In 2019, government stimulus was not sufficient Shipbuilding volume in 2019 shows an upward  Although private sector remains slow in 2019, to fully recover depressed auto market and the trendy-o-y with increased orders taken in 2017 construction investment will narrow the size of shrinkage in OEM manufacturing and 2018 reduction in 2H with expanded public projects—During the period from Jan to Aug an automaker’s—Bottoming out from the order drought, shipbuilding—Civil engineering project orders from government production volume is forecast to reduced by 40k cars volume will expand until 4Q supported by increased and public organizations increased and offset due to partialstrike and reduced OEM production orders taken in 2018 for shortened delivery time private sector slowness 【Auto Production (YoY, thousand cars) Shipbuilding Volume (YoY, million GT) Construction Investment (YoY) 2018 Quarterly 2018 Quarterly 1,071 1,088 6.3 5.3 5.2 4.5-1.8% 957 887-2.2% +2.8%-3.5%-0.6%-0.9% +80.9% +78.8%-3.6% +8.9% +55.0%-7.2% ‘19.1Q 2Q 3Q 4Q(f) ‘19.1Q 2Q 3Q 4Q(f) ‘19.1Q 2Q 3Q 4Q(f) * Korea Automobile Manufacturers Association (2019.10), * Clarkson(2019.10), POSRI(2019.10) * Bank of Korea(2019.10) , POSRI(2019.10) POSRI(2019.10) Steel Supply and Demand (million tons) 2016 2017 2018 2019(f) 1Q 2Q 3Q(f) 4Q(f) YoY Nominal Consumption 57.2 56.3 53.7 53.8 13.5 14.1 13.0 13.2-7.4% Export 30.8 31.7 30.4 30.1 7.7 7.5 7.5 7.4 +5.8% Production 74.3 77.1 75.2 74.0 18.4 18.9 18.2 18.5-1.6% Import 13.7 10.9 8.9 9.9 2.7 2.7 2.3 2.2-13.8% Including Semi-Product 23.7 19.7 15.4 16.5 4.5 4.5 3.8 3.7-9.9% * POSRI(2019.10) 3Q 2019 Earnings Release â”, October 24, 2019
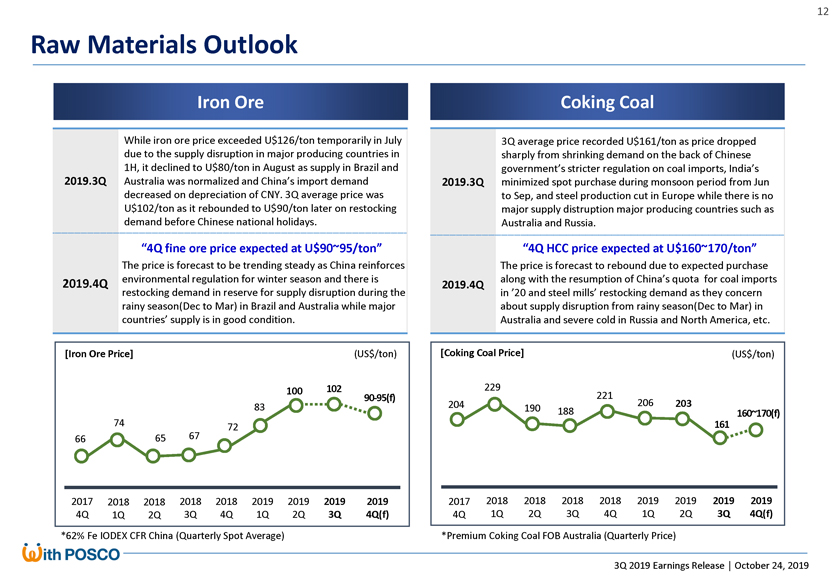
Raw Materials Outlook Iron Ore Coking Coal While iron ore price exceeded U$126/ton temporarily in July 3Q average price recorded U$161/ton as price dropped due to the supply disruption in major producing countries in sharply from shrinking demand on the back of Chinese 1H, it declined to U$80/ton in August as supply in Brazil and government’s stricter regulation on coal imports, India’s 2019.3Q Australia was normalized and China’s import demand 2019.3Q minimized spot purchase during monsoon period from Jun decreased on depreciation of CNY. 3Q average price was to Sep, and steel production cut in Europe while there is no U$102/ton as it rebounded to U$90/ton later on restocking major supply distruption major producing countries such as demand before Chinese national holidays. Australia and Russia. “4Q fine ore price expected at U$90~95/ton” “4Q HCC price expected at U$160~170/ton” The price is forecast to be trending steady as China reinforces The price is forecast to rebound due to expected purchase 2019.4Q environmental regulation for winter season and there is along with the resumption of China’s quota for coal imports 2019.4Q restocking demand in reserve for supply disruption during the in ’20 and steel mills’ restocking demand as they concern rainy season(Dec to Mar) in Brazil and Australia while major about supply disruption from rainy season(Dec to Mar) in countries’ supply is in good condition. Australia and severe cold in Russia and North America, etc. [Iron Ore Price] (US$/ton) [Coking Coal Price] (US$/ton) 100 102 229 22190-95(f) 204 206 203 83 190 188 160~170(f) 74 161 72 66 65 67 2017 2018 2018 2018 2018 2019 2019 2019 2019 2017 2018 2018 2018 2018 2019 2019 2019 2019 4Q 1Q 2Q 3Q 4Q 1Q 2Q 3Q 4Q(f) 4Q 1Q 2Q 3Q 4Q 1Q 2Q 3Q 4Q(f) *62% Fe IODEX CFR China (Quarterly Spot Average) *Premium Coking Coal FOB Australia (Quarterly Price) 3Q 2019 Earnings Release â”, October 24, 2019
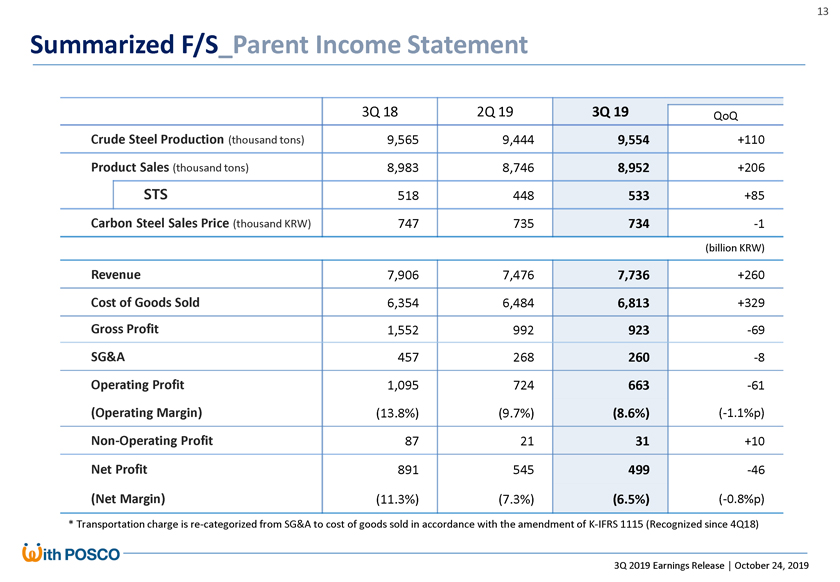
Summarized F/S_Parent Income Statement 3Q 18 2Q 19 3Q 19 QoQ Crude Steel Production (thousand tons) 9,565 9,444 9,554 +110 Product Sales (thousand tons) 8,983 8,746 8,952 +206 STS 518 448 533 +85 Carbon Steel Sales Price (thousand KRW) 747 735 734-1 (billion KRW) Revenue 7,906 7,476 7,736 +260 Cost of Goods Sold 6,354 6,484 6,813 +329 Gross Profit 1,552 992 923-69 SG&A 457 268 260-8 Operating Profit 1,095 724 663-61 (Operating Margin) (13.8%) (9.7%) (8.6%)(-1.1%p)Non-Operating Profit 87 21 31 +10 Net Profit 891 545 499-46 (Net Margin) (11.3%) (7.3%) (6.5%)(-0.8%p) * Transportation charge isre-categorized from SG&A to cost of goods sold in accordance with the amendment ofK-IFRS 1115 (Recognized since 4Q18) 3Q 2019 Earnings Release â”, October 24, 2019
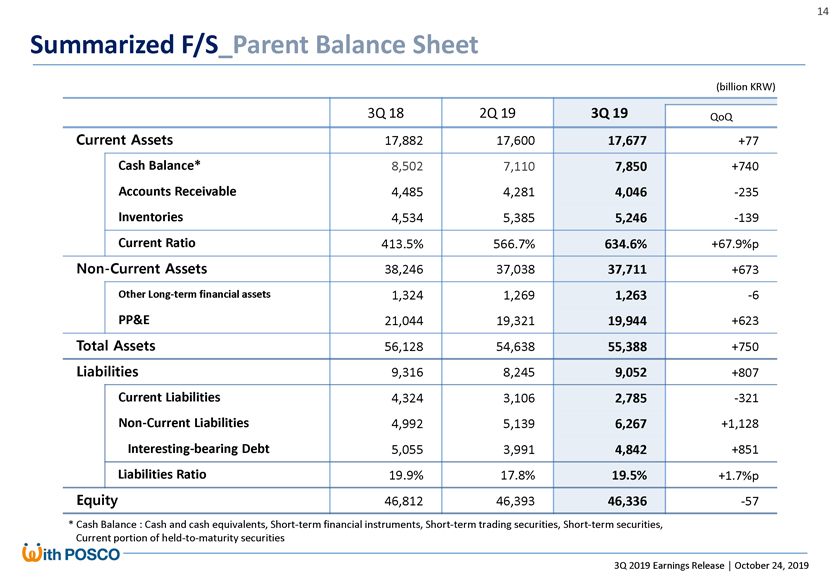
Summarized F/S_Parent Balance Sheet (billion KRW) 3Q 18 2Q 19 3Q 19 QoQ Current Assets 17,882 17,600 17,677 +77 Cash Balance* 8,502 7,110 7,850 +740 Accounts Receivable 4,485 4,281 4,046-235 Inventories 4,534 5,385 5,246-139 Current Ratio 413.5% 566.7% 634.6% +67.9%pNon-Current Assets 38,246 37,038 37,711 +673 Other Long-term financial assets 1,324 1,269 1,263-6 PP&E 21,044 19,321 19,944 +623 Total Assets 56,128 54,638 55,388 +750 Liabilities 9,316 8,245 9,052 +807 Current Liabilities 4,324 3,106 2,785-321Non-Current Liabilities 4,992 5,139 6,267 +1,128 Interesting-bearing Debt 5,055 3,991 4,842 +851 Liabilities Ratio 19.9% 17.8% 19.5% +1.7%p Equity 46,812 46,393 46,336-57 * Cash Balance : Cash and cash equivalents, Short-term financial instruments, Short-term trading securities, Short-term securities, Current portion ofheld-to-maturity securities 3Q 2019 Earnings Release â”, October 24, 2019
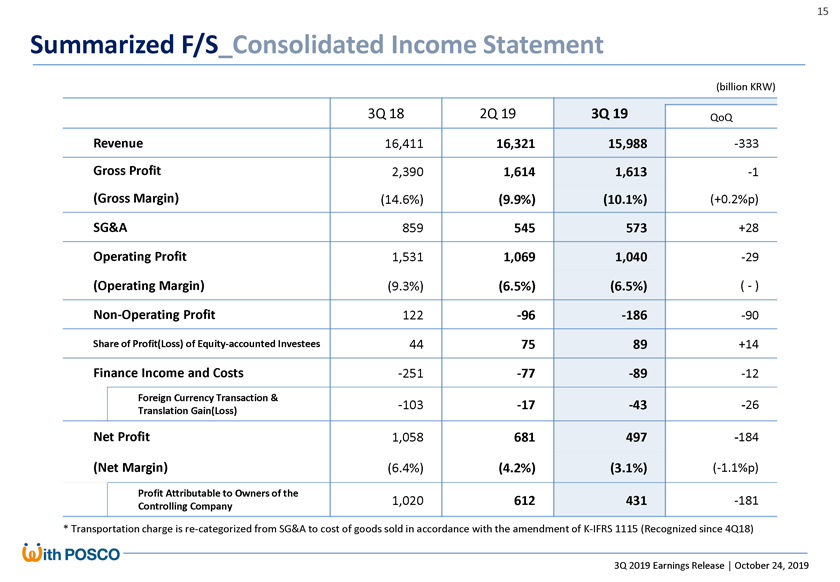
Summarized F/S_Consolidated Income Statement (billion KRW) 3Q 18 2Q 19 3Q 19 QoQ Revenue 16,411 16,321 15,988-333 Gross Profit 2,390 1,614 1,613-1 (Gross Margin) (14.6%) (9.9%) (10.1%) (+0.2%p) SG&A 859 545 573 +28 Operating Profit 1,531 1,069 1,040-29 (Operating Margin) (9.3%) (6.5%) (6.5%) (—)Non-Operating Profit 122-96-186-90 Share of Profit(Loss) of Equity-accounted Investees 44 75 89 +14 Finance Income and Costs-251-77-89-12 Foreign Currency Transaction &-103-17-43-26 Translation Gain(Loss) Net Profit 1,058 681 497-184 (Net Margin) (6.4%) (4.2%) (3.1%)(-1.1%p) Profit Attributable to Owners of the 1,020 612 431-181 Controlling Company * Transportation charge isre-categorized from SG&A to cost of goods sold in accordance with the amendment ofK-IFRS 1115 (Recognized since 4Q18) 3Q 2019 Earnings Release â”, October 24, 2019

Summarized F/S_Consolidated Balance Sheet (billion KRW) 3Q 18 2Q 19 3Q 19 QoQ Current Assets 35,395 34,058 34,827 +769 Cash Balance* 11,723 10,021 10,709 +688 Accounts Receivable 9,829 9,939 9,714-225 Inventories 10,911 11,708 11,770 +62 Current Ratio 175.5% 192.6% 205.5% +12.9%pNon-Current Assets 45,948 44,933 44,909-24 Other Long-term financial assets 1,845 1,717 1,686-31 PP&E 31,040 30,340 30,318-22 Total Assets 81,343 78,991 79,736 +745 Liabilities 33,270 31,117 31,608 +491 Current Liabilities 20,166 17,684 16,946-738Non-Current Liabilities 13,104 13,433 14,662 +1,229 Interesting-bearing Debt 22,069 19,199 19,855 +656 Liabilities Ratio 69.2% 65.0% 65.7% +0.7%p Equity 48,073 47,874 48,128 +254 Owners of the Controlling Company 44,694 44,457 44,756 +299 * Cash Balance : Cash and cash equivalents, Short-term financial instruments, Short-term trading securities, Short-term securities, Current portion ofheld-to-maturity securities 3Q 2019 Earnings Release â”, October 24, 2019
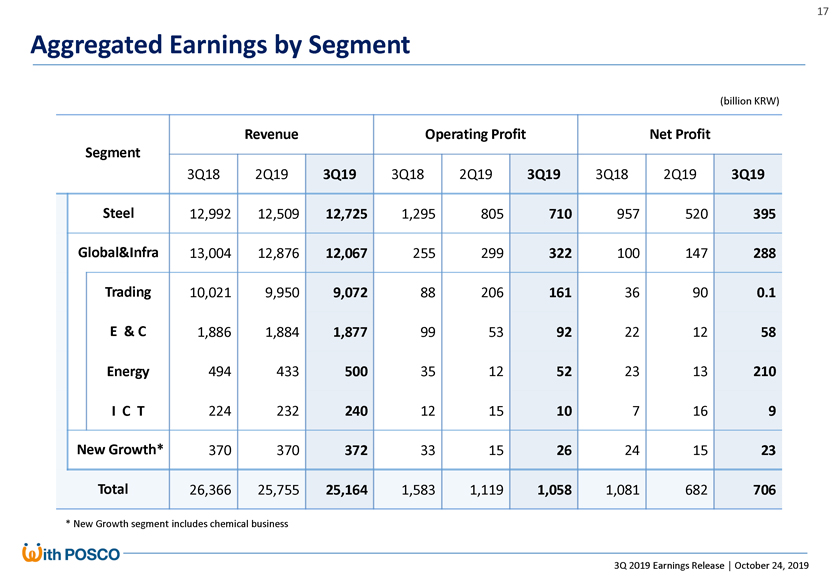
Aggregated Earnings by Segment (billion KRW) Revenue Operating Profit Net Profit Segment 3Q18 2Q19 3Q19 3Q18 2Q19 3Q19 3Q18 2Q19 3Q19 Steel 12,992 12,509 12,725 1,295 805 710 957 520 395 Global&Infra 13,004 12,876 12,067 255 299 322 100 147 288 Trading 10,021 9,950 9,072 88 206 161 36 90 0.1 E & C 1,886 1,884 1,877 99 53 92 22 12 58 Energy 494 433 500 35 12 52 23 13 210 I C T 224 232 240 12 15 10 7 16 9 New Growth* 370 370 372 33 15 26 24 15 23 Total 26,366 25,755 25,164 1,583 1,119 1,058 1,081 682 706 * New Growth segment includes chemical business 3Q 2019 Earnings Release â”, October 24, 2019
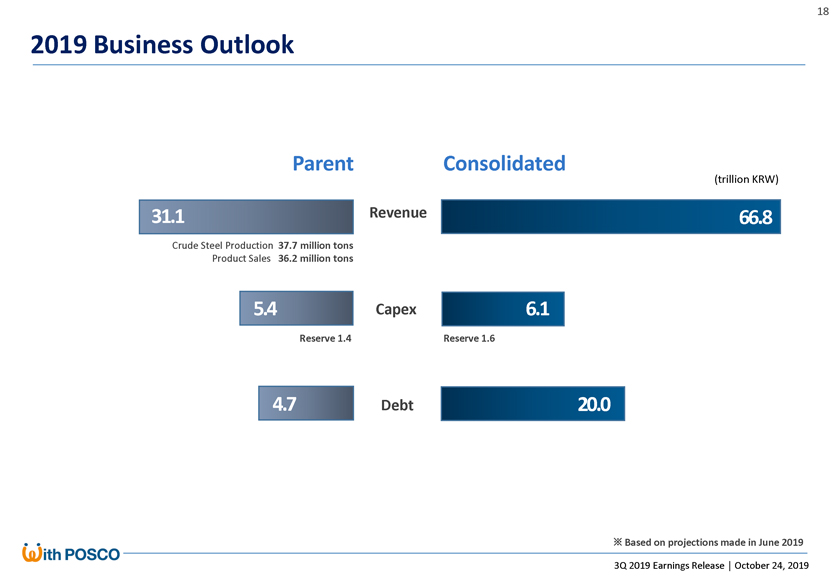
2019 Business Outlook Parent Consolidated (trillion KRW) 31.1 Revenue 66.8 Crude Steel Production 37.7 million tons Product Sales 36.2 million tons 5.4 Capex 6.1 Reserve 1.4 Reserve 1.6 4.7 Debt 20.0 ? Based on projections made in June 2019 3Q 2019 Earnings Release â”, October 24, 2019 3Q 2019 Earnings Release â”, October 24, 2019