UNITED STATES
SECURITIES AND EXCHANGE COMMISSION
Washington, D.C. 20549
Form 6-K
REPORT OF FOREIGN PRIVATE ISSUER
PURSUANT TO RULE 13a-16 OR 15D-16 UNDER
THE SECURITIES EXCHANGE ACT OF 1934
For the month of February, 2025
Commission File Number: 1-13368
POSCO HOLDINGS INC.
(Translation of registrant’s name into English)
POSCO Center, 440 Teheran-ro, Gangnam-gu, Seoul, Korea, 06194
(Address of principal executive offices)
Indicate by check mark whether the registrant files or will file annual reports under cover of Form 20-F or Form 40-F.
Form 20-F ☒ Form 40-F ☐
Provisional Earnings in Consolidated Financial Statements Base
| (In trillions of KRW) | ||||||||||||
| 2024 | 2023 | Changes over 2023(%) | ||||||||||
Revenue | Amount | 72.69 | 77.13 | -5.8% | ||||||||
Yearly Amount | — | — | — | |||||||||
Operating Profit | Amount | 2.17 | 3.53 | -38.5% | ||||||||
Yearly Amount | — | — | — | |||||||||
Profit before Income Tax | Amount | 1.25 | 2.64 | -52.7% | ||||||||
Yearly Amount | — | — | — | |||||||||
Profit | Amount | 0.95 | 1.85 | -48.6% | ||||||||
Yearly Amount | — | — | — | |||||||||
Profit Attributable to Owners of the Controlling Company | Amount | 1.09 | 1.70 | -35.9% | ||||||||
Yearly Amount | — | — | — | |||||||||
| * | The above earnings information is is prepared on a consolidated basis in accordance with K-IFRS (Korean International Financial Reporting Standards) and the independent auditors’ review is not finished. Therefore, the earnings information may change in the review process. |
SIGNATURES
Pursuant to the requirements of the Securities Exchange Act of 1934, the registrant has duly caused this report to be signed on its behalf by the undersigned, thereunto duly authorized.
| POSCO HOLDINGS INC. | ||||||
| (Registrant) | ||||||
| Date: February 3, 2025 | By | /s/ Han, Young-Ah | ||||
| (Signature) | ||||||
| Name: Han, Young-Ah | ||||||
| Title: Senior Vice President | ||||||

POSCO Holdings 2024 Earnings Release February 3, 2025
2 Disclaimer This presentation was prepared and circulated to shareholders and investors to release information regarding the company’s business performance prior to completion of auditing for the period pertaining to the 4th quarter of 2024. Given that this presentation is based on unaudited financial statements, certain figures may be modified in the course of the audit process. This presentation contains certain forward-looking statements relating to the business, financial performance and results of the company and/or the industry in which it operates. The forward-looking statements set forth herein concern future circumstances that are not historical facts and that are solely based on views and forecasts which are uncertain and subject to risk. Therefore, readers of this presentation shall be aware that foreward-looking statements set forth herein may not correspond to the actual business performance of the company, resulting from changes and risks in business environment and conditions. The sole purpose of this presentation is to assist persons in deciding whether they wish to proceed with certain investments to the Company. The Company does not offer guarantee, expressed or implied, as to the accuracy and completeness of this presentation or of the information contained herein or assume any liability for the information described in this presentation.

3 Contents Consolidated Business Performance Key Business Activities Business Performance by Key Area I. Steel - POSCO · Production/Sales · Income - Overseas · PT-KP · PZSS · P-Maharashtra · PY-VINA II. Energy Materials - POSCO Future M III. Infrastructure - POSCO International - POSCO E&C Appendix

4 2024 Consolidated Performance Earnings declined due to concurrent downturns in both Steel and Energy Materials (KRW bil.,%, %p) (KRW bil., %, %p) Income Financial Structure YoY Revenue Operating Profit OP Margin Ratio Net Debt EBITDA Net Debt Ratio YoY +4.7%p 84,750 18.2% 77,127 72,688△ 4,439 13.5% 9.6% 11,195 5.7% +3,132 8,544 8,063 4.6% 1.6%p 3.0% 7,360 4,850 △1,202 6,158 5,566 3,531 △1,357 2,174 2023 2022 2024 2022 2023 2024 - 2024 CAPEX : KRW 9.0 tril. (consolidated), KRW 1.0 tril. (separate) Performance Before Intercompany Transaction Adjustment Revenue Net Profit Operating Profit (KRW bil.) 2022 2023 2024 4Q24 2022 2023 2024 4Q24 2022 2023 2024 4Q24 *Consolidated Income 84,750 77,127 72,688 17,805 4,850 3,531 2,174 95 3,560 1,846 948 703 △ Steel 70,650 63,539 62,201 15,639 3,236 2,557 1,637 334 1,712 1,241 692 6 △ 1) 42,695 38,972 37,556 9,281 2,295 2,083 1,473 322 1,126 1,180 902 146 POSCO Overseas 23,933 20,494 20,713 5,335 474 194 39 8 109 137 149 64 △ △ Energy Materials 3,389 4,822 3,830 761 143 161 278 203 109 236 631 565 △ △ △ △ △ △ 2) 3,302 4,760 3,700 723 166 36 1 41 204 4 231 276 POSCO Future M △ △ △ Infrastructure 65,901 57,157 56,872 13,749 1,544 1,533 1,324 108 957 1,078 445 374 △ 2) 37,990 33,133 32,341 7,942 903 1,163 1,117 145 605 680 503 107 POSCO International △ 2) POSCO E&C 9,435 10,166 9,469 2,251 309 201 62 △63 171 177 51 78 1) Separate 2) Consolidated, POSCO International performance includes POSCO Energy
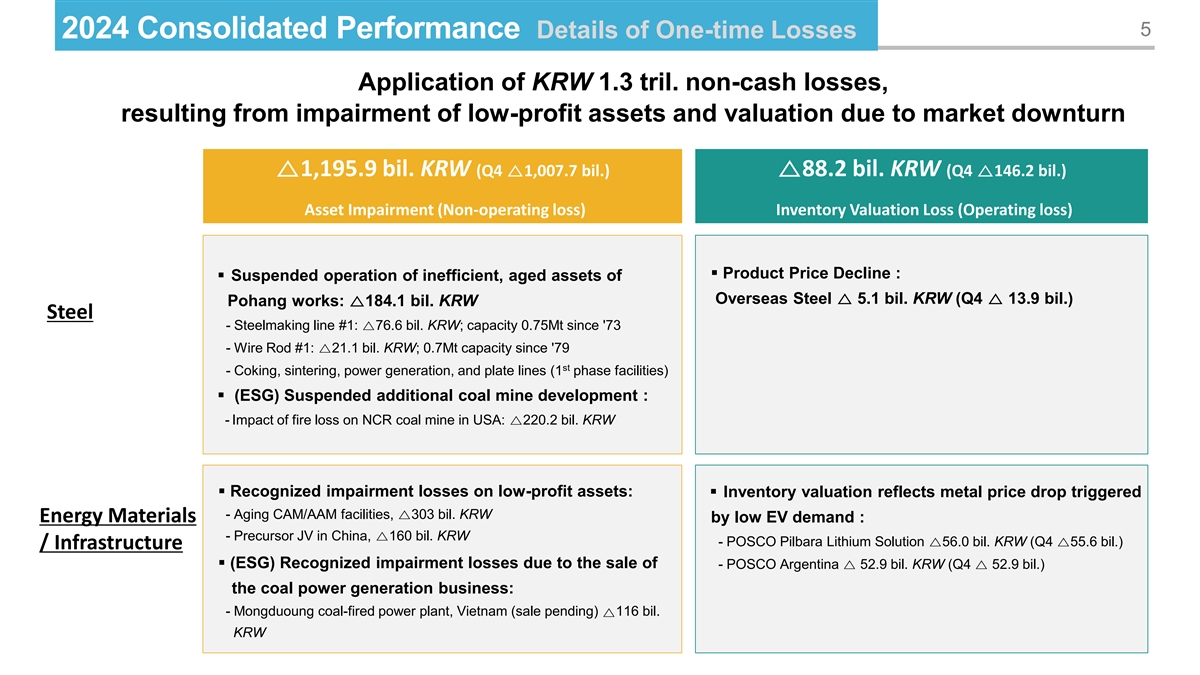
5 2024 Consolidated Performance Details of One-time Losses Application of KRW 1.3 tril. non-cash losses, resulting from impairment of low-profit assets and valuation due to market downturn △1,195.9 bil. KRW (Q4 △1,007.7 bil.)△88.2 bil. KRW (Q4 △146.2 bil.) Asset Impairment (Non-operating loss) Inventory Valuation Loss (Operating loss) ▪ Product Price Decline : ▪ Suspended operation of inefficient, aged assets of Overseas Steel △ 5.1 bil. KRW (Q4 △ 13.9 bil.) Pohang works: △184.1 bil. KRW Steel - Steelmaking line #1: △76.6 bil. KRW; capacity 0.75Mt since '73 - Wire Rod #1: △21.1 bil. KRW; 0.7Mt capacity since '79 st - Coking, sintering, power generation, and plate lines (1 phase facilities) ▪ (ESG) Suspended additional coal mine development : - Impact of fire loss on NCR coal mine in USA: △220.2 bil. KRW ▪ Recognized impairment losses on low-profit assets: ▪ Inventory valuation reflects metal price drop triggered - Aging CAM/AAM facilities, △303 bil. KRW Energy Materials by low EV demand : - Precursor JV in China, △160 bil. KRW - POSCO Pilbara Lithium Solution △56.0 bil. KRW (Q4 △55.6 bil.) / Infrastructure ▪ (ESG) Recognized impairment losses due to the sale of - POSCO Argentina △ 52.9 bil. KRW (Q4 △ 52.9 bil.) the coal power generation business: - Mongduoung coal-fired power plant, Vietnam (sale pending) 116 bil. △ KRW

6 Key Business Activities Performance by Business Division in 2024 Energy Materials Infrastructure Steel New plant commissioning & Continue to drive gas field Invest in low-carbon steelmaking & expansion project explore offshore growth markets initial ramp-up operations 4-Stage expansion of the Myanmar HyREX technology development A suite of materials plants come on line 1 1 1 offshore gas field - Designated as a National Strategic Technology - P-Argentina completed facilities (upstream & - Stage 3: gas booster platform test run; P-Int’l (Jan.‘24) downstream) to produce 25Kt of LH (Oct. ‘24) began commercial operation (Apr. ‘24) - ‘H2-based Steelmaking Feedstock’ selected as - P-Silicon Solution commissioned 550-ton capacity - Stage 4: project kick-off in ’23 2H; basic plant MSIT’s global R&D flagship project (May ‘24) silicon anode material plants (Nov. ‘24) design began (Jul. ’24) - First batch of molten iron tapped from ESF - P-PLS completed 21.5Kt capacity LH Plant 2 (Apr.‘24) Senex 3x capacity expansion speeds up (Nov. ‘24) 2 - P-Int’l’s expansion project gained Australia’s JV integrated steelworks in India 2 Environment Protection and Biodiversity - POSCO-JSW signed MOU to seek Steel/Battery Conservation (EPBC) gov’t approval (Jun. ‘24) Materials/Energy collaboration (Oct. ‘24) - Agreed to raise A$ 650mil. in capital with - To build a 5Mt+ capacity JV integrated steel mill Hancock Energy. (P-Int’l 50.1%, A$ 326mil) - JV defines a 50:50 ownership split with equal number of directors on the Board No.1 in Korean remodeling construction 3 Continuous expansion of CAM plants 2 - POSCO E&C achieved an industry milestones EAF construction 3 - P-Future M’s Gwangyang NCA CAM plant broke as Korea’s first vertical extension remodeling - With the aim to reach its interim carbon net ground (52.5Kt, Feb. ‘24) construction service provider. It ranked No.1 zero miletone, POSCO began construction of in the nation’s remodeling order book. - P-Future M’s Pohang NCA CAM plant began a 2.5Mt EAF at Gwangyang Steelworks (Feb. ’24) operation at full capacity (30Kt, Oct. ’24)
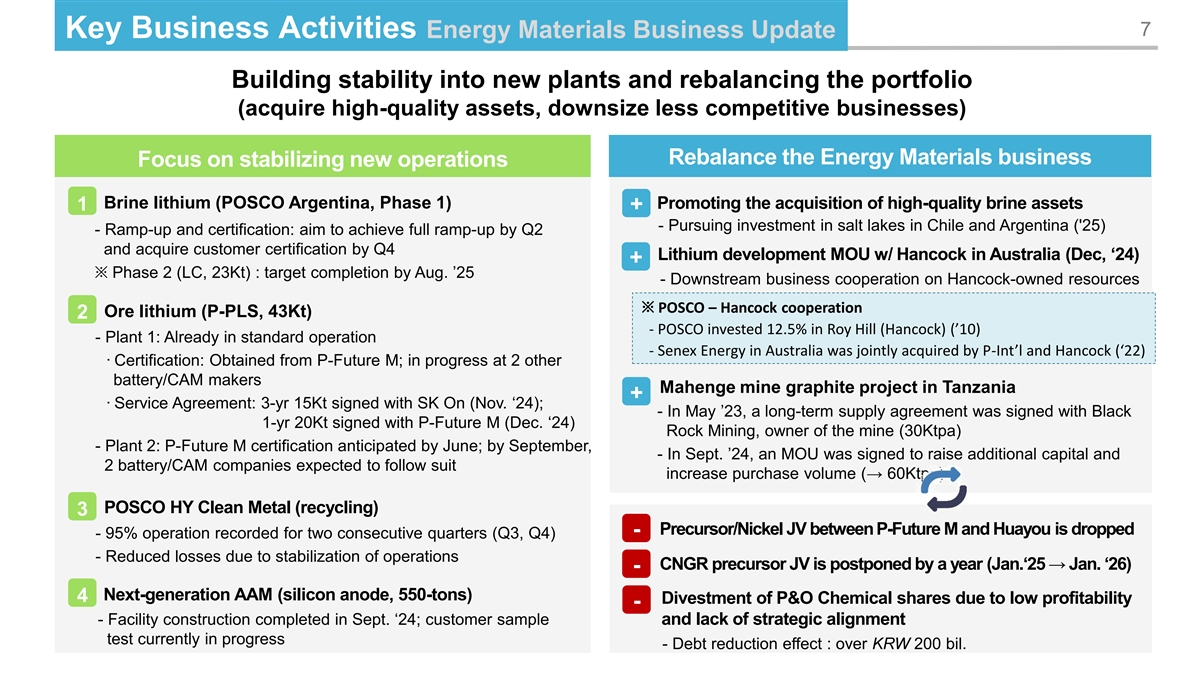
7 Key Business Activities Energy Materials Business Update Building stability into new plants and rebalancing the portfolio (acquire high-quality assets, downsize less competitive businesses) Rebalance the Energy Materials business Focus on stabilizing new operations Brine lithium (POSCO Argentina, Phase 1) Promoting the acquisition of high-quality brine assets 1 + - Pursuing investment in salt lakes in Chile and Argentina ('25) - Ramp-up and certification: aim to achieve full ramp-up by Q2 and acquire customer certification by Q4 Lithium development MOU w/ Hancock in Australia (Dec, ‘24) + ※ Phase 2 (LC, 23Kt) : target completion by Aug. ’25 - Downstream business cooperation on Hancock-owned resources ※ POSCO – Hancock cooperation Ore lithium (P-PLS, 43Kt) 2 - POSCO invested 12.5% in Roy Hill (Hancock) (’10) - Plant 1: Already in standard operation - Senex Energy in Australia was jointly acquired by P-Int’l and Hancock (‘22) · Certification: Obtained from P-Future M; in progress at 2 other battery/CAM makers Mahenge mine graphite project in Tanzania + · Service Agreement: 3-yr 15Kt signed with SK On (Nov. ‘24); - In May ’23, a long-term supply agreement was signed with Black 1-yr 20Kt signed with P-Future M (Dec. ‘24) Rock Mining, owner of the mine (30Ktpa) - Plant 2: P-Future M certification anticipated by June; by September, - In Sept. ’24, an MOU was signed to raise additional capital and 2 battery/CAM companies expected to follow suit increase purchase volume (→ 60Ktpa) POSCO HY Clean Metal (recycling) 3 Precursor/Nickel JV between P-Future M and Huayou is dropped - - 95% operation recorded for two consecutive quarters (Q3, Q4) - Reduced losses due to stabilization of operations CNGR precursor JV is postponed by a year (Jan.‘25 → Jan. ‘26) - Next-generation AAM (silicon anode, 550-tons) 4 Divestment of P&O Chemical shares due to low profitability - - Facility construction completed in Sept. ‘24; customer sample and lack of strategic alignment test currently in progress - Debt reduction effect : over KRW 200 bil.

8 Key Business Activities Portfolio Management Restructuring under-performing projects and non-essential assets to enhance capital efficiency 125 projects including 55 under-performing projects and 70 non-core assets Project Scope 45 projects completed → Cumulative cash generation of KRW 662.5 bil. 2024 Performance *Includes advance payment from ongoing projects; KRW 102.5 bil. in demolition costs separately incurred 24 projects, cash inflow of KRW 415.1 bil. 19 projects, cash inflow of KRW 26.6 bil. Infrastructure Steel 4% 〮 Sale of low-profit assets 〮 Restructure low-profit steel service centers in China : property income rights of Guryong Village 〮 Liquidate investment funds & commercial space in Haengdang-dong 31% 〮 Enhanced ESG management 662.5 bil. : sale of heavy oil power plant in Papua New Guinea KRW 〮 Sale of minority stakes 65% : shares in West Seoul Expressway, 2 projects, cash inflow of KRW 194.2 bil. Other East Seoul Expressway, Northwest Copper, and ITI 〮 Sale of KB Financial Group shares Additional KRW 1.5 tril. cash generation through 61 restructuring projects 2025 Goal (Cumulative KRW 2.1 tril. across '24 to '25)

9 POSCO Income Production/Sales (KRW bil., %) (KRW bil., %) Crude Steel (Kt) Utilization Rate* Revenue Operating Profit OP Margin YoY Product Sales Volume (Kt) YoY % of Premium Plus Products Sold** 5.4% 5.3% 87.7% 86.6% 84.1%△1.1%p 3.9% △1.4%p 42,695 35,682 △635 35,047 38,972 34,219 37,556 △1,416 33,144 32,800△344 32,144 30.6% 2,295 29.1% +1.5%p 2,083 28.6% 1,473△610 2022 2023 2024 2022 2023 2024 * Utilization Rate: crude steel production / crude steel capacity **Excludes figures for non-prime and semi-finished products Production/sales declined due to BF refurbishment; however, high value-add product sales grew, defying weak global demand - Despite QoQ mill margin growth, OP fell due to higher non-recurring costs, Lower (KRW bil.) e.g., one-time labor expenses selling price Lower unit • Selling price (carbon steel): ‘23) KRW 1,022K/t → ‘24) KRW 985K/t (△37) 2,083 Lower production/sales raw material cost △1,451 * Q3) 980 → Q4) 931 Higher cost 1,473 +1,317 △476 • Key raw materials cost (carbon steel): ‘23) 100 → ’24) 97 (△3) * 3Q) 100 → 4Q) 87 2023 2024 • Expenses: Higher energy cost due to rise in power rates; higher labor cost

10 Steel (overseas) (KRW bil.) PZSS (China) PT. Krakatau POSCO (Indonesia) (KRW bil.) YoY Revenue Operating Profit YoY Revenue Operating Profit 4,209 △317 3,359 3,130 △313 3,006 3,042 2,817 285 232 +38 △129 17 △78△167 △215 2024 2022 2023 2022 2023 2024 POSCO Maharashtra (India) (KRW bil.) PY VINA (Vietnam) (KRW bil.) YoY YoY Revenue Operating Profit Revenue Operating Profit 1,902 462 1,785 +29 395 424 1,763 +22 91 98 △7 15 44 7 △39 △24 2022 2023 2024 2022 2023 2024 YoY OP declined due to weakened global demand markets • [PT.KP] OP fell on market slowdown despite cost optimization efforts, e.g., increased use of low-cost coking coal, improved BF charge mix • [POSCO Maharashtra] Despite lower market prices in India, OP preserved by improved product mix (Automotive steel sales ratio ’23, 49% → ‘24, 51%) • [PZSS, PY VINA] Despite adverse market conditions, cost saving activities helped to defend against more sizeable losses (PZSS), earnings turned negative due to H beam price decline, resulting from China’s construction sector downturn (PY VINA)

11 POSCO FUTURE M Income (KRW bil., %) Revenue & OP by Segment (KRW bil.) YoY Revenue Operating Profit OP Margin 2022 2023 2024 YoY 3,302 4,760 3,700 △1,060 Revenue 4,760 5.0% 1,938 3,362 2,340 △1,022 Energy Material 3,700 1,364 1,398 1,360 △38 △ 1,060 Base Material 3,302 166 36 1 △35 Operating Profit 0.8% 166 151 △12 △37 △25 Energy Material △0.8%p 0.0% 36 1 △35 15 48 38 △10 Base Material 2023 2022 2024 CAM: Revenue declined on low selling price, pegged to the falling price of metals; margins eroded by lower capacity utilization • Slight volume growth in CAM sold, impacted by the quick rise in high-Ni sales from initial NCA shipments, which helped to offset the drop in mid-Ni (N65) sales AAM: US delays FEOC ruling, causing weak Natural Graphite sales, thus shifting the business into negative profit. Fixed cost enters the book as Artificial Graphite begins mass production • [Natural] Glut of cheap Chinese imports dented sales and capacity utilization from 2H ’24; • [Artificial] Mass production began, but sales trailed output. Government considers subsidy program with the goal to stabilize supply chains Basic Materials: Earnings decline resulting from slimmer Chemical margins due to crude oil price drop

12 POSCO International Income (KRW bil., %) Revenue & OP by Segment (KRW bil.) YoY Revenue Operating Profit OP Margin 2022 2023 2024 YoY 37,990 33,133 32,341 △792 Revenue 3.5% - %p 3.5% 2.4% 1) 1,558 4,084 4,041 △43 Energy 2) Steel Mtrls,etc. 36,432 29,049 28,300 △749 37,990 △792 33,133 32,341 Operating Profit 903 1,163 1,117 △46 1) 352 592 613 +21 Energy △46 1,163 1,117 903 2) 551 571 504 △67 Steel Mtrls,etc. 1) Consists of E&P, LNG plant and terminal 2023 2022 2024 2) Consists of steel, eco-friendly industrial material, foods trading, and consolidated accounts * Acquisition of POSCO Energy completed in Jan. ’23. (’22E sales: KRW 3,707 bil., OP: KRW 271 bil.) While Steel Materials took a modest OP decline in a sluggish global economy, the extended Energy value chain is helping to maintain stable profits • [Steel Materials] Profits declined due to slow global demand and weak commodity market (KRW △67 bil, YoY) • [Myanmar gas field] Gains generated from FX hike and depreciation cost drop, resulting from certification of additional reserves following Phase 3 development completion (+ KRW 26 bil., YoY) • [LNG/Terminal] Profits lifted by commencement of commercial operation at expanded terminal (Tank No. 6) and new customers (+ KRW 18 bil., YoY) • [Power] Despite stronger sales from record summer heat and winter freeze, profits shrank due to lower SMP* caused by weak crude oil and gas prices (△ KRW 19 bil., YoY) *The price at which KEPCO buys electricity from energy companies
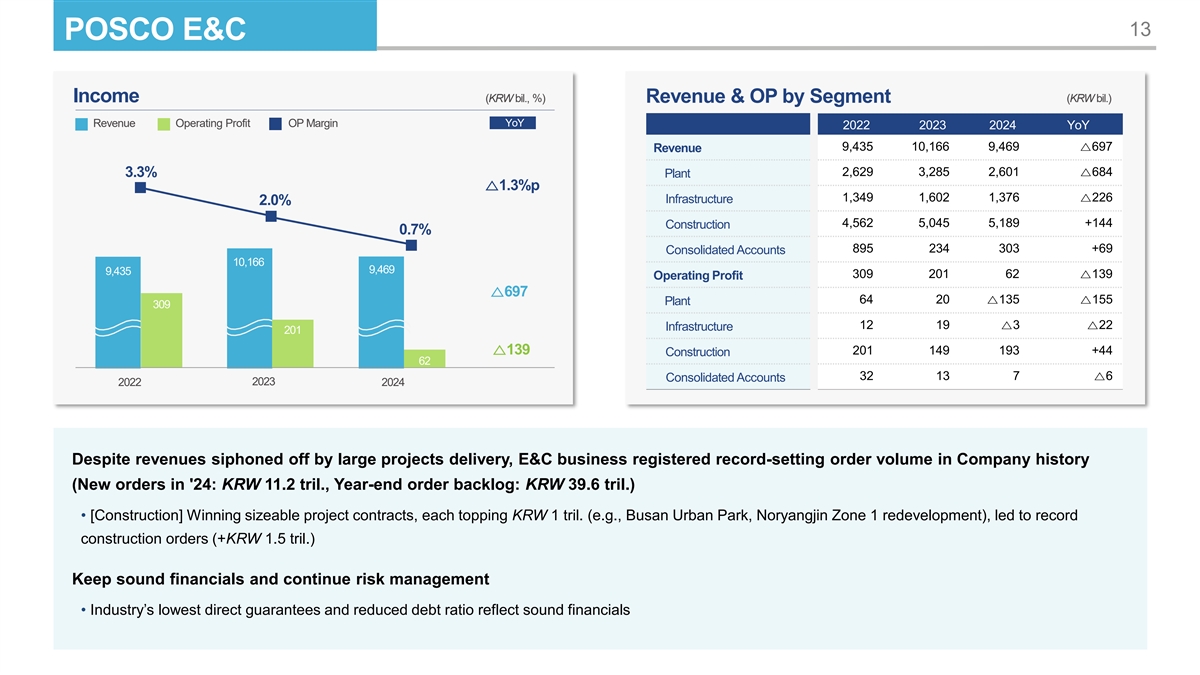
13 POSCO E&C Income (KRW bil., %) Revenue & OP by Segment (KRW bil.) YoY Revenue Operating Profit OP Margin 2022 2023 2024 YoY 9,435 10,166 9,469 △697 Revenue 2,629 3,285 2,601 △684 3.3% Plant △1.3%p 1,349 1,602 1,376 △226 Infrastructure 2.0% 4,562 5,045 5,189 +144 Construction 0.7% 895 234 303 +69 Consolidated Accounts 10,166 9,469 9,435 309 201 62 △139 Operating Profit △697 64 20 △135 △155 Plant 309 12 19 △3 △22 Infrastructure 201 △139 201 149 193 +44 Construction 62 32 13 7 △6 Consolidated Accounts 2023 2022 2024 Despite revenues siphoned off by large projects delivery, E&C business registered record-setting order volume in Company history (New orders in '24: KRW 11.2 tril., Year-end order backlog: KRW 39.6 tril.) • [Construction] Winning sizeable project contracts, each topping KRW 1 tril. (e.g., Busan Urban Park, Noryangjin Zone 1 redevelopment), led to record construction orders (+KRW 1.5 tril.) Keep sound financials and continue risk management • Industry’s lowest direct guarantees and reduced debt ratio reflect sound financials
14 Appendix Progress on Battery Materials Plant Construction Summarized Income Statement Summarized Balance Sheet Summarized Cash Flow Statement
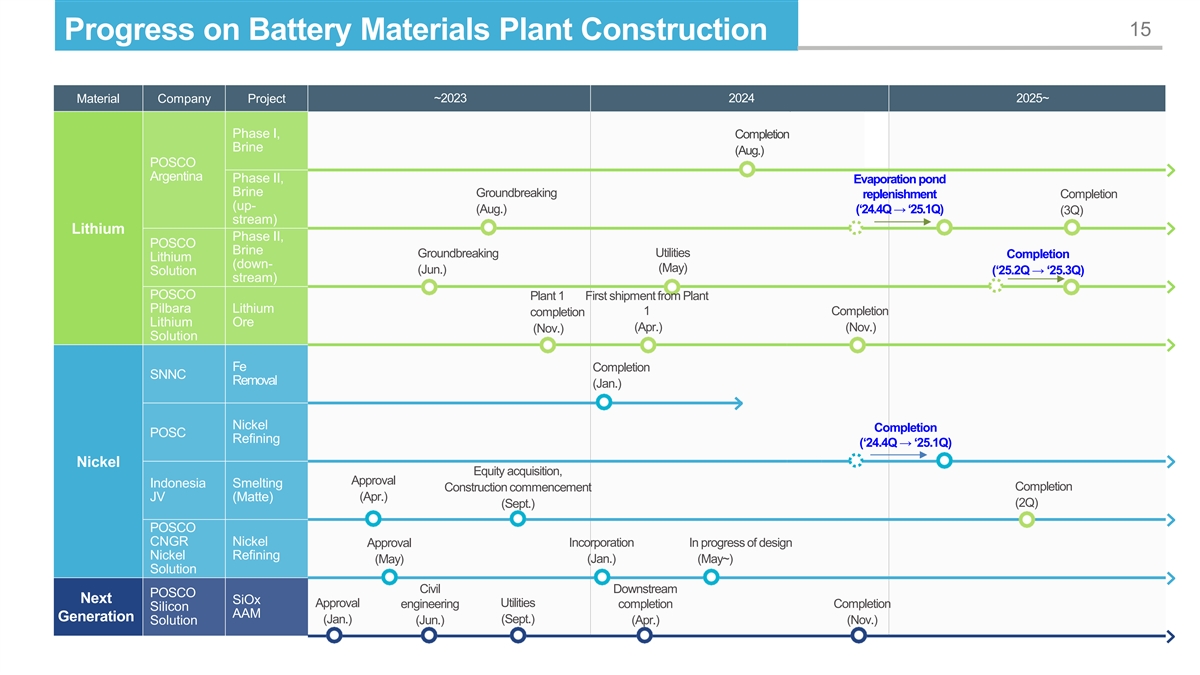
15 Progress on Battery Materials Plant Construction Material Company Project ~2023 2024 2025~ Phase I, Completion Brine (Aug.) POSCO Argentina Phase II, Evaporation pond Brine Groundbreaking replenishment Completion (up- (Aug.) (‘24.4Q → ‘25.1Q) (3Q) stream) Lithium Phase II, POSCO Brine Groundbreaking Utilities Completion Lithium (down- (May) (Jun.) Solution (‘25.2Q → ‘25.3Q) stream) POSCO Plant 1 First shipment from Plant Pilbara Lithium 1 Completion completion Lithium Ore (Apr.) (Nov.) (Nov.) Solution Fe Completion SNNC Removal (Jan.) Nickel Completion POSC Refining (‘24.4Q → ‘25.1Q) Nickel Equity acquisition, Approval Indonesia Smelting Construction commencement Completion JV (Matte) (Apr.) (Sept.) (2Q) POSCO CNGR Nickel Approval Incorporation In progress of design Nickel Refining (Jan.) (May) (May~) Solution Civil Downstream POSCO Next SiOx Approval Utilities Completion engineering completion Silicon AAM Generation (Jan.) (Sept.) (Nov.) Solution (Jun.) (Apr.)
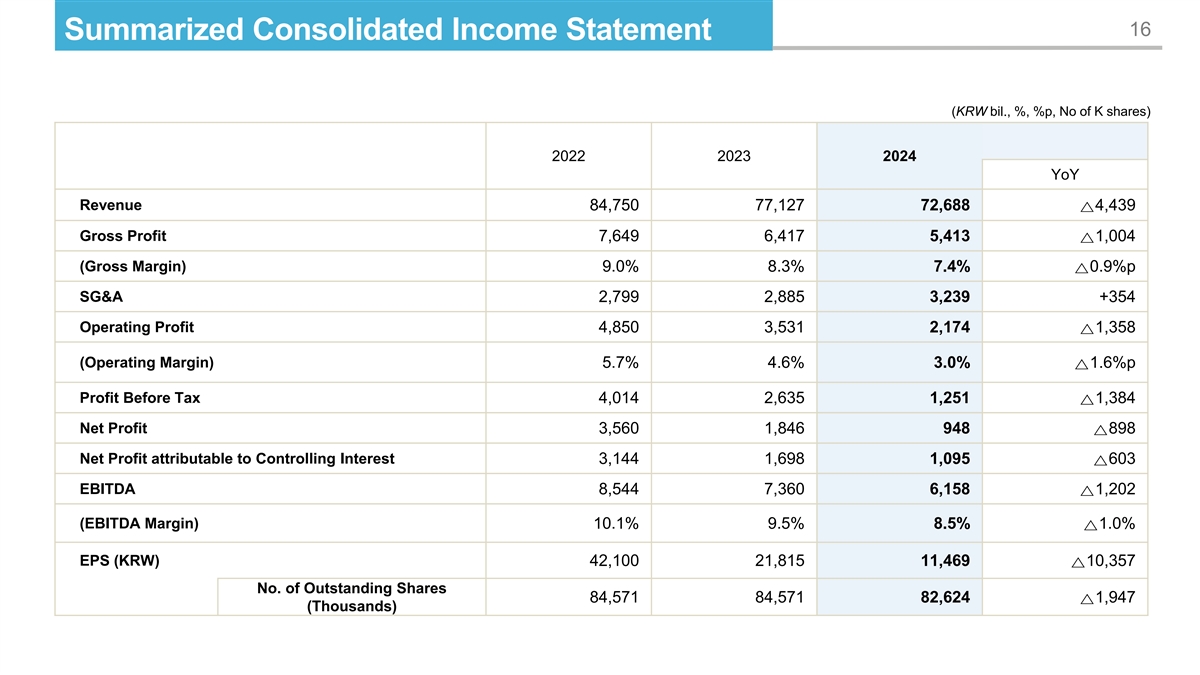
16 Summarized Consolidated Income Statement (KRW bil., %, %p, No of K shares) 2022 2023 2024 YoY Revenue 84,750 77,127 72,688 4,439 △ Gross Profit 7,649 6,417 5,413 1,004 △ (Gross Margin) 9.0% 8.3% 7.4% 0.9%p △ SG&A 2,799 2,885 3,239 +354 Operating Profit 4,850 3,531 2,174 1,358 △ (Operating Margin) 5.7% 4.6% 3.0% 1.6%p △ Profit Before Tax 4,014 2,635 1,251 1,384 △ Net Profit 3,560 1,846 948 898 △ Net Profit attributable to Controlling Interest 3,144 1,698 1,095 603 △ EBITDA 8,544 7,360 6,158 1,202 △ (EBITDA Margin) 10.1% 9.5% 8.5% 1.0% △ EPS (KRW) 42,100 21,815 11,469 10,357 △ No. of Outstanding Shares 84,571 84,571 82,624 1,947 △ (Thousands)
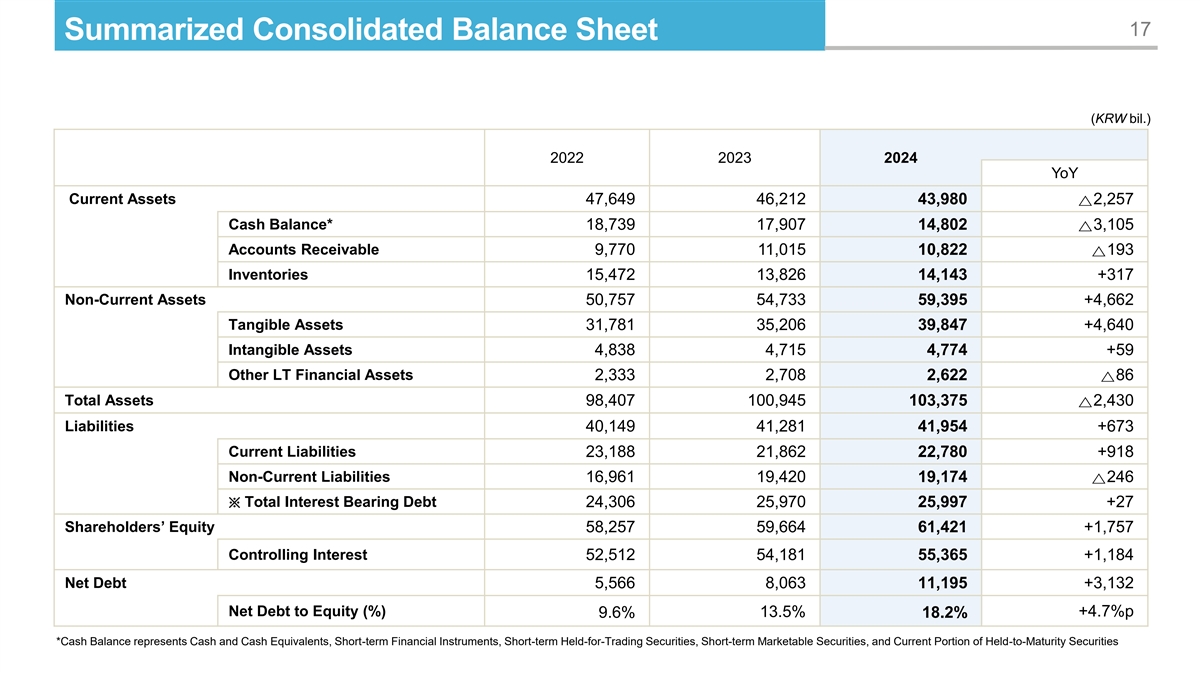
17 Summarized Consolidated Balance Sheet (KRW bil.) 2022 2023 2024 YoY Current Assets 47,649 46,212 43,980 2,257 △ Cash Balance* 18,739 17,907 14,802 3,105 △ Accounts Receivable 9,770 11,015 10,822 193 △ Inventories 15,472 13,826 14,143 +317 Non-Current Assets 50,757 54,733 59,395 +4,662 Tangible Assets 31,781 35,206 39,847 +4,640 Intangible Assets 4,838 4,715 4,774 +59 Other LT Financial Assets 2,333 2,708 2,622 86 △ Total Assets 98,407 100,945 103,375 2,430 △ Liabilities 40,149 41,281 41,954 +673 Current Liabilities 23,188 21,862 22,780 +918 Non-Current Liabilities 16,961 19,420 19,174 246 △ Total Interest Bearing Debt 24,306 25,970 25,997 +27 ※ Shareholders’ Equity 58,257 59,664 61,421 +1,757 Controlling Interest 52,512 54,181 55,365 +1,184 Net Debt 5,566 8,063 11,195 +3,132 Net Debt to Equity (%) +4.7%p 9.6% 13.5% 18.2% *Cash Balance represents Cash and Cash Equivalents, Short-term Financial Instruments, Short-term Held-for-Trading Securities, Short-term Marketable Securities, and Current Portion of Held-to-Maturity Securities

18 Summarized Cash Flow Statement (KRW bil.) 2022 2023 2024 . Operating Activities 5,706 7,062 7,078 Ⅰ 1. Net Profit 3,560 1,846 948 2. Depreciation and Amortization 3,694 3,845 3,985 3. Changes in Accounts Receivable, Accounts Payable, etc. 1,548 1,371 2,145 △ . Investing Activities 6,433 7,732 8,079 Ⅱ △ △ △ 1. Tangible Asset Disposition(Acquisition) 5,412 7,197 8,081 △ △ △ 2. Financial Instruments Disposition(Acquisition), etc. 1,021 535 2 △ △ . Financing Activities 1,319 179 2,318 Ⅲ △ △ 1. Increase in Borrowings(Decrease) 2,180 832 1,853 △ 2. Dividends Paid, etc. 861 1,011 465 △ △ △ . Others 9 17 214 Ⅳ △ . Net Increase/Decrease in Cash and Cash Equivalents Ⅴ 583 832 3,105 △ △ 1. Cash Balance, Beginning of Period 18,156 18,739 17,907 2. Cash Balance, End of Period 18,739 17,907 14,802