| UNITED STATES |
| SECURITIES AND EXCHANGE COMMISSION |
| Washington, D.C. 20549 |
| FORM N-CSR |
| CERTIFIED SHAREHOLDER REPORT OF REGISTERED MANAGEMENT |
| INVESTMENT COMPANIES |
| Investment Company Act file number 811-6718 |
| Dreyfus Investment Grade Funds, Inc. |
| (Exact name of Registrant as specified in charter) |
| c/o The Dreyfus Corporation |
| 200 Park Avenue |
| New York, New York 10166 |
| (Address of principal executive offices) (Zip code) |
| |
| Michael A. Rosenberg, Esq. |
| 200 Park Avenue |
| New York, New York 10166 |
| (Name and address of agent for service) |
| |
| Registrant's telephone number, including area code: (212) 922-6000 |
| Date of fiscal year end: | | 7/31 |
| Date of reporting period: | | 7/31/07 |
FORM N-CSR
Item 1. Reports to Stockholders.
Save time. Save paper. View your next shareholder report online as soon as it’s available. Log into www.dreyfus.com and sign up for Dreyfus eCommunications. It’s simple and only takes a few minutes.
The views expressed in this report reflect those of the portfolio manager only through the end of the period covered and do not necessarily represent the views of Dreyfus or any other person in the Dreyfus organization. Any such views are subject to change at any time based upon market or other conditions and Dreyfus disclaims any responsibility to update such views.These views may not be relied on as investment advice and, because investment decisions for a Dreyfus fund are based on numerous factors, may not be relied on as an indication of trading intent on behalf of any Dreyfus fund.
Not FDIC-Insured • Not Bank-Guaranteed • May Lose Value
| | | Contents |
| |
| | | THE FUND |
| |
|
| 2 | | A Letter from the CEO |
| 3 | | Discussion of Fund Performance |
| 6 | | Fund Performance |
| 7 | | Understanding Your Fund’s Expenses |
| 7 | | Comparing Your Fund’s Expenses |
| | | With Those of Other Funds |
| 8 | | Statement of Investments |
| 9 | | Statement of Assets and Liabilities |
| 10 | | Statement of Operations |
| 11 | | Statement of Changes in Net Assets |
| 13 | | Financial Highlights |
| 15 | | Notes to Financial Statements |
| 24 | | Report of Independent Registered |
| | | Public Accounting Firm |
| 25 | | Important Tax Information |
| 26 | | Information About the Review and Approval |
| | | of the Fund’s Management Agreement |
| 30 | | Board Members Information |
| 32 | | Officers of the Fund |
| |
| | | FOR MORE INFORMATION |
| |
|
| | | Back Cover |
The Fund
| Dreyfus |
| Inflation Adjusted |
| Securities Fund |

A LETTER FROM THE CEO
Dear Shareholder:
We are pleased to present this annual report for Dreyfus Inflation Adjusted Securities Fund, covering the 12-month period from August 1, 2006, through July 31, 2007.
After rallying earlier in the reporting period amid slowing economic growth and benign inflation, the U.S. bond market has encountered significantly heightened volatility in recent months.While the markets’ nominal returns remained positive for the reporting period overall, the recent sell-off has hurt current year-to-date returns most notably on longer-term and high-yield securities. Fixed-income investors have become less tolerant of risk, due mainly to rate hikes in overseas markets, turmoil in the U.S. sub-prime mortgage sector, stronger economic data and a flood of newly issued high-yield bonds with questionable credit characteristics.
In our view, it is appropriate for the bond market to become more concerned with the pricing of risk, which may help wring excesses out of some market sectors. Furthermore, we view recent volatility in credit-sensitive sectors as offering potential investment opportunities in fundamentally sound securities at relatively attractive prices. As always, we encourage you to talk with your financial advisor, who can help you understand the challenges and potential opportunities presented by today’s more turbulent market conditions.
For information about how the fund performed during the reporting period, as well as market perspectives, we have provided a Discussion of Fund Performance given by the fund’s Portfolio Manager.
Thank you for your continued confidence and support.

| Thomas F. Eggers |
| Chief Executive Officer |
| The Dreyfus Corporation |
| August 15, 2007 |

DISCUSSION OF FUND PERFORMANCE
For the period of August 1, 2006, through July 31, 2007, as provided by Robert Bayston, Portfolio Manager
Fund and Market Performance Overview
For the 12-month period ended July 31, 2007, Dreyfus Inflation Adjusted Securities Fund’s Institutional shares achieved a total return of 4.47%, and its Investor shares achieved a total return of 4.24% ..1 In comparison, the fund’s benchmark, the Lehman Brothers U.S.Treasury Inflation Protected Securities Index (the “Index”), which is not subject to fees and expenses like a mutual fund, achieved a total return of 4.66% for the same period.2 In addition, the average total return of all funds reported in the Lipper Treasury Inflation Protected Securities category was 3.67% over the reporting period.3
Despite several bouts of market volatility, prices of Treasury Inflation Protected Securities (TIPS) ended the reporting period only slightly lower than where they began. The fund’s performance mainly was driven by our yield curve strategy and our full investment in TIPS to the exclusion of other securities.
The Fund’s Investment Approach
The fund seeks returns that exceed the rate of inflation.To pursue this goal, the fund normally invests at least 80% of its assets in inflation-indexed securities, which are fixed-income securities designed to protect investors from a loss of value due to inflation by periodically adjusting their principal and/or coupon according to the rate of inflation.
The fund invests primarily in high-quality, U.S. dollar-denominated, inflation-indexed securities.To a limited extent, the fund may invest in foreign currency-denominated, inflation-protected securities and other fixed-income securities not adjusted for inflation, including U.S. government bonds and notes, corporate bonds, mortgage-related securities and asset-backed securities. The fund seeks to keep its average effective duration between two and 10 years, and the fund may invest in securities of any maturity without restriction.
The Fund 3
DISCUSSION OF FUND PERFORMANCE (continued)
Inflation Remained Moderate Despite Rising Food and Energy Prices
Although slowing economic growth helped support bond prices in most sectors of the U.S. fixed-income market over the first half of the reporting period, inflation-adjusted securities generally lost value relative to nominal Treasuries, as inflation expectations diminished. Most significantly, crude oil and unleaded gasoline prices retreated from previous record highs over the final five months of 2006, helping to alleviate inflation concerns.
However, evidence of stronger economic growth and rising food and energy prices rekindled investors’ inflation fears at times during the reporting period’s second half. Gasoline prices surged in the spring of 2007, when global demand remained robust for a limited supply of oil and gas. By the end of the reporting period, crude oil prices had surpassed the record highs set during the summer of 2006. In addition, U.S. energy prices were pushed higher by unanticipated problems at a number of domestic refineries and low inventory levels prior to the summer “driving season.”
Food prices rose sharply due mainly to intensifying demand for corn-based biofuels and the higher production costs associated with elevated energy prices. Higher grain prices fed through to increased costs of producing beef, pork and other grain-fed meat products. Production shifts toward corn and away from alternative crops also led to reduced supply of other grains. By the end of June 2007, a measure of wholesale food prices had climbed by more than 8% over the previous 12 months.
However, the rate of “core” inflation, which excludes food and energy, peaked in September 2006 when the pace of U.S. economic growth began to moderate. Softer housing markets, slowing retail sales of apparel and poor conditions in the U.S. automotive industry helped keep core inflation in check.As a result, even after accounting for rising food and energy prices, the rate of “headline” inflation was a relatively moderate 2.7% over the course of the full reporting period, slightly higher than the Federal Reserve Board’s (the “Fed”) “comfort zone” of 2% to 2.5% .
An Emphasis on Quality Helped Support Relative Performance
In this changing market environment, we generally maintained the fund’s average duration in a range that was roughly in line with its
benchmark. In addition, we focused primarily on intermediate-term TIPS, and we held a correspondingly underweighted position in longer-term securities.We implemented this “bulleted” yield curve strategy in anticipation of wider yield differences along the market’s maturity range. However, yield differences narrowed slightly over the reporting period, and this strategy detracted slightly from the fund’s relative performance.
We more than made up for any lost ground through our security selection and tactically managing the fund’s duration to changing market conditions.The fund is exclusively invested in U.S.TIPS and therefore has avoided weakness in investments that were affected later in the reporting period by turmoil in the U.S. sub-prime mortgage sector.
The Fund Is Positioned for Steady Interest Rates
As of the reporting period’s end, we have seen little evidence that the Fed is prepared to alter its interest-rate policies, and we have maintained the fund’s generally neutral duration stance.Yet, current turbulence in credit markets suggests to us that yield differences are likely to increase across the market’s maturity range, and we have continued to employ a bulleted yield curve strategy.We also have maintained our emphasis on high-quality securities, which we believe is prudent in today’s relatively volatile market environment.
August 15, 2007
| 1 | | Total return includes reinvestment of dividends and any capital gains paid. Past performance is no |
| | | guarantee of future results. Share price, yield and investment return fluctuate such that upon |
| | | redemption, fund shares may be worth more or less than their original cost. Return figures |
| | | provided reflect the absorption of certain fund expenses by The Dreyfus Corporation pursuant to |
| | | an agreement in effect through July 31, 2008, at which time it may be extended, terminated or |
| | | modified. Had these expenses not been absorbed, the fund’s returns would have been lower. |
| 2 | | SOURCE: LEHMAN BROTHERS INC. — Reflects reinvestment of dividends and, where |
| | | applicable, capital gain distributions.The Lehman Brothers U.S.Treasury Inflation Protected |
| | | Securities Index is a sub-index of the U.S.Treasury component of the Lehman Brothers U.S. |
| | | Government Index. Securities in the Lehman Brothers U.S.Treasury Inflation Protected Securities |
| | | Index are dollar-denominated, non-convertible, publicly issued, fixed-rate, investment-grade |
| | | (Moody’s Baa3 or better) U.S.Treasury inflation notes, with at least one year to final maturity |
| | | and at least $100 million par amount outstanding. |
| 3 | | Source: Lipper Inc. |
The Fund 5
FUND PERFORMANCE
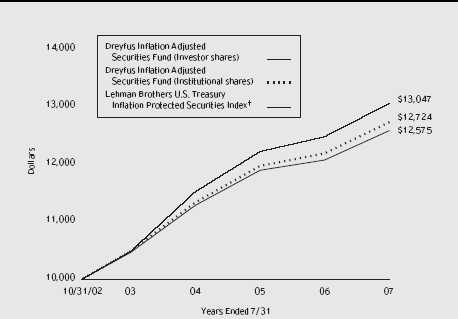
Comparison of change in value of $10,000 investment in Dreyfus Inflation Adjusted Securities Fund Investor shares and Institutional shares and the Lehman Brothers U.S. Treasury Inflation Protected Securities Index
| Average Annual Total Returns as of 7/31/07 | | | | |
| | | Inception | | | | From |
| | | Date | | 1 Year | | Inception |
| |
| |
| |
|
| Investor shares | | 10/31/02 | | 4.24% | | 4.94% |
| Institutional shares | | 10/31/02 | | 4.47% | | 5.20% |
| † Source: Lipper Inc. |
| Past performance is not predictive of future performance.The fund’s performance shown in the graph and table does not |
| reflect the deduction of taxes that a shareholder would pay on fund distributions or the redemption of fund shares. |
| The above graph compares a $10,000 investment made in Investor and Institutional shares of Dreyfus Inflation Adjusted |
| Securities Fund on 10/31/02 (inception date) to a $10,000 investment made in the Lehman Brothers U.S.Treasury |
| Inflation Protected Securities Index (the “Index”) on that date.All dividends and capital gain distributions are reinvested. |
| The fund’s performance shown in the line graph takes into account all applicable fees and expenses.The Index is a |
| sub-index of the U.S.Treasury component of the Lehman Brothers U.S. Government Index. Securities in the Index are |
| dollar-denominated, non-convertible, publicly-issued, fixed-rate, investment-grade (Moody’s Baa3 or better) U.S. |
| Treasury inflation notes, with at least one year to final maturity and at least $100 million par amount outstanding. |
| The Index does not take into account charges, fees and other expenses. Further information relating to fund |
| performance, including expense reimbursements, if applicable, is contained in the Financial Highlights section of the |
| prospectus and elsewhere in this report. |
6
U N D E R S TA N D I N G YO U R F U N D ’ S E X P E N S E S ( U n a u d i t e d )
As a mutual fund investor, you pay ongoing expenses, such as management fees and other expenses. Using the information below, you can estimate how these expenses affect your investment and compare them with the expenses of other funds.You also may pay one-time transaction expenses, including sales charges (loads) and redemption fees, which are not shown in this section and would have resulted in higher total expenses. For more information, see your fund’s prospectus or talk to your financial adviser.
Review your fund’s expenses
The table below shows the expenses you would have paid on a $1,000 investment in Dreyfus Inflation Adjusted Securities Fund from February 1, 2007 to July 31, 2007. It also shows how much a $1,000 investment would be worth at the close of the period, assuming actual returns and expenses.
| Expenses and Value of a $1,000 Investment | | |
| assuming actual returns for the six months ended July 31, 2007 | | |
| | | Investor Shares | | Institutional Shares |
| |
| |
|
| Expenses paid per $1,000 † | | $ 2.78 | | $ 1.52 |
| Ending value (after expenses) | | $1,037.40 | | $1,038.40 |
COMPARING YOUR FUND’S EXPENSES WITH THOSE OF OTHER FUNDS (Unaudited)
Using the SEC’s method to compare expenses
The Securities and Exchange Commission (SEC) has established guidelines to help investors assess fund expenses. Per these guidelines, the table below shows your fund’s expenses based on a $1,000 investment, assuming a hypothetical 5% annualized return. You can use this information to compare the ongoing expenses (but not transaction expenses or total cost) of investing in the fund with those of other funds.All mutual fund shareholder reports will provide this information to help you make this comparison. Please note that you cannot use this information to estimate your actual ending account balance and expenses paid during the period.
Expenses and Value of a $1,000 Investment assuming a hypothetical 5% annualized return for the six months ended July 31, 2007
| | | Investor Shares | | Institutional Shares |
| |
| |
|
| Expenses paid per $1,000 † | | $ 2.76 | | $ 1.51 |
| Ending value (after expenses) | | $1,022.07 | | $1,023.31 |
† Expenses are equal to the fund’s annualized expense ratio of .55% for Investor shares and .30% for Institutional shares, multiplied by the average account value over the period, multiplied by 181/365 (to reflect the one-half year period).
The Fund 7
| STATEMENT OF INVESTMENTS |
| July 31, 2007 |
| | | Principal | | |
| Bonds and Notes—99.8% | | Amount ($) | | Value ($) |
| |
| |
|
| U.S. Treasury Inflation Protected Securities: | | |
| 0.88%, 4/15/10 | | 276,560 a,b | | 263,690 |
| 1.63%, 1/15/15 | | 634,794 a,b | | 598,210 |
| 1.88%, 7/15/13 | | 656,560 a,b | | 636,371 |
| 2.00%, 1/15/14 | | 426,451 a,b | | 414,538 |
| 2.00%, 7/15/14 | | 426,853 a,b | | 414,797 |
| 2.00%, 1/15/26 | | 339,396 b | | 316,945 |
| 2.38%, 1/15/25 | | 266,921 b | | 264,200 |
| 2.63%, 7/15/17 | | 155,488 b | | 158,118 |
| 3.00%, 7/15/12 | | 555,038 a,b | | 570,025 |
| 3.50%, 1/15/11 | | 635,511 a,b | | 656,689 |
| 3.63%, 4/15/28 | | 383,064 b | | 457,881 |
| 3.88%, 4/15/29 | | 376,881 a,b | | 469,604 |
| Total Bonds and Notes | | | | |
| (cost $5,113,347) | | | | 5,221,068 |
| |
| |
|
| |
| Investment of Cash Collateral | | | | |
| for Securities Loaned—3.0% | | Shares | | Value ($) |
| |
| |
|
| Registered Investment Company; | | | | |
| Dreyfus Institutional Cash | | | | |
| Advantage Plus Fund | | | | |
| (cost $156,750) | | 156,750 c | | 156,750 |
| |
| |
|
| |
| Total Investments (cost $5,270,097) | | 102.8% | | 5,377,818 |
| |
| Liabilities, Less Cash and Receivables | | (2.8%) | | (146,785) |
| |
| Net Assets | | 100.0% | | 5,231,033 |
| a All or a portion of these securities are on loan. At July 31, 2007, the total market value of the fund’s securities on |
| loan is $1,755,859 and the total market value of the collateral held by the fund is $1,778,625, consisting of cash |
| collateral of $156,750 and U.S. Government and agency securities valued at $1,621,875. |
| b Principal amount for accrual purposes is periodically adjusted based on changes in the Consumer Price Index. |
| c Investment in affiliated money market mutual fund. |
| Portfolio Summary (Unaudited) † | | | | |
| | | Value (%) | | | | Value (%) |
| |
| |
| |
|
| U.S. Government & Agencies | | 99.8 | | Money Market Investment | | 3.0 |
| | | | | | | 102.8 |
| † Based on net assets. | | | | | | |
| See notes to financial statements. | | | | | | |
8
| STATEMENT OF ASSETS AND LIABILITIES |
| July 31, 2007 |
| | | Cost | | Value |
| |
| |
|
| Assets ($): | | | | |
| Investments in securities—See Statement | | | | |
| of Investments (including securities on loan, | | |
| valued at $1,755,859)—Note 1(b): | | | | |
| Unaffiliated issuers | | 5,113,347 | | 5,221,068 |
| Affiliated issuers | | 156,750 | | 156,750 |
| Cash | | | | 41,135 |
| Cash denominated in foreign currencies | | 2 | | 3 |
| Receivable for investment securities sold | | | | 167,834 |
| Dividends and interest receivable | | | | 13,346 |
| Prepaid expenses | | | | 6,514 |
| Due from The Dreyfus Corporation and affiliates—Note 3(b) | | 1,110 |
| | | | | 5,607,760 |
| |
| |
|
| Liabilities ($): | | | | |
| Payable for investment securities purchased | | 183,151 |
| Liability for securities on loan—Note 1(b) | | | | 156,750 |
| Payable for shares of Common Stock redeemed | | 103 |
| Accrued expenses | | | | 36,723 |
| | | | | 376,727 |
| |
| |
|
| Net Assets ($) | | | | 5,231,033 |
| |
| |
|
| Composition of Net Assets ($): | | | | |
| Paid-in capital | | | | 5,664,482 |
| Accumulated distributions in excess of investment income—net | | (264,887) |
| Accumulated net realized gain (loss) on investments | | (276,283) |
| Accumulated net unrealized appreciation | | | | |
| (depreciation) on investments | | | | 107,721 |
| |
| |
|
| Net Assets ($) | | | | 5,231,033 |
| |
| |
|
| |
| |
| Net Asset Value Per Share | | | | |
| | | Investor Shares | | Institutional Shares |
| |
| |
|
| Net Assets ($) | | 2,538,327 | | 2,692,706 |
| Shares Outstanding | | 217,578 | | 230,844 |
| |
| |
|
| Net Asset Value Per Share ($) | | 11.67 | | 11.66 |
See notes to financial statements.
The Fund 9
| STATEMENT OF OPERATIONS |
| Year Ended July 31, 2007 |
| Investment Income ($): | | |
| Income: | | |
| Interest | | 123,433 |
| Dividends; | | 2,646 |
| Income from securities lending | | 287 |
| Total Income | | 126,366 |
| Expenses: | | |
| Management fee—Note 3(a) | | 16,058 |
| Auditing fees | | 31,380 |
| Registration fees | | 27,938 |
| Prospectus and shareholders’ reports | | 9,033 |
| Shareholder servicing costs—Note 3(b) | | 7,604 |
| Legal fees | | 4,626 |
| Custodian fees—Note 3(b) | | 2,599 |
| Directors’ fees and expenses—Note 3(c) | | 701 |
| Loan commitment fees—Note 2 | | 18 |
| Miscellaneous | | 5,072 |
| Total Expenses | | 105,029 |
| Less—expense reimbursement from | | |
| The Dreyfus Corporation due to undertaking—Note 3(a) | | (82,524) |
| Less—reduction in custody fees due to | | |
| earnings credits—Note 1(b) | | (1,061) |
| Net Expenses | | 21,444 |
| Investment Income—Net | | 104,922 |
| |
|
| Realized and Unrealized Gain (Loss) on Investments—Note 4 ($): |
| Net realized gain (loss) on investments | | 24,250 |
| Net realized gain (loss) on financial futures | | (3,632) |
| Net realized gain (loss) on options transactions | | 270 |
| Net Realized Gain (loss) | | 20,888 |
| Net unrealized appreciation (depreciation) on investments | | |
| (including $2,531 net unrealized appreciation on financial futures) | | 119,459 |
| Net Realized and Unrealized Gain (Loss) on Investments | | 140,347 |
| Net Increase in Net Assets Resulting from Operations | | 245,269 |
See notes to financial statements.
STATEMENT OF CHANGES IN NET ASSETS
| | | | | Year Ended July 31, |
| |
| |
|
| | | 2007 | | 2006 |
| |
| |
|
| Operations ($): | | | | |
| Investment income—net | | 104,922 | | 150,994 |
| Net realized gain (loss) on investments | | 20,888 | | (49,174) |
| Net unrealized appreciation | | | | |
| (depreciation) on investments | | 119,459 | | 9,514 |
| Net Increase (Decrease) in Net Assets | | | | |
| Resulting from Operations | | 245,269 | | 111,334 |
| |
| |
|
| Dividends to Shareholders from ($): | | | | |
| Investment income—net: | | | | |
| Investor Shares | | (110,748) | | (184,050) |
| Institutional Shares | | (124,621) | | (213,355) |
| Net realized gain on investments: | | | | |
| Investor Shares | | — | | (34,693) |
| Institutional Shares | | — | | (39,384) |
| Total Dividends | | (235,369) | | (471,482) |
| |
| |
|
| Capital Stock Transactions ($): | | | | |
| Net proceeds from shares sold: | | | | |
| Investor Shares | | 108,727 | | 364,915 |
| Institutional Shares | | 34,575 | | 60,530 |
| Dividends reinvested: | | | | |
| Investor Shares | | 109,794 | | 217,763 |
| Institutional Shares | | 105,738 | | 227,303 |
| Cost of shares redeemed: | | | | |
| Investor Shares | | (954,237) | | (151,409) |
| Institutional Shares | | (915,537) | | (40,328) |
| Increase (Decrease) in Net Assets | | | | |
| from Capital Stock Transactions | | (1,510,940) | | 678,774 |
| Total Increase (Decrease) in Net Assets | | (1,501,040) | | 318,626 |
| |
| |
|
| Net Assets ($): | | | | |
| Beginning of Period | | 6,732,073 | | 6,413,447 |
| End of Period | | 5,231,033 | | 6,732,073 |
| Distributions in excess of investment income—net | | (264,887) | | (232,810) |
The Fund 11
STATEMENT OF CHANGES IN NET ASSETS (continued)
| | | | | Year Ended July 31, |
| |
| |
|
| | | 2007 | | 2006 |
| |
| |
|
| Capital Share Transactions: | | | | |
| Investor Shares | | | | |
| Shares sold | | 9,334 | | 30,623 |
| Shares issued for dividends reinvested | | 9,398 | | 18,200 |
| Shares redeemed | | (80,937) | | (12,780) |
| Net Increase (Decrease) in Shares Outstanding | | (62,205) | | 36,043 |
| |
| |
|
| Institutional Shares | | | | |
| Shares sold | | 2,975 | | 5,079 |
| Shares issued for dividends reinvested | | 9,048 | | 18,988 |
| Shares redeemed | | (77,605) | | (3,359) |
| Net Increase (Decrease) in Shares Outstanding | | (65,582) | | 20,708 |
See notes to financial statements.
FINANCIAL HIGHLIGHTS
The following tables describe the performance for each share class for the fiscal periods indicated.All information (except portfolio turnover rate) reflects financial results for a single fund share.Total return shows how much your investment in the fund would have increased (or decreased) during each period, assuming you had reinvested all dividends and distributions.These figures have been derived from the fund’s financial statements.
| | | | | Year Ended July 31, | | |
| |
| |
| |
|
| Investor Shares | | 2007 | | 2006 | | 2005 | | 2004 | | 2003 a |
| |
| |
| |
| |
| |
|
| Per Share Data ($): | | | | | | | | | | |
| Net asset value, beginning of period | | 11.69 | | 12.34 | | 12.25 | | 12.69 | | 12.50 |
| Investment Operations: | | | | | | | | | | |
| Investment income—net b | | .21 | | .26 | | .25 | | .26 | | .23 |
| Net realized and unrealized | | | | | | | | | | |
| gain (loss) on investments | | .27 | | (.06) | | .40 | | .71 | | .35 |
| Total from Investment Operations | | .48 | | .20 | | .65 | | .97 | | .58 |
| Distributions: | | | | | | | | | | |
| Dividends from investment income—net | | (.50) | | (.71) | | (.56) | | (.55) | | (.39) |
| Dividends from net realized | | | | | | | | | | |
| gain on investments | | — | | (.14) | | — | | (.86) | | — |
| Total Distributions | | (.50) | | (.85) | | (.56) | | (1.41) | | (.39) |
| Net asset value, end of period | | 11.67 | | 11.69 | | 12.34 | | 12.25 | | 12.69 |
| |
| |
| |
| |
| |
|
| Total Return (%) | | 4.24 | | 1.51 | | 5.39 | | 7.79 | | 4.63c |
| |
| |
| |
| |
| |
|
| Ratios/Supplemental Data (%): | | | | | | | | | | |
| Ratio of total expenses | | | | | | | | | | |
| to average net assets | | 2.10 | | 1.88 | | 1.74 | | 1.80 | | 3.30d |
| Ratio of net expenses | | | | | | | | | | |
| to average net assets | | .53 | | .55 | | .55 | | .55 | | .55d |
| Ratio of net investment income | | | | | | | | | | |
| to average net assets | | 1.83 | | 2.18 | | 2.00 | | 2.05 | | 2.33d |
| Portfolio Turnover Rate | | 18.17 | | 60.82 | | 118.91 | | 951.51 | | 1,306.72c |
| |
| |
| |
| |
| |
|
| Net Assets, end of period ($ x 1,000) | | 2,538 | | 3,269 | | 3,009 | | 2,857 | | 2,650 |
| a | | From October 31, 2002 (commencement of operations) to July 31, 2003. |
| b | | Based on average shares outstanding at each month end. |
| c | | Not annualized. |
| d | | Annualized. |
| See notes to financial statements. |
The Fund 13
FINANCIAL HIGHLIGHTS (continued)
| | | | | Year Ended July 31, | | |
| |
| |
| |
|
| Institutional Shares | | 2007 | | 2006 | | 2005 | | 2004 | | 2003 a |
| |
| |
| |
| |
| |
|
| Per Share Data ($): | | | | | | | | | | |
| Net asset value, beginning of period | | 11.68 | | 12.35 | | 12.25 | | 12.69 | | 12.50 |
| Investment Operations: | | | | | | | | | | |
| Investment income—net b | | .24 | | .29 | | .28 | | .27 | | .25 |
| Net realized and unrealized | | | | | | | | | | |
| gain (loss) on investments | | .26 | | (.07) | | .41 | | .73 | | .35 |
| Total from Investment Operations | | .50 | | .22 | | .69 | | 1.00 | | .60 |
| Distributions: | | | | | | | | | | |
| Dividends from investment income—net | | (.52) | | (.75) | | (.59) | | (.58) | | (.41) |
| Dividends from net realized | | | | | | | | | | |
| gain on investments | | — | | (.14) | | — | | (.86) | | — |
| Total Distributions | | (.52) | | (.89) | | (.59) | | (1.44) | | (.41) |
| Net asset value, end of period | | 11.66 | | 11.68 | | 12.35 | | 12.25 | | 12.69 |
| |
| |
| |
| |
| |
|
| Total Return (%) | | 4.47 | | 1.82 | | 5.60 | | 8.06 | | 4.82c |
| |
| |
| |
| |
| |
|
| Ratios/Supplemental Data (%): | | | | | | | | | | |
| Ratio of total expenses | | | | | | | | | | |
| to average net assets | | 1.83 | | 1.63 | | 1.49 | | 1.54 | | 3.06d |
| Ratio of net expenses | | | | | | | | | | |
| to average net assets | | .28 | | .30 | | .30 | | .30 | | .30d |
| Ratio of net investment income | | | | | | | | | | |
| to average net assets | | 2.08 | | 2.43 | | 2.26 | | 2.17 | | 2.58d |
| Portfolio Turnover Rate | | 18.17 | | 60.82 | | 118.91 | | 951.51 | | 1,306.72c |
| |
| |
| |
| |
| |
|
| Net Assets, end of period ($ x 1,000) | | 2,693 | | 3,463 | | 3,405 | | 3,296 | | 2,621 |
| a | | From October 31, 2002 (commencement of operations) to July 31, 2003. |
| b | | Based on average shares outstanding at each month end. |
| c | | Not annualized. |
| d | | Annualized. |
| See notes to financial statements. |
NOTES TO FINANCIAL STATEMENTS
NOTE 1—Significant Accounting Policies:
Dreyfus Inflation Adjusted Securities Fund (the “fund”) is a separate diversified series of Dreyfus Investment Grade Funds, Inc. (the “Company”) which is registered under the Investment Company Act of 1940, as amended (the “Act”), as an open-end management investment company and operates as a series company currently offering four series, including the fund.The fund’s investment objective is to seek returns that exceed the rate of inflation.The Dreyfus Corporation (the “Manager” or “Dreyfus”) serves as the fund’s investment adviser. During the reporting period, the Manager was a wholly-owned subsidiary of Mellon Financial Corporation (“Mellon Financial”). During the reporting period, Dreyfus Service Corporation (the “Distributor”), a wholly-owned subsidiary of the Manager, served as the distributor of the fund’s shares which are sold to the public without a sales charge. Effective June 30, 2007, the Distributor became known as MBSC Securities Corporation.
On July 1, 2007, the Mellon Financial and The Bank of New York Company, Inc. merged, forming The Bank of New York Mellon Corporation. As part of this transaction, Dreyfus became a wholly-owned subsidiary of The Bank of New York Mellon Corporation.
The fund is authorized to issue 500 million shares of $.001 par value Common Stock in each of the following classes of shares: Investor and Institutional. Investor shares are subject to a shareholder services plan. Other differences between the classes include the services offered to and the expenses borne by each class, the minimum initial investment and certain voting rights. Income, expenses (other than expenses attributable to a specific class), and realized and unrealized gains or losses on investments are allocated to each class of shares based on its relative net assets.
As of July 31, 2007, MBC Investments Corp., an indirect subsidiary of Mellon Financial, held 190,413 Investor shares and 193,451 Institutional shares.
The Fund 15
NOTES TO FINANCIAL STATEMENTS (continued)
The Company accounts separately for the assets, liabilities and operations of each series. Expenses directly attributable to each series are charged to that series’ operations; expenses which are applicable to all series are allocated among them on a pro rata basis.
The fund’s financial statements are prepared in accordance with U.S. generally accepted accounting principles, which may require the use of management estimates and assumptions. Actual results could differ from those estimates.
The fund enters into contracts that contain a variety of indemnifications. The fund’s maximum exposure under these arrangements is unknown.The fund does not anticipate recognizing any loss related to these arrangements.
(a) Portfolio valuation: Investments in securities excluding short-term investments (other than U.S. Treasury Bills), financial futures and options are valued each business day by an independent pricing service (the “Service”) approved by the Board of Directors. Investments for which quoted bid prices are readily available and are representative of the bid side of the market in the judgment of the Service are valued at the mean between the quoted bid prices (as obtained by the Service from dealers in such securities) and asked prices (as calculated by the Service based upon its evaluation of the market for such securities). Other investments (which constitute a majority of the portfolio securities) are valued as determined by the Service, based on methods which include consideration of: yields or prices of securities of comparable quality, coupon, maturity and type; indications as to values from dealers; and general market conditions. Restricted securities, as well as securities or other assets for which recent market quotations are not readily available, that are not valued by a pricing service approved by the Board of Directors, or are determined by the fund not to reflect accurately fair value, are valued at fair value as determined in good faith under the direction of the Board of Directors.The factors that may be considered when fair valuing a security include fundamental analytical
data, the nature and duration of restrictions on disposition, an evaluation of the forces that influence the market in which the securities are purchased and sold and public trading in similar securities of the issuer or comparable issuers. Short-term investments, excluding U.S.Treasury Bills, are carried at amortized cost, which approximates value. Registered open-end investment companies that are not traded on an exchange are valued at their net asset value. Financial futures and options, which are traded on an exchange, are valued at the last sales price on the securities exchange on which such securities are primarily traded or at the last sales price on the national securities market on each business day. Options traded over-the-counter are priced at the mean between the bid and asked price.
On September 20, 2006, the Financial Accounting Standards Board (FASB) released Statement of Financial Accounting Standards No. 157 “Fair Value Measurements” (“FAS 157”). FAS 157 establishes an authoritative definition of fair value, sets out a framework for measuring fair value, and requires additional disclosures about fair-value measurements. The application of FAS 157 is required for fiscal years beginning after November 15, 2007 and interim periods within those fiscal years. Management does not believe that the application of this standard will have a material impact on the financial statements of the fund.
(b) Securities transactions and investment income: Securities transactions are recorded on a trade date basis. Realized gain and loss from securities transactions are recorded on the identified cost basis. Dividend income is recognized on the ex-dividend date and interest income, including, where applicable, accretion of discount and amortization of premium on investments, is recognized on the accrual basis.
The fund has an arrangement with the custodian bank whereby the fund receives earnings credits from the custodian when positive cash balances are maintained, which are used to offset custody fees. For financial reporting purposes, the fund includes net earnings credits as an expense offset in the Statement of Operations.
The Fund 17
NOTES TO FINANCIAL STATEMENTS (continued)
Pursuant to a securities lending agreement with Mellon Bank, N.A., an affiliate of the Manager, the fund may lend securities to qualified institutions. It is the fund’s policy, that at origination, all loans are secured by collateral of at least 102% of the value of U.S. securities loaned and 105% of the value of foreign securities loaned. It is the portfolio’s policy that collateral equivalent to at least 100% of the market value of securities on loan is maintained at all times. Cash collateral is invested in certain money market mutual funds managed by the Manager.The fund is entitled to receive all income on securities loaned, in addition to income earned as a result of the lending transaction. Although each security loaned is fully collateralized, the fund bears the risk of delay in recovery of, or loss of rights in, the securities loaned should a borrower fail to return the securities in a timely manner.
(c) Affiliated issuers: Investments in other investment companies advised by the Manager are defined as “affiliated” in the Act.
(d) Dividends to shareholders: It is the policy of the fund to declare dividends daily from investment income-net. Such dividends are paid monthly. Dividends from net realized capital gain, if any, are normally declared and paid annually, but the fund may make distributions on a more frequent basis to comply with the distribution requirements of the Internal Revenue Code of 1986, as amended (the “Code”).To the extent that net realized capital gain can be offset by capital loss carryovers, it is the policy of the fund not to distribute such gain. Income and capital gain distributions are determined in accordance with income tax regulations, which may differ from U.S. generally accepted accounting principles.
(e) Federal income taxes: It is the policy of the fund to continue to qualify as a regulated investment company, if such qualification is in the best interests of its shareholders, by complying with the applicable provisions of the Code, and to make distributions of taxable income sufficient to relieve it from substantially all federal income and excise taxes.
The FASB released FASB Interpretation No. 48 “Accounting for Uncertainty in Income Taxes” (FIN 48). FIN 48 provides guidance
for how uncertain tax positions should be recognized, measured, presented and disclosed in the financial statements. FIN 48 requires the evaluation of tax positions taken or expected to be taken in the course of preparing the fund’s tax returns to determine whether the tax positions are “more-likely-than-not” of being sustained by the applicable tax authority.Tax positions not deemed to meet the more-likely-than-not threshold would be recorded as a tax benefit or expense in the current year.Adoption of FIN 48 is required for fiscal years beginning after December 15, 2006 and is to be applied to all open tax years as of the effective date. Management does not believe that the application of this standard will have a material impact on the financial statements of the fund.
At July 31, 2007, the components of accumulated earnings on a tax basis were as follows: undistributed ordinary income $27,459, accumulated capital losses $271,230 and unrealized depreciation $184,829. In addition, the fund had $4,849 of capital losses realized after October 31, 2006, which were deferred for tax purposes to the first day of the following fiscal year.
The accumulated capital loss carryover is available to be applied against future net securities profits, if any, realized subsequent to July 31,2007. If not applied,$8,577 of the carryover expires in fiscal 2014 and $262,653 expires in fiscal 2015.
The tax character of distributions paid to shareholders during the fiscal periods ended July 31, 2007 and July 31, 2006, were as follows: ordinary income $235,369 and $423,164 and long term capital gains $0 and 48,318, respectively.
During the period ended July 31, 2007, as a result of permanent book to tax differences primarily due to the tax treatment for treasury inflation protected securities, the fund increased accumulated undistributed investment income-net by $98,370 and decreased accumulated net realized gain (loss) on investments by same amount. Net assets were not affected by this reclassification
The Fund 19
NOTES TO FINANCIAL STATEMENTS (continued)
NOTE 2—Bank Line of Credit:
The fund participates with other Dreyfus-managed funds in a $350 million redemption credit facility (the “Facility”) to be utilized for temporary or emergency purposes, including the financing of redemptions. In connection therewith, the fund has agreed to pay commitment fees on its pro rata portion of the Facility. Interest is charged to the fund based on prevailing market rates in effect at the time of borrowings. During the period ended July 31, 2007, the fund did not borrow under the Facility.
NOTE 3—Management Fee and Other Transactions With Affiliates:
(a) Pursuant to a management agreement (“Agreement”) with the Manager, the management fee is computed at the annual rate of .30% of the value of the fund’s average daily net assets and is payable monthly. The Manager has undertaken from August 1, 2006 through July 31, 2008 that if the aggregated expenses of the fund, exclusive of taxes, brokerage fees, shareholder services plan fees and extraordinary expenses, exceed an annual rate of .30% of the value of the fund’s average daily net assets, the fund may deduct from the payment to be made to the Manager under the Agreement, or the Manager will bear, such excess expense. The expense reimbursement, pursuant to the undertaking, amounted to $82,524 during the period ended July 31, 2007.
(b) Under the Investor Shares Shareholder Services Plan, the fund pays the Distributor at an annual rate of .25% of the value of Investor Shares average daily net assets for the provision of certain services. The services provided may include personal services relating to shareholder accounts, such as answering shareholder inquiries regarding the fund and providing reports and other information, and services related to the maintenance of shareholder accounts.The Distributor may make payments to Service Agents (a securities dealer, financial institution or
other industry professional) in respect of these services.The Distributor determines the amounts to be paid to Service Agents. During the period ended July 31, 2007, Investor Shares were charged $6,448 pursuant to the Shareholder Services Plan.
The fund compensates Dreyfus Transfer, Inc., a wholly-owned subsidiary of the Manager, under a transfer agency agreement for providing personnel and facilities to perform transfer agency services for the fund. During the period ended July 31, 2007, the fund was charged $643 pursuant to the transfer agency agreement.
The fund compensates Mellon Bank, N.A., an affiliate of the Manager, under a custody agreement for providing custodial services for the fund. During the period ended July 31, 2007, the fund was charged $2,599 pursuant to the custody agreement.
During the period ended July 31, 2007, the fund was charged $4,499 for services performed by the Chief Compliance Officer.
The components of “Due from The Dreyfus Corporation and affiliates” in the Statement of Assets and Liabilities consist of: management fees $1,305, shareholder services plan fees $528, custodian fees $1,166, chief compliance officer fees $1,607 and transfer agency per account fees $59, which are offset against an expense reimbursement currently in effect in the amount of $5,775.
(c) Each Board member also serves as a Board member of other funds within the Dreyfus complex. Annual retainer fees and attendance fees are allocated to each fund based on net assets.
(d) Pursuant to an exemptive order from the SEC, the fund may invest its available cash balances in affiliated money market mutual funds. Management fees of the underlying money market mutual funds have been waived by the Manager.
The Fund 21
NOTES TO FINANCIAL STATEMENTS (continued)
NOTE 4—Securities Transactions:
The aggregate amount of purchases and sales (including paydowns) of investment securities, excluding short-term securities, financial futures and options during the period ended July 31, 2007, amounted to $977,856 and $2,520,737, respectively.
The fund may invest in financial futures contracts in order to gain exposure to or protect against changes in the market. The fund is exposed to market risk as a result of changes in the value of the underlying financial instruments. Investments in financial futures require the fund to “mark to market” on a daily basis, which reflects the change in the market value of the contracts at the close of each day’s trading. Accordingly, variation margin payments are received or made to reflect daily unrealized gains or losses.When the contracts are closed, the fund recognizes a realized gain or loss.These investments require initial margin deposits with a broker, which consist of cash or cash equivalents. The amount of these deposits is determined by the exchange or Board of Trade on which the contract is traded and is subject to change.
The fund may purchase and write (sell) call/put options in order to gain exposure to or protect against changes in the market.
As a writer of call options, the fund receives a premium at the outset and then bears the market risk of unfavorable changes in the price of the financial instruments underlying the options. Generally, the fund would incur a gain, to the extent of the premium, if the price of the underlying financial instrument decreases between the date the option is written and the date on which the option is terminated. Generally, the fund would realize a loss, if the price of the financial instrument increases between those dates.
As a writer of put options, the fund receives a premium at the outset and then bears the market risk of unfavorable changes in the price of the financial instruments underlying the options. Generally, the fund would incur a gain, to the extent of the premium, if the price of the underlying financial instrument increases between the date the option
is written and the date on which the option is terminated. Generally, the fund would realize a loss, if the price of the financial instrument decreases between those dates.
In addition, the following table summarizes the fund’s call/put options written during the period ended July 31, 2007:
| | | Face Amount | | | | Options Terminated |
| | | | | |
|
| | | Covered by | | Premiums | | | | Net Realized |
| Options Written: | | Contracts ($) | | Received ($) | | Costs ($) | | Gain ($) |
| |
| |
| |
| |
|
| Contracts outstanding | | | | | | | | |
| July 31, 2006 | | — | | — | | | | |
| Contracts written | | 500,000 | | 530 | | | | |
| Contracts Terminated: | | | | | | | | |
| Closed | | 500,000 | | 530 | | 172 | | 358 |
| Contracts outstanding | | | | | | | | |
| July 31, 2007 | | — | | — | | | | |
At July 31, 2007, the cost of investments for federal income tax purposes was $5,562,647; accordingly, accumulated net unrealized depreciation on investments was $184,829, consisting of $114,602 gross unrealized appreciation and $299,431 gross unrealized depreciation.
The Fund 23
REPORT OF INDEPENDENT REGISTERED PUBLIC ACCOUNTING FIRM
Shareholders and Board of Directors Dreyfus Inflation Adjusted Securities Fund
We have audited the accompanying statement of assets and liabilities, including the statements of investments and financial futures, of Dreyfus Inflation Adjusted Securities (one of the funds comprising Dreyfus Investment Grade Bond Funds), as of July 31, 2007, and the related statement of operations for the year then ended, the statement of changes in net assets for each of the two years in the period then ended, and financial highlights for each of the periods indicated therein.These financial statements and financial highlights are the responsibility of the Fund’s management. Our responsibility is to express an opinion on these financial statements and financial highlights based on our audits.
We conducted our audits in accordance with the standards of the Public Company Accounting Oversight Board (United States).Those standards require that we plan and perform the audit to obtain reasonable assurance about whether the financial statements and financial highlights are free of material misstatement.We were not engaged to perform an audit of the Fund’s internal control over financial reporting. Our audits included consideration of internal control over financial reporting as a basis for designing audit procedures that are appropriate in the circumstances, but not for the purpose of expressing an opinion on the effectiveness of the Fund’s internal control over financial reporting. Accordingly, we express no such opinion.An audit also includes examining, on a test basis, evidence supporting the amounts and disclosures in the financial statements and financial highlights, assessing the accounting principles used and significant estimates made by management, and evaluating the overall financial statement presentation. Our procedures included confirmation of securities owned as of July 31, 2007 by correspondence with the custodian and others. We believe that our audits provide a reasonable basis for our opinion.
In our opinion, the financial statements and financial highlights referred to above present fairly, in all material respects, the financial position of Dreyfus Inflation Adjusted Securities Fund at July 31, 2007, the results of its operations for the year then ended,the changes in its net assets for each of the two years in the period then ended, and the financial highlights for each of the indicated periods, in conformity with U.S. generally accepted accounting principles.

New York, New York September 14, 2007
24
IMPORTANT TAX INFORMATION (Unaudited)
For federal tax purposes the fund hereby designates 100% of ordinary income dividends paid during the fiscal year ended July 31, 2007 as qualifying “interest related dividends.” Also for state individual income tax purposes, the fund hereby designates 98.32% of the ordinary income dividends paid during its fiscal year ended July 31, 2007 as attributable to interest income from direct obligations of the United States. Such dividends are currently exempt from taxation for individual income tax purposes in most states, including New York, California and the District of Columbia.
The Fund 25
INFORMATION ABOUT THE REVIEW AND APPROVAL OF THE FUND’S MANAGEMENT AGREEMENT (Unaudited)
At a meeting of the fund’s Board of Directors held on July 19 and 20, 2007, the Board considered the re-approval for an annual period (through July 29,2008) of the Management Agreement with Dreyfus for the fund, pursuant to which Dreyfus provides the fund with investment advisory and administrative services. The Board members, none of whom are “interested persons” (as defined in the Investment Company Act of 1940, as amended) of the fund, were assisted in their review by independent legal counsel and met with counsel in executive session separate from representatives of Dreyfus.
Analysis of Nature, Extent and Quality of Services Provided to the Fund. The Board members received a presentation from representatives of Dreyfus regarding services provided to the fund and other funds in the Dreyfus fund complex, and discussed the nature, extent and quality of the services provided to the fund pursuant to its Management Agreement. Dreyfus’ representatives reviewed the fund’s distribution of accounts and the relationships Dreyfus has with various intermediaries and the different needs of each. Dreyfus’ representatives noted the distribution channels for the fund as well as the diversity of distribution among the funds in the Dreyfus fund complex, and Dreyfus’ corresponding need for broad, deep, and diverse resources to be able to provide ongoing shareholder services to each distribution channel, including those of the fund. Dreyfus also provided the number of shareholder accounts in the fund, as well as the fund’s asset size.
The Board members also considered Dreyfus’ research and portfolio management capabilities and that Dreyfus also provides oversight of day-to-day fund operations, including fund accounting and administration and assistance in meeting legal and regulatory requirements. The Board members also considered Dreyfus’ extensive administrative, accounting and compliance infrastructure.
Comparative Analysis of the Fund’s Performance and Management Fee and Expense Ratio. The Board members reviewed the performance of the fund’s Investor Shares and comparisons to a group of retail no-load and front-end load Treasury inflation-protected securities funds (the
“Performance Group”) and to a larger universe of funds, consisting of all retail no-load and front-end load Treasury inflation-protected securities funds, excluding outliers (the “Performance Universe”), selected and provided by Lipper, Inc., an independent provider of investment company data. The Board was provided with a description of the methodology Lipper used to select the Performance Group and Performance Universe, as well as the Expense Group and Expense Universe (discussed below).The Board members discussed the results of the comparisons for various periods ended May 31, 2007. The Board members noted that the fund’s total return performance was above the Performance Group median for the one-and three-year periods, below the Performance Group median for the two-year and four-year periods, and above the Performance Universe median for each period except the four-year period; with respect to those periods where fund performance was below the median, the Board members noted the close proximity of the fund’s performance to the median. The Board members noted that the fund’s yield performance was above the Performance Group and Performance Universe medians for each period. Dreyfus also provided a comparison of the fund’s total returns to the returns of the fund’s benchmark index for each of the calendar years for the past four years.
The Board members also discussed the fund’s management fee and expense ratio and reviewed the range of management fees and expense ratios as compared to a comparable group of funds (the “Expense Group”) and a broader group of funds (the “Expense Universe”), each selected and provided by Lipper. The Board members noted that the fund’s contractual management fee was lower than the Expense Group median, and that the actual management fee and total expense ratio were lower than the Expense Group and Expense Universe medians, which included the undertaking by Dreyfus to limit the fund’s expense ratio. The Board noted that the fund’s actual management fee and expense ratio were lower due to the undertaking by Dreyfus to waive fees and reimburse expenses.
The Fund 27
I N FO R M AT I O N A B O U T T H E R E V I E W A N D A P P R OVA L O F T H E F U N D ’S M A N A G E M E N T A G R E E M E N T ( U n a u d i t e d ) ( c o n t i n u e d )
Representatives of Dreyfus stated that there were no other mutual funds managed by Dreyfus or its affiliates with similar investment objectives, policies and strategies, and no other accounts managed by Dreyfus or its affiliates, with similar investment objectives, policies and strategies as the fund.
Analysis of Profitability and Economies of Scale. Dreyfus’ representatives reviewed the dollar amount of expenses allocated and profit received by Dreyfus and the method used to determine such expenses and profit.The Board considered information, previously provided and discussed, prepared by an independent consulting firm regarding Dreyfus’ approach to allocating costs to, and determining the profitability of, individual funds and the entire Dreyfus mutual fund complex. The Board members also considered that the methodology had also been reviewed by an independent registered public accounting firm which, like the consultant, found the methodology to be reasonable.The consulting firm also analyzed where any economies of scale might emerge in connection with the management of the fund.The Board members evaluated the profitability analysis in light of the relevant circumstances for the fund and the extent to which economies of scale would be realized if the fund grows and whether fee levels reflect these economies of scale for the benefit of fund investors.The Board members also considered potential benefits to Dreyfus from acting as investment adviser and noted that there were no soft dollar arrangements with respect to trading the fund’s investments.
It was noted that the Board members should consider Dreyfus’ profitability with respect to the fund as part of their evaluation of whether the fees under the Management Agreement bear a reasonable relationship to the mix of services provided by Dreyfus, including the nature, extent and quality of such services and that a discussion of economies of scale is predicated on increasing assets and that, if a fund’s assets had been decreasing, the possibility that Dreyfus may have realized any economies of scale would be less. It also was noted that the profitability percentage for managing the fund was within ranges determined by appropriate court cases to be reasonable given the ser-
vices rendered and generally superior service levels provided. The Board also noted the fee waiver and expense reimbursement arrangement and its effect on Dreyfus’ profitability.
At the conclusion of these discussions, the Board agreed that it had been furnished with sufficient information to make an informed business decision with respect to continuation of the Management Agreement, with respect to the fund. Based on the discussions and considerations as described above, the Board made the following conclusions and determinations.
- The Board concluded that the nature, extent and quality of the ser- vices provided by Dreyfus are adequate and appropriate.
- The Board generally was satisfied with the fund’s performance.
- The Board concluded that the fee paid by the fund to Dreyfus was reasonable in light of the services provided, comparative performance, expense and management fee information, including Dreyfus’ under- taking to limit the fund’s expense ratio (which reduced the fund’s actual management fee and expense ratio), costs of the services pro- vided and profits to be realized and benefits derived or to be derived by Dreyfus from its relationship with the fund.
- The Board determined that the economies of scale which may accrue to Dreyfus and its affiliates in connection with the management of the fund had been adequately considered by Dreyfus in connection with the management fee rate charged to the fund and that, to the extent in the future it were determined that material economies of scale had not been shared with the fund, the Board would seek to have those economies of scale shared with the fund.
The Board members considered these conclusions and determinations, along with information received on a routine and regular basis throughout the year, and, without any one factor being dispositive, the Board determined that re-approval of the Management Agreement,with respect to the fund, was in the best interests of the fund and its shareholders.
BOARD MEMBERS INFORMATION (Unaudited)
Joseph S. DiMartino (63)
Chairman of the Board (1995)
|
Principal Occupation During Past 5 Years:
• Corporate Director and Trustee
|
Other Board Memberships and Affiliations:
|
- The Muscular Dystrophy Association, Director
- Century Business Services, Inc., a provider of outsourcing functions for small and medium size companies, Director
- The Newark Group, a provider of a national market of paper recovery facilities, paperboard mills and paperboard converting plants, Director
- Sunair Services Corporation, a provider of certain outdoor-related services to homes and businesses, Director
- Ivory Investment Management, L.P., a registered investment adviser to three private funds, Senior Adviser
No. of Portfolios for which Board Member Serves: 164
Clifford L. Alexander, Jr. (73)
Board Member (2003)
|
Principal Occupation During Past 5 Years:
|
- President of Alexander & Associates, Inc., a management consulting firm ( January 1981-present)
- Chairman of the Board of Moody’s Corporation (October 2000-October 2003)
Other Board Memberships and Affiliations:
• Mutual of America Life Insurance Company, Director
No. of Portfolios for which Board Member Serves: 53
|
David W. Burke (71)
Board Member (1994)
|
Principal Occupation During Past 5 Years:
• Corporate Director and Trustee
|
Other Board Memberships and Affiliations:
• John F. Kennedy Library Foundation, Director
|
No. of Portfolios for which Board Member Serves: 88
|
Whitney I. Gerard (72)
Board Member (1993)
|
Principal Occupation During Past 5 Years:
• Partner of Chadbourne & Parke LLP
|
No. of Portfolios for which Board Member Serves: 26
|
George L. Perry (72)
Board Member (1992)
|
Principal Occupation During Past 5 Years:
• Economist and Senior Fellow at Brookings Institution
No. of Portfolios for which Board Member Serves: 26
|
Once elected all Board Members serve for an indefinite term, but achieve Emeritus status upon reaching age 80.The address of the Board Members and Officers is in c/o The Dreyfus Corporation, 200 Park Avenue, New York, New York 10166. Additional information about the Board Members is available in the fund’s Statement of Additional Information which can be obtained from Dreyfus free of charge by calling this toll free number: 1-800-554-4611.
Lucy Wilson Benson, Emeritus Board Member
Arthur A. Hartman, Emeritus Board Member
|
The Fund 31
OFFICERS OF THE FUND (Unaudited)
J. DAVID OFFICER, President since December 2006.
Chief Operating Officer,Vice Chairman and a Director of the Manager, and an officer of 82 investment companies (comprised of 164 portfolios) managed by the Manager. He is 58 years old and has been an employee of the Manager since April 1998.
PHILLIP N. MAISANO, Executive Vice President since July 2007.
Chief Investment Officer,Vice Chair and a director of the Manager, and an officer of 82 investment companies (compromised of 164 portfolios) managed by the Manager. Mr. Maisano also is an officer and/or board member of certain other investment management subsidiaries of The Bank of New York Mellon Corperation, each of which is an affiliate of the Manager. He is 60 years old and has been employee of the Manager since November 2006. Prior to joining the Manager, Mr. Maisano served as Chairman and Chief Executive Officer of EACM Advisors, an affiliate of the Manager, since August 2004, and served as Chief Executive Officer of Evaluation Associates, a leading institutional investment consulting firm, from 1988 until 2004.
MICHAEL A. ROSENBERG, Vice President and Secretary since August 2005.
Associate General Counsel of the Manager, and an officer of 83 investment companies (comprised of 181 portfolios) managed by the Manager. He is 47 years old and has been an employee of the Manager since October 1991.
JAMES BITETTO, Vice President and Assistant Secretary since August 2005.
Associate General Counsel and Assistant Secretary of the Manager, and an officer of 83 investment companies (comprised of 181 portfolios) managed by the Manager. He is 41 years old and has been an employee of the Manager since December 1996.
JONI LACKS CHARATAN, Vice President and Assistant Secretary since August 2005.
Associate General Counsel of the Manager, and an officer of 83 investment companies (comprised of 181 portfolios) managed by the Manager. She is 51 years old and has been an employee of the Manager since October 1988.
JOSEPH M. CHIOFFI, Vice President and Assistant Secretary since August 2005.
Associate General Counsel of the Manager, and an officer of 83 investment companies (comprised of 181 portfolios) managed by the Manager. He is 45 years old and has been an employee of the Manager since June 2000.
JANETTE E. FARRAGHER, Vice President and Assistant Secretary since August 2005.
Associate General Counsel of the Manager, and an officer of 83 investment companies (comprised of 181 portfolios) managed by the Manager. She is 44 years old and has been an employee of the Manager since February 1984.
JOHN B. HAMMALIAN, Vice President and Assistant Secretary since August 2005.
Associate General Counsel of the Manager, and an officer of 83 investment companies (comprised of 181 portfolios) managed by the Manager. He is 44 years old and has been an employee of the Manager since February 1991.
ROBERT R. MULLERY, Vice President and Assistant Secretary since August 2005.
Associate General Counsel of the Manager, and an officer of 83 investment companies (comprised of 181 portfolios) managed by the Manager. He is 55 years old and has been an employee of the Manager since May 1986.
JEFF PRUSNOFSKY, Vice President and Assistant Secretary since August 2005.
Associate General Counsel of the Manager, and an officer of 83 investment companies (comprised of 181 portfolios) managed by the Manager. He is 42 years old and has been an employee of the Manager since October 1990.
JAMES WINDELS, Treasurer since November 2001.
Director – Mutual Fund Accounting of the Manager, and an officer of 83 investment companies (comprised of 181 portfolios) managed by the Manager. He is 48 years old and has been an employee of the Manager since April 1985.
ROBERT ROBOL, Assistant Treasurer since August 2005.
Senior Accounting Manager – Money Market and Municipal Bond Funds of the Manager, and an officer of 83 investment companies (comprised of 181 portfolios) managed by the Manager. He is 43 years old and has been an employee of the Manager since October 1988.
ROBERT SALVIOLO, Assistant Treasurer since May 2007.
Senior Accounting Manager – Equity Funds of the Manager, and an officer of 83 investment companies (comprised of 181 portfolios) managed by the Manager. He is 40 years old and has been an employee of the Manager since June 1989.
ROBERT SVAGNA, Assistant Treasurer since August 2005.
Senior Accounting Manager Equity Funds of the Manager, and an officer of 83 investment companies (comprised of 181 portfolios) managed by the Manager. He is 40 years old and has been an employee of the Manager since November 1990.
GAVIN C. REILLY, Assistant Treasurer since December 2005.
Tax Manager of the Investment Accounting and Support Department of the Manager, and an officer of 83 investment companies (comprised of 181 portfolios) managed by the Manager. He is 38 years old and has been an employee of the Manager since April 1991.
JOSEPH W. CONNOLLY, Chief Compliance Officer since October 2004.
Chief Compliance Officer of the Manager and The Dreyfus Family of Funds (83 investment companies, comprised of 181 portfolios). From November 2001 through March 2004, Mr. Connolly was first Vice-President, Mutual Fund Servicing for Mellon Global Securities Services. In that capacity, Mr. Connolly was responsible for managing Mellon’s Custody, Fund Accounting and Fund Administration services to third-party mutual fund clients. He is 50 years old and has served in various capacities with the Manager since 1980, including manager of the firm’s Fund Accounting Department from 1997 through October 2001.
WILLIAM GERMENIS, Anti-Money Laundering Compliance Officer since October 2002.
Vice President and Anti-Money Laundering Compliance Officer of the Distributor, and the Anti-Money Laundering Compliance Officer of 79 investment companies (comprised of 177 portfolios) managed by the Manager. He is 36 years old and has been an employee of the Distributor since October 1998.
The Fund 33
For More Information

| Ticker Symbols: Institutional: DIASX Investor: DIAVX |
|
| |
| Telephone 1-800-645-6561 |
| Mail The Dreyfus Family of Funds, 144 Glenn Curtiss Boulevard, Uniondale, NY 11556- |
| E-mail Send your request to info@dreyfus.com |
| Internet Information can be viewed online or downloaded at: http://www.dreyfus.com |
The fund files its complete schedule of portfolio holdings with the Securities and Exchange Commission (“SEC”) for the first and third quarters of each fiscal year on Form N-Q. The fund’s Forms N-Q are available on the SEC’s website at http://www.sec.gov and may be reviewed and copied at the SEC’s Public Reference Room in Washington, DC. Information on the operation of the Public Reference Room may be obtained by calling 1-202-551-8090.
A description of the policies and procedures that the fund uses to determine how to vote proxies relating to portfolio securities, and information regarding how the fund voted these proxies for the 12-month period ended June 30, 2007, is available at http://www.dreyfus.com and on the SEC’s website at http://www.sec.gov. The description of the policies and procedures is also available without charge, upon request, by calling 1-800-645-6561.

© 2007 MBSC Securities Corporation

Save time. Save paper. View your next shareholder report online as soon as it’s available. Log into www.dreyfus.com and sign up for Dreyfus eCommunications. It’s simple and only takes a few minutes.
The views expressed in this report reflect those of the portfolio manager only through the end of the period covered and do not necessarily represent the views of Dreyfus or any other person in the Dreyfus organization. Any such views are subject to change at any time based upon market or other conditions and Dreyfus disclaims any responsibility to update such views.These views may not be relied on as investment advice and, because investment decisions for a Dreyfus fund are based on numerous factors, may not be relied on as an indication of trading intent on behalf of any Dreyfus fund.
Not FDIC-Insured • Not Bank-Guaranteed • May Lose Value
| | | Contents |
| |
| |
| | | THE FUND |
| |
|
| 2 | | A Letter from the CEO |
| 3 | | Discussion of Fund Performance |
| 6 | | Fund Performance |
| 7 | | Understanding Your Fund’s Expenses |
| 7 | | Comparing Your Fund’s Expenses |
| | | With Those of Other Funds |
| 8 | | Statement of Investments |
| 28 | | Statement of Financial Futures |
| 28 | | Statement of Options Written |
| 29 | | Statement of Assets and Liabilities |
| 30 | | Statement of Operations |
| 31 | | Statement of Changes in Net Assets |
| 33 | | Financial Highlights |
| 35 | | Notes to Financial Statements |
| 49 | | Report of Independent Registered |
| | | Public Accounting Firm |
| 50 | | Important Tax Information |
| 51 | | Information About the Review and Approval |
| | | of the Fund’s Management Agreement |
| 56 | | Board Members Information |
| 58 | | Officers of the Fund |
| |
| | | FOR MORE INFORMATION |
| |
|
| | | Back Cover |
| Dreyfus Intermediate |
| Term Income Fund |

A LETTER FROM THE CEO
Dear Shareholder:
We are pleased to present this annual report for Dreyfus Intermediate Term Income Fund, covering the 12-month period from August 1, 2006, through July 31, 2007.
After rallying earlier in the reporting period amid slowing economic growth and benign inflation, the U.S. bond market has encountered significantly heightened volatility in recent months.While the markets’ nominal returns remained positive for the reporting period overall, the recent sell-off has hurt current year-to-date returns most notably on longer-term and high-yield securities. Fixed-income investors have become less tolerant of risk, due mainly to rate hikes in overseas markets, turmoil in the U.S. sub-prime mortgage sector, stronger economic data and a flood of newly issued high-yield bonds with questionable credit characteristics.
In our view, it is appropriate for the bond market to become more concerned with the pricing of risk, which may help wring excesses out of some market sectors. Furthermore, we view recent volatility in credit-sensitive sectors as offering potential investment opportunities in fundamentally sound securities at relatively attractive prices. As always, we encourage you to talk with your financial advisor, who can help you understand the challenges and potential opportunities presented by today’s more turbulent market conditions.
For information about how the fund performed during the reporting period, as well as market perspectives, we have provided a Discussion of Fund Performance given by the fund’s Portfolio Manager.
Thank you for your continued confidence and support.

Thomas F. Eggers
Chief Executive Officer
The Dreyfus Corporation
August 15, 2007
|
2

DISCUSSION OF FUND PERFORMANCE
For the period of August 1, 2006, through July 31, 2007, as provided by Kent Wosepka, Portfolio Manager
Fund and Market Performance Overview
The U.S. bond market generally rallied in an environment of slowing economic growth over much of the reporting period, but encountered heightened volatility in June and July 2007, when credit concerns in the sub-prime mortgage sector spread to other relatively credit-sensitive areas of the fixed-income market. The fund produced higher returns than its benchmark, primarily on the strength of our yield curve strategy and favorable security selections among high yield and investment-grade corporate bonds.
For the 12-month period ended July 31, 2007, Dreyfus Intermediate Term Income Fund’s Institutional shares achieved a total return of 6.02%, and the fund’s Investor shares achieved a total return of 5.74% ..1 In comparison, the fund’s benchmark, the Lehman Brothers U.S. Aggregate Index (the “Index”), achieved a total return of 5.58% for the same period.2
The Fund’s Investment Approach
The fund seeks to maximize total return, consisting of capital appreciation and current income. To pursue this goal, the fund normally invests at least 80% of its assets in fixed-income securities of U.S. and foreign issuers rated at least investment grade or the unrated equivalent as determined by Dreyfus. These securities include U.S. government bonds and notes, corporate bonds, municipal bonds, convertible securities, preferred stocks, inflation-indexed securities, asset-backed securities, mortgage-related securities and foreign bonds. Typically, the fund can expect to have an average effective maturity ranging from 5 to 10 years, and an average effective duration ranging between three and eight years. For additional yield, the fund may invest up to 20% of its assets in fixed-income securities rated below investment grade.
The Fund 3
DISCUSSION OF FUND PERFORMANCE (continued)
Bouts of Market Volatility Offset Earlier Gains
Moderating economic growth and generally benign inflation helped support bond prices over much of the reporting period. Bonds rallied over the final five months of 2006 as the U.S. economic expansion moderated and energy prices retreated, helping to alleviate inflation concerns. Despite bouts of volatility in February and March 2007 stemming from turmoil in the sub-prime mortgage market, investor sentiment remained favorable early in the year as the Federal Reserve Board (the “Fed”) left short-term interest rates unchanged in its attempt to keep the U.S. economy growing without stimulating a reacceleration of inflation.
However, the market suffered sharp declines between June and July. Credit concerns spread from the sub-prime mortgage sector and a surge of newly issued high yield bonds with questionable credit characteristics caused investor sentiment to deteriorate, erasing most of the market’s previous gains.
Corporate Bonds Helped Support the Fund’s Returns
Although prices of high yield corporate bonds were hurt by these recent developments, their relatively high coupon rates enabled them to outperform Treasuries for the reporting period overall. In addition, the fund avoided the full impact of price declines in the high yield sector by focusing primarily on credits with shorter-term maturities, which tend to be less sensitive to changes in perceived credit quality.We found such opportunities from issuers that we believed exhibited improving credit characteristics, including the financing arms of major automobile manufacturers.
The fund also benefited from its investment in investment-grade corporate bonds, where we attempted to avoid issuers that we regarded as susceptible to leveraged buyouts. Instead, we emphasized BBB-rated, shorter-maturity bonds from regulated industries, such as utilities and real estate investment trusts.
The fund’s holdings of bonds issued in emerging market countries also produced attractive returns, including both securities denominated in U.S. dollars and local currencies. Bonds from Brazil proved to be particularly rewarding due to their high yields and currency appreciation relative to the U.S. dollar. However, bonds from developed markets
4
such as Japan and Sweden did not perform as strongly as we expected due to rising interest rates in those markets, and we eliminated them from the fund’s portfolio.
Our yield-curve strategy, which emphasized intermediate-term bonds and de-emphasized bonds at the longer end of the maturity range, also helped support relative performance when yield differences steepened along the market’s maturity range.
Finally, mortgage-backed securities produced mixed results. An underweighted position in mortgages constrained returns in the low volatility environment early in the reporting period, but helped during more volatile market conditions in June and July.
The Fund Is Positioned for Stable Interest Rates
Recent economic and market data suggest to us that the Fed is likely to cut policy rates by the end of the year.We have maintained a slightly longer-than-average duration in an attempt to capture incrementally higher yields. In addition, we have trimmed our positions in investment-grade credits while intensifying our focus on bonds with strong covenants that discourage leveraged buyouts.We also have reduced the fund’s exposure to bonds in certain emerging markets, taking profits in securities that have gained substantial value. We recently have found more attractive values among mortgage-backed securities, increasing the fund’s holdings in the sector to a position that is only slightly underweight the benchmark.
August 15, 2007
1 Total return includes reinvestment of dividends and any capital gains paid. Past performance is no guarantee of future results. Share price, yield and investment return fluctuate such that upon redemption, fund shares may be worth more or less than their original cost. Return figure provided for the fund’s Investor shares reflects the absorption of certain fund expenses by The Dreyfus Corporation pursuant to an undertaking in effect that may be extended, terminated or modified at any time. Had these expenses not been absorbed, the fund’s returns would have been lower.
2 SOURCE: LIPPER INC. — Reflects reinvestment of dividends and, where applicable, capital gain distributions.The Lehman Brothers U.S.Aggregate Index is a widely accepted, unmanaged total return index of corporate, U.S. government and U.S. government agency debt instruments, mortgage-backed securities and asset-backed securities with an average maturity of 1-10 years.
The Fund 5
FUND PERFORMANCE
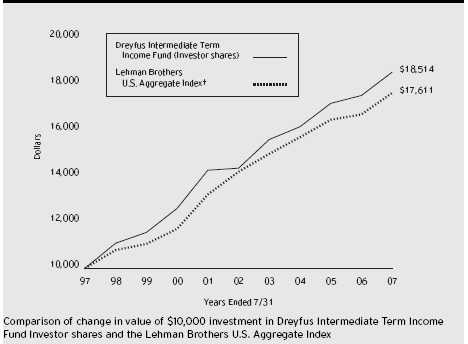
| Average Annual Total Returns | | as of 7/31/07 | | | | | | |
| | | Inception | | | | | | | | From |
| | | Date | | 1 Year | | 5 Years | | 10 Years | | Inception |
| |
| |
| |
| |
| |
|
| Investor shares | | | | 5.74% | | 5.23% | | 6.35% | | |
| Institutional shares | | 5/31/01 | | 6.02% | | 5.52% | | — | | 4.95% |
† Source: Lipper Inc.
Past performance is not predictive of future performance.The fund’s performance shown in the graph and table does not reflect the deduction of taxes that a shareholder would pay on fund distributions or the redemption of fund shares. The above graph compares a $10,000 investment made in Investor shares of Dreyfus Intermediate Term Income Fund on 7/31/97 to a $10,000 investment made in the Lehman Brothers U.S.Aggregate Index (the “Index”) on that date. All dividends and capital gain distributions are reinvested.
The fund invests primarily in debt securities and securities with debt-like characteristics of domestic and foreign issuers and maintains an average effective maturity ranging between five and ten years and an average effective duration ranging between three and eight years.The fund’s performance shown in the line graph takes into account all applicable fees and expenses.The Index is a widely accepted, unmanaged total return index of corporate, U.S. government and U.S. government agency debt instruments, mortgage-backed securities and asset-backed securities with an average maturity of 1-10 years.The Index does not take into account charges, fees and other expenses. Further information relating to fund performance, including expense reimbursements, if applicable, is contained in the Financial Highlights section of the prospectus and elsewhere in this report.
6
U N D E R S TA N D I N G YO U R F U N D ’ S E X P E N S E S ( U n a u d i t e d )
As a mutual fund investor, you pay ongoing expenses, such as management fees and other expenses. Using the information below, you can estimate how these expenses affect your investment and compare them with the expenses of other funds.You also may pay one-time transaction expenses, including sales charges (loads) and redemption fees, which are not shown in this section and would have resulted in higher total expenses. For more information, see your fund’s prospectus or talk to your financial adviser.
Review your fund’s expenses
The table below shows the expenses you would have paid on a $1,000 investment in Dreyfus Intermediate Term Income Fund from February 1, 2007 to July 31, 2007. It also shows how much a $1,000 investment would be worth at the close of the period, assuming actual returns and expenses.
| Expenses and Value of a $1,000 Investment | | |
| assuming actual returns for the six months ended July 31, 2007 | | |
| | | Investor Shares | | Institutional Shares |
| |
| |
|
| Expenses paid per $1,000 † | | $ 4.00 | | $ 2.75 |
| Ending value (after expenses) | | $1,018.50 | | $1,019.00 |
| | COMPARING YOUR FUND’S EXPENSES
WITH THOSE OF OTHER FUNDS (Unaudited)
|
Using the SEC’s method to compare expenses
The Securities and Exchange Commission (SEC) has established guidelines to help investors assess fund expenses. Per these guidelines, the table below shows your fund’s expenses based on a $1,000 investment, assuming a hypothetical 5% annualized return. You can use this information to compare the ongoing expenses (but not transaction expenses or total cost) of investing in the fund with those of other funds.All mutual fund shareholder reports will provide this information to help you make this comparison. Please note that you cannot use this information to estimate your actual ending account balance and expenses paid during the period.
| | Expenses and Value of a $1,000 Investment
assuming a hypothetical 5% annualized return for the six months ended July 31, 2007
|
| | | Investor Shares | | Institutional Shares |
| |
| |
|
| Expenses paid per $1,000 † | | $ 4.01 | | $ 2.76 |
| Ending value (after expenses) | | $1,020.83 | | $1,022.07 |
| † Expenses are equal to the fund’s annualized expense ratio of .80% for Investor shares and .55% for Institutional |
| shares, multiplied by the average account value over the period, multiplied by 181/365 (to reflect the one-half |
| year period). |
The Fund 7
STATEMENT OF INVESTMENTS
July 31, 2007
|
| | | Coupon | | Maturity | | Principal | | |
| Bonds and Notes—132.2% | | Rate (%) | | Date | | Amount ($) | | Value ($) |
| |
| |
| |
| |
|
| Aerospace & Defense—.1% | | | | | | | | |
| L-3 Communications, | | | | | | | | |
| Gtd. Bonds | | 3.00 | | 8/1/35 | | 440,000 | | 493,900 |
| Agricultural—.3% | | | | | | | | |
| Philip Morris, | | | | | | | | |
| Debs. | | 7.75 | | 1/15/27 | | 1,495,000 a | | 1,771,956 |
| Asset-Backed Ctfs./ | | | | | | | | |
| Auto Receivables—2.1% | | | | | | | | |
| Americredit Prime Automobile | | | | | | | | |
| Receivables, Ser. 2007-1, Cl. E | | 6.96 | | 3/8/16 | | 1,140,000 b | | 1,128,725 |
| Capital Auto Receivables Asset | | | | | | | | |
| Trust, Ser. 2005-1, Cl. D | | 6.50 | | 5/15/12 | | 900,000 b | | 892,125 |
| Capital Auto Receivables Asset | | | | | | | | |
| Trust, Ser. 2007-1, Cl. D | | 6.57 | | 9/16/13 | | 500,000 b | | 450,000 |
| Capital Auto Receivables Asset | | | | | | | | |
| Trust, Ser. 2006-1, Cl. D | | 7.16 | | 1/15/13 | | 1,050,000 b | | 1,068,042 |
| Ford Credit Auto Owner Trust, | | | | | | | | |
| Ser. 2004-A, Cl. C | | 4.19 | | 7/15/09 | | 1,000,000 | | 996,286 |
| Ford Credit Auto Owner Trust, | | | | | | | | |
| Ser. 2005-B, Cl. B | | 4.64 | | 4/15/10 | | 1,405,000 | | 1,396,545 |
| Ford Credit Auto Owner Trust, | | | | | | | | |
| Ser 2005-C, Cl. C | | 4.72 | | 2/15/11 | | 720,000 | | 716,286 |
| Ford Credit Auto Owner Trust, | | | | | | | | |
| Ser. 2007-A, Cl. D | | 7.05 | | 12/15/13 | | 1,575,000 b | | 1,576,969 |
| Ford Credit Auto Owner Trust, | | | | | | | | |
| Ser. 2006-B, Cl. D | | 7.12 | | 2/15/13 | | 700,000 b | | 718,968 |
| Hyundai Auto Receivables Trust, | | | | | | | | |
| Ser. 2006-A, Cl. A2 | | 5.13 | | 2/16/09 | | 65,696 | | 65,680 |
| Hyundai Auto Receivables Trust, | | | | | | | | |
| Ser. 2006-B, Cl. C | | 5.25 | | 5/15/13 | | 495,000 | | 494,893 |
| WFS Financial Owner Trust, | | | | | | | | |
| Ser. 2004-4, Cl. B | | 3.13 | | 5/17/12 | | 96,897 | | 95,394 |
| WFS Financial Owner Trust, | | | | | | | | |
| Ser. 2004-3, Cl. B | | 3.51 | | 2/17/12 | | 92,885 | | 91,737 |
| WFS Financial Owner Trust, | | | | | | | | |
| Ser. 2005-2, Cl. B | | 4.57 | | 11/19/12 | | 2,065,000 | | 2,049,120 |
| | | | | | | | | 11,740,770 |
8
| | | Coupon | | Maturity | | Principal | | |
| Bonds and Notes (continued) | | Rate (%) | | Date | | Amount ($) | | Value ($) |
| |
| |
| |
| |
|
| Asset-Backed Ctfs./Credit Cards—3.2% | | | | | | |
| American Express Credit Account | | | | | | | | |
| Master Trust, Ser. 2007-6, Cl. C | | 5.60 | | 1/15/13 | | 2,210,000 b,c | | 2,210,000 |
| Citibank Credit Card Issuance | | | | | | | | |
| Trust, Ser. 2006-C4, Cl. C4 | | 5.54 | | 1/9/12 | | 10,235,000 c | | 10,234,862 |
| MBNA Credit Card Master Note | | | | | | | | |
| Trust, Ser. 2002-C1, Cl. C1 | | 6.80 | | 7/15/14 | | 5,268,000 | | 5,542,451 |
| | | | | | | | | 17,987,313 |
| Asset-Backed Ctfs./ | | | | | | | | |
| Home Equity Loans—2.9% | | | | | | | | |
| Bayview Financial Acquisition | | | | | | | | |
| Trust, Ser. 2005-B, Cl. 1A6 | | 5.21 | | 4/28/39 | | 1,795,000 c | | 1,736,601 |
| Centex Home Equity, | | | | | | | | |
| Ser. 2006-A, Cl. AV1 | | 5.37 | | 6/25/36 | | 232,360 c | | 232,353 |
| Citicorp Residential Mortgage | | | | | | | | |
| Securities, Ser. 2006-2, Cl. A1A | | 5.87 | | 9/25/36 | | 466,420 c | | 465,353 |
| Citicorp Residential Mortgage | | | | | | | | |
| Securities, Ser. 2006-1, Cl. A1 | | 5.96 | | 7/25/36 | | 1,015,062 c | | 1,013,166 |
| Citigroup Mortgage Loan Trust, | | | | | | | | |
| Ser. 2005-WF1, Cl. A5 | | 5.01 | | 2/25/35 | | 1,700,000 | | 1,657,959 |
| Conseco Finance Home Loan Trust, | | | | | | | | |
| Ser. 2000-E, Cl. A5 | | 9.02 | | 8/15/31 | | 107,888 c | | 108,257 |
| Countrywide Asset-Backed | | | | | | | | |
| Certificates, Ser. 2006-1, Cl. AF1 | | 5.45 | | 7/25/36 | | 391,440 c | | 391,444 |
| Credit Suisse Mortgage Capital | | | | | | | | |
| Certificates, Ser. 2007-1, Cl. 1A6A | | 5.86 | | 2/25/37 | | 1,520,000 | | 1,516,726 |
| Home Equity Mortgage Trust, | | | | | | | | |
| Ser. 2006-5, Cl. A1 | | 5.50 | | 1/25/37 | | 885,944 c | | 868,968 |
| Home Equity Mortgage Trust, | | | | | | | | |
| Ser. 2006-4, Cl. A1 | | 5.67 | | 11/25/36 | | 796,781 c | | 788,904 |
| Morgan Stanley ABS Capital I, | | | | | | | | |
| Ser. 2006-HE3, Cl. A2A | | 5.36 | | 4/25/36 | | 748,727 c | | 748,436 |
| Morgan Stanley Mortgage Loan | | | | | | | | |
| Trust, Ser. 2006-15XS, Cl. A6B | | 5.83 | | 11/25/36 | | 740,000 c | | 735,439 |
| Popular ABS Mortgage Pass-Through | | | | | | | | |
| Trust, Ser. 2005-6, Cl. M1 | | 5.91 | | 1/25/36 | | 1,525,000 c | | 1,464,445 |
The Fund 9
STATEMENT OF INVESTMENTS (continued)
| | | Coupon | | Maturity | | Principal | | |
| Bonds and Notes (continued) | | Rate (%) | | Date | | Amount ($) | | Value ($) |
| |
| |
| |
| |
|
| Asset-Backed Ctfs./ | | | | | | | | |
| Home Equity Loans (continued) | | | | | | | | |
| Residential Asset Mortgage | | | | | | | | |
| Products, Ser. 2005-RS2, Cl. M2 | | 5.80 | | 2/25/35 | | 1,585,000 c | | 1,579,605 |
| Residential Asset Mortgage | | | | | | | | |
| Products, Ser. 2005-RS2, Cl. M3 | | 5.87 | | 2/25/35 | | 490,000 c | | 486,548 |
| Residential Asset Securities, | | | | | | | | |
| Ser. 2003-KS7, Cl. MI3 | | 5.75 | | 9/25/33 | | 752,256 | | 642,901 |
| Residential Asset Securities, | | | | | | | | |
| Ser. 2005-AHL2, Cl. M3 | | 5.79 | | 10/25/35 | | 450,000 c | | 428,592 |
| Residential Funding Mortgage | | | | | | | | |
| Securities II, Ser. 2006-HSA2, | | | | | | | | |
| Cl. AI1 | | 5.43 | | 3/25/36 | | 249,358 c | | 249,286 |
| Soundview Home Equity Loan Trust, | | | | | | |
| Ser. 2005-B, Cl. M2 | | 5.73 | | 5/25/35 | | 1,120,000 c | | 1,115,510 |
| | | | | | | | | 16,230,493 |
| Asset-Backed Ctfs./ | | | | | | | | |
| Manufactured Housing—.6% | | | | | | | | |
| Green Tree Financial, | | | | | | | | |
| Ser. 1994-7, Cl. M1 | | 9.25 | | 3/15/20 | | 1,327,617 | | 1,372,011 |
| Origen Manufactured Housing, | | | | | | | | |
| Ser. 2005-B, Cl. A2 | | 5.25 | | 12/15/18 | | 1,375,000 | | 1,368,894 |
| Origen Manufactured Housing, | | | | | | | | |
| Ser. 2005-B, Cl. M2 | | 6.48 | | 1/15/37 | | 745,000 | | 734,586 |
| | | | | | | | | 3,475,491 |
| Automobile Manufacturers—1.3% | | | | | | | | |
| Daimler Chrysler N.A. Holding, | | | | | | | | |
| Gtd. Notes | | 5.71 | | 3/13/09 | | 2,580,000 c | | 2,580,977 |
| DaimlerChrysler N.A. Holding, | | | | | | | | |
| Notes | | 4.88 | | 6/15/10 | | 800,000 | | 784,213 |
| DaimlerChrysler N.A. Holding, | | | | | | | | |
| Gtd. Notes | | 5.79 | | 3/13/09 | | 1,375,000 c | | 1,378,387 |
| DaimlerChrysler N.A. Holding, | | | | | | | | |
| Gtd. Notes, Ser. E | | 5.89 | | 10/31/08 | | 2,725,000 c | | 2,738,783 |
| | | | | | | | | 7,482,360 |
| Automotive, Trucks & Parts—.1% | | | | | | | | |
| Goodyear Tire & Rubber, | | | | | | | | |
| Sr. Notes | | 9.13 | | 12/1/09 | | 295,000 b,c | | 295,000 |
10
| | | Coupon | | Maturity | | Principal | | |
| Bonds and Notes (continued) | | Rate (%) | | Date | | Amount ($) | | Value ($) |
| |
| |
| |
| |
|
| Banks—6.5% | | | | | | | | |
| Capital One Financial, | | | | | | | | |
| Sr. Unsub. Notes | | 5.64 | | 9/10/09 | | 5,275,000 c | | 5,280,354 |
| Chevy Chase Bank, | | | | | | | | |
| Sub. Notes | | 6.88 | | 12/1/13 | | 1,220,000 | | 1,220,000 |
| Chuo Mitsui Trust & Banking, | | | | | | | | |
| Sub. Notes | | 5.51 | | 12/29/49 | | 2,185,000 b,c | | 2,048,878 |
| Colonial Bank, | | | | | | | | |
| Sub. Notes | | 6.38 | | 12/1/15 | | 1,105,000 | | 1,125,311 |
| Colonial Bank, | | | | | | | | |
| Sub. Notes | | 8.00 | | 3/15/09 | | 385,000 | | 399,554 |
| Glitnir Banki, | | | | | | | | |
| Unscd. Bonds | | 7.45 | | 9/14/49 | | 1,470,000 b,c | | 1,519,194 |
| ICICI Bank, | | | | | | | | |
| Bonds | | 5.90 | | 1/12/10 | | 710,000 b,c | | 713,348 |
| Industrial Bank of Korea, | | | | | | | | |
| Sub. Notes | | 4.00 | | 5/19/14 | | 2,630,000 b,c | | 2,558,574 |
| Islandsbanki, | | | | | | | | |
| Notes | | 5.52 | | 10/15/08 | | 975,000 b,c | | 974,429 |
| Landsbanki Islands, | | | | | | | | |
| Sr. Notes | | 6.06 | | 8/25/09 | | 2,450,000 b,c | | 2,476,051 |
| Marshall and Ilsley Bank, | | | | | | | | |
| Sub. Notes, Ser. BN | | 5.63 | | 12/4/12 | | 2,430,000 c | | 2,433,251 |
| Northern Rock, | | | | | | | | |
| Sub. Notes | | 6.59 | | 6/28/49 | | 700,000 b,c | | 684,803 |
| Popular North America, | | | | | | | | |
| Notes | | 5.71 | | 12/12/07 | | 1,315,000 c | | 1,316,763 |
| Sovereign Bancorp, | | | | | | | | |
| Sr. Unscd. Notes | | 5.59 | | 3/23/10 | | 2,105,000 c | | 2,105,354 |
| Sovereign Bancorp, | | | | | | | | |
| Sr. Notes | | 5.64 | | 3/1/09 | | 2,145,000 c | | 2,151,128 |
| SunTrust Preferred Capital I, | | | | | | | | |
| Bank Gtd. Notes | | 5.85 | | 12/31/49 | | 345,000 c | | 339,473 |
| USB Capital IX, | | | | | | | | |
| Gtd. Notes | | 6.19 | | 4/15/49 | | 4,890,000 a,c | | 4,836,533 |
| Western Financial Bank, | | | | | | | | |
| Sub. Debs. | | 9.63 | | 5/15/12 | | 1,695,000 | | 1,815,815 |
The Fund 11
STATEMENT OF INVESTMENTS (continued)
| | | Coupon | | Maturity | | Principal | | |
| Bonds and Notes (continued) | | Rate (%) | | Date | | Amount ($) | | Value ($) |
| |
| |
| |
| |
|
| Banks (continued) | | | | | | | | |
| Zions Bancorporation, | | | | | | | | |
| Sr. Unscd. Notes | | 5.48 | | 4/15/08 | | 2,350,000 c | | 2,351,934 |
| | | | | | | | | 36,350,747 |
| Building & Construction—.9% | | | | | | | | |
| American Standard, | | | | | | | | |
| Gtd. Notes | | 7.38 | | 2/1/08 | | 1,530,000 | | 1,540,428 |
| Centex, | | | | | | | | |
| Notes | | 4.75 | | 1/15/08 | | 725,000 | | 720,257 |
| D.R. Horton, | | | | | | | | |
| Gtd. Notes | | 5.88 | | 7/1/13 | | 1,365,000 | | 1,252,573 |
| Masco, | | | | | | | | |
| Sr. Unscd. Notes | | 5.66 | | 3/12/10 | | 1,390,000 c | | 1,377,351 |
| | | | | | | | | 4,890,609 |
| Chemicals—.4% | | | | | | | | |
| Equistar Chemicals/Funding, | | | | | | | | |
| Gtd. Notes | | 10.13 | | 9/1/08 | | 309,000 | | 321,360 |
| Lubrizol, | | | | | | | | |
| Debs. | | 6.50 | | 10/1/34 | | 690,000 a | | 655,849 |
| RPM International, | | | | | | | | |
| Sr. Notes | | 4.45 | | 10/15/09 | | 1,140,000 | | 1,120,259 |
| | | | | | | | | 2,097,468 |
| Commercial & Professional Services—.3% | | | | | | |
| ERAC USA Finance, | | | | | | | | |
| Notes | | 5.61 | | 4/30/09 | | 700,000 b,c | | 702,255 |
| ERAC USA Finance, | | | | | | | | |
| Notes | | 7.95 | | 12/15/09 | | 760,000 b | | 798,958 |
| | | | | | | | | 1,501,213 |
| Commercial Mortgage | | | | | | | | |
| Pass-Through Ctfs.—5.0% | | | | | | | | |
| Bayview Commercial Asset Trust, | | | | | | | | |
| Ser. 2006-SP2, Cl. A | | 5.60 | | 1/25/37 | | 1,762,605 b,c | | 1,762,605 |
| Bayview Commercial Asset Trust, | | | | | | | | |
| Ser. 2004-1, Cl. A | | 5.68 | | 4/25/34 | | 684,967 b,c | | 685,395 |
| Bayview Commercial Asset Trust, | | | | | | | | |
| Ser. 2005-3A, Cl. A2 | | 5.72 | | 11/25/35 | | 1,606,170 b,c | | 1,610,688 |
| Bayview Commercial Asset Trust, | | | | | | | | |
| Ser. 2003-2, Cl. A | | 5.90 | | 12/25/33 | | 533,782 b,c | | 533,962 |
12
| | | Coupon | | Maturity | | Principal | | | | |
| Bonds and Notes (continued) | | Rate (%) | | Date | | Amount ($) | | Value ($) |
| |
| |
| |
| |
|
| Commercial Mortgage | | | | | | | | | | |
| Pass-Through Ctfs. (continued) | | | | | | | | | | |
| Bayview Commercial Asset Trust, | | | | | | | | | | |
| Ser. 2005-4A, Cl. M5 | | 5.97 | | 1/25/36 | | 437,969 | | b,c | | 438,243 |
| Bayview Commercial Asset Trust, | | | | | | | | | | |
| Ser. 2004-1, Cl. M2 | | 6.52 | | 4/25/34 | | 206,577 | | b,c | | 209,611 |
| Bayview Commercial Asset Trust, | | | | | | | | | | |
| Ser. 2006-2A, Cl. B3 | | 8.02 | | 7/25/36 | | 237,983 | | b,c | | 218,005 |
| Bayview Commercial Asset Trust, | | | | | | | | | | |
| Ser. 2005-3A, Cl. B3 | | 8.32 | | 11/25/35 | | 398,553 | | b,c | | 404,793 |
| Bear Stearns Commercial Mortgage | | | | | | | | | | |
| Securities, Ser. 2004-PWR5, Cl. A2 | | 4.25 | | 7/11/42 | | 1,125,000 | | | | 1,096,994 |
| Bear Stearns Commercial Mortgage | | | | | | | | | | |
| Securities, Ser. 2005-T18, Cl. A2 | | 4.56 | | 2/13/42 | | 1,365,000 | | | | 1,338,628 |
| Credit Suisse/Morgan Stanley | | | | | | | | | | |
| Commercial Mortgage Certificates, | | | | | | | | | | |
| Ser. 2006-HC1A, Cl. A1 | | 5.51 | | 5/15/23 | | 2,285,000 | | b,c | | 2,284,952 |
| Crown Castle Towers, | | | | | | | | | | |
| Ser. 2005-1A, Cl. D | | 5.61 | | 6/15/35 | | 1,290,000 | | b | | 1,258,827 |
| Crown Castle Towers, | | | | | | | | | | |
| Ser. 2006-1A, Cl. D | | 5.77 | | 11/15/36 | | 745,000 | | b | | 712,116 |
| Global Signal Trust, | | | | | | | | | | |
| Ser. 2006-1, Cl. D | | 6.05 | | 2/15/36 | | 1,650,000 | | b | | 1,603,891 |
| Global Signal Trust, | | | | | | | | | | |
| Ser. 2006-1, Cl. E | | 6.50 | | 2/15/36 | | 400,000 | | b | | 390,094 |
| GMAC Commercial Mortgage | | | | | | | | | | |
| Securities, Ser. 2003-C3, Cl. A2 | | 4.22 | | 4/10/40 | | 1,075,000 | | | | 1,052,498 |
| Goldman Sachs Mortgage Securities | | | | | | | | | | |
| Corporation II, Ser. 2007-EOP, Cl. F | | 5.80 | | 3/6/20 | | 1,250,000 | | b,c | | 1,242,188 |
| Goldman Sachs Mortgage Securities | | | | | | | | | | |
| Corporation II, Ser. 2007-EOP, Cl. G | | 5.84 | | 3/6/20 | | 1,415,000 | | b,c | | 1,406,156 |
| Goldman Sachs Mortgage Securities | | | | | | | | | | |
| Corporation II, Ser. 2007-EOP, Cl. K | | 6.37 | | 3/6/20 | | 915,000 | | b,c | | 905,850 |
| Goldman Sachs Mortgage | | | | | | | | | | |
| Securities Corporation II, | | | | | | | | | | |
| Ser. 2007-EOP, Cl. L | | 6.62 | | 3/6/20 | | 3,060,000 | | b,c | | 3,029,400 |
| Morgan Stanley Capital I, | | | | | | | | | | |
| Ser. 1998-HF1, Cl. E | | 7.24 | | 3/15/30 | | 300,000 | | c | | 301,571 |
The Fund 13
STATEMENT OF INVESTMENTS (continued)
| | | Coupon | | Maturity | | Principal | | |
| Bonds and Notes (continued) | | Rate (%) | | Date | | Amount ($) | | Value ($) |
| |
| |
| |
| |
|
| Commercial Mortgage | | | | | | | | |
| Pass-Through Ctfs. (continued) | | | | | | | | |
| Nationslink Funding Corporation, | | | | | | | | |
| Ser. 1998-2, Cl. A2 | | 6.48 | | 8/20/30 | | 994,019 | | 997,029 |
| SBA CMBS Trust, | | | | | | | | |
| Ser. 2006-1A, Cl. D | | 5.85 | | 11/15/36 | | 695,000 b | | 674,977 |
| Washington Mutual Asset | | | | | | | | |
| Securities, Ser. 2003-C1A, Cl. A | | 3.83 | | 1/25/35 | | 3,658,153 b | | 3,547,327 |
| | | | | | | | | 27,705,800 |
| Diversified Financial Services—8.8% | | | | | | | | |
| Ameriprise Financial, | | | | | | | | |
| Jr. Sub. Notes | | 7.52 | | 6/1/66 | | 1,215,000 c | | 1,231,913 |
| Amvescap, | | | | | | | | |
| Gtd. Notes | | 5.63 | | 4/17/12 | | 2,780,000 | | 2,754,707 |
| Capmark Financial Group, | | | | | | | | |
| Gtd. Notes | | 5.88 | | 5/10/12 | | 3,245,000 b | | 3,037,388 |
| CIT Group, | | | | | | | | |
| Sr. Notes | | 5.51 | | 8/15/08 | | 2,035,000 c | | 2,033,555 |
| Countrywide Home Loans, | | | | | | | | |
| Notes | | 4.13 | | 9/15/09 | | 1,445,000 | | 1,392,299 |
| FCE Bank, | | | | | | | | |
| Notes EUR | | 5.16 | | 9/30/09 | | 1,655,000 c,d | | 2,188,588 |
| Ford Motor Credit, | | | | | | | | |
| Notes | | 5.63 | | 10/1/08 | | 2,985,000 | | 2,920,270 |
| Ford Motor Credit, | | | | | | | | |
| Unscd. Notes | | 6.19 | | 9/28/07 | | 2,470,000 c | | 2,456,259 |
| Fuji JGB Investment, | | | | | | | | |
| Sub. Bonds | | 9.87 | | 12/29/49 | | 1,175,000 b,c | | 1,219,375 |
| Glencore Funding, | | | | | | | | |
| Gtd. Notes | | 6.00 | | 4/15/14 | | 1,280,000 b | | 1,266,807 |
| GMAC, | | | | | | | | |
| Unsub. Notes | | 6.61 | | 5/15/09 | | 1,465,000 c | | 1,409,588 |
| Goldman Sachs Capital II, | | | | | | | | |
| Gtd. Bonds | | 5.79 | | 12/29/49 | | 965,000 c | | 913,074 |
| HSBC Finance, | | | | | | | | |
| Sr. Notes | | 5.71 | | 9/14/12 | | 3,060,000 a,c | | 3,013,133 |
| Janus Capital Group, | | | | | | | | |
| Notes | | 6.25 | | 6/15/12 | | 1,955,000 | | 1,980,624 |
14
| | | Coupon | | Maturity | | Principal | | |
| Bonds and Notes (continued) | | Rate (%) | | Date | | Amount ($) | | Value ($) |
| |
| |
| |
| |
|
| Diversified Financial Services (continued) | | | | | | |
| Jefferies Group, | | | | | | | | |
| Sr. Unscd. Notes | | 7.75 | | 3/15/12 | | 805,000 | | 862,628 |
| John Deere Capital, | | | | | | | | |
| Notes | | 5.40 | | 9/1/09 | | 770,000 c | | 770,832 |
| Kaupthing Bank, | | | | | | | | |
| Sr. Notes | | 6.06 | | 1/15/10 | | 2,295,000 b,c | | 2,319,924 |
| Lehman Brothers Capital Trust VII, | | | | | | | | |
| Notes | | 5.86 | | 11/29/49 | | 675,000 a,c | | 641,304 |
| Leucadia National, | | | | | | | | |
| Sr. Unscd. Notes | | 7.00 | | 8/15/13 | | 1,100,000 | | 1,039,500 |
| MBNA Capital, | | | | | | | | |
| Gtd. Cap. Secs., Ser. A | | 8.28 | | 12/1/26 | | 905,000 | | 942,558 |
| Merrill Lynch, | | | | | | | | |
| Notes, Ser. C | | 5.58 | | 2/5/10 | | 755,000 c | | 753,658 |
| Residential Capital, | | | | | | | | |
| Gtd. Notes | | 6.66 | | 11/21/08 | | 1,700,000 c | | 1,634,831 |
| Residential Capital, | | | | | | | | |
| Gtd. Notes | | 6.88 | | 6/30/15 | | 675,000 | | 598,516 |
| Residential Capital, | | | | | | | | |
| Gtd. Notes | | 7.69 | | 4/17/09 | | 2,390,000 a,b,c | | 2,309,816 |
| SB Treasury, | | | | | | | | |
| Jr. Sub. Bonds | | 9.40 | | 12/29/49 | | 2,390,000 b,c | | 2,469,597 |
| SLM, | | | | | | | | |
| Unscd. Notes, Ser. A | | 4.50 | | 7/26/10 | | 1,425,000 a | | 1,333,482 |
| SLM, | | | | | | | | |
| Unscd. Notes, Ser. A | | 5.50 | | 7/27/09 | | 2,740,000 a,c | | 2,652,928 |
| Tokai Preferred Capital, | | | | | | | | |
| Bonds | | 9.98 | | 12/29/49 | | 2,240,000 b,c | | 2,325,738 |
| Windsor Financing, | | | | | | | | |
| Gtd. Notes | | 5.88 | | 7/15/17 | | 580,515 b | | 580,539 |
| | | | | | | | | 49,053,431 |
| Diversified Metals & Mining—.2% | | | | | | | | |
| Falconbridge, | | | | | | | | |
| Bonds | | 5.38 | | 6/1/15 | | 265,000 | | 255,567 |
| Noranda, | | | | | | | | |
| Notes | | 6.00 | | 10/15/15 | | 835,000 | | 837,644 |
| | | | | | | | | 1,093,211 |
The Fund 15
STATEMENT OF INVESTMENTS (continued)
| | | Coupon | | Maturity | | Principal | | |
| Bonds and Notes (continued) | | Rate (%) | | Date | | Amount ($) | | Value ($) |
| |
| |
| |
| |
|
| Electric Utilities—3.8% | | | | | | | | |
| AES, | | | | | | | | |
| Sr. Notes | | 9.38 | | 9/15/10 | | 395,000 | | 406,850 |
| American Electric Power, | | | | | | | | |
| Sr. Unsub. Notes | | 4.71 | | 8/16/07 | | 1,020,000 c | | 1,019,712 |
| Cinergy, | | | | | | | | |
| Debs. | | 6.53 | | 12/16/08 | | 1,015,000 | | 1,028,685 |
| Dominion Resources, | | | | | | | | |
| Sr. Unscd. Notes, Ser. B | | 5.54 | | 11/14/08 | | 1,335,000 c | | 1,336,976 |
| Dominion Resources, | | | | | | | | |
| Sr. Notes, Ser. D | | 5.66 | | 9/28/07 | | 2,765,000 c | | 2,765,470 |
| FirstEnergy, | | | | | | | | |
| Unsub. Notes, Ser. B | | 6.45 | | 11/15/11 | | 2,580,000 | | 2,664,495 |
| National Grid, | | | | | | | | |
| Sr. Unscd. Notes | | 6.30 | | 8/1/16 | | 1,010,000 | | 1,037,953 |
| Niagara Mohawk Power, | | | | | | | | |
| Sr. Unscd. Notes, Ser. G | | 7.75 | | 10/1/08 | | 845,000 | | 867,081 |
| NiSource Finance, | | | | | | | | |
| Gtd. Notes | | 5.93 | | 11/23/09 | | 1,675,000 c | | 1,676,301 |
| Ohio Power, | | | | | | | | |
| Unscd. Notes | | 5.54 | | 4/5/10 | | 1,400,000 c | | 1,402,173 |
| TXU Electric Delivery, | | | | | | | | |
| Bonds | | 5.74 | | 9/16/08 | | 4,440,000 b,c | | 4,443,215 |
| TXU, | | | | | | | | |
| Sr. Notes, Ser. O | | 4.80 | | 11/15/09 | | 2,335,000 | | 2,294,971 |
| | | | | | | | | 20,943,882 |
| Environmental Control—.6% | | | | | | | | |
| Allied Waste North America, | | | | | | | | |
| Scd. Notes, Ser. B | | 5.75 | | 2/15/11 | | 475,000 | | 448,875 |
| Allied Waste North America, | | | | | | | | |
| Scd. Notes | | 6.38 | | 4/15/11 | | 445,000 | | 426,644 |
| Oakmont Asset Trust, | | | | | | | | |
| Notes | | 4.51 | | 12/22/08 | | 1,265,000 b | | 1,250,303 |
| Waste Management, | | | | | | | | |
| Sr. Unsub. Notes | | 6.50 | | 11/15/08 | | 950,000 | | 961,226 |
| | | | | | | | | 3,087,048 |
| Food & Beverages—.8% | | | | | | | | |
| H.J. Heinz, | | | | | | | | |
| Notes | | 6.43 | | 12/1/20 | | 1,625,000 b | | 1,644,515 |
| Safeway, | | | | | | | | |
| Sr. Unscd. Notes | | 4.13 | | 11/1/08 | | 930,000 | | 917,037 |
16
| | | | | Coupon | | Maturity | | Principal | | |
| Bonds and Notes (continued) | | Rate (%) | | Date | | Amount ($) | | Value ($) |
| |
| |
| |
| |
|
| Food & Beverages (continued) | | | | | | | | |
| Stater Brothers Holdings, | | | | | | | | |
| Sr. Notes | | | | 7.75 | | 4/15/15 | | 190,000 a,b | | 177,650 |
| Stater Brothers Holdings, | | | | | | | | |
| Sr. Notes | | | | 8.13 | | 6/15/12 | | 1,100,000 | | 1,067,000 |
| Tyson Foods, | | | | | | | | | | |
| Sr. Unscd. Notes | | | | 6.85 | | 4/1/16 | | 800,000 c | | 815,674 |
| | | | | | | | | | | 4,621,876 |
| Foreign/Governmental—4.1% | | | | | | | | |
| Arab Republic of Egypt | | | | | | | | |
| Unsub. Notes | | EGP | | 8.75 | | 7/18/12 | | 9,740,000 b,d | | 1,736,884 |
| Banco Nacional de | | | | | | | | | | |
| Desenvolvimento | | | | | | | | | | |
| Economico e Social, | | | | | | | | |
| Unsub. Notes | | | | 5.84 | | 6/16/08 | | 2,080,000 c | | 2,071,680 |
| Federal Republic of Brazil, | | | | | | | | |
| Unscd. Bonds | | BRL | | 12.50 | | 1/5/16 | | 7,340,000 a,d | | 4,598,225 |
| Mexican Bonos, | | | | | | | | | | |
| Bonds, Ser. M | | MXN | | 9.00 | | 12/22/11 | | 25,645,000 d | | 2,457,807 |
| Mexican Bonos, | | | | | | | | | | |
| Bonds, Ser. M 30 | | MXN | | 10.00 | | 11/20/36 | | 11,615,000 d | | 1,339,797 |
| Republic of Argentina, | | | | | | | | |
| Bonds | | | | 5.48 | | 8/3/12 | | 9,355,000 c | | 6,457,480 |
| Russian Federation, | | | | | | | | | | |
| Unsub. Bonds | | | | 8.25 | | 3/31/10 | | 3,890,107 b | | 4,021,204 |
| | | | | | | | | | | 22,683,077 |
| Health Care—1.5% | | | | | | | | | | |
| Baxter International, | | | | | | | | | | |
| Sr. Unscd. Notes | | | | 5.20 | | 2/16/08 | | 1,528,000 | | 1,525,677 |
| HCA, | | | | | | | | | | |
| Sr. Unscd. Notes | | | | 7.88 | | 2/1/11 | | 1,140,000 | | 1,097,273 |
| HCA, | | | | | | | | | | |
| Sr. Unscd. Notes | | | | 8.75 | | 9/1/10 | | 1,395,000 | | 1,360,125 |
| Medco Health Solutions, | | | | | | | | |
| Sr. Unscd. Notes | | | | 7.25 | | 8/15/13 | | 3,276,000 | | 3,479,286 |
| Tenet Healthcare, | | | | | | | | | | |
| Sr. Notes | | | | 6.38 | | 12/1/11 | | 1,205,000 | | 1,030,275 |
| | | | | | | | | | | 8,492,636 |
| Lodging & Entertainment—.5% | | | | | | | | |
| Cinemark, | | | | | | | | | | |
| Sr. Discount Notes | | | | 9.75 | | 3/15/14 | | 200,000 e | | 181,000 |
The Fund 17
STATEMENT OF INVESTMENTS (continued)
| | | Coupon | | Maturity | | Principal | | |
| Bonds and Notes (continued) | | Rate (%) | | Date | | Amount ($) | | Value ($) |
| |
| |
| |
| |
|
| Lodging & Entertainment (continued) | | | | | | |
| MGM Mirage, | | | | | | | | |
| Gtd. Notes | | 8.50 | | 9/15/10 | | 1,575,000 | | 1,598,625 |
| Mohegan Tribal Gaming Authority, | | | | | | | | |
| Sr. Unscd. Notes | | 6.13 | | 2/15/13 | | 1,000,000 | | 937,500 |
| Speedway Motorsports, | | | | | | | | |
| Sr. Sub. Notes | | 6.75 | | 6/1/13 | | 155,000 | | 148,800 |
| | | | | | | | | 2,865,925 |
| Machinery—.3% | | | | | | | | |
| Case New Holland, | | | | | | | | |
| Gtd. Notes | | 7.13 | | 3/1/14 | | 650,000 | | 638,625 |
| Terex, | | | | | | | | |
| Gtd. Notes | | 7.38 | | 1/15/14 | | 1,110,000 | | 1,093,350 |
| | | | | | | | | 1,731,975 |
| Manufacturing—.1% | | | | | | | | |
| Tyco International Group, | | | | | | | | |
| Gtd. Notes | | 6.88 | | 1/15/29 | | 530,000 | | 575,083 |
| Media—1.5% | | | | | | | | |
| Clear Channel Communications, | | | | | | | | |
| Sr. Unscd. Notes | | 4.50 | | 1/15/10 | | 1,700,000 | | 1,530,856 |
| Comcast, | | | | | | | | |
| Gtd. Notes | | 5.66 | | 7/14/09 | | 4,385,000 c | | 4,378,720 |
| Time Warner, | | | | | | | | |
| Gtd. Notes | | 5.59 | | 11/13/09 | | 2,725,000 c | | 2,727,894 |
| | | | | | | | | 8,637,470 |
| Oil & Gas—2.5% | | | | | | | | |
| Anadarko Petroleum, | | | | | | | | |
| Sr. Unscd. Notes | | 5.76 | | 9/15/09 | | 5,250,000 c | | 5,258,184 |
| BJ Services, | | | | | | | | |
| Sr. Unscd. Notes | | 5.53 | | 6/1/08 | | 4,850,000 c | | 4,855,417 |
| Enterprise Products Operating, | | | | | | | | |
| Gtd. Notes, Ser. B | | 4.00 | | 10/15/07 | | 4,000,000 | | 3,986,612 |
| | | | | | | | | 14,100,213 |
| Packaging & Containers—.1% | | | | | | | | |
| Crown Americas/Capital, | | | | | | | | |
| Gtd. Notes | | 7.63 | | 11/15/13 | | 815,000 | | 806,850 |
18
| | | Coupon | | Maturity | | Principal | | |
| Bonds and Notes (continued) | | Rate (%) | | Date | | Amount ($) | | Value ($) |
| |
| |
| |
| |
|
| Paper & Forest Products—.4% | | | | | | | | |
| Sappi Papier Holding, | | | | | | | | |
| Gtd. Notes | | 6.75 | | 6/15/12 | | 1,095,000 b | | 1,040,611 |
| Temple-Inland, | | | | | | | | |
| Gtd. Notes | | 6.63 | | 1/15/18 | | 1,100,000 | | 1,066,053 |
| | | | | | | | | 2,106,664 |
| Property & Casualty | | | | | | | | |
| Insurance—2.0% | | | | | | | | |
| Allmerica Financial, | | | | | | | | |
| Debs. | | 7.63 | | 10/15/25 | | 760,000 | | 790,202 |
| Chubb, | | | | | | | | |
| Sr. Unscd. Notes | | 5.47 | | 8/16/08 | | 2,375,000 | | 2,374,213 |
| Hartford Financial Services Group, | | | | | | | | |
| Sr. Unscd. Notes | | 5.55 | | 8/16/08 | | 875,000 | | 876,485 |
| Hartford Financial Services Group, | | | | | | | | |
| Sr. Notes | | 5.66 | | 11/16/08 | | 1,950,000 | | 1,956,260 |
| Leucadia National, | | | | | | | | |
| Sr. Notes | | 7.13 | | 3/15/17 | | 3,465,000 b | | 3,170,475 |
| Nippon Life Insurance, | | | | | | | | |
| Notes | | 4.88 | | 8/9/10 | | 1,350,000 b | | 1,324,003 |
| Phoenix Cos., | | | | | | | | |
| Sr. Unscd. Notes | | 6.68 | | 2/16/08 | | 735,000 | | 736,647 |
| | | | | | | | | 11,228,285 |
| Real Estate Investment Trusts—3.5% | | | | | | |
| Archstone-Smith Operating Trust, | | | | | | | | |
| Notes | | 3.00 | | 6/15/08 | | 1,000,000 | | 976,577 |
| Archstone-Smith Operating Trust, | | | | | | | | |
| Sr. Unscd. Notes | | 5.25 | | 5/1/15 | | 180,000 a | | 172,903 |
| Archstone-Smith Operating Trust, | | | | | | | | |
| Sr. Unscd. Notes | | 5.63 | | 8/15/14 | | 340,000 | | 336,321 |
| Boston Properties, | | | | | | | | |
| Sr. Notes | | 5.63 | | 4/15/15 | | 810,000 | | 803,541 |
| Commercial Net Lease Realty, | | | | | | | | |
| Sr. Unscd. Notes | | 6.15 | | 12/15/15 | | 1,100,000 | | 1,100,077 |
| Duke Realty, | | | | | | | | |
| Notes | | 3.50 | | 11/1/07 | | 925,000 | | 919,857 |
The Fund 19
STATEMENT OF INVESTMENTS (continued)
| | | Coupon | | Maturity | | Principal | | |
| Bonds and Notes (continued) | | Rate (%) | | Date | | Amount ($) | | Value ($) |
| |
| |
| |
| |
|
| Real Estate Investment | | | | | | | | |
| Trusts (continued) | | | | | | | | |
| Duke Realty, | | | | | | | | |
| Sr. Unscd. Notes | | 5.63 | | 8/15/11 | | 350,000 | | 350,393 |
| ERP Operating, | | | | | | | | |
| Notes | | 4.75 | | 6/15/09 | | 560,000 | | 552,465 |
| ERP Operating, | | | | | | | | |
| Notes | | 5.13 | | 3/15/16 | | 825,000 | | 773,427 |
| Federal Realty Investment Trust, | | | | | | | | |
| Sr. Unscd. Notes | | 5.40 | | 12/1/13 | | 650,000 | | 636,039 |
| Federal Realty Investment Trust, | | | | | | | | |
| Notes | | 6.00 | | 7/15/12 | | 570,000 | | 579,646 |
| Healthcare Realty Trust, | | | | | | | | |
| Sr. Unscd. Notes | | 5.13 | | 4/1/14 | | 2,820,000 | | 2,670,300 |
| HRPT Properties Trust, | | | | | | | | |
| Sr. Unscd. Notes | | 5.96 | | 3/16/11 | | 1,350,000 c | | 1,350,570 |
| Istar Financial, | | | | | | | | |
| Sr. Unscd. Notes | | 5.71 | | 3/9/10 | | 2,935,000 c | | 2,940,741 |
| Mack-Cali Realty, | | | | | | | | |
| Unscd. Notes | | 5.05 | | 4/15/10 | | 1,600,000 | | 1,575,450 |
| Mack-Cali Realty, | | | | | | | | |
| Notes | | 5.25 | | 1/15/12 | | 580,000 | | 567,874 |
| Regency Centers, | | | | | | | | |
| Gtd. Notes | | 5.25 | | 8/1/15 | | 1,450,000 a | | 1,392,825 |
| Simon Property Group, | | | | | | | | |
| Notes | | 4.60 | | 6/15/10 | | 1,098,000 | | 1,072,052 |
| Simon Property Group, | | | | | | | | |
| Notes | | 4.88 | | 8/15/10 | | 850,000 | | 836,176 |
| | | | | | | | | 19,607,234 |
| Residential Mortgage | | | | | | | | |
| Pass-Through Ctfs.—5.4% | | | | | | | | |
| American General Mortgage Loan | | | | | | | | |
| Trust, Ser. 2006-1, Cl. A1 | | 5.75 | | 12/25/35 | | 665,745 b | | 664,287 |
| Banc of America Mortgage | | | | | | | | |
| Securities, Ser. 2001-4, Cl. 2B3 | | 6.75 | | 4/20/31 | | 155,673 | | 155,205 |
| Bayview Commercial Asset Trust, | | | | | | | | |
| Ser. 2006-1A, Cl. M6 | | 5.96 | | 4/25/36 | | 387,970 b,c | | 381,241 |
| Bayview Commercial Asset Trust, | | | | | | | | |
| Ser. 2006-1A, Cl. B3 | | 8.27 | | 4/25/36 | | 400,902 b,c | | 400,902 |
20
| | | Coupon | | Maturity | | Principal | | |
| Bonds and Notes (continued) | | Rate (%) | | Date | | Amount ($) | | Value ($) |
| |
| |
| |
| |
|
| Residential Mortgage | | | | | | | | |
| Pass-Through Ctfs. (continued) | | | | | | | | |
| ChaseFlex Trust, | | | | | | | | |
| Ser. 2006-2, Cl. A1A | | 5.59 | | 9/25/36 | | 453,630 | | 453,211 |
| ChaseFlex Trust, | | | | | | | | |
| Ser. 2006-2, Cl. A5 | | 5.99 | | 9/25/36 | | 1,200,000 | | 1,205,361 |
| Citigroup Mortgage Loan Trust, | | | | | | | | |
| Ser. 2005-WF2, Cl. AF2 | | 4.92 | | 8/25/35 | | 159,264 c | | 158,494 |
| Countrywide Home Loan Mortgage | | | | | | | | |
| Pass-Through Trust, | | | | | | | | |
| Ser. 2003-8, Cl. B3 | | 5.00 | | 5/25/18 | | 233,977 b | | 210,141 |
| Countrywide Home Loan Mortgage | | | | | | | | |
| Pass-Through Trust, | | | | | | | | |
| Ser. 2005-31, Cl. 2A1 | | 5.51 | | 1/25/36 | | 959,175 c | | 955,285 |
| First Horizon Alternative Mortgage | | | | | | | | |
| Securities, Ser. 2004-FA1, Cl. 1A1 | | 6.25 | | 10/25/34 | | 5,703,995 | | 5,743,903 |
| Impac CMB Trust, | | | | | | | | |
| Ser. 2005-8, Cl. 2M2 | | 6.07 | | 2/25/36 | | 1,313,578 c | | 1,290,401 |
| Impac CMB Trust, | | | | | | | | |
| Ser. 2005-8, Cl. 2M3 | | 6.82 | | 2/25/36 | | 1,056,374 c | | 968,853 |
| Impac Secured Assets CMN Owner | | | | | | | | |
| Trust, Ser. 2006-1, Cl. 2A1 | | 5.67 | | 5/25/36 | | 709,845 c | | 711,360 |
| IndyMac Index Mortgage Loan Trust, | | | | | | | | |
| Ser. 2006-AR9, Cl. B1 | | 6.06 | | 6/25/36 | | 399,574 c | | 397,205 |
| IndyMac Index Mortgage Loan Trust, | | | | | | | | |
| Ser. 2006-AR25, Cl. 4A2 | | 6.15 | | 9/25/36 | | 1,143,264 c | | 1,154,677 |
| J.P. Morgan Alternative Loan | | | | | | | | |
| Trust, Ser. 2006-S4, Cl. A6 | | 5.71 | | 12/25/36 | | 890,000 c | | 887,567 |
| J.P. Morgan Mortgage Trust, | | | | | | | | |
| Ser. 2005-A1, Cl. 5A1 | | 4.48 | | 2/25/35 | | 754,653 c | | 737,213 |
| New Century Alternative Mortgage | | | | | | | | |
| Loan Trust, Ser. 2006-ALT2, | | | | | | | | |
| Cl. AF6A | | 5.89 | | 10/25/36 | | 695,000 c | | 691,017 |
| Nomura Asset Acceptance, | | | | | | | | |
| Ser. 2005-AP2, Cl. A5 | | 4.98 | | 5/25/35 | | 1,725,000 c | | 1,678,087 |
| Nomura Asset Acceptance, | | | | | | | | |
| Ser. 2005-WF1, Cl. 2A5 | | 5.16 | | 3/25/35 | | 1,195,000 c | | 1,165,017 |
| Terwin Mortgage Trust, | | | | | | | | |
| Ser. 2006-9HGA, Cl. A1 | | 5.40 | | 10/25/37 | | 743,409 c | | 743,276 |
The Fund 21
STATEMENT OF INVESTMENTS (continued)
| | | Coupon | | Maturity | | Principal | | |
| Bonds and Notes (continued) | | Rate (%) | | Date | | Amount ($) | | Value ($) |
| |
| |
| |
| |
|
| Residential Mortgage | | | | | | | | |
| Pass-Through Ctfs. (continued) | | | | | | | | |
| Washington Mutual, | | | | | | | | |
| Ser. 2005-AR4, Cl. A4B | | 4.67 | | 4/25/35 | | 3,325,000 c | | 3,276,186 |
| Wells Fargo Mortgage Backed | | | | | | | | |
| Securities Trust, | | | | | | | | |
| Ser. 2005-AR1, Cl. 1A1 | | 4.54 | | 2/25/35 | | 4,369,862 c | | 4,306,574 |
| Wells Fargo Mortgage Backed | | | | | | | | |
| Securities Trust, Ser. 2003-1, | | | | | | | | |
| Cl. 2A9 | | 5.75 | | 2/25/33 | | 1,800,000 | | 1,795,629 |
| | | | | | | | | 30,131,092 |
| Retail—.5% | | | | | | | | |
| CVS Caremark, | | | | | | | | |
| Sr. Unscd. Notes | | 5.66 | | 6/1/10 | | 1,055,000 c | | 1,056,297 |
| Home Depot, | | | | | | | | |
| Sr. Unscd. Notes | | 5.49 | | 12/16/09 | | 815,000 c | | 812,891 |
| May Department Stores, | | | | | | | | |
| Gtd. Notes | | 5.95 | | 11/1/08 | | 760,000 | | 758,950 |
| Saks, | | | | | | | | |
| Gtd. Notes | | 8.25 | | 11/15/08 | | 429 | | 443 |
| | | | | | | | | 2,628,581 |
| State/Territory Gen Oblg—1.9% | | | | | | | | |
| Michigan Tobacco Settlement | | | | | | | | |
| Finance Authority, Tobacco | | | | | | | | |
| Settlement Asset-Backed Bonds | | 7.31 | | 6/1/34 | | 4,525,000 | | 4,610,206 |
| Michigan Tobacco Settlement | | | | | | | | |
| Finance Authority, Tobacco | | | | | | | | |
| Settlement Asset-Backed Bonds | | 7.54 | | 6/1/34 | | 1,050,000 c | | 1,024,832 |
| New York Counties Tobacco Trust | | | | | | | | |
| IV, Tobacco Settlement | | | | | | | | |
| Pass-Through Bonds | | 6.00 | | 6/1/27 | | 1,750,000 | | 1,704,413 |
| Tobacco Settlement Authority of | | | | | | | | |
| Iowa, Tobacco Settlement | | | | | | | | |
| Asset-Backed Bonds | | 6.50 | | 6/1/23 | | 3,255,000 | | 3,207,900 |
| | | | | | | | | 10,547,351 |
| Telecommunications—4.0% | | | | | | | | |
| America Movil, | | | | | | | | |
| Gtd. Notes | | 5.46 | | 6/27/08 | | 455,000 b,c | | 455,091 |
22
| | | Coupon | | Maturity | | Principal | | |
| Bonds and Notes (continued) | | Rate (%) | | Date | | Amount ($) | | Value ($) |
| |
| |
| |
| |
|
| Telecommunications (continued) | | | | | | | | |
| AT & T, | | | | | | | | |
| Sr. Notes | | 5.45 | | 5/15/08 | | 2,700,000 c | | 2,702,481 |
| AT & T, | | | | | | | | |
| Notes | | 5.46 | | 2/5/10 | | 2,390,000 c | | 2,394,622 |
| France Telecom, | | | | | | | | |
| Unsub. Notes | | 7.75 | | 3/1/11 | | 1,280,000 c | | 1,375,436 |
| Intelsat, | | | | | | | | |
| Sr. Unscd. Notes | | 5.25 | | 11/1/08 | | 1,540,000 | | 1,509,200 |
| Nextel Communications, | | | | | | | | |
| Gtd. Notes, Ser. F | | 5.95 | | 3/15/14 | | 1,035,000 | | 961,241 |
| Qwest, | | | | | | | | |
| Bank Note, Ser. B | | 6.95 | | 6/30/10 | | 464,000 c | | 461,680 |
| Qwest, | | | | | | | | |
| Bank Note, Ser. B | | 6.95 | | 6/30/10 | | 1,858,000 c | | 1,849,639 |
| Qwest, | | | | | | | | |
| Sr. Notes | | 7.88 | | 9/1/11 | | 710,000 | | 724,200 |
| Sprint Capital, | | | | | | | | |
| Gtd. Notes | | 8.75 | | 3/15/32 | | 2,340,000 | | 2,578,294 |
| Telefonica Emisiones, | | | | | | | | |
| Gtd. Notes | | 5.66 | | 6/19/09 | | 2,330,000 c | | 2,326,792 |
| Telefonica Emisiones, | | | | | | | | |
| Gtd. Notes | | 5.98 | | 6/20/11 | | 2,425,000 | | 2,438,699 |
| Time Warner Cable, | | | | | | | | |
| Sr. Unscd. Notes | | 5.85 | | 5/1/17 | | 1,380,000 b | | 1,333,281 |
| Windstream, | | | | | | | | |
| Gtd. Notes | | 8.13 | | 8/1/13 | | 1,435,000 | | 1,458,319 |
| | | | | | | | | 22,568,975 |
| Textiles & Apparel—.2% | | | | | | | | |
| Mohawk Industries, | | | | | | | | |
| Sr. Unscd. Notes | | 5.75 | | 1/15/11 | | 990,000 | | 1,000,708 |
| Transportation—.2% | | | | | | | | |
| Ryder System, | | | | | | | | |
| Notes | | 3.50 | | 3/15/09 | | 1,435,000 | | 1,391,067 |
| U.S. Government Agencies—.4% | | | | | | | | |
| Federal National Mortgage | | | | | | | | |
| Association, Notes | | 5.75 | | 8/3/09 | | 2,495,000 | | 2,494,950 |
The Fund 23
| STATEMENT OF INVESTMENTS (continued) |
| | | Principal | | |
| Bonds and Notes (continued) | | Amount ($) | | Value ($) |
| |
| |
|
| U.S. Government Agencies/ | | | | |
| Mortgage-Backed—34.6% | | | | |
| Federal Home Loan Mortgage Corp.: | | | | |
| 5.50% | | 54,915,000 f | | 53,290,653 |
| 6.50%, 10/1/31—3/1/32 | | 91,070 | | 92,853 |
| Multiclass Mortgage Participation Ctfs., | | | | |
| Ser. 2586, Cl. WE, 4.00%, 12/15/32 | | 4,746,133 | | 4,358,745 |
| Federal National Mortgage Association: | | | | |
| 5.00% | | 22,325,000 f | | 21,644,757 |
| 6.00% | | 81,235,000 f | | 80,850,214 |
| 5.00%, 5/1/18 | | 1,086,089 | | 1,058,622 |
| 5.50%, 8/1/34—9/1/34 | | 8,720,450 | | 8,454,196 |
| 6.50%, 11/1/10 | | 418 | | 424 |
| Pass-Through Ctfs., Ser. 2004-58, | | | | |
| Cl. LJ, 5.00%, 7/25/34 | | 3,263,905 | | 3,241,416 |
| Government National Mortgage Association I: | | | | |
| Ser. 2007-46, Cl. A, 3.14%, 11/16/29 | | 1,250,000 | | 1,250,000 |
| Ser. 2004-25, Cl. AC, 3.38%, 1/16/23 | | 330,371 | | 320,767 |
| Ser. 2005-34, Cl. A, 3.96%, 9/16/21 | | 1,272,847 | | 1,250,874 |
| Ser. 2005-79, Cl. A, 4.00%, 10/16/33 | | 1,322,102 | | 1,293,150 |
| Ser. 2005-50, Cl. A, 4.02%, 10/16/26 | | 1,204,545 | | 1,181,452 |
| Ser. 2005-29, Cl. A, 4.02%, 7/16/27 | | 1,797,264 | | 1,750,858 |
| Ser. 2005-42, Cl. A, 4.05%, 7/16/20 | | 1,626,104 | | 1,596,957 |
| Ser. 2005-67, Cl. A, 4.22%, 6/16/21 | | 1,248,322 | | 1,229,491 |
| Ser. 2005-59, Cl. A, 4.39%, 5/16/23 | | 1,295,908 | | 1,276,611 |
| Ser. 2005-32, Cl. B, 4.39%, 8/16/30 | | 3,418,483 | | 3,364,266 |
| Ser. 2004-39, Cl. LC, 5.50%, 12/20/29 | | 4,800,000 | | 4,809,065 |
| Government National Mortgage Association II: | | | | |
| 5.50%, 7/20/30 | | 69,345 c | | 70,058 |
| 6.50%, 2/20/31—7/20/31 | | 280,758 | | 287,075 |
| 7.00%, 11/20/29 | | 785 | | 818 |
| | | | | 192,673,322 |
| U.S. Government Securities—30.6% | | | | |
| U.S. Treasury Bonds | | | | |
| 4.75%, 2/15/37 | | 6,634,000 g | | 6,459,864 |
| U.S. Treasury Notes: | | | | |
| 3.88%, 9/15/10 | | 15,635,000 | | 15,330,852 |
| 4.25%, 1/15/11 | | 80,450,000 a | | 79,683,231 |
24
| | | Principal | | |
| Bonds and Notes (continued) | | Amount ($) | | Value ($) |
| |
| |
|
| U.S. Government Securities (continued) | | |
| U.S. Treasury Notes (continued): | | | | |
| 4.50%, 4/30/12 | | 165,000 | | 164,291 |
| 4.50%, 5/15/17 | | 69,860,000 g | | 68,391,892 |
| | | | | 170,030,130 |
| Total Bonds and Notes | | | | |
| (cost $738,618,014) | | | | 737,124,156 |
| |
| |
|
| |
| Preferred Stocks—.5% | | Shares | | Value ($) |
| |
| |
|
| Banks—.1% | | | | |
| Sovereign Capital Trust IV, | | | | |
| Conv., Cum. $2.1875 | | 15,500 | | 679,675 |
| Diversified Financial Services—.4% | | |
| AES Trust VII, | | | | |
| Conv., Cum. $3.00 | | 44,450 | | 2,216,944 |
| Total Preferred Stocks | | | | |
| (cost $2,973,894) | | | | 2,896,619 |
| |
| |
|
| | | Face Amount | | |
| | | Covered by | | |
| Options—.5% | | Contracts ($) | | Value ($) |
| |
| |
|
| Call Options—.5% | | | | |
| 3-Month Floor USD Libor-BBA | | | | |
| Interest Rate, October 2009 @ 4 | | 49,400,000 | | 49,831 |
| 3-Month USD Libor-BBA, | | | | |
| Swaption | | 10,510,000 | | 520,644 |
| 3-Month USD Libor-BBA, | | | | |
| Swaption | | 44,095,000 | | 2,215,862 |
| Dow Jones CDX.IG8 | | | | |
| September 2007 @.400 | | 107,160,000 | | 7,608 |
| Dow Jones CDX.IG8 | | | | |
| December 2007 @ .45 | | 54,820,000 | | 5,482 |
| U.S. Treasury 5 Year Note | | | | |
| August 2007 @ 105.5 | | 26,200,000 | | 126,906 |
| | | | | 2,926,333 |
The Fund 25
STATEMENT OF INVESTMENTS (continued)
| | | Face Amount | | |
| | | Covered by | | |
| Options (continued) | | Contracts ($) | | Value ($) |
| |
| |
|
| Put Options—.0% | | | | |
| U.S. Treasury 10 Year Note | | | | |
| September 2007 @ 104.5 | | 20,600,000 | | 28,970 |
| U.S. Treasury 5 Year Note | | | | |
| August 2007 @ 105 | | 21,000,000 | | 62,344 |
| | | | | 91,314 |
| Total Options | | | | |
| (cost $3,212,645) | | | | 3,017,647 |
| |
| |
|
| | | Principal | | |
| Short-Term Investments—5.1% | | Amount ($) | | Value ($) |
| |
| |
|
| Commerical Paper—2.0% | | | | |
| Cox Communications, | | | | |
| 5.57%, 1/15/08 | | 5,645,000 | | 5,645,000 |
| Cox Enterprises, | | | | |
| 5.60%, 8/15/07 | | 5,450,000 b,c | | 5,450,000 |
| | | | | 11,095,000 |
| U.S. Government Agencies—2.7% | | | | |
| Federal National Mortgage | | | | |
| Association, 5.14%, 10/10/07 | | 15,195,000 | | 15,043,169 |
| U.S. Treasury Bills—.4% | | | | |
| 4.77%, 9/6/07 | | 2,075,000 h | | 2,064,749 |
| Total Short-Term Investments | | | | |
| (cost $28,203,274) | | | | 28,202,918 |
| |
| |
|
| |
| Other Investment—1.4% | | Shares | | Value ($) |
| |
| |
|
| Registered Investment Company; | | | | |
| Dreyfus Institutional Preferred | | | | |
| Plus Money Market Fund | | | | |
| (cost $7,997,000) | | 7,997,000 i | | 7,997,000 |
26
| Investment of Cash Collateral | | | | |
| for Securities Loaned—18.1% | | Shares | | Value ($) |
| |
| |
|
| Registered Investment Company; | | | | |
| Dreyfus Institutional Cash | | | | |
| Advantage Plus Fund | | | | |
| (cost $101,271,566) | | 101,271,566 i | | 101,271,566 |
| |
| |
|
| Total Investments (cost $882,276,393) | | 157.8% | | 880,509,906 |
| Liabilities, Less Cash and Receivables | | (57.8%) | | (322,366,164) |
| Net Assets | | 100.0% | | 558,143,742 |
| a All or a portion of these securities are on loan.At July 31, 2007, the total market value of the fund’s securities on |
| loan is $98,714,756 and the total market value of the collateral held by the fund is $101,271,566. |
| b Securities exempt from registration under Rule 144A of the Securities Act of 1933.These securities may be resold in |
| transactions exempt from registration, normally to qualified institutional buyers.At July 31, 2007, these securities |
| amounted to $86,968,386 or 15.6% of net assets. |
| c Variable rate security—interest rate subject to periodic change. |
| d Principal amount stated in U.S. Dollars unless otherwise noted. |
| BRL—Brazilian Real |
| EGP—Egyptian Pound |
| EUR—Euro |
| MXN—Mexican Peso |
| e Zero coupon until a specified date at which time the stated coupon rate becomes effective until maturity. |
| f Purchased on a forward commitment basis. |
| g Purchased on a delayed delivery basis. |
| h All or partially held by a broker as collateral for open financial futures positions. |
| i Investment in affiliated money market mutual fund. |
| Portfolio Summary (Unaudited) † | | | | |
| |
| | | Value (%) | | | | Value (%) |
| |
| |
| |
|
| U.S. Government & Agencies | | 65.6 | | Foreign/Governmental | | 4.1 |
| Corporate Bonds | | 41.4 | | State/Government General Obligations | | 1.9 |
| Short-Term/Money | | | | Options | | .5 |
| Market Investments | | 24.6 | | Preferred Stocks | | .5 |
| Asset/Mortgage-Backed | | 19.2 | | | | 157.8 |
† Based on net assets.
See notes to financial statements.
The Fund 27
STATEMENT OF FINANCIAL FUTURES
July 31, 2007
|
| | | | | | | | | Unrealized |
| | | | | Market Value | | | | Appreciation |
| | | | | Covered by | | | | (Depreciation) |
| | | Contracts | | Contracts ($) | | Expiration | | at 7/31/2007 ($) |
| |
| |
| |
| |
|
| Financial Futures Long: | | | | | | | | |
| U.S. Treasury 5 Year Notes | | 324 | | 34,171,875 | | September 2007 | | 400,649 |
| U.S. Treasury 10 Year Notes | | 156 | | 16,757,813 | | September 2007 | | 185,250 |
| Financial Futures Short; | | | | | | | | |
| U.S. Treasury 2 Year Notes | | 98 | | (20,083,875) | | September 2007 | | (81,156) |
| | | | | | | | | 504,743 |
See notes to financial statements.
STATEMENT OF OPTIONS WRITTEN
July 31, 2007
|
| | | Face Amount | | |
| | | Covered by | | |
| | | Contracts ($) | | Value ($) |
| |
| |
|
| Call Options: | | | | |
| Dow Jones CDX.IG8 | | 214,320,000 | | (536) |
| September 2007 @ .35 | | | | |
| Dow Jones CDX.IG8 | | 109,640,000 | | (43,527) |
| December 2007 @ .395 | | | | |
| U.S. Treasury 5 Year Notes | | 52,400,000 | | (98,250) |
| August 2007 @ 106.5 | | | | |
| Put Options; | | | | |
| U.S. Treasury 10 Year Notes | | 20,600,000 | | (3,220) |
| August 2007 @ 101 | | | | |
| (Premiums received $526,514) | | (145,533) |
See notes to financial statements.
28
| | STATEMENT OF ASSETS AND LIABILITIES
July 31, 2007
|
| | | Cost | | Value |
| |
| |
|
| Assets ($): | | | | |
| Investment in securities—See Statement of Investments (including | | |
| securities on loan, valued at $98,714,756)—Note 1(c): | | |
| Unaffiliated issuers | | 773,007,827 | | 771,241,340 |
| Affiliated issuers | | 109,268,566 | | 109,268,566 |
| Cash denominated in foreign currencies | | 390,289 | | 386,891 |
| Receivable for investment securities sold | | | | 66,703,073 |
| Dividends and interest receivable | | | | 5,703,185 |
| Receivable from broker for swap transactions—Note 4 | | 3,380,978 |
| Swaps Premium paid | | | | 2,161,630 |
| Unrealized appreciation on swap contracts—Note 4 | | 1,588,790 |
| Receivable for shares of Common stock subscribed | | 483,732 |
| Receivable for futures variation margin | | | | 66,062 |
| Prepaid expenses | | | | 25,209 |
| | | | | 961,009,456 |
| |
| |
|
| Liabilities ($): | | | | |
| Due to The Dreyfus Corporation and affiliates—Note 3 (b) | | 354,205 |
| Cash overdraft due to Custodian | | | | 87,745 |
| Payable for investment securities purchased | | 296,602,540 |
| Liability for securities on loan—Note 1(c) | | | | 101,271,566 |
| Unrealized depreciation on swap contracts—Note 4 | | 2,866,251 |
| Payable for shares of Common stock redeemed | | 762,543 |
| Payable to broker from swap transactions—Note 4 | | 454,194 |
| Outstanding options written, at value (premiums received | | |
| $526,514)—See Statement of Options Written—Note 4 | | 145,533 |
| Unrealized depreciation on forward currency exchange contracts—Note 4 | | 34,298 |
| Accrued expenses | | | | 286,839 |
| | | | | 402,865,714 |
| |
| |
|
| Net Assets ($) | | | | 558,143,742 |
| |
| |
|
| Composition of Net Assets ($): | | | | |
| Paid-in capital | | | | 580,717,952 |
| Accumulated undistributed investment income—net | | 3,559,619 |
| Accumulated net realized gain (loss) on investments | | (23,966,621) |
| Accumulated net unrealized appreciation (depreciation) on investments, | | |
| options, swap transactions and foreign currency transactions | | |
| (including $ 504,743 net unrealized appreciation on financial futures) | | (2,167,208) |
| |
|
| Net Assets ($) | | | | 558,143,742 |
| |
| |
|
| |
| |
| |
| Net Asset Value Per Share | | | | |
| | | Investor Shares | | Institutional Shares |
| |
| |
|
| Net Assets ($) | | 522,661,434 | | 35,482,308 |
| Shares Outstanding | | 42,136,021 | | 2,860,927 |
| |
| |
|
| Net Asset Value Per Share ($) | | 12.40 | | 12.40 |
See notes to financial statements.
The Fund 29
STATEMENT OF OPERATIONS
Year Ended July 31, 2007
|
| Investment Income ($): | | |
| Interest | | 29,158,921 |
| Dividends: | | |
| Unaffiliated issuers | | 127,000 |
| Affiliated issuers | | 260,222 |
| Income from securities lending | | 29,262 |
| Total Income | | 29,575,405 |
| Expenses: | | |
| Management fee—Note 3(a) | | 2,356,977 |
| Shareholder servicing costs—Note 3(b) | | 1,934,699 |
| Custodian fees—Note 3(b) | | 156,607 |
| Professional fees | | 61,250 |
| Prospectus and shareholders’ reports | | 41,216 |
| Registration fees | | 33,159 |
| Directors’ fees and expenses—Note 3(c) | | 9,074 |
| Miscellaneous | | 69,783 |
| Total Expenses | | 4,662,765 |
| Less—reduction in management fee | | |
| due to undertaking—Note 3(a) | | (559,737) |
| Net Expenses | | 4,103,028 |
| Investment Income—Net | | 25,472,377 |
| |
|
| Realized and Unrealized Gain (Loss) on Investments—Note 4 ($): |
| Net realized gain (loss) on investments and foreign currency transactions | | 2,668,561 |
| Net realized gain (loss) on options transactions | | (31,279) |
| Net realized gain (loss) on financial futures | | (3,641,377) |
| Net realized gain (loss) on swap transactions | | 738,271 |
| Net realized gain (loss) on forward currency exchange contracts | | (428,904) |
| Net realized gain (loss) | | (694,728) |
| Net unrealized appreciation (depreciation) on investments, options | | |
| transactions, swap transactions and foreign currency transactions | | |
| (including $805,383 net unrealized appreciation on financial futures) | | 3,626,068 |
| Net Realized and Unrealized Gain (Loss) on Investments | | 2,931,340 |
| Net Increase in Net Assets Resulting from Operations | | 28,403,717 |
See notes to financial statements.
30
STATEMENT OF CHANGES IN NET ASSETS
| | | | | Year Ended July 31, |
| |
| |
|
| | | 2007 | | 2006 |
| |
| |
|
| Operations ($): | | | | |
| Investment income—net | | 25,472,377 | | 21,936,937 |
| Net realized gain (loss) on investments | | (694,728) | | (9,334,542) |
| Net unrealized appreciation | | | | |
| (depreciation) on investments | | 3,626,068 | | (2,363,159) |
| Net Increase (Decrease) in Net Assets | | | | |
| Resulting from Operations | | 28,403,717 | | 10,239,236 |
| |
| |
|
| Dividends to Shareholders from ($): | | | | |
| Investment income—net: | | | | |
| Investor Shares | | (25,028,938) | | (22,849,510) |
| Institutional Shares | | (1,871,248) | | (1,381,927) |
| Net realized gain on investments: | | | | |
| Investor Shares | | — | | (2,832,114) |
| Institutional Shares | | — | | (162,146) |
| Total Dividends | | (26,900,186) | | (27,225,697) |
| |
| |
|
| Capital Stock Transactions ($): | | | | |
| Net proceeds from shares sold: | | | | |
| Investor Shares | | 154,466,147 | | 78,528,146 |
| Institutional Shares | | 6,267,151 | | 11,044,482 |
| Dividends reinvested: | | | | |
| Investor Shares | | 23,136,692 | | 23,080,078 |
| Institutional Shares | | 19,209 | | 166,374 |
| Cost of shares redeemed: | | | | |
| Investor Shares | | (115,167,212) | | (157,878,749) |
| Institutional Shares | | (2,411,080) | | (6,257,458) |
| Increase (Decrease) in Net Assets from | | | | |
| Capital Stock Transactions | | 66,310,907 | | (51,317,127) |
| Total Increase (Decrease) in Net Assets | | 67,814,438 | | (68,303,588) |
| |
| |
|
| Net Assets ($): | | | | |
| Beginning of Period | | 490,329,304 | | 558,632,892 |
| End of Period | | 558,143,742 | | 490,329,304 |
| Undistributed investment income—net | | 3,559,619 | | 2,637,000 |
The Fund 31
STATEMENT OF CHANGES IN NET ASSETS (continued)
| | | | | Year Ended July 31, |
| |
| |
|
| | | 2007 | | 2006 |
| |
| |
|
| Capital Share Transactions: | | | | |
| Investor Shares | | | | |
| Shares sold | | 12,317,326 | | 6,278,917 |
| Shares issued for dividends reinvested | | 1,844,775 | | 1,847,048 |
| Shares redeemed | | (9,194,033) | | (12,627,666) |
| Net Increase (Decrease) in Shares Outstanding | | 4,968,068 | | (4,501,701) |
| |
| |
|
| Institutional Shares | | | | |
| Shares sold | | 501,731 | | 894,160 |
| Shares issued for dividends reinvested | | 1,534 | | 13,285 |
| Shares redeemed | | (192,195) | | (507,206) |
| Net Increase (Decrease) in Shares Outstanding | | 311,070 | | 400,239 |
See notes to financial statements.
32
FINANCIAL HIGHLIGHTS
The following tables describe the performance for each share class for the fiscal periods indicated.All information (except portfolio turnover rate) reflects financial results for a single fund share.Total return shows how much your investment in the fund would have increased (or decreased) during each period, assuming you had reinvested all dividends and distributions.These figures have been derived from the fund’s financial statements.
| | | | | Year Ended July 31, | | |
| |
| |
| |
|
| Investor Shares | | 2007 | | 2006 | | 2005 | | 2004 a | | 2003 |
| |
| |
| |
| |
| |
|
| Per Share Data ($): | | | | | | | | | | |
| Net asset value, beginning of period | | 12.35 | | 12.75 | | 12.53 | | 12.86 | | 12.42 |
| Investment Operations: | | | | | | | | | | |
| Investment income—net b | | .61 | | .53 | | .46 | | .46 | | .56 |
| Net realized and unrealized | | | | | | | | | | |
| gain (loss) on investments | | .08 | | (.28) | | .31 | | (.01)c | | .51 |
| Total from Investment Operations | | .69 | | .25 | | .77 | | .45 | | 1.07 |
| Distributions: | | | | | | | | | | |
| Dividends from investment income—net | | (.64) | | (.58) | | (.55) | | (.54) | | (.63) |
| Dividends from net realized | | | | | | | | | | |
| gain on investments | | — | | (.07) | | — | | (.24) | | — |
| Total Distributions | | (.64) | | (.65) | | (.55) | | (.78) | | (.63) |
| Net asset value, end of period | | 12.40 | | 12.35 | | 12.75 | | 12.53 | | 12.86 |
| |
| |
| |
| |
| |
|
| Total Return (%) | | 5.74 | | 2.05 | | 6.24 | | 3.59 | | 8.64 |
| |
| |
| |
| |
| |
|
| Ratios/Supplemental Data (%): | | | | | | | | | | |
| Ratio of total expenses | | | | | | | | | | |
| to average net assets | | .92 | | .91 | | .89 | | .90 | | .90 |
| Ratio of net expenses | | | | | | | | | | |
| to average net assets | | .80 | | .80 | | .80 | | .80 | | .82 |
| Ratio of net investment income | | | | | | | | | | |
| to average net assets | | 4.85 | | 4.21 | | 3.63 | | 3.56 | | 4.34 |
| Portfolio Turnover Rate | | 492.35d | | 439.09d | | 644.23d | | 801.49d | | 838.50 |
| |
| |
| |
| |
| |
|
| Net Assets, end of period ($ x 1,000) | | 522,661 | | 458,856 | | 531,232 | | 677,228 | | 831,818 |
| a As of August 1, 2003, the fund has adopted the method of accounting for interim payments on swap contracts in |
| accordance with Financial Accounting Standards Board Statement No. 133.These interim payments are reflected |
| within net realized and unrealized gain (loss) on swap contracts, however, prior to August 1, 2003, these interim |
| payments were reflected within interest income/expense in the Statement of Operations.The effect of this change for |
| the fiscal year ended July 31, 2004, was to increase net investment income per share by $.01, decrease net realized |
| and unrealized gain (loss) on investments per share by $.01 and increase the ratio of net investment income to |
| average net assets from 3.51% to 3.56%. Per share data and ratios/supplemental data for periods prior to August 1, |
| 2003 have not been restated to reflect this change in presentation. |
| b Based on average shares outstanding at each month end. |
| c In addition to the net realized and unrealized gain on investments as shown in the Statement of Operations, this |
| amount includes a decrease in net asset value per share resulting from the timing of issuances and redemptions of |
| shares in relation to fluctuating market values for the fund’s investments. |
| d The portfolio turnover rates excluding mortgage dollar roll transactions for the periods ended July 31, 2007, July 31, |
| 2006, July 31, 2005 and July 31, 2004 were 357.70%, 270.18%, 521.83% and 718.14%, respectively. |
See notes to financial statements.
The Fund 33
FINANCIAL HIGHLIGHTS (continued)
| | | | | Year Ended July 31, | | |
| |
| |
| |
|
| Institutional Shares | | 2007 | | 2006 | | 2005 | | 2004 a | | 2003 |
| |
| |
| |
| |
| |
|
| Per Share Data ($): | | | | | | | | | | |
| Net asset value, beginning of period | | 12.34 | | 12.75 | | 12.52 | | 12.85 | | 12.41 |
| Investment Operations: | | | | | | | | | | |
| Investment income—net b | | .64 | | .56 | | .51 | | .49 | | .63 |
| Net realized and unrealized | | | | | | | | | | |
| gain (loss) on investments | | .09 | | (.28) | | .30 | | .00c | | .48 |
| Total from Investment Operations | | .73 | | .28 | | .81 | | .49 | | 1.11 |
| Distributions: | | | | | | | | | | |
| Dividends from investment income—net | | (.67) | | (.62) | | (.58) | | (.58) | | (.67) |
| Dividends from net realized | | | | | | | | | | |
| gain on investments | | — | | (.07) | | — | | (.24) | | — |
| Total Distributions | | (.67) | | (.69) | | (.58) | | (.82) | | (.67) |
| Net asset value, end of period | | 12.40 | | 12.34 | | 12.75 | | 12.52 | | 12.85 |
| |
| |
| |
| |
| |
|
| Total Return (%) | | 6.02 | | 2.35 | | 6.40 | | 3.88 | | 9.07 |
| |
| |
| |
| |
| |
|
| Ratios/Supplemental Data (%): | | | | | | | | | | |
| Ratio of total expenses | | | | | | | | | | |
| to average net assets | | .53 | | .51 | | .55 | | .53 | | .53 |
| Ratio of net expenses | | | | | | | | | | |
| to average net assets | | .53 | | .51 | | .53 | | .52 | | .50 |
| Ratio of net investment income | | | | | | | | | | |
| to average net assets | | 5.10 | | 4.48 | | 3.86 | | 3.85 | | 4.88 |
| Portfolio Turnover Rate | | 492.35d | | 439.09d | | 644.23d | | 801.49d | | 838.50 |
| |
| |
| |
| |
| |
|
| Net Assets, end of period ($ x 1,000) | | 35,482 | | 31,473 | | 27,401 | | 2,850 | | 4,470 |
| a | | As of August 1, 2003, the fund has adopted the method of accounting for interim payments on swap contracts in |
| | | accordance with Financial Accounting Standards Board Statement No. 133.These interim payments are reflected |
| | | within net realized and unrealized gain (loss) on swap contracts, however, prior to August 1, 2003, these interim |
| | | payments were reflected within interest income/expense in the Statement of Operations.The effect of this change for |
| | | the fiscal year ended July 31, 2004, was to increase net investment income per share by less than $.01, decrease net |
| | | realized and unrealized gain (loss) on investments per share by less than $.01 and increase the ratio of net |
| | | investment income to average net assets from 3.80% to 3.85%. Per share data and ratios/supplemental data for |
| | | periods prior to August 1, 2003 have not been restated to reflect this change in presentation. |
| b | | Based on average shares outstanding at each month end. |
| c | | Amount represents less than $.01 per share. |
| d | | The portfolio turnover rates excluding mortgage dollar roll transactions for the periods ended July 31, 2007, July 31, |
| | | 2006, July 31, 2005 and July 31, 2004 were 357.70%, 270.18%, 521.83% and 718.14%, respectively. |
| See notes to financial statements. |
34
NOTES TO FINANCIAL STATEMENTS
NOTE 1—Significant Accounting Policies:
Dreyfus Intermediate Term Income Fund (the “fund”) is a separate diversified series of Dreyfus Investment Grade Funds, Inc. (the “Company”) which is registered under the Investment Company Act of 1940, as amended (the “Act”), as an open-end management investment company and operates as a series company currently offering four series, including the fund.The fund’s investment objective is to seek to maximize total return, consisting of capital appreciation and current income.The Dreyfus Corporation (the “Manager” or “Dreyfus”) serves as the fund’s investment adviser. During the reporting period, the Manager was a wholly-owned subsidiary of Mellon Financial Corporation (“Mellon Financial”).
On July 1, 2007, the Mellon Financial and The Bank of New York Company, Inc. merged, forming The Bank of New York Mellon Corporation. As part of this transaction, Dreyfus became a wholly-owned subsidiary of The Bank of New York Mellon Corporation.
During the reporting period, Dreyfus Service Corporation (the “Distributor”), a wholly-owned subsidiary of the Manager, was the distributor of the fund’s shares which are sold to the public without a sales charge. Effective June 30, 2007, the Distributor became known as MBSC Securities Corporation. The fund is authorized to issue 500 million shares of $.001 par value Common Stock in each of the following classes of shares: Investor and Institutional. Investor shares are subject to a shareholder services plan. Other differences between the classes include the services offered to and the expenses borne by each class, the minimum initial investment and certain voting rights. Income, expenses (other than expenses attributable to a specific class), and realized and unrealized gains or losses on investments are allocated to each class of shares based on its relative net assets.
The Company accounts separately for the assets, liabilities and operations of each series. Expenses directly attributable to each series are charged to that series’ operations; expenses which are applicable to all series are allocated among them on a pro rata basis.
The Fund 35
NOTES TO FINANCIAL STATEMENTS (continued)
The fund’s financial statements are prepared in accordance with U.S. generally accepted accounting principles, which may require the use of management estimates and assumptions. Actual results could differ from those estimates.
The fund enters into contracts that contain a variety of indemnifications. The fund’s maximum exposure under these arrangements is unknown.The fund does not anticipate recognizing any loss related to these arrangements.
(a) Portfolio valuation: Investments in securities excluding short-term investments (other than U.S. Treasury Bills), financial futures, options, swap transactions and forward currency exchange contracts are valued each business day by an independent pricing service (the “Service”) approved by the Board of Directors. Investments for which quoted bid prices are readily available and are representative of the bid side of the market in the judgment of the Service are valued at the mean between the quoted bid prices (as obtained by the Service from dealers in such securities) and asked prices (as calculated by the Service based upon its evaluation of the market for such securities). Other investments (which constitute a majority of the portfolio securities) are valued as determined by the Service, based on methods which include consideration of: yields or prices of securities of comparable quality, coupon, maturity and type; indications as to values from dealers; and general market conditions. Securities for which there are no such valuations are valued at fair value as determined in good faith under the direction of the Board of Directors. Restricted securities, as well as securities or other assets for which recent market quotations are not readily available,that are not valued by a pricing service approved by the Board of Directors, or determined by the fund not to reflect accurately fair value, are valued at fair value as determined in good faith under the direction of the Board of Directors.The factors that may be considered when fair valuing a security include fundamental analytical data, the nature and duration of restrictions on disposition, an evaluation of the forces that influence the market in which the securities are purchased and sold and public trading in similar securities of the issuer or comparable issuers. Short-term
36
investments, excluding U.S.Treasury Bills, are carried at amortized cost, which approximates value. Registered open-end investment companies that are not traded on an exchange, are valued at their net asset value. Financial futures and options, which are traded on an exchange, are valued at the last sales price on the securities exchange on which such securities are primarily traded or at the last sales price on the national securities market on each business day. Options traded over-the-counter are priced at the mean between the bid and the asked price. Investments in swap transactions are valued each business day by a pricing service approved by the Board of Trustees. Swaps are valued by the service by using a swap pricing model which incorporates among other factors, default probabilities, recovery rates, credit curves of the underlying issuer and swap spreads on interest rates. Investments denominated in foreign currencies are translated to U.S. dollars at the prevailing rates of exchange. Forward currency exchange contracts are valued at the forward rate.
On September 20, 2006, the Financial Accounting Standards Board (FASB) released Statement of Financial Accounting Standards No. 157 “Fair Value Measurements” (“FAS 157”). FAS 157 establishes an authoritative definition of fair value, sets out a framework for measuring fair value, and requires additional disclosures about fair-value measurements. The application of FAS 157 is required for fiscal years beginning after November 15, 2007 and interim periods within those fiscal years. Management does not believe that the application of this standard will have a material impact on the financial statements of the fund.
(b) Foreign currency transactions: The fund does not isolate that portion of the results of operations resulting from changes in foreign exchange rates on investments from the fluctuations arising from changes in market prices of securities held. Such fluctuations are included with the net realized and unrealized gain or loss on investments.
Net realized foreign exchange gains or losses arise from sales and maturities of short-term securities, sales of foreign currencies, currency gains or losses realized on securities transactions and the difference between
The Fund 37
NOTES TO FINANCIAL STATEMENTS (continued)
the amounts of dividends, interest, and foreign withholding taxes recorded on the fund’s books and the U.S. dollar equivalent of the amounts actually received or paid. Net unrealized foreign exchange gains and losses arise from changes in the value of assets and liabilities other than investments in securities, resulting from changes in exchange rates. Such gains and losses are included with net realized and unrealized gain or loss on investments.
(c) Securities transactions and investment income: Securities transactions are recorded on a trade date basis. Realized gain and loss from securities transactions are recorded on the identified cost basis. Dividend income is recognized on the ex-dividend date and interest income, including, where applicable, accretion of discount and amortization of premium on investments, is recognized on the accrual basis.
The fund has an arrangement with the custodian bank whereby the fund receives earnings credits from the custodian when positive cash balances are maintained, which are used to offset custody fees. For financial reporting purposes, the fund includes net earnings credits as an expense offset in the Statement of Operations.
Pursuant to a securities lending agreement with Mellon Bank, N.A., an affiliate of the Manager, the fund may lend securities to qualified institutions. It is the fund’s policy, that at origination, all loans are secured by collateral of at least 102% of the value of U.S. securities loaned and 105% of the value of foreign securities loaned. Collateral equivalent to at least 100% of the market value of securities on loan is maintained at all times. Cash collateral is invested in certain money market mutual funds managed by the Manager. The fund is entitled to receive all income on securities loaned, in addition to income earned as a result of the lending transaction.Although each security loaned is fully collateralized, the fund bears the risk of delay in recovery of, or loss of rights in, the securities loaned should a borrower fail to return the securities in a timely manner.
(d) Affiliated issuers: Investments in other investment companies advised by the Manager are defined as “affiliated” in the Act.
38
(e) Dividends to shareholders: It is the policy of the fund to declare dividends daily from investment income-net. Such dividends are paid monthly. Dividends from net realized capital gain, if any, are normally declared and paid annually, but the fund may make distributions on a more frequent basis to comply with the distribution requirements of the Internal Revenue Code of 1986, as amended (the “Code”).To the extent that net realized capital gain can be offset by capital loss carryovers, it is the policy of the fund not to distribute such gain. Income and capital gain distributions are determined in accordance with income tax regulations, which may differ from U.S. generally accepted accounting principles.
(f) Federal income taxes: It is the policy of the fund to continue to qualify as a regulated investment company, if such qualification is in the best interests of its shareholders, by complying with the applicable provisions of the Code, and to make distributions of taxable income sufficient to relieve it from substantially all federal income and excise taxes.
The FASB released FASB Interpretation No. 48 “Accounting for Uncertainty in Income Taxes” (FIN 48). FIN 48 provides guidance for how uncertain tax positions should be recognized, measured, presented and disclosed in the financial statements. FIN 48 requires the evaluation of tax positions taken or expected to be taken in the course of preparing the fund’s tax returns to determine whether the tax positions are “more-likely-than-not” of being sustained by the applicable tax authority. Tax positions not deemed to meet the more-likely-than-not threshold would be recorded as a tax benefit or expense in the current year.Adoption of FIN 48 is required for fiscal years beginning after December 15,2006 and is to be applied to all open tax years as of the effective date. Management does not believe that the application of this standard will have a material impact on the financial statements of the fund.
At July 31, 2007, the components of accumulated earnings on a tax basis were as follows: undistributed ordinary income $3,835,862, accumulated capital losses $17,298,296 and unrealized depreciation $5,690,435. In addition, the fund had $3,465,644 of capital losses
The Fund 39
NOTES TO FINANCIAL STATEMENTS (continued)
realized after October 31, 2006, which were deferred for tax purposes to the first day of the following fiscal year.
The accumulated capital loss carryover is available to be applied against future net securities profits, if any, realized subsequent to July 31,2007. If not applied, $3,468,128 of the carryover expires in fiscal 2012, $5,388,717 expires in fiscal 2013, $1,724,165 expires in fiscal 2014 and $6,717,286 expires in fiscal 2015.
The tax character of distributions paid to shareholders during the fiscal periods ended July 31, 2007 and July 31, 2006, were as follows: ordinary income $26,900,186, and $27,225,697, respectively.
During the period ended July 31, 2007, as a result of permanent book to tax differences primarily due to the tax treatment for amortization of premiums, paydown gains and losses on mortgage backed securities, sales treatment for treasury inflation protected securities, contingent deferred debt securities and foreign currency transactions, the fund increased accumulated undistributed investment income-net by $2,350,428, decreased accumulated net realized gain (loss) on investments by $2,109,629 and decreased paid-in capital by $240,799. Net assets were not affected by this reclassification
NOTE 2—Bank Lines of Credit:
The fund may borrow up to $10 million for leveraging purposes under a short-term unsecured line of credit and participates with other Dreyfus-managed funds in a $100 million unsecured line of credit primarily to be utilized for temporary or emergency purposes, including the financing of redemptions. Interest is charged to the fund based on prevailing market rates in effect at the time of borrowing. During the period ended July 31, 2007, the fund did not borrow under either line of credit.
NOTE 3—Management Fee and Other Transactions With Affiliates:
(a) Pursuant to a management agreement (“Agreement”) with the Manager, the management fee is computed at the annual rate of .45% of the value of the fund’s average daily net assets and is payable monthly.
40
The Manager had undertaken through July 31, 2007 to reduce the management fee paid by the fund, if the fund’s aggregate expenses, exclusive of taxes, brokerage fees, interest on borrowings, Shareholder Service Plan fees and extraordinary expenses exceed .55% of the value of the fund’s average daily net assets.The reduction in management fee, pursuant to the undertaking, amounted to $559,737 during the period ended July 31, 2007.
(b) Under the Investor Shares Shareholder Services Plan, the fund pays the Distributor at an annual rate of .25% of the value of Investor Shares average daily net assets for the provision of certain services.The services provided may include personal services relating to shareholder accounts, such as answering shareholder inquiries regarding the fund and providing reports and other information, and services related to the maintenance of shareholder accounts.The Distributor may make payments to Service Agents (a securities dealer, financial institution or other industry professional) in respect of these services.The Distributor determines the amounts to be paid to Service Agents. During the period ended July 31, 2007, Investor Shares were charged $1,222,272 pursuant to the Shareholder Services Plan.
The fund compensates Dreyfus Transfer, Inc., a wholly-owned subsidiary of the Manager, under a transfer agency agreement for providing personnel and facilities to perform transfer agency services for the fund. During the period ended July 31, 2007, the fund was charged $102,473 pursuant to the transfer agency agreement.
The fund compensates Mellon Bank, N.A., an affiliate of the Manager, under a custody agreement for providing custodial services for the fund. During the period ended July 31, 2007, the fund was charged $156,607 pursuant to the custody agreement.
During the period ended July 31, 2007, the fund was charged $4,499 for services performed by the Chief Compliance Officer.
The components of “Due to The Dreyfus Corporation and affiliates” in the Statement of Assets and Liabilities consist of: management fees $211,316, shareholder services plan fees $109,928, custodian fees
The Fund 41
NOTES TO FINANCIAL STATEMENTS (continued)
$53,517, chief compliance officer fees $1,607 and transfer agency per account fees $20,032, which are offset against an expense reimbursement currently in effect in the amount of $42,195.
(c) Each Board member also serves as a Board member of other funds within the Dreyfus complex. Annual retainer fees and attendance fees are allocated to each fund based on net assets.
(d) Pursuant to an exemptive order from the SEC, the fund may invest its available cash balances in affiliated money market mutual funds. Management fees of the underlying money market mutual funds have been waived by the Manager.
NOTE 4—Securities Transactions:
The following summarizes the aggregate amount of purchases and sales (including paydowns) of investment securities, excluding short-term securities, option transactions, financial futures, forward currency exchange contracts and swap transactions, during the period ended July 31, 2007, amounted to $3,580,606,562 and $3,570,263,438, respectively, of which $976,149,398 in purchases and $976,399,225 in sales were from dollar roll transactions.
A mortgage dollar roll transaction involves a sale by the fund of mortgage related securities that it holds with an agreement by the fund to repurchase similar securities at an agreed upon price and date. The securities purchased will bear the same interest rate as those sold, but generally will be collateralized by pools of mortgages with different prepayment histories than those securities sold.
The fund may purchase and write (sell) put and call options in order to gain exposure to or to protect against changes in the market.
As a writer of call options, the fund receives a premium at the outset and then bears the market risk of unfavorable changes in the price of the financial instrument underlying the option. Generally, the fund would incur a gain, to the extent of the premium, if the price of the underlying financial instrument decreases between the date the option
42
is written and the date on which the option is terminated. Generally, the fund would realize a loss, if the price of the financial instrument increases between those dates.
As a writer of put options, the fund receives a premium at the outset and then bears the market risk of unfavorable changes in the price of the financial instrument underlying the option. Generally, the fund would incur a gain, to the extent of the premium, if the price of the underlying financial instrument increases between the date the option is written and the date on which the option is terminated. Generally, the fund would realize a loss, if the price of the financial instrument decreases between those dates.
In addition, the following summarizes the fund’s call/put options written for the period ended July 31, 2007:
| | | Face Amount | | | | Options Terminated |
| | | | | |
|
| | | Covered by | | Premiums | | | | Net Realized |
| Options Written: | | Contracts ($) | | Received ($) | | Cost ($) | | Gain (Loss) ($) |
| |
| |
| |
| |
|
| Contracts outstanding | | | | | | |
| July 31, 2006 | | 186,320,000 | | 466,448 | | | | |
| Contracts written | | 527,060,000 | | 788,756 | | | | |
| Contracts terminated: | | | | | | |
| Closed | | 206,120,000 | | 468,863 | | 753,193 | | (284,330) |
| Expired | | 110,300,000 | | 259,827 | | — | | 259,827 |
| Total contracts | | | | | | | | |
| terminated | | 316,420,000 | | 728,690 | | — | | (24,503) |
| Contracts outstanding | | | | | | |
| July 31, 2007 | | 396,960,000 | | 526,514 | | | | |
The fund may invest in financial futures contracts in order to gain exposure to or protect against changes in the market.The fund is exposed to market risk as a result of changes in the value of the underlying financial instruments. Investments in financial futures require the fund to “mark to market” on a daily basis, which reflects the change in the market value of the contracts at the close of each day’s trading. Typically, variation margin payments are received or made to reflect daily unrealized gains or losses.When the contracts are closed, the fund recognizes a realized gain or loss.These investments require initial margin deposits
The Fund 43
NOTES TO FINANCIAL STATEMENTS (continued)
with a broker, which consist of cash or cash equivalents.The amount of these deposits is determined by the exchange or Board of Trade on which the contract is traded and is subject to change. Contracts open at July 31, 2007 are set forth in the Statement of Financial Futures.
The fund enters into forward currency exchange contracts in order to hedge its exposure to changes in foreign currency exchange rates on its foreign portfolio holdings and to settle foreign currency transactions. When executing forward currency exchange contracts, the fund is obligated to buy or sell a foreign currency at a specified rate on a certain date in the future.With respect to sales of forward currency exchange contracts, the fund would incur a loss if the value of the contract increases between the date the forward contract is opened and the date the forward contract is closed.The fund realizes a gain if the value of the contract decreases between those dates.With respect to purchases of forward currency exchange contracts, the fund would incur a loss if the value of the contract decreases between the date the forward contract is opened and the date the forward contract is closed.The fund realizes a gain if the value of the contract increases between those dates. The fund is also exposed to credit risk associated with counter party nonperformance on these forward currency exchange contracts which is typically limited to the unrealized gain on each open contract.The following summarizes open forward currency exchange contracts at July 31, 2007:
| | | Foreign | | | | | | |
| Forward Currency | | Currency | | | | | | Unrealized |
| Exchange Contracts | | Amounts | | Cost ($) | | Value ($) | | (Depreciation) ($) |
| |
| |
| |
| |
|
| Sales: | | | | | | | | |
| Euro, | | | | | | | | |
| Expiring 09/19/2007 | | 920,000 | | 1,226,838 | | 1,261,136 | | (34,298) |
The fund may enter into swap agreements to exchange the interest rate on, or return generated by, one nominal instrument for the return generated by another nominal instrument.
44
The fund accrues for the interim payments on swap contracts on a daily basis, with the net amount recorded within unrealized appreciation (depreciation) of swap contracts in the Statement of Assets and Liabilities. Once the interim payments are settled in cash, the net amount is recorded as realized gain (loss) on swaps, in addition to realized gain (loss) recorded upon the termination of swaps contracts in the Statement of Operations. Fluctuations in the value of swap contracts are recorded as a component of net change in unrealized appreciation (depreciation) on investments.
Credit default swaps involve commitments to pay a fixed interest rate in exchange for payment if a credit event affecting a third party (the referenced company) occurs. Credit events may include a failure to pay interest or principal, bankruptcy, or restructuring. For those credit default swaps in which the portfolio is receiving a fixed rate, the portfolio is providing credit protection on the underlying instrument.The maximum payouts for these contracts are limited to the notional amount of each swap. The following summarizes open credit default swaps entered into by the fund at July 31, 2007:
| | | | | | | | | | | Unrealized |
| Notional | | Reference | | | | (Pay)/Receive | | Appreciation |
| Amount ($) | | Entity | | Counterparty | | Fixed Rate (%) Expiration (Depreciation)($) |
| |
| |
| |
|
| |
| 9,850,000 | | Altria, 7%, | | | | | | | | |
| | | 11/4/2013 | | Citibank | | (.27) | | 12/20/2011 | | 17,994 |
| 5,710,000 | | AT&T, 5.875%, | | JP Morgan | | | | | | |
| | | 8/15/2012 | | Chase | | (.49) | | 3/20/2017 | | 56,062 |
| 4,630,000 | | AT&T, 5.875%, | | JP Morgan | | | | | | |
| | | 8/15/2012 | | Chase | | (.44) | | 3/20/2017 | | 62,813 |
| 5,430,000 | | Autozone, | | | | | | | | |
| | | 5.875%, | | Goldman, | | | | | | |
| | | 10/15/2012 | | Sachs & Co. | | (.62) | | 6/20/2017 | | 101,896 |
| 2,550,000 | | BLOCK | | | | | | | | |
| | | FINANCIAL CORP | | Barclays | | (1.95) | | 9/20/2014 | | (10,682) |
| 1,830,000 | | BLOCK | | Morgan | | | | | | |
| | | FINANCIAL CORP | | Stanley | | (1.95) | | 9/20/2014 | | (7,666) |
| 2,161,000 | | Century Tel, | | | | | | | | |
| | | 7.875%, | | | | | | | | |
| | | 8/15/2012 | | Citibank | | (1.16) | | 9/20/2015 | | (18,156) |
The Fund 45
NOTES TO FINANCIAL STATEMENTS (continued)
| | | | | | | | | | | Unrealized |
| Notional | | Reference | | | | (Pay)/Receive | | Appreciation |
| Amount ($) | | Entity | | Counterparty | | Fixed Rate (%) Expiration (Depreciation)($) |
| |
| |
| |
|
| |
| 626,000 | | Century Tel, | | | | | | | | |
| | | 7.875%, | | Morgan | | | | | | |
| | | 8/15/2012 | | Stanley | | (1.15) | | 9/20/2015 | | (4,851) |
| 1,600,000 | | CMBX 2007-3 A | | JP Morgan | | | | | | |
| | | Index | | Chase | | (.62) | | 12/13/2049 | | 61,202 |
| 3,870,000 | | CMBX 2007-3 A | | Deutsche | | | | | | |
| | | Index | | Bank | | (.62) | | 12/13/2049 | | 121,203 |
| 4,310,000 | | CMBX 2007-3 | | JP Morgan | | | | | | |
| | | AAA Index | | Chase | | (.08) | | 12/13/2049 | | 72,995 |
| 5,190,000 | | CMBX 2007-3 | | Morgan | | | | | | |
| | | AAA Index | | Stanley | | (.08) | | 12/13/2049 | | 82,781 |
| 950,000 | | Dow Jones | | Deutsche | | | | | | |
| | | CDX.EM.6 Index | | Bank | | 1.40 | | 12/20/2011 | | (3,824) |
| 1,660,000 | | Dow Jones | | Morgan | | | | | | |
| | | CDX.EM.6 Index | | Stanley | | 1.40 | | 12/20/2011 | | (40,437) |
| 2,470,000 | | Dow Jones | | | | | | | | |
| | | CDX.EM.6 Index | | UBS | | 1.40 | | 12/20/2011 | | (44,283) |
| 2,776,300 | | Dow Jones | | | | | | | | |
| | | CDX.NA.IG.4 Index | | Merrill Lynch | | (.31) | | 6/20/2010 | | 4,238 |
| 1,889,700 | | Dow Jones | | Morgan | | | | | | |
| | | CDX.NA.IG.4 Index | | Stanley | | (.35) | | 6/20/2010 | | 551 |
| 8,200,000 | | Dow Jones | | Goldman, | | | | | | |
| | | CDX.NA.IG.8 Index | | Sachs & Co. | | (.60) | | 6/20/2017 | | 227,675 |
| 1,900,000 | | Ford Motor | | | | | | | | |
| | | Company, 7.45%, | | Morgan | | | | | | |
| | | 7/16/2031 | | Stanley | | 5.35 | | 3/20/2012 | | (91,584) |
| 1,670,000 | | Ford Motor | | | | | | | | |
| | | Company, 7.45%, | | Morgan | | | | | | |
| | | 7/16/2031 | | Stanley | | 4.50 | | 3/20/2012 | | (129,882) |
| 1,375,000 | | Freeport-McMoran | | | | | | | | |
| | | C & G, 10.125%, | | | | | | | | |
| | | 2/1/2010 | | Merrill Lynch | | .92 | | 6/20/2010 | | 10,962 |
| 1,900,000 | | General Motors, | | | | | | | | |
| | | 7.125%, | | Morgan | | | | | | |
| | | 7/15/2013 | | Stanley | | (3.80) | | 3/20/2012 | | 132,032 |
| 1,670,000 | | General Motors, | | | | | | | | |
| | | 7.125%, | | Morgan | | | | | | |
| | | 7/15/2013 | | Stanley | | (3.30) | | 3/20/2012 | | 144,823 |
| 9,545,000 | | JPMCC | | | | | | | | |
| | | 2006-CB15, | | | | | | | | |
| | | CL.AJ, 5.89%, | | | | | | | | |
| | | 6/12/2043 | | Merrill Lynch | | (.13) | | 6/12/2043 | | 27,641 |
| 1,425,000 | | Kaupthing Bank, | | | | | | | | |
| | | 5.51%, 12/1/2009 | | Deutsche | | | | | | |
| | | | | Bank | | .65 | | 9/20/2007 | | 1,579 |
| 5,625,000 | | Kaupthing Bank, | | | | | | | | |
| | | 5.51%, 12/1/2009 | | Deutsche | | | | | | |
| | | | | Bank | | .52 | | 9/20/2007 | | 4,340 |
| 360,000 | | Kaupthing Bank, | | JP Morgan | | | | | | |
| | | 5.51%, 12/1/2009 | | Chase | | .57 | | 9/20/2007 | | 324 |
| 505,000 | | Kimberly Clark, | | | | | | | | |
| | | 6.875%, | | Morgan | | | | | | |
| | | 2/15/2014 | | Stanley | | (.38) | | 12/20/2016 | | 3,500 |
46
| | | | | | | | | | | Unrealized |
| Notional | | Reference | | | | (Pay)/Receive | | Appreciation |
| Amount ($) | | Entity | | Counterparty | | Fixed Rate (%) Expiration (Depreciation)($) |
| |
| |
| |
|
| |
| 155,000 | | Kimberly Clark, | | | | | | | | |
| | | 6.875%, | | Morgan | | | | | | |
| | | 2/15/2014 | | Stanley | | (.37) | | 12/20/2016 | | 1,189 |
| 1,300,000 | | Kraft Foods, | | | | | | | | |
| | | 5.625%, | | | | | | | | |
| | | 11/1/2011 | | Barclays | | (.57) | | 6/20/2017 | | 23,511 |
| 1,385,000 | | Kraft Foods, | | | | | | | | |
| | | 5.625%, | | Goldman, | | | | | | |
| | | 11/1/2011 | | Sachs & Co. | | (.53) | | 6/20/2017 | | 29,234 |
| 5,618,000 | | Morgan Stanley, | | | | | | | | |
| | | 6.6%, 4/1/2012 | | UBS | | (.62) | | 6/20/2015 | | 67,284 |
| 4,925,000 | | Northern Tobacco, | | | | | | | | |
| | | 5%, 6/1/2046 | | Citibank | | 1.35 | | 12/20/2011 | | (83,764) |
| 2,600,000 | | Republic of | | | | | | | | |
| | | Venezuela, 9.25%, | | Deutsche | | | | | | |
| | | 9/15/2027 | | Bank | | (2.87) | | 10/20/2016 | | 188,424 |
| 1,285,000 | | Republic of | | | | | | | | |
| | | Venezuela, 9.25%, | | Morgan | | | | | | |
| | | 9/15/2027 | | Stanley | | (2.53) | | 1/20/2017 | | 132,617 |
| 675,000 | | Rite Aid, 7.7% | | Lehman | | | | | | |
| | | 2/15/2027 | | Brothers | | 4.55 | | 9/20/2010 | | 7,007 |
| 1,225,000 | | Rite Aid, 7.7% | | JP Morgan | | | | | | |
| | | 2/15/2027 | | Chase | | 3.55 | | 9/20/2010 | | (21,512) |
| 4,925,000 | | Southern | | | | | | | | |
| | | California Tobacco, | | | | | | | | |
| | | 5%, 6/1/2037 | | Citibank | | 1.35 | | 12/20/2011 | | (83,764) |
| 5,430,000 | | Structured Model | | | | | | | | |
| | | Portfolio 0-3% | | Barclays | | 13.39 | | 6/20/2012 | | (1,846,087) |
| 3,900,000 | | Structured Model | | JP Morgan | | | | | | |
| | | Portfolio 0-3% | | Chase | | — | | 9/20/2013 | | (58,500) |
| 2,390,000 | | Structured Model | | Morgan | | | | | | |
| | | Portfolio 0-3% | | Stanley | | — | | 9/20/2013 | | (113,826) |
| 2,975,000 | | Structured Model | | | | | | | | |
| | | Portfolio 0-3% | | UBS | | — | | 9/20/2013 | | (47,600) |
| 4,070,000 | | Structured Model | | | | | | | | |
| | | Portfolio 5-7% | | Barclays | | (4.84) | | 6/20/2017 | | 4,911 |
| 2,680,000 | | Univision | | | | | | | | |
| | | Communication, | | Lehman | | | | | | |
| | | 7.85%, 7/15/2011 | | Brothers | | 2.60 | | 6/20/2010 | | (206,943) |
| 1,510,000 | | VF, 8.5%, | | Morgan | | | | | | |
| | | 10/1/2010 | | Stanley | | (.72) | | 6/20/2016 | | (17,401) |
| 1,830,000 | | VF, 8.5%, | | Morgan | | | | | | |
| | | 10/1/2010 | | Stanley | | (.46) | | 6/20/2011 | | (12,403) |
| 900,000 | | VF, 8.5%, | | Morgan | | | | | | |
| | | 10/1/2010 | | Stanley | | (.45) | | 6/20/2011 | | (5,771) |
| 2,700,000 | | VF, 8.5%, | | | | | | | | |
| | | 10/1/2010 | | UBS | | (.45) | | 6/20/2011 | | (17,313) |
| Total | | | | | | | | | | (1,277,461) |
The Fund 47
NOTES TO FINANCIAL STATEMENTS (continued)
The fund may enter into interest rate swaps which involve the exchange of commitments to pay and receive interest based on a notional principal amount.At July 31, 2007, there were no open interest rate swaps.
Total return swaps involve commitments to pay interest in exchange for a market-linked return based on a notional amount.To the extent the total return of the security or index underlying the transaction exceeds or falls short of the offsetting interest rate obligation, the portfolio will receive a payment from or make a payment to the counterparty, respec-tively.At July 31, 2007, there were no open total return swaps.
Risks may arise upon entering into these agreements from the potential inability of the counterparties to meet the terms of the agreement and are generally limited to the amount of net payments to be received, if any, at the date of default.
At July 31, 2007, the cost of investments for federal income tax purposes was $884,178,373; accordingly, accumulated net unrealized depreciation on investments was $3,668,467, consisting of $4,500,508 gross unrealized appreciation and $8,168,975 gross unrealized depreciation.
48
REPORT OF INDEPENDENT REGISTERED
PUBLIC ACCOUNTING FIRM
|
Shareholders and Board of Directors Dreyfus Intermediate Term Income Fund
We have audited the accompanying statement of assets and liabilities, including the statements of investments and financial futures, of Dreyfus Intermediate Term Income Fund (one of the funds comprising Dreyfus Investment Grade Funds, Inc.) as of July 31, 2007, and the related statement of operations for the year then ended, the statement of changes in net assets for each of the two years in the period then ended, and financial highlights for each of the years indicated therein.These financial statements and financial highlights are the responsibility of the Fund’s management. Our responsibility is to express an opinion on these financial statements and financial highlights based on our audits.
We conducted our audits in accordance with the standards of the Public Company Accounting Oversight Board (United States).Those standards require that we plan and perform the audit to obtain reasonable assurance about whether the financial statements and financial highlights are free of material misstatement.We were not engaged to perform an audit of the Fund’s internal control over financial reporting. Our audits included consideration of internal control over financial reporting as a basis for designing audit procedures that are appropriate in the circumstances, but not for the purpose of expressing an opinion on the effectiveness of the Fund’s internal control over financial reporting.Accordingly, we express no such opinion. An audit also includes examining, on a test basis, evidence supporting the amounts and disclosures in the financial statements and financial highlights, assessing the accounting principles used and significant estimates made by management, and evaluating the overall financial statement presentation. Our procedures included confirmation of securities owned as of July 31, 2007 by correspondence with the custodian and others.We believe that our audits provide a reasonable basis for our opinion.
In our opinion, the financial statements and financial highlights referred to above present fairly, in all material respects, the financial position of Dreyfus Intermediate Term Income Fund at July 31, 2007, the results of its operations for the year then ended, the changes in its net assets for each of the two years in the period then ended, and the financial highlights for each of the indicated years, in conformity with U.S. generally accepted accounting principles.
| | New York, New York
September 14, 2007
|
The Fund 49
IMPORTANT TAX INFORMATION (Unaudited)
For federal tax purposes the fund hereby designates 0.44% of the ordinary dividends paid during the fiscal year ended July 31, 2007 as qualifying for the corporate dividends received deduction. Also certain dividends paid by the fund may be subject to a maximum tax rate of 15%, as provided for by the Jobs and Growth Tax Relief Reconciliation Act of 2003. Of the distributions paid during the fiscal year, $127,000 represents the maximum amount that may be considered qualified dividend income. Shareholders will receive notification in January 2008 of the percentage applicable to the preparation of their 2007 income tax returns. Also, the fund hereby designates 92.92% of ordinary income dividends paid during the fiscal year ended July 31, 2007 as qualifying “interest related dividends”.
50
INFORMATION ABOUT THE REVIEW
AND APPROVAL OF THE FUND’S
M A N A G E M E N T A G R E E M E N T (Unaudited)
|
At a meeting of the fund’s Board of Directors held on July 19 and 20, 2007, the Board considered the re-approval for an annual period (through July 29,2008) of the Management Agreement with Dreyfus for the fund, pursuant to which Dreyfus provides the fund with investment advisory and administrative services. The Board members, none of whom are “interested persons” (as defined in the Investment Company Act of 1940, as amended) of the fund, were assisted in their review by independent legal counsel and met with counsel in executive session separate from representatives of Dreyfus.
Analysis of Nature, Extent and Quality of Services Provided to the Fund. The Board members received a presentation from representatives of Dreyfus regarding services provided to the fund and other funds in the Dreyfus fund complex, and discussed the nature, extent and quality of the services provided to the fund pursuant to its Management Agreement. Dreyfus’ representatives reviewed the fund’s distribution of accounts and the relationships Dreyfus has with various intermediaries and the different needs of each. Dreyfus’ representatives noted the distribution channels for the fund as well as the diversity of distribution among the funds in the Dreyfus fund complex, and Dreyfus’ corresponding need for broad, deep, and diverse resources to be able to provide ongoing shareholder services to each distribution channel, including those of the fund. Dreyfus also provided the number of shareholder accounts in the fund, as well as the fund’s asset size.
The Board members also considered Dreyfus’ research and portfolio management capabilities and that Dreyfus also provides oversight of day-to-day fund operations, including fund accounting and administration and assistance in meeting legal and regulatory requirements. The Board members also considered Dreyfus’ extensive administrative, accounting and compliance infrastructure.
Comparative Analysis of the Fund’s Performance and Management Fee and Expense Ratio. The Board members reviewed the performance of the fund’s Investor Shares and comparisons to a group of retail no-load intermediate investment-grade debt funds (the
The Fund 51
| | I N FO R M AT I O N A B O U T T H E R E V I E W A N D A P P R OVA L O F T H E
F U N D ’S M A N A G E M E N T A G R E E M E N T ( U n a u d i t e d ) ( c o n t i n u e d )
|
“Performance Group”) and to a larger universe of funds, consisting of all retail no-load intermediate investment grade debt funds, excluding outliers (the “Performance Universe”), selected and provided by Lipper, Inc., an independent provider of investment company data.The Board was provided with a description of the methodology Lipper used to select the Performance Group and Performance Universe, as well as the Expense Group and Expense Universe (discussed below). The Board members discussed the results of the comparisons for various periods ended May 31, 2007. The Board members noted that the fund’s total return performance was above the Performance Group and Performance Universe medians for all periods, and that the fund’s yield performance for the past ten one-year periods was above the Performance Group median for eight of the ten periods and above the Performance Universe medians for all periods. Dreyfus also provided a comparison of the fund’s total returns to the returns of the fund’s benchmark index for each of the calendar years for the past ten years.
The Board members also discussed the fund’s management fee and expense ratio and reviewed the range of management fees and expense ratios as compared to a comparable group of funds (the “Expense Group”) and a broader group of funds (the “Expense Universe”), each selected and provided by Lipper. The Board members noted that the fund’s contractual management fee was lower than the Expense Group median, and that the actual management fee was lower than the Expense Group and Expense Universe medians, which included the undertaking by Dreyfus to limit the fund’s expense ratio. The Board noted that the expense ratio for the fund was higher than the Expense Group and Expense Universe medians. The Board noted that the fund’s actual management fee and expense ratio were lower due to the undertaking by Dreyfus to waive fees and reimburse expenses.
Representatives of Dreyfus reviewed with the Board members the advisory fees paid by mutual funds managed by Dreyfus or its affiliates with similar investment objectives, policies and strategies, and included
52
within the fund’s Lipper category (the “Similar Funds”), and by other accounts managed by Dreyfus or its affiliates, with similar investment objectives, policies and strategies as the fund (the “Similar Accounts”). Dreyfus representatives explained the nature of the Similar Accounts and the differences, from Dreyfus’ perspective, in providing services to such Similar Accounts as compared to managing and providing services to the fund. Dreyfus’ representatives also reviewed the costs associated with distribution through intermediaries. The Board analyzed differences in fees paid to Dreyfus and discussed the relationship of the fees paid in light of the services provided.The Board members considered the relevance of the fee information provided for the Similar Funds and Similar Accounts to evaluate the appropriateness and reasonableness of the fund’s management fee.
Analysis of Profitability and Economies of Scale. Dreyfus’ representatives reviewed the dollar amount of expenses allocated and profit received by Dreyfus and the method used to determine such expenses and profit. The Board considered information, previously provided and discussed, prepared by an independent consulting firm regarding Dreyfus’ approach to allocating costs to, and determining the profitability of, individual funds and the entire Dreyfus mutual fund complex. The Board members also considered that the methodology had also been reviewed by an independent registered public accounting firm which, like the consultant, found the methodology to be reasonable. The consulting firm also analyzed where any economies of scale might emerge in connection with the management of the fund.The Board members evaluated the profitability analysis in light of the relevant circumstances for the fund and the extent to which economies of scale would be realized if the fund grows and whether fee levels reflect these economies of scale for the benefit of fund investors.The Board members also considered potential benefits to Dreyfus from acting as investment adviser and noted that there were no soft dollar arrangements with respect to trading the fund’s investments.
The Fund 53
| | I N FO R M AT I O N A B O U T T H E R E V I E W A N D A P P R OVA L O F T H E
F U N D ’S M A N A G E M E N T A G R E E M E N T ( U n a u d i t e d ) ( c o n t i n u e d )
|
It was noted that the Board members should consider Dreyfus’ profitability with respect to the fund as part of their evaluation of whether the fees under the Management Agreement bear a reasonable relationship to the mix of services provided by Dreyfus, including the nature, extent and quality of such services and that a discussion of economies of scale is predicated on increasing assets and that, if a fund’s assets had been decreasing, the possibility that Dreyfus may have realized any economies of scale would be less. It also was noted that the profitability percentage for managing the fund was within ranges determined by appropriate court cases to be reasonable given the services rendered and generally superior service levels provided.The Board also noted the fee waiver and expense reimbursement arrangement and its effect on Dreyfus’ profitability.
At the conclusion of these discussions, the Board agreed that it had been furnished with sufficient information to make an informed business decision with respect to continuation of the Management Agreement, with respect to the fund. Based on the discussions and considerations as described above, the Board made the following conclusions and determinations.
- The Board concluded that the nature, extent and quality of the ser- vices provided by Dreyfus are adequate and appropriate.
- The Board was satisfied with the fund’s performance.
- The Board concluded that the fee paid by the fund to Dreyfus was reasonable in light of the services provided, comparative performance, expense and management fee information, including Dreyfus’ under- taking to limit the fund’s expense ratio (which reduced the fund’s actual management fee and expense ratio), costs of the services pro- vided and profits to be realized and benefits derived or to be derived by Dreyfus from its relationship with the fund.
54
- The Board determined that the economies of scale which may accrue to Dreyfus and its affiliates in connection with the manage- ment of the fund had been adequately considered by Dreyfus in connection with the management fee rate charged to the fund and that, to the extent in the future it were determined that material economies of scale had not been shared with the fund, the Board would seek to have those economies of scale shared with the fund.
The Board members considered these conclusions and determinations, along with information received on a routine and regular basis throughout the year, and, without any one factor being dispositive, the Board determined that re-approval of the Management Agreement,with respect to the fund, was in the best interests of the fund and its shareholders.
The Fund 55
BOARD MEMBERS INFORMATION (Unaudited)
Joseph S. DiMartino (63)
Chairman of the Board (1995)
|
Principal Occupation During Past 5 Years:
• Corporate Director and Trustee
|
Other Board Memberships and Affiliations:
|
- The Muscular Dystrophy Association, Director
- Century Business Services, Inc., a provider of outsourcing functions for small and medium size companies, Director
- The Newark Group, a provider of a national market of paper recovery facilities, paperboard mills and paperboard converting plants, Director
- Sunair Services Corporation, a provider of certain outdoor-related services to homes and businesses, Director
- Ivory Investment Management, L.P., a registered investment adviser to three private funds, Senior Adviser
No. of Portfolios for which Board Member Serves: 164
———————
Clifford L. Alexander, Jr. (73)
Board Member (2003)
|
Principal Occupation During Past 5 Years:
|
- President of Alexander & Associates, Inc., a management consulting firm ( January 1981-present)
- Chairman of the Board of Moody’s Corporation (October 2000-October 2003)
Other Board Memberships and Affiliations:
• Mutual of America Life Insurance Company, Director
No. of Portfolios for which Board Member Serves: 53
|
———————
David W. Burke (71)
Board Member (1994)
|
Principal Occupation During Past 5 Years:
• Corporate Director and Trustee
|
Other Board Memberships and Affiliations:
• John F. Kennedy Library Foundation, Director
|
No. of Portfolios for which Board Member Serves: 88
|
56
Whitney I. Gerard (72)
Board Member (1993)
|
Principal Occupation During Past 5 Years:
• Partner of Chadbourne & Parke LLP
|
No. of Portfolios for which Board Member Serves: 26
|
———————
George L. Perry (72)
Board Member (1992)
|
Principal Occupation During Past 5 Years:
• Economist and Senior Fellow at Brookings Institution
No. of Portfolios for which Board Member Serves: 26
|
———————
Once elected all Board Members serve for an indefinite term, but achieve Emeritus status upon reaching age 80.The address of the Board Members and Officers is in c/o The Dreyfus Corporation, 200 Park Avenue, New York, New York 10166.Additional information about the Board Members is available in the fund’s Statement of Additional Information which can be obtained from Dreyfus free of charge by calling this toll free number: 1-800-554-4611.
Lucy Wilson Benson, Emeritus Board Member Arthur A. Hartman, Emeritus Board Member
The Fund 57
OFFICERS OF THE FUND (Unaudited)
J. DAVID OFFICER, President since December 2006.
Chief Operating Officer,Vice Chairman and a Director of the Manager, and an officer of 82 investment companies (comprised of 164 portfolios) managed by the Manager. He is 58 years old and has been an employee of the Manager since April 1998.
PHILLIP N. MAISANO, Executive Vice President since July 2007.
Chief Investment Officer,Vice Chair and a director of the Manager, and an officer of 82 investment companies (compromised of 164 portfolios) managed by the Manager. Mr. Maisano also is an officer and/or board member of certain other investment management subsidiaries of The Bank of New York Mellon Corperation, each of which is an affiliate of the Manager. He is 60 years old and has been employee of the Manager since November 2006. Prior to joining the Manager, Mr. Maisano served as Chairman and Chief Executive Officer of EACM Advisors, an affiliate of the Manager, since August 2004, and served as Chief Executive Officer of Evaluation Associates, a leading institutional investment consulting firm, from 1988 until 2004.
MICHAEL A. ROSENBERG, Vice President and Secretary since August 2005.
Associate General Counsel of the Manager, and an officer of 83 investment companies (comprised of 181 portfolios) managed by the Manager. He is 47 years old and has been an employee of the Manager since October 1991.
JAMES BITETTO, Vice President and Assistant Secretary since August 2005.
Associate General Counsel and Assistant Secretary of the Manager, and an officer of 83 investment companies (comprised of 181 portfolios) managed by the Manager. He is 41 years old and has been an employee of the Manager since December 1996.
JONI LACKS CHARATAN, Vice President and Assistant Secretary since August 2005.
Associate General Counsel of the Manager, and an officer of 83 investment companies (comprised of 181 portfolios) managed by the Manager. She is 51 years old and has been an employee of the Manager since October 1988.
JOSEPH M. CHIOFFI, Vice President and Assistant Secretary since August 2005.
Associate General Counsel of the Manager, and an officer of 83 investment companies (comprised of 181 portfolios) managed by the Manager. He is 45 years old and has been an employee of the Manager since June 2000.
JANETTE E. FARRAGHER, Vice President and Assistant Secretary since August 2005.
Associate General Counsel of the Manager, and an officer of 83 investment companies (comprised of 181 portfolios) managed by the Manager. She is 44 years old and has been an employee of the Manager since February 1984.
JOHN B. HAMMALIAN, Vice President and Assistant Secretary since August 2005.
Associate General Counsel of the Manager, and an officer of 83 investment companies (comprised of 181 portfolios) managed by the Manager. He is 44 years old and has been an employee of the Manager since February 1991.
ROBERT R. MULLERY, Vice President and Assistant Secretary since August 2005.
Associate General Counsel of the Manager, and an officer of 83 investment companies (comprised of 181 portfolios) managed by the Manager. He is 55 years old and has been an employee of the Manager since May 1986.
58
JEFF PRUSNOFSKY, Vice President and Assistant Secretary since August 2005.
Associate General Counsel of the Manager, and an officer of 83 investment companies (comprised of 181 portfolios) managed by the Manager. He is 42 years old and has been an employee of the Manager since October 1990.
JAMES WINDELS, Treasurer since November 2001.
Director – Mutual Fund Accounting of the Manager, and an officer of 83 investment companies (comprised of 181 portfolios) managed by the Manager. He is 48 years old and has been an employee of the Manager since April 1985.
ROBERT ROBOL, Assistant Treasurer since August 2005.
Senior Accounting Manager – Money Market and Municipal Bond Funds of the Manager, and an officer of 83 investment companies (comprised of 181 portfolios) managed by the Manager. He is 43 years old and has been an employee of the Manager since October 1988.
ROBERT SALVIOLO, Assistant Treasurer since May 2007.
Senior Accounting Manager – Equity Funds of the Manager, and an officer of 83 investment companies (comprised of 181 portfolios) managed by the Manager. He is 40 years old and has been an employee of the Manager since June 1989.
ROBERT SVAGNA, Assistant Treasurer since August 2005.
Senior Accounting Manager Equity Funds of the Manager, and an officer of 83 investment companies (comprised of 181 portfolios) managed by the Manager. He is 40 years old and has been an employee of the Manager since November 1990.
GAVIN C. REILLY, Assistant Treasurer since December 2005.
Tax Manager of the Investment Accounting and Support Department of the Manager, and an officer of 83 investment companies (comprised of 181 portfolios) managed by the Manager. He is 38 years old and has been an employee of the Manager since April 1991.
JOSEPH W. CONNOLLY, Chief Compliance Officer since October 2004.
Chief Compliance Officer of the Manager and The Dreyfus Family of Funds (83 investment companies, comprised of 181 portfolios). From November 2001 through March 2004, Mr. Connolly was first Vice-President, Mutual Fund Servicing for Mellon Global Securities Services. In that capacity, Mr. Connolly was responsible for managing Mellon’s Custody, Fund Accounting and Fund Administration services to third-party mutual fund clients. He is 50 years old and has served in various capacities with the Manager since 1980, including manager of the firm’s Fund Accounting Department from 1997 through October 2001.
WILLIAM GERMENIS, Anti-Money Laundering Compliance Officer since October 2002.
Vice President and Anti-Money Laundering Compliance Officer of the Distributor, and the Anti-Money Laundering Compliance Officer of 79 investment companies (comprised of 177 portfolios) managed by the Manager. He is 36 years old and has been an employee of the Distributor since October 1998.
The Fund 59
NOTES
For More Information
| Dreyfus |
| Intermediate |
| Term Income Fund |
| 200 Park Avenue |
| New York, NY 10166 |
| |
| Manager |
| The Dreyfus Corporation |
| 200 Park Avenue |
| New York, NY 10166 |
| |
| Custodian |
| Mellon Bank, N.A. |
| One Mellon Bank Center |
| Transfer Agent & |
| Dividend Disbursing Agent |
| Dreyfus Transfer, Inc. |
| 200 Park Avenue |
| New York, NY 10166 |
| |
| Distributor |
| MBSC Securities Corporation |
| 200 Park Avenue |
| New York, NY 10166 |
| Ticker Symbols: | | Institutional: DITIX | | Investor: DRITX |
Telephone 1-800-645-6561
Mail The Dreyfus Family of Funds, 144 Glenn Curtiss Boulevard, Uniondale, NY 11556-0144 E-mail Send your request to info@dreyfus.com Internet Information can be viewed online or downloaded at: http://www.dreyfus.com
The fund files its complete schedule of portfolio holdings with the Securities and Exchange Commission (“SEC”) for the first and third quarters of each fiscal year on Form N-Q. The fund’s Forms N-Q are available on the SEC’s website at http://www.sec.gov and may be reviewed and copied at the SEC’s Public Reference Room in Washington, DC. Information on the operation of the Public Reference Room may be obtained by calling 1-202-551-8090.
A description of the policies and procedures that the fund uses to determine how to vote proxies relating to portfolio securities, and information regarding how the fund voted these proxies for the 12-month period ended June 30, 2007, is available at http://www.dreyfus.com and on the SEC’s website at http://www.sec.gov. The description of the policies and procedures is also available without charge, upon request, by calling 1-800-645-6561.
© 2007 MBSC Securities Corporation

Save time. Save paper. View your next shareholder report online as soon as it’s available. Log into www.dreyfus.com and sign up for Dreyfus eCommunications. It’s simple and only takes a few minutes.
The views expressed in this report reflect those of the portfolio manager only through the end of the period covered and do not necessarily represent the views of Dreyfus or any other person in the Dreyfus organization. Any such views are subject to change at any time based upon market or other conditions and Dreyfus disclaims any responsibility to update such views.These views may not be relied on as investment advice and, because investment decisions for a Dreyfus fund are based on numerous factors, may not be relied on as an indication of trading intent on behalf of any Dreyfus fund.
Not FDIC-Insured • Not Bank-Guaranteed • May Lose Value
| | | Contents |
| |
| | | THE FUND |
| |
|
| 2 | | A Letter from the CEO |
| 3 | | Discussion of Fund Performance |
| 6 | | Fund Performance |
| 8 | | Understanding Your Fund’s Expenses |
| 8 | | Comparing Your Fund’s Expenses |
| | | With Those of Other Funds |
| 9 | | Statement of Investments |
| 25 | | Statement of Financial Futures |
| 26 | | Statement of Assets and Liabilities |
| 27 | | Statement of Operations |
| 28 | | Statement of Changes in Net Assets |
| 30 | | Financial Highlights |
| 33 | | Notes to Financial Statements |
| 43 | | Report of Independent Registered |
| | | Public Accounting Firm |
| 44 | | Important Tax Information |
| 45 | | Information About the Review and Approval |
| | | of the Fund’s Management Agreement |
| 49 | | Board Members Information |
| 51 | | Officers of the Fund |
| |
| | | FOR MORE INFORMATION |
| |
|
| | | Back Cover |
The Fund
| Dreyfus Premier |
| Short Term Income Fund |

A LETTER FROM THE CEO
Dear Shareholder:
We are pleased to present this annual report for Dreyfus Premier Short Term Income Fund, covering the 12-month period from August 1, 2006, through July 31, 2007.
After rallying earlier in the reporting period amid slowing economic growth and benign inflation, the U.S. bond market has encountered significantly heightened volatility in recent months.While the markets’ nominal returns remained positive for the reporting period overall, the recent sell-off has hurt current year-to-date returns most notably on longer-term and high-yield securities. Fixed-income investors have become less tolerant of risk, due mainly to rate hikes in overseas markets, turmoil in the U.S. sub-prime mortgage sector, stronger economic data and a flood of newly issued high-yield bonds with questionable credit characteristics.
In our view, it is appropriate for the bond market to become more concerned with the pricing of risk, which may help wring excesses out of some market sectors. Furthermore, we view recent volatility in credit-sensitive sectors as offering potential investment opportunities in fundamentally sound securities at relatively attractive prices. As always, we encourage you to talk with your financial advisor, who can help you understand the challenges and potential opportunities presented by today’s more turbulent market conditions.
For information about how the fund performed during the reporting period, as well as market perspectives, we have provided a Discussion of Fund Performance given by the fund’s Portfolio Manager.
Thank you for your continued confidence and support.
| Thomas F. Eggers |
| Chief Executive Officer |
| The Dreyfus Corporation |
| August 15, 2007 |

DISCUSSION OF FUND PERFORMANCE
For the period of August 31, 2006, through July 31, 2007, as provided by Catherine Powers, Portfolio Manager
Fund and Market Performance
Strong performance for the fund and most fixed-income securities over the bulk of the reporting period was erased by heightened market turbulence in July 2007, when credit concerns in the sub-prime mortgage sector spread to other credit-sensitive areas of the fixed-income market.The fund produced lower returns than its benchmark, due in part to a general widening of credit spreads as well as to the residual effects related to sub-prime mortgages that are not completely reflected in the benchmark’s results.
For the 12-month period ended July 31, 2007, Dreyfus Premier Short Term Income Fund achieved total returns of 3.84% for Class B shares, 4.49% for Class D shares and 4.50% for Class P shares.1 In comparison, the fund’s benchmark, the Merrill Lynch 1-5 Year Corporate/Government Index (the “Index”), which is not subject to fees and expenses like a mutual fund, achieved a total return of 5.54% for the same period.2
The Fund’s Investment Approach
The fund seeks to maximize total returns consisting of capital appreciation and current income.To pursue this goal, the fund invests at least 80% of its assets in fixed-income securities of U.S. or foreign issuers rated investment grade or the unrated equivalent as determined by Dreyfus.This may include: U.S. government bonds and notes; corporate bonds; municipal bonds; convertible securities; preferred stocks; inflation-indexed securities; asset-backed securities; mortgage-related securities (including CMOs) and foreign bonds. For additional yield, the fund may invest up to 20% of its assets in fixed-income securities rated below investment grade (“high yield” or “junk” bonds).Typically, the fund’s portfolio can be expected to have an average effective maturity and an average effective duration of three years or less.
The Fund 3
DISCUSSION OF FUND PERFORMANCE (continued)
Credit Concerns Derailed Bond Market Performance
Most of the reporting period was characterized by moderate economic growth, generally benign inflation and steady short-term interest rates.Typically, these factors have been a recipe for a rallying bond market. Indeed, fixed-income securities provided generally strong results over the first 10 months of the reporting period, when positive investor sentiment and high levels of demand for current income helped support bond prices. Some of the riskier market sectors, such as high yield bonds and emerging-market securities, ranked among the market’s better performers during that time.
The rally in some of the market’s more credit-sensitive areas was interrupted in late February 2007, when reports surfaced regarding greater-than-expected delinquencies and defaults among homeowners with sub-prime mortgages. However, it seemed at the time that these credit concerns were limited to the sub-prime mortgage sector, and other areas of the U.S. bond market quickly regained any lost ground. In fact, default rates on high yield corporate bonds remained near historically low levels, and mergers-and-acquisitions activity remained robust, including a number of record-setting leveraged buyouts.
By July, evidence began to emerge that more homeowners were coming under pressure. Investors also worried that consumers were feeling the pinch from higher food and energy prices, and several large hedge funds posted substantial losses stemming from sub-prime mortgage exposure. Consequently, investor sentiment and market liquidity deteriorated rapidly, leading to sharp declines in the prices of stocks, corporate bonds and other financial instruments that tend to be sensitive to credit concerns.
A Successful Yield-Curve Strategy Was Not Enough to Offset Weakness in Credit-Sensitive Holdings
Although the fund held relatively little exposure to sub-prime mortgages, its holdings of high yield bonds, investment-grade corporate bonds and emerging-market securities were nonetheless affected by the market downturn. Even the fund’s focus on high yield credits with
maturities in the one- to three-year range, which tend to be less sensitive to changes in credit quality, did not fully protect the fund from weakness in the sector.Among investment-grade corporate bonds, we emphasized regulated issuers that we regarded as less vulnerable to the risks of leveraged buyouts. However, bonds from banks and brokerage firms were among those adversely affected in July by the spread of mortgage-related credit concerns.
Our duration and yield curve strategies proved more successful, but their benefits were not enough to fully offset credit-related weakness.With the Federal Reserve Board (the “Fed”) “on hold” throughout the reporting period, we generally maintained the fund’s average duration in a neutral position. At the same time, we adopted a “bulleted” yield curve strategy that emphasized shorter-term securities and de-emphasized longer-term bonds in anticipation of steeper yield differences along the market’s maturity range.This strategy helped boost returns when yield differences widened from historically narrow levels late in the reporting period.
The Outlook Is Currently Uncertain
As of the reporting period’s end, the credit crisis remains unresolved.We are monitoring the situation carefully, and we expect the Fed to take steps to promote market liquidity if current turmoil persists. In addition, recent events have increased the likelihood that the Fed will reduce short-term interest rates from current levels, which could help relieve some of the pressure on homeowners and lenders.While we have modestly increased the fund’s average duration to prepare for lower interest rates, we intend to maintain a relatively defensive security selection strategy until we see evidence that the credit crisis is nearing an end.
August 15, 2007
| 1 | | Total return includes reinvestment of dividends and any capital gains paid. Past performance is no |
| | | guarantee of future results. Share price, yield and investment return fluctuate such that upon |
| | | redemption, fund shares may be worth more or less than their original cost. |
| 2 | | SOURCE: LIPPER INC. — Reflects reinvestment of dividends and, where applicable, capital |
| | | gain distributions.The Merrill Lynch 1-5 Year Corporate/Government Index is a market value- |
| | | weighted index that tracks the performance of publicly placed, non-convertible, fixed-rate, coupon- |
| | | bearing, investment-grade U.S. domestic debt. Maturities of the securities range from one to five years. |
The Fund 5
FUND PERFORMANCE

Comparison of change in value of $10,000 investment in Dreyfus Premier Short Term Income Fund Class B shares, Class D shares and Class P shares and the Merrill Lynch 1-5 Year Corporate/Government Index
| † Source: Lipper Inc. |
| Past performance is not predictive of future performance. |
| The above graph compares a $10,000 investment made in Class B, Class D and Class P shares of Dreyfus Premier |
| Short Term Income Fund on 7/31/97 to a $10,000 investment made in the Merrill Lynch 1-5 Year |
| Corporate/Government Index (the “Index”) on that date. All dividends and capital gain distributions are reinvested. |
| Performance for Class B and Class P shares represent the performance of the fund’s Class D shares for periods prior to |
| November 1, 2002 (the inception date for Class B and Class P shares), and is adjusted to reflect the applicable sales |
| load of that class. Performance for Class B and Class P shares do not include differences in distribution/servicing fees |
| prior to November 1, 2002, which would have lowered the performance for Class B and Class P shares. |
| The fund invests primarily in debt securities and securities with debt-like characteristics of domestic and foreign issuers |
| and maintains an average effective maturity and an average effective duration of three years or less.The Index is an |
| unmanaged performance benchmark including U.S. government and fixed-coupon domestic investment-grade corporate |
| bonds with maturities greater than or equal to one year and less than five years.The Index does not take into account |
| charges, fees and other expenses. Further information relating to fund performance, including expense reimbursements, if |
| applicable, is contained in the Financial Highlights section of the prospectus and elsewhere in this report. |
| Average Annual Total Returns as of 7/31/07 | | | | |
| | | 1 Year | | 5 Years | | 10 Years |
| |
| |
| |
|
| Class B shares | | | | | | |
| with applicable redemption charge † | | (0.15)% | | 1.66% | | 4.27% |
| without redemption | | 3.84% | | 2.00% | | 4.27% |
| Class D shares | | 4.49% | | 2.58% | | 4.30% |
| Class P shares | | 4.50% | | 2.63% | | 4.33% |
Past performance is not predictive of future performance.The fund’s performance shown in the graph and table does not reflect the deduction of taxes that a shareholder would pay on fund distributions or the redemption of fund shares.The performance figures for Class B and Class P shares shown in the table include the performance of Class D shares for periods prior to November 1, 2002, and are adjusted to reflect the applicable sales load of that class but do not include current distribution/servicing fees of each share class prior to that date. Performance for Class B shares assumes the conversion of Class B shares to Class D shares at the end of the sixth year following the date of purchase.
† The maximum contingent deferred sales charge for Class B shares is 4%. After six years Class B shares convert to Class D shares.
The Fund 7
UNDERSTANDING YOUR FUND’S EXPENSES (Unaudited)
As a mutual fund investor, you pay ongoing expenses, such as management fees and other expenses. Using the information below, you can estimate how these expenses affect your investment and compare them with the expenses of other funds.You also may pay one-time transaction expenses, including sales charges (loads) and redemption fees, which are not shown in this section and would have resulted in higher total expenses. For more information, see your fund’s prospectus or talk to your financial adviser.
Review your fund’s expenses
The table below shows the expenses you would have paid on a $1,000 investment in Dreyfus Premier Short Term Income Fund from February 1, 2007 to July 31, 2007. It also shows how much a $1,000 investment would be worth at the close of the period, assuming actual returns and expenses.
| Expenses and Value of a $1,000 Investment | | | | |
| assuming actual returns for the six months ended July 31, 2007 | | |
| | | Class B | | Class D | | Class P |
| |
| |
| |
|
| Expenses paid per $1,000 † | | $ 8.04 | | $ 4.60 | | $ 4.65 |
| Ending value (after expenses) | | $1,013.10 | | $1,016.30 | | $1,015.40 |
COMPARING YOUR FUND’S EXPENSES WITH THOSE OF OTHER FUNDS (Unaudited)
Using the SEC’s method to compare expenses
The Securities and Exchange Commission (SEC) has established guidelines to help investors assess fund expenses. Per these guidelines, the table below shows your fund’s expenses based on a $1,000 investment, assuming a hypothetical 5% annualized return. You can use this information to compare the ongoing expenses (but not transaction expenses or total cost) of investing in the fund with those of other funds.All mutual fund shareholder reports will provide this information to help you make this comparison. Please note that you cannot use this information to estimate your actual ending account balance and expenses paid during the period.
Expenses and Value of a $1,000 Investment assuming a hypothetical 5% annualized return for the six months ended July 31, 2007
| | | Class B | | Class D | | Class P |
| |
| |
| |
|
| Expenses paid per $1,000 † | | $ 8.05 | | $ 4.61 | | $ 4.66 |
| Ending value (after expenses) | | $1,016.81 | | $1,020.23 | | $1,020.18 |
† Expenses are equal to the fund’s annualized expense ratio of 1.61% for Class B, .92% for Class D, and .93% for Class P; multiplied by the average account value over the period, multiplied by 181/365 (to reflect the one-half year period).
| STATEMENT OF INVESTMENTS |
| July 31, 2007 |
| | | Coupon | | Maturity | | Principal | | |
| Bonds and Notes—104.4% | | Rate (%) | | Date | | Amount ($) | | Value ($) |
| |
| |
| |
| |
|
| Aerospace & Defense—.1% | | | | | | | | |
| L-3 Communications, | | | | | | | | |
| Gtd. Notes, Ser. B | | 6.38 | | 10/15/15 | | 250,000 | | 231,250 |
| Asset-Backed Ctfs./ | | | | | | | | |
| Auto Receivables—3.9% | | | | | | | | |
| Americredit Prime Automobile | | | | | | | | |
| Receivables, Ser. 2007-1, Cl. E | | 6.96 | | 3/8/16 | | 420,000 a | | 415,846 |
| Capital Auto Receivables Asset | | | | | | | | |
| Trust, Ser. 2006-2, Cl. B | | 5.07 | | 12/15/11 | | 485,000 | | 481,726 |
| Ford Credit Auto Owner Trust, | | | | | | | | |
| Ser. 2005-A, Cl. B | | 3.88 | | 1/15/10 | | 750,000 | | 740,105 |
| Ford Credit Auto Owner Trust, | | | | | | | | |
| Ser. 2005-B, Cl. B | | 4.64 | | 4/15/10 | | 1,500,000 | | 1,490,973 |
| Ford Credit Auto Owner Trust, | | | | | | | | |
| Ser 2005-C, Cl. C | | 4.72 | | 2/15/11 | | 355,000 | | 353,169 |
| Ford Credit Auto Owner Trust, | | | | | | | | |
| Ser. 2006-C, Cl. B | | 5.30 | | 6/15/12 | | 1,875,000 | | 1,870,706 |
| Ford Credit Auto Owner Trust, | | | | | | | | |
| Ser. 2007-A, Cl. D | | 7.05 | | 12/15/13 | | 300,000 a | | 300,375 |
| Hyundai Auto Receivables Trust, | | | | | | | | |
| Ser. 2006-B, Cl. C | | 5.25 | | 5/15/13 | | 1,420,000 | | 1,419,693 |
| Wachovia Automobile Loan Owner | | | | | | |
| Trust, Ser. 2007-1, Cl. D | | 5.65 | | 2/20/13 | | 935,000 | | 930,082 |
| WFS Financial Owner Trust, | | | | | | | | |
| Ser. 2005-2, Cl. B | | 4.57 | | 11/19/12 | | 2,500,000 | | 2,480,775 |
| | | | | | | | | 10,483,450 |
| Asset-Backed Ctfs./Credit Cards—2.7% | | | | | | |
| American Express Credit Account | | | | | | |
| Master Trust, Ser. 2007-6, | | | | | | | | |
| Cl. C | | 5.60 | | 1/15/13 | | 2,060,000 a,b | | 2,060,000 |
| BA Credit Card Trust, | | | | | | | | |
| Ser. 2007-C1, Cl. C1 | | 5.61 | | 6/15/14 | | 2,830,000 b | | 2,826,463 |
| Citibank Credit Card Issuance | | | | | | | | |
| Trust, Ser. 2006-C4, Cl. C4 | | 5.54 | | 1/9/12 | | 2,500,000 b | | 2,499,966 |
| | | | | | | | | 7,386,429 |
| Asset-Backed Ctfs./ | | | | | | | | |
| Home Equity Loans—6.0% | | | | | | | | |
| Ameriquest Mortgage Securities, | | | | | | | | |
| Ser. 2003-11, Cl. AF6 | | 5.14 | | 1/25/34 | | 1,225,000 b | | 1,206,465 |
| Bayview Financial Acquisition | | | | | | | | |
| Trust, Ser. 2005-B, Cl. 1A6 | | 5.21 | | 4/28/39 | | 1,985,000 b | | 1,920,420 |
The Fund 9
STATEMENT OF INVESTMENTS (continued)
| | | Coupon | | Maturity | | Principal | | |
| Bonds and Notes (continued) | | Rate (%) | | Date | | Amount ($) | | Value ($) |
| |
| |
| |
| |
|
| Asset-Backed Ctfs./ | | | | | | | | |
| Home Equity Loans (continued) | | | | | | | | |
| Citicorp Residential Mortgage | | | | | | | | |
| Securities, Ser. 2006-1, Cl. A1 | | 5.96 | | 7/25/36 | | 1,856,113 b | | 1,852,646 |
| Citicorp Residential Mortgage | | | | | | | | |
| Securities, Ser. 2007-2, Cl. A1A | | 5.98 | | 6/25/37 | | 1,530,958 b | | 1,531,710 |
| Citicorp Residential Mortgage | | | | | | | | |
| Securities, Ser. 2007-2, Cl. M8 | | 7.00 | | 6/25/37 | | 150,000 b | | 112,569 |
| Citicorp Residential Mortgage | | | | | | | | |
| Securities, Ser. 2007-2, Cl. M9 | | 7.00 | | 6/25/37 | | 450,000 b | | 375,750 |
| Conseco Finance Home Loan Trust, | | | | | | | | |
| Ser. 2000-E, Cl. A5 | | 9.02 | | 8/15/31 | | 261,547 b | | 262,442 |
| Countrywide Asset Backed | | | | | | | | |
| Certificates, Ser. 2006-15, Cl. A6 | | 5.83 | | 10/25/46 | | 1,155,000 | | 1,140,470 |
| Countrywide Asset-Backed | | | | | | | | |
| Certificates, Ser. 2007-4, Cl. M5 | | 6.92 | | 9/25/37 | | 615,000 | | 580,504 |
| Credit Suisse Mortgage Capital | | | | | | | | |
| Certificates, Ser. 2007-1, Cl. 1A6A | | 5.86 | | 2/25/37 | | 945,000 | | 942,965 |
| Credit-Based Asset Servicing and | | | | | | | | |
| Securitization, Ser. 2005-CB8, | | | | | | | | |
| Cl. AF1B | | 5.45 | | 12/25/35 | | 387,650 b | | 386,085 |
| Credit-Based Asset Servicing and | | | | | | | | |
| Securitization, Ser. 2006-CB2, | | | | | | | | |
| Cl. AF1 | | 5.72 | | 12/25/36 | | 164,670 b | | 164,056 |
| J.P. Morgan Mortgage Acquisition, | | | | | | | | |
| Ser. 2007-HE1, Cl. AF1 | | 5.42 | | 4/1/37 | | 1,362,265 b | | 1,361,172 |
| Morgan Stanley Mortgage Loan | | | | | | | | |
| Trust, Ser. 2006-15XS, Cl. A6B | | 5.83 | | 11/25/36 | | 235,000 b | | 233,551 |
| Ownit Mortgage Loan Asset Backed | | | | | | | | |
| Certificates, Ser. 2006-1, Cl. AF1 | | 5.42 | | 12/25/36 | | 990,328 b | | 985,757 |
| Residential Asset Mortgage | | | | | | | | |
| Products, Ser. 2003-RS9, Cl. MI1 | | 5.80 | | 10/25/33 | | 687,208 b | | 676,814 |
| Residential Asset Securities, | | | | | | | | |
| Ser. 2003-KS7, Cl. MI3 | | 5.75 | | 9/25/33 | | 260,396 | | 222,543 |
| Residential Funding Mortgage | | | | | | | | |
| Securities II, Ser. 2005-HI3, Cl. A2 | | 5.09 | | 9/25/35 | | 600,000 | | 595,818 |
| Residential Funding Mortgage | | | | | | | | |
| Securities II, Ser. 2006-HSA2, | | | | | | | | |
| Cl. AI2 | | 5.50 | | 3/25/36 | | 275,000 | | 274,072 |
| Residential Funding Mortgage | | | | | | | | |
| Securities II, Ser. 2006-HI1, Cl. M4 | | 6.26 | | 2/25/36 | | 613,000 b | | 568,205 |
10
| | | Coupon | | Maturity | | Principal | | |
| Bonds and Notes (continued) | | Rate (%) | | Date | | Amount ($) | | Value ($) |
| |
| |
| |
| |
|
| Asset-Backed Ctfs./ | | | | | | | | |
| Home Equity Loans (continued) | | | | | | | | |
| Soundview Home Equity Loan Trust, | | | | | | |
| Ser. 2005-B, Cl. M3 | | 5.83 | | 5/25/35 | | 525,000 b | | 517,405 |
| Sovereign Commercial Mortgage | | | | | | | | |
| Securities, Ser. 2007-C1, Cl. D | | 5.77 | | 7/22/30 | | 415,000 a,b | | 394,541 |
| | | | | | | | | 16,305,960 |
| Asset-Backed Ctfs./ | | | | | | | | |
| Manufactured Housing—.2% | | | | | | | | |
| Green Tree Financial, | | | | | | | | |
| Ser. 1994-7, Cl. M1 | | 9.25 | | 3/15/20 | | 601,185 | | 621,288 |
| Automobile Manufacturers—.5% | | | | | | | | |
| DaimlerChrysler N.A. Holding, | | | | | | | | |
| Gtd. Notes | | 4.05 | | 6/4/08 | | 960,000 | | 946,314 |
| DaimlerChrysler N.A. Holding, | | | | | | | | |
| Notes | | 4.88 | | 6/15/10 | | 285,000 | | 279,375 |
| | | | | | | | | 1,225,689 |
| Banks—7.7% | | | | | | | | |
| Bank of Scotland, | | | | | | | | |
| Bonds | | 7.00 | | 11/29/49 | | 550,000 a,b | | 551,714 |
| Charter One Bank N.A., | | | | | | | | |
| Sr. Notes | | 5.50 | | 4/26/11 | | 1,435,000 | | 1,450,638 |
| Chevy Chase Bank, | | | | | | | | |
| Sub. Notes | | 6.88 | | 12/1/13 | | 590,000 | | 590,000 |
| Chuo Mitsui Trust & Banking, | | | | | | | | |
| Sub. Notes | | 5.51 | | 12/29/49 | | 700,000 a,b | | 656,391 |
| Colonial Bank, | | | | | | | | |
| Sub. Notes | | 6.38 | | 12/1/15 | | 1,000,000 | | 1,018,381 |
| Colonial Bank, | | | | | | | | |
| Sub. Notes | | 8.00 | | 3/15/09 | | 305,000 | | 316,530 |
| Fleet National Bank, | | | | | | | | |
| Sub. Notes | | 5.75 | | 1/15/09 | | 2,000,000 | | 2,009,994 |
| Glitnir Banki, | | | | | | | | |
| Unscd. Bonds | | 7.45 | | 9/14/49 | | 860,000 a,b | | 888,780 |
| ICICI Bank, | | | | | | | | |
| Bonds | | 5.90 | | 1/12/10 | | 400,000 a,b | | 401,886 |
| M&T Bank, | | | | | | | | |
| Sr. Unscd. Bonds | | 5.38 | | 5/24/12 | | 705,000 | | 703,310 |
| Marshall & Ilsley, | | | | | | | | |
| Unsub. Notes | | 4.38 | | 8/1/09 | | 4,200,000 | | 4,122,153 |
The Fund 11
STATEMENT OF INVESTMENTS (continued)
| | | Coupon | | Maturity | | Principal | | |
| Bonds and Notes (continued) | | Rate (%) | | Date | | Amount ($) | | Value ($) |
| |
| |
| |
| |
|
| Banks (continued) | | | | | | | | |
| Merrill Lynch, | | | | | | | | |
| Sr. Unscd. Notes, Ser. 1 | | 5.46 | | 3/23/10 | | 2,920,000 b | | 2,905,715 |
| Northern Rock, | | | | | | | | |
| Sub. Notes | | 6.59 | | 6/29/49 | | 325,000 a,b | | 317,944 |
| Northern Trust, | | | | | | | | |
| Sr. Unscd. Notes | | 5.30 | | 8/29/11 | | 575,000 | | 576,006 |
| Shinsei Finance Cayman, | | | | | | | | |
| Jr. Sub. Bonds | | 6.42 | | 1/29/49 | | 810,000 a,b | | 779,239 |
| Sovereign Bancorp, | | | | | | | | |
| Sr. Notes | | 4.80 | | 9/1/10 | | 1,075,000 b | | 1,052,516 |
| SunTrust Preferred Capital I, | | | | | | | | |
| Bank Gtd. Notes | | 5.85 | | 12/31/49 | | 625,000 b | | 614,987 |
| USB Capital IX, | | | | | | | | |
| Gtd. Notes | | 6.19 | | 4/15/49 | | 1,335,000 b | | 1,320,403 |
| Western Financial Bank, | | | | | | | | |
| Sub. Debs. | | 9.63 | | 5/15/12 | | 580,000 | | 621,341 |
| | | | | | | | | 20,897,928 |
| Building & Construction—.2% | | | | | | | | |
| Masco, | | | | | | | | |
| Sr. Unscd. Notes | | 5.66 | | 3/12/10 | | 390,000 b | | 386,451 |
| Owens Corning, | | | | | | | | |
| Gtd. Notes | | 6.50 | | 12/1/16 | | 200,000 | | 198,257 |
| | | | | | | | | 584,708 |
| Chemicals—1.7% | | | | | | | | |
| Equistar Chemicals/Funding, | | | | | | | | |
| Gtd. Notes | | 10.13 | | 9/1/08 | | 229,000 | | 238,160 |
| ICI Wilmington, | | | | | | | | |
| Gtd. Notes | | 4.38 | | 12/1/08 | | 1,535,000 | | 1,509,513 |
| Lubrizol, | | | | | | | | |
| Sr. Notes | | 4.63 | | 10/1/09 | | 2,945,000 | | 2,894,040 |
| | | | | | | | | 4,641,713 |
| Commercial Mortgage | | | | | | | | |
| Pass-Through Ctfs.—12.0% | | | | | | | | |
| Banc of America Commercial | | | | | | | | |
| Mortgage, Ser. 2005-2, Cl. A2 | | 4.25 | | 7/10/43 | | 1,828,790 | | 1,815,547 |
| Banc of America Commercial | | | | | | | | |
| Mortgage, Ser. 2005-6, Cl. A1 | | 5.00 | | 9/10/47 | | 1,468,097 | | 1,455,850 |
| Bayview Commercial Asset Trust, | | | | | | | | |
| Ser. 2006-SP1, Cl. A1 | | 5.59 | | 4/25/36 | | 211,036 a,b | | 211,036 |
12
| | | Coupon | | Maturity | | Principal | | | | |
| Bonds and Notes (continued) | | Rate (%) | | Date | | Amount ($) | | Value ($) |
| |
| |
| |
| |
|
| Commercial Mortgage | | | | | | | | | | |
| Pass-Through Ctfs. (continued) | | | | | | | | | | |
| Bayview Commercial Asset Trust, | | | | | | | | | | |
| Ser. 2004-1, Cl. A | | 5.68 | | 4/25/34 | | 417,504 | | a,b | | 417,765 |
| Bayview Commercial Asset Trust, | | | | | | | | | | |
| Ser. 2003-2, Cl. A | | 5.90 | | 12/25/33 | | 355,854 | | a,b | | 355,975 |
| Bayview Commercial Asset Trust, | | | | | | | | | | |
| Ser. 2004-1, Cl. M2 | | 6.52 | | 4/25/34 | | 576,242 | | a,b | | 584,706 |
| Bayview Commercial Asset Trust, | | | | | | | | | | |
| Ser. 2005-4A, Cl. B2 | | 7.72 | | 1/25/36 | | 595,298 | | a,b | | 609,158 |
| Bayview Commercial Asset Trust, | | | | | | | | | | |
| Ser. 2005-3A, Cl. B3 | | 8.32 | | 11/25/35 | | 219,204 | | a,b | | 222,636 |
| Bear Stearns Commercial Mortgage | | | | | | | | | | |
| Securities, Ser. 2005-T20, Cl. A2 | | 5.13 | | 10/12/42 | | 2,400,000 | | | | 2,377,323 |
| Bear Stearns Commercial Mortgage | | | | | | | | | | |
| Securities, Ser. 2006-PW14, | | | | | | | | | | |
| Cl. AAB | | 5.17 | | 12/11/38 | | 1,615,000 | | | | 1,559,329 |
| Bear Stearns Commercial Mortgage | | | | | | | | | | |
| Securities, Ser. 2006-PW12, | | | | | | | | | | |
| Cl. AAB | | 5.69 | | 9/11/38 | | 375,000 | | b | | 374,393 |
| Crown Castle Towers, | | | | | | | | | | |
| Ser. 2006-1A, Cl. AFX | | 5.24 | | 11/15/36 | | 575,000 | | a | | 568,259 |
| Crown Castle Towers, | | | | | | | | | | |
| Ser. 2006-1A, Cl. B | | 5.36 | | 11/15/36 | | 460,000 | | a | | 451,580 |
| Crown Castle Towers, | | | | | | | | | | |
| Ser. 2006-1A, Cl. C | | 5.47 | | 11/15/36 | | 1,035,000 | | a | | 1,012,713 |
| Crown Castle Towers, | | | | | | | | | | |
| Ser. 2005-1A, Cl. D | | 5.61 | | 6/15/35 | | 565,000 | | a | | 551,347 |
| DLJ Commercial Mortgage, | | | | | | | | | | |
| Ser. 1998-CF2, Cl. A1B | | 6.24 | | 11/12/31 | | 771,453 | | | | 774,934 |
| Global Signal Trust, | | | | | | | | | | |
| Ser. 2006-1, Cl. D | | 6.05 | | 2/15/36 | | 660,000 | | a | | 641,556 |
| Global Signal Trust, | | | | | | | | | | |
| Ser. 2006-1, Cl. E | | 6.50 | | 2/15/36 | | 385,000 | | a | | 375,465 |
| Goldman Sachs Mortgage Securities | | | | | | | | | | |
| Corporation II, Ser. 2007-EOP, Cl. B | | 5.57 | | 3/6/20 | | 1,630,000 | | a,b | | 1,625,925 |
| Goldman Sachs Mortgage Securities | | | | | | | | | | |
| Corporation II, Ser. 2007-EOP, Cl. F | | 5.80 | | 3/6/20 | | 730,000 | | a,b | | 725,438 |
| Goldman Sachs Mortgage Securities | | | | | | | | | | |
| Corporation II, Ser. 2007-EOP, Cl. K | | 6.37 | | 3/6/20 | | 350,000 | | a,b | | 346,500 |
The Fund 13
STATEMENT OF INVESTMENTS (continued)
| | | Coupon | | Maturity | | Principal | | |
| Bonds and Notes (continued) | | Rate (%) | | Date | | Amount ($) | | Value ($) |
| |
| |
| |
| |
|
| Commercial Mortgage | | | | | | | | |
| Pass-Through Ctfs. (continued) | | | | | | | | |
| Greenwich Capital Commercial | | | | | | | | |
| Funding, Ser. 2007-GG9, Cl. AAB | | 5.44 | | 3/10/39 | | 1,450,000 | | 1,413,185 |
| J.P. Morgan Chase Commercial | | | | | | | | |
| Mortgage Securities, | | | | | | | | |
| Ser. 2005-LDP5, Cl. A1 | | 5.04 | | 12/15/44 | | 1,868,694 | | 1,854,317 |
| J.P. Morgan Chase Commercial | | | | | | | | |
| Mortgage Securities, | | | | | | | | |
| Ser. 2006-LDP7, Cl. ASB | | 5.88 | | 4/15/45 | | 750,000 b | | 756,735 |
| J.P. Morgan Chase Commercial | | | | | | | | |
| Mortgage Securities, | | | | | | | | |
| Ser. 2001-CIBC, Cl. D | | 6.75 | | 3/15/33 | | 955,000 | | 989,548 |
| Merrill Lynch Mortgage Trust, | | | | | | | | |
| Ser. 2005-CIP1, Cl. A2 | | 4.96 | | 7/12/38 | | 1,100,000 | | 1,085,559 |
| Merrill Lynch Mortgage Trust, | | | | | | | | |
| Ser. 2005-CKI1, Cl. A2 | | 5.22 | | 11/12/37 | | 350,000 b | | 348,113 |
| Morgan Stanley Capital I, | | | | | | | | |
| Ser. 2006-T21, Cl. A2 | | 5.09 | | 10/12/52 | | 1,150,000 | | 1,136,307 |
| Morgan Stanley Capital I, | | | | | | | | |
| Ser. 2006-HQ9, Cl. A3 | | 5.71 | | 7/12/44 | | 1,575,000 | | 1,571,936 |
| Morgan Stanley Dean Witter Capital | | | | | | |
| I, Ser. 2001-TOP3, Cl. A4 | | 6.39 | | 7/15/33 | | 1,450,000 | | 1,488,140 |
| Nationslink Funding Corporation, | | | | | | | | |
| Ser. 1998-2, Cl. A2 | | 6.48 | | 8/20/30 | | 411,905 | | 413,152 |
| SBA CMBS Trust, | | | | | | | | |
| Ser. 2006-1A, Cl. A | | 5.31 | | 11/15/36 | | 1,695,000 a | | 1,676,470 |
| Washington Mutual Asset | | | | | | | | |
| Securities, Ser. 2003-C1A, Cl. A | | 3.83 | | 1/25/35 | | 2,793,777 a | | 2,709,138 |
| | | | | | | | | 32,500,035 |
| Diversified Financial Services—12.6% | | | | | | |
| Ameriprise Financial, | | | | | | | | |
| Jr. Sub. Notes | | 7.52 | | 6/1/66 | | 212,000 b | | 214,951 |
| Amvescap, | | | | | | | | |
| Gtd. Notes | | 5.38 | | 2/27/13 | | 380,000 | | 369,704 |
| Bear Stearns, | | | | | | | | |
| Sr. Unscd. Notes | | 5.50 | | 8/15/11 | | 1,620,000 | | 1,583,976 |
| Boeing Capital, | | | | | | | | |
| Sr. Notes | | 7.38 | | 9/27/10 | | 1,170,000 | | 1,247,210 |
| Capmark Financial Group, | | | | | | | | |
| Gtd. Notes | | 5.88 | | 5/10/12 | | 850,000 a | | 795,617 |
14
| | | Coupon | | Maturity | | Principal | | |
| Bonds and Notes (continued) | | Rate (%) | | Date | | Amount ($) | | Value ($) |
| |
| |
| |
| |
|
| Diversified Financial | | | | | | | | |
| Services (continued) | | | | | | | | |
| Caterpillar Financial Services, | | | | | | | | |
| Notes | | 5.13 | | 10/12/11 | | 765,000 | | 760,051 |
| Chase Manhattan, | | | | | | | | |
| Sub. Notes | | 7.88 | | 6/15/10 | | 2,190,000 c | | 2,332,709 |
| Citicorp, | | | | | | | | |
| Sub. Notes | | 7.25 | | 9/1/08 | | 3,290,000 | | 3,350,980 |
| Countrywide Financial, | | | | | | | | |
| Gtd. Notes | | 5.80 | | 6/7/12 | | 710,000 | | 683,318 |
| Credit Suisse Guernsey, | | | | | | | | |
| Jr. Sub. Notes | | 5.86 | | 5/29/49 | | 660,000 b | | 622,964 |
| Credit Suisse USA, | | | | | | | | |
| Sr. Unsub. Notes | | 5.50 | | 8/16/11 | | 1,255,000 c | | 1,257,515 |
| ERAC USA Finance, | | | | | | | | |
| Bonds | | 5.60 | | 5/1/15 | | 720,000 a | | 689,095 |
| Ford Motor Credit, | | | | | | | | |
| Unscd. Notes | | 7.38 | | 10/28/09 | | 1,385,000 | | 1,337,773 |
| Fuji JGB Investment, | | | | | | | | |
| Sub. Bonds | | 9.87 | | 12/29/49 | | 850,000 a,b | | 882,101 |
| Goldman Sachs Capital II, | | | | | | | | |
| Gtd. Bonds | | 5.79 | | 12/29/49 | | 285,000 b | | 269,664 |
| Goldman Sachs Group, | | | | | | | | |
| Notes | | 4.50 | | 6/15/10 | | 575,000 | | 561,876 |
| HSBC Finance Capital Trust IX, | | | | | | | | |
| Gtd. Notes | | 5.91 | | 11/30/35 | | 1,870,000 b | | 1,805,769 |
| Janus Capital Group, | | | | | | | | |
| Notes | | 6.25 | | 6/15/12 | | 540,000 | | 547,078 |
| Jefferies Group, | | | | | | | | |
| Sr. Unscd. Notes | | 7.75 | | 3/15/12 | | 1,100,000 | | 1,178,746 |
| Kaupthing Bank, | | | | | | | | |
| Sub. Notes | | 7.13 | | 5/19/16 | | 545,000 a | | 580,650 |
| Lehman Brothers Capital Trust VII, | | | | | | | | |
| Notes | | 5.86 | | 11/29/49 | | 195,000 b,c | | 185,266 |
| MUFG Capital Finance 1, | | | | | | | | |
| Bank Gtd. Bonds | | 6.35 | | 7/29/49 | | 575,000 b | | 553,248 |
| New York Life Global Funding, | | | | | | | | |
| Notes | | 4.63 | | 8/16/10 | | 4,610,000 a | | 4,558,861 |
| Nuveen Investments, | | | | | | | | |
| Sr. Unscd. Notes | | 5.00 | | 9/15/10 | | 97,000 | | 91,283 |
The Fund 15
STATEMENT OF INVESTMENTS (continued)
| | | Coupon | | Maturity | | Principal | | |
| Bonds and Notes (continued) | | Rate (%) | | Date | | Amount ($) | | Value ($) |
| |
| |
| |
| |
|
| Diversified Financial | | | | | | | | |
| Services (continued) | | | | | | | | |
| Pricoa Global Funding I, | | | | | | | | |
| Notes | | 4.20 | | 1/15/10 | | 4,950,000 a | | 4,816,484 |
| Residential Capital, | | | | | | | | |
| Gtd. Notes | | 6.13 | | 11/21/08 | | 310,000 c | | 297,473 |
| Residential Capital, | | | | | | | | |
| Gtd. Notes | | 6.50 | | 4/17/13 | | 275,000 | | 247,062 |
| Residential Capital, | | | | | | | | |
| Gtd. Notes | | 7.69 | | 4/17/09 | | 905,000 a,b,c | | 874,637 |
| SLM, | | | | | | | | |
| Unscd. Notes, Ser. A | | 4.50 | | 7/26/10 | | 710,000 | | 664,402 |
| SMFG Preferred Capital, | | | | | | | | |
| Sub. Bonds | | 6.08 | | 1/29/49 | | 715,000 a,b | | 688,209 |
| | | | | | | | | 34,048,672 |
| Diversified Metals & Mining—.3% | | | | | | | | |
| Reliance Steel & Aluminum, | | | | | | | | |
| Gtd. Notes | | 6.20 | | 11/15/16 | | 390,000 | | 379,383 |
| US Steel, | | | | | | | | |
| Sr. Unsub. Notes | | 5.65 | | 6/1/13 | | 320,000 | | 315,752 |
| | | | | | | | | 695,135 |
| Electric Utilities—2.6% | | | | | | | | |
| Cleveland Electric Illumination, | | | | | | | | |
| Sr. Unscd. Notes | | 5.70 | | 4/1/17 | | 430,000 | | 417,573 |
| FPL Energy National Wind, | | | | | | | | |
| Scd. Bonds | | 5.61 | | 3/10/24 | | 5 a | | 5 |
| FPL Group Capital, | | | | | | | | |
| Gtd. Debs. | | 5.63 | | 9/1/11 | | 1,620,000 | | 1,634,456 |
| National Grid, | | | | | | | | |
| Sr. Unscd. Notes | | 6.30 | | 8/1/16 | | 724,000 | | 744,037 |
| NiSource Finance, | | | | | | | | |
| Gtd. Notes | | 5.93 | | 11/23/09 | | 641,000 b | | 641,498 |
| Nisource Finance, | | | | | | | | |
| Sr. Notes | | 6.15 | | 3/1/13 | | 545,000 | | 552,627 |
| PacifiCorp, | | | | | | | | |
| First Mortgage Bonds | | 6.90 | | 11/15/11 | | 2,265,000 | | 2,395,170 |
| Southern, | | | | | | | | |
| Sr. Unsub. Notes, Ser. A | | 5.30 | | 1/15/12 | | 700,000 | | 694,327 |
| | | | | | | | | 7,079,693 |
16
| | | Coupon | | Maturity | | Principal | | |
| Bonds and Notes (continued) | | Rate (%) | | Date | | Amount ($) | | Value ($) |
| |
| |
| |
| |
|
| Environmental Control—.4% | | | | | | | | |
| Allied Waste North America, | | | | | | | | |
| Scd. Notes, Ser. B | | 5.75 | | 2/15/11 | | 290,000 | | 274,050 |
| Allied Waste North America, | | | | | | | | |
| Scd. Notes | | 6.38 | | 4/15/11 | | 230,000 | | 220,513 |
| Republic Services, | | | | | | | | |
| Sr. Notes | | 6.75 | | 8/15/11 | | 475,000 | | 496,118 |
| | | | | | | | | 990,681 |
| Food & Beverages—1.1% | | | | | | | | |
| H.J. Heinz, | | | | | | | | |
| Notes | | 6.43 | | 12/1/20 | | 500,000 a | | 506,004 |
| Stater Brothers Holdings, | | | | | | | | |
| Sr. Notes | | 7.75 | | 4/15/15 | | 190,000 a | | 177,650 |
| Stater Brothers Holdings, | | | | | | | | |
| Sr. Notes | | 8.13 | | 6/15/12 | | 480,000 | | 465,600 |
| Tyson Foods, | | | | | | | | |
| Sr. Unscd. Notes | | 6.85 | | 4/1/16 | | 1,850,000 b | | 1,886,247 |
| | | | | | | | | 3,035,501 |
| Foreign/Governmental—1.3% | | | | | | | | |
| Banco Nacional de Desenvolvimento | | | | | | |
| Economico e Social, Unsub. Notes | | 5.84 | | 6/16/08 | | 1,390,000 b | | 1,384,440 |
| Republic of Argentina, | | | | | | | | |
| Bonds | | 5.48 | | 8/3/12 | | 2,275,000 b | | 1,641,697 |
| Republic of Argentina, | | | | | | | | |
| Bonds, Ser. VII | | 7.00 | | 9/12/13 | | 455,000 | | 418,600 |
| | | | | | | | | 3,444,737 |
| Health Care—1.3% | | | | | | | | |
| American Home Products, | | | | | | | | |
| Unscd. Notes | | 6.95 | | 3/15/11 | | 1,150,000 b | | 1,212,884 |
| Community Health Systems, | | | | | | | | |
| Sr. Notes | | 8.88 | | 7/15/15 | | 310,000 a | | 302,638 |
| Coventry Health Care, | | | | | | | | |
| Sr. Unscd. Notes | | 5.88 | | 1/15/12 | | 760,000 | | 758,503 |
| Coventry Health Care, | | | | | | | | |
| Sr. Unscd. Notes | | 5.95 | | 3/15/17 | | 410,000 | | 391,353 |
| Wellpoint, | | | | | | | | |
| Sr. Unsub. Notes | | 5.88 | | 6/15/17 | | 740,000 | | 736,640 |
| | | | | | | | | 3,402,018 |
The Fund 17
STATEMENT OF INVESTMENTS (continued)
| | | Coupon | | Maturity | | Principal | | |
| Bonds and Notes (continued) | | Rate (%) | | Date | | Amount ($) | | Value ($) |
| |
| |
| |
| |
|
| Lodging & Entertainment—.8% | | | | | | | | |
| Carnival, | | | | | | | | |
| Gtd. Notes | | 3.75 | | 11/15/07 | | 1,240,000 | | 1,233,775 |
| MGM Mirage, | | | | | | | | |
| Gtd. Notes | | 8.38 | | 2/1/11 | | 325,000 c | | 330,688 |
| Mohegan Tribal Gaming Authority, | | | | | | | | |
| Sr. Unscd. Notes | | 6.13 | | 2/15/13 | | 775,000 | | 726,563 |
| | | | | | | | | 2,291,026 |
| Machinery—.4% | | | | | | | | |
| Atlas Copco, | | | | | | | | |
| Bonds | | 5.60 | | 5/22/17 | | 285,000 a | | 277,252 |
| Case New Holland, | | | | | | | | |
| Gtd. Notes | | 7.13 | | 3/1/14 | | 315,000 | | 309,487 |
| Terex, | | | | | | | | |
| Gtd. Notes | | 7.38 | | 1/15/14 | | 410,000 | | 403,850 |
| | | | | | | | | 990,589 |
| Media—.7% | | | | | | | | |
| AOL Time Warner, | | | | | | | | |
| Gtd. Notes | | 6.75 | | 4/15/11 | | 695,000 | | 720,902 |
| Comcast, | | | | | | | | |
| Gtd. Notes | | 5.50 | | 3/15/11 | | 1,240,000 c | | 1,236,027 |
| | | | | | | | | 1,956,929 |
| Oil & Gas—1.2% | | | | | | | | |
| Amerada Hess, | | | | | | | | |
| Unscd. Notes | | 6.65 | | 8/15/11 | | 985,000 c | | 1,024,547 |
| Chesapeake Energy, | | | | | | | | |
| Gtd. Notes | | 7.50 | | 6/15/14 | | 150,000 | | 151,125 |
| Enterprise Products Operating, | | | | | | | | |
| Gtd. Notes, Ser. B | | 4.63 | | 10/15/09 | | 2,045,000 | | 2,012,349 |
| | | | | | | | | 3,188,021 |
| Packaging & Containers—.3% | | | | | | | | |
| Ball, | | | | | | | | |
| Gtd. Notes | | 6.88 | | 12/15/12 | | 205,000 | | 203,975 |
| Crown Americas/Capital, | | | | | | | | |
| Gtd. Notes | | 7.63 | | 11/15/13 | | 690,000 | | 683,100 |
| | | | | | | | | 887,075 |
| Paper & Forest Products—.3% | | | | | | | | |
| Georgia-Pacific, | | | | | | | | |
| Gtd. Notes | | 7.00 | | 1/15/15 | | 550,000 a | | 508,750 |
18
| | | Coupon | | Maturity | | Principal | | |
| Bonds and Notes (continued) | | Rate (%) | | Date | | Amount ($) | | Value ($) |
| |
| |
| |
| |
|
| Paper & Forest Products (continued) | | | | | | |
| Temple-Inland, | | | | | | | | |
| Gtd. Notes | | 6.63 | | 1/15/18 | | 425,000 | | 411,884 |
| | | | | | | | | 920,634 |
| Property & Casualty Insurance—1.3% | | | | | | |
| Allstate, | | | | | | | | |
| Jr. Sub. Debs. | | 6.50 | | 5/15/57 | | 265,000 b,c | | 245,342 |
| ING Groep, | | | | | | | | |
| Bonds | | 5.78 | | 12/29/49 | | 500,000 b | | 481,604 |
| Leucadia National, | | | | | | | | |
| Sr. Notes | | 7.13 | | 3/15/17 | | 885,000 a | | 809,775 |
| Nippon Life Insurance, | | | | | | | | |
| Notes | | 4.88 | | 8/9/10 | | 1,050,000 a | | 1,029,780 |
| Phoenix Cos., | | | | | | | | |
| Sr. Unscd. Notes | | 6.68 | | 2/16/08 | | 430,000 | | 430,964 |
| Prudential Financial, | | | | | | | | |
| Notes | | 5.10 | | 12/14/11 | | 485,000 | | 478,317 |
| | | | | | | | | 3,475,782 |
| Real Estate Investment Trusts—5.1% | | | | | | |
| Archstone-Smith Operating Trust, | | | | | | | | |
| Sr. Unscd. Notes | | 5.25 | | 5/1/15 | | 925,000 | | 888,530 |
| Arden Realty, | | | | | | | | |
| Notes | | 5.25 | | 3/1/15 | | 475,000 | | 462,299 |
| Duke Realty, | | | | | | | | |
| Sr. Notes | | 5.88 | | 8/15/12 | | 2,150,000 | | 2,171,108 |
| ERP Operating, | | | | | | | | |
| Notes | | 4.75 | | 6/15/09 | | 2,400,000 | | 2,367,705 |
| Federal Realty Investment Trust, | | | | | | | | |
| Sr. Unscd. Notes | | 5.65 | | 6/1/16 | | 345,000 | | 338,437 |
| Federal Realty Investment Trust, | | | | | | | | |
| Notes | | 6.00 | | 7/15/12 | | 305,000 | | 310,161 |
| Healthcare Realty Trust, | | | | | | | | |
| Sr. Unscd. Notes | | 5.13 | | 4/1/14 | | 1,165,000 | | 1,103,156 |
| Host Hotels & Resorts, | | | | | | | | |
| Scd. Notes | | 6.88 | | 11/1/14 | | 135,000 | | 130,950 |
| HRPT Properties Trust, | | | | | | | | |
| Sr. Unscd. Notes | | 5.96 | | 3/16/11 | | 462,000 b | | 462,195 |
| Istar Financial, | | | | | | | | |
| Sr. Unscd. Notes | | 5.71 | | 3/9/10 | | 1,000,000 b | | 1,001,956 |
The Fund 19
STATEMENT OF INVESTMENTS (continued)
| | | Coupon | | Maturity | | Principal | | |
| Bonds and Notes (continued) | | Rate (%) | | Date | | Amount ($) | | Value ($) |
| |
| |
| |
| |
|
| Real Estate Investment | | | | | | | | |
| Trusts (continued) | | | | | | | | |
| Liberty Property, | | | | | | | | |
| Sr. Unscd. Notes | | 5.50 | | 12/15/16 | | 310,000 | | 302,070 |
| Mack-Cali Realty, | | | | | | | | |
| Unscd. Notes | | 5.05 | | 4/15/10 | | 550,000 | | 541,561 |
| Mack-Cali Realty, | | | | | | | | |
| Notes | | 5.25 | | 1/15/12 | | 300,000 | | 293,728 |
| Regency Centers, | | | | | | | | |
| Sr. Unscd. Notes | | 5.88 | | 6/15/17 | | 370,000 | | 367,601 |
| Simon Property Group, | | | | | | | | |
| Unsub. Notes | | 5.00 | | 3/1/12 | | 2,275,000 | | 2,219,995 |
| Socgen Real Estate, | | | | | | | | |
| Bonds | | 7.64 | | 12/29/49 | | 700,000 a,b | | 702,421 |
| | | | | | | | | 13,663,873 |
| Residential Mortgage | | | | | | | | |
| Pass-Through Ctfs.—5.4% | | | | | | | | |
| Bayview Commercial Asset Trust, | | | | | | | | |
| Ser. 2006-1A, Cl. B2 | | 7.02 | | 4/25/36 | | 189,674 a,b | | 180,725 |
| ChaseFlex Trust, | | | | | | | | |
| Ser. 2006-2, Cl. A1A | | 5.59 | | 9/25/36 | | 360,384 | | 360,051 |
| Citigroup Mortgage Loan Trust, | | | | | | | | |
| Ser. 2005-WF2, Cl. AF7 | | 5.25 | | 8/25/35 | | 2,050,000 b | | 2,001,322 |
| Citigroup Mortgage Loan Trust, | | | | | | | | |
| Ser. 2006-WF1, Cl. A2A | | 5.70 | | 3/25/36 | | 103,734 b | | 103,356 |
| First Horizon Alternative Mortgage | | | | | | | | |
| Securities, Ser. 2004-FA1, Cl. 1A1 | | 6.25 | | 10/25/34 | | 2,293,010 | | 2,309,053 |
| GSR Mortgage Loan Trust, | | | | | | | | |
| Ser. 2004-12, Cl. 2A2 | | 3.55 | | 12/25/34 | | 1,514,064 b | | 1,545,029 |
| Impac Secured Assets CMN Owner | | | | | | | | |
| Trust, Ser. 2006-1, Cl. 2A1 | | 5.67 | | 5/25/36 | | 515,821 b | | 516,922 |
| IndyMac Index Mortgage Loan Trust, | | | | | | | | |
| Ser. 2006-AR25, Cl. 4A2 | | 6.15 | | 9/25/36 | | 1,333,808 b | | 1,347,123 |
| New Century Alternative Mortgage | | | | | | | | |
| Loan Trust, Ser. 2006-ALT2, | | | | | | | | |
| Cl. AF6A | | 5.89 | | 10/25/36 | | 750,000 b | | 745,702 |
| Nomura Asset Acceptance, | | | | | | | | |
| Ser. 2005-AP2, Cl. A5 | | 4.98 | | 5/25/35 | | 750,000 b | | 729,603 |
| Nomura Asset Acceptance, | | | | | | | | |
| Ser. 2005-WF1, Cl. 2A5 | | 5.16 | | 3/25/35 | | 1,575,000 b | | 1,535,483 |
20
| | | Coupon | | Maturity | | Principal | | |
| Bonds and Notes (continued) | | Rate (%) | | Date | | Amount ($) | | Value ($) |
| |
| |
| |
| |
|
| Residential Mortgage | | | | | | | | |
| Pass-Through Ctfs. (continued) | | | | | | | | |
| Washington Mutual, | | | | | | | | |
| Ser. 2005-AR4, Cl. A4B | | 4.67 | | 4/25/35 | | 3,294,000 b | | 3,245,641 |
| | | | | | | | | 14,620,010 |
| Retail—.4% | | | | | | | | |
| CVS Caremark, | | | | | | | | |
| Sr. Unscd. Notes | | 5.66 | | 6/1/10 | | 345,000 b | | 345,424 |
| CVS Caremark, | | | | | | | | |
| Sr. Unscd. Notes | | 5.75 | | 8/15/11 | | 260,000 | | 261,059 |
| Delhaize Group, | | | | | | | | |
| Notes | | 6.50 | | 6/15/17 | | 185,000 a | | 179,761 |
| Federated Retail Holding, | | | | | | | | |
| Gtd. Notes | | 5.90 | | 12/1/16 | | 280,000 | | 271,299 |
| | | | | | | | | 1,057,543 |
| State/Territory Gen Oblg—2.4% | | | | | | | | |
| Erie Tobacco Asset | | | | | | | | |
| Securitization/NY, Tobacco | | | | | | | | |
| Settlement Asset-Backed Bonds | | 6.00 | | 6/1/28 | | 815,000 | | 783,117 |
| Michigan Tobacco Settlement | | | | | | | | |
| Finance Authority, Tobacco | | | | | | | | |
| Settlement Asset-Backed Bonds | | 7.31 | | 6/1/34 | | 825,000 | | 840,535 |
| Michigan Tobacco Settlement | | | | | | | | |
| Finance Authority, Tobacco | | | | | | | | |
| Settlement Asset-Backed Bonds | | 7.54 | | 6/1/34 | | 2,600,000 b | | 2,537,678 |
| Tobacco Settlement Authority of | | | | | | | | |
| Iowa, Tobacco Settlement | | | | | | | | |
| Asset-Backed Bonds | | 6.50 | | 6/1/23 | | 2,492,000 | | 2,455,941 |
| | | | | | | | | 6,617,271 |
| Telecommunications—1.3% | | | | | | | | |
| AT & T, | | | | | | | | |
| Sr. Notes | | 5.45 | | 5/15/08 | | 700,000 b | | 700,643 |
| AT & T, | | | | | | | | |
| Sr. Unscd. Notes | | 7.30 | | 11/15/11 | | 770,000 b | | 822,860 |
| Nextel Communications, | | | | | | | | |
| Gtd. Notes, Ser. F | | 5.95 | | 3/15/14 | | 605,000 | | 561,885 |
| Qwest, | | | | | | | | |
| Notes | | 8.88 | | 3/15/12 | | 50,000 b | | 52,813 |
| Sprint Capital, | | | | | | | | |
| Gtd. Notes | | 7.63 | | 1/30/11 | | 175,000 | | 184,136 |
The Fund 21
STATEMENT OF INVESTMENTS (continued)
| | | Coupon | | Maturity | | Principal | | | | |
| Bonds and Notes (continued) | | Rate (%) | | Date | | Amount ($) | | Value ($) |
| |
| |
| |
| |
|
| Telecommunications (continued) | | | | | | | | | | |
| Telefonica Emisiones, | | | | | | | | | | |
| Gtd. Notes | | 5.98 | | 6/20/11 | | 675,000 | | | | 678,813 |
| Windstream, | | | | | | | | | | |
| Gtd. Notes | | 8.13 | | 8/1/13 | | 630,000 | | | | 640,238 |
| | | | | | | | | | | 3,641,388 |
| Textiles & Apparel—.3% | | | | | | | | | | |
| Mohawk Industries, | | | | | | | | | | |
| Sr. Unscd. Notes | | 5.75 | | 1/15/11 | | 805,000 | | | | 813,707 |
| Transportation—1.4% | | | | | | | | | | |
| Norfolk Southern, | | | | | | | | | | |
| Sr. Notes | | 8.63 | | 5/15/10 | | 1,250,000 | | | | 1,354,008 |
| Union Pacific, | | | | | | | | | | |
| Sr. Unscd. Notes | | 5.75 | | 10/15/07 | | 2,510,000 | | | | 2,510,542 |
| | | | | | | | | | | 3,864,550 |
| U.S. Government Agencies—.4% | | | | | | | | | | |
| Federal National Mortgage | | | | | | | | | | |
| Association, Notes | | 5.75 | | 8/3/09 | | 1,115,000 | | | | 1,114,978 |
| U.S. Government Agencies/ | | | | | | | | | | |
| Mortgage-Backed—13.5% | | | | | | | | | | |
| Federal Home Loan Mortgage Corp.: | | | | | | | | |
| 3.50%, 9/1/10 | | | | | | 310,689 | | | | 297,265 |
| 4.00%, 3/1/10—4/1/10 | | | | | | 8,839,499 | | | | 8,604,152 |
| 6.50%, 6/1/32 | | | | | | 5,171 | | | | 5,281 |
| Stripped Security, Interest Only Class, | | | | | | | | |
| Ser. 1987, Cl. PI, 7.00%, 9/15/12 | | | | 109,814 | | d | | 11,519 |
| Federal National Mortgage Association: | | | | | | | | |
| 4.00%, 2/1/10—5/1/10 | | | | | | 2,599,404 | | | | 2,519,655 |
| 4.50%, 11/1/14 | | | | | | 1,474,285 | | | | 1,440,568 |
| Gtd. Pass-Through Ctfs., Ser. 2003-49, | | | | | | | | |
| Cl. JE, 3.00%, 4/25/33 | | | | | | 682,969 | | | | 596,834 |
| Government National Mortgage Association I: | | | | | | | | |
| 8.00%, 9/15/08 | | | | | | 11,927 | | | | 11,924 |
| Ser. 2003-96, Cl. B, 3.61%, 8/16/18 | | | | 1,011,247 | | | | 997,622 |
| Ser. 2005-90, Cl. A, 3.76%, 9/16/28 | | | | 2,114,887 | | | | 2,051,446 |
| Ser. 2006-67, Cl. A, 3.95%, 10/6/11 | | | | 1,580,596 | | | | 1,535,933 |
| Ser. 2005-34, Cl. A, 3.96%, 9/16/21 | | | | 1,675,647 | | | | 1,646,721 |
| Ser. 2005-79, Cl. A, 4.00%, 10/16/33 | | | | 1,939,082 | | | | 1,896,621 |
| Ser. 2005-50, Cl. A, 4.02%, 10/16/26 | | | | 995,757 | | | | 976,667 |
| | | Principal | | |
| Bonds and Notes (continued) | | Amount ($) | | Value ($) |
| |
| |
|
| U.S. Government Agencies/ | | | | |
| Mortgage-Backed (continued) | | | | |
| Government National Mortgage Association I (continued): | | |
| Ser. 2005-29, Cl. A, 4.02%, 7/16/27 | | 1,274,010 | | 1,241,115 |
| Ser. 2005-42, Cl. A, 4.05%, 7/16/20 | | 4,336,278 | | 4,258,552 |
| Ser. 2006-6, Cl. A, 4.05%, 10/16/23 | | 453,023 | | 444,635 |
| Ser. 2006-3, Cl. A, 4.21%, 1/16/28 | | 1,924,100 | | 1,882,742 |
| Ser. 2006-5, Cl. A, 4.24%, 7/16/29 | | 1,829,748 | | 1,791,071 |
| Ser. 2005-52, Cl. A, 4.29%, 1/16/30 | | 820,896 | | 806,563 |
| Ser. 2005-59, Cl. A, 4.39%, 5/16/23 | | 746,129 | | 735,019 |
| Ser. 2005-32, Cl. B, 4.39%, 8/16/30 | | 1,524,323 | | 1,500,148 |
| Ser. 2005-87, Cl. A, 4.45%, 3/16/25 | | 1,045,408 | | 1,028,065 |
| Government National Mortgage Association II: | | |
| 5.38%, 4/20/30 | | 240,482 b | | 243,483 |
| 7.00%, 12/20/30—4/20/31 | | 27,294 | | 28,446 |
| 7.50%, 11/20/29—12/20/30 | | 29,501 | | 30,788 |
| | | | | 36,582,835 |
| U.S. Government Securities—14.6% | | | | |
| U.S. Treasury Notes: | | | | |
| 4.50%, 5/15/17 | | 21,155,000 e | | 20,710,428 |
| 4.63%, 12/31/11 | | 13,028,000 c | | 13,046,330 |
| 4.63%, 11/15/16 | | 3,168,000 c | | 3,130,383 |
| 5.13%, 6/30/08 | | 2,190,000 c | | 2,195,819 |
| | | | | 39,082,960 |
| Total Bonds and Notes | | | | |
| (cost $285,426,190) | | | | 282,344,058 |
| |
| |
|
| |
| | | Principal | | |
| Short-Term Investments—.2% | | Amount ($) | | Value ($) |
| |
| |
|
| U.S. Treasury Bills; | | | | |
| 4.66%, 9/6/07 | | | | |
| (cost $423,022) | | 425,000 f | | 422,901 |
| |
| |
|
| |
| |
| Other Investment—3.4% | | Shares | | Value ($) |
| |
| |
|
| Registered Investment Company; | | | | |
| Dreyfus Institutional Preferred | | | | |
| Plus Money Market Fund | | | | |
| (cost $9,076,000) | | 9,076,000 g | | 9,076,000 |
The Fund 23
STATEMENT OF INVESTMENTS (continued)
| Investment of Cash Collateral | | | | |
| for Securities Loaned—6.9% | | Shares | | Value ($) |
| |
| |
|
| Registered Investment Company; | | | | |
| Dreyfus Institutional Cash | | | | |
| Advantage Plus Fund | | | | |
| (cost $18,676,024) | | 18,676,024 g | | 18,676,024 |
| |
| |
|
| Total Investments (cost $313,601,236) | | 114.9% | | 310,518,983 |
| Liabilities, Less Cash and Receivables | | (14.9%) | | (40,301,789) |
| Net Assets | | 100.0% | | 270,217,194 |
| a Securities exempt from registration under Rule 144A of the Securities Act of 1933.These securities may be resold in |
| transactions exempt from registration, normally to qualified institutional buyers. At July 31, 2007, these securities |
| amounted to $38,412,798 or 14.2% of net assets. |
| b Variable rate security—interest rate subject to periodic change. |
| c All or a portion of these securities are on loan. At July 31, 2007, the total market value of the fund’s securities on |
| loan is $22,056,775 and the total market value of the collateral held by the fund is $22,632,295, consisting of |
| cash collateral of $18,676,024 and U.S. Government and agency securities valued at $3,956,271. |
| d Notional face amount shown. |
| e Purchased on a delayed delivery basis. |
| f All or partially held by a broker as collateral for open financial futures positions. |
| g Investment in affiliated money market mutual fund. |
| Portfolio Summary (Unaudited) † | | | | |
| |
| | | Value (%) | | | | Value (%) |
| |
| |
| |
|
| Corporate Bonds | | 42.0 | | State/Government | | |
| Asset/Mortgage-Backed | | 30.2 | | General Obligations | | 2.4 |
| U.S. Government & Agencies | | 28.5 | | Foreign/Governmental | | 1.3 |
| Short-Term/Money | | | | | | |
| Market Investments | | 10.5 | | | | 114.9 |
| |
| † Based on net assets. | | | | | | |
| See notes to financial statements. | | | | | | |
| STATEMENT OF FINANCIAL FUTURES |
| July 31, 2007 |
| | | | | | | | | Unrealized |
| | | | | Market Value | | | | Appreciation |
| | | | | Covered by | | | | (Depreciation) |
| | | Contracts | | Contracts ($) | | Expiration | | at 7/31/2007 ($) |
| |
| |
| |
| |
|
| Financial Futures Long | | | | | | | | |
| U.S. Treasury 2 Year Notes | | 342 | | 70,088,625 | | September 2007 | | 324,000 |
| U.S. Treasury 5 Year Notes | | 94 | | 9,914,063 | | September 2007 | | 190,094 |
| Financial Futures Short | | | | | | | | |
| U.S. Treasury 10 Year Notes | | 596 | | (64,023,437) | | September 2007 | | (648,530) |
| U.S. Treasury 30 Year Notes | | 13 | | (1,430,813) | | September 2007 | | (21,023) |
| | | | | | | | | (155,459) |
See notes to financial statements.
The Fund 25
| STATEMENT OF ASSETS AND LIABILITIES |
| July 31, 2007 |
| | | | | Cost | | Value |
| |
| |
| |
|
| Assets ($): | | | | | | |
| Investment in securities—See Statement of | | | | |
| Investments (including securities on loan, | | | | |
| valued at $22,056,775)—Note 1(c): | | | | |
| Unaffiliated issuers | | | | 285,849,212 | | 282,766,959 |
| Affiliated issuers | | | | 27,752,024 | | 27,752,024 |
| Cash denominated in foreign currencies | | 32,158 | | 33,290 |
| Dividends and interest receivable | | | | | | 2,709,881 |
| Receivable for shares of Common Stock subscribed | | | | 8,304 |
| Prepaid expenses | | | | | | 2,890 |
| | | | | | | 313,273,348 |
| |
| |
| |
|
| Liabilities ($): | | | | | | |
| Due to The Dreyfus Corporation and affiliates—Note 3(c) | | | | 216,907 |
| Cash overdraft due to Custodian | | | | | | 153,130 |
| Payable for investment securities purchased | | | | 22,884,341 |
| Liability for securities on loan—Note 1(c) | | | | 18,676,024 |
| Payable for shares of Common Stock redeemed | | | | 864,956 |
| Payable for futures variation margin—Note 4 | | | | 93,625 |
| Accrued expenses | | | | | | 167,171 |
| | | | | | | 43,056,154 |
| |
| |
| |
|
| Net Assets ($) | | | | | | 270,217,194 |
| |
| |
| |
|
| Composition of Net Assets ($): | | | | | | |
| Paid-in capital | | | | | | 362,711,577 |
| Accumulated undistributed investment income—net | | | | 214,592 |
| Accumulated net realized gain (loss) on investments | | | | (89,472,395) |
| Accumulated net unrealized appreciation (depreciation) | | | | |
| on investments and foreign currency transactions [including | | | | |
| ($155,459) net unrealized (depreciation) on financial futures] | | | | (3,236,580) |
| |
| |
|
| Net Assets ($) | | | | | | 270,217,194 |
| |
| |
| |
|
| |
| |
| Net Asset Value Per Share | | | | | | |
| | | Class B | | Class D | | Class P |
| |
| |
| |
|
| Net Assets ($) | | 5,745,522 | | 261,163,711 | | 3,307,961 |
| Shares Outstanding | | 531,693 | | 24,155,265 | | 305,635 |
| |
| |
| |
|
| Net Asset Value Per Share ($) | | 10.81 | | 10.81 | | 10.82 |
See notes to financial statements.
STATEMENT OF OPERATIONS
Year Ended July 31, 2007
|
| Investment Income ($): | | |
| Interest | | 14,886,816 |
| Dividends; | | |
| Affiliated issuers | | 205,842 |
| Income from securities lending | | 7,530 |
| Total Income | | 15,100,188 |
| Expenses: | | |
| Management fee—Note 3(a) | | 1,503,708 |
| Shareholder servicing costs—Note 3(c) | | 959,879 |
| Professional fees | | 54,761 |
| Registration fees | | 43,804 |
| Custodian fees—Note 3(c) | | 42,157 |
| Prospectus and shareholders’ reports | | 39,997 |
| Distribution fees—Note 3(b) | | 33,945 |
| Directors’ fees and expenses—Note 3(d) | | 12,484 |
| Interest expense—Note 2 | | 251 |
| Miscellaneous | | 55,177 |
| Total Expenses | | 2,746,163 |
| Investment Income—Net | | 12,354,025 |
| |
|
| Realized and Unrealized Gain (Loss) on Investments—Note 4 ($): |
| Net realized gain (loss) on investments and foreign currency transactions | | (2,655,896) |
| Net realized gain (loss) on financial futures | | (1,125,013) |
| Net realized gain (loss) on forward currency exchange contracts | | 59,773 |
| Net Realized Gain (Loss) | | (3,721,136) |
| Net unrealized appreciation (depreciation) on investments, | | |
| foreign currency transcactions (including $248,729 | | |
| net unrealized appreciation on financial futures) | | 5,012,159 |
| Net Realized and Unrealized Gain (Loss) on Investments | | 1,291,023 |
| Net Increase in Net Assets Resulting from Operations | | 13,645,048 |
See notes to financial statements.
The Fund 27
STATEMENT OF CHANGES IN NET ASSETS
| | | | | Year Ended July 31, |
| |
| |
|
| | | 2007 | | 2006 |
| |
| |
|
| Operations ($): | | | | |
| Investment income—net | | 12,354,025 | | 14,045,314 |
| Net realized gain (loss) on investments | | (3,721,136) | | (2,408,114) |
| Net unrealized appreciation | | | | |
| (depreciation) on investments | | 5,012,159 | | (2,466,116) |
| Net Increase (Decrease) in Net Assets | | | | |
| Resulting from Operations | | 13,645,048 | | 9,171,084 |
| |
| |
|
| Dividends to Shareholders from ($): | | | | |
| Investment income—net: | | | | |
| Class A | | — | | (275,055) |
| Class B | | (262,943) | | (344,288) |
| Class D | | (13,034,116) | | (15,903,014) |
| Class P | | (161,986) | | (227,066) |
| Net realized gain on investments: | | | | |
| Class A | | — | | (15,053) |
| Class B | | — | | (13,956) |
| Class D | | — | | (538,880) |
| Class P | | — | | (6,475) |
| Total Dividends | | (13,459,045) | | (17,323,787) |
| |
| |
|
| Capital Stock Transactions ($): | | | | |
| Net proceeds from shares sold: | | | | |
| Class A | | — | | 3,713,134 |
| Class B | | 486,992 | | 513,403 |
| Class D | | 31,624,823 | | 149,456,810 |
| Class P | | 42,360 | | 511,511 |
| Dividends reinvested: | | | | |
| Class A | | — | | 235,816 |
| Class B | | 219,310 | | 293,119 |
| Class D | | 11,141,935 | | 13,941,228 |
| Class P | | 81,531 | | 154,730 |
| Cost of shares redeemed: | | | | |
| Class A | | — | | (13,620,477) |
| Class B | | (2,872,725) | | (4,293,256) |
| Class D | | (97,331,627) | | (274,916,324) |
| Class P | | (846,500) | | (4,206,268) |
| Increase (Decrease) in Net Assets | | | | |
| from Capital Stock Transactions | | (57,453,901) | | (128,216,574) |
| Total Increase (Decrease) in Net Assets | | (57,267,898) | | (136,369,277) |
| |
| |
|
| Net Assets ($): | | | | |
| Beginning of Period | | 327,485,092 | | 463,854,369 |
| End of Period | | 270,217,194 | | 327,485,092 |
| Undistributed (distributions in excess) | | | | |
| of investment income—net | | 214,592 | | (13,599) |
28
| | | | | Year Ended July 31, |
| |
| |
|
| | | 2007 | | 2006 |
| |
| |
|
| Capital Share Transactions: | | | | |
| Class A a | | | | |
| Shares sold | | — | | 339,116 |
| Shares issued for dividends reinvested | | — | | 21,520 |
| Shares redeemed | | — | | (1,249,744) |
| Net Increase (Decrease) in Shares Outstanding | | — | | (889,108) |
| |
| |
|
| Class B a | | | | |
| Shares sold | | 44,601 | | 47,129 |
| Shares issued for dividends reinvested | | 20,240 | | 26,899 |
| Shares redeemed | | (263,856) | | (393,753) |
| Net Increase (Decrease) in Shares Outstanding | | (199,015) | | (319,725) |
| |
| |
|
| Class D a | | | | |
| Shares sold | | 2,903,502 | | 13,673,122 |
| Shares issued for dividends reinvested | | 1,022,614 | | 1,279,002 |
| Shares redeemed | | (8,940,596) | | (25,193,273) |
| Net Increase (Decrease) in Shares Outstanding | | (5,014,480) | | (10,241,149) |
| |
| |
|
| Class P | | | | |
| Shares sold | | 3,900 | | 46,679 |
| Shares issued for dividends reinvested | | 7,468 | | 14,149 |
| Shares redeemed | | (77,358) | | (384,118) |
| Net Increase (Decrease) in Shares Outstanding | | (65,990) | | (323,290) |
| a | | During the period ended July 31, 2007, 74,413 Class B shares representing $813,043 were automatically |
| | | converted to 74,413 Class D shares and during the year ended July 31, 2006, 55,669 Class B shares representing |
| | | $608,568 were automatically converted to 55,626 shares consisting of 47,984 Class A shares until March 24, |
| | | 2006 and 7,642 Class D shares from March 25, 2006 through July 31, 2006. |
| See notes to financial statements. |
The Fund 29
FINANCIAL HIGHLIGHTS
The following tables describe the performance for each share class for the fiscal periods indicated.All information (except portfolio turnover rate) reflects financial results for a single fund share.Total return shows how much your investment in the fund would have increased (or decreased) during each period, assuming you had reinvested all dividends and distributions.These figures have been derived from the fund’s financial statements.
| | | | | Year Ended July 31, | | |
| |
| |
| |
|
| Class B Shares | | 2007 | | 2006 | | 2005 | | 2004 a | | 2003 b |
| |
| |
| |
| |
| |
|
| Per Share Data ($): | | | | | | | | | | |
| Net asset value, beginning of period | | 10.82 | | 11.03 | | 11.13 | | 11.50 | | 11.59 |
| Investment Operations: | | | | | | | | | | |
| Investment income—net c | | .38 | | .32 | | .21 | | .19 | | .14 |
| Net realized and unrealized | | | | | | | | | | |
| gain (loss) on investments | | .03 | | (.12) | | .05 | | (.23) | | .10 |
| Total from Investment Operations | | .41 | | .20 | | .26 | | (.04) | | .24 |
| Distributions: | | | | | | | | | | |
| Dividends from investment income—net | | (.42) | | (.39) | | (.35) | | (.32) | | (.33) |
| Dividends from net realized | | | | | | | | | | |
| gain on investments | | — | | (.02) | | (.01) | | (.01) | | — |
| Total Distributions | | (.42) | | (.41) | | (.36) | | (.33) | | (.33) |
| Net asset value, end of period | | 10.81 | | 10.82 | | 11.03 | | 11.13 | | 11.50 |
| |
| |
| |
| |
| |
|
| Total Return (%) d | | 3.84 | | 1.81 | | 2.37 | | (.39) | | 2.11e |
| |
| |
| |
| |
| |
|
| Ratios/Supplemental Data (%): | | | | | | | | | | |
| Ratio of total expenses | | | | | | | | | | |
| to average net assets | | 1.56 | | 1.50 | | 1.50 | | 1.54 | | 1.43f |
| Ratio of net investment income | | | | | | | | | | |
| to average net assets | | 3.46 | | 2.92 | | 1.88 | | 1.64 | | 1.67f |
| Portfolio Turnover Rate | | 146.57 | | 181.07g | | 494.93g | | 695.82g | | 460.89 |
| |
| |
| |
| |
| |
|
| Net Assets, end of period ($ x 1000) | | 5,746 | | 7,905 | | 11,586 | | 13,323 | | 11,367 |
| a | | As of August 1, 2003, the fund has adopted the method of accounting for interim payments on swap contracts in |
| | | accordance with Financial Accounting Standards Board Statement No. 133.These interim payments are reflected |
| | | within net realized and unrealized gain (loss) on swap contracts, however, prior to August 1, 2003, these interim |
| | | payments were reflected within interest income/expense in the Statement of Operations.The effect of this change for |
| | | the period ended July 31, 2004, was to increase net investment income per share by $.01, decrease net realized and |
| | | unrealized gain (loss) on investments per share by $.01 and increase the ratio of net investment income to average net |
| | | assets from 1.60% to 1.64%. Per share data and ratios/supplemental data for periods prior to August 1, 2003 have |
| | | not been restated to reflect this change in presentation. |
| b | | From November 1, 2002 (commencement of initial offering) to July 31, 2003. |
| c | | Based on average shares outstanding at each month end. |
| d | | Exclusive of sales charge. |
| e | | Not annualized. |
| f | | Annualized. |
| g | | The portfolio turnover rates excluding mortgage dollar roll transactions for the periods ended July 31, 2006, July 31, |
| | | 2005 and July 31, 2004, were 169.73%, 463.30% and 665.12%, respectively. |
| See notes to financial statements. |
30
| | | | | Year Ended July 31, | | |
| |
| |
| |
|
| Class D Shares | | 2007 | | 2006 | | 2005 | | 2004 a | | 2003 b |
| |
| |
| |
| |
| |
|
| Per Share Data ($): | | | | | | | | | | |
| Net Asset Value, beginning of period | | 10.82 | | 11.03 | | 11.13 | | 11.50 | | 11.69 |
| Investment Operations: | | | | | | | | | | |
| Investment income—net c | | .45 | | .39 | | .28 | | .27 | | .40 |
| Net realized and unrealized | | | | | | | | | | |
| gain (loss) on investments | | .03 | | (.12) | | .05 | | (.23) | | (.09) |
| Total from Investment Operations | | .48 | | .27 | | .33 | | .04 | | .31 |
| Distributions: | | | | | | | | | | |
| Dividends from investment income—net | | (.49) | | (.46) | | (.42) | | (.40) | | (.50) |
| Dividends from net realized | | | | | | | | | | |
| gain on investments | | — | | (.02) | | (.01) | | (.01) | | — |
| Total Distributions | | (.49) | | (.48) | | (.43) | | (.41) | | (.50) |
| Net asset value, end of period | | 10.81 | | 10.82 | | 11.03 | | 11.13 | | 11.50 |
| |
| |
| |
| |
| |
|
| Total Return (%) | | 4.49 | | 2.48 | | 2.99 | | .28 | | 2.69 |
| |
| |
| |
| |
| |
|
| Ratios/Supplemental Data (%): | | | | | | | | | | |
| Ratio of total expenses | | | | | | | | | | |
| to average net assets | | .90 | | .86 | | .88 | | .87 | | .88 |
| Ratio of net investment income | | | | | | | | | | |
| to average net assets | | 4.12 | | 3.55 | | 2.52 | | 2.36 | | 3.45 |
| Portfolio Turnover Rate | | 146.57 | | 181.07d | | 494.93d | | 695.82d | | 460.89 |
| |
| |
| |
| |
| |
|
| Net Assets, end of period ($ x 1000) | | 261,164 | | 315,555 | | 434,779 | | 573,676 | | 850,189 |
| a | | As of August 1, 2003, the fund has adopted the method of accounting for interim payments on swap contracts in |
| | | accordance with Financial Accounting Standards Board Statement No. 133.These interim payments are reflected |
| | | within net realized and unrealized gain (loss) on swap contracts, however, prior to August 1, 2003, these interim |
| | | payments were reflected within interest income/expense in the Statement of Operations.The effect of this change for |
| | | the period ended July 31, 2004, was to increase net investment income per share by less than $.01, decrease net |
| | | realized and unrealized gain (loss) on investments per share by less than $.01 and increase the ratio of net |
| | | investment income to 2.32% to 2.36%. Per share data and ratios/supplemental data for periods prior to August 1, |
| | | 2003 have not been restated average net assets from to reflect this change in presentation. |
| b | | The fund commenced offering four classes of shares on November 1, 2002.The existing shares were redesignated |
| | | Class D shares. |
| c | | Based on average shares outstanding at each month end. |
| d | | The portfolio turnover rates excluding mortgage dollar roll transactions for the periods ended July 31, 2006, July 31, |
| | | 2005 and July 31, 2004, were 169.73%, 463.30% and 665.12%, respectively. |
| See notes to financial statements. |
The Fund 31
FINANCIAL HIGHLIGHTS (continued)
| | | | | Year Ended July 31, | | |
| |
| |
| |
|
| Class P Shares | | 2007 | | 2006 | | 2005 | | 2004 a | | 2003 b |
| |
| |
| |
| |
| |
|
| Per Share Data ($): | | | | | | | | | | |
| Net Asset Value, beginning of period | | 10.83 | | 11.04 | | 11.15 | | 11.51 | | 11.59 |
| Investment Operations: | | | | | | | | | | |
| Investment income—net c | | .45 | | .39 | | .30 | | .28 | | .20 |
| Net realized and unrealized | | | | | | | | | | |
| gain (loss) on investments | | .03 | | (.12) | | .02 | | (.22) | | .09 |
| Total from Investment Operations | | .48 | | .27 | | .32 | | .06 | | .29 |
| Distributions: | | | | | | | | | | |
| Dividends from investment income—net | | (.49) | | (.46) | | (.42) | | (.41) | | (.37) |
| Dividends from net realized | | | | | | | | | | |
| gain on investments | | — | | (.02) | | (.01) | | (.01) | | — |
| Total Distributions | | (.49) | | (.48) | | (.43) | | (.42) | | (.37) |
| Net asset value, end of period | | 10.82 | | 10.83 | | 11.04 | | 11.15 | | 11.51 |
| |
| |
| |
| |
| |
|
| Total Return (%) | | 4.50 | | 2.46 | | 3.01 | | .38 | | 2.53d |
| |
| |
| |
| |
| |
|
| Ratios/Supplemental Data (%): | | | | | | | | | | |
| Ratio of total expenses | | | | | | | | | | |
| to average net assets | | .90 | | .88 | | .86 | | .86 | | .85e |
| Ratio of net investment income | | | | | | | | | | |
| to average net assets | | 4.12 | | 3.56 | | 2.59 | | 2.41 | | 2.33e |
| Portfolio Turnover Rate | | 146.57 | | 181.07f | | 494.93f | | 695.82f | | 460.89 |
| |
| |
| |
| |
| |
|
| Net Assets, end of period ($ x 1000) | | 3,308 | | 4,025 | | 7,674 | | 12,121 | | 19,763 |
| a | | As of August 1, 2003, the fund has adopted the method of accounting for interim payments on swap contracts in |
| | | accordance with Financial Accounting Standards Board Statement No. 133.These interim payments are reflected |
| | | within net realized and unrealized gain (loss) on swap contracts, however, prior to August 1, 2003, these interim |
| | | payments were reflected within interest income/expense in the Statement of Operations.The effect of this change for |
| | | the period ended July 31, 2004, was to increase net investment income per share by less than $.01, decrease net |
| | | realized and unrealized gain (loss) on investments per share by less than $.01 and increase the ratio of net |
| | | investment income to average net assets from 2.37% to 2.41%. Per share data and ratios/supplemental data for |
| | | periods prior to August 1, 2003 have not been restated to reflect this change in presentation. |
| b | | From November 1, 2002 (commencement of initial offering) to July 31, 2003. |
| c | | Based on average shares outstanding at each month end. |
| d | | Not annualized. |
| e | | Annualized. |
| f | | The portfolio turnover rates excluding mortgage dollar roll transactions for the periods ended |
| | | July 31, 2006, July 31, 2005 and July 31, 2004, were 169.73%, 463.30% and 665.12%, respectively. |
| See notes to financial statements. |
32
NOTES TO FINANCIAL STATEMENTS
NOTE 1—Significant Accounting Policies:
Dreyfus Premier Short Term Income Fund (the “fund”) is a separate non-diversified series of Dreyfus Investment Grade Funds, Inc. (the “Company”), which is registered under the Investment Company Act of 1940, as amended (the “Act”), as an open-end management investment company and operates as a series company currently offering four series, including the fund.The fund’s investment objective is to seek to maximize total return, consisting of capital appreciation and current income.The Dreyfus Corporation (the “Manager” or “Dreyfus”) serves as the fund’s investment adviser. During the reporting period, the manager was a wholly-owned subsidiary of Mellon Financial Corporation (“Mellon Financial”).
On July 1, 2007, Mellon Financial and The Bank of New York Company, Inc. merged, forming The Bank of New York Mellon Corporation. As part of this transaction, Dreyfus became a wholly-owned subsidiary of The Bank of New York Mellon Corporation.
During the reporting period, Dreyfus Service Corporation (the “Distributor”), a wholly-owned subsidiary of the Manager, was the distributor of the fund’s shares. Effective June 30, 2007, the Distributor became known as MBSC Securities Corporation.The fund is authorized to issue 700 million shares of $.001 par value Common Stock. The fund currently offers three classes of shares: Class B (100 million shares authorized), Class D (500 million shares authorized) and Class P (100 million shares authorized). Class B shares are subject to a CDSC imposed on Class B share redemption made within six years of purchase and automatically convert to Class D shares after six years. The fund no longer offers Class B shares, except in connection with dividend reinvestment and permitted exchanges of Class B shares. Class D and Class P shares are sold at net asset value per share only to institutional investors. Class D shares purchased at net asset value (an investment of $250,000 or more) will have a CDSC imposed on redemptions made within eighteen months of purchase. Other differ-
The Fund 33
NOTES TO FINANCIAL STATEMENTS (continued)
ences between the classes include the services offered to and the expenses borne by each class and certain voting rights. Income, expenses (other than expenses attributable to a specific class), and realized and unrealized gains or losses on investments are allocated to each class of shares based on its relative net assets.
The Company accounts separately for the assets, liabilities and operations of each series. Expenses directly attributable to each series are charged to that series’ operations; expenses which are applicable to all series are allocated among them on a pro rata basis.
The fund’s financial statements are prepared in accordance with U.S. generally accepted accounting principles, which may require the use of management estimates and assumptions. Actual results could differ from those estimates.
The fund enters into contracts that contain a variety of indemnifications. The fund’s maximum exposure under these arrangements is unknown.The fund does not anticipate recognizing any loss related to these arrangements.
(a) Portfolio valuation: Investments in securities (excluding short-term investments (other than U.S. Treasury Bills), financial futures, options, swaps and forward currency exchange contracts) are valued each business day by an independent pricing service (the “Service”) approved by the Board of Directors. Investments for which quoted bid prices are readily available and are representative of the bid side of the market in the judgment of the Service are valued at the mean between the quoted bid prices (as obtained by the Service from dealers in such securities) and asked prices (as calculated by the Service based upon its evaluation of the market for such securities). Other investments (which constitute a majority of the portfolio securities) are valued as determined by the Service, based on methods which include consideration of: yields or prices of securities of comparable quality, coupon, maturity and type; indications as to values from dealers; and general market conditions. Securities for which there are no such valuations are valued at fair value
as determined in good faith under the direction of the Board of Directors. Restricted securities, as well as securities or other assets for which recent market quotations are not readily available,that are not valued by a pricing service approved by the Board of Directors, or are determined by the fund not to reflect accurately fair value (such as when an event occurs after the close of the exchange on which the security is principally traded and that is determined by the fund to have changed the value of the security), are valued at fair value as determined in good faith under the direction of the Board of Directors.The factors that may be considered when fair valuing a security include fundamental analytical data, the nature and duration of restrictions on disposition, an evaluation of the forces that influence the market in which the securities are purchased and sold and public trading in similar securities of the issuer or comparable issuers. Short-term investments, excluding U.S.Treasury Bills,are carried at amortized cost,which approximates value.Registered open-end investment companies that are not traded on an exchange are valued at their net asset value. Financial futures and options, which are traded on an exchange, are valued at the last sales price on the securities exchange on which such securities are primarily traded or at the last sales price on the national securities market on each business day. Options traded over-the-counter are priced at the mean between the bid and asked price. Investments denominated in foreign currencies are translated to U.S. dollars at the prevailing rates of exchange. Forward currency exchange contracts are valued at the forward rate.
On September 20, 2006, the Financial Accounting Standards Board (FASB) released Statement of Financial Accounting Standards No. 157 “Fair Value Measurements” (“FAS 157”). FAS 157 establishes an authoritative definition of fair value, sets out a framework for measuring fair value, and requires additional disclosures about fair-value measurements. The application of FAS 157 is required for fiscal years beginning after November 15, 2007 and interim periods within those fiscal years. Management does not believe that the application of this standard will have a material impact on the financial statements of the fund.
The Fund 35
NOTES TO FINANCIAL STATEMENTS (continued)
(b) Foreign currency transactions: The fund does not isolate that portion of the results of operations resulting from changes in foreign exchange rates on investments from the fluctuations arising from changes in market prices of securities held. Such fluctuations are included with the net realized and unrealized gain or loss on investments.
Net realized foreign exchange gains or losses arise from sales and maturities of short-term securities, sales of foreign currencies, currency gains or losses realized on securities transactions and the difference between the amounts of dividends, interest, and foreign withholding taxes recorded on the fund’s books and the U.S. dollar equivalent of the amounts actually received or paid. Net unrealized foreign exchange gains and losses arise from changes in the value of assets and liabilities other than investments in securities, resulting from changes in exchange rates. Such gains and losses are included with net realized and unrealized gain or loss on investments.
(c) Securities transactions and investment income: Securities transactions are recorded on a trade date basis. Realized gain and loss from securities transactions are recorded on the identified cost basis. Dividend income is recognized on the ex-dividend date and interest income, including, where applicable, accretion of discount and amortization of premium on investments, is recognized on the accrual basis.
The fund has an arrangement with the custodian bank whereby the fund receives earnings credits from the custodian when positive cash balances are maintained, which are used to offset custody fees. For financial reporting purposes, the fund includes net earnings credits, if any, as an expense offset in the Statement of Operations.
Pursuant to a securities lending agreement with Mellon Bank, N.A., an affiliate of the Manager, the fund may lend securities to qualified institutions. It is the fund’s policy, that at origination, all loans are secured by collateral of at least 102% of the value of U.S. securities loaned and 105% of the value of foreign securities loaned. . It is the fund’s policy that collateral equivalent to at least 100% of the market value of secu-
rities on loan will be maintained at all times. Cash collateral is invested in certain money market mutual funds managed by the Manager.The fund is entitled to receive all income on securities loaned, in addition to income earned as a result of the lending transaction. Although each security loaned is fully collateralized, the fund bears the risk of delay in recovery of, or loss of rights in, the securities loaned should a borrower fail to return the securities in a timely manner.
(d) Affiliated issuers: Investments in other investment companies advised by the Manager are defined as “affiliated” in the Act.
(e) Dividends to shareholders: It is the policy of the fund to declare dividends daily from investment income-net. Such dividends are paid monthly. Dividends from net realized capital gain, if any, are normally declared and paid annually, but the fund may make distributions on a more frequent basis to comply with the distribution requirements of the Internal Revenue Code of 1986, as amended (the “Code”).To the extent that net realized capital gain can be offset by capital loss carryovers, it is the policy of the fund not to distribute such gain. Income and capital gain distributions are determined in accordance with income tax regulations, which may differ from U.S. generally accepted accounting principles.
(f) Federal income taxes: It is the policy of the fund to continue to qualify as a regulated investment company, if such qualification is in the best interests of its shareholders, by complying with the applicable provisions of the Code, and to make distributions of taxable income sufficient to relieve it from substantially all federal income and excise taxes.
The FASB released FASB Interpretation No. 48 “Accounting for Uncertainty in Income Taxes” (FIN 48). FIN 48 provides guidance for how uncertain tax positions should be recognized, measured, presented and disclosed in the financial statements. FIN 48 requires the evaluation of tax positions taken or expected to be taken in the course of preparing the fund’s tax returns to determine whether the
The Fund 37
NOTES TO FINANCIAL STATEMENTS (continued)
tax positions are “more-likely-than-not” of being sustained by the applicable tax authority.Tax positions not deemed to meet the more-likely-than-not threshold would be recorded as a tax benefit or expense in the current year.Adoption of FIN 48 is required for fiscal years beginning after December 15, 2006 and is to be applied to all open tax years as of the effective date. Management does not believe that the application of this standard will have a material impact on the financial statements of the fund.
At July 31, 2007, the components of accumulated earnings on a tax basis were as follows: undistributed ordinary income $243,727, accumulated capital losses $84,916,232 and unrealized depreciation $4,240,642. In addition, the fund had $3,581,236 of capital losses realized after October 31, 2006 which were deferred for tax purposes to the first day of the following fiscal year.
The accumulated capital loss carryover of is available for federal income tax purposes to be applied against future net securities profits, if any, realized subsequent to July 31, 2007. If not applied, $5,887,866 of the carryover expires in fiscal 2008, $4,403,293 expires in fiscal 2010, $21,420,716 expires in fiscal 2011, $7,815,155 expires in fiscal 2012, $29,412,542 expires in fiscal 2013, $8,634,655 expires in fiscal 2014 and $7,342,005 expires in fiscal 2015.
The tax character of distributions paid to shareholders during the fiscal periods ended July 31, 2007 and July 31, 2006, were as follows: ordinary income $13,459,045 and $17,323,787, respectively.
During the period ended July 31, 2007, as a result of permanent book to tax differences, primarily due to the tax treatment for amortization of premiums, paydown gains and losses on mortgage backed securities, sales treatment for treasury inflation protected securities, foreign currency transactions, contingent deferred debt securities and expiration of capital loss carryover the fund increased accumulated undistributed investment income-net by $1,333,211, increased accumulated net realized gain (loss) on investments by $485,168 and decreased paid-in capital by $1,818,379. Net assets were not affected by this reclassification.
NOTE 2—Bank Lines of Credit:
The fund may borrow up to $10 million for leveraging purposes under a short-term unsecured line of credit and participates with other Dreyfus-managed funds in a $100 million unsecured line of credit primarily to be utilized for temporary or emergency purposes, including the financing of redemptions. Interest is charged to the fund based on prevailing market rates in effect at the time of borrowing.
The average daily amount of borrowings outstanding under the lever aging arrangement during the period ended July 31, 2007 was approximately $2,600, with a related weighted average annualized interest rate of 5.84% ..
NOTE 3—Management Fee and Other Transactions With Affiliates:
(a) Pursuant to a management agreement with the Manager, the management fee is computed at the annual rate of .50% of the value of the fund’s average daily net assets and is payable monthly.
During the period ended July 31, 2007, the Distributor retained $27,823 from contingent deferred sales charges on redemptions of the fund’s Class B shares.
(b) Under the Distribution Plan (the “Plan”) adopted pursuant to Rule 12b-1 under the Act, Class B shares pay the Distributor for distributing their shares at an annual rate of .50% of the value of the average daily net assets of Class B shares. During the period ended July 31, 2007, Class B shares were charged $33,945, pursuant to the Plan.
(c) Under the Shareholder Services Plan, Class B, Class D and Class P shares pay the Distributor at an annual rate of .25% of the value of the average daily net assets Class B and Class P shares and .20% of the value of the average daily net assets of Class D shares, for the provision of certain services.The services provided may include personal services relating to shareholder accounts, such as answering shareholder inquiries
The Fund 39
NOTES TO FINANCIAL STATEMENTS (continued)
regarding Class B, Class D and Class P shares and providing reports and other information, and services related to the maintenance of shareholder accounts.The Distributor may make payments to Service Agents (a securities dealer, financial institution or other industry professional) in respect of these services.The Distributor determines the amounts to be paid to Service Agents. During the period ended July 31, 2007, Class B, Class D and Class P shares were charged, $16,973, $580,711 and $8,992, respectively, pursuant to the Shareholder Services Plan.
The fund compensates Dreyfus Transfer, Inc., a wholly-owned subsidiary of the Manager, under a transfer agency agreement for providing personnel and facilities to perform transfer agency services for the fund. During the period ended July 31, 2007, the fund was charged $95,043 pursuant to the transfer agency agreement.
The fund compensates Mellon Bank, N.A., an affiliate of the Manager, under a custody agreement for providing custodial services for the fund. During the period ended July 31, 2007, the fund was charged $42,157 pursuant to the custody agreement.
During the period ended July 31, 2007, the fund was charged $4,499 for services performed by the Chief Compliance Officer.
The components of “Due to The Dreyfus Corporation and affiliates” in the Statement of Assets and Liabilities consist of: management fees $116,448, Rule 12b-1 distribution plan fees $2,512, shareholder services plan fees $46,971, custodian fees $12,294, chief compliance officer fees $1,607 and transfer agency per account fees $37,075.
(d) Each Board member also serves as a Board member of other funds within the Dreyfus complex. Annual retainer fees and attendance fees are allocated to each fund based on net assets.
(e) Pursuant to an exemptive order from the SEC, the fund may invest its available cash balances in affiliated money market mutual funds. Management fees of the underlying money market mutual funds have been waived by the Manager.
40
NOTE 4—Securities Transactions:
The aggregate amount of purchases and sales (including paydowns) of investment securities, excluding short-term securities, forward currency exchange contracts and financial futures, during the period ended July 31, 2007, amounted to $464,860,911 and $540,423,096, respectively.
The fund may invest in financial futures contracts in order to gain exposure to or protect against changes in the market.The fund is exposed to market risk as a result of changes in the value of the underlying financial instruments. Investments in financial futures require the fund to “mark to market” on a daily basis, which reflects the change in market value of the contracts at the close of each day’s trading.Accordingly, variation margin payments are received or made to reflect daily unrealized gains and losses. When the contracts are closed, the fund recognizes a realized gain or loss. These investments require initial margin deposits with a broker, which consist of cash or cash equivalents.The amount of these deposits is determined by the exchange or Board of Trade on which the contract is traded and is subject to change. Contracts open at July 31, 2007, are set forth in the Statement of Financial Futures.
The fund enters into forward currency exchange contracts in order to hedge its exposure to changes in foreign currency exchange rates on its foreign portfolio holdings and to settle foreign currency transactions. When executing forward currency exchange contracts, the fund is obligated to buy or sell a foreign currency at a specified rate on a certain date in the future.With respect to sales of forward currency exchange contracts, the fund would incur a loss if the value of the contract increases between the date the forward contract is opened and the date the forward contract is closed.The fund realizes a gain if the value of the contract decreases between those dates.With respect to purchases of forward currency exchange contracts, the fund would incur a loss if the value of the contract decreases between the date the forward contract is opened and the date the forward contract
The Fund 41
NOTES TO FINANCIAL STATEMENTS (continued)
is closed.The fund realizes a gain if the value of the contract increases between those dates.The fund is also exposed to credit risk associated with counterparty nonperformance on these forward currency exchange contracts which is typically limited to the unrealized gain on each open contract. At July 31, 2007, there were no forward currency exchange contracts outstanding.
At July 31, 2007, the cost of investments for federal income tax purposes was $314,533,046; accordingly, accumulated net unrealized depreciation on investments was $4,014,063, consisting of $718,129 gross unrealized appreciation and $4,732,192 gross unrealized depreciation.
REPORT OF INDEPENDENT REGISTERED PUBLIC ACCOUNTING FIRM
Shareholders and Board of Directors Dreyfus Premier Short Term Income Fund
We have audited the accompanying statement of assets and liabilities, including the statements of investments and financial futures, of Dreyfus Premier Short Term Income Fund (one of the funds comprising Dreyfus Investment Grade Funds, Inc.), as of July 31, 2007, and the related statement of operations for the year then ended, the statement of changes in net assets for each of the two years in the period then ended, and financial highlights for each of the periods indicated therein.These financial statements and financial highlights are the responsibility of the Fund’s management. Our responsibility is to express an opinion on these financial statements and financial highlights based on our audits.
We conducted our audits in accordance with the standards of the Public Company Accounting Oversight Board (United States).Those standards require that we plan and perform the audit to obtain reasonable assurance about whether the financial statements and financial highlights are free of material misstatement.We were not engaged to perform an audit of the Fund’s internal control over financial reporting. Our audits included consideration of internal control over financial reporting as a basis for designing audit procedures that are appropriate in the circumstances, but not for the purpose of expressing an opinion on the effectiveness of the Fund’s internal control over financial reporting. Accordingly, we express no such opinion.An audit includes examining, on a test basis, evidence supporting the amounts and disclosures in the financial statements and financial highlights, assessing the accounting principles used and significant estimates made by management, and evaluating the overall financial statement presentation. Our procedures included confirmation of securities owned as of July 31, 2007 by correspondence with the custodian and others. We believe that our audits provided a reasonable basis for our opinion
In our opinion, the financial statements and financial highlights referred to above present fairly, in all material respects, the financial position of Dreyfus Premier Short Term Income Fund at July 31, 2007, the results of its operations for the year then ended, the changes in its net assets for each of the two years in the period then ended, and the financial highlights for each of the indicated periods, in conformity with U.S. generally accepted accounting principles.

| New York, New York |
| September 14, 2007 |
The Fund 43
IMPORTANT TAX INFORMATION (Unaudited)
The fund hereby designates 95.93% of ordinary income dividends paid during the fiscal year ended July 31, 2007 as qualifying “interest related dividends”.
INFORMATION ABOUT THE REVIEW AND APPROVAL OF THE FUND’S MANAGEMENT AGREEMENT (Unaudited)
At a meeting of the fund’s Board of Directors held on July 19 and 20, 2007, the Board considered the re-approval for an annual period (through July 29,2008) of the Management Agreement with Dreyfus for the fund, pursuant to which Dreyfus provides the fund with investment advisory and administrative services. The Board members, none of whom are “interested persons” (as defined in the Investment Company Act of 1940, as amended) of the fund were assisted in their review by independent legal counsel and met with counsel in executive session separate from representatives of Dreyfus.
Analysis of Nature, Extent and Quality of Services Provided to the Fund. The Board members received a presentation from representatives of Dreyfus regarding services provided to the fund and other funds in the Dreyfus fund complex, and discussed the nature, extent and quality of the services provided to the fund pursuant to its Management Agreement. Dreyfus’ representatives reviewed the fund’s distribution of accounts and the relationships Dreyfus has with various intermediaries and the different needs of each. Dreyfus’ representatives noted the distribution channels for the fund as well as the diversity of distribution among the funds in the Dreyfus fund complex, and Dreyfus’ corresponding need for broad, deep, and diverse resources to be able to provide ongoing shareholder services to each distribution channel, including those of the fund. Dreyfus also provided the number of shareholder accounts in the fund, as well as the fund’s asset size.
The Board members also considered Dreyfus’ research and portfolio management capabilities and that Dreyfus also provides oversight of day-to-day fund operations, including fund accounting and administration and assistance in meeting legal and regulatory requirements. The Board members also considered Dreyfus’ extensive administrative, accounting and compliance infrastructure.
Comparative Analysis of the Fund’s Performance and Management Fee and Expense Ratio. The Board members reviewed the performance of the fund’s Class D shares and comparisons to a group of retail no-load short investment grade debt funds (the “Performance Group”) and to a
The Fund 45
INFORMATION ABOUT THE REVIEW AND APPROVAL OF THE FUND’S MANAGEMENT AGREEMENT (Unaudited) (continued)
larger universe of funds, consisting of all retail no-load short investment grade debt funds, excluding outliers (the “Performance Universe”), selected and provided by Lipper, Inc., an independent provider of investment company data.The Board was provided with a description of the methodology Lipper used to select the Performance Group and Performance Universe, as well as the Expense Group and Expense Universe (discussed below).The Board members discussed the results of the comparisons for various periods ended May 31, 2007. The Board members noted that the fund’s total return performance variously was above, at and below the Performance Group and Performance Universe medians for all periods, including being above or at both medians for the one-, three- and ten-year periods.The fund’s yield performance was above the Performance Group median for all periods except one and above the Performance Universe median for all periods. Representatives of Dreyfus discussed certain factors that affected the fund’s relative performance, including that the portfolio was underweight in mortgage-backed securities. Dreyfus also provided a comparison of the fund’s total returns to the returns of the fund’s benchmark index for each of the calendar years for the prior ten years.
The Board members also discussed the fund’s management fee and expense ratio and reviewed the range of management fees and expense ratios as compared to a comparable group of funds (the “Expense Group”) and a broader group of funds (the “Expense Universe”), each selected and provided by Lipper. The Board members noted that the fund’s actual management fee and expense ratio were above the Expense Group and Expense Universe medians,and that the contractual management fee was slightly above the Expense Group median.
Representatives of Dreyfus stated that there were no other mutual funds managed by Dreyfus or its affiliates with similar investment objectives, policies and strategies, and reviewed with the Board other accounts managed by Dreyfus or its affiliates, with similar investment objectives, policies and strategies as the fund (the “Similar Accounts”). Dreyfus representatives explained the nature of the Similar Accounts and the differences, from Dreyfus’ perspective, in providing services to
such Similar Accounts as compared to managing and providing services to the fund. Dreyfus’ representatives also reviewed the costs associated with distribution through intermediaries. The Board analyzed differences in fees paid to Dreyfus and discussed the relationship of the fees paid in light of the services provided.The Board members considered the relevance of the fee information provided for the Similar Accounts to evaluate the appropriateness and reasonableness of the fund’s management fee.
Analysis of Profitability and Economies of Scale. Dreyfus’ representatives reviewed the dollar amount of expenses allocated and profit received by Dreyfus and the method used to determine such expenses and profit.The Board considered information, previously provided and discussed, prepared by an independent consulting firm regarding Dreyfus’ approach to allocating costs to, and determining the profitability of, individual funds and the entire Dreyfus mutual fund complex. The Board members also considered that the methodology had also been reviewed by an independent registered public accounting firm which, like the consultant, found the methodology to be reason-able.The consulting firm also analyzed where any economies of scale might emerge in connection with the management of the fund. The Board members evaluated the profitability analysis in light of the relevant circumstances for the fund and the extent to which economies of scale would be realized if the fund grows and whether fee levels reflect these economies of scale for the benefit of fund investors.The Board members also considered potential benefits to Dreyfus from acting as investment adviser and noted that there were no soft dollar arrangements with respect to trading the fund’s investments.
It was noted that the Board members should consider Dreyfus’ profitability with respect to the fund as part of their evaluation of whether the fees under the Management Agreement bear a reasonable relationship to the mix of services provided by Dreyfus, including the nature, extent and quality of such services and that a discussion of economies of scale is predicated on increasing assets and that, if a fund’s assets had
The Fund 47
INFORMATION ABOUT THE REVIEW AND APPROVAL OF THE FUND’S MANAGEMENT AGREEMENT (Unaudited) (continued)
been decreasing, the possibility that Dreyfus may have realized any economies of scale would be less. It also was noted that the profitability percentage for managing the fund was within ranges determined by appropriate court cases to be reasonable given the services rendered and generally superior service levels provided.
At the conclusion of these discussions, the Board agreed that it had been furnished with sufficient information to make an informed business decision with respect to continuation of the Management Agreement, with respect to the fund. Based on the discussions and considerations as described above, the Board made the following conclusions and determinations.
- The Board concluded that the nature, extent and quality of the ser- vices provided by Dreyfus are adequate and appropriate.
- The Board was generally satisfied with the fund’s overall performance.
- The Board concluded that the fee paid by the fund to Dreyfus was reasonable in light of the services provided, comparative performance, expense and management fee information, costs of the services pro- vided and profits to be realized and benefits derived or to be derived by Dreyfus from its relationship with the fund.
- The Board determined that the economies of scale which may accrue to Dreyfus and its affiliates in connection with the manage- ment of the fund had been adequately considered by Dreyfus in connection with the management fee rate charged to the fund and that, to the extent in the future it were determined that material economies of scale had not been shared with the fund, the Board would seek to have those economies of scale shared with the fund.
The Board members considered these conclusions and determinations, along with information received on a routine and regular basis throughout the year, and, without any one factor being dispositive, the Board determined that re-approval of the Management Agreement,with respect to the fund, was in the best interests of the fund and its shareholders.
48
BOARD MEMBERS INFORMATION (Unaudited)
Joseph S. DiMartino (63)
Chairman of the Board (1995)
|
Principal Occupation During Past 5 Years:
• Corporate Director and Trustee
|
Other Board Memberships and Affiliations:
|
- The Muscular Dystrophy Association, Director
- Century Business Services, Inc., a provider of outsourcing functions for small and medium size companies, Director
- The Newark Group, a provider of a national market of paper recovery facilities, paperboard mills and paperboard converting plants, Director
- Sunair Services Corporation, a provider of certain outdoor-related services to homes and businesses, Director
- Ivory Investment Management, L.P., a registered investment adviser to three private funds, Senior Adviser
No. of Portfolios for which Board Member Serves: 164
Clifford L. Alexander, Jr. (73)
Board Member (2003)
|
Principal Occupation During Past 5 Years:
|
- President of Alexander & Associates, Inc., a management consulting firm ( January 1981-present)
- Chairman of the Board of Moody’s Corporation (October 2000-October 2003)
Other Board Memberships and Affiliations:
• Mutual of America Life Insurance Company, Director
No. of Portfolios for which Board Member Serves: 53
|
David W. Burke (71)
Board Member (1994)
|
Principal Occupation During Past 5 Years:
• Corporate Director and Trustee
|
Other Board Memberships and Affiliations:
• John F. Kennedy Library Foundation, Director
|
No. of Portfolios for which Board Member Serves: 88
|
The Fund 49
BOARD MEMBERS INFORMATION (Unaudited) (continued)
Whitney I. Gerard (72)
Board Member (1993)
|
Principal Occupation During Past 5 Years:
• Partner of Chadbourne & Parke LLP
|
No. of Portfolios for which Board Member Serves: 26
|
George L. Perry (72)
Board Member (1992)
|
Principal Occupation During Past 5 Years:
• Economist and Senior Fellow at Brookings Institution
No. of Portfolios for which Board Member Serves: 26
|
Once elected all Board Members serve for an indefinite term, but achieve Emeritus status upon reaching age 80.The address of the Board Members and Officers is in c/o The Dreyfus Corporation, 200 Park Avenue, New York, New York 10166. Additional information about the Board Members is available in the fund’s Statement of Additional Information which can be obtained from Dreyfus free of charge by calling this toll free number: 1-800-554-4611.
Arthur A. Hartman, Emeritus Board Member
OFFICERS OF THE FUND (Unaudited)
J. DAVID OFFICER, President since December 2006.
Chief Operating Officer,Vice Chairman and a Director of the Manager, and an officer of 82 investment companies (comprised of 164 portfolios) managed by the Manager. He is 58 years old and has been an employee of the Manager since April 1998.
PHILLIP N. MAISANO, Executive Vice President since July 2007.
Chief Investment Officer,Vice Chair and a director of the Manager, and an officer of 82 investment companies (compromised of 164 portfolios) managed by the Manager. Mr. Maisano also is an officer and/or board member of certain other investment management subsidiaries of The Bank of New York Mellon Corperation, each of which is an affiliate of the Manager. He is 60 years old and has been employee of the Manager since November 2006. Prior to joining the Manager, Mr. Maisano served as Chairman and Chief Executive Officer of EACM Advisors, an affiliate of the Manager, since August 2004, and served as Chief Executive Officer of Evaluation Associates, a leading institutional investment consulting firm, from 1988 until 2004.
MICHAEL A. ROSENBERG, Vice President and Secretary since August 2005.
Associate General Counsel of the Manager, and an officer of 83 investment companies (comprised of 181 portfolios) managed by the Manager. He is 47 years old and has been an employee of the Manager since October 1991.
JAMES BITETTO, Vice President and Assistant Secretary since August 2005.
Associate General Counsel and Assistant Secretary of the Manager, and an officer of 83 investment companies (comprised of 181 portfolios) managed by the Manager. He is 41 years old and has been an employee of the Manager since December 1996.
JONI LACKS CHARATAN, Vice President and Assistant Secretary since August 2005.
Associate General Counsel of the Manager, and an officer of 83 investment companies (comprised of 181 portfolios) managed by the Manager. She is 51 years old and has been an employee of the Manager since October 1988.
JOSEPH M. CHIOFFI, Vice President and Assistant Secretary since August 2005.
Associate General Counsel of the Manager, and an officer of 83 investment companies (comprised of 181 portfolios) managed by the Manager. He is 45 years old and has been an employee of the Manager since June 2000.
JANETTE E. FARRAGHER, Vice President and Assistant Secretary since August 2005.
Associate General Counsel of the Manager, and an officer of 83 investment companies (comprised of 181 portfolios) managed by the Manager. She is 44 years old and has been an employee of the Manager since February 1984.
JOHN B. HAMMALIAN, Vice President and Assistant Secretary since August 2005.
Associate General Counsel of the Manager, and an officer of 83 investment companies (comprised of 181 portfolios) managed by the Manager. He is 44 years old and has been an employee of the Manager since February 1991.
ROBERT R. MULLERY, Vice President and Assistant Secretary since August 2005.
Associate General Counsel of the Manager, and an officer of 83 investment companies (comprised of 181 portfolios) managed by the Manager. He is 55 years old and has been an employee of the Manager since May 1986.
The Fund 51
OFFICERS OF THE FUND (Unaudited) (continued)
JEFF PRUSNOFSKY, Vice President and Assistant Secretary since August 2005.
Associate General Counsel of the Manager, and an officer of 83 investment companies (comprised of 181 portfolios) managed by the Manager. He is 42 years old and has been an employee of the Manager since October 1990.
JAMES WINDELS, Treasurer since November 2001.
Director – Mutual Fund Accounting of the Manager, and an officer of 83 investment companies (comprised of 181 portfolios) managed by the Manager. He is 48 years old and has been an employee of the Manager since April 1985.
ROBERT ROBOL, Assistant Treasurer since August 2005.
Senior Accounting Manager – Money Market and Municipal Bond Funds of the Manager, and an officer of 83 investment companies (comprised of 181 portfolios) managed by the Manager. He is 43 years old and has been an employee of the Manager since October 1988.
ROBERT SALVIOLO, Assistant Treasurer since May 2007.
Senior Accounting Manager – Equity Funds the Manager, and an officer of 83 investment companies (comprised of 181 portfolios) managed by the Manager. He is 40 years old and has been an employee of the Manager since June 1989.
ROBERT SVAGNA, Assistant Treasurer since August 2005.
Senior Accounting Manager Equity Funds of the Manager, and an officer of 83 investment companies (comprised of 181 portfolios) managed by the Manager. He is 40 years old and has been an employee of the Manager since November 1990.
GAVIN C. REILLY, Assistant Treasurer since December 2005.
Tax Manager of the Investment Accounting and Support Department of the Manager, and an officer of 83 investment companies (comprised of 181 portfolios) managed by the Manager. He is 38 years old and has been an employee of the Manager since April 1991.
JOSEPH W. CONNOLLY, Chief Compliance Officer since October 2004.
Chief Compliance Officer of the Manager and The Dreyfus Family of Funds (83 investment companies, comprised of 181 portfolios). From November 2001 through March 2004, Mr. Connolly was first Vice-President, Mutual Fund Servicing for Mellon Global Securities Services. In that capacity, Mr. Connolly was responsible for managing Mellon’s Custody, Fund Accounting and Fund Administration services to third-party mutual fund clients. He is 50 years old and has served in various capacities with the Manager since 1980, including manager of the firm’s Fund Accounting Department from 1997 through October 2001.
WILLIAM GERMENIS, Anti-Money Laundering Compliance Officer since October 2002.
Vice President and Anti-Money Laundering Compliance Officer of the Distributor, and the Anti-Money Laundering Compliance Officer of 79 investment companies (comprised of 177 portfolios) managed by the Manager. He is 36 years old and has been an employee of the Distributor since October 1998.
For More Information

Telephone Call your financial representative or 1-800-554-4611
| Mail | | The Dreyfus Premier Family of Funds |
| | | 144 Glenn Curtiss Boulevard, Uniondale, NY 11556-0144 |
The fund files its complete schedule of portfolio holdings with the Securities and Exchange Commission (“SEC”) for the first and third quarters of each fiscal year on Form N-Q. The fund’s Forms N-Q are available on the SEC’s website at http://www.sec.gov and may be reviewed and copied at the SEC’s Public Reference Room in Washington, DC. Information on the operation of the Public Reference Room may be obtained by calling 1-202-551-8090.
A description of the policies and procedures that the fund uses to determine how to vote proxies relating to portfolio securities, and information regarding how the fund voted these proxies for the 12-month period ended June 30, 2007, is available at http://www.dreyfus.com and on the SEC’s website at http://www.sec.gov. The description of the policies and procedures is also available without charge, upon request, by calling 1-800-645-6561.
®
0083AR0707
© 2007 MBSC Securities Corporation
Save time. Save paper. View your next shareholder report online as soon as it’s available. Log into www.dreyfus.com and sign up for Dreyfus eCommunications. It’s simple and only takes a few minutes.
The views expressed in this report reflect those of the portfolio manager only through the end of the period covered and do not necessarily represent the views of Dreyfus or any other person in the Dreyfus organization. Any such views are subject to change at any time based upon market or other conditions and Dreyfus disclaims any responsibility to update such views.These views may not be relied on as investment advice and, because investment decisions for a Dreyfus fund are based on numerous factors, may not be relied on as an indication of trading intent on behalf of any Dreyfus fund.
Not FDIC-Insured • Not Bank-Guaranteed • May Lose Value
| | | Contents |
| |
| | | THE FUND |
| |
|
| 2 | | A Letter from the CEO |
| 3 | | Discussion of Fund Performance |
| 6 | | Fund Performance |
| 8 | | Understanding Your Fund’s Expenses |
| 8 | | Comparing Your Fund’s Expenses |
| | | With Those of Other Funds |
| 9 | | Statement of Investments |
| 14 | | Statement of Financial Futures |
| 15 | | Statement of Assets and Liabilities |
| 16 | | Statement of Operations |
| 17 | | Statement of Changes in Net Assets |
| 19 | | Financial Highlights |
| 21 | | Notes to Financial Statements |
| 29 | | Report of Independent Registered |
| | | Public Accounting Firm |
| 30 | | Important Tax Information |
| 31 | | Information About the Review and Approval |
| | | of the Fund’s Management Agreement |
| 36 | | Board Members Information |
| 38 | | Officers of the Fund |
| |
| | | FOR MORE INFORMATION |
| |
|
| | | Back Cover |
The Fund
| Dreyfus Premier |
| Yield Advantage Fund |

A LETTER FROM THE CEO
Dear Shareholder:
We are pleased to present this annual report for Dreyfus Premier Yield Advantage Fund, covering the 12-month period from August 1, 2006, through July 31, 2007.
After rallying earlier in the reporting period amid slowing economic growth and benign inflation, the U.S. bond market has encountered significantly heightened volatility in recent months.While the markets’ nominal returns remained positive for the reporting period overall, the recent sell-off has hurt current year-to-date returns most notably on longer-term and high-yield securities. Fixed-income investors have become less tolerant of risk, due mainly to rate hikes in overseas markets, turmoil in the U.S. sub-prime mortgage sector, stronger economic data and a flood of newly issued high-yield bonds with questionable credit characteristics.
In our view, it is appropriate for the bond market to become more concerned with the pricing of risk, which may help wring excesses out of some market sectors. Furthermore, we view recent volatility in credit-sensitive sectors as offering potential investment opportunities in fundamentally sound securities at relatively attractive prices. As always, we encourage you to talk with your financial advisor, who can help you understand the challenges and potential opportunities presented by today’s more turbulent market conditions.
For information about how the fund performed during the reporting period, as well as market perspectives, we have provided a Discussion of Fund Performance given by the fund’s Portfolio Manager.
Thank you for your continued confidence and support.

| Thomas F. Eggers |
| Chief Executive Officer |
| The Dreyfus Corporation |
| August 15, 2007 |

DISCUSSION OF FUND PERFORMANCE
For the period of August 31, 2006, through July 31, 2007, as provided by Laurie Carroll, Portfolio Manager
Fund and Market Performance Overview
Strong performance for the fund and short-term fixed-income instruments over the bulk of the reporting period was erased by heightened market turbulence in June and July 2007, when credit concerns in the sub-prime mortgage sector spread to other areas of the financial markets. The fund produced lower returns than its benchmark, due to a general widening of credit spreads and, specifically, to its holdings of asset-backed securities backed by sub-prime home equity loans.
For the 12-month period ended July 31, 2007, Dreyfus Premier Yield Advantage Fund achieved total returns of 1.93% for Class B shares and 3.23% for Class D shares.1 In comparison, the Citigroup 1-Year Treasury Benchmark Index, the fund’s benchmark, achieved a total return of 5.05% for the same period.2
The Fund’s Investment Approach
The fund seeks as high a level of current income as is consistent with the preservation of capital, with minimal changes in share price.To pursue its goal, the fund invests only in investment-grade fixed-income securities of U.S. and foreign issuers or the unrated equivalent (at the time of investment)3 as determined by Dreyfus. This may include: U.S. government bonds and notes; corporate bonds; municipal bonds; convertible securities; preferred stocks; inflation-indexed securities; asset-backed securities; mortgage-related securities (including CMOs); and foreign bonds.
To help reduce share price fluctuations, the fund seeks to keep the average effective duration of its overall portfolio at one year or less, and the fund may invest in securities with effective final maturities of any length.
The fund may also utilize risk management techniques, including futures contracts, swap agreements and other derivatives, in seeking to reduce share price volatility, increase income and otherwise manage the fund’s exposure to investment risks.The fund will focus primarily on U.S. securities, but may invest up to 10% of its total assets in fixed-income securities of foreign issuers.
The Fund 3
DISCUSSION OF FUND PERFORMANCE (continued)
Sub-Prime Mortgage Turmoil Derailed a Rallying Bond Market
The reporting period overall was characterized by moderate economic growth, generally benign inflation, historically low default rates and steady short-term interest rates.Typically, factors such as these have been a recipe for favorable fixed-income returns. Indeed, such was generally the case over the first 10 months or so of the reporting period, when positive investor sentiment and high levels of demand for current income helped support bond prices in most bond market sectors.
The rally in some of the bond market’s more credit-sensitive areas was interrupted in late February 2007, when reports surfaced regarding greater-than-expected delinquencies and defaults among homeowners with sub-prime mortgages. However, it seemed at the time that these credit concerns were limited to the sub-prime mortgage sector, and other areas of the U.S. bond market quickly regained any lost ground.
In late June, investors’ credit concerns again intensified when evidence began to emerge that more homeowners were coming under pressure as their adjustable-rate mortgages reset at higher levels. Investors also worried that consumers were feeling the pinch from higher food and energy prices. Indeed, some retailers that cater to lower- and middle-income consumers began to report disappointing sales and earnings. Consequently, investor sentiment deteriorated rapidly, leading to sharp declines in the prices of stocks, corporate bonds and other financial instruments that tend to be sensitive to credit concerns. Even some AAA-rated fixed-income securities lost value, including some of the fund’s positions in asset-backed securities. Although these holdings were backed by senior traunches of home equity loans, giving them priority for repayment in the event of default, their prices were nonetheless adversely affected by the developing credit crisis.The fund did not experience any defaults during the reporting period.
Defensive Positioning Proved to be Warranted
We attempted to guard against credit risks throughout the reporting period by adopting a relatively conservative security selection strategy. During the fall of 2006, we grew concerned regarding higher levels of mergers-and-acquisitions activity, including record-setting leveraged buyouts, and we attempted to avoid issuers and industries that we believed were vulnerable to LBO risk. We allocated a portion of the
fund’s assets to shorter-maturity asset-backed securities, some of which were backed by mortgages and home equity loans, while others were secured by non-mortgage assets such as credit card receivables and automobile loans.We also deployed a portion of the fund’s assets to a diversified mix of short-maturity corporate bonds with investment-grade credit ratings.
We generally set the fund’s weighted average maturity in a range we considered to be in line with industry averages, but we positioned the fund for wider differences along its maturity range by adopting a “bulleted” yield curve strategy that balanced floating-rate instruments with one-year notes.The fund’s weighted average maturity and yield curve strategy had relatively little impact on relative performance.
The Outlook Is Currently Uncertain
As of the reporting period’s end, the credit crisis in the broad market remains unresolved. We are monitoring the situation carefully, and we expect government regulators to take steps to promote market liquidity. Currently, the fund has not been affected by the current situation. In addition, recent economic and inflation data appear to have increased the likelihood that the Federal Reserve Board may reduce short-term interest rates from current levels, which could help relieve some of the pressure on homeowners and lenders. In the meantime, we intend to maintain the fund’s relatively conservative positioning, including a focus on higher-quality fixed-income instruments.
August 15, 2007
| 1 | | Total return includes reinvestment of dividends and any capital gains paid, and does not take into |
| | | consideration the applicable contingent deferred sales charges imposed on redemptions in the case of |
| | | Class B shares. Had these charges been reflected, returns would have been lower. Past performance |
| | | is no guarantee of future results. Share price, yield and investment return fluctuate such that upon |
| | | redemption, fund shares may be worth more or less than their original cost. Return figures |
| | | provided reflect the absorption of certain fund expenses by The Dreyfus Corporation pursuant to |
| | | an agreement in effect through July 31, 2008, at which time it may be extended, terminated or |
| | | modified. Had these expenses not been absorbed, the fund’s returns would have been lower. |
| 2 | | SOURCE: BLOOMBERG L.P. — Reflects reinvestment of dividends and, where applicable, |
| | | capital gain distributions.The Citigroup 1-Year Treasury Benchmark Index is an unmanaged index |
| | | generally representative of the average yield on 1-year U.S.Treasury bills.The index does not take |
| | | into account charges, fees and other expenses.Total return is calculated on a month-end basis. |
| 3 | | The fund may continue to own investment-grade bonds (at the time of purchase) which are |
| | | subsequently downgraded to below investment grade. |
The Fund 5
FUND PERFORMANCE

Comparison of change in value of $10,000 investment in Dreyfus Premier Yield Advantage Fund Class B shares and Class D shares and the Citigroup 1-Year Treasury Benchmark Index
| † Source: Bloomberg L.P. |
| Past performance is not predictive of future performance. |
| The above graph compares a $10,000 investment made in Class B and Class D shares of Dreyfus Premier Yield |
| Advantage Fund on 11/15/01 (inception date for Class D) to a $10,000 investment made in the Citigroup 1-Year |
| Treasury Benchmark Index (the “Index”) on that date. For comparative purposes, the value of the Index on 10/31/01 |
| is used as the beginning value on 11/15/01. All dividends and capital gain distributions are reinvested. Performance for |
| Class B shares represent the performance of the fund’s Class D shares from the inception date to November 1, 2002 (the |
| inception date for Class B shares), and is adjusted to reflect the applicable sales load of that class. Performance for Class |
| B shares does not include differences in distributions/servicing fees prior to November 1, 2002, which would have |
| lowered the performance for Class B shares. |
| The performance shown in the line graph above takes into account the applicable contingent deferred sales charge on Class |
| B shares.The fund invests primarily in investment-grade fixed-income securities of U.S. and foreign issuers and seeks to |
| maintain an average effective duration of one year or less.The Index is an unmanaged index generally representative of |
| the average yield on 1-year U.S.Treasury bills.The Index does not take into account charges, fees and other expenses. |
| Further information relating to fund performance, including expense reimbursements, if applicable, is contained in the |
| Financial Highlights section of the prospectus and elsewhere in this report. |
| Average Annual Total Returns as of 7/31/07 | | | | |
| |
| | | Inception | | | | | | From |
| | | Date | | 1 Year | | 5 Years | | Inception |
| |
| |
| |
| |
|
| Class B shares | | | | | | | | |
| with applicable redemption charge † | | 11/15/01 | | (1.99)% | | 1.04% | | 1.60% |
| without redemption | | 11/15/01 | | 1.93% | | 1.40% | | 1.75% |
| Class D shares | | 11/15/01 | | 3.23% | | 2.12% | | 2.39% |
Past performance is not predictive of future performance.The fund’s performance shown in the graph and table does not reflect the deduction of taxes that a shareholder would pay on fund distributions or the redemption of fund shares.The performance figures for Class B shares shown in the table include the performance of Class D shares from November 15, 2001, to November 1, 2002, and are adjusted to reflect the applicable sales load of that class but do not include current distribution/servicing fees during that period.
† The maximum contingent deferred sales charge for Class B shares is 4%. After six years Class B shares convert to Class D shares.
The Fund 7
U N D E R S TA N D I N G YO U R F U N D ’ S E X P E N S E S ( U n a u d i t e d )
As a mutual fund investor, you pay ongoing expenses, such as management fees and other expenses. Using the information below, you can estimate how these expenses affect your investment and compare them with the expenses of other funds.You also may pay one-time transaction expenses, including sales charges (loads) and redemption fees, which are not shown in this section and would have resulted in higher total expenses. For more information, see your fund’s prospectus or talk to your financial adviser.
Review your fund’s expenses
The table below shows the expenses you would have paid on a $1,000 investment in Dreyfus Premier Yield Advantage Fund from February 1, 2007 to July 31, 2007. It also shows how much a $1,000 investment would be worth at the close of the period, assuming actual returns and expenses.
| Expenses and Value of a $1,000 Investment | | |
| assuming actual returns for the six months ended July 31, 2007 | | |
| | | Class B | | Class D |
| |
| |
|
| Expenses paid per $1,000 † | | $ 7.70 | | $ 3.98 |
| Ending value (after expenses) | | $1,004.60 | | $1,008.20 |
COMPARING YOUR FUND’S EXPENSES WITH THOSE OF OTHER FUNDS (Unaudited)
Using the SEC’s method to compare expenses
The Securities and Exchange Commission (SEC) has established guidelines to help investors assess fund expenses. Per these guidelines, the table below shows your fund’s expenses based on a $1,000 investment, assuming a hypothetical 5% annualized return. You can use this information to compare the ongoing expenses (but not transaction expenses or total cost) of investing in the fund with those of other funds.All mutual fund shareholder reports will provide this information to help you make this comparison. Please note that you cannot use this information to estimate your actual ending account balance and expenses paid during the period.
Expenses and Value of a $1,000 Investment assuming a hypothetical 5% annualized return for the six months ended July 31, 2007
| | | Class B | | Class D |
| |
| |
|
| Expenses paid per $1,000 † | | $ 7.75 | | $ 4.01 |
| Ending value (after expenses) | | $1,017.11 | | $1,020.83 |
† Expenses are equal to the fund’s annualized expense ratio of 1.55% for Class B and .80% for Class D, multiplied by the average account value over the period, multiplied by 181/365 (to reflect the one-half year period).
| STATEMENT OF INVESTMENTS | | | | | | |
| July 31, 2007 | | | | | | | | |
| |
| |
| |
| |
|
| |
| |
| |
| | | Coupon | | Maturity | | Principal | | |
| Bonds and Notes—87.4% | | Rate (%) | | Date | | Amount ($) | | Value ($) |
| |
| |
| |
| |
|
| Asset-Backed Ctfs./ | | | | | | | | |
| Auto Receivables—7.1% | | | | | | | | |
| Capital Auto Receivables Asset | | | | | | | | |
| Trust, Ser. 2006-1, Cl. A3 | | 5.03 | | 10/15/09 | | 1,040,000 | | 1,038,041 |
| Harley-Davidson Motorcycle Trust, | | | | | | |
| Ser. 2005-2, Cl. A2 | | 4.07 | | 2/15/12 | | 800,000 | | 790,752 |
| WFS Financial Owner Trust, | | | | | | | | |
| Ser. 2005-1, Cl. A3 | | 3.59 | | 10/19/09 | | 766,200 | | 762,004 |
| WFS Financial Owner Trust, | | | | | | | | |
| Ser. 2005-2, Cl. A4 | | 4.39 | | 11/19/12 | | 1,500,000 | | 1,490,010 |
| | | | | | | | | 4,080,807 |
| Asset-Backed Ctfs./Credit Cards—9.2% | | | | | | |
| Advanta Business Card Master | | | | | | | | |
| Trust, Ser. 2005-C1, Cl. C1 | | 5.83 | | 8/22/11 | | 1,500,000 a | | 1,505,354 |
| American Express Issuance Trust, | | | | | | |
| Ser. 2005-1, Cl. C | | 5.65 | | 8/15/11 | | 1,250,000 a | | 1,255,825 |
| Chase Issuance Trust, | | | | | | | | |
| Ser. 2005-C1, Cl. C1 | | 5.69 | | 11/15/12 | | 1,250,000 a | | 1,254,318 |
| Gracechurch Card Funding, | | | | | | | | |
| Ser. 9, Cl. C | | 5.63 | | 9/15/10 | | 1,250,000 a | | 1,250,000 |
| | | | | | | | | 5,265,497 |
| Asset-Backed Ctfs./ | | | | | | | | |
| Home Equity Loans—22.0% | | | | | | | | |
| Asset-Backed Securities Home | | | | | | | | |
| Equity, Ser. 2004-HE3, Cl. M2 | | 6.44 | | 6/25/34 | | 1,750,000 a | | 1,734,692 |
| Bayview Financial Acquisition | | | | | | | | |
| Trust, Ser. 2006-A, Cl. 1A1 | | 5.61 | | 2/28/41 | | 1,249,577 a | | 1,243,963 |
| Bayview Financial Acquisition | | | | | | | | |
| Trust, Ser. 2007-A, Cl. 1A1 | | 6.13 | | 5/28/37 | | 649,572 a | | 646,935 |
| Broadwick Funding, | | | | | | | | |
| Ser. 2006-1A, Cl. B | | 5.89 | | 7/13/41 | | 822,873 a,b | | 617,155 |
| Centex Home Equity, | | | | | | | | |
| Ser. 2003-B, Cl. AF4 | | 3.24 | | 2/25/32 | | 265,600 a | | 261,832 |
| Centex Home Equity, | | | | | | | | |
| Ser. 2005-D, Cl. M4 | | 5.93 | | 10/25/35 | | 1,000,000 a | | 916,107 |
| Fremont Home Loan Trust, | | | | | | | | |
| Ser. 2006-1, Cl. M1 | | 5.64 | | 4/25/36 | | 1,000,000 a | | 967,845 |
| Home Equity Asset Trust, | | | | | | | | |
| Ser. 2005-9, Cl. M7 | | 6.52 | | 4/25/36 | | 450,000 a | | 360,087 |
| Nomura Home Equity Loan, | | | | | | | | |
| Ser. 2006-WF1, Cl. M7 | | 6.22 | | 3/25/36 | | 500,000 a | | 395,736 |
The Fund 9
STATEMENT OF INVESTMENTS (continued)
| | | Coupon | | Maturity | | Principal | | |
| Bonds and Notes (continued) | | Rate (%) | | Date | | Amount ($) | | Value ($) |
| |
| |
| |
| |
|
| Asset-Backed Ctfs./ | | | | | | | | |
| Home Equity Loans (continued) | | | | | | | | |
| Option One Mortgage Loan Trust, | | | | | | | | |
| Ser. 2005-4, Cl. M5 | | 5.95 | | 11/25/35 | | 500,000 a | | 440,587 |
| Option One Mortgage Loan Trust, | | | | | | | | |
| Ser. 2003-5, Cl. M1 | | 5.97 | | 8/25/33 | | 806,366 a | | 802,467 |
| Popular ABS Mortgage Pass-Through | | | | | | |
| Trust, Ser. 2004-4, Cl. AF4 | | 4.63 | | 9/25/34 | | 1,000,000 | | 977,549 |
| Renaissance Home Equity Loan | | | | | | | | |
| Trust, Ser. 2006-3, Cl. AF2 | | 5.58 | | 11/25/36 | | 500,000 a | | 498,802 |
| Renaissance Home Equity Loan | | | | | | | | |
| Trust, Ser. 2007-2, Cl. AF1 | | 5.89 | | 6/25/37 | | 736,631 a | | 735,985 |
| Residential Asset Securities, | | | | | | | | |
| Ser. 2005-KS4, Cl. M2 | | 5.90 | | 5/25/35 | | 1,500,000 a | | 1,405,107 |
| Residential Funding Mortgage | | | | | | | | |
| Securities II, Ser. 2006-HSA2, | | | | | | | | |
| Cl. AI3 | | 5.55 | | 3/25/36 | | 600,000 a | | 590,597 |
| | | | | | | | | 12,595,446 |
| Asset-Backed Ctfs./ | | | | | | | | |
| Manufactured Housing—.9% | | | | | | | | |
| Green Tree Financial, | | | | | | | | |
| Ser. 1994-7, Cl. M1 | | 9.25 | | 3/15/20 | | 500,988 | | 517,740 |
| Automobile Manufacturers—1.8% | | | | | | | | |
| DaimlerChrysler N.A. Holding, | | | | | | | | |
| Gtd. Notes | | 5.79 | | 3/13/09 | | 1,000,000 a | | 1,002,463 |
| Banks—3.6% | | | | | | | | |
| City National Bank/Beverly Hills | | | | | | | | |
| CA, Sub. Notes | | 6.38 | | 1/15/08 | | 721,000 | | 722,903 |
| ICICI Bank, | | | | | | | | |
| Bonds | | 5.90 | | 1/12/10 | | 300,000 a,b | | 301,414 |
| Landsbanki Islands, | | | | | | | | |
| Sr. Notes | | 6.06 | | 8/25/09 | | 1,000,000 a,b | | 1,010,633 |
| | | | | | | | | 2,034,950 |
| Building Materials-Cement—1.3% | | | | | | |
| Martin Marietta Material, | | | | | | | | |
| Sr. Unsub. Notes | | 5.51 | | 4/30/10 | | 750,000 a | | 750,334 |
| Diversified Financial Services—9.5% | | | | | | |
| Capital One Bank, | | | | | | | | |
| Notes | | 4.88 | | 5/15/08 | | 400,000 | | 397,759 |
| Capmark Financial Group, | | | | | | | | |
| Gtd. Notes | | 6.01 | | 5/10/10 | | 750,000 a,b | | 752,028 |
10
| | | Coupon | | Maturity | | Principal | | |
| Bonds and Notes (continued) | | Rate (%) | | Date | | Amount ($) | | Value ($) |
| |
| |
| |
| |
|
| Diversified Financial Services (continued) | | | | | | |
| Discover Financial Services, | | | | | | | | |
| Bonds | | 5.89 | | 6/11/10 | | 750,000 a,b | | 750,696 |
| Kaupthing Bank, | | | | | | | | |
| Sr. Notes | | 6.06 | | 1/15/10 | | 1,000,000 a,b | | 1,010,860 |
| Lehman Brothers Holdings, | | | | | | | | |
| Sr. Notes | | 5.59 | | 1/12/12 | | 700,000 a | | 686,498 |
| Merrill Lynch, | | | | | | | | |
| Sr. Unscd. Notes | | 5.59 | | 6/5/12 | | 600,000 a | | 588,518 |
| Textron Financial, | | | | | | | | |
| Sr. Unscd. Notes | | 4.13 | | 3/3/08 | | 1,255,000 c | | 1,246,853 |
| | | | | | | | | 5,433,212 |
| Foreign/Governmental—2.6% | | | | | | | | |
| United Mexican States, | | | | | | | | |
| Notes | | 6.06 | | 1/13/09 | | 1,500,000 a | | 1,507,875 |
| Real Estate Investment Trusts—2.5% | | | | | | |
| Duke Realty, | | | | | | | | |
| Notes | | 6.75 | | 5/30/08 | | 450,000 | | 452,573 |
| HRPT Properties Trust, | | | | | | | | |
| Sr. Unscd. Notes | | 5.96 | | 3/16/11 | | 500,000 a | | 500,211 |
| Istar Financial, | | | | | | | | |
| Sr. Unscd. Notes | | 5.71 | | 3/9/10 | | 500,000 a | | 500,978 |
| | | | | | | | | 1,453,762 |
| Residential Mortgage | | | | | | | | |
| Pass-Through Ctfs.—17.1% | | | | | | | | |
| Adjustable Rate Mortgage Trust, | | | | | | | | |
| Ser. 2006-2, Cl. 6A1 | | 5.49 | | 5/25/36 | | 417,292 a | | 416,013 |
| Adjustable Rate Mortgage Trust, | | | | | | | | |
| Ser. 2005-3, Cl. 8A2 | | 5.56 | | 7/25/35 | | 488,651 a | | 489,744 |
| Adjustable Rate Mortgage Trust, | | | | | | | | |
| Ser. 2005-7, Cl. 7A21 | | 5.57 | | 10/25/35 | | 320,521 a | | 321,290 |
| Adjustable Rate Mortgage Trust, | | | | | | | | |
| Ser. 2005-9, Cl. 5A1 | | 5.59 | | 11/25/35 | | 620,815 a | | 622,348 |
| Adjustable Rate Mortgage Trust, | | | | | | | | |
| Ser. 2006-1, Cl. 6A2 | | 5.61 | | 3/25/36 | | 560,035 a | | 560,551 |
| American General Mortgage Loan | | | | | | | | |
| Trust, Ser. 2006-1, Cl. A1 | | 5.75 | | 12/25/35 | | 409,689 a,b | | 408,792 |
| Bear Stearns Alt-A Trust, | | | | | | | | |
| Ser. 2005-1, Cl. A1 | | 5.60 | | 1/25/35 | | 372,125 a | | 372,851 |
| Countrywide Alternative Loan | | | | | | | | |
| Trust, Ser. 2005-65CB, Cl. 1A5 | | 5.50 | | 1/25/36 | | 1,950,712 a | | 1,906,443 |
The Fund 11
STATEMENT OF INVESTMENTS (continued)
| | | Coupon | | Maturity | | Principal | | |
| Bonds and Notes (continued) | | Rate (%) | | Date | | Amount ($) | | Value ($) |
| |
| |
| |
| |
|
| Residential Mortgage | | | | | | | | |
| Pass-Through Ctfs. (continued) | | | | | | | | |
| Countrywide Alternative Loan | | | | | | | | |
| Trust, Ser. 2006-6CB, Cl. 1A2 | | 5.66 | | 5/25/36 | | 779,909 a | | 777,957 |
| Countrywide Alternative Loan | | | | | | | | |
| Trust, Ser. 2004-7T1, Cl. A1 | | 5.75 | | 6/25/34 | | 862,813 | | 860,278 |
| Countrywide Home Loan Mortgage | | | | | | | | |
| Pass-Through Trust, | | | | | | | | |
| Ser. 2004-16, Cl. 1A1 | | 5.72 | | 9/25/34 | | 460,712 a | | 461,361 |
| Countrywide Home Loan Mortgage | | | | | | | | |
| Pass-Through Trust, | | | | | | | | |
| Ser. 2004-21, Cl. A8 | | 8.00 | | 11/25/34 | | 613,583 | | 618,565 |
| GSR Mortgage Loan Trust, | | | | | | | | |
| Ser. 2004-15F, Cl. 2A2 | | 5.00 | | 12/25/34 | | 648,459 | | 628,739 |
| Impac CMB Trust, | | | | | | | | |
| Ser. 2005-4, Ser. 1M3 | | 5.80 | | 5/25/35 | | 290,350 a | | 290,363 |
| Impac Secured Assets CMN Owner | | | | | | | | |
| Trust, Ser. 2006-1, Cl. 2A1 | | 5.67 | | 5/25/36 | | 709,845 a | | 711,360 |
| Opteum Mortgage Acceptance, | | | | | | | | |
| Ser. 2005-5, Cl. 2A1A | | 5.47 | | 12/25/35 | | 346,966 | | 345,600 |
| | | | | | | | | 9,792,255 |
| Telecommunications—.9% | | | | | | | | |
| Telecom Italia Capital, | | | | | | | | |
| Gtd. Notes | | 5.97 | | 7/18/11 | | 500,000 a | | 502,399 |
| U.S. Government Agencies/ | | | | | | | | |
| Mortgage-Backed—8.2% | | | | | | | | |
| Federal Home Loan Mortgage Corp.: | | | | | | | | |
| Multiclass Mortgage Participation Ctfs., | | | | | | |
| Ser. 2890, Cl. PA, 5.00%, 9/15/24 | | | | 1,569,152 | | 1,560,789 |
| Multiclass Mortgage Participation Ctfs., | | | | | | |
| Ser. 2503, Cl. VD, 6.00%, 2/15/21 | | | | 2,192,343 | | 2,200,937 |
| Government National Mortgage Association I | | | | | | |
| Ser. 2005-50, Cl. A, 4.02%, 10/16/26 | | | | 943,560 | | 925,471 |
| | | | | | | | | 4,687,197 |
| U.S. Government Securities—.7% | | | | | | | | |
| U.S. Treasury Inflation Protected | | | | | | | | |
| Securities, 3.63%, 1/15/08 | | | | | | 386,076 c,d,e | | 384,944 |
| Total Bonds and Notes | | | | | | | | |
| (cost $50,993,664) | | | | | | | | 50,008,881 |
| | | Principal | | |
| Short-Term Investments—.6% | | Amount ($) | | Value ($) |
| |
| |
|
| Commerical Paper: | | | | |
| Cox Enterprises, | | | | |
| 5.60%, 8/15/07 | | | | |
| (cost $350,000) | | 350,000 a,b | | 350,000 |
| |
| |
|
| |
| Other Investment—10.1% | | Shares | | Value ($) |
| |
| |
|
| Registered Investment Company; | | | | |
| Dreyfus Institutional Preferred | | | | |
| Plus Money Market Fund | | | | |
| (cost $5,770,000) | | 5,770,000 f | | 5,770,000 |
| |
| |
|
| |
| Investment of Cash Collateral | | | | |
| for Securities Loaned—1.9% | | | | |
| |
| |
|
| Registered Investment Company; | | | | |
| Dreyfus Institutional Cash | | | | |
| Advantage Plus Fund | | | | |
| (cost $1,066,050) | | 1,066,050 f | | 1,066,050 |
| |
| |
|
| |
| Total Investments (cost $58,179,714) | | 100.0% | | 57,194,931 |
| Cash and Receivables (Net) | | .0% | | 25,739 |
| Net Assets | | 100.0% | | 57,220,670 |
| a Variable rate security—interest rate subject to periodic change. |
| b Securities exempt from registration under Rule 144A of the Securities Act of 1933.These securities may be resold in |
| transactions exempt from registration, normally to qualified institutional buyers. At July 31, 2007, these securities |
| amounted to $5,201,578 or 9.1% of net assets. |
| c All or a portion of these securities are on loan. At July 31, 2007, the total market value of the fund's securities on |
| loan is $1,220,753 and the total market value of the collateral held by the fund is $1,262,550, consisting of cash |
| collateral of $1,066,050 and Letters of Credit valued at $196,500. |
| d Principal amount for accrual purposes is periodically adjusted based on changes in the Consumer Price Index. |
| e All or partially held by a broker as collateral for open financial futures positions. |
| f Investment in affiliated money market mutual fund. |
| Portfolio Summary (Unaudited) † | | | | |
| |
| Value (%) | | | | Value (%) |
| |
| |
|
| Asset/Mortgage-Backed | | 56.3 | | U.S. Government & Agencies | | 8.9 |
| Corporate Bonds | | 19.6 | | Foreign/Governmental | | 2.6 |
| Short-Term/Money Market Investments | | 12.6 | | | | 100.0 |
| |
| † Based on net assets. | | | | | | |
| See notes to financial statements. | | | | | | |
The Fund 13
| STATEMENT OF FINANCIAL FUTURES |
| July 31, 2007 |
| | | | | | | | | Unrealized |
| | | | | Market Value | | | | Appreciation |
| | | | | Covered by | | | | (Depreciation) |
| | | Contracts | | Contracts ($) | | Expiration | | at 7/31/2007 ($) |
| |
| |
| |
| |
|
| Financial Futures Long | | | | | | | | |
| 90 Day Euro Dollar | | 96 | | 22,807,200 | | June 2009 | | 33,181 |
| 90 Day Euro Dollar | | 96 | | 22,777,200 | | December 2007 | | 31,597 |
| Financial Futures Short | | | | | | | | |
| 90 Day Euro Dollar | | 132 | | (31,404,450) | | September 2008 | | (66,370) |
| | | | | | | | | (1,592) |
See notes to financial statements.
| STATEMENT OF ASSETS AND LIABILITIES |
| July 31, 2007 |
| | | Cost | | Value |
| |
| |
|
| Assets ($): | | | | |
| Investment in securities-See Statement of Investments | | |
| (including securities on loan, valued at $1,220,753)—Note 1(b): | | |
| Unaffiliated issuers | | 51,343,664 | | 50,358,881 |
| Affiliated issuers | | 6,836,050 | | 6,836,050 |
| Cash | | | | 1,004,125 |
| Dividends and interest receivable | | | | 217,918 |
| Receivable for futures variation margin—Note 4 | | 1,998 |
| Prepaid expenses | | | | 8,758 |
| | | | | 58,427,730 |
| |
| |
|
| Liabilities ($): | | | | |
| Due to The Dreyfus Corporation and affiliates—Note 3(c) | | 33,698 |
| Liability for securities on loan—Note 1(b) | | 1,066,050 |
| Payable for shares of Common Stock redeemed | | 52,935 |
| Accrued expenses | | | | 54,377 |
| | | | | 1,207,060 |
| |
| |
|
| Net Assets ($) | | | | 57,220,670 |
| |
| |
|
| Composition of Net Assets ($): | | | | |
| Paid-in capital | | | | 72,271,855 |
| Accumulated undistributed investment income—net | | 10,283 |
| Accumulated net realized gain (loss) on investments | | (14,075,093) |
| Accumulated net unrealized appreciation (depreciation) | | |
| on investments [including ($1,592) net unrealized | | |
| (depreciation) on financial futures] | | (986,375) |
| |
|
| Net Assets ($) | | | | 57,220,670 |
| |
| |
|
| |
| |
| Net Asset Value Per Share | | | | |
| | | Class B | | Class D |
| |
| |
|
| Net Assets ($) | | 1,630,061 | | 55,590,609 |
| Shares Outstanding | | 857,107 | | 29,296,545 |
| |
| |
|
| Net Asset Value Per Share ($) | | 1.90 | | 1.90 |
See notes to financial statements.
The Fund 15
STATEMENT OF OPERATIONS
Year Ended July 31, 2007
|
| Investment Income ($): | | |
| Income: | | |
| Interest | | 3,680,505 |
| Dividends; | | |
| Affiliated issuers | | 89,284 |
| Income from securities lending | | 624 |
| Total Income | | 3,770,413 |
| Expenses: | | |
| Management fee—Note 3(a) | | 350,533 |
| Shareholder servicing costs—Note 3(c) | | 226,694 |
| Registration fees | | 30,659 |
| Professional fees | | 27,952 |
| Distribution fees—Note 3(b) | | 17,354 |
| Prospectus and shareholders’ reports | | 14,216 |
| Custodian fees—Note 3(c) | | 8,205 |
| Interest expense—Note 2 | | 1,489 |
| Directors’ fees and expenses—Note 3(d) | | 1,109 |
| Miscellaneous | | 18,377 |
| Total Expenses | | 696,588 |
| Less—reduction in management fee | | |
| due to undertaking—Note 3(a) | | (116,892) |
| Less—reduction in custody fees | | |
| due to earnings credits—Note 1(b) | | (2,605) |
| Net Expenses | | 577,091 |
| Investment Income—Net | | 3,193,322 |
| |
|
| Realized and Unrealized Gain (Loss) on Investments—Note 4 ($): |
| Net realized gain (loss) on investments | | (461,676) |
| Net realized gain (loss) on financial futures | | (77,384) |
| Net Realized Gain (Loss) | | (539,060) |
| Net unrealized appreciation (depreciation) on investments | | |
| (including $34,736 net unrealized appreciation on financial futures) | | (362,303) |
| Net Realized and Unrealized Gain (Loss) on Investments | | (901,363) |
| Net Increase in Net Assets Resulting from Operations | | 2,291,959 |
See notes to financial statements.
STATEMENT OF CHANGES IN NET ASSETS
| | | | | Year Ended July 31, |
| |
| |
|
| | | 2007 | | 2006 |
| |
| |
|
| Operations ($): | | | | |
| Investment income—net | | 3,193,322 | | 4,371,375 |
| Net realized gain (loss) on investments | | (539,060) | | (268,618) |
| Net unrealized appreciation | | | | |
| (depreciation) on investments | | (362,303) | | 36,841 |
| Net Increase (Decrease) in Net Assets | | | | |
| Resulting from Operations | | 2,291,959 | | 4,139,598 |
| |
| |
|
| Dividends to Shareholders from ($): | | | | |
| Investment income—net: | | | | |
| Class A | | — | | (106,547) |
| Class B | | (92,373) | | (115,128) |
| Class D | | (3,211,456) | | (4,034,586) |
| Class P | | — | | (536,093) |
| Class S | | — | | (10,293) |
| Total Dividends | | (3,303,829) | | (4,802,647) |
| |
| |
|
| Capital Stock Transactions ($): | | | | |
| Net proceeds from shares sold: | | | | |
| Class A | | — | | 549,470 |
| Class B | | 87,607 | | 712,886 |
| Class D | | 7,922,936 | | 38,295,756 |
| Class P | | — | | 3,085,423 |
| Class S | | — | | 380 |
| Dividends reinvested: | | | | |
| Class A | | — | | 80,486 |
| Class B | | 84,913 | | 99,964 |
| Class D | | 2,920,713 | | 3,725,662 |
| Class P | | — | | 439,156 |
| Class S | | — | | 8,576 |
| Cost of shares redeemed: | | | | |
| Class A | | — | | (5,927,520) |
| Class B | | (1,514,555) | | (2,016,460) |
| Class D | | (40,590,402) | | (76,165,279) |
| Class P | | — | | (29,123,051) |
| Class S | | — | | (530,414) |
| Increase (Decrease) in Net Assets | | | | |
| from Capital Stock Transactions | | (31,088,788) | | (66,764,965) |
| Total Increase (Decrease) in Net Assets | | (32,100,658) | | (67,428,014) |
| |
| |
|
| Net Assets ($): | | | | |
| Beginning of Period | | 89,321,328 | | 156,749,342 |
| End of Period | | 57,220,670 | | 89,321,328 |
| Undistributed (distributions in excess of) | | | | |
| investment income—net | | 10,283 | | (33,235) |
The Fund 17
STATEMENT OF CHANGES IN NET ASSETS (continued)
| | | | | Year Ended July 31, |
| |
| |
|
| | | 2007 | | 2006 |
| |
| |
|
| Capital Share Transactions: | | | | |
| Class A a | | | | |
| Shares sold | | — | | 284,668 |
| Shares issued for dividends reinvested | | — | | 41,186 |
| Shares redeemed | | — | | (3,038,200) |
| Net Increase (Decrease) in Shares Outstanding | | — | | (2,712,346) |
| |
| |
|
| Class B a | | | | |
| Shares sold | | 45,541 | | 367,840 |
| Shares issued for dividends reinvested | | 43,961 | | 51,553 |
| Shares redeemed | | (783,909) | | (1,039,351) |
| Net Increase (Decrease) in Shares Outstanding | | (694,407) | | (619,958) |
| |
| |
|
| Class D a | | | | |
| Shares sold | | 4,118,743 | | 19,819,432 |
| Shares issued for dividends reinvested | | 1,516,195 | | 1,926,483 |
| Shares redeemed | | (21,057,779) | | (39,357,687) |
| Net Increase (Decrease) in Shares Outstanding | | (15,422,841) | | (17,611,772) |
| |
| |
|
| Class P | | | | |
| Shares sold | | — | | 1,577,736 |
| Shares issued for dividends reinvested | | — | | 226,020 |
| Shares redeemed | | — | | (15,005,167) |
| Net Increase (Decrease) in Shares Outstanding | | — | | (13,201,411) |
| |
| |
|
| Class S | | | | |
| Shares issued for dividends reinvested | | — | | 4,415 |
| Shares redeemed | | — | | (273,189) |
| Net Increase (Decrease) in Shares Outstanding | | — | | (268,774) |
| a | | During the period ended July 31, 2007, 192,127 Class B shares representing $370,144 were automatically |
| | | converted to 192,215 Class D shares and during the period ended July 31, 2006, 224,764 Class B shares |
| | | representing $436,049 were automatically converted to 223,711 shares consisting of 212,601 Class A shares until |
| | | March 24, 2006 and 11,110 Class D shares. |
| See notes to financial statements. |
FINANCIAL HIGHLIGHTS
The following tables describe the performance for each share class for the fiscal periods indicated.All information (except portfolio turnover rate) reflects financial results for a single fund share.Total return shows how much your investment in the fund would have increased (or decreased) during each period, assuming you had reinvested all dividends and distributions.These figures have been derived from the fund’s financial statements.
| | | | | Year Ended July 31, | | |
| |
| |
| |
|
| Class B Shares | | 2007 | | 2006 | | 2005 | | 2004 | | 2003 a |
| |
| |
| |
| |
| |
|
| Per Share Data ($): | | | | | | | | | | |
| Net asset value, beginning of period | | 1.94 | | 1.95 | | 1.96 | | 1.98 | | 2.00 |
| Investment Operations: | | | | | | | | | | |
| Investment income—net b | | .07 | | .06 | | .03 | | .02 | | .01 |
| Net realized and unrealized | | | | | | | | | | |
| gain (loss) on investments | | (.03) | | .00c | | .00c | | (.02) | | .00c |
| Total from Investment Operations | | .04 | | .06 | | .03 | | — | | .01 |
| Distributions: | | | | | | | | | | |
| Dividends from investment income—net | | (.08) | | (.07) | | (.04) | | (.02) | | (.03) |
| Net asset value, end of period | | 1.90 | | 1.94 | | 1.95 | | 1.96 | | 1.98 |
| |
| |
| |
| |
| |
|
| Total Return (%) d | | 1.93 | | 2.89 | | 1.37 | | .23 | | .29e |
| |
| |
| |
| |
| |
|
| Ratios/Supplemental Data (%): | | | | | | | | | | |
| Ratio of total expenses | | | | | | | | | | |
| to average net assets | | 1.74 | | 1.73 | | 1.66 | | 1.64 | | 1.74f |
| Ratio of net expenses | | | | | | | | | | |
| to average net assets | | 1.55 | | 1.55 | | 1.54 | | 1.55 | | 1.55f |
| Ratio of net investment income | | | | | | | | | | |
| to average net assets | | 3.84 | | 2.93 | | 1.42 | | .77 | | .74f |
| Portfolio Turnover Rate | | 14.71 | | 48.35 | | 211.75 | | 309.23 | | 371.43 |
| |
| |
| |
| |
| |
|
| Net Assets, end of period ($ x 1,000) | | 1,630 | | 3,002 | | 4,225 | | 6,343 | | 5,290 |
| a | | From November 1, 2002 (commencement of initial offering) to July 31, 2003. |
| b | | Based on average shares outstanding at each month end. |
| c | | Amount represents less than $.01 per share. |
| d | | Exclusive of sales charge. |
| e | | Not annualized. |
| f | | Annualized. |
| See notes to financial statements. |
The Fund 19
FINANCIAL HIGHLIGHTS (continued)
| | | | | Year Ended July 31, | | |
| |
| |
| |
|
| Class D Shares | | 2007 | | 2006 | | 2005 | | 2004 | | 2003 a |
| |
| |
| |
| |
| |
|
| Per Share Data ($): | | | | | | | | | | |
| Net asset value, beginning of period | | 1.93 | | 1.94 | | 1.95 | | 1.98 | | 2.01 |
| Investment Operations: | | | | | | | | | | |
| Investment income—net b | | .09 | | .07 | | .04 | | .03 | | .04 |
| Net realized and unrealized | | | | | | | | | | |
| gain (loss) on investments | | (.03) | | .00c | | .00c | | (.02) | | (.02) |
| Total from Investment Operations | | .06 | | .07 | | .04 | | .01 | | .02 |
| Distributions: | | | | | | | | | | |
| Dividends from investment income—net | | (.09) | | (.08) | | (.05) | | (.04) | | (.05) |
| Net asset value, end of period | | 1.90 | | 1.93 | | 1.94 | | 1.95 | | 1.98 |
| |
| |
| |
| |
| |
|
| Total Return (%) | | 3.23 | | 3.66 | | 2.13 | | .48 | | 1.16 |
| |
| |
| |
| |
| |
|
| Ratios/Supplemental Data (%): | | | | | | | | | | |
| Ratio of total expenses | | | | | | | | | | |
| to average net assets | | .97 | | .97 | | .90 | | .88 | | .85 |
| Ratio of net expenses | | | | | | | | | | |
| to average net assets | | .80 | | .80 | | .80 | | .80 | | .80 |
| Ratio of net investment income | | | | | | | | | | |
| to average net assets | | 4.58 | | 3.70 | | 2.19 | | 1.60 | | 2.10 |
| Portfolio Turnover Rate | | 14.71 | | 48.35 | | 211.75 | | 309.23 | | 371.43 |
| |
| |
| |
| |
| |
|
| Net Assets, end of period ($ x 1,000) | | 55,591 | | 86,319 | | 121,006 | | 177,228 | | 313,644 |
| a | | The fund commenced offering five classes of shares on November 1, 2002.The existing shares were redesignated |
| | | Class D shares. |
| b | | Based on average shares outstanding at each month end. |
| c | | Amount represents less than $.01 per share. |
| See notes to financial statements. |
NOTES TO FINANCIAL STATEMENTS
NOTE 1—Significant Accounting Policies:
Dreyfus Premier Yield Advantage Fund (the “fund”) is a separate non-diversified series of Dreyfus Investment Grade Funds, Inc. (the “Company”), which is registered under the Investment Company Act of 1940, as amended (the “Act”), as an open-end management investment company and operates as a series company currently offering four series, including the fund.The fund’s investment objective is to provide investors with as high a level of current income as is consistent with the preservation of capital with minimal changes in share price. The Dreyfus Corporation (the “Manager” or “Dreyfus”) serves as the fund’s investment adviser. During the reporting period, the Manager was a wholly-owned subsidiary of Mellon Financial Corporation (“Mellon Financial”).
On July 1, 2007, Mellon Financial and The Bank of New York Company, Inc. merged, forming The Bank of New York Mellon Corporation. As part of this transaction, Dreyfus became a wholly-owned subsidiary of The Bank of New York Mellon Corporation.
During the reporting period, Dreyfus Service Corporation (the “Distributor”), a wholly-owned subsidiary of the Manager, served as the distributor of the fund’s shares. Effective June 30, 2007, the Distributor became known as MBSC Securities Corporation. The fund is authorized to issue 550 million shares of $.001 par value Common Stock.The fund currently offers two classes of shares: Class B (50 million shares authorized) and Class D (500 million shares authorized). Class B shares are subject to a contingent deferred sales charge (“CDSC”) imposed on Class B share redemptions made within six years of purchase and automatically convert to Class D shares after six years.The fund no longer offers Class B shares, except in connection with dividend reinvestment and permitted exchanges of Class B shares. Class D shares are sold at net asset value per share only to institutional investors. Other differences between the classes include the services offered to and the expenses
The Fund 21
NOTES TO FINANCIAL STATEMENTS (continued)
borne by each class and certain voting rights. Income, expenses (other than expenses attributable to a specific class), and realized and unrealized gains or losses on investments are allocated to each class of shares based on its relative net assets.
The Company accounts separately for the assets, liabilities and operations of each series. Expenses directly attributable to each series are charged to that series’ operations; expenses which are applicable to all series are allocated among them on a pro rata basis.
The fund’s financial statements are prepared in accordance with U.S. generally accepted accounting principles, which may require the use of management estimates and assumptions. Actual results could differ from those estimates.
The fund enters into contracts that contain a variety of indemnifications. The fund’s maximum exposure under these arrangements is unknown.The fund does not anticipate recognizing any loss related to these arrangements.
(a) Portfolio valuation: Investments in securities excluding short-term investments (other than U.S.Treasury Bills), financial futures and options are valued each business day by an independent pricing service (the “Service”) approved by the Board of Directors. Investments for which quoted bid prices are readily available and are representative of the bid side of the market in the judgment of the Service are valued at the mean between the quoted bid prices (as obtained by the Service from dealers in such securities) and asked prices (as calculated by the Service based upon its evaluation of the market for such securities). Other investments (which constitute a majority of the portfolio securities) are valued as determined by the Service, based on methods which include consideration of: yields or prices of securities of comparable quality, coupon, maturity and type; indications as to values from dealers; and general market conditions. Restricted securities, as well as securities or other assets for which recent market quotations are not readily available, that are not valued by a pricing service approved by the Board of Directors, or are determined by the fund not to reflect
accurately fair value, are valued at fair value as determined in good faith under the direction of the Board of Directors. The factors that may be considered when fair valuing a security include fundamental analytical data, the nature and duration of restrictions on disposition, an evaluation of the forces that influence the market in which the securities are purchased and sold and public trading in similar securities of the issuer or comparable issuers. Short-term investments, excluding U.S. Treasury Bills, are carried at amortized cost, which approximates value. Registered open-end investment companies that are not traded on an exchange are valued at their net asset value. Financial futures and options, which are traded on an exchange, are valued at the last sales price on the securities exchange on which such securities are primarily traded or at the last sales price on the national securities market on each business day. Options traded over-the-counter are priced at the mean between the bid and asked price.
On September 20, 2006, the Financial Accounting Standards Board (FASB) released Statement of Financial Accounting Standards No. 157 “Fair Value Measurements” (“FAS 157”). FAS 157 establishes an authoritative definition of fair value, sets out a framework for measuring fair value, and requires additional disclosures about fair-value measurements. The application of FAS 157 is required for fiscal years beginning after November 15, 2007 and interim periods within those fiscal years. Management does not believe that the application of this standard will have a material impact on the financial statements of the fund.
(b) Securities transactions and investment income: Securities transactions are recorded on a trade date basis. Realized gain and loss from securities transactions are recorded on the identified cost basis. Dividend income is recognized on the ex-dividend date and interest income, including, where applicable, accretion of discount and amortization of premium on investments, is recognized on the accrual basis.
The fund has an arrangement with the custodian bank whereby the fund receives earnings credits from the custodian when positive cash balances are maintained, which are used to offset custody fees. For
The Fund 23
NOTES TO FINANCIAL STATEMENTS (continued)
financial reporting purposes, the fund includes net earnings credits as an expense offset in the Statement of Operations.
Pursuant to a securities lending agreement with Mellon Bank, N.A., an affiliate of the Manager, the fund may lend securities to qualified institutions. It is the fund’s policy, that at origination, all loans are secured by collateral of at least 102% of the value of U.S. securities loaned and 105% of the value of foreign securities loaned. Collateral equivalent to at least 100% of the market value of securities on loan is maintained at all times. Cash collateral is invested in certain money market mutual funds managed by the Manager.The fund is entitled to receive all income on securities loaned, in addition to income earned as a result of the lending transaction.Although each security loaned is fully collateralized, the fund bears the risk of delay in recovery of, or loss of rights in, the securities loaned should a borrower fail to return the securities in a timely manner.
(c) Affiliated issuers: Investments in other investment companies advised by the Manager are defined as “affiliated” in the Act.
(d) Dividends to shareholders: It is the policy of the fund to declare dividends daily from investment income-net. Such dividends are paid monthly. Dividends from net realized capital gain, if any, are normally declared and paid annually, but the fund may make distributions on a more frequent basis to comply with the distribution requirements of the Internal Revenue Code of 1986, as amended (the “Code”).To the extent that net realized capital gain can be offset by capital loss carryovers, it is the policy of the fund not to distribute such gain. Income and capital gain distributions are determined in accordance with income tax regulations, which may differ from U.S. generally accepted accounting principles.
(e) Federal income taxes: It is the policy of the fund to continue to qualify as a regulated investment company, if such qualification is in the best interests of its shareholders, by complying with the applicable provisions of the Code, and to make distributions of taxable income sufficient to relieve it from substantially all federal income and excise taxes.
The FASB released FASB Interpretation No. 48 “Accounting for Uncertainty in Income Taxes” (FIN 48). FIN 48 provides guidance for how uncertain tax positions should be recognized, measured, presented and disclosed in the financial statements. FIN 48 requires the evaluation of tax positions taken or expected to be taken in the course of preparing the fund’s tax returns to determine whether the tax positions are “more-likely-than-not” of being sustained by the applicable tax authority. Tax positions not deemed to meet the more-likely-than-not threshold would be recorded as a tax benefit or expense in the current year.Adoption of FIN 48 is required for fiscal years beginning after December 15, 2006 and is to be applied to all open tax years as of the effective date. Management does not believe that the application of this standard will have a material impact on the financial statements of the fund.
At July 31, 2007, the components of accumulated earnings on a tax basis were as follows: undistributed ordinary income $42,421, accumulated capital losses $13,484,033 and unrealized depreciation $1,016,922. In addition, the fund had $592,651 of capital losses realized after October 31, 2006 which were deferred for tax purposes to the first day of the following fiscal year.
The accumulated capital loss carryover is available to be applied against future net securities profits, if any, relized subsequent to July 31, 2007. If not applied, $3,308,447 of the carryover expires in fiscal 2011, $1,633,108 expires in fiscal 2012, $7,636,137 expires in fiscal 2013, $175,781 expires in fiscal 2014 and $730,560 expires in fiscal 2015.
The tax character of distributions paid to shareholders during the fiscal year ended July 31, 2007 and July 31, 2006, were as follows: ordinary income $3,303,829 and $4,802,647, respectively.
During the period ended July 31, 2007, as a result of permanent book to tax differences, primarily due to the tax treatment for paydown gains and losses on mortgage backed securities and sales treatment for treasury inflation protected securities, the fund increased accumulated undistributed investment income-net by $154,025 and decreased accu-
The Fund 25
NOTES TO FINANCIAL STATEMENTS (continued)
mulated net realized gain (loss) on investments by the same amount. Net assets were not affected by this reclassification.
NOTE 2—Bank Line of Credit:
The fund participates with other Dreyfus-managed funds in a $100 million unsecured line of credit primarily to be utilized for temporary or emergency purposes, including the financing of redemptions. Interest is charged to the fund based on prevailing market rates in effect at the time of borrowing.
The average daily amount of borrowings outstanding under the line of credit during the period ended July 31,2007,was approximately $25,658, with a related weighted average annualized interest rate of 5.80% .
NOTE 3—Management Fee and Other Transactions With Affiliates:
(a) Pursuant to a management agreement (“Agreement”) with the Manager, the management fee is computed at the annual rate of .50% of the value of the fund’s average daily net assets and is payable monthly. The Manager has undertaken from August 1, 2006 through July 31, 2008, that, if the aggregate expenses of the fund, exclusive of taxes, brokerage fees, Rule 12b-1 distribution plan fees, shareholder services plan fees and extraordinary expenses, exceed an annual rate of .55% of the value of the fund’s average daily net assets, the fund may deduct from the payment to be made to the Manager under the Agreement, or the Manager will bear, such excess expense.The reduction in management fee, pursuant to the undertaking, amounted to $116,892 during the period ended July 31, 2007.
During the period ended July 31, 2007, the Distributor retained $12,977 from CDSC on redemptions of the fund’s Class B shares.
(b) Under the Distribution Plan (the “Plan”) adopted pursuant to Rule 12b-1 under the Act, Class B shares pay the Distributor for distributing its shares at an annual rate of .75% of the value of the average daily net assets of Class B shares. During the period ended January 31, 2007, Class B shares were charged $17,354 pursuant to the Plan.
(c) Under the Shareholder Services Plan, Class B and Class D shares pay the Distributor at an annual rate of .25% of the value of their average daily net assets for the provision of certain services. The services provided may include personal services relating to shareholder accounts, such as answering shareholder inquiries regarding Class B and Class D shares and providing reports and other information, and services related to the maintenance of shareholder accounts.The Distributor may make payments to Service Agents (a securities dealer, financial institution or other industry professional) in respect of these services.The Distributor determines the amounts to be paid to Service Agents. During the period ended July 31, 2007, Class B and Class D shares were charged $5,785 and $169,482, respectively, pursuant to the Shareholder Services Plan.
The fund compensates Dreyfus Transfer, Inc., a wholly-owned subsidiary of the Manager, under a transfer agency agreement for providing personnel and facilities to perform transfer agency services for the fund. During the period ended July 31, 2007, the fund was charged $53,764 pursuant to the transfer agency agreement.
The fund compensates Mellon Bank, N.A., an affiliate of the Manager, under a custody agreement for providing custodial services for the fund. During the period ended July 31, 2007, the fund was charged $8,205 pursuant to the custody agreement.
During the period ended July 31, 2007, the fund was charged $4,499 for services performed by the Chief Compliance Officer.
The components of “Due to The Dreyfus Corporation and affiliates” in the Statement of Assets and Liabilities consist of: management fees $24,488 Rule 12b-1 distribution plan fees $1,041, shareholder services plan fees $12,244, custodian fees $2,298, chief compliance officer fees $1,607 and transfer agency per account fees $5,341, which are offset against an expense reimbursement currently in effect in the amount of $13,321.
(d) Each Board member also serves as a Board member of other funds within the Dreyfus complex. Annual retainer fees and attendance fees are allocated to each fund based on net assets.
The Fund 27
NOTES TO FINANCIAL STATEMENTS (continued)
(e) Pursuant to an exemptive order from the SEC, the fund may invest its available cash balances in affiliated money market mutual funds. Management fees of the underlying money market mutual funds have been waived by the Manager.
NOTE 4—Securities Transactions:
The aggregate amount of purchases and sales (including paydowns) of investment securities, excluding short-term securities and financial futures, during the period ended July 31, 2007, amounted to $9,929,908 and $46,592,325, respectively.
The fund may invest in financial futures contracts in order to gain exposure to or protect against changes in the market. The fund is exposed to market risk as a result of changes in the value of the underlying financial instruments. Investments in financial futures require the fund to “mark to market” on a daily basis, which reflects the change in market value of the contracts at the close of each day’s trading.Accordingly, variation margin payments are received or made to reflect daily unrealized gains and losses. When the contracts are closed, the fund recognizes a realized gain or loss.These investments require initial margin deposits with a broker, which consist of cash or cash equivalents.The amount of these deposits is determined by the exchange or Board of Trade on which the contract is traded and is subject to change. Contracts open at July 31, 2007, are set forth in the Statement of Financial Futures.
At July 31, 2007, the cost of investments for federal income tax purposes was $58,211,853; accordingly, accumulated net unrealized depreciation on investments was $1,016,922, consisting of $70,678 gross unrealized appreciation and $1,087,600 gross unrealized depreciation.
REPORT OF INDEPENDENT REGISTERED PUBLIC ACCOUNTING FIRM
| Shareholders and Board of Directors |
| Dreyfus Premier Yield Advantage Fund |
We have audited the accompanying statement of assets and liabilities, including the statements of investments and financial futures, of Dreyfus Premier Yield Advantage Fund (one of the funds comprising Dreyfus Investment Grade Funds, Inc.), as of July 31, 2007, and the related statement of operations for the year then ended, the statement of changes in net assets for each of the two years in the period then ended, and financial highlights for each of the periods indicated therein. These financial statements and financial highlights are the responsibility of the Fund’s management. Our responsibility is to express an opinion on these financial statements and financial highlights based on our audits.
We conducted our audits in accordance with the standards of the Public Company Accounting Oversight Board (United States).Those standards require that we plan and perform the audit to obtain reasonable assurance about whether the financial statements and financial highlights are free of material misstatement.We were not engaged to perform an audit of the Fund’s internal control over financial reporting. Our audits included consideration of internal control over financial reporting as a basis for designing audit procedures that are appropriate in the circumstances, but not for the purpose of expressing an opinion on the effectiveness of the Fund’s internal control over financial reporting. Accordingly, we express no such opinion.An audit includes examining, on a test basis, evidence supporting the amounts and disclosures in the financial statements and financial highlights, assessing the accounting principles used and significant estimates made by management, and evaluating the overall financial statement presentation. Our procedures included confirmation of securities owned as of July 31, 2007 by correspondence with the custodian and others. We believe that our audits provide a reasonable basis for our opinion.
In our opinion, the financial statements and financial highlights referred to above present fairly, in all material respects, the financial position of Dreyfus Premier Yield Advantage Fund at July 31, 2007, the results of its operations for the year then ended, the changes in its net assets for each of the two years in the period then ended, and the financial highlights for each of the indicated periods, in conformity with U.S. generally accepted accounting principles.

| New York, New York |
| September 14, 2007 |
The Fund 29
IMPORTANT TAX INFORMATION (Unaudited)
The fund hereby designates 97.27% of ordinary income dividends paid during the fiscal year ended July 31, 2007 as qualifying “interest related dividends”.
INFORMATION ABOUT THE REVIEW AND APPROVAL OF THE FUND’S MANAGEMENT AGREEMENT (Unaudited)
At a meeting of the fund’s Board of Directors held on July 19 and 20, 2007, the Board considered the re-approval for an annual period (through July 29,2008) of the Management Agreement with Dreyfus for the fund, pursuant to which Dreyfus provides the fund with investment advisory and administrative services. The Board members, none of whom are “interested persons” (as defined in the Investment Company Act of 1940, as amended) of the fund, were assisted in their review by independent legal counsel and met with counsel in executive session separate from representatives of Dreyfus.
Analysis of Nature, Extent and Quality of Services Provided to the Fund. The Board members received a presentation from representatives of Dreyfus regarding services provided to the fund and other funds in the Dreyfus fund complex, and discussed the nature, extent and quality of the services provided to the fund pursuant to its Management Agreement. Dreyfus’ representatives reviewed the fund’s distribution of accounts and the relationships Dreyfus has with various intermediaries and the different needs of each. Dreyfus’ representatives noted the distribution channels for the fund as well as the diversity of distribution among the funds in the Dreyfus fund complex, and Dreyfus’ corresponding need for broad, deep, and diverse resources to be able to provide ongoing shareholder services to each distribution channel, including those of the fund. Dreyfus also provided the number of shareholder accounts in the fund, as well as the fund’s asset size.
The Board members also considered Dreyfus’ research and portfolio management capabilities and that Dreyfus also provides oversight of day-to-day fund operations, including fund accounting and administration and assistance in meeting legal and regulatory requirements. The Board members also considered Dreyfus’ extensive administrative, accounting and compliance infrastructure.
Comparative Analysis of the Fund’s Performance and Management Fee and Expense Ratio. The Board members reviewed the performance of the fund’s Class D shares and comparisons to a group of retail no-load ultra-short obligation funds (the “Performance Group”) and to
The Fund 31
I N FO R M AT I O N A B O U T T H E R E V I E W A N D A P P R OVA L O F T H E F U N D ’S M A N A G E M E N T A G R E E M E N T ( U n a u d i t e d ) ( c o n t i n u e d )
a larger universe of funds, consisting of all retail no-load ultra-short obligation funds, excluding outliers (the “Performance Universe”), selected and provided by Lipper, Inc., an independent provider of investment company data.The Board was provided with a description of the methodology Lipper used to select the Performance Group and Performance Universe, as well as the Expense Group and Expense Universe (discussed below).The Board members discussed the results of the comparisons for various periods ended May 31, 2007. The Board members noted that the fund’s total return performance was below the Performance Group and Performance Universe medians for all periods. Dreyfus representatives discussed with the Board the interest rate environment that has prevailed in recent years and its impact on fund performance, how the funds in the Performance Group were diverse and different from the fund with respect to strategies and certain portfolio characteristics and how this affected the total return comparisons in such an interest rate environment. Dreyfus also provided a comparison of the fund’s total returns to the returns of the fund’s benchmark index for each of the calendar years for the past five years, and Dreyfus representatives noted that the fund’s total return performance had outperformed its benchmark in two of the prior five calendar years and one year where it slightly underperformed its benchmark.The fund’s yield performance variously was above, at or below the Performance Group and Performance Universe medians for all periods.
The Board members also discussed the fund’s management fee and expense ratio and reviewed the range of management fees and expense ratios as compared to a comparable group of funds (the “Expense Group”) and a broader group of funds (the “Expense Universe”), each selected and provided by Lipper. The Board members noted that the fund’s actual and contractual management fees and expense ratio were above the Expense Group and Expense Universe medians. The Board noted that the fund’s management fee and expense ratio were lower due to the undertaking by Dreyfus to waive fees and reimburse expenses.
Representatives of Dreyfus reviewed with the Board members the advisory fee paid by the one other mutual fund managed by Dreyfus or its affiliates with similar investment objectives, policies and strategies, and included within the fund’s Lipper category (the “Similar Fund”), and stated that there are no other accounts managed by Dreyfus or its affiliates, with similar investment objectives, policies and strategies as the fund. Dreyfus’ representatives also reviewed the costs associated with distribution through intermediaries.The Board analyzed differences in fees paid to Dreyfus and discussed the relationship of the fees paid in light of the services provided.The Board members considered the relevance of the fee information provided for the Similar Fund to evaluate the appropriateness and reasonableness of the fund’s management fee.
Analysis of Profitability and Economies of Scale. Dreyfus’ representatives reviewed the dollar amount of expenses allocated and profit received by Dreyfus and the method used to determine such expenses and profit. The Board considered information, previously provided and discussed, prepared by an independent consulting firm regarding Dreyfus’ approach to allocating costs to, and determining the profitability of, individual funds and the entire Dreyfus mutual fund complex. The Board members also considered that the methodology had also been reviewed by an independent registered public accounting firm which, like the consultant, found the methodology to be reasonable. The consulting firm also analyzed where any economies of scale might emerge in connection with the management of the fund. The Board members evaluated the profitability analysis in light of the relevant circumstances for the fund and the extent to which economies of scale would be realized if the fund grows and whether fee levels reflect these economies of scale for the benefit of fund investors.The Board members also considered potential benefits to Dreyfus from acting as investment adviser and noted that there were no soft dollar arrangements with respect to trading the fund’s investments.
The Fund 33
I N FO R M AT I O N A B O U T T H E R E V I E W A N D A P P R OVA L O F T H E F U N D ’S M A N A G E M E N T A G R E E M E N T ( U n a u d i t e d ) ( c o n t i n u e d )
It was noted that the Board members should consider Dreyfus’ profitability with respect to the fund as part of their evaluation of whether the fees under the Management Agreement bear a reasonable relationship to the mix of services provided by Dreyfus, including the nature, extent and quality of such services and that a discussion of economies of scale is predicated on increasing assets and that, if a fund’s assets had been decreasing, the possibility that Dreyfus may have realized any economies of scale would be less. It also was noted that the profitability percentage for managing the fund was within ranges determined by appropriate court cases to be reasonable given the services rendered and generally superior service levels provided. The Board also noted the fee waiver and expense reimbursement arrangement and its effect on Dreyfus’ profitability.
At the conclusion of these discussions, the Board agreed that it had been furnished with sufficient information to make an informed business decision with respect to continuation of the Management Agreement, with respect to the fund. Based on the discussions and considerations as described above, the Board made the following conclusions and determinations.
- The Board concluded that the nature, extent and quality of the ser- vices provided by Dreyfus are adequate and appropriate.
- The Board noted the fund’s performance in light of the interest rate environment that has prevailed in recent years and the manner in which the fund is managed as compared to some of its competitors.
- The Board concluded that the fee paid by the fund to Dreyfus was reasonable in light of the services provided, comparative performance, expense and management fee information, including Dreyfus’ under- taking to limit the fund’s expense ratio (which reduced the fund’s actual management fee and expense ratio), costs of the services pro- vided and profits to be realized and benefits derived or to be derived by Dreyfus from its relationship with the fund.
- The Board determined that the economies of scale which may accrue to Dreyfus and its affiliates in connection with the manage- ment of the fund had been adequately considered by Dreyfus in connection with the management fee rate charged to the fund and that, to the extent in the future it were determined that material economies of scale had not been shared with the fund, the Board would seek to have those economies of scale shared with the fund.
The Board members considered these conclusions and determinations, along with information received on a routine and regular basis throughout the year, and, without any one factor being dispositive, the Board determined that re-approval of the Management Agreement,with respect to the fund, was in the best interests of the fund and its shareholders.
The Fund 35
BOARD MEMBERS INFORMATION (Unaudited)
Joseph S. DiMartino (63)
Chairman of the Board (1995)
|
Principal Occupation During Past 5 Years:
• Corporate Director and Trustee
|
Other Board Memberships and Affiliations:
|
- The Muscular Dystrophy Association, Director
- Century Business Services, Inc., a provider of outsourcing functions for small and medium size companies, Director
- The Newark Group, a provider of a national market of paper recovery facilities, paperboard mills and paperboard converting plants, Director
- Sunair Services Corporation, a provider of certain outdoor-related services to homes and businesses, Director
- Ivory Investment Management, L.P., a registered investment adviser to three private funds, Senior Adviser
No. of Portfolios for which Board Member Serves: 164
Clifford L. Alexander, Jr. (73)
Board Member (2003)
|
Principal Occupation During Past 5 Years:
|
- President of Alexander & Associates, Inc., a management consulting firm ( January 1981-present)
- Chairman of the Board of Moody’s Corporation (October 2000-October 2003)
Other Board Memberships and Affiliations:
• Mutual of America Life Insurance Company, Director
No. of Portfolios for which Board Member Serves: 53
|
David W. Burke (71)
Board Member (1994)
|
Principal Occupation During Past 5 Years:
• Corporate Director and Trustee
|
Other Board Memberships and Affiliations:
• John F. Kennedy Library Foundation, Director
|
No. of Portfolios for which Board Member Serves: 88
|
Whitney I. Gerard (72)
Board Member (1993)
|
Principal Occupation During Past 5 Years:
• Partner of Chadbourne & Parke LLP
|
No. of Portfolios for which Board Member Serves: 26
|
George L. Perry (72)
Board Member (1992)
|
Principal Occupation During Past 5 Years:
• Economist and Senior Fellow at Brookings Institution
No. of Portfolios for which Board Member Serves: 26
|
Once elected all Board Members serve for an indefinite term, but achieve Emeritus status upon reaching age 80.The address of the Board Members and Officers is in c/o The Dreyfus Corporation, 200 Park Avenue, New York, New York 10166. Additional information about the Board Members is available in the fund’s Statement of Additional Information which can be obtained from Dreyfus free of charge by calling this toll free number: 1-800-554-4611.
Lucy Wilson Benson, Emeritus Board Member
Arthur A. Hartman, Emeritus Board Member
|
The Fund 37
OFFICERS OF THE FUND (Unaudited)
J. DAVID OFFICER, President since December 2006.
Chief Operating Officer,Vice Chairman and a Director of the Manager, and an officer of 82 investment companies (comprised of 164 portfolios) managed by the Manager. He is 58 years old and has been an employee of the Manager since April 1998.
PHILLIP N. MAISANO, Executive Vice President since July 2007.
Chief Investment Officer,Vice Chair and a director of the Manager, and an officer of 82 investment companies (compromised of 164 portfolios) managed by the Manager. Mr. Maisano also is an officer and/or board member of certain other investment management subsidiaries of The Bank of New York Mellon Corperation, each of which is an affiliate of the Manager. He is 60 years old and has been employee of the Manager since November 2006. Prior to joining the Manager, Mr. Maisano served as Chairman and Chief Executive Officer of EACM Advisors, an affiliate of the Manager, since August 2004, and served as Chief Executive Officer of Evaluation Associates, a leading institutional investment consulting firm, from 1988 until 2004.
MICHAEL A. ROSENBERG, Vice President and Secretary since August 2005.
Associate General Counsel of the Manager, and an officer of 83 investment companies (comprised of 181 portfolios) managed by the Manager. He is 47 years old and has been an employee of the Manager since October 1991.
JAMES BITETTO, Vice President and Assistant Secretary since August 2005.
Associate General Counsel and Assistant Secretary of the Manager, and an officer of 83 investment companies (comprised of 181 portfolios) managed by the Manager. He is 41 years old and has been an employee of the Manager since December 1996.
JONI LACKS CHARATAN, Vice President and Assistant Secretary since August 2005.
Associate General Counsel of the Manager, and an officer of 83 investment companies (comprised of 181 portfolios) managed by the Manager. She is 51 years old and has been an employee of the Manager since October 1988.
JOSEPH M. CHIOFFI, Vice President and Assistant Secretary since August 2005.
Associate General Counsel of the Manager, and an officer of 83 investment companies (comprised of 181 portfolios) managed by the Manager. He is 45 years old and has been an employee of the Manager since June 2000.
JANETTE E. FARRAGHER, Vice President and Assistant Secretary since August 2005.
Associate General Counsel of the Manager, and an officer of 83 investment companies (comprised of 181 portfolios) managed by the Manager. She is 44 years old and has been an employee of the Manager since February 1984.
JOHN B. HAMMALIAN, Vice President and Assistant Secretary since August 2005.
Associate General Counsel of the Manager, and an officer of 83 investment companies (comprised of 181 portfolios) managed by the Manager. He is 44 years old and has been an employee of the Manager since February 1991.
ROBERT R. MULLERY, Vice President and Assistant Secretary since August 2005.
Associate General Counsel of the Manager, and an officer of 83 investment companies (comprised of 181 portfolios) managed by the Manager. He is 55 years old and has been an employee of the Manager since May 1986.
JEFF PRUSNOFSKY, Vice President and Assistant Secretary since August 2005.
Associate General Counsel of the Manager, and an officer of 83 investment companies (comprised of 181 portfolios) managed by the Manager. He is 42 years old and has been an employee of the Manager since October 1990.
JAMES WINDELS, Treasurer since November 2001.
Director – Mutual Fund Accounting of the Manager, and an officer of 83 investment companies (comprised of 181 portfolios) managed by the Manager. He is 48 years old and has been an employee of the Manager since April 1985.
ROBERT ROBOL, Assistant Treasurer since August 2005.
Senior Accounting Manager – Money Market and Municipal Bond Funds of the Manager, and an officer of 83 investment companies (comprised of 181 portfolios) managed by the Manager. He is 43 years old and has been an employee of the Manager since October 1988.
ROBERT SALVIOLO, Assistant Treasurer since May 2007.
Senior Accounting Manager – Equity Funds of the Manager, and an officer of 83 investment companies (comprised of 181 portfolios) managed by the Manager. He is 40 years old and has been an employee of the Manager since June 1989.
ROBERT SVAGNA, Assistant Treasurer since August 2005.
Senior Accounting Manager Equity Funds of the Manager, and an officer of 83 investment companies (comprised of 181 portfolios) managed by the Manager. He is 40 years old and has been an employee of the Manager since November 1990.
GAVIN C. REILLY, Assistant Treasurer since December 2005.
Tax Manager of the Investment Accounting and Support Department of the Manager, and an officer of 83 investment companies (comprised of 181 portfolios) managed by the Manager. He is 38 years old and has been an employee of the Manager since April 1991.
JOSEPH W. CONNOLLY, Chief Compliance Officer since October 2004.
Chief Compliance Officer of the Manager and The Dreyfus Family of Funds (83 investment companies, comprised of 181 portfolios). From November 2001 through March 2004, Mr. Connolly was first Vice-President, Mutual Fund Servicing for Mellon Global Securities Services. In that capacity, Mr. Connolly was responsible for managing Mellon’s Custody, Fund Accounting and Fund Administration services to third-party mutual fund clients. He is 50 years old and has served in various capacities with the Manager since 1980, including manager of the firm’s Fund Accounting Department from 1997 through October 2001.
WILLIAM GERMENIS, Anti-Money Laundering Compliance Officer since October 2002.
Vice President and Anti-Money Laundering Compliance Officer of the Distributor, and the Anti-Money Laundering Compliance Officer of 79 investment companies (comprised of 177 portfolios) managed by the Manager. He is 36 years old and has been an employee of the Distributor since October 1998.
The Fund 39
NOTES
For More Information
| Dreyfus Premier | | Transfer Agent & |
| Yield Advantage Fund | | Dividend Disbursing Agent |
| 200 Park Avenue | | |
| | | | | Dreyfus Transfer, Inc. |
| New York, NY 10166 | | |
| | | | | 200 Park Avenue |
| Manager | | | | New York, NY 10166 |
| The Dreyfus Corporation | | Distributor |
| 200 Park Avenue | | |
| | | | | MBSC Securities Corporation |
| New York, NY 10166 | | |
| | | | | 200 Park Avenue |
| Custodian | | | | New York, NY 10166 |
| Mellon Bank, N.A. | | |
| One Mellon Bank Center | | |
| Pittsburgh, PA | | 15258 | | |
| |
| |
|
| |
| |
| Ticker Symbols: | | Class B: DPYBX | | Class D: DYADX |
Telephone Call your financial representative or 1-800-554-4611
| Mail | | The Dreyfus Premier Family of Funds |
| | | 144 Glenn Curtiss Boulevard, Uniondale, NY 11556-0144 |
The fund files its complete schedule of portfolio holdings with the Securities and Exchange Commission (“SEC”) for the first and third quarters of each fiscal year on Form N-Q. The fund’s Forms N-Q are available on the SEC’s website at http://www.sec.gov and may be reviewed and copied at the SEC’s Public Reference Room in Washington, DC. Information on the operation of the Public Reference Room may be obtained by calling 1-202-551-8090.
A description of the policies and procedures that the fund uses to determine how to vote proxies relating to portfolio securities, and information regarding how the fund voted these proxies for the 12-month period ended June 30, 2007, is available at http://www.dreyfus.com and on the SEC’s website at http://www.sec.gov. The description of the policies and procedures is also available without charge, upon request, by calling 1-800-645-6561.

© 2007 MBSC Securities Corporation
Item 2. Code of Ethics.
The Registrant has adopted a code of ethics that applies to the Registrant's principal executive officer, principal financial officer, principal accounting officer or controller, or persons performing similar functions There have been no amendments to, or waivers in connection with, the Code of Ethics during the period covered by this Report.
Item 3. Audit Committee Financial Expert.
The Registrant's Board has determined that Joseph S. DiMartino, a member of the Audit Committee of the Board, is an audit committee financial expert as defined by the Securities and Exchange Commission (the "SEC"). Joseph S. DiMartino is "independent" as defined by the SEC for purposes of audit committee financial expert determinations.
Item 4. Principal Accountant Fees and Services
(a) Audit Fees. The aggregate fees billed for each of the last two fiscal years (the "Reporting Periods") for professional services rendered by the Registrant's principal accountant (the "Auditor") for the audit of the Registrant's annual financial statements, or services that are normally provided by the Auditor in connection with the statutory and regulatory filings or engagements for the Reporting Periods, were $117,107 in 2006 and $117,107 in 2007.
(b) Audit-Related Fees. The aggregate fees billed in the Reporting Periods for assurance and related services by the Auditor that are reasonably related to the performance of the audit of the Registrant's financial statements and are not reported under paragraph (a) of this Item 4 were $20,488 in 2006 and $20,488 in 2007. These services consisted of security counts required by Rule 17f-2 under the Investment Company Act of 1940, as amended.
The aggregate fees billed in the Reporting Periods for non-audit assurance and related services by the Auditor to the Registrant's investment adviser (not including any sub-investment adviser whose role is primarily portfolio management and is subcontracted with or overseen by another investment adviser), and any entity controlling, controlled by or under common control with the investment adviser that provides ongoing services to the Registrant ("Service Affiliates"), that were reasonably related to the performance of the annual audit of the Service Affiliate, which required pre-approval by the Audit Committee were $0 in 2006 and $0 in 2007.
Note: For the second paragraph in each of (b) through (d) of this Item 4, certain of such services were not pre-approved prior to May 6, 2003, when such services were required to be pre-approved. On and after May 6, 2003, 100% of all services provided by the Auditor were pre-approved as required. For comparative purposes, the fees shown assume that all such services were pre-approved, including services that were not pre-approved prior to the compliance date of the pre-approval requirement.
(c) Tax Fees. The aggregate fees billed in the Reporting Periods for professional services rendered by the Auditor for tax compliance, tax advice and tax planning ("Tax Services") were $12,585 in 2006 and $11,422 in 2007. These services consisted of (i) review or preparation of U.S. federal, state, local and excise tax returns; (ii) U.S. federal, state and local tax planning, advice and assistance regarding statutory, regulatory or
administrative developments, (iii) tax advice regarding tax qualification matters and/or treatment of various financial instruments held or proposed to be acquired or held, and (iv) determination of Passive Foreign Investment Companies (as applicable).
The aggregate fees billed in the Reporting Periods for Tax Services by the Auditor to Service Affiliates which required pre-approval by the Audit Committee were $0 in 2006 and $0 in 2007.
(d) All Other Fees. The aggregate fees billed in the Reporting Periods for products and services provided by the Auditor, other than the services reported in paragraphs (a) through (c) of this Item, were $1,054 in 2006 and $949 in 2007. These services consisted of a review of the Registrant's anti-money laundering program.
The aggregate fees billed in the Reporting Periods for Non-Audit Services by the Auditor to Service Affiliates, other than the services reported in paragraphs (b) through (c) of this Item, which required pre-approval by the Audit Committee were $0 in 2006 and $0 in 2007.
Audit Committee Pre-Approval Policies and Procedures. The Registrant's Audit Committee has established policies and procedures (the "Policy") for pre-approval (within specified fee limits) of the Auditor's engagements for non-audit services to the Registrant and Service Affiliates without specific case-by-case consideration. Pre-approval considerations include whether the proposed services are compatible with maintaining the Auditor's independence. Pre-approvals pursuant to the Policy are considered annually.
Non-Audit Fees. The aggregate non-audit fees billed by the Auditor for services rendered to the Registrant, and rendered to Service Affiliates, for the Reporting Periods were $504,120 in 2006 and $1,654,921 in 2007.
Auditor Independence. The Registrant's Audit Committee has considered whether the provision of non-audit services that were rendered to Service Affiliates which were not pre-approved (not requiring pre-approval) is compatible with maintaining the Auditor's independence.
| Item 5. | | Audit Committee of Listed Registrants. |
| | | Not applicable. [CLOSED-END FUNDS ONLY] |
| Item 6. | | Schedule of Investments. |
| | | Not applicable. |
| Item 7. | | Disclosure of Proxy Voting Policies and Procedures for Closed-End Management |
| | | Investment Companies. |
| | | Not applicable. [CLOSED-END FUNDS ONLY] |
| Item 8. | | Portfolio Managers of Closed-End Management Investment Companies. |
| | | Not applicable. [CLOSED-END FUNDS ONLY, beginning with reports for periods ended |
| | | on and after December 31, 2005] |
| Item 9. | | Purchases of Equity Securities by Closed-End Management Investment Companies and |
| | | Affiliated Purchasers. |
| | | Not applicable. [CLOSED-END FUNDS ONLY] |
| Item 10. | | Submission of Matters to a Vote of Security Holders. |
The Registrant has a Nominating Committee (the "Committee"), which is responsible for selecting and nominating persons for election or appointment by the Registrant's Board as Board members. The Committee has adopted a Nominating Committee Charter (the "Charter"). Pursuant to the Charter, the Committee will consider recommendations for nominees from shareholders submitted to the Secretary of the Registrant, c/o The Dreyfus Corporation Legal Department, 200 Park Avenue, 8th Floor East, New York, New York 10166. A nomination submission must include information regarding the recommended nominee as specified in the Charter. This information includes all information relating to a recommended nominee that is required to be disclosed in solicitations or proxy statements for the election of Board members, as well as information sufficient to evaluate the factors to be considered by the Committee, including character and integrity, business and professional experience, and whether the person has the ability to apply sound and independent business judgment and would act in the interests of the Registrant and its shareholders.
Nomination submissions are required to be accompanied by a written consent of the individual to stand for election if nominated by the Board and to serve if elected by the shareholders, and such additional information must be provided regarding the recommended nominee as reasonably requested by the Committee.
Item 11. Controls and Procedures.
(a) The Registrant's principal executive and principal financial officers have concluded, based on their evaluation of the Registrant's disclosure controls and procedures as of a date within 90 days of the filing date of this report, that the Registrant's disclosure controls and procedures are reasonably designed to ensure that information required to be disclosed by the Registrant on Form N-CSR is recorded, processed, summarized and reported within the required time periods and that information required to be disclosed by the Registrant in the reports that it files or submits on Form N-CSR is accumulated and communicated to the Registrant's management, including its principal executive and principal financial officers, as appropriate to allow timely decisions regarding required disclosure.
(b) There were no changes to the Registrant's internal control over financial reporting that occurred during the second fiscal quarter of the period covered by this report that have materially affected, or are reasonably likely to materially affect, the Registrant's internal control over financial reporting.
Item 12. Exhibits.
| (a)(1) | | Code of ethics referred to in Item 2. |
| (a)(2) | | Certifications of principal executive and principal financial officers as required by Rule 30a-2(a) |
| under the Investment Company Act of 1940. |
| (a)(3) | | Not applicable. |
| (b) | | Certification of principal executive and principal financial officers as required by Rule 30a-2(b) |
| under the Investment Company Act of 1940. |
Pursuant to the requirements of the Securities Exchange Act of 1934 and the Investment Company Act of 1940, the Registrant has duly caused this Report to be signed on its behalf by the undersigned, thereunto duly authorized.
Dreyfus Investment Grade Fund, Inc.
| By: | | /s/ J. David Officer |
| | | J. David Officer |
| | | President |
| |
| Date: | | September 26, 2007 |
Pursuant to the requirements of the Securities Exchange Act of 1934 and the Investment Company Act of 1940, this Report has been signed below by the following persons on behalf of the Registrant and in the capacities and on the dates indicated.
| By: | | /s/ J. David Officer |
| | | J. David Officer |
| | | President |
| |
| Date: | | September 26, 2007 |
| |
| By: | | /s/ James Windels |
| | | James Windels |
| Treasurer |
| |
| Date: | | September 26, 2007 |
EXHIBIT INDEX
(a)(1) Code of ethics referred to in Item 2.
(a)(2) Certifications of principal executive and principal financial officers as required by Rule 30a-2(a) under the Investment Company Act of 1940. (EX-99.CERT)
(b) Certification of principal executive and principal financial officers as required by Rule 30a-2(b) under the Investment Company Act of 1940. (EX-99.906CERT)