UNITED STATES
SECURITIES AND EXCHANGE COMMISSION
Washington, D.C. 20549
FORM N-CSR
CERTIFIED SHAREHOLDER REPORT OF REGISTERED MANAGEMENT
INVESTMENT COMPANIES
| Investment Company Act file number | 811-06718 |
| | |
| | BNY Mellon Investment Funds VII, Inc. | |
| | (Exact name of Registrant as specified in charter) | |
| | | |
| | c/o BNY Mellon Investment Adviser, Inc. 240 Greenwich Street New York, New York 10286 | |
| | (Address of principal executive offices) (Zip code) | |
| | | |
| | Deirdre Cunnane, Esq. 240 Greenwich Street New York, New York 10286 | |
| | (Name and address of agent for service) | |
| |
| Registrant's telephone number, including area code: | (212) 922-6400 |
| | |
Date of fiscal year end: | 07/31 | |
| Date of reporting period: | 07/31/23 | |
| | | | | | | |
FORM N-CSR
Item 1. Reports to Stockholders.
BNY Mellon Short Term Income Fund
| |
ANNUAL REPORT July 31, 2023 |
| |
Save time. Save paper. View your next shareholder report online as soon as it’s available. Log into www.im.bnymellon.com and sign up for eCommunications. It’s simple and only takes a few minutes. |
| |
The views expressed in this report reflect those of the portfolio manager(s) only through the end of the period covered and do not necessarily represent the views of BNY Mellon Investment Adviser, Inc. or any other person in the BNY Mellon Investment Adviser, Inc. organization. Any such views are subject to change at any time based upon market or other conditions and BNY Mellon Investment Adviser, Inc. disclaims any responsibility to update such views. These views may not be relied on as investment advice and, because investment decisions for a fund in the BNY Mellon Family of Funds are based on numerous factors, may not be relied on as an indication of trading intent on behalf of any fund in the BNY Mellon Family of Funds. |
| |
Not FDIC-Insured • Not Bank-Guaranteed • May Lose Value |
Contents
THE FUND
FOR MORE INFORMATION
Back Cover
DISCUSSION OF FUND PERFORMANCE (Unaudited)
For the period from August 1, 2022, through July 31, 2023, as provided by David Bowser, CFA, Scott Zaleski, CFA and Gautam Khanna, CFA, portfolio managers at Insight North America LLC (INA), an affiliate of BNY Mellon Investment Adviser, Inc.
Market and Fund Performance Overview
For the 12-month period ended July 31, 2023, BNY Mellon Short Term Income Fund’s (the “fund”) Class A shares produced a total return of .76%, Class D shares produced a total return of 1.15%, Class I shares produced a total return of 1.36% and Class Y shares produced a total return of 1.46%.1 In comparison, the fund’s benchmark, the ICE BofA Merrill Lynch 1-5 Year U.S. Corporate/Government Index (the “Index”), produced a total return of −.24% for the same period.2
Some sectors of the bond market remained under pressure during the reporting period from rising inflation and hawkish activity on the part of the U.S. Federal Reserve (the “Fed”) and other central banks. The fund outperformed the Index due to asset allocation, security selection and duration positioning.
The Fund’s Investment Approach
The fund seeks to maximize total return, consisting of capital appreciation and current income. To pursue its goal, the fund invests at least 80% of its net assets, plus any borrowings for investment purposes, in fixed-income securities of U.S. or foreign issuers rated investment grade or the unrated equivalent, as determined by the sub-adviser. This may include U.S. government bonds and notes, corporate bonds, municipal bonds, convertible securities, preferred stocks, inflation-indexed securities, asset-backed securities, mortgage-related securities (including collateralized mortgage obligations), floating-rate loans (limited to up to 20% of the fund’s net assets) and other floating-rate securities and foreign bonds. Typically, the fund’s portfolio can be expected to have an average effective maturity and an average effective duration of three years or less.
For additional yield, the fund may invest up to 35% of its net assets in fixed-income securities rated below investment grade (“high yield” or “junk” bonds) to as low as Caa/CCC or the unrated equivalent as determined by the sub-adviser. The fund will focus on U.S. securities but may invest up to 30% of its total assets in fixed-income securities of foreign issuers including those securities denominated in foreign currencies and of issuers in emerging markets.
Inflation and Interest Rates Drive Bond Markets
Elevated inflationary pressures caused by rising commodity prices and a tight labor market generally drove bond yields higher during the first three months of the reporting period, causing bond prices to decline (bond yields and prices typically move in opposite directions). The level and persistence of inflationary pressures prompted the Fed to continue implementing the aggressive series of rate hikes it began in March 2022, raising rates by an additional 0.75% in September 2022, the central bank’s third consecutive 0.75% increase, with additional increases expected. The yield curve, which began the period with the two-year Treasury rate exceeding the 10-year Treasury rate, remained inverted throughout the period, a condition widely viewed as a precursor to a recession. Credit spreads widened amid
2
fears of a marked economic slowdown. (Credit spreads refer to the comparative yields of bonds of different credit quality but the same maturity.)
Although fears of a recession continued to pressure markets in late 2022 and early 2023, mounting evidence of easing inflation gave hope that the Fed might reduce the pace of further rate increases. Indeed, after an additional 0.75% rate hike in early November, the central bank reduced the pace of rate increases to 0.50% in December and 0.25% subsequently. While high rates led to difficulties in some areas of the economy—most notably in the banking sector, where a few prominent regional banks faced defaults—economic growth remained positive, supported by robust consumer spending and a strong labor market. As the prospects of a recession receded, credit spreads tightened on improved risk sentiment. For the period as a whole, short-term U.S. bond price performance proved mixed, with Treasury bonds and some corporate issues losing ground. However, spread product tended to outperform, particularly from October 2022 through the end of the period as hopes of less hawkish policies from the Fed outweighed lingering geopolitical uncertainties, and as asset flows into fixed-income securities increased.
Allocation, Selection and Duration Bolster Fund Performance
The fund was well positioned to benefit from the rally in spread product seen during most of the reporting period. Performance relative to the Index benefited from the combined effects of favorable asset allocation, security selection and duration positioning. From an allocation perspective, overweight exposure to spread product bolstered returns, led by holdings in high-yield corporates, investment-grade corporates and structured products, all of which outperformed Treasury bonds as spreads returned to levels not seen since the beginning of 2022. In terms of security selection, the fund’s holdings among high-yield credits, characterized by increased quality and relatively short yield-curve positioning, benefited from both yield and spread performance. Strong-performing holdings included subordinate debt positions in money center banks, including Bank of America, Citibank, Goldman Sachs and JPMorgan, along with senior notes in Credit Suisse and very short positions in select regional banks at the height of the industry’s troubles in early 2023. Other notably strong holdings included non-agency mortgage-backed securities, which performed well amid healthy consumer spending trends, and debt issued by casino operator Wynn Macau, which gained ground on China’s post-pandemic-lockdown recovery. Regarding duration, relatively underweight positions, primarily in the three-year and five-year portions of the yield curve, further contributed to relatively strong returns. Few positions detracted from relative performance, the most notable being the fund’s yield curve positioning during isolated portions of the period and lack of exposure to some outperforming banking names. In addition, a few of the fund’s bonds were called, and so failed to benefit from tightening spreads.
During the period, derivatives such as forwards and futures were used to hedge duration risk and credit volatility within the portfolio. These positions had little net impact on the fund’s relative performance, with slightly positive contributions from duration hedges and slightly negative effects from volatility hedges.
Remaining Cautiously Optimistic
While the economy has remained resilient in the face of the Fed’s aggressive efforts to combat inflation, cracks have begun to appear in some areas, including increasing consumer
3
DISCUSSION OF FUND PERFORMANCE (Unaudited) (continued)
delinquencies and tightening bank credit, with impacts on commercial real estate and commercial and industrial loans. We expect to see further effects if, as expected, the Fed maintains rates at or near current levels for an extended period of time. On the other hand, the labor market remains healthy, with the overall economy continuing to benefit from several recent federal programs designed to stimulate growth, including the CHIPS and Science Act, the $1 trillion bipartisan infrastructure bill and the Inflation Reduction Act of 2022. Accordingly, while we expect economic growth to modestly slow in the near term, we do not anticipate a steep recession.
In light of these countervailing forces, we continue to maintain the fund’s competitive yield advantage, while remaining cautious regarding the valuations of positions we add to the portfolio. From a sector perspective, we currently see the most attractive investments in banks, which appear reasonably valued; utilities, which offer a low-volatility way to add yield; pipelines, which are well positioned for the continued onshoring of U.S. manufacturing; gaming, which is likely to benefit from China’s continued recovery; and securitized products, which are also reasonably valued. In addition, we remain alert for emerging opportunities in terms of duration positioning, prepared to make tactical allocations along the yield curve depending on evolving conditions. At the same time, the fund continues to hold a Treasury position, a potential source of assets to take advantage of emerging opportunities in spread product.
August 15, 2023
1 Total return includes reinvestment of dividends and any capital gains paid. Past performance is no guarantee of future results. Share price, yield and investment returns fluctuate such that upon redemption, fund shares may be worth more or less than their original cost. The fund’s return reflects the absorption of certain fund expenses by BNY Mellon Investment Adviser, Inc. pursuant to an agreement in effect through December 1, 2023, at which time it may be extended, modified or terminated. Had these expenses not been absorbed, returns would have been lower.
2 Source: Lipper Inc. — The ICE BofA Merrill Lynch 1-5 Year U.S. Corporate/Government Index tracks the performance of U.S. dollar-denominated, investment-grade debt publicly issued in the U.S. domestic market, including U.S. Treasury, U.S. agency, foreign government, supranational and corporate securities, including all securities with a remaining term to final maturity of less than five years. Investors cannot invest directly in any index.
Bonds are subject generally to interest-rate, credit, liquidity and market risks, to varying degrees, all of which are more fully described in the fund’s prospectus. Generally, all other factors being equal, bond prices are inversely related to interest-rate changes, and rate increases can cause price declines.
High yield bonds are subject to increased credit risk and are considered speculative in terms of the issuer’s perceived ability to continue making interest payments on a timely basis and to repay principal upon maturity.
Investing internationally involves special risks, including changes in currency exchange rates, political, economic and social instability, a lack of comprehensive company information, differing auditing and legal standards, and less market liquidity. The fixed-income securities of issuers located in emerging markets can be more volatile and less liquid than those of issuers in more mature economies.
The fund may, but is not required to, use derivative instruments. A small investment in derivatives could have a potentially large impact on the fund’s performance. The use of derivatives involves risks different from, or possibly greater than, the risks associated with investing directly in the underlying assets.
4
FUND PERFORMANCE (Unaudited)
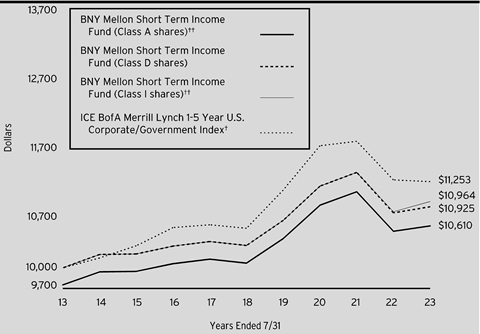
Comparison of change in value of a $10,000 investment in Class A shares, Class D shares and Class I shares of BNY Mellon Short Term Income Fund with a hypothetical investment of $10,000 in the ICE BofA Merrill Lynch 1-5 Year U.S. Corporate/Government Index (the “Index”).
† Source: Lipper Inc.
†† The total return figures presented for Class A shares and Class I shares of the fund reflect the performance of the fund’s Class D shares for the period prior to 5/6/22 (the inception date for Class A shares and Class I shares).
Past performance is not predictive of future performance.
The above graph compares a hypothetical $10,000 investment made in Class A shares, Class D shares and Class I shares of BNY Mellon Short Term Income Fund on 7/31/13 to a hypothetical investment of $10,000 made in the Index on that date. All dividends and capital gain distributions are reinvested.
The fund’s performance shown in the line graph above takes into account all applicable fees and expenses. The Index tracks the performance of U.S. dollar-denominated investment-grade debt publicly issued in the U.S. domestic market, including U.S. Treasury, U.S. agency, foreign government, supranational and corporate securities, including all securities with a remaining term to final maturity less than five years. Investors cannot invest directly in any index. Further information relating to fund performance, including expense reimbursements, if applicable, is contained in the Financial Highlights section of the prospectus and elsewhere in this report.
5
FUND PERFORMANCE (Unaudited) (continued)

Comparison of change in value of a $1,000,000 investment in Class Y shares of BNY Mellon Short Term Income Fund with a hypothetical investment of $1,000,000 in the ICE BofA Merrill Lynch 1-5 Year U.S. Corporate/Government Index (the “Index”).
† Source: Lipper Inc.
†† The total return figures presented for Class Y shares of the fund reflect the performance of the fund’s Class D shares for the period prior to 5/6/22 (the inception date for Class Y shares).
Past performance is not predictive of future performance.
The above graph compares a hypothetical $1,000,000 investment made in Class Y shares of BNY Mellon Short Term Income Fund on 7/31/13 to a hypothetical investment of $1,000,000 made in the Index on that date. All dividends and capital gain distributions are reinvested.
The fund’s performance shown in the line graph above takes into account all applicable fees and expenses. The Index tracks the performance of U.S. dollar-denominated investment-grade debt publicly issued in the U.S. domestic market, including U.S. Treasury, U.S. agency, foreign government, supranational and corporate securities, including all securities with a remaining term to final maturity less than five years. Investors cannot invest directly in any index. Further information relating to fund performance, including expense reimbursements, if applicable, is contained in the Financial Highlights section of the prospectus and elsewhere in this report.
6
| | | | | | | |
Average Annual Total Returns as of 7/31/2023 |
| Inception
Date | 1 Year | 5 Years | 10 Years |
Class A shares | | | | | | |
with maximum sales charge (2.50%) | 5/6/22 | -1.79%† | .54% | † | .59% | † |
without sales charge | 5/6/22 | .76%† | 1.06% | † | .85% | † |
Class D shares | 8/18/92 | 1.15% | 1.14% | | .89% | |
Class I shares | 5/6/22 | 1.36%† | 1.21% | † | .92% | † |
Class Y shares | 5/6/22 | 1.46%† | 1.21% | † | .92% | † |
ICE BofA Merrill Lynch 1-5 Year U.S. Corporate/Government Index | | -.24% | 1.25% | | 1.19% | |
† The total return performance figures presented for Class A shares, Class I shares and Class Y shares of the fund reflect the performance of the fund’s Class D shares for the period prior to 5/6/22 (the inception date for Class A shares, Class I shares and Class Y shares).
The performance data quoted represents past performance, which is no guarantee of future results. Share price and investment return fluctuate and an investor’s shares may be worth more or less than original cost upon redemption. Current performance may be lower or higher than the performance quoted. Go to www.im.bnymellon.com for the fund’s most recent month-end returns.
The fund’s performance shown in the graphs and table does not reflect the deduction of taxes that a shareholder would pay on fund distributions or the redemption of fund shares.
7
UNDERSTANDING YOUR FUND’S EXPENSES (Unaudited)
As a mutual fund investor, you pay ongoing expenses, such as management fees and other expenses. Using the information below, you can estimate how these expenses affect your investment and compare them with the expenses of other funds. You also may pay one-time transaction expenses, including sales charges (loads) and redemption fees, which are not shown in this section and would have resulted in higher total expenses. For more information, see your fund’s prospectus or talk to your financial adviser.
Review your fund’s expenses
The table below shows the expenses you would have paid on a $1,000 investment in BNY Mellon Short Term Income Fund from February 1, 2023 to July 31, 2023. It also shows how much a $1,000 investment would be worth at the close of the period, assuming actual returns and expenses.
| | | | | | | |
Expenses and Value of a $1,000 Investment | |
Assume actual returns for the six months ended July 31, 2023 | |
| | | | | | |
| | Class A | Class D | Class I | Class Y | |
Expenses paid per $1,000† | $3.13 | $2.84 | $1.84 | $1.84 | |
Ending value (after expenses) | $1,004.00 | $1,007.90 | $1,008.90 | $1,008.90 | |
COMPARING YOUR FUND’S EXPENSES WITH THOSE OF OTHER FUNDS (Unaudited)
Using the SEC’s method to compare expenses
The Securities and Exchange Commission (“SEC”) has established guidelines to help investors assess fund expenses. Per these guidelines, the table below shows your fund’s expenses based on a $1,000 investment, assuming a hypothetical 5% annualized return. You can use this information to compare the ongoing expenses (but not transaction expenses or total cost) of investing in the fund with those of other funds. All mutual fund shareholder reports will provide this information to help you make this comparison. Please note that you cannot use this information to estimate your actual ending account balance and expenses paid during the period.
| | | | | | | |
Expenses and Value of a $1,000 Investment | |
Assuming a hypothetical 5% annualized return for the six months ended July 31, 2023 | |
| | | | | | |
| | Class A | Class D | Class I | Class Y | |
Expenses paid per $1,000† | $3.16 | $2.86 | $1.86 | $1.86 | |
Ending value (after expenses) | $1,021.67 | $1,021.97 | $1,022.96 | $1,022.96 | |
† | Expenses are equal to the fund’s annualized expense ratio of .63% for Class A, .57% for Class D, .37% for Class I and .37% for Class Y, multiplied by the average account value over the period, multiplied by 181/365 (to reflect the one-half year period). |
8
STATEMENT OF INVESTMENTS
July 31, 2023
| | | | | | | | | | |
| |
Description | Coupon
Rate (%) | | Maturity
Date | | Principal
Amount ($) | a | Value ($) | |
Bonds and Notes - 96.5% | | | | | |
Aerospace & Defense - .8% | | | | | |
Rolls-Royce PLC, Gtd. Notes | | 5.75 | | 10/15/2027 | | 220,000 | b | 217,019 | |
The Boeing Company, Sr. Unscd. Notes | | 2.20 | | 2/4/2026 | | 550,000 | | 507,785 | |
TransDigm, Inc., Sr. Scd. Notes | | 6.75 | | 8/15/2028 | | 52,000 | b | 52,220 | |
| | 777,024 | |
Agriculture - .3% | | | | | |
Philip Morris International, Inc., Sr. Unscd. Notes | | 0.88 | | 5/1/2026 | | 350,000 | | 313,409 | |
Airlines - .1% | | | | | |
Air Canada, Sr. Scd. Notes | | 3.88 | | 8/15/2026 | | 128,000 | b | 118,899 | |
Asset-Backed Certificates - 8.7% | | | | | |
AMSR Trust, Ser. 2023-SFR2, Cl. A | | 3.95 | | 8/17/2040 | | 555,000 | b | 516,396 | |
Amur Equipment Finance Receivables XI LLC, Ser. 2022-2A, Cl. A2 | | 5.30 | | 6/21/2028 | | 88,423 | b | 87,670 | |
CF Hippolyta Issuer LLC, Ser. 2020-1, Cl. A1 | | 1.69 | | 7/15/2060 | | 346,289 | b | 312,230 | |
CF Hippolyta Issuer LLC, Ser. 2021-1A, Cl. A1 | | 1.53 | | 3/15/2061 | | 259,173 | b | 226,012 | |
CLI Funding VI LLC, Ser. 2020-1A, Cl. A | | 2.08 | | 9/18/2045 | | 131,073 | b | 114,238 | |
CLI Funding VI LLC, Ser. 2020-3A, Cl. A | | 2.07 | | 10/18/2045 | | 221,542 | b | 193,006 | |
CNH Capital Canada Receivables Trust, Ser. 2021-1A, Cl. A2 | CAD | 1.00 | | 11/16/2026 | | 218,023 | b | 158,989 | |
CyrusOne Data Centers Issuer I LLC, Ser. 2023-1A, Cl. B | | 5.45 | | 4/20/2048 | | 97,222 | b | 83,540 | |
DataBank Issuer, Ser. 2021-1A, Cl. A2 | | 2.06 | | 2/27/2051 | | 300,000 | b | 263,124 | |
DataBank Issuer, Ser. 2021-2A, CI. A2 | | 2.40 | | 10/25/2051 | | 350,000 | b | 303,258 | |
DataBank Issuer, Ser. 2023-1A, Cl. A2 | | 5.12 | | 2/25/2053 | | 270,000 | b | 249,029 | |
Dell Equipment Finance Trust, Ser. 2023-1, Cl. A3 | | 5.65 | | 9/22/2028 | | 310,000 | b | 310,888 | |
Domino's Pizza Master Issuer LLC, Ser. 2021-1A, Cl. A2I | | 2.66 | | 4/25/2051 | | 219,937 | b | 186,463 | |
Flexential Issuer, Ser. 2021-1A, Cl. A2 | | 3.25 | | 11/27/2051 | | 305,000 | b | 267,628 | |
Hilton Grand Vacations Trust, Ser. 2022-2A, CI. A | | 4.30 | | 1/25/2037 | | 82,013 | b | 78,539 | |
HPEFS Equipment Trust, Ser. 2021-2A, CI. C | | 0.88 | | 9/20/2028 | | 500,000 | b | 485,199 | |
9
STATEMENT OF INVESTMENTS (continued)
| | | | | | | | | | |
| |
Description | Coupon
Rate (%) | | Maturity
Date | | Principal
Amount ($) | a | Value ($) | |
Bonds and Notes - 96.5% (continued) | | | | | |
Asset-Backed Certificates - 8.7% (continued) | | | | | |
Marlette Funding Trust, Ser. 2022-3A, Cl. A | | 5.18 | | 11/15/2032 | | 52,731 | b | 52,442 | |
MVW LLC, Ser. 2020-1A, Cl. A | | 1.74 | | 10/20/2037 | | 73,337 | b | 67,328 | |
New Economy Assets Phase 1 Sponsor LLC, Ser. 2021-1, Cl. A1 | | 1.91 | | 10/20/2061 | | 1,125,000 | b | 966,333 | |
Octane Receivables Trust, Ser. 2023-1A, Cl. B | | 5.96 | | 7/20/2029 | | 300,000 | b | 296,556 | |
OneMain Financial Issuance Trust, Ser. 2020-2A, Cl. A | | 1.75 | | 9/14/2035 | | 350,000 | b | 315,001 | |
Pagaya AI Debt Selection Trust, Ser. 2021-3, Cl. A | | 1.15 | | 5/15/2029 | | 54,674 | b | 54,289 | |
Purewest Funding LLC, Ser. 2021-1, Cl. A1 | | 4.09 | | 12/22/2036 | | 265,456 | b | 251,051 | |
Textainer Marine Containers VII Ltd., Ser. 2020-2A, CI. A | | 2.10 | | 9/20/2045 | | 420,403 | b | 370,051 | |
Textainer Marine Containers VII Ltd., Ser. 2021-1A, Cl. A | | 1.68 | | 2/20/2046 | | 282,333 | b | 239,645 | |
Tricon American Homes Trust, Ser. 2018-SFR1, Cl. A | | 3.53 | | 5/17/2037 | | 604,802 | b | 580,750 | |
Trinity Rail Leasing LLC, Ser. 2020-2A, Cl. A1 | | 1.83 | | 11/19/2050 | | 171,771 | b | 156,140 | |
TRP, Ser. 2021-2, Cl. A | | 2.15 | | 6/19/2051 | | 293,940 | b | 253,916 | |
TRP LLC, Ser. 2021-1, Cl. A | | 2.07 | | 6/19/2051 | | 286,891 | b | 247,171 | |
Upstart Securitization Trust, Ser. 2021-4, Cl. A | | 0.84 | | 9/20/2031 | | 80,732 | b | 79,571 | |
Vantage Data Centers Issuer LLC, Ser. 2021-1A, CI. A2 | | 2.17 | | 10/15/2046 | | 250,000 | b | 220,092 | |
Vantage Data Centers LLC, Ser. 2020-2A, CI. A2 | | 1.99 | | 9/15/2045 | | 414,000 | b | 349,352 | |
Verizon Master Trust, Ser. 2021-1, Cl. C | | 0.89 | | 5/20/2027 | | 500,000 | | 478,334 | |
Verizon Master Trust, Ser. 2022-5, CI. A1A | | 3.72 | | 7/20/2027 | | 142,000 | | 140,672 | |
| | 8,954,903 | |
Asset-Backed Certificates/Auto Receivables - 13.9% | | | | | |
AmeriCredit Automobile Receivables Trust, Ser. 2020-1, Cl. C | | 1.59 | | 10/20/2025 | | 285,298 | | 280,516 | |
AmeriCredit Automobile Receivables Trust, Ser. 2022-1, CI. A2 | | 2.05 | | 1/20/2026 | | 13,785 | | 13,727 | |
AmeriCredit Automobile Receivables Trust, Ser. 2022-2, Cl. B | | 4.81 | | 4/18/2028 | | 214,000 | | 209,407 | |
Avis Budget Rental Car Funding AESOP LLC, Ser. 2020-1A, Cl. A | | 2.33 | | 8/20/2026 | | 240,000 | b | 224,540 | |
10
| | | | | | | | | | |
| |
Description | Coupon
Rate (%) | | Maturity
Date | | Principal
Amount ($) | a | Value ($) | |
Bonds and Notes - 96.5% (continued) | | | | | |
Asset-Backed Certificates/Auto Receivables - 13.9% (continued) | | | | | |
Avis Budget Rental Car Funding AESOP LLC, Ser. 2023-3A, Cl. A | | 5.44 | | 2/22/2028 | | 385,000 | b | 379,418 | |
Bank of the West Auto Trust, Ser. 2019-1, Cl. B | | 2.76 | | 1/15/2025 | | 286,056 | b | 284,686 | |
BMW Canada Auto Trust, Ser. 2021-1A, Cl. A3 | CAD | 0.76 | | 12/20/2025 | | 400,000 | b | 298,311 | |
BMW Vehicle Lease Trust, Ser.2023-1, CI. A3 | | 5.16 | | 11/25/2025 | | 56,000 | | 55,694 | |
Capital One Prime Auto Receivables Trust, Ser. 2022-2, CI. A3 | | 3.66 | | 5/17/2027 | | 302,000 | | 293,149 | |
CarMax Auto Owner Trust, Ser. 2019-3, Cl. C | | 2.60 | | 6/16/2025 | | 315,000 | | 313,775 | |
CarMax Auto Owner Trust, Ser. 2019-4, Cl. B | | 2.32 | | 7/15/2025 | | 475,000 | | 469,073 | |
CarMax Auto Owner Trust, Ser. 2021-3, Cl. C | | 1.25 | | 5/17/2027 | | 500,000 | | 451,569 | |
Carvana Auto Receivables Trust, Ser. 2020-P1, Cl. A3 | | 0.44 | | 6/9/2025 | | 26,017 | | 25,967 | |
Carvana Auto Receivables Trust, Ser. 2020-P1, Cl. C | | 1.32 | | 11/9/2026 | | 425,000 | | 380,829 | |
Carvana Auto Receivables Trust, Ser. 2021-N2, Cl. C | | 1.07 | | 3/10/2028 | | 127,630 | | 117,833 | |
Carvana Auto Receivables Trust, Ser. 2021-P1, Cl. B | | 1.19 | | 1/11/2027 | | 230,000 | | 205,873 | |
Carvana Auto Receivables Trust, Ser. 2021-P4, Cl. B | | 1.98 | | 2/10/2028 | | 125,000 | | 108,344 | |
Carvana Auto Receivables Trust, Ser. 2022-P3, CI. C | | 5.54 | | 11/10/2028 | | 238,000 | | 229,998 | |
CPS Auto Receivables Trust, Ser. 2021-D, Cl. B | | 1.09 | | 10/15/2027 | | 475,487 | b | 469,350 | |
DT Auto Owner Trust, Ser. 2021-2A, Cl. B | | 0.81 | | 1/15/2027 | | 194,326 | b | 193,360 | |
Enterprise Fleet Financing LLC, Ser. 2022-3, CI. A2 | | 4.38 | | 7/20/2029 | | 90,352 | b | 88,581 | |
Exeter Automobile Receivables Trust, Ser. 2021-2A, Cl. C | | 0.98 | | 6/15/2026 | | 359,036 | | 351,858 | |
Exeter Automobile Receivables Trust, Ser. 2021-3A, Cl. B | | 0.69 | | 1/15/2026 | | 78,804 | | 78,430 | |
Exeter Automobile Receivables Trust, Ser. 2022-3A, Cl. B | | 4.86 | | 12/15/2026 | | 254,000 | | 251,554 | |
Ford Auto Securitization Trust, Ser. 2020-AA, Cl. B | CAD | 1.87 | | 6/15/2026 | | 450,000 | b | 321,796 | |
Ford Auto Securitization Trust II, Ser. 2022-AA, Cl. A3 | CAD | 5.40 | | 9/15/2028 | | 626,000 | b | 472,207 | |
Ford Credit Auto Owner Trust, Ser. 2020-2, Cl. B | | 1.49 | | 4/15/2033 | | 375,000 | b | 339,405 | |
11
STATEMENT OF INVESTMENTS (continued)
| | | | | | | | | | |
| |
Description | Coupon
Rate (%) | | Maturity
Date | | Principal
Amount ($) | a | Value ($) | |
Bonds and Notes - 96.5% (continued) | | | | | |
Asset-Backed Certificates/Auto Receivables - 13.9% (continued) | | | | | |
Ford Credit Auto Owner Trust, Ser. 2022-C, CI. C | | 5.22 | | 3/15/2030 | | 325,000 | | 318,818 | |
GM Financial Automobile Leasing Trust, Ser. 2021-3, Cl. B | | 0.76 | | 7/21/2025 | | 500,000 | | 483,447 | |
GM Financial Consumer Automobile Receivables Trust, Ser. 2020-4, Cl. B | | 0.73 | | 3/16/2026 | | 300,000 | | 283,581 | |
GMF Canada Leasing Trust, Ser. 2021-1A, Cl. B | CAD | 1.26 | | 5/20/2026 | | 850,000 | b | 642,936 | |
Hertz Vehicle Financing LLC, Ser. 2021-1A, CI. A | | 1.21 | | 12/26/2025 | | 650,000 | b | 611,925 | |
Hyundai Auto Receivables Trust, Ser. 2022-C, CI. A4 | | 5.52 | | 10/16/2028 | | 333,000 | | 336,245 | |
MBarc Credit Canada, Inc., Ser. 2021-AA, Cl. A3 | CAD | 0.93 | | 2/17/2026 | | 323,767 | b | 243,081 | |
Nissan Auto Receivables Owner Trust, Ser. 2022-A, Cl. A2 | | 1.32 | | 11/15/2024 | | 47,378 | | 47,046 | |
OSCAR US Funding XIII LLC, Ser. 2021-2A, Cl. A4 | | 1.27 | | 9/11/2028 | | 600,000 | b | 553,627 | |
PenFed Auto Receivables Owner Trust, Ser. 2022-A, CI. C | | 4.83 | | 12/15/2028 | | 1,000,000 | b | 965,541 | |
Santander Consumer Auto Receivables Trust, Ser. 2020-BA, Cl. C | | 1.29 | | 4/15/2026 | | 210,000 | b | 205,601 | |
Santander Drive Auto Receivables Trust, Ser. 2021-4, CI. C | | 1.26 | | 2/16/2027 | | 260,000 | | 251,162 | |
Santander Drive Auto Receivables Trust, Ser. 2022-5, CI. C | | 4.74 | | 10/16/2028 | | 306,000 | | 298,347 | |
SFS Auto Receivables Securitization Trust, Ser.2023-1A, CI. A2A | | 5.89 | | 3/22/2027 | | 124,000 | b | 123,978 | |
SFS Auto Receivables Securitization Trust, Ser.2023-1A, CI. A3 | | 5.47 | | 10/20/2028 | | 205,000 | b | 204,499 | |
Tesla Auto Lease Trust, Ser. 2021-A, CI. C | | 1.18 | | 3/20/2025 | | 275,000 | b | 269,480 | |
Tesla Auto Lease Trust, Ser. 2021-A, Cl. A3 | | 0.56 | | 3/20/2025 | | 128,129 | b | 127,621 | |
Toyota Auto Receivables Owner Trust, Ser. 2020-D, Cl. A3 | | 0.35 | | 1/15/2025 | | 12,352 | | 12,242 | |
Toyota Auto Receivables Owner Trust, Ser. 2022-D, CI. A3 | | 5.30 | | 9/15/2027 | | 514,000 | | 513,742 | |
Volkswagen Auto Lease Trust, Ser. 2022-A, Cl. A3 | | 3.44 | | 7/21/2025 | | 100,000 | | 98,196 | |
Westlake Automobile Receivables Trust, Ser. 2021-1A, Cl. C | | 0.95 | | 3/16/2026 | | 510,000 | b | 500,264 | |
Westlake Automobile Receivables Trust, Ser. 2021-2A, CI. B | | 0.62 | | 7/15/2026 | | 218,331 | b | 215,969 | |
12
| | | | | | | | | | |
| |
Description | Coupon
Rate (%) | | Maturity
Date | | Principal
Amount ($) | a | Value ($) | |
Bonds and Notes - 96.5% (continued) | | | | | |
Asset-Backed Certificates/Auto Receivables - 13.9% (continued) | | | | | |
World Omni Auto Receivables Trust, Ser. 2023-A, Cl. A3 | | 4.83 | | 5/15/2028 | | 101,000 | | 99,887 | |
| | 14,316,485 | |
Automobiles & Components - 1.8% | | | | | |
Ford Motor Credit Co., LLC, Sr. Unscd. Notes | | 2.30 | | 2/10/2025 | | 290,000 | | 272,187 | |
General Motors Financial Co., Inc., Sr. Unscd. Notes | | 1.70 | | 8/18/2023 | | 300,000 | | 299,401 | |
General Motors Financial Co., Inc., Sr. Unscd. Notes | | 2.35 | | 2/26/2027 | | 400,000 | | 359,289 | |
Mercedes-Benz Finance North America LLC, Gtd. Notes | | 0.75 | | 3/1/2024 | | 650,000 | b | 629,881 | |
Stellantis Finance US, Inc., Gtd. Notes | | 1.71 | | 1/29/2027 | | 330,000 | b | 290,084 | |
| | 1,850,842 | |
Banks - 10.2% | | | | | |
Banco Santander Mexico SA, Sr. Unscd. Notes | | 5.38 | | 4/17/2025 | | 200,000 | b | 198,243 | |
Banco Santander SA, Sr. Unscd. Notes | | 1.85 | | 3/25/2026 | | 600,000 | | 541,375 | |
Banco Santander SA, Sr. Unscd. Notes | | 5.59 | | 8/8/2028 | | 400,000 | | 400,000 | |
Bank of America Corp., Jr. Sub. Notes, Ser. JJ | | 5.13 | | 6/20/2024 | | 192,000 | c | 188,759 | |
Bank of America Corp., Jr. Sub. Notes, Ser. X | | 6.25 | | 9/5/2024 | | 196,000 | c | 194,667 | |
Bank of America Corp., Sr. Unscd. Notes | | 0.98 | | 9/25/2025 | | 700,000 | | 661,564 | |
Barclays PLC, Sr. Unscd. Notes | | 3.93 | | 5/7/2025 | | 300,000 | | 294,699 | |
BNP Paribas SA, Sr. Unscd. Notes | | 2.22 | | 6/9/2026 | | 325,000 | b | 303,864 | |
Canadian Imperial Bank of Commerce, Sr. Unscd. Notes | | 3.30 | | 4/7/2025 | | 650,000 | | 626,132 | |
Citigroup, Inc., Jr. Sub. Bonds, Ser. W | | 4.00 | | 12/10/2025 | | 600,000 | c | 539,964 | |
Citizens Bank NA/ Providence RI, Sr. Unscd. Notes | | 6.06 | | 10/24/2025 | | 500,000 | | 484,280 | |
Credit Agricole SA, Sub. Notes | | 4.38 | | 3/17/2025 | | 600,000 | | 581,464 | |
Deutsche Bank AG, Sr. Unscd. Notes | | 7.15 | | 7/13/2027 | | 360,000 | | 367,346 | |
ING Groep NV, Sr. Unscd. Notes | | 3.55 | | 4/9/2024 | | 280,000 | | 275,673 | |
JPMorgan Chase & Co., Jr. Sub. Bonds, Ser. FF | | 5.00 | | 8/1/2024 | | 614,000 | c | 600,722 | |
JPMorgan Chase & Co., Sr. Unscd. Notes | | 4.85 | | 7/25/2028 | | 445,000 | | 439,136 | |
Morgan Stanley, Sr. Unscd. Notes | | 5.12 | | 2/1/2029 | | 270,000 | | 267,372 | |
Morgan Stanley, Sr. Unscd. Notes | | 6.14 | | 10/16/2026 | | 300,000 | | 303,816 | |
Santander Holdings USA, Inc., Sr. Unscd. Notes | | 6.50 | | 3/9/2029 | | 139,000 | | 139,747 | |
13
STATEMENT OF INVESTMENTS (continued)
| | | | | | | | | | |
| |
Description | Coupon
Rate (%) | | Maturity
Date | | Principal
Amount ($) | a | Value ($) | |
Bonds and Notes - 96.5% (continued) | | | | | |
Banks - 10.2% (continued) | | | | | |
Synovus Bank/Columbus GA, Sr. Unscd. Notes | | 5.63 | | 2/15/2028 | | 300,000 | | 280,060 | |
The Goldman Sachs Group, Inc., Jr. Sub. Notes, Ser. T | | 3.80 | | 5/10/2026 | | 350,000 | c | 289,600 | |
The Goldman Sachs Group, Inc., Sr. Unscd. Notes | | 0.93 | | 10/21/2024 | | 660,000 | | 651,952 | |
The PNC Financial Services Group, Inc., Sr. Unscd. Notes | | 5.67 | | 10/28/2025 | | 379,000 | | 377,249 | |
The Toronto-Dominion Bank, Sr. Unscd. Notes | | 5.53 | | 7/17/2026 | | 361,000 | | 362,737 | |
Truist Financial Corp., Sr. Unscd. Notes | | 1.27 | | 3/2/2027 | | 325,000 | | 289,874 | |
UBS Group AG, Sr. Unscd. Notes | | 2.59 | | 9/11/2025 | | 500,000 | b | 479,901 | |
UBS Group AG, Sr. Unscd. Notes | | 6.37 | | 7/15/2026 | | 350,000 | b | 350,511 | |
| | 10,490,707 | |
Beverage Products - .4% | | | | | |
Bacardi Ltd./Bacardi-Martini BV, Sr. Unscd. Notes | | 5.25 | | 1/15/2029 | | 380,000 | b | 377,090 | |
Chemicals - 1.0% | | | | | |
Celanese US Holdings LLC, Gtd. Notes | | 5.90 | | 7/5/2024 | | 300,000 | | 299,537 | |
Celanese US Holdings LLC, Gtd. Notes | | 6.17 | | 7/15/2027 | | 200,000 | | 201,612 | |
MEGlobal Canada ULC, Gtd. Notes | | 5.00 | | 5/18/2025 | | 300,000 | | 294,374 | |
SPCM SA, Sr. Unscd. Notes | | 3.13 | | 3/15/2027 | | 250,000 | b | 225,188 | |
The Sherwin-Williams Company, Sr. Unscd. Notes | | 4.05 | | 8/8/2024 | | 48,000 | | 47,201 | |
| | 1,067,912 | |
Collateralized Loan Obligations Debt - 7.1% | | | | | |
Antares Ltd. CLO, Ser. 2020-1A, Cl. A1R, (3 Month TSFR +1.72%) | | 7.07 | | 10/23/2033 | | 350,000 | b,d | 344,925 | |
Arbor Realty Commercial Real Estate Notes Ltd. CLO, Ser. 2021-FL4, Cl. A, (1 Month TSFR +1.46%) | | 6.69 | | 11/15/2036 | | 365,000 | b,d | 361,315 | |
Bain Capital Credit Ltd. CLO, Ser. 2020-3A, Cl. A1R, (3 Month TSFR +1.42%) | | 6.77 | | 10/23/2034 | | 360,000 | b,d | 357,863 | |
Ballyrock Ltd. CLO, Ser. 2020-2A, Cl. A1R, (3 Month TSFR +1.27%) | | 6.60 | | 10/20/2031 | | 275,000 | b,d | 273,916 | |
Carlyle US Ltd. CLO, Ser. 2017-1A, Cl. A1R, (3 Month TSFR +1.26%) | | 6.59 | | 4/20/2031 | | 497,731 | b,d | 495,380 | |
Cent 21 Ltd. CLO, Ser. 2014-21A, Cl. A1R3, (3 Month TSFR +1.23%) | | 6.59 | | 7/27/2030 | | 215,274 | b,d | 214,248 | |
14
| | | | | | | | | | |
| |
Description | Coupon
Rate (%) | | Maturity
Date | | Principal
Amount ($) | a | Value ($) | |
Bonds and Notes - 96.5% (continued) | | | | | |
Collateralized Loan Obligations Debt - 7.1% (continued) | | | | | |
Columbia Cent 30 Ltd. CLO, Ser. 2020-30A, Cl. A1, (3 Month TSFR +1.57%) | | 6.90 | | 1/20/2034 | | 330,000 | b,d | 326,885 | |
Dryden 41 Senior Loan Fund CLO, Ser. 2015-41A, Cl. AR, (3 Month TSFR +1.23%) | | 6.54 | | 4/15/2031 | | 268,448 | b,d | 267,231 | |
Dryden 83 Ltd. CLO, Ser. 2020-83A, Cl. B, (3 Month TSFR +1.86%) | | 7.17 | | 1/18/2032 | | 600,000 | b,d | 587,926 | |
Madison Park Funding XXVII Ltd. CLO, Ser. 2018-27A, Cl. A1A, (3 Month TSFR +1.29%) | | 6.62 | | 4/20/2030 | | 298,348 | b,d | 297,730 | |
Madison Park Funding XXX Ltd. CLO, Ser. 2018-30A, Cl. A, (3 Month TSFR +1.01%) | | 6.32 | | 4/15/2029 | | 354,356 | b,d | 352,211 | |
Magnetite XIX Ltd. CLO, Ser. 2017-19A, Cl. AR, (3 Month TSFR +1.31%) | | 6.62 | | 4/17/2034 | | 325,000 | b,d | 322,721 | |
Magnetite XVII Ltd. CLO, Ser. 2016-17A, Cl. AR, (3 Month TSFR +1.36%) | | 6.69 | | 7/20/2031 | | 325,000 | b,d | 324,033 | |
MF1 Ltd. CLO, Ser. 2021-FL7, CI. AS, (1 Month TSFR +1.56%) | | 6.79 | | 10/16/2036 | | 500,000 | b,d | 489,680 | |
MF1 Ltd. CLO, Ser. 2022-FL8, CI. AS, (1 Month SOFR +1.75%) | | 6.82 | | 2/19/2037 | | 375,000 | b,d | 367,720 | |
Neuberger Berman Loan Advisers 40 Ltd. CLO, Ser. 2021-40A, Cl. B, (3 Month TSFR +1.66%) | | 6.97 | | 4/16/2033 | | 400,000 | b,d | 392,325 | |
RIN IV Ltd. CLO, Ser. 2021-1A, CI. A, (3 Month TSFR +1.56%) | | 6.89 | | 4/20/2033 | | 250,000 | b,d | 245,495 | |
Symphony XV Ltd. CLO, Ser. 2014-15A, Cl. BR3, (3 Month TSFR +1.81%) | | 7.12 | | 1/17/2032 | | 550,000 | b,d | 539,928 | |
Symphony XXIV Ltd. CLO, Ser. 2020-24A, Cl. A, (3 Month TSFR +1.46%) | | 6.81 | | 1/23/2032 | | 300,000 | b,d | 298,792 | |
TPRK CLO, Ser. 2021-1A, CI. A1, (3 Month TSFR +1.26%) | | 6.57 | | 4/15/2034 | | 350,000 | b,d | 347,202 | |
Voya Ltd. CLO, Ser. 2019-1A, Cl. AR, (3 Month TSFR +1.32%) | | 6.63 | | 4/15/2031 | | 137,480 | b,d | 137,026 | |
| | 7,344,552 | |
Commercial & Professional Services - .6% | | | | | |
Adani Ports & Special Economic Zone Ltd., Sr. Unscd. Notes | | 3.38 | | 7/24/2024 | | 600,000 | b | 579,854 | |
Commercial Mortgage Pass-Through Certificates - 7.8% | | | | | |
American Homes 4 Rent Trust, Ser. 2014-SFR3, Cl. A | | 3.68 | | 12/17/2036 | | 272,658 | b | 263,741 | |
15
STATEMENT OF INVESTMENTS (continued)
| | | | | | | | | | |
| |
Description | Coupon
Rate (%) | | Maturity
Date | | Principal
Amount ($) | a | Value ($) | |
Bonds and Notes - 96.5% (continued) | | | | | |
Commercial Mortgage Pass-Through Certificates - 7.8% (continued) | | | | | |
BSREP, Ser. 2021-DC, Cl. C, (1 Month TSFR +1.66%) | | 6.89 | | 8/15/2038 | | 500,000 | b,d | 434,706 | |
BXHPP Trust, Ser. 2021-FILM, Cl. B, (1 Month TSFR +1.01%) | | 6.24 | | 8/15/2036 | | 450,000 | b,d | 414,479 | |
CAMB Commercial Mortgage Trust, Ser. 2019-LIFE, Cl. A, (1 Month TSFR +1.18%) | | 6.41 | | 12/15/2037 | | 500,000 | b,d | 498,196 | |
CGDB Commercial Mortgage Trust, Ser. 2019-MOB, Cl. B, (1 Month TSFR +1.36%) | | 6.59 | | 11/15/2036 | | 675,000 | b,d | 660,321 | |
CHC Commercial Mortgage Trust, Ser. 2019-CHC, Cl. C, (1 Month TSFR +1.86%) | | 7.09 | | 6/15/2034 | | 302,149 | b,d | 296,294 | |
Citigroup Commercial Mortgage Trust, Ser. 2014-GC25, Cl. B | | 4.35 | | 10/10/2047 | | 270,000 | | 234,206 | |
CSAIL Commercial Mortgage Trust, Ser. 2015-C1, Cl. A3 | | 3.24 | | 4/15/2050 | | 465,181 | | 447,537 | |
GS Mortgage Securities Corp. Trust, Ser. 2019-70P, Cl. B, (1 Month TSFR +1.43%) | | 6.66 | | 10/15/2036 | | 560,000 | b,d | 524,423 | |
HPLY Trust, Ser. 2019-HIT, Cl. A, (1 Month TSFR +1.11%) | | 6.34 | | 11/15/2036 | | 379,013 | b,d | 375,872 | |
Imperial Fund Mortgage Trust, Ser. 2023-NQM1, Cl. A3 | | 7.16 | | 2/25/2068 | | 464,435 | b | 461,767 | |
JPMBB Commercial Mortgage Securities Trust, Ser. 2015-C30, Cl. A4 | | 3.55 | | 7/15/2048 | | 318,228 | | 302,126 | |
Morgan Stanley Bank of America Merrill Lynch Trust, Ser. 2014-C17, Cl. A4 | | 3.44 | | 8/15/2047 | | 345,007 | | 338,503 | |
Natixis Commercial Mortgage Securities Trust, Ser. 2020-2PAC, Cl. A | | 2.97 | | 12/15/2038 | | 172,355 | b | 160,318 | |
New Residential Mortgage Loan Trust, Ser. 2022-NQM1, CI. A1 | | 2.28 | | 4/25/2061 | | 512,975 | b | 429,863 | |
OBX Trust, Ser. 2023-NQM2, Cl. A1 | | 6.32 | | 1/25/2062 | | 400,440 | b | 399,948 | |
Towd Point Mortgage Trust, Ser. 2023-1, CI. A1 | | 3.75 | | 1/25/2063 | | 103,477 | b | 95,106 | |
Tricon American Homes Trust, Ser. 2017-SFR2, Cl. A | | 2.93 | | 1/17/2036 | | 459,503 | b | 452,074 | |
Tricon American Homes Trust, Ser. 2019-SFR1, Cl. A | | 2.75 | | 3/17/2038 | | 321,848 | b | 298,670 | |
Verus Securitization Trust, Ser. 2019-INV2, CI. A1 | | 3.80 | | 7/25/2059 | | 136,816 | b | 132,621 | |
Wells Fargo Commercial Mortgage Trust, Ser. 2015-C27, Cl. A4 | | 3.19 | | 2/15/2048 | | 384,239 | | 366,949 | |
16
| | | | | | | | | | |
| |
Description | Coupon
Rate (%) | | Maturity
Date | | Principal
Amount ($) | a | Value ($) | |
Bonds and Notes - 96.5% (continued) | | | | | |
Commercial Mortgage Pass-Through Certificates - 7.8% (continued) | | | | | |
Wells Fargo Commercial Mortgage Trust, Ser. 2020-C56, CI. A2 | | 2.50 | | 6/15/2053 | | 300,000 | | 283,828 | |
Wells Fargo Commercial Mortgage Trust, Ser. 2021-SAVE, Cl. A, (1 Month TSFR +1.26%) | | 6.49 | | 2/15/2040 | | 164,210 | b,d | 154,911 | |
| | 8,026,459 | |
Consumer Discretionary - 1.9% | | | | | |
Caesars Entertainment, Inc., Sr. Scd. Notes | | 6.25 | | 7/1/2025 | | 500,000 | b | 497,728 | |
Caesars Entertainment, Inc., Sr. Scd. Notes | | 7.00 | | 2/15/2030 | | 99,000 | b | 100,085 | |
Caesars Entertainment, Inc., Sr. Unscd. Notes | | 8.13 | | 7/1/2027 | | 270,000 | b | 277,175 | |
Lennar Corp., Gtd. Notes | | 4.50 | | 4/30/2024 | | 600,000 | | 595,705 | |
Wynn Macau Ltd., Sr. Unscd. Notes | | 5.63 | | 8/26/2028 | | 600,000 | b | 533,308 | |
| | 2,004,001 | |
Diversified Financials - 3.3% | | | | | |
Aercap Ireland Capital DAC/AerCap Global Aviation Trust, Gtd. Notes | | 1.75 | | 1/30/2026 | | 700,000 | | 632,790 | |
Aercap Ireland Capital DAC/AerCap Global Aviation Trust, Gtd. Notes | | 2.45 | | 10/29/2026 | | 500,000 | | 450,011 | |
Air Lease Corp., Sr. Unscd. Notes | | 3.38 | | 7/1/2025 | | 625,000 | | 596,675 | |
Ally Financial, Inc., Sr. Unscd. Notes | | 4.75 | | 6/9/2027 | | 330,000 | e | 311,301 | |
Capital One Financial Corp., Sub. Notes | | 4.20 | | 10/29/2025 | | 650,000 | | 626,053 | |
Discover Financial Services, Sr. Unscd. Notes | | 3.75 | | 3/4/2025 | | 450,000 | | 433,935 | |
MDGH GMTN RSC Ltd., Gtd. Notes | | 2.50 | | 11/7/2024 | | 320,000 | | 307,800 | |
Nasdaq, Inc., Sr. Unscd. Notes | | 5.35 | | 6/28/2028 | | 85,000 | | 85,195 | |
| | 3,443,760 | |
Energy - 6.7% | | | | | |
Aker BP ASA, Sr. Unscd. Notes | | 3.00 | | 1/15/2025 | | 325,000 | b | 310,142 | |
BP Capital Markets PLC, Gtd. Notes | | 4.38 | | 6/22/2025 | | 345,000 | c | 333,063 | |
Cheniere Corpus Christi Holdings LLC, Sr. Scd. Notes | | 5.88 | | 3/31/2025 | | 585,000 | | 585,136 | |
CITGO Petroleum Corp., Sr. Scd. Notes | | 7.00 | | 6/15/2025 | | 250,000 | b | 247,256 | |
CVR Energy, Inc., Gtd. Bonds | | 5.25 | | 2/15/2025 | | 280,000 | b | 272,198 | |
Ecopetrol SA, Sr. Unscd. Notes | | 8.63 | | 1/19/2029 | | 107,000 | | 110,290 | |
Enbridge, Inc., Gtd. Notes | | 1.60 | | 10/4/2026 | | 500,000 | | 448,113 | |
Enbridge, Inc., Gtd. Notes | | 2.50 | | 1/15/2025 | | 300,000 | | 286,843 | |
Energean Israel Finance Ltd., Sr. Scd. Notes | | 4.50 | | 3/30/2024 | | 275,000 | b | 272,312 | |
Energy Transfer LP, Sr. Unscd. Notes | | 2.90 | | 5/15/2025 | | 500,000 | | 476,689 | |
17
STATEMENT OF INVESTMENTS (continued)
| | | | | | | | | | |
| |
Description | Coupon
Rate (%) | | Maturity
Date | | Principal
Amount ($) | a | Value ($) | |
Bonds and Notes - 96.5% (continued) | | | | | |
Energy - 6.7% (continued) | | | | | |
Energy Transfer LP, Sr. Unscd. Notes | | 5.55 | | 2/15/2028 | | 266,000 | | 267,306 | |
Enterprise Products Operating LLC, Gtd. Notes | | 5.05 | | 1/10/2026 | | 136,000 | | 135,962 | |
EQT Corp., Sr. Unscd. Notes | | 3.13 | | 5/15/2026 | | 500,000 | b | 463,453 | |
Howard Midstream Energy Partners LLC, Sr. Unscd. Notes | | 6.75 | | 1/15/2027 | | 116,000 | b | 112,002 | |
Howard Midstream Energy Partners LLC, Sr. Unscd. Notes | | 8.88 | | 7/15/2028 | | 113,000 | b | 115,655 | |
Marathon Petroleum Corp., Sr. Unscd. Notes | | 3.63 | | 9/15/2024 | | 300,000 | | 293,111 | |
Parkland Corp., Gtd. Notes | | 4.50 | | 10/1/2029 | | 210,000 | b | 185,509 | |
Parkland Corp., Gtd. Notes | | 5.88 | | 7/15/2027 | | 875,000 | b | 852,235 | |
Petroleos Mexicanos, Gtd. Notes | | 4.25 | | 1/15/2025 | | 1,000,000 | e | 950,546 | |
Pioneer Natural Resources Co., Sr. Unscd. Notes | | 1.13 | | 1/15/2026 | | 150,000 | | 135,993 | |
| | 6,853,814 | |
Food Products - .2% | | | | | |
MARB BondCo PLC, Gtd. Bonds | | 3.95 | | 1/29/2031 | | 260,000 | b | 192,752 | |
Foreign Governmental - .5% | | | | | |
Hungary, Sr. Unscd. Notes | | 6.13 | | 5/22/2028 | | 200,000 | b | 203,904 | |
Romania, Sr. Unscd. Notes | | 6.63 | | 2/17/2028 | | 300,000 | b | 311,611 | |
| | 515,515 | |
Health Care - 2.0% | | | | | |
AbbVie, Inc., Sr. Unscd. Notes | | 3.80 | | 3/15/2025 | | 450,000 | | 438,576 | |
Elevance Health, Inc., Sr. Unscd. Notes | | 5.35 | | 10/15/2025 | | 155,000 | | 155,289 | |
HCA, Inc., Gtd. Notes | | 5.38 | | 2/1/2025 | | 300,000 | | 298,355 | |
Royalty Pharma PLC, Gtd. Notes | | 1.20 | | 9/2/2025 | | 325,000 | | 295,551 | |
Shire Acquisitions Investments Ireland DAC, Gtd. Notes | | 3.20 | | 9/23/2026 | | 300,000 | | 282,044 | |
Tenet Healthcare Corp., Sr. Scd. Notes | | 4.88 | | 1/1/2026 | | 300,000 | | 290,652 | |
Teva Pharmaceutical Finance Netherlands III BV, Gtd. Notes | | 3.15 | | 10/1/2026 | | 331,000 | | 299,756 | |
| | 2,060,223 | |
Industrial - .8% | | | | | |
General Electric Co., Jr. Sub. Debs., Ser. D, (3 Month LIBOR +3.33%) | | 8.88 | | 9/15/2023 | | 347,000 | c,d | 348,509 | |
Penske Truck Leasing Co. LP/ PTL Finance Corp., Sr. Unscd. Notes | | 6.05 | | 8/1/2028 | | 141,000 | b | 141,494 | |
TK Elevator US Newco, Inc., Sr. Scd. Notes | | 5.25 | | 7/15/2027 | | 400,000 | b | 374,475 | |
| | 864,478 | |
Insurance - 1.6% | | | | | |
Allianz SE, Jr. Sub. Bonds | | 3.20 | | 10/30/2027 | | 400,000 | b,c | 307,491 | |
18
| | | | | | | | | | |
| |
Description | Coupon
Rate (%) | | Maturity
Date | | Principal
Amount ($) | a | Value ($) | |
Bonds and Notes - 96.5% (continued) | | | | | |
Insurance - 1.6% (continued) | | | | | |
Berkshire Hathaway, Inc., Sr. Unscd. Notes | EUR | 0.87 | | 3/12/2025 | | 875,000 | | 904,688 | |
Jackson Financial, Inc., Sr. Unscd. Notes | | 1.13 | | 11/22/2023 | | 410,000 | | 404,003 | |
| | 1,616,182 | |
Materials - 2.3% | | | | | |
Ardagh Metal Packaging Finance USA LLC/ Ardagh Metal Packaging Finance PLC, Sr. Scd. Notes | | 6.00 | | 6/15/2027 | | 500,000 | b | 493,922 | |
Ball Corp., Gtd. Notes | | 5.25 | | 7/1/2025 | | 575,000 | | 570,479 | |
Berry Global, Inc., Sr. Scd. Notes | | 1.57 | | 1/15/2026 | | 175,000 | | 158,768 | |
Crown Americas LLC/Crown Americas Capital Corp. VI, Gtd. Notes | | 4.75 | | 2/1/2026 | | 190,000 | | 183,846 | |
Sealed Air Corp., Sr. Scd. Notes | | 1.57 | | 10/15/2026 | | 1,075,000 | b | 952,038 | |
| | 2,359,053 | |
Media - .0% | | | | | |
Univision Communications, Inc., Sr. Scd. Notes | | 8.00 | | 8/15/2028 | | 8,000 | b | 8,067 | |
Metals & Mining - ..3% | | | | | |
Anglo American Capital PLC, Gtd. Notes | | 3.63 | | 9/11/2024 | | 300,000 | b | 292,852 | |
Municipal Securities - .1% | | | | | |
Dallas Fort Worth International Airport, Revenue Bonds, Refunding, Ser. C | | 1.33 | | 11/1/2025 | | 75,000 | | 68,969 | |
Real Estate - 4.4% | | | | | |
Boston Properties LP, Sr. Unscd. Notes | | 3.80 | | 2/1/2024 | | 153,000 | | 150,056 | |
Brixmor Operating Partnership LP, Sr. Unscd. Notes | | 2.25 | | 4/1/2028 | | 355,000 | | 301,554 | |
Brixmor Operating Partnership LP, Sr. Unscd. Notes | | 3.85 | | 2/1/2025 | | 95,000 | | 91,439 | |
Equinix, Inc., Sr. Unscd. Notes | | 1.00 | | 9/15/2025 | | 430,000 | e | 391,564 | |
ERP Operating LP, Sr. Unscd. Notes | | 3.38 | | 6/1/2025 | | 650,000 | | 627,310 | |
Extra Space Storage LP, Gtd. Notes | | 5.70 | | 4/1/2028 | | 80,000 | | 80,504 | |
GLP Capital LP/GLP Financing II, Inc., Gtd. Notes | | 5.38 | | 4/15/2026 | | 710,000 | | 697,406 | |
Kimco Realty OP LLC, Gtd. Notes | | 3.85 | | 6/1/2025 | | 235,000 | | 223,699 | |
Realty Income Corp., Sr. Unscd. Notes | | 5.05 | | 1/13/2026 | | 112,000 | | 111,323 | |
SBA Tower Trust, Asset Backed Notes | | 1.84 | | 4/15/2027 | | 500,000 | b | 431,445 | |
SBA Tower Trust, Asset Backed Notes | | 1.88 | | 1/15/2026 | | 275,000 | b | 247,878 | |
19
STATEMENT OF INVESTMENTS (continued)
| | | | | | | | | | |
| |
Description | Coupon
Rate (%) | | Maturity
Date | | Principal
Amount ($) | a | Value ($) | |
Bonds and Notes - 96.5% (continued) | | | | | |
Real Estate - 4.4% (continued) | | | | | |
SBA Tower Trust, Asset Backed Notes | | 2.84 | | 1/15/2025 | | 650,000 | b | 619,399 | |
VICI Properties LP/ VICI Note Co., Inc., Gtd. Notes | | 3.50 | | 2/15/2025 | | 225,000 | b | 216,265 | |
WPC Eurobond BV, Gtd. Notes | EUR | 1.35 | | 4/15/2028 | | 300,000 | | 286,739 | |
| | 4,476,581 | |
Retailing - 1.1% | | | | | |
7-Eleven, Inc., Sr. Unscd. Notes | | 0.80 | | 2/10/2024 | | 500,000 | b | 486,563 | |
Autozone, Inc., Sr. Unscd. Notes | | 3.63 | | 4/15/2025 | | 300,000 | | 291,624 | |
CK Hutchison Europe Finance 18 Ltd., Gtd. Bonds | EUR | 1.25 | | 4/13/2025 | | 300,000 | | 313,768 | |
| | 1,091,955 | |
Semiconductors & Semiconductor Equipment - .3% | | | | | |
Intel Corp., Sr. Unscd. Notes | | 4.88 | | 2/10/2028 | | 104,000 | | 103,687 | |
TSMC Arizona Corp., Gtd. Notes | | 1.75 | | 10/25/2026 | | 240,000 | | 215,947 | |
| | 319,634 | |
Supranational Bank - .6% | | | | | |
The African Export-Import Bank, Sr. Unscd. Notes | | 4.13 | | 6/20/2024 | | 300,000 | | 294,399 | |
The African Export-Import Bank, Sr. Unscd. Notes | | 5.25 | | 10/11/2023 | | 350,000 | | 349,256 | |
| | 643,655 | |
Technology Hardware & Equipment - .3% | | | | | |
Hewlett Packard Enterprise Co., Sr. Unscd. Notes | | 1.45 | | 4/1/2024 | | 300,000 | | 291,131 | |
Kyndryl Holdings, Inc., Sr. Unscd. Notes | | 2.05 | | 10/15/2026 | | 76,000 | | 66,236 | |
| | 357,367 | |
Telecommunication Services - .8% | | | | | |
Millicom International Cellular SA, Sr. Unscd. Notes | | 5.13 | | 1/15/2028 | | 180,000 | b | 161,441 | |
T-Mobile USA, Inc., Gtd. Notes | | 2.25 | | 2/15/2026 | | 300,000 | | 277,484 | |
T-Mobile USA, Inc., Gtd. Notes | | 3.50 | | 4/15/2025 | | 300,000 | | 289,996 | |
T-Mobile USA, Inc., Gtd. Notes | | 4.95 | | 3/15/2028 | | 58,000 | | 57,317 | |
| | 786,238 | |
Transportation - .4% | | | | | |
Canadian Pacific Railway Co., Gtd. Notes | | 1.35 | | 12/2/2024 | | 385,000 | | 363,838 | |
U.S. Government Agencies Collateralized Mortgage Obligations - 1.6% | | | | | |
Federal Home Loan Mortgage Corp., REMIC, Ser. 3541, Cl. KB | | 4.00 | | 6/15/2024 | | 23,108 | f | 22,895 | |
Federal Home Loan Mortgage Corp., REMIC, Ser. 4091 Cl. KC | | 3.00 | | 8/15/2040 | | 55,575 | f | 53,285 | |
20
| | | | | | | | | | |
| |
Description | Coupon
Rate (%) | | Maturity
Date | | Principal
Amount ($) | a | Value ($) | |
Bonds and Notes - 96.5% (continued) | | | | | |
U.S. Government Agencies Collateralized Mortgage Obligations - 1.6% (continued) | | | | | |
Federal Home Loan Mortgage Corp., REMIC, Ser. 4838, Cl. VA | | 4.00 | | 3/15/2036 | | 356,010 | f | 343,124 | |
Federal Home Loan Mortgage Corp., REMIC, Ser. 5050, Cl. XA | | 1.00 | | 7/15/2039 | | 438,641 | f | 388,069 | |
Federal Home Loan Mortgage Corp. Seasoned Credit Risk Transfer Trust, Ser. 2020-3, Cl. TTU | | 2.50 | | 5/25/2060 | | 97,979 | f | 88,479 | |
Federal Home Loan Mortgage Corp. Seasoned Loans Structured Transaction Trust, Ser. 2018-2, Cl. A1 | | 3.50 | | 11/25/2028 | | 57,089 | f | 53,851 | |
Federal National Mortgage Association, REMIC, Ser. 2013-16, Cl. GP | | 3.00 | | 3/25/2033 | | 50,151 | f | 48,277 | |
Government National Mortgage Association, Ser. 2011-H23, Cl. HA | | 3.00 | | 12/20/2061 | | 5,263 | | 4,930 | |
Government National Mortgage Association, Ser. 2022-173, Cl. PQ | | 5.00 | | 6/20/2051 | | 681,512 | | 665,101 | |
| | 1,668,011 | |
U.S. Government Agencies Collateralized Municipal-Backed Securities - .0% | | | | | |
Federal Home Loan Mortgage Corp. Multifamily Structured Credit Risk, Ser. 2021-MN1, Cl. M1, (1 Month SOFR +2.00%) | | 7.07 | | 1/25/2051 | | 47,697 | b,d,f | 45,879 | |
U.S. Government Agencies Mortgage-Backed - .1% | | | | | |
Federal Home Loan Mortgage Corp.: | | | |
2.50%, 7/1/2029 | | | 84,709 | f | 80,403 | |
Government National Mortgage Association II: | | | |
7.00%, 12/20/2030-4/20/2031 | | | 1,787 | | 1,848 | |
7.50%, 11/20/2029-12/20/2030 | | | 1,611 | | 1,649 | |
| | 83,900 | |
U.S. Treasury Securities - 9.1% | | | | | |
U.S. Treasury Bonds | | 6.25 | | 8/15/2023 | | 415,000 | | 415,103 | |
U.S. Treasury Notes | | 0.63 | | 12/31/2027 | | 317,500 | | 271,611 | |
U.S. Treasury Notes | | 1.13 | | 2/28/2027 | | 3,550,000 | | 3,173,229 | |
U.S. Treasury Notes | | 2.88 | | 5/31/2025 | | 1,350,000 | | 1,300,641 | |
U.S. Treasury Notes | | 3.13 | | 8/31/2027 | | 1,530,000 | | 1,463,272 | |
U.S. Treasury Notes | | 3.63 | | 3/31/2028 | | 63,000 | | 61,453 | |
U.S. Treasury Notes | | 4.00 | | 6/30/2028 | | 1,354,000 | e | 1,343,210 | |
U.S. Treasury Notes | | 4.00 | | 2/29/2028 | | 40,000 | | 39,647 | |
U.S. Treasury Notes | | 4.13 | | 10/31/2027 | | 730,000 | | 725,495 | |
U.S. Treasury Notes | | 4.25 | | 10/15/2025 | | 550,000 | | 543,780 | |
| | 9,337,441 | |
21
STATEMENT OF INVESTMENTS (continued)
| | | | | | | | | | |
| |
Description | Coupon
Rate (%) | | Maturity
Date | | Principal
Amount ($) | a | Value ($) | |
Bonds and Notes - 96.5% (continued) | | | | | |
Utilities - 5.4% | | | | | |
American Electric Power Co., Inc., Jr. Sub. Notes | | 2.03 | | 3/15/2024 | | 170,000 | | 165,958 | |
Constellation Energy Generation LLC, Sr. Unscd. Notes | | 5.60 | | 3/1/2028 | | 375,000 | | 379,476 | |
Dominion Energy, Inc., Sr. Unscd. Notes | | 3.90 | | 10/1/2025 | | 575,000 | | 556,199 | |
DTE Energy Co., Sr. Unscd. Notes | | 4.22 | | 11/1/2024 | | 207,000 | | 203,095 | |
Duke Energy Corp., Sr. Unscd. Notes | | 2.65 | | 9/1/2026 | | 300,000 | | 278,158 | |
Electricite de France SA, Sr. Unscd. Notes | | 5.70 | | 5/23/2028 | | 200,000 | b | 201,495 | |
Enel Finance America LLC, Gtd. Notes | | 7.10 | | 10/14/2027 | | 200,000 | b | 210,218 | |
Entergy Corp., Sr. Unscd. Notes | | 0.90 | | 9/15/2025 | | 500,000 | | 453,084 | |
Evergy Missouri West, Inc., First Mortgage Bonds | | 5.15 | | 12/15/2027 | | 855,000 | b | 845,433 | |
NextEra Energy Capital Holdings, Inc., Gtd. Notes | | 4.26 | | 9/1/2024 | | 82,000 | | 80,797 | |
NextEra Energy Capital Holdings, Inc., Gtd. Notes | | 6.05 | | 3/1/2025 | | 62,000 | | 62,476 | |
NiSource, Inc., Sr. Unscd. Notes | | 5.25 | | 3/30/2028 | | 30,000 | | 30,071 | |
NRG Energy, Inc., Sr. Scd. Notes | | 2.00 | | 12/2/2025 | | 600,000 | b | 540,939 | |
Pacific Gas & Electric Co., First Mortgage Bonds | | 3.25 | | 2/16/2024 | | 600,000 | | 590,542 | |
The AES Corp., Sr. Unscd. Notes | | 1.38 | | 1/15/2026 | | 300,000 | | 271,321 | |
The AES Corp., Sr. Unscd. Notes | | 3.30 | | 7/15/2025 | | 300,000 | b | 285,553 | |
Xcel Energy, Inc., Sr. Unscd. Notes | | 1.75 | | 3/15/2027 | | 500,000 | | 443,772 | |
| | 5,598,587 | |
Total Bonds and Notes
(cost $103,661,028) | | 99,270,888 | |
| | Annualized
Yield (%) | | | | | | | |
Short-Term Investments - 1.9% | | | | | |
U.S. Government Securities | | | | | |
U.S. Treasury Bills
(cost $1,958,627) | | 5.35 | | 12/21/2023 | | 2,000,000 | g | 1,958,491 | |
| | 1-Day
Yield (%) | | | | Shares | | | |
Investment Companies - 4.0% | | | | | |
Registered Investment Companies - 4.0% | | | | | |
Dreyfus Institutional Preferred Government Plus Money Market Fund, Institutional Shares
(cost $4,103,714) | | 5.38 | | | | 4,103,714 | h | 4,103,714 | |
22
| | | | | | | | | | |
| |
Description | 1-Day
Yield (%) | | | | Shares | | Value ($) | |
Investment of Cash Collateral for Securities Loaned - 1.6% | | | | | |
Registered Investment Companies - 1.6% | | | | | |
Dreyfus Institutional Preferred Government Plus Money Market Fund, Institutional Shares
(cost $1,616,117) | | 5.38 | | | | 1,616,117 | h | 1,616,117 | |
Total Investments (cost $111,339,486) | | 104.0% | 106,949,210 | |
Liabilities, Less Cash and Receivables | | (4.0%) | (4,083,148) | |
Net Assets | | 100.0% | 102,866,062 | |
LIBOR—London Interbank Offered Rate
REMIC—Real Estate Mortgage Investment Conduit
SOFR—Secured Overnight Financing Rate
TSFR—Term Secured Overnight Financing Rate Reference Rates
CAD—Canadian Dollar
EUR—Euro
a Amount stated in U.S. Dollars unless otherwise noted above.
b Security exempt from registration pursuant to Rule 144A under the Securities Act of 1933. These securities may be resold in transactions exempt from registration, normally to qualified institutional buyers. At July 31, 2023, these securities were valued at $45,102,861 or 43.85% of net assets.
c Security is a perpetual bond with no specified maturity date. Maturity date shown is next reset date of the bond.
d Variable rate security—interest rate resets periodically and rate shown is the interest rate in effect at period end. Security description also includes the reference rate and spread if published and available.
e Security, or portion thereof, on loan. At July 31, 2023, the value of the fund’s securities on loan was $1,706,982 and the value of the collateral was $1,744,474, consisting of cash collateral of $1,616,117 and U.S. Government & Agency securities valued at $128,357. In addition, the value of collateral may include pending sales that are also on loan.
f The Federal Housing Finance Agency (“FHFA”) placed the Federal Home Loan Mortgage Corporation and Federal National Mortgage Association into conservatorship with FHFA as the conservator. As such, the FHFA oversees the continuing affairs of these companies.
g Security is a discount security. Income is recognized through the accretion of discount.
h Investment in affiliated issuer. The investment objective of this investment company is publicly available and can be found within the investment company’s prospectus.
23
STATEMENT OF INVESTMENTS (continued)
| | |
Portfolio Summary (Unaudited) † | Value (%) |
Asset Backed Securities | 22.6 |
Financial | 19.5 |
Government | 12.2 |
Mortgage Securities | 9.6 |
Collateralized Loan Obligations | 7.1 |
Energy | 6.7 |
Investment Companies | 5.6 |
Utilities | 5.4 |
Consumer, Cyclical | 4.9 |
Industrial | 4.2 |
Consumer, Non-cyclical | 3.4 |
Basic Materials | 1.3 |
Communications | .8 |
Technology | .7 |
| | 104.0 |
† Based on net assets.
See notes to financial statements.
24
| | | | | | | |
Affiliated Issuers | | | |
Description | Value ($) 7/31/2022 | Purchases ($)† | Sales ($) | Value ($) 7/31/2023 | Dividends/
Distributions ($) | |
Registered Investment Companies - 4.0% | | |
Dreyfus Institutional Preferred Government Plus Money Market Fund, Institutional Shares - 4.0% | 9,970,569 | 45,329,491 | (51,196,346) | 4,103,714 | 54,091 | |
Investment of Cash Collateral for Securities Loaned - 1.6%†† | | |
Dreyfus Institutional Preferred Government Plus Money Market Fund, Institutional Shares - 1.6% | - | 12,847,986 | (11,231,869) | 1,616,117 | 3,714 | ††† |
Dreyfus Institutional Preferred Government Plus Money Market Fund, SL Shares - .0% | 1,545,600 | 88,512,814 | (90,058,414) | - | 16,096 | ††† |
Total - 5.6% | 11,516,169 | 146,690,291 | (152,486,629) | 5,719,831 | 73,901 | |
† Includes reinvested dividends/distributions.
†† Effective July 3, 2023, cash collateral for securities lending was transferred from Dreyfus Institutional Preferred Government Plus Money Market Fund, SL Shares to Dreyfus Institutional Preferred Government Plus Money Market Fund, Institutional Shares.
††† Represents securities lending income earned from the reinvestment of cash collateral from loaned securities, net of fees and collateral investment expenses, and other payments to and from borrowers of securities.
See notes to financial statements.
25
STATEMENT OF INVESTMENTS (continued)
| | | | | | | |
Futures | | | |
Description | Number of
Contracts | Expiration | Notional
Value ($) | Market
Value ($) | Unrealized Appreciation (Depreciation) ($) | |
Futures Long | | |
U.S. Treasury 2 Year Notes | 72 | 9/29/2023 | 14,848,828 | 14,618,250 | (230,578) | |
U.S. Treasury 5 Year Notes | 109 | 9/29/2023 | 11,867,671 | 11,643,414 | (224,257) | |
Futures Short | | |
Canadian 10 Year Bond | 3 | 9/20/2023 | 281,236a | 273,234 | 8,002 | |
Euro-Bobl | 2 | 9/7/2023 | 256,620a | 254,842 | 1,778 | |
Euro-Schatz | 11 | 9/7/2023 | 1,275,837a | 1,270,527 | 5,310 | |
U.S. Treasury 10 Year Notes | 4 | 9/20/2023 | 457,556 | 445,625 | 11,931 | |
Gross Unrealized Appreciation | | 27,021 | |
Gross Unrealized Depreciation | | (454,835) | |
a Notional amounts in foreign currency have been converted to USD using relevant foreign exchange rates.
See notes to financial statements.
| | | | | | |
Forward Foreign Currency Exchange Contracts | |
Counterparty/ Purchased
Currency | Purchased Currency
Amounts | Currency
Sold | Sold
Currency
Amounts | Settlement Date | Unrealized Appreciation (Depreciation) ($) |
Goldman Sachs & Co. LLC |
United States Dollar | 2,114,428 | Canadian Dollar | 2,788,000 | 8/25/2023 | (586) |
HSBC Securities (USA) Inc. |
United States Dollar | 1,609,206 | Euro | 1,428,000 | 8/25/2023 | 37,073 |
Gross Unrealized Appreciation | | | 37,073 |
Gross Unrealized Depreciation | | | (586) |
See notes to financial statements.
26
| | | | | | |
Centrally Cleared Credit Default Swaps | |
Reference
Obligation | Maturity
Date | Notional
Amount ($) | Market
Value ($) | Upfront
Payments/
Receipts ($) | Unrealized (Depreciation) ($) |
Purchased Contracts:1 | |
Markit iTraxx Europe Index Series 39, Paid Fixed Rate of 1.00% 3 Month | 6/20/2028 | 1,044,525 | (16,287) | (2,036) | (14,251) |
Markit CDX North America Investment Grade Index Series 40, Paid Fixed Rate of 1.00% 3 Month | 6/20/2028 | 5,000,000 | (86,256) | (37,656) | (48,600) |
Gross Unrealized Depreciation | (62,851) |
1 If the fund is a buyer of protection and a credit event occurs, as defined under the terms of the swap agreement, the fund will either (i) receive from the seller of protection an amount equal to the notional amount of the swap and deliver the reference obligation or (ii) receive a net settlement amount in the form of cash or securities equal to the notional amount of the swap less the recovery value of the reference obligation.
See notes to financial statements.
27
STATEMENT OF ASSETS AND LIABILITIES
July 31, 2023
| | | | | | | |
| | | | | | |
| | | Cost | | Value | |
Assets ($): | | | | |
Investments in securities—See Statement of Investments
(including securities on loan, valued at $1,706,982)—Note 1(c): | | | |
Unaffiliated issuers | 105,619,655 | | 101,229,379 | |
Affiliated issuers | | 5,719,831 | | 5,719,831 | |
Cash denominated in foreign currency | | | 61,097 | | 60,512 | |
Dividends, interest and securities lending income receivable | | 598,167 | |
Receivable for shares of Common Stock subscribed | | 558,736 | |
Cash collateral held by broker—Note 4 | | 432,618 | |
Unrealized appreciation on forward foreign
currency exchange contracts—Note 4 | | 37,073 | |
Receivable for futures variation margin—Note 4 | | 10,454 | |
Tax reclaim receivable—Note 1(b) | | 1,225 | |
Receivable for swap variation margin—Note 4 | | 583 | |
Prepaid expenses | | | | | 35,992 | |
| | | | | 108,684,570 | |
Liabilities ($): | | | | |
Due to BNY Mellon Investment Adviser, Inc. and affiliates—Note 3(b) | | 48,365 | |
Cash overdraft due to Custodian | | | | | 965,971 | |
Payable for investment securities purchased | | 2,821,596 | |
Liability for securities on loan—Note 1(c) | | 1,616,117 | |
Payable for shares of Common Stock redeemed | | 244,590 | |
Directors’ fees and expenses payable | | 1,923 | |
Unrealized depreciation on forward foreign
currency exchange contracts—Note 4 | | 586 | |
Other accrued expenses | | | | | 119,360 | |
| | | | | 5,818,508 | |
Net Assets ($) | | | 102,866,062 | |
Composition of Net Assets ($): | | | | |
Paid-in capital | | | | | 121,946,600 | |
Total distributable earnings (loss) | | | | | (19,080,538) | |
Net Assets ($) | | | 102,866,062 | |
| | | | | | |
Net Asset Value Per Share | Class A | Class D | Class I | Class Y | |
Net Assets ($) | 334,242 | 96,110,855 | 6,372,018 | 48,947 | |
Shares Outstanding | 35,408 | 10,146,540 | 672,065 | 5,165 | |
Net Asset Value Per Share ($) | 9.44 | 9.47 | 9.48 | 9.48 | |
| | | | | |
See notes to financial statements. | | | | | |
28
STATEMENT OF OPERATIONS
Year Ended July 31, 2023
| | | | | | | |
| | | | | | |
| | | | | | |
Investment Income ($): | | | | |
Income: | | | | |
Interest (net of $507 foreign taxes withheld at source) | | | 3,604,110 | |
Dividends from affiliated issuers | | | 54,091 | |
Income from securities lending—Note 1(c) | | | 19,810 | |
Total Income | | | 3,678,011 | |
Expenses: | | | | |
Management fee—Note 3(a) | | | 326,875 | |
Shareholder servicing costs—Note 3(b) | | | 305,915 | |
Professional fees | | | 117,305 | |
Registration fees | | | 86,708 | |
Pricing fees | | | 58,906 | |
Chief Compliance Officer fees—Note 3(b) | | | 22,122 | |
Prospectus and shareholders’ reports | | | 16,790 | |
Custodian fees—Note 3(b) | | | 9,695 | |
Directors’ fees and expenses—Note 3(c) | | | 5,587 | |
Loan commitment fees—Note 2 | | | 2,302 | |
Miscellaneous | | | 21,254 | |
Total Expenses | | | 973,459 | |
Less—reduction in expenses due to undertaking—Note 3(a) | | | (322,990) | |
Less—reduction in fees due to earnings credits—Note 3(b) | | | (20,143) | |
Net Expenses | | | 630,326 | |
Net Investment Income | | | 3,047,685 | |
Realized and Unrealized Gain (Loss) on Investments—Note 4 ($): | | |
Net realized gain (loss) on investments and foreign currency transactions | (1,724,719) | |
Net realized gain (loss) on futures | (558,535) | |
Net realized gain (loss) on options transactions | (92,141) | |
Net realized gain (loss) on forward foreign currency exchange contracts | (31,040) | |
Net realized gain (loss) on swap agreements | 23,207 | |
Net Realized Gain (Loss) | | | (2,383,228) | |
Net change in unrealized appreciation (depreciation) on investments
and foreign currency transactions | 891,786 | |
Net change in unrealized appreciation (depreciation) on futures | (495,888) | |
Net change in unrealized appreciation (depreciation) on
forward foreign currency exchange contracts | 78,094 | |
Net change in unrealized appreciation (depreciation) on swap agreements | (62,851) | |
Net Change in Unrealized Appreciation (Depreciation) | | | 411,141 | |
Net Realized and Unrealized Gain (Loss) on Investments | | | (1,972,087) | |
Net Increase in Net Assets Resulting from Operations | | 1,075,598 | |
| | | | | | |
See notes to financial statements. | | | | | |
29
STATEMENT OF CHANGES IN NET ASSETS
| | | | | | | | | | |
| | | | Year Ended July 31, |
| | | | 2023 | | 2022a | |
Operations ($): | | | | | | | | |
Net investment income | | | 3,047,685 | | | | 1,755,045 | |
Net realized gain (loss) on investments | | (2,383,228) | | | | (1,031,101) | |
Net change in unrealized appreciation
(depreciation) on investments | | 411,141 | | | | (7,338,916) | |
Net Increase (Decrease) in Net Assets
Resulting from Operations | 1,075,598 | | | | (6,614,972) | |
Distributions ($): | |
Distributions to shareholders: | | | | | | | | |
Class A | | | (18,047) | | | | (4,277) | |
Class D | | | (3,093,566) | | | | (2,113,684) | |
Class I | | | (193,281) | | | | (17,145) | |
Class Y | | | (1,580) | | | | (195) | |
Total Distributions | | | (3,306,474) | | | | (2,135,301) | |
Capital Stock Transactions ($): | |
Net proceeds from shares sold: | | | | | | | | |
Class A | | | 226,776 | | | | 1,651,246 | |
Class D | | | 11,841,130 | | | | 18,550,198 | |
Class I | | | 1,950,379 | | | | 6,563,996 | |
Class Y | | | - | | | | 50,000 | |
Distributions reinvested: | | | | | | | | |
Class A | | | 16,585 | | | | 4,109 | |
Class D | | | 2,698,909 | | | | 1,930,166 | |
Class I | | | 191,698 | | | | 16,943 | |
Class P | | | - | | | | 1,989 | |
Cost of shares redeemed: | | | | | | | | |
Class A | | | (1,532,058) | | | | (549) | |
Class D | | | (23,212,858) | | | | (36,259,329) | |
Class I | | | (1,622,033) | | | | (619,284) | |
Class P | | | - | | | | (316,713) | |
Increase (Decrease) in Net Assets
from Capital Stock Transactions | (9,441,472) | | | | (8,427,228) | |
Total Increase (Decrease) in Net Assets | (11,672,348) | | | | (17,177,501) | |
Net Assets ($): | |
Beginning of Period | | | 114,538,410 | | | | 131,715,911 | |
End of Period | | | 102,866,062 | | | | 114,538,410 | |
30
| | | | | | | | | | |
| | | | Year Ended July 31, |
| | | | 2023 | | 2022a | |
Capital Share Transactions (Shares): | |
Class A | | | | | | | | |
Shares sold | | | 24,093 | | | | 171,244 | |
Shares issued for distributions reinvested | | | 1,758 | | | | 427 | |
Shares redeemed | | | (162,057) | | | | (57) | |
Net Increase (Decrease) in Shares Outstanding | (136,206) | | | | 171,614 | |
Class Db | | | | | | | | |
Shares sold | | | 1,251,085 | | | | 1,848,040 | |
Shares issued for distributions reinvested | | | 285,186 | | | | 192,838 | |
Shares redeemed | | | (2,466,779) | | | | (3,654,073) | |
Net Increase (Decrease) in Shares Outstanding | (930,508) | | | | (1,613,195) | |
Class Ib | | | | | | | | |
Shares sold | | | 205,274 | | | | 681,490 | |
Shares issued for distributions reinvested | | | 20,231 | | | | 1,763 | |
Shares redeemed | | | (171,970) | | | | (64,723) | |
Net Increase (Decrease) in Shares Outstanding | 53,535 | | | | 618,530 | |
Class Y | | | | | | | | |
Shares sold | | | - | | | | 5,165 | |
Net Increase (Decrease) in Shares Outstanding | - | | | | 5,165 | |
Class Pb | | | | | | | | |
Shares issued for distributions reinvested | | | - | | | | 194 | |
Shares redeemed | | | - | | | | (31,088) | |
Net Increase (Decrease) in Shares Outstanding | - | | | | (30,894) | |
| | | | | | | | | |
a | On May 6, 2022, the fund commenced offering Class A, Class I and Class Y shares and Class P shares converted into Class D shares, Class P shares of the fund were terminated as a separate class of shares. | |
b | During the period ended July 31, 2022, 7,803 Class D shares representing $74,906 were exchanged for 7,795 Class I shares and 1,932 Class P shares representing $18,730 were exchanged for 1,937 Class D shares. | |
See notes to financial statements. | | | | | | | | |
31
FINANCIAL HIGHLIGHTS
The following tables describe the performance for each share class for the fiscal periods indicated. All information (except portfolio turnover rate) reflects financial results for a single fund share. Net asset value total return is calculated assuming an initial investment made at the net asset value at the beginning of the period, reinvestment of all dividends and distributions at net asset value during the period, and redemption at net asset value on the last day of the period. Net asset value total return includes adjustments in accordance with accounting principles generally accepted in the United States of America and as such, the net asset value for financial reporting purposes and the returns based upon those net asset values may differ from the net asset value and returns for shareholder transactions. These figures have been derived from the fund’s financial statements.
| | | | | | | | | |
| | | |
| | | |
Class A Shares | | | Year Ended July 31, |
| | | | | 2023 | 2022a |
Per Share Data ($): | | | | | | |
Net asset value, beginning of period | | | | | 9.64 | 9.67 |
Investment Operations: | | | | | | |
Net investment income (loss)b | | | | | .24 | (.00)c |
Net realized and unrealized
gain (loss) on investments | | | | | (.16) | .00c |
Total from Investment Operations | | | | | .08 | .00c |
Distributions: | | | | | | |
Dividends from
net investment income | | | | | (.28) | (.03) |
Net asset value, end of period | | | | | 9.44 | 9.64 |
Total Return (%)d | | | | | .76 | .13e |
Ratios/Supplemental Data (%): | | | | | | |
Ratio of total expenses to
average net assets | | | | | .94 | 1.17f |
Ratio of net expenses to
average net assets | | | | | .65 | .65f |
Ratio of net investment income
(loss) to average net assets | | | | | 2.73 | .(20)f |
Portfolio Turnover Rate | | | | | 46.00 | 43.43 |
Net Assets, end of period ($ x 1,000) | | | | | 334 | 1,655 |
a From May 6, 2022 (commencement of initial offering) to July 31, 2022.
b Based on average shares outstanding.
c Amount represents less than $.01 per share.
d Exclusive of sales charge.
e Not annualized.
f Annualized.
See notes to financial statements.
32
| | | | | | | | | |
| | | |
| | | |
Class D Shares | | Year Ended July 31, |
| | 2023 | 2022a | 2021 | 2020 | 2019 |
Per Share Data ($): | | | | | | |
Net asset value, beginning of period | | 9.65 | 10.35 | 10.38 | 10.16 | 10.10 |
Investment Operations: | | | | | | |
Net investment incomeb | | .26 | .14 | .16 | .22 | .25 |
Net realized and unrealized
gain (loss) on investments | | (.15) | (.67) | .02 | .25 | .10 |
Total from Investment Operations | | .11 | (.53) | .18 | .47 | .35 |
Distributions: | | | | | | |
Dividends from
net investment income | | (.29) | (.16) | (.19) | (.25) | (.21) |
Dividends from net realized
gain on investments | | - | (.01) | (.02) | - | (.08) |
Total Distributions | | (.29) | (.17) | (.21) | (.25) | (.29) |
Net asset value, end of period | | 9.47 | 9.65 | 10.35 | 10.38 | 10.16 |
Total Return (%) | | 1.15 | (5.15) | 1.78 | 4.66 | 3.53 |
Ratios/Supplemental Data (%): | | | | | | |
Ratio of total expenses to
average net assets | | .91 | 1.27 | 1.19 | 1.16 | 1.07 |
Ratio of net expenses to
average net assets | | .59 | .64 | .65 | .65 | .65 |
Ratio of net investment income
to average net assets | | 2.79 | 1.43 | 1.53 | 2.18 | 2.48 |
Portfolio Turnover Rate | | 46.00 | 43.43 | 127.20c | 98.18c | 143.61 |
Net Assets,
end of period ($ x 1,000) | | 96,111 | 106,861 | 131,395 | 129,876 | 137,065 |
a Effective May 6, 2022, Class P shares converted into Class D shares, terminate Class P shares as a separate class of shares.
b Based on average shares outstanding.
c The portfolio turnover rate excluding mortgage dollar roll transactions for the period ended July 31, 2021 and 2020 were 112.23% and 84.31%, respectively.
See notes to financial statements.
33
FINANCIAL HIGHLIGHTS (continued)
| | | | | | | | | |
| | | |
| | | |
Class I Shares | | | Year Ended July 31, |
| | | | | 2023 | 2022a |
Per Share Data ($): | | | | | | |
Net asset value, beginning of period | | | | | 9.66 | 9.67 |
Investment Operations: | | | | | | |
Net investment incomeb | | | | | .28 | .00c |
Net realized and unrealized
gain (loss) on investments | | | | | (.15) | .03 |
Total from Investment Operations | | | | | .13 | .03 |
Distributions: | | | | | | |
Dividends from
net investment income | | | | | (.31) | (.04) |
Net asset value, end of period | | | | | 9.48 | 9.66 |
Total Return (%) | | | | | 1.36 | .29d |
Ratios/Supplemental Data (%): | | | | | | |
Ratio of total expenses to
average net assets | | | | | .67 | .95e |
Ratio of net expenses to
average net assets | | | | | .39 | .40e |
Ratio of net investment income
to average net assets | | | | | 2.99 | .20e |
Portfolio Turnover Rate | | | | | 46.00 | 43.43 |
Net Assets, end of period ($ x 1,000) | | | | | 6,372 | 5,973 |
a From May 6, 2022 (commencement of initial offering) to July 31, 2022.
b Based on average shares outstanding.
c Amount represents less than $.01 per share.
d Not annualized.
e Annualized.
See notes to financial statements.
34
| | | | | | | | | |
| | | |
| | | |
Class Y Shares | | | Year Ended July 31, |
| | | | | 2023 | 2022a |
Per Share Data ($): | | | | | | |
Net asset value, beginning of period | | | | | 9.65 | 9.67 |
Investment Operations: | | | | | | |
Net investment incomeb | | | | | .28 | .01 |
Net realized and unrealized
gain (loss) on investments | | | | | (.14) | .01 |
Total from Investment Operations | | | | | .14 | .02 |
Distributions: | | | | | | |
Dividends from
net investment income | | | | | (.31) | (.04) |
Net asset value, end of period | | | | | 9.48 | 9.65 |
Total Return (%) | | | | | 1.46 | .19c |
Ratios/Supplemental Data (%): | | | | | | |
Ratio of total expenses to
average net assets | | | | | .69 | .95d |
Ratio of net expenses to
average net assets | | | | | .39 | .40d |
Ratio of net investment income
to average net assets | | | | | 2.99 | .58d |
Portfolio Turnover Rate | | | | | 46.00 | 43.43 |
Net Assets, end of period ($ x 1,000) | | | | | 49 | 50 |
a From May 6, 2022 (commencement of initial offering) to July 31, 2022.
b Based on average shares outstanding.
c Not annualized.
d Annualized.
See notes to financial statements.
35
NOTES TO FINANCIAL STATEMENTS
NOTE 1—Significant Accounting Policies:
BNY Mellon Short Term Income Fund (the “fund”) is the sole series of BNY Mellon Investment Funds VII, Inc. (the “Company”), which is registered under the Investment Company Act of 1940, as amended (the “Act”), as a diversified open-end management investment company. The fund’s investment objective is to seek to maximize total return, consisting of capital appreciation and current income. BNY Mellon Investment Adviser, Inc. (the “Adviser”), a wholly-owned subsidiary of The Bank of New York Mellon Corporation (“BNY Mellon”), serves as the fund’s investment adviser. Insight North America LLC (the “Sub-Adviser”), an indirect wholly-owned subsidiary of BNY Mellon and an affiliate of the Adviser, serves as the fund’s sub-adviser.
BNY Mellon Securities Corporation (the “Distributor”), a wholly-owned subsidiary of the Adviser, is the distributor of the fund’s shares. The fund is authorized to issue 500 million shares of $.001 par value Common Stock in each of the following classes of shares: Class A, Class D, Class I and Class Y. Class A shares are sold primarily to retail investors through financial intermediaries and bear Shareholder Services Plan fees. Class A shares generally are subject to a sales charge imposed at the time of purchase. Class A shares bought without an initial sales charge as part of an investment of $250,000 or more may be charged a contingent deferred sales charge (“CDSC”) of 1.00% if redeemed within one year. Class D shares are sold at net asset value per share generally to institutional investors and bear Shareholder Services Plan fees. Class I shares are sold primarily to bank trust departments and other financial service providers (including BNY Mellon and its affiliates), acting on behalf of customers having a qualified trust or an investment account or relationship at such institution, and bear no Shareholder Services Plan fees. Class Y shares are sold at net asset value per share generally to institutional investors, and bear no Shareholder Services Plan fees. Class I and Class Y shares are offered without a front-end sales charge or CDSC. Other differences between the classes include the services offered to and the expenses borne by each class, the allocation of certain transfer agency costs and certain voting rights. Income, expenses (other than expenses attributable to a specific class), and realized and unrealized gains or losses on investments are allocated to each class of shares based on its relative net assets.
As of July 31, 2023, MBC Investments Corporation, an indirect subsidiary of BNY Mellon, held 5,165 of Class A shares and all of the outstanding Class Y shares of the fund.
36
The Company accounts separately for the assets, liabilities and operations of each series. Expenses directly attributable to each series are charged to that series’ operations; expenses which are applicable to all series are allocated among them on a pro rata basis.
The Financial Accounting Standards Board (“FASB”) Accounting Standards Codification (“ASC”) is the exclusive reference of authoritative U.S. generally accepted accounting principles (“GAAP”) recognized by the FASB to be applied by nongovernmental entities. Rules and interpretive releases of the SEC under authority of federal laws are also sources of authoritative GAAP for SEC registrants. The fund is an investment company and applies the accounting and reporting guidance of the FASB ASC Topic 946 Financial Services-Investment Companies. The fund’s financial statements are prepared in accordance with GAAP, which may require the use of management estimates and assumptions. Actual results could differ from those estimates.
The Company enters into contracts that contain a variety of indemnifications. The fund’s maximum exposure under these arrangements is unknown. The fund does not anticipate recognizing any loss related to these arrangements.
(a) Portfolio valuation: The fair value of a financial instrument is the amount that would be received to sell an asset or paid to transfer a liability in an orderly transaction between market participants at the measurement date (i.e., the exit price). GAAP establishes a fair value hierarchy that prioritizes the inputs of valuation techniques used to measure fair value. This hierarchy gives the highest priority to unadjusted quoted prices in active markets for identical assets or liabilities (Level 1 measurements) and the lowest priority to unobservable inputs (Level 3 measurements).
Additionally, GAAP provides guidance on determining whether the volume and activity in a market has decreased significantly and whether such a decrease in activity results in transactions that are not orderly. GAAP requires enhanced disclosures around valuation inputs and techniques used during annual and interim periods.
Various inputs are used in determining the value of the fund’s investments relating to fair value measurements. These inputs are summarized in the three broad levels listed below:
Level 1—unadjusted quoted prices in active markets for identical investments.
37
NOTES TO FINANCIAL STATEMENTS (continued)
Level 2—other significant observable inputs (including quoted prices for similar investments, interest rates, prepayment speeds, credit risk, etc.).
Level 3—significant unobservable inputs (including the fund’s own assumptions in determining the fair value of investments).
The inputs or methodology used for valuing securities are not necessarily an indication of the risk associated with investing in those securities.
Changes in valuation techniques may result in transfers in or out of an assigned level within the disclosure hierarchy. Valuation techniques used to value the fund’s investments are as follows:
The Company’s Board of Directors (the “Board”) has designated the Adviser as the fund’s valuation designee, effective September 8, 2022, to make all fair value determinations with respect to the fund’s portfolio investments, subject to the Board’s oversight and pursuant to Rule 2a-5 under the Act.
Registered investment companies that are not traded on an exchange are valued at their net asset value and are generally categorized within Level 1 of the fair value hierarchy.
Investments in debt securities, excluding short-term investments (other than U.S. Treasury Bills), forward foreign currency exchange contracts (“forward contracts”), futures and options are valued each business day by one or more independent pricing services (each, a “Service”) approved by the Board. Investments for which quoted bid prices are readily available and are representative of the bid side of the market in the judgment of a Service are valued at the mean between the quoted bid prices (as obtained by a Service from dealers in such securities) and asked prices (as calculated by a Service based upon its evaluation of the market for such securities). Securities are valued as determined by a Service, based on methods which include consideration of the following: yields or prices of securities of comparable quality, coupon, maturity and type; indications as to values from dealers; and general market conditions. The Services are engaged under the general supervision of the Board. These securities are generally categorized within Level 2 of the fair value hierarchy.
When market quotations or official closing prices are not readily available, or are determined not to accurately reflect fair value, such as when the value of a security has been significantly affected by events after the close of the exchange or market on which the security is principally traded (for example, a foreign exchange or market), but before the fund calculates its net asset value, the fund may value these investments at fair value as
38
determined in accordance with the procedures approved by the Board. Certain factors may be considered when fair valuing investments such as: fundamental analytical data, the nature and duration of restrictions on disposition, an evaluation of the forces that influence the market in which the securities are purchased and sold, and public trading in similar securities of the issuer or comparable issuers. These securities are either categorized within Level 2 or 3 of the fair value hierarchy depending on the relevant inputs used.
For securities where observable inputs are limited, assumptions about market activity and risk are used and such securities are generally categorized within Level 3 of the fair value hierarchy.
Investments denominated in foreign currencies are translated to U.S. dollars at the prevailing rates of exchange.
Forward contracts are valued at the forward rate and are generally categorized within Level 2 of the fair value hierarchy. Futures, which are traded on an exchange, are valued at the last sales price on the securities exchange on which such securities are primarily traded or at the last sales price on the national securities market on each business day and are generally categorized within Level 1 of the fair value hierarchy. Investments in swap agreements are valued each business day by a Service. Swap agreements are valued by a Service by using a swap pricing model which incorporates among other factors, default probabilities, recovery rates, credit curves of the underlying issuer and swap spreads on interest rates and are generally categorized within Level 2 of the fair value hierarchy.
The following is a summary of the inputs used as of July 31, 2023 in valuing the fund’s investments:
| | | | | | | |
| | Level 1-Unadjusted Quoted Prices | Level 2- Other Significant Observable Inputs | | Level 3-Significant Unobservable Inputs | Total | |
Assets ($) | | |
Investments in Securities:† | | |
Asset-Backed Securities | - | 23,271,388 | | - | 23,271,388 | |
Collateralized Loan Obligations | - | 7,344,552 | | - | 7,344,552 | |
Commercial Mortgage-Backed | - | 8,026,459 | | - | 8,026,459 | |
Corporate Bonds | - | 48,908,774 | | - | 48,908,774 | |
Foreign Governmental | - | 515,515 | | - | 515,515 | |
39
NOTES TO FINANCIAL STATEMENTS (continued)
| | | | | | | |
| | Level 1-Unadjusted Quoted Prices | Level 2- Other Significant Observable Inputs | | Level 3-Significant Unobservable Inputs | Total | |
Assets ($) (continued) | | |
Investments in Securities:† (continued) | | |
Investment Companies | 5,719,831 | - | | - | 5,719,831 | |
Municipal Securities | - | 68,969 | | - | 68,969 | |
U.S. Government Agencies Collateralized Mortgage Obligations | - | 1,668,011 | | - | 1,668,011 | |
U.S. Government Agencies Collateralized Municipal-Backed Securities | - | 45,879 | | - | 45,879 | |
U.S. Government Agencies Mortgage-Backed | - | 83,900 | | - | 83,900 | |
U.S. Treasury Securities | - | 11,295,932 | | - | 11,295,932 | |
Other Financial Instruments: | | |
Forward Foreign Currency Exchange Contracts†† | - | 37,073 | | - | 37,073 | |
Futures†† | 27,021 | - | | - | 27,021 | |
Liabilities ($) | | |
Other Financial Instruments: | | |
Forward Foreign Currency Exchange Contracts†† | - | (586) | | - | (586) | |
Futures†† | (454,835) | - | | - | (454,835) | |
Swap Agreements†† | - | (62,851) | | - | (62,851) | |
† See Statement of Investments for additional detailed categorizations, if any.
†† Amount shown represents unrealized appreciation (depreciation) at period end, but only variation margin on exchange-traded and centrally cleared derivatives, if any, are reported in the Statement of Assets and Liabilities.
(b) Foreign currency transactions: The fund does not isolate that portion of the results of operations resulting from changes in foreign exchange rates on investments from the fluctuations arising from changes in the market prices of securities held. Such fluctuations are included with the net realized and unrealized gain or loss on investments.
40
Net realized foreign exchange gains or losses arise from sales of foreign currencies, currency gains or losses realized on securities transactions between trade and settlement date, and the difference between the amounts of dividends, interest and foreign withholding taxes recorded on the fund’s books and the U.S. dollar equivalent of the amounts actually received or paid. Net unrealized foreign exchange gains and losses arise from changes in the value of assets and liabilities other than investments resulting from changes in exchange rates. Foreign currency gains and losses on foreign currency transactions are also included with net realized and unrealized gain or loss on investments.
Foreign taxes: The fund may be subject to foreign taxes (a portion of which may be reclaimable) on income, stock dividends, realized and unrealized capital gains on investments or certain foreign currency transactions. Foreign taxes are recorded in accordance with the applicable foreign tax regulations and rates that exist in the foreign jurisdictions in which the fund invests. These foreign taxes, if any, are paid by the fund and are reflected in the Statement of Operations, if applicable. Foreign taxes payable or deferred or those subject to reclaims as of July 31, 2023, if any, are disclosed in the fund’s Statement of Assets and Liabilities.
(c) Securities transactions and investment income: Securities transactions are recorded on a trade date basis. Realized gains and losses from securities transactions are recorded on the identified cost basis. Dividend income is recognized on the ex-dividend date and interest income, including, where applicable, accretion of discount and amortization of premium on investments, is recognized on the accrual basis.
Pursuant to a securities lending agreement with BNY Mellon, the fund may lend securities to qualified institutions. It is the fund’s policy that, at origination, all loans are secured by collateral of at least 102% of the value of U.S. securities loaned and 105% of the value of foreign securities loaned. Collateral equivalent to at least 100% of the market value of securities on loan is maintained at all times. Collateral is either in the form of cash, which can be invested in certain money market mutual funds managed by the Adviser, or U.S. Government and Agency securities. The fund is entitled to receive all dividends, interest and distributions on securities loaned, in addition to income earned as a result of the lending transaction. Should a borrower fail to return the securities in a timely manner, BNY Mellon is required to replace the securities for the benefit of the fund or credit the fund with the market value of the unreturned securities and is subrogated to the fund’s rights against the borrower and the collateral. Additionally, the contractual maturity of security lending
41
NOTES TO FINANCIAL STATEMENTS (continued)
transactions are on an overnight and continuous basis. During the period ended July 31, 2023, BNY Mellon earned $2,700 from the lending of the fund’s portfolio securities, pursuant to the securities lending agreement.
(d) Affiliated issuers: Investments in other investment companies advised by the Adviser are considered “affiliated” under the Act.
(e) Market Risk: The value of the securities in which the fund invests may be affected by political, regulatory, economic and social developments, and developments that impact specific economic sectors, industries or segments of the market. The value of a security may also decline due to general market conditions that are not specifically related to a particular company or industry, such as real or perceived adverse economic conditions, changes in the general outlook for corporate earnings, changes in interest or currency rates, changes to inflation, adverse changes to credit markets or adverse investor sentiment generally. In addition, turbulence in financial markets and reduced liquidity in equity, credit and/or fixed-income markets may negatively affect many issuers, which could adversely affect the fund. Global economies and financial markets are becoming increasingly interconnected, and conditions and events in one country, region or financial market may adversely impact issuers in a different country, region or financial market. These risks may be magnified if certain events or developments adversely interrupt the global supply chain; in these and other circumstances, such risks might affect companies world-wide. Recent examples include pandemic risks related to COVID-19 and aggressive measures taken world-wide in response by governments, including closing borders, restricting international and domestic travel, and the imposition of prolonged quarantines of large populations, and by businesses, including changes to operations and reducing staff.
Foreign Investment Risk: To the extent the fund invests in foreign securities, the fund’s performance will be influenced by political, social and economic factors affecting investments in foreign issuers. Special risks associated with investments in foreign issuers include exposure to currency fluctuations, less liquidity, less developed or less efficient trading markets, lack of comprehensive company information, political and economic instability and differing auditing and legal standards. Investments denominated in foreign currencies are subject to the risk that such currencies will decline in value relative to the U.S. dollar and affect the value of these investments held by the fund.
Derivatives Risk: A small investment in derivatives could have a potentially large impact on the fund’s performance. The use of derivatives involves risks different from, or possibly greater than, the risks associated with investing directly in the underlying assets, and the fund’s use of
42
derivatives may result in losses to the fund. Derivatives in which the fund may invest can be highly volatile, illiquid and difficult to value, and there is the risk that changes in the value of a derivative held by the fund will not correlate with the underlying assets or the fund’s other investments in the manner intended. Certain derivatives have the potential for unlimited loss, regardless of the size of the initial investment, and involve greater risks than the underlying assets because, in addition to general market risks, they are subject to liquidity risk, credit and counterparty risk (failure of the counterparty to the derivatives transaction to honor its obligation) and pricing risk (risk that the derivative cannot or will not be accurately valued).
Debt Risk: The fund invests in debt securities. Failure of an issuer of the debt securities to make timely interest or principal payments, or a decline or the perception of a decline in the credit quality of a debt security, can cause the debt security’s price to fall, potentially lowering the fund’s share price. High yield (“junk”) bonds involve greater credit risk, including the risk of default, than investment grade bonds, and are considered predominantly speculative with respect to the issuer’s continuing ability to make principal and interest payments. In addition, the value of debt securities may decline due to general market conditions that are not specifically related to a particular issuer, such as real or perceived adverse economic conditions, changes in outlook for corporate earnings, changes in interest or currency rates or adverse investor sentiment. Such values may also decline because of factors that affect a particular industry or country.
(f) Dividends and distributions to shareholders: It is the policy of the fund to declare dividends daily from net investment income. Such dividends are paid monthly. Dividends from net realized capital gains, if any, are normally declared and paid annually, but the fund may make distributions on a more frequent basis to comply with the distribution requirements of the Internal Revenue Code of 1986, as amended (the “Code”). To the extent that net realized capital gains can be offset by capital loss carryovers, it is the policy of the fund not to distribute such gains. Income and capital gain distributions are determined in accordance with income tax regulations, which may differ from GAAP.
(g) Federal income taxes: It is the policy of the fund to continue to qualify as a regulated investment company, if such qualification is in the best interests of its shareholders, by complying with the applicable provisions of the Code, and to make distributions of taxable income and net realized capital gain sufficient to relieve it from substantially all federal income and excise taxes.
43
NOTES TO FINANCIAL STATEMENTS (continued)
As of and during the period ended July 31, 2023, the fund did not have any liabilities for any uncertain tax positions. The fund recognizes interest and penalties, if any, related to uncertain tax positions as income tax expense in the Statement of Operations. During the period ended July 31, 2023, the fund did not incur any interest or penalties.
Each tax year in the four-year period ended July 31, 2023 remains subject to examination by the Internal Revenue Service and state taxing authorities.
At July 31, 2023, the components of accumulated earnings on a tax basis were as follows: accumulated capital and other losses $13,973,595 and unrealized depreciation $5,071,796. In addition, the fund deferred for tax purposes late year ordinary losses of $35,147 to the first day of the following fiscal year.
The fund is permitted to carry forward capital losses for an unlimited period. Furthermore, capital loss carryovers retain their character as either short-term or long-term capital losses.
The accumulated capital loss carryover is available for federal income tax purposes to be applied against future net realized capital gains, if any, realized subsequent to July 31, 2023. The fund has $5,189,064 of short-term capital losses and $8,783,188 of long-term capital losses which can be carried forward for an unlimited period.
The tax character of distributions paid to shareholders during the fiscal years ended July 31, 2023 and July 31, 2022 were as follows: ordinary income $3,306,474 and $2,135,301, respectively.
(h) New accounting pronouncements: In 2020, the FASB issued Accounting Standards Update No. 2020-04, Reference Rate Reform (Topic 848): Facilitation of the Effects of Reference Rate Reform on Financial Reporting, which provides optional guidance to ease the potential burden in accounting for (or recognizing the effects of) reference rate reform on financial reporting.
The objective of the guidance in Topic 848 is to provide temporary relief during the transition period. The FASB included a sunset provision within Topic 848 based on expectations of when the LIBOR would cease being published. At the time that Update 2020-04 was issued, the UK Financial Conduct Authority (FCA) had established its intent that it would no longer be necessary to persuade, or compel, banks to submit to LIBOR after December 31, 2021. As a result, the sunset provision was set for December 31, 2022—12 months after the expected cessation date of all currencies and tenors of LIBOR.
44
In March 2021, the FCA announced that the intended cessation date of the overnight 1-, 3-, 6-, and 12-month tenors of USD LIBOR would be June 30, 2023, which is beyond the current sunset date of Topic 848.
Because the current relief in Topic 848 may not cover a period of time during which a significant number of modifications may take place, the amendments in this Update defer the sunset date of Topic 848 from December 31, 2022, to December 31, 2024 (“FASB Sunset Date”), after which entities will no longer be permitted to apply the relief in Topic 848.
Management had evaluated the impact of Topic 848 on the fund’s investments, derivatives, debt and other contracts that will undergo reference rate-related modifications as a result of the Reference Rate Reform. Management has no concerns in adopting Topic 848 by FASB Sunset Date. Management will continue to work with other financial institutions and counterparties to modify contracts as required by applicable regulation and within the regulatory deadlines.
NOTE 2—Bank Lines of Credit:
The fund participates with other long-term open-end funds managed by the Adviser in a $823.5 million unsecured credit facility led by Citibank, N.A. (the “Citibank Credit Facility”) and a $300 million unsecured credit facility provided by BNY Mellon (the “BNYM Credit Facility”), each to be utilized primarily for temporary or emergency purposes, including the financing of redemptions (each, a “Facility”). The Citibank Credit Facility is available in two tranches: (i) Tranche A is in an amount equal to $688.5 million and is available to all long-term open-ended funds, including the fund, and (ii) Tranche B is an amount equal to $135 million and is available only to BNY Mellon Floating Rate Income Fund, a series of BNY Mellon Investment Funds IV, Inc. In connection therewith, the fund has agreed to pay its pro rata portion of commitment fees for Tranche A of the Citibank Credit Facility and the BNYM Credit Facility. Interest is charged to the fund based on rates determined pursuant to the terms of the respective Facility at the time of borrowing. During the period ended July 31, 2023, the fund did not borrow under the Facilities.
NOTE 3—Management Fee, Sub-Advisory Fee and Other Transactions with Affiliates:
(a) Pursuant to a management agreement with the Adviser, the management fee is computed at the annual rate of .30% of the value of the fund’s average daily net assets and is payable monthly. The Adviser has contractually agreed, from August 1, 2022 through December 1, 2023, to waive receipt of its fees and/or assume the direct expenses of the fund so that the direct expenses of none of the fund’s share classes (excluding
45
NOTES TO FINANCIAL STATEMENTS (continued)
Shareholder Services Plan fees, taxes, interest expense, brokerage commissions, commitment fees on borrowings and extraordinary expenses) exceed .40% of the value of the fund’s average daily net assets. On or after December 1, 2023, the Adviser may terminate this expense limitation at any time. The reduction in expenses, pursuant to the undertaking, amounted to $322,990 during the period ended July 31, 2023.
Pursuant to a sub-investment advisory agreement between the Adviser and the Sub-Adviser, the Adviser pays the Sub-Adviser a monthly fee at an annual rate of .15% of the value of the fund’s average daily net assets.
During the period ended July 31, 2023, the Distributor retained $1 from commissions earned on sales of the fund’s Class A shares.
(b) Under the Shareholder Services Plan, the fund pays the Distributor at an annual rate of .25% of the value of the average daily net assets of Class A shares and .20% of the value of the average daily net assets of Class D shares for the provision of certain services. The services provided may include personal services relating to shareholder accounts, such as answering shareholder inquiries regarding the fund, and services related to the maintenance of shareholder accounts. The Distributor may make payments to Service Agents (securities dealers, financial institutions or other industry professionals) with respect to these services. The Distributor determines the amounts to be paid to Service Agents. During the period ended July 31, 2023, Class A and Class D shares were charged $1,614 and $204,591 respectively, pursuant to the Shareholder Services Plan.
The fund has an arrangement with BNY Mellon Transfer, Inc., (the “Transfer Agent”), a subsidiary of BNY Mellon and an affiliate of the Adviser, whereby the fund may receive earnings credits when positive cash balances are maintained, which are used to offset Transfer Agent fees. For financial reporting purposes, the fund includes transfer agent net earnings credits, if any, as an expense offset in the Statement of Operations.
The fund has an arrangement with The Bank of New York Mellon (the “Custodian”), a subsidiary of BNY Mellon and an affiliate of the Adviser, whereby the fund will receive interest income or be charged overdraft fees when cash balances are maintained. For financial reporting purposes, the fund includes this interest income and overdraft fees, if any, as interest income in the Statement of Operations.
The fund compensates the Transfer Agent, under a transfer agency agreement, for providing transfer agency and cash management services for the fund. The majority of Transfer Agent fees are comprised of amounts paid on a per account basis, while cash management fees are
46
related to fund subscriptions and redemptions. During the period ended July 31, 2023, the fund was charged $51,288 for transfer agency services. These fees are included in Shareholder servicing costs in the Statement of Operations. These fees were partially offset by earnings credits of $20,143.
The fund compensates the Custodian, under a custody agreement, for providing custodial services for the fund. These fees are determined based on net assets, geographic region and transaction activity. During the period ended July 31, 2023, the fund was charged $9,695 pursuant to the custody agreement.
The fund compensates the Custodian, under a shareholder redemption draft processing agreement, for providing certain services related to the fund’s check writing privilege. During the period ended July 31, 2023, the fund was charged $3,335 pursuant to the agreement, which is included in Shareholder servicing costs in the Statement of Operations.
During the period ended July 31, 2023, the fund was charged $22,122 for services performed by the fund’s Chief Compliance Officer and his staff. These fees are included in Chief Compliance Officer fees in the Statement of Operations.
The components of “Due to BNY Mellon Investment Adviser, Inc. and affiliates” in the Statement of Assets and Liabilities consist of: management fee of $26,206, Shareholder Services Plan fees of $16,385, Custodian fees of $4,154, Chief Compliance Officer fees of $9,848 and Transfer Agent fees of $8,511, which are offset against an expense reimbursement currently in effect in the amount of $16,739.
(c) Each board member also serves as a board member of other funds in the BNY Mellon Family of Funds complex. Annual retainer fees and attendance fees are allocated to each fund based on net assets.
NOTE 4—Securities Transactions:
The aggregate amount of purchases and sales (including paydowns) of investment securities, excluding short-term securities, futures, forward contracts, options and swap agreements, during the period ended July 31, 2023, amounted to $47,257,562 and $46,120,338, respectively.
Derivatives: A derivative is a financial instrument whose performance is derived from the performance of another asset. The fund enters into International Swaps and Derivatives Association, Inc. Master Agreements or similar agreements (collectively, “Master Agreements”) with its over-the counter (“OTC”) derivative contract counterparties in order to, among other things, reduce its credit risk to counterparties. Master Agreements include provisions for general obligations, representations, collateral and
47
NOTES TO FINANCIAL STATEMENTS (continued)
events of default or termination. Under a Master Agreement, the fund may offset with the counterparty certain derivative financial instruments’ payables and/or receivables with collateral held and/or posted and create one single net payment in the event of default or termination. The SEC adopted Rule 18f-4 under the Act, which, effective August 18, 2022, regulates the use of derivatives transactions for certain funds registered under the Act. The fund's derivative transactions are subject to a value-at-risk leverage limit and certain reporting and other requirements pursuant to a derivatives risk management program adopted by the fund.
Each type of derivative instrument that was held by the fund during the period ended July 31, 2023 is discussed below.
Futures: In the normal course of pursuing its investment objective, the fund is exposed to market risk, including interest rate risk as a result of changes in value of underlying financial instruments. The fund invests in futures in order to manage its exposure to or protect against changes in the market. A futures contract represents a commitment for the future purchase or a sale of an asset at a specified date. Upon entering into such contracts, these investments require initial margin deposits with a counterparty, which consist of cash or cash equivalents. The amount of these deposits is determined by the exchange or Board of Trade on which the contract is traded and is subject to change. Accordingly, variation margin payments are received or made to reflect daily unrealized gains or losses which are recorded in the Statement of Operations. When the contracts are closed, the fund recognizes a realized gain or loss which is reflected in the Statement of Operations. There is minimal counterparty credit risk to the fund with futures since they are exchange traded, and the exchange guarantees the futures against default. Futures open at July 31, 2023 are set forth in the Statement of Investments.
Options Transactions: The fund purchases and writes (sells) put and call options to hedge against changes in the values of interest rates, credit, or as a substitute for an investment. The fund is subject to market risk, interest rate risk and credit risk in the course of pursuing its investment objectives through its investments in options contracts. A call option gives the purchaser of the option the right (but not the obligation) to buy, and obligates the writer to sell, the underlying financial instrument at the exercise price at any time during the option period, or at a specified date. Conversely, a put option gives the purchaser of the option the right (but not the obligation) to sell, and obligates the writer to buy the underlying financial instrument at the exercise price at any time during the option period, or at a specified date.
48
As a writer of call options, the fund receives a premium at the outset and then bears the market risk of unfavorable changes in the price of the financial instrument underlying the option. Generally, the fund realizes a gain, to the extent of the premium, if the price of the underlying financial instrument decreases between the date the option is written and the date on which the option is terminated. Generally, the fund incurs a loss if the price of the financial instrument increases between those dates. The maximum payout for those contracts is limited to the number of call option contracts written and the related strike prices, respectively.
As a writer of put options, the fund receives a premium at the outset and then bears the market risk of unfavorable changes in the price of the financial instrument underlying the option. Generally, the fund realizes a gain, to the extent of the premium, if the price of the underlying financial instrument increases between the date the option is written and the date on which the option is terminated. Generally, the fund incurs a loss if the price of the financial instrument decreases between those dates. The maximum payout for those contracts is limited to the number of put option contracts written and the related strike prices, respectively.
As a writer of an option, the fund has no control over whether the underlying financial instrument may be sold (call) or purchased (put) and as a result bears the market risk of an unfavorable change in the price of the financial instrument underlying the written option. There is a risk of loss from a change in value of such options which may exceed the related premiums received. This risk is mitigated by Master Agreements between the fund and the counterparty and the posting of collateral, if any, by the counterparty to the fund to cover the fund’s exposure to the counterparty. The Statement of Operations reflects any unrealized gains or losses which occurred during the period as well as any realized gains or losses which occurred upon the expiration or closing of the option transaction. Purchase and write options on swaps (“swaptions”) are used primarily to preserve a return or spread on a particular investment or portion of the fund holdings. The purchaser and writer of a swaption is buying or granting the right to enter into a previously agreed upon interest rate or credit default swap agreement (interest rate risk and/or credit risk) at any time before the expiration of the option. As of July 31, 2023, there was no options written and options purchased outstanding.
Forward Foreign Currency Exchange Contracts: The fund enters into forward contracts in order to hedge its exposure to changes in foreign currency exchange rates on its foreign portfolio holdings, to settle foreign currency transactions or as a part of its investment strategy. When executing forward contracts, the fund is obligated to buy or sell a foreign
49
NOTES TO FINANCIAL STATEMENTS (continued)
currency at a specified rate on a certain date in the future. With respect to sales of forward contracts, the fund incurs a loss if the value of the contract increases between the date the forward contract is opened and the date the forward contract is closed. The fund realizes a gain if the value of the contract decreases between those dates. With respect to purchases of forward contracts, the fund incurs a loss if the value of the contract decreases between the date the forward contract is opened and the date the forward contract is closed. The fund realizes a gain if the value of the contract increases between those dates. Any realized or unrealized gains or losses which occurred during the period are reflected in the Statement of Operations. The fund is exposed to foreign currency risk as a result of changes in value of underlying financial instruments. The fund is also exposed to credit risk associated with counterparty non-performance on these forward contracts, which is generally limited to the unrealized gain on each open contract. This risk may be mitigated by Master Agreements, if any, between the fund and the counterparty and the posting of collateral, if any, by the counterparty to the fund to cover the fund’s exposure to the counterparty. Forward contracts open at July 31, 2023 are set forth in the Statement of Investments.
Swap Agreements: The fund enters into swap agreements to exchange the interest rate on, or return generated by, one nominal instrument for the return generated by another nominal instrument. Swap agreements are privately negotiated in the OTC market or centrally cleared. The fund enters into these agreements to hedge certain market or interest rate risks, to manage the interest rate sensitivity (sometimes called duration) of fixed income securities, to provide a substitute for purchasing or selling particular securities or to increase potential returns.
For OTC swaps, the fund accrues for interim payments on a daily basis, with the net amount recorded within unrealized appreciation (depreciation) on swap agreements in the Statement of Assets and Liabilities. Once the interim payments are settled in cash, the net amount is recorded as a realized gain (loss) on swaps, in addition to realized gain (loss) recorded upon the termination of swap agreements in the Statement of Operations. Upfront payments made and/or received by the fund, are recorded as an asset and/or liability in the Statement of Assets and Liabilities and are recorded as a realized gain or loss ratably over the agreement’s term/event with the exception of forward starting interest rate swaps which are recorded as realized gains or losses on the termination date.
Upon entering into centrally cleared swap agreements, an initial margin deposit is required with a counterparty, which consists of cash or cash equivalents. The amount of these deposits is determined by the exchange
50
on which the agreement is traded and is subject to change. The change in valuation of centrally cleared swaps is recorded as a receivable or payable for variation margin in the Statement of Assets and Liabilities. Payments received from (paid to) the counterparty, including upon termination, are recorded as realized gain (loss) in the Statement of Operations.
Fluctuations in the value of swap agreements are recorded for financial statement purposes as unrealized appreciation or depreciation on swap agreements.
Credit Default Swaps: Credit default swaps involve commitments to pay a fixed interest rate in exchange for payment if a credit event affecting a third party (the referenced obligation or index) occurs. Credit events may include a failure to pay interest or principal, bankruptcy, or restructuring. The fund enters into these agreements to manage its exposure to the market or certain sectors of the market, to reduce its risk exposure to defaults of corporate and sovereign issuers, or to create exposure to corporate or sovereign issuers to which it is not otherwise exposed. For those credit default swaps in which the fund is paying a fixed rate, the fund is buying credit protection on the instrument. In the event of a credit event, the fund would receive the full notional amount for the reference obligation. For those credit default swaps in which the fund is receiving a fixed rate, the fund is selling credit protection on the underlying instrument. The maximum payouts for these agreements are limited to the notional amount of each swap. Credit default swaps may involve greater risks than if the fund had invested in the reference obligation directly and are subject to general market risk, liquidity risk, counterparty risk and credit risk. This risk may be mitigated by Master Agreements, if any, between the fund and the counterparty and the posting of collateral, if any, by the counterparty to the fund to cover the fund’s exposure to the counterparty.
The maximum potential amount of future payments (undiscounted) that a fund as a seller of protection could be required to make under a credit default swap agreement would be an amount equal to the notional amount of the agreement which may exceed the amount of unrealized appreciation or depreciation reflected in the Statement of Assets and Liabilities. Notional amounts of all credit default swap agreements are disclosed in the Statement of Swap Agreements, which summarizes open credit default swaps entered into by the fund. These potential amounts would be partially offset by any recovery values of the respective referenced obligations, underlying securities comprising the referenced index, upfront payments received upon entering into the agreement, or net amounts received from the settlement of buy protection credit default swap agreements entered
51
NOTES TO FINANCIAL STATEMENTS (continued)
into by the fund for the same referenced entity or entities. Credit default swaps open at July 31, 2023 are set forth in the Statement of Investments.
GAAP requires disclosure for (i) the nature and terms of the credit derivative, reasons for entering into the credit derivative, the events or circumstances that would require the seller to perform under the credit derivative, and the current status of the payment/performance risk of the credit derivative, (ii) the maximum potential amount of future payments (undiscounted) the seller could be required to make under the credit derivative, (iii) the fair value of the credit derivative, and (iv) the nature of any recourse provisions and assets held either as collateral or by third parties. All required disclosures have been made and are incorporated within the current period as part of the Notes to the Statement of Investments and disclosures within this Note.
The following tables show the fund’s exposure to different types of market risk as it relates to the Statement of Assets and Liabilities and the Statement of Operations, respectively.
Fair value of derivative instruments as of July 31, 2023 is shown below:
| | | | | | | | |
| | Derivative
Assets ($) | | | | Derivative
Liabilities ($) | |
Interest rate risk | 27,021 | 1 | Interest rate risk | (454,835) | 1 |
Foreign exchange risk | 37,073 | 2 | Foreign exchange risk | (586) | 2 |
Credit risk | - | | Credit risk | (62,851) | 3 |
Gross fair value of
derivative contracts | 64,094 | | | | (518,272) | |
| | | | | | |
| Statement of Assets and Liabilities location: | |
1 | Includes cumulative appreciation (depreciation) on futures as reported in the Statement of Investments, but
only the unpaid variation margin is reported in the Statement of Assets and Liabilities. |
2 | Unrealized appreciation (depreciation) on forward foreign currency exchange contracts. |
3 | Includes cumulative appreciation (depreciation) on swap agreements as reported in the Statement of Investments.
Unrealized appreciation (depreciation) on OTC swap agreements and only unpaid variation
margin on cleared swap agreements, are reported in the Statement of Assets and Liabilities. |
The effect of derivative instruments in the Statement of Operations during the period ended July 31, 2023 is shown below:
| | | | | | | | | | | |
Amount of realized gain (loss) on derivatives recognized in income ($) | |
Underlying
risk | Futures | 1 | Options
Transactions | 2 | Forward
Contracts | 3 | Swap
Agreements | 4 | Total | |
Interest rate | (558,535) | | (119,163) | | - | | - | | (677,698) | |
Foreign
exchange | - | | - | | (31,040) | | - | | (31,040) | |
Credit | - | | 27,022 | | - | | 23,207 | | 50,229 | |
Total | (558,535) | | (92,141) | | (31,040) | | 23,207 | | (658,509) | |
| | | | | | | | | | |
52
| | | | | | | | | | | | |
Net change in unrealized appreciation (depreciation)
on derivatives recognized in income ($) | |
Underlying
risk | Futures | 5 | Options
Transactions | | Forward
Contracts | 6 | Swap
Agreements | 7 | Total | |
Interest rate | (495,888) | | - | | - | | - | | (495,888) | |
Foreign
exchange | - | | - | | 78,094 | | - | | 78,094 | |
Credit | - | | - | | - | | (62,851) | | (62,851) | |
Total | (495,888) | | - | | 78,094 | | (62,851) | | (480,645) | |
| | | | | | | | | | | |
| Statement of Operations location: | |
1 | Net realized gain (loss) on futures. | | |
2 | Net realized gain (loss) on options transactions. |
3 | Net realized gain (loss) on forward foreign currency exchange contracts. | | |
4 | Net realized gain (loss) on swap agreements. | | |
5 | Net change in unrealized appreciation (depreciation) on futures. | | |
6 | Net change in unrealized appreciation (depreciation) on forward foreign currency exchange contracts. | |
7 | Net change in unrealized appreciation (depreciation) on swap agreements. | | |
The provisions of ASC Topic 210 “Disclosures about Offsetting Assets and Liabilities” require disclosure on the offsetting of financial assets and liabilities. These disclosures are required for certain investments, including derivative financial instruments subject to Master Agreements which are eligible for offsetting in the Statement of Assets and Liabilities and require the fund to disclose both gross and net information with respect to such investments. For financial reporting purposes, the fund does not offset derivative assets and derivative liabilities that are subject to Master Agreements in the Statement of Assets and Liabilities.
At July 31, 2023, derivative assets and liabilities (by type) on a gross basis are as follows:
| | | | | | |
Derivative Financial Instruments: | | Assets ($) | | Liabilities ($) | |
Futures | | 27,021 | | (454,835) | |
Forward contracts | | 37,073 | | (586) | |
Swaps | | - | | (62,851) | |
Total gross amount of derivative | | | | | |
assets and liabilities in the | | | | | |
Statement of Assets and Liabilities | | 64,094 | | (518,272) | |
Derivatives not subject to | | | | | |
Master Agreements | | (27,021) | | 517,686 | |
Total gross amount of assets | | | | | |
and liabilities subject to | | | | | |
Master Agreements | | 37,073 | | (586) | |
53
NOTES TO FINANCIAL STATEMENTS (continued)
The following table presents derivative assets and liabilities net of amounts available for offsetting under Master Agreements and net of related collateral received or pledged, if any, as of July 31, 2023:
| | | | | | | |
| | | Financial | | | |
| | | Instruments | | | |
| | | and Derivatives | | | |
| Gross Amount of | | Available | Collateral | | Net Amount of |
Counterparty | Assets ($) | 1 | for Offset ($) | Received ($) | | Assets ($) |
HSBC Securities
(USA) Inc. | 37,073 | | - | - | | 37,073 |
| | | | | | |
| | | Financial | | | |
| | | Instruments | | | |
| | | and Derivatives | | | |
| Gross Amount of | | Available | Collateral | | Net Amount of |
Counterparty | Liabilities ($) | 1 | for Offset ($) | Pledged ($) | | Liabilities ($) |
Goldman
Sachs & Co. LLC | (586) | | - | - | | (586) |
| | | | | | |
1 Absent a default event or early termination, OTC derivative assets and liabilities are presented at gross amounts
and are not offset in the Statement of Assets and Liabilities. |
The following table summarizes the average market value of derivatives outstanding during the period ended July 31, 2023:
| | | |
| | Average Market Value ($) |
Interest rate futures | | 28,176,048 |
Interest rate options contracts | | 1,215 |
Forward contracts | | 5,887,494 |
Credit options contracts | | 37,445 |
The following table summarizes the average notional value of swap agreements outstanding during the period ended July 31, 2023:
| | | |
| | Average Notional Value ($) |
Credit default swap agreements | | 6,445,187 |
| | |
At July 31, 2023, the cost of investments for federal income tax purposes was $112,028,666; accordingly, accumulated net unrealized depreciation on investments was $5,071,453, consisting of $322,149 gross unrealized appreciation and $5,393,602 gross unrealized depreciation.
54
REPORT OF INDEPENDENT REGISTERED PUBLIC ACCOUNTING FIRM
To the Shareholders and the Board of Directors of BNY Mellon Short Term Income Fund
Opinion on the Financial Statements
We have audited the accompanying statement of assets and liabilities of BNY Mellon Short Term Income Fund (the “Fund”) (the sole fund constituting BNY Mellon Investment Funds VII, Inc. (the “Company”)), including the statement of investments, as of July 31, 2023, and the related statement of operations for the year then ended, the statements of changes in net assets for each of the two years in the period then ended, the financial highlights for each of the five years in the period then ended and the related notes (collectively referred to as the “financial statements”). In our opinion, the financial statements present fairly, in all material respects, the financial position of the Fund (the sole fund constituting BNY Mellon Investment Funds VII, Inc.) at July 31, 2023, the results of its operations for the year then ended, the changes in its net assets for each of the two years in the period then ended and its financial highlights for each of the five years in the period then ended, in conformity with U.S. generally accepted accounting principles.
Basis for Opinion
These financial statements are the responsibility of the Company’s management. Our responsibility is to express an opinion on the Fund’s financial statements based on our audits. We are a public accounting firm registered with the Public Company Accounting Oversight Board (United States) (“PCAOB”) and are required to be independent with respect to the Company in accordance with the U.S. federal securities laws and the applicable rules and regulations of the Securities and Exchange Commission and the PCAOB.
We conducted our audits in accordance with the standards of the PCAOB. Those standards require that we plan and perform the audit to obtain reasonable assurance about whether the financial statements are free of material misstatement, whether due to error or fraud. The Company is not required to have, nor were we engaged to perform, an audit of the Company’s internal control over financial reporting. As part of our audits, we are required to obtain an understanding of internal control over financial reporting but not for the purpose of expressing an opinion on the effectiveness of the Company’s internal control over financial reporting. Accordingly, we express no such opinion.
Our audits included performing procedures to assess the risks of material misstatement of the financial statements, whether due to error or fraud, and performing procedures that respond to those risks. Such procedures included examining, on a test basis, evidence regarding the amounts and disclosures in the financial statements. Our procedures included confirmation of securities owned as of July 31, 2023, by correspondence with the custodian, brokers and others; when replies were not received from brokers and others, we performed other auditing procedures. Our audits also included evaluating the accounting principles used and significant estimates made by management, as well as evaluating the overall presentation of the financial statements. We believe that our audits provide a reasonable basis for our opinion.

We have served as the auditor of one or more investment companies in the BNY Mellon Family of Funds since at least 1957, but we are unable to determine the specific year.
New York, New York
September 22, 2023
55
IMPORTANT TAX INFORMATION (Unaudited)
For federal tax purposes, the fund hereby reports 75.48% of ordinary income dividends paid during the fiscal year ended July 31, 2023 as qualifying “interest related dividends.”
56
INFORMATION ABOUT THE RENEWAL OF THE FUND'S MANAGEMENT AND SUB-INVESTMENT ADVISORY AGREEMENTS (Unaudited)
At a meeting of the fund’s Board of Directors held on March 1, 2023, the Board considered the renewal of the fund’s Management Agreement, pursuant to which the Adviser provides the fund with investment advisory and administrative services, and the Sub-Investment Advisory Agreement (together with the Management Agreement, the “Agreements”), pursuant to which Insight North America LLC (the “Sub-Adviser”) provides day-to-day management of the fund’s investments. The Board members, none of whom are “interested persons” (as defined in the Investment Company Act of 1940, as amended) of the fund, were assisted in their review by independent legal counsel and met with counsel in executive session separate from representatives of the Adviser and the Sub-Adviser. In considering the renewal of the Agreements, the Board considered several factors that it believed to be relevant, including those discussed below. The Board did not identify any one factor as dispositive, and each Board member may have attributed different weights to the factors considered.
Analysis of Nature, Extent, and Quality of Services Provided to the Fund. The Board considered information provided to it at the meeting and in previous presentations from representatives of the Adviser regarding the nature, extent, and quality of the services provided to funds in the BNY Mellon fund complex, including the fund. The Adviser provided the number of open accounts in the fund, the fund’s asset size and the allocation of fund assets among distribution channels. The Adviser also had previously provided information regarding the diverse intermediary relationships and distribution channels of funds in the BNY Mellon fund complex (such as retail direct or intermediary, in which intermediaries typically are paid by the fund and/or the Adviser) and the Adviser’s corresponding need for broad, deep, and diverse resources to be able to provide ongoing shareholder services to each intermediary or distribution channel, as applicable to the fund.
The Board also considered research support available to, and portfolio management capabilities of, the fund’s portfolio management personnel and that the Adviser also provides oversight of day-to-day fund operations, including fund accounting and administration and assistance in meeting legal and regulatory requirements. The Board also considered the Adviser’s extensive administrative, accounting and compliance infrastructures, as well as the Adviser’s supervisory activities over the Sub-Adviser.
Comparative Analysis of the Fund’s Performance and Management Fee and Expense Ratio. The Board reviewed reports prepared by Broadridge Financial Solutions, Inc. (“Broadridge”), an independent provider of investment company data based on classifications provided by Thomson Reuters Lipper, which included information comparing (1) the performance of the fund’s Class D shares with the performance of a group of retail no-load short investment-grade debt funds selected by Broadridge as comparable to the fund (the “Performance Group”) and with a broader group of funds consisting of all retail and institutional short investment-grade debt funds (the “Performance Universe”), all for various periods ended December 31, 2022, and (2) the fund’s actual and contractual management fees and total expenses with those of the same group of funds in the Performance Group (the “Expense Group”) and with a
57
INFORMATION ABOUT THE RENEWAL OF THE FUND'S MANAGEMENT AND SUB-INVESTMENT ADVISORY AGREEMENTS (Unaudited) (continued)
broader group of all retail no-load short investment-grade debt funds, excluding outliers (the “Expense Universe”), the information for which was derived in part from fund financial statements available to Broadridge as of the date of its analysis. The Adviser previously had furnished the Board with a description of the methodology Broadridge used to select the Performance Group and Performance Universe and the Expense Group and Expense Universe.
Performance Comparisons. Representatives of the Adviser stated that the usefulness of performance comparisons may be affected by a number of factors, including different investment limitations and policies that may be applicable to the fund and comparison funds and the end date selected. The Board also considered the fund’s performance in light of overall financial market conditions. The Board discussed with representatives of the Adviser and the Sub-Adviser the results of the comparisons and considered that the fund’s total return performance was below the Performance Group and Performance Universe medians for all periods, except the four-year period when the fund’s total return performance was at the Performance Group median and the six-month period when the fund’s total return performance was above the Performance Universe median. The Board also considered that the fund’s yield performance was above the Performance Group for five of the ten one-year periods and the Performance Universe medians for six of the ten one-year periods ended December 31st. The Adviser also provided a comparison of the fund’s calendar year total returns to the returns of the fund’s benchmark index. The Board discussed with representatives of the Adviser and the Sub-Adviser the reasons for the fund’s underperformance versus the Performance Group and Performance Universe during certain periods under review and noted that, effective in May 2022, the fund implemented certain changes to its investment parameters and appointed a new additional primary portfolio manager.
Management Fee and Expense Ratio Comparisons. The Board reviewed and considered the contractual management fee rate payable by the fund to the Adviser in light of the nature, extent and quality of the management services and the sub-advisory services provided by the Adviser and the Sub-Adviser, respectively. In addition, the Board reviewed and considered the actual management fee rate paid by the fund over the fund’s last fiscal year, which included reductions for an expense limitation arrangement in place that reduced the management fee paid to the Adviser. The Board also reviewed the range of actual and contractual management fees and total expenses as a percentage of average net assets of the Expense Group and Expense Universe funds and discussed the results of the comparisons.
The Board considered that the fund’s contractual management fee was lower than the Expense Group median contractual management fee, the fund’s actual management fee was lower than the Expense Group median and lower than the Expense Universe median actual management fee and the fund’s total expenses were higher than the Expense Group median and higher than the Expense Universe median total expenses.
Representatives of the Adviser stated that the Adviser has contractually agreed, until December 1, 2023, to waive receipt of its fees and/or assume the direct expenses of the fund so that the direct expenses of none of the fund’s share classes (excluding
58
shareholder services fees, taxes, interest expense, brokerage commissions, commitment fees on borrowings and extraordinary expenses) exceed .40% of the fund’s average daily net assets.
Representatives of the Adviser noted that there were no other funds advised by the Adviser that are in the same Lipper category as the fund or separate accounts and/or other types of client portfolios advised by the Adviser or the Sub-Adviser that are considered to have similar investment strategies and policies as the fund.
The Board considered the fee payable to the Sub-Adviser in relation to the fee payable to the Adviser by the fund and the respective services provided by the Sub-Adviser and the Adviser. The Board also took into consideration that the Sub-Adviser’s fee is paid by the Adviser, out of its fee from the fund, and not the fund.
Analysis of Profitability and Economies of Scale. Representatives of the Adviser reviewed the expenses allocated and profit received by the Adviser and its affiliates and the resulting profitability percentage for managing the fund and the aggregate profitability percentage to the Adviser and its affiliates for managing the funds in the BNY Mellon fund complex, and the method used to determine the expenses and profit. The Board concluded that the profitability results were not excessive, given the services rendered and service levels provided by the Adviser and its affiliates. The Board also considered the expense limitation arrangement and its effect on the profitability of the Adviser and its affiliates. The Board also had been provided with information prepared by an independent consulting firm regarding the Adviser’s approach to allocating costs to, and determining the profitability of, individual funds and the entire BNY Mellon fund complex. The consulting firm also had analyzed where any economies of scale might emerge in connection with the management of a fund.
The Board considered, on the advice of its counsel, the profitability analysis (1) as part of its evaluation of whether the fees under the Agreements, considered in relation to the mix of services provided by the Adviser and the Sub-Adviser, including the nature, extent and quality of such services, supported the renewal of the Agreements and (2) in light of the relevant circumstances for the fund and the extent to which economies of scale would be realized if the fund grows and whether fee levels reflect these economies of scale for the benefit of fund shareholders. Representatives of the Adviser also stated that a discussion of economies of scale is predicated on a fund having achieved a substantial size with increasing assets and that, if a fund’s assets had been stable or decreasing, the possibility that the Adviser may have realized any economies of scale would be less. Representatives of the Adviser also stated that, as a result of shared and allocated costs among funds in the BNY Mellon fund complex, the extent of economies of scale could depend substantially on the level of assets in the complex as a whole, so that increases and decreases in complex-wide assets can affect potential economies of scale in a manner that is disproportionate to, or even in the opposite direction from, changes in the fund’s asset level. The Board also considered potential benefits to the Adviser and the Sub-Adviser from acting as investment adviser and sub-investment adviser, respectively, and took into consideration that there were no soft dollar arrangements in effect for trading the fund’s investments.
59
INFORMATION ABOUT THE RENEWAL OF THE FUND'S MANAGEMENT AND SUB-INVESTMENT ADVISORY AGREEMENTS (Unaudited) (continued)
At the conclusion of these discussions, the Board agreed that it had been furnished with sufficient information to make an informed business decision with respect to the renewal of the Agreements. Based on the discussions and considerations as described above, the Board concluded and determined as follows.
· The Board concluded that the nature, extent and quality of the services provided by the Adviser and the Sub-Adviser are adequate and appropriate.
· The Board was generally satisfied with the fund’s improved relative total return performance in the most recent one-year period and determined to continue to monitor the fund’s performance.
· The Board concluded that the fees paid to the Adviser and the Sub-Adviser continued to be appropriate under the circumstances and in light of the factors and the totality of the services provided as discussed above.
· The Board determined that the economies of scale which may accrue to the Adviser and its affiliates in connection with the management of the fund had been adequately considered by the Adviser in connection with the fee rate charged to the fund pursuant to the Management Agreement and that, to the extent in the future it were determined that material economies of scale had not been shared with the fund, the Board would seek to have those economies of scale shared with the fund.
In evaluating the Agreements, the Board considered these conclusions and determinations and also relied on its previous knowledge, gained through meetings and other interactions with the Adviser and its affiliates and the Sub-Adviser, of the Adviser and the Sub-Adviser and the services provided to the fund by the Adviser and the Sub-Adviser. The Board also relied on information received on a routine and regular basis throughout the year relating to the operations of the fund and the investment management and other services provided under the Agreements, including information on the investment performance of the fund in comparison to similar mutual funds and benchmark performance indices; general market outlook as applicable to the fund; and compliance reports. In addition, the Board’s consideration of the contractual fee arrangements for the fund had the benefit of a number of years of reviews of the Agreements for the fund, or substantially similar agreements for other BNY Mellon funds that the Board oversees, during which lengthy discussions took place between the Board and representatives of the Adviser. Certain aspects of the arrangements may receive greater scrutiny in some years than in others, and the Board’s conclusions may be based, in part, on its consideration of the fund’s arrangements, or substantially similar arrangements for other BNY Mellon funds that the Board oversees, in prior years. The Board determined to renew the Agreements the remainder of the one-year term.
60
LIQUIDITY RISK MANAGEMENT PROGRAM (Unaudited)
The fund adopted a liquidity risk management program (the “Liquidity Risk Management Program”) pursuant to the requirements of Rule 22e-4 under the Investment Company Act of 1940, as amended. Rule 22e-4 requires registered open-end funds, including mutual funds and exchange-traded funds but not money market funds, to establish liquidity risk management programs in order to effectively manage fund liquidity and shareholder redemptions. The rule is designed to mitigate the risk that a fund could not meet redemption requests without significantly diluting the interests of remaining investors.
The rule requires the fund to assess, manage and review their liquidity risk at least annually considering applicable factors such as investment strategy and liquidity during normal and foreseeable stressed conditions, including whether the strategy is appropriate for an open-end fund and whether the fund has a relatively concentrated portfolio or large positions in particular issuers. The fund must also assess its use of borrowings and derivatives, short-term and long-term cash flow projections in normal and stressed conditions, holdings of cash and cash equivalents, and borrowing arrangements and other funding sources.
The rule also requires the fund to classify its investments as highly liquid, moderately liquid, less liquid or illiquid based on the number of days the fund expects it would take to liquidate the investment, and to review these classifications at least monthly or more often under certain conditions. The periods range from three or fewer business days for a highly liquid investment to greater than seven calendar days for settlement of a less liquid investment. Illiquid investments are those a fund does not expect to be able to sell or dispose of within seven calendar days without significantly changing the market value. The fund is prohibited from acquiring an investment if, after the acquisition, its holdings of illiquid assets will exceed 15% of its net assets. In addition, if a fund permits redemptions in-kind, the rule requires the fund to establish redemption in-kind policies and procedures governing how and when it will engage in such redemptions.
Pursuant to the rule’s requirements, the Liquidity Risk Management Program has been reviewed and approved by the Board. Furthermore, the Board has received a written report prepared by the Program’s Administrator that addresses the operation of the Program, assesses its adequacy and effectiveness and describes any material changes made to the Program.
Assessment of Program
In the opinion of the Program Administrator, the Program approved by the Board continues to be adequate for the fund and the Program has been implemented effectively. The Program Administrator has monitored the fund’s liquidity risk and the liquidity classification of the securities held by the fund and has determined that the Program is operating effectively.
During the period from January 1, 2022 to December 31, 2022, there were no material changes to the Program and no material liquidity events that impacted the fund. During the period, the fund held sufficient highly liquid assets to meet fund redemptions.
Under normal expected foreseeable fund redemption forecasts and foreseeable stressed fund redemption forecasts, the Program Administrator believes that the fund maintains sufficient highly liquid assets to meet expected fund redemptions.
61
BOARD MEMBERS INFORMATION (Unaudited)
iIndependent Board Members
Joseph S. DiMartino (79)h
Cairman of the Board (1995)
Principal Occupation During Past 5 Years:
· Director or Trustee of funds in the BNY Mellon Family of Funds and certain other entities (1995-Present)
Other Public Company Board Memberships During Past 5 Years:
· CBIZ, Inc., a public company providing professional business services, products and solutions, Director (1997-May 2023)
No. of Portfolios for which Board Member Serves: 86
———————
Francine J. Bovich (71)
Board Member (2015)
Principal Occupation During Past 5 Years:
· The Bradley Trusts, private trust funds, Trustee (2011-Present)
Other Public Company Board Memberships During Past 5 Years:
· Annaly Capital Management, Inc., a real estate investment trust, Director (2014-Present)
No. of Portfolios for which Board Member Serves: 47
———————
J. Charles Cardona (67)
Board Member (2014)
Principal Occupation During Past 5 Years:
· BNY Mellon ETF Trust, Chairman and Trustee (2020-Present)
· BNY Mellon Liquidity Funds, Director (2004-Present) and Chairman (2019-2021)
No. of Portfolios for which Board Member Serves: 39
———————
Andrew J. Donohue (72)
Board Member (2019)
Principal Occupation During Past 5 Years:
· Attorney, Solo Law Practice (2019-Present)
· Shearman & Sterling LLP, a law firm, Of Counsel (2017-2019)
· Chief of Staff to the Chair of the SEC (2015-2017)
Other Public Company Board Memberships During Past 5 Years:
· Oppenheimer Funds (58 funds), Director (2017-2019)
No. of Portfolios for which Board Member Serves: 40
———————
62
Isabel P. Dunst (76)
Board Member (2014)
Principal Occupation During Past 5 Years:
· Hogan Lovells LLP, a law firm, Retired (2019-Present); Senior Counsel (2018-2019); Of Counsel (2015-2018)
· Hebrew Union College Jewish Institute of Religion, Member of the Board of Governors (2015-Present)
· Bend the ARC, a civil rights organization, Board Member (2016-December 2021)
No. of Portfolios for which Board Member Serves: 22
———————
Nathan Leventhal (80)
Board Member (2009)
Principal Occupation During Past 5 Years:
· Lincoln Center for the Performing Arts, President Emeritus (2001-Present)
· Palm Beach Opera, President (2016-Present)
Other Public Company Board Memberships During Past 5 Years:
· Movado Group, Inc., a public company that designs, sources, markets and distributes watches Director (2003-2020)
No. of Portfolios for which Board Member Serves: 29
———————
Robin A. Melvin (59)
Board Member (2014)
Principal Occupation During Past 5 Years:
· Westover School, a private girls' boarding school in Middlebury, Connecticut, Trustee (2019-June 2023)
· Mentor Illinois, a non-profit organization dedicated to increasing the quantity and quality of mentoring services in Illinois, Co-Chair (2014-2020); Board Member, Mentor Illinois (2013-2020)
· JDRF, a non-profit juvenile diabetes research foundation, Board Member (June 2021-June 2022)
Other Public Company Board Memberships During Past 5 Years:
· HPS Corporate Lending Fund, a closed-end management investment company regulated as a business development company, Trustee (August 2021-Present)
No. of Portfolios for which Board Member Serves: 68
———————
Roslyn M. Watson (73)
Board Member (2014)
Principal Occupation During Past 5 Years:
· Watson Ventures, Inc., a real estate investment company. Principal (1993-Present)
Other Public Company Board Memberships During Past 5 Years:
· American Express Bank, FSB, Director (1993-2018)
No. of Portfolios for which Board Member Serves: 40
———————
63
BOARD MEMBERS INFORMATION (Unaudited) (continued)
Benaree Pratt Wiley (77)
Board Member (2009)
Principal Occupation During Past 5 Years:
· The Wiley Group, a firm specializing in strategy and business development, Principal (2005-Present)
Other Public Company Board Memberships During Past 5 Years:
· CBIZ, Inc., a public company providing professional business services, products and solutions, Director (2008-Present)
· Blue Cross Blue Shield of Massachusetts, Director (2004-2020)
No. of Portfolios for which Board Member Serves: 57
———————
Tamara Belinfanti (48)
Advisory Board Member (2021)
Principal Occupation During Past 5 Years:
· New York Law School, Lester Martin Professor of Law (2009-Present)
No. of Portfolios for which Advisory Board Member Serves: 22
———————
Gordon J. Davis (81)
Advisory Board Member (2021)
Principal Occupation During Past 5 Years:
· Venable LLP, a law firm, Partner (2012-Present)
Other Public Company Board Memberships During Past 5 Years:
· BNY Mellon Family of Funds (53 funds), Board Member (1995-August 2021)
No. of Portfolios for which Advisory Board Member Serves: 39
———————
The address of the Board Members and Officers is c/o BNY Mellon Investment Adviser, Inc., 240 Greenwich Street, New York, New York 10286. Additional information about each Board Member is available in the fund’s Statement of Additional Information which can be obtained from the Adviser free of charge by calling this toll free number: 1-800-373-9387.
64
OFFICERS OF THE FUND (Unaudited)
DAVID DIPETRILLO, President since January 2021.
Vice President and Director of the Adviser since February 2021; Head of North America Distribution, BNY Investment Management since February 2023; Head of North America Product, BNY Mellon Investment Management from January 2018 to February 2023. He is an officer of 53 investment companies (comprised of 103 portfolios) managed by the Adviser or an affiliate of the Adviser. He is 45 years old and has been an employee of BNY Mellon since 2005.
JAMES WINDELS, Treasurer since November 2001.
Director of the Adviser since February 2023; Vice President of the Adviser since September 2020; and Director–BNY Mellon Fund Administration. He is an officer of 54 investment companies (comprised of 123 portfolios) managed by the Adviser or an affiliate of the Adviser. He is 64 years old and has been an employee of the Adviser since April 1985.
PETER M. SULLIVAN, Chief Legal Officer since July 2021 and Vice President and Assistant Secretary since March 2019.
Chief Legal Officer of the Adviser and Associate General Counsel of BNY Mellon since July 2021; Senior Managing Counsel of BNY Mellon from December 2020 to July 2021; and Managing Counsel of BNY Mellon from March 2009 to December 2020. He is an officer of 54 investment companies (comprised of 123 portfolios) managed by the Adviser or an affiliate of the Adviser. He is 55 years old and has been an employee of BNY Mellon since April 2004.
JAMES BITETTO, Vice President since August 2005 and Secretary since February 2018.
Senior Managing Counsel of BNY Mellon since December 2019; Managing Counsel of BNY Mellon from April 2014 to December 2019; and Secretary of the Adviser. He is an officer of 54 investment companies (comprised of 123 portfolios) managed by the Adviser or an affiliate of the Adviser. He is 57 years old and has been an employee of the Adviser since December 1996.
DEIRDRE CUNNANE, Vice President and Assistant Secretary since March 2019.
Managing Counsel of BNY Mellon since December 2021, Counsel of BNY Mellon from August 2018 to December 2021; and Senior Regulatory Specialist at BNY Mellon Investment Management Services from February 2016 to August 2018. She is an officer of 54 investment companies (comprised of 123 portfolios) managed by the Adviser or an affiliate of the Adviser. She is 33 years old and has been an employee of the Adviser since August 2018.
SARAH S. KELLEHER, Vice President and Assistant Secretary since April 2014.
Vice President of BNY Mellon ETF Investment Adviser; LLC since February 2020; Senior Managing Counsel of BNY Mellon since September 2021; and Managing Counsel of BNY Mellon from December 2017 to September 2021. She is an officer of 54 investment companies (comprised of 123 portfolios) managed by the Adviser or an affiliate of BNY Mellon. She is 47 years old and has been an employee of BNY Mellon since March 2013.
JEFF PRUSNOFSKY, Vice President and Assistant Secretary since August 2005.
Senior Managing Counsel of BNY Mellon. He is an officer of 54 investment companies (comprised of 123 portfolios) managed by the Adviser or an affiliate of the Adviser. He is 58 years old and has been an employee of the Adviser since October 1990.
AMANDA QUINN, Vice President and Assistant Secretary since March 2020.
Counsel of BNY Mellon since June 2019; Regulatory Administration Manager at BNY Mellon Investment Management Services from September 2018 to May 2019; and Senior Regulatory Specialist at BNY Mellon Investment Management Services from April 2015 to August 2018. She is an officer of 54 investment companies (comprised of 123 portfolios) managed by the Adviser or an affiliate of the Adviser. She is 38 years old and has been an employee of BNY Mellon since June 2012.
65
OFFICERS OF THE FUND (Unaudited) (continued)
JOANNE SKERRETT, Vice President and Assistant Secretary since March 2023.
Counsel of BNY Mellon since June 2022; and Senior Counsel with the Mutual Fund Directors Forum, a leading funds industry organization, from 2016 to June 2022. She is an officer of 54 investment companies (comprised of 123 portfolios) managed by the Adviser or an affiliate of the Adviser. She is 51 years old and has been an employee of the Adviser since June 2022.
NATALYA ZELENSKY, Vice President and Assistant Secretary since March 2017.
Chief Compliance Officer since August 2021 and Vice President since February 2020 of BNY Mellon ETF Investment Adviser, LLC; Chief Compliance Officer since August 2021 and Vice President and Assistant Secretary since February 2020 of BNY Mellon ETF Trust; Managing Counsel of BNY Mellon from December 2019 to August 2021; Counsel of BNY Mellon from May 2016 to December 2019; and Assistant Secretary of the Adviser from April 2018 to August 2021. She is an officer of 54 investment companies (comprised of 123 portfolios) managed by the Adviser or an affiliate of the Adviser. She is 38 years old and has been an employee of BNY Mellon since May 2016.
DANIEL GOLDSTEIN, Vice President since March 2022.
Head of Product Development of North America Distribution, BNY Mellon Investment Management since January 2018; Executive Vice President of North America Product, BNY Mellon Investment Management since April 2023, and Senior Vice President, Development & Oversight of North America Product, BNY Mellon Investment Management from 2010 to March 2023. He is an officer of 53 investment companies (comprised of 103 portfolios) managed by the Adviser or an affiliate of the Adviser. He is 54 years old and has been an employee of the Distributor since 1991.
JOSEPH MARTELLA, Vice President since March 2022.
Vice President of the Adviser since December 2022; Head of Product Management of North America Distribution, BNY Mellon Investment Management since January 2018; Executive Vice President of North America Product, BNY Mellon Investment Management since April 2023, and Senior Vice President of North America Product, BNY Mellon Investment Management from 2010 to March 2023. He is an officer of 53 investment companies (comprised of 103 portfolios) managed by the Adviser or an affiliate of the Adviser. He is 46 years old and has been an employee of the Distributor since 1999.
GAVIN C. REILLY, Assistant Treasurer since December 2005.
Tax Manager–BNY Mellon Fund Administration. He is an officer of 54 investment companies (comprised of 123 portfolios) managed by the Adviser or an affiliate of the Adviser. He is 54 years old and has been an employee of the Adviser since April 1991.
ROBERT SALVIOLO, Assistant Treasurer since July 2007.
Senior Accounting Manager–BNY Mellon Fund Administration. He is an officer of 54 investment companies (comprised of 123 portfolios) managed by the Adviser or an affiliate of the Adviser. He is 56 years old and has been an employee of the Adviser since June 1989.
ROBERT SVAGNA, Assistant Treasurer since August 2005.
Senior Accounting Manager–BNY Mellon Fund Administration. He is an officer of 54 investment companies (comprised of 123 portfolios) managed by the Adviser or an affiliate of the Adviser. He is 56 years old and has been an employee of the Adviser since November 1990.
JOSEPH W. CONNOLLY, Chief Compliance Officer since October 2004.
Chief Compliance Officer of the BNY Mellon Family of Funds and BNY Mellon Funds Trust since 2004; and Chief Compliance Officer of the Adviser from 2004 until June 2021. He is the Chief Compliance Officer of 53 investment companies (comprised of 106 portfolios) managed by the Adviser. He is 66 years old.
CARIDAD M. CAROSELLA, Anti-Money Laundering Compliance Officer since January 2016.
Anti-Money Laundering Compliance Officer of the BNY Mellon Family of Funds and BNY Mellon Funds Trust. She is an officer of 47 investment companies (comprised of 116 portfolios) managed by the Adviser or an affiliate of the Adviser. She is 55 years old and has been an employee of the Distributor since 1997.
66
This page intentionally left blank.
67
This page intentionally left blank.
68
69
BNY Mellon Short Term Income Fund
240 Greenwich Street
New York, NY 10286
Adviser
BNY Mellon Investment Adviser, Inc.
240 Greenwich Street
New York, NY 10286
Sub-Adviser
Insight North America LLC
200 Park Avenue, 7th Floor
New York, NY 10166
Custodian
The Bank of New York Mellon
240 Greenwich Street
New York, NY 10286
Transfer Agent &
Dividend Disbursing Agent
BNY Mellon Transfer, Inc.
240 Greenwich Street
New York, NY 10286
Distributor
BNY Mellon Securities Corporation
240 Greenwich Street
New York, NY 10286
| | |
Ticker Symbols: | Class A:BYSAX Class D:DSTIX Class I:BYSIX Class Y:BYSYX |
Telephone Call your financial representative or 1-800-373-9387
Mail The BNY Mellon Family of Funds, 144 Glenn Curtiss Boulevard, Uniondale, NY 11556-0144
E-mail Send your request to info@bnymellon.com
Internet Information can be viewed online or downloaded at www.im.bnymellon.com
The fund files its complete schedule of portfolio holdings with the Securities and Exchange Commission (“SEC”) for the first and third quarters of each fiscal year on Form N-PORT. The fund’s Forms N-PORT are available on the SEC’s website at www.sec.gov.
A description of the policies and procedures that the fund uses to determine how to vote proxies relating to portfolio securities and information regarding how the fund voted these proxies for the most recent 12-month period ended June 30 is available at www.im.bnymellon.com and on the SEC’s website at www.sec.gov and without charge, upon request, by calling 1-800-373-9387.
| | |
© 2023 BNY Mellon Securities Corporation
0083AR0723 | 
|
Item 2. Code of Ethics.
The Registrant has adopted a code of ethics that applies to the Registrant's principal executive officer, principal financial officer, principal accounting officer or controller, or persons performing similar functions. There have been no amendments to, or waivers in connection with, the Code of Ethics during the period covered by this Report.
Item 3. Audit Committee Financial Expert.
The Registrant's Board has determined that Charles Cardona, member of the Audit Committee of the Board, is an audit committee financial expert as defined by the Securities and Exchange Commission (the "SEC"). Mr. Cardona is "independent" as defined by the SEC for purposes of audit committee financial expert determinations.
Item 4. Principal Accountant Fees and Services.
(a) Audit Fees. The aggregate fees billed for each of the last two fiscal years (the "Reporting Periods") for professional services rendered by the Registrant's principal accountant (the "Auditor") for the audit of the Registrant's annual financial statements or services that are normally provided by the Auditor in connection with the statutory and regulatory filings or engagements for the Reporting Periods, were $42,156 in 2022 and $43,859 in 2023.
(b) Audit-Related Fees. The aggregate fees billed in the Reporting Periods for assurance and related services by the Auditor that are reasonably related to the performance of the audit of the Registrant's financial statements and are not reported under paragraph (a) of this Item 4 were $22,131 in 2022 and $19,503 in 2023. These services consisted of one or more of the following: (i) agreed upon procedures related to compliance with Internal Revenue Code section 817(h), (ii) security counts required by Rule 17f-2 under the Investment Company Act of 1940, as amended, (iii) advisory services as to the accounting or disclosure treatment of Registrant transactions or events and (iv) advisory services to the accounting or disclosure treatment of the actual or potential impact to the Registrant of final or proposed rules, standards or interpretations by the Securities and Exchange Commission, the Financial Accounting Standards Boards or other regulatory or standard-setting bodies.
The aggregate fees billed in the Reporting Periods for non-audit assurance and related services by the Auditor to the Registrant's investment adviser (not including any sub-investment adviser whose role is primarily portfolio management and is subcontracted with or overseen by another investment adviser), and any entity controlling, controlled by or under common control with the investment adviser that provides ongoing services to the Registrant ("Service Affiliates"), that were reasonably related to the performance of the annual audit of the Service Affiliate, which required pre-approval by the Audit Committee were $0 in 2022 and $0 in 2023.
(c) Tax Fees. The aggregate fees billed in the Reporting Periods for professional services rendered by the Auditor for tax compliance, tax advice, and tax planning ("Tax Services") were $3,342 in 2022 and $3,342 in 2023. These services consisted of: (i) review or preparation of U.S. federal, state, local and excise tax returns; (ii) U.S. federal, state and local tax planning, advice and assistance regarding statutory, regulatory or administrative developments; (iii) tax advice regarding tax qualification matters and/or treatment of various financial instruments held or proposed to be acquired or held, and (iv) determination of Passive Foreign Investment Companies. The aggregate fees billed in the Reporting Periods for Tax Services by the Auditor to Service Affiliates, which required pre-approval by the Audit Committee were $8,158 in 2022 and $8,158 in 2023.
(d) All Other Fees. The aggregate fees billed in the Reporting Periods for products and services provided by the Auditor, other than the services reported in paragraphs (a) through (c) of this Item, were $1,933 in 2022 and $1,089 in 2023. These services consisted of a review of the Registrant's anti-money laundering program.
The aggregate fees billed in the Reporting Periods for Non-Audit Services by the Auditor to Service Affiliates, other than the services reported in paragraphs (b) through (c) of this Item, which required pre-approval by the Audit Committee, were $0 in 2022 and $0 in 2023.
(e)(1) Audit Committee Pre-Approval Policies and Procedures. The Registrant's Audit Committee has established policies and procedures (the "Policy") for pre-approval (within specified fee limits) of the Auditor's engagements for non-audit services to the Registrant and Service Affiliates without specific case-by-case consideration. The pre-approved services in the Policy can include pre-approved audit services, pre-approved audit-related services, pre-approved tax services and pre-approved all other services. Pre-approval considerations include whether the proposed services are compatible with maintaining the Auditor's independence. Pre-approvals pursuant to the Policy are considered annually.
(e)(2) Note. None of the services described in paragraphs (b) through (d) of this Item 4 were approved by the Audit Committee pursuant to paragraph (c)(7)(i)(C) of Rule 2-01 of Regulation S-X.
(f) None of the hours expended on the principal accountant's engagement to audit the registrant's financial statements for the most recent fiscal year were attributed to work performed by persons other than the principal accountant's full-time, permanent employees.
Non-Audit Fees. The aggregate non-audit fees billed by the Auditor for services rendered to the Registrant, and rendered to Service Affiliates, for the Reporting Periods were $2,313,479 in 2022 and $1,762,051 in 2023.
Auditor Independence. The Registrant's Audit Committee has considered whether the provision of non-audit services that were rendered to Service Affiliates, which were not pre-approved (not requiring pre-approval), is compatible with maintaining the Auditor's independence.
(j) Not applicable.
Item 5. Audit Committee of Listed Registrants.
Not applicable.
Item 6. Investments.
(a) Not applicable.
| Item 7. | Disclosure of Proxy Voting Policies and Procedures for Closed-End Management Investment Companies. |
Not applicable.
Item 8. Portfolio Managers of Closed-End Management Investment Companies.
Not applicable.
| Item 9. | Purchases of Equity Securities by Closed-End Management Investment Companies and Affiliated Purchasers. |
Not applicable.
| Item 10. | Submission of Matters to a Vote of Security Holders. |
There have been no material changes to the procedures applicable to Item 10.
| Item 11. | Controls and Procedures. |
(a) The Registrant's principal executive and principal financial officers have concluded, based on their evaluation of the Registrant's disclosure controls and procedures as of a date within 90 days of the filing date of this report, that the Registrant's disclosure controls and procedures are reasonably designed to ensure that information required to be disclosed by the Registrant on Form N-CSR is recorded, processed, summarized and reported within the required time periods and that information required to be disclosed by the Registrant in the reports that it files or submits on Form N-CSR is accumulated and communicated to the Registrant's management, including its principal executive and principal financial officers, as appropriate to allow timely decisions regarding required disclosure.
(b) There were no changes to the Registrant's internal control over financial reporting that occurred during the period covered by this report that have materially affected, or are reasonably likely to materially affect, the Registrant's internal control over financial reporting.
| Item 12. | Disclosure of Securities Lending Activities for Closed-End Management Investment Companies. |
Not applicable.
(a)(1) Code of ethics referred to in Item 2.
(a)(2) Certifications of principal executive and principal financial officers as required by Rule 30a-2(a) under the Investment Company Act of 1940.
(a)(3) Not applicable.
(b) Certification of principal executive and principal financial officers as required by Rule 30a-2(b) under the Investment Company Act of 1940.
SIGNATURES
Pursuant to the requirements of the Securities Exchange Act of 1934 and the Investment Company Act of 1940, the Registrant has duly caused this Report to be signed on its behalf by the undersigned, thereunto duly authorized.
BNY Mellon Investment Funds VII, Inc.
By: /s/ David J. DiPetrillo
David J. DiPetrillo
President (Principal Executive Officer)
Date: September 20, 2023
Pursuant to the requirements of the Securities Exchange Act of 1934 and the Investment Company Act of 1940, this Report has been signed below by the following persons on behalf of the Registrant and in the capacities and on the dates indicated.
By: /s/ David J. DiPetrillo
David J. DiPetrillo
President (Principal Executive Officer)
Date: September 20, 2023
By: /s/ James Windels
James Windels
Treasurer (Principal Financial Officer)
Date: September 19, 2023
EXHIBIT INDEX
(a)(1) Code of ethics referred to in Item 2.
(a)(2) Certifications of principal executive and principal financial officers as required by Rule 30a-2(a) under the Investment Company Act of 1940. (EX-99.CERT)
(b) Certification of principal executive and principal financial officers as required by Rule 30a-2(b) under the Investment Company Act of 1940. (EX-99.906CERT)