EXHIBIT 2
The audited Consolidated Financial Statements for the fiscal year ended December 31, 2003 and the accompanying Management's Discussion and Analysis of Noranda Inc. appearing on pages 36 to 65 and page 17 to 35, respectively, of the Noranda Inc. 2003 Annual Report, which are incorporated by reference into the Annual Information Form of Noranda Inc.
Management's Responsibility
The accompanying consolidated financial statements have been prepared by management in accordance with Canadian generally accepted accounting principles. Financial statements are not precise since they include certain amounts based on estimates and judgments. When alternative methods exist, management has chosen those it deems most appropriate in the circumstances in order to ensure that the consolidated financial statements are presented fairly, in all material respects, in accordance with generally accepted accounting principles. The financial information presented elsewhere in the annual report is consistent with that in the consolidated financial statements.
Noranda maintains adequate systems of internal accounting and administrative controls, consistent with reasonable cost. Such systems are designed to provide reasonable assurance that the financial information is relevant and reliable and that Noranda's assets are appropriately accounted for and adequately safeguarded.
The Board of Directors of the Company is responsible for ensuring that management fulfills its responsibilities for financial reporting, and is ultimately responsible for reviewing and approving the consolidated financial statements and the accompanying management's discussion and analysis. The Board carries out this responsibility principally through its Audit Committee.
The Audit Committee is appointed by the Board, and all of its members are non-management directors. The Audit Committee meets periodically with management and the external auditors to discuss internal controls, auditing matters and financial reporting issues, and to satisfy itself that each party is properly discharging its responsibilities. The Audit Committee also reviews the consolidated financial statements, management's discussion and analysis, the external auditors' report, and examines the fees and expenses for audit services, and considers the engagement or reappointment of the external auditors. The Audit Committee reports its findings to the Board for its consideration when approving the consolidated financial statements for issuance to the shareholders. Ernst & Young LLP, the external auditors, have full and free access to the Audit Committee.
|
|
|

Derek Pannell
President and Chief
Executive Officer |
|

Steven Douglas
Executive Vice-President
and Chief Financial Officer |
February 9, 2004 |
|
|
Auditors' Report
To the Shareholders of Noranda Inc.
We have audited the consolidated balance sheets of Noranda Inc. as at December 31, 2003 and 2002 and the consolidated statements of income (loss) and retained earnings (deficit) and cash flows for the years then ended. These financial statements are the responsibility of the Company's management. Our responsibility is to express an opinion on these financial statements based on our audits.
We conducted our audits in accordance with Canadian generally accepted auditing standards. Those standards require that we plan and perform an audit to obtain reasonable assurance whether the financial statements are free of material misstatement. An audit includes examining, on a test basis, evidence supporting the amounts and disclosures in the financial statements. An audit also includes assessing the accounting principles used and significant estimates made by management, as well as evaluating the overall financial statement presentation.
In our opinion, these consolidated financial statements present fairly, in all material respects, the financial position of the Company as at December 31, 2003 and 2002 and the results of its operations and its cash flows for the years then ended in accordance with Canadian generally accepted accounting principles.
|
|
|

Chartered Accountants |
|
|
Toronto, Canada
February 9, 2004 |
|
|
36 Noranda Annual Report 2003
Consolidated Balance Sheets
(US$ millions)
As at December 31
| | Notes
| | 2003
| | 2002
|
|---|
| |
| |
| | (Notes 1 and 2)
|
|---|
| Assets | | | | | | | | |
| Current assets | | | | | | | | |
| | Cash and cash equivalents | | | | $ | 501 | | $ | 293 |
| | Short-term investments | | | | | 129 | | | — |
| | Accounts receivable | | | | | 576 | | | 476 |
| | Metals and other inventories | | | | | 1,179 | | | 896 |
| | | | |
| |
|
| | | | | | 2,385 | | | 1,665 |
| Operating capital assets | | 5 | | | 4,682 | | | 4,652 |
| Development projects | | 6 | | | 973 | | | 603 |
| Investment and other assets | | 7 | | | 205 | | | 182 |
| | | | |
| |
|
| | | | | $ | 8,245 | | $ | 7,102 |
| | | | |
| |
|
| Liabilities and Shareholders' Equity | | | | | | | | |
| Current liabilities | | | | | | | | |
| | Accounts and taxes payable | | | | $ | 903 | | $ | 720 |
| | Debt due within one year | | 8 | | | 431 | | | 335 |
| | | | |
| |
|
| | | | | | 1,334 | | | 1,055 |
| Long-term debt | | 8 and 11 | | | 2,893 | | | 3,014 |
| Future income taxes | | 13 | | | 54 | | | 49 |
| Reclamation, pension and other provisions | | 9 | | | 414 | | | 367 |
Stockholders' interests |
|
|
|
|
|
|
|
|
| Interests of other shareholders | | 10 | | | 914 | | | 759 |
| Shareholders' equity | | 11 and 12 | | | 2,636 | | | 1,858 |
| | | | |
| |
|
| | | | | $ | 8,245 | | $ | 7,102 |
| | | | |
| |
|
Commitments and contingencies (notes 14 and 15)
(See accompanying notes)
On behalf of the Board:
Derek Pannell
Director | | 
Al Flood
Director |
Noranda Annual Report 2003 37
Consolidated Statements of Income (Loss) and Retained Earnings (Deficit)
(US$ millions, except per share amounts)
Years ended December 31
| | Notes
| | 2003
| | 2002
| |
|---|
| |
| |
| | (Notes 1 and 2)
| |
|---|
| Revenues | | 16 | | $ | 4,657 | | $ | 3,873 | |
| | | | |
| |
| |
| Operating expenses | | | | | | | | | |
| | Cost of operations | | | | | 2,024 | | | 1,879 | |
| | Purchased raw materials | | | | | 1,744 | | | 1,390 | |
| | Depreciation, amortization and reclamation | | | | | 480 | | | 490 | |
| | | | |
| |
| |
| | | | | | 4,248 | | | 3,759 | |
| | | | |
| |
| |
| Income generated by operating assets | | | | | 409 | | | 114 | |
| | | | |
| |
| |
| Interest expense | | 8 | | | 129 | | | 98 | |
| Corporate and general administration | | | | | 58 | | | 58 | |
| Research, development and exploration | | | | | 51 | | | 49 | |
| Minority interest in earnings of subsidiaries | | | | | 89 | | | 26 | |
| | | | |
| |
| |
| Income (loss) before undernoted | | | | | 82 | | | (117 | ) |
| | | | |
| |
| |
| Tax expense (recovery) | | 13 | | | 24 | | | (168 | ) |
| Restructuring costs | | 3 | | | 62 | | | 561 | |
| Gain on sale of investments | | 3 | | | (38 | ) | | (63 | ) |
| | | | |
| |
| |
| Net income (loss) | | | | $ | 34 | | $ | (447 | ) |
| | | | |
| |
| |
| Dividends on preferred shares | | | | | 21 | | | 11 | |
| Interest on convertible debentures | | | | | 3 | | | 2 | |
| | | | |
| |
| |
| Net income (loss) attributable to common shares | | | | | 10 | | | (460 | ) |
| | | | |
| |
| |
| Basic and diluted earnings (loss) per share | | | | $ | 0.04 | | $ | (1.93 | ) |
| | | | |
| |
| |
| Basic weighted average number of shares | | | | | 261,618,375 | | | 238,823,521 | |
| Diluted weighted average number of shares | | | | | 261,983,971 | | | 238,823,521 | |
Retained earnings (deficit) |
|
|
|
|
|
|
|
|
|
| | Balance, beginning of year | | | | $ | 24 | | $ | 583 | |
| | Change in accounting policy — capitalization of interest | | 2 | | | — | | | 25 | |
| | Income (loss) | | | | | 34 | | | (447 | ) |
| | Dividends | | | | | | | | | |
| | | Common | | | | | (121 | ) | | (122 | ) |
| | | Preferred | | | | | (21 | ) | | (11 | ) |
| | Other | | | | | (8 | ) | | (4 | ) |
| | | | |
| |
| |
| Balance, end of year | | 11 and 12 | | $ | (92 | ) | $ | 24 | |
| | | | |
| |
| |
(See accompanying notes)
38 Noranda Annual Report 2003
Consolidated Statements of Cash Flows
(US$ millions)
Years ended December 31
| | Notes
| | 2003
| | 2002
| |
|---|
| |
| |
| | (Notes 1 and 2)
| |
|---|
| Cash realized from (used for): | | | | | | | | | |
| Operations | | | | | | | | | |
| Net income (loss) | | | | $ | 34 | | $ | (447 | ) |
| Charges (credits) not affecting cash: | | | | | | | | | |
| | Depreciation, amortization and reclamation | | | | | 447 | | | 435 | |
| | Future taxes | | | | | (2 | ) | | (188 | ) |
| | Minority interest | | | | | 89 | | | 26 | |
| | Asset impairment | | | | | — | | | 520 | |
| | Foreign exchange, restructuring and other | | | | | 9 | | | 2 | |
| | | | |
| |
| |
| | | | | | 577 | | | 348 | |
| Net change in accounts receivable, inventories and payables | | | | | (164 | ) | | 32 | |
| | | | |
| |
| |
| Cash from operations | | | | | 413 | | | 380 | |
| | | | |
| |
| |
| Investment activities | | | | | | | | | |
| Capital investments | | | | | (489 | ) | | (528 | ) |
| Investments and advances | | | | | (153 | ) | | (116 | ) |
| Proceeds on dispositions | | 3 | | | 99 | | | 265 | |
| | | | |
| |
| |
| Cash used in investment activities | | | | | (543 | ) | | (379 | ) |
| | | | |
| |
| |
| | | | | | (130 | ) | | 1 | |
| | | | |
| |
| |
| Financing activities | | | | | | | | | |
| Long-term debt, including current portion | | | | | | | | | |
| | Issued | | | | | 717 | | | 615 | |
| | Repaid | | | | | (807 | ) | | (373 | ) |
| Issue of shares — common | | 12 | | | 439 | | | 2 | |
| Issue of shares — preferred | | | | | 198 | | | — | |
| Redemption of preferred shares | | 12 | | | (104 | ) | | — | |
| Dividends paid | | | | | (92 | ) | | (108 | ) |
| Exercise of stock options | | | | | — | | | (2 | ) |
| Issue of shares — minority shareholders, net | | | | | 18 | | | 8 | |
| Dividends paid to minority shareholders | | | | | (31 | ) | | (29 | ) |
| | | | |
| |
| |
| | | | | | 338 | | | 113 | |
| | | | |
| |
| |
| Increase in cash and cash equivalents | | | | | 208 | | | 114 | |
| Cash and cash equivalents, beginning of year | | | | | 293 | | | 179 | |
| | | | |
| |
| |
| Cash and cash equivalents, end of year | | | | $ | 501 | | $ | 293 | |
| | | | |
| |
| |
(See accompanying notes)
Noranda Annual Report 2003 39
Notes to Consolidated Financial Statements
(US$ millions except as otherwise indicated)
1. Accounting Policies
Basis of Presentation of the Consolidated Financial Statements
The accompanying consolidated financial statements have been prepared in accordance with Canadian generally accepted accounting principles which are in conformity, in all material respects, with United States generally accepted accounting principles, except as described in Note 19. The consolidated financial statements include the accounts of Noranda Inc. (the "Company") and all of its subsidiaries and joint ventures (together, "Noranda"). Long-term investments in companies in which Noranda has significant influence are accounted for on the basis of cost plus equity in undistributed earnings since the dates of investment. The interests of the Company, Falconbridge Limited ("Falconbridge") and Novicourt Inc. ("Novicourt") in their joint ventures are proportionately consolidated. The difference between the cost of the shares of acquired companies and the underlying net book value of the assets is amortized over the estimated economic life of the assets to which the difference is attributed.
Reporting Currency and Translation of Foreign Currencies
Prior to July 1, 2003, Noranda's Canadian operations have been measured in Canadian dollars and consolidated financial statements have been expressed in Canadian dollars. The accounts of self-sustaining foreign operations were translated using the current rate method, under which all assets and liabilities were translated at the exchange rate prevailing at year end, and revenues and expenses at average rates of exchange during the year. Gains or losses on translation of these account balances were not included in the consolidated statements of loss, but deferred and shown as a separate item in shareholders' equity. Gains or losses on foreign currency loans and transactions that were designated as hedges of a net investment in self-sustaining foreign operations were reported in shareholders' equity in the same manner as translation adjustments.
Foreign-denominated monetary assets and liabilities of Canadian operations and integrated foreign operations were translated at the exchange rates prevailing at the year end, and revenue and expenses (other than depreciation) at average rates of exchange during the year. Exchange gains and losses arising on the translation of the accounts were included in the consolidated loss. Non-monetary assets and liabilities were translated at historical rates of exchange.
Effective July 1, 2003, the United States dollar ("U.S. dollar") was adopted as the unit of measure of Noranda's Canadian operations which reflect significant operational exposure to the U.S. dollar and predominantly U.S. dollar-based asset and investment base of the Company. Concurrent with this change in functional currency, Noranda adopted the U.S. dollar as its reporting currency. In accordance with Canadian generally accepted accounting principles, the Company restated all amounts presented for comparative purposes into U.S. dollars using the current rate method whereby all revenues, expenses and cash flows are translated at the average rates that were in effect during these periods or presented at their U.S. dollar transactional amount and all assets and liabilities are translated at the prevailing noon rate in effect at the end of these periods (Cdn$1.5796 per US$1.00 for December 31, 2002). Equity transactions have been translated at historic rates; with opening equity restated at the rate of exchange on January 1, 1999. The resulting net translation adjustment has been credited to the cumulative translation account.
For periods after July 1, 2003, the assets and liabilities of Noranda's self-sustaining operations having a functional currency other than the U.S. dollar are translated into U.S. dollars using the exchange rate in effect at the month end and revenues and expenses are translated at the average rate during the month. Exchange gains and losses on translation of the Company's net equity investment in these operations are deferred as a separate component of shareholders' equity. Gains or losses on foreign currency loans and transactions that are designated as hedges of a net investment in self-sustaining foreign operations are reported in shareholders' equity in the same manner as translation adjustments.
Foreign-denominated monetary assets and liabilities are translated at the exchange rates prevailing at the year end, and revenue and expenses (other than depreciation) at average rates of exchange during the year. Exchange gains and losses arising on the translation of the accounts are included in the consolidated statement of income (loss). Non-monetary assets and liabilities are translated at historical rates of exchange.
Cash and Cash Equivalents
Cash and cash equivalents include cash on account, demand deposits and short-term investments with original maturities of three months or less and are stated at cost, which approximates market value. Cash equivalents of $59 (2002 — $nil) include $33 of restricted cash (2002 — $nil) to be used for repayment of senior debt of the Antamina project.
40 Noranda Annual Report 2003
Short-term Investments
Investments in corporate commercial paper issues have original maturities between four and nine months and are stated at cost, which approximates market value.
Product Inventories
Mining and metallurgical product inventories are valued at the lower of net realizable value and average cost where costs are comprised of direct costs and an allocation of production overheads and depreciation of production-related assets. Aluminum and fabricated product inventories are valued at the lower of cost (determined on a first-in, first-out basis, comprised of direct costs and an allocation of production overheads and depreciation of production-related assets) and net realizable value. Inventories of operating supplies and raw materials are valued at the lower of average direct acquisition cost and replacement value.
Revenue Recognition
Revenues from the sale of base metals, aluminum and fabricated products and from by-product materials are recorded at the time of sale, when the rights and obligations of ownership pass to the buyer. Prices used for provisionally priced sales are based on market prices prevailing at the time of shipment and are adjusted based upon market prices until final settlement with customers pursuant to the terms of sales contracts. Price changes for shipments which at year end are awaiting final pricing could have a material effect on future revenues.
Financial Instruments
Noranda enters into interest rate swap agreements to alter the interest characteristics of a portion of its outstanding debt from a fixed to a floating rate basis. These agreements involve the receipt of fixed-rate amounts in exchange for floating rate interest payments over the life of the agreement without an exchange of the underlying principal amount. Noranda also enters into interest rate swap agreements that involve the payment of fixed-rate amounts in exchange for the receipt of floating rate interest over the life of the agreement. The differential paid or received as a result of interest rate swap agreements is accrued and recognized as an adjustment to interest expense related to the debt.
Noranda uses forward foreign exchange and option contracts to hedge the effect of exchange rate changes on identifiable foreign currency exposures and futures, and forward and option contracts to hedge the effect of price changes on a portion of the commodities it sells. Gains and losses on these contracts are reported as a component of the related transactions. Gains and losses on early termination of hedging contracts are deferred until the hedged items are recognized in earnings. From time to time, Noranda enters into futures and forward contracts for the purchase or sale of commodities and currencies not related to production. Provisions are made for any estimated unrealized gains and losses on these contracts.
Noranda also uses cross-currency swap agreements which are used to hedge the interest rate risk and foreign currency exposures related to its non-U.S. dollar-denominated debt. Gains or losses on these contracts are accounted for in the same manner as the interest rate swap agreements and forward exchange contracts discussed above.
Noranda formally documents all relationships between hedging instruments and hedged items, as well as its risk management objective and strategy for undertaking various hedge transactions. This process includes linking all derivatives to specific firm commitments or forecasted transactions.
Noranda does not consider the credit risk associated with its financial instruments to be significant. Interest rate swaps, foreign currency contracts and commodity hedge contracts are maintained with high-quality counter-parties, and Noranda does not anticipate that any counterparty will fail to meet its obligations. Noranda does not have significant exposure to any individual customer, and these risks are further managed through an effective credit management program.
Depreciation, Amortization and Reclamation
Depreciation of property, plant and equipment is based on the estimated service lives of the assets, calculated primarily on a straight-line basis for metallurgical operations (not exceeding 40 years) and on a unit-of-production basis for mining operations. Preproduction and mine development expenditures are amortized over the estimated life of the mine on the unit-of-production method over proven and probable reserves. Construction in progress will be depreciated once the project is substantially completed. Provisions are made for future site reclamation and closure costs, net of expected recoveries, in a rational and systematic manner by charges to earnings over the expected life of an operation and calculated on a discounted basis. In the case of Noranda's mining operations this is on a unit-of-production basis over proven and probable reserves and in the case of Noranda's other operations on a straight-line basis.
Noranda Annual Report 2003 41
The estimated site reclamation and closure costs may change materially based on future changes in operations, costs of reclamation and closure activities, regulatory requirements and the outcome of legal proceedings.
Preproduction Costs
Preproduction costs related to major projects are deferred until the facilities achieve commercial production or are deemed to be uneconomic. These deferred costs are amortized on a unit-of-production method over the estimated useful life of the project or are written off when the project is determined to be uneconomic.
Asset Valuation
The company assesses long-lived assets for recoverability whenever indicators of impairment exist. When the carrying value of a long-lived asset is less than its net recoverable value as determined on an undiscounted basis, an impairment loss is recognized to the extent that its fair value, measured as the discounted cash flows over the life of the asset when quoted market prices are not readily available, is below the asset's carrying value.
Exploration
Mining exploration expenditures are charged against current earnings unless they relate to properties that have been subjected to sufficient pre-feasibility work that indicates future mine production is reasonably certain. Gains on the sale of mining exploration properties or recoveries of costs previously written off are credited against exploration expense.
Income and Production Taxes
Current taxes are recognized for the estimated income and mining taxes payable for the current year.
Future tax assets and liabilities are recognized for temporary differences between the tax and accounting bases of assets and liabilities as well as for the benefit of losses available to be carried forward to future years for tax purposes that are more likely than not to be realized. Future taxes are measured using the tax rates and laws that will be in effect when the differences are expected to reverse or the losses to be realized.
Interest
Interest incurred is charged to earnings, except for interest that can be identified with a major capital expenditure program. Prior to January 1, 2003, Noranda capitalized interest that could be identified with major projects until the project achieved commercial production. Under the new policy, interest is capitalized as it arises from indebtedness incurred to finance major projects, either directly or indirectly, until the project achieves commercial production.
Post-employment Costs
The cost of retirement benefits and certain post-employment benefits are recognized as the benefits are earned by the employees. Noranda uses the accrued benefit method pro-rated on length of service and management's best estimate assumptions to value its pensions and other retirement benefits. Assets are valued at fair value for the purpose of calculating the expected return on plan assets. Past service costs from plan amendments are amortized on a straight-line basis over the term of the employment contract. The excess of the net actuarial gain (loss) over 10% of the greater of the benefit obligation and the fair value of plan assets is amortized over the average remaining service period of active employees.
Under its defined contribution retirement savings program, Noranda makes payments based on employee earnings and partially matches employee contributions, to a defined maximum. Employees may receive profit sharing credits based on earnings.
When a defined benefit plan gives rise to an accrued benefit asset, Noranda recognizes a valuation allowance for the excess of the adjusted benefit asset over the expected future benefit to be realized from the plan asset. Changes in the allowance are included in the determination of pension expense.
Stock-based Compensation Plans
The Company has stock-based compensation plans, which are described in Note 12. The Company accounts for stock options using the fair value method. Under this method, compensation expense for stock options granted since January 1, 2002 is measured at fair value at the grant date using the Black-Scholes valuation model and recognized over the vesting period of the options granted.
The Company also has an employee share savings plan through which employees can purchase shares of the Company at market prices. For each dollar employees contribute to the plan, the Company contributes a prescribed percentage, which is expensed as employee compensation. For the Company's deferred unit plans, a liability is recorded to the extent that the Company's common share price exceeds the notional purchase price of the units. Notional dividends on the units are recorded as a direct charge to retained earnings.
42 Noranda Annual Report 2003
Earnings Per Share
Earnings per common share has been determined after deducting preferred share dividends and convertible debenture interest and has been based on the weighted-average number of common shares outstanding during the year excluding shares securing employee share purchase loans. Diluted earnings per share is calculated using the treasury stock method to compute the dilutive effect of stock options and the if-converted method for convertible debentures.
Use of Estimates
The preparation of financial statements in conformity with generally accepted accounting principles requires management to make estimates and assumptions. These estimates affect the reported amounts of assets and liabilities and the disclosure of contingent assets and liabilities at the date of the financial statements and the reported amounts of revenues and expenses during the reported period. Actual results could differ from those estimates.
Comparative Consolidated Financial Statements
The comparative consolidated financial statements have been reclassified from statements previously presented to conform to the presentation of the 2003 consolidated financial statements.
2. Changes in Accounting Policies
Capitalization of Interest
Effective January 1, 2003, Noranda revised its capitalization of interest policy to harmonize its policies with U.S. accounting standards as described in Note 1.
As a result, an increase to retained earnings of $25 was recorded at January 1, 2002. The change resulted in an increase to net income of $2 in both 2002 and 2003 years.
3. Restructuring and Gain on Sale of Investments
As at December 31
| | 2003
| | 2002
| |
|---|
| Magnesium impairment and closure costs (Note 4) | | $ | 33 | | $ | 520 | |
| Other restructuring costs | | | 29 | | | 41 | |
| Gain on sale of Noranda Income Fund/CEZ facility | | | (35 | ) | | (63 | ) |
| Other | | | (3 | ) | | — | |
| | |
| |
| |
| | | $ | 24 | | $ | 498 | |
| | |
| |
| |
Sale of CEZ Processing Facility
On May 3, 2002, the Company successfully completed an initial public offering of Priority Units of the Noranda Income Fund (the "Fund"). The Fund was created to acquire the Company's CEZ processing facility and ancillary assets located in Salaberry-de-Valleyfield, Quebec. Net cash proceeds of $263 were received and a pre-tax gain of $63 was recognized.
The Fund is an unincorporated open-ended trust established under the laws of Ontario. The Company's participation in the Fund decreased in the year to 25% following the sale of the Priority Units the Company held in the Fund.
Cash distributions on Ordinary Units are subordinate to distributions on Priority Units for 15 years except upon the occurrence of certain events. Each Ordinary Unit is entitled to receive cash distributions on a monthly basis in an amount that is equal to the monthly cash distributions paid to each Priority Unit, provided each Priority Unit is first paid an amount that is equal to the monthly cash distribution of not less than Cdn$0.08333 per Priority Unit (the "Base Distribution") before any amount is paid to holders of Ordinary Units. If, notwithstanding the subordination of the Ordinary Units, Distributable Cash is not sufficient to make the Base Distributions on Priority Units in a month, the amount of the deficiency shall not accumulate and will not be paid to holders of Priority Units. If Distributable Cash in a month is not sufficient to make a distribution on the Ordinary Units that is equal to the distribution on the Priority Units, the amount of the deficiency will accumulate and be paid to holders of the Ordinary Units from excess Distributable Cash in a subsequent month.
The Company's share of its 25% interest in the Fund, representing all of the outstanding Ordinary Units of the Fund, is accounted for on an equity basis.
On July 17, 2003, Noranda sold its remaining 11,984,900 Priority Units of the Noranda Income Fund for gross proceeds of $84 million. The pre-tax gain on the sale was $35 million. The proceeds were used to repay debt.
Noranda Annual Report 2003 43
Other Restructuring Costs
Employee reductions at Horne, Brunswick smelter and Kidd Creek operating sites and restructuring provisions at American Racing were recorded in the year of $29 (2002 — $30). Further restructuring costs for 2002 of $11 were recorded for the closure of the Gaspé smelter.
4. Joint Ventures
Noranda's share of the assets, liabilities and equity, revenues and expenses and cash flows of its major joint ventures for the years ended December 31, 2003 and 2002 are as follows:
| | 2003
| |
|---|
| | Antamina
| | Collahuasi
| | Magnesium
| | Louvicourt
| | Total
| |
|---|
| Balance Sheets | | | | | | | | | | | | | | | | |
| Current assets | | $ | 110 | | $ | 143 | | $ | 23 | | $ | 12 | | $ | 288 | |
| Capital assets and other | | | 655 | | | 917 | | | 252 | | | 9 | | | 1,833 | |
| | |
| |
| |
| |
| |
| |
| | | $ | 765 | | $ | 1,060 | | $ | 275 | | $ | 21 | | $ | 2,121 | |
| | |
| |
| |
| |
| |
| |
| Current liabilities | | $ | 75 | | $ | 87 | | $ | 6 | | $ | 2 | | $ | 170 | |
| Long-term debt and other | | | 339 | | | 592 | | | 41 | | | 2 | | | 974 | |
| Minority interest in subsidiaries | | | — | | | 156 | | | — | | | 7 | | | 163 | |
| Noranda' s investment | | | 351 | | | 225 | | | 228 | | | 10 | | | 814 | |
| | |
| |
| |
| |
| |
| |
| | | $ | 765 | | $ | 1,060 | | $ | 275 | | $ | 21 | | $ | 2,121 | |
| | |
| |
| |
| |
| |
| |
| Statements of Earnings (Loss) | | | | | | | | | | | | | | | | |
| Sales and other revenues | | $ | 187 | | $ | 275 | | $ | — | | $ | 28 | | $ | 490 | |
| Expenses | | | 159 | | | 206 | | | 33 | | | 24 | | | 422 | |
| Minority interest | | | — | | | 28 | | | — | | | 1 | | | 29 | |
| | |
| |
| |
| |
| |
| |
| Noranda' s share of earnings (loss) | | $ | 28 | | $ | 41 | | $ | (33 | ) | $ | 3 | | $ | 39 | |
| | |
| |
| |
| |
| |
| |
| Statements of Cash Flows | | | | | | | | | | | | | | | | |
| Cash realized from (used for): | | | | | | | | | | | | | | | | |
| | Operations | | $ | 57 | | $ | 95 | | $ | (28 | ) | $ | 13 | | $ | 137 | |
| | Investment activities | | | (15 | ) | | (114 | ) | | (13 | ) | | — | | | (142 | ) |
| | Financing activities | | | (47 | ) | | 9 | | | (1 | ) | | — | | | (39 | ) |
| | |
| |
| |
| |
| |
| |
| | 2002
| |
|---|
| | Antamina
| | Collahuasi
| | Magnesium
| | Louvicourt
| | Total
| |
|---|
| Balance Sheets | | | | | | | | | | | | | | | | |
| Current assets | | $ | 95 | | $ | 142 | | $ | 28 | | $ | 12 | | $ | 277 | |
| Capital assets and other | | | 680 | | | 807 | | | 194 | | | 15 | | | 1,696 | |
| | |
| |
| |
| |
| |
| |
| | | $ | 775 | | $ | 949 | | $ | 222 | | $ | 27 | | $ | 1,973 | |
| | |
| |
| |
| |
| |
| |
| Current liabilities | | $ | 75 | | $ | 81 | | $ | 17 | | $ | 2 | | $ | 175 | |
| Long-term debt and other | | | 377 | | | 556 | | | 25 | | | 2 | | | 960 | |
| Minority interest in subsidiaries | | | — | | | 126 | | | — | | | 9 | | | 135 | |
| Noranda' s investment | | | 323 | | | 186 | | | 180 | | | 14 | | | 703 | |
| | |
| |
| |
| |
| |
| |
| | | $ | 775 | | $ | 949 | | $ | 222 | | $ | 27 | | $ | 1,973 | |
| | |
| |
| |
| |
| |
| |
| Statements of Earnings (Loss) | | | | | | | | | | | | | | | | |
| Sales and other revenues | | $ | 166 | | $ | 246 | | $ | — | | $ | 28 | | $ | 440 | |
| Expenses | | | 149 | | | 200 | | | 429 | | | 26 | | | 804 | |
| Minority interest | | | — | | | 19 | | | — | | | 1 | | | 20 | |
| | |
| |
| |
| |
| |
| |
| Noranda' s share of earnings (loss) | | $ | 17 | | $ | 27 | | $ | (429 | ) | $ | 1 | | $ | (384 | ) |
| | |
| |
| |
| |
| |
| |
| Statements of Cash Flows | | | | | | | | | | | | | | | | |
| Cash realized from (used for): | | | | | | | | | | | | | | | | |
| | Operations | | $ | 66 | | $ | 127 | | $ | — | | $ | 10 | | $ | 203 | |
| | Investment activities | | | (54 | ) | | (65 | ) | | (85 | ) | | — | | | (204 | ) |
| | Financing activities | | | 9 | | | (19 | ) | | — | | | — | | | (10 | ) |
| | |
| |
| |
| |
| |
| |
44 Noranda Annual Report 2003
Noranda holds a 33.75% interest in Antamina, a copper/zinc mine project in Peru. Noranda, through its Falconbridge subsidiary, holds a 44% interest in Compañia Minera Doña Inés de Collahuasi S.C.M. ("Collahuasi"), a corporation which owns the mining and water rights and other assets relating to the Collahuasi project, and which secured financing, conducts the operations and markets the products of the property.
Noranda owns an 80% joint-venture interest in the Magnesium project, a facility for the extraction of magnesium from mining residues in Danville, Quebec. As a result of depressed global magnesium prices, the Company recorded an impairment charge of $520 in 2002 and temporarily shut down its Magnesium operation in April 2003. Included in restructuring costs in 2003 is a charge of $33 related to this closure. The Company holds through its 62.1%-owned subsidiary, Novicourt, a 45% joint-venture interest in the Louvicourt copper/zinc mine in northwestern Quebec.
5. Operating Capital Assets
| | 2003
| |
|---|
As at December 31
| |
|---|
| | Copper
| | Nickel
| | Zinc
| | Aluminum
| | Other
| | Total
| |
|---|
| Property, plant and equipment, at cost | | $ | 4,107 | | $ | 1,868 | | $ | 628 | | $ | 1,195 | | $ | 527 | | $ | 8,325 | |
| Accumulated depreciation | | | (1,790 | ) | | (1,114 | ) | | (462 | ) | | (616 | ) | | (442 | ) | | (4,424 | ) |
| | |
| |
| |
| |
| |
| |
| |
| | | | 2,317 | | | 754 | | | 166 | | | 579 | | | 85 | | | 3,901 | |
| Deferred preproduction, development and exploration (net) | | | 423 | | | 298 | | | 57 | | | — | | | 3 | | | 781 | |
| | |
| |
| |
| |
| |
| |
| |
| | | $ | 2,740 | | $ | 1,052 | | $ | 223 | | $ | 579 | | $ | 88 | | $ | 4,682 | |
| | |
| |
| |
| |
| |
| |
| |
| | 2002
| |
|---|
As at December 31
| |
|---|
| | Copper
| | Nickel
| | Zinc
| | Aluminum
| | Other
| | Total
| |
|---|
| Property, plant and equipment, at cost | | $ | 3,664 | | $ | 1,620 | | $ | 542 | | $ | 1,186 | | $ | 563 | | $ | 7,575 | |
| Accumulated depreciation | | | (1,355 | ) | | (915 | ) | | (366 | ) | | (588 | ) | | (445 | ) | | (3,669 | ) |
| | |
| |
| |
| |
| |
| |
| |
| | | | 2,309 | | | 705 | | | 176 | | | 598 | | | 118 | | | 3,906 | |
| Deferred preproduction, development and exploration (net) | | | 393 | | | 277 | | | 68 | | | — | | | 8 | | | 746 | |
| | |
| |
| |
| |
| |
| |
| |
| | | $ | 2,702 | | $ | 982 | | $ | 244 | | $ | 598 | | $ | 126 | | $ | 4,652 | |
| | |
| |
| |
| |
| |
| |
| |
6. Development Projects
Development projects consist of brownfield and greenfield projects that are expected to contribute to earnings upon completion of construction and advancement to commercial production.
Major projects in the category are as follows:
| |
| | As at December 31
|
|---|
| | Category
|
|---|
| | 2003
| | 2002
|
|---|
| | Collahuasi expansion | | Brownfield | | $ | 207 | | $ | 47 |
| | Kidd Creek — deep expansion | | Brownfield | | | 276 | | | 191 |
| | Koniambo — New Caledonia | | Greenfield | | | 123 | | | 76 |
| | Magnesium | | Brownfield | | | 252 | | | 194 |
| Other development projects | | | | | 115 | | | 95 |
| | | | |
| |
|
| | | | | $ | 973 | | $ | 603 |
| | | | |
| |
|
During 2003, an additional $370 million of capital was invested into the projects. No additional capital was expended in the magnesium operations during 2003. The increase in carrying value attributed to the magnesium operations in 2003 is as a result of capitalization of operating costs during the first quarter of 2003 and the appreciation of the Canadian dollar compared to the U.S. dollar during 2003.
Noranda Annual Report 2003 45
7. Investments and Other Assets
As at December 31
| | 2003
| | 2002
|
|---|
| Equity accounted investment — Noranda Income Fund | | $ | 46 | | $ | 84 |
| Cost accounted investments | | | 17 | | | 14 |
| Derivative financial instrument | | | 24 | | | — |
| Deferred acquisition costs | | | 23 | | | — |
| Debenture discount and issue expenses — net | | | 21 | | | 14 |
| Supplies inventory | | | 16 | | | 18 |
| Deposits and other assets | | | 58 | | | 52 |
| | |
| |
|
| | | $ | 205 | | $ | 182 |
| | |
| |
|
8. Debt
| |
| |
| | Principal repayment schedule as at December 31, 2003
|
|---|
| | Interest rates1
| | Total 2003
| | 2004
| | 2005
| | 2006
| | 2007
| | 2008
| | 2009 to 2012
| | After 2012
| | Total 2002
|
|---|
| Debt of the Company and its wholly-owned subsidiaries: | | | | | | | | | | | | | | | | | | | | | | |
| Notes payable and revolving term loans | | 4.00% | | $ | 55 | | 13 | | 3 | | 1 | | 28 | | 2 | | 4 | | 4 | | $ | 330 |
| Senior debentures | | 4.83% | | | 1,450 | | 300 | | 200 | | — | | — | | — | | 600 | | 350 | | | 1,300 |
| Liability element of convertible debentures (Note 11) | | 5.0% | | | 18 | | — | | — | | — | | 18 | | — | | — | | — | | | 18 |
| | |
| |
| |
| |
| |
| |
| |
| |
| |
| |
|
| | | 4.80% | | | 1,523 | | 313 | | 203 | | 1 | | 46 | | 2 | | 604 | | 354 | | | 1,648 |
| | |
| |
| |
| |
| |
| |
| |
| |
| |
| |
|
| Debt of partially-owned subsidiaries and joint ventures | | 4.44% | | | 1,801 | | 118 | | 330 | | 346 | | 96 | | 217 | | 436 | | 258 | | | 1,701 |
| | |
| |
| |
| |
| |
| |
| |
| |
| |
| |
|
| Total | | 4.61% | | $ | 3,324 | | 431 | | 533 | | 347 | | 142 | | 219 | | 1,040 | | 612 | | $ | 3,349 |
| | |
| |
| |
| |
| |
| |
| |
| |
| |
| |
|
| Debt due within one year | | | | | 431 | | | | | | | | | | | | | | | | | 335 |
| | | | |
| | | | | | | | | | | | | | | |
|
| Long-term debt | | | | $ | 2,893 | | | | | | | | | | | | | | | | $ | 3,014 |
| | | | |
| | | | | | | | | | | | | | | |
|
- 1
- Weighted-average interest rates after swap contracts, as at December 31, 2003.
a) On May 28, 2003, Noranda's partially-owned subsidiary Falconbridge issued $250 million 5.375% fixed-rate debentures maturing on June 1, 2015. The proceeds from this offering were used to repay debt outstanding under its commercial paper program, to fund planned expenditures and for other general corporate purposes.
On September 24, 2003, Noranda issued $350 million 6% fixed-rate debentures maturing October 15, 2015. The proceeds from this offering were invested in short-term investments and used for other general corporate purposes.
b) Notes payable and revolving term loans include borrowings under unsecured committed bank lines of credit that are structured to provide the Company with the right to borrow at floating rates and repay these amounts over the next five years. At December 31, 2003, Noranda had utilized $68 (including $32 by Falconbridge, excluding Collahuasi) from its total committed lines of $1,132 (including $405 for Falconbridge, excluding Collahuasi).
Senior debentures of $1,450 (2002 — $1,300) are direct unsecured obligations of the Company.
c) Debt of partially-owned subsidiaries and joint ventures includes US$374, Noranda's 33.75% share of the $1,109 of borrowings under Antamina's $1,320 senior credit facilities. These facilities, provided by a consortium of international banks and national import/export credit agencies, have maturity dates ranging from 4.5 to 8.5 years. With the exception of $157, all of these facilities are insured for political risks or are otherwise guaranteed for political risks by multilateral, national or private sector institutions. Noranda's guarantee of this facility was removed during 2003 as the completion tests were met.
46 Noranda Annual Report 2003
d) After taking into account current interest rates and credit spreads, the fair value of the debt of the Company at December 31, 2003 was greater than book value by $120 (2002 — $20), and the fair value of the debt of its partially-owned subsidiaries and joint ventures was greater than book value by $94 (2002 — $48).
e) Interest rate swap agreements of $650 (2002 — $300) have been entered into by the Company, and $400 (2002 — $275) by its partially-owned subsidiaries and joint ventures, whereby fixed rates of interest are received and floating rates are paid for terms up to 11.5 years. In addition, interest rate swap agreements of $561 (2002 — $454) have been entered into by the Company's partially-owned subsidiaries and joint ventures, whereby fixed rates of interest are paid and floating rates are received for a period up to 8.5 years. As at December 31, 2003, the estimated aggregate fair value of the interest rate swap agreements of the Company and its partially-owned subsidiaries and joint ventures had a mark-to-market gain of $14 and $24 respectively (2002 — $23 and $39, respectively).
The Company's partially-owned subsidiary Falconbridge has entered into several cross-currency interest rate swap transactions whereby rates of interest on debentures in the amount of $86 (2002 — $86) are swapped to floating and $25 (2002 — $25) are swapped to fixed rates of interest for terms of five years. At December 31, 2003, the mark-to-market value of these positions was a gain of $31 (2002 — $1).
At December 31, 2002, the Company recorded a deferred gain of $21 on the closure of Cdn$400 interest rate swap agreements. Of this amount, the Company recognized into income $17 during 2003, with the balance to be recognized over the original remaining term which will expire July 2004.
Interest, net
| | 2003
| | 2002
| |
|---|
| Interest on long-term debt | | $ | 158 | | $ | 156 | |
| Interest on short-term debt | | | 5 | | | 4 | |
| Interest income | | | (14 | ) | | (12 | ) |
| | |
| |
| |
| | | | 149 | | | 148 | |
| Capitalized interest | | | (20 | ) | | (50 | ) |
| | |
| |
| |
| | | $ | 129 | | $ | 98 | |
| | |
| |
| |
9. Reclamation, Pension and Other Provisions
| | 2003
| |
| | 2002
| |
|
|---|
As at December 31
| | Company and wholly-owned subsidiaries
| | Partially-owned subsidiaries and joint ventures
| | Total
| | Company and wholly-owned subsidiaries
| | Partially-owned subsidiaries and joint ventures
| | Total
|
|---|
| Reclamation and other environmental provisions | | $ | 197 | | $ | 106 | | $ | 303 | | $ | 171 | | $ | 64 | | $ | 235 |
| Pension, benefits and other provisions | | | (64 | ) | | 175 | | | 111 | | | (56 | ) | | 188 | | $ | 132 |
| | |
| |
| |
| |
| |
| |
|
| | | $ | 133 | | $ | 281 | | $ | 414 | | $ | 115 | | $ | 252 | | $ | 367 |
| | |
| |
| |
| |
| |
| |
|
10. Interests of Other Shareholders
As at December 31
| | 2003
| | 2002
|
|---|
| Preferred shares of subsidiaries | | $ | 130 | | $ | 130 |
| Common equity interests | | | 784 | | | 629 |
| | |
| |
|
| | | $ | 914 | | $ | 759 |
| | |
| |
|
11. Convertible Debentures
The Cdn$150 adjustable rate convertible subordinated debentures Series 1, due April 30, 2007, bear interest at a rate which is the greater of 5%, and of 1% plus the percentage that two times the common share dividend paid in the previous six months is of the conversion price. The debentures are convertible at the holder's option into common shares of the Company at a conversion price of Cdn$27.55 per common share, on or before the last business day prior to the maturity date of the debentures, or the last business day prior to redemption. The Company has the option of redeeming the debentures, and upon maturity they are redeemable, at the Company's option, for common shares of the Company.
The Company's convertible debentures contain both debt and equity components. Although under certain conditions the interest portion of the debentures may be settled by issuing common shares, the Company believes it is improbable that those conditions will be met, and has accounted for the present value of the interest portion as a liability. At December 31, 2003, this liability amounted to $18 (2002 — $18). The amount representing the principal has been classified as a component of shareholders' equity and was $84 at December 31, 2003 (2002 — $79).
Noranda Annual Report 2003 47
12. Shareholders' Equity
Capital Stock
Authorized:
Preferred shares, an unlimited number
Common shares, an unlimited number
Participating shares, an unlimited number
| | 2003
| | 2002
| |
|---|
| Issued: | | | | | | | |
| | Preferred shares Series F | | $ | 59 | | $ | 59 | |
| | Preferred shares Series G | | | 137 | | | 137 | |
| | Preferred shares Series H | | | 99 | | | — | |
| | Equity element of convertible debentures (Note 11) | | | 84 | | | 79 | |
| | Common shares | | | 2,084 | | | 1,595 | |
| | Stock option valuation | | | 3 | | | 1 | |
| | |
| |
| |
| | | | 2,466 | | | 1,871 | |
| Retained earnings (deficit) | | | (92 | ) | | 24 | |
| Currency translation adjustment | | | 265 | | | (34 | ) |
| | |
| |
| |
| | | | 2,639 | | | 1,861 | |
| Share purchase plan | | | (3 | ) | | (3 | ) |
| | |
| |
| |
| | | $ | 2,636 | | $ | 1,858 | |
| | |
| |
| |
Preferred Shares Series F
The Company had 3,246,057 (2002 — 3,246,057) Cumulative, Redeemable Preferred Shares, Series F (the "Series F Preferred Shares") outstanding at December 31, 2003.
Prior to November 1, 2001, holders of Series F Preferred Shares received a quarterly fixed dividend at a rate of 5.8% per annum. On November 1, 2001, the Series F Preferred Shares commenced paying a monthly floating dividend based on a dividend rate that fluctuates over time between 50% and 100% of Prime for each month. The dividend rate is adjusted upwards or downwards on a monthly basis by an Adjustment Factor whenever the Calculated Trading Price, being the market price of the Series F Preferred Shares, is Cdn$24.875 or less or Cdn$25.125 or more, respectively. The Adjustment Factor for a month is based on the Calculated Trading Price of the Series F Preferred Shares for the preceding month. The maximum Adjustment Factor for any month is ±4.00%. The annual floating dividend rate for any month is Prime multiplied by the Designated Percentage for such month (the Adjustment Factor for such month plus the Designated Percentage for the preceding month).
Holders of Series F Preferred Shares had the right to convert their shares, effective on November 1, 2001, on a one-for-one basis into Cumulative, Redeemable Preferred Shares, Series G (the "Series G Preferred Shares"). Of the 12,000,000 outstanding Series F Preferred Shares, 8,753,943 were converted into Series G Preferred Shares. Holders will again have the right to convert their shares, on a one-for-one basis into Series G Preferred Shares on November 1, 2006, and every five years thereafter. On November 1, 2001, the Series F Preferred Shares became redeemable, at the option of the Company, at Cdn$25.50 per share plus unpaid and accrued dividends.
Preferred Shares Series G
The Company had 8,753,943 (2002 — 8,753,943) Series G Preferred Shares outstanding at December 31, 2003. These Series G Preferred Shares were issued as a result of the conversion of the same number of Series F Preferred Shares into Series G Preferred Shares on November 1, 2001.
For each of the five years commencing November 1, 2001, holders of Series G Preferred Shares will receive, as and when declared by the Board of Directors, a quarterly fixed dividend at a rate of 6.10% per annum. On November 1, 2006, the Series G Preferred Shares will be redeemable, at the option of the Company, at Cdn$25.00 per share plus unpaid and accrued dividends. Subject to certain conditions, holders of Series G Preferred Shares will have the right to convert their shares into Series F Preferred Shares on a one-for-one basis on November 1, 2006 and on November 1 of every fifth year thereafter.
48 Noranda Annual Report 2003
Preferred Shares Series H
The Company completed a public offering of Cumulative Preferred Shares, Series H for aggregate gross proceeds of Cdn$150 million on March 25, 2003. At December 31, 2003, there were 6,000,000 Series H Preferred Shares outstanding.
Holders of the Series H Preferred Shares are entitled to fixed cumulative preferential cash dividends, if, as and when declared by the Company's board of directors, at a rate of Cdn$1.625 per share per annum, payable quarterly, in equal installments of Cdn$0.40625 per share, on the last day of March, June, September and December of each year.
On and after March 31, 2008, the Company may, at its option (i) redeem the outstanding Series H Preferred Shares in whole at any time or in part from time to time, by the payment of Cdn$25.00 per share, together with all accrued and unpaid dividends up to but excluding the date fixed for redemption; or (ii) subject, if required, to stock exchange approvals, convert the outstanding Series H Preferred Shares into Noranda common shares. The number of common shares into which each Series H Preferred Share may be so converted will be determined by dividing the redemption price per Series H Preferred Share, together with all accrued and unpaid dividends up to but excluding the date fixed for conversion, by the greater of Cdn$2.00 and 95% of the current market price of Noranda common shares at such time.
On or after June 30, 2008, each Series H Preferred Share will be convertible at the option of the holder on the last day of March, June, September and December in each year into that number of Noranda common shares determined by dividing Cdn$25.00, together with all accrued and unpaid dividends up to but excluding the date fixed for conversion, by the greater of Cdn$2.00 and 95% of the current market price of Noranda common shares at such time. If a holder of Series H Preferred Shares elects to convert any of those shares into Noranda common shares, the Company may, on not less than 20 days notice prior to the conversion date, elect to redeem those Series H Preferred Shares for Cdn$25.00 per share, together with all accrued and unpaid dividends up to but excluding the date fixed for conversion or arrange for the sale of those shares to substitute purchasers at such price.
Preferred Shares Series I
The Company completed a private placement of 6,000,000 Cumulative Preferred Shares, Series I to Brascan Corporation for aggregate gross proceeds of Cdn$150 million on April 25, 2003. On August 18, 2003 the Company redeemed all Series I Preferred Shares with a portion of the net proceeds it received from the issuance of the 24,800,000 common shares issued on August 11, 2003. As a result of this redemption, a foreign exchange loss of $5 was recorded in retained earnings.
Common Share Issue
On August 12, 2003, the Company completed a public issue of 48,520,000 common shares at a price of Cdn$12.65 for net proceeds of Cdn$601. Brascan Corporation subscribed for 20,000,000 shares from this issue.
Non-voting Participating Shares
The authorized and unissued non-voting participating shares participate ratably with the holders of common shares in dividends and distributions of the assets of the Company.
Summary of Common Share Transactions
| | Shares (000)
| | Amount
|
|---|
| Common shares, December 31, 2001 | | 238,584 | | $ | 1,568 |
| Issued on exercise of stock options | | 15 | | | — |
| Issued under dividend re-investment | | 2,553 | | | 25 |
| Issued under share purchase plan | | 137 | | | 2 |
| | |
| |
|
| Common shares, December 31, 2002 | | 241,289 | | $ | 1,595 |
| | |
| |
|
| Issue of common shares | | 48,520 | | $ | 434 |
| Issued on exercise of stock options | | 373 | | | 5 |
| Issued under dividend re-investment | | 5,046 | | | 50 |
| | |
| |
|
| Common shares, December 31, 2003 | | 295,228 | | $ | 2,084 |
| | |
| |
|
Earnings Per Share
Earnings per share is determined by dividing net earnings, after deducting preferred share dividends and the equity portion of the convertible debenture interest, by the weighted-average number of common shares outstanding during the year, excluding shares securing employee share purchase loans.
Noranda Annual Report 2003 49
Diluted loss per share assumes that outstanding dilutive stock options are exercised at the beginning of the period (or at the time of issuance, if later) and the proceeds are used to purchase common stock at the average market price during the period, and that dilutive convertible debentures are converted into common shares at the beginning of the period.
Share Purchase Plan
In 1998, 2001 and 2002, loans were issued to executives of the Company for the purchase of common shares under the share purchase plan. The loans are repayable on demand, mature in ten years, and are secured by a pledge of 331,950 common shares at December 31, 2003 (2002 — 344,550). Loans receivable at December 31, 2003 of $3 (2002 — $3) are recorded as a reduction of shareholders' equity, and upon loan repayment there will be a corresponding increase in shareholders' equity.
Stock Options
The Company has a stock option plan through which options may be granted to directors, officers and employees for the purchase of common shares. Options were granted at prices equal to the five-day average price prior to the grant. Stock options generally have a 10-year term and contain vesting provisions of 20% on the first anniversary following the date of the grant, and a further 20% on each of the four subsequent anniversary dates. Stock options granted from January 1, 2000 to February 28, 2002 have a 10-year term and the same vesting provisions; however, they also contain an accelerated vesting feature specifying that on the first day that the market price of the common shares is 20% greater than the exercise price of the option, the final tranche of certain unvested options outstanding on that date will immediately vest and be exercisable.
During 2003, three stock option series were granted totaling 1,422,500 options at a weighted-average price of Cdn$14.45. The compensation expense associated with these stock options series was calculated using the Black-Scholes valuation model assuming the following weighted-average parameters; 8-year term, 25% volatility, expected dividend of 5.35% annually and an interest rate of 4.89%. The stock option value is charged against net income over its vesting period.
Corporate and general administration expenses to December 31, 2003 include compensation costs of $3 (2002 — $4) relating to outstanding options granted since January 1, 2002.
A summary of the status of the stock option plan and changes during the years is presented below:
| | 2003
| | 2002
|
|---|
| | Options (000)
| | Weighted-average exercise price (Cdn)
| | Options (000)
| | Weighted-average exercise price (Cdn)
|
|---|
| Outstanding, beginning of year | | 8,591 | | $ | 16.65 | | 7,182 | | $ | 16.90 |
| Granted | | 1,422 | | | 14.45 | | 2,211 | | | 15.56 |
| Exercised through the purchase option feature | | (373 | ) | | 15.92 | | (13 | ) | | 18.25 |
| Exercised through the market growth option feature | | — | | | — | | (774 | ) | | 15.91 |
| Cancelled | | (56 | ) | | 16.85 | | (15 | ) | | 15.83 |
| | |
| |
| |
| |
|
| Outstanding, end of year | | 9,584 | | $ | 16.35 | | 8,591 | | $ | 16.65 |
| | |
| |
| |
| |
|
The following table summarizes information about stock options outstanding at December 31, 2003:
| | Options outstanding
| |
| | Options exercisable
|
|---|
Range of
exercise prices (Cdn)
| | Number (000)
outstanding at
December 31, 2003
| | Weighted-average remaining contractual life (years)
| | Weighted-average exercise price (Cdn)
| | Number (000)
exercisable at
December 31, 2003
| | Weighted-average exercise price (Cdn)
|
|---|
| $12.67 to $17.88 | | 8,162 | | 8.0 | | $ | 15.63 | | 3,719 | | $ | 16.03 |
| $18.00 to $19.29 | | 914 | | 6.2 | | | 18.86 | | 687 | | | 19.14 |
| $23.26 to $24.17 | | 508 | | 4.0 | | | 23.27 | | 508 | | | 23.27 |
| | |
| |
| |
| |
| |
|
| | | 9,584 | | 7.6 | | $ | 16.35 | | 4,914 | | $ | 17.21 |
| | |
| |
| |
| |
| |
|
50 Noranda Annual Report 2003
Director Deferred Stock Unit Plan
Under the Deferred Stock Unit (DSU) Plan for the Company's non-employee directors, each eligible director may elect to be paid annual retainer fees and/or meeting attendance fees in DSUs rather than in cash. A DSU is a notional unit, equivalent in value to a common share.
Deferred stock units are credited with "dividend equivalents" when dividends are paid on the common shares of the Company, and such dividend equivalents are converted into additional units based on the fair market value of common shares on the date credited.
Payment of DSUs is not made until such time as the director leaves the Board, and may be in cash or in common shares of the Company purchased on the open market.
As of December 31, 2003 the total DSUs held by participating directors was 44,108 (2002 — 23,988), the accrual in respect of which is not significant at December 31, 2003 and 2002.
Management Deferred Share Unit Plan (MDSUP)
Management deferred share units ("Units") may be granted each year at the discretion of the Board to senior executives in lieu of all or part of their annual cash bonus awards. The annual bonus awards would be converted to Units based on a rate set on the award date. The portion of the annual bonus award elected to be received in Units by the executive may, at the discretion of the H.R. Committee, be increased by a factor of up to two times for purposes of calculating the number of Units to be allocated under the MDSUP.
An executive who holds Units will receive additional Units as dividends are paid on the common shares of the Company, on the same basis as if the dividends were reinvested pursuant to the Company's dividend reinvestment plan. The Units will vest over a five-year period and participants will only be allowed to redeem the Units upon cessation of employment.
The cash value of the Units when redeemed will be equivalent to the market value of an equivalent number of Noranda common shares at the time of cessation of employment with the Company.
As of December 31, 2003, a total of 33,666 Units were held by executives of the Company (2002 — 23,250), the accrual in respect of which is not significant at December 31, 2003 and 2002.
Dividend Reinvestment Plan
Canadian resident shareholders may elect to reinvest their cash dividends from common shares to purchase additional shares. During 2003, 5,046,641 (2002 — 2,552,932) common shares were issued under the dividend reinvestment plan.
13. Income and Production Taxes
The provision for income and production taxes differs from the amount that would have resulted by applying statutory income tax rates to earnings as described below. The difference arose for the following reasons:
| | 2003
| | 2002
| |
|---|
| Income (loss) before the following: | | | | | | | |
| | Income and production taxes and minority interest | | $ | 147 | | $ | (589 | ) |
| | |
| |
| |
| Provision based on combined federal and composite provincial tax rate of 38.6% (2002 — 39.8%) | | $ | 57 | | $ | (234 | ) |
| Increase (decrease) in taxes resulting from: | | | | | | | |
| | Resource and depletion allowances | | | (6 | ) | | 48 | |
| | Royalties and mineral taxes | | | 7 | | | — | |
| | Rate differences from foreign and manufacturing activities | | | (52 | ) | | (8 | ) |
| | Non-taxable items | | | (20 | ) | | — | |
| | Capital taxes | | | 13 | | | 15 | |
| | Foreign exchange adjustments | | | 18 | | | (7 | ) |
| | Non-recurring and other | | | 7 | | | 18 | |
| | |
| |
| |
| Income and production taxes | | $ | 24 | | $ | (168 | ) |
| | |
| |
| |
Consolidated income and production taxes are as follows:
| | 2003
| | 2002
| |
|---|
| Current: | | | | | | | |
| | Federal and provincial income taxes | | $ | 16 | | $ | 20 | |
| | Provincial mining taxes | | | 2 | | | 3 | |
| | Foreign taxes | | | 35 | | | 11 | |
| | |
| |
| |
| | | $ | 53 | | $ | 34 | |
| | |
| |
| |
| Future: | | | | | | | |
| | Federal and provincial income taxes | | $ | (51 | ) | $ | (168 | ) |
| | Provincial mining taxes | | | 4 | | | (3 | ) |
| | Foreign taxes | | | 18 | | | (31 | ) |
| | |
| |
| |
| | | $ | (29 | ) | $ | (202 | ) |
| | |
| |
| |
| | | $ | 24 | | $ | (168 | ) |
| | |
| |
| |
Noranda Annual Report 2003 51
The components of the future tax asset and future tax liability at December 31, 2003 and 2002 are as follows:
|
|
2003
|
|
2002
|
|
|---|
| | Legal entities where
| | Legal entities where
| |
|---|
| | assets exceed liabilities
| | liabilities exceed assets
| | assets exceed liabilities
| | liabilities exceed assets
| |
|---|
| Future tax assets: | | | | | | | | | | | | | |
| | Pensions | | $ | 1 | | $ | — | | $ | — | | $ | 10 | |
| | Post-retirement benefits | | | 21 | | | 59 | | | 16 | | | 45 | |
| | Reclamation provisions | | | 54 | | | 30 | | | 35 | | | 22 | |
| | Exploration | | | 15 | | | — | | | 13 | | | 9 | |
| | Inventory valuations | | | 3 | | | 6 | | | 3 | | | 7 | |
| | Non capital losses | | | 55 | | | 197 | | | 66 | | | 119 | |
| | Foreign exchange | | | — | | | — | | | 37 | | | — | |
| | Research and development | | | 79 | | | 16 | | | 49 | | | 10 | |
| | Other | | | 120 | | | 53 | | | 87 | | | 36 | |
| | |
| |
| |
| |
| |
| | | $ | 348 | | $ | 361 | | $ | 306 | | $ | 258 | |
| | |
| |
| |
| |
| |
| Future tax liabilities: | | | | | | | | | | | | | |
| | Property, plant and equipment | | $ | (38 | ) | $ | (407 | ) | $ | (51 | ) | $ | (327 | ) |
| | Development and preproduction | | | (5 | ) | | (177 | ) | | (6 | ) | | (128 | ) |
| | Foreign exchange | | | (18 | ) | | (9 | ) | | (5 | ) | | (14 | ) |
| | Pensions | | | (50 | ) | | (12 | ) | | (37 | ) | | — | |
| | Exploration | | | (2 | ) | | — | | | (2 | ) | | 2 | |
| | Other | | | (5 | ) | | (40 | ) | | (5 | ) | | (40 | ) |
| | |
| |
| |
| |
| |
| | | $ | (118 | ) | $ | (645 | ) | $ | (106 | ) | $ | (507 | ) |
| | |
| |
| |
| |
| |
| Net future tax asset (liability) | | $ | 230 | | $ | (284 | ) | $ | 200 | | $ | (249 | ) |
| | |
| |
| |
| |
| |
The Company has non-resident subsidiaries that have tax losses of $106 (2002 — $106) for which no benefit has been recorded. If the tax benefit had been recorded, the amount would have been $18 (2002 — $18).
14. Financial Instruments
Noranda uses various strategies to manage its market risk, including the use of derivative contracts to limit, offset or reduce the Company's market exposure. Derivative instruments are used to manage well-defined commodity price, foreign exchange and interest rate risks arising from Noranda's primary business activities. The fair values of Noranda's derivative instruments, as summarized later in this note, are based on quoted market prices for similar instruments and on market closing prices at year end.
Effective July 1, 2003, Noranda's functional currency was changed from the Canadian to U.S. dollar. Following this change, Noranda realigned its hedging programs to manage the risk associated with its non-U.S. dollar investments and monetary assets and liabilities, as well as change its cash flow hedging program to now hedge the exposure created by its non-U.S. dollar expenses.
a) Fixed Forward Price Hedges
Some customers request a fixed sales price instead of the COMEX or London Metal Exchange ("LME") average price in the month of shipment. Noranda enters into futures contracts that will allow it to receive the COMEX or LME average price in the month of shipment while customers pay the agreed upon fixed price. Noranda accomplishes this by settling the futures contracts during the month of shipment, which generally results in the realization of the COMEX or LME average price.
At December 31, 2003, the mark-to-market value of these positions was a gain of $9 (2002 — loss of $5).
b) Commodity Hedges
Noranda purchases metal in concentrate or scrap to be processed eventually into refined metal for sale to customers. The raw material feed is purchased from third parties at prices that are often different from the eventual sale to metal customers, largely due to the timing of processing. To mitigate the price risk resulting from the difference between the timing of purchases and sales, Noranda hedges such transactions. The hedge transactions involve the purchase or sale of over-the-counter or LME or COMEX exchange-traded contracts. In the month that the refined metal is sold, the corresponding commodity hedge position is liquidated at the COMEX or LME average price for the month of sale.
As at December 31, 2003 the mark-to-market unrealized loss was $18 (2002 — unrealized gain of $4).
52 Noranda Annual Report 2003
c) Hedges of Foreign-denominated Expenditures
Prior to July 1, 2003, Noranda managed a foreign currency cash flow hedging program whereby portions of its forecasted U.S. dollar-denominated revenue were hedged with forward foreign exchange contracts with its banks. At December 31, 2002, Noranda had forward contracts to sell $886 maturing over the following 4.5 years, at an average exchange rate of Cdn$1.53. In addition, Noranda's partially-owned subsidiary had also entered into various short-term option contracts which, if exercised, would have resulted in additional sales of $125. The mark-to-market value of these positions at December 31, 2002 was a loss of $40.
Subsequent to the change, Noranda started hedging its Canadian dollar costs using foreign currency exchange contracts. When the Canadian dollar strengthens significantly against the U.S. dollar, the increase in value of future Canadian dollar costs is partially offset by gains in the value of the forward currency contracts designated as hedges. Conversely, when the Canadian dollar weakens, the decrease in the value of future Canadian dollar costs is partially offset by losses in the value of the forward currency contracts.
At December 31, 2003, Noranda had forward currency exchange contracts to purchase Cdn$1,097 maturing over the next 3.5 years at an average exchange rate of Cdn$1.50. In addition, Noranda's partially-owned subsidiary also had option contracts that, if exercised, would result in the purchase of Cdn$29 over the next four months. The mark-to-market value of these positions at December 31, 2003 was a gain of $110.
In addition, Noranda's partially-owned subsidiary also maintains a program to hedge its Norwegian Kroner and Chilean peso expenditures. At December 31, 2003, Noranda's partially-owned subsidiary entered into other short-term forward foreign exchange contracts to hedge its Norwegian and Chilean commitments, whereby it would purchase notional amounts with a U.S. dollar equivalent of $81 (2002 — Canadian dollar equivalent of $218) and also entered into various short-term forward foreign option contracts which, if exercised, would have resulted in the purchase of 210 million Norwegian Kroner (2002 — 165 million). At December 31, 2003, the mark-to-market value of these contracts was a gain of $17 (2002 — mark-to-market approximated their carrying value).
Noranda's revenues and operating costs to December 31, 2003 include realized exchange gains from the settlement of various revenue and cost hedge contracts of $18 and $16 (2002 — exchange loss in revenue of $18 and exchange gain in operating costs of $8).
d) Hedge of Net Investment in Foreign Operations
The Company uses forward foreign exchange contracts and foreign-denominated obligations to protect the value of its investments in its foreign subsidiaries.
At December 31, 2002, the Company hedged its U.S. dollar net assets with a principal amount of $955 of its senior debentures and a series of short-term foreign exchange contracts resulting in sales of $570 to purchase Canadian dollars. In addition, the forward foreign exchange components of the cross-currency swap agreements and other short-term foreign exchange contracts combined to buy $345 and sell Canadian dollars, were designed as hedges against U.S. dollar-denominated debt. The Company's partially-owned subsidiary had outstanding foreign exchange contracts to sell a notional amount of $61 as a hedge against foreign-denominated monetary assets and liabilities. As at December 31, 2002 the unrealized gain on these contracts was $31.
At December 31, 2003, the Company had outstanding foreign exchange contracts to sell Cdn$82, maturing over the next eight years, designated as hedges against Canadian dollar net assets. In addition, a series of short-term foreign exchange contracts to sell Cdn$134 are designated as hedges against foreign-denominated monetary assets of the Company. The Company's partially-owned subsidiary had a series of short-term foreign exchange contracts to purchase a notional amount of Cdn$510 as a hedge against foreign-denominated monetary assets and liabilities. As at December 31, 2003 the unrealized loss on these contracts was $27.
The Company has also entered into short-term forward foreign exchange contracts to sell £4 million (2002 — £7 million) and purchase U.S. dollars as a hedge against pounds sterling net assets. At December 31, 2003 and 2002, the fair value of these contracts approximated their carrying value.
Derivative financial instruments involve credit and market risk. Credit risk arises from the potential for a counterparty to default on its contractual obligations and is limited to those contracts where the Company would incur a loss in replacing the defaulted transaction. The Company minimizes credit risk through the selection, monitoring and diversification of counterparties, use of the International Swaps and Derivatives Association (ISDA) documentation and master netting agreements, collateral and other credit mitigation techniques.
Noranda Annual Report 2003 53
15. Commitments and Contingencies
a) On July 1, 2003, the senior debt of the Antamina project became non-recourse to its sponsors, the Company, BHP Billiton PLC, Teck Cominco Limited and Mitsubishi Corporation, upon successful completion of a series of tests and following the delivery of the related certificates to the senior lenders.
b) As a result of the sale of the CEZ processing facility to the Noranda Income Fund (Note 3), the Company entered into a 15-year supply and processing agreement with the Fund. The Company has committed to sell up to 550,000 tonnes of zinc concentrate annually to the refinery (its annual concentrate requirement to operate to its full current capacity) at market rates for the payable metal, less a fixed treatment charge initially set at $0.352 per pound of "payable zinc metal". Commencing January 1, 2004, the Processing Fee will be the Processing Fee in the previous year adjusted annually (i) upward by 1% and (ii) upward or downward by 10% of the year-over-year percentage change in the average cost of electricity per megawatt hour for the Processing Facility. "Payable zinc metal" in respect of a quantity of concentrate will be equal to 96% of the assayed zinc metal content in the concentrate under the Supply and Processing Agreement.
The Company has also committed to manage the processing facility through operating and marketing agreements and will act as an agent for the sale of the facility's zinc production for the duration of the supply agreement.
c) From time to time, Noranda is involved in litigation, investigations or proceedings relating to claims arising out of its operations in the ordinary course of business. In the opinion of Noranda's management, these claims and lawsuits in the aggregate will not have a material adverse effect on the consolidated financial statements.
16. Related-party Transactions
a) Noranda has reduced its ownership interest in the Noranda Income Fund ("the Fund") from 48.97% to 25% during the year (see Note 3). Included in revenues are $7 (2002 — $11) representing the Company's share of income from the Fund accounted for under the equity method.
Noranda has entered into a Supply and Processing Agreement and a Management Service Agreement with the Fund which have contracted Noranda to provide concentrate and services to the Fund on a regular basis (see Note 15). Noranda has sold $79 (May to December 2002 — $40) of concentrate to the Fund at their negotiated value. As of December 31, 2003, Noranda has a receivable of $9 (2002 — $8) from the Fund. Noranda has also provided $46 (May to December 2002 — $27) of administration, management and operating services to the Fund at their negotiated value. As of December 31, 2003, Noranda has a receivable of $7 (2002 — $1) from the Fund due to the services provided. In addition, Noranda has made purchases of $57 (May to December 2002 — $28) of zinc metals and by-products at terms that reflect market rates. Included in accounts payable as at December 31, 2003 is $5 (2002 — $7) of amounts due to the Fund.
b) Noranda has undertaken a number of transactions with Antamina in which Noranda has a 33.75% ownership interest. Included in raw material costs are purchases of concentrate of $49 (2002 — $41) from Antamina at their market value. As of December 31, 2003, Noranda has a payable of $13 (2002 — $2) to Antamina.
During 2003, Noranda has made purchases of goods of $120 (2002 — $81) and provided services of $nil (2002 — $1) to its affiliates. These transactions were measured at their exchange amount. As of December 31, 2003, Noranda has a payable of $12 (2002 — $nil) to its affiliates.
c) Noranda has entered into short-term financing transactions with affiliates and associates from time to time at market interest rates. Noranda has revolving credit facilities totaling Cdn$100 with an affiliate. Under the credit agreement, Cdn$75 of these facilities are to expire in January 2004 with the remainder maturing January 2006. As of December 31, 2003, Noranda has made no drawdown against the credit facilities.
d) Noranda Aluminum Inc. ("Aluminum"), a wholly-owned subsidiary of Noranda Inc., has entered into a power supply contract with Brascan Energy Marketing Inc. ("BEMI"). BEMI, an affiliate of the Company, agreed to provide Aluminum's New Madrid primary aluminum smelter up to 490 MWh of electricity annually for a two-year period commencing June 1, 2003 at negotiated market prices.
e) Noranda has sold certain trade receivables to a securitization trust which is owned by Brascan Financial Corporation for a total of $20 in cash, under an agreement that came into effect on November 13, 2003.
f) Included in accounts receivable are loans receivable from officers of the Company in the amount of $3 (2002 — $3), secured by collateral that has market values in excess of cost for both years.
54 Noranda Annual Report 2003
17. Post-employment Costas
Noranda has a number of defined benefit plans providing pension, health, dental and life insurance benefits to substantially all employees after one or two years of continuous service. Pension benefits are calculated based upon length of service and either final average earnings or a specific amount per year of service. Hourly employees are generally members of negotiated plans.
Defined benefit plan assets consist primarily of cash, equity securities and fixed income securities. The defined benefit plan holds less than 1% of its assets in common shares of Noranda and its related parties.
Noranda's funding policy is to contribute amounts sufficient to meet minimum funding requirements as set forth by the regulations of the appropriate jurisdictions plus such additional amounts as Noranda may determine to be appropriate.
The obligation for benefits under these plans is determined through periodic actuarial reports that are based on the following weighted-average assumptions:
|
|
Pension Benefit Plans
|
|---|
| | December 31, 2003
| | December 31, 2002
|
|---|
| | Company and wholly-owned subsidiaries
| | Partially-owned subsidiaries and joint ventures
| | Company and wholly-owned subsidiaries
| | Partially-owned subsidiaries and joint ventures
|
|---|
| Discount rate | | 6.25% | | 6.25% | | 6.75% | | 6.75% |
| Expected long-term rate of return on plan assets | | 7.35% | | 7.00% | | 7.43% | | 7.00% |
| Rate of compensation increase | | 3.75% | | 3.50% | | 3.81% | | 3.50% |
| | |
| |
| |
| |
|
|
|
Other Benefit Plans
|
|---|
| | December 31, 2003
| | December 31, 2002
|
|---|
| | Company and wholly-owned subsidiaries
| | Partially-owned subsidiaries and joint ventures
| | Company and wholly-owned subsidiaries
| | Partially-owned subsidiaries and joint ventures
|
|---|
| Discount rate | | 6.25% | | 6.25% | | 6.75% | | 6.75% |
| Expected long-term rate of return on plan assets | | — | | — | | — | | — |
| Rate of compensation increase | | — | | — | | — | | — |
| | |
| |
| |
| |
|
The health care cost trend rate is assumed to start at 9% for 2003 for the Company, its partially-owned subsidiaries and joint ventures (2002 — 9%), decreasing to an ultimate medical trend rate of 4.0% by 2012 for the Company, its partially-owned subsidiaries and joint ventures (2002 — 4.0%).
In 2003, Noranda ratified new collective agreements at three of its operations. Included in these agreements was an increase in the pension plan benefits that amounts to an average of 15.5% at the end of three years, as well as provisions for early retirements.
Noranda Annual Report 2003 55
The funded status of Noranda's post-employment benefit plans and net accrued benefit asset (obligation) are as follows:
|
|
Pension Benefits
|
|
|---|
| | December 31, 2003
| | December 31, 2002
| |
|---|
| | Plans where assets exceed benefit obligations
| | Plans where benefit obligations exceed assets
| | Net
| | Plans where assets exceed benefit obligations
| | Plans where benefit obligations exceed assets
| | Net
| |
|---|
| Plans assets | | $ | 714 | | 889 | | $ | 1,603 | | $ | 509 | | 676 | | $ | 1,185 | |
| Benefit obligations | | | 580 | | 1,184 | | | 1,764 | | | 447 | | 948 | | | 1,395 | |
| | |
| |
| |
| |
| |
| |
| |
| Excess (deficit) of plan assets over benefit obligations | | | 134 | | (295 | ) | | (161 | ) | | 62 | | (272 | ) | | (210 | ) |
| | |
| |
| |
| |
| |
| |
| |
| Net accrued asset | | | | | | | $ | 208 | | | | | | | $ | 157 | |
| | | | | | | |
| | | | | | |
| |
|
|
Other Benefit Plans
|
|
|---|
| | December 31, 2003
| | December 31, 2002
| |
|---|
| | Plans where assets exceed benefit obligations
| | Plans where benefit obligations exceed assets
| | Net
| | Plans where assets exceed benefit obligations
| | Plans where benefit obligations exceed assets
| | Net
| |
|---|
| Plans assets | | $ | 18 | | 7 | | $ | 25 | | $ | — | | 17 | | $ | 17 | |
| Benefit obligations | | | 16 | | 309 | | | 325 | | | — | | 231 | | | 231 | |
| | |
| |
| |
| |
| |
| |
| |
| Excess (deficit) of plan assets over benefit obligations | | | 2 | | (302 | ) | | (300 | ) | | — | | (214 | ) | | (214 | ) |
| | |
| |
| |
| |
| |
| |
| |
| Net accrued liability | | | | | | | $ | 250 | | | | | | | $ | 204 | |
| | | | | | | |
| | | | | | |
| |
56 Noranda Annual Report 2003
The change in the funded status of Noranda's post-employment benefit plans was as follows:
|
|
December 31, 2003
|
|
|---|
| | Pension Benefit Plans
| | Other Benefit Plans
| |
|---|
| | Company and wholly-owned subsidiaries
| | Partially-owned subsidiaries and joint ventures
| | Total
| | Company and wholly-owned subsidiaries
| | Partially-owned subsidiaries and joint ventures
| | Total
| |
|---|
| Change in Actuarial Benefit Obligation | | | | | | | | | | | | | | | | | |
| Actuarial obligation at beginning of year | | $ | 738 | | 657 | | $ | 1,395 | | $ | 66 | | 165 | | $ | 231 | |
| Current service | | | 13 | | 11 | | | 24 | | | 2 | | 3 | | | 5 | |
| Benefits paid | | | (64 | ) | (58 | ) | | (122 | ) | | (5 | ) | (13 | ) | | (18 | ) |
| Interest cost on benefit obligation | | | 53 | | 52 | | | 105 | | | 5 | | 13 | | | 18 | |
| Plan amendments | | | 22 | | — | | | 22 | | | — | | — | | | — | |
| Actuarial (gains) losses | | | 35 | | 52 | | | 87 | | | (2 | ) | 43 | | | 41 | |
| Effect of exchange rate change | | | 131 | | 131 | | | 262 | | | 13 | | 35 | | | 48 | |
| Transfer from other plans | | | — | | 1 | | | 1 | | | — | | — | | | — | |
| Decrease due to curtailment/settlement | | | (3 | ) | (7 | ) | | (10 | ) | | — | | — | | | — | |
| | |
| |
| |
| |
| |
| |
| |
| Actuarial obligation at end of year | | $ | 925 | | 839 | | $ | 1,764 | | $ | 79 | | 246 | | $ | 325 | |
| | |
| |
| |
| |
| |
| |
| |
| Change in Plan Assets | | | | | | | | | | | | | | | | | |
| Fair value of assets at beginning of year | | $ | 704 | | 481 | | $ | 1,185 | | $ | 7 | | 10 | | $ | 17 | |
| Employer contributions | | | 22 | | 65 | | | 87 | | | — | | 18 | | | 18 | |
| Benefits paid | | | (64 | ) | (55 | ) | | (119 | ) | | (2 | ) | (13 | ) | | (15 | ) |
| Return on plan assets | | | 158 | | 40 | | | 198 | | | 1 | | 1 | | | 2 | |
| Effect of exchange rate change | | | 134 | | 94 | | | 228 | | | 1 | | 2 | | | 3 | |
| Transfer (to) from other plans | | | (2 | ) | 1 | | | (1 | ) | | — | | — | | | — | |
| Settlement payments | | | (1 | ) | (6 | ) | | (7 | ) | | — | | — | | | — | |
| Actuarial gains | | | — | | 32 | | | 32 | | | — | | — | | | — | |
| | |
| |
| |
| |
| |
| |
| |
| Fair value assets at end of year | | $ | 951 | | 652 | | $ | 1,603 | | $ | 7 | | 18 | | $ | 25 | |
| | |
| |
| |
| |
| |
| |
| |
| Surplus (deficit) status of plan at end of year | | $ | 26 | | (187 | ) | $ | (161 | ) | $ | (72 | ) | (228 | ) | $ | (300 | ) |
| Unamortized: | | | | | | | | | | | | | | | | | |
| | Past service costs | | | 25 | | 1 | | | 26 | | | (2 | ) | 1 | | | (1 | ) |
| | Net actuarial (gains) losses | | | 136 | | 213 | | | 349 | | | (4 | ) | 55 | | | 51 | |
| | |
| |
| |
| |
| |
| |
| |
| Accrued benefit asset (liability) | | $ | 187 | | 27 | | $ | 214 | | $ | (78 | ) | (172 | ) | $ | (250 | ) |
| Valuation allowance | | | — | | (6 | ) | | (6 | ) | | — | | — | | | — | |
| | |
| |
| |
| |
| |
| |
| |
| Accrued benefit asset (liability), net of valuation allowance | | $ | 187 | | 21 | | $ | 208 | | $ | (78 | ) | (172 | ) | $ | (250 | ) |
| | |
| |
| |
| |
| |
| |
| |
Noranda Annual Report 2003 57
|
|
December 31, 2002
|
|
|---|
| | Pension Benefit Plans
| | Other Benefit Plans
| |
|---|
| | Company and wholly-owned subsidiaries
| | Partially-owned subsidiaries and joint ventures
| | Total
| | Company and wholly-owned subsidiaries
| | Partially-owned subsidiaries and joint ventures
| | Total
| |
|---|
| Change in Actuarial Benefit Obligation | | | | | | | | | | | | | | | | | |
| Actuarial obligation at beginning of year | | $ | 719 | | 644 | | $ | 1,363 | | $ | 63 | | 161 | | $ | 224 | |
| Current service | | | 13 | | 9 | | | 22 | | | 4 | | 4 | | | 8 | |
| Benefits paid | | | (53 | ) | (47 | ) | | (100 | ) | | (5 | ) | (11 | ) | | (16 | ) |
| Interest cost on benefit obligation | | | 51 | | 44 | | | 95 | | | 4 | | 11 | | | 15 | |
| Plan amendments | | | 3 | | — | | | 3 | | | — | | — | | | — | |
| Actuarial losses | | | 12 | | 6 | | | 18 | | | — | | — | | | — | |
| Effect of exchange rate change | | | 5 | | 8 | | | 13 | | | — | | — | | | — | |
| Decrease due to curtailment | | | (12 | ) | (7 | ) | | (19 | ) | | — | | — | | | — | |
| | |
| |
| |
| |
| |
| |
| |
| Actuarial obligation at end of year | | $ | 738 | | 657 | | $ | 1,395 | | $ | 66 | | 165 | | $ | 231 | |
| | |
| |
| |
| |
| |
| |
| |
| Change in Plan Assets | | | | | | | | | | | | | | | | | |
| Fair value of assets at beginning of year | | $ | 797 | | 520 | | $ | 1,317 | | $ | 7 | | 10 | | $ | 17 | |
| Employer contributions | | | 8 | | 33 | | | 41 | | | 1 | | 10 | | | 11 | |
| Benefits paid | | | (49 | ) | (45 | ) | | (94 | ) | | (2 | ) | (11 | ) | | (13 | ) |
| Return on plan assets | | | (42 | ) | 36 | | | (6 | ) | | 1 | | 1 | | | 2 | |
| Settlement payments | | | — | | (6 | ) | | (6 | ) | | — | | — | | | — | |
| Effect of exchange rate change | | | 6 | | 8 | | | 14 | | | — | | — | | | — | |
| Transfer to other plans | | | (16 | ) | — | | | (16 | ) | | — | | — | | | — | |
| Actuarial losses | | | — | | (65 | ) | | (65 | ) | | — | | — | | | — | |
| | |
| |
| |
| |
| |
| |
| |
| Fair value assets at end of year | | $ | 704 | | 481 | | $ | 1,185 | | $ | 7 | | 10 | | $ | 17 | |
| | |
| |
| |
| |
| |
| |
| |
| Deficit status of plan at end of year | | $ | (34 | ) | (176 | ) | $ | (210 | ) | $ | (59 | ) | (155 | ) | $ | (214 | ) |
| Unamortized: | | | | | | | | | | | | | | | | | |
| | Past service costs | | | 14 | | 3 | | | 17 | | | — | | 1 | | | 1 | |
| | Net actuarial (gains) losses | | | 187 | | 170 | | | 357 | | | (3 | ) | 12 | | | 9 | |
| | |
| |
| |
| |
| |
| |
| |
| Accrued benefit asset (liability) | | $ | 167 | | (3 | ) | $ | 164 | | $ | (62 | ) | (142 | ) | $ | (204 | ) |
| Valuation allowance | | | — | | (7 | ) | | (7 | ) | | — | | — | | | — | |
| | |
| |
| |
| |
| |
| |
| |
| Accrued benefit asset (liability), net of valuation allowance | | $ | 167 | | (10 | ) | $ | 157 | | $ | (62 | ) | (142 | ) | $ | (204 | ) |
| | |
| |
| |
| |
| |
| |
| |
58 Noranda Annual Report 2003
Noranda's post-employment benefit expense included the following components:
|
|
December 31, 2003
|
|
|---|
| | Pension Benefit Plans
| | Other Benefit Plans
| |
|---|
| | Company and wholly-owned subsidiaries
| | Partially-owned subsidiaries and joint ventures
| | Total
| | Company and wholly-owned subsidiaries
| | Partially-owned subsidiaries and joint ventures
| | Total
| |
|---|
| Current Year Expense | | | | | | | | | | | | | | | | | |
| Current service | | $ | 13 | | 11 | | $ | 24 | | $ | 2 | | 3 | | $ | 5 | |
| Interest cost on benefit obligation | | | 53 | | 52 | | | 105 | | | 5 | | 13 | | | 18 | |
| Expected return on plan assets | | | (55 | ) | (42 | ) | | (97 | ) | | — | | (1 | ) | | (1 | ) |
| Amortization of: | | | | | | | | | | | | | | | | | |
| | Past service costs | | | 13 | | 3 | | | 16 | | | — | | — | | | — | |
| | Transitional asset | | | — | | — | | | — | | | — | | — | | | — | |
| | Net actuarial losses | | | 8 | | 14 | | | 22 | | | — | | 2 | | | 2 | |
| Loss on recognition of a settlement/curtailment | | | 1 | | 2 | | | 3 | | | — | | — | | | — | |
| Valuation allowance | | | — | | (1 | ) | | (1 | ) | | — | | — | | | — | |
| | |
| |
| |
| |
| |
| |
| |
| Defined benefit pension expense | | $ | 33 | | 39 | | $ | 72 | | $ | 7 | | 17 | | $ | 24 | |
| | |
| |
| |
| |
| |
| |
| |
In 2002, Noranda offered its salaried employees the opportunity to switch from the current defined benefit plan to a defined contribution plan. Approximately 41% of salaried employees chose to make the switch with $15 in assets to be allocated to the defined contribution plan. Noranda is expecting regulatory approval for the defined contribution plan in 2004.
In 2003, one of Noranda's partially-owned subsidiaries offered certain groups of employees to switch from the current defined benefit plan to a defined contribution plan. Approximately 30% of eligible employees chose to make the switch with $7 in assets to be allocated to the defined contribution plan which is expected to be approved by the regulatory bureau in 2004.
Noranda, its partially-owned subsidiaries and joint ventures contributed $11 in payroll expenses to the defined contribution plan in 2003 (2002 — $8).
|
|
December 31, 2002
|
|---|
| | Pension Benefit Plans
| | Other Benefit Plans
|
|---|
| | Company and wholly-owned subsidiaries
| | Partially-owned subsidiaries and joint ventures
| | Total
| | Company and wholly-owned subsidiaries
| | Partially-owned subsidiaries and joint ventures
| | Total
|
|---|
| Current Year Expense | | | | | | | | | | | | | | | | |
| Current service | | $ | 13 | | 9 | | $ | 22 | | $ | 4 | | 4 | | $ | 8 |
| Interest cost on benefit obligation | | | 51 | | 44 | | | 95 | | | 4 | | 11 | | | 15 |
| Expected return on plan assets | | | (59 | ) | (37 | ) | | (96 | ) | | — | | — | | | — |
| Amortization of: | | | | | | | | | | | | | | | | |
| | Past service costs | | | 12 | | 3 | | | 15 | | | — | | — | | | — |
| | Transitional asset | | | (1 | ) | — | | | (1 | ) | | — | | — | | | — |
| | Net actuarial losses | | | — | | 4 | | | 4 | | | — | | — | | | — |
| Loss on recognition of a settlement/curtailment | | | 8 | | — | | | 8 | | | — | | — | | | — |
| Other | | | — | | — | | | — | | | — | | 1 | | | 1 |
| Valuation allowance | | | (65 | ) | — | | | (65 | ) | | — | | — | | | — |
| | |
| |
| |
| |
| |
| |
|
| Defined benefit pension expense | | $ | (41 | ) | 23 | | $ | (18 | ) | $ | 8 | | 16 | | $ | 24 |
| | |
| |
| |
| |
| |
| |
|
Noranda Annual Report 2003 59
| | December 31, 2003
| |
|---|
| | Company and
wholly-owned
subsidiaries
| | Partially-owned
subsidiaries and
joint ventures
| | Total
| |
|---|
| Effect of 1% increase in assumed health care cost trend rates | | | | | | | | | |
| Total of service and interest cost components | | $ | — | | 2 | | $ | 2 | |
| Post-retirement benefit obligation | | | 3 | | 31 | | | 34 | |
| Effect of 1% decrease in assumed health care cost trend rates | | | | | | | | | |
| Total of service and interest cost components | | | — | | (2 | ) | | (2 | ) |
| Post-retirement benefit obligation | | | (3 | ) | (26 | ) | | (29 | ) |
| | December 31, 2002
| |
|---|
| | Company and
wholly-owned
subsidiaries
| | Partially-owned
subsidiaries and
joint ventures
| | Total
| |
|---|
| Effect of 1% increase in assumed health care cost trend rates | | | | | | | | | |
| Total of service and interest cost components | | $ | — | | 2 | | $ | 2 | |
| Post-retirement benefit obligation | | | 3 | | 20 | | | 23 | |
| Effect of 1% decrease in assumed health care cost trend rates | | | | | | | | | |
| Total of service and interest cost components | | | — | | (1 | ) | | (1 | ) |
| Post-retirement benefit obligation | | | (2 | ) | (14 | ) | | (16 | ) |
18. Segmented Information
Noranda has four operating segments: Copper, Nickel, Zinc and Aluminum. Inter-segment sales and purchases are made at market prices and trade terms. Operations and identifiable assets by operating and geographic segment are presented below:
a) Operating Segments
| | Year ended December 31, 2003
| |
|---|
| | Copper
| | Nickel
| | Zinc
| | Aluminum
| | Other
| | Total
| |
|---|
| Revenues | | $ | 2,165 | | 1,297 | | 410 | | 688 | | 97 | | $ | 4,657 | |
| | |
| |
| |
| |
| |
| |
| |
| Operating expenses | | | | | | | | | | | | | | | |
| | Cost of operations | | | 732 | | 586 | | 232 | | 389 | | 85 | | | 2,024 | |
| | Purchased raw materials | | | 1,064 | | 280 | | 175 | | 238 | | (13 | ) | | 1,744 | |
| | Depreciation, amortization and reclamation | | | 205 | | 135 | | 71 | | 41 | | 28 | | | 480 | |
| | |
| |
| |
| |
| |
| |
| |
| | | | 2,001 | | 1,001 | | 478 | | 668 | | 100 | | | 4,248 | |
| | |
| |
| |
| |
| |
| |
| |
| Income (loss) generated by operating assets | | $ | 164 | | 296 | | (68 | ) | 20 | | (3 | ) | $ | 409 | |
| | |
| |
| |
| |
| |
| |
| |
| | Interest expense, net | | | | | | | | | | | | | | (129 | ) |
| | Corporate and general administration | | | | | | | | | | | | | | (58 | ) |
| | Research, development and exploration | | | | | | | | | | | | | | (51 | ) |
| | Minority interest in earnings of subsidiaries | | | | | | | | | | | | | | (89 | ) |
| | | | | | | | | | | | | |
| |
| Income before undernoted | | | | | | | | | | | | | $ | 82 | |
| Taxes | | | | | | | | | | | | | | (24 | ) |
| Restructuring costs | | | | | | | | | | | | | | (62 | ) |
| Gain on sale of investments | | | | | | | | | | | | | | 38 | |
| | | | | | | | | | | | | |
| |
| Net income | | | | | | | | | | | | | $ | 34 | |
| | |
| |
| |
| |
| |
| |
| |
| Total assets, excluding cash and short-term investments | | $ | 4,082 | | 1,668 | | 439 | | 814 | | 612 | | $ | 7,615 | |
| | |
| |
| |
| |
| |
| |
| |
| Capital investments | | $ | 326 | | 109 | | 2 | | 22 | | 30 | | $ | 489 | |
| | |
| |
| |
| |
| |
| |
| |
60 Noranda Annual Report 2003
| | Year ended December 31, 2002
| |
|---|
| | Copper
| | Nickel
| | Zinc
| | Aluminum
| | Other
| | Total
| |
|---|
| Revenues | | $ | 1,906 | | 842 | | 399 | | 662 | | 64 | | $ | 3,873 | |
| | |
| |
| |
| |
| |
| |
| |
| Operating expenses | | | | | | | | | | | | | | | |
| | Cost of operations | | | 692 | | 488 | | 242 | | 349 | | 108 | | | 1,879 | |
| | Purchased raw materials | | | 947 | | 146 | | 144 | | 241 | | (88 | ) | | 1,390 | |
| | | Depreciation, amortization and reclamation | | | 209 | | 114 | | 65 | | 38 | | 64 | | | 490 | |
| | |
| |
| |
| |
| |
| |
| |
| | | | 1,848 | | 748 | | 451 | | 628 | | 84 | | | 3,759 | |
| | |
| |
| |
| |
| |
| |
| |
| Income (loss) generated by operating assets | | $ | 58 | | 94 | | (52 | ) | 34 | | (20 | ) | $ | 114 | |
| | |
| |
| |
| |
| |
| |
| |
| | Interest expense, net | | | | | | | | | | | | | | (98 | ) |
| | Corporate and general administration | | | | | | | | | | | | | | (58 | ) |
| | Research, development and exploration | | | | | | | | | | | | | | (49 | ) |
| | Minority interest in earnings of subsidiaries | | | | | | | | | | | | | | (26 | ) |
| | | | | | | | | | | | | |
| |
| Loss before undernoted | | | | | | | | | | | | | $ | (117 | ) |
| Tax recovery | | | | | | | | | | | | | | 168 | |
| Restructuring costs | | | | | | | | | | | | | | (561 | ) |
| Gain on sale of investment | | | | | | | | | | | | | | 63 | |
| | | | | | | | | | | | | |
| |
| Net loss | | | | | | | | | | | | | $ | (447 | ) |
| | | | | | | | | | | | | |
| |
| Total assets, excluding cash and short-term investments | | $ | 3,596 | | 1,139 | | 511 | | 797 | | 766 | | $ | 6,809 | |
| | |
| |
| |
| |
| |
| |
| |
| Capital investments | | $ | 257 | | 84 | | 4 | | 41 | | 142 | | $ | 528 | |
| | |
| |
| |
| |
| |
| |
| |
b) Geographic Segments
| | Revenues
| | Capital assets
|
|---|
| | 2003
| | 2002
| | 2003
| | 2002
|
|---|
| Canada | | | | | | | | | | | | |
| | — Domestic | | $ | 802 | | $ | 662 | | | | | | |
| | — Export | | | 1,530 | | | 1,285 | | | | | | |
| | |
| |
| |
| |
|
| Canada | | $ | 2,332 | | $ | 1,947 | | $ | 2,405 | | $ | 2,165 |
| United States | | | 1,118 | | | 1,046 | | | 602 | | | 641 |
| Chile | | | 652 | | | 487 | | | 1,517 | | | 1,409 |
| Peru | | | 118 | | | 144 | | | 699 | | | 684 |
| Other | | | 437 | | | 249 | | | 432 | | | 356 |
| | |
| |
| |
| |
|
| Total | | $ | 4,657 | | $ | 3,873 | | $ | 5,655 | | $ | 5,255 |
| | |
| |
| |
| |
|
Noranda Annual Report 2003 61
19. Significant Differences from United States Accounting Principles
These consolidated financial statements have been prepared in accordance with Canadian generally accepted accounting principles ("Canadian GAAP"). Canadian GAAP varies in certain significant respects from the principles and practices generally accepted in the United States ("U.S. GAAP"). The effect of these principal differences on the Company's financial statements is quantified below and described in the accompanying notes.
Statements of Income (Loss)
Years ended December 31
| | 2003
| | 2002
| |
|---|
| Net income (loss) — Cdn GAAP | | $ | 34 | | $ | (447 | ) |
| | Increase in interest expenses(b) | | | (4 | ) | | (4 | ) |
| | Adjustment of certain financial instruments to market(c) | | | (14 | ) | | 12 | |
| | Start-up costs and exploration(d) | | | (40 | ) | | (81 | ) |
| | Amortization of start-up costs and exploration(d) | | | 14 | | | (5 | ) |
| | Recognition of asset impairment(e) | | | — | | | 232 | |
| | Pension and post-employment benefits(g) | | | — | | | (64 | ) |
| | Stock options(f) | | | (1 | ) | | (18 | ) |
| | Amortization of asset retirement obligation asset(h) | | | (4 | ) | | — | |
| | Accretion of asset retirement obligation liability(h) | | | (26 | ) | | — | |
| | Reversal of reclamation expenses(h) | | | 22 | | | — | |
| | Foreign exchange difference | | | (10 | ) | | — | |
| | Tax effect of adjustments | | | 19 | | | (10 | ) |
| | |
| |
| |
| Net loss — U.S. GAAP before accounting change | | | (10 | ) | | (385 | ) |
| Cumulative impact of change in accounting policy, net of tax(h) | | | (20 | ) | | — | |
| | |
| |
| |
| Net loss — U.S. GAAP | | | (30 | ) | | (385 | ) |
| | |
| |
| |
| Net loss per share reported under U.S. GAAP ($): | | | | | | | |
| | Basic and Diluted | | | (0.20 | ) | | (1.67 | ) |
| Retained earnings (deficit) under U.S. GAAP: | | | | | | | |
| | Balance, beginning of year | | | (74 | ) | | 446 | |
| | Loss | | | (30 | ) | | (385 | ) |
| | Dividends: | | | | | | | |
| | | Common | | | (121 | ) | | (122 | ) |
| | | Preferred | | | (21 | ) | | (11 | ) |
| | Other | | | (5 | ) | | (2 | ) |
| | |
| |
| |
| Balance, end of year | | $ | (251 | ) | $ | (74 | ) |
| | |
| |
| |
Statements of Comprehensive Income (Loss)
Years ended December 31
| | 2003
| | 2002
| |
|---|
| Years ended December 31 | | | 2003 | | | 2002 | |
| | |
| |
| |
| Net loss under U.S. GAAP: | | $ | (30 | ) | $ | (385 | ) |
| Other comprehensive income (loss):(a) | | | | | | | |
| | Foreign currency translation adjustments(i) | | | 258 | | | 31 | |
| | Unrealized gains (loss) on long-term investments(j) | | | 7 | | | 2 | |
| | Derivative financial instruments:(c) | | | | | | | |
| | | Net amount reclassified into earnings | | | (15 | ) | | 10 | |
| | | Net changes associated with current period hedging | | | 138 | | | 5 | |
| | Minimum additional pension liability adjustment(k) | | | 58 | | | (200 | ) |
| | Tax effect of adjustments on comprehensive income (loss) | | | (89 | ) | | 54 | |
| | |
| |
| |
| Other comprehensive income (loss) — U.S. GAAP(a) | | $ | 357 | | $ | (98 | ) |
| | |
| |
| |
| Comprehensive income (loss) under U.S. GAAP(a) | | $ | 327 | | $ | (483 | ) |
| | |
| |
| |
a) Comprehensive income is measured in accordance with Statement of Financial Accounting Standards ("FAS") No. 130, "Reporting Comprehensive Income." This standard defines comprehensive income as all changes in equity other than those resulting from investments by owners and distributions to owners. Comprehensive income is comprised of net earnings and other comprehensive income where other comprehensive income ("OCI") is the change in equity during the period that arises from transactions and other events that are related to non-owner sources. The concept of comprehensive income does not exist under Canadian GAAP.
b) Noranda accounts for the convertible debentures in accordance with their substance and, as such, they are presented in the financial statements in their liability and equity component parts. Under U.S. GAAP, the entire face value of the convertible debentures is treated as debt, with interest expense based on the coupon rate of 5.0%.
62 Noranda Annual Report 2003
c) Under Canadian GAAP, certain financial instruments qualify as a hedge for accounting purposes and therefore gains and losses on these contracts are recognized in revenue at the time the anticipated cash flows are realized. U.S. GAAP, specifically under FAS No. 133 "Accounting for Derivative Instruments and Hedging Activities" and No. 138 "Accounting for Certain Derivative Instruments and Hedging Activities" (together, "FAS 133"), requires a company to recognize all of its derivative instruments, whether designated in hedging relationships or not, on the balance sheet at fair value. The accounting for changes in the fair value (i.e. gains or losses) of a derivative instrument depends on whether it has been designated and qualifies as part of a hedging relationship. For strategies designated as fair value hedges, the effective portion of the change in the fair value of the derivative is offset by changes in the fair value of its hedged item. For cash flow hedges and hedges of the net investment in self-sustaining operations, the effective portion of the changes in the fair value of the derivative is accumulated in OCI and then is released from OCI and included in income when the hedged item affects earnings. All other derivatives are carried at fair value. FAS 133 establishes certain criteria to be met in order to designate a derivative instrument as a hedge and to deem a hedge as effective.
Fair Value Hedges
Noranda has chosen to designate its fixed forward price hedges and certain interest rate swaps as fair value hedges. During the year ended December 31, 2003, the Company recognized a net loss of $16 (2002 — $10) related to the ineffective portion of these hedging instruments.
Cash Flow Hedges
Noranda has chosen to designate its foreign currency-denominated revenue hedges and foreign currency-denominated expenditure hedges as cash flow hedges. No ineffectiveness to these hedging instruments was incurred during 2003 and 2002. At December 31, 2003, the Company expects to reclassify $55 of net gains (2002 — $14 of net losses) on derivative instruments from accumulated OCI to earnings during the next 12 months according to contract settlement dates.
Hedges of Foreign Net Assets
During the year ended December 31, 2003, the Company recognized $288 of net gains (2002 — $14), included in the cumulative translation adjustment, related to the forward foreign exchange contracts and foreign-denominated fixed-rate debt.
Other Hedges
For all other derivative instruments, Noranda has chosen not to designate them as hedging instruments.
d) Under Canadian GAAP, Noranda capitalizes exploration costs when sufficient pre-feasibility work indicates that future mine production is reasonably certain and capitalizes costs incurred during the start-up phase of a project until commercial production commences. Under U.S. GAAP, exploration costs cannot be capitalized until the Company has objective reasonable assurance as to their recovery, generally upon receipt of a bankable feasibility study. Statement of Position 98-5 requires start-up costs to be expensed as incurred. As a result of the differences in the carrying amount of capital assets under Canadian and U.S. GAAP, there are differences in depreciation expense in subsequent periods. Further a difference in depreciation expense arises due to the earlier commencement of depreciation under U.S. GAAP.
e) As a result of differences in the original carrying value of the magnesium project under Canadian and U.S. GAAP, related to start-up costs, capitalization of interest and depreciation, there is a difference in the amount of the asset impairment charge.
f) Effective January 1, 2002, Noranda prospectively adopted FAS No. 123 "Accounting for Stock-based Compensation" whereby compensation expense for options granted or modified after January 1, 2002 is measured at fair value at the grant date or modification date using the Black-Scholes valuation model and recognized over the remaining vesting period of the options granted or modified.
Prior to June 30, 2002, Noranda's stock option plan allowed for, at the option of the holder, the exercise of the employee's vested option whereby the difference between the grant price and the market price is paid on exercise by the Company, with no increase in the capital stock issued. Under U.S. GAAP, such a feature requires the mark-to-market obligation to be recognized through the income statement of the Company.
On June 30, 2002 Noranda's stock option plan was modified to remove the cash settlement feature. As a result, under U.S. GAAP additional compensation expense is being recognized over the remaining vesting period of these modified options to the extent that the fair value of the options outstanding on the modification date exceeded the previously recorded compensation expense of these options.
Under Canadian GAAP, there is no requirement to account for options that contain a cash settlement feature when the cash settlement feature is removed by June 30, 2002.
g) Under Canadian GAAP, when a defined benefit plan gives rise to an accrued benefit asset, a company must recognize a valuation allowance for the excess of the adjusted benefit asset over the expected future benefit to be realized from the plan asset. U.S. GAAP does not provide for a valuation allowance against pension assets. As a result, a difference between U.S. and Canadian GAAP has been recorded for the effects of recognizing a pension valuation allowance and changes therein under Canadian GAAP. Further differences result from the different transition rules and timing of the adoption of the current U.S. and Canadian standards for post-employment costs.
Noranda Annual Report 2003 63
h) Effective January 1, 2003, Noranda adopted FAS 143, "Accounting for Asset Retirement Obligations" which requires that the fair value of liabilities for asset retirement obligations be recognized in the period in which they are incurred. A corresponding increase to the carrying amount of the related asset is generally recorded and depreciated over the life of the asset. The amount of the liability is subject to re-measurement at each reporting period. This differs from the Canadian GAAP which involves accruing for the estimated reclamation and closure liability through annual charges to earnings over the estimated life of the mine. The cumulative effect of the change through January 1, 2003 was to increase capital assets by $66, increase deferred credits by $84, decrease future tax liability by $4 and increase minority interest in subsidiaries by $6, with a one time after-tax charge to net earnings of $20 (loss of $0.08 per share). Canadian GAAP would adopt the same accounting rule, effective January 1, 2004.
In accordance with the standard, the Company has not included any provision for reclamation costs associated with assets of indeterminate lives, in particular metallurgical plants, as their lives cannot be reasonably estimated nor reclamation obligations determinable.
i) Under U.S. GAAP, foreign exchange gains and losses on translation of self-sustaining foreign operations are recorded in OCI. Under Canadian GAAP, such gains and losses are included as a separate component of shareholders' equity referred to as cumulative translation adjustment.
j) U.S. GAAP requires that certain long-term investments not held for trading be recorded at fair value, with unrealized holding gains and losses excluded from the determination of earnings and reported as a separate component of OCI.
k) U.S. GAAP requires the recognition of a minimum additional pension liability in the amount of the excess of the Company's unfounded accumulated benefits obligation over the recorded pension benefits liability. An offsetting intangible pension asset is recorded equal to the unrecognized prior service costs, with any difference recorded as a reduction in accumulated OCI.
l) U.S. GAAP requires investments in joint ventures to be accounted for under the equity method, while under Canadian GAAP, the accounts of joint ventures are proportionately consolidated. However, under rules promulgated by the Securities and Exchange Commission, a foreign registrant may, subject to the provision of additional information, continue to follow proportionate consolidation for the purposes of registration and other filings notwithstanding the departure from U.S. GAAP. Consequently, the consolidated balance sheets have not been adjusted to restate the accounting for joint ventures under U.S. GAAP. Additional information concerning the Company's interests in joint ventures is presented in Note 5.
m) U.S. GAAP does not permit the subtotal of cash from operations before net changes in non-cash working capital.
The following summarizes the adjustments to the Company's balance sheets and cash flow statements in order to conform to U.S. GAAP.
Balance Sheet
Years ended December 31
| | 2003
| | 2002
| |
|---|
| | Canadian GAAP
| | United States
GAAP
| | Canadian GAAP
| | United States
GAAP
| |
|---|
| Assets: | | | | | | | | | | | | | |
| | Investments and other assets(c)(j) | | $ | 205 | | $ | 514 | | $ | 182 | | $ | 300 | |
| | Capital assets(d)(e)(h) | | | 5,655 | | | 5,463 | | | 5,255 | | | 5,036 | |
| Liabilities: | | | | | | | | | | | | | |
| | Accounts and taxes payable(c) | | | 903 | | | 992 | | | 720 | | | 774 | |
| | Long-term debt(b)(c) | | | 2,893 | | | 3,045 | | | 3,014 | | | 3,132 | |
| | Deferred credits(c)(g)(h) | | | 414 | | | 783 | | | 367 | | | 632 | |
| | Future income tax liability (asset) | | | 54 | | | (54 | ) | | 49 | | | (104 | ) |
| | Minority interest in subsidiaries | | | 914 | | | 823 | | | 759 | | | 660 | |
| Shareholders' Equity: | | | | | | | | | | | | | |
| | Retained earnings (deficit) | | | (92 | ) | | (251 | ) | | 24 | | | (74 | ) |
| | Capital stock(f) | | | 2,382 | | | 2,415 | | | 1,792 | | | 1,825 | |
| | Convertible debentures(b) | | | 84 | | | — | | | 79 | | | — | |
| | Currency translation adjustment(i) | | | 265 | | | — | | | (34 | ) | | — | |
| | Accumulated other comprehensive income (loss) | | | — | | | 181 | | | — | | | (176 | ) |
64 Noranda Annual Report 2003
Cash Flow Statement
Years ended December 31
| | 2003
| | 2002
| |
|---|
| | Canadian GAAP
| | United States
GAAP
| | Canadian GAAP
| | United States
GAAP
| |
|---|
| Operating activities | | $ | 413 | | $ | 376 | | $ | 380 | | $ | 271 | |
| Investment activities | | | (543 | ) | | (506 | ) | | (379 | ) | | (270 | ) |
| Financing activities | | | 338 | | | 338 | | | 113 | | | 113 | |
| Cash and cash equivalents, beginning of year | | | 293 | | | 293 | | | 179 | | | 179 | |
| Cash and cash equivalents, end of year | | | 501 | | | 501 | | | 293 | | | 293 | |
Impending Accounting Changes
Canadian GAAP
In 2003, the CICA issued Handbook Section 3110, "Asset Retirement Obligations", which establishes standards for the recognition, measurement and disclosure of asset retirement obligations and the related asset retirement costs. This new section is effective for the Company's 2004 fiscal year and harmonizes Canadian requirements with existing U.S. GAAP. The adoption of this section on January 1, 2004 is expected to result in the cumulative effect of an accounting change of $28 being recognized as a charge to opening retained earnings, the recognition of a liability of $117, the recognition of a fixed asset of $84, the recognition of a future tax asset of $8, the recognition of a charge to CTA of $3 and the recognition of minority interest in subsidiaries of $6.
In 2003, the CICA issued Accounting Guideline AcG-15, "Consolidation of Variable Interest Entities", to provide guidance for applying the principles in Handbook Section 1590, "Subsidiaries", to certain entities. Although the CICA is contemplating amendments to the Guideline, it is expected to be effective for the Company's 2005 fiscal year. Although the Company is currently reviewing AcG-15, the impact of the Guideline, if any, on the Company's consolidated financial statements has not been determined.
In 2003, the CICA finalized amendments to Accounting Guideline AcG-13, "Hedging Relationships", that clarified certain of the requirements in AcG-13 and provided additional application guidance. AcG-13 is applicable for the Company's 2004 fiscal year. The Company does not expect the adoption of this Guideline to have a material impact on its consolidated financial statements.
United States GAAP
In 2003, the FASB amended Interpretation No. 46, "Consolidation of Variable Interest Entities" ("FIN 46R"). FIN 46R requires that a variable interest entity ("VIE") be consolidated by a company if that company is subject to a majority of the risk of loss from the VIE's activities and/or is entitled to receive a majority of the VIE's residual returns. For the Company, the requirements of FIN 46R apply in 2003 for all VIEs created after January 31, 2003. For VIEs created before January 31, 2003, the requirements of FIN 46R apply as of December 31, 2004 for a VIE that does not meet the definition of a special-purpose entity ("SPE") and as of January 1, 2004 for a VIE that is an SPE.
Although the Company is currently reviewing FIN 46R (with respect to VIEs created before January 31, 2003), the impact, if any, of these pronouncements on the Company's consolidated financial statements has not been determined.
Noranda Annual Report 2003 65
Management's Discussion and Analysis
Corporate Overview
Noranda is a leading copper and nickel producer with investments in integrated zinc and aluminum assets. The Company employs approximately 15,000 people at its operations and offices in 18 countries and is listed on both the New York and Toronto Stock Exchanges.
Noranda's goal is to deliver superior return to shareholders by owning, developing and efficiently managing integrated copper, nickel, zinc and aluminum operations.
Financial Summary
Effective July 1, 2003, the Company's functional and reporting currency was converted to U.S. dollars. Unless otherwise noted, all amounts in this report are expressed in U.S. dollars.
$ millions, except per share data
| | 2003
| | 2002
| |
|---|
| Results of operations | | | | | | | |
| Revenues | | | 4,657 | | | 3,873 | |
| Income generated by operating assets* | | | 409 | | | 114 | |
| Net income (loss) | | | 34 | | | (447 | ) |
| Net income (loss) per common share | | $ | 0.04 | | $ | (1.93 | ) |
| Cash flow | | | | | | | |
| Cash flow from operations | | | 577 | | | 348 | |
| Investment in growth projects | | | 307 | | | 382 | |
| Sustaining capital expenditures | | | 182 | | | 146 | |
| Financial position | | | | | | | |
| Cash and short-term investments | | | 630 | | | 293 | |
| Operating capital assets | | | 4,682 | | | 4,652 | |
| Development projects | | | 973 | | | 603 | |
| Total assets | | | 8,245 | | | 7,102 | |
| Long-term debt | | | 2,893 | | | 3,014 | |
| Shareholders' equity | | | 2,636 | | | 1,858 | |
| Net-debt-to-equity ratio | | | 43% | | | 54% | |
- *
- Defined as earnings before interest, corporate and general administration, research, development, exploration, minority interest, taxes, restructuring costs and gain on sale of investments.
Financial Profile
Noranda's consolidated assets totaled $8.2 billion as at December 31, 2003 on a book value basis compared with $7.1 billion at the end of 2002. The increase is primarily due to the investment of additional capital in advancing brownfield expansion development projects and debt and equity issues completed in 2003. Total revenues increased to $4.7 billion during 2003, an increase of $800 million over the $3.9 billion in revenue generated in 2002, mainly due to stronger metals prices and higher production levels. Noranda returned to profitability in 2003, generating net income of $34 million, or $0.04 per share diluted, an increase of $481 million from the loss of $447 million in 2002. The improved results were attributed to higher base metal prices and a lower cost structure in 2003. This was partially offset by the impact of the strengthening Canadian dollar, which increased Canadian-based operating costs when converted to U.S. dollars. 2002 net income included a reduction in the carrying value of the Company's magnesium operations of $520 million in recognition of the lower than expected magnesium prices.
At December 31, 2003, Noranda held cash and short-term investments of $630 million as a result of improved operating cash flows and the proceeds of debt and equity issues completed in September 2003, which generated $880 million. These cash resources, combined with undrawn credit facilities of over $1 billion, provide the Company with sufficient liquidity to complete its development projects, pursue new investment and development opportunities currently contemplated and repay near-term debt maturities.
Noranda Annual Report 2003 17
Operating Assets
Of the $8.2 billion of assets, the capital assets which are currently contributing to earnings totaled $4.7 billion, while projects under development, which are not currently contributing to earnings, totaled $1 billion. Combined, these assets represent 70% of the total asset base of the Company. The operating assets are distributed in the Company's core metals as follows:
$ millions
| | 2003
| | 2002
|
|---|
| Operating capital assets | | | | |
| | Copper | | 2,740 | | 2,702 |
| | Nickel | | 1,052 | | 982 |
| | Zinc | | 223 | | 244 |
| | Aluminum | | 579 | | 598 |
| | Other | | 88 | | 126 |
| | |
| |
|
| Total | | 4,682 | | 4,652 |
| | |
| |
|
Capacity Enhancements
Since 1998, Noranda has invested in excess of $4 billion in the expansion of its operating capacity with the addition of world-class, low-cost assets and the improvement of existing operations. The Company increased its copper, nickel and zinc ore reserves, enhanced its copper and nickel processing capacity and expanded its primary and fabricated production capacity. These investments have substantially increased the Company's baseline earnings and its leverage to metal prices. The following is a summary of these initiatives and their impact on Noranda.
Business
| | Initiative
| | Impact
| | Completed
|
|---|
| Copper | | Collahuasi mine
Antamina mine
Lomas Bayas
Recycling plant — Tennessee
Altonorte smelter expansion
Recycling plant — Ontario | | Additional ore reserves of 1,983 million tonnes grading 0.92% copper
Additional ore reserves of 530 million tonnes grading 1.22% copper and 1.01% zinc
Additional ore reserves of 397 million tonnes grading 0.32% copper
Additional throughput capacity of 20,000 tonnes
Additional throughput capacity of 440,000 tonnes
Annual throughput capacity of over 5,000 tonnes of electronic recyclables | | 1998
2001
2001
2001
2003
2003 |
| Nickel | | Raglan mine
Nikkelverk refinery expansion | | Additional ore reserves of 22.1 million tonnes grading 3.12% nickel
Increased throughput capacity by 23% to 85,000 tonnes | | 1998
2001 |
| Aluminum | | Primary aluminum expansion
Huntingdon foil plant | | Increased annual production capacity by 15% to 250,000 tonnes
Additional 125,000 tonnes of production capacity | | 2001
2002 |
18 Noranda Annual Report 2003
Projects Under Development
Investments in development projects at the end of the year totaled $973 million, an increase of $370 million since 2002, primarily due to capital invested in two major sources of copper production. The Collahuasi transition/ expansion project will increase the mine's annual production capacity by 24% to 410,000 tonnes of copper in concentrate compared to 2003. Kidd Creek Mine D will give access to an additional 10.3 million tonnes of reserves and 14.1 tonnes of resources. While the annual production level of the Kidd Creek mine is expected to be similar to that of 2003, the cost structure will be lower and significantly more stable. Total investments in the Collahuasi and Kidd projects during 2003 totaled $160 million and $85 million, respectively.
Nickel and copper mining is the focus of the Company's growth program. As shown in the following table, Noranda has expansion projects in both these commodities that are currently under development. With the exception of Koniambo and Nickel Rim South, all projects underway are expected to be in production before mid-2005.
Projects Under Development
| | Noranda Inc.'s
Beneficial Interests
| | Book Value
| | Planned
Completion
| | Resource
Category
| | Tonnes
| | Copper
| | Grade
Nickel
| | Zinc
|
|---|
| | (%)
| | ($ millions)
| |
| |
| | (millions)
| | (%)
| | (%)
| | (%)
|
|---|
| Copper | | | | | | | | | | | | | | | | | |
| | Kidd Creek Mine D, Ontario | | 59.2 | | $ | 276 | | 2004 | | Inferred | | 14.1 | | 3.40 | | — | | 4.90 |
| | Collahuasi extension, Chile | | 59.2 | | | 207 | | 2004 | | Proven
Probable | | 254.1
1,554.1 | | 1.01
0.90 | | —
— | | —
— |
Nickel |
|
|
|
|
|
|
|
|
|
|
|
|
|
|
|
|
|
| | Montcalm, Ontario | | 59.2 | | | 17 | | 2005 | | Probable | | 5.1 | | 0.71 | | 1.46 | | — |
| | Koniambo, New Caledonia | | 29.0 | | | 123 | | 2008 | | Measured
Indicated
Inferred | | 32.4
109.7
156.0 | | —
—
— | | 2.21
2.10
2.20 | | —
—
— |
| | Nickel Rim South, Ontario | | 59.2 | | | 5 | | 2008 | | Inferred | | 11.7 | | 3.70 | | 1.60 | | — |
| Other brownfield and greenfield developments | | | | | 345 | | 2005-2008 | | — | | — | | — | | — | | — |
| | | | |
| | | | | | | | | | | | |
| Total | | | | $ | 973 | | | | | | | | | | | | |
| | | | |
| | | | | | | | | | | | |
Montcalm
One of the most advanced of these projects is the Montcalm nickel project which has secured all the necessary regulatory approvals for development and began construction in November 2003. It is scheduled to start operations in 2005 after an investment of $75 million. This project, located in Ontario, near existing metallurgical plants, is expected to add 8,000 tonnes of nickel production on an annual basis at an operating cost of $2.47 per pound.
Koniambo
The Koniambo nickel project in New Caledonia is one of the world's highly-coveted, undeveloped nickel deposits with total measured and indicated resources of 142 million tonnes grading 2.13% nickel and inferred resources of 156 million tonnes grading 2.20% nickel. Our partner, Société Minière du Sud Pacifique (largely owned by the North Province of New Caledonia), owns 51% of the project. A pre-feasibility study was completed in 2003 and a bankable feasibility study is scheduled for completion in 2004. The project is based on a proven smelting process similar to the one that has been employed for over 20 years at the ferronickel facility in the Dominican Republic. The expected capital investment to develop the project is $1,120 million, excluding a power-generation project expected to require an investment of $450 million. The partners intend to be in a position to make a decision on the development of the project before the end of 2004, following the completion of the bankable feasibility study. If this project is developed, Noranda's beneficial interest in mined nickel production will almost double.
Nickel Rim South
The Nickel Rim South project is located in the Sudbury basin in close proximity to our existing nickel operations and their infrastructure. The project is expected to add 11.7 million tonnes to resources, with exploration work continuing to further expand the reserves.
Noranda Annual Report 2003 19
In addition to the projects outlined on page 19, there are opportunities to expand the mines and extend the copper ore reserves efficiently with minimal capital investment at the currently operating Collahuasi, Lomas Bayas, and Antamina mines. These development opportunities are generally lower-risk in nature as they are typically integrated with current operations in known environments and geological areas. Similarly, in the vicinity of our Sudbury operations and our Raglan mine, our exploration efforts have identified several areas to add to the nickel reserves and further extend the mines' lives. While the scope of the opportunities have not, in all cases, been identified they present an option for us to ensure we maintain and enhance our future production profile. The following is a list of some of those opportunities:
Brownfield Opportunities
| Copper | | |
| | Antamina mine, Peru | | Production capacity expansion |
| | Collahuasi mine, Chile | | Production capacity expansion; water rights already secured |
| | Lomas Bayas mine, Chile | | Adjacent Fortuna de Cobre deposit; would extend mine life beyond 15 years |
Nickel |
|
|
| | Fraser Morgan mine, Canada | | Indicated resources of 6.3 million tonnes of 1.6% nickel and 0.52% copper; access from existing infrastructure |
| | Raglan mine, Canada | | Opportunity to increase nickel production capacity by 20% |
Zinc |
|
|
| | Perseverance mine, Canada | | Measured and indicated resources of 5.12 million tonnes grading 15.82% zinc and 1.24% copper; would utilize existing infrastructure from Bell Allard mine |
Greenfield Opportunities
Greenfield opportunities, or those potential projects which are located at previously undeveloped locations (from a Noranda perspective), also represent significant growth potential to Noranda. Projects currently being reviewed for development are as follows:
| Copper | | |
| | El Pachón, Argentina | | Measured and indicated resources of 724 million tonnes grading 0.65% copper |
| | El Morro, Chile | | Inferred resources of 466 million tonnes grading 0.61% copper and 0.50 grams per tonne gold |
| | Frieda River, Papua New Guinea | | Measured, indicated and inferred resources of 785 million tonnes grading 0.70% copper and 0.38 grams per tonne gold |
Zinc |
|
|
| | Lady Loretta, Australia | | Measured and indicated resources of 11.6 million tonnes grading 16.1% zinc |
20 Noranda Annual Report 2003
Planned Capital Investments
Capital investments for 2004 are expected to total $595 million as the development of the Collahuasi, Kidd Mine D, Montcalm and Nickel Rim South projects are advanced towards operating status. Sustaining capital expenditures average approximately $200 million annually. All of the currently projected capital investments can be funded from the current capital structure. Noranda's capital investment projections and its major components are shown in the following table.
| |
| |
| | Capital Investments
|
|---|
Business
| |
| | Impact
|
|---|
| | Growth Project
| | 2003
| | 2004F
| | 2005F
|
|---|
| |
| |
| | ($ millions)
|
|---|
| Copper | | Altonorte smelter expansion
Collahuasi mine
Kidd Mine D | | Additional throughput capacity of 440,000 tonnes
Restore annual production to 410,000-tonne level
Access to additional 10.3 million tonnes of ore reserves with 2.25% copper and 6.98% zinc | | $
| 15
160
85 | | $
| —
80
105 | | $
| —
—
90 |
Nickel |
|
Nickel Rim South
Montcalm
Koniambo
Fraser Morgan
Raglan |
|
5-year development timeframe; inferred resources of 11.7 million tonnes of 1.6% nickel and 3.7% copper; significant PGMs
8,000 tonnes per year operation for 7 years
60,000 tonnes per year operation with measured and indicated resources of 142 million tonnes grading 2.13% nickel
Indicated resources of 6.3 million tonnes of 1.71% nickel and 0.52% copper
Increase milling capacity by 40% |
|
|
11
13
23
—
— |
|
|
75
55
55
5
10 |
|
|
50
20
105
20
40 |
| | | | |
| |
| |
| |
|
| | | | | | | | 307 | | | 385 | | | 325 |
| Sustaining Capital | | | | | | | 182 | | | 210 | | | 205 |
| | | | |
| |
| |
| |
|
| Total Capital Investments | | | | | | $ | 489 | | $ | 595 | | $ | 530 |
| | | | |
| |
| |
| |
|
F: Forecast
Risk Assessment and Reduction in the Evaluation, Selection and Implementation of Projects
Noranda's preference for low-risk brownfield expansion projects provides inherent risk reduction due to the Company's knowledge of the environment in which the expansion project is to be undertaken. Where Noranda's growth demands development of greenfield projects, risk assessment and reduction is our top priority.
Managing Project Evaluation, Selection and Implementation
Noranda has taken several steps to ensure the success of all its current and future capital projects:
- •
- Creation of a highly-experienced projects group with world-class project leaders dedicated to securing the investment performance of major capital projects;
- •
- Implementation of Six Sigma-based Stage-gate process for project evaluation. This process is a disciplined system which addresses and quantifies key sources of project impact and risk in support of management decision making;
- •
- Addition of parameters in our Stage-gate process that measure social, business and strategic elements;
- •
- Recognition of investment returns as the primary metric of project success; and
- •
- Assignment of accountability.
Exploration
The exploration team conducts worldwide exploration focused on copper, nickel and platinum group metals. The mandate is to discover and delineate mineral resources that merit approval to proceed to development and production. The team targets mineral resources of strategic size, in locations with acceptable country risk, with after-tax rates of return on investment of greater than 15% and operating costs below the industry mid-point.
Noranda Annual Report 2003 21
This group's goal is to conduct safe and environmentally responsible exploration utilizing the latest appropriate technological advances in exploration methodology to improve efficiency and the likelihood of success. Joint-venture arrangements are pursued with both junior and senior mining companies to increase the level of focused activity and to share cost and risk. The exploration budget for 2004 is forecast to be $35 million. Worldwide joint-venture participants, plus tax credits and grants provided by the Quebec and New Brunswick provincial governments to stimulate exploration activity are expected to provide external funding that will have the effect of increasing the internal budget to an estimated $50 million.
Exploration is currently being carried out primarily in Canada, Mexico, Brazil, Chile, South Africa, Norway, Australia and Papua New Guinea.
Copper and Copper-Zinc Exploration
Global copper exploration during 2003 was focused primarily on Chile, Argentina, Brazil, Mexico, Papua New Guinea, Canada and Australia. Exploration in support of the Canadian operations focused on the Abitibi region of Quebec and Ontario.
Nickel and Platinum Group Metals Exploration
Advanced exploration is focused in Sudbury, Ontario and Raglan, Quebec near our existing operations. Diamond drilling at the Nickel Rim South discovery at Sudbury has increased the estimated inferred mineral resource from 6.3 million tonnes to 11.7 million tonnes of 1.6% nickel, 3.7% copper, 2.0 grams per tonne platinum, 2.3 grams per tonne palladium and 0.7 grams per tonne gold. Exploration at Raglan during 2003 has resulted in 1.7 million tonnes being added to the mineral reserves and resources.
Results of Operations
New production which has come on stream, recent inefficient-capacity shutdowns, staffing reductions, and increased base metal prices have enabled Noranda to continue to report quarter-over-quarter improvements in earnings over the past twelve months.
Quarterly Earnings
$ millions, except per share data
| | Q1
| | Q2
| | Q3
| | Q4
| | 2003
| | Q1
| | Q2
| | Q3
| | Q4
| | 2002
| |
|---|
| Results of Operations | | | | | | | | | | | | | | | | | | | | | | | | | | | | | | | |
| Revenues | | | 1,056 | | | 1,112 | | | 1,165 | | | 1,324 | | | 4,657 | | | 1,026 | | | 1,071 | | | 889 | | | 887 | | | 3,873 | |
| | |
| |
| |
| |
| |
| |
| |
| |
| |
| |
| |
| Cost of operations | | | 485 | | | 514 | | | 516 | | | 509 | | | 2,024 | | | 483 | | | 490 | | | 454 | | | 452 | | | 1,879 | |
| Purchased raw materials | | | 398 | | | 408 | | | 478 | | | 460 | | | 1,744 | | | 385 | | | 401 | | | 344 | | | 260 | | | 1,390 | |
| Depreciation, amortization and reclamation | | | 114 | | | 127 | | | 120 | | | 119 | | | 480 | | | 113 | | | 126 | | | 117 | | | 134 | | | 490 | |
| | |
| |
| |
| |
| |
| |
| |
| |
| |
| |
| |
| Income (loss) generated by operating assets | | | 59 | | | 63 | | | 51 | | | 236 | | | 409 | | | 45 | | | 54 | | | (26 | ) | | 41 | | | 114 | |
| Interest expense | | | 38 | | | 37 | | | 33 | | | 21 | | | 129 | | | 23 | | | 22 | | | 26 | | | 27 | | | 98 | |
| Corporate and general administration | | | 13 | | | 14 | | | 12 | | | 19 | | | 58 | | | 13 | | | 16 | | | 14 | | | 15 | | | 58 | |
| Research, development and exploration | | | 8 | | | 12 | | | 13 | | | 18 | | | 51 | | | 11 | | | 13 | | | 16 | | | 9 | | | 49 | |
| Minority interest in earnings of subsidiaries | | | 17 | | | 18 | | | 11 | | | 43 | | | 89 | | | 8 | | | 12 | | | (6 | ) | | 12 | | | 26 | |
| | |
| |
| |
| |
| |
| |
| |
| |
| |
| |
| |
| Income (loss) before undernoted | | | (17 | ) | | (18 | ) | | (18 | ) | | 135 | | | 82 | | | (10 | ) | | (9 | ) | | (76 | ) | | (22 | ) | | (117 | ) |
| Tax expense (recovery) | | | (6 | ) | | (23 | ) | | (1 | ) | | 54 | | | 24 | | | (13 | ) | | 2 | | | (33 | ) | | (124 | ) | | (168 | ) |
| Restructuring costs | | | 29 | | | 15 | | | (3 | ) | | 21 | | | 62 | | | �� | | | 15 | | | — | | | 546 | | | 561 | |
| Gain on sale of investments | | | — | | | — | | | (34 | ) | | (4 | ) | | (38 | ) | | — | | | (61 | ) | | — | | | (2 | ) | | (63 | ) |
| | |
| |
| |
| |
| |
| |
| |
| |
| |
| |
| |
| Net Income (loss) | | | (40 | ) | | (10 | ) | | 20 | | | 64 | | | 34 | | | 3 | | | 35 | | | (43 | ) | | (442 | ) | | (447 | ) |
| | |
| |
| |
| |
| |
| |
| |
| |
| |
| |
| |
| Earnings (loss) per common share | | $ | (0.18 | ) | $ | (0.08 | ) | $ | 0.04 | | $ | 0.21 | | $ | 0.04 | | $ | 0.00 | | $ | 0.15 | | $ | (0.21 | ) | $ | (1.86 | ) | $ | (1.93 | ) |
| | |
| |
| |
| |
| |
| |
| |
| |
| |
| |
| |
22 Noranda Annual Report 2003
Results of Operations
Net income for the year ended December 31, 2003 was $34 million or $0.04 per common share on a diluted basis, compared with a loss of $447 million or $1.93 per share for 2002. The improved results in 2003 are due to higher average realized prices for all four main metals and cost-containment initiatives undertaken in the past three years, which will continue to add to the core earnings of the Company. The net income in 2003 included a gain of $38 million pre-tax on the sale of the remaining priority units of the Noranda Income Fund and other investments. This was offset by $62 million pre-tax of restructuring costs related to the shutdown of unprofitable operations. The 2002 results included a restructuring provision of $520 million pre-tax against the Company's magnesium investment, other restructuring costs of $41 million, and a gain realized on the sale of the Company's CEZ facility which totaled $63 million pre-tax.
Income generated by operating assets increased to $409 million in 2003 compared to $114 million in 2002. The contribution from operating assets is expected to rise as capacity expansions begin contributing to operating earnings in 2004 and 2005. This includes the expansion of the Kidd Creek and Collahuasi mines and realization of benefits from cost-saving initiatives which were undertaken in 2003.
Revenues increased to $4.7 billion in 2003, an increase of 21% over 2002 revenues of $3.9 billion, due to additional capacity brought on stream, and higher realized prices during 2003. Average realized prices, as well as estimated current realized prices which will positively impact 2004, are as follows:
Average Realized Prices
$ per pound
| | Estimated
Current Price*
| | 2003
| | 2002
|
|---|
| Copper | | $ | 1.30 | | $ | 0.82 | | $ | 0.74 |
| Nickel | | $ | 7.10 | | $ | 4.40 | | $ | 3.14 |
| Ferronickel | | $ | 6.65 | | $ | 4.20 | | $ | 3.16 |
| Zinc | | $ | 0.51 | | $ | 0.43 | | $ | 0.40 |
| Aluminum | | $ | 0.82 | | $ | 0.68 | | $ | 0.65 |
| Lead | | $ | 0.42 | | $ | 0.27 | | $ | 0.23 |
| Cobalt | | $ | 25.00 | | $ | 10.41 | | $ | 7.02 |
- *
- As of February 18, 2004
Cost of operations increased to $2.0 billion, an 8% increase from 2002 levels of $1.9 billion, largely as a result of the strength of the Canadian dollar relative to the U.S. dollar, which appreciated approximately 20% during 2003, and increasing energy costs throughout the operations. Approximately 50% of the Company's operating costs are incurred in Canadian dollars. Purchased raw materials, including costs incurred to purchase custom feed, increased to $1.7 billion in 2003 from $1.4 billion in 2002, due to higher average metal prices and the impact of the stronger Canadian dollar. The settlement price for purchased custom feed is based on metal content and the prevailing market prices of the metals.
Earnings per share is calculated as follows:
$ millions, except per share information
| | 2003
| | 2002
| |
|---|
| Net income (loss) | | | 34 | | | (447 | ) |
| Deduct | | | | | | | |
| | Preferred share dividends | | | 21 | | | 11 | |
| | Interest on convertible debentures | | | 3 | | | 2 | |
| | |
| |
| |
| Income (loss) available to common shareholders | | | 10 | | | (460 | ) |
| | |
| |
| |
| Weighted average shares outstanding — 000s | | | 261,618 | | | 238,824 | |
| | |
| |
| |
| Net income (loss) per common share | | $ | 0.04 | | $ | (1.93 | ) |
| | |
| |
| |
Net income for the fourth quarter of 2003 was $64 million, or $0.21 per share diluted compared to a loss of $442 million or $1.86 per share diluted for the same period in 2002. This increase was as a result of significantly higher metals prices realized in the fourth quarter of 2003 versus 2002 offset by the impact of a strong Canadian dollar. Nickel prices realized in the fourth quarter of 2003 averaged $5.57 per pound, a 70% increase over $3.28 per pound realized in the fourth quarter of 2002, while realized copper prices increased to $0.93 per pound in the fourth quarter of 2003 compared with $0.72 per pound realized in the same period of 2002. The fourth quarter of 2002 also included a charge reducing the carrying value of the Company's magnesium operations of $520 million pre-tax.
With the addition of new mine capacity to Noranda's operating base, the Company's net income sensitivity to improvement in metal prices has increased significantly. The following table shows the annualized impact on Noranda's net income from changes in metals prices and the U.S./Canadian dollar exchange rate.
Noranda Annual Report 2003 23
| |
| | Impact on
|
|---|
| | Change in US$/lb.
Price
| | Net income
| | Income per share
|
|---|
| |
| | ($ millions)
| |
|
|---|
| Copper | | $ | 0.05 | | $ | 27 | | $ | 0.09 |
| Nickel | | $ | 0.10 | | $ | 7 | | $ | 0.02 |
| Zinc | | $ | 0.05 | | $ | 40 | | $ | 0.14 |
| Aluminum | | $ | 0.05 | | $ | 19 | | $ | 0.06 |
| Lead | | $ | 0.05 | | $ | 5 | | $ | 0.02 |
| Exchange rate Cdn$ = US$ | | | 1¢ | | $ | 5 | | $ | 0.02 |
Integrated Operations
As an integrated producer of metals, Noranda's operations include mines and metallurgical facilities which provide the Company with maximum flexibility in both minimizing costs and maximizing operating performance in processing its ore. This integration also reduces the Company's exposure to treatment charge fluctuations and shipping rate volatility.
When milling, smelting or refining capacity exceeds the Company's own mine production, Noranda acquires third-party ores to utilize this capacity and realize incremental treatment charges. These treatment charges provide incremental income to the Company and absorb fixed costs at metallurgical sites, with custom milling and refining operations being conducted throughout the Company as capacity allows. Operations conducting custom feed processing of copper and nickel feeds are located in North and South America, and Norway. This integration allows Noranda to maintain some of the lowest cash cost operations in the industry. In 2003, Noranda's integrated cost to produce a pound of copper was $0.30 per pound while the trading price for copper averaged $0.81 per pound, and was in mid-February 2004 approximately $1.30. The flexibility of the processing facilities also enables the Company to treat complex ore which may otherwise render a deposit uneconomic due to high treatment costs.
The price paid to suppliers of these custom feed ores varies with the prevailing price of the metals being treated and as such, Noranda's exposure to increasing metals prices is primarily based upon its own mine production. Noranda's continued focus on the identification and development of long-life, high-quality copper and nickel mining assets will continue to increase its leverage to copper and nickel while current metallurgical site infrastructure will minimize the investment required to bring new deposits into commercial production.
The Copper business is a fully-integrated producer of copper metal and concentrate. It is comprised mostly of long-life, low-cost mines located primarily in South America. They include Noranda's interest in the Antamina copper and zinc mine in Peru, the Collahuasi and Lomas Bayas mines in Chile and the Kidd Creek mine in Ontario, Canada. In addition to these mines, the operations include the Altonorte copper smelter in Chile, as well as refining, smelting and recycling facilities in Canada and the U.S. As discussed previously, the mines have several potential brownfield and greenfield expansion opportunities which can further increase earnings from this business.
| | 2003
| | 2002
|
|---|
| Revenues — $ millions | | | 2,165 | | | 1,906 |
| Purchased raw materials — $ millions | | | 1,064 | | | 947 |
| Operating cash cost** — per pound of copper | | $ | 0.30 | | $ | 0.34 |
| Income generated by operating assets — $ millions | | | 164 | | | 58 |
| Sales and throughput (000 tonnes)* | | | | | | |
| | Copper in concentrates | | | 219 | | | 256 |
| | Copper metal | | | 436 | | | 488 |
| | Zinc metal | | | 99 | | | 145 |
| | Zinc in concentrates | | | 112 | | | 75 |
| | Sulphuric acid | | | 651 | | | 322 |
| | Concentrate processed | | | 1,436 | | | 1,286 |
- *
- 100% basis except for Collahuasi and Antamina.
- **
- Includes all cash production and selling costs, net of by-product credits, but excludes interest, corporate, research, exploration costs and custom feed profits. Continuing costs incurred during shutdowns or strikes are excluded.
24 Noranda Annual Report 2003
Total revenue for the Copper business increased to $2.2 billion during 2003, an increase of 14% over 2002 revenue of $1.9 billion, on the strength of increased production levels and higher prices. During 2003, average realized prices increased from $0.80 per pound in the first quarter of 2003 to $0.93 per pound in the fourth quarter of 2003. Copper prices in February 2004 were approximately $1.30 per pound on the LME, which should contribute to further increases in earnings contribution from these operations in 2004.
The integrated nature of the Copper business enables the Company to maintain maximum flexibility in ore processing and will minimize future investment in the development of brownfield expansions. The integrated cash costs to produce a pound of copper declined from $0.34 to $0.30 as a result of the increased capacity at the Altonorte smelter and improved operations at the recycling operations.
Operating highlights for each of the major assets in the copper group are as follows:
- •
- Collahuasi — 2003 production totaled 168,578 tonnes of copper concentrate at an operating cash cost of $0.38, a decrease of $0.01 per pound over 2002 despite lower grades. These lower grades also accounted for a decrease in copper production of 9% compared to 2002 levels of 185,014 tonnes. The concentrator processing capacity is currently being expanded to 110,000 tonnes per day and, when combined with a transition to higher-grade ores, should increase refined copper production during 2004 to a planned level of 178,000 tonnes;
- •
- Antamina — 2003 copper production decreased to 85,188 tonnes as access to the higher-grade copper-only ores was restricted as a result of residual lake sediment. However, zinc production was over 56% higher as ores processed were of a higher zinc content compared to 2002. In 2004, copper production is expected to increase as the removal of the lake residue is completed and the higher-grade copper can be accessed.
The Antamina orebody is highly variable and is currently described by more than six different ore classifications. Since mill start-up in June 2001, Antamina has experienced difficulty in predicting the distribution of ore types that affect production, recoveries and concentrate quality, and in reconciling production tonnage and grades to the reserve model. In order to enhance the predictive ability of the current reserve model and to facilitate better short- and long-term mine planning, Antamina is undertaking 112,000 metres of infill drilling and drilling at depth, at a cost of $14 million. This drill program and associated analyses are expected to be completed in the first half of 2005. Results will be reviewed periodically during the course of the program and, as warranted, will be incorporated in reserve and resource estimates for the deposit;
- •
- Lomas Bayas — During 2003 Lomas Bayas achieved record production levels, producing 60,427 tonnes of copper cathode in 2003 compared to 59,304 tonnes in 2002. Current operating cash cost per pound is $0.48 per pound, a slight increase over $0.45 per pound due to an increase in the Chilean peso relative to the U.S. dollar. A total of 81.1 million tonnes of mineral resources were added during 2003, increasing proven and probable mineral reserves to 363.9 million tonnes at December 31, 2003;
- •
- Kidd Creek — The mining operations at Kidd Creek mined 2.1 million tonnes in 2003, a 5% decrease compared to 2002 levels due to difficult ground control conditions in the upper mine and a delay in stope rehabilitation in the lower portion of the mine. Copper ore grade in 2003 was 2.3% compared to 2.1% in 2002, and the zinc ore grade declined slightly to 4.27% compared with 5.9% in 2002. As a result of lower than expected production, increasing energy costs and the strength of the Canadian dollar, mining cash costs increased to $0.87 per pound of copper compared with $0.62 per pound of copper in 2002. The Company continued with its Mine D expansion at Kidd during 2004, a project which is expected to add additional production of 1.8 million tonnes of ore once full production is achieved; and,
- •
- Processing facilities — The copper group has three smelters and two refinery complexes within its operations located at: Altonorte in Chile, and the Kidd Creek and Horne/CCR operations in Canada. The geographic diversity of the sites and the ability of the operations to treat highly complex ore and recycled materials provides Noranda with a high degree of flexibility in deciding what site is the most appropriate location to treat the ore mined at its various operations. These metallurgical sites also purchase custom feed to absorb capacity and generate incremental treatment charges from third parties to the extent that Noranda mines do not provide sufficient ore to fill capacity. The development of the Montcalm nickel mine near Timmins, Ontario will see some concentrator capacity at Kidd Creek be converted to the treatment of this nickel ore, commencing in early 2005. This modification, coupled with the increased ore generated by the production expansion at Mine D at the Kidd mine, will significantly improve the profitability of the Kidd metallurgical site. In 2003, the revenue contribution from the processing operations was reduced because of low treatment terms. This trend will likely continue for the short term due to continued over-capacity in world smelting and refining capacity and reduced copper mine production throughout the world.
During 2003, the Copper business produced 436,000 tonnes of copper in cathode and 219,000 tonnes of copper in concentrate, compared to 488,000 tonnes and 256,000 tonnes respectively, in 2002. In addition to copper, zinc metal produced at Kidd Creek declined to 94,719 tonnes in 2003 from 145,309 tonnes in 2002 due to a planned shutdown in response to low zinc prices during 2003. Zinc concentrate production increased to 122,422 tonnes, a 56% increase from 2002 production levels of 77,876 tonnes as ore processed from the Antamina operation consisted of higher zinc grades during 2003.
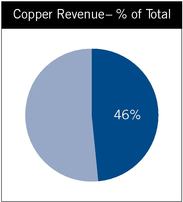
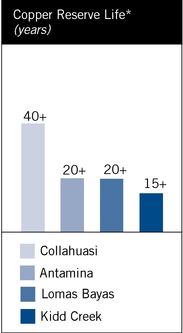
- *
- Reflects impact of expansions on a pro forma basis
Noranda Annual Report 2003 25
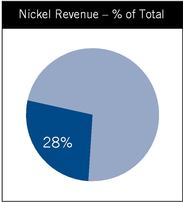 | 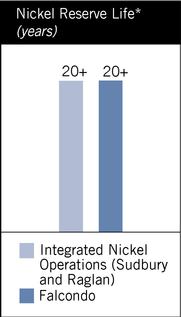 | 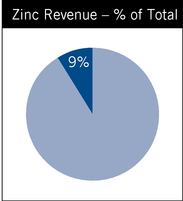 |
|
*Reflects impact of expansions on a pro forma basis |
|
Nickel
The Nickel business is comprised of nickel mines and processing facilities in Sudbury and Raglan, Canada, a refinery in Kristiansand, Norway, and a ferronickel operation at Falcondo in the Dominican Republic. Processed ore is acquired from both the Company's mining operations and through purchased custom feed.
| | 2003
| | 2002
|
|---|
| Revenues — $ millions | | | 1,297 | | | 842 |
| Purchased raw materials — $ millions | | | 280 | | | 146 |
| Operating cash cost — per pound of nickel | | $ | 2.64 | | $ | 1.96 |
| Operating cash cost — per pound of ferronickel | | $ | 3.04 | | $ | 2.76 |
| Income generated by operating assets — $ millions | | | 296 | | | 94 |
| Sales (000 tonnes) — 100% basis | | | | | | |
| | Nickel | | | 79 | | | 71 |
| | Ferronickel | | | 27 | | | 21 |
| | Cobalt | | | 3 | | | 3 |
Revenues for 2003 increased by 54% to $1,297 million when compared to 2002. In addition to the improved nickel price, sales volumes increased as higher ore grades at the Raglan mine, a higher operating level at Falcondo and increased custom feed deliveries at the Sudbury smelter and Kristiansand refinery offset lower mine production in the Integrated Nickel Operations ("INO").
The operating cash cost of producing a pound of nickel from the mines in the INO, was $2.64 per pound of nickel. The $0.68, or 35%, increase over 2002 costs resulted from the strengthening of the Canadian dollar on operating costs, higher spending levels in the Canadian operations and lower ore grades, which were partially offset by higher by-product credits as a result of the increase in metal prices. Falcondo's operating cash cost per pound of ferronickel increased by 10% in 2003, to $3.04 per pound due to the increase in oil prices.
Income generated by the nickel business in 2003 was $296 million compared to $94 million for 2002. The $202 million increase was attributable to the impact of increased metal prices and higher sales volumes which were partially offset by higher unit production costs and increases in charges for depreciation caused, in part, by the strengthening of the Canadian dollar.
The collective agreements with the production and maintenance workers at Sudbury expired on January 31, 2004 and a settlement was achieved on February 21, 2004, after a three-week strike. The collective agreement with the office, clerical and technical workers expired February 28, 2004 and was renewed for a three-year term at that time.
Zinc
The Zinc business includes the Brunswick and Bell Allard mining operations, the Brunswick lead metallurgical operations (lead smelter, lead refinery and silver refinery), General Smelting, the NorFalco sulphuric acid marketing operations, sales offices in Independence, Ohio and Zug, Switzerland, and Noranda's interest in a zinc refinery held through the Noranda Income Fund.
| | 2003
| | 2002
| |
|---|
| Revenues — $ millions | | | 410 | | | 399 | |
| Purchased raw materials — $ millions | | | 175 | | | 144 | |
| Operating cash cost — per pound of zinc | | $ | 0.32 | | $ | 0.32 | |
| Income generated by operating assets | | | (68 | ) | | (52 | ) |
| Sales (000 tonnes) | | | | | | | |
| | Zinc in concentrates | | | 335 | | | 257 | |
| | Lead metal | | | 60 | | | 91 | |
The 2003 revenues for the Zinc business were $410 million compared to $399 million in 2002. In 2003, higher zinc and lead prices, and higher production from the Brunswick and Bell Allard mines, more than offset a reduction in output from the Brunswick smelter related to the move to an eight-month seasonal operation.
The amount of contained zinc in the concentrates produced increased by 9% in 2003 as a result of record zinc recoveries at the Brunswick mine and a 17% increase in mill throughput at the Bell Allard mine.
26 Noranda Annual Report 2003
The cost to produce a pound of zinc at the Brunswick mine was up slightly over 2002 on account of higher energy costs and a stronger Canadian dollar. At the Bell Allard mine, unit costs improved slightly as higher ore grades, zinc recoveries and mill throughput offset the stronger Canadian dollar. Overall operating cash costs were $227 million compared to $242 million in 2002. The lower costs reflect the transition of the Brunswick smelter to an eight-month operation and the change in the ownership of CEZ in 2002. These were offset somewhat by the impact of the stronger Canadian dollar and higher energy costs.
The loss generated by operating assets of $68 million compares with a loss of $52 million in 2002. In 2003, improved zinc and lead prices and higher production from Brunswick and Bell Allard mines were offset by the impact of the weaker U.S. dollar, higher energy costs and the fact that CEZ was 100% owned for the first four months of the year in 2002.
Production levels in 2004 should approximate the level achieved in 2003 as higher forecasted production from the Brunswick mine is expected to offset the depletion of the Bell Allard mine ore reserves in the fourth quarter of 2004.
On May 3, 2002, the Company successfully completed an initial public offering of the Noranda Income Fund (the "Fund") after which the Company's participation in the Fund was 48.97%. During July 2003, the Company further reduced its participation in the Fund to 25%. The Fund was created to acquire the Company's CEZinc refinery. As a result of the transaction, the Company has accounted for its share of the Fund on an equity basis from May 2002. Under a supply agreement with the Fund, Noranda has assumed responsibility for securing the refinery's annual zinc concentrate requirements for a 15-year period at prevailing market zinc prices less a fixed processing fee of Cdn$0.352 per pound.
Aluminum
Noranda's Aluminum business is comprised of one primary smelter and four downstream fabrication plants. The group produces primary aluminum, aluminum foil and light sheet.
| | 2003
| | 2002
|
|---|
| Revenues — $ millions | | | 688 | | | 662 |
| Purchased raw materials — $ millions | | | 238 | | | 241 |
| Average fabricating spread — per pound of foil | | $ | 0.44 | | $ | 0.45 |
| Operating cash cost — per pound of aluminum | | $ | 0.55 | | $ | 0.50 |
| Income generated by operating assets — $ millions | | | 20 | | | 34 |
| Sales (000 tonnes) | | | | | | |
| | Primary aluminum | | | 247 | | | 242 |
| | Aluminum foil | | | 147 | | | 128 |
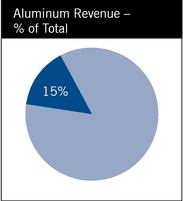
Noranda's aluminum operations consist of a primary aluminum reduction facility, accounting for 9% of aluminum production in the U.S., and four modern aluminum rolling mills, capable of producing a variety of foil sheets to fulfill numerous applications. During 2003, the foil operations supplied in excess of 20% of North American demand for foil sheet.
During 2003, the primary facility produced 244,044 tonnes of aluminum metal. In addition to aluminum metal for sales to customers, the primary aluminum facility adds further value to its finished products through the production of extrusion billets and aluminum rod, with both products attracting significant premiums over unprocessed metal. The primary operations currently have a seven-year contract for the supply of alumina, a key element in the manufacturing of aluminum, which presently allows Noranda to acquire alumina at approximately 50% of current spot prices. The aluminum foil operations produced 147,000 tonnes of foil, with the largest contributor to sales represented by fin stock sales, used primarily in heat exchangers for automotive and heating, ventilation and air conditioning applications.
Revenues for the Aluminum business increased 4% year over year as the higher aluminum price and record production from both the primary and fabricating operations more than offset lower average fabrication prices from a less favourable product mix. The change in product mix was necessitated by weakness in the light foil sector. At the primary operation, value-added products accounted for approximately 67% of total production. This was reduced from 82% in 2002 reflecting the weakness in the North American manufacturing industry in the first nine months of the year. In the fourth quarter, demand for value-added products improved and higher sales volumes are expected in 2004.
Operating costs were higher in 2003 reflecting the higher production level, the increase in natural gas prices and higher terms on a new electrical power contract at the primary smelter.
Income generated by operating assets of $20 million for 2003 compares to $34 million in 2002.
For 2004, foil shipments are expected to increase by a further 20%, as the aluminum foil plant continues to ramp up its production and to increase market share within the context of a recovering North American economy.
Noranda Annual Report 2003 27
Interest expense increased to $129 million in 2003, an increase of 32% over $98 million in 2002 due to the impact of the stronger Canadian dollar on Canadian-denominated debt and associated interest costs, and higher average interest costs due to the extension of the average term of the Company's long-term debt.
Corporate and general administration costs as well as research and development costs remained relatively unchanged over 2002 levels, and are expected to decline marginally in the near term as the Company continues to pursue cost reductions.
Minority interest in earnings increased to $89 million in 2003 from $26 million in 2002 due to the higher contribution to earnings of the Nickel business unit, which is 59.2%-owned by Noranda.
Tax expense increased to $24 million in 2003 reflecting the profitability of the Company in 2003, as compared to a tax recovery of $168 million on a consolidated basis in 2002, primarily due to the tax impact of restructuring expenses incurred in 2002.
Pre-tax restructuring costs incurred and gains on sale of investments in 2003 and 2002 are as follows:
As at December 31
| | 2003
| | 2002
| |
|---|
| Magnesium impairment and closure costs | | $ | 33 | | $ | 520 | |
| Other restructuring costs | | | 29 | | | 41 | |
| Gain on sale of CEZ facility/investments | | | (38 | ) | | (63 | ) |
| | |
| |
| |
| | | $ | 24 | | $ | 498 | |
| | |
| |
| |
Noranda maintains long-term credit arrangements and relationships with a variety of financial institutions and investors in order to facilitate its ongoing access to domestic and international financial markets to meet its funding requirements. Noranda's future financial requirements related to debt maturities, operating costs, the projects currently under development and other capital investments will be funded primarily from a combination of existing cash balances, committed bank lines, operating cash flows, project financing and new borrowings. The Company does not currently anticipate issuing additional common shares to meet these needs.
Working capital, excluding cash, short-term investments and short-term indebtedness, increased to $852 million from $652 million at the end of 2002. During the year, Noranda repositioned its balance sheet and operating capacity to support its strategic objective of maintaining a strong balance sheet meeting investment grade criteria. This will allow the Company to benefit more fully from improving fundamentals in the copper and nickel sectors. The repositioning plan included:
- •
- Issuing preferred and common shares for net proceeds of $99 million and $434 million in March and August, respectively; and,
- •
- Issuing 6% notes due in 2015 for gross proceeds of $350 million in September and the sale of Priority Units of the Noranda Income Fund for gross proceeds of $84 million. The Company also raised net proceeds of $250 million from its issuance of a 12-year debenture in May 2003, through a partially-owned subsidiary.
Cash and cash equivalents at December 31, 2003 totaled $501 million compared to $293 million at December 31, 2002. In addition to its cash balances, Noranda's liquidity and financial flexibility is augmented by revolving credit facilities. Committed lines of credit at December 31, 2003 totaled $1,132 million of which $68 million had been drawn or utilized. These lines of credit are primarily with various Canadian chartered banks and syndicates of U.S. and international banks. These bank facilities currently have committed terms of up to three years and are unsecured. Liquidity was further enhanced during the year with the release of corporate guarantees in the amount of $442 million following the conversion of the Antamina project's debt to a non-recourse basis.
Long-term debt, excluding the amount due in less than one year, amounted to $2,893 million at December 31, 2003 compared to $3,014 million a year earlier. The Company and its partially-owned subsidiary currently have $250 million and $600 million, respectively, available for public debt issuance under shelf prospectuses filed in September 2003 and January 2004, respectively. Noranda continues to monitor capital markets worldwide, seeking opportunities to diversify its financing sources. At December 31, 2003, Noranda's consolidated net debt-to-total-capitalization ratio was 43% compared to 54% at December 31, 2002.
28 Noranda Annual Report 2003
Noranda's long-term public debt ratings at December 31 are noted below:
| | 2003
| | 2002
|
|---|
| Standard & Poor' s | | BBB— | | BBB— |
| Moody' s | | Baa3 | | Baa3 |
| Dominion Bond Rating Services | | BBB | | BBB |
| | |
| |
|
Shareholders' equity at the end of 2003 was $2.6 billion after the inclusion of common and preferred share equity issues that occurred during the year.
Cash Flows
Cash generated from operations, before net changes in non-cash working capital, totaled $577 million in 2003, up from $348 million in 2002. The increase is primarily the result of higher sales and production volumes, lower operating costs and higher metal prices, despite the adverse impact of foreign exchange rates.
Capital investments totaled $489 million in 2003 compared to $528 million in 2002. Major capital expenditures during 2003 included the expansion of the Altonorte copper smelter, the expansion and transfer of mining operations at the Collahuasi copper mine and the Kidd Creek Mine D underground extension.
Capital investments for 2004 are budgeted to be $595 million. A more detailed discussion is provided on page 21.
In 2003, Noranda's common and preferred share dividend obligations were reduced by $14 million to $123 million compared to $137 million in 2002, despite an increase in both the number and amount of common and preferred shares outstanding. The annual common share dividend was reduced from Cdn$0.80 per share to Cdn$0.48 per share to bring it into line with those of other major metal and mining companies.
Metal Markets
Copper Market
LME copper prices traded in the $0.72 to $0.77 per pound range for the first nine months of 2003 then broke through $1.00 in December with current levels at $1.30.
Improved market sentiment was supported by mine disruptions, smelter cutbacks, strong Asian demand, and declining metal stocks. The weakening U.S. dollar has had a profound impact on U.S. dollar-based metal prices and accounted for a substantive part of the overall increase. China continues to drive global metal demand and its copper consumption for 2003 is expected to total 3.1 million tonnes, a 22% increase over 2002. Total exchange inventories dropped 464,500 tonnes to end the year at 793,000 tonnes. This was partially offset as Codelco, a major Chilean copper mining company, stockpiled approximately 200,000 tonnes of copper.
Despite the release of the Codelco stockpile and new expanded, and restarted mine production planned for the second half of the year, the overall market is expected to end in a slight deficit for another year. Continued strong demand in China and marked improvement in the U.S. economy are expected to create further upside for the copper price and premiums.
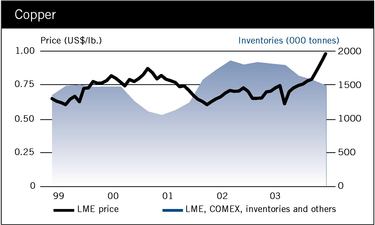
Nickel Market
In 2003, the nickel price rose from a low of $3.27 per pound at the start of the year to $7.55 per pound by year end with much of the increase occurring in the second half of the year.
Supply-side fundamentals were the main driver behind this run-up, accentuated by the very strong demand for metals in China. In 2003, world production of nickel grew by only 1.7%, less than half the growth seen in 2002. Disruptions at producers reduced supply in the first half of the year. This was followed by a three-month strike at Inco's Sudbury operations during the summer, which removed approximately 30,000 tonnes of nickel from the market.
Noranda Annual Report 2003 29
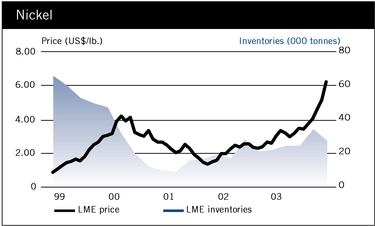
Consumption of nickel grew 5.9% in 2003, with one-third of the growth coming from China. Stainless steel production beat expectations for the year, growing at 6.3%, well above the trend growth rate, and almost at the high levels of the previous year. The first half of the year was particularly strong as mills in all geographic market sectors, with the exception of the U.S., produced at record levels. The second half did not have as strong a showing, as delayed global economic recovery translated into weak demand for stainless steel in the U.S. and Europe for the balance of the year. Growth in the availability of global external scrap kept pace with the growth in stainless steel production, with the net effect that stainless steel scrap availability remained tight. In the non-stainless steel sectors, electronic alloys and batteries showed some signs of recovery, but both the aerospace and land-based gas turbine markets remained weak.
When factoring in the Inco strike, the nickel market deficit increased to 56,000 tonnes. However, the release of the 60,000-tonne collateral stocks by Norilsk more than offset the deficit, creating an implied surplus of 4,000 tonnes for 2003.
The prospect of synchronized growth in the three major Western World economies (USA, Europe, Japan), together with the robust growth continuing in the non-OECD countries (China, Russia, India, Latin America), should underpin a strong pick-up in metal consumption. As a robust period of demand growth is forecast in 2004, the nickel market is expected to remain in significant deficit.
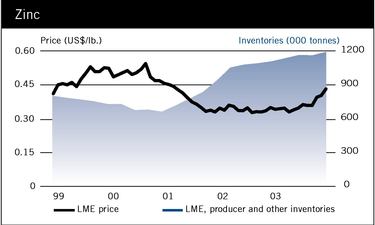
Zinc Market
Zinc prices in 2003 traded in a narrow range of $0.34 to $0.37 per pound for the first nine months, before staging a strong recovery in the fourth quarter. The LME cash settlement price climbed from $0.38 in early October to a high for the year of $0.46 on December 31 and $0.51 currently. The price improvement is partly attributable to weakness in the U.S. dollar, as well as bullish investor sentiment for an improved market outlook in 2004. LME stocks increased during the year by 89,000 tonnes to 740,400 tonnes at year end.
While global smelting capacity continues to expand, principally in China, actual refined production levels in 2003 were believed to be unchanged from 2002 levels as a result of the tight zinc concentrate supply. Low treatment charges, combined with strong domestic currencies, have forced many smelters to cut back operations or permanently close due to the poor smelting margins. Zinc demand remains very strong in China, such that China is now a net importer of zinc. Combined imports of zinc concentrates and zinc alloys exceeded metal exports, which were 15% lower year over year during the first 10 months of 2003.
During the fourth quarter, U.S. consumption improved markedly resulting in an increase in premiums in the $0.03 to $0.035 range.
The world zinc market is estimated to have been in balance for 2003 following two years of surplus. Most analysts expect that limited mine supply growth combined with higher metal demand in Asia, the U.S. and Western Europe will result in a significant supply deficit in 2004 and higher average prices than 2003 levels.
Aluminum Market
LME cash prices for 2003 ranged from a low of $0.60 in April, to a high of $0.72, on December 31 and $0.82 currently. Despite weaker fundamentals than some other base metals, aluminum's 20% recovery from its lows in 2003 is substantial and meaningful. Continued weakening of the U.S. dollar coupled with speculative fund buying propelled the price to its highest level in 34 months in December.
30 Noranda Annual Report 2003
The firming belief in a broad economic recovery is creating a bullish view of aluminum going into 2004. However, despite the growing optimism, issues and concerns remain. Among the issues in question is the direction of the Chinese market. Reductions in export rebates in conjunction with a substantial rise in spot alumina costs and regional power constraints could significantly impact the amount of aluminum China sends to the West, but it remains uncertain how Chinese producers and their supporters will respond to these issues.
The potential reduction of Chinese exports and the anticipated demand growth resulting from the economic recovery could lead to a more balanced market. Improving fundamentals should continue to support the price and provide the potential for further price improvement in aluminum during the coming year. The weaker U.S. dollar bodes well for American producers and fabricators exporting goods as their ability to be competitive on pricing is enhanced.
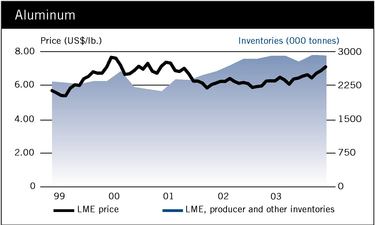
Fluctuating Metal Prices
Noranda's earnings are affected by fluctuations in the prices of the metals it produces. Their prices are subject to volatile price movements over short periods of time. We generally do not hedge prices of the metals we produce. Market prices can be affected by numerous factors beyond our control, including expectations for inflation, speculative activities, relative exchange rates to the U.S. dollar, production activities of our competitors, global and regional demand and supply, political and economic conditions including availability of subsidies and tax incentives to our competitors and production costs in major producing regions. The prices for nickel, zinc, copper or other metals produced by us may decline significantly from current levels. A reduction in the prices of one or more of these metals could materially adversely affect the value and amount of our reserves and our business, financial condition, liquidity and operating results.
Mining and Processing Risks
The business of mining and processing of metals is generally subject to a number of risks and hazards, including unusual or unexpected geological conditions, ground conditions, phenomena such as inclement weather conditions, floods and earthquakes and the handling of hazardous substances and emissions of contaminants. Such risks and hazards could result in personal injury or death, damage to, or destruction of, mineral properties, processing or production facilities or the environment, monetary losses and possible legal liability. Our business, financial condition, liquidity and operating results could be materially adversely affected if any of these developments were to occur.
Although we maintain insurance which we believe is consistent with mining industry practice to the extent available to cover some of these risks and hazards, no assurance can be given that such insurance will continue to be available, or that it will be available at economically feasible premiums. Our property, business interruption and liability insurance may not provide sufficient coverage for losses related to these or other risks or hazards. In such event, our business, financial condition, liquidity and results of operations could be materially adversely affected.
Environmental Risks
Environmental legislation affects nearly all aspects of our operations worldwide. This type of legislation requires us to obtain operating licenses and imposes standards and controls on activities relating to mining, exploration, development, production, closure and the refining, distribution and marketing of copper, nickel, zinc and other metals products. Environmental assessments are required before initiating most new products or undertaking significant changes to existing operations. Compliance with environmental legislation can require significant expenditures, including expenditures for clean-up costs and damages arising out of contaminated properties. In addition to current requirements, we expect that additional environmental regulations will likely be implemented to protect the environment and quality of life, given issues of sustainable development and other similar requirements which governmental and supragovernmental organizations and other bodies have been pursuing. Some of the issues currently under review by environmental regulatory agencies include reducing or stabilizing various emissions, including sulphur dioxide and greenhouse gas emissions, mine reclamation and restoration, and water, air and soil quality.
Noranda Annual Report 2003 31
Canada ratified the Kyoto Protocol to the United Nations Framework Convention on Climate Change in late 2002. The protocol has not come into force but may do so in the future. Various levels of government in Canada are developing a number of policy measures in order to meet Canada's emission reduction obligations under the protocol. While the impact of the protocol and measures cannot be quantified at this time, the likely effect will be to increase costs for fossil fuels, electricity and transportation, restrict industrial emission levels, impose added costs for emissions in excess of permitted levels and increase costs for monitoring and reporting. Compliance with these initiatives could have a material adverse effect on our business, financial condition, liquidity and operating results.
Further changes in environmental laws, new information on existing environmental conditions or other events, including legal proceedings brought based upon such conditions or an inability to obtain necessary permits, could have a material adverse effect on product demand, product quality and methods of production and distribution or could require increased financial reserves or compliance expenditures or otherwise have a material adverse effect on our business, financial condition, liquidity and operating results.
Failure to comply with environmental legislation may result in the imposition of fines and penalties, liability for clean-up costs, damages and the loss of important permits. There can be no assurance that we will at all times be in compliance with all environmental regulations or that steps required to bring us into compliance would not materially adversely affect our business, financial condition, liquidity or operating results.
In view of the uncertainties concerning future removal and site restoration costs on our properties, the ultimate costs for future removal and site restoration to us could differ from the amounts estimated. The estimate for this future liability is subject to change based on amendments to applicable laws and legislation, the nature of ongoing operations and technological innovations. Future changes, if any, due to their nature and unpredictability, could have a significant impact and would be reflected prospectively as a change in an accounting estimate. In addition, regulatory authorities in various jurisdictions around the world may require us to post financial security to secure in whole or in part future reclamation and restoration obligations in such jurisdictions. In some instances, we have already provided this security. In other instances, such security may be required to be posted upon the occurrence of certain events including if we cease to maintain a minimum investment grade credit rating, if the regulatory authority ceases to accept alternative forms of comfort to secure the obligation or as a property nears the end of its operation. Although the posting of this security does not increase the future reclamation and restoration costs (other than costs associated with posting such security), a portion of our credit may be required to back up these commitments, which could adversely affect our liquidity.
Labour Relations
Collective agreements covering our unionized employees at CEZ, Matagami, CCR (Plant workers), CCR (Security guards), Noranda Recycling — Roseville, Micro Metallics — San Jose, Nikkelverk, Collahuasi, and American Racing Equipments will expire in 2004. At Sudbury, a collective agreement was signed with the Mine, Mill and Smelter Workers Union after a three-week strike in February 2004. The collective agreement covering the Office, Clerical & Technical at Falconbridge's Sudbury Operations was renewed on February 28, 2004. Collective agreements covering our unionized hourly employees and workers at Brunswick Mine, Brunswick Smelter, Brunswick Smelter Bulk Handling, General Smelting, Horne Smelter, Kidd Metallurgical Division, Raglan Operations, Falcondo, Lomas Bayas, Altonorte, Antamina, New Madrid, and the aluminum foil operations at Newport and Salisbury are currently in place and will expire between 2005 and 2007.
Uncertainty of Reserve Estimates and Production Estimates
Our reported ore reserves as of December 31, 2003 are estimated quantities of proven and probable ore that under present and anticipated conditions can be legally and economically mined and processed by the extraction of their mineral content. We determine the amount of our ore reserves in accordance with the requirements of the applicable Canadian securities regulatory authorities and established mining standards. We do not use outside sources to verify our reserves. The volume and grade of reserves actually recovered and rates of production from our present ore reserves may be less than geological measurements of the reserves. Market price fluctuations in nickel, copper, other metals and exchange rates, and changes in operating and capital costs, may in the future render certain ore reserves uneconomic to mine. In addition, short-term operating factors relating to the mineral reserves, such as the need for orderly development of ore bodies or the processing of new or different ore grades, may cause mineral reserves to be modified or our operations to be unprofitable in any particular fiscal period.
32 Noranda Annual Report 2003
No assurance can be given that the indicated amount of ore will be recovered or that it will be recovered at the prices assumed by us in determining ore reserves. Ore reserve estimates are based on limited sampling and, consequently, are uncertain because the samples may not be representative of the entire orebody. As more knowledge and understanding of the orebody are obtained, the reserve estimates may change significantly, either positively or negatively.
We prepare estimates of future production for particular operations. These production estimates are based on, among other things, reserve estimates; assumptions regarding ground conditions and physical characteristics of ores, such as hardness and presence or absence of particular metallurgical characteristics; and estimated rates and costs of mining and processing. Our actual production may vary from estimates for a variety of reasons, including actual ore mined varying from estimates of grade, tonnage, dilution and metallurgical and other characteristics; short-term operating factors relating to the ore reserves, such as the need for sequential development of ore bodies and the processing of new or different ore grades; risks and hazards associated with mining; natural phenomena, such as inclement weather conditions, floods, and earthquakes; and unexpected labour shortages or strikes. No assurance can be given that production estimates will be achieved. Failure to achieve production estimates could have a material adverse impact on our future cash flows, earnings, results of operations and financial condition.
Exchange Rate Fluctuations
Fluctuations in currency exchange rates, principally the Canadian/U.S. dollar exchange rate and, to a lesser extent, Chilean Pesos, Norwegian Kroner and Euros exchange rates against the U.S. dollar, can significantly impact our earnings and cash flows. These exchange rates have varied substantially over time, including over the last five years. Most of our revenues and debt are denominated in U.S. dollars, whereas most of the operating costs at our Canadian sites are incurred in Canadian dollars and Nikkelverk's costs are incurred in Norwegian kroner. Effective July 1, 2003 we are reporting our financial results in U.S. dollars. Fluctuations in exchange rates between the U.S. dollar and the Canadian dollar and between the U.S. dollar and other currencies may give rise to foreign currency exposure, either favourable or unfavourable, which may in the future materially impact our financial results. We, from time to time, may hedge a portion of our currency requirements to limit any adverse effect of exchange rate fluctuations with respect to our costs, but there can be no assurance that such hedges will eliminate the potential material adverse effect of such fluctuations.
Interest Rate and Counterparty Risk
Our exposure to changes in interest rates results from investing and borrowing activities undertaken to manage our liquidity and capital requirements. We have entered into interest rate swap agreements to manage the interest rate risk associated with a portion of our fixed-rate debt. The interest rate swap changes our exposure to interest risk by effectively converting a portion of our fixed-rate debt to a floating rate. We may elect in the future to enter into interest rate swaps to effectively convert floating-rate debt to fixed-rate debt and enter into additional fixed-rate to floating-rate swaps. There can be no assurance that we will not be materially adversely affected by interest rate changes in the future, notwithstanding our use of interest rate swaps.
In addition, our interest rate swaps, metals hedging and foreign currency and energy risk management activities expose us to the risk of default by the counterparties to such arrangements. Any such default could have a material adverse effect on our business, financial condition and results of operations.
Energy Supply and Prices
Our operations and facilities are intensive users of natural gas, electricity and oil. Procurement of these types of energy can be affected by numerous factors beyond our control, including global and regional supply and demand, political and economic conditions and problems related to local production and delivery conditions. Our supply contracts typically provide that suppliers may be released from their delivery obligations to us if certain "force majeure" events occur. Our business operations could be adversely affected, including loss of production and damage to our plants and equipment, if, even temporarily, the supply of energy to one or more of our facilities was interrupted.
Noranda Annual Report 2003 33
A prolonged shortage of supply of energy used in our operations could materially adversely affect our business, financial condition, liquidity and results of operations. As a significant portion of our costs relate to energy consumption, our earnings are directly related to fluctuations in the cost of natural gas, electricity and oil. Energy prices can be affected by numerous factors beyond our control, including global and regional demand and supply, and applicable regulatory regimes. The prices for various sources of energy we use may increase significantly from current levels. An increase in energy prices could materially adversely affect our business, financial condition, liquidity and operating results.
Foreign Operations
Some of our activities and related assets are located in countries outside North America, some of which may be considered to be, or may become, politically or economically unstable. Exploration or development activities in such countries may require protracted negotiations with host governments, international organizations and other third parties, including non-governmental organizations, and are frequently subject to economic and political considerations, such as taxation, nationalization, inflation, currency fluctuations and governmental regulation and approval requirements, which could adversely affect the economics of projects. These projects and investments could be adversely affected by war, civil disturbances and activities of foreign governments which limit or disrupt markets, restrict the movement of funds or supplies or result in the restriction of contractual rights or the taking of property without fair compensation.
We perform a thorough risk assessment on a country-by-country basis when considering foreign activities and attempt to conduct our business and financial affairs so as to protect against political, legal, regulatory and economic risks applicable to operations in the various countries where we operate, but there can be no assurance that we will be successful in so protecting ourself. These projects and investments could also be adversely affected by changes in Canadian laws and regulations relating to foreign trade, investment and taxation.
Market Access
Global and regional demand for metals is influenced by regulatory and voluntary initiatives to restrict or eliminate the use of certain metals in particular products or applications. Impacts of such measures can be global, creating non-tariff barriers to international trade and affecting product design and specifications on a global basis. Such measures could affect the balance between supply and demand and depress metal prices and treatment/refining charges. Metals with a limited number of major applications are most susceptible to changes in demand and price in response to such measures.
Production Technology
We believe that the technology we use to produce and process metals is significantly advanced and, in part due to high investment costs, subject only to slow technological change. However, there can be no assurance that more economical production or processing technology will not be developed or that the economic conditions in which current technology is applied will not change.
Legal Proceedings
The nature of our business subjects us to numerous regulatory investigations, claims, lawsuits and other proceedings in the ordinary course of our business. The results of these legal proceedings cannot be predicted with certainty. There can be no assurance that these matters will not have a material adverse effect on our results of operations in any future period, and a substantial judgment could have a material adverse impact on our business, financial condition, liquidity and results of operations.
Sulphuric Acid
Sulphur dioxide is a by-product from the smelting of copper, zinc, nickel and lead sulphide concentrates. We process sulphur dioxide into sulphuric acid to meet our environmental commitments. Due to increasingly strict environmental standards worldwide for sulphur dioxide emissions, involuntary production of sulphuric acid by smelters is growing. The balance of world acid production is largely based on elemental sulphur, whose supply is now a by-product of oil and gas production, and growing more rapidly than demand. Long term, these factors may make it more difficult for us to obtain satisfactory prices for our sulphuric acid. However, our production of sulphuric acid cannot be reduced in response to low prices, or dropping sales volumes, without a corresponding reduction in our production of metals.
34 Noranda Annual Report 2003
Raw Material Procurement Risks
Procurement of raw materials involves the risks typically connected with commercial transactions, which can include trade barriers, political instability and problems due to local production conditions. In addition, our supply contracts provide that suppliers of concentrate may be released from their delivery obligations to us if certain "force majeure" events occur. Our business operations could be adversely affected, at least temporarily, if supplies of raw materials are interrupted as a result of the imposition of trade barriers or other events and if we are unable, on short notice, to shift to alternative sources of supply. We also process copper scrap, the availability of which in past years has been subject to significant fluctuations and the supply of which has been declining since the mid-1990s. The availability of scrap, blister copper and other material we process can be significantly affected by fluctuations in prices.
Noranda Annual Report 2003 35