QuickLinks -- Click here to rapidly navigate through this documentEXHIBIT 2
The audited Consolidated Financial Statements for the fiscal year ended December 31, 2004 and the accompanying Management's Discussion and Analysis of Noranda Inc. appearing on pages 49 to 85 and pages 18 to 48, respectively, of the Noranda Inc. 2004 Annual Report, which are incorporated by reference into the Annual Information Form of Noranda Inc.
Management's Discussion and Analysis
The following analysis and discussion of the Company's activities take into account management's knowledge of all material facts and events up to and including February 3, 2005.
Selected Annual Information
The analysis contained herein is based upon the financial position, results of operations and cash flows of the Company in accordance with Canadian Generally Accepted Accounting Principles. The Company's functional reporting currency was converted to U.S. dollars on July 1, 2003 and unless otherwise noted, all amounts in this report are expressed in U.S. dollars.
| | 2004
| | 2003
| | 2002
| |
|---|
| | ($ millions, except per share data)
| |
|---|
| Results of operations | | | | | | | | | | |
| Revenues | | $ | 6,978 | | $ | 4,657 | | $ | 3,873 | |
| Income generated by operating assets(1) | | | 1,380 | | | 397 | | | 151 | |
| Net income (loss) | | | 551 | | | 23 | | | (414 | ) |
| Net income (loss) per common share | | $ | 1.78 | | $ | — | | $ | (1.79 | ) |
| | |
| |
| |
| |
| Cash flow | | | | | | | | | | |
| Cash flow from operations | | $ | 1,191 | | $ | 413 | | $ | 380 | |
| Investment in growth projects | | | 432 | | | 307 | | | 382 | |
| Sustaining capital expenditures | | | 234 | | | 182 | | | 146 | |
| Dividends per common share | | | Cdn$0.48 | | | Cdn$0.64 | | | Cdn$0.80 | |
| | |
| |
| |
| |
| Financial position | | | | | | | | | | |
| Cash and short-term investments | | $ | 884 | | $ | 630 | | $ | 293 | |
| Operating capital assets | | | 4,870 | | | 4,765 | | | 4,722 | |
| Development projects | | | 1,166 | | | 973 | | | 603 | |
| Total assets | | | 9,611 | | | 8,328 | | | 7,172 | |
| Long-term debt | | | 2,638 | | | 2,893 | | | 3,014 | |
| Shareholders' equity | | | 3,059 | | | 2,597 | | | 1,831 | |
| Net-debt-to-total-capitalization ratio | | | 35% | | | 43% | | | 54% | |
| | |
| |
| |
| |
- (1)
- Defined as earnings before interest, corporate and general administration, research, development, exploration, minority interest, taxes, gains net of restructuring costs and other.
Noranda is a global integrated metals producer focused on the extraction and processing of copper and nickel, and has investments in zinc and aluminum producing assets. Noranda is focused on increasing the profitability of its core operations through cost reductions and capacity expansions while identifying and defining orebodies for future development.
Total revenues have increased from $3.9 billion for the year ended December 31, 2002 to almost $7.0 billion for the year ended December 31, 2004 primarily due to the significant increase in realized metal prices during that period. Since 2002, average copper prices realized increased from $0.74/lb. to $0.82/lb. for the year ended December 31, 2003, and rising to $1.30/lb. for the year ended December 31, 2004. Prices realized for nickel increased from $3.14/lb. in 2002, to $4.40/lb. in 2003, with realized prices in 2004 averaging $6.40/lb. Prices realized for zinc increased from $0.40/lb. in 2002, to $0.43/lb. in 2003, with realized prices in 2004 averaging $0.52/lb. Prices realized for aluminum increased from $0.65/lb. in 2002, to $0.68/lb. in 2003, with realized prices in 2004 averaging $0.84/lb. Prices for by-product materials such as lead, cobalt and precious metals, which are found and processed in conjunction with our core metals, have also experienced similar price increases during these periods.
Production of nickel, zinc and aluminum all increased in 2003 over 2002 levels, while copper declined slightly due to grade reductions at Collahuasi and decreased copper production from the Antamina copper-zinc deposit, where higher zinc-yielding ore was mined, offsetting reduced copper production with increased zinc recoveries. During 2004, mined copper production increased 14% due to the impact of expansions at Collahuasi and the accessing of the high-grade copper zone at Antamina. Nickel and aluminum production also increased during 2004, while zinc production declined due to the closure of the Bell Allard mine at Matagami, Quebec, which ceased production in October 2004. Zinc production from Antamina also declined as production was shifted to high-grade copper zones following the removal of sediment in June 2004. Further information on production levels is found on page 87 of this report.
18
The increase in production and metals prices, coupled with the various cost reduction initiatives yielded an increase in net income per common share from a loss of $1.79 for the year ended December 31, 2002, to net income per common share of $1.78 for the year ended December 31, 2004. Offsetting the impact of price increases and cost containment initiatives was the influence of rising energy costs across all elements of the operations and the impact of the weakening of the U.S. dollar relative to both the Canadian dollar and Chilean peso, thereby increasing operating costs in those jurisdictions relative to our U.S. dollar revenue base. Approximately 50% of Noranda's operating costs are incurred in Canadian dollars.
Total assets have increased from $7.2 billion at December 31, 2002 to in excess of $9.6 billion at December 31, 2004 due to the following:
- •
- Increased investment in production expansion projects to enhance the Company's operating base, which has seen in excess of $1.0 billion in investment since December 31, 2002
- •
- Increased investment in working capital investment due to higher realized prices and increased production levels
- •
- Increased cash retained due to higher earnings levels
Long-term financial liabilities have declined from $3.0 billion at December 31, 2002 to $2.6 billion primarily due to the use of operating cash flow to reduce overall consolidated leverage ratios, despite increased capacity investment.
Corporate Developments
During the third quarter of 2004, Noranda announced that it entered into exclusive negotiations with China Minmetals concerning a proposal from Minmetals to acquire 100% of the outstanding common shares of Noranda. Noranda's exclusive negotiations with China Minmetals ended on November 16, 2004. While discussions with China Minmetals are currently continuing on a non-exclusive basis, the Special Committee of the Noranda Board of Directors now has the opportunity to advance other alternatives, both on a stand-alone basis and with other parties.
Asset Profile
Noranda's consolidated assets totaled $9.6 billion as at December 31, 2004 on a book-value basis compared with $8.3 billion at the end of 2003. The increase is primarily due to the investment of additional capital in both completing and advancing brownfield expansion development projects and income generated in excess of debt repaid. Total revenues increased to $7.0 billion during 2004, an increase of $2.3 billion over the $4.7 billion in revenue generated in 2003, due to stronger metal prices and higher production levels. Noranda generated net income of $551 million, or $1.75 per share on a diluted basis, an increase of $528 million from the net income of $23 million, or nil per share on a diluted basis in 2003. The improved results were attributed to higher base metal prices, increased production levels and a lower cost structure in 2004. This was partially offset by the impact of the stronger Canadian dollar relative to the U.S. currency, which increased Canadian-based operating costs when converted to U.S. dollars.
At December 31, 2004, Noranda held cash and cash equivalents of $884 million as a result of improved operating cash flows. During 2004, Noranda's consolidated net debt to capitalization declined by over 800 basis points to 35%. Cash resources, combined with undrawn credit facilities of over $1.7 billion, provide the Company with sufficient liquidity to complete its development projects, pursue new investment and development opportunities currently contemplated and repay near-term debt maturities.
19
Operating Assets
Of the $9.6 billion of assets, the book value of capital assets which are currently contributing to earnings totaled $4.9 billion, while projects under development, which are not currently contributing to earnings, totaled $1.2 billion. Combined, these assets represent 63% of the total asset base of the Company. During 2004, Noranda completed the construction of the Collahuasi expansion. This project, which was completed ahead of schedule and below budget, resulted in $272 million being transferred from projects under development to operating capital assets. The operating assets are distributed in the Company's core metals as follows:
| | 2004
| | 2003
|
|---|
| | ($ millions)
|
|---|
| Operating capital assets | | | | | | |
| | Copper | | $ | 2,890 | | $ | 2,757 |
| | Nickel | | | 1,078 | | | 1,107 |
| | Zinc | | | 158 | | | 234 |
| | Aluminum | | | 702 | | | 579 |
| | Other | | | 42 | | | 88 |
| | |
| |
|
| Total | | $ | 4,870 | | $ | 4,765 |
| | |
| |
|
Capacity Enhancements
Since 1998, Noranda has invested significant capital in the expansion of its operating capacity with the addition of world-class, low-cost assets and the improvement of existing operations. The Company increased its copper, nickel and zinc mineral reserves, enhanced its copper and nickel processing capacity, expanded its primary and fabricated production capacity and acquired bauxite mining and alumina refining assets to fully integrate its aluminum operations. These investments have substantially increased the Company's baseline earnings and its leverage to metal prices. The following is a summary of these initiatives and their impact on Noranda.
Business
| | Initiative
| | Impact
| | Completed
|
|---|
| Copper | | Collahuasi mine | | Additional reserves of 2,010 million tonnes grading 0.83% copper | | 1998 |
| | | | Antamina mine | | Additional reserves of 559 million tonnes grading 1.23% copper and 1.03% zinc | | 2001 |
| | | | Lomas Bayas | | Additional reserves of 397 million tonnes grading 0.32% copper | | 2001 |
| | | | Recycling plant - Tennessee | | Additional throughput capacity of 20,000 tonnes | | 2001 |
| | | | Altonorte smelter expansion | | Additional throughput capacity of 440,000 tonnes | | 2003 |
| | | | Recycling plant - Ontario | | Annual throughput capacity of over 5,000 tonnes of electronic recyclables | | 2003 |
| | | | Collahuasi | | Completed the Ujina-Rosario transition and Phase II expansion project, began molybdenum recovery circuit | | 2004 |
| Nickel | | Raglan mine | | Additional reserves of 22.1 million tonnes grading 3.12% nickel | | 1998 |
| | | | Nikkelverk refinery expansion | | Increased throughput capacity by 23% to 85,000 tonnes | | 2001 |
| | | | Montcalm mine | | Developed deposit and began mining reserves of 5.1 million tonnes grading 1.46% nickel and 0.71% copper. | | 2004 |
| Aluminum | | Primary aluminum expansion | | Increased annual production capacity by 15% to 250,000 tonnes | | 2001 |
| | | | Huntingdon foil plant | | Additional 125,000 tonnes of production capacity | | 2002 |
| | | | New Madrid Smelter | | Renewed operating permit that will allow a 2% higher rate of capacity utilization, providing another 5,000 - 6,000 tonnes per year of output | | 2004 |
20
Projects Under Development
Investments in development projects at the end of the year totaled $1,166 million, an increase of $193 million since December 31, 2003, primarily due to capital invested in brownfield expansions offset by the completion of the Collahuasi mine expansion in 2004. The Collahuasi transition/expansion project increased the mine's concentrator design capacity to 110,000 tonnes per day from 70,000 tonnes per day. This capacity increase will help compensate for an expected decline in ore grade and thereby enable Collahuasi to maintain copper production at current levels. Kidd Creek Mine D gave access to an additional 9.1 million tonnes of reserves and 15.3 tonnes of resources. While the future annual production level of the Kidd Creek mine is expected to be similar to that of 2003, the cost structure will be lower and significantly more stable. Total investments in the Collahuasi and Kidd projects during 2004 totaled $65 million and $127 million, respectively.
Nickel and copper mining remains the focus of the Company's growth program. As shown in the following table, Noranda has expansion projects that are currently under development in both these commodities.
Projects Under Development — Capital Spending 2004
| | Noranda Inc.'s
Beneficial Interests
| | Book Value at
Dec. 31, 2003
| | Expenditures
| | Transferred to
Operating Assets
| | Book Value at
Dec. 31, 2004
|
|---|
| | (%)
| | ($ millions)
| | ($ millions)
| | ($ millions)
| | ($ millions)
|
|---|
| Copper | | | | | | | | | | | | | | |
| | Collahuasi | | 25.9 | | $ | 207 | | $ | 65 | | $ | (272 | ) | $ | — |
| | Kidd Creek Mine D, Ontario | | 58.8 | | | 277 | | | 127 | | | — | | | 404 |
| Nickel | | | | | | | | | | | | | | |
| | Koniambo, New Caledonia | | 28.8 | | | 123 | | | 57 | | | — | | | 180 |
| | Nickel Rim South, Ontario | | 58.8 | | | 5 | | | 96 | | | — | | | 101 |
| Other | | — | | | 361 | | | 120 | | | — | | | 481 |
| | |
| |
| |
| |
| |
|
| Total | | | | $ | 973 | | $ | 465 | | $ | (272 | ) | $ | 1,166 |
| | |
| |
| |
| |
| |
|
Kidd Mine D
At Kidd Mine D, work is progressing as planned as Kidd continues to develop the Mine Depth extension of the Kidd orebody. Mine D will allow the mine to produce 2.4 million tonnes of ore annually once in full production. Shaft progress advanced to 93% of plan and is now below the 8800 level. The Operations group has assumed control of the Block 1 Ore Handling System. Production began in late 2004. In 2004, $127 million, including capitalized interest was spent on Mine D development, with a total of $404 million spent to date. The cost of Mine D Stage I has been estimated at $500 million, excluding capitalized interest.
Montcalm
The Montcalm nickel project, near Timmins, Ontario, was completed in December 2004 after an investment of $75 million. This project is expected to add 8,000 to 9,000 tonnes of nickel production on an annual basis at an operating cost of $2.47/lb.
Nickel Rim South
The Nickel Rim South project is progressing on schedule and within budget. Site preparation, services and installation of electrical systems were completed in 2004. Both the vent shaft and main shaft construction programs are on track. The updated inferred mineral resource estimate at December 31, 2004 was 13.4 million tonnes grading 1.8% nickel and 3.3% copper with significant platinum and palladium.
Koniambo
Work continued throughout the year on the Koniambo ferronickel project in the Northern Province of New Caledonia, near the provincial capital of Kone. At a 1.5% nickel cut-off grade, the deposit contains measured plus indicated resources totaling 142.1 million tonnes at 2.13% nickel. Together with additional inferred resources of 156 million tonnes at 2.2% nickel, Koniambo is one of the world's largest and highest grade nickel laterite deposits. At a 2.0% nickel cut-off grade, the deposit contains measured plus indicated resources of 75.6 million tonnes at 2.47% nickel. In addition, the project has an inferred limonite resource estimated at 100 million tonnes at 1.6% nickel and 0.2% cobalt that could be developed at a later date.
21
In 1998, Falconbridge entered into a joint-venture agreement with Société Minière du Sud Pacifique S.A. (SMSP) and its controlling shareholder, Société de Financement et d'Investissement de la Province Nord, for the evaluation and development of the 60,000-tonne per year nickel in ferronickel mining and smelting complex. By signing its joint-venture agreement with SMSP, Falconbridge became SMSP's approved industrial partner under the Bercy Accord, with titles to the Koniambo orebody held in escrow until the conditions of the Bercy Accord are met. Upon satisfaction of the conditions in the Bercy Accord, SMSP and Falconbridge are to receive a 51% and 49% interest, respectively, in the Project. The two conditions precedent are: 1) the completion of a positive technical study, and 2) firm orders of $100 million related to the project. These conditions must be met before the expiry of the Bercy Accord on January 1, 2006.
The Bankable Feasibility Study (BFS) on the Koniambo ferronickel project was completed in late 2004.
The BFS has increased the level of project definition, with engineering increasing from approximately 10% to 25%. Substantial analysis has been completed on many aspects of the project and included extensive third-party reviews. The project scope has remained essentially unchanged, with the work performed in the pre-feasibility study validated through the completion of the BFS. The costs of the inputs have increased as a result of changes in foreign currency exchange rates, and increased service and raw materials costs. As a result, the estimated capital cost of the project has increased to $2.2 billion. Working capital, cost escalation from 2004 to start-up, financing and arrangement fees and interest costs, for a total of approximately $500 million of other costs, are not included in the $2.2 billion. This cost estimate compares with a pre-feasibility estimate of $1.6 billion (in 2002 dollars). Estimated operating costs have increased to $1.65/lb., from $1.27/lb.
The capital cost of $2.2 billion includes the construction of a $600 million power station with an installed generating capacity of 390 MW. The remaining $1.6 billion relates to the metallurgical plant, mine development and other infrastructure such as the port and road facilities.
With the Bankable Feasibility Study completed, the Company and its partners SMSP and the French government are focused on finalizing the financing structure for this project. The implementation approach to this project continues to be assessed, with earliest possible start-up in 2009.
If developed, Koniambo would be one of the largest nickel producers in the world with initial production of 60,000 tonnes per year. In addition, future expansion could take advantage of the large resource base, which has an estimated life in excess of 50 years.
Other Development Opportunities
In addition to the previous summary of projects, there are attractive opportunities to expand the mines and extend the copper mineral reserves efficiently with minimal capital investment at the currently operating Collahuasi, Lomas Bayas and Antamina copper mines. These development opportunities are generally lower-risk in nature as they are typically integrated with current operations in known environments and geological areas. Similarly, in the vicinity of the Sudbury operations and the Raglan mine, exploration efforts have identified several areas to add to the nickel reserves and further extend the mines' lives. While the scope of the opportunities have not, in all cases, been identified, they present an option to ensure the Company maintains and enhances its future production profile. The following is a list of some of those opportunities:
22
Brownfield Opportunities
Brownfield development sites represent expansions to existing operations which have a reduced risk profile due to their proximity to existing infrastructure and known geological composition. These developments also usually require less capital than new operating environments and remain a key focus for near-term investment, including:
| Copper | | |
| | Altonorte smelter, Chile | | Conversion of idle existing roasters to treat molybdenum concentrates and produce finished molybdite (MoO3). |
| | Collahuasi mine, Chile | | Studying Phase 3 production capacity expansion that would add 175,000 tonnes per year copper-in-concentrate production; implementing a molybdenum recovery circuit for concentrate production. |
| | Lomas Bayas mine, Chile | | Studying adjacent Fortuna de Cobre deposit for possible additional 30,000 tonnes per year copper cathode production; would extend existing Lomas Bayas mine life to 20 years. Measured and indicated resources of 470 million tonnes grading 0.29% copper with an additional inferred resources of 150 million tonnes. |
| Nickel | | |
| | Fraser Morgan mine, Canada | | Exploring this Sudbury area deposit that can be accessed from existing infrastructure. Measured and indicated resources of 4.9 million tonnes grading 1.80% nickel and 0.56% copper with additional inferred resources of 2.1 million tonnes. |
| | Raglan mine, Canada | | Phase I milling circuit modifications completed; Phase II engineering project is underway to assess changes to the grinding circuit that would enable a production rate of 1.2 million tonnes of ore per year. Extensive exploration program in progress to evaluate further growth scenarios. |
| | Falcondo, Dominican Republic | | Studying the opportunity to increase annual ferronickel production by 6,000 tonnes of contained nickel, an addition of approximately 25% of current output. |
| | Montcalm, Ontario | | Evaluating the possibility of increasing the annual mining rate from 750,000 tonnes of ore to one million tonnes per year. |
| Zinc | | |
| | Lennard Shelf mine, Australia | | Evaluating options and timing to restart this currently idle mine. Measured and indicated resources of 2.8 million tonnes grading 8.47% zinc and 1.96% lead. |
| | Perseverance mine, Canada | | Evaluating options and timing to develop this Matagami camp deposit. Measured and indicated resources of 5.12 million tonnes grading 15.82% zinc and 1.24% copper; could utilize existing mill and concentrator infrastructure. |
23
Greenfield Opportunities
Greenfield opportunities, or those potential projects which are located in regions where Noranda does not currently operate, represent significant growth potential to Noranda. Projects currently being reviewed for development are as follows:
| Copper | | |
| |
El Pachón, Argentina |
|
A very large and promising deposit with measured and indicated resources of 724 million tonnes grading 0.65% copper; capable of producing approximately 200,000 tonnes per year of copper-in-concentrate. |
| |
El Morro, Chile |
|
A porphyry copper deposit with inferred resources of 466 million tonnes grading 0.61% copper and 0.50 grams per tonne gold. |
| |
West Wall, Chile |
|
With an active drilling program underway, Noranda will vest 50% ownership in this promising copper porphyry in 2005. |
| |
Frieda River, Papua New Guinea |
|
The Frieda River project contains three significant copper deposits. Currently the focus of exploration is on the Nena deposit. With measured and indicated resources of 50 million tonnes grading 2.21% copper and 0.60 grams per tonne gold, this deposit is being further explored to expand and improve precision of the resource estimates. |
Zinc |
|
|
| |
Lady Loretta, Australia |
|
Studying the optimal timing to develop this deposit. Located near the Mt. Isa camp in a known area of mineralization. Measured and indicated resources of 11.6 million tonnes grading 16.1% zinc and 5.7% lead. |
Planned Capital Investments
Capital investments for 2005 are expected to total $681 million as the development of the Nickel Rim South and other Brownfield expansions are advanced towards operating status. Additional capital will be spent on Koniambo during the year to advance engineering of the project. Sustaining capital expenditures average approximately $200 million annually. All of the currently projected capital investments can be funded from the current capital structure. Noranda's capital investment projections and its major components are shown in the following table.
| |
| |
| | Capital Investments
|
|---|
Metal
| | Growth Project
| | Impact
| | 2004
| | 2005F
| | 2006F
|
|---|
| |
| |
| | ($ millions)
|
|---|
| Copper | | Kidd Mine D | | Existing mine deepening to provide access to additional 15.3 million tonnes of inferred reserves with 3.0% copper and 4.6% zinc. | | $ | 127 | | $ | 86 | | $ | 65 |
| Nickel | | Nickel Rim South | | Potential new nickel/copper mine with inferred resources of 13.4 million tonnes of 1.8% nickel and 3.3% copper and significant platinum group metals; 5-year development timeframe. | | | 96 | | | 61 | | | 75 |
| | | Koniambo | | Potential new nickel mine envisioning a 60,000 tonne-per-year operation. Measured and indicated resources of 142 million tonnes grading 2.13% nickel. | | | 57 | | | 146 | | | 70 |
| | | Raglan | | Increase milling capacity by 40% to enable mine output increase. | | | — | | | 21 | | | 38 |
| | | Other | | | | | 152 | | | 102 | | | 69 |
| | | | | | |
| |
| |
|
| | | | | | | | 432 | | | 416 | | | 317 |
| Sustaining Capital | | | | | 234 | | | 265 | | | 226 |
| | | | | | |
| |
| |
|
| Total Capital Investments | | | | $ | 666 | | $ | 681 | | $ | 543 |
| | | | | | |
| |
| |
|
- F:
- Forecast
24
Risk Assessment and Reduction in the Evaluation, Selection and Implementation of Projects
Noranda's preference for lower-risk brownfield expansion projects provides inherent risk reduction due to the Company's knowledge of the environment in which the expansion project is to be undertaken and its ability to tap into existing human and physical resources. Where Noranda chooses to invest and grow via the development of greenfield projects, away from existing infrastructure, risk assessment and reduction is a top priority.
Managing Project Evaluation, Selection and Implementation
Noranda has taken several steps to ensure the success of all its current and future capital projects including the following:
- •
- Creation of a highly-experienced projects group with world-class leaders dedicated to securing the investment performance of major capital projects
- •
- Implementation of Six Sigma-based Stage Gate process for project evaluation. This process is a disciplined system which addresses and quantifies key sources of project impact and risk in support of management decision making
- •
- Addition of parameters in the Stage Gate process that measure social, business and strategic elements
- •
- Recognition of investment returns as the primary metric of project success
- •
- Assignment of accountability
Exploration
The objectives of the exploration team are aligned with those of the copper, nickel and zinc business units and are aligned with the corporate strategy of focusing primarily on copper and nickel growth opportunities worldwide. The Company's goal is to be the most valued and sought after partner in the mining and metals business. The Company's approach is one of consistently being a fair and honest partner, complemented by strong technical skills and a solid track record with a "win-win" philosophy. Joint-venture arrangements are pursued with both junior and senior mining companies to increase the level of focused exploration activity, thereby sharing cost and risk, and improving the likelihood of success. The exploration team is supported by an experienced mergers and acquisitions team and a strong project engineering team with significant experience building mines around the world.
As a Founding Patron of the Association of Professional Geoscientists of Ontario and a Founding Partner of the Prospector and Developers Association of Canada's Environmental Excellence in Exploration initiative, the team of geoscientists is committed to being fully compliant with National Instrument 43-101 requirements and in consistently conducting safe and environmentally responsible global exploration.
The exploration team consists of 107 employees, including 87 geologists and geophysicists. Noranda forecasts exploration expenditures for 2005 at $46.2 million compared to $42.5 million invested in 2004. Exploration activity is primarily focused on Canada, Chile, Brazil, Mexico, Norway, Australia, Africa, Papua New Guinea and China.
Interesting 2004 exploration results that will be pursued further in 2005 include:
- 1.
- A new nickel sulphide discovery east of Fraser Mine at Sudbury, Ontario, referred to as Fraser-Morgan West.
- 2.
- A new nickel sulphide discovery in Norway, a joint venture with Blackstone Ventures Inc.
- 3.
- The discovery of a new zinc occurrence at Matagami, Quebec.
- 4.
- Encouraging copper intersections at the Frieda River project in PNG, a joint venture with Highlands Pacific Limited.
Planned 2005 exploration also includes 8,000-metre diamond-drilling programs at each of two porphyry copper projects in Chile: the West Wall project, a joint venture with Anglo American, and the El Morro project, a joint venture with Metallica Resources.
Results of Operations
Net income for the year ended December 31, 2004 was $551 million or $1.75 per common share on a diluted basis, compared with a net income of $23 million or $0.00 per share for 2003. The significant improvement in 2004 results is due to higher average realized prices for all four primary metals as well as by-products, and strong operational performance from each business unit. Net income in 2004 included a gain of $80 million on the settlement of a favourable alumina purchase agreement offset by an asset impairment provision of $50 million realized against the assets of American Racing. In 2003, net income included a gain of $38 million pre-tax on the sale of the remaining priority units of the Noranda Income Fund and other investments. This was offset by $66 million pre-tax of restructuring costs related to the shutdown of unprofitable operations.
25
Revenues increased to $7.0 billion in 2004, an increase of 49% over 2003 revenues of $4.7 billion due to additional capacity brought on stream, and higher realized prices during 2004. Income generated by operating assets increased to $1,380 million in 2004 compared to $397 million in 2003. The contribution from operating assets is expected to rise as capacity expansions begin contributing to operating earnings in 2005 and beyond.
| | 2004
| | 2003
| |
|---|
| | $ millions, except per share information
| |
|---|
| Revenue | | $ | 6,978 | | $ | 4,657 | |
| Operating expenses | | | | | | | |
| | Cost of operations | | | 2,094 | | | 1,948 | |
| | Purchased raw materials | | | 3,005 | | | 1,822 | |
| | Depreciation, amortization and reclamation | | | 499 | | | 490 | |
| | |
| |
| |
| Total operating expenses | | | 5,598 | | | 4,260 | |
| Income generated by operating assets | | | 1,380 | | | 397 | |
| | Corporate costs(1) | | | 232 | | | 238 | |
| | Minority interest | | | 297 | | | 88 | |
| | (Gain) loss net of restructuring costs and other | | | (33 | ) | | 28 | |
| | Taxes | | | 333 | | | 20 | |
| | |
| |
| |
| Net income | | | 551 | | | 23 | |
| | |
| |
| |
| Deduct | | | | | | | |
| | Preferred share dividends | | | 20 | | | 21 | |
| | Interest on convertible debentures | | | 3 | | | 3 | |
| | |
| |
| |
| Income (loss) available to common shareholders — basic | | | 528 | | | (1 | ) |
| | |
| |
| |
| Impact of convertible debentures | | | 3 | | | — | |
| | |
| |
| |
| Income (loss) available to common shareholders — diluted | | | 531 | | | (1 | ) |
| | |
| |
| |
| Basic weighted average number of shares — 000s | | | 296,246 | | | 261,618 | |
| Diluted weighted average number of shares — 000s | | | 303,790 | | | 261,618 | |
| | |
| |
| |
| Basic earnings per common share | | $ | 1.78 | | | — | |
| | |
| |
| |
| Diluted earnings per common share | | $ | 1.75 | | | — | |
| | |
| |
| |
- (1)
- Corporate costs include interest, corporate and general administration, research, development and exploration costs.
Average Realized Prices
Average realized prices during 2004 and 2003, as well as estimated current realized prices which will positively impact 2005, are as follows:
$ per pound
| | Estimated
Current Price*
| | 2004
| | 2003
|
|---|
| Copper | | $ | 1.50 | | $ | 1.30 | | $ | 0.82 |
| Nickel | | $ | 7.10 | | $ | 6.40 | | $ | 4.40 |
| Zinc | | $ | 0.62 | | $ | 0.52 | | $ | 0.43 |
| Aluminum | | $ | 0.88 | | $ | 0.84 | | $ | 0.68 |
| Lead | | $ | 0.45 | | $ | 0.43 | | $ | 0.27 |
| Cobalt | | $ | 18.60 | | $ | 22.48 | | $ | 9.42 |
| Molybdenum | | $ | 30.00 | | $ | 14.09 | | $ | 4.51 |
| | |
| |
| |
|
- *
- As at February 23, 2005
Cost of operations increased to $2.1 billion, a 7% increase from 2003 levels of $1.9 billion, largely as a result of the strength of the Canadian dollar relative to the U.S. dollar, and increasing energy costs throughout the operations. Approximately 50% of the Company's operating costs are incurred in Canadian dollars. Purchased raw materials, including costs incurred to purchase custom feed, increased to $3.0 billion in 2004 from $1.8 billion in 2003, due to higher average metal prices paid for in purchased feeds. The settlement price for purchased custom feed is based on metal content and the prevailing market prices of the metals at the time of settlement.
26
With the addition of new mine capacity to Noranda's operating base, the Company's net income sensitivity to improvement in metal prices has increased significantly. The following table shows the annualized impact on Noranda's net income from changes in metals prices and the U.S./Canadian dollar exchange rate.
| |
| | Impact on
|
|---|
| | Change in US $/lb.
Price
| | Net income
| | Income
per share
|
|---|
| | ($ millions)
|
|---|
| Copper | | $ | 0.05 | | $ | 29 | | $ | 0.10 |
| Nickel | | $ | 0.50 | | $ | 35 | | $ | 0.12 |
| Zinc | | $ | 0.05 | | $ | 32 | | $ | 0.11 |
| Aluminum | | $ | 0.05 | | $ | 19 | | $ | 0.06 |
| Lead | | $ | 0.05 | | $ | 5 | | $ | 0.02 |
| Exchange rate Cdn$ = US$ | | $ | 0.01 | | $ | 5 | | $ | 0.02 |
| | |
| |
| |
|
Integrated Operations
As an integrated producer of metals, Noranda's operations include mines and metallurgical facilities which provide the Company with maximum flexibility in both minimizing costs and maximizing operating performance by processing its own ores. This integration also reduces the Company's exposure to treatment charge fluctuations and shipping rate volatility on a consolidated basis.
When milling, smelting or refining capacity exceeds the Company's own mine production, Noranda acquires third-party ores to utilize this capacity and realize incremental treatment charges. These treatment charges provide incremental income to the Company and absorb fixed costs at metallurgical sites, with custom milling and refining operations being conducted throughout the Company as capacity allows. Operations conducting custom feed processing of copper and nickel feeds are located in North and South America and Norway. This integration allows Noranda to maintain some of the lowest cash cost operations in the industry. The flexibility of the processing facilities also enables the Company to treat complex ore which may otherwise render a deposit uneconomic due to high treatment costs. The Company also fixes the sulphur content of the ores that it treats at its metallurgical sites and produces sulphuric acid as a marketable by-product, which provides incremental revenues that help reduce cash operating costs at current sulphuric acid price levels.
The price paid to suppliers of these custom feed ores varies with the prevailing price of the metals being treated, and as such, Noranda's exposure to increasing metals prices is primarily based upon its own mine production. Noranda's continued focus on the identification and development of long-life, high-quality copper and nickel mining assets will continue to increase its leverage to copper and nickel. Current metallurgical sites provide a source of treatment charge revenue and act as a hedge for the Company on the fluctuations in market treatment charges.
Integrated cash costs are calculated as follows:
| | Copper
(Integrated)
| | Nickel
(Integrated)
| | Zinc
(Mining)
| | Aluminum (1)
(Smelting)
| |
|---|
| | 2004
| | 2003
| | 2004
| | 2003
| | 2004
| | 2003
| | 2004
| | 2003
| |
|---|
| | $ millions, except as noted
| |
|---|
| Cost of operations, as reported | | $ | 841 | | $ | 710 | | $ | 615 | | $ | 587 | | $ | 158 | | $ | 204 | | $ | 282 | | $ | 263 | |
| Non-mining costs | | | — | | | — | | | — | | | — | | | (73 | ) | | (71 | ) | | — | | | — | |
| By-product and processing credits | | | (613 | ) | | (463 | ) | | (206 | ) | | (144 | ) | | (68 | ) | | (45 | ) | | (76 | ) | | (50 | ) |
| Processing fee on sale of concentrates | | | 125 | | | 82 | | | — | | | — | | | 127 | | | 112 | | | — | | | — | |
| Purchases of raw materials | | | — | | | — | | | — | | | — | | | — | | | — | | | 103 | | | 86 | |
| Other operating and non-cash costs | | | (2 | ) | | (6 | ) | | 106 | | | 25 | | | 72 | | | 31 | | | 12 | | | 7 | |
| | |
| |
| |
| |
| |
| |
| |
| |
| |
| Cash costs — net | | $ | 351 | | $ | 323 | | $ | 515 | | $ | 468 | | $ | 216 | | $ | 231 | | $ | 321 | | $ | 306 | |
| | |
| |
| |
| |
| |
| |
| |
| |
| |
| Volumes — (000s lbs.)(2) | | | 921,900 | | | 798,035 | | | 176,030 | | | 168,609 | | | 684,530 | | | 733,603 | | | 548,900 | | | 543,964 | |
| Cash cost per pound — $(3) | | | 0.38 | | | 0.40 | | | 2.93 | | | 2.78 | | | 0.32 | | | 0.32 | | | 0.58 | | | 0.56 | |
| | |
| |
| |
| |
| |
| |
| |
| |
| |
27
- (1)
- Represents Primary operations only: Aluminum segment cost of operations reported for 2004 totals $420 million (2003 — $388 million), which includes foil processing and other costs of $138 million (2003 — $125 million).
- (2)
- Volumes as shown are based on production, except for Aluminum business, which represent shipments of primary aluminum.
- (3)
- While not defined under generally accepted accounting principles ("GAAP"), this measure is based on practices used in the mining and metals industry. It is not intended to be considered as an alternative to determining "cost of operations" as determined under GAAP.
Copper
The Copper Business is a fully-integrated producer of copper metal and concentrate, precious metals and sulphuric acid. It comprises mostly long-life, low-cost mines located primarily in South America. They include Noranda's interest in the Antamina copper and zinc mine in Peru, the Collahuasi and Lomas Bayas mines in Chile and the Kidd Creek mine in Ontario, Canada. In addition to these mines, the operations include the Altonorte copper smelter in Chile, as well as refining, smelting and recycling facilities in Canada and the U.S. The Copper Business also operates one of the world's largest electronic scrap collection and smelting/refining operations and provides end-of-life electronics disposal services for companies like Hewlett Packard. As discussed previously, there are several potential brownfield and greenfield expansion opportunities which can further increase earnings from this business.
| | 2004
| | 2003
|
|---|
| Revenues — $ millions | | | 3,630 | | | 2,147 |
| Purchased raw materials — $ millions | | | 1,882 | | | 1,067 |
| Operating cash cost** — per pound of copper | | $ | 0.38 | | $ | 0.40 |
| Income generated by operating assets — $ millions | | | 673 | | | 170 |
| Sales and throughput (000 tonnes)* | | | | | | |
| | Copper-in-concentrates | | | 275 | | | 212 |
| | Copper metal | | | 612 | | | 604 |
| | Zinc metal | | | 135 | | | 111 |
| | Zinc-in-concentrates | | | 52 | | | 100 |
| | Sulphuric acid | | | 749 | | | 651 |
| | Concentrate processed | | | 1,810 | | | 1,793 |
- *
- 100% basis except for Collahuasi (44%) and Antamina (33.75%).
- **
- Includes all cash production and selling costs, net of by-product credits, but excludes interest, corporate, research, exploration costs and custom feed profits. Continuing costs incurred during shutdowns or strikes are excluded.
Revenues: For the year, consolidated revenues for the Copper Business were $3.63 billion, an increase of 69% over the $2.15 billion for the same period of 2003. Higher copper sales and metal prices and by-product revenues accounted for the increase as well as increased production levels of copper as expansions at Collahuasi and the completion of the removal of sediment from the high-grade copper zone at Antamina led the increase in production. The realized copper price averaged $1.30/lb. compared to $0.82/lb. in 2003.
Costs: Total Copper Business operating expenses totaled $2,957 million in 2004 versus $1,977 million in 2003. Cost of operations totaled $841 million in 2004 versus $710 million in 2003. Cost of purchased raw materials increased to $1,882 million from $1,067 million, a 76% increase year-over-year due to higher metal prices. In 2004, the operating cash cost of producing a pound of copper was $0.38/lb. versus $0.40/lb. in 2003.
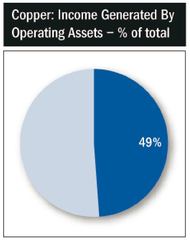
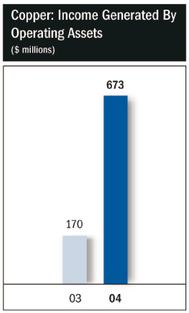
Income generated by operating assets: In 2004, the Copper Business operating income was $673 million compared to $170 million in the same period for 2003. The $503 million increase was mainly attributable to higher realized prices and production volumes.
Production: For 2004, mined copper production totaled 430,391 tonnes compared to 360,602 tonnes respectively, during 2003. Production was higher due to the completion of the Collahuasi expansion and open pit transition project, the removal of lake sediment at the Antamina mine allowing access to better copper grades, and due to the record production at the Lomas Bayas operation.
28
Mined zinc-in-concentrate in 2004 totaled 152,004 tonnes versus 197,950 tonnes in 2003. Zinc concentrate volumes declined due to lower zinc output from the Antamina mine as high-grade copper zones were mined instead.
Refined copper cathode volumes were 491,624 tonnes versus 456,111 tonnes 2003. Refined zinc volumes in 2004 were 121,557 tonnes versus 94,719 tonnes in 2003. The positive copper variance in 2004 reflects significantly higher copper cathode production from the CCR refinery due mostly to higher copper anode production at the Horne smelter.
Nickel
The Nickel Business comprises nickel mines and processing facilities in Sudbury, Montcalm and Raglan, Canada, a refinery in Kristians and, Norway, described as the Integrated Nickel Operations (INO), and a ferronickel operation at Falcondo in the Dominican Republic. Mine concentrate is acquired from both the Company's mining operations and through purchases of custom feeds. The business produces and sells ferronickel and refines and markets nickel, copper, cobalt and significant quantities of precious and platinum group metals. Nickel exploration and new mine development is one of the core growth focuses for the company.
| | 2004
| | 2003
|
|---|
| Revenues — $ millions | | | 1,835 | | | 1,298 |
| Purchased raw materials — $ millions | | | 447 | | | 280 |
| Operating cash cost — per pound of nickel | | $ | 2.57 | | $ | 2.64 |
| Operating cash cost — per pound of ferronickel | | $ | 3.50 | | $ | 3.04 |
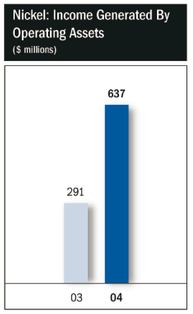
| Income generated by operating assets — $ millions | | | 637 | | | 291 |
| Sales (000 tonnes) — 100% basis | | | | | | |
| | Nickel | | | 71 | | | 79 |
| | Ferronickel | | | 29 | | | 27 |
| | Cobalt | | | 4 | | | 3 |
| | |
| |
|
Revenues: For 2004, consolidated revenues for the Nickel Business were $1.84 billion, an increase of 42% over the $1.30 billion recorded in 2003. At INO, sales volumes of nickel and copper decreased by 10% and 14%, respectively, in 2004 as a result of lower metal deliveries resulting from the strike at Sudbury Operations and reductions from custom shippers. Cobalt sales increased 7% from 2003 levels due to increases in production related to custom feeds. At Falcondo, sales volumes increased 7% to 28,936 tonnes from 27,133 tonnes in 2003. The realized ferronickel price increased 52% in 2004, compared to 2003. Realized nickel prices of $6.40/lb. increased by 45% compared with $4.40/lb. in 2003. Realized cobalt prices increased by 139% versus 2003.
Costs: Total nickel operating expenses totaled $1,198 million in 2004 versus $1,007 million in 2003. Cost of nickel operations totaled $615 million in 2004 versus $587 million in 2003, an increase of $28 million. Cost of purchased raw materials increased from $280 million to $447 million due to higher metal prices. The operating cash cost per pound of mined nickel for all of Falconbridge was $2.93 in 2004, compared with $2.78 in 2003. At INO, in 2004 the operating cash cost of producing a pound of nickel from INO mines was $2.57. The $0.07, or 3%, decrease from 2003 costs was the result of increased mine production and higher by-product credits due to the increase in metal prices which offset the impact of the stronger Canadian dollar, increased costs to access the ore at the Canadian operations and lower ore grades. At Falcondo, operating cash cost per pound of ferronickel was $3.50 in 2004, compared with $3.04 in 2003. The increase in costs was largely due to the increase in the oil price and costs for extra power generation during periods of power plant maintenance. Oil costs rose from $29.42 per barrel in 2003 to $36.63 in 2004.
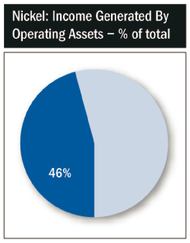
Income generated by operating assets: For 2004, the operating income was $637 million compared with $291 million for 2003. The $346 million increase was mainly due to higher metal prices and lower depreciation and amortization charges, which were offset by lower sales volumes for nickel and copper, increased administrative charges and higher unit costs, again caused in part by the strengthening of the Canadian dollar.
29
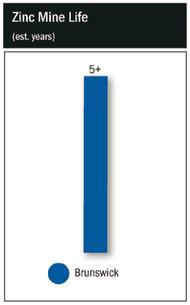
Includes Brunswick Mine only and none of the resources at development projects. | 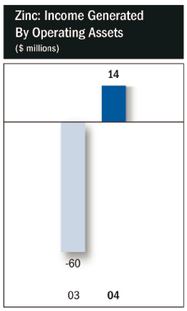 |
Production: Refined nickel production totaled 100,887 tonnes in 2004, compared to 104,410 tonnes in the same period in 2003. During 2004, Sudbury mines nickel production was 22,602 tonnes, compared with 24,143 tonnes in 2003. The reduction in nickel production was attributable to the strike in the first quarter of 2004 and the subsequent ramp-up of production (which reduced the annual production by 3,500 tonnes). For 2004, Raglan nickel-in-concentrate production was 26,552 tonnes, compared with 25,110 tonnes of nickel in 2003. Increased ore tonnages offset the impact of lower ore grades. In Sudbury, smelter production of nickel-in-matte was 52,595 tonnes in 2004 compared with 59,831 tonnes in 2003, largely as a result of the strike at Sudbury and lower concentrate grades. At Nikkelverk, 2004 nickel production of 71,410 tonnes was lower than the 77,183 tonnes produced in 2003 due to lower shipments of material from Sudbury. Nikkelverk cobalt production set a new record at 4,670 tonnes. The Falcondo ferronickel operation increased production by 8% to 29,477 tonnes of nickel in ferronickel compared to 27,227 tonnes in 2003.
Zinc
In 2004, the Zinc Business included the Brunswick mine and the Brunswick lead metallurgical operations (lead smelter, lead refinery and silver refinery), the Bell Allard mine (which was depleted and permanently closed in October), General Smelting (alloy foundry), the NorFalco sulphuric acid marketing operations, sales offices in Independence, Ohio and Zug, Switzerland, and Noranda's 25% interest in the Canadian Electrolytic Zinc refinery held through the Noranda Income Fund. The Zinc Business is a fully-integrated operation that produces and sells zinc and lead concentrates and refines and markets zinc and lead metal and a significant amount of byproduct silver and sulphuric acid.
| | 2004
| | 2003
| |
|---|
| Revenues — $ millions | | | 415 | | | 363 | |
| Purchased raw materials — $ millions | | | 187 | | | 155 | |
| Operating cash cost — per pound of zinc | | $ | 0.32 | | $ | 0.32 | |
| Income generated by operating assets | | | 14 | | | (60 | ) |
| Sales (000 tonnes) | | | | | | | |
| | Zinc-in-concentrates | | | 293 | | | 335 | |
| | Lead metal | | | 83 | | | 60 | |
| | |
| |
| |
Revenues: For the year, consolidated revenues for the Zinc Business increased 14% to $415 million from $363 million in 2003. Sales volumes of zinc-in-concentrate decreased in 2004 by 13% from 292,512 tonnes compared to 335,059 tonnes in 2003, principally due to the closure of the Bell Allard mine in October 2004. Lead metal sales volumes increased in 2004 by 38% to 83,194 from 60,452 tonnes in 2003. The increase in lead metal sales is primarily due to a shorter seasonal shutdown in 2004 versus 2003.
Costs: Total Zinc Business operating expenses totaled $401 million in 2004, a decrease from $423 million in 2003. Cost of zinc operations totaled $158 million in 2004 versus $204 million in 2003, a decrease of $46 million. Cost of purchased raw materials increased from $155 million to $187 million due to higher metal prices. In 2004, the operating cash cost of producing a pound of zinc was $0.32, unchanged from 2003. Costs remain unchanged from the same period last year with higher by-product revenue offsetting increased transportation and smelting charges.
Income generated by operating assets: For 2004, the Zinc Business operating income was $14 million compared with a loss of $60 million for 2003. The $74 million increase was mainly due to higher metal prices, which were offset by lower sales volumes and the negative effect of the stronger Canadian dollar on costs.
30
Production: During 2004, contained zinc in mine production was 366,969 tonnes in 2004, compared to 396,136 tonnes in 2003. Brunswick Mine production was 268,068 tonnes zinc-in-concentrate, compared with 286,457 tonnes zinc-in-concentrate in 2003. The decrease in zinc production was attributable to ore pass operating issues during the fourth quarter of 2004. Bell Allard mine production during 2004 was 98,901 tonnes zinc-in-concentrate, compared with 109,679 tonnes zinc-in-concentrate in 2003. The decrease in 2004 was due to the closure of Bell Allard in October 2004 due to the depletion of reserves and planned closure of the mine. During 2004, Brunswick Smelter consumed 205,473 tonnes of feed, compared to 153,207 tonnes of feed in 2003. Refined lead production totaled 83,829 tonnes in 2004 versus 60,776 tonnes in 2003, an increase of 38% for the year. The increase during 2004 was due to the earlier re-start of the smelter following its seasonal shutdown.
Aluminum
Noranda's aluminum operations consist of a primary aluminum reduction facility, accounting for 10% of aluminum production in the U.S., and four modern aluminum rolling mills, capable of producing a variety of foil and sheet products to fulfill numerous applications. During 2004, the foil operations supplied in excess of 22% of North American demand for foil sheet. In addition to these smelting and rolling mill assets, in 2004, Noranda acquired a 50% interest in the former Kaiser Aluminum Gramercy alumina refinery in Gramercy, Louisiana and the St. Ann bauxite mine in St. Ann, Jamaica. The Gramercy alumina refinery is the primary source of feed for Noranda's primary aluminum smelter located in New Madrid, Missouri. Noranda now has the benefit of being a fully-integrated aluminum producer and has gained full leverage to aluminum prices.
| | 2004
| | 2003
|
|---|
| Revenues — $ millions | | | 935 | | | 686 |
| Purchased raw materials — $ millions | | | 388 | | | 236 |
| Average fabricating spread — per pound of foil | | $ | 0.42 | | $ | 0.44 |
| Operating cash cost — per pound of aluminum | | $ | 0.58 | | $ | 0.56 |
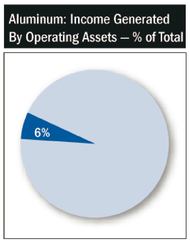
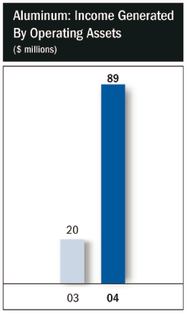
| Income generated by operating assets — $ millions | | | 89 | | | 20 |
| Sales (000 tonnes) | | | | | | |
| | Primary aluminum | | | 249 | | | 247 |
| | Aluminum foil | | | 174 | | | 147 |
| | |
| |
|
Revenues: For the year, consolidated revenues for the Aluminum Business increased 36%, to $935 million from $686 million in 2003. Primary sales volumes increased slightly over 2003. Realized mid-west prices in 2004 increased by 24% to $0.84/lb. from $0.68/lb. in 2003. For the rolled products division, sales were up by 18% for the year. Overall weighted fabrication spreads were down a little over one cent, or 2% from 2003 levels, due entirely to a change in product mix towards heavier-gauge products. This change in product mix also reduced conversion costs by 8% year-over-year.
Costs: Total Aluminum Business operating expenses totaled $846 million in 2004 versus $666 million in 2003. Cost of aluminum operations totaled $420 million in 2004 versus $388 million in 2003, an increase of $32 million. Cost of purchased raw materials increased to $388 million from $236 million due to higher metal prices. For the year, the net operating cash cost at the primary division was $0.58/lb. compared with $0.56/lb. in 2003. Higher power costs in 2004 more than offset the positive impact of higher volumes and improved metal premiums. Unit costs at the rolled products division declined by 8%, due entirely to higher volumes, especially at the Huntingdon West plant.
Income generated by operating assets: For 2004, operating income for the Aluminum Business was $89 million compared with $20 million for 2003. The increase was mainly due to higher metal prices, higher volumes in both the primary and rolled products divisions, and higher value-added margins.
31
Production: For the year 2004, production of primary aluminum was 247,472 tonnes in 2004, compared to 244,044 tonnes in the same period in 2003. For the rolled products operations, shipments were 173,853 tonnes compared with 146,716 tonnes in 2003.
Other Income and Expenses
Interest expense decreased to $119 million in 2004, a decrease of 8% over $129 million in 2003 due to lower average debt levels and interest rates below the levels of 2003.
Corporate and general administration costs as well as research and development costs remained relatively unchanged over 2003 levels, and are expected to decline marginally in the near term as the Company continues to pursue cost reductions.
Minority interest in earnings increased to $297 million in 2004, up from $88 million in 2003 due to the higher contribution to earnings of the Nickel Business unit, which is 58.8% owned by Noranda.
Tax expense increased to $333 million in 2004 reflecting the increased profitability of the Company in 2004, as compared to a tax expense of $20 million on a consolidated basis in 2003.
Pre-tax restructuring costs incurred and gains on sale of investments in 2004 and 2003 are as follows:
For the year ended December 31
| | 2004
| | 2003
| |
|---|
| Gain on alumina contract settlement | | $ | (80 | ) | $ | — | |
| American Racing Equipment impairment charge | | | 50 | | | — | |
| Magnesium closure costs | | | — | | | 33 | |
| Restructuring costs | | | 3 | | | 33 | |
| Gain on sale of units in Noranda Income Fund | | | — | | | (35 | ) |
| Gain on sale of investments and other | | | (6 | ) | | (3 | ) |
| | |
| |
| |
| | | $ | (33 | ) | $ | 28 | |
| | |
| |
| |
The gain on contract settlement recorded in 2004 reflects the fair value at the time of termination of the alumina supply contract in the Company's alumina operations. The amount of the gain was capitalized to the carried value of the assets received and is allotted to capital assets. The contract, originally signed in June 2000 provided the full alumina requirement of the New Madrid smelter until the year 2010 at a price equal to 12.35% of the then prevailing LME price for aluminum. The counterparty to the contract agreed to transfer ownership of the alumina refinery in Gramercy, Louisiana, and a 25% interest in the St. Ann bauxite mine in Jamaica in exchange for cancellation of the contract plus $11.5 million in cash.
Noranda recorded an impairment charge of $50 million against the carried value of the Company's investment in American Racing.
Fourth Quarter 2004 Results
Quarterly Earnings
Net income for the fourth quarter of 2004 was $158 million, or $0.50 per share on a diluted basis compared to $55 million or $0.18 per share on a diluted basis for the same period in 2003. This increase was as a result of significantly higher metal prices realized in the fourth quarter of 2004 versus 2003 offset by the impact of a strong Canadian dollar. Realized copper prices increased to $1.43/lb. in the fourth quarter of 2004 compared with $0.93/lb. realized in the same period of 2003, while nickel prices realized in the fourth quarter of 2004 averaged $6.45/lb. versus $5.57/lb. realized in the fourth quarter of 2003. Zinc prices realized in the fourth quarter of 2004 averaged $0.56/lb. versus $0.47/lb. realized in the fourth quarter of 2003, while realized aluminum prices increased to $0.89/lb. in the fourth quarter of 2004 compared with $0.71/lb. realized in the same period of 2003.
32
| | | Q1
| | Q2
| | Q3
| | Q4
| | 2004
| | Q1
| | Q2
| | Q3
| | Q4
| | 2003
|
| | ($ millions, except per share data)
|
|---|
Results of Operations |
|
|
|
|
|
|
|
|
|
|
|
|
|
|
|
|
|
|
|
|
|
|
|
|
|
|
|
|
|
|
| Revenues | | | 1,653 | | | 1,694 | | | 1,716 | | | 1,915 | | | 6,978 | | | 1,056 | | | 1,112 | | | 1,165 | | | 1,324 | | | 4,657 |
| | |
| |
| |
| |
| |
| |
| |
| |
| |
| |
|
| Cost of operations | | | 467 | | | 539 | | | 515 | | | 573 | | | 2,094 | | | 469 | | | 502 | | | 497 | | | 480 | | | 1,948 |
| Purchased raw materials | | | 711 | | | 749 | | | 705 | | | 840 | | | 3,005 | | | 414 | | | 421 | | | 496 | | | 491 | | | 1,822 |
| Depreciation, amortization and accretion | | | 117 | | | 126 | | | 119 | | | 137 | | | 499 | | | 114 | | | 127 | | | 121 | | | 128 | | | 490 |
| | |
| |
| |
| |
| |
| |
| |
| |
| |
| |
|
| Income generated by operating assets | | | 358 | | | 280 | | | 377 | | | 365 | | | 1,380 | | | 59 | | | 62 | | | 51 | | | 225 | | | 397 |
| Interest expense | | | 25 | | | 36 | | | 31 | | | 27 | | | 119 | | | 38 | | | 36 | | | 33 | | | 22 | | | 129 |
| Corporate and general administration | | | 13 | | | 15 | | | 17 | | | 21 | | | 66 | | | 13 | | | 14 | | | 12 | | | 19 | | | 58 |
| Research, development and exploration | | | 7 | | | 12 | | | 14 | | | 14 | | | 47 | | | 8 | | | 12 | | | 14 | | | 17 | | | 51 |
| Minority interest in earnings of subsidiaries | | | 79 | | | 64 | | | 76 | | | 78 | | | 297 | | | 16 | | | 18 | | | 11 | | | 43 | | | 88 |
| | |
| |
| |
| |
| |
| |
| |
| |
| |
| |
|
| Income (loss) before undernoted | | | 234 | | | 153 | | | 239 | | | 225 | | | 851 | | | (16 | ) | | (18 | ) | | (19 | ) | | 124 | | | 71 |
| (Gain) loss net of restructuring costs and other | | | (5 | ) | | (12 | ) | | 7 | | | (23 | ) | | (33 | ) | | 30 | | | 15 | | | (36 | ) | | 19 | | | 28 |
| Tax expense (recovery) | | | 86 | | | 58 | | | 99 | | | 90 | | | 333 | | | (6 | ) | | (23 | ) | | (1 | ) | | 50 | | | 20 |
| | |
| |
| |
| |
| |
| |
| |
| |
| |
| |
|
| Net income (loss) | | | 153 | | | 107 | | | 133 | | | 158 | | | 551 | | | (40 | ) | | (10 | ) | | 18 | | | 55 | | | 23 |
| | |
| |
| |
| |
| |
| |
| |
| |
| |
| |
|
| Earnings (loss) per common share | | $ | 0.50 | | $ | 0.34 | | $ | 0.43 | | $ | 0.51 | | $ | 1.78 | | $ | (0.18 | ) | $ | (0.08 | ) | $ | 0.04 | | $ | 0.18 | | $ | — |
| | |
| |
| |
| |
| |
| |
| |
| |
| |
| |
|
Copper
Revenues: For the fourth quarter of 2004, consolidated revenues of $1,009 million increased 59% from $633 million in the fourth quarter of 2003. The increase reflects higher average realized copper, zinc and precious metal prices, and higher copper sales volumes, mostly from the Antamina and Collahuasi mines. Total sales of copper during the quarter were 242,627 tonnes versus 233,685 tonnes in the same period in 2003. Increased sales of copper from Antamina and Collahuasi were offset by decreased sales of Altonorte anodes and Horne concentrates. Increased sales of zinc metal from Kidd Creek were offset by decreased sales of zinc-in-concentrate from Antamina. The realized copper price of $1.43/lb. increased by 54% in the quarter compared to $0.93/lb. realized in the same period in 2003.
Costs: Total operating expenses increased to $839 million from $546 million in the fourth quarter of 2003. Cost of operations increased to $239 million from $199 million in the same period last year, while cost of purchased raw materials increased to $534 million from $301 million in the fourth quarter of 2003. Cost of raw materials increased due to the rise in copper prices. The operating cash cost of producing a pound of copper in the fourth quarter of 2004 increased to $0.43/lb. from $0.39/lb. in the fourth quarter of 2003.
Operating income: Operating income for the Copper Business in fourth quarter 2004 increased to $170 million from $87 million a year ago due to the impact of higher copper, zinc and precious metal prices and higher copper sales volumes. Offsetting the stronger revenues were increased costs resulting from the impact of a weaker U.S. dollar on Canadian and South American operating costs.
Production: During the fourth quarter of 2004, copper mine production from Canadian and South American operations totaled 117,450 tonnes, compared to 90,914 tonnes a year ago. Significant increases in mined copper output were achieved at the Antamina and Collahuasi mines. Refined copper production was 133,843 tonnes of copper cathode in the fourth quarter of 2004 versus 130,122 tonnes in the fourth quarter of 2003. Zinc-in-concentrate production at Kidd Creek increased to 30,761 tonnes from 18,095 tonnes in the fourth quarter of 2003, while zinc-in-concentrate production at Antamina decreased to 8,193 tonnes from 31,799 tonnes due to a shift in the mine plan towards higher copper ores.
Nickel
Revenues: For the fourth quarter of 2004, consolidated revenues of $499 million increased from $411 million in the fourth quarter of 2003. Sales volumes of nickel decreased 3% to 19,799 tonnes from 20,468 tonnes in the fourth quarter of 2003. At Falcondo, ferronickel sales volumes increased by 20% to 8,104 tonnes from 6,781 tonnes in the fourth quarter of 2003. Fourth quarter 2004 copper sales volumes of 12,521 tonnes decreased 24% from 16,506 tonnes in the same period a year ago as a result of lower copper production due to lower ore grades from the mines and reduced feed from custom shippers. Cobalt sales volumes increased by 19% to 1,072 tonnes in response to higher deliveries from custom shippers. Realized nickel prices of $6.45/lb. increased by 16% in the quarter compared with $5.57/lb. in the same period in 2003. Realized ferronickel prices of $6.42/lb. increased by 23% in the quarter compared with $5.21/lb. in the same period in 2003. Precious metal revenues increased by $7 million in the fourth quarter of 2004 compared to the same period in 2003.
33
Costs: Total operating expenses increased to $331 million from $270 million in the fourth quarter of 2003. Cost of operations increased to $178 million from $129 million in the same period last year, while cost of purchased raw materials increased to $105 million from $101 million in the fourth quarter of 2003. The operating cash cost per pound of mined nickel for all of Falconbridge (including INO and Falcondo) was $3.05 in the fourth quarter of 2004, compared with $3.06 for the same period in 2003. The operating cash cost of producing a pound of nickel from INO mines, was $2.46. The $0.62/lb., or 20%, decrease from the 2003 costs was the result of increased mine production and higher by-product credits due to the increase in metal prices, which offset the impact of the stronger Canadian dollar, increased costs to access the ore at the Canadian operations and lower ore grades. Falcondo's operating cash cost per pound of fer-ronickel increased by 35% in the fourth quarter of 2004 to $4.17, mainly due to the increase in oil prices and maintenance costs. Oil costs rose from $28.53 per barrel in the fourth quarter of 2003 to $42.34 in the most recent quarter.
Income generated by operating assets: Fourth quarter operating income for the Nickel Business totaled $168 million, compared to $141 million in the fourth quarter of 2003. The $27 million increase was mainly due to the impact of nickel, copper and cobalt prices, and increased cobalt and precious metal sales volumes, which were offset by the impact of lower nickel and copper sales volumes, increased depreciation and amortization charges and higher unit costs, caused in part by the strengthening of the Canadian dollar.
Production: Total mined nickel production was 13,881 tonnes during the quarter versus 11,286 tonnes during the same period in 2003. Sudbury mines production was 5,674 tonnes of nickel and 6,775 tonnes of copper during the fourth quarter of 2004, which was essentially the same as the fourth quarter of 2003. At Raglan, nickel-in-concentrate production in the quarter was 6,683 tonnes and copper production was 1,734 tonnes, compared with 5,616 tonnes of nickel and 1,518 tonnes of copper in 2003. The increases in production were due to the increase in mined ore tonnages, which more than offset the reduced ore grades. At the Sudbury smelter, nickel-in-matte production in the fourth quarter of 2004 increased to 18,053 tonnes from 17,774 tonnes in the same period of 2003, as a result of the treatment of higher concentrate tonnages with lower feed grades. Total refined nickel production was 27,632 tonnes in the fourth quarter of 2004, compared to 27,058 tonnes in the same period in 2003. At Nikkelverk, fourth-quarter refined nickel production level of 20,458 tonnes was essentially the same as in 2003. In the fourth quarter of 2004, Falcondo produced 7,174 tonnes of nickel in ferronickel, an 11% increase from 6,490 tonnes in the fourth quarter of 2003.
Zinc
Revenues: Total zinc revenues increased to $119 million or 53% higher than $78 million recorded during the fourth quarter of 2003. In the fourth quarter of 2004, sales volumes of zinc-in-concentrates decreased 22% to 64,785 tonnes from 82,873 tonnes in the fourth quarter of 2003. The decrease in zinc concentrate sales reflects the closure of the Bell Allard mine in October 2004. Fourth quarter 2004 lead metal sales doubled to 23,139 tonnes from 11,609 tonnes in the same period a year ago, as full smelter production was resumed in the fourth quarter, after a reduced summer outage in 2004 versus 2003. The average realized price per pound of zinc during the fourth quarter was $0.56/lb. versus $0.47/lb. in the same period last year. The average realized price per pound of lead during the fourth quarter was $0.46/lb. versus $0.33/lb. in the same period last year.
34
Costs: Total operating expenses increased to $114 million from $81 million in the fourth quarter of 2003. Cost of operations decreased to $45 million from $47 million in the same period last year, while cost of purchased raw materials increased to $60 million from $17 million in the fourth quarter of 2003. Cost of raw materials increased along with the rise in zinc and lead prices. The operating cash cost per pound of mined zinc was $0.32 in the fourth quarter of 2004, unchanged from $0.33 for the same period in 2003.
Income generated by operating assets: The fourth quarter 2004 operating income of the Zinc Business was $5 million compared with a loss of $3 million for the fourth quarter of 2003. The $8 million increase was due to the impact of higher metal prices and decreased depreciation and amortization charges which were offset by the impact of lower sales volumes, and an unfavourable impact on costs due to the foreign exchange variance caused by the strengthening of the Canadian dollar.
Production: Contained zinc production was 74,886 tonnes in the fourth quarter of 2004, compared to 102,936 tonnes in the same period in 2003. The decrease in sales is primarily attributable to the planned closure of the Bell Allard mine in October and partially due to ore pass availability issues at the Brunswick mine, which have since been resolved. Brunswick mine production was 67,589 tonnes of zinc-in-concentrate during the fourth quarter of 2004 compared to 72,088 tonnes zinc-in-concentrate for the same period of 2003. Bell Allard mine production was 7,297 tonnes of zinc concentrate during the fourth quarter of 2004 compared to 30,848 tonnes zinc-in-concentrate for the same period of 2003.
The Brunswick lead smelter consumed 61,690 tonnes of lead concentrates and secondaries during the fourth quarter of 2004, compared to 38,825 tonnes during the same period in 2003. Lead metal production was 25,892 tonnes in the fourth quarter of 2004, compared to 12,988 tonnes in the same period in 2003. The increased feed consumption and lead metal output at the Brunswick Smelter is due to the earlier re-start of operations following the seasonal shutdown.
Aluminum
Revenues: Total aluminum revenues increased to $257 million or 50% higher than $171 million recorded during the fourth quarter of 2003. Sales volumes of primary aluminum decreased 5% to 61,662 tonnes from 64,795 tonnes in the fourth quarter of 2003. Fourth quarter 2004 rolled products sales volumes of 42,011 tonnes increased by 23% from 34,267 tonnes in the same period a year ago as a result of the continued ramp-up of the new Huntingdon, TN, West plant and strong product demand. The realized primary aluminum price of $0.89/lb. increased by 25% in the quarter compared with $0.71/lb. in the same period in 2003.
Costs: Total operating expenses increased to $228 million from $169 million in the fourth quarter of 2003. Cost of operations decreased to $102 million from $106 million in the same period last year, while cost of purchased raw materials increased to $116 million from $53 million in the fourth quarter of 2003. Cost of raw materials increased along with the rise in aluminum prices. The operating cash cost per pound of primary aluminum metal, net of metal premiums and by-product credits was $0.57 in the fourth quarter of 2004, unchanged from $0.61 for the same period in 2003. The cost per pound at the rolled products division was 20% lower in the fourth quarter of 2004 compared with the same period in 2003.
Income generated by operating assets: Fourth quarter 2004 operating income for the Aluminum Business was $29 million compared with $2 million for the fourth quarter of 2003. The $27 million increase was mainly due to the impact of higher metal prices, higher volumes and increased metal premiums and fabrication margins.
Production: In the fourth quarter of 2004, primary aluminum production of 62,302 tonnes, compared to 60,985 tonnes in the same period in 2003. For the rolled products operations, shipments were 42,011 tonnes for the fourth quarter compared with 34,267 tonnes for the 2003 fourth quarter.
35
Financial Position and Liquidity
Noranda maintains long-term credit arrangements and relationships with a variety of financial institutions and investors in order to facilitate its ongoing access to domestic and international financial markets to meet its funding requirements. Noranda's future financial requirements related to debt maturities, operating costs, the projects currently under development and other capital investments will be funded primarily from a combination of existing cash balances, committed bank lines, operating cash flows, project financings and new borrowings. Given the current outlook for its principal products and operating cash flow, the Company does not foresee issuing equity to enhance liquidity.
Working capital, excluding cash, short-term investments and short-term indebtedness, increased to $1,119 million from $852 million at the end of 2003. During the year, Noranda continued to improve its balance sheet and operating capacity to support its strategic objective of maintaining an investment-grade credit rating. This will allow the Company to benefit more fully from improving fundamentals in the copper and nickel sectors. During 2004, the Company:
- •
- Arranged $295 million of three-year revolving credit facilities with six banks.
- •
- Repaid the $300 million 81/8% debenture maturity.
- •
- Cash and cash equivalents and short-term investments at December 31, 2004 totaled $884 million compared to $630 million at December 31, 2003. In addition to its cash balances, Noranda's liquidity and financial flexibility is augmented by revolving credit facilities. Committed lines of credit at December 31, 2004 totaled $1,112 million of which $246 million had been drawn or utilized. These lines of credit are primarily with various Canadian chartered banks and syndicates of U.S. and international banks. These bank facilities currently have committed terms of up to three years and are unsecured.
Long-term debt, excluding the amount due in less than one year, amounted to $2,638 million at December 31, 2004 compared to $2,893 million a year earlier. The Company and its partially-owned subsidiary currently have $250 million and $600 million, respectively, available for public debt issuance under shelf prospectuses filed in September 2003 and January 2004, respectively. Noranda continues to monitor capital markets worldwide, seeking opportunities to diversify its financing sources. At December 31, 2004, Noranda's consolidated net-debt-to-total-capitalization ratio was 35% compared to 43% at December 31, 2003.
"Net-debt-to-total-capitalization" can be calculated as follows:
| |
| | Dec. 31, 2004
| | Dec. 31, 2003
| |
|---|
| |
| | ($ millions)
| |
|---|
| Long-term debt | | | | $ | 2,638 | | $ | 2,893 | |
| Debt due within one year | | | | | 570 | | | 431 | |
| Cash, cash equivalents and short-term investments | | | | | (884 | ) | | (630 | ) |
| | |
| |
| |
| |
| Net debt | | (1) | | | 2,324 | | | 2,694 | |
| | |
| |
| |
| |
| Interests of other shareholders | | | | | 1,197 | | | 919 | |
| Shareholders' equity | | | | | 3,059 | | | 2,597 | |
| | |
| |
| |
| |
| Stockholders' interests (equity) | | (2) | | | 4,256 | | | 3,516 | |
| | |
| |
| |
| |
| Total capitalization | | (3)=(1)+(2) | | | 6,580 | | | 6,210 | |
| | |
| |
| |
| |
| Net-debt-to-total-capitalization ratio(*) | | (1)/(3) | | | 35% | | | 43% | |
| | |
| |
| |
| |
- (*)
- The measure of "net-debt-to-total-capitalization" is not defined under GAAP. Management believes the presentation of this measure is relevant and useful for investors when assessing the Company's liquidity and its ability for growth and investment. This measure should not be considered an alternative to liquidity as determined under GAAP.
Noranda's long-term public debt ratings at December 31 are noted below:
| | 2004
| | 2003
|
|---|
| Standard & Poor's | | BBB- | | BBB- |
| Moody's | | Baa3 | | Baa3 |
| Dominion Bond Rating Services | | BBB | | BBB |
| | |
| |
|
36
Cash Flows
Cash generated from operations, before net changes in non-cash working capital, totaled $1,468 million in 2004, up from $577 million in 2003. The increase is primarily the result of higher sales and production volumes, lower operating costs and higher metal prices, despite the adverse impact of foreign exchange rates.
Capital investments totaled $666 million in 2004 compared to $489 million in 2003. Major capital expenditures during 2004 included the expansion and transfer of mining operations at the Collahuasi copper mine, the Kidd Creek Mine D underground extension, the Montcalm nickel mine and the Nickel Rim South underground exploration project initiated in early 2004.
Capital investments for 2005 are budgeted to be $681 million. A more detailed discussion is provided on page 24.
In 2004, Noranda's common and preferred share dividend obligations were $165 million compared to $123 million in 2003. The annual common share dividend was Cdn$0.48 per share in 2004 versus Cdn$0.64 per share in 2003.
Significant future obligations of Noranda and its partially-owned subsidiaries are summarized as follows:
| | Payments by year
|
|---|
Nature of obligation:
| | 2005
| | 2006
| | 2007
| | 2008
| | 2009
| | Thereafter
| | Total
|
|---|
| | ($ millions)
|
|---|
| Long-term debt | | $ | 568 | | $ | 353 | | $ | 328 | | $ | 256 | | $ | 83 | | $ | 1,603 | | $ | 3,191 |
| Capital leases | | | 2 | | | 2 | | | 3 | | | 1 | | | 1 | | | 8 | | | 17 |
| Operating leases | | | 29 | | | 23 | | | 18 | | | 14 | | | 9 | | | 21 | | | 114 |
| | |
| |
| |
| |
| |
| |
| |
|
| Total | | $ | 599 | | $ | 378 | | $ | 349 | | $ | 271 | | $ | 93 | | $ | 1,632 | | $ | 3,322 |
| | |
| |
| |
| |
| |
| |
| |
|
Metal Markets
In 2004, non-ferrous base metal prices rose significantly across all metals due to a similar combination of factors. Reasons behind the substantial increase in prices included strong current market fundamentals and future market outlooks, lack of immediately available new supply, the impact of the depreciated U.S. dollar on commodity prices and, lastly, bullish market sentiments shared by virtually all market participants and investment funds. Front and centre again was the double-digit economic growth recorded in China and that country's continued strong demand for metal concentrates and refined metals.
Early in the year, metal prices were temporarily affected by China's tightening of its credit policy and nervousness over the impact this might have on capital investment and demand for raw materials. But the effects of this policy proved to be temporary and metals markets had regained their bullishness by the fourth quarter. Nonetheless, high spot prices for raw materials as well as the rising cost and constrained availability of power combined to limit electricity-intensive metal production by Chinese metal refineries.
Strong supply/demand fundamentals were witnessed by the magnitude of the declines in exchange stocks and the significant rise in physical delivery premiums in all geographic markets. The continuation of a synchronized global economic recovery allowed the base-metals industry to record its highest prices across the board in many years.
China, India and other developing Asian economies should continue to be the main drivers of growth in global demand for metals in the foreseeable future, with their ongoing investments in basic infrastructure and surging domestic demand for consumer products and motor vehicles. Indeed, strong demand from these economies should underpin above-average growth rates for metals consumption over the next few years.
There has been some concern that the impact of the rise in oil prices, combined with inflated currency values in certain countries, could pose a threat to continued global economic growth. However, despite those potential dampers, low inventories of raw materials, a lack of immediately developable large new mines, tightening supplies of finished metals and current robust demand provide optimism for metal market outlooks to remain very positive in 2005.
Copper Market
After breaking through the $1.00/lb. level at the end of 2003, the copper price continued to rise steadily, reaching a high of $1.41/lb. in early April. Copper prices then retracted to the $1.20 - $1.30/lb. range until late September, after which they regained momentum, rising to a high of $1.49/lb. at year end. The average LME cash-settlement price for 2004 was $1.30/lb., 60% above the average price of $0.81/lb. in 2003.
37
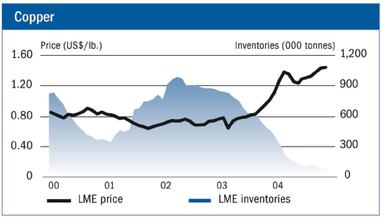
In 2004, the copper market was characterized by extraordinarily strong global consumption growth that, despite supply growth, caused the supply/demand deficit to exceed one million tonnes. Global copper consumption is forecast to have grown a hefty 8.7%, as Western consumption staged a recovery. Chinese consumption growth, having receded from the previous year, still grew at a very robust 18% year-over-year.
During the first few years of the decade, when prices were significantly lower, copper producers exhibited discipline and curtailed copper mine and refinery output. However, the rapid rise in copper prices, which began in late 2003, has led to the restart of de-activated production as well as the emergence of new brownfield and greenfield projects. Copper mine production rose sharply in 2004, spurred by the combination of mine restarts and expansion projects. An estimated 865,000 tonnes of additional mined production entered the market in 2004, mostly from brownfield expansions. Despite the increased mine production, refinery utilization rates still were constrained at around 85%, as a significant portion of the additional mined production was absorbed into concentrate pipelines and smelter stock replenishments.
Despite the increases on the supply side, the strong demand for copper metal outpaced the additional supply, forcing consumers and merchants to draw down physical stocks and exchange stocks in order to fulfill their needs. By year end LME stocks decreased 384,000 tonnes to 49,000 tonnes. Total LME, Comex and Shanghai exchange stocks decreased by 672,000 tonnes over the course of the year.
Nickel Market
After moving above the $4.00/lb. level in the second half of 2003, the nickel price continued to rise and peaked at $8.06/lb. in early January of 2004. For the balance of the year, nickel prices remained volatile, oscillating within a range of $4.78/lb. to $7.53/lb., breaking the trend of the previous decade when the nickel price managed to stay above the $4.00/lb. level only briefly. The average LME cash-settlement price for 2004 was $6.27/lb., 44% above the average price of $4.37/lb. for 2003.
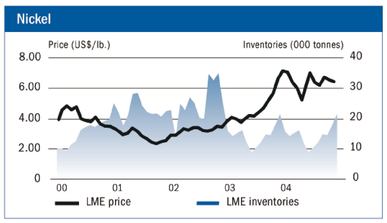
The surge in nickel prices was driven by constrained supply of both primary nickel and stainless steel scrap and strong demand from the stainless-steel sector, particularly in China.
Stainless steel production grew an estimated 8% in 2004. Strong market fundamentals were further supported by investment-fund interest and activity. A continued strengthening of the global economy bolstered other nickel end-use sectors as well, including the high-performance nickel alloys used in jet-engine turbines.
By the start of summer, already low LME nickel inventories fell to critical levels just below 8,000 tonnes. High prices and tight availability caused Chinese traders and consumers to begin de-stocking and also resulted in increased quantities of stainless steel scrap appearing on the market. Some stainless steel producers, particularly in Asia, shifted their production focus onto ferritic grades of stainless steel and/or grades with lower nickel content. This action alleviated the pressure on a tight primary nickel supply and caused the forecast deficit for 2004 to be reduced to 5,000 tonnes from an initial forecast of 25,000 tonnes. LME inventories began to reflect this increased availability, as a steady trickle of small warehouse deposits brought the exchange stocks back up to 20,892 tonnes by the end of the year. At December 31, 2004, LME nickel inventories had declined by 3,180 tonnes from the beginning of the year.
Zinc Market
In 2004, LME zinc prices rose from $0.46/lb. at the beginning of the year to a high of $0.58/lb. on the very last day of the year. Prices first peaked in early March at $0.52/lb. and then eased back to the year's low of $0.43/lb. in September. Prices began to rise strongly again in the fourth quarter, as market analysts began to believe that the projected supply/demand deficit had drawn out most of the unreported, off-exchange stocks. The LME cash-settlement zinc price averaged $0.475/lb. in 2004, a 27% increase over the average of $0.375/lb. in 2003.
38
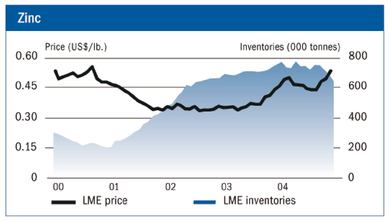
Historically low zinc prices over the past few years led to the depletion and closure of older, uneconomic mines, with the result that mine concentrate availability became very tight. The past 24-month recovery in global economic activity and industrial output led to a resurgence in zinc demand, especially from the steel galvanizing sector. Leading all regions was China, where zinc demand rose approximately 14% in 2004. Demand for zinc also rebounded strongly in the United States, again spurred primarily by the steel sector. Over the past four years, significant capacity and ownership rationalization has contributed to a comeback by the U.S. steel industry and capacity utilization rates began to surge again in 2004.
While smelting capacity has continued to expand, mainly in China, actual refined zinc production is forecast to have increased by less than 2% last year. In China, a tight global market for zinc concentrates, increased electricity costs and frequent electricity shortages, combined with rising domestic demand, resulted in that country becoming a net importer of zinc metal after many years of leading the world in zinc exports. At the beginning of 2004, zinc surpluses accumulated in previous years had raised LME stocks to 740,000 tonnes. By April, off-exchange stocks that continued to be deposited in LME warehouses caused reported inventories to peak at 787,000 tonnes. All that while, though, smaller but steady outflows of the metal continued on a daily basis. By the beginning of the summer, the trend to increased LME zinc stocks had been reversed. LME warehouse stocks subsequently declined to 629,000 tonnes by December 31, a reduction of 111,000 tonnes from the previous year end. The global refined zinc supply/demand balance is estimated to have been in deficit by 200,000 tonnes in 2004.
Aluminum Market
The LME aluminum price moved steadily higher throughout 2004, from $0.73/lb. in January to a near ten-year high of $0.89/lb. by December. The rise in prices was fairly constant throughout the year. The LME cash-settlement aluminum price averaged $0.78/lb. in 2004, a 20% increase over the average of $0.65/lb. in 2003.
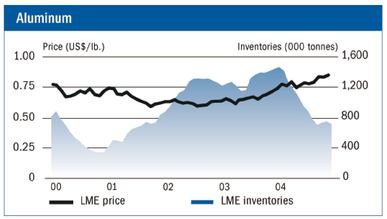
Aluminum's supply/demand fundamentals improved significantly in 2004. Market surpluses of the past few years finally were reversed, with a deficit of more than 450,000 tonnes forecast for 2004. Most of the improvement was led by increased demand in China and the United States. Other major industrial economies demonstrated somewhat lesser — but still positive — rates of demand growth. Production increases have been unable to keep pace with demand growth as both power and alumina costs rose significantly during the year. Smelter strikes also impacted production, especially in Canada. LME inventories began 2004 with 1.4 million tonnes in warehouse, but by year's end this stockpile had decreased more than 50% to 695,000 tonnes. This decline in stocks and the continued depreciation of the U.S. dollar added further support to aluminum prices throughout the year.
Both the Chinese and U.S. economies are expected to support strong demand again during 2005. Effective January 1, 2005, China was to begin applying an export tax on aluminum, copper and nickel exports. Given that the country has been a significant exporter of aluminum, the export tax should curtail the growth of Chinese aluminum production and exports — and could possibly cause inefficient Chinese producers to close or consolidate. These supply/demand fundamentals coupled with a weak U.S. dollar should continue to benefit aluminum prices over the coming year.
39
Off-Balance Sheet Arrangements
Noranda does not have any unconsolidated affiliates. The Company does not enter into material off-balance sheet arrangements with special purpose entities in the normal course of business. Its only significant off-balance sheet arrangements are the Canadian dollar expenditure hedges discussed under the "Financial Instruments and other Instruments" section of this document.
Transactions with Related Parties
Related-party transactions for the year ended 2004 and the fourth quarter of 2004 are summarized as follows:
Year ended December 31, 2004:
Related Party
| | Description
| | Revenue
| | Product
Revenue
| | Service
Purchases
| | Receivables
| | Payables
|
|---|
| |
| | ($ millions)
|
|---|
| Noranda Income Fund | | Processing & administration agreement | | 127 | | 56 | | — | | 27 | | — |
| Noranda Income Fund | | Trading activity | | 5 | | — | | 29 | | 1 | | 8 |
| Antamina | | Trading activity | | — | | — | | 159 | | — | | 42 |
| Other Affiliates | | Power supply contract | | — | | — | | 127 | | — | | — |
| Other Affiliates | | Trading activity | | — | | — | | 3 | | — | | — |
Quarter ended December 31, 2004:
Related Party
| | Description
| | Revenue
| | Product
Revenue
| | Service
Purchases
| | Receivables
| | Payables
|
|---|
| |
| | ($ millions)
|
|---|
| Noranda Income Fund | | Processing & administration agreement | | 35 | | 17 | | — | | 27 | | — |
| Noranda Income Fund | | Trading activity | | 3 | | — | | 7 | | 1 | | 8 |
| Antamina | | Trading activity | | — | | — | | 59 | | — | | 42 |
| Other Affiliates | | Power supply contract | | — | | — | | 31 | | — | | — |
| Other Affiliates | | Trading activity | | — | | — | | 1 | | — | | — |
Critical Accounting Estimates
Management is required to make estimates in preparing its financial statements in conformity with generally accepted accounting principles. These estimates affect the reported amounts of assets and liabilities and the disclosure of contingent assets and liabilities at the date of the financial statements and the reported amounts of revenues and expenses during the reporting period. Changes to these estimates would result in material changes to these line items. The critical accounting estimates made by Noranda relate to our accounting for the following items:
- •
- Property, plant and equipment
- •
- The determination of mineral reserves
- •
- Impairment assessments of long-lived assets
- •
- Amortization of property, plant and equipment
- •
- Employee future benefits
- •
- Asset retirement obligations
- •
- The determination of taxes
Property, plant and equipment
Included in Operating capital assets of $4.9 billion at December 31, 2004, was a property, plant and equipment carrying value of $4.2 billion. This represents 86% of the book value of the asset base. As such, the estimates used in accounting for property, plant and equipment and the related depreciation and amortization charges are critical and have a material impact on the Company's financial condition and earnings. Property, plant and equipment and related capitalized interest and development and pre-production expenditures are recorded at cost and are subject to impairment testing as discussed below.
40
Determination of mineral reserves
One of the most significant estimates which impacts the accounting for property, plant and equipment and the related depreciation and amortization, is the estimate of proven and probable mineral reserves. The process of estimating reserves is complex; requiring significant assumptions, estimates and decisions regarding economic (i.e. metal prices, production costs, and exchange rates), engineering, geophysical and geological data. A material revision to existing reserve estimates could occur because of changes to any of these inputs. Changes in reserves could result in impairment of the carrying amount of property, plant and equipment and a change in amortization expense.
Impairment assessments of long-lived assets
We review and evaluate our long-lived assets for impairment when events or changes in circumstances indicate that the carrying amount may not be recoverable. In 2004, an asset impairment charge of $50 million was realized with respect to a wholly-owned subsidiary, American Racing Equipment, a wheel manufacturing subsidiary located in the United States. Asset impairment is considered to exist if the total estimated future cash flows on an undiscounted basis are less than the carrying amount of the asset. An impairment loss is measured and recorded based on recoverable minerals, expected commodity prices (considering current and historical prices, price trends and related factors), production levels, capital and reclamation costs, and are all based on detailed life-of-mine plans. The term "recoverable minerals" refers to the estimated amount of metal that will be obtained from proven and probable mineral reserves, after taking into account losses during ore processing and treatment. Significant management judgment is involved in estimating these factors, which include inherent risks and uncertainties. The assumptions Noranda uses are consistent with its internal planning. Management periodically evaluates and updates the estimates based on the conditions that influence these factors. The variability of these factors depends on a number of conditions, including uncertainty about future events, and thus accounting estimates may change from period to period. If other assumptions and estimates had been used in the current period, the asset balances could have been materially impacted. If management uses different assumptions or if different conditions occur in future periods, future operating results could be materially impacted.
In estimating future cash flows, assets are grouped at the lowest levels for which there are identifiable cash flows that are largely independent of future cash flows from other asset groups, taking into consideration movements of intermediate products to ensure the utilization of available capacity across our operations. All assets at a particular operation are considered together for purposes of estimating future cash flows.
Amortization of property, plant and equipment
The Company generally depreciates plant and equipment on a straight-line basis over the lesser of their useful service lives or the lives of the producing mines to which they relate. Mine facilities are depreciated over the estimated lives of the mines based on the unit of production basis. Depletion of resource properties is provided over the estimated lives of the resources recoverable from the properties on the unit of production basis. Development and pre-production expenditures, together with certain subsequent capitalized development expenditures are amortized over periods not exceeding the lives of the producing mines and properties.
The most critical estimates which impact the above accounting policy are the estimated quantities of proven and probable mineral reserves which are the underlying bases for the calculation of the depletion of resource properties using the unit of production method. Changes in the quantity of reserves would result in changes in amortization expense in the periods subsequent to the revision.
Employee future benefits
Assets are valued at current market value. The expected return on plan assets, currently 7%, is based on current bond yields and expected long-term rate of return on equities. The long-term rate of return on assets assumption is reviewed on an annual basis.
41
Liabilities are determined as a present value of future anticipated cash flows using a discount rate based on corporate AA bond yields at the valuation date and an inflation expectation consistent with the corporate AA bond yield curve. Differences between the estimated future results and actual future results are amortized (to the extent that the cumulative experience gain or loss is in excess of the permitted 10% corridor under Canadian GAAP) over the expected average remaining service life of the active members (EARSL). This 10% corridor represents 10% of the greater of the post-retirement benefits obligations and the fair value of plan assets. The return on assets assumption and the discount rate, salary and inflation assumptions used to value the liabilities are reviewed annually and are determined based on a consistent framework from year-to-year. The most significant risk is that the assumption will prove to be either too high or too low in the long term. It is reasonable to assume that there will be a significant variation between the assumptions (which are set within the framework of a long-term commitment) and actual experience in any one year, but are expected to produce an appropriate reflection of costs over the long term.
For post-employment benefits other than pensions, the discount rate is the same as for pensions. The inflation rate assumed for medical costs is based on our history of healthcare spending. The assumption for the ultimate healthcare trend rates relates to the overall economic trends.
We currently estimate that a 0.5% increase or decrease in the return on assets assumption would result in a corresponding $9 million increase or decrease in annual pension expense. Changes to the return on asset assumption would have no significant effect on funding requirements, as our contributions are primarily determined based on the applicable Canadian regulatory solvency funding requirements. Under this valuation methodology, liabilities for solvency valuation are based on market bond yields and the excess of liabilities over assets must be amortized over a five-year period. We estimate that a 0.5% increase or decrease in the discount rate assumption would result in a corresponding $4 million increase or decrease in the pension expense.
Asset retirement obligations
As a result of our mining activities, we incur legal obligations associated with the retirement of tangible long-lived assets, from the acquisition, construction, development or normal operations of those assets, which an entity is required to settle as a result of an existing or enacted law or contract. CICA 3110, which was adopted January 1, 2004, requires that, when a legal obligation is incurred, we record the fair value of our estimated asset retirement obligations and a corresponding deferred charge presented as an asset grouped with property plant and equipment. The liabilities are accreted to full value over time through a charge to earnings. The asset is depreciated over the useful life of the associated long-lived asset on a straight-line basis. The fair value of the obligation as of December 31, 2004 was $436 million.
The fair value of these obligations are determined by discounting the projected cash flows required to settle the legal obligations at our credit adjusted risk free interest rate over the time periods over which the obligations were incurred. The future cash flows required to settle the obligations were determined by detailed engineering and environmental reviews assuming the most probable outcome based on present facts, circumstances and legislation.
Critical estimates and judgments were made by management in the determination of the fair value of our obligations. Cash outflows to settle these obligations will be incurred during periods ranging from one to 62 years. Due to the combined effect of the uncertainty associated with such extended time periods, the estimated discount and inflation factors and potential changes to applicable legislation, the fair value of our asset retirement obligations could materially change from period-to-period.
Income and mining taxes
The provision or relief for income taxes is calculated based on the expected tax treatment of transactions recorded in our consolidated financial statements. The objectives of accounting for income and mining taxes are to recognize the amount of taxes payable or refundable for the current year and deferred tax liabilities and assets for the future tax consequences of events that have been recognized in our consolidated financial statements or tax returns. In determining both the current and future components of income and mining taxes, we interpret tax legislation in a variety of jurisdictions as well as make assumptions about the expected timing of the reversal of future tax assets and liabilities. If our interpretation differs from those of tax authorities or if the timing of reversals is not as anticipated, the provision or relief for income and mining taxes could increase or decrease in future periods. In estimating deferred income and mining tax assets, a valuation allowance is determined to reduce the future income tax assets to the amount that is more likely than not to be realized.
42
Changes in Accounting Policies Including Initial Adoption
Asset retirement obligations
Under the previous standard, costs related to ongoing site restoration programs were expensed when incurred. A provision for mine closure and site closure costs was charged to earnings during the life of the operations. Under the new standard, a capital asset and corresponding long-term liability equal to the present value of the legal obligation for asset retirement, at the date that the obligation arose is recorded. Provisions recorded under the prior standard are reversed to retained earnings. The capital asset is depreciated and charged to earnings on a straight-line basis over the life of the related asset. Interest on the obligation is accreted and charged to earnings. This standard is applied retroactively with restatement of prior years.
As of January 1, 2003, the cumulative impact of the adoption of the standard was to decrease retained earnings by $27 million, increase capital assets by $70 million, increase the asset retirement obligation by $97 million, decrease future income taxes by $5 million and increase interest of other shareholders by $5 million. The adoption of the new standard reduced net income by $11 million for the year ended December 31, 2003.
Hedging relationships
As of January 1, 2004, the Company adopted CICA guideline AcG 13, which establishes new standards for when hedge accounting may be applied. Under the provisions of the standard, the Company's interest rate hedge positions and certain energy price hedges were not eligible for hedge accounting. As a result of the implementation of this standard, on January 1, 2004 Noranda recorded a deferred mark-to-market gain of $27 million on its interest rate hedges while recording a long-term receivable and long-term payable of $67 million and $40 million, for those contracts in a gain and loss position, respectively. During the year ended December 31, 2004 $7 million of this deferred gain was amortized into income as an adjustment of interest expense.
Impending accounting changes
A discussion of impending accounting changes has been included in note 19 to the consolidated financial statements.
Financial Instruments and Other Instruments
Noranda uses financial and other instruments in the following instances:
Foreign currency exposure
Noranda uses forward foreign exchange and option contracts to hedge the effect of exchange rate changes on identifiable foreign currency exposures. Noranda may hedge up to 50% of its current year Canadian dollar operating cost for the next two years and 25% of the subsequent three years. A summary of these positions is tabled below:
| | (Positions are in millions of Cdn$, gain/loss are in millions of US$)
|
|---|
| | 2005
| | 2006 and beyond
| | Totals as at December 31, 2004
|
|---|
| | Amount
| | Rate
| | Amount
| | Rate
| | Amount
| | Rate
| | Unrealized
Gain
| | Realized
Gain
|
|---|
| Noranda Inc. | | $ | 224 | | 1.5014 | | $ | 12 | | 1.5157 | | $ | 236 | | 1.5022 | | $ | 39 | | $ | 24 |
| Falconbridge* | | $ | 274 | | 1.3835 | | | — | | — | | $ | 274 | | 1.3835 | | $ | 30 | | $ | 53 |
| | |
| |
| |
| |
| |
| |
| |
| |
|
| Total | | $ | 498 | | 1.4366 | | $ | 12 | | 1.5157 | | $ | 510 | | 1.4385 | | $ | 69 | | $ | 77 |
| | |
| |
| |
| |
| |
| |
| |
| |
|
- *
- Falconbridge's totals include gains/(losses) on foreign exchange option contracts.
43
Noranda may enter into futures and forward contracts for the purchase or sale of currencies not designated as hedges. These contracts are carried at estimated fair values and gains or losses arising from the changes in the market values of these contracts are recognized in the earnings of the period in which the changes occur.
Commodity price exposure
Generally, Noranda does not hedge the price it realizes on the sale of its own production and accepts realizations based on market prices prevailing around the time of delivery of metals to customers. Under certain circumstances, Noranda enters into futures and option contracts to hedge the effect of price changes on a portion of the raw materials it purchases on a custom processing or resale basis. Gains and losses on these contracts are reported as a component of the related transactions. Designated contracts meeting the definition for hedge accounting under GAAP are not recorded. Noranda may also enter into futures and forward contracts for the purchase or sale of commodities not designated as hedges. These contracts are carried at estimated fair values and gains or losses arising from the changes in the market values of these contracts are recognized in the earnings of the period in which the changes occur.
Interest rate management
Noranda also enters into interest rate swap agreements, including foreign exchange cross-currency swaps, to modify the interest characteristics of its outstanding debt. The differential to be paid or received, for interest rate swaps for which we receive hedge accounting, is accrued and recognized as an adjustment to interest expense related to the debt. A summary of these positions is tabled below:
Interest rate swaps (notional principal amount in $ millions)
| | Total
|
|---|
| Maturity (2005) | | $ | 400 |
| Maturity (2006) | | | 325 |
| Maturity (2008)(1) | | | 136 |
| Maturity (2011) | | | 300 |
| Maturity (2012) | | | 350 |
| Maturity (2015) | | | 500 |
| Fair value(2) | | | 86 |
| | |
|
- (1)
- Includes a cross-currency interest rate swap (with a notional amount of $111.3 million) designated as a hedge of a Canadian dollar debenture. The total fair value of this instrument at December 31, 2004 was $46.3 million of which $34.1 million related to the currency component of the swap and $12.2 million related to the interest component.
- (2)
- Includes the fair value of $34.1 million related to the cross-currency interest rate swap discussed above.
Risk Factors
Fluctuating Metal Prices
Noranda's earnings are affected by fluctuations in the prices of the metals it produces. Their prices are subject to volatile price movements over short periods of time. Noranda generally does not hedge prices of the metals we produce. Market prices can be affected by numerous factors beyond our control, including expectations for inflation, speculative activities, relative exchange rates to the U.S. dollar, production activities of our competitors, global and regional demand and supply, political and economic conditions including availability of subsidies and tax incentives to our competitors and production costs in major producing regions. The prices for copper, nickel, zinc, aluminum or other metals produced by us may decline significantly from current levels. A reduction in the prices of one or more of these metals could materially adversely affect the value and amount of our reserves and our business, financial condition, liquidity and operating results.
Mining and Processing Risks
The business of mining and processing of metals is generally subject to a number of risks and hazards, including unusual or unexpected geological conditions, ground conditions, phenomena such as inclement weather conditions, floods and earthquakes and the handling of hazardous substances and emissions of contaminants. Such risks and hazards could result in personal injury or death, damage to, or destruction of, mineral properties, processing or production facilities or the environment, monetary losses and possible legal liability. Noranda's business, financial condition, liquidity and operating results could be materially adversely affected if any of these developments were to occur.
44
Although Noranda maintains insurance which Noranda believes is consistent with mining industry practice to the extent available to cover some of these risks and hazards, no assurance can be given that such insurance will continue to be available, or that it will be available at economically feasible premiums. Noranda's property, business interruption and liability insurance may not provide sufficient coverage for losses related to these or other risks or hazards. In such event, Noranda's business, financial condition, liquidity and results of operations could be materially adversely affected.
Environmental Risks
Environmental legislation affects nearly all aspects of our operations worldwide. This type of legislation requires Noranda to obtain operating licences and imposes standards and controls on activities relating to mining, exploration, development, production, closure and the refining, distribution and marketing of copper, nickel, zinc and other metals products. Environmental assessments are required before initiating most new products or undertaking significant changes to existing operations. Compliance with environmental legislation can require significant expenditures, including expenditures for clean-up costs and damages arising out of contaminated properties. In addition to current requirements, Noranda expects that additional environmental regulations will likely be implemented to protect the environment and quality of life, given issues of sustainable development and other similar requirements which governmental and supragovernmental organizations and other bodies have been pursuing. Some of the issues currently under review by environmental regulatory agencies include reducing or stabilizing various emissions, including sulphur dioxide and greenhouse gas emissions, mine reclamation and restoration, and water, air and soil quality and absolute liability for spills and exceedances.
Canada ratified the Kyoto Protocol to the United Nations Framework Convention on Climate Change in late 2002. The protocol will enter into force in February 2005. Various levels of government in Canada are developing a number of policy measures in order to meet Canada's emission reduction obligations under the protocol. While the impact of the protocol and measures cannot be quantified at this time, the likely effect will be to increase costs for fossil fuels, electricity and transportation, restrict industrial emission levels, impose added costs for emissions in excess of permitted levels and increase costs for monitoring, reporting and financial accounting. Compliance with these initiatives could have a material adverse effect on our business, financial condition, liquidity and operating results.
Further changes in environmental laws, new information on existing environmental conditions or other events, including legal proceedings brought based upon such conditions or an inability to obtain necessary permits, could have a material adverse effect on product demand, product quality and methods of production and distribution or could require increased financial reserves or compliance expenditures or otherwise have a material adverse effect on Noranda's business, financial condition, liquidity and operating results.
Failure to comply with environmental legislation may result in the imposition of fines and penalties, liability for clean-up costs, damages and the loss of important permits. There can be no assurance that Noranda will at all times be in compliance with all environmental regulations or that steps required to bring us into compliance would not materially adversely affect Noranda's business, financial condition, liquidity or operating results.
In view of the uncertainties concerning future removal and site restoration costs on Noranda's properties, the ultimate costs for future removal and site restoration to Noranda could differ from the amounts estimated. The estimate for this future liability is subject to change based on amendments to applicable laws and legislation, the nature of ongoing operations and technological innovations. Future changes, if any, due to their nature and unpredictability, could have a significant impact and would be reflected prospectively as a change in an accounting estimate. In addition, regulatory authorities in various jurisdictions around the world may require Noranda to post financial security to secure in whole or in part future reclamation and restoration obligations in such jurisdictions. In some instances, Noranda has already provided this security. In other instances, such security may be required to be posted upon the occurrence of certain events, including if Noranda ceases to maintain a minimum investment grade credit rating, if the regulatory authority ceases to accept alternative forms of comfort to secure the obligation or as a property nears the end of its operation. Although the posting of this security does not increase the future reclamation and restoration costs (other than costs associated with posting such security), a portion of Noranda's credit may be required to back up these commitments, which could adversely affect Noranda's liquidity.
45
Labour Relations
Collective agreements covering our unionized employees at CEZ, Matagami, CCR (Plant workers), Noranda Recycling — Roseville (two agreements), Nikkelverk, Collahuasi, Altonorte and American Racing Equipments were all renewed in 2004. At Sudbury, a collective agreement was signed with the CAW after a three-week strike in February 2004. The collective agreement covering the Office, Clerical & Technical employees at Falconbridge's Sudbury Operations was renewed on February 28, 2004. Bargaining is currently ongoing for the renewal of the collective agreements at CCR (Security Guards only).
Three collective agreements will expire in 2005. The contract covering the production and maintenance employees at Norandal's Newport facility will expire on May 31, 2005. The contract covering the production and maintenance employees at the Kidd Metallurgical site will expire on September 30, 2005. The contract covering the production and maintenance employees at Falcondo will expire on November 30, 2005.
Collective agreements covering our unionized hourly employees and workers at Brunswick Mine, Brunswick Smelter, Brunswick Smelter Bulk Handling, General Smelting, Horne Smelter, Raglan Operations, Nikkelverk, Lomas Bayas, Altonorte, Antamina, CCR (Production), CCR (Security), Noranda Recycling — Roseville (two agreements), Sudbury (Production & Maintenance), Sudbury (OCT), American Racing, New Madrid and the aluminum foil operation at Salisbury are currently in place and will expire between 2006 and 2008.
Uncertainty of Reserve Estimates and Production Estimates
Noranda's reported mineral reserves as of December 31, 2004 are estimated quantities of proven and probable ore that, under present and anticipated conditions, can be legally and economically mined and processed by the extraction of their mineral content. Noranda determines the amount of our mineral reserves in accordance with the requirements of the applicable Canadian securities regulatory authorities and established mining standards. Noranda does not use outside sources to verify our reserves. The volume and grade of reserves actually recovered and rates of production from Noranda's present mineral reserves may be less than geological measurements of the reserves. Market price fluctuations in nickel, copper, other metals and exchange rates, and changes in operating and capital costs, may in the future render certain mineral reserves uneconomic to mine. In addition, short-term operating factors relating to the mineral reserves, such as the need for orderly development of orebodies or the processing of new or different ore grades, may cause mineral reserves to be modified or Noranda's operations to be unprofitable in any particular fiscal period.
No assurance can be given that the indicated amount of ore will be recovered or that it will be recovered at the prices assumed by Noranda in determining mineral reserves. Mineral reserve estimates are based on limited sampling and, consequently, are uncertain because the samples may not be representative of the entire orebody. As more knowledge and understanding of the orebody are obtained, the reserve estimates may change significantly, either positively or negatively.
Noranda prepares estimates of future production for particular operations. These production estimates are based on, among other things: reserve estimates; assumptions regarding ground conditions and physical characteristics of ores, such as hardness and presence or absence of particular metallurgical characteristics; and estimated rates and costs of mining and processing. Noranda's actual production may vary from estimates for a variety of reasons, including: actual ore mined varying from estimates of grade, tonnage, dilution and metallurgical and other characteristics; short-term operating factors relating to the mineral reserves, such as the need for sequential development of orebodies and the processing of new or different ore grades; risks and hazards associated with mining; natural phenomena, such as inclement weather conditions, floods, and earthquakes; and unexpected labour shortages or strikes. No assurance can be given that production estimates will be achieved. Failure to achieve production estimates could have a material adverse impact on Noranda's future cash flows, earnings, results of operations and financial condition.
46
Exchange Rate Fluctuations
Fluctuations in currency exchange rates, principally the Canadian/U.S. dollar exchange rate and, to a lesser extent, Chilean Peso, Norwegian Kroner and Euro exchange rates against the U.S. dollar, can significantly impact Noranda's earnings and cash flows. These exchange rates have varied substantially over time, including over the last five years. Most of Noranda's revenues and debt are denominated in U.S. dollars, whereas most of the operating costs at Noranda's Canadian sites are incurred in Canadian dollars and Nikkelverk's costs are incurred in Norwegian Kroner. Noranda has been reporting its financial results in U.S. dollars since July 1, 2003. Fluctuations in exchange rates between the U.S. dollar and the Canadian dollar and between the U.S. dollar and other currencies may give rise to foreign currency exposure, either favourable or unfavourable, which may in the future materially impact Noranda's financial results. Noranda, from time to time, may hedge a portion of its currency requirements to limit any adverse effect of exchange rate fluctuations with respect to Noranda's Canadian dollar and other costs, but there can be no assurance that such hedges will eliminate the potential material adverse effect of such fluctuations.
Interest Rate and Counterparty Risk
Noranda's exposure to changes in interest rates results from investing and borrowing activities undertaken to manage Noranda's liquidity and capital requirements. Noranda has entered into interest rate swap agreements to manage the interest rate risk associated with a portion of Noranda's fixed-rate debt. These interest rate swaps change our exposure to interest risk by effectively converting a portion of our fixed-rate debt to a floating rate. Noranda may elect in the future to enter into interest rate swaps to effectively convert floating-rate debt to fixed-rate debt and enter into additional fixed-rate to floating-rate swaps. There can be no assurance that Noranda will not be materially adversely affected by interest rate changes in the future, notwithstanding our use of interest rate swaps.
In addition, Noranda's interest rate swaps, metals hedging and foreign currency and energy risk management activities expose us to the risk of default by the counterparties to such arrangements. Any such default could have a material adverse effect on Noranda's business, financial condition and results of operations.
Energy Supply and Prices
Noranda's operations and facilities are intensive users of natural gas, electricity and oil. Procurement of these types of energy can be affected by numerous factors beyond our control, including global and regional supply and demand, political and economic conditions and problems related to local production and delivery conditions. Noranda's supply contracts typically provide that suppliers may be released from their delivery obligations to us if certain "force majeure" events occur. Noranda's business operations could be adversely affected, including loss of production and damage to our plants and equipment, if, even temporarily, the supply of energy to one or more of our facilities was interrupted.
A prolonged shortage of supply of energy used in our operations could materially adversely affect our business, financial condition, liquidity and results of operations. As a significant portion of Noranda's costs relate to energy consumption, Noranda's earnings are directly related to fluctuations in the cost of natural gas, electricity and oil. Energy prices can be affected by numerous factors beyond Noranda's control, including global and regional demand and supply, and applicable regulatory regimes. The prices for various sources of energy we use may increase significantly from current levels. An increase in energy prices could materially adversely affect Noranda's business, financial condition, liquidity and operating results.
Foreign Operations
Some of Noranda's activities and related assets are located in countries outside North America, some of which may be considered to be, or may become, politically or economically unstable. Exploration or development activities in such countries may require protracted negotiations with host governments, international organizations and other third parties, including non-governmental organizations, and are frequently subject to economic and political considerations, such as taxation, nationalization, inflation, currency fluctuations and governmental regulation and approval requirements, which could adversely affect the economics of projects. These projects and investments could be adversely affected by war, civil disturbances and activities of foreign governments which limit or disrupt markets, restrict the movement of funds or supplies or result in the restriction of contractual rights or the taking of property without fair compensation.
47
Noranda performs a thorough risk assessment on a country-by-country basis when considering foreign activities and attempts to conduct our business and financial affairs so as to protect against political, legal, regulatory and economic risks applicable to operations in the various countries where we operate, but there can be no assurance that Noranda will be successful in so protecting ourselves. These projects and investments could also be adversely affected by changes in Canadian laws and regulations relating to foreign trade, investment and taxation.
Market Access
Global and regional demand for metals is influenced by regulatory and voluntary initiatives to restrict or eliminate the use of certain metals in particular products or applications. Impacts of such measures can be global, creating non-tariff barriers to international trade and affecting product design and specifications on a global basis. Such measures could affect the balance between supply and demand and depress metal prices and treatment/refining charges. Metals with a limited number of major applications are most susceptible to changes in demand and price in response to such measures.
Production Technology
Noranda believes that the technology we use to produce and process metals is significantly advanced and, in part, due to high investment costs, subject only to slow technological change. However, there can be no assurance that more economical production or processing technology will not be developed or that the economic conditions in which current technology is applied will not change.
Legal Proceedings
The nature of Noranda's business subjects us to numerous regulatory investigations, claims, lawsuits and other proceedings in the ordinary course of our business. The results of these legal proceedings cannot be predicted with certainty. There can be no assurance that these matters will not have a material adverse effect on our results of operations in any future period, and a substantial judgment could have a material adverse impact on Noranda's business, financial condition, liquidity and results of operations.
Sulphuric Acid
Sulphur dioxide is a by-product from the smelting of copper, zinc, nickel and lead sulphide concentrates. Noranda processes sulphur dioxide into sulphuric acid to meet our environmental commitments. Due to increasingly strict environmental standards worldwide for sulphur dioxide emissions, involuntary production of sulphuric acid by smelters is growing. The balance of world acid production is largely based on elemental sulphur, the supply of which is now a by-product of oil and gas production, and growing more rapidly than demand. Long term, these factors may make it more difficult for us to obtain satisfactory prices for our sulphuric acid. However, Noranda's production of sulphuric acid cannot be reduced in response to low prices, or dropping sales volumes, without a corresponding reduction in our production of metals.
Raw Material Procurement Risks
Procurement of raw materials involves the risks typically connected with commercial transactions, which can include trade barriers, political instability and problems due to local production conditions. In addition, Noranda's supply contracts provide that suppliers of concentrate may be released from their delivery obligations to us if certain "force majeure" events occur. Noranda's business operations could be adversely affected, at least temporarily, if supplies of raw materials are interrupted as a result of the imposition of trade barriers or other events and if Noranda is unable, on short notice, to shift to alternative sources of supply. Noranda also processes copper scrap, the availability of which in past years has been subject to significant fluctuations in the marketplace and the supply of which has been declining since the mid-1990s. The availability of scrap, blister copper and other material we process can be significantly affected by fluctuations in prices.
48
Management's Responsibility
The accompanying consolidated financial statements have been prepared by management in accordance with Canadian generally accepted accounting principles. Financial statements are not precise since they include certain amounts based on estimates and judgments. When alternative methods exist, management has chosen those it deems most appropriate in the circumstances in order to ensure that the consolidated financial statements are presented fairly, in all material respects, in accordance with generally accepted accounting principles. The financial information presented elsewhere in the annual report is consistent with that in the consolidated financial statements.
Noranda maintains adequate systems of internal accounting and administrative controls, consistent with reasonable cost. Such systems are designed to provide reasonable assurance that the financial information is relevant and reliable and that Noranda's assets are appropriately accounted for and adequately safeguarded.
The Board of Directors of the Company is responsible for ensuring that management fulfills its responsibilities for financial reporting, and is ultimately responsible for reviewing and approving the consolidated financial statements and the accompanying management's discussion and analysis. The Board carries out this responsibility principally through its Audit Committee.
The Audit Committee is appointed by the Board, and all of its members are non-management directors. The Audit Committee meets periodically with management and the external auditors to discuss internal controls, auditing matters and financial reporting issues, and to satisfy itself that each party is properly discharging its responsibilities. The Audit Committee also reviews the consolidated financial statements, management's discussion and analysis, the external auditors' report, and examines the fees and expenses for audit services, and considers the engagement or reappointment of the external auditors. The Audit Committee reports its findings to the Board for its consideration when approving the consolidated financial statements for issuance to the shareholders. Ernst & Young LLP, the external auditors, have full and free access to the Audit Committee.
| |
|
|---|
| President and Chief Executive Officer | | Executive Vice-President and Chief Financial Officer |
|
|
|
 | |  |
Derek Pannell
February 3, 2005 |
|
Steven Douglas |
Auditors' Report
To the Shareholders of Noranda Inc.
We have audited the consolidated balance sheets of Noranda Inc. as at December 31, 2004 and 2003 and the consolidated statements of income (loss) and retained earnings (deficit) and cash flows for the years then ended. These financial statements are the responsibility of the Company's management. Our responsibility is to express an opinion on these financial statements based on our audits.
We conducted our audits in accordance with Canadian generally accepted auditing standards. Those standards require that we plan and perform an audit to obtain reasonable assurance whether the financial statements are free of material misstatement. An audit includes examining, on a test basis, evidence supporting the amounts and disclosures in the financial statements. An audit also includes assessing the accounting principles used and significant estimates made by management, as well as evaluating the overall financial statement presentation.
In our opinion, these consolidated financial statements present fairly, in all material respects, the financial position of the Company as at December 31, 2004 and 2003 and the results of its operations and its cash flows for the years then ended in accordance with Canadian generally accepted accounting principles.

Chartered Accountants
Toronto, Canada
February 3, 2005
49
Consolidated Balance Sheets
| |
| | As at December 31
|
|---|
| | Notes
| | 2004
| | 2003
Restated — Note 2
|
|---|
| |
| | (US$ millions)
|
|---|
| Assets | | | | | | | | |
| Current assets | | | | | | | | |
| | Cash and cash equivalents | | | | $ | 884 | | $ | 501 |
| | Short-term investments | | | | | — | | | 129 |
| | Accounts receivable | | | | | 931 | | | 576 |
| | Metals and other inventories | | | | | 1,436 | | | 1,179 |
| | | | |
| |
|
| | | | | | 3,251 | | | 2,385 |
| Operating capital assets | | 5 | | | 4,870 | | | 4,765 |
| Development projects | | 6 | | | 1,166 | | | 973 |
| Investment and other assets | | 7 | | | 324 | | | 205 |
| | | | |
| |
|
| | | | | $ | 9,611 | | $ | 8,328 |
| | | | |
| |
|
Liabilities and Shareholders' Equity |
|
|
|
|
|
|
|
|
| Current liabilities | | | | | | | | |
| | Accounts and taxes payable | | | | $ | 1,248 | | $ | 903 |
| | Debt due within one year | | 8 | | | 570 | | | 431 |
| | | | |
| |
|
| | | | | | 1,818 | | | 1,334 |
| Long-term debt | | 8 and 11 | | | 2,638 | | | 2,893 |
| Future income taxes | | 13 | | | 304 | | | 46 |
| Asset retirement obligation, pension and other provisions | | 9 | | | 595 | | | 539 |
Stockholders' interests |
|
|
|
|
|
|
|
|
| Interests of other shareholders | | 10 | | | 1,197 | | | 919 |
| Shareholders' equity | | 11 and 12 | | | 3,059 | | | 2,597 |
| | | | |
| |
|
| | | | | $ | 9,611 | | $ | 8,328 |
| | | | |
| |
|
Commitments and contingencies (notes 14 and 15)
(See accompanying notes)
On behalf of the Board:
| |
|
|---|
| |  |
Derek Pannell
Director |
|
Al Flood
Director |
50
Consolidated Statements of Income (Loss) and
Retained Earnings (Deficit)
| |
| | As at December 31
| |
|---|
| | Notes
| | 2004
| | 2003
Restated — Note 2
| |
|---|
| |
| | (US$ millions, except per share amounts)
| |
|---|
| Revenues | | 16 | | $ | 6,978 | | $ | 4,657 | |
| | | | |
| |
| |
| Operating expenses | | | | | | | | | |
| | Cost of operations | | | | | 2,094 | | | 1,948 | |
| | Purchased raw materials | | | | | 3,005 | | | 1,822 | |
| | Depreciation, amortization and accretion | | | | | 499 | | | 490 | |
| | | | |
| |
| |
| | | | | | 5,598 | | | 4,260 | |
| | | | |
| |
| |
| Income generated by operating assets | | | | | 1,380 | | | 397 | |
| | | | |
| |
| |
| Interest expense | | 8 | | | 119 | | | 129 | |
| Corporate and general administration | | | | | 66 | | | 58 | |
| Research, development and exploration | | | | | 47 | | | 51 | |
| Minority interest in earnings of subsidiaries | | | | | 297 | | | 88 | |
| | | | |
| |
| |
| Income before undernoted | | | | | 851 | | | 71 | |
| | | | |
| |
| |
| (Gain) loss net of restructuring costs and other | | 3 | | | (33 | ) | | 28 | |
| Tax expense | | 13 | | | 333 | | | 20 | |
| | | | |
| |
| |
| Net income | | | | $ | 551 | | $ | 23 | |
| | | | |
| |
| |
| Dividends on preferred shares | | | | | 20 | | | 21 | |
| Interest on convertible debentures | | | | | 3 | | | 3 | |
| | | | |
| |
| |
| Net income (loss) attributable to common shares | | | | | 528 | | | (1 | ) |
| | | | |
| |
| |
| Basic earnings per share | | | | $ | 1.78 | | $ | — | |
| | | | |
| |
| |
| Diluted earnings per share | | | | $ | 1.75 | | $ | — | |
| | | | |
| |
| |
| Basic weighted average number of shares | | | | | 296,245,753 | | | 261,618,375 | |
| Diluted weighted average number of shares | | | | | 303,789,960 | | | 261,618,375 | |
Retained earnings (deficit) |
|
|
|
|
|
|
|
|
|
| | Balance, as previously reported | | | | $ | (130 | ) | $ | 24 | |
| | Change in accounting policy — asset retirement obligation | | 2 | | | — | | | (27 | ) |
| | | | |
| |
| |
| | Balance, after accounting policy change | | | | | (130 | ) | | (3 | ) |
| | Net income | | | | | 551 | | | 23 | |
| | Dividends | | | | | | | | | |
| | | Common | | | | | (110 | ) | | (121 | ) |
| | | Preferred | | | | | (20 | ) | | (21 | ) |
| | Other | | | | | (3 | ) | | (8 | ) |
| | | | |
| |
| |
| Balance, end of year | | 11 and 12 | | $ | 288 | | $ | (130 | ) |
| | | | |
| |
| |
(See accompanying notes)
51
Consolidated Statements of Cash Flows
| |
| | As at December 31
| |
|---|
| | Notes
| | 2004
| | 2003
Restated — Note 2
| |
|---|
| |
| | (US$ millions)
| |
|---|
| Cash realized from (used for): | | | | | | | | | |
Operations |
|
|
|
|
|
|
|
|
|
| Net income | | | | $ | 551 | | $ | 23 | |
| Charges (credits) not affecting cash: | | | | | | | | | |
| | Depreciation and amortization | | | | | 484 | | | 452 | |
| | Future taxes | | | | | 212 | | | (5 | ) |
| | Minority interest | | | | | 297 | | | 88 | |
| | Gain on settlement of contract | | 3 | | | (80 | ) | | — | |
| | Asset impairment | | 3 | | | 50 | | | — | |
| | Foreign exchange, restructuring and other | | | | | (46 | ) | | 19 | |
| | | | |
| |
| |
| | | | | | 1,468 | | | 577 | |
| Net change in accounts receivable, inventories and payables | | | | | (277 | ) | | (164 | ) |
| | | | |
| |
| |
| Cash from operations | | | | | 1,191 | | | 413 | |
| | | | |
| |
| |
Investment activities |
|
|
|
|
|
|
|
|
|
| Capital investments | | | | | (666 | ) | | (489 | ) |
| Investments and advances | | | | | 105 | | | (153 | ) |
| Proceeds on dispositions | | 3 | | | 6 | | | 99 | |
| | | | |
| |
| |
| Cash used in investment activities | | | | | (555 | ) | | (543 | ) |
| | | | |
| |
| |
Financing activities |
|
|
|
|
|
|
|
|
|
| Long-term debt, including current portion | | | | | | | | | |
| | Issued | | | | | 344 | | | 717 | |
| | Repaid | | | | | (470 | ) | | (807 | ) |
| Issue of shares — common | | 12 | | | 23 | | | 439 | |
| Issue of shares — preferred | | | | | — | | | 198 | |
| Redemption of preferred shares | | 12 | | | — | | | (104 | ) |
| Dividends paid | | | | | (130 | ) | | (92 | ) |
| Issue of shares — minority shareholders, net | | | | | 15 | | | 18 | |
| Dividends paid to minority shareholders | | | | | (35 | ) | | (31 | ) |
| | | | |
| |
| |
| | | | | | (253 | ) | | 338 | |
| | | | |
| |
| |
| Increase in cash and cash equivalents | | | | | 383 | | | 208 | |
| Cash and cash equivalents, beginning of year | | | | | 501 | | | 293 | |
| | | | |
| |
| |
| Cash and cash equivalents, end of year | | | | $ | 884 | | $ | 501 | |
| | | | |
| |
| |
(See accompanying notes)
52
Notes to the Consolidated Financial Statements
(US$ millions except as otherwise indicated) December 31, 2004
1 Accounting Policies
Basis of Presentation of the Consolidated Financial Statements
The accompanying consolidated financial statements have been prepared in accordance with Canadian generally accepted accounting principles which are in conformity, in all material respects, with United States generally accepted accounting principles, except as described in Note 19. The consolidated financial statements include the accounts of Noranda Inc. (the "Company") and all of its subsidiaries and joint ventures (together, "Noranda"). Long-term investments in companies in which Noranda has significant influence are accounted for on the basis of cost plus equity in undistributed earnings since the dates of investment. The interests of the Company, Falconbridge Limited ("Falconbridge") and Novicourt Inc. ("Novicourt") in their joint ventures are proportionately consolidated. The difference between the cost of the shares of acquired companies and the underlying net book value of the assets is amortized over the estimated economic life of the assets to which the difference is attributed.
Reporting Currency and Translation of Foreign Currencies
Effective July 1, 2003, the United States dollar ("U.S. dollar") was adopted as the unit of measure of Noranda's Canadian operations which reflects significant operational exposure to the U.S. dollar and predominantly the U.S. dollar-based asset and investment base of the Company. Concurrent with this change in functional currency, Noranda adopted the U.S. dollar as its reporting currency. In accordance with Canadian generally accepted accounting principles, the Company restated all amounts presented for comparative purposes into U.S. dollars using the current rate method whereby all revenues, expenses and cash flows are translated at the average rates that were in effect during these periods and all assets and liabilities are translated at the prevailing noon rate in effect at the end of these periods. Equity transactions have been translated at historic rates; with opening equity restated at the rate of exchange on January 1, 1999. The resulting net translation adjustment on the change in functional currency has been credited to the cumulative translation account.
For periods after July 1, 2003, the assets and liabilities of Noranda's self-sustaining operations having a functional currency other than the U.S. dollar are translated into U.S. dollars using the exchange rate in effect at the period end and revenues and expenses are translated at the average rate during the period. Exchange gains and losses on translation of the Company's net equity investment in these operations are deferred as a separate component of shareholders' equity. Gains or losses on foreign currency loans and transactions that are designated as hedges of a net investment in self-sustaining foreign operations are reported in shareholders' equity in the same manner as translation adjustments.
Foreign-denominated monetary assets and liabilities are translated at the exchange rates prevailing at the year end, and revenue and expenses (other than depreciation) at average rates of exchange during the year. Exchange gains and losses arising on the translation of the accounts are included in the consolidated statement of income (loss). Non-monetary assets and liabilities are translated at historical rates of exchange.
Prior to July 1, 2003, Noranda's Canadian operations have been measured in Canadian dollars and consolidated financial statements have been expressed in Canadian dollars. The accounts of self-sustaining foreign operations were translated using the current rate method, under which all assets and liabilities were translated at the exchange rate prevailing at year end, and revenues and expenses at average rates of exchange during the year. Gains or losses on translation of these account balances were not included in the consolidated statements of loss, but deferred and shown as a separate item in shareholders' equity. Gains or losses on foreign currency loans and transactions that were designated as hedges of a net investment in self-sustaining foreign operations were reported in shareholders' equity in the same manner as translation adjustments.
53
Cash and Cash Equivalents
Cash and cash equivalents include cash on account, demand deposits and short-term investments with original maturities of three months or less and are stated at cost, which approximates market value. Cash and cash equivalents of $884 (2003 — $501) include $35 of restricted cash (2003 — $33) to be used for repayment of senior debt of the Antamina project.
Short-term Investments
Investments in corporate commercial paper issues have original maturities between four and nine months and are stated at cost, which approximates market value.
Product Inventories
Mining and metallurgical product inventories are valued at the lower of net realizable value and average cost, where costs comprise direct costs and an allocation of production overheads and depreciation of production-related assets. Aluminum and fabricated product inventories are valued at the lower of cost (determined on a first-in, first-out basis, comprising direct costs and an allocation of production overheads and depreciation of production-related assets) and net realizable value. Inventories of operating supplies and raw materials are valued at the lower of average direct acquisition cost and replacement value.
Revenue Recognition
Revenues from the sale of base metals, aluminum and fabricated products and from by-product materials are recorded at the time of sale, when the rights and obligations of ownership pass to the buyer. Prices used for provisionally priced sales are based on market prices prevailing at the time of shipment and are adjusted based upon market prices until final settlement with customers pursuant to the terms of sales contracts. Price changes for shipments which at year end are awaiting final pricing could have a material effect on future revenues.
Financial Instruments
Noranda enters into interest rate swap agreements to alter the interest characteristics of a portion of its outstanding debt from a fixed to a floating rate basis. These agreements involve the receipt of fixed-rate amounts in exchange for floating rate interest payments over the life of the agreement without an exchange of the underlying principal amount. Noranda also enters into interest rate swap agreements that involve the payment of fixed-rate amounts in exchange for the receipt of floating rate interest over the life of the agreement. The differential to be paid or received as a result of interest rate swap agreements is accrued and recognized as an adjustment to interest expense related to the debt.
Noranda uses forward foreign exchange and option contracts to hedge the effect of exchange rate changes on identifiable foreign currency exposures and futures, and forward and option contracts to hedge the effect of price changes on a portion of the commodities it sells. Gains and losses on these contracts are reported as a component of the related transactions. Gains and losses on early termination of hedging contracts are deferred until the hedged items are recognized in earnings. From time to time, Noranda enters into futures and forward contracts for the purchase or sale of commodities and currencies not related to production. Provisions are made for any estimated unrealized gains and losses on these contracts.
Noranda also uses cross-currency swap agreements which are used to hedge the interest rate risk and foreign currency exposures related to its non-U.S. dollar-denominated debt. Gains or losses on these contracts are accounted for in the same manner as the interest rate swap agreements and forward exchange contracts discussed above.
Financial instruments designated as hedges are tested for effectiveness on a quarterly basis. Gains and losses on those contracts that are proven to be effective are reported as a component of the related transaction.
Noranda formally documents all relationships between hedging instruments and hedged items, as well as its risk management objective and strategy for undertaking various hedge transactions. This process includes linking all derivatives to specific firm commitments or forecasted transactions.
Noranda does not consider the credit risk associated with its financial instruments to be significant. Interest rate swaps, foreign currency contracts and commodity hedge contracts are maintained with high-quality counterparties, and Noranda does not anticipate that any counter-party will fail to meet its obligations. Noranda does not have significant exposure to any individual customer, and these risks are further managed through an effective credit management program.
54
As of January 1, 2004, Noranda adopted the recommendations of AcG 13 which provide for more restrictive conditions as to when hedge accounting may be used (see note 2).
Depreciation, Amortization
Depreciation of property, plant and equipment is based on the estimated service lives of the assets, calculated primarily on a straight-line basis for metallurgical operations (not exceeding 40 years) and on a unit-of-production basis for mining operations. Preproduction and mine development expenditures are amortized over the estimated life of the mine on the unit-of-production method over proven and probable reserves. Construction in progress will be depreciated once the project is substantially completed, and has reached commercial production.
Reclamation
Effective January 1, 2004, Noranda adopted the new Canadian Institute of Chartered Accountants (CICA) standards for Asset Retirement Obligations (CICA 3110) (see note 2).
In accordance with CICA 3110, asset retirement obligations are recognized when incurred and recorded as liabilities at fair value. The amount of the liability is subject to re-measurement at each reporting period. The liability is accreted over time through periodic charges to earnings. In addition, the asset retirement cost is capitalized as part of the asset's carrying value and amortized over the estimated life of the mine. The key assumptions on which the fair value of the asset retirement obligations is based includes the estimated future cash flows, the timing of those cash flows and the credit-adjusted risk-free rate or rates on which the estimated cash flows have been discounted.
The asset retirement obligation and closure costs may change materially based on future changes in operations, costs of reclamation and closure activities, regulatory requirements and the outcome of legal proceedings.
Preproduction Costs
Preproduction costs related to major projects are deferred until the facilities achieve commercial production or are deemed to be uneconomic. These deferred costs are amortized on a unit-of-production method over the estimated useful life of the project or are written off when the project is determined to be uneconomic.
Asset Valuation
The Company assesses long-lived assets for recoverability whenever indicators of impairment exist. When the carrying value of a long-lived asset is less than its net recoverable value as determined on an undiscounted basis, an impairment loss is recognized to the extent that its fair value, measured as the discounted cash flows over the life of the asset when quoted market prices are not readily available, is below the asset's carrying value.
Exploration
Mining exploration expenditures are charged against current earnings unless they relate to properties that have been subjected to sufficient pre-feasibility work that indicates future mine production is reasonably certain. Gains on the sale of mining exploration properties or recoveries of costs previously written off are credited against exploration expense.
Income and Production Taxes
Current taxes are recognized for the estimated income and mining taxes payable for the current year.
Future tax assets and liabilities are recognized for temporary differences between the tax and accounting bases of assets and liabilities as well as for the benefit of losses available to be carried forward to future years for tax purposes that are more likely than not to be realized. Future taxes are measured using the tax rates and laws that will be in effect when the differences are expected to reverse or the losses to be realized.
55
Interest
Interest incurred is charged to earnings, except for interest that can be identified with a major capital expenditure program. Under the policy, interest is capitalized as it arises from indebtedness incurred to finance major projects, either directly or indirectly, until the project achieves commercial production.
Post-employment Costs
The cost of retirement benefits and certain post-employment benefits are recognized as the benefits are earned by the employees. Noranda uses the accrued benefit method pro-rated on length of service and management's best estimate assumptions to value its pensions and other retirement benefits. Assets are valued at fair value for the purpose of calculating the expected return on plan assets. Past service costs from plan amendments are amortized on a straight-line basis over the term of the employment contract. The excess of the net actuarial gain (loss) over 10% of the greater of the benefit obligation and the fair value of plan assets is amortized over the average remaining service period of active employees.
Under its defined contribution retirement savings program, Noranda makes payments based on employee earnings and partially matches employee contributions, to a defined maximum. Employees may receive profit sharing credits based on earnings.
When a defined benefit plan gives rise to an accrued benefit asset, Noranda recognizes a valuation allowance for the excess of the adjusted benefit asset over the expected future benefit to be realized from the plan asset. Changes in the allowance are included in the determination of pension expense.
Stock-based Compensation Plans
The Company has stock-based compensation plans, which are described in Note 12. The Company accounts for stock options using the fair value method. Under this method, compensation expense for stock options granted since January 1, 2002 is measured at fair value at the grant date using the Black-Scholes valuation model and recognized over the vesting period of the options granted.
The Company also has an employee share savings plan through which employees can purchase shares of the Company at market prices. For each dollar employees contribute to the plan, the Company contributes a prescribed percentage, which is expensed as employee compensation. For the Company's deferred unit plans, a liability is recorded to the extent that the Company's common share price exceeds the notional purchase price of the units. Notional dividends on the units are recorded as a direct charge to retained earnings.
Earnings Per Share
Earnings per share is determined by dividing net earnings, after deducting preferred share dividends and the equity portion of the convertible debenture interest, by the weighted-average number of common shares outstanding during the year, excluding shares securing employee share purchase loans.
Diluted loss per share assumes that outstanding dilutive stock options are exercised at the beginning of the period (or at the time of issuance, if later) and the proceeds are used to purchase common stock at the average market price during the period, and that dilutive convertible debentures are converted into common shares at the beginning of the period.
Use of Estimates
The preparation of financial statements in conformity with generally accepted accounting principles requires management to make estimates and assumptions. These estimates affect the reported amounts of assets and liabilities and the disclosure of contingent assets and liabilities at the date of the financial statements and the reported amounts of revenues and expenses during the reported period. Actual results could differ from those estimates.
Comparative Consolidated Financial Statements
The comparative consolidated financial statements have been reclassified from statements previously presented to conform to the presentation of the 2004 consolidated financial statements.
56
2 Changes in Accounting Policies
a) Asset Retirement Obligations
Effective January 1, 2004, Noranda adopted the new CICA standard for Asset Retirement Obligations (CICA 3110). Previously, Noranda expensed costs related to ongoing site restoration programs when incurred, while a provision for future site reclamation and closure costs was charged to earnings over the life of the operations.
In accordance with CICA 3110, asset retirement obligations are recognized when incurred and recorded as liabilities at fair value. The amount of the liability is subject to re-measurement at each reporting period. The liability is accreted over time through periodic charges to earnings. In addition, the asset retirement cost is capitalized as part of the asset's carrying value and amortized over the estimated life of the mine. The key assumptions on which the fair value of the asset retirement obligations is based includes the estimated future cash flows, the timing of those cash flows and the credit-adjusted risk-free rate or rates on which the estimated cash flows have been discounted. Cash outflows totaling $1,551 are expected to be incurred over a period extending to 62 years. These cash outflows are discounted using a rate ranging from 5% to 9%. This change in accounting policy was applied retroactively and, accordingly, the consolidated financial statements of prior periods were restated.
As a result of this change, the cumulative impact from the adoption of this standard at January 1, 2003 was to decrease retained earnings by $27, increase capital assets by $70, increase the provision for asset retirement by $97, decrease future income taxes by $5 and increase interest of other shareholders by $5. Adoption of the new standard reduced net income by $11 for the year ended December 31, 2003.
| | Periods ending December 31,
| |
|---|
| | 2004
| | 2003
| |
|---|
| Asset retirement obligation beginning of period | | $ | (412 | ) | $ | (334 | ) |
| | Liabilities incurred | | | (5 | ) | | (18 | ) |
| | Liabilities settled | | | 36 | | | 29 | |
| | Gain on settlement of liabilities | | | 5 | | | — | |
| | Accretion expense | | | (24 | ) | | (27 | ) |
| | Revision in estimated cash flows | | | (9 | ) | | — | |
| | Foreign exchange | | | (27 | ) | | (62 | ) |
| | |
| |
| |
| Asset retirement obligation end of period | | $ | (436 | ) | $ | (412 | ) |
| | |
| |
| |
b) Hedging Relationships
Effective January 1, 2004, Noranda adopted the new CICA standard for Hedging Relationships (AcG 13). This standard is applied prospectively without restatement of prior period results. As of January 1, 2004, Noranda adopted the recommendations of AcG 13 which provide for more restrictive conditions as to when hedge accounting may be used. On implementation of this standard at January 1, 2004, the Company's partially-owned subsidiary, Falconbridge, recorded a deferred mark-to-market gain of $27 on its interest rate hedges while recording a long-term receivable and long-term payable of $67 and $40, for those contracts in a gain and loss position, respectively. Amortization of $7 of this deferred gain was amortized into income during 2004, as a reduction of interest expense. Since the interest rate hedge contracts were not eligible for hedge accounting, the change in fair value on these positions are shown as a component of other income.
Falconbridge recorded a mark-to-market loss of $1 during 2004 respectively, for those contracts which were not eligible for hedge accounting.
At January 1, 2004, Falconbridge recorded a deferred mark-to-market gain of $3, for energy price hedge contracts not eligible for hedge accounting, $2 of this deferred gain was amortized into income during 2004. In addition, Falconbridge recorded a $1 mark-to-market gain on those contracts during 2004.
Under the provisions of the new standard, Noranda continued to be eligible for hedge accounting on its fixed forward price hedges and on its forward and option contracts used as a currency hedge of Canadian dollars operating costs. Falconbridge did not seek hedge accounting for its contracts used as an economic currency hedge of Canadian dollar monetary assets and liabilities and accordingly continues to mark these to market.
57
3 (Gain) Loss Net of Restructuring Costs and Other
| | 2004
| | 2003
| |
|---|
| Gain on settlement of alumina contract (Note 4) | | $ | (80 | ) | $ | — | |
| Gain on sale of units in Noranda Income Fund | | | — | | | (35 | ) |
| Gain on sale of investment and other | | | (6 | ) | | (3 | ) |
| American Racing impairment | | | 50 | | | — | |
| Magnesium closure costs (Note 4) | | | — | | | 33 | |
| Restructuring costs | | | 3 | | | 33 | |
| | |
| |
| |
| | | $ | (33 | ) | $ | 28 | |
| | |
| |
| |
American Racing Impairment
American Racing is a subsidiary of Noranda that manufactures and distributes aluminum wheels. In 2004, Noranda recorded an impairment loss of $50 which was applied to the carrying value of the operations in the United States. The impairment loss was determined using a discounted cash flow analysis.
Sale of Units in Noranda Income Fund
On July 17, 2003, Noranda sold its remaining 11,984,900 Priority Units of the Noranda Income Fund for gross proceeds of $84. The pre-tax gain on the sale was $35. Noranda's participation in the Fund decreased to 25% following the sale, representing all of the outstanding Ordinary Units of the Fund. Noranda's investment is accounted for on an equity basis.
Other Restructuring Costs
In 2003, employee reductions at Horne, Brunswick smelter and Kidd Creek operating sites and restructuring provisions at American Racing were recorded in the amount of $33.
4 Joint Ventures
Noranda's share of the assets, liabilities and equity, revenues and expenses and cash flows of its major joint ventures for the years ended December 31, 2004 and 2003 are as follows:
| | 2004
| |
|---|
| | Antamina
| | Collahuasi
| | Magnesium
| | Louvicourt
| | Gramercy
| | Total
| |
|---|
| Balance Sheets | | | | | | | | | | | | | | | | | | | |
| Current assets | | $ | 223 | | $ | 392 | | $ | 12 | | $ | 18 | | $ | 38 | | $ | 683 | |
| Capital assets and other | | | 630 | | | 955 | | | 272 | | | 4 | | | 133 | | | 1,994 | |
| | |
| |
| |
| |
| |
| |
| |
| | | $ | 853 | | $ | 1,347 | | $ | 284 | | $ | 22 | | $ | 171 | | $ | 2,677 | |
| | |
| |
| |
| |
| |
| |
| |
| Current liabilities | | $ | 73 | | $ | 179 | | $ | — | | $ | 2 | | $ | 18 | | $ | 272 | |
| Long-term debt and other | | | 346 | | | 628 | | | 27 | | | 5 | | | 56 | | | 1,062 | |
| Minority interest in subsidiaries | | | — | | | 222 | | | — | | | 6 | | | — | | | 228 | |
| Noranda's investment | | | 434 | | | 318 | | | 257 | | | 9 | | | 97 | | | 1,115 | |
| | |
| |
| |
| |
| |
| |
| |
| | | $ | 853 | | $ | 1,347 | | $ | 284 | | $ | 22 | | $ | 171 | | $ | 2,677 | |
| | |
| |
| |
| |
| |
| |
| |
Statements of Earnings (Loss) |
|
|
|
|
|
|
|
|
|
|
|
|
|
|
|
|
|
|
|
| Sales and other revenues | | $ | 351 | | $ | 575 | | $ | — | | $ | 47 | | $ | 39 | | $ | 1,012 | |
| Expenses | | | 221 | | | 319 | | | 5 | | | 23 | | | 38 | | | 606 | |
| Minority interest | | | — | | | 105 | | | — | | | 9 | | | — | | | 114 | |
| | |
| |
| |
| |
| |
| |
| |
| Noranda's share of earnings (loss) | | $ | 130 | | $ | 151 | | $ | (5 | ) | $ | 15 | | $ | 1 | | $ | 292 | |
| | |
| |
| |
| |
| |
| |
| |
Statements of Cash Flows |
|
|
|
|
|
|
|
|
|
|
|
|
|
|
|
|
|
|
|
| Cash realized from (used for): | | | | | | | | | | | | | | | | | | | |
| | Operations | | $ | 196 | | $ | 272 | | $ | (3 | ) | $ | 27 | | $ | 13 | | $ | 505 | |
| | Investment activities | | | (15 | ) | | (20 | ) | | — | | | — | | | (5 | ) | | (40 | ) |
| | Financing activities | | | (69 | ) | | (66 | ) | | (1 | ) | | — | | | — | | | (136 | ) |
| | |
| |
| |
| |
| |
| |
| |
58
| | 2003
| |
|---|
| | Antamina
| | Collahuasi
| | Magnesium
| | Louvicourt
| | Total
| |
|---|
| Balance Sheets | | | | | | | | | | | | | | | | |
| Current assets | | $ | 110 | | $ | 143 | | $ | 23 | | $ | 12 | | $ | 288 | |
| Capital assets and other | | | 660 | | | 923 | | | 252 | | | 9 | | | 1,844 | |
| | |
| |
| |
| |
| |
| |
| | | $ | 770 | | $ | 1,066 | | $ | 275 | | $ | 21 | | $ | 2,132 | |
| | |
| |
| |
| |
| |
| |
| Current liabilities | | $ | 75 | | $ | 87 | | $ | 6 | | $ | 2 | | $ | 170 | |
| Long-term debt and other | | | 346 | | | 598 | | | 30 | | | 2 | | | 976 | |
| Minority interest in subsidiaries | | | — | | | 156 | | | — | | | 7 | | | 163 | |
| Noranda's investment | | | 349 | | | 225 | | | 239 | | | 10 | | | 823 | |
| | |
| |
| |
| |
| |
| |
| | | $ | 770 | | $ | 1,066 | | $ | 275 | | $ | 21 | | $ | 2,132 | |
| | |
| |
| |
| |
| |
| |
Statements of Earnings (Loss) |
|
|
|
|
|
|
|
|
|
|
|
|
|
|
|
|
| Sales and other revenues | | $ | 187 | | $ | 275 | | $ | — | | $ | 28 | | $ | 490 | |
| Expenses | | | 159 | | | 206 | | | 34 | | | 24 | | | 423 | |
| Minority interest | | | — | | | 28 | | | — | | | 1 | | | 29 | |
| | |
| |
| |
| |
| |
| |
| Noranda's share of earnings (loss) | | $ | 28 | | $ | 41 | | $ | (34 | ) | $ | 3 | | $ | 38 | |
| | |
| |
| |
| |
| |
| |
Statements of Cash Flows |
|
|
|
|
|
|
|
|
|
|
|
|
|
|
|
|
| Cash realized from (used for): | | | | | | | | | | | | | | | | |
| | Operations | | $ | 57 | | $ | 95 | | $ | (28 | ) | $ | 13 | | $ | 137 | |
| | Investment activities | | | (15 | ) | | (114 | ) | | (13 | ) | | — | | | (142 | ) |
| | Financing activities | | | (47 | ) | | 9 | | | (1 | ) | | — | | | (39 | ) |
| | |
| |
| |
| |
| |
| |
Noranda holds a 33.75% interest in Antamina, a copper/zinc mine project in Peru. Noranda, through its Falconbridge subsidiary, holds a 44% interest in Compañia Minera Doña Inés de Collahuasi S.C.M. ("Collahuasi"), a corporation which owns the mining and water rights and other assets relating to the Collahuasi project, and which secured financing, conducts the operations and markets the products of the property.
Noranda owns an 80% joint-venture interest in the Magnesium project, a facility for the extraction of magnesium from mining residues in Danville, Quebec. As a result of depressed global magnesium prices, the Company temporarily shut down its Magnesium operation in April 2003. Included in restructuring costs in 2003 is a charge of $33 related to this closure.
The Company holds through its 62.1%-owned subsidiary, Novicourt, a 45% joint-venture interest in the Louvicourt copper/zinc mine in northwestern Quebec.
In October 2004, the Company assumed a 50% interest in Kaiser Aluminum's Gramercy alumina plant in Gramercy, Louisiana and Kaiser Aluminum's related bauxite assets in Jamaica, in exchange for the settlement of an alumina supply contract and $11.5. The Company recorded a gain of $80 on the settlement of the contract. The total consideration of $91.5, comprised of cash and the gain on the settlement of the contract, was allocated as $11.5 to working capital, $129 to capital assets and $49 to future income taxes.
5 Operating Capital Assets
| | As at December 31, 2004
| |
|---|
| | Copper
| | Nickel
| | Zinc
| | Aluminum
| | Other
| | Total
| |
|---|
| Property, plant and equipment, at cost | | $ | 4,490 | | $ | 2,027 | | $ | 632 | | $ | 1,344 | | $ | 476 | | $ | 8,969 | |
| Accumulated depreciation | | | (1,988 | ) | | (1,228 | ) | | (488 | ) | | (642 | ) | | (438 | ) | | (4,784 | ) |
| | |
| |
| |
| |
| |
| |
| |
| | | | 2,502 | | | 799 | | | 144 | | | 702 | | | 38 | | | 4,185 | |
| Deferred preproduction, development and exploration (net) | | | 388 | | | 279 | | | 14 | | | — | | | 4 | | | 685 | |
| | |
| |
| |
| |
| |
| |
| |
| | | $ | 2,890 | | $ | 1,078 | | $ | 158 | | $ | 702 | | $ | 42 | | $ | 4,870 | |
| | |
| |
| |
| |
| |
| |
| |
59
| | As at December 31, 2003
| |
|---|
| | Copper
| | Nickel
| | Zinc
| | Aluminum
| | Other
| | Total
| |
|---|
| Property, plant and equipment, at cost | | $ | 4,127 | | $ | 1,941 | | $ | 640 | | $ | 1,195 | | $ | 527 | | $ | 8,430 | |
| Accumulated depreciation | | | (1,793 | ) | | (1,132 | ) | | (464 | ) | | (616 | ) | | (442 | ) | | (4,447 | ) |
| | |
| |
| |
| |
| |
| |
| |
| | | | 2,334 | | | 809 | | | 176 | | | 579 | | | 85 | | | 3,983 | |
| Deferred preproduction, development and exploration (net) | | | 423 | | | 298 | | | 58 | | | — | | | 3 | | | 782 | |
| | |
| |
| |
| |
| |
| |
| |
| | | $ | 2,757 | | $ | 1,107 | | $ | 234 | | $ | 579 | | $ | 88 | | $ | 4,765 | |
| | |
| |
| |
| |
| |
| |
| |
6 Development Projects
Development projects consist of brownfield and greenfield projects that are expected to contribute to earnings upon completion of construction and advancement to commercial production.
Major projects in the category are as follows:
| | As at December 31
|
|---|
| | 2004
| | 2003
|
|---|
| Collahuasi expansion | | $ | — | | $ | 207 |
| Kidd Creek — deep expansion | | | 404 | | | 277 |
| Koniambo — New Caledonia | | | 180 | | | 123 |
| Nickel Rim South | | | 101 | | | 5 |
| Magnesium | | | 272 | | | 252 |
| Other development projects | | | 209 | | | 109 |
| | |
| |
|
| | | $ | 1,166 | | $ | 973 |
| | |
| |
|
The increase in carrying value attributed to the magnesium operations in 2004 is a result of the appreciation of the Canadian dollar compared to the U.S. dollar during 2004. The Collahuasi expansion went into commercial production during the third quarter of 2004.
7 Investments and Other Assets
| | As at December 31
|
|---|
| | 2004
| | 2003
|
|---|
| Equity accounted investment — Noranda Income Fund | | $ | 43 | | $ | 46 |
| Cost accounted investments | | | 24 | | | 17 |
| Derivative financial instruments | | | 120 | | | 24 |
| Antamina net proceeds interest | | | 23 | | | 23 |
| Debenture discount and issue expenses — net | | | 18 | | | 21 |
| Supplies inventory | | | 25 | | | 16 |
| Deposits and other assets | | | 71 | | | 58 |
| | |
| |
|
| | | $ | 324 | | $ | 205 |
| | |
| |
|
60
8 Debt
| | Principal repayment schedule as at December 31, 2004
|
|---|
| | Interest
rates(1)
| | Total
2004
| | 2005
| | 2006
| | 2007
| | 2008
| | 2009
| | 2010 to
2013
| | After
2013
| | Total
2003
|
|---|
| Debt of the Company and its wholly-owned subsidiaries: | | | | | | | | | | | | | | | | | | | | | | |
| Notes payable and revolving term loans | | 3.57% | | $ | 302 | | 75 | | 2 | | 215 | | 1 | | 1 | | 5 | | 3 | | $ | 55 |
| Senior debentures | | 5.73% | | | 1,150 | | 200 | | — | | — | | — | | — | | 600 | | 350 | | | 1,450 |
| Liability element of convertible debentures (Note 11) | | 5.00% | | | 13 | | — | | — | | 13 | | — | | — | | — | | — | | | 18 |
| | |
| |
| |
| |
| |
| |
| |
| |
| |
| |
|
| | | 5.28% | | | 1,465 | | 275 | | 2 | | 228 | | 1 | | 1 | | 605 | | 353 | | | 1,523 |
| | |
| |
| |
| |
| |
| |
| |
| |
| |
| |
|
| Debt of partially-owned subsidiaries and joint ventures | | 5.02% | | | 1,743 | | 295 | | 353 | | 103 | | 256 | | 83 | | 395 | | 258 | | | 1,801 |
| | |
| |
| |
| |
| |
| |
| |
| |
| |
| |
|
| Total | | 5.14% | | $ | 3,208 | | 570 | | 355 | | 331 | | 257 | | 84 | | 1,000 | | 611 | | $ | 3,324 |
| | |
| |
| |
| |
| |
| |
| |
| |
| |
| |
|
| Debt due within one year | | | | | 570 | | | | | | | | | | | | | | | | | 431 |
| | | | |
| | | | | | | | | | | | | | | |
|
| Long-term debt | | | | $ | 2,638 | | | | | | | | | | | | | | | | $ | 2,893 |
| | | | |
| | | | | | | | | | | | | | | |
|
- (1)
- weighted average interest rates after swap contracts, as at December 31, 2004.
- a)
- Notes payable and revolving term loans include borrowings under unsecured committed bank lines of credit that are structured to provide the Company with the right to borrow at floating rates and repay these amounts over the next three years. At December 31, 2004, Noranda had utilized $246 (including $18 by Falconbridge, excluding Collahuasi) from its total committed lines of $1,112 (including $475 for Falconbridge, excluding Collahuasi).
Senior debentures of $1,150 (2003 — $1,450) are direct unsecured obligations of the Company.
- b)
- On May 28, 2003, Noranda's partially-owned subsidiary Falconbridge issued $250 5.375% fixed-rate debentures maturing on June 1, 2015. The proceeds from this offering were used to repay debt outstanding under its commercial paper program, to fund planned expenditures and for other general corporate purposes.
On September 24, 2003, Noranda issued $350 6% fixed-rate debentures maturing October 15, 2015. The proceeds from this offering were invested in short-term investments and used for other general corporate purposes.
- c)
- Debt of partially-owned subsidiaries and joint ventures includes $305, Noranda's 33.75% share of the $905 of borrowings under Antamina's $1,320 senior credit facilities. These facilities, provided by a consortium of international banks and national import/export credit agencies, have maturity dates ranging from 3.5 to 7.5 years. With the exception of $118, all of these facilities are insured for political risks or are otherwise guaranteed for political risks by multilateral, national or private sector institutions. Noranda's guarantee of this facility was removed during 2003 as the completion tests were met.
d)- After taking into account current interest rates and credit spreads, the fair value of the debt of the Company at December 31, 2004 was greater than book value by $112 (2003 — $120), and the fair value of the debt of its partially-owned subsidiaries and joint ventures was greater than book value by $70 (2003 — $94).
e)- Interest rate swap agreements of $650 (2003 — $650) have been entered into by the Company, and $400 (2003 — $400) by its partially-owned subsidiaries and joint ventures, whereby fixed rates of interest are received and floating rates are paid for terms up to 10.5 years. In addition, interest rate swap agreements of $550 (2003 — $561) have been entered into by the Company's partially-owned subsidiaries and joint ventures, whereby fixed rates of interest are paid and floating rates are received for a period up to 7.5 years. As at December 31, 2004, the estimated aggregate fair value of the interest rate swap agreements of the Company and its partially-owned subsidiaries and joint ventures had a mark-to-market gain of $20 and $21 respectively (2003 — $14 and $24, respectively).
61
The Company's partially-owned subsidiary Falconbridge has entered into several cross-currency interest rate swap transactions whereby rates of interest on debentures in the amount of $86 (2003 — $86) are swapped to floating and $25 (2003 — $25) are swapped to fixed rates of interest for terms of four years. At December 31, 2004, the mark-to-market value of these positions was a gain of $45 (2003 — $31).
At December 31, 2002, the Company recorded a deferred gain of $21 on the closure of Cdn$400 million interest rate swap agreements. The Company recognized into income $4 during 2004 (2003 — $17).
Interest, net
| | 2004
| | 2003
| |
|---|
| Interest on long-term debt | | $ | 163 | | $ | 158 | |
| Interest on short-term debt | | | 16 | | | 5 | |
| Interest income | | | (24 | ) | | (14 | ) |
| | |
| |
| |
| | | | 155 | | | 149 | |
| Capitalized interest | | | (36 | ) | | (20 | ) |
| | |
| |
| |
| | | $ | 119 | | $ | 129 | |
| | |
| |
| |
9 Asset Retirement Obligation, Pension and Other Provisions
| | As at December 31, 2004
| | As at December 31, 2003
Restated — Note 2
|
|---|
| | Company and wholly-owned subsidiaries
| | Partially-owned subsidiaries and joint ventures
| | Total
| | Company and wholly-owned subsidiaries
| | Partially-owned subsidiaries and joint ventures
| | Total
|
|---|
| Asset retirement obligation | | $ | 273 | | $ | 163 | | $ | 436 | | $ | 271 | | $ | 141 | | $ | 412 |
| Pension, benefits and other provisions | | | (56 | ) | | 215 | | | 159 | | | (64 | ) | | 191 | | | 127 |
| | |
| |
| |
| |
| |
| |
|
| | | $ | 217 | | $ | 378 | | $ | 595 | | $ | 207 | | $ | 332 | | $ | 539 |
| | |
| |
| |
| |
| |
| |
|
10 Interests of Other Shareholders
| | As at December 31
|
|---|
| | 2004
| | 2003
|
|---|
| Preferred shares of subsidiaries | | $ | 130 | | $ | 130 |
| Common equity interests | | | 1,067 | | | 789 |
| | |
| |
|
| | | $ | 1,197 | | $ | 919 |
| | |
| |
|
62
11 Convertible Debentures
The Cdn$150 million adjustable rate convertible subordinated debentures Series 1, due April 30, 2007, bear interest at a rate which is the greater of 5%, and of 1% plus the percentage that two times the common share dividend paid in the previous six months is of the conversion price. The debentures are convertible at the holder's option into common shares of the Company at a conversion price of Cdn$27.55 per common share, on or before the last business day prior to the maturity date of the debentures, or the last business day prior to redemption. The Company has the option of redeeming the debentures, and upon maturity they are redeemable, at the Company's option, for common shares of the Company at the average closing price on the Toronto Stock Exchange for the 30 trading days prior to the maturity date.
The Company's convertible debentures contain both debt and equity components. Although under certain conditions the interest portion of the debentures may be settled by issuing common shares, the Company believes it is improbable that those conditions will be met, and has accounted for the present value of the interest portion as a liability. At December 31, 2004, this liability amounted to $13 (2003 — $18). The amount representing the principal has been classified as a component of shareholders' equity and was $89 at December 31, 2004 (2003 — $84).
12 Shareholders' Equity
Capital Stock
Authorized:
Preferred shares, an unlimited number
Common shares, an unlimited number
Participating shares, an unlimited number
| | 2004
| | 2003
| |
|---|
| Issued: | | | | | | | |
| | Preferred shares Series F | | $ | 59 | | $ | 59 | |
| | Preferred shares Series G | | | 137 | | | 137 | |
| | Preferred shares Series H | | | 99 | | | 99 | |
| | Equity element of convertible debentures (Note 11) | | | 89 | | | 84 | |
| | Common shares | | | 2,107 | | | 2,084 | |
| | Stock option valuation | | | 3 | | | 3 | |
| | |
| |
| |
| | | | 2,494 | | | 2,466 | |
| Retained earnings (deficit) | | | 288 | | | (130 | ) |
| Currency translation adjustment | | | 280 | | | 264 | |
| | |
| |
| |
| | | | 3,062 | | | 2,600 | |
| Share purchase plan | | | (3 | ) | | (3 | ) |
| | |
| |
| |
| | | $ | 3,059 | | $ | 2,597 | |
| | |
| |
| |
Preferred Shares Series F
The Company had 3,246,057 (2003 — 3,246,057) Cumulative, Redeemable Preferred Shares, Series F (the "Series F Preferred Shares") outstanding at December 31, 2004.
Prior to November 1, 2001, holders of Series F Preferred Shares received a quarterly fixed dividend at a rate of 5.8% per annum. On November 1, 2001, the Series F Preferred Shares commenced paying a monthly floating dividend based on a dividend rate that fluctuates over time between 50% and 100% of Prime for each month. The dividend rate is adjusted upwards or downwards on a monthly basis by an Adjustment Factor whenever the Calculated Trading Price, being the market price of the Series F Preferred Shares, is Cdn$24.875 or less or Cdn$25.125 or more, respectively. The Adjustment Factor for a month is based on the Calculated Trading Price of the Series F Preferred Shares for the preceding month. The maximum Adjustment Factor for any month is ±4.00%. The annual floating dividend rate for any month is Prime multiplied by the Designated Percentage for such month (the Adjustment Factor for such month plus the Designated Percentage for the preceding month).
Holders of Series F Preferred Shares had the right to convert their shares, effective on November 1, 2001, on a one-for-one basis into Cumulative, Redeemable Preferred Shares, Series G (the "Series G Preferred Shares"). Of the 12,000,000 outstanding Series F Preferred Shares, 8,753,943 were converted into Series G Preferred Shares. Holders will again have the right to convert their shares, on a one-for-one basis into Series G Preferred Shares on November 1, 2006, and every five years thereafter. On November 1, 2001, the Series F Preferred Shares became redeemable, at the option of the Company, at Cdn$25.50 per share plus unpaid and accrued dividends.
63
Preferred Shares Series G
The Company had 8,753,943 (2003 — 8,753,943) Series G Preferred Shares outstanding at December 31, 2004. These Series G Preferred Shares were issued as a result of the conversion of the same number of Series F Preferred Shares into Series G Preferred Shares on November 1, 2001.
For each of the five years commencing November 1, 2001, holders of Series G Preferred Shares will receive, as and when declared by the Board of Directors, a quarterly fixed dividend at a rate of 6.10% per annum. On November 1, 2006, the Series G Preferred Shares will be redeemable, at the option of the Company, at Cdn$25.00 per share plus unpaid and accrued dividends. Subject to certain conditions, holders of Series G Preferred Shares will have the right to convert their shares into Series F Preferred Shares on a one-for-one basis on November 1, 2006 and on November 1 of every fifth year thereafter.
Preferred Shares Series H
The Company completed a public offering of Cumulative Preferred Shares, Series H for aggregate gross proceeds of Cdn$150 million on March 25, 2003. At December 31, 2004, there were 6,000,000 (2003 — 6,000,000) Series H Preferred Shares outstanding.
Holders of the Series H Preferred Shares are entitled to fixed cumulative preferential cash dividends, if, as and when declared by the Company's Board of Directors, at a rate of Cdn$1.625 per share per annum, payable quarterly, in equal installments of Cdn$0.40625 per share, on the last day of March, June, September and December of each year.
On and after March 31, 2008, the Company may, at its option (i) redeem the outstanding Series H Preferred Shares in whole at any time or in part from time to time, by the payment of Cdn$25.00 per share, together with all accrued and unpaid dividends up to but excluding the date fixed for redemption; or (ii) subject, if required, to stock exchange approvals, convert the outstanding Series H Preferred Shares into Noranda common shares. The number of common shares into which each Series H Preferred Share may be so converted will be determined by dividing the redemption price per Series H Preferred Share, together with all accrued and unpaid dividends up to but excluding the date fixed for conversion, by the greater of Cdn$2.00 and 95% of the current market price of Noranda common shares at such time.
On or after June 30, 2008, each Series H Preferred Share will be convertible at the option of the holder on the last day of March, June, September and December in each year into that number of Noranda common shares determined by dividing Cdn$25.00, together with all accrued and unpaid dividends up to but excluding the date fixed for conversion, by the greater of Cdn$2.00 and 95% of the current market price of Noranda common shares at such time. If a holder of Series H Preferred Shares elects to convert any of those shares into Noranda common shares, the Company may, on not less than 20 days notice prior to the conversion date, elect to redeem those Series H Preferred Shares for Cdn$25.00 per share, together with all accrued and unpaid dividends up to but excluding the date fixed for conversion or arrange for the sale of those shares to substitute purchasers at such price.
Preferred Shares Series I
The Company completed a private placement of 6,000,000 Cumulative Preferred Shares, Series I to Brascan Corporation for aggregate gross proceeds of Cdn$150 million on April 25, 2003. On August 18, 2003, the Company redeemed all Series I Preferred Shares with a portion of the net proceeds it received from the issuance of the 24,800,000 common shares issued on August 11, 2003. As a result of this redemption, a foreign exchange loss of $5 was recorded in retained earnings.
64
Common Share Issue
On August 12, 2003, the Company completed a public issue of 48,520,000 common shares at a price of Cdn$12.65 for net proceeds of Cdn$601 million. Brascan Corporation subscribed for 20,000,000 shares from this issue.
Non-voting Participating Shares
The authorized and unissued non-voting participating shares participate ratably with the holders of common shares in dividends and distributions of the assets of the Company.
Summary of Common Share Transactions
| | Shares (000)
| | Amount
|
|---|
| Common shares, December 31, 2002 | | 241,289 | | $ | 1,595 |
| Issue of common shares | | 48,520 | | | 434 |
| Issued on exercise of stock options | | 373 | | | 5 |
| Issued under dividend re-investment | | 5,046 | | | 50 |
| | |
| |
|
| Common shares, December 31, 2003 | | 295,228 | | $ | 2,084 |
| | |
| |
|
| Issued on exercise of stock options | | 1,704 | | | 22 |
| Issued under dividend re-investment | | 38 | | | 1 |
| | |
| |
|
| Common shares, December 31, 2004 | | 296,970 | | $ | 2,107 |
| | |
| |
|
Earnings Per Share
Earnings per share is determined by dividing net income, after deducting preferred share dividends of $20 (2003 — $21) and the equity portion of the convertible debenture interest of $3 (2003 — $3), by the weighted-average number of common shares outstanding during the year, excluding shares securing employee share purchase loans of 296,245,753 (2003 — 261,618,375).
Diluted earnings per share assumes that outstanding dilutive stock options are exercised at the beginning of the period (or at the time of issuance, if later) and the proceeds are used to purchase common stock at the average market price during the period, and that dilutive convertible debentures are converted into common shares at the beginning of the period.
Diluted earnings per share is determined by dividing net income (loss) attributable to common shares, after adding the dilutive effect of convertible debentures of $3 (2003 — $nil), by the diluted weighted average number of shares 303,789,960 (2003 — 261,618,375).
Share Purchase Plan
In 1998, 2001 and 2002, loans were issued to executives of the Company for the purchase of common shares under the share purchase plan. The loans are repayable on demand, mature in ten years, and are secured by a pledge of 331,950 common shares at December 31, 2004 (2003 — 331,950). Loans receivable at December 31, 2004 of $3 (2003 — $3) are recorded as a reduction of shareholders' equity, and upon loan repayment there will be a corresponding increase in shareholders' equity. As of December 31, 2004, the fair value of the common shares pledged was $6.
Stock Options
The Company has a stock option plan through which options may be granted to directors, officers and employees for the purchase of common shares. Options were granted at prices equal to the five-day average price prior to the grant. Stock options generally have a 10-year term and contain vesting provisions of 20% on the first anniversary following the date of the grant, and a further 20% on each of the four subsequent anniversary dates. Stock options granted from January 1, 2000 to February 28, 2002 have a 10-year term and the same vesting provisions; however, they also contain an accelerated vesting feature specifying that on the first day that the market price of the common shares is 20% greater than the exercise price of the option, the final tranche of certain unvested options outstanding on that date will immediately vest and be exercisable.
During 2004, three stock option series were granted totaling 882,000 options at a weighted-average price of Cdn$20.42. The compensation expense associated with these stock options series was calculated using the Black-Scholes valuation model assuming the following weighted-average parameters; 10-year term, 25% volatility, expected dividend of 1.86% annually and an interest rate of 4.33%. The stock option value is charged against net income over its vesting period.
65
Corporate and general administration expenses to December 31, 2004 include compensation costs of $4 (2003 — $3) relating to outstanding options granted since January 1, 2002.
A summary of the status of the stock option plan and changes during the years is presented below:
| | 2004
| | 2003
|
|---|
| | Options
(000)
| | Weighted-
average exercise
price (Cdn$)
| | Options (000)
| | Weighted-
average exercise
price (Cdn$)
|
|---|
| Outstanding, beginning of year | | 9,584 | | $ | 16.35 | | 8,591 | | $ | 16.65 |
| Granted | | 882 | | | 20.42 | | 1,422 | | | 14.45 |
| Exercised | | (1,704 | ) | | 16.47 | | (373 | ) | | 15.92 |
| Cancelled | | (1,346 | ) | | 16.64 | | (56 | ) | | 16.85 |
| | |
| |
| |
| |
|
| Outstanding, end of year | | 7,416 | | $ | 16.75 | | 9,584 | | $ | 16.35 |
| | |
| |
| |
| |
|
The following table summarizes information about stock options outstanding at December 31, 2004:
| | Options outstanding
| | Options exercisable
|
|---|
Range of exercice prices
| | Number (000)
outstanding at
December 31,
2004
| | Weighted-average
remaining
contractual life
(years)
| | Weighted-average
exercise price
(Cdn$)
| | Number (000)
exercisable at
December 31,
2004
| | Weighted-average
exercise price
(Cdn$)
|
|---|
| $12.67 to $17.88 | | 5,537 | | 7.2 | | $ | 15.50 | | 3,539 | | $ | 15.95 |
| $18.00 to $19.29 | | 640 | | 5.8 | | | 18.73 | | 460 | | | 19.01 |
| $20.37 to $24.17 | | 1,239 | | 7.8 | | | 21.31 | | 388 | | | 23.27 |
| | |
| |
| |
| |
| |
|
| | | 7,416 | | 7.2 | | $ | 16.75 | | 4,387 | | $ | 16.92 |
| | |
| |
| |
| |
| |
|
Director Deferred Stock Unit Plan
Under the Deferred Stock Unit (DSU) Plan for the Company's non-employee directors, each eligible director may elect to be paid annual retainer fees and/or meeting attendance fees in DSUs rather than in cash. A DSU is a notional unit, equivalent in value to a common share.
Deferred stock units are credited with "dividend equivalents" when dividends are paid on the common shares of the Company, and such dividend equivalents are converted into additional units based on the fair market value of common shares on the date credited.
Payment of DSUs is not made until such time as the director leaves the Board, and may be in cash or in common shares of the Company purchased on the open market.
As of December 31, 2004 the total DSUs held by participating directors was 61,351 (2003 — 44,108), the accrual in respect of which is not significant at December 31, 2004 and 2003.
Management Deferred Share Unit Plan (MDSUP)
Management deferred share units ("Units") may be granted each year at the discretion of the Board to senior executives in lieu of all or part of their annual cash bonus awards. The annual bonus awards would be converted to Units based on a rate set on the award date. The portion of the annual bonus award elected to be received in Units by the executive may, at the discretion of the H.R. Committee, be increased by a factor of up to two times for purposes of calculating the number of Units to be allocated under the MDSUP.
An executive who holds Units will receive additional Units as dividends are paid on the common shares of the Company, on the same basis as if the dividends were reinvested pursuant to the Company's dividend reinvestment plan. The Units will vest over a five-year period and participants will only be allowed to redeem the Units upon cessation of employment.
The cash value of the Units when redeemed will be equivalent to the market value of an equivalent number of Noranda common shares at the time of cessation of employment with the Company.
66
As of December 31, 2004, a total of 44,274 Units were held by executives of the Company (2003 — 33,666), the accrual in respect of which is not significant at December 31, 2004 and 2003.
Dividend Reinvestment Plan
Canadian resident shareholders may elect to reinvest their cash dividends from common shares to purchase additional shares. During 2004, 37,910 (2003 — 5,046,641) common shares were issued under the dividend reinvestment plan.
13 Income and Production Taxes
The provision for income and production taxes differs from the amount that would have resulted by applying statutory income tax rates to earnings as described below. The difference arose for the following reasons:
| | 2004
| | 2003
| |
|---|
| Income before the following: | | | | | | | |
| | Income and production taxes and minority interest | | $ | 1,181 | | $ | 131 | |
| | |
| |
| |
| Provision based on combined federal and composite provincial tax rate of 37.6% (2003 — 38.6%) | | $ | 444 | | $ | 51 | |
| Increase (decrease) in taxes resulting from: | | | | | | | |
| | Resource and depletion allowances | | | (26 | ) | | (6 | ) |
| | Royalties and mineral taxes | | | 22 | | | 7 | |
| | Rate differences from foreign and manufacturing activities | | | (116 | ) | | (50 | ) |
| | Non-taxable items | | | (57 | ) | | (20 | ) |
| | Capital taxes | | | 7 | | | 13 | |
| | Foreign exchange adjustments | | | 41 | | | 18 | |
| | Non-recurring and other | | | 18 | | | 7 | |
| | |
| |
| |
| Income and production taxes | | $ | 333 | | $ | 20 | |
| | |
| |
| |
Consolidated income and production taxes are as follows:
| | 2004
| | 2003
| |
|---|
| Current: | | | | | | | |
| | Federal and provincial income taxes | | $ | 27 | | $ | 16 | |
| | Provincial mining taxes | | | 5 | | | 2 | |
| | Foreign taxes | | | 75 | | | 35 | |
| | |
| |
| |
| | | $ | 107 | | $ | 53 | |
| | |
| |
| |
| Future: | | | | | | | |
| | Federal and provincial income taxes | | $ | 32 | | $ | (55 | ) |
| | Provincial mining taxes | | | 18 | | | 4 | |
| | Foreign taxes | | | 176 | | | 18 | |
| | |
| |
| |
| | | $ | 226 | | $ | (33 | ) |
| | |
| |
| |
| | | $ | 333 | | $ | 20 | |
| | |
| |
| |
67
The components of the future tax asset and future tax liability at December 31, 2004 and 2003 are as follows:
| | 2004
| | 2003
| |
|---|
| | Legal entities where
| | Legal entities where
| |
|---|
| | assets exceed liabilities
| | liabilities exceed assets
| | assets exceed liabilities
| | liabilities exceed assets
| |
|---|
| Future tax assets: | | | | | | | | | | | | | |
| | Property, plant and equipment | | $ | 15 | | $ | — | | $ | — | | $ | — | |
| | Pensions | | | — | | | — | | | 1 | | | — | |
| | Post-retirement benefits | | | — | | | 69 | | | 21 | | | 59 | |
| | Asset retirement obligation | | | 50 | | | 51 | | | 54 | | | 30 | |
| | Exploration | | | 30 | | | 15 | | | 15 | | | — | |
| | Inventory valuations | | | — | | | 10 | | | 3 | | | 6 | |
| | Non capital losses | | | 74 | | | 95 | | | 55 | | | 197 | |
| | Research and development | | | 86 | | | 21 | | | 79 | | | 16 | |
| | Other | | | 167 | | | 39 | | | 120 | | | 53 | |
| | |
| |
| |
| |
| |
| | | $ | 422 | | $ | 300 | | $ | 348 | | $ | 361 | |
| | |
| |
| |
| |
| |
| Future tax liabilities: | | | | | | | | | | | | | |
| | Property plant and equipment | | $ | — | | $ | (473 | ) | $ | (30 | ) | $ | (407 | ) |
| | Development and preproduction | | | (5 | ) | | (210 | ) | | (5 | ) | | (177 | ) |
| | Foreign exchange | | | (27 | ) | | (33 | ) | | (18 | ) | | (9 | ) |
| | Pensions | | | (6 | ) | | (28 | ) | | (50 | ) | | (12 | ) |
| | Exploration | | | — | | | — | | | (2 | ) | | — | |
| | Other | | | (92 | ) | | (152 | ) | | (5 | ) | | (40 | ) |
| | |
| |
| |
| |
| |
| | | $ | (130 | ) | $ | (896 | ) | $ | (110 | ) | $ | (645 | ) |
| | |
| |
| |
| |
| |
| Net future tax asset (liability) | | $ | 292 | | $ | (596 | ) | $ | 238 | | $ | (284 | ) |
| | |
| |
| |
| |
| |
The Company has non-resident subsidiaries that have tax losses of $nil (2003 — $106) for which no benefit has been recorded. If the tax benefit had been recorded, the amount would have been $nil (2003 — $21).
14 Financial Instruments
Noranda uses various strategies to manage its market risk, including the use of derivative contracts to limit, offset or reduce the Company's market exposure. Derivative instruments are used to manage well-defined commodity price, foreign exchange and interest rate risks arising from Noranda's primary business activities. The fair values of Noranda's derivative instruments, as summarized later in this note, are based on quoted market prices for similar instruments and on market closing prices at year end.
Effective July 1, 2003, Noranda's functional currency was changed from the Canadian to U.S. dollar. Following this change, Noranda realigned its hedging programs to manage the risk associated with its non-U.S. dollar investments and monetary assets and liabilities, as well as change its cash flow hedging program to now hedge the exposure created by its non-U.S. dollar expenses.
a) Fixed Forward Price Hedges
Some customers request a fixed sales price instead of the COMEX or London Metal Exchange ("LME") average price in the month of shipment. Noranda enters into futures contracts that will allow it to receive the COMEX or LME average price in the month of shipment while customers pay the agreed upon fixed price. Noranda accomplishes this by settling the futures contracts during the month of shipment, which generally results in the realization of the COMEX or LME average price.
At December 31, 2004, the mark-to-market value of these positions was a gain of $8 (2003 — gain of $9).
68
b) Commodity Hedges
Noranda purchases metal in concentrate or scrap to be processed eventually into refined metal for sale to customers. The raw material feed is purchased from third parties at prices that are often different from the eventual sale price to metal customers, largely due to the timing of processing. To mitigate the price risk resulting from the difference between the timing of purchases and sales, Noranda hedges such transactions. The hedge transactions involve the purchase or sale of over-the-counter or LME or COMEX exchange-traded contracts. In the month that the refined metal is sold, the corresponding commodity hedge position is liquidated at the COMEX or LME average price for the month of sale.
As at December 31, 2004, the mark-to-market unrealized loss was $1 (2003 — unrealized loss of $18).
c) Hedges of Foreign-denominated Expenditures
Prior to July 1, 2003, Noranda managed a foreign currency cash flow hedging program whereby portions of its forecasted U.S. dollar-denominated revenue were hedged with forward foreign exchange contracts with its banks. Subsequent to the change, Noranda started hedging its Canadian dollar costs using foreign currency exchange contracts. When the Canadian dollar strengthens significantly against the U.S. dollar, the increase in value of future Canadian dollar costs is partially offset by gains in the value of the forward currency contracts designated as hedges. Conversely, when the Canadian dollar weakens, the decrease in the value of future Canadian dollar costs is partially offset by losses in the value of the forward currency contracts.
At December 31, 2004, Noranda had forward currency exchange contracts to purchase Cdn$510 million maturing over the next 2.5 years at an average exchange rate of Cdn$1.44. In addition, Noranda's partially-owned subsidiary also had option contracts that, if exercised, would result in the purchase of Cdn$50 million over the next twelve months. The mark-to-market value of these positions at December 31, 2004 was a gain of $71.
In addition, Noranda's partially-owned subsidiary also maintains a program to hedge its Norwegian Kroner and Chilean Peso expenditures. At December 31, 2004, Noranda's partially-owned subsidiary entered into other short-term forward foreign exchange contracts to hedge its Norwegian and Chilean commitments, whereby it would purchase notional amounts with a U.S. dollar equivalent of $9 (2003 — $81) and also entered into various short-term forward foreign option contracts which, if exercised, would have resulted in the purchase of 135 million Norwegian Kroner (2003 — 210 million). At December 31, 2004, the mark-to-market value of these contracts was a gain of $4 (2003 — mark-to-market gain of $17).
Noranda's operating costs to December 31, 2004 include realized exchange gains from the settlement of various cost hedge contracts of $77 (2003 — exchange gain in revenue of $18 and exchange gain in operating costs of $16).
d) Hedge of Net Investment in Foreign Operations
The Company uses forward foreign exchange contracts and foreign-denominated obligations to protect the value of its investments in its self-sustaining foreign subsidiaries.
At December 31, 2003, the Company had outstanding foreign exchange contracts to sell Cdn$82 million, maturing over the next eight years, designated as hedges against Canadian dollar net assets. In addition, a series of short-term foreign exchange contracts to sell Cdn$134 million are designated as hedges against foreign-denominated monetary assets of the Company. The Company's partially-owned subsidiary had a series of short-term foreign exchange contracts to purchase a notional amount of Cdn$510 million as a hedge against foreign-denominated monetary assets and liabilities. As at December 31, 2003, the unrealized loss on these contracts was $27.
69
At December 31, 2004, the Company had outstanding foreign exchange contracts to sell Cdn$77 million, maturing over the next seven years, designated as hedges against Canadian dollar net assets. In addition, a series of foreign exchange contracts to buy Cdn$40 million and sell Cdn$23 million are designated as hedges against foreign-denominated monetary liabilities and net monetary assets of the Company. The Company's partially-owned subsidiary had a series of short-term foreign exchange contracts to purchase a notional amount of Cdn$520 million as a hedge against foreign-denominated monetary assets and liabilities. As at December 31, 2004, the unrealized loss on these contracts was $75.
The Company has also entered into short-term forward foreign exchange contracts to sell £3 million (2003 — £4 million) and purchase U.S. dollars as a hedge against pounds sterling net assets. At December 31, 2004 and 2003, the fair value of these contracts approximated their carrying value.
Derivative financial instruments involve credit and market risk. Credit risk arises from the potential for a counterparty to default on its contractual obligations and is limited to those contracts where the Company would incur a loss in replacing the defaulted transaction. The Company minimizes credit risk through the selection, monitoring and diversification of counterparties, use of the International Swaps and Derivatives Association (ISDA) documentation and master netting agreements, collateral and other credit mitigation techniques.
15 Commitments and Contingencies
- a)
- On July 1, 2003, the senior debt of the Antamina project became non-recourse to its sponsors, the Company, BHP Billiton PLC, Teck Cominco Limited and Mitsubishi Corporation, upon successful completion of a series of tests and following the delivery of the related certificates to the senior lenders.
- b)
- As a result of the sale of the CEZ processing facility to the Noranda Income Fund in 2002, the Company entered into a 15-year supply and processing agreement with the Fund. The Company has committed to sell up to 550,000 tonnes of zinc concentrate annually to the refinery (its annual concentrate requirement to operate to its full current capacity) at market rates for the payable metal, less a fixed treatment charge initially set at Cdn$0.352/lb. of "payable zinc metal." Commencing January 1, 2004, the Processing Fee will be the Processing Fee in the previous year adjusted annually (i) upward by 1% and (ii) upward or downward by 10% of the year-over-year percentage change in the average cost of electricity per megawatt hour for the Processing Facility. "Payable zinc metal" in respect of a quantity of concentrate will be equal to 96% of the assayed zinc metal content in the concentrate under the Supply and Processing Agreement.
The Company has also committed to manage the processing facility through operating and marketing agreements and will act as an agent for the sale of the facility's zinc production for the duration of the supply agreement.
- c)
- From time to time, Noranda is involved in litigation, investigations or proceedings relating to claims arising out of its operations in the ordinary course of business. In the opinion of Noranda's management, these claims and lawsuits in the aggregate will not have a material adverse effect on the consolidated financial statements.
70
16 Related-party Transactions
- a)
- Noranda's ownership interest in the Noranda Income Fund was 25% during the year (see Note 3). Included in revenues are $7 (2003 — $7) representing the Company's share of income from the Fund accounted for under the equity method.
Noranda has entered into a Supply and Processing Agreement and a Management Service Agreement with the Fund which have contracted Noranda to provide concentrate and services to the Fund on a regular basis (see Note 15). Noranda has sold $127 (2003 — $79) of concentrate to the Fund at their negotiated value. As of December 31, 2004, Noranda has a receivable of $16 (2003 — $9) from the Fund. Noranda has also provided $56 (2003 — $46) of administration, management and operating services to the Fund at their negotiated value. As of December 31, 2004, Noranda has a receivable of $11 (2003 — $7) from the Fund due to the services provided. In addition, Noranda has made purchases of $29 (2003 — $57) of zinc metals and by-products at terms that reflect market rates. Noranda has sold metals and operating supplies of $5 (2003 — $5) at terms that reflect market rates. Included in accounts payable as at December 31, 2004 is $8 (2003 — $5) of amounts due to the Fund. Included in accounts receivable as at December 2004 is $1 (2003 — $1) of amounts due from the Fund.
- b)
- Noranda has undertaken a number of transactions with Antamina in which Noranda has a 33.75% ownership interest. Included in raw material costs are purchases of concentrate of $159 (2003 — $49) from Antamina at their market value. As of December 31, 2004, Noranda has a payable of $42 (2003 — $13) to Antamina.
During 2004, Noranda has made purchases of goods of $3 (2003 — $120) from its affiliates. These transactions were measured at their exchange amount. As of December 31, 2004, Noranda has a payable of $nil (2003 — $12) to its affiliates.
- c)
- Noranda has entered into short-term financing transactions with affiliates and associates from time to time at market interest rates. Noranda has revolving credit facilities totaling Cdn$25 million with an affiliate, maturing January 2006. As of December 31, 2004, Noranda has made no drawdown against the credit facilities.
- d)
- Noranda Aluminum Inc. ("Aluminum"), a wholly-owned subsidiary of Noranda Inc., has entered into a power supply contract with Brascan Energy Marketing Inc. ("BEMI"). BEMI, an affiliate of the Company, agreed to provide Aluminum's New Madrid primary aluminum smelter up to 490 MWh of electricity annually for a two-year period commencing June 1, 2003. Noranda has purchased $127 (2003 — $73) under this contract.
- e)
- Noranda has sold certain trade receivables to a securitization trust which is owned by Brascan Financial Corporation for a total of $315 (2003 — $20) in cash, under an agreement that came into effect on November 13, 2003.
- f)
- Included in accounts receivable are loans receivable from officers of the Company in the amount of $3 (2003 — $3), secured by collateral that has market values in excess of cost for both years.
The above transactions have been recorded at their exchange amounts.
17 Post-employment Costs
Noranda has a number of defined benefit plans providing pension, health, dental and life insurance benefits to substantially all employees after one or two years of continuous service. Pension benefits are calculated based upon length of service and either final average earnings or a specific amount per year of service. Hourly employees are generally members of negotiated plans.
Defined benefit plan assets consist primarily of cash, equity securities and fixed income securities. The defined benefit plan holds less than 1% of its assets in common shares of Noranda and its related parties.
Noranda's funding policy is to contribute amounts sufficient to meet minimum funding requirements as set forth by the regulations of the appropriate jurisdictions plus such additional amounts as Noranda may determine to be appropriate.
71
The obligation for benefits and the benefits expenses under these plans are determined through periodic actuarial reports that are based on the following weighted average assumptions:
| | Pension Benefit Plans
|
|---|
| | December 31, 2004
| | December 31, 2003
|
|---|
| | Company and
wholly-owned subsidiaries
| | Partially-owned
subsidiaries and joint ventures
| | Company and
wholly-owned subsidiaries
| | Partially-owned
subsidiaries and joint ventures
|
|---|
| Assumptions used to calculate benefit obligations: | | | | | | | | |
| | Discount rate | | 5.76% | | 5.75% | | 6.25% | | 6.25% |
| | Rate of compensation increase | | 3.65% | | 3.50% | | 3.75% | | 3.50% |
| Assumptions used to calculate benefit expense: | | | | | | | | |
| | Discount rate | | 6.25% | | 6.25% | | 6.75% | | 6.75% |
| | Expected long-term rate of return | | 7.32% | | 7.00% | | 7.35% | | 7.00% |
| | Rate of compensation increase | | 3.81% | | 3.50% | | 3.75% | | 3.50% |
| | Other Benefit Plans
|
|---|
| | December 31, 2004
| | December 31, 2003
|
|---|
| | Company and
wholly-owned subsidiaries
| | Partially-owned
subsidiaries and joint ventures
| | Company and
wholly-owned subsidiaries
| | Partially-owned
subsidiaries and joint ventures
|
|---|
| Assumptions used to calculate benefit obligations: | | | | | | | | |
| | Discount rate | | 5.80% | | 5.75% | | 6.25% | | 6.25% |
| | Rate of compensation increase | | 3.67% | | na | | 3.66% | | na |
| Assumptions used to calculate benefit expense: | | | | | | | | |
| | Discount rate | | 6.25% | | 6.25% | | 6.75% | | 6.75% |
| | Rate of compensation increase | | 3.67% | | na | | 3.66% | | na |
- na:
- not applicable
The cost of pension and other post-retirement benefits earned by employees is actuarially determined using the projected benefit method pro-rated on service and management's best estimate of expected plan investment performance, salary escalation, retirement ages of employees and health care costs. Plan obligations are discounted using rates that reflect the market yields as of the measurement date on high-quality debt instrument with cash flows that match expected benefit payments.
72
The health care cost trend rate is assumed to be the following:
| | Health Care Cost Trends
|
|---|
| | December 31, 2004
| | December 31, 2003
|
|---|
| | Company and
wholly-owned subsidiaries
| | Partially-owned
subsidiaries and joint ventures
| | Company and
wholly-owned subsidiaries
| | Partially-owned
subsidiaries and joint ventures
|
|---|
| Initial medical trend rate | | 8.14% | | 8.50% | | 8.20% | | 9.00% |
| Ultimate medical trend rate | | 4.52% | | 4.50% | | 4.50% | | 4.50% |
| Number of years to reach trend rate | | 9 | | 8 | | 9 | | 9 |
| Initial and ultimate dental trend rate | | 4.00% | | 4.00% | | 4.00% | | 4.00% |
| | |
| |
| |
| |
|
In 2004, Noranda ratified new collective agreements at four of its operations that had an impact on pension benefits. Included in these agreements was an increase in the pension plan benefits that amounts to an average of 6.5% at the end of three years, as well as provisions for early retirements.
The funded status of Noranda's post-employment benefit plans and net accrued benefit asset (obligation) are as follows:
| | Pension Benefit Plans
| |
|---|
| | December 31, 2004
| | December 31, 2003
| |
|---|
| | Plans where assets exceed benefit obligations
| | Plans where benefit obligations exceed assets
| | Net
| | Plans where assets exceed benefit obligations
| | Plans where benefit obligations exceed assets
| | Net
| |
|---|
| Plan assets | | $ | 947 | | 921 | | $ | 1,868 | | $ | 714 | | 889 | | $ | 1,603 | |
| Benefit obligations | | | 833 | | 1,202 | | | 2,035 | | | 580 | | 1,184 | | | 1,764 | |
| | |
| |
| |
| |
| |
| |
| |
| Excess (deficit) of plan assets over benefit obligations | | | 114 | | (281 | ) | | (167 | ) | | 134 | | (295 | ) | | (161 | ) |
| | |
| |
| |
| |
| |
| |
| |
| Net accrued asset | | | | | | | $ | 289 | | | | | | | $ | 208 | |
| | | | | | | |
| | | | | | |
| |
| | Other Benefit Plans
| |
|---|
| | December 31, 2004
| | December 31, 2003
| |
|---|
| | Plans where assets exceed benefit obligations
| | Plans where benefit obligations exceed assets
| | Net
| | Plans where assets exceed benefit obligations
| | Plans where benefit obligations exceed assets
| | Net
| |
|---|
| Plan assets | | $ | 30 | | — | | $ | 30 | | $ | 18 | | 7 | | $ | 25 | |
| Benefit obligations | | | 24 | | 349 | | | 373 | | | 16 | | 309 | | | 325 | |
| | |
| |
| |
| |
| |
| |
| |
| Excess (deficit) of plan assets over benefit obligations | | | 6 | | (349 | ) | | (343 | ) | | 2 | | (302 | ) | | (300 | ) |
| | |
| |
| |
| |
| |
| |
| |
| Net accrued liability | | | | | | | $ | 277 | | | | | | | $ | 250 | |
| | | | | | | |
| | | | | | |
| |
The measurement date used for financial reporting purposes of the plan assets and benefit obligations is December 31, 2004. For material plans, the most recent actuarial valuations filed for funding purposes were prepared as of December 31, 2003, with the exception of the Retirement Annuity Plan which was prepared as of December 31, 2002. With respect to Falconbridge's significant Canadian pension plans, the most recent actuarial valuations required for funding purposes were prepared as of January 1, 2004 and the effective date of the next required funding actuarial valuations is January 1, 2005. Actuarial valuations are generally required every three years. Falconbridge and U.S. Plans have valuations every year.
73
The change in the funded status of Noranda's post-employment benefit plans was as follows:
| | December 31, 2004
| |
|---|
| | Pension Benefit Plans
| | Other Benefit Plans
| |
|---|
| | Company and
wholly-owned subsidiaries
| | Partially-owned
subsidiaries and joint ventures
| | Total
| | Company and
wholly-owned subsidiaries
| | Partially-owned
subsidiaries and joint ventures
| | Total
| |
|---|
| Change in Benefit Obligation | | | | | | | | | | | | | | | | | | |
| Obligation at beginning of year | | $ | 925 | | | 839 | | $ | 1,764 | | $ | 79 | | 246 | | $ | 325 | |
| Current service | | | 16 | | | 10 | | | 26 | | | 3 | | 5 | | | 8 | |
| Benefits paid | | | (62 | ) | | (61 | ) | | (123 | ) | | (5 | ) | (14 | ) | | (19 | ) |
| Interest cost on benefit obligation | | | 56 | | | 52 | | | 108 | | | 5 | | 15 | | | 20 | |
| Plan amendments | | | (2 | ) | | 6 | | | 4 | | | — | | — | | | — | |
| Actuarial losses | | | 71 | | | 56 | | | 127 | | | — | | 14 | | | 14 | |
| Effect of exchange rate change | | | 62 | | | 66 | | | 128 | | | 5 | | 20 | | | 25 | |
| Increase due to curtailment/settlement | | | — | | | 1 | | | 1 | | | — | | — | | | — | |
| | |
| |
| |
| |
| |
| |
| |
| Obligation at end of year | | $ | 1,066 | | | 969 | | $ | 2,035 | | $ | 87 | | 286 | | $ | 373 | |
| | |
| |
| |
| |
| |
| |
| |
Change in Plan Assets |
|
|
|
|
|
|
|
|
|
|
|
|
|
|
|
|
|
|
| Fair value of assets at beginning of year | | $ | 951 | | | 652 | | $ | 1,603 | | $ | 7 | | 18 | | $ | 25 | |
| Employer contributions | | | 28 | | | 79 | | | 107 | | | 5 | | 15 | | | 20 | |
| Benefits paid | | | (62 | ) | | (61 | ) | | (123 | ) | | (5 | ) | (14 | ) | | (19 | ) |
| Surplus paid out to employer | | | (2 | ) | | — | | | (2 | ) | | — | | — | | | — | |
| Return on plan assets | | | 104 | | | 63 | | | 167 | | | — | | 1 | | | 1 | |
| Effect of exchange rate change | | | 61 | | | 55 | | | 116 | | | 1 | | 2 | | | 3 | |
| | |
| |
| |
| |
| |
| |
| |
| Fair value assets at end of year | | $ | 1,080 | | $ | 788 | | | 1,868 | | $ | 8 | | 22 | | $ | 30 | |
| | |
| |
| |
| |
| |
| |
| |
Surplus (deficit) status of plan at end of year |
|
$ |
14 |
|
|
(181 |
) |
$ |
(167 |
) |
$ |
(79 |
) |
(264 |
) |
$ |
(343 |
) |
| Unamortized: | | | | | | | | | | | | | | | | | | |
| | Past service costs | | | 17 | | | 5 | | | 22 | | | (2 | ) | (1 | ) | | (3 | ) |
| | Net actuarial (gains) losses | | | 178 | | | 256 | | | 434 | | | (4 | ) | 73 | | | 69 | |
| | |
| |
| |
| |
| |
| |
| |
Accrued benefit asset (liability) |
|
$ |
209 |
|
|
80 |
|
$ |
289 |
|
$ |
(85 |
) |
(192 |
) |
$ |
(277 |
) |
| | |
| |
| |
| |
| |
| |
| |
74
| | December 31, 2003
| |
|---|
| | Pension Benefit Plans
| | Other Benefit Plans
| |
|---|
| | Company and
wholly-owned subsidiaries
| | Partially-owned
subsidiaries and joint ventures
| | Total
| | Company and
wholly-owned subsidiaries
| | Partially-owned
subsidiaries and joint ventures
| | Total
| |
|---|
| Change in Benefit Obligation | | | | | | | | | | | | | | | | | |
| Obligation at beginning of year | | $ | 738 | | 657 | | $ | 1,395 | | $ | 66 | | 165 | | $ | 231 | |
| Current service | | | 13 | | 11 | | | 24 | | | 2 | | 3 | | | 5 | |
| Benefits paid | | | (64 | ) | (58 | ) | | (122 | ) | | (5 | ) | (13 | ) | | (18 | ) |
| Interest cost on benefit obligation | | | 53 | | 52 | | | 105 | | | 5 | | 13 | | | 18 | |
| Plan amendments | | | 22 | | — | | | 22 | | | — | | — | | | — | |
| Actuarial (gains) losses | | | 35 | | 52 | | | 87 | | | (2 | ) | 43 | | | 41 | |
| Effect of exchange rate change | | | 131 | | 131 | | | 262 | | | 13 | | 35 | | | 48 | |
| Transfer (to) from other plans | | | — | | 1 | | | 1 | | | — | | — | | | — | |
| Decrease due to curtailment/settlement | | | | | | | | | | | | | | | | | |
| | | | | (3 | ) | (7 | ) | | (10 | ) | | — | | — | | | — | |
| | |
| |
| |
| |
| |
| |
| |
| Obligation at end of year | | $ | 925 | | 839 | | $ | 1,764 | | $ | 79 | | 246 | | $ | 325 | |
| | |
| |
| |
| |
| |
| |
| |
Change in Plan Assets |
|
|
|
|
|
|
|
|
|
|
|
|
|
|
|
|
|
| Fair value of assets at beginning of year | | $ | 704 | | 481 | | $ | 1,185 | | $ | 7 | | 10 | | $ | 17 | |
| Employer contributions | | | 22 | | 65 | | | 87 | | | — | | 18 | | | 18 | |
| Benefits paid | | | (64 | ) | (55 | ) | | (119 | ) | | (2 | ) | (13 | ) | | (15 | ) |
| Return on plan assets | | | 158 | | 40 | | | 198 | | | 1 | | 1 | | | 2 | |
| Effect of exchange rate change | | | 134 | | 94 | | | 228 | | | 1 | | 2 | | | 3 | |
| Transfer (to) from other plans | | | (2 | ) | 1 | | | (1 | ) | | — | | — | | | — | |
| Settlement payments | | | (1 | ) | (6 | ) | | (7 | ) | | — | | — | | | — | |
| Actuarial losses | | | — | | 32 | | | 32 | | | — | | — | | | — | |
| | |
| |
| |
| |
| |
| |
| |
| Fair value assets at end of year | | $ | 951 | | 652 | | $ | 1,603 | | $ | 7 | | 18 | | $ | 25 | |
| | |
| |
| |
| |
| |
| |
| |
Surplus (deficit) status of plan at end of year |
|
$ |
26 |
|
(187 |
) |
$ |
(161 |
) |
$ |
(72 |
) |
(228 |
) |
$ |
(300 |
) |
| Unamortized: | | | | | | | | | | | | | | | | | |
| | Past service costs | | | 25 | | 1 | | | 26 | | | (2 | ) | 1 | | | (1 | ) |
| | Net actuarial (gains) losses | | | 136 | | 213 | | | 349 | | | (4 | ) | 55 | | | 51 | |
| | |
| |
| |
| |
| |
| |
| |
Accrued benefit asset (liability) |
|
$ |
187 |
|
27 |
|
$ |
214 |
|
$ |
(78 |
) |
(172 |
) |
$ |
(250 |
) |
| Valuation allowance | | | — | | (6 | ) | | (6 | ) | | — | | — | | | — | |
| | |
| |
| |
| |
| |
| |
| |
Accrued benefit asset (liability), net of valuation allowance |
|
$ |
187 |
|
21 |
|
$ |
208 |
|
$ |
(78 |
) |
(172 |
) |
$ |
(250 |
) |
| | |
| |
| |
| |
| |
| |
| |
Past service costs resulting from plan amendments are amortized over the remaining average service life of active employees. Past service costs from negotiated plan improvements are amortized over the term of the collective agreement.
For most plans, the net actuarial gain (loss) that exceeds 10% of the greater of the benefit obligation and the value of plan assets is amortized over the remaining service period of active employees. Accrued post-retirement benefits asset (liability) is recorded in pension and other provisions.
75
Noranda's post-employment benefit expense included the following components:
| | December 31, 2004
| |
|---|
| | Pension Benefit Plans
| | Other Benefit Plans
| |
|---|
| | Company and
wholly-owned subsidiaries
| | Partially-owned
subsidiaries and joint ventures
| | Total
| | Company and
wholly-owned subsidiaries
| | Partially-owned
subsidiaries and joint ventures
| | Total
| |
|---|
| Current Year Expense | | | | | | | | | | | | | | | | | |
| Current service, net of | | | | | | | | | | | | | | | | | |
| | employee contributions | | $ | 16 | | 10 | | $ | 26 | | $ | 2 | | 5 | | $ | 7 | |
| Interest cost on benefit | | | | | | | | | | | | | | | | | |
| | obligation | | | 56 | | 52 | | | 108 | | | 5 | | 15 | | | 20 | |
| Expected return on plan | | | | | | | | | | | | | | | | | |
| | assets | | | (68 | ) | (46 | ) | | (114 | ) | | — | | (1 | ) | | (1 | ) |
| Amortization of: | | | | | | | | | | | | | | | | | |
| | Past service costs | | | 7 | | 2 | | | 9 | | | — | | — | | | — | |
| | Net actuarial losses | | | 4 | | 13 | | | 17 | | | — | | 3 | | | 3 | |
| Valuation allowance | | | — | | (5 | ) | | (5 | ) | | — | | — | | | — | |
| | |
| |
| |
| |
| |
| |
| |
| Defined benefit pension expense | | $ | 15 | | 26 | | $ | 41 | | $ | 7 | | 22 | | $ | 29 | |
| Defined contribution expense | | | 4 | | 8 | | | 12 | | | — | | — | | | — | |
| | |
| |
| |
| |
| |
| |
| |
| Total expense | | $ | 19 | | 34 | | $ | 53 | | $ | 7 | | 22 | | $ | 29 | |
| | |
| |
| |
| |
| |
| |
| |
In 2004, Noranda introduced the option for employees to contribute directly to the long-term disability benefit plan.
| | December 31, 2004
|
|---|
| | Pension Benefit Plans
| | Other Benefit Plans
|
|---|
| | Company and
wholly-owned subsidiaries
| | Partially-owned
subsidiaries and joint ventures
| | Total
| | Company and
wholly-owned subsidiaries
| | Partially-owned
subsidiaries and joint ventures
| | Total
|
|---|
| Reconciliation of defined | | | | | | | | | | | | | | | | |
| | benefit expense recognized | | | | | | | | | | | | | | | | |
| | with defined benefits | | | | | | | | | | | | | | | | |
| | expense incurred: | | | | | | | | | | | | | | | | |
| Total deferred benefit | | | | | | | | | | | | | | | | |
| | expense recognized | | $ | 15 | | 26 | | $ | 41 | | $ | 7 | | 22 | | $ | 29 |
| Difference between: | | | | | | | | | | | | | | | | |
| | Expected and actual | | | | | | | | | | | | | | | | |
| | | return on plan assets | | | (36 | ) | (18 | ) | | (54 | ) | | — | | — | | | — |
| | Actuarial losses (gains) | | | | | | | | | | | | | | | | |
| | | amortized and actuarial | | | | | | | | | | | | | | | | |
| | | losses (gains) arising | | | 67 | | 44 | | | 111 | | | — | | 12 | | | 12 |
| | Past service costs | | | | | | | | | | | | | | | | |
| | | amortized and past | | | | | | | | | | | | | | | | |
| | | service costs arising | | | (9 | ) | 4 | | | (5 | ) | | — | | — | | | — |
| Change in valuation allowance | | | — | | 5 | | | 5 | | | — | | — | | | — |
| | |
| |
| |
| |
| |
| |
|
| Total defined benefit expense | | | | | | | | | | | | | | | | |
| | incurred | | $ | 37 | | 61 | | $ | 98 | | $ | 7 | | 34 | | $ | 41 |
| | |
| |
| |
| |
| |
| |
|
In 2002, Noranda offered its salaried employees the opportunity to switch from the current defined benefit plan to a defined contribution plan. Approximately 41% of salaried employees chose to make the switch with $15 in assets to be allocated to the defined contribution plan. Noranda is expecting regulatory approval for the defined contribution plan in 2005.
76
In 2003, one of Noranda's partially-owned subsidiaries offered certain groups of employees to switch from the current defined benefit plan to a defined contribution plan. Approximately 30% of eligible employees chose to make the switch with $7 in assets to be allocated to the defined contribution plan which is expected to be approved by the regulatory bureau in 2005.
| | December 31, 2003
| |
|---|
| | Pension Benefit Plans
| | Other Benefit Plans
| |
|---|
| | Company and
wholly-owned subsidiaries
| | Partially-owned
subsidiaries and joint ventures
| | Total
| | Company and
wholly-owned subsidiaries
| | Partially-owned
subsidiaries and joint ventures
| | Total
| |
|---|
| Current Year Expense | | | | | | | | | | | | | | | | | |
| Current service | | $ | 13 | | 11 | | $ | 24 | | $ | 2 | | 3 | | $ | 5 | |
| Interest cost on benefit obligation | | | 53 | | 52 | | | 105 | | | 5 | | 13 | | | 18 | |
| Expected return on plan assets | | | (55 | ) | (42 | ) | | (97 | ) | | — | | (1 | ) | | (1 | ) |
| Amortization of: | | | | | | | | | | | | | | | | | |
| | Past service costs | | | 13 | | 3 | | | 16 | | | — | | — | | | — | |
| | Net actuarial losses | | | 8 | | 14 | | | 22 | | | — | | 2 | | | 2 | |
| Loss on recognition of a settlement / curtailment | | | 1 | | 2 | | | 3 | | | — | | — | | | — | |
| Valuation allowance | | | — | | (1 | ) | | (1 | ) | | — | | — | | | — | |
| | |
| |
| |
| |
| |
| |
| |
| Defined benefit pension expense | | $ | 33 | | 39 | | $ | 72 | | $ | 7 | | 17 | | $ | 24 | |
| Defined contribution expense | | | 6 | | 8 | | | 14 | | | — | | — | | | — | |
| | |
| |
| |
| |
| |
| |
| |
| Total expense | | $ | 39 | | 47 | | $ | 86 | | $ | 7 | | 17 | | $ | 24 | |
| | |
| |
| |
| |
| |
| |
| |
| | December 31, 2003
|
|---|
| | Pension Benefit Plans
| | Other Benefit Plans
|
|---|
| | Company and
wholly-owned subsidiaries
| | Partially-owned
subsidiaries and joint ventures
| | Total
| | Company and
wholly-owned subsidiaries
| | Partially-owned
subsidiaries and joint ventures
| | Total
|
|---|
| Reconciliation of defined benefit expense recognized with defined benefits expense incurred: | | | | | | | | | | | | | | | | |
| Total deferred benefit expense recognized | | $ | 33 | �� | 39 | | $ | 72 | | $ | 7 | | 17 | | $ | 24 |
| Difference between: | | | | | | | | | | | | | | | | |
| | | Expected and actual return on plan assets | | | (103 | ) | (32 | ) | | (135 | ) | | — | | — | | | — |
| | | Actuarial losses (gains) amortized and actuarial losses (gains) arising | | | 27 | | 38 | | | 65 | | | (2 | ) | 41 | | | 39 |
| | | Past service costs amortized and past service costs arising | | | 9 | | (3 | ) | | 6 | | | — | | 1 | | | 1 |
| Change in valuation allowance | | | — | | 2 | | | 2 | | | — | | — | | | — |
| | |
| |
| |
| |
| |
| |
|
| Total defined benefit expense | | | | | | | | | | | | | | | | |
| | incurred | | $ | (34 | ) | 44 | | $ | 10 | | $ | 5 | | 59 | | $ | 64 |
| | |
| |
| |
| |
| |
| |
|
77
| | December 31, 2003
| |
|---|
| | Company and
wholly-owned subsidiaries
| | Partially-owned
subsidiaries and joint ventures
| | Total
| |
|---|
| Effect of 1% increase in assumed health care cost trend rates | | | | | | | | | |
| Total of service and interest cost components | | $ | — | | 3 | | $ | 3 | |
| Post-retirement benefit obligation | | | 3 | | 37 | | | 40 | |
| Effect of 1% decrease in assumed health care cost trend rates | | | | | | | | | |
| Total of service and interest cost components | | | — | | (2 | ) | | (2 | ) |
| Post-retirement benefit obligation | | | (3 | ) | (30 | ) | | (33 | ) |
| | |
| |
| |
| |
| | December 31, 2003
| |
|---|
| | Company and
wholly-owned subsidiaries
| | Partially-owned
subsidiaries and joint ventures
| | Total
| |
|---|
| Effect of 1% increase in assumed health care cost trend rates | | | | | | | | | |
| Total of service and interest cost components | | $ | — | | 2 | | $ | 2 | |
| Post-retirement benefit obligation | | | 3 | | 31 | | | 34 | |
Effect of 1% decrease in assumed health care cost trend rates |
|
|
|
|
|
|
|
|
|
| Total of service and interest cost components | | | — | | (2 | ) | | (2 | ) |
| Post-retirement benefit obligation | | | (3 | ) | (26 | ) | | (29 | ) |
| | |
| |
| |
| |
The expected rate of return on plan assets assumption is reviewed annually by management. The assumption is based on expected returns for the various asset classes, weighted by the portfolio allocation. Anticipated future long-term performance of individual asset categories is considered, reflecting expected future inflation and real yields on fixed income securities and equities.
| | Pension Benefit Plans
|
|---|
| | December 31, 2004
| | December 31, 2003
|
|---|
| | Company and
wholly-owned subsidiaries
| | Partially-owned
subsidiaries and joint ventures
| | Company and
wholly-owned subsidiaries
| | Partially-owned
subsidiaries and joint ventures
|
|---|
| Actual asset allocation: | | | | | | | | |
| | Equity securities | | 54% | | 50% | | 58% | | 55% |
| | Debt securities | | 45% | | 50% | | 42% | | 45% |
| | Other | | 1% | | — | | — | | — |
| | |
| |
| |
| |
|
| Total | | 100% | | 100% | | 100% | | 100% |
| | |
| |
| |
| |
|
| Target asset allocation: | | | | | | | | |
| | Equity securities | | 60% | | 50% | | 61% | | 60% |
| | Debt securities | | 40% | | 50% | | 39% | | 40% |
| | |
| |
| |
| |
|
| Total | | 100% | | 100% | | 100% | | 100% |
| | |
| |
| |
| |
|
78
| | Other Benefit Plans
|
|---|
| | December 31, 2004
| | December 31, 2003
|
|---|
| | Company and
wholly-owned subsidiaries
| | Partially-owned
subsidiaries and joint ventures
| | Company and
wholly-owned subsidiaries
| | Partially-owned
subsidiaries and joint ventures
|
|---|
| Actual asset allocation: | | | | | | | | |
| | Debt securities | | 100% | | 100% | | 100% | | 100% |
| | |
| |
| |
| |
|
| Target asset allocation: | | | | | | | | |
| | Debt securities | | 100% | | 100% | | 100% | | 100% |
| | |
| |
| |
| |
|
Cash Flows
Noranda made cash contributions during the year of $119 to pension benefit plans and $20 to other benefit plans.
Our best estimate of the amounts we expect to contribute for the year ending December 31, 2005 is $116 for pension benefit plans and $20 for other benefit plans.
| | Other Benefit Plans
|
|---|
| | December 31, 2004
| | December 31, 2003
|
|---|
| | Company and
wholly-owned subsidiaries
| | Partially-owned
subsidiaries and joint ventures
| | Company and
wholly-owned subsidiaries
| | Partially-owned
subsidiaries and joint ventures
|
|---|
| Benefit payments projection: | | | | | | | | | | | | |
| 2005 | | $ | 68 | | $ | 70 | | $ | 5 | | $ | 15 |
| 2006 | | | 68 | | | 66 | | | 5 | | | 16 |
| 2007 | | | 69 | | | 66 | | | 6 | | | 17 |
| 2008 | | | 69 | | | 65 | | | 6 | | | 18 |
| 2009 | | | 68 | | | 65 | | | 6 | | | 19 |
| 2010 to 2014 | | | 363 | | | 317 | | | 34 | | | 106 |
| | |
| |
| |
| |
|
18 Segmented Information
Noranda has four operating segments: Copper, Nickel, Zinc and Aluminum. Inter-segment sales and purchases are made at market prices and trade terms. As the products and services in each of the reportable segments, except for Corporate, are essentially the same, the reportable segments have been selected at the level where decisions are made on the provision of resources, capital and where performance is measured. For operations forming part of a reportable segment, performance is measured based on production targets, operating costs incurred and unit operating costs. During preparation of the financial statements, the sales and purchases between segments are eliminated. Operations and identifiable assets by operating and geographic segments are presented below:
79
a) Operating Segments
| | Year ended December 31, 2004
| |
|---|
| | Copper
| | Nickel
| | Zinc
| | Aluminum
| | Other
| | Total
| |
|---|
| Revenues | | $ | 3,630 | | 1,835 | | 415 | | 935 | | 163 | | $ | 6,978 | |
| Operating expenses | | | | | | | | | | | | | | | |
| Cost of operations | | | 841 | | 615 | | 158 | | 420 | | 60 | | | 2,094 | |
| Purchased raw materials | | | 1,882 | | 447 | | 187 | | 388 | | 101 | | | 3,005 | |
| Depreciation, amortization and accretion | | | 234 | | 136 | | 56 | | 38 | | 35 | | | 499 | |
| | |
| |
| |
| |
| |
| |
| |
| | | | 2,957 | | 1,198 | | 401 | | 846 | | 196 | | | 5,598 | |
| | |
| |
| |
| |
| |
| |
| |
| Income (loss) generated by operating assets | | $ | 673 | | 637 | | 14 | | 89 | | (33 | ) | $ | 1,380 | |
| | |
| |
| |
| |
| |
| |
| |
| Interest expense, net | | | | | | | | | | | | | | (119 | ) |
| Corporate and general administration | | | | | | | | | | | | | | (66 | ) |
| Research, development and exploration | | | | | | | | | | | | | | (47 | ) |
| Minority interest in earnings of subsidiaries | | | | | | | | | | | | | | (297 | ) |
| | |
| |
| |
| |
| |
| |
| |
| Income before undernoted | | | | | | | | | | | | | $ | 851 | |
| Gain net of restructuring costs and other | | | | | | | | | | | | | | 33 | |
| Tax expense | | | | | | | | | | | | | | (333 | ) |
| | |
| |
| |
| |
| |
| |
| |
| Net income | | | | | | | | | | | | | $ | 551 | |
| | |
| |
| |
| |
| |
| |
| |
| Total assets, excluding cash and | | $ | 4,553 | | 1,960 | | 400 | | 1,003 | | 811 | | $ | 8,727 | |
| | |
| |
| |
| |
| |
| |
| |
| Capital investments | | $ | 285 | | 316 | | 5 | | 32 | | 28 | | $ | 666 | |
| | |
| |
| |
| |
| |
| |
| |
| | Year ended December 31, 2003
| |
|---|
| | Copper
| | Nickel
| | Zinc
| | Aluminum
| | Other
| | Total
| |
|---|
| Revenues | | $ | 2,147 | | 1,298 | | 363 | | 686 | | 163 | | $ | 4,657 | |
| | |
| |
| |
| |
| |
| |
| |
Operating expenses |
|
|
|
|
|
|
|
|
|
|
|
|
|
|
|
| Cost of operations | | | 710 | | 587 | | 204 | | 388 | | 59 | | | 1,948 | |
| Purchased raw materials | | | 1,067 | | 280 | | 155 | | 236 | | 84 | | | 1,822 | |
| Depreciation, amortization and accretion | | | 200 | | 140 | | 64 | | 42 | | 44 | | | 490 | |
| | |
| |
| |
| |
| |
| |
| |
| | | | 1,977 | | 1,007 | | 423 | | 666 | | 187 | | | 4,260 | |
| | |
| |
| |
| |
| |
| |
| |
| Income (loss) generated by operating assets | | $ | 170 | | 291 | | (60 | ) | 20 | | (24 | ) | $ | 397 | |
| | |
| |
| |
| |
| |
| |
| |
| Interest expense, net | | | | | | | | | | | | | | (129 | ) |
| Corporate and general administration | | | | | | | | | | | | | | (58 | ) |
| Research, development and exploration | | | | | | | | | | | | | | (51 | ) |
| Minority interest in earnings of subsidiaries | | | | | | | | | | | | | | (88 | ) |
| | |
| |
| |
| |
| |
| |
| |
| Income before undernoted | | | | | | | | | | | | | $ | 71 | |
| Gain on sale of investment net of restructuring costs and other | | | | | | | | | | | | | | (28 | ) |
| Tax expense | | | | | | | | | | | | | | (20 | ) |
| | |
| |
| |
| |
| |
| |
| |
| Net income | | | | | | | | | | | | | $ | 23 | |
| | |
| |
| |
| |
| |
| |
| |
| Total assets, excluding cash and cash equivalents, and | | $ | 4,097 | | 1,722 | | 434 | | 814 | | 631 | | $ | 7,698 | |
| | |
| |
| |
| |
| |
| |
| |
| Capital investments | | $ | 326 | | 109 | | 2 | | 22 | | 30 | | $ | 489 | |
| | |
| |
| |
| |
| |
| |
| |
80
b) Geographic Segments
| | Revenues
| | Capital assets
|
|---|
| | 2004
| | 2003
| | 2004
| | 2003
|
|---|
| Canada — Domestic | | $ | 1,116 | | $ | 802 | | | | | | |
| — Export | | | 2,011 | | | 1,530 | | | | | | |
| | |
| |
| |
| |
|
| Canada | | $ | 3,127 | | $ | 2,332 | | $ | 2,619 | | $ | 2,456 |
| United States | | | 1,507 | | | 1,118 | | | 706 | | | 602 |
| Chile | | | 1,333 | | | 652 | | | 1,529 | | | 1,527 |
| Peru | | | 270 | | | 118 | | | 669 | | | 721 |
| Other | | | 741 | | | 437 | | | 513 | | | 432 |
| | |
| |
| |
| |
|
| Total | | $ | 6,978 | | $ | 4,657 | | $ | 6,036 | | $ | 5,738 |
| | |
| |
| |
| |
|
19 Significant Differences from United States Accounting Principles
These consolidated financial statements have been prepared in accordance with Canadian generally accepted accounting principles ("Canadian GAAP"). Canadian GAAP varies in certain significant respects from the principles and practices generally accepted in the United States ("U.S. GAAP"). The effect of these principal differences on the Company's financial statements is quantified below and described in the accompanying notes.
Statements of Income (Loss)
Years ended December 31
| | 2004
| | 2003
| |
|---|
| |
| | Restated (g)
| |
|---|
| Net income (loss) — Cdn GAAP | | $ | 551 | | $ | 23 | |
| Increase in interest expenses(b) | | | (5 | ) | | (4 | ) |
| Adjustment of certain financial instruments to market(c) | | | (11 | ) | | (14 | ) |
| Start-up costs and exploration(d) | | | (94 | ) | | (40 | ) |
| Amortization of start-up costs and exploration(d) | | | 7 | | | 14 | |
| Pensions and post-employment benefits(f) | | | (2 | ) | | — | |
| Stock options(e) | | | (1 | ) | | (1 | ) |
| Foreign exchange difference | | | (4 | ) | | (7 | ) |
| Tax effect of adjustments | | | 27 | | | 19 | |
| | |
| |
| |
| | | $ | 468 | | $ | (10 | ) |
| Net income (loss) — U.S. GAAP before accounting change Cumulative impact of change in accounting policy,net of tax (g) | | | — | | | (27 | ) |
| | |
| |
| |
| Net income (loss) — U.S. GAAP | | $ | 468 | | $ | (37 | ) |
| | |
| |
| |
Net income (loss) per share reported under U.S. GAAP ($): |
|
|
|
|
|
|
|
| Basic earnings (loss) per share | | $ | 1.50 | | $ | (0.23 | ) |
| Diluted earnings (loss) per share | | $ | 1.48 | | $ | (0.23 | ) |
| Retained earnings (deficit) under U.S. GAAP: | | | | | | | |
| | Balance, beginning of year | | $ | (258 | ) | $ | (74 | ) |
| | Net income (loss) | | | 468 | | | (37 | ) |
| | Dividends: | | | | | | | |
| | | Common | | | (110 | ) | | (121 | ) |
| | | Preferred | | | (20 | ) | | (21 | ) |
| | Other | | | — | | | (5 | ) |
| | |
| |
| |
| Balance, end of year | | $ | 80 | | $ | (258 | ) |
| | |
| |
| |
81
Statements of Comprehensive Income (Loss)
| | Years ended December 31
| |
|---|
| | 2004
| | 2003
| |
|---|
| |
| | Restated (g)
| |
|---|
| Net income (loss) under U.S. GAAP: | | $ | 468 | | $ | (37 | ) |
Other comprehensive income (loss):(a) |
|
|
|
|
|
|
|
| Foreign currency translation adjustments(h) | | | 19 | | | 260 | |
| Unrealized gains (loss) on long-term investments(i) | | | 1 | | | 7 | |
| Derivative financial instruments:(c) | | | | | | | |
| | Net amount reclassified into earnings | | | (52 | ) | | (15 | ) |
| | Net changes associated with current period hedging | | | 27 | | | 138 | |
| Additional minimum pension liability adjustment(j) | | | (19 | ) | | 58 | |
| Tax effect of adjustments on comprehensive loss | | | 10 | | | (89 | ) |
| | |
| |
| |
| Other comprehensive income (loss) — U.S. GAAP(a) | | $ | (14 | ) | $ | 359 | |
| | |
| |
| |
| Comprehensive income under U.S. GAAP(a) | | $ | 454 | | $ | 322 | |
| | |
| |
| |
- a)
- Comprehensive income is measured in accordance with Statement of Financial Accounting Standards ("FAS") No. 130, "Reporting Comprehensive Income." This standard defines comprehensive income as all changes in equity other than those resulting from investments by owners and distributions to owners. Comprehensive income comprises net earnings and other comprehensive income where other comprehensive income ("OCI") is the change in equity during the period that arises from transactions and other events that are related to non-owner sources. The concept of comprehensive income does not exist under Canadian GAAP.
- b)
- Noranda accounts for the convertible debentures in accordance with their substance and, as such, they are presented in the financial statements in their liability and equity component parts. Under U.S. GAAP, the entire face value of the convertible debentures is treated as debt, with interest expense based on the coupon rate of 5.0%.
- c)
- Under Canadian GAAP, certain financial instruments qualify as a hedge for accounting purposes and therefore gains and losses on these contracts are recognized in revenue at the time the anticipated cash flows are realized. U.S. GAAP, specifically under FAS No. 133 "Accounting for Derivative Instruments and Hedging Activities" and No. 138 "Accounting for Certain Derivative Instruments and Hedging Activities" (together, "FAS 133"), requires a company to recognize all of its derivative instruments, whether designated in hedging relationships or not, on the balance sheet at fair value. The accounting for changes in the fair value (i.e. gains or losses) of a derivative instrument depends on whether it has been designated and qualifies as part of a hedging relationship. For derivatives designated as fair value hedges, the effective portion of the change in the fair value of the derivative is offset by changes in the fair value of its hedged item. For cash flow hedges and hedges of the net investment in self-sustaining operations, the effective portion of the changes in the fair value of the derivative is accumulated in OCI and then is released from OCI and included in income when the hedged item affects earnings. All other derivatives are carried at fair value. FAS 133 establishes certain criteria to be met in order to designate a derivative instrument as a hedge and to deem a hedge as effective.
Fair Value Hedges
Noranda has chosen to designate its fixed forward price hedges and certain interest rate swaps as fair value hedges. During the year ended December 31, 2004, the Company recognized a net loss of $nil (2003 — $16) related to the ineffective portion of these hedging instruments.
Cash Flow Hedges
Noranda has chosen to designate its foreign currency-denominated revenue hedges and foreign currency-denominated expenditure hedges as cash flow hedges. No ineffectiveness to these hedging instruments was incurred during 2004 and 2003. At December 31, 2004, the Company expects to reclassify $55 of net gains (2003 — $55) on derivative instruments from accumulated OCI to earnings during the next 12 months according to contract settlement dates.
82
Hedges of Foreign Net Assets
During the year ended December 31, 2004, the Company recognized a net loss of $6 (2003 — net gain of $288), included in the cumulative translation adjustment, related to the forward foreign exchange contracts and foreign-denominated fixed-rate debt.
Other Hedges
For all other derivative instruments, Noranda has chosen not to designate them as hedging instruments.
- d)
- Under Canadian GAAP, Noranda capitalizes exploration costs when sufficient pre-feasibility work indicates that future mine production is reasonably certain and capitalizes costs incurred during the start-up phase of a project until commercial production commences. Under U.S. GAAP, exploration costs cannot be capitalized until the Company has objective reasonable assurance as to their recovery, generally upon receipt of a bankable feasibility study. Statement of Position 98-5 requires start-up costs to be expensed as incurred. As a result of the differences in the carrying amount of capital assets under Canadian and U.S. GAAP, there are differences in depreciation expense in subsequent periods. Further a difference in depreciation expense arises due to the earlier commencement of depreciation under U.S. GAAP.
- e)
- Effective January 1, 2002, Noranda prospectively adopted FAS No. 123 "Accounting for Stock-based Compensation" whereby compensation expense for options granted or modified after January 1, 2002 is measured at fair value at the grant date or modification date using the Black-Scholes valuation model and recognized over the remaining vesting period of the options granted or modified.
Prior to June 30, 2002, Noranda's stock option plan allowed for, at the option of the holder, the exercise of the employee's vested option whereby the difference between the grant price and the market price is paid on exercise by the Company, with no increase in the capital stock issued. Under U.S. GAAP, such a feature requires the mark-to-market obligation to be recognized through the income statement of the Company.
On June 30, 2002 Noranda's stock option plan was modified to remove the cash settlement feature. As a result, under U.S. GAAP additional compensation expense is being recognized over the remaining vesting period of these modified options to the extent that the fair value of the options outstanding on the modification date exceeded the previously recorded compensation expense of these options.
Under Canadian GAAP, there is no requirement to account for options that contain a cash settlement feature when the cash settlement feature is removed by June 30, 2002.
- f)
- Under Canadian GAAP, when a defined benefit plan gives rise to an accrued benefit asset, a company must recognize a valuation allowance for the excess of the adjusted benefit asset over the expected future benefit to be realized from the plan asset. U.S. GAAP does not provide for a valuation allowance against pension assets. As a result, a difference between U.S. and Canadian GAAP has been recorded for the effects of recognizing a pension valuation allowance and changes therein under Canadian GAAP.
- g)
- Effective January 1, 2003, Noranda adopted FAS 143, "Accounting for Asset Retirement Obligations" which requires that the fair value of liabilities for asset retirement obligations be recognized in the period in which they are incurred. A corresponding increase to the carrying amount of the related asset is generally recorded and depreciated over the life of the asset. The amount of the liability is subject to re-measurement at each reporting period. The cumulative effect of the change through January 1, 2003 was to increase capital assets by $70, increase deferred credits by $97, decrease future tax liability by $5 and increase minority interest in subsidiaries by $5, with a one time after-tax charge to net earnings of $27 (loss of $0.10 per share). Canadian GAAP adopted the same accounting rule, effective January 1, 2004. Comparative figures for the year ended December 31, 2003 have been adjusted to reflect the remeasurement of the asset retirement obligation under Canadian GAAP.
In accordance with the standard, the Company has not included any provision for reclamation costs associated with assets of indeterminate lives, in particular metallurgical plants, as their lives cannot be reasonably estimated nor reclamation obligations determinable.
83
- h)
- Under U.S. GAAP, foreign exchange gains and losses on translation of self-sustaining foreign operations are recorded in OCI. Under Canadian GAAP, such gains and losses are included as a separate component of shareholders' equity referred to as cumulative translation adjustment.
- i)
- U.S. GAAP requires that certain long-term investments not held for trading be recorded at fair value, with unrealized holding gains and losses excluded from the determination of earnings and reported as a separate component of OCI.
- j)
- U.S. GAAP requires the recognition of an additional minimum pension liability in the amount of the excess of the Company's unfunded accumulated benefits obligation over the recorded pension benefits liability. An offsetting intangible pension asset is recorded no greater than the unrecognized prior service costs, with any difference recorded as a reduction in accumulated OCI.
- k)
- U.S. GAAP requires investments in joint ventures to be accounted for under the equity method, while under Canadian GAAP, the accounts of joint ventures are proportionately consolidated. However, under rules promulgated by the Securities and Exchange Commission, a foreign registrant may, subject to the provision of additional information, continue to follow proportionate consolidation for the purposes of registration and other filings notwithstanding the departure from U.S. GAAP. Consequently, the consolidated balance sheets have not been adjusted to restate the accounting for joint ventures under U.S. GAAP. Additional information concerning the Company's interests in joint ventures is presented in Note 4.
- l)
- U.S. GAAP does not permit the subtotal of cash from operations before net changes in non-cash working capital. The various subtotals presented on the statement of income (loss) under Canadian GAAP are not permitted under U.S. GAAP.
- m)
- In December 2003, FASB issued a revised intrepretation of FIN 46 (FIN 46-R), which supercedes FIN 46 and clarifies and expands current accounting guidance for variable interest entities (VIEs). As a result, Noranda determined that the securitization trust (note 16e) was a VIE of which Noranda was the primary beneficiary. FIN 46-R requires that Noranda consolidate entities that are considered to be VIEs and that it is the primary beneficiary of. Under Canadian GAAP, the securitization trust would not have been consolidated. This difference resulted in adjustments to the consolidated balance sheet, but did not result in any adjustments to net income.
The following summarizes the adjustments to the Company's balance sheets and cash flow statements in order to conform to U.S. GAAP.
Balance Sheet
| | Years ended December 31
| |
|---|
| | 2004
| | 2003
| |
|---|
| |
| |
| | Restated (g)
| |
|---|
| | Canadian GAAP
| | United States GAAP
| | Canadian GAAP
| | United States GAAP
| |
|---|
| Assets: | | | | | | | | | | | | | |
| Accounts receivable(m) | | $ | 931 | | $ | 940 | | $ | 576 | | $ | 591 | |
| Investments and other assets(c)(i) | | | 324 | | | 508 | | | 205 | | | 532 | |
| Capital assets(d) | | | 6,036 | | | 5,614 | | | 5,738 | | | 5,462 | |
Liabilities: |
|
|
|
|
|
|
|
|
|
|
|
|
|
| Accounts and taxes payable(c)(m) | | | 1,248 | | | 1,294 | | | 903 | | | 1,007 | |
| Long-term debt(b)(c) | | | 2,638 | | | 2,809 | | | 2,893 | | | 3,045 | |
| Deferred credits(c)(f) | | | 595 | | | 857 | | | 539 | | | 809 | |
| Future income tax liability (asset) | | | 304 | | | 138 | | | 46 | | | (57 | ) |
| Minority interest in subsidiaries | | | 1,197 | | | 1,028 | | | 919 | | | 822 | |
Shareholders' Equity: |
|
|
|
|
|
|
|
|
|
|
|
|
|
| Retained earnings (deficit) | | | 288 | | | 80 | | | (130 | ) | | (258 | ) |
| Capital stock(e) | | | 2,405 | | | 2,440 | | | 2,382 | | | 2,415 | |
| Convertible debentures(b) | | | 89 | | | — | | | 84 | | | — | |
| Currency translation adjustment(h) | | | 280 | | | — | | | 264 | | | — | |
| Accumulated other comprehensive income | | | — | | | 169 | | | — | | | 183 | |
| | |
| |
| |
| |
| |
84
Cash Flow Statement
| | Years ended December 31
| |
|---|
| | 2004
| | 2003
| |
|---|
| | Canadian GAAP
| | United States GAAP
| | Canadian GAAP
| | United States GAAP
| |
|---|
| Operating activities | | $ | 1,191 | | $ | 1,097 | | $ | 413 | | $ | 376 | |
| Investment activities | | | (555 | ) | | (460 | ) | | (543 | ) | | (521 | ) |
| Financing activities | | | (253 | ) | | (254 | ) | | 338 | | | 353 | |
| Cash and cash equivalents,beginning of year | | | 501 | | | 501 | | | 293 | | | 293 | |
| Cash and cash equivalents,end of year | | | 884 | | | 884 | | | 501 | | | 501 | |
| | |
| |
| |
| |
| |
Impending Accounting Changes
Canadian GAAP
In 2003, the CICA amended Handbook Section 3860, "Financial Instruments — Disclosure and Presentation" ("CICA 3860"), to require certain obligations that may be settled with an entity's own equity instruments to be reflected as a liability. The amendments must be adopted in the Company's 2005 consolidated financial statements with retroactive application. Upon adoption, the Company's Convertible Debentures will be presented as liabilities, with the exception of the equity value ascribed to the holder's option to convert certain of the Convertible Debentures into Common Shares, and the related liability carrying costs will be presented as a charge to net income. The amendments to CICA 3860 will have no impact on basic or diluted earnings per share.
In 2004, the CICA issued Accounting Guideline AcG-15, "Consolidation of Variable Interest Entities", to provide guidance for applying the principles in Handbook Section 1590, "Subsidiaries", to certain entities. AcG-15 is effective for the Company's 2005 fiscal year and harmonizes Canadian GAAP with U.S. GAAP accounting for variable interest entities. As a result, the disclosures for U.S. GAAP related to the VIEs will also be required for Canadian GAAP in 2005.
In January 2005, the CICA approved Handbook Sections 1530, "Comprehensive Income", 3855, "Financial Instruments — Recognition and Measurement", and 3865, "Hedges". The new standards are intended to harmonize Canadian GAAP with U.S. GAAP. The new standards are effective for the Company in the first quarter of 2007, but earlier adoption is permitted.
United States GAAP
In 2002, the Company adopted FAS 123 on a prospective basis. In December 2004, an amended Statement of Financial Accounting Standard No. 123 "Share-Based Payment" was issued, which may require the Company to apply a different method for valuing awards of stock options. Beginning in 2005, the Company will have to expense all stock options, including the remaining unrecognized compensation relating to options granted on or before December 31, 2001.
In November 2004, the FASB issued SFAS No. 151, "Inventory Costs — an Amendment of ARB No. 43, Chapter 4." This standard provides clarification that abnormal amounts of idle facility expense, freight handling costs, and spoilage should be recognized as current-period charges. The provisions of this standard are effective for inventory costs incurred during 2006.
The above U.S. GAAP standards are not expected to have a material impact on the Company's financial statements.
85
QuickLinks
Management's Discussion and AnalysisManagement's ResponsibilityAuditors' ReportConsolidated Balance SheetsConsolidated Statements of Income (Loss) and Retained Earnings (Deficit)Consolidated Statements of Cash FlowsNotes to the Consolidated Financial Statements (US$ millions except as otherwise indicated) December 31, 2004