Filed by Falconbridge Limited
Pursuant to Rule 425 under the Securities Act of 1933
Subject Company: Falconbridge Limited
Commission File No. 333-129218


Searchable text section of graphics shown above
Forward-Looking Statements
Certain statements contained in this News Release are forward-looking statements (as defined in applicable securities legislation). Examples of such statements include, but are not limited to, statements concerning (i) our assessment of the outlook for metal markets in 2006, (ii) Inco’s offer to acquire all of the common shares of Falconbridge Limited and the benefits of such combination, (iii) our future financial requirements and funding of those requirements, (iv) our expectations with respect to our development projects, (v) our production forecast for 2006 and (vi) our dividend schedule. Inherent in forward-looking statements are risks and uncertainties well beyond our ability to predict or control. Actual results and developments are likely to differ, and may differ materially, from those expressed or implied by the forward-looking statements contained in this News Release. Such statements are based on a number of assumptions which may prove to be incorrect, including, but not limited to, assumptions about the timing, steps to be taken and completion of Inco’s offer to acquire all of our common shares, the ability to successfully compete against global metals and mining and exploration companies by creating through such a combination an enterprise of increased scale; strong demand for nickel, copper and other metals in emerging markets such as China; approximately $350 million per annum in pre-tax operating and other synergies and cost savings, and other benefits being realized based on the achievement of operational efficiencies from restructuring, integration and other initiatives relating to the combination of Falconbridge and Inco; the approvals or clearances required to be obtained by Inco and Falconbridge from regulatory and other agencies and bodies being obtained in a timely manner; divestitures required by regulatory agencies being acceptable and completed in a timely manner; there being limited costs, difficulties or delays related to the integration of the Falconbridge’s operations with those of Inco; the timely completion of the steps required to be taken for the eventual combination of the two companies; business and economic conditions generally; exchange rates, energy and other anticipated and unanticipated costs and pension contributions and expenses; the supply and demand for, deliveries of, and the level and volatility of prices of, nickel, copper, aluminum, zinc and other primary metals products and other metal products Inco and Falconbridge produce; the timing of the receipt of remaining regulatory and governmental approvals for the development projects and other operations; the continued availability of financing on appropriate terms for development projects; Falconbridge’s costs of production and production and productivity levels, as well as those of its competitors; market competition; mining, processing, exploration and research and development activities; the accuracy of ore/mineral reserve estimates; premiums realized over LME cash and other benchmark prices; tax benefits/charges; the resolution of environmental and other proceedings and the impact on the combined company of various environmental regulations and initiatives; assumptions concerning political and economic stability in countries or locations in which Falconbridge operates or otherwise and the ability to continue to pay quarterly cash dividends in such amounts as Falconbridge’s Board of Directors may determine in light of other uses for such funds and other factors.
Inherent in those statements are known and unknown risks, uncertainties and other factors well beyond the Company’s ability to control or predict. Some of these known risks and uncertainties are outlined in filings by Falconbridge with applicable securities regulatory authorities, including in Falconbridge’s annual information form. Readers are encouraged to consult such filings. While Falconbridge anticipates that subsequent events and developments may cause Falconbridge’s views to change, the Company specifically disclaims any obligation to update these forward-looking statements. These forward-looking statements should not be relied upon as representing the Company’s views as of any date subsequent to the date of this news release. Although the Company has attempted to identify important factors that could cause actual actions, events or results to differ materially from those described in forward-looking statements, there may be other factors that cause actions, events or results not to be as anticipated, estimated or intended. There can be no assurance that forward-looking statements will prove to be accurate, as actual results and future events could differ materially from those anticipated in such statements. Accordingly, readers should not place undue reliance on forward-looking statements. These factors are not intended to represent a complete list of the factors that could affect Falconbridge and the combination of Inco and Falconbridge.
2
Speakers
• | Opening Remarks | - | Derek Pannell |
|
|
| Chief Executive Officer |
|
|
|
|
• | Financial Review | - | Steve Douglas |
|
|
| Chief Financial Officer |
|
|
|
|
• | Projects & Markets | - | Aaron Regent |
| ALL NUMBERS ARE IN U.S. DOLLARS |
3
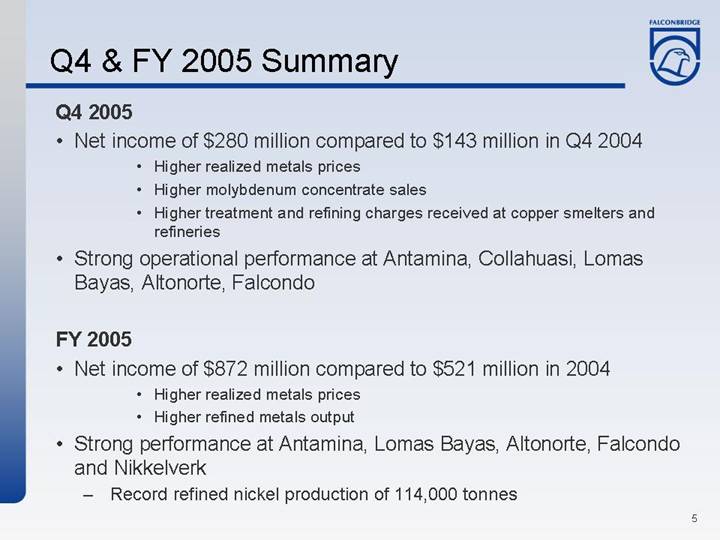
Q4 & FY 2005 Summary
Q4 2005
• Net income of $280 million compared to $143 million in Q4 2004
• Higher realized metals prices
• Higher molybdenum concentrate sales
• Higher treatment and refining charges received at copper smelters and refineries
• Strong operational performance at Antamina, Collahuasi, Lomas Bayas, Altonorte, Falcondo
FY 2005
• Net income of $872 million compared to $521 million in 2004
• Higher realized metals prices
• Higher refined metals output
• Strong performance at Antamina, Lomas Bayas, Altonorte, Falcondo and Nikkelverk
• Record refined nickel production of 114,000 tonnes
5
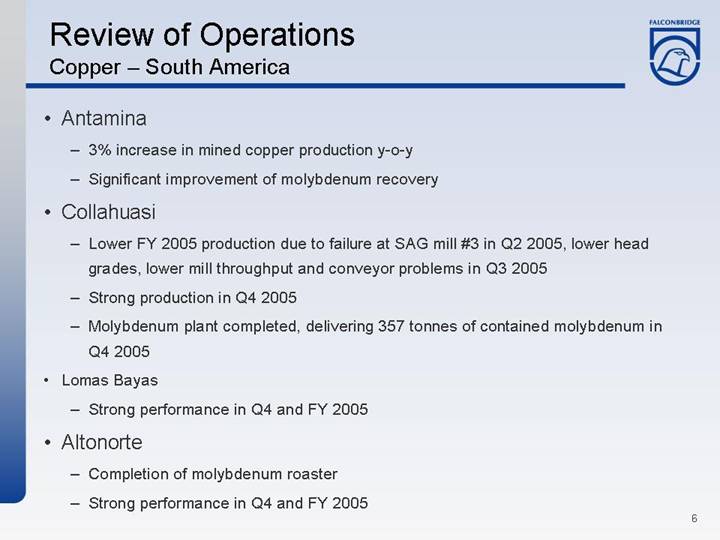
Review of Operations
Copper – South America
• Antamina
• 3% increase in mined copper production y-o-y
• Significant improvement of molybdenum recovery
• Collahuasi
• Lower FY 2005 production due to failure at SAG mill #3 in Q2 2005, lower head grades, lower mill throughput and conveyor problems in Q3 2005
• Strong production in Q4 2005
• Molybdenum plant completed, delivering 357 tonnes of contained molybdenum in Q4 2005
• Lomas Bayas
• Strong performance in Q4 and FY 2005
• Altonorte
• Completion of molybdenum roaster
• Strong performance in Q4 and FY 2005
6
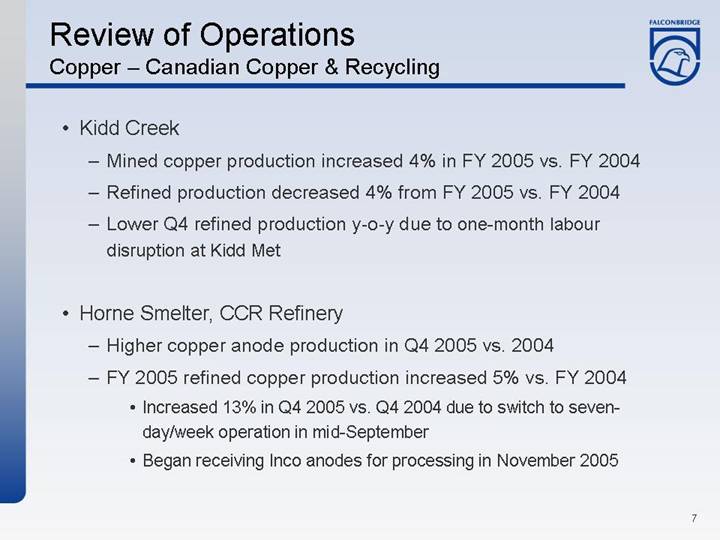
Review of Operations
Copper – Canadian Copper & Recycling
• Kidd Creek
• Mined copper production increased 4% in FY 2005 vs. FY 2004
• Refined production decreased 4% from FY 2005 vs. FY 2004
• Lower Q4 refined production y-o-y due to one-month labour disruption at Kidd Met
• Horne Smelter, CCR Refinery
• Higher copper anode production in Q4 2005 vs. 2004
• FY 2005 refined copper production increased 5% vs. FY 2004
• Increased 13% in Q4 2005 vs. Q4 2004 due to switch to seven-day/week operation in mid-September
• Began receiving Inco anodes for processing in November 2005
7
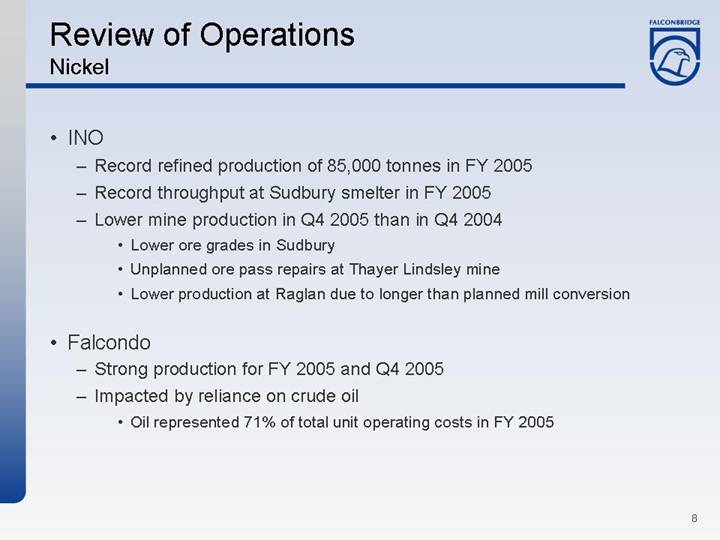
Review of Operations
Nickel
• INO
• Record refined production of 85,000 tonnes in FY 2005
• Record throughput at Sudbury smelter in FY 2005
• Lower mine production in Q4 2005 than in Q4 2004
• Lower ore grades in Sudbury
• Unplanned ore pass repairs at Thayer Lindsley mine
• Lower production at Raglan due to longer than planned mill conversion
• Falcondo
• Strong production for FY 2005 and Q4 2005
• Impacted by reliance on crude oil
• Oil represented 71% of total unit operating costs in FY 2005
8
Review of Operations
Zinc and Aluminum
• Zinc
• Lower zinc-in-concentrate production in FY 2005 vs. FY 2004 and Q4 2005 vs. Q4 2004
• Closure of Bell Allard mine in October 2004
• Ore pass operating issues and rock burst at Brunswick mine
• Aluminum
• Primary aluminum production totaled 245,600 tonnes, 1,900 tonnes lower than FY 2004
• 1,872,400 tonnes of bauxite at St. Ann (Falconbridge’s 50% share)
• 588,300 tonnes of alumina at Gramercy refinery (Falconbridge’s 50% share)
• Fabricated aluminum shipments totaled 177,900 tonnes, 4,000 tonnes higher than FY 2004
• Strong production in Q4 2005
9
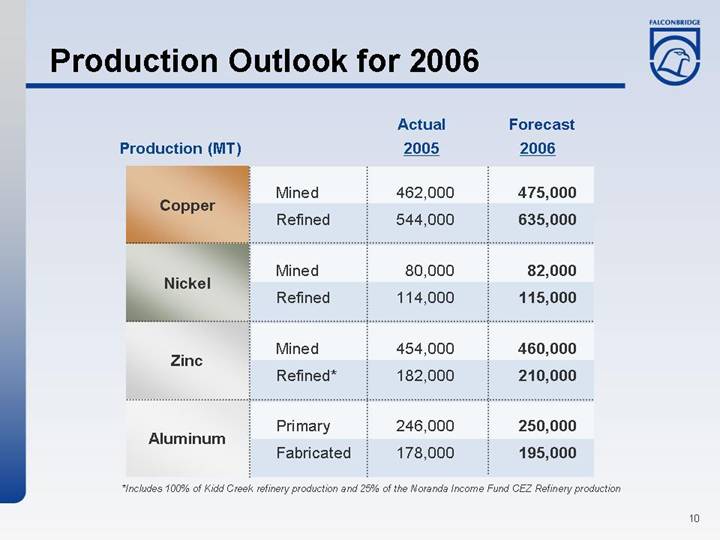
Production Outlook for 2006
|
| Actual |
| Forecast |
| |
Production (MT) |
| 2005 |
| 2006 |
| |
|
|
|
|
|
| |
Copper | Mined |
| 462,000 |
| 475,000 |
|
Refined |
| 544,000 |
| 635,000 |
| |
|
|
|
|
|
|
|
Nickel | Mined |
| 80,000 |
| 82,000 |
|
Refined |
| 114,000 |
| 115,000 |
| |
|
|
|
|
|
|
|
Zinc | Mined |
| 454,000 |
| 460,000 |
|
Refined* |
| 182,000 |
| 210,000 |
| |
|
|
|
|
|
|
|
Aluminum | Primary |
| 246,000 |
| 250,000 |
|
Fabricated |
| 178,000 |
| 195,000 |
| |
*Includes 100% of Kidd Creek refinery production and 25% of the Noranda Income Fund CEZ Refinery production
10
Planned Maintenance Shutdowns
• Kidd Creek Copper smelter – Shutdown for rebuild of furnaces
(April 29 - June 6)
• Horne Smelter - General shutdown
(two weeks in September)
• Antamina – Shutdown for mill relining
(90 hours in July)
• Sudbury Smelter – Maintenance shutdown
(two weeks in May)
• Raglan Mill – Shutdown for repairs to thickener
(four-week outage in Q4 2006)
• Brunswick Smelter – Seasonal shutdown
(July, August and September)
11
Contract Negotiations in 2006
Eleven collective agreements will expire in 2006:
• General Smelting (Montreal) – January 31
• Brunswick Mine (Bathurst) – February 28
• Brunswick Smelter (Bathurst) – February 28
• Horne Smelter (Rouyn) – March 1
• Bulk Handling Operation (Bathurst) – March 31
• Raglan Mine (Rouyn) – April 30
• Lomas Bayas (Chile) –April 30
• Nikkelverk (Norway) – May 31
• Antamina (Peru) – July 24
• Norandal – Salisbury (Salisbury) – November 20
• Altonorte (Chile) – December 12
12
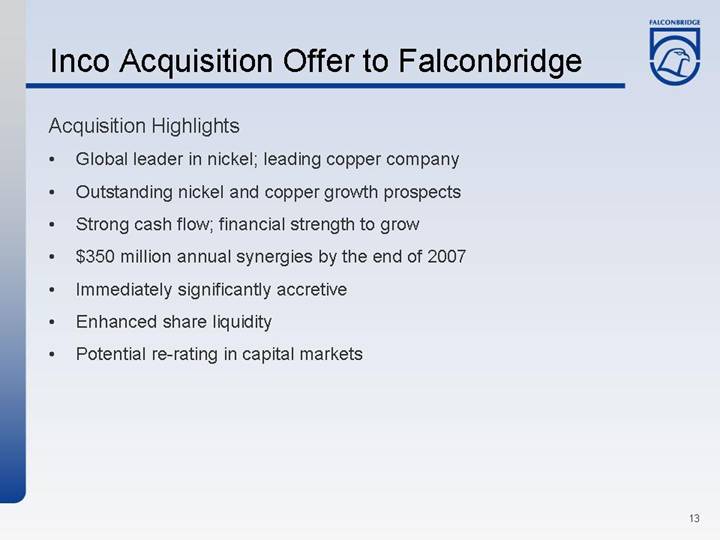
Inco Acquisition Offer to Falconbridge
Acquisition Highlights
• Global leader in nickel; leading copper company
• Outstanding nickel and copper growth prospects
• Strong cash flow; financial strength to grow
• $350 million annual synergies by the end of 2007
• Immediately significantly accretive
• Enhanced share liquidity
• Potential re-rating in capital markets
13
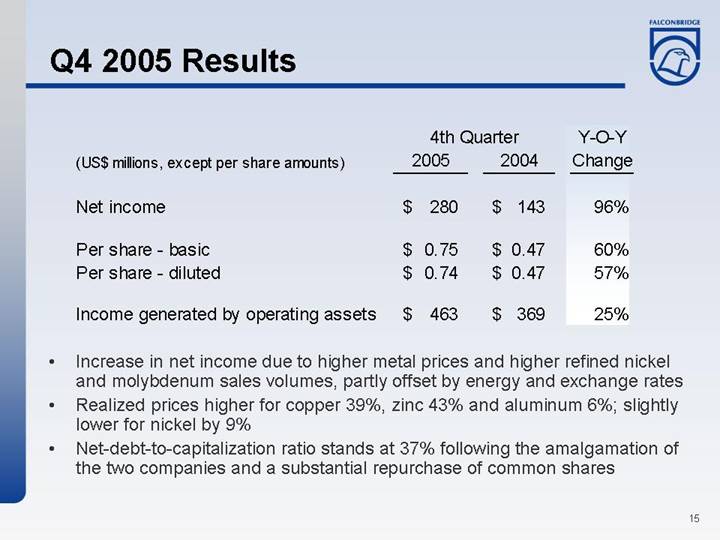
Q4 2005 Results
|
| 4th Quarter |
| Y-O-Y |
| ||||
(US$ millions, except per share amounts) |
| 2005 |
| 2004 |
| Change |
| ||
|
|
|
|
|
|
|
| ||
Net income |
| $ | 280 |
| $ | 143 |
| 96 | % |
|
|
|
|
|
|
|
| ||
Per share - basic |
| $ | 0.75 |
| $ | 0.47 |
| 60 | % |
Per share - diluted |
| $ | 0.74 |
| $ | 0.47 |
| 57 | % |
|
|
|
|
|
|
|
| ||
Income generated by operating assets |
| $ | 463 |
| $ | 369 |
| 25 | % |
• Increase in net income due to higher metal prices and higher refined nickel and molybdenum sales volumes, partly offset by energy and exchange rates
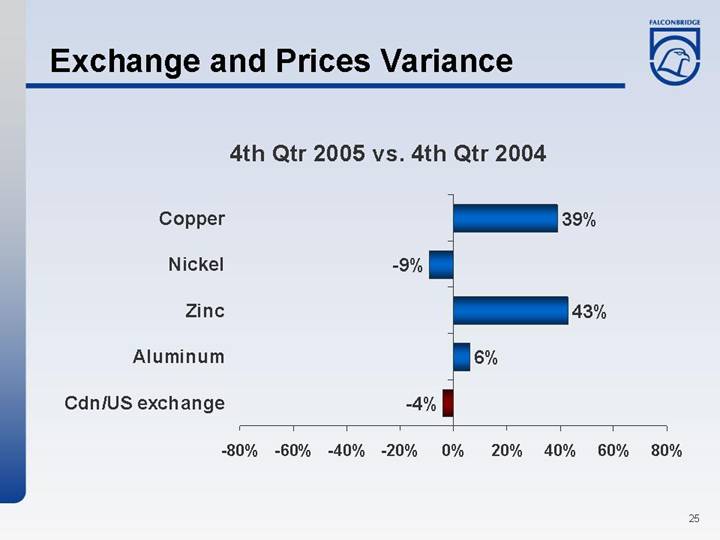
• Realized prices higher for copper 39%, zinc 43% and aluminum 6%; slightly lower for nickel by 9%
• Net-debt-to-capitalization ratio stands at 37% following the amalgamation of the two companies and a substantial repurchase of common shares
15
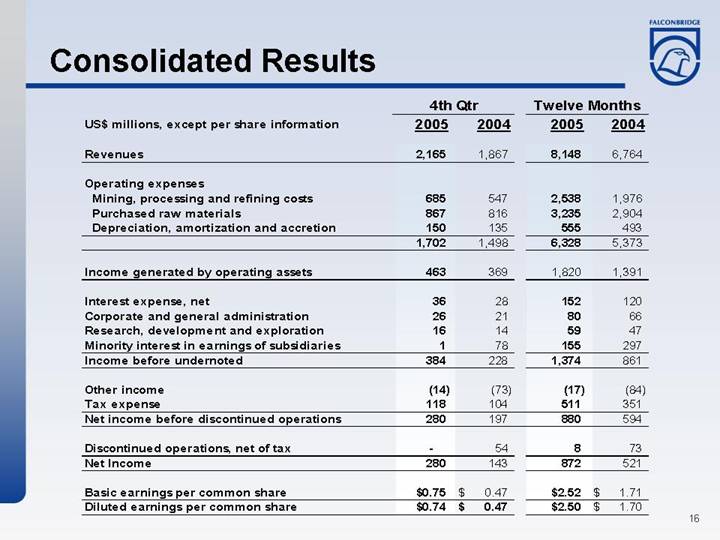
Consolidated Results
|
| 4th Qtr |
| Twelve Months |
| ||||||||
US$ millions, except per share information |
| 2005 |
| 2004 |
| 2005 |
| 2004 |
| ||||
|
|
|
|
|
|
|
|
|
| ||||
Revenues |
| 2,165 |
| 1,867 |
| 8,148 |
| 6,764 |
| ||||
|
|
|
|
|
|
|
|
|
| ||||
Operating expenses |
|
|
|
|
|
|
|
|
| ||||
Mining, processing and refining costs |
| 685 |
| 547 |
| 2,538 |
| 1,976 |
| ||||
Purchased raw materials |
| 867 |
| 816 |
| 3,235 |
| 2,904 |
| ||||
Depreciation, amortization and accretion |
| 150 |
| 135 |
| 555 |
| 493 |
| ||||
|
| 1,702 |
| 1,498 |
| 6,328 |
| 5,373 |
| ||||
|
|
|
|
|
|
|
|
|
| ||||
Income generated by operating assets |
| 463 |
| 369 |
| 1,820 |
| 1,391 |
| ||||
|
|
|
|
|
|
|
|
|
| ||||
Interest expense, net |
| 36 |
| 28 |
| 152 |
| 120 |
| ||||
Corporate and general administration |
| 26 |
| 21 |
| 80 |
| 66 |
| ||||
Research, development and exploration |
| 16 |
| 14 |
| 59 |
| 47 |
| ||||
Minority interest in earnings of subsidiaries |
| 1 |
| 78 |
| 155 |
| 297 |
| ||||
Income before undernoted |
| 384 |
| 228 |
| 1,374 |
| 861 |
| ||||
|
|
|
|
|
|
|
|
|
| ||||
Other income |
| (14 | ) | (73 | ) | (17 | ) | (84 | ) | ||||
Tax expense |
| 118 |
| 104 |
| 511 |
| 351 |
| ||||
Net income before discontinued operations |
| 280 |
| 197 |
| 880 |
| 594 |
| ||||
|
|
|
|
|
|
|
|
|
| ||||
Discontinued operations, net of tax |
| — |
| 54 |
| 8 |
| 73 |
| ||||
Net Income |
| 280 |
| 143 |
| 872 |
| 521 |
| ||||
|
|
|
|
|
|
|
|
|
| ||||
Basic earnings per common share |
| $ | 0.75 |
| $ | 0.47 |
| $ | 2.52 |
| $ | 1.71 |
|
Diluted earnings per common share |
| $ | 0.74 |
| $ | 0.47 |
| $ | 2.50 |
| $ | 1.70 |
|
16
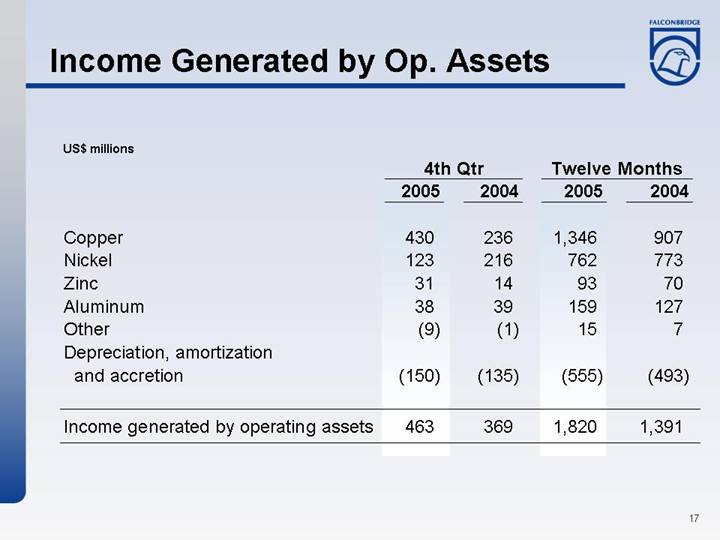
Income Generated by Op. Assets
|
| 4th Qtr |
| Twelve Months |
| ||||
US$ millions |
| 2005 |
| 2004 |
| 2005 |
| 2004 |
|
|
|
|
|
|
|
|
|
|
|
Copper |
| 430 |
| 236 |
| 1,346 |
| 907 |
|
Nickel |
| 123 |
| 216 |
| 762 |
| 773 |
|
Zinc |
| 31 |
| 14 |
| 93 |
| 70 |
|
Aluminum |
| 38 |
| 39 |
| 159 |
| 127 |
|
Other |
| (9 | ) | (1 | ) | 15 |
| 7 |
|
Depreciation, amortization and accretion |
| (150 | ) | (135 | ) | (555 | ) | (493 | ) |
|
|
|
|
|
|
|
|
|
|
Income generated by operating assets |
| 463 |
| 369 |
| 1,820 |
| 1,391 |
|
17
Impact of Noranda/Falconbridge Merger
Financial Statement Presentation
• Most dramatic impact of merger on financial statements is below operating line – Falconbridge and Noranda have been presented on a consolidated basis since 1989
• Major income statement line items impacted are as follows:
• Increased depreciation and amortization of acquisition values of merged company
• One-time increase in inventory valued at time of purchase
• Increased interest expense due to issue of preferred share liabilities to complete share repurchase
• Reduced minority interest costs as balance of old Falconbridge minority acquired
• Shares outstanding increased due to merger offset by share repurchase
18
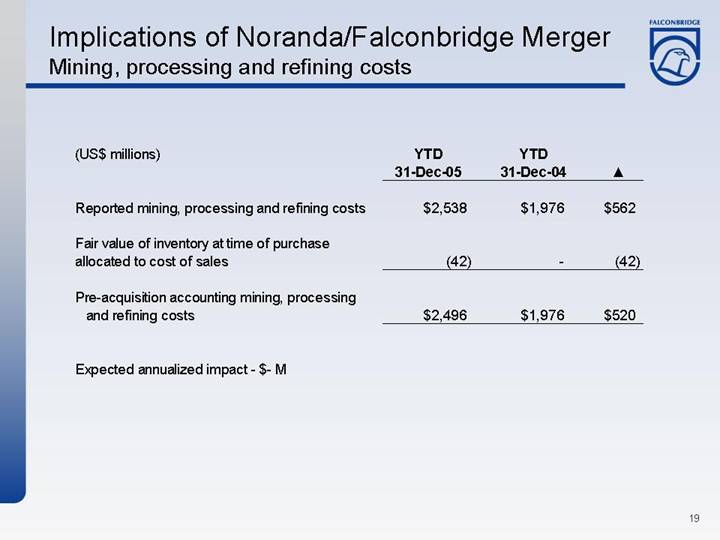
Implications of Noranda/Falconbridge Merger
Mining, processing and refining costs
|
| YTD |
| YTD |
|
|
| |||
(US$ millions) |
| 31-Dec-05 |
| 31-Dec-04 |
|
|
| |||
|
|
|
|
|
|
|
| |||
Reported mining, processing and refining costs |
| $ | 2,538 |
| $ | 1,976 |
| $ | 562 |
|
|
|
|
|
|
|
|
| |||
Fair value of inventory at time of purchase allocated to cost of sales |
| (42 | ) | — |
| (42 | ) | |||
|
|
|
|
|
|
|
| |||
Pre-acquisition accounting mining, processing and refining costs |
| $ | 2,496 |
| $ | 1,976 |
| $ | 520 |
|
|
|
|
|
|
|
|
| |||
Expected annualized impact - $- M |
|
|
|
|
|
|
| |||
19
Implications of Noranda/Falconbridge Merger
Depreciation and Amortization
|
| YTD |
| YTD |
|
|
| |||
(US$ millions) |
| 31-Dec-05 |
| 31-Dec-04 |
|
|
| |||
|
|
|
|
|
|
|
| |||
Reported depreciation and amortization |
| $ | 555 |
| $ | 493 |
| $ | 62 |
|
|
|
|
|
|
|
|
| |||
Amortization of purchase price of FL assets |
| (21 | ) | — |
| (21 | ) | |||
|
|
|
|
|
|
|
| |||
Pre-acquisition DD&A |
| $ | 534 |
| $ | 493 |
| $ | 41 |
|
• Expected annualized pre-tax impact - $62 million
20
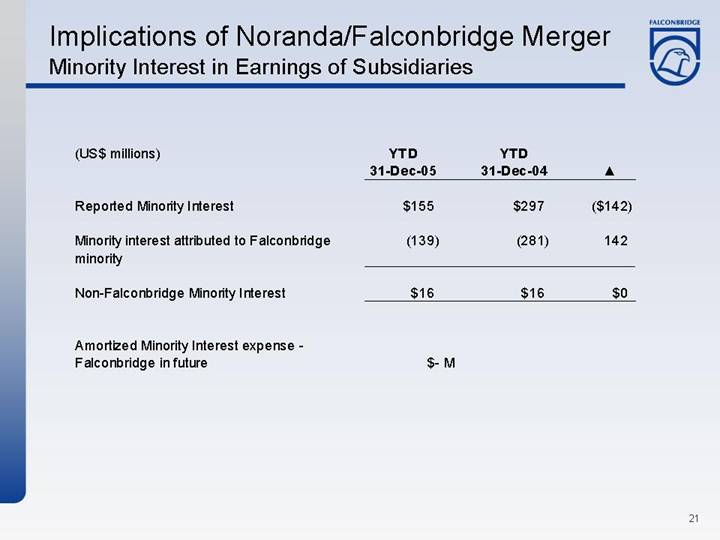
Implications of Noranda/Falconbridge Merger
Minority Interest in Earnings of Subsidiaries
|
| YTD |
| YTD |
|
|
| |||
(US$ millions) |
| 31-Dec-05 |
| 31-Dec-04 |
|
|
| |||
|
|
|
|
|
|
|
| |||
Reported Minority Interest |
| $ | 155 |
| $ | 297 |
| $ | (142 | ) |
|
|
|
|
|
|
|
| |||
Minority interest attributed to Falconbridge minority |
| (139 | ) | (281 | ) | 142 |
| |||
|
|
|
|
|
|
|
| |||
Non-Falconbridge Minority Interest |
| $ | 16 |
| $ | 16 |
| $ | 0 |
|
|
|
|
|
|
|
|
| |||
Amortized Minority Interest expense - Falconbridge in future |
| $ | - | M |
|
|
|
| ||
21
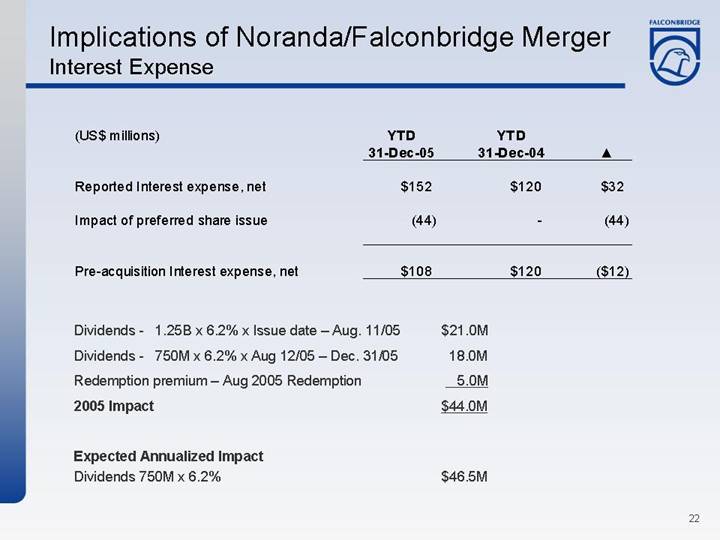
Implications of Noranda/Falconbridge Merger
Interest Expense
|
| YTD |
| YTD |
|
|
| |||
(US$ millions) |
| 31-Dec-05 |
| 31-Dec-04 |
|
|
| |||
|
|
|
|
|
|
|
| |||
Reported Interest expense, net |
| $ | 152 |
| $ | 120 |
| $ | 32 |
|
|
|
|
|
|
|
|
| |||
Impact of preferred share issue |
| (44 | ) | — |
| (44 | ) | |||
|
|
|
|
|
|
|
| |||
Pre-acquisition Interest expense, net |
| $ | 108 |
| $ | 120 |
| $ | (12 | ) |
Dividends - 1.25B x 6.2% x Issue date – Aug. 11/05 |
| $ | 21.0 | M |
Dividends - 750M x 6.2% x Aug 12/05 – Dec. 31/05 |
| 18.0 | M | |
Redemption premium – Aug 2005 Redemption |
| 5.0 | M | |
2005 Impact |
| $ | 44.0 | M |
|
|
|
| |
Expected Annualized Impact |
|
|
| |
Dividends 750M x 6.2% |
| $ | 46.5 | M |
22
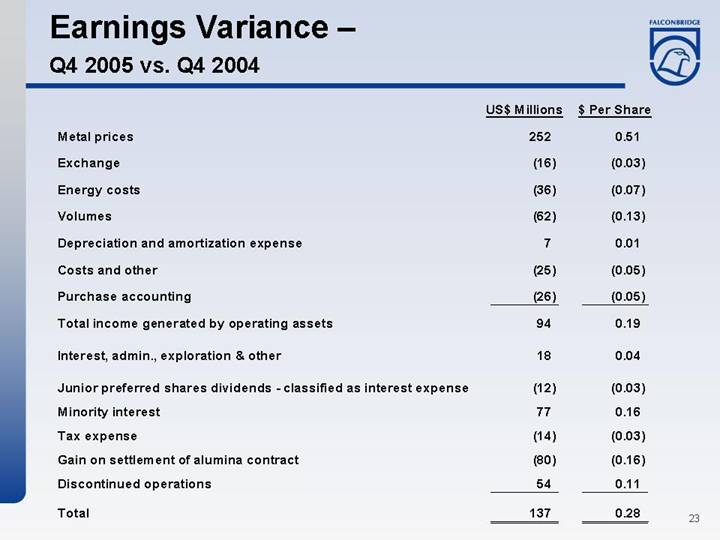
Earnings Variance –
Q4 2005 vs. Q4 2004
|
| US$ Millions |
| $ Per Share |
|
Metal prices |
| 252 |
| 0.51 |
|
Exchange |
| (16 | ) | (0.03 | ) |
Energy costs |
| (36 | ) | (0.07 | ) |
Volumes |
| (62 | ) | (0.13 | ) |
Depreciation and amortization expense |
| 7 |
| 0.01 |
|
Costs and other |
| (25 | ) | (0.05 | ) |
Purchase accounting |
| (26 | ) | (0.05 | ) |
Total income generated by operating assets |
| 94 |
| 0.19 |
|
Interest, admin., exploration & other |
| 18 |
| 0.04 |
|
Junior preferred shares dividends - classified as interest expense |
| (12 | ) | (0.03 | ) |
Minority interest |
| 77 |
| 0.16 |
|
Tax expense |
| (14 | ) | (0.03 | ) |
Gain on settlement of alumina contract |
| (80 | ) | (0.16 | ) |
Discontinued operations |
| 54 |
| 0.11 |
|
Total |
| 137 |
| 0.28 |
|
23
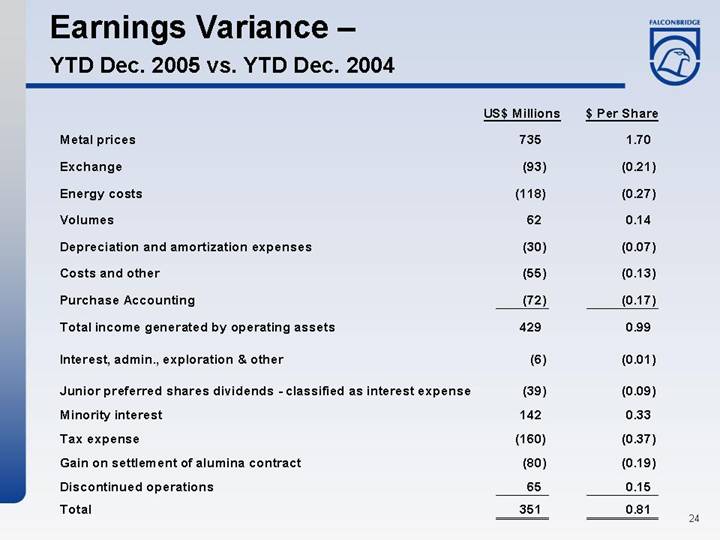
Earnings Variance –
YTD Dec. 2005 vs. YTD Dec. 2004
|
| US$ Millions |
| $ Per Share |
|
Metal prices |
| 735 |
| 1.70 |
|
Exchange |
| (93 | ) | (0.21 | ) |
Energy costs |
| (118 | ) | (0.27 | ) |
Volumes |
| 62 |
| 0.14 |
|
Depreciation and amortization expenses |
| (30 | ) | (0.07 | ) |
Costs and other |
| (55 | ) | (0.13 | ) |
Purchase Accounting |
| (72 | ) | (0.17 | ) |
Total income generated by operating assets |
| 429 |
| 0.99 |
|
Interest, admin., exploration & other |
| (6 | ) | (0.01 | ) |
Junior preferred shares dividends - classified as interest expense |
| (39 | ) | (0.09 | ) |
Minority interest |
| 142 |
| 0.33 |
|
Tax expense |
| (160 | ) | (0.37 | ) |
Gain on settlement of alumina contract |
| (80 | ) | (0.19 | ) |
Discontinued operations |
| 65 |
| 0.15 |
|
Total |
| 351 |
| 0.81 |
|
24
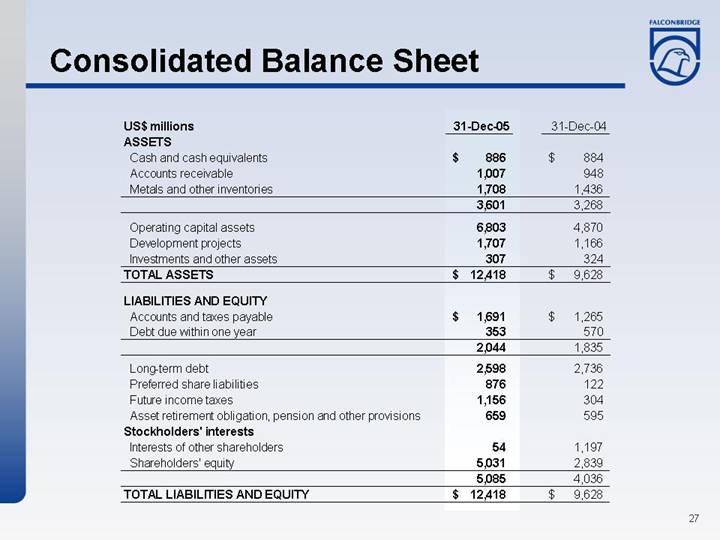
Consolidated Balance Sheet
US$ millions |
| 31-Dec-05 |
| 31-Dec-04 |
| ||
ASSETS |
|
|
|
|
| ||
Cash and cash equivalents |
| $ | 886 |
| $ | 884 |
|
Accounts receivable |
| 1,007 |
| 948 |
| ||
Metals and other inventories |
| 1,708 |
| 1,436 |
| ||
|
| 3,601 |
| 3,268 |
| ||
|
|
|
|
|
| ||
Operating capital assets |
| 6,803 |
| 4,870 |
| ||
Development projects |
| 1,707 |
| 1,166 |
| ||
Investments and other assets |
| 307 |
| 324 |
| ||
TOTAL ASSETS |
| $ | 12,418 |
| $ | 9,628 |
|
|
|
|
|
|
| ||
LIABILITIES AND EQUITY |
|
|
|
|
| ||
Accounts and taxes payable |
| $ | 1,691 |
| $ | 1,265 |
|
Debt due within one year |
| 353 |
| 570 |
| ||
|
| 2,044 |
| 1,835 |
| ||
|
|
|
|
|
| ||
Long-term debt |
| 2,598 |
| 2,736 |
| ||
Preferred share liabilities |
| 876 |
| 122 |
| ||
Future income taxes |
| 1,156 |
| 304 |
| ||
Asset retirement obligation, pension and other provisions |
| 659 |
| 595 |
| ||
Stockholders’ interests |
|
|
|
|
| ||
Interests of other shareholders |
| 54 |
| 1,197 |
| ||
Shareholders’ equity |
| 5,031 |
| 2,839 |
| ||
|
| 5,085 |
| 4,036 |
| ||
TOTAL LIABILITIES AND EQUITY |
| $ | 12,418 |
| $ | 9,628 |
|
27
Capital Investments
(US$ millions) |
| 2005 |
| 2006F |
| ||
|
|
|
|
|
| ||
Koniambo development |
| $ | 96 |
| $ | 180 |
|
Kidd Mine extension |
| 114 |
| 90 |
| ||
Nickel Rim South project |
| 74 |
| 85 |
| ||
Copper dev. projects (El Morro, El Pachon, Lomas Bayas) |
| 4 |
| 50 |
| ||
Nickel dev. projects (Kabanga, Raglan) |
| 61 |
| 30 |
| ||
Sustaining Capital and other |
| 388 |
| 315 |
| ||
|
|
|
|
|
| ||
Total |
| $ | 737 |
| $ | 750 |
|
28
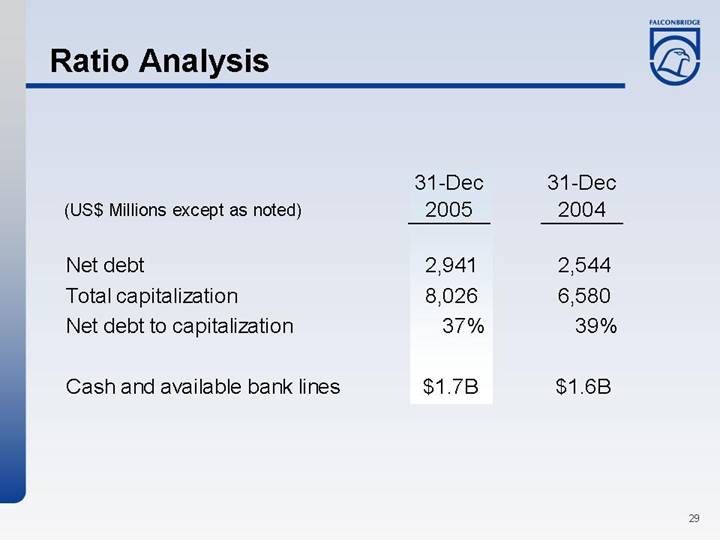
Ratio Analysis
|
| 31-Dec |
| 31-Dec |
| ||
(US$ Millions except as noted) |
| 2005 |
| 2004 |
| ||
|
|
|
|
|
| ||
Net debt |
| 2,941 |
| 2,544 |
| ||
Total capitalization |
| 8,026 |
| 6,580 |
| ||
Net debt to capitalization |
| 37 | % | 39 | % | ||
|
|
|
|
|
| ||
Cash and available bank lines |
| $ | 1.7 | B | $ | 1.6 | B |
29
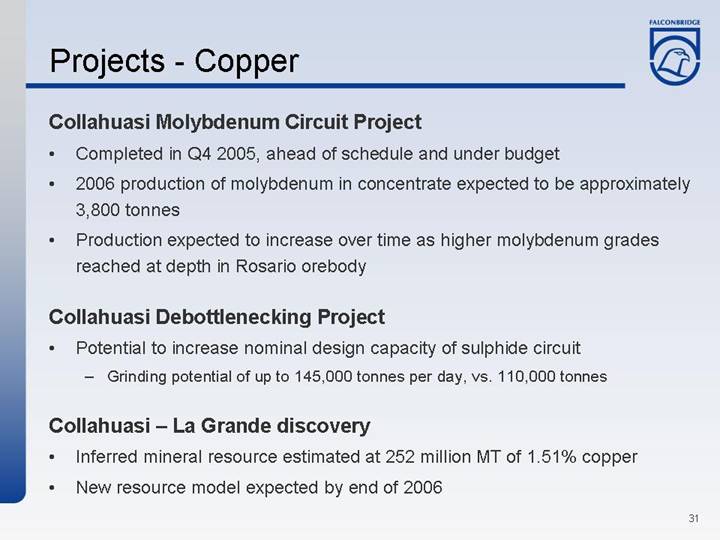
Projects - Copper
Collahuasi Molybdenum Circuit Project
• Completed in Q4 2005, ahead of schedule and under budget
• 2006 production of molybdenum in concentrate expected to be approximately 3,800 tonnes
• Production expected to increase over time as higher molybdenum grades reached at depth in Rosario orebody
Collahuasi Debottlenecking Project
• Potential to increase nominal design capacity of sulphide circuit
• Grinding potential of up to 145,000 tonnes per day, vs. 110,000 tonnes
Collahuasi – La Grande discovery
• Inferred mineral resource estimated at 252 million MT of 1.51% copper
• New resource model expected by end of 2006
31
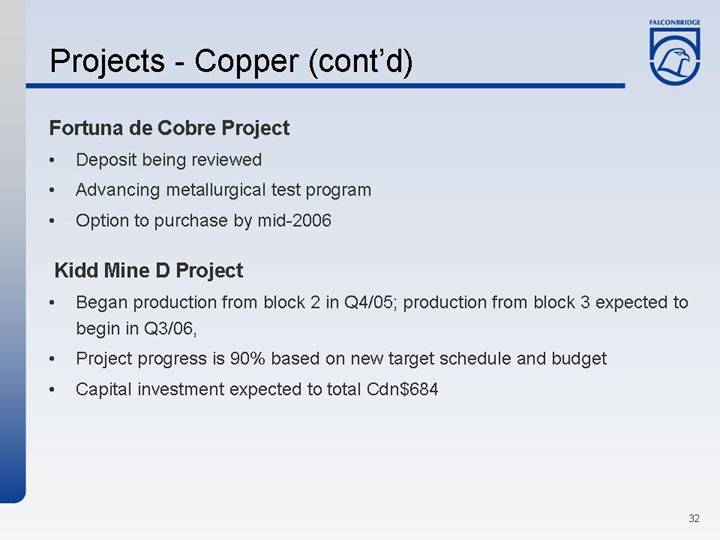
Fortuna de Cobre Project
• Deposit being reviewed
• Advancing metallurgical test program
• Option to purchase by mid-2006
Kidd Mine D Project
• Began production from block 2 in Q4/05; production from block 3 expected to begin in Q3/06,
• Project progress is 90% based on new target schedule and budget
• Capital investment expected to total Cdn$684
32
El Morro (Chile)
• Ore reserves estimated at 466 million MT of 0.61% copper and 0.50g/MT gold
• Production forecast at 160,000 MT of copper and 360,000 Oz. of gold for 16+ years
• Feasibility-level work to begin in 2006, including 30,000 metre in-fill drill program and metallurgical test work
• Feasibility study targeted for completion in Q4 2007
El Pachón (Argentina)
• Attractive copper mine development project situated less than five km from Chilean border and Las Pelambres copper mine
• High grade core, unusually low strip ratio and favourable metallurgical recoveries
• Conceptual study completed in 2005
• Mine reserves estimated at 724 million MT grading 0.65% copper and 0.02% molybdenum
• Production estimated at 275,000 MT of copper per year for four years; 175,000 MT/yr during remaining 19 years
• Expected completion of updated prefeasibility study in Q4 2007
33
Projects - Nickel
Koniambo Project
• Fulfilled the requirements of the Bercy Accord In December 2005, along with its 51% partner Société Minière du Sud Pacifique S.A. (SMSP)
• Completed positive technical feasibility study
• Placed firm orders of at least $100 million for equipment and services relating to project.
• Will result in transfer of ownership to Koniambo Nickel SAS, owned 49% by Falconbridge and 51% by SMSP
• Falconbridge and SMSP reached agreement on financing framework
• Common equity ownership of Koniambo remains at 51% (SMSP) and 49% (Falconbridge)
• Falconbridge to assume responsibility for financing of up to 100%
• Cash generated will be exclusively dedicated to debt retirement prior to shareholder distributions
• Capital cost to be financed is $2.2 billion (in 2004 dollars)
• Excludes working capital and interest during construction
• Next steps include advancing detailed engineering in 2006
• Once necessary permits are in place and details of financing are finalized, Falconbridge expects start of construction phase in 2007
• Start-up of operation expected in 2009/2010
34
Raglan Mine Optimization Project
• Phase One – conversion of mill from autogenous to semi-autogenous grinding
• Completed in October 2005; on schedule and on budget (Cdn$33 million)
• Will increase level of annual throughput to approximately one million MT of ore per year and increase mill’s ability to process harder ore
• Phase Two – maximizing throughput capacity
• Involves expanding site infrastructure and ore production to allow for mining, milling and processing of 1.3 million tonnes of ore annually; resulting in 30,500 MT of annual contained nickel production
• Expected to be complete in early in 2008
35
Nickel Rim South Project
• Vent shaft sinking began in February 2005
• At 1,092 metres
• Main shaft sinking began in April 2005
• At 467 metres
Kabanga Project
• JV agreement with Barrick Gold for nickel deposit in Tanzania
• Scoping study initiated in April 2005
• Drilling program completed over 48,000 meters
• Scheduled completion of scoping study in Q1 2006
36
Market Review
Copper, Nickel, Zinc & Aluminum
• Pension funds and money managers helping drive metals prices
• Excellent fundamentals prevail across metals complex
• Commodity Index Funds now providing exposure to basket of commodities
• Funds’ investments in metals expected to grow
• Rising metal prices affecting consumers
• Constrained consumer inventories providing support during price retractions
• Markets remain firmly underpinned and exposed to supply disruptions and increased role of investment funds
37
Market Review
Copper
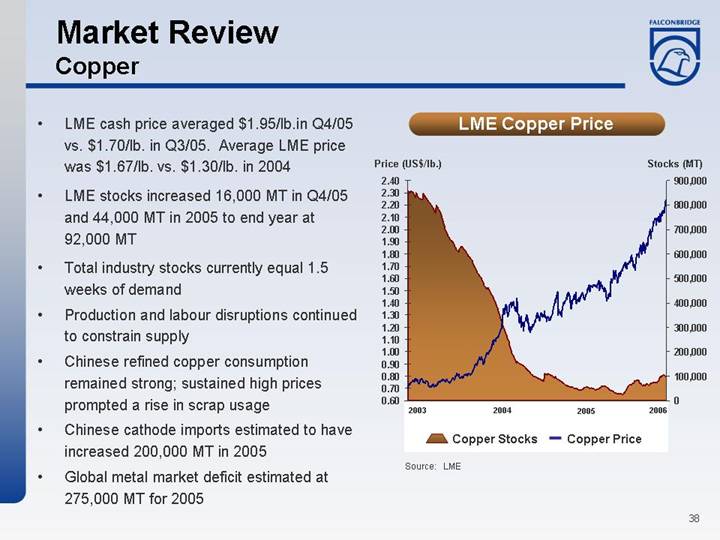
• LME cash price averaged $1.95/lb.in Q4/05 vs. $1.70/lb. in Q3/05. Average LME price was $1.67/lb. vs. $1.30/lb. in 2004
• LME stocks increased 16,000 MT in Q4/05 and 44,000 MT in 2005 to end year at 92,000 MT
• Total industry stocks currently equal 1.5 weeks of demand
• Production and labour disruptions continued to constrain supply
• Chinese refined copper consumption remained strong; sustained high prices prompted a rise in scrap usage
• Chinese cathode imports estimated to have increased 200,000 MT in 2005
• Global metal market deficit estimated at 275,000 MT for 2005
LME Copper Price
[CHART]
Source: LME
38
Market Outlook
Copper
Copper Metal World Supply/Demand Balance
(000s MT) |
| 2005A |
| % |
| 2006F |
| % |
|
|
|
|
|
|
|
|
|
|
|
Supply |
| 17,094 |
| 7.4 | % | 18,437 |
| 7.9 | % |
|
|
|
|
|
|
|
|
|
|
Demand |
|
|
|
|
|
|
|
|
|
North America |
| 3,139 |
| 0.6 | % | 3,202 |
| 2.0 | % |
Europe |
| 4,126 |
| -0.2 | % | 4,213 |
| 2.1 | % |
Japan |
| 1,283 |
| 0.4 | % | 1,288 |
| 0.4 | % |
China |
| 3,820 |
| 7.2 | % | 4,226 |
| 10.6 | % |
Other |
| 5,001 |
| 7.4 | % | 5,171 |
| 3.4 | % |
Total Demand |
| 17,369 |
| 3.7 | % | 18,100 |
| 4.2 | % |
|
|
|
|
|
|
|
|
|
|
Balance |
| -275 |
|
|
| 377 |
|
|
|
|
|
|
|
|
|
|
|
|
|
Stocks |
| 462 |
|
|
| 799 |
|
|
|
Weeks of Supply |
| 1.4 |
|
|
| 2.3 |
|
|
|
|
|
|
|
|
|
|
|
|
|
(Stocks include: LME, CMX, SHFE, Producer, Consumer & Merchant) |
| ||||||||
• Mine production to grow in 2006, but will be affected by declining ore grades in 2007
• Chinese infrastructure building and U.S. hurricane rebuilding continue to support demand
• Metal market to shift to small surplus from small deficit in 2005
• Reuters analyst poll forecasts average price of $1.70/lb. in 2006
39
Market Review
Nickel
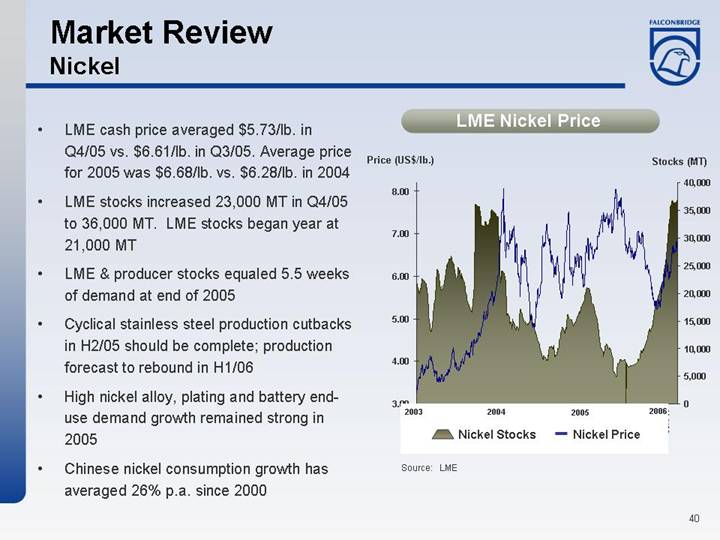
• LME cash price averaged $5.73/lb. in Q4/05 vs. $6.61/lb. in Q3/05. Average price for 2005 was $6.68/lb. vs. $6.28/lb. in 2004
• LME stocks increased 23,000 MT in Q4/05 to 36,000 MT. LME stocks began year at 21,000 MT
• LME & producer stocks equaled 5.5 weeks of demand at end of 2005
• Cyclical stainless steel production cutbacks in H2/05 should be complete; production forecast to rebound in H1/06
• High nickel alloy, plating and battery end-use demand growth remained strong in 2005
• Chinese nickel consumption growth has averaged 26% p.a. since 2000
LME Nickel Price
[CHART]
Source: LME
40
Market Outlook
Nickel
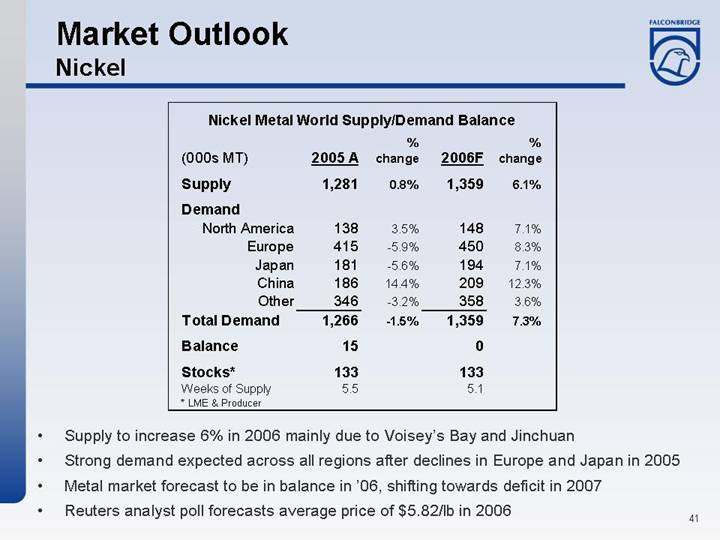
Nickel Metal World Supply/Demand Balance
(000s MT) |
| 2005 A |
| % |
| 2006F |
| % |
|
|
|
|
|
|
|
|
|
|
|
Supply |
| 1,281 |
| 0.8 | % | 1,359 |
| 6.1 | % |
|
|
|
|
|
|
|
|
|
|
Demand |
|
|
|
|
|
|
|
|
|
North America |
| 138 |
| 3.5 | % | 148 |
| 7.1 | % |
Europe |
| 415 |
| -5.9 | % | 450 |
| 8.3 | % |
Japan |
| 181 |
| -5.6 | % | 194 |
| 7.1 | % |
China |
| 186 |
| 14.4 | % | 209 |
| 12.3 | % |
Other |
| 346 |
| -3.2 | % | 358 |
| 3.6 | % |
Total Demand |
| 1,266 |
| -1.5 | % | 1,359 |
| 7.3 | % |
|
|
|
|
|
|
|
|
|
|
Balance |
| 15 |
|
|
| 0 |
|
|
|
|
|
|
|
|
|
|
|
|
|
Stocks* |
| 133 |
|
|
| 133 |
|
|
|
Weeks of Supply |
| 5.5 |
|
|
| 5.1 |
|
|
|
* LME & Producer |
|
|
|
|
|
|
|
|
|
• Supply to increase 6% in 2006 mainly due to Voisey’s Bay and Jinchuan
• Strong demand expected across all regions after declines in Europe and Japan in 2005
• Metal market forecast to be in balance in ’06, shifting towards deficit in 2007
• Reuters analyst poll forecasts average price of $5.82/lb in 2006
41
Market Review
Zinc
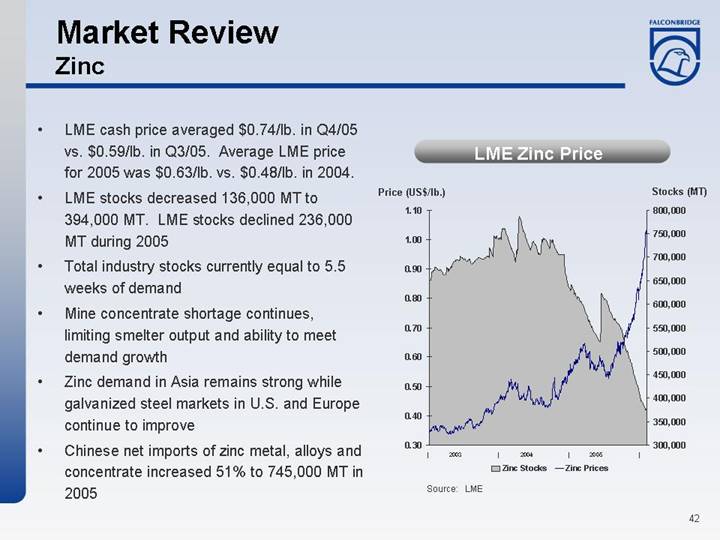
• LME cash price averaged $0.74/lb. in Q4/05 vs. $0.59/lb. in Q3/05. Average LME price for 2005 was $0.63/lb. vs. $0.48/lb. in 2004.
• LME stocks decreased 136,000 MT to 394,000 MT. LME stocks declined 236,000 MT during 2005
• Total industry stocks currently equal to 5.5 weeks of demand
• Mine concentrate shortage continues, limiting smelter output and ability to meet demand growth
• Zinc demand in Asia remains strong while galvanized steel markets in U.S. and Europe continue to improve
• Chinese net imports of zinc metal, alloys and concentrate increased 51% to 745,000 MT in 2005
LME Zinc Price
[CHART]
Source: LME
42
Market Outlook
Zinc
Zinc Metal World Supply/Demand Balance
(000s MT) |
| 2005 A |
| % |
| 2006F |
| % |
|
|
|
|
|
|
|
|
|
|
|
Supply |
| 10,380 |
| 2.2 | % | 10,790 |
| 3.9 | % |
|
|
|
|
|
|
|
|
|
|
Demand |
|
|
|
|
|
|
|
|
|
North America |
| 1,630 |
| -2.7 | % | 1,680 |
| 3.1 | % |
Europe |
| 2,640 |
| -1.5 | % | 2,680 |
| 1.5 | % |
Japan |
| 630 |
| 1.0 | % | 640 |
| 1.6 | % |
China |
| 2,650 |
| 11.0 | % | 2,920 |
| 10.2 | % |
Other |
| 3,120 |
| 2.4 | % | 3,250 |
| 4.2 | % |
Total Demand |
| 10,670 |
| 2.7 | % | 11,170 |
| 4.7 | % |
|
|
|
|
|
|
|
|
|
|
Balance |
| -290 |
|
|
| -380 |
|
|
|
|
|
|
|
|
|
|
|
|
|
Stocks* |
| 1,100 |
|
|
| 720 |
|
|
|
Weeks of Supply |
| 5.5 |
|
|
| 3.5 |
|
|
|
*global LME, producer, consumer |
|
|
|
|
|
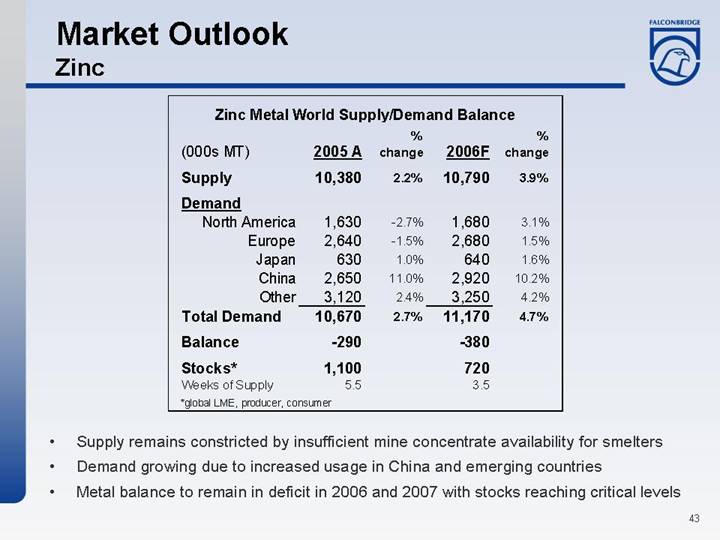
• Supply remains constricted by insufficient mine concentrate availability for smelters
• Demand growing due to increased usage in China and emerging countries
• Metal balance to remain in deficit in 2006 and 2007 with stocks reaching critical levels
43
Market Review
Aluminum
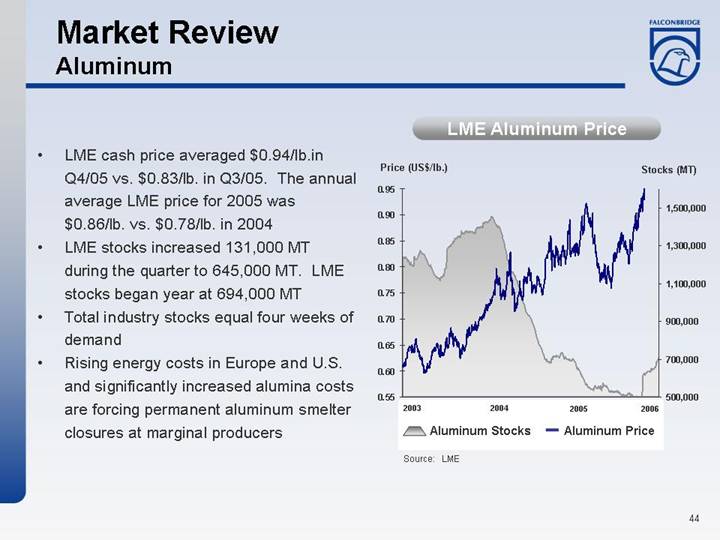
• LME cash price averaged $0.94/lb.in Q4/05 vs. $0.83/lb. in Q3/05. The annual average LME price for 2005 was $0.86/lb. vs. $0.78/lb. in 2004
• LME stocks increased 131,000 MT during the quarter to 645,000 MT. LME stocks began year at 694,000 MT
• Total industry stocks equal four weeks of demand
• Rising energy costs in Europe and U.S. and significantly increased alumina costs are forcing permanent aluminum smelter closures at marginal producers
LME Aluminum Price
[CHART]
Source: LME
44
Market Outlook
Aluminum
Aluminum Metal World Supply/Demand Balance
(’000 MT) |
| 2005 A |
| % |
| 2006F |
| % |
|
|
|
|
|
|
|
|
|
|
|
Supply |
| 31,901 |
| 6.7 | % | 33,567 |
| 5.2 | % |
|
|
|
|
|
|
|
|
|
|
Demand |
|
|
|
|
|
|
|
|
|
North America |
| 7,114 |
| 2.1 | % | 7,193 |
| 1.1 | % |
Europe |
| 8,592 |
| 1.5 | % | 8,853 |
| 3.0 | % |
Japan |
| 2,231 |
| -3.0 | % | 2,235 |
| 0.2 | % |
China |
| 6,983 |
| 17.0 | % | 7,820 |
| 12.0 | % |
Other |
| 6,913 |
| 7.5 | % | 7,263 |
| 5.1 | % |
Total Demand |
| 31,833 |
| 5.7 | % | 33,364 |
| 4.8 | % |
|
|
|
|
|
|
|
|
|
|
Balance |
| 68 |
|
|
| 203 |
|
|
|
|
|
|
|
|
|
|
|
|
|
Stocks |
| 2,439 |
|
|
| 2,642 |
|
|
|
Weeks of Supply |
| 4.0 |
|
|
| 4.1 |
|
|
|
|
|
|
|
|
|
|
|
|
|
Source: Brook Hunt |
|
|
|
| |||||
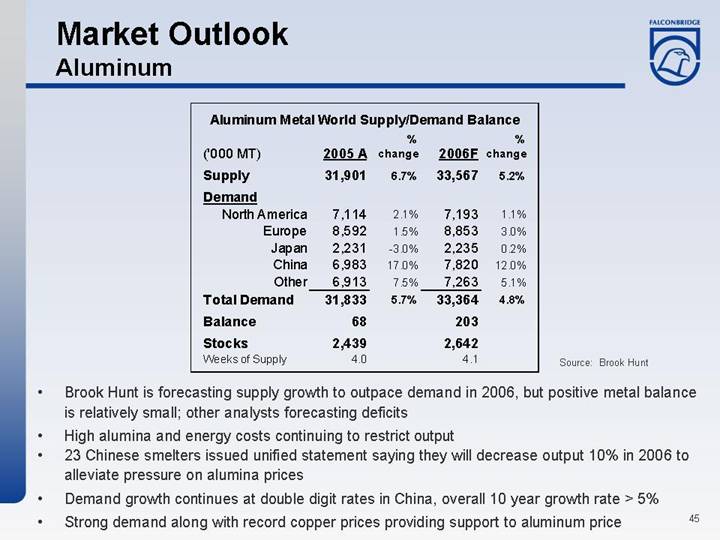
• Brook Hunt is forecasting supply growth to outpace demand in 2006, but positive metal balance is relatively small; other analysts forecasting deficits
• High alumina and energy costs continuing to restrict output
• 23 Chinese smelters issued unified statement saying they will decrease output 10% in 2006 to alleviate pressure on alumina prices
• Demand growth continues at double digit rates in China, overall 10 year growth rate > 5%
• Strong demand along with record copper prices providing support to aluminum price
45
Summary
• Overall demand for metals well supported
• Inventories are low
• New supply slow to materialize
• Positive fundamentals encouraged investment fund participation
• Capital invested to increase
• Positive metal prices environment looks sustainable
46
Important Legal Information
This communication is being made in respect of the share exchange takeover bid by Inco Limited for common shares of Falconbridge Limited. Inco has filed with the U.S. Securities and Exchange Commission (“SEC”) a registration statement on Form F-8 containing a share exchange take-over bid circular. Inco, if required, will file other documents regarding the transaction with the SEC. INVESTORS ARE URGED TO READ THE REGISTRATION STATEMENT AND ANY OTHER RELEVANT DOCUMENTS FILED OR TO BE FILED WITH THE SEC WHEN THEY BECOME AVAILABLE BECAUSE THEY WILL CONTAIN IMPORTANT INFORMATION. Investors will be able to obtain the documents filed with the SEC free of charge at the SEC’s website (www.sec.gov). Canadian investors will also be able to obtain information filed in respect of this bid at www.sedar.com.
48