Filed by Falconbridge Limited
Pursuant to Rule 425 under the Securities Act of 1933
Subject Company: Falconbridge Limited
Commission File No. 333-129218


Searchable text section of graphics shown above
Forward-Looking Statements |
| [LOGO] |
Certain statements contained in this News Release are forward-looking statements (as defined in applicable securities legislation). Examples of such statements include, but are not limited to, statements concerning (i) our assessment of the outlook for metal markets in 2006, (ii) Inco’s offer to acquire all of the common shares of Falconbridge Limited and the benefits of such combination, (iii) our future financial requirements and funding of those requirements, (iv) our expectations with respect to our development projects, (v) our production forecast for 2006 and (vi) our dividend schedule. Inherent in forward-looking statements are risks and uncertainties well beyond our ability to predict or control. Actual results and developments are likely to differ, and may differ materially, from those expressed or implied by the forward-looking statements contained in this News Release. Such statements are based on a number of assumptions which may prove to be incorrect, including, but not limited to, assumptions about the timing, steps to be taken and completion of Inco’s offer to acquire all of our common shares, the ability to successfully compete against global metals and mining and exploration companies by creating through such a combination an enterprise of increased scale; strong demand for nickel, copper and other metals in emerging markets such as China; approximately $350 million per annum in pre-tax operating and other synergies and cost savings, and other benefits being realized based on the achievement of operational efficiencies from restructuring, integration and other initiatives relating to the combination of Falconbridge and Inco; the approvals or clearances required to be obtained by Inco and Falconbridge from regulatory and other agencies and bodies being obtained in a timely manner; divestitures required by regulatory agencies being acceptable and completed in a timely manner; there being limited costs, difficulties or delays related to the integration of the Falconbridge’s operations with those of Inco; the timely completion of the steps required to be taken for the eventual combination of the two companies; business and economic conditions generally; exchange rates, energy and other anticipated and unanticipated costs and pension contributions and expenses; the supply and demand for, deliveries of, and the level and volatility of prices of, nickel, copper, aluminum, zinc and other primary metals products and other metal products Inco and Falconbridge produce; the timing of the receipt of remaining regulatory and governmental approvals for the development projects and other operations; the continued availability of financing on appropriate terms for development projects; Falconbridge’s costs of production and production and productivity levels, as well as those of its competitors; market competition; mining, processing, exploration and research and development activities; the accuracy of ore/mineral reserve estimates; premiums realized over LME cash and other benchmark prices; tax benefits/charges; the resolution of environmental and other proceedings and the impact on the combined company of various environmental regulations and initiatives; assumptions concerning political and economic stability in countries or locations in which Falconbridge operates or otherwise and the ability to continue to pay quarterly cash dividends in such amounts as Falconbridge’s Board of Directors may determine in light of other uses for such funds and other factors.
Inherent in those statements are known and unknown risks, uncertainties and other factors well beyond the Company’s ability to control or predict. Some of these known risks and uncertainties are outlined in filings by Falconbridge with applicable securities regulatory authorities, including in Falconbridge’s annual information form. Readers are encouraged to consult such filings. While Falconbridge anticipates that subsequent events and developments may cause Falconbridge’s views to change, the Company specifically disclaims any obligation to update these forward-looking statements. These forward-looking statements should not be relied upon as representing the Company’s views as of any date subsequent to the date of this news release. Although the Company has attempted to identify important factors that could cause actual actions, events or results to differ materially from those described in forward-looking statements, there may be other factors that cause actions, events or results not to be as anticipated, estimated or intended. There can be no assurance that forward-looking statements will prove to be accurate, as actual results and future events could differ materially from those anticipated in such statements. Accordingly, readers should not place undue reliance on forward-looking statements. These factors are not intended to represent a complete list of the factors that could affect Falconbridge and the combination of Inco and Falconbridge.
2
Falconbridge
A Leading Copper and Nickel Company
• Formed on June 30, 2005 from the merger of Noranda Inc. and Falconbridge Limited
• Focused on the discovery and development of world-class copper and nickel deposits
• One of the world’s largest producers of copper and nickel
• Outstanding pipeline of high-return brownfield and large-scale greenfield project opportunities
• Assets at book value of US$12.4 billion
• Traded FAL on the New York Stock Exchange and FAL.LV on the Toronto Stock Exchange
3
Investor Information
Falconbridge
• As of July 6, 2005, the newly amalgamated company began trading on the Toronto Stock Exchange FAL.LV and the New York Stock Exchange FAL.
• Prior to July 6, 2005 the Company traded on the Toronto Stock Exchange (NRD.LV) and the New York Stock Exchange (NRD) under the name of Noranda Inc.
• Falconbridge’s quarterly financial results for 2006 are scheduled to be released as follows:
• First quarter April 25, 2006
• Press releases and other investor information are available on Falconbridge’s web site at www.falconbridge.com
• Contact information:
| • | General information |
| Reception |
| (416) 982-7111 |
| • | News media |
| Ian Hamilton |
| (416) 982-7161 |
| • | Financial information |
| Martin Pede |
| (416) 982-7337 |
| • | Financial information |
| Tracey Wise |
| (416) 982-7178 |
4
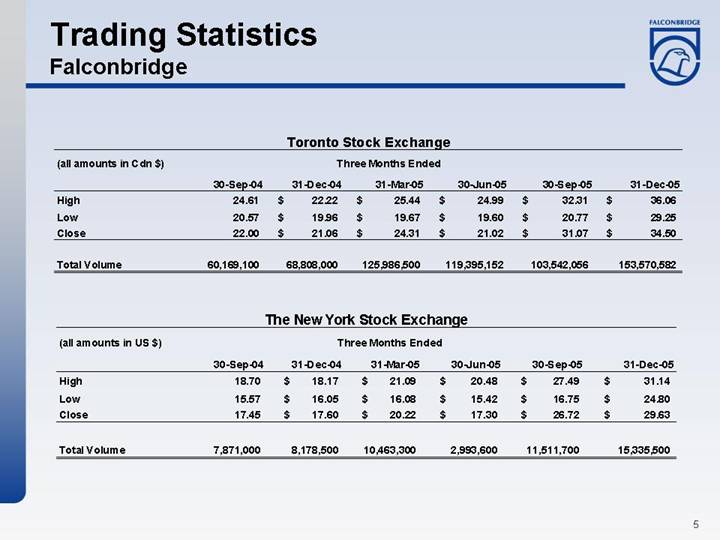
Trading Statistics
Falconbridge
Toronto Stock Exchange
|
| Three Months Ended |
| |||||||||||||||
(all amounts in Cdn $) |
| 30-Sep-04 |
| 31-Dec-04 |
| 31-Mar-05 |
| 30-Jun-05 |
| 30-Sep-05 |
| 31-Dec-05 |
| |||||
High |
| 24.61 |
| $ | 22.22 |
| $ | 25.44 |
| $ | 24.99 |
| $ | 32.31 |
| $ | 36.06 |
|
Low |
| 20.57 |
| $ | 19.96 |
| $ | 19.67 |
| $ | 19.60 |
| $ | 20.77 |
| $ | 29.25 |
|
Close |
| 22.00 |
| $ | 21.06 |
| $ | 24.31 |
| $ | 21.02 |
| $ | 31.07 |
| $ | 34.50 |
|
|
|
|
|
|
|
|
|
|
|
|
|
|
| |||||
Total Volume |
| 60,169,100 |
| 68,808,000 |
| 125,986,500 |
| 119,395,152 |
| 103,542,056 |
| 153,570,582 |
| |||||
The New York Stock Exchange
|
| Three Months Ended |
| |||||||||||||||
(all amounts in US $) |
| 30-Sep-04 |
| 31-Dec-04 |
| 31-Mar-05 |
| 30-Jun-05 |
| 30-Sep-05 |
| 31-Dec-05 |
| |||||
High |
| 18.70 |
| $ | 18.17 |
| $ | 21.09 |
| $ | 20.48 |
| $ | 27.49 |
| $ | 31.14 |
|
Low |
| 15.57 |
| $ | 16.05 |
| $ | 16.08 |
| $ | 15.42 |
| $ | 16.75 |
| $ | 24.80 |
|
Close |
| 17.45 |
| $ | 17.60 |
| $ | 20.22 |
| $ | 17.30 |
| $ | 26.72 |
| $ | 29.63 |
|
|
|
|
|
|
|
|
|
|
|
|
|
|
| |||||
Total Volume |
| 7,871,000 |
| 8,178,500 |
| 10,463,300 |
| 2,993,600 |
| 11,511,700 |
| 15,335,500 |
| |||||
5
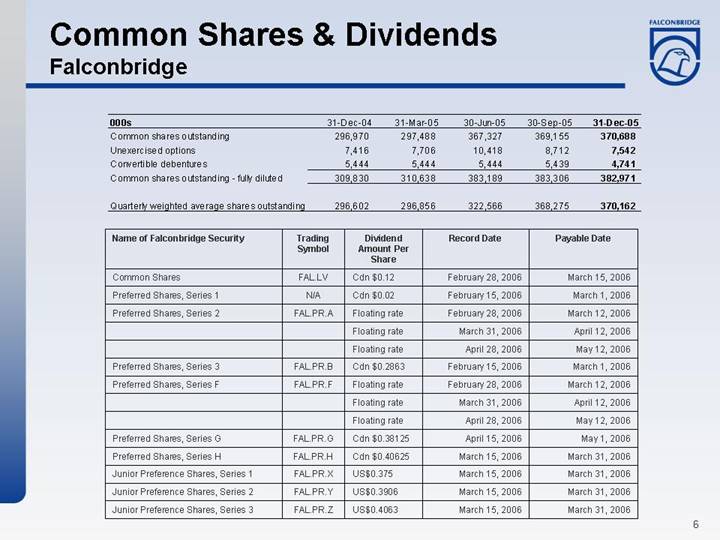
Common Shares & Dividends
Falconbridge
000s |
| 31-Dec-04 |
| 31-Mar-05 |
| 30-Jun-05 |
| 30-Sep-05 |
| 31-Dec-05 |
|
Common shares outstanding |
| 296,970 |
| 297,488 |
| 367,327 |
| 369,155 |
| 370,688 |
|
Unexercised options |
| 7,416 |
| 7,706 |
| 10,418 |
| 8,712 |
| 7,542 |
|
Convertible debentures |
| 5,444 |
| 5,444 |
| 5,444 |
| 5,439 |
| 4,741 |
|
Common shares outstanding - fully diluted |
| 309,830 |
| 310,638 |
| 383,189 |
| 383,306 |
| 382,971 |
|
|
|
|
|
|
|
|
|
|
|
|
|
Quarterly weighted average shares outstanding |
| 296,602 |
| 296,856 |
| 322,566 |
| 368,275 |
| 370,162 |
|
Name of Falconbridge Security |
| Trading |
| Dividend |
| Record Date |
| Payable Date |
|
Common Shares |
| FAL.LV |
| Cdn $0.12 |
| February 28, 2006 |
| March 15, 2006 |
|
Preferred Shares, Series 1 |
| N/A |
| Cdn $0.02 |
| February 15, 2006 |
| March 1, 2006 |
|
Preferred Shares, Series 2 |
| FAL.PR.A |
| Floating rate |
| February 28, 2006 |
| March 12, 2006 |
|
|
|
|
| Floating rate |
| March 31, 2006 |
| April 12, 2006 |
|
|
|
|
| Floating rate |
| April 28, 2006 |
| May 12, 2006 |
|
Preferred Shares, Series 3 |
| FAL.PR.B |
| Cdn $0.2863 |
| February 15, 2006 |
| March 1, 2006 |
|
Preferred Shares, Series F |
| FAL.PR.F |
| Floating rate |
| February 28, 2006 |
| March 12, 2006 |
|
|
|
|
| Floating rate |
| March 31, 2006 |
| April 12, 2006 |
|
|
|
|
| Floating rate |
| April 28, 2006 |
| May 12, 2006 |
|
Preferred Shares, Series G |
| FAL.PR.G |
| Cdn $0.38125 |
| April 15, 2006 |
| May 1, 2006 |
|
Preferred Shares, Series H |
| FAL.PR.H |
| Cdn $0.40625 |
| March 15, 2006 |
| March 31, 2006 |
|
Junior Preference Shares, Series 1 |
| FAL.PR.X |
| US$0.375 |
| March 15, 2006 |
| March 31, 2006 |
|
Junior Preference Shares, Series 2 |
| FAL.PR.Y |
| US$0.3906 |
| March 15, 2006 |
| March 31, 2006 |
|
Junior Preference Shares, Series 3 |
| FAL.PR.Z |
| US$0.4063 |
| March 15, 2006 |
| March 31, 2006 |
|
6
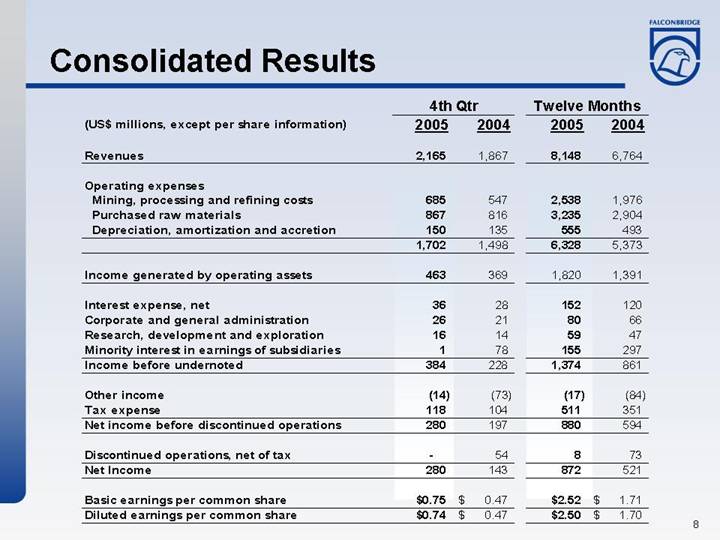
Consolidated Results
|
| 4th Qtr |
| Twelve Months |
| ||||||||
(US$ millions, except per share information) |
| 2005 |
| 2004 |
| 2005 |
| 2004 |
| ||||
|
|
|
|
|
|
|
|
|
| ||||
Revenues |
| 2,165 |
| 1,867 |
| 8,148 |
| 6,764 |
| ||||
|
|
|
|
|
|
|
|
|
| ||||
Operating expenses |
|
|
|
|
|
|
|
|
| ||||
Mining, processing and refining costs |
| 685 |
| 547 |
| 2,538 |
| 1,976 |
| ||||
Purchased raw materials |
| 867 |
| 816 |
| 3,235 |
| 2,904 |
| ||||
Depreciation, amortization and accretion |
| 150 |
| 135 |
| 555 |
| 493 |
| ||||
|
| 1,702 |
| 1,498 |
| 6,328 |
| 5,373 |
| ||||
|
|
|
|
|
|
|
|
|
| ||||
Income generated by operating assets |
| 463 |
| 369 |
| 1,820 |
| 1,391 |
| ||||
|
|
|
|
|
|
|
|
|
| ||||
Interest expense, net |
| 36 |
| 28 |
| 152 |
| 120 |
| ||||
Corporate and general administration |
| 26 |
| 21 |
| 80 |
| 66 |
| ||||
Research, development and exploration |
| 16 |
| 14 |
| 59 |
| 47 |
| ||||
Minority interest in earnings of subsidiaries |
| 1 |
| 78 |
| 155 |
| 297 |
| ||||
Income before undernoted |
| 384 |
| 228 |
| 1,374 |
| 861 |
| ||||
|
|
|
|
|
|
|
|
|
| ||||
Other income |
| (14 | ) | (73 | ) | (17 | ) | (84 | ) | ||||
Tax expense |
| 118 |
| 104 |
| 511 |
| 351 |
| ||||
Net income before discontinued operations |
| 280 |
| 197 |
| 880 |
| 594 |
| ||||
|
|
|
|
|
|
|
|
|
| ||||
Discontinued operations, net of tax |
| — |
| 54 |
| 8 |
| 73 |
| ||||
Net Income |
| 280 |
| 143 |
| 872 |
| 521 |
| ||||
|
|
|
|
|
|
|
|
|
| ||||
Basic earnings per common share |
| $ | 0.75 |
| $ | 0.47 |
| $ | 2.52 |
| $ | 1.71 |
|
Diluted earnings per common share |
| $ | 0.74 |
| $ | 0.47 |
| $ | 2.50 |
| $ | 1.70 |
|
8
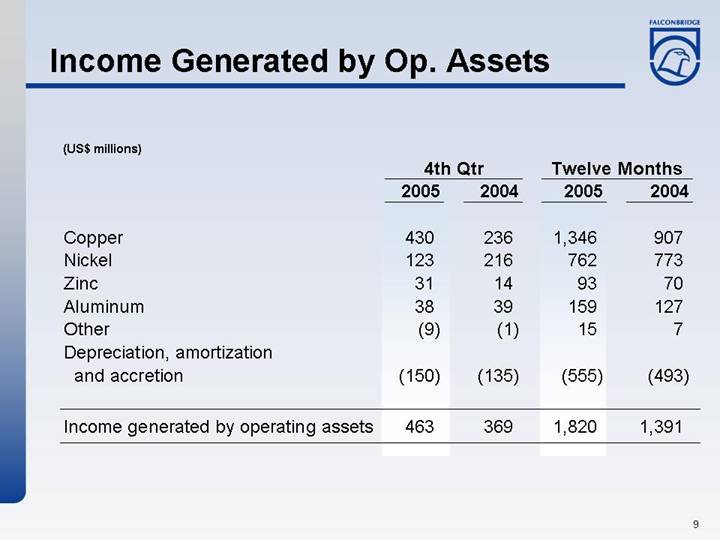
Income Generated by Op. Assets
|
| 4th Qtr |
| Twelve Months |
| ||||
(US$ millions) |
| 2005 |
| 2004 |
| 2005 |
| 2004 |
|
|
|
|
|
|
|
|
|
|
|
Copper |
| 430 |
| 236 |
| 1,346 |
| 907 |
|
Nickel |
| 123 |
| 216 |
| 762 |
| 773 |
|
Zinc |
| 31 |
| 14 |
| 93 |
| 70 |
|
Aluminum |
| 38 |
| 39 |
| 159 |
| 127 |
|
Other |
| (9 | ) | (1 | ) | 15 |
| 7 |
|
Depreciation, amortization and accretion |
| (150 | ) | (135 | ) | (555 | ) | (493 | ) |
|
|
|
|
|
|
|
|
|
|
Income generated by operating assets |
| 463 |
| 369 |
| 1,820 |
| 1,391 |
|
9
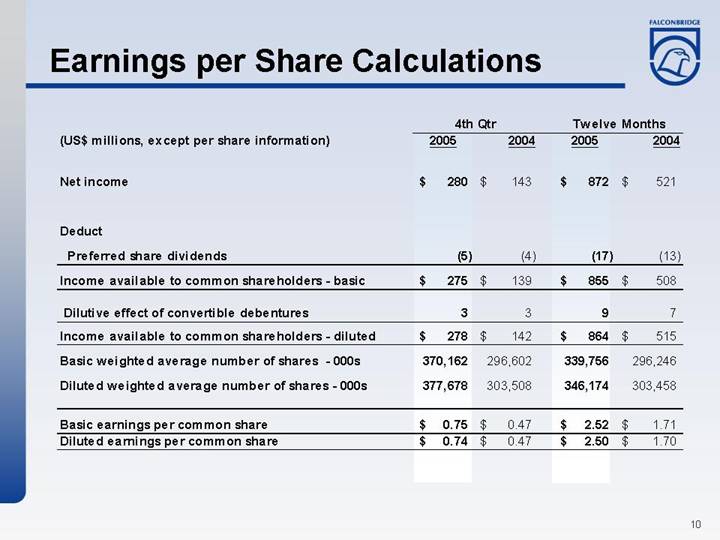
Earnings per Share Calculations
|
| 4th Qtr |
| Twelve Months |
| ||||||||
(US$ millions, except per share information) |
| 2005 |
| 2004 |
| 2005 |
| 2004 |
| ||||
|
|
|
|
|
|
|
|
|
| ||||
Net income |
| $ | 280 |
| $ | 143 |
| $ | 872 |
| $ | 521 |
|
|
|
|
|
|
|
|
|
|
| ||||
Deduct |
|
|
|
|
|
|
|
|
| ||||
Preferred share dividends |
| (5 | ) | (4 | ) | (17 | ) | (13 | ) | ||||
Income available to common shareholders - basic |
| $ | 275 |
| $ | 139 |
| $ | 855 |
| $ | 508 |
|
|
|
|
|
|
|
|
|
|
| ||||
Dilutive effect of convertible debentures |
| 3 |
| 3 |
| 9 |
| 7 |
| ||||
Income available to common shareholders - diluted |
| $ | 278 |
| $ | 142 |
| $ | 864 |
| $ | 515 |
|
Basic weighted average number of shares - 000s |
| 370,162 |
| 296,602 |
| 339,756 |
| 296,246 |
| ||||
Diluted weighted average number of shares - 000s |
| 377,678 |
| 303,508 |
| 346,174 |
| 303,458 |
| ||||
|
|
|
|
|
|
|
|
|
| ||||
Basic earnings per common share |
| $ | 0.75 |
| $ | 0.47 |
| $ | 2.52 |
| $ | 1.71 |
|
Diluted earnings per common share |
| $ | 0.74 |
| $ | 0.47 |
| $ | 2.50 |
| $ | 1.70 |
|
10
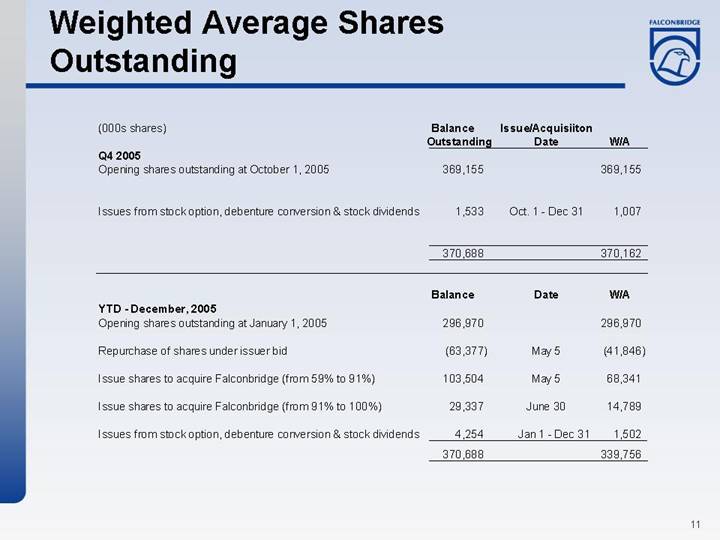
Weighted Average Shares Outstanding
|
| Balance |
| Issue/Acquisiiton |
|
|
|
(000s shares) |
| Outstanding |
| Date |
| W/A |
|
Q4 2005 |
|
|
|
|
|
|
|
Opening shares outstanding at October 1, 2005 |
| 369,155 |
|
|
| 369,155 |
|
|
|
|
|
|
|
|
|
Issues from stock option, debenture conversion & stock dividends |
| 1,533 |
| Oct. 1 - Dec 31 |
| 1,007 |
|
|
|
|
|
|
|
|
|
|
| 370,688 |
|
|
| 370,162 |
|
|
| Balance |
| Date |
| W/A |
|
YTD - December, 2005 |
|
|
|
|
|
|
|
Opening shares outstanding at January 1, 2005 |
| 296,970 |
|
|
| 296,970 |
|
|
|
|
|
|
|
|
|
Repurchase of shares under issuer bid |
| (63,377 | ) | May 5 |
| (41,846 | ) |
|
|
|
|
|
|
|
|
Issue shares to acquire Falconbridge (from 59% to 91%) |
| 103,504 |
| May 5 |
| 68,341 |
|
|
|
|
|
|
|
|
|
Issue shares to acquire Falconbridge (from 91% to 100%) |
| 29,337 |
| June 30 |
| 14,789 |
|
|
|
|
|
|
|
|
|
Issues from stock option, debenture conversion & stock dividends |
| 4,254 |
| Jan 1 - Dec 31 |
| 1,502 |
|
|
| 370,688 |
|
|
| 339,756 |
|
11
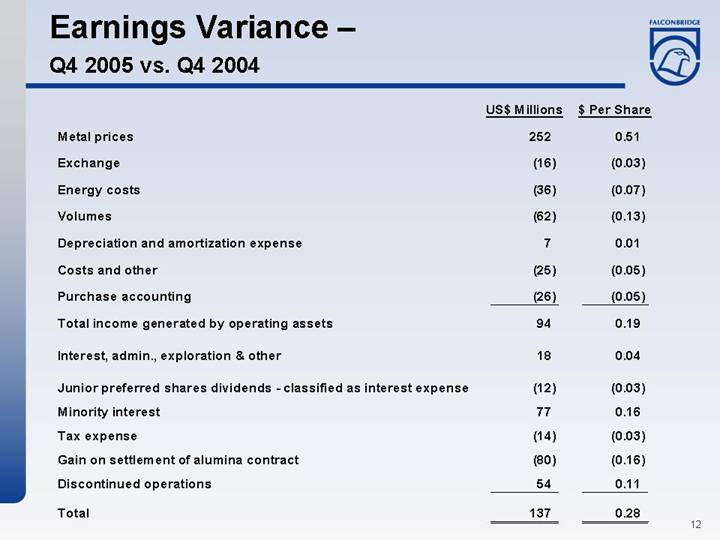
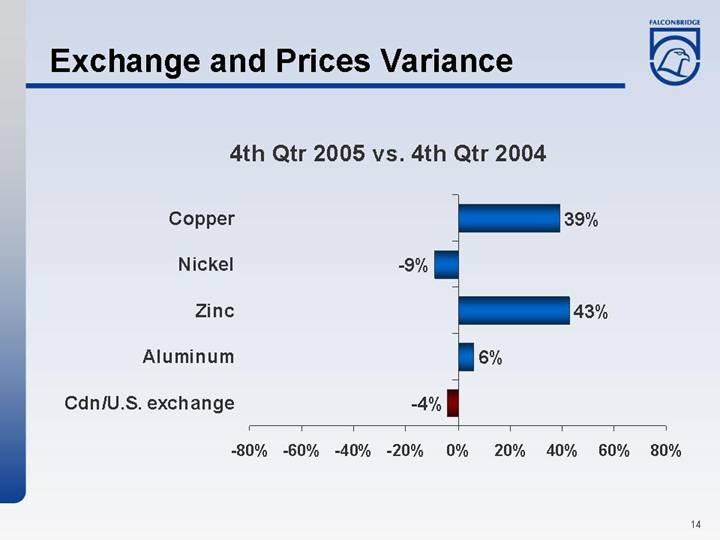
Earnings Variance –
Q4 2005 vs. Q4 2004
|
| US$ Millions |
| $ Per Share |
|
|
|
|
|
|
|
Metal prices |
| 252 |
| 0.51 |
|
|
|
|
|
|
|
Exchange |
| (16 | ) | (0.03 | ) |
|
|
|
|
|
|
Energy costs |
| (36 | ) | (0.07 | ) |
|
|
|
|
|
|
Volumes |
| (62 | ) | (0.13 | ) |
|
|
|
|
|
|
Depreciation and amortization expense |
| 7 |
| 0.01 |
|
|
|
|
|
|
|
Costs and other |
| (25 | ) | (0.05 | ) |
|
|
|
|
|
|
Purchase accounting |
| (26 | ) | (0.05 | ) |
|
|
|
|
|
|
Total income generated by operating assets |
| 94 |
| 0.19 |
|
|
|
|
|
|
|
Interest, admin., exploration & other |
| 18 |
| 0.04 |
|
|
|
|
|
|
|
Junior preferred shares dividends - classified as interest expense |
| (12 | ) | (0.03 | ) |
|
|
|
|
|
|
Minority interest |
| 77 |
| 0.16 |
|
|
|
|
|
|
|
Tax expense |
| (14 | ) | (0.03 | ) |
|
|
|
|
|
|
Gain on settlement of alumina contract |
| (80 | ) | (0.16 | ) |
|
|
|
|
|
|
Discontinued operations |
| 54 |
| 0.11 |
|
|
|
|
|
|
|
Total |
| 137 |
| 0.28 |
|
12
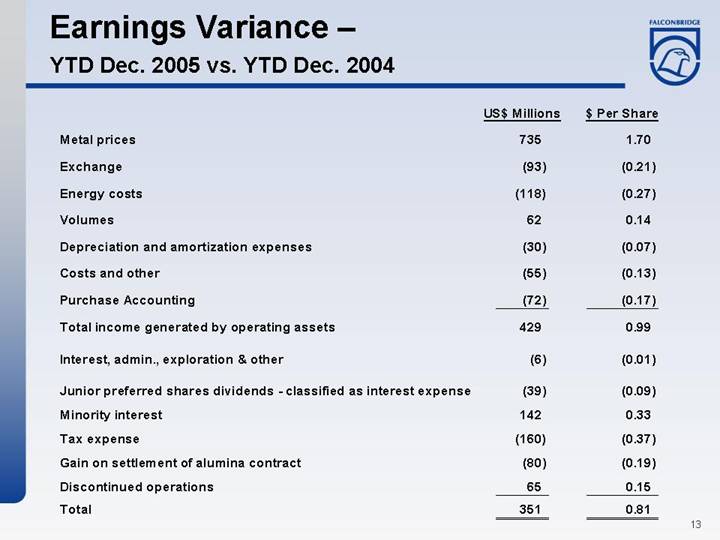
Earnings Variance –
YTD Dec. 2005 vs. YTD Dec. 2004
|
| US$ Millions |
| $ Per Share |
|
|
|
|
|
|
|
Metal prices |
| 735 |
| 1.70 |
|
|
|
|
|
|
|
Exchange |
| (93 | ) | (0.21 | ) |
|
|
|
|
|
|
Energy costs |
| (118 | ) | (0.27 | ) |
|
|
|
|
|
|
Volumes |
| 62 |
| 0.14 |
|
|
|
|
|
|
|
Depreciation and amortization expenses |
| (30 | ) | (0.07 | ) |
|
|
|
|
|
|
Costs and other |
| (55 | ) | (0.13 | ) |
|
|
|
|
|
|
Purchase Accounting |
| (72 | ) | (0.17 | ) |
|
|
|
|
|
|
Total income generated by operating assets |
| 429 |
| 0.99 |
|
|
|
|
|
|
|
Interest, admin., exploration & other |
| (6 | ) | (0.01 | ) |
|
|
|
|
|
|
Junior preferred shares dividends - classified as interest expense |
| (39 | ) | (0.09 | ) |
|
|
|
|
|
|
Minority interest |
| 142 |
| 0.33 |
|
|
|
|
|
|
|
Tax expense |
| (160 | ) | (0.37 | ) |
|
|
|
|
|
|
Gain on settlement of alumina contract |
| (80 | ) | (0.19 | ) |
|
|
|
|
|
|
Discontinued operations |
| 65 |
| 0.15 |
|
|
|
|
|
|
|
Total |
| 351 |
| 0.81 |
|
13
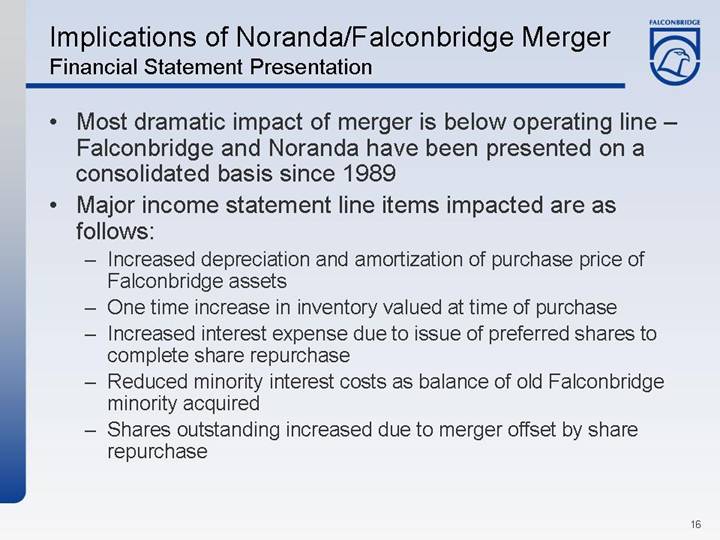
Implications of Noranda/Falconbridge Merger
Financial Statement Presentation
• Most dramatic impact of merger is below operating line – Falconbridge and Noranda have been presented on a consolidated basis since 1989
• Major income statement line items impacted are as follows:
• Increased depreciation and amortization of purchase price of Falconbridge assets
• One time increase in inventory valued at time of purchase
• Increased interest expense due to issue of preferred shares to complete share repurchase
• Reduced minority interest costs as balance of old Falconbridge minority acquired
• Shares outstanding increased due to merger offset by share repurchase
16
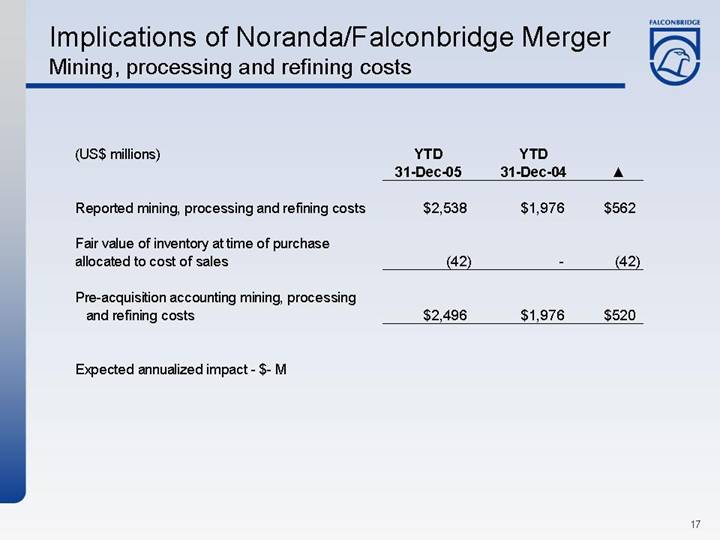
Implications of Noranda/Falconbridge Merger
Mining, processing and refining costs
(US$ millions) |
| YTD |
| YTD |
|
|
| |||
|
|
|
|
|
|
|
| |||
Reported mining, processing and refining costs |
| $ | 2,538 |
| $ | 1,976 |
| $ | 562 |
|
|
|
|
|
|
|
|
| |||
Fair value of inventory at time of purchase allocated to cost of sales |
| (42 | ) | — |
| (42 | ) | |||
|
|
|
|
|
|
|
| |||
Pre-acquisition accounting mining, processing and refining costs |
| $ | 2,496 |
| $ | 1,976 |
| $ | 520 |
|
Expected annualized impact - $- M
17
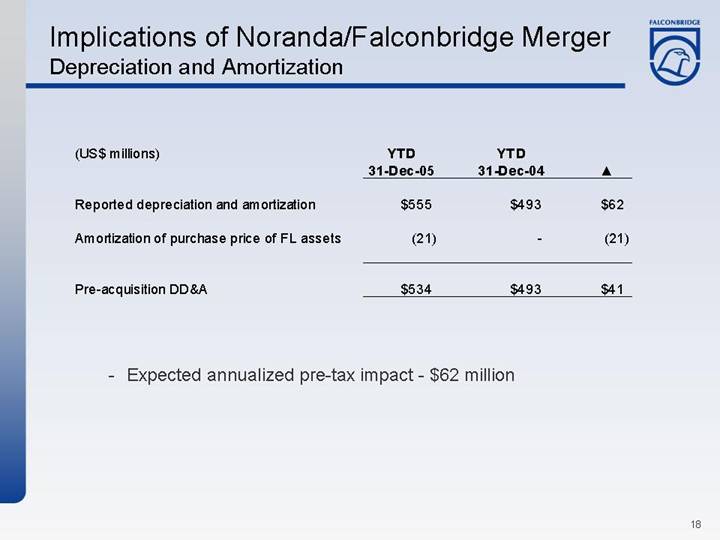
Implications of Noranda/Falconbridge Merger
Depreciation and Amortization
(US$ millions) |
| YTD |
| YTD |
|
|
| |||
|
|
|
|
|
|
|
| |||
Reported depreciation and amortization |
| $ | 555 |
| $ | 493 |
| $ | 62 |
|
|
|
|
|
|
|
|
| |||
Amortization of purchase price of FL assets |
| (21 | ) | — |
| (21 | ) | |||
|
|
|
|
|
|
|
| |||
Pre-acquisition DD&A |
| $ | 534 |
| $ | 493 |
| $ | 41 |
|
• Expected annualized pre-tax impact - $62 million
18
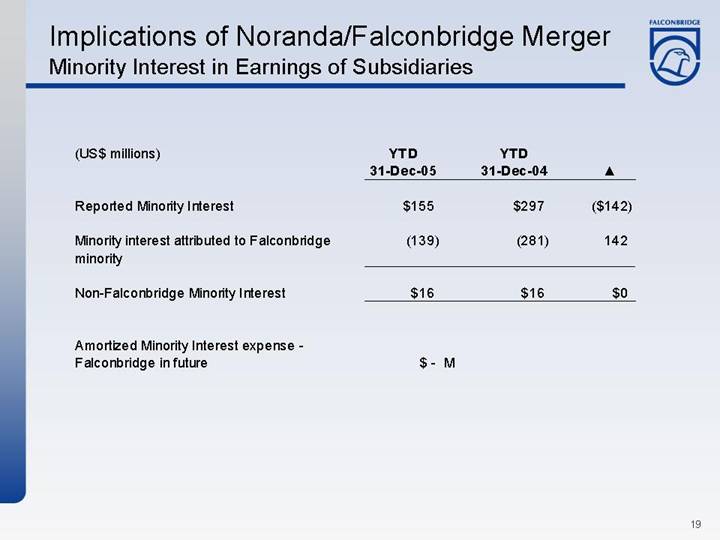
Implications of Noranda/Falconbridge Merger
Minority Interest in Earnings of Subsidiaries
(US$ millions) |
| YTD |
| YTD |
|
|
| |||
|
|
|
|
|
|
|
| |||
Reported Minority Interest |
| $ | 155 |
| $ | 297 |
| $ | (142 | ) |
|
|
|
|
|
|
|
| |||
Minority interest attributed to Falconbridge minority |
| (139 | ) | (281 | ) | 142 |
| |||
|
|
|
|
|
|
|
| |||
Non-Falconbridge Minority Interest |
| $ | 16 |
| $ | 16 |
| $ | 0 |
|
Amortized Minority Interest expense - Falconbridge in future $ - M
19
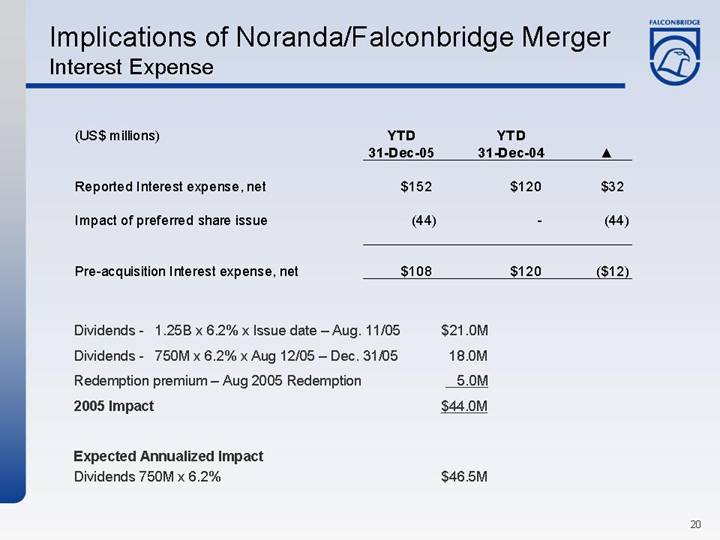
Implications of Noranda/Falconbridge Merger
Interest Expense
(US$ millions) |
| YTD |
| YTD |
|
|
| |||
|
|
|
|
|
|
|
| |||
Reported Interest expense, net |
| $ | 152 |
| $ | 120 |
| $ | 32 |
|
|
|
|
|
|
|
|
| |||
Impact of preferred share issue |
| (44 | ) | — |
| (44 | ) | |||
|
|
|
|
|
|
|
| |||
Pre-acquisition Interest expense, net |
| $ | 108 |
| $ | 120 |
| $ | (12 | ) |
Dividends - | 1.25B x 6.2% x Issue date – Aug. 11/05 |
| $ | 21.0M |
| |
|
|
|
|
| ||
Dividends - | 750M x 6.2% x Aug 12/05 – Dec. 31/05 |
| 18.0M |
| ||
|
|
|
|
| ||
Redemption premium – Aug 2005 Redemption |
| 5.0M |
| |||
|
|
|
|
| ||
2005 Impact |
| $ | 44.0M |
| ||
|
|
|
|
| ||
Expected Annualized Impact |
|
|
| |||
|
|
|
| |||
Dividends 750M x 6.2% |
| $ | 46.5M |
| ||
20
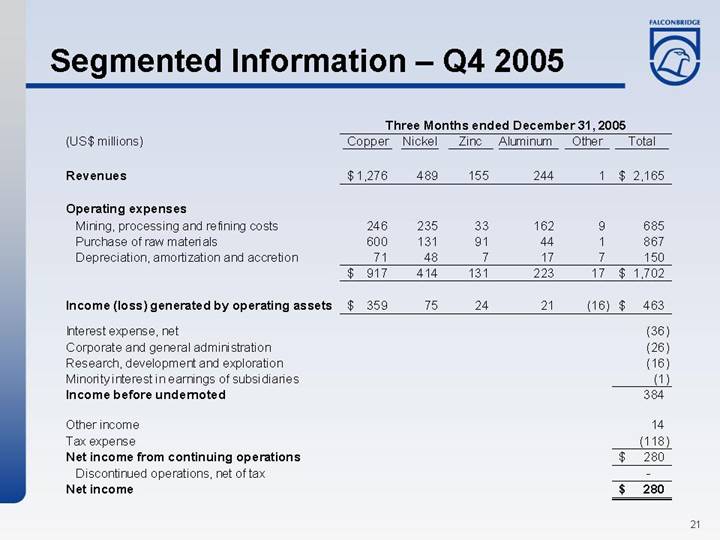
Segmented Information – Q4 2005
|
| Three Months ended December 31, 2005 |
| ||||||||||||
(US$ millions) |
| Copper |
| Nickel |
| Zinc |
| Aluminum |
| Other |
| Total |
| ||
|
|
|
|
|
|
|
|
|
|
|
|
|
| ||
Revenues |
| $ | 1,276 |
| 489 |
| 155 |
| 244 |
| 1 |
| $ | 2,165 |
|
|
|
|
|
|
|
|
|
|
|
|
|
|
| ||
Operating expenses |
|
|
|
|
|
|
|
|
|
|
|
|
| ||
Mining, processing and refining costs |
| 246 |
| 235 |
| 33 |
| 162 |
| 9 |
| 685 |
| ||
Purchase of raw materials |
| 600 |
| 131 |
| 91 |
| 44 |
| 1 |
| 867 |
| ||
Depreciation, amortization and accretion |
| 71 |
| 48 |
| 7 |
| 17 |
| 7 |
| 150 |
| ||
|
| $ | 917 |
| 414 |
| 131 |
| 223 |
| 17 |
| $ | 1,702 |
|
|
|
|
|
|
|
|
|
|
|
|
|
|
| ||
Income (loss) generated by operating assets |
| $ | 359 |
| 75 |
| 24 |
| 21 |
| (16 | ) | $ | 463 |
|
|
|
|
|
|
|
|
|
|
|
|
|
|
| ||
Interest expense, net |
|
|
|
|
|
|
|
|
|
|
| (36 | ) | ||
Corporate and general administration |
|
|
|
|
|
|
|
|
|
|
| (26 | ) | ||
Research, development and exploration |
|
|
|
|
|
|
|
|
|
|
| (16 | ) | ||
Minority interest in earnings of subsidiaries |
|
|
|
|
|
|
|
|
|
|
| (1 | ) | ||
Income before undernoted |
|
|
|
|
|
|
|
|
|
|
| 384 |
| ||
|
|
|
|
|
|
|
|
|
|
|
|
|
| ||
Other income |
|
|
|
|
|
|
|
|
|
|
| 14 |
| ||
Tax expense |
|
|
|
|
|
|
|
|
|
|
| (118 | ) | ||
Net income from continuing operations |
|
|
|
|
|
|
|
|
|
|
| $ | 280 |
| |
Discontinued operations, net of tax |
|
|
|
|
|
|
|
|
|
|
| — |
| ||
Net income |
|
|
|
|
|
|
|
|
|
|
| $ | 280 |
| |
21
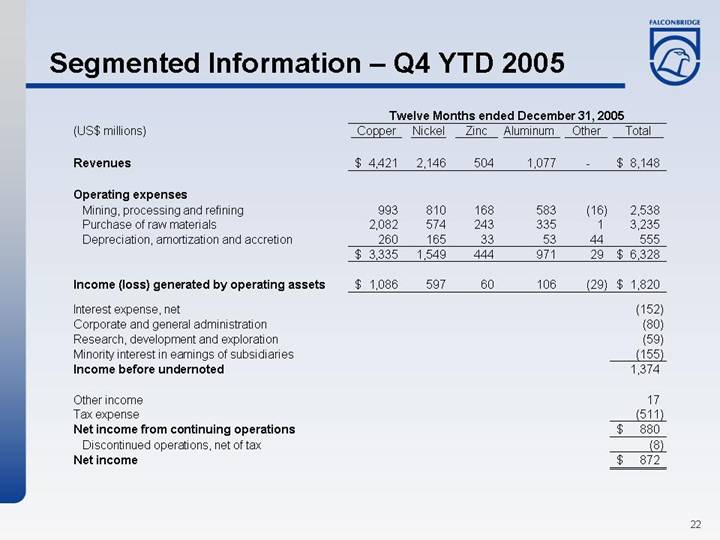
Segmented Information – Q4 YTD 2005
|
| Twelve Months ended December 31, 2005 |
| ||||||||||||
(US$ millions) |
| Copper |
| Nickel |
| Zinc |
| Aluminum |
| Other |
| Total |
| ||
|
|
|
|
|
|
|
|
|
|
|
|
|
| ||
Revenues |
| $ | 4,421 |
| 2,146 |
| 504 |
| 1,077 |
| — |
| $ | 8,148 |
|
|
|
|
|
|
|
|
|
|
|
|
|
|
| ||
Operating expenses |
|
|
|
|
|
|
|
|
|
|
|
|
| ||
Mining, processing and refining |
| 993 |
| 810 |
| 168 |
| 583 |
| (16 | ) | 2,538 |
| ||
Purchase of raw materials |
| 2,082 |
| 574 |
| 243 |
| 335 |
| 1 |
| 3,235 |
| ||
Depreciation, amortization and accretion |
| 260 |
| 165 |
| 33 |
| 53 |
| 44 |
| 555 |
| ||
|
| $ | 3,335 |
| 1,549 |
| 444 |
| 971 |
| 29 |
| $ | 6,328 |
|
|
|
|
|
|
|
|
|
|
|
|
|
|
| ||
Income (loss) generated by operating assets |
| $ | 1,086 |
| 597 |
| 60 |
| 106 |
| (29 | ) | $ | 1,820 |
|
|
|
|
|
|
|
|
|
|
|
|
|
|
| ||
Interest expense, net |
|
|
|
|
|
|
|
|
|
|
| (152 | ) | ||
Corporate and general administration |
|
|
|
|
|
|
|
|
|
|
| (80 | ) | ||
Research, development and exploration |
|
|
|
|
|
|
|
|
|
|
| (59 | ) | ||
Minority interest in earnings of subsidiaries |
|
|
|
|
|
|
|
|
|
|
| (155 | ) | ||
Income before undernoted |
|
|
|
|
|
|
|
|
|
|
| 1,374 |
| ||
|
|
|
|
|
|
|
|
|
|
|
|
|
| ||
Other income |
|
|
|
|
|
|
|
|
|
|
| 17 |
| ||
Tax expense |
|
|
|
|
|
|
|
|
|
|
| (511 | ) | ||
Net income from continuing operations |
|
|
|
|
|
|
|
|
|
|
| $ | 880 |
| |
Discontinued operations, net of tax |
|
|
|
|
|
|
|
|
|
|
| (8 | ) | ||
Net income |
|
|
|
|
|
|
|
|
|
|
| $ | 872 |
| |
22
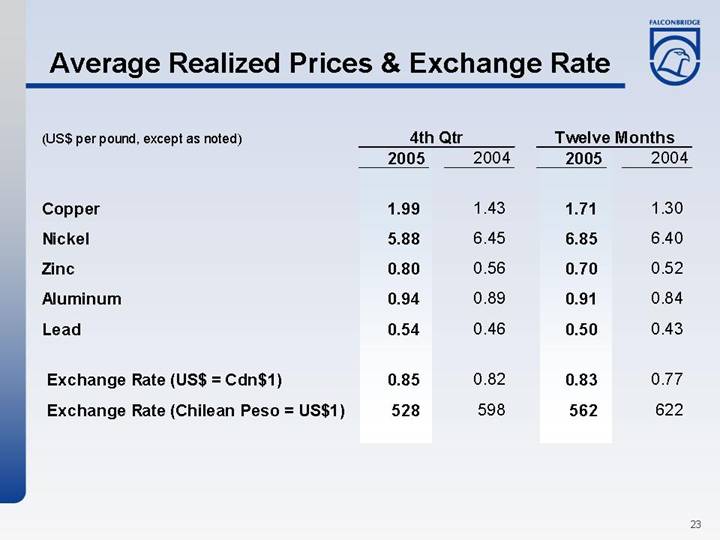
Average Realized Prices & Exchange Rate
|
| 4th Qtr |
| Twelve Months |
| ||||
(US$ per pound, except as noted) |
| 2005 |
| 2004 |
| 2005 |
| 2004 |
|
|
|
|
|
|
|
|
|
|
|
Copper |
| 1.99 |
| 1.43 |
| 1.71 |
| 1.30 |
|
|
|
|
|
|
|
|
|
|
|
Nickel |
| 5.88 |
| 6.45 |
| 6.85 |
| 6.40 |
|
|
|
|
|
|
|
|
|
|
|
Zinc |
| 0.80 |
| 0.56 |
| 0.70 |
| 0.52 |
|
|
|
|
|
|
|
|
|
|
|
Aluminum |
| 0.94 |
| 0.89 |
| 0.91 |
| 0.84 |
|
|
|
|
|
|
|
|
|
|
|
Lead |
| 0.54 |
| 0.46 |
| 0.50 |
| 0.43 |
|
|
|
|
|
|
|
|
|
|
|
Exchange Rate (US$= Cdn$1) |
| 0.85 |
| 0.82 |
| 0.83 |
| 0.77 |
|
|
|
|
|
|
|
|
|
|
|
Exchange Rate (Chilean Peso = US$1) |
| 528 |
| 598 |
| 562 |
| 622 |
|
23
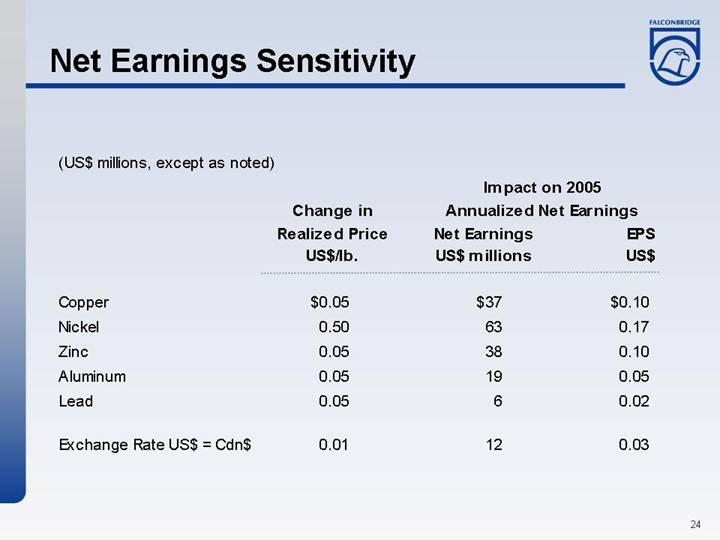
Net Earnings Sensitivity
|
|
|
| Impact on 2005 |
| |||||
|
| Change in |
| Annualized Net Earnings |
| |||||
|
| Realized Price |
| Net Earnings |
| EPS |
| |||
(US$ millions, except as noted) |
| US$/lb. |
| US$ millions |
| US$ |
| |||
|
|
|
|
|
|
|
| |||
Copper |
| $ | 0.05 |
| $ | 37 |
| $ | 0.10 |
|
Nickel |
| 0.50 |
| 63 |
| 0.17 |
| |||
Zinc |
| 0.05 |
| 38 |
| 0.10 |
| |||
Aluminum |
| 0.05 |
| 19 |
| 0.05 |
| |||
Lead |
| 0.05 |
| 6 |
| 0.02 |
| |||
|
|
|
|
|
|
|
| |||
Exchange Rate US$ = Cdn$ |
| 0.01 |
| 12 |
| 0.03 |
| |||
24
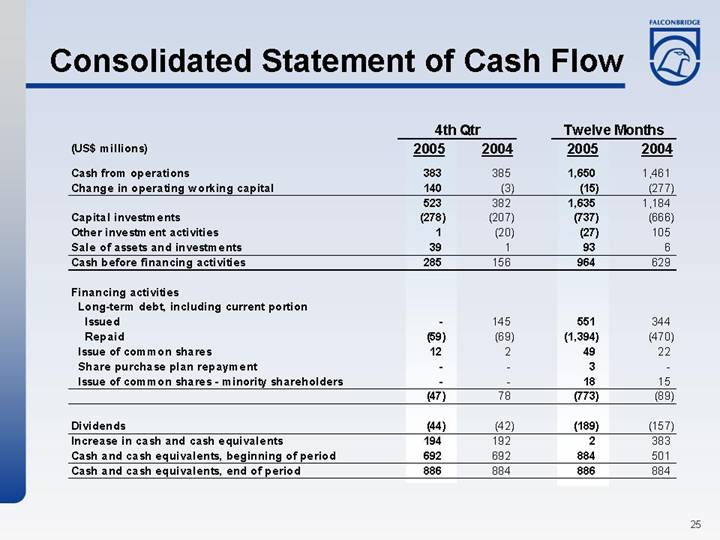
Consolidated Statement of Cash Flow
|
| 4th Qtr |
| Twelve Months |
| ||||
(US$ millions) |
| 2005 |
| 2004 |
| 2005 |
| 2004 |
|
|
|
|
|
|
|
|
|
|
|
Cash from operations |
| 383 |
| 385 |
| 1,650 |
| 1,461 |
|
Change in operating working capital |
| 140 |
| (3 | ) | (15 | ) | (277 | ) |
|
| 523 |
| 382 |
| 1,635 |
| 1,184 |
|
Capital investments |
| (278 | ) | (207 | ) | (737 | ) | (666 | ) |
Other investment activities |
| 1 |
| (20 | ) | (27 | ) | 105 |
|
Sale of assets and investments |
| 39 |
| 1 |
| 93 |
| 6 |
|
Cash before financing activities |
| 285 |
| 156 |
| 964 |
| 629 |
|
|
|
|
|
|
|
|
|
|
|
Financing activities |
|
|
|
|
|
|
|
|
|
Long-term debt, including current portion |
|
|
|
|
|
|
|
|
|
Issued |
| — |
| 145 |
| 551 |
| 344 |
|
Repaid |
| (59 | ) | (69 | ) | (1,394 | ) | (470 | ) |
Issue of common shares |
| 12 |
| 2 |
| 49 |
| 22 |
|
Share purchase plan repayment |
| — |
| — |
| 3 |
| — |
|
Issue of common shares - minority shareholders |
| — |
| — |
| 18 |
| 15 |
|
|
| (47 | ) | 78 |
| (773 | ) | (89 | ) |
|
|
|
|
|
|
|
|
|
|
Dividends |
| (44 | ) | (42 | ) | (189 | ) | (157 | ) |
Increase in cash and cash equivalents |
| 194 |
| 192 |
| 2 |
| 383 |
|
Cash and cash equivalents, beginning of period |
| 692 |
| 692 |
| 884 |
| 501 |
|
Cash and cash equivalents, end of period |
| 886 |
| 884 |
| 886 |
| 884 |
|
25
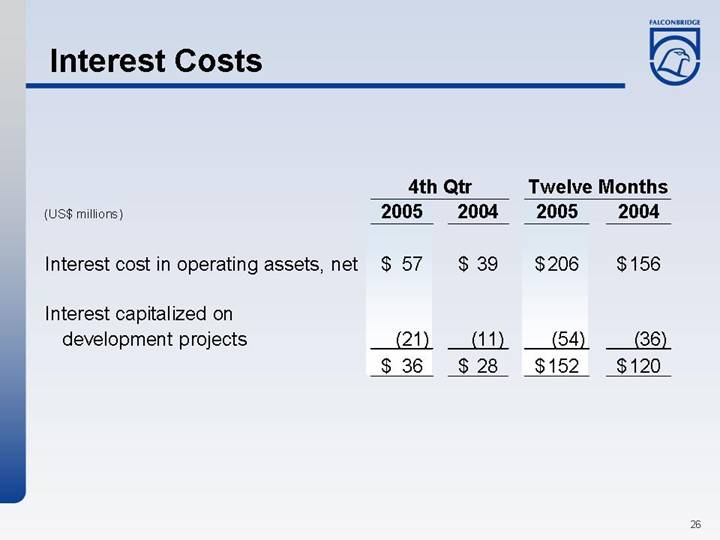
Interest Costs
|
| 4th Qtr |
| Twelve Months |
| ||||||||
(US$ millions) |
| 2005 |
| 2004 |
| 2005 |
| 2004 |
| ||||
|
|
|
|
|
|
|
|
|
| ||||
Interest cost in operating assets, net |
| $ | 57 |
| $ | 39 |
| $ | 206 |
| $ | 156 |
|
|
|
|
|
|
|
|
|
|
| ||||
Interest capitalized on development projects |
| (21 | ) | (11 | ) | (54 | ) | (36 | ) | ||||
|
| $ | 36 |
| $ | 28 |
| $ | 152 |
| $ | 120 |
|
26
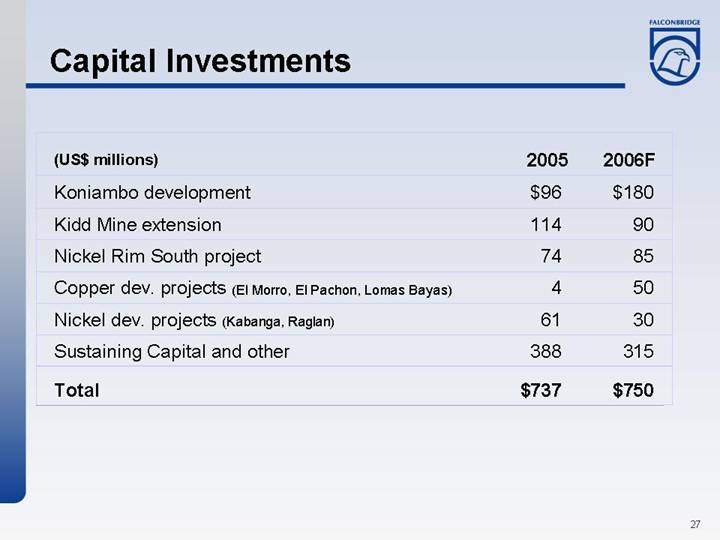
Capital Investments
(US$ millions) |
| 2005 |
| 2006F |
| ||
|
|
|
|
|
| ||
Koniambo development |
| $ | 96 |
| $ | 180 |
|
Kidd Mine extension |
| 114 |
| 90 |
| ||
Nickel Rim South project |
| 74 |
| 85 |
| ||
Copper dev. projects (El Morro, El Pachon, Lomas Bayas) |
| 4 |
| 50 |
| ||
Nickel dev. projects (Kabanga, Raglan) |
| 61 |
| 30 |
| ||
Sustaining Capital and other |
| 388 |
| 315 |
| ||
|
|
|
|
|
| ||
Total |
| $ | 737 |
| $ | 750 |
|
27
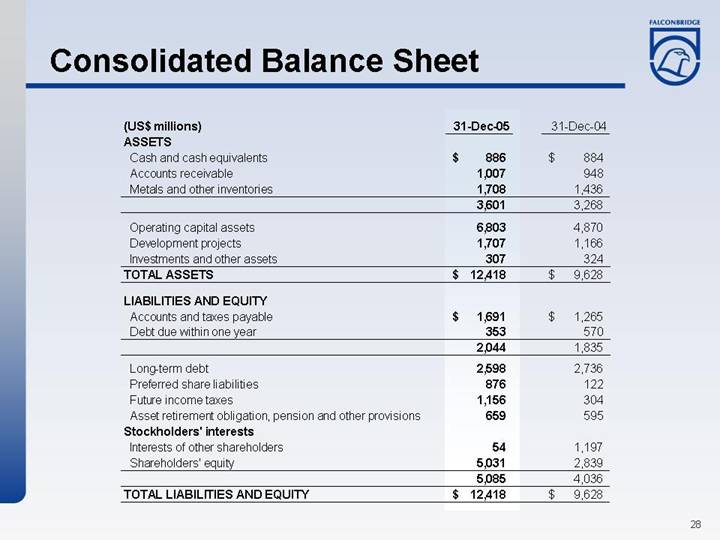
Consolidated Balance Sheet
(US$ millions) |
| 31-Dec-05 |
| 31-Dec-04 |
| ||
ASSETS |
|
|
|
|
| ||
Cash and cash equivalents |
| $ | 886 |
| $ | 884 |
|
Accounts receivable |
| 1,007 |
| 948 |
| ||
Metals and other inventories |
| 1,708 |
| 1,436 |
| ||
|
| 3,601 |
| 3,268 |
| ||
|
|
|
|
|
| ||
Operating capital assets |
| 6,803 |
| 4,870 |
| ||
Development projects |
| 1,707 |
| 1,166 |
| ||
Investments and other assets |
| 307 |
| 324 |
| ||
TOTAL ASSETS |
| $ | 12,418 |
| $ | 9,628 |
|
|
|
|
|
|
| ||
LIABILITIES AND EQUITY |
|
|
|
|
| ||
Accounts and taxes payable |
| $ | 1,691 |
| $ | 1,265 |
|
Debt due within one year |
| 353 |
| 570 |
| ||
|
| 2,044 |
| 1,835 |
| ||
|
|
|
|
|
| ||
Long-term debt |
| 2,598 |
| 2,736 |
| ||
Preferred share liabilities |
| 876 |
| 122 |
| ||
Future income taxes |
| 1,156 |
| 304 |
| ||
Asset retirement obligation, pension and other provisions |
| 659 |
| 595 |
| ||
Stockholders’ interests |
|
|
|
|
| ||
Interests of other shareholders |
| 54 |
| 1,197 |
| ||
Shareholders’ equity |
| 5,031 |
| 2,839 |
| ||
|
| 5,085 |
| 4,036 |
| ||
TOTAL LIABILITIES AND EQUITY |
| $ | 12,418 |
| $ | 9,628 |
|
28
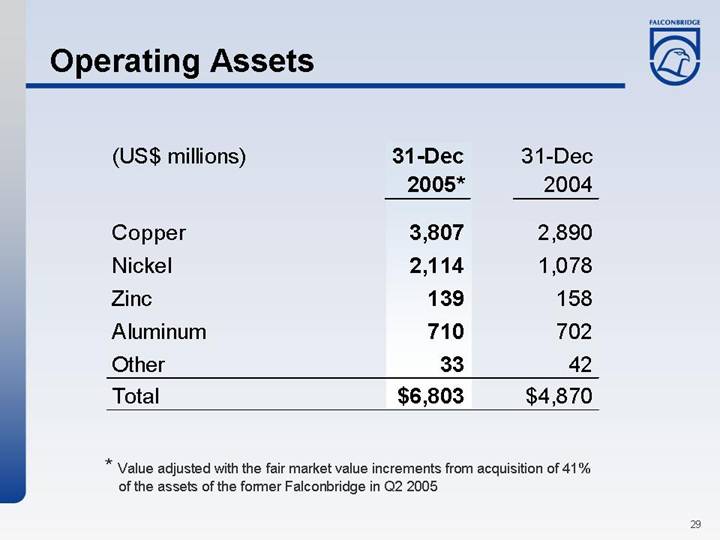
Operating Assets
|
| 31-Dec |
| 31-Dec |
| ||
(US$ millions) |
| 2005* |
| 2004 |
| ||
|
|
|
|
|
| ||
Copper |
| 3,807 |
| 2,890 |
| ||
Nickel |
| 2,114 |
| 1,078 |
| ||
Zinc |
| 139 |
| 158 |
| ||
Aluminum |
| 710 |
| 702 |
| ||
Other |
| 33 |
| 42 |
| ||
Total |
| $ | 6,803 |
| $ | 4,870 |
|
* Value adjusted with the fair market value increments from acquisition of 41% of the assets of the former Falconbridge in Q2 2005
29
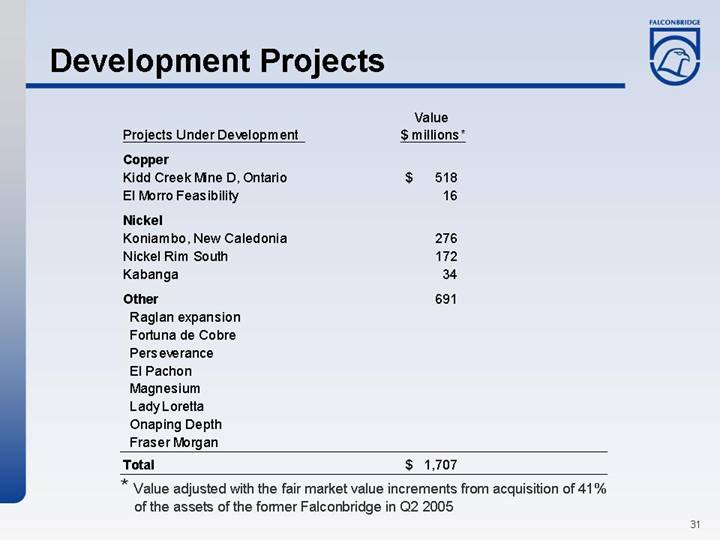
Development Projects
|
| Value |
| |
Projects Under Development |
| $ millions* |
| |
|
|
|
| |
Copper |
|
|
| |
Kidd Creek Mine D, Ontario |
| $ | 518 |
|
El Morro Feasibility |
| 16 |
| |
|
|
|
| |
Nickel |
|
|
| |
Koniambo, New Caledonia |
| 276 |
| |
Nickel Rim South |
| 172 |
| |
Kabanga |
| 34 |
| |
|
|
|
| |
Other |
| 691 |
| |
Raglan expansion |
|
|
| |
Fortuna de Cobre |
|
|
| |
Perseverance |
|
|
| |
El Pachon |
|
|
| |
Magnesium |
|
|
| |
Lady Loretta |
|
|
| |
Onaping Depth |
|
|
| |
Fraser Morgan |
|
|
| |
Total |
| $ | 1,707 |
|
* Value adjusted with the fair market value increments from acquisition of 41% of the assets of the former Falconbridge in Q2 2005
31
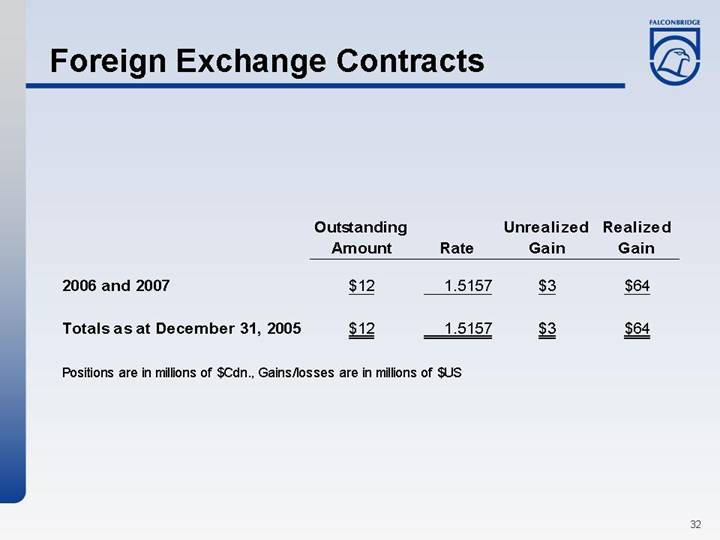
Foreign Exchange Contracts
|
| Outstanding Amount |
| Rate |
| Unrealized |
| Realized |
| |||
|
|
|
|
|
|
|
|
|
| |||
2006 and 2007 |
| $ | 12 |
| 1.5157 |
| $ | 3 |
| $ | 64 |
|
|
|
|
|
|
|
|
|
|
| |||
Totals as at December 31, 2005 |
| $ | 12 |
| 1.5157 |
| $ | 3 |
| $ | 64 |
|
Positions are in millions of $Cdn., Gains/losses are in millions of $US
32
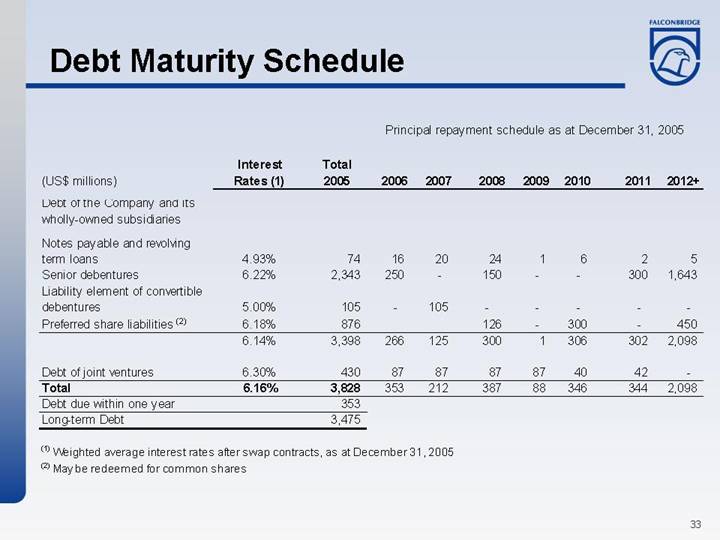
Debt Maturity Schedule
Principal repayment schedule as at December 31, 2005
(US$ millions) |
| Interest |
| Total |
| 2006 |
| 2007 |
| 2008 |
| 2009 |
| 2010 |
| 2011 |
| 2012+ |
|
|
|
|
|
|
|
|
|
|
|
|
|
|
|
|
|
|
|
|
|
Debt of the Company and its wholly-owned subsidiaries |
|
|
|
|
|
|
|
|
|
|
|
|
|
|
|
|
|
|
|
|
|
|
|
|
|
|
|
|
|
|
|
|
|
|
|
|
|
|
|
Notes payable and revolving term loans |
| 4.93 | % | 74 |
| 16 |
| 20 |
| 24 |
| 1 |
| 6 |
| 2 |
| 5 |
|
Senior debentures |
| 6.22 | % | 2,343 |
| 250 |
| — |
| 150 |
| — |
| — |
| 300 |
| 1,643 |
|
Liability element of convertible debentures |
| 5.00 | % | 105 |
| — |
| 105 |
| — |
| — |
| — |
| — |
| — |
|
Preferred share liabilities (2) |
| 6.18 | % | 876 |
|
|
|
|
| 126 |
| — |
| 300 |
| — |
| 450 |
|
|
| 6.14 | % | 3,398 |
| 266 |
| 125 |
| 300 |
| 1 |
| 306 |
| 302 |
| 2,098 |
|
|
|
|
|
|
|
|
|
|
|
|
|
|
|
|
|
|
|
|
|
Debt of joint ventures |
| 6.30 | % | 430 |
| 87 |
| 87 |
| 87 |
| 87 |
| 40 |
| 42 |
| — |
|
Total |
| 6.16 | % | 3,828 |
| 353 |
| 212 |
| 387 |
| 88 |
| 346 |
| 344 |
| 2,098 |
|
Debt due within one year |
|
|
| 353 |
|
|
|
|
|
|
|
|
|
|
|
|
|
|
|
Long-term Debt |
|
|
| 3,475 |
|
|
|
|
|
|
|
|
|
|
|
|
|
|
|
(1) Weighted average interest rates after swap contracts, as at December 31, 2005
(2) May be redeemed for common shares
33
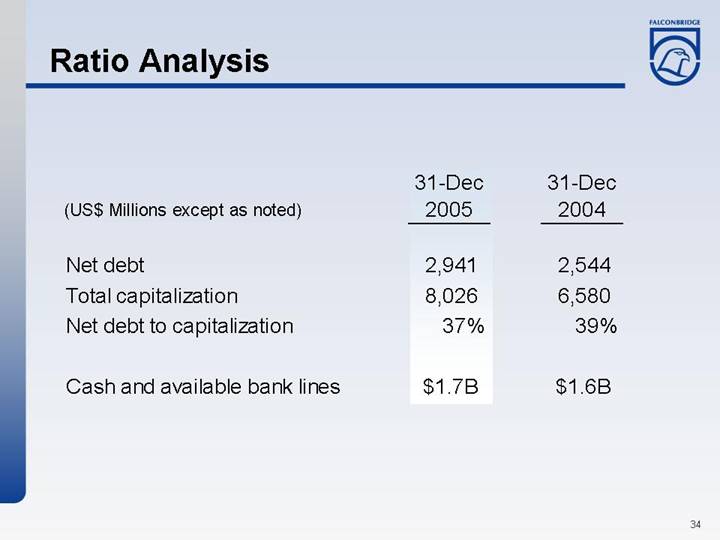
Ratio Analysis
|
| 31-Dec |
| 31-Dec |
| ||
(US$ Millions except as noted) |
| 2005 |
| 2004 |
| ||
|
|
|
|
|
| ||
Net debt |
| 2,941 |
| 2,544 |
| ||
Total capitalization |
| 8,026 |
| 6,580 |
| ||
Net debt to capitalization |
| 37 | % | 39 | % | ||
|
|
|
|
|
| ||
Cash and available bank lines |
| $ | 1.7B |
| $ | 1.6B |
|
34
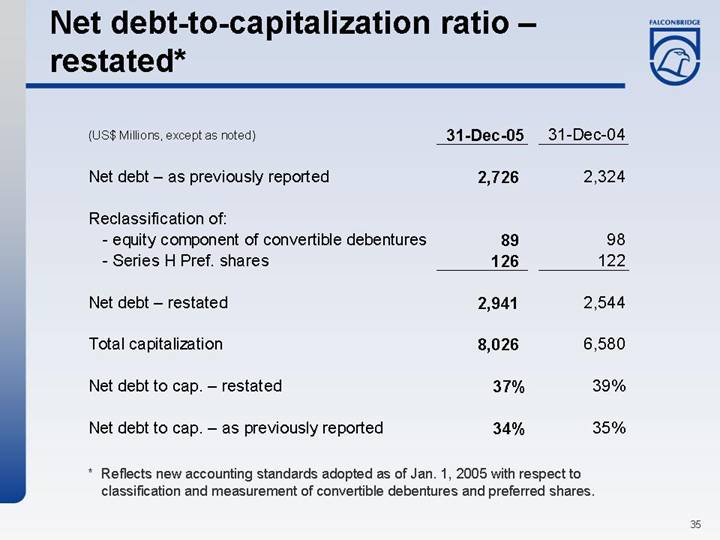
Net debt-to-capitalization ratio – restated*
(US$ Millions, except as noted) |
| 31-Dec-05 |
| 31-Dec-04 |
|
|
|
|
|
|
|
Net debt – as previously reported |
| 2,726 |
| 2,324 |
|
|
|
|
|
|
|
Reclassification of: |
|
|
|
|
|
- equity component of convertible debentures |
| 89 |
| 98 |
|
- Series H Pref. shares |
| 126 |
| 122 |
|
|
|
|
|
|
|
Net debt – restated |
| 2,941 |
| 2,544 |
|
|
|
|
|
|
|
Total capitalization |
| 8,026 |
| 6,580 |
|
|
|
|
|
|
|
Net debt to cap. – restated |
| 37 | % | 39 | % |
|
|
|
|
|
|
Net debt to cap. – as previously reported |
| 34 | % | 35 | % |
* Reflects new accounting standards adopted as of Jan. 1, 2005 with respect to classification and measurement of convertible debentures and preferred shares.
35
Investment Grade Credit Ratings
• |
| Moody’s Investors Service |
| Baa3 |
|
|
|
|
|
• |
| Standard & Poor’s |
| BBB- |
|
|
|
|
|
• |
| Dominion Bond Rating |
| BBB |
36
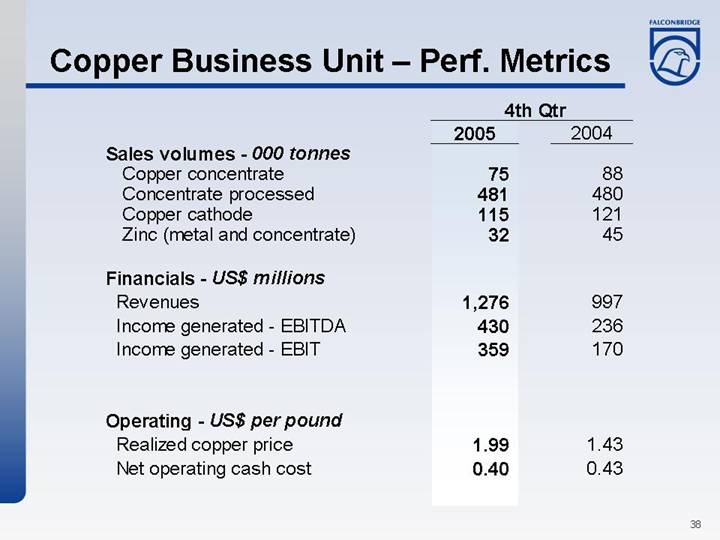
Copper Business Unit – Perf. Metrics |
| [LOGO] |
|
| 4th Qtr |
| ||
|
| 2005 |
| 2004 |
|
Sales volumes - 000 tonnes |
|
|
|
|
|
Copper concentrate |
| 75 |
| 88 |
|
Concentrate processed |
| 481 |
| 480 |
|
Copper cathode |
| 115 |
| 121 |
|
Zinc (metal and concentrate) |
| 32 |
| 45 |
|
|
|
|
|
|
|
Financials - US$ millions |
|
|
|
|
|
Revenues |
| 1,276 |
| 997 |
|
Income generated - EBITDA |
| 430 |
| 236 |
|
Income generated - EBIT |
| 359 |
| 170 |
|
|
|
|
|
|
|
Operating - US$ per pound |
|
|
|
|
|
Realized copper price |
| 1.99 |
| 1.43 |
|
Net operating cash cost |
| 0.40 |
| 0.43 |
|
38
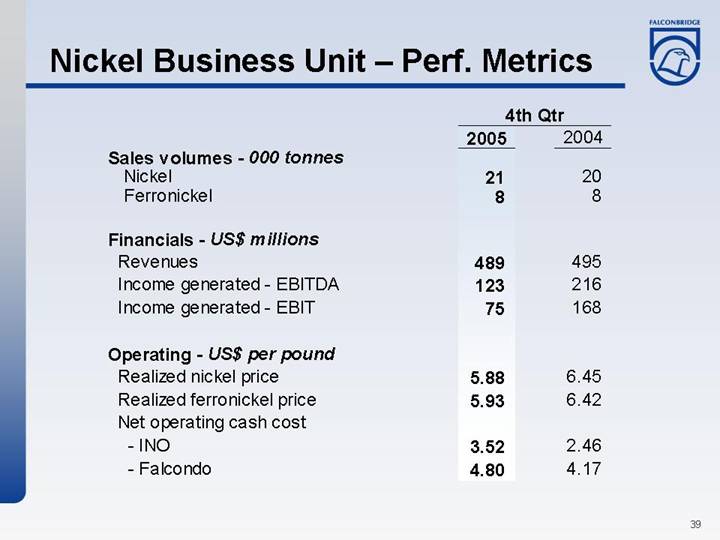
Nickel Business Unit – Perf. Metrics
|
| 4th Qtr |
| ||
|
| 2005 |
| 2004 |
|
Sales volumes - 000 tonnes |
|
|
|
|
|
Nickel |
| 21 |
| 20 |
|
Ferronickel |
| 8 |
| 8 |
|
|
|
|
|
|
|
Financials - US$ millions |
|
|
|
|
|
Revenues |
| 489 |
| 495 |
|
Income generated - EBITDA |
| 123 |
| 216 |
|
Income generated - EBIT |
| 75 |
| 168 |
|
|
|
|
|
|
|
Operating - US$ per pound |
|
|
|
|
|
Realized nickel price |
| 5.88 |
| 6.45 |
|
Realized ferronickel price |
| 5.93 |
| 6.42 |
|
Net operating cash cost |
|
|
|
|
|
- INO |
| 3.52 |
| 2.46 |
|
- Falcondo |
| 4.80 |
| 4.17 |
|
39
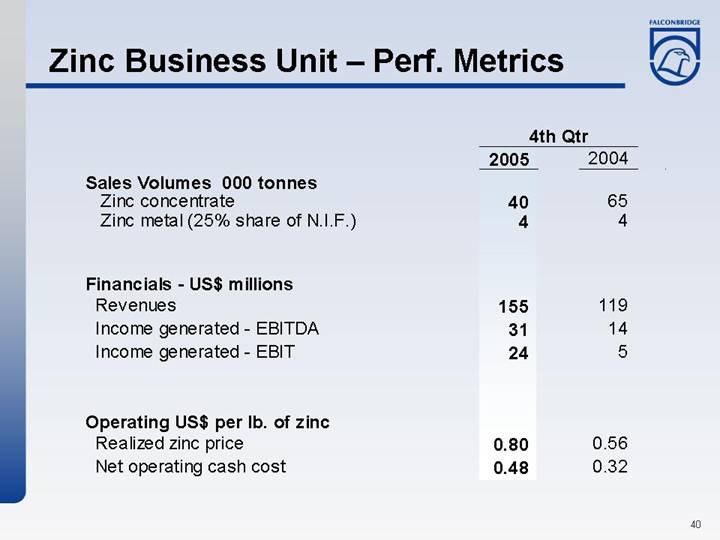
Zinc Business Unit – Perf. Metrics
|
| 4th Qtr |
| ||
|
| 2005 |
| 2004 |
|
Sales Volumes 000 tonnes |
|
|
|
|
|
Zinc concentrate |
| 40 |
| 65 |
|
Zinc metal (25% share of N.I.F.) |
| 4 |
| 4 |
|
|
|
|
|
|
|
Financials - US$ millions |
|
|
|
|
|
Revenues |
| 155 |
| 119 |
|
Income generated - EBITDA |
| 31 |
| 14 |
|
Income generated - EBIT |
| 24 |
| 5 |
|
|
|
|
|
|
|
Operating US$ per lb. of zinc |
|
|
|
|
|
Realized zinc price |
| 0.80 |
| 0.56 |
|
Net operating cash cost |
| 0.48 |
| 0.32 |
|
40
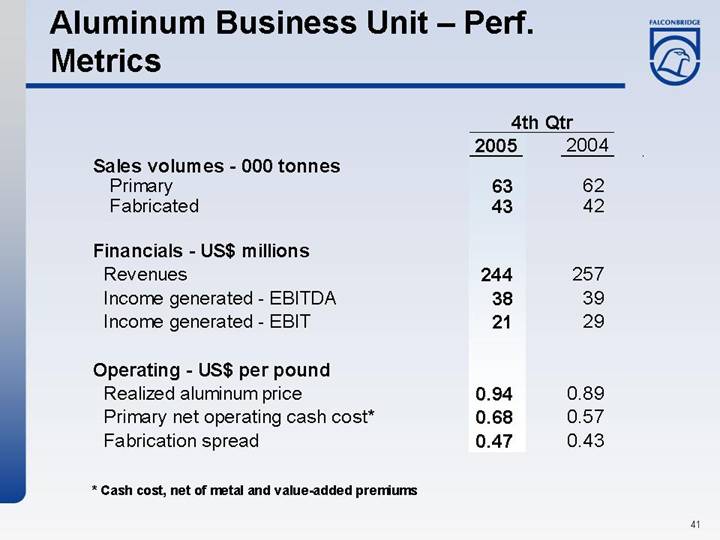
Aluminum Business Unit – Perf. Metrics
|
| 4th Qtr |
| ||
|
| 2005 |
| 2004 |
|
Sales volumes - 000 tonnes |
|
|
|
|
|
Primary |
| 63 |
| 62 |
|
Fabricated |
| 43 |
| 42 |
|
|
|
|
|
|
|
Financials - US$ millions |
|
|
|
|
|
Revenues |
| 244 |
| 257 |
|
Income generated - EBITDA |
| 38 |
| 39 |
|
Income generated - EBIT |
| 21 |
| 29 |
|
|
|
|
|
|
|
Operating - US$ per pound |
|
|
|
|
|
Realized aluminum price |
| 0.94 |
| 0.89 |
|
Primary net operating cash cost* |
| 0.68 |
| 0.57 |
|
Fabrication spread |
| 0.47 |
| 0.43 |
|
* Cash cost, net of metal and value-added premiums
41
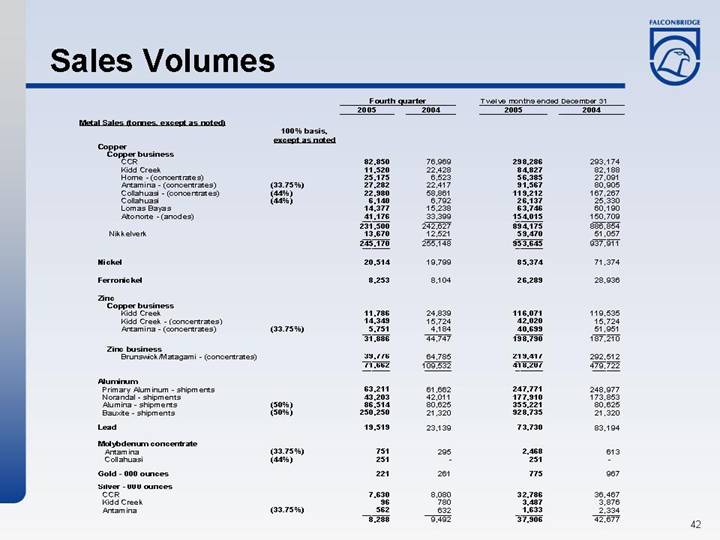
Sales Volumes
|
|
|
| Fourth quarter |
| Twelve months ended December 31 |
| ||||
Metal Sales (tonnes, except as noted) |
|
|
| 2005 |
| 2004 |
| 2005 |
| 2004 |
|
|
| 100% basis, |
|
|
|
|
|
|
|
|
|
|
| except as noted |
|
|
|
|
|
|
|
|
|
Copper |
|
|
|
|
|
|
|
|
|
|
|
Copper business |
|
|
|
|
|
|
|
|
|
|
|
CCR |
|
|
| 82,850 |
| 76,969 |
| 298,286 |
| 293,174 |
|
Kidd Creek |
|
|
| 11,520 |
| 22,428 |
| 84,827 |
| 82,188 |
|
Horne - (concentrates) |
|
|
| 25,175 |
| 6,523 |
| 56,385 |
| 27,091 |
|
Antamina - (concentrates) |
| (33.75%) |
| 27,282 |
| 22,417 |
| 91,567 |
| 80,905 |
|
Collahuasi - (concentrates) |
| (44%) |
| 22,980 |
| 58,861 |
| 119,212 |
| 167,267 |
|
Collahuasi |
| (44%) |
| 6,140 |
| 6,792 |
| 26,137 |
| 25,330 |
|
Lomas Bayas |
|
|
| 14,377 |
| 15,238 |
| 63,746 |
| 60,190 |
|
Altonorte - (anodes) |
|
|
| 41,176 |
| 33,399 |
| 154,015 |
| 150,709 |
|
|
|
|
| 231,500 |
| 242,627 |
| 894,175 |
| 886,854 |
|
Nikkelverk |
|
|
| 13,670 |
| 12,521 |
| 59,470 |
| 51,057 |
|
|
|
|
| 245,170 |
| 255,148 |
| 953,645 |
| 937,911 |
|
|
|
|
|
|
|
|
|
|
|
|
|
Nickel |
|
|
| 20,514 |
| 19,799 |
| 85,374 |
| 71,374 |
|
|
|
|
|
|
|
|
|
|
|
|
|
Ferronickel |
|
|
| 8,253 |
| 8,104 |
| 26,289 |
| 28,936 |
|
|
|
|
|
|
|
|
|
|
|
|
|
Zinc |
|
|
|
|
|
|
|
|
|
|
|
Copper business |
|
|
|
|
|
|
|
|
|
|
|
Kidd Creek |
|
|
| 11,786 |
| 24,839 |
| 116,071 |
| 119,535 |
|
Kidd Creek - (concentrates) |
|
|
| 14,349 |
| 15,724 |
| 42,020 |
| 15,724 |
|
Antamina - (concentrates) |
| (33.75%) |
| 5,751 |
| 4,184 |
| 40,699 |
| 51,951 |
|
|
|
|
| 31,886 |
| 44,747 |
| 198,790 |
| 187,210 |
|
Zinc business |
|
|
|
|
|
|
|
|
|
|
|
Brunswick/Matagami - (concentrates) |
|
|
| 39,776 |
| 64,785 |
| 219,417 |
| 292,512 |
|
|
|
|
| 71,662 |
| 109,532 |
| 418,207 |
| 479,722 |
|
|
|
|
|
|
|
|
|
|
|
|
|
Aluminum |
|
|
|
|
|
|
|
|
|
|
|
Primary Aluminum - shipments |
|
|
| 63,211 |
| 61,662 |
| 247,771 |
| 248,977 |
|
Norandal - shipments |
|
|
| 43,203 |
| 42,011 |
| 177,910 |
| 173,853 |
|
Alumina - shipments |
| (50%) |
| 86,514 |
| 80,625 |
| 355,221 |
| 80,625 |
|
Bauxite - shipments |
| (50%) |
| 250,250 |
| 21,320 |
| 928,735 |
| 21,320 |
|
|
|
|
|
|
|
|
|
|
|
|
|
Lead |
|
|
| 19,519 |
| 23,139 |
| 73,730 |
| 83,194 |
|
|
|
|
|
|
|
|
|
|
|
|
|
Molybdenum concentrate |
|
|
|
|
|
|
|
|
|
|
|
Antamina |
| (33.75%) |
| 751 |
| 295 |
| 2,468 |
| 613 |
|
Collahuasi |
| (44%) |
| 251 |
| — |
| 251 |
| — |
|
|
|
|
|
|
|
|
|
|
|
|
|
Gold - 000 ounces |
|
|
|
|
|
|
|
|
|
|
|
|
|
|
| 221 |
| 261 |
| 775 |
| 967 |
|
Silver - 000 ounces |
|
|
|
|
|
|
|
|
|
|
|
CCR |
|
|
| 7,630 |
| 8,080 |
| 32,786 |
| 36,467 |
|
Kidd Creek |
|
|
| 96 |
| 780 |
| 3,487 |
| 3,876 |
|
Antamina |
| (33.75%) |
| 562 |
| 632 |
| 1,633 |
| 2,334 |
|
|
|
|
| 8,288 |
| 9,492 |
| 37,906 |
| 42,677 |
|
42
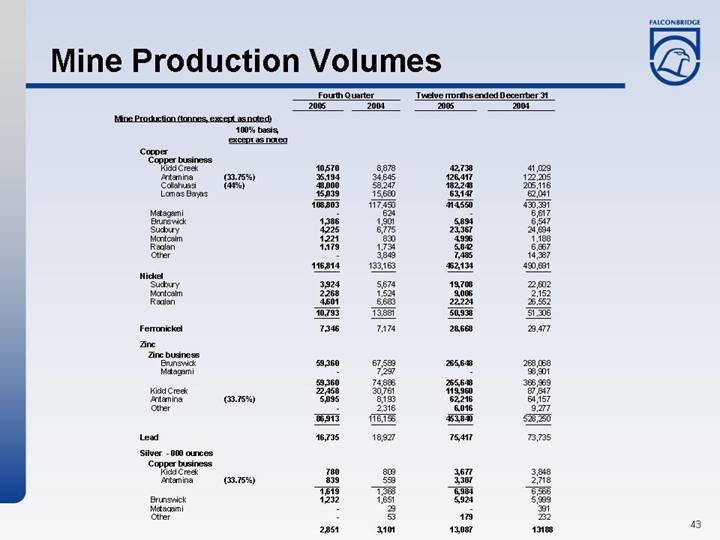
Mine Production Volumes
|
|
|
| Fourth Quarter |
| Twelve months ended December 31 |
| ||||
Mine Production (tonnes, except as noted) |
|
|
| 2005 |
| 2004 |
| 2005 |
| 2004 |
|
|
| 100% basis, |
|
|
|
|
|
|
|
|
|
|
| except as noted |
|
|
|
|
|
|
|
|
|
Copper |
|
|
|
|
|
|
|
|
|
|
|
Copper business |
|
|
|
|
|
|
|
|
|
|
|
Kidd Creek |
|
|
| 10,570 |
| 8,878 |
| 42,738 |
| 41,029 |
|
Antamina |
| (33.75%) |
| 35,194 |
| 34,645 |
| 126,417 |
| 122,205 |
|
Collahuasi |
| (44%) |
| 48,000 |
| 58,247 |
| 182,248 |
| 205,116 |
|
Lomas Bayas |
|
|
| 15,039 |
| 15,680 |
| 63,147 |
| 62,041 |
|
|
|
|
| 108,803 |
| 117,450 |
| 414,550 |
| 430,391 |
|
Matagami |
|
|
| — |
| 624 |
| — |
| 6,617 |
|
Brunswick |
|
|
| 1,386 |
| 1,901 |
| 5,894 |
| 6,547 |
|
Sudbury |
|
|
| 4,225 |
| 6,775 |
| 23,367 |
| 24,694 |
|
Montcalm |
|
|
| 1,221 |
| 830 |
| 4,996 |
| 1,188 |
|
Raglan |
|
|
| 1,179 |
| 1,734 |
| 5,842 |
| 6,867 |
|
Other |
|
|
| — |
| 3,849 |
| 7,485 |
| 14,387 |
|
|
|
|
| 116,814 |
| 133,163 |
| 462,134 |
| 490,691 |
|
Nickel |
|
|
|
|
|
|
|
|
|
|
|
Sudbury |
|
|
| 3,924 |
| 5,674 |
| 19,708 |
| 22,602 |
|
Montcalm |
|
|
| 2,268 |
| 1,524 |
| 9,006 |
| 2,152 |
|
Raglan |
|
|
| 4,601 |
| 6,683 |
| 22,224 |
| 26,552 |
|
|
|
|
| 10,793 |
| 13,881 |
| 50,938 |
| 51,306 |
|
|
|
|
|
|
|
|
|
|
|
|
|
Ferronickel |
|
|
| 7,346 |
| 7,174 |
| 28,668 |
| 29,477 |
|
|
|
|
|
|
|
|
|
|
|
|
|
Zinc |
|
|
|
|
|
|
|
|
|
|
|
Zinc business |
|
|
|
|
|
|
|
|
|
|
|
Brunswick |
|
|
| 59,360 |
| 67,589 |
| 265,648 |
| 268,068 |
|
Matagami |
|
|
| — |
| 7,297 |
| — |
| 98,901 |
|
|
|
|
| 59,360 |
| 74,886 |
| 265,648 |
| 366,969 |
|
Kidd Creek |
|
|
| 22,458 |
| 30,761 |
| 119,960 |
| 87,847 |
|
Antamina |
| (33.75%) |
| 5,095 |
| 8,193 |
| 62,216 |
| 64,157 |
|
Other |
|
|
| — |
| 2,316 |
| 6,016 |
| 9,277 |
|
|
|
|
| 86,913 |
| 116,156 |
| 453,840 |
| 528,250 |
|
|
|
|
|
|
|
|
|
|
|
|
|
Lead |
|
|
| 16,735 |
| 18,927 |
| 75,417 |
| 73,735 |
|
|
|
|
|
|
|
|
|
|
|
|
|
Silver - 000 ounces |
|
|
|
|
|
|
|
|
|
|
|
Copper business |
|
|
|
|
|
|
|
|
|
|
|
Kidd Creek |
|
|
| 780 |
| 809 |
| 3,677 |
| 3,848 |
|
Antamina |
| (33.75%) |
| 839 |
| 559 |
| 3,307 |
| 2,718 |
|
|
|
|
| 1,619 |
| 1,368 |
| 6,984 |
| 6,566 |
|
Brunswick |
|
|
| 1,232 |
| 1,651 |
| 5,924 |
| 5,999 |
|
Matagami |
|
|
| — |
| 29 |
| — |
| 391 |
|
Other |
|
|
| — |
| 53 |
| 179 |
| 232 |
|
|
|
|
| 2,851 |
| 3,101 |
| 13,087 |
| 13,188 |
|
43
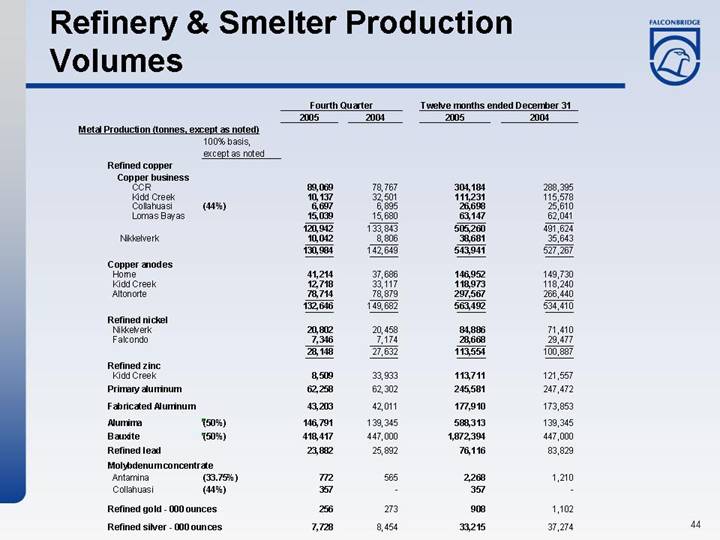
Refinery & Smelter Production Volumes
|
|
|
| Fourth Quarter |
| Twelve months ended December 31 |
| ||||
Metal Production (tonnes, except as noted) |
|
|
| 2005 |
| 2004 |
| 2005 |
| 2004 |
|
|
| 100% basis, |
|
|
|
|
|
|
|
|
|
|
| except as noted |
|
|
|
|
|
|
|
|
|
Refined copper |
|
|
|
|
|
|
|
|
|
|
|
Copper business |
|
|
|
|
|
|
|
|
|
|
|
CCR |
|
|
| 89,069 |
| 78,767 |
| 304,184 |
| 288,395 |
|
Kidd Creek |
|
|
| 10,137 |
| 32,501 |
| 111,231 |
| 115,578 |
|
Collahuasi |
| (44%) |
| 6,697 |
| 6,895 |
| 26,698 |
| 25,610 |
|
Lomas Bayas |
|
|
| 15,039 |
| 15,680 |
| 63,147 |
| 62,041 |
|
|
|
|
| 120,942 |
| 133,843 |
| 505,260 |
| 491,624 |
|
Nikkelverk |
|
|
| 10,042 |
| 8,806 |
| 38,681 |
| 35,643 |
|
|
|
|
| 130,984 |
| 142,649 |
| 543,941 |
| 527,267 |
|
Copper anodes |
|
|
|
|
|
|
|
|
|
|
|
Horne |
|
|
| 41,214 |
| 37,686 |
| 146,952 |
| 149,730 |
|
Kidd Creek |
|
|
| 12,718 |
| 33,117 |
| 118,973 |
| 118,240 |
|
Altonorte |
|
|
| 78,714 |
| 78,879 |
| 297,567 |
| 266,440 |
|
|
|
|
| 132,646 |
| 149,682 |
| 563,492 |
| 534,410 |
|
Refined nickel |
|
|
|
|
|
|
|
|
|
|
|
Nikkelverk |
|
|
| 20,802 |
| 20,458 |
| 84,886 |
| 71,410 |
|
Falcondo |
|
|
| 7,346 |
| 7,174 |
| 28,668 |
| 29,477 |
|
|
|
|
| 28,148 |
| 27,632 |
| 113,554 |
| 100,887 |
|
Refined zinc |
|
|
|
|
|
|
|
|
|
|
|
Kidd Creek |
|
|
| 8,509 |
| 33,933 |
| 113,711 |
| 121,557 |
|
|
|
|
|
|
|
|
|
|
|
|
|
Primary aluminum |
|
|
| 62,258 |
| 62,302 |
| 245,581 |
| 247,472 |
|
|
|
|
|
|
|
|
|
|
|
|
|
Fabricated Aluminum |
|
|
| 43,203 |
| 42,011 |
| 177,910 |
| 173,853 |
|
|
|
|
|
|
|
|
|
|
|
|
|
Alumima |
| (50%) |
| 146,791 |
| 139,345 |
| 588,313 |
| 139,345 |
|
|
|
|
|
|
|
|
|
|
|
|
|
Bauxite |
| (50%) |
| 418,417 |
| 447,000 |
| 1,872,394 |
| 447,000 |
|
|
|
|
|
|
|
|
|
|
|
|
|
Refined lead |
|
|
| 23,882 |
| 25,892 |
| 76,116 |
| 83,829 |
|
|
|
|
|
|
|
|
|
|
|
|
|
Molybdenum concentrate |
|
|
|
|
|
|
|
|
|
|
|
Antamina |
| (33.75%) |
| 772 |
| 565 |
| 2,268 |
| 1,210 |
|
Collahuasi |
| (44%) |
| 357 |
| — |
| 357 |
| — |
|
|
|
|
|
|
|
|
|
|
|
|
|
Refined gold - 000 ounces |
|
|
| 256 |
| 273 |
| 908 |
| 1,102 |
|
|
|
|
|
|
|
|
|
|
|
|
|
Refined silver - 000 ounces |
|
|
| 7,728 |
| 8,454 |
| 33,215 |
| 37,274 |
|
44
Production Outlook for 2006
Production (MT) |
|
|
| Actual |
| Forecast |
|
Copper |
| Mined |
| 462,000 |
| 475,000 |
|
|
| Refined |
| 544,000 |
| 635,000 |
|
Nickel |
| Mined |
| 80,000 |
| 82,000 |
|
|
| Refined |
| 114,000 |
| 115,000 |
|
Zinc |
| Mined |
| 454,000 |
| 460,000 |
|
|
| Refined* |
| 182,000 |
| 210,000 |
|
Aluminum |
| Primary |
| 246,000 |
| 250,000 |
|
|
| Fabricated |
| 178,000 |
| 195,000 |
|
*Includes 100% of Kidd Creek refinery production and 25% of the Noranda Income Fund CEZ Refinery production
45
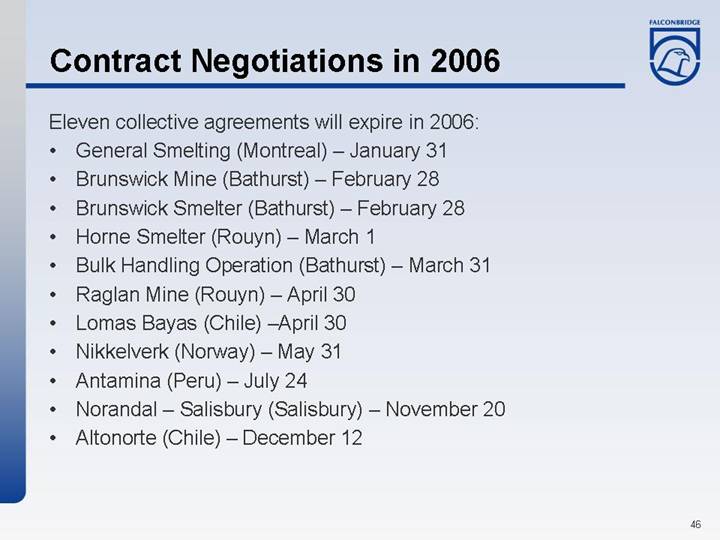
Contract Negotiations in 2006
Eleven collective agreements will expire in 2006:
• General Smelting (Montreal) – January 31
• Brunswick Mine (Bathurst) – February 28
• Brunswick Smelter (Bathurst) – February 28
• Horne Smelter (Rouyn) – March 1
• Bulk Handling Operation (Bathurst) – March 31
• Raglan Mine (Rouyn) – April 30
• Lomas Bayas (Chile) –April 30
• Nikkelverk (Norway) – May 31
• Antamina (Peru) – July 24
• Norandal – Salisbury (Salisbury) – November 20
• Altonorte (Chile) – December 12
46
Important Legal Information |
| [LOGO] |
This communication is being made in respect of the share exchange takeover bid by Inco Limited for common shares of Falconbridge Limited. Inco has filed with the U.S. Securities and Exchange Commission (“SEC”) a registration statement on Form F-8 containing a share exchange take-over bid circular. Inco, if required, will file other documents regarding the transaction with the SEC. INVESTORS ARE URGED TO READ THE REGISTRATION STATEMENT AND ANY OTHER RELEVANT DOCUMENTS FILED OR TO BE FILED WITH THE SEC WHEN THEY BECOME AVAILABLE BECAUSE THEY WILL CONTAIN IMPORTANT INFORMATION. Investors will be able to obtain the documents filed with the SEC free of charge at the SEC’s website (www.sec.gov). In addition, documents filed with the SEC by Inco will be available free of charge from Inco. You should direct requests for documents to the Secretary of Inco, Inco Limited, 145 King Street West, Suite 1500, Toronto, Canada, M5H 4B7.
48