
1 Q2 2021 EARNINGS RELEASE July 28, 2021

2Littelfuse, Inc. © 2021 DISCLAIMERS Important Information About Interfuse, Inc. This presentation does not constitute or form part of, and should not be construed as, an offer or solicitation to purchase or sell securities of Interfuse, Inc. and no investment decision should be made based upon the information provided herein. Interfuse strongly urges you to review its filings with the Securities and Exchange Commission, which can be found at investor.littelfuse.com/sec.cfm. This website also provides additional information about Interfuse. “Safe Harbor” Statement Under the Private Securities Litigation Reform Act of 1995. The statements in this presentation that are not historical facts are intended to constitute "forward-looking statements" entitled to the safe-harbor provisions of the Private Securities Litigation Reform Act. These statements may involve risks and uncertainties, including, but not limited to, risks and uncertainties relating to general economic conditions; the severity and duration of the COVID- 19 pandemic and the measures taken in response thereto and the effects of those items on the company’s business; product demand and market acceptance; the impact of competitive products and pricing; product quality problems or product recalls; capacity and supply difficulties or constraints; coal mining exposures reserves; failure of an indemnification for environmental liability; exchange rate fluctuations; commodity and other raw material price fluctuations; the effect of Interfuse, Inc.'s ("Interfuse" or the "Company") accounting policies; labor disputes; restructuring costs in excess of expectations; pension plan asset returns less than assumed; integration of acquisitions; uncertainties related to political or regulatory changes; and other risks which may be detailed in the company's Securities and Exchange Commission filings. Should one or more of these risks or uncertainties materialize or should the underlying assumptions prove incorrect, actual results and outcomes may differ materially from those indicated or implied in the forward-looking statements. This presentation should be read in conjunction with information provided in the financial statements appearing in the company's Annual Report on Form 10-K for the year ended December 26, 2020. Further discussion of the risk factors of the company can be found under the caption "Risk Factors" in the company's Annual Report on Form 10-K for the year ended December 26, 2020, and in other filings and submissions with the SEC, each of which are available free of charge on the company’s investor relations website at investor.littelfuse.com and on the SEC’s website at www.sec.gov. These forward-looking statements are made as of the date hereof. The company does not undertake any obligation to update, amend or clarify these forward-looking statements to reflect events or circumstances after the date hereof or to reflect the availability of new information. Non-GAAP Financial Measures. The information included in this presentation includes the non-GAAP financial measures of organic net sales growth, adjusted operating margin, adjusted diluted earnings per share, adjusted income taxes, adjusted effective tax rate, and free cash flow. A reconciliation of these non-GAAP financial measures to the most directly comparable GAAP financial measures are set forth in the appendix. The company believes that these non-GAAP financial measures provide useful information to investors regarding its operational performance and ability to generate cash enhancing an investor’s overall understanding of its core financial performance. The company believes that these non-GAAP financial measures are commonly used by financial analysts and provide useful information to analysts. Management uses these measures when assessing the performance of the business and for business planning purposes. Note that the definitions of these non-GAAP financial measures may differ from those terms as defined or used by other companies.

BUSINESS UPDATE Dave Heinzmann, President & CEO
4Littelfuse, Inc. © 2021 Q2-21 KEY THEMES Ongoing strong execution within an unprecedented environment Supporting customers while navigating complex operating environment Working to mitigate impact of higher input costs Exceptional teamwork & strong business fundamentals Continued strength across broad range of electronics, transportation & industrial end markets Record quarter of performance Delivered record revenue & adjusted EPS Strong operating margins & operating leverage
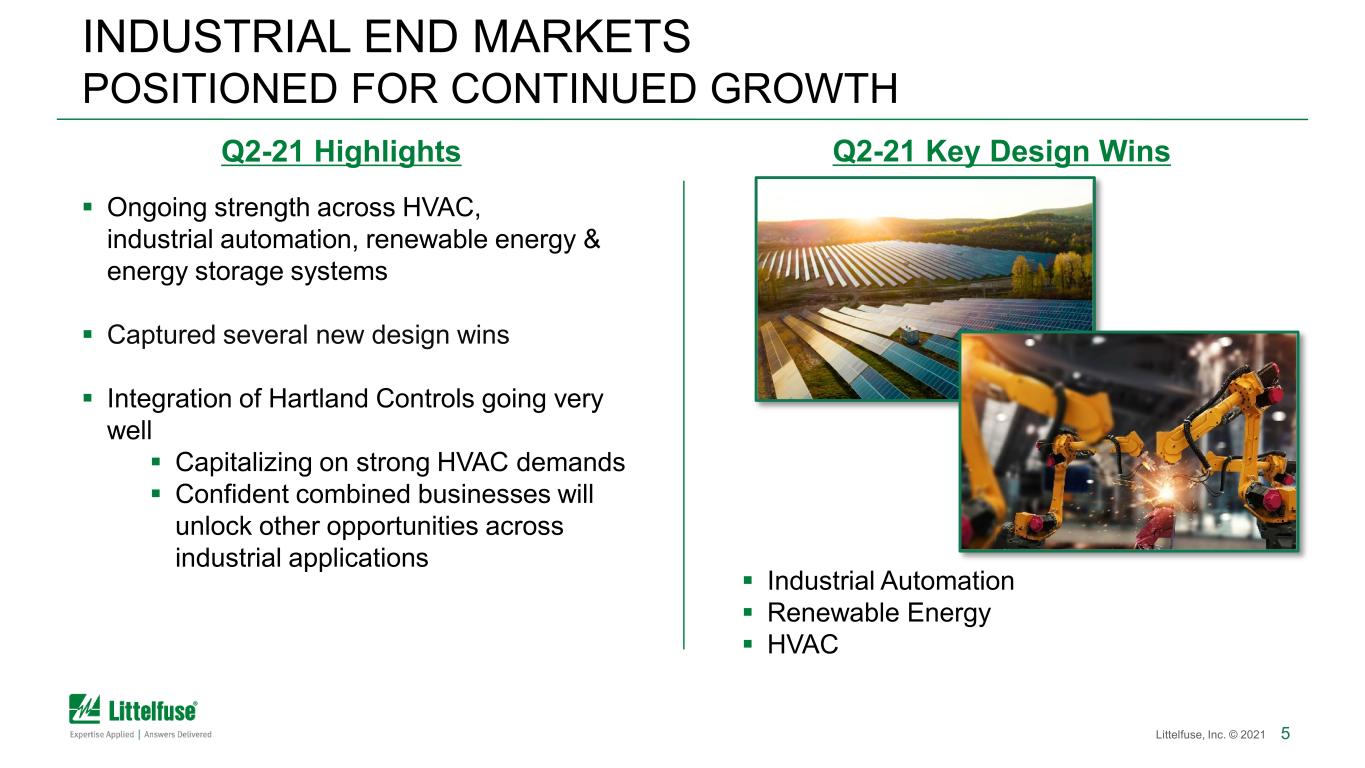
5Littelfuse, Inc. © 2021 INDUSTRIAL END MARKETS POSITIONED FOR CONTINUED GROWTH Ongoing strength across HVAC, industrial automation, renewable energy & energy storage systems Captured several new design wins Integration of Hartland Controls going very well Capitalizing on strong HVAC demands Confident combined businesses will unlock other opportunities across industrial applications Q2-21 Highlights Q2-21 Key Design Wins Industrial Automation Renewable Energy HVAC
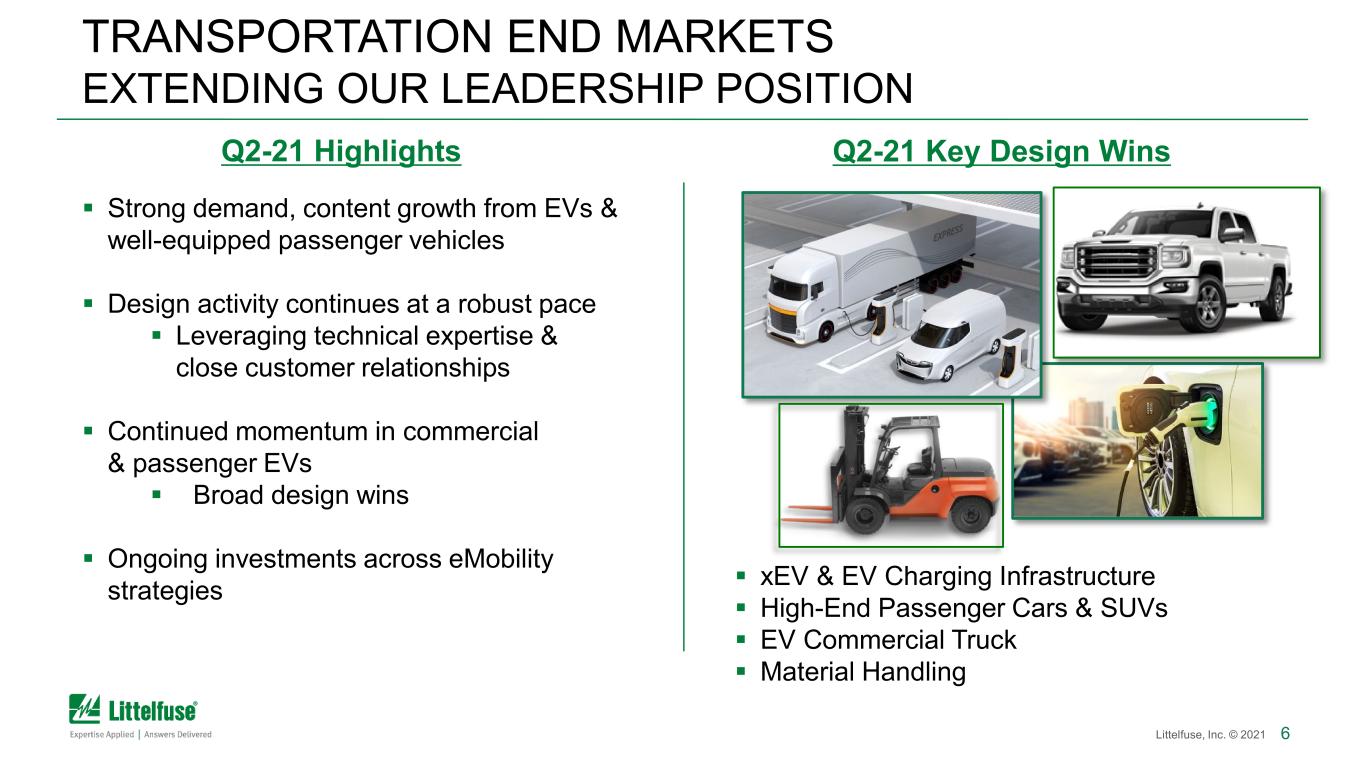
6Littelfuse, Inc. © 2021 TRANSPORTATION END MARKETS EXTENDING OUR LEADERSHIP POSITION Q2-21 Key Design WinsQ2-21 Highlights xEV & EV Charging Infrastructure High-End Passenger Cars & SUVs EV Commercial Truck Material Handling Strong demand, content growth from EVs & well-equipped passenger vehicles Design activity continues at a robust pace Leveraging technical expertise & close customer relationships Continued momentum in commercial & passenger EVs Broad design wins Ongoing investments across eMobility strategies

7Littelfuse, Inc. © 2021 ELECTRONICS END MARKETS LEVERAGING OUR LEADERSHIP Q2-21 Highlights Q2-21 Key Design Wins Battery Protection, Notebook PCs Telecom, Data Center & Cloud Infrastructure Electric Bicycles Volume & content growth from favorable end market trends Data center & communications infrastructure Building & home automation Consumer electronics Robust design activity Secured a broad range of business wins Ongoing electronification Expanded opportunity pipeline

FINANCIAL UPDATE Meenal Sethna, EVP & CFO
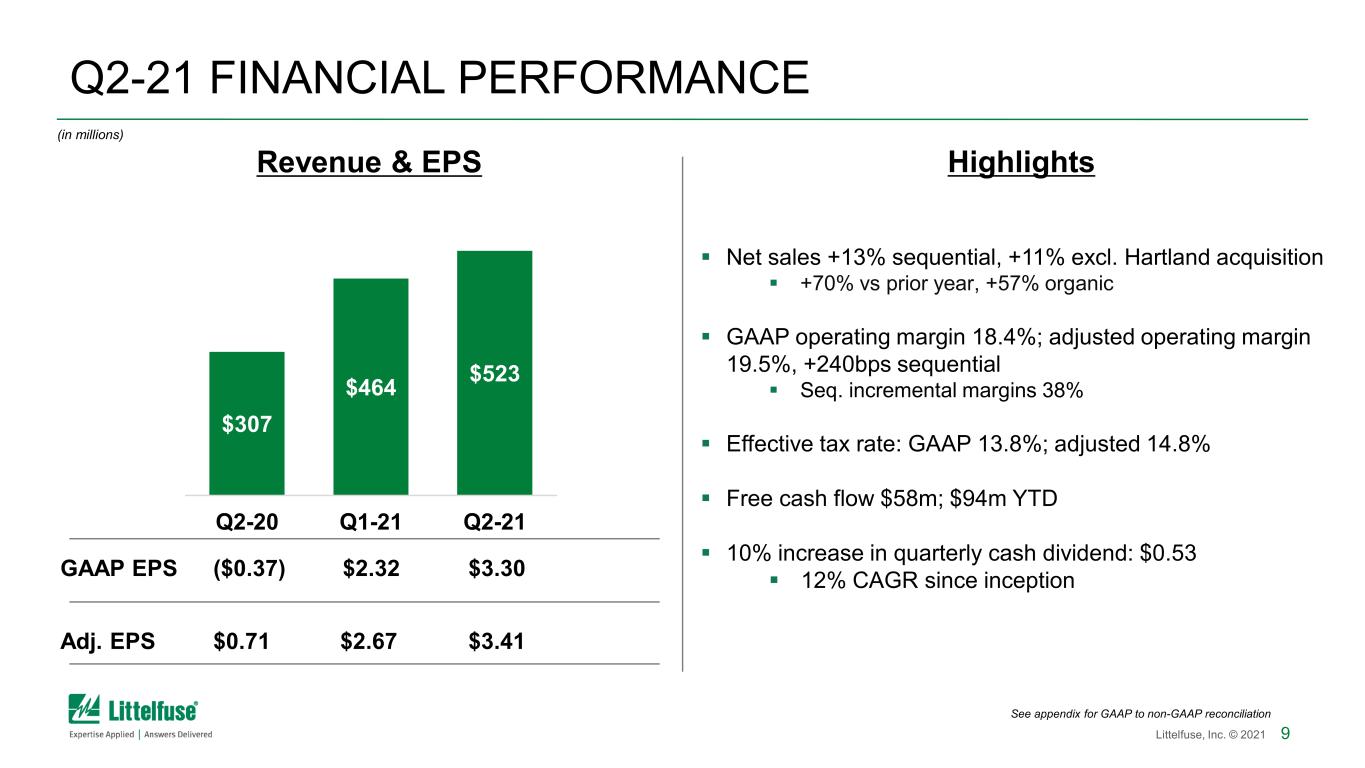
9Littelfuse, Inc. © 2021 See appendix for GAAP to non-GAAP reconciliation Highlights Net sales +13% sequential, +11% excl. Hartland acquisition +70% vs prior year, +57% organic GAAP operating margin 18.4%; adjusted operating margin 19.5%, +240bps sequential Seq. incremental margins 38% Effective tax rate: GAAP 13.8%; adjusted 14.8% Free cash flow $58m; $94m YTD 10% increase in quarterly cash dividend: $0.53 12% CAGR since inceptionGAAP EPS ($0.37) $2.32 $3.30 Adj. EPS $0.71 $2.67 $3.41 $307 $464 $523 Q2-20 Q1-21 Q2-21 (in millions) Q2-21 FINANCIAL PERFORMANCE Revenue & EPS

10Littelfuse, Inc. © 2021 $22 $49 $65 Q2-20 Q1-21 Q2-21 Revenue $62 $129 $133 Q2-20 Q1-21 Q2-21 Revenue Q2-21 SEGMENT PERFORMANCE Electronics Segment Automotive Segment Industrial Segment Revenue +14% sequential Benefitting from volume & content growth across broad range of end markets, as well as solid price realization (in millions) Op Margin 14.6% 19.4% 22.8% $223 $287 $325 Q2-20 Q1-21 Q2-21 Revenue Revenue +4% sequential Impacted most by higher commodity prices & lower price realization due to customer structures Revenue +33% sequential Improvement from manufacturing footprint optimization & solid acquisition performance Op Margin (14.3%) 15.8% 14.4% Op Margin (0.1%) 7.2% 12.9% Productivity improvements driving elevated capacity to meet customer requirements
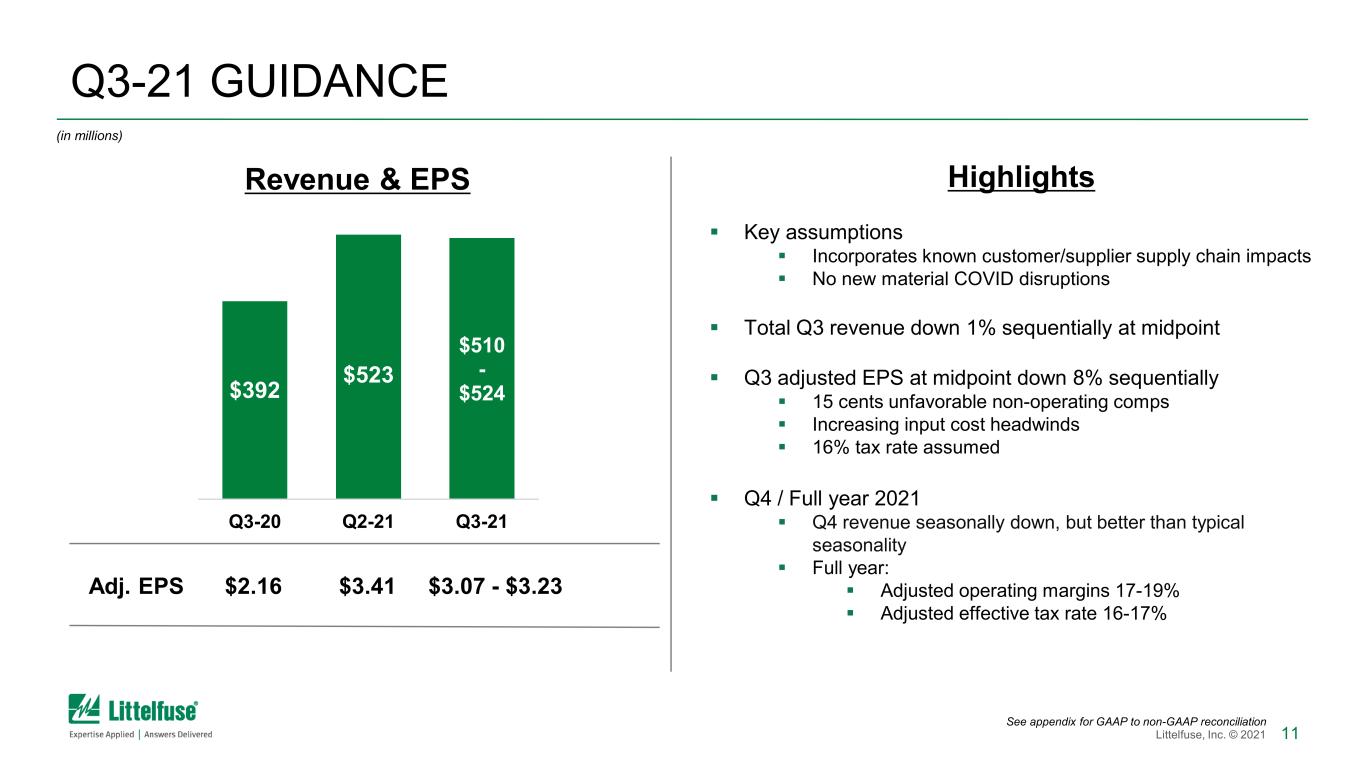
11Littelfuse, Inc. © 2021 Q3-21 GUIDANCE Highlights Key assumptions Incorporates known customer/supplier supply chain impacts No new material COVID disruptions Total Q3 revenue down 1% sequentially at midpoint Q3 adjusted EPS at midpoint down 8% sequentially 15 cents unfavorable non-operating comps Increasing input cost headwinds 16% tax rate assumed Q4 / Full year 2021 Q4 revenue seasonally down, but better than typical seasonality Full year: Adjusted operating margins 17-19% Adjusted effective tax rate 16-17% Adj. EPS $2.16 $3.41 $3.07 - $3.23 $392 $523 $510 - $524 Q3-20 Q2-21 Q3-21 Revenue & EPS (in millions) See appendix for GAAP to non-GAAP reconciliation
12Littelfuse, Inc. © 2021 Strong first half performance within an ongoing dynamic market environment H2 demand remains strong, supported by order backlog & bookings Sound business fundamentals Well-positioned for continued profitable growth consistent with long-term strategy KEY TAKEAWAYS

13Littelfuse, Inc. © 2021 Q&A

14Littelfuse, Inc. © 2021 APPENDIX
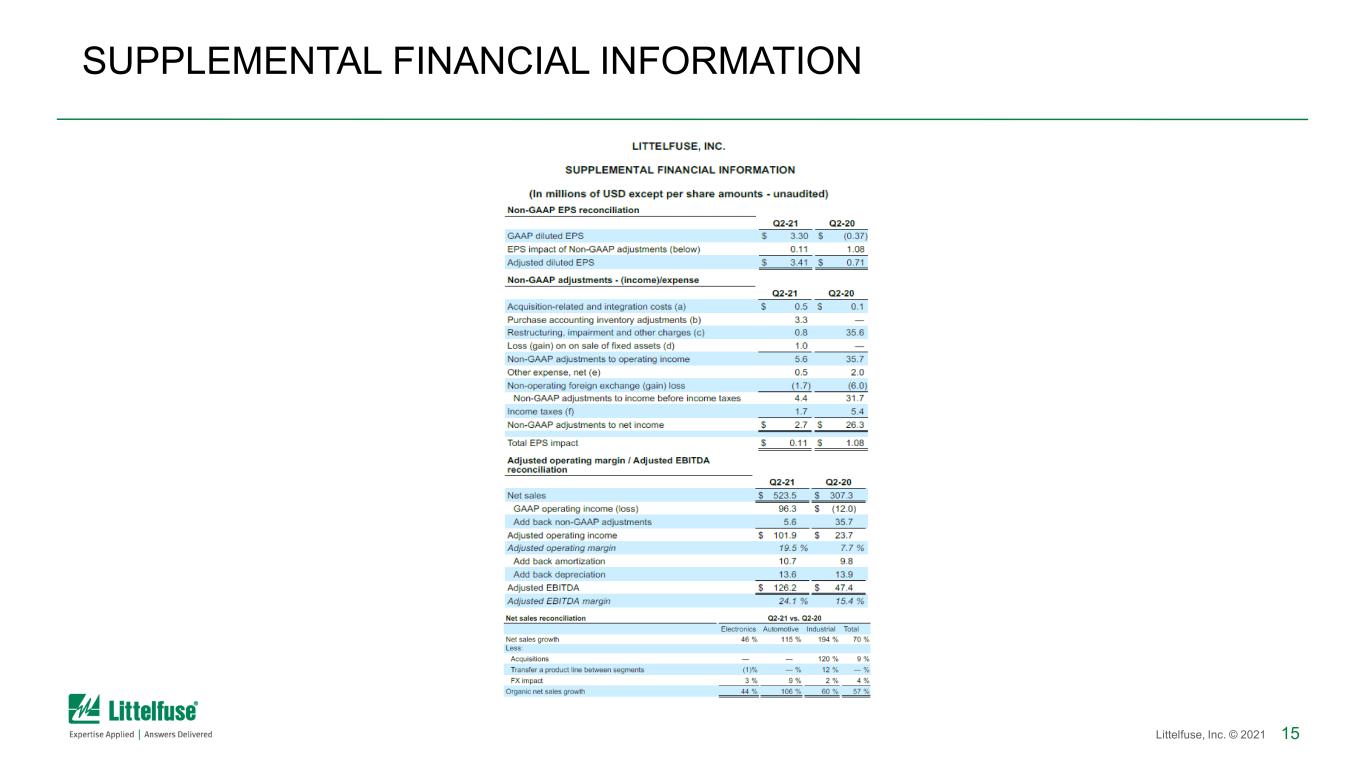
15Littelfuse, Inc. © 2021 SUPPLEMENTAL FINANCIAL INFORMATION
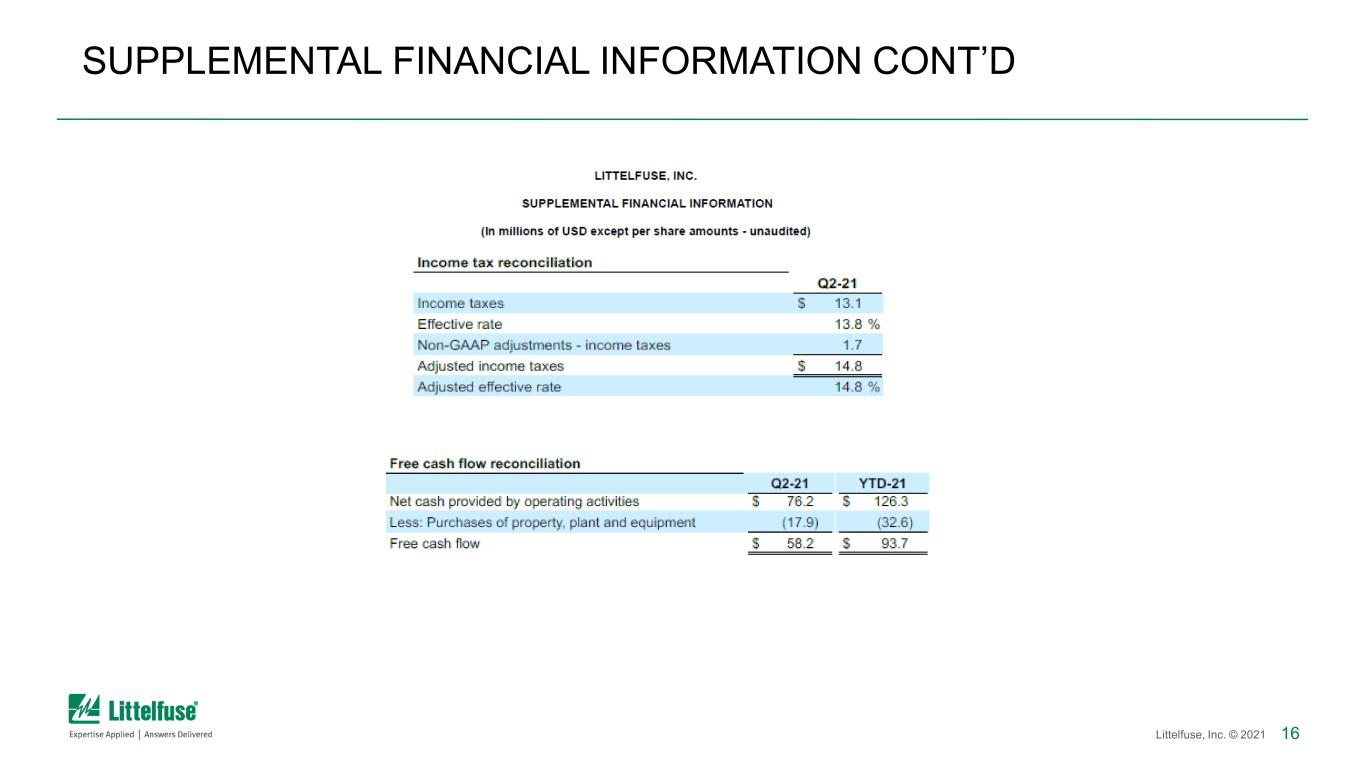
16Littelfuse, Inc. © 2021 SUPPLEMENTAL FINANCIAL INFORMATION CONT’D
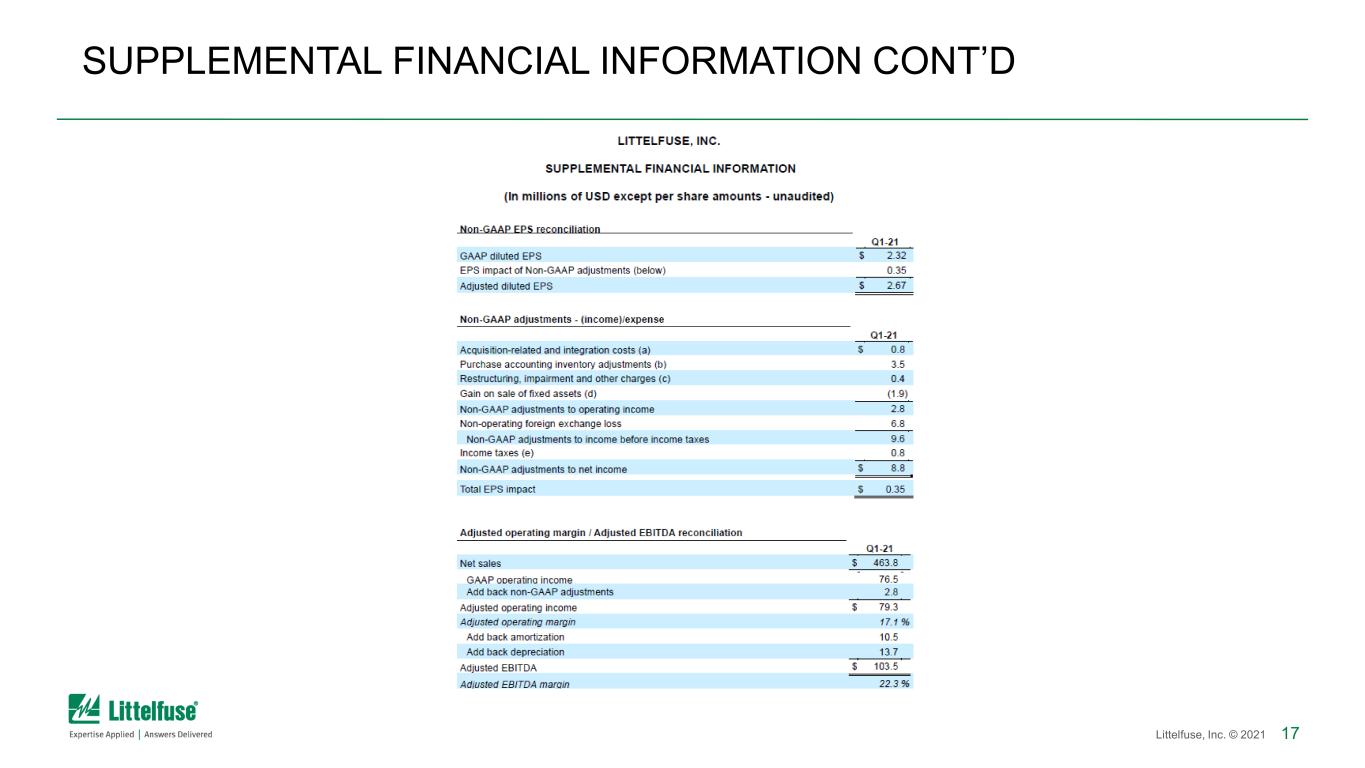
17Littelfuse, Inc. © 2021 SUPPLEMENTAL FINANCIAL INFORMATION CONT’D
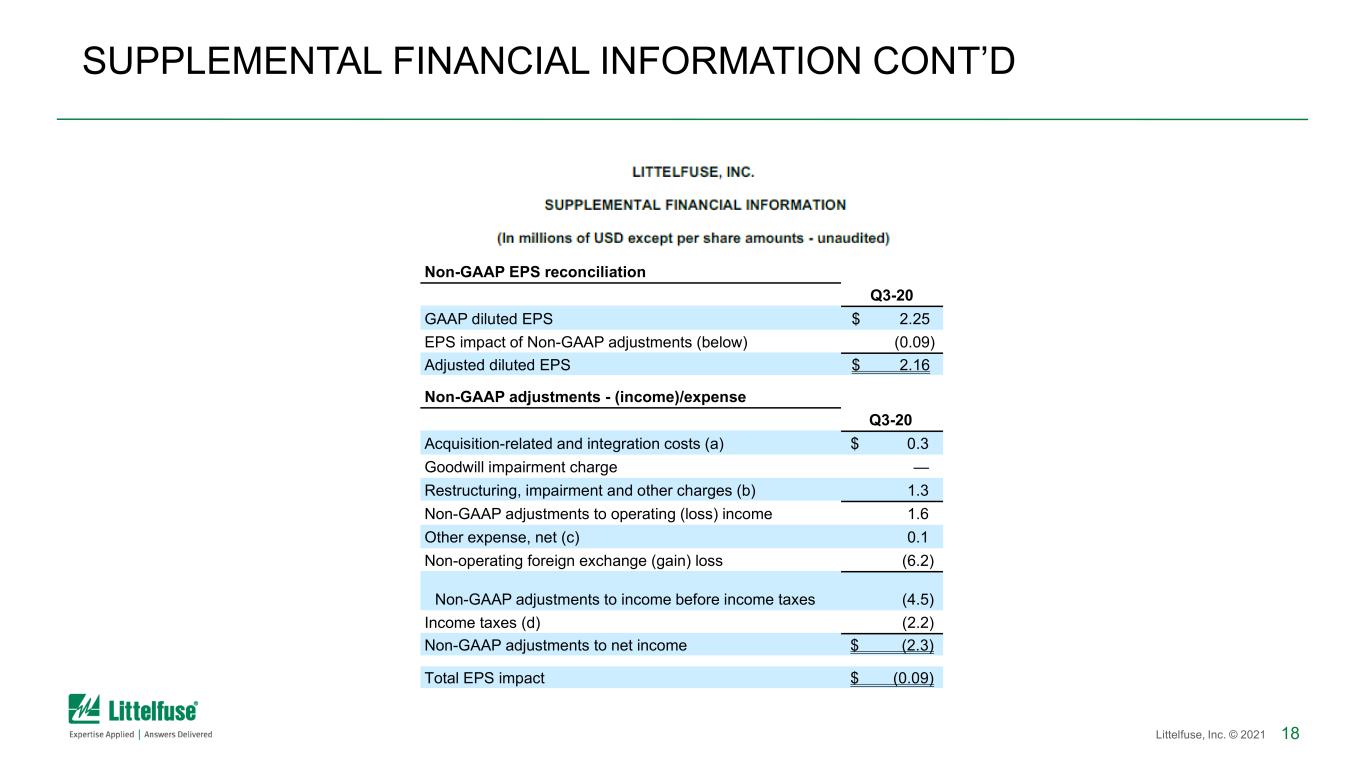
18Littelfuse, Inc. © 2021 SUPPLEMENTAL FINANCIAL INFORMATION CONT’D Non-GAAP EPS reconciliation Q3-20 GAAP diluted EPS $ 2.25 EPS impact of Non-GAAP adjustments (below) (0.09) Adjusted diluted EPS $ 2.16 Non-GAAP adjustments - (income)/expense Q3-20 Acquisition-related and integration costs (a) $ 0.3 Goodwill impairment charge — Restructuring, impairment and other charges (b) 1.3 Non-GAAP adjustments to operating (loss) income 1.6 Other expense, net (c) 0.1 Non-operating foreign exchange (gain) loss (6.2) Non-GAAP adjustments to income before income taxes (4.5) Income taxes (d) (2.2) Non-GAAP adjustments to net income $ (2.3) Total EPS impact $ (0.09)


