United States
Securities and Exchange Commission
Washington, D.C. 20549
Amended
Form N-CSR
Certified Shareholder Report of Registered
Management Investment Companies
811-58429
(Investment Company Act File Number)
Federated Investment Series Funds, Inc.
(Exact Name of Registrant as Specified in Charter)
Federated Investors Funds
4000 Ericsson Drive
Warrendale, Pennsylvania 15086-7561
(Address of Principal Executive Offices)
(412) 288-1900
(Registrant’s Telephone Number)
John W. McGonigle, Esquire
Federated Investors Tower
1001 Liberty Avenue
Pittsburgh, Pennsylvania 15222-3779
(Name and Address of Agent for Service)
(Notices should be sent to the Agent for Service)
Date of Fiscal Year End: 11/30/2009
Date of Reporting Period: 11/30/2009
| Item 1. | Reports to Stockholders |
Federated Bond FundEstablished 1987
A Portfolio of Federated Investment Series Funds, Inc.
ANNUAL SHAREHOLDER REPORTNovember 30, 2009
Class A Shares
Class B Shares
Class C Shares
Class F Shares
FINANCIAL HIGHLIGHTS
SHAREHOLDER EXPENSE EXAMPLE
MANAGEMENT'S DISCUSSION OF FUND PERFORMANCE
PORTFOLIO OF INVESTMENTS SUMMARY TABLE
PORTFOLIO OF INVESTMENTS
STATEMENT OF ASSETS AND LIABILITIES
STATEMENT OF OPERATIONS
STATEMENT OF CHANGES IN NET ASSETS
NOTES TO FINANCIAL STATEMENTS
REPORT OF INDEPENDENT REGISTERED PUBLIC ACCOUNTING FIRM
BOARD OF DIRECTORS AND CORPORATION OFFICERS
EVALUATION AND APPROVAL OF ADVISORY CONTRACT
VOTING PROXIES ON FUND PORTFOLIO SECURITIES
QUARTERLY PORTFOLIO SCHEDULE
Financial Highlights - Class A Shares
(For a Share Outstanding Throughout Each Period)
| Year Ended November 30 | 2009 | 2008 | 2007 | 2006 | 2005 |
| Net Asset Value, Beginning of Period | $7.08 | $8.87 | $8.93 | $8.79 | $9.09 |
| Income From Investment Operations: | | | | | |
| Net investment income | 0.52 | 0.50 | 0.48 | 0.50 | 0.52 |
| Net realized and unrealized gain (loss) on investments, futures contracts and swap contracts | 1.74 | (1.79) | (0.07) | 0.13 | (0.31) |
| TOTAL FROM INVESTMENT OPERATIONS | 2.26 | (1.29) | 0.41 | 0.63 | 0.21 |
| Less Distributions: | | | | | |
| Distributions from net investment income | (0.54) | (0.50) | (0.47) | (0.49) | (0.51) |
| Net Asset Value, End of Period | $8.80 | $7.08 | $8.87 | $8.93 | $8.79 |
| Total Return1 | 33.05% | (15.25)% | 4.74% | 7.47% | 2.36% |
| Ratios to Average Net Assets: | | | | | |
| Net expenses2 | 0.99% | 0.99% | 0.99% | 0.99% | 1.06% |
| Net investment income | 6.40% | 5.79% | 5.37% | 5.48% | 5.37% |
| Expense waiver/reimbursement3 | 0.23% | 0.23% | 0.22% | 0.26% | 0.19% |
| Supplemental Data: | | | | | |
| Net assets, end of period (000 omitted) | $628,675 | $457,276 | $573,375 | $478,755 | $442,294 |
| Portfolio turnover | 28% | 21% | 27% | 34% | 34% |
| 1 | Based on net asset value, which does not reflect the sales charge, redemption fee or contingent deferred sales charge, if applicable. |
| 2 | Pursuant to a settlement with the New York Attorney General, the Adviser has agreed to waive investment adviser fees in compliance with an Assurance of Discontinuance dated November 17, 2005. The net investment adviser fee was reduced to 0.5557% effective January 1, 2006, and may not be increased until after December 31, 2010. |
| 3 | This expense decrease is reflected in both the net expense and the net investment income ratios shown above. |
See Notes which are an integral part of the Financial Statements
Annual Shareholder Report1
Financial Highlights - Class B Shares
(For a Share Outstanding Throughout Each Period)
| Year Ended November 30 | 2009 | 2008 | 2007 | 2006 | 2005 |
| Net Asset Value, Beginning of Period | $7.11 | $8.90 | $8.96 | $8.82 | $9.12 |
| Income From Investment Operations: | | | | | |
| Net investment income | 0.46 | 0.44 | 0.42 | 0.43 | 0.45 |
| Net realized and unrealized gain (loss) on investments, futures contracts and swap contracts | 1.73 | (1.80) | (0.08) | 0.13 | (0.31) |
| TOTAL FROM INVESTMENT OPERATIONS | 2.19 | (1.36) | 0.34 | 0.56 | 0.14 |
| Less Distributions: | | | | | |
| Distributions from net investment income | (0.47) | (0.43) | (0.40) | (0.42) | (0.44) |
| Net Asset Value, End of Period | $8.83 | $7.11 | $8.90 | $8.96 | $8.82 |
| Total Return1 | 31.84% | (15.89)% | 3.89% | 6.59% | 1.53% |
| Ratios to Average Net Assets: | | | | | |
| Net expenses2 | 1.79% | 1.79% | 1.79% | 1.79% | 1.85% |
| Net investment income | 5.63% | 4.96% | 4.57% | 4.68% | 4.57% |
| Expense waiver/reimbursement3 | 0.22% | 0.22% | 0.21% | 0.21% | 0.15% |
| Supplemental Data: | | | | | |
| Net assets, end of period (000 omitted) | $155,907 | $153,465 | $236,276 | $292,622 | $353,858 |
| Portfolio turnover | 28% | 21% | 27% | 34% | 34% |
| 1 | Based on net asset value, which does not reflect the sales charge, redemption fee or contingent deferred sales charge, if applicable. |
| 2 | Pursuant to a settlement with the New York Attorney General, the Adviser has agreed to waive investment adviser fees in compliance with an Assurance of Discontinuance dated November 17, 2005. The net investment adviser fee was reduced to 0.5557% effective January 1, 2006, and may not be increased until after December 31, 2010. |
| 3 | This expense decrease is reflected in both the net expense and the net investment income ratios shown above. |
See Notes which are an integral part of the Financial Statements
Annual Shareholder Report2
Financial Highlights - Class C Shares
(For a Share Outstanding Throughout Each Period)
| Year Ended November 30 | 2009 | 2008 | 2007 | 2006 | 2005 |
| Net Asset Value, Beginning of Period | $7.11 | $8.90 | $8.96 | $8.82 | $9.12 |
| Income From Investment Operations: | | | | | |
| Net investment income | 0.45 | 0.43 | 0.41 | 0.43 | 0.45 |
| Net realized and unrealized gain (loss) on investments, futures contracts and swap contracts | 1.75 | (1.79) | (0.07) | 0.13 | (0.31) |
| TOTAL FROM INVESTMENT OPERATIONS | 2.20 | (1.36) | 0.34 | 0.56 | 0.14 |
| Less Distributions: | | | | | |
| Distributions from net investment income | (0.47) | (0.43) | (0.40) | (0.42) | (0.44) |
| Net Asset Value, End of Period | $8.84 | $7.11 | $8.90 | $8.96 | $8.82 |
| Total Return1 | 32.01% | (15.88)% | 3.89% | 6.60% | 1.54% |
| Ratios to Average Net Assets: | | | | | |
| Net expenses2 | 1.79% | 1.79% | 1.79% | 1.79% | 1.85% |
| Net investment income | 5.58% | 5.00% | 4.57% | 4.68% | 4.57% |
| Expense waiver/reimbursement3 | 0.22% | 0.22% | 0.21% | 0.21% | 0.15% |
| Supplemental Data: | | | | | |
| Net assets, end of period (000 omitted) | $146,220 | $84,701 | $101,561 | $95,453 | $90,716 |
| Portfolio turnover | 28% | 21% | 27% | 34% | 34% |
| 1 | Based on net asset value, which does not reflect the sales charge, redemption fee or contingent deferred sales charge, if applicable. |
| 2 | Pursuant to a settlement with the New York Attorney General, the Adviser has agreed to waive investment adviser fees in compliance with an Assurance of Discontinuance dated November 17, 2005. The net investment adviser fee was reduced to 0.5557% effective January 1, 2006, and may not be increased until after December 31, 2010. |
| 3 | This expense decrease is reflected in both the net expense and the net investment income ratios shown above. |
See Notes which are an integral part of the Financial Statements
Annual Shareholder Report3
Financial Highlights - Class F Shares
(For a Share Outstanding Throughout Each Period)
| Year Ended November 30 | 2009 | 2008 | 2007 | 2006 | 2005 |
| Net Asset Value, Beginning of Period | $7.12 | $8.91 | $8.97 | $8.83 | $9.13 |
| Income From Investment Operations: | | | | | |
| Net investment income | 0.51 | 0.50 | 0.48 | 0.50 | 0.52 |
| Net realized and unrealized gain (loss) on investments, futures contracts and swap contracts | 1.75 | (1.80) | (0.07) | 0.13 | (0.31) |
| TOTAL FROM INVESTMENT OPERATIONS | 2.26 | (1.30) | 0.41 | 0.63 | 0.21 |
| Less Distributions: | | | | | |
| Distributions from net investment income | (0.53) | (0.49) | (0.47) | (0.49) | (0.51) |
| Net Asset Value, End of Period | $8.85 | $7.12 | $8.91 | $8.97 | $8.83 |
| Total Return1 | 32.96% | (15.21)% | 4.68% | 7.41% | 2.32% |
| Ratios to Average Net Assets: | | | | | |
| Net expenses2 | 1.02% | 1.02% | 1.02% | 1.03% | 1.08% |
| Net investment income | 6.37% | 5.75% | 5.34% | 5.45% | 5.34% |
| Expense waiver/reimbursement3 | 0.24% | 0.23% | 0.22% | 0.21% | 0.16% |
| Supplemental Data: | | | | | |
| Net assets, end of period (000 omitted) | $178,466 | $126,458 | $170,492 | $170,464 | $185,591 |
| Portfolio turnover | 28% | 21% | 27% | 34% | 34% |
| 1 | Based on net asset value, which does not reflect the sales charge, redemption fee or contingent deferred sales charge, if applicable. |
| 2 | Pursuant to a settlement with the New York Attorney General, the Adviser has agreed to waive investment adviser fees in compliance with an Assurance of Discontinuance dated November 17, 2005. The net investment adviser fee was reduced to 0.5557% effective January 1, 2006, and may not be increased until after December 31, 2010. |
| 3 | This expense decrease is reflected in both the net expense and the net investment income ratios shown above. |
See Notes which are an integral part of the Financial Statements
Annual Shareholder Report4
Shareholder Expense Example (unaudited)
As a shareholder of the Fund, you incur ongoing costs, including management fees and to the extent applicable, distribution (12b-1) fees and/or shareholder services fees and other Fund expenses. This Example is intended to help you to understand your ongoing costs (in dollars) of investing in the Fund and to compare these costs with the ongoing costs of investing in other mutual funds. It is based on an investment of $1,000 invested at the beginning of the period and held for the entire period from June 1, 2009 to November 30, 2009.
ACTUAL EXPENSES
The first section of the table below provides information about actual account values and actual expenses. You may use the information in this section, together with the amount you invested, to estimate the expenses that you incurred over the period. Simply divide your account value by $1,000 (for example, an $8,600 account value divided by $1,000 = 8.6), then multiply the result by the number in the first section under the heading entitled “Expenses Paid During Period” to estimate the expenses attributable to your investment during this period.
HYPOTHETICAL EXAMPLE FOR COMPARISON PURPOSES
The second section of the table below provides information about hypothetical account values and hypothetical expenses based on the Fund's actual expense ratio and an assumed rate of return of 5% per year before expenses, which is not the Fund's actual return. Thus, you should not use the hypothetical account values and expenses to estimate the actual ending account balance or your expenses for the period. Rather, these figures are required to be provided to enable you to compare the ongoing costs of investing in the Fund with other funds. To do so, compare this 5% hypothetical example with the 5% hypothetical examples that appear in the shareholder reports of the other funds.
Annual Shareholder Report5
Please note that the expenses shown in the table are meant to highlight your ongoing costs only and do not reflect any transaction costs, such as sales charges (loads) on purchase or redemption payments. Therefore, the second section of the table is useful in comparing ongoing costs only, and will not help you determine the relative total costs of owning different funds. In addition, if these transaction costs were included, your costs would have been higher. | Beginning
Account Value
6/1/2009 | Ending
Account Value
11/30/2009 | Expenses Paid
During Period1 |
| Actual: | | | |
| Class A Shares | $1,000 | $1,153.10 | $5.34 |
| Class B Shares | $1,000 | $1,147.90 | $9.64 |
| Class C Shares | $1,000 | $1,149.30 | $9.64 |
| Class F Shares | $1,000 | $1,153.40 | $5.51 |
Hypothetical (assuming a 5% return
before expenses): | | | |
| Class A Shares | $1,000 | $1,020.10 | $5.01 |
| Class B Shares | $1,000 | $1,016.09 | $9.05 |
| Class C Shares | $1,000 | $1,016.09 | $9.05 |
| Class F Shares | $1,000 | $1,019.95 | $5.16 |
| 1 | Expenses are equal to the Fund's annualized net expense ratios, multiplied by the average account value over the period, multiplied by 183/365 (to reflect the one-half-year period). The annualized net expense ratios are as follows: |
| Class A Shares | 0.99% |
| Class B Shares | 1.79% |
| Class C Shares | 1.79% |
| Class F Shares | 1.02% |
Annual Shareholder Report6
Performance data quoted represents past performance which is no guarantee of future results. Investment return and principal value will fluctuate so that an investor's shares, when redeemed, may be worth more or less than their original cost. Mutual fund performance changes over time and current performance may be lower or higher than what is stated. For current to the most recent month-end performance and after-tax returns, visit FederatedInvestors.com or call 1-800-341-7400.
Management's Discussion of Fund Performance (unaudited)
The Fund's total return, based on net asset value for the 12-month reporting period ended November 30, 2009, was 33.05% for Class A Shares, 31.84% for Class B Shares, 32.01% for Class C Shares and 32.96% for Class F Shares. The total return of the Lipper BBB Debt Category1 average was 27.81% during the same period. The Fund's and the Lipper Average's total returns for the most recently completed fiscal year reflected actual cash flows, transactions costs and other expenses.
During the reporting period, the most significant factors affecting the Fund's performance were: (1) the allocation of the portfolio among securities of similar types of issuers (referred to as “sectors”); (2) individual security selection; and (3) the effect of changing interest rates2 (referred to as duration).
For purposes of the following, the discussion will focus on the performance of the Fund's Class A Shares. The 33.05% total return for the Class A Shares for the reporting period consisted of 8.76% of dividends and reinvestments, and 24.29% appreciation in the net asset value of the shares.
| 1 | Lipper figures represent the average of the total returns reported by all of the mutual funds designated by Lipper, Inc. as falling into the category indicated. These figures do not reflect sales charges. |
| 2 | Bond prices are sensitive to changes in interest rates and a rise in interest rates can cause a decline in their prices. |
Annual Shareholder Report7
MARKET OVERVIEW
From December 2008 through March 2009, the economy was deep in recessionary territory and anxiety remained in the financial markets, particularly the stock markets. The non-Treasury bond sectors, on the other hand, immediately began delivering returns well in excess of the U.S. Treasury markets, a reflection that bond investors thought that the economy's deterioration would slow. The Federal Reserve (Fed) made no official adjustments to monetary policy, keeping the Fed Funds target within its previous range of 0% to 0.25%. However, the Fed embarked on direct support to the bond market and economy by purchasing large amounts of both U.S. Treasury and agency-backed mortgage securities, in effect helping to keep overall interest rates at low historical levels. After four consecutive negative quarters for Gross Domestic Product (GDP),3 the economy exhibited positive growth in the third quarter of 2009, after many foreign economies had already begun growing again. As the reporting period came to a close, it was apparent that economic growth continued. The Fed gave no indication that higher Fed Funds rates would be occurring over the near term. As a result, U.S. interest rates fell over the reporting period, with larger declines felt in the shorter to intermediate maturity areas (i.e., two-year to ten-year), with relatively lesser declines for 30-year maturities. With many world economies growing and no near term rate hikes expected in the United States, the corporate bond markets experienced very large positive returns, both investment grade and especially high yield.
Sector
Sector allocation was a significant positive contributor to absolute performance, as the Fund continually increased the percentage of assets in high yield bonds,4 the single best performing sector of all bond markets. The Fund did, however, maintain a majority but lesser (relative to the prior year) position in high quality bonds, which also aided in performance, as its high quality bonds generated a positive return though less than the high yield holdings.
| 3 | Gross Domestic Product: A broad gauge of the economy that measures the retail value of goods and services produced in the United States. |
| 4 | High-yield, lower-rated securities generally entail greater market, credit and liquidity risks than investment-grade securities and may include higher volatility and higher risk of default. |
Annual Shareholder Report8
Security Selection
Overall security selection was a negative contributor to Fund performance. The high yield bond portion significantly underperformed the Barclays Capital High Yield Index,5 partially offsetting the positive contribution attributed to the high yield sector allocation.
Duration6
Duration was a modest negative contributor to total return, particularly over the summer months of 2009. With the economy finally exhibiting positive growth characteristics, later confirmed by a positive GDP release for the third quarter, and with corporate earnings generally exceeding analyst estimates, Fund management reduced interest rate exposure by shortening duration. In reality, interest rate levels declined over the summer months as the Fed reiterated its position to keep Fed Funds at historically low levels.
| 5 | The Barclays Capital High Yield Index covers the universe of fixed rate, publicly issued, noninvestment-grade debt registered with the SEC. All bonds included in the High Yield Index must be dollar-denominated and nonconvertible and have at least one year remaining to maturity and an outstanding par value of at least $100 million. Generally, securities must be rated Ba1 or lower by Moody's Investors Service, including defaulted issues. If no Moody's rating is available, bonds must be rated BB+ or lower by S&P; and if no S&P rating is available, bonds must be rated below investment grade by Fitch Investor's Service. A small number of unrated bonds is included in the index; to be eligible they must have previously held a high-yield rating or have been associated with a high-yield issuer, and must trade accordingly. Investments cannot be made in an index. |
| 6 | Duration is a measure of a security's price sensitivity to changes in interest rates. Securities with longer durations are more sensitive to changes in interest rates than securities of shorter durations. |
Annual Shareholder Report9
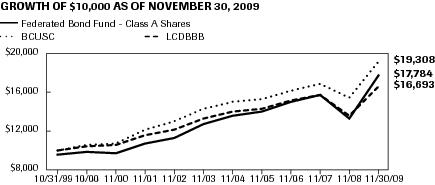
GROWTH OF $10,000 INVESTMENT - CLASS A SHARES
The graph below illustrates the hypothetical investment of $10,0001 in the Federated Bond Fund (Class A Shares) (the “Fund”) from October 31, 1999 to November 30, 2009, compared to the Barclays Capital U.S. Credit Index (BCUSC)2 and the Lipper Corporate Debt Funds BBB Rated Average (LCDBBB).2
| Average Annual Total Returns3 for the Period Ended 11/30/2009 | |
| 1 Year | 27.13% |
| 5 Years | 4.40% |
| 10 Years | 5.89% |
Performance data quoted represents past performance which is no guarantee of future results. Investment return and principal value will fluctuate so that an investor's shares, when redeemed, may be worth more or less than their original cost. Mutual fund performance changes over time and current performance may be lower or higher than what is stated. For current to the most recent month-end performance and after-tax returns, visit FederatedInvestors.com or call 1-800-341-7400. Returns shown do not reflect the deduction of taxes that a shareholder would pay on Fund distributions or the redemption of Fund shares. Mutual funds are not obligations of or guaranteed by any bank and are not federally insured. Total returns shown include the maximum sales charge of 4.50%.
| 1 | Represents a hypothetical investment of $10,000 in the Fund after deducting the maximum sales charge of 4.50% ($10,000 investment minus $450 sales charge = $9,550). The Fund's performance assumes the reinvestment of all dividends and distributions. The BCUSC and the LCDBBB have been adjusted to reflect reinvestment of dividends on securities in the index and average. |
| 2 | The BCUSC and LCDBBB are not adjusted to reflect sales charges, expenses or other fees that the Securities and Exchange Commission (SEC) requires to be reflected in the Fund's performance. The LCDBBB represents the average of the total returns reported by all of the mutual funds designated by Lipper, Inc. as falling in the category indicated, and is not adjusted to reflect any sales charges. However, these total returns are reported net of expenses or other fees that the SEC requires to be reflected in a mutual fund's performance. The index is unmanaged and, unlike the Fund, is not affected by cash flows. It is not possible to invest directly in an index or an average. |
| 3 | Total returns quoted reflect all applicable sales charges. |
Annual Shareholder Report10
GROWTH OF $10,000 INVESTMENT - CLASS B SHARES
The graph below illustrates the hypothetical investment of $10,0001 in the Federated Bond Fund (Class B Shares) (the “Fund”) from October 31, 1999 to November 30, 2009, compared to the Barclays Capital U.S. Credit Index (BCUSC)2 and the Lipper Corporate Debt Funds BBB Rated Average (LCDBBB).2
| Average Annual Total Returns3 for the Period Ended 11/30/2009 | |
| 1 Year | 26.34% |
| 5 Years | 4.18% |
| 10 Years | 5.70% |
Performance data quoted represents past performance which is no guarantee of future results. Investment return and principal value will fluctuate so that an investor's shares, when redeemed, may be worth more or less than their original cost. Mutual fund performance changes over time and current performance may be lower or higher than what is stated. For current to the most recent month-end performance and after-tax returns, visit FederatedInvestors.com or call 1-800-341-7400. Returns shown do not reflect the deduction of taxes that a shareholder would pay on Fund distributions or the redemption of Fund shares. Mutual funds are not obligations of or guaranteed by any bank and are not federally insured. Total returns shown include the maximum contingent deferred sales charge of 5.50% as applicable.
| 1 | Represents a hypothetical investment of $10,000 in the Fund. The ending value of the Fund does not reflect a contingent deferred sales charge on any redemption over seven years from the purchase date. The maximum contingent deferred sales charge is 5.50% on any redemption less than one year from the purchase date. The Fund's performance assumes the reinvestment of all dividends and distributions. The BCUSC and the LCDBBB have been adjusted to reflect reinvestment of dividends on securities in the index and average. |
| 2 | The BCUSC and the LCDBBB are not adjusted to reflect sales charges, expenses or other fees that the SEC requires to be reflected in the Fund's performance. The LCDBBB represents the average of the total returns reported by all of the mutual funds designated by Lipper, Inc. as falling in the category indicated, and is not adjusted to reflect any sales charges. However, these total returns are reported net of expenses or other fees that the SEC requires to be reflected in a mutual fund's performance. The index is unmanaged and, unlike the Fund, is not affected by cash flows. It is not possible to invest directly in an index or an average. |
| 3 | Total returns quoted reflect all applicable contingent deferred sales charges. |
Annual Shareholder Report11
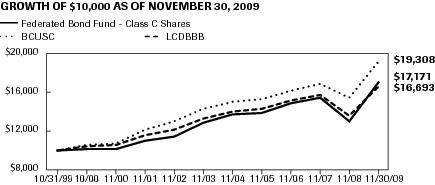
GROWTH OF $10,000 INVESTMENT - CLASS C SHARES
The graph below illustrates the hypothetical investment of $10,0001 in the Federated Bond Fund (Class C Shares) (the “Fund”) from October 31, 1999 to November 30, 2009, compared to the Barclays Capital U.S. Credit Index (BCUSC)2 and the Lipper Corporate Debt Funds BBB Rated Average (LCDBBB).2
| Average Annual Total Returns3 for the Period Ended 11/30/2009 | |
| 1 Year | 31.01% |
| 5 Years | 4.54% |
| 10 Years | 5.54% |
Performance data quoted represents past performance which is no guarantee of future results. Investment return and principal value will fluctuate so that an investor's shares, when redeemed, may be worth more or less than their original cost. Mutual fund performance changes over time and current performance may be lower or higher than what is stated. For current to the most recent month-end performance and after-tax returns, visit FederatedInvestors.com or call 1-800-341-7400. Returns shown do not reflect the deduction of taxes that a shareholder would pay on Fund distributions or the redemption of Fund shares. Mutual funds are not obligations of or guaranteed by any bank and are not federally insured. Total returns shown include the maximum contingent deferred sales charge of 1.00% as applicable.
| 1 | Represents a hypothetical investment of $10,000 in the Fund. A 1.00% contingent deferred sales charge would be applied on any redemption less than one year from the purchase date. The Fund's performance assumes the reinvestment of all dividends and distributions. The BCUSC and the LCDBBB have been adjusted to reflect reinvestment of dividends on securities in the index and average. |
| 2 | The BCUSC and LCDBBB are not adjusted to reflect sales charges, expenses or other fees that the SEC requires to be reflected in the Fund's performance. The LCDBBB represents the average of the total returns reported by all of the mutual funds designated by Lipper, Inc. as falling in the category indicated, and is not adjusted to reflect any sales charges. However, these total returns are reported net of expenses or other fees that the SEC requires to be reflected in a mutual fund's performance. The index is unmanaged and, unlike the Fund, is not affected by cash flows. It is not possible to invest directly in an index or an average. |
| 3 | Total returns quoted reflect all applicable contingent deferred sales charges. |
Annual Shareholder Report12
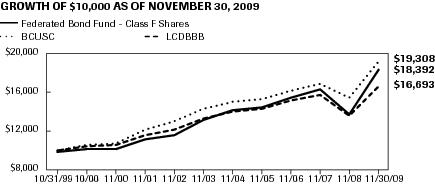
GROWTH OF $10,000 INVESTMENT - CLASS F SHARES
The graph below illustrates the hypothetical investment of $10,0001 in the Federated Bond Fund (Class F Shares) (the “Fund”) from October 31, 1999 to November 30, 2009, compared to the Barclays Capital U.S. Credit Bond Index (BCUSC)2 and the Lipper Corporate Debt Funds BBB Rated Average (LCDBBB).2
| Average Annual Total Returns3 for the Period Ended 11/30/2009 | |
| 1 Year | 30.68% |
| 5 Years | 5.13% |
| 10 Years | 6.25% |
Performance data quoted represents past performance which is no guarantee of future results. Investment return and principal value will fluctuate so that an investor's shares, when redeemed, may be worth more or less than their original cost. Mutual fund performance changes over time and current performance may be lower or higher than what is stated. For current to the most recent month-end performance and after-tax returns, visit FederatedInvestors.com or call 1-800-341-7400. Returns shown do not reflect the deduction of taxes that a shareholder would pay on Fund distributions or the redemption of Fund shares. Mutual funds are not obligations of or guaranteed by any bank and are not federally insured. Total returns reflect the maximum sales charge of 1.00% and the 1.00% contingent deferred sales charge as applicable.
| 1 | Represents a hypothetical investment of $10,000 in the Fund after deducting the maximum sales charge of 1.00% ($10,000 investment minus $100 sales charge = $9,900). A 1.00% contingent deferred sales charge would be applied on any redemption less than three years from the purchase date. The Fund's performance assumes the reinvestment of all dividends and distributions. The BCUSC and the LCDBBB have been adjusted to reflect reinvestment of dividends on securities in the index and average. |
| 2 | The BCUSC and LCDBBB are not adjusted to reflect sales charges, expenses or other fees that the SEC requires to be reflected in the Fund's performance. The LCDBBB represents the average of the total returns reported by all of the mutual funds designated by Lipper, Inc. as falling in the category indicated, and is not adjusted to reflect any sales charges. However, these total returns are reported net of expenses or other fees that the SEC requires to be reflected in a mutual fund's performance. The index is unmanaged and, unlike the Fund, is not affected by cash flows. It is not possible to invest directly in an index or an average. |
| 3 | Total returns quoted reflect all applicable sales charges and contingent deferred sales charges. |
Annual Shareholder Report13
Portfolio of Investments Summary Table (unaudited)
At November 30, 2009, the Fund's portfolio composition1 was as follows:
| Security Type | | Percentage of
Total Net Assets2 |
| Corporate Debt Securities | | 96.1% |
| Foreign Governments/Agencies | | 1.2% |
| Municipal Securities | | 0.2% |
| Asset-Backed Securities3 | | 0.0% |
| Collateralized Mortgage Obligations3 | | 0.0% |
| Mortgage-Backed Securities3,4 | | 0.0% |
| Derivative Contracts3,5 | | (0.0)% |
| Other Security Types6 | | 0.4% |
| Cash Equivalents7 | | 0.5% |
| Other Assets and Liabilities — Net8 | | 1.6% |
| TOTAL | | 100% |
| 1 | See the Fund's Prospectus and Statement of Additional Information for a description of these security types. |
| 2 | As of the date specified above, the Fund owned shares of one or more affiliated investment companies. For purposes of these tables, the affiliated investment company (other than an affiliated money market fund) is not treated as a single portfolio security, but rather the Fund is treated as owning a pro rata portion of each security and each other asset and liability owned by the affiliated investment company. Accordingly, the percentages of total net assets shown in the table will differ from those presented on the Portfolio of Investments. |
| 3 | Represents less than 0.1%. |
| 4 | For purposes of this table, mortgage-backed securities includes mortgage-backed securities guaranteed by Government Sponsored Entities (GSEs) and adjustable rate mortgage-backed securities. |
| 5 | Based upon net unrealized appreciation (depreciation) or value of the derivative contracts as applicable. Derivative contracts may consist of futures, forwards, options and swaps. The impact of a derivative contract on the Fund's performance may be larger than its unrealized appreciation (depreciation) or value may indicate. In many cases, the notional value or amount of a derivative contract may provide a better indication of the contract's significance to the portfolio. More complete information regarding the Fund's direct investments in derivative contracts, including unrealized appreciation (depreciation), value, and notional values or amounts of such contracts, can be found in the table at the end of the Portfolio of Investments included in this report. |
| 6 | Other Security Types consist of common stock and preferred stock. |
| 7 | Cash Equivalents includes any investments in money market mutual funds and/or overnight repurchase agreements. |
| 8 | Assets, other than investments in securities and derivative contracts, less liabilities. See Statement of Assets and Liabilities. |
Annual Shareholder Report14
Portfolio of Investments
November 30, 2009
|
| Principal Amount or Shares | | | Value |
| | Corporate Bonds – 65.9% | |
| | Basic Industry — Chemicals – 1.6% | |
| $3,760,000 | | Albemarle Corp., Sr. Note, 5.10%, 2/1/2015 | 3,771,500 |
| 3,670,000 | | Dow Chemical Co., Note, 8.55%, 5/15/2019 | 4,347,614 |
| 2,600,000 | | Du Pont (E.I.) de Nemours & Co., 6.00%, 7/15/2018 | 2,963,854 |
| 1,900,000 | 1 | Fertinitro Finance, Company Guarantee, 8.29%, 4/1/2020 | 1,311,000 |
| 2,365,000 | | RPM International, Inc., 6.50%, 2/15/2018 | 2,453,607 |
| 1,885,000 | | RPM International, Inc., Sr. Unsecd. Note, 6.125%, 10/15/2019 | 1,928,206 |
| 1,525,000 | | Rohm & Haas Co., 6.00%, 9/15/2017 | 1,589,122 |
| | TOTAL | 18,364,903 |
| | Basic Industry — Metals & Mining – 2.7% | |
| 2,500,000 | | Alcoa, Inc., Note, 5.55%, 2/1/2017 | 2,515,498 |
| 1,860,000 | | Allegheny Technologies, Inc., Sr. Note, 9.375%, 6/1/2019 | 2,145,196 |
| 1,370,000 | | ArcelorMittal, 6.125%, 6/1/2018 | 1,402,678 |
| 400,000 | | BHP Finance (USA), Inc., 6.50%, 4/1/2019 | 470,443 |
| 5,000,000 | | Barrick Gold Corp., 4.875%, 11/15/2014 | 5,380,568 |
| 530,000 | | Barrick Gold Corp., 6.95%, 4/1/2019 | 620,191 |
| 3,325,000 | 1,2 | Codelco, Inc., Bond, 5.625%, 9/21/2035 | 3,224,917 |
| 4,050,000 | | Newmont Mining Corp., Company Guarantee, 5.875%, 4/1/2035 | 3,855,353 |
| 3,230,000 | | Rio Tinto Finance USA Ltd., 5.875%, 7/15/2013 | 3,516,156 |
| 2,810,000 | | Rio Tinto Finance USA Ltd., 6.50%, 7/15/2018 | 3,126,882 |
| 2,500,000 | | Xstrata Canada Corp., 6.00%, 10/15/2015 | 2,670,890 |
| 1,500,000 | 1,2 | Xstrata Finance Canada Ltd., Unsecd. Note, 5.50%, 11/16/2011 | 1,569,437 |
| | TOTAL | 30,498,209 |
| | Basic Industry — Paper – 1.1% | |
| 1,700,000 | | International Paper Co., Bond, 7.30%, 11/15/2039 | 1,695,597 |
| 1,175,000 | | International Paper Co., Sr. Unsecd. Note, 7.50%, 8/15/2021 | 1,316,285 |
| 1,330,000 | | Louisiana-Pacific Corp., 8.875%, 8/15/2010 | 1,363,250 |
| 2,850,000 | 3,4 | Pope & Talbot, Inc., 8.375%, 6/1/2013 | 26,362 |
| 4,500,000 | | Westvaco Corp., 7.65%, 3/15/2027 | 4,432,771 |
| 3,750,000 | | Weyerhaeuser Co., Deb., 7.375%, 3/15/2032 | 3,432,169 |
| | TOTAL | 12,266,434 |
| | Capital Goods — Aerospace & Defense – 0.6% | |
| 3,650,000 | 1,2 | BAE Systems Holdings, Inc., 5.20%, 8/15/2015 | 3,951,404 |
| 2,000,000 | | Boeing Co., 4.875%, 2/15/2020 | 2,084,983 |
Annual Shareholder Report15
|
| $600,000 | | Raytheon Co., Sr. Note, 4.40%, 2/15/2020 | 612,093 |
| | TOTAL | 6,648,480 |
| | Capital Goods — Building Materials – 0.5% | |
| 5,500,000 | | Masco Corp., Note, 5.875%, 7/15/2012 | 5,529,817 |
| | Capital Goods — Diversified Manufacturing – 2.8% | |
| 2,940,000 | | Briggs & Stratton Corp., Company Guarantee, 8.875%, 3/15/2011 | 3,079,650 |
| 2,065,000 | | Dover Corp., Note, 5.45%, 3/15/2018 | 2,265,667 |
| 2,020,000 | | Harsco Corp., 5.75%, 5/15/2018 | 2,136,956 |
| 2,600,000 | | Hubbell, Inc., 5.95%, 6/1/2018 | 2,759,209 |
| 768,000 | 1,2 | Hutchison Whampoa International Ltd., 6.50%, 2/13/2013 | 848,699 |
| 1,000,000 | 1,2 | Hutchison Whampoa International Ltd., 7.625%, 4/9/2019 | 1,163,835 |
| 2,300,000 | 1,2 | Hutchison Whampoa International Ltd., Company Guarantee, Series 144A, 4.625%, 9/11/2015 | 2,346,817 |
| 1,910,000 | | Ingersoll-Rand Global Holding Co. Ltd., 6.875%, 8/15/2018 | 2,161,836 |
| 2,770,000 | | Roper Industries, Inc., 6.625%, 8/15/2013 | 3,060,130 |
| 660,000 | | Roper Industries, Inc., Sr. Unsecd. Note, 6.25%, 9/1/2019 | 706,917 |
| 2,630,000 | | Textron Financial Corp., 5.40%, 4/28/2013 | 2,603,674 |
| 3,230,000 | 1,2 | Textron Financial Corp., Jr. Sub. Note, 6.00%, 2/15/2067 | 2,277,150 |
| 1,090,000 | | Thomas & Betts Corp., Sr. Unsecd. Note, 5.625%, 11/15/2021 | 1,116,299 |
| 4,230,000 | | Tyco Electronics Group SA, 5.95%, 1/15/2014 | 4,527,416 |
| | TOTAL | 31,054,255 |
| | Capital Goods — Environmental – 0.3% | |
| 500,000 | | Republic Services, Inc., Note, 6.086%, 3/15/2035 | 480,131 |
| 600,000 | | Republic Services, Inc., Note, 6.75%, 8/15/2011 | 636,978 |
| 1,000,000 | 1,2 | Republic Services, Inc., Sr. Unsecd. Note, Series 144A, 5.50%, 9/15/2019 | 1,049,965 |
| 1,275,000 | | Waste Management, Inc., 7.375%, 3/11/2019 | 1,491,983 |
| | TOTAL | 3,659,057 |
| | Communications — Media & Cable – 1.8% | |
| 900,000 | | Comcast Corp., 7.05%, 3/15/2033 | 992,561 |
| 520,000 | | Comcast Corp., Company Guarantee, 5.70%, 5/15/2018 | 557,586 |
| 5,480,000 | | Comcast Corp., Company Guarantee, 6.50%, 1/15/2017 | 6,137,333 |
| 5,010,000 | | Cox Communications, Inc., Unsecd. Note, 5.45%, 12/15/2014 | 5,462,734 |
| 2,470,000 | | Time Warner Cable, Inc., Company Guarantee, 6.75%, 6/15/2039 | 2,631,839 |
| 1,600,000 | | Time Warner Cable, Inc., Company Guarantee, 8.75%, 2/14/2019 | 1,999,756 |
| 2,250,000 | | Time Warner Cable, Inc., Sr. Unsecd. Note, 5.85%, 5/1/2017 | 2,408,834 |
| | TOTAL | 20,190,643 |
Annual Shareholder Report16
|
| | Communications — Media Noncable – 0.7% | |
| $6,880,000 | | Grupo Televisa S.A., 6.625%, 3/18/2025 | 6,933,183 |
| 500,000 | | News America Holdings, Inc., Sr. Deb., 9.25%, 2/1/2013 | 592,660 |
| | TOTAL | 7,525,843 |
| | Communications — Telecom Wireless – 1.2% | |
| 6,540,000 | | AT&T Wireless Services, Inc., 8.75%, 3/1/2031 | 8,675,400 |
| 3,100,000 | | America Movil S.A.B. de C.V., Note, 5.75%, 1/15/2015 | 3,343,112 |
| 800,000 | | Vodafone Group PLC, 5.35%, 2/27/2012 | 862,771 |
| | TOTAL | 12,881,283 |
| | Communications — Telecom Wirelines – 3.3% | |
| 1,000,000 | | AT&T, Inc., 6.70%, 11/15/2013 | 1,151,525 |
| 3,810,000 | | BellSouth Corp., 5.20%, 9/15/2014 | 4,183,948 |
| 1,540,000 | | CenturyTel, Inc., Sr. Note, 6.15%, 9/15/2019 | 1,589,279 |
| 2,620,000 | | Citizens Communications Co., 9.00%, 8/15/2031 | 2,574,150 |
| 6,380,000 | | Deutsche Telekom International Finance BV, 4.875%, 7/8/2014 | 6,839,782 |
| 4,940,000 | 1,2 | KT Corp., Note, 5.875%, 6/24/2014 | 5,285,074 |
| 2,140,000 | | Rogers Communications, Inc., 5.50%, 3/15/2014 | 2,304,513 |
| 3,870,000 | | SBC Communications, Inc., 5.10%, 9/15/2014 | 4,232,725 |
| 5,030,000 | | Telefonica SA, Sr. Note, 5.855%, 2/4/2013 | 5,559,938 |
| 3,260,000 | | Verizon Communications, Inc., Sr. Unsecd. Note, 6.35%, 4/1/2019 | 3,676,437 |
| | TOTAL | 37,397,371 |
| | Consumer Cyclical — Automotive – 2.0% | |
| 3,560,000 | 1,2 | American Honda Finance Corp., 4.625%, 4/2/2013 | 3,704,912 |
| 2,490,000 | | DaimlerChrysler North America Holding Corp., 6.50%, 11/15/2013 | 2,737,379 |
| 7,740,000 | | DaimlerChrysler North America Holding Corp., Note, 4.875%, 6/15/2010 | 7,882,119 |
| 2,100,000 | 3,4 | General Motors Corp., Note, 9.45%, 11/1/2011 | 451,500 |
| 2,710,000 | 1,2 | Hyundai Capital Services, Inc., Note, Series 144A, 6.00%, 5/5/2015 | 2,788,026 |
| 4,800,000 | 1,2 | Nissan Motor Acceptance Corp., Sr. Unsecd. Note, 5.625%, 3/14/2011 | 4,964,756 |
| | TOTAL | 22,528,692 |
| | Consumer Cyclical — Entertainment – 0.6% | |
| 2,500,000 | | Time Warner, Inc., 5.50%, 11/15/2011 | 2,676,149 |
| 3,390,000 | | Time Warner, Inc., Company Guarantee, 6.875%, 5/1/2012 | 3,758,579 |
| | TOTAL | 6,434,728 |
| | Consumer Cyclical — Lodging – 0.1% | |
| 1,530,000 | | Wyndham Worldwide Corp., Sr. Unsecd. Note, 6.00%, 12/1/2016 | 1,427,565 |
| | Consumer Cyclical — Retailers – 0.9% | |
| 2,240,000 | | Best Buy Co., Inc., Sr. Unsecd. Note, 6.75%, 7/15/2013 | 2,440,796 |
Annual Shareholder Report17
|
| $1,827,798 | 1,2 | CVS Caremark Corp., Pass Thru Cert., 5.298%, 1/11/2027 | 1,764,333 |
| 4,350,000 | | CVS Caremark Corp., Sr. Unsecd. Note, 5.75%, 6/1/2017 | 4,703,967 |
| 900,000 | | JC Penney Corp., Inc., Sr. Unsecd. Note, 5.75%, 2/15/2018 | 855,000 |
| | TOTAL | 9,764,096 |
| | Consumer Cyclical — Services – 0.8% | |
| 7,475,000 | | Boston University, 7.625%, 7/15/2097 | 8,585,875 |
| | Consumer Non-Cyclical — Food/Beverage – 1.3% | |
| 4,000,000 | 1,2 | Bacardi Ltd., Sr. Note, 7.45%, 4/1/2014 | 4,615,119 |
| 960,000 | | Diageo Capital PLC, Company Guarantee, 7.375%, 1/15/2014 | 1,132,258 |
| 2,420,000 | | General Mills, Inc., Note, 5.70%, 2/15/2017 | 2,692,483 |
| 2,000,000 | | Kraft Foods, Inc., 5.625%, 11/1/2011 | 2,144,014 |
| 740,000 | | Kraft Foods, Inc., Note, 6.25%, 6/1/2012 | 808,986 |
| 1,540,000 | | Kraft Foods, Inc., Sr. Unsecd. Note, 6.125%, 2/1/2018 | 1,664,060 |
| 1,120,000 | 1,2 | Ralcorp Holdings, Inc., Sr. Note, 6.625%, 8/15/2039 | 1,161,562 |
| | TOTAL | 14,218,482 |
| | Consumer Non-Cyclical — Health Care – 0.6% | |
| 1,060,000 | | Covidien International Finance SA, 6.55%, 10/15/2037 | 1,231,040 |
| 500,000 | | Quest Diagnostics, Inc., Sr. Unsecd. Note, 4.75%, 1/30/2020 | 507,072 |
| 500,000 | | Quest Diagnostics, Inc., Sr. Unsecd. Note, 5.75%, 1/30/2040 | 506,962 |
| 1,660,000 | | Thermo Electron Corp., Sr. Unsecd. Note, 5.00%, 6/1/2015 | 1,815,008 |
| 1,210,000 | 1,2 | Thermo Fisher Scientific, Inc. , Sr. Note, Series 144A, 2.15%, 12/28/2012 | 1,219,491 |
| 1,120,000 | | Zimmer Holdings, Inc., Sr. Note, 5.75%, 11/30/2039 | 1,150,462 |
| | TOTAL | 6,430,035 |
| | Consumer Non-Cyclical — Products – 0.6% | |
| 900,000 | | Clorox Co., Sr. Unsecd. Note, 3.55%, 11/1/2015 | 917,933 |
| 500,000 | | Philips Electronics NV, 4.625%, 3/11/2013 | 530,371 |
| 1,960,000 | | Philips Electronics NV, 5.75%, 3/11/2018 | 2,156,013 |
| 2,950,000 | | Whirlpool Corp., 5.50%, 3/1/2013 | 3,069,982 |
| | TOTAL | 6,674,299 |
| | Consumer Non-Cyclical — Supermarkets – 0.1% | |
| 1,310,000 | | Kroger Co., Bond, 6.90%, 4/15/2038 | 1,551,596 |
| | Consumer Non-Cyclical — Tobacco – 0.3% | |
| 2,900,000 | | Altria Group, Inc., 9.25%, 8/6/2019 | 3,547,150 |
| | Energy — Independent – 1.9% | |
| 460,000 | | Canadian Natural Resources Ltd., 4.90%, 12/1/2014 | 494,074 |
| 5,890,000 | | Canadian Natural Resources Ltd., 5.85%, 2/1/2035 | 5,995,347 |
Annual Shareholder Report18
|
| $1,500,000 | 1,2 | Lukoil International Finance BV, 6.356%, 6/7/2017 | 1,455,000 |
| 495,000 | | Pemex Project Funding Master, 5.75%, 12/15/2015 | 517,120 |
| 3,450,000 | | Pemex Project Funding Master, Company Guarantee, 9.125%, 10/13/2010 | 3,690,119 |
| 6,000,000 | 1,2 | Petroleos Mexicanos, 4.875%, 3/15/2015 | 6,087,334 |
| 440,000 | | XTO Energy, Inc., 6.375%, 6/15/2038 | 474,311 |
| 775,000 | | XTO Energy, Inc., 6.75%, 8/1/2037 | 874,290 |
| 1,135,000 | | XTO Energy, Inc., Sr. Unsecd. Note, 6.25%, 8/1/2017 | 1,265,380 |
| | TOTAL | 20,852,975 |
| | Energy — Integrated – 0.9% | |
| 2,750,000 | | Conoco, Inc., 7.25%, 10/15/2031 | 3,294,027 |
| 550,000 | | Husky Energy, Inc., 5.90%, 6/15/2014 | 602,310 |
| 450,000 | | Husky Oil Ltd., Deb., 7.55%, 11/15/2016 | 508,016 |
| 4,650,000 | | Petro-Canada, Bond, 5.35%, 7/15/2033 | 4,185,208 |
| 220,000 | | Petro-Canada, Deb., 7.00%, 11/15/2028 | 240,505 |
| 1,190,238 | 1,2 | Qatar Petroleum, 5.579%, 5/30/2011 | 1,228,887 |
| | TOTAL | 10,058,953 |
| | Energy — Oil Field Services – 0.4% | |
| 1,100,000 | | Nabors Industries, Inc., Company Guarantee, 9.25%, 1/15/2019 | 1,365,505 |
| 210,000 | | Noble Drilling Corp., Sr. Note, 7.50%, 3/15/2019 | 236,134 |
| 100,000 | | Weatherford International Ltd., 6.00%, 3/15/2018 | 104,617 |
| 2,700,000 | | Weatherford International Ltd., 7.00%, 3/15/2038 | 2,852,109 |
| | TOTAL | 4,558,365 |
| | Energy — Refining – 0.6% | |
| 1,000,000 | | Premcor Refining Group, Inc., 6.125%, 5/1/2011 | 1,056,537 |
| 1,665,000 | | Valero Energy Corp., 7.50%, 4/15/2032 | 1,719,593 |
| 2,870,000 | | Valero Energy Corp., 9.375%, 3/15/2019 | 3,460,131 |
| | TOTAL | 6,236,261 |
| | Financial Institution — Banking – 11.6% | |
| 4,000,000 | | Astoria Financial Corp., Note, 5.75%, 10/15/2012 | 3,774,244 |
| 870,000 | | Banc One Corp., Sub. Deb., 8.00%, 4/29/2027 | 1,044,604 |
| 1,580,000 | | Bank of America Corp., Sr. Note, 7.375%, 5/15/2014 | 1,777,837 |
| 930,000 | | Bank of America Corp., Sr. Unsecd. Note, 6.50%, 8/1/2016 | 998,078 |
| 5,000,000 | 1,2 | Barclays Bank PLC, 5.926%, 12/31/2049 | 3,625,000 |
| 4,750,000 | 5 | Bear Stearns Cos., Inc., Sr. Unsecd. Note, 7.25%, 2/1/2018 | 5,520,949 |
| 4,180,000 | | Capital One Capital IV, 6.745%, 2/17/2037 | 3,323,100 |
| 1,450,000 | | Capital One Capital V, 10.25%, 8/15/2039 | 1,598,977 |
Annual Shareholder Report19
|
| $3,140,000 | | Capital One Capital VI, 8.875%, 5/15/2040 | 3,130,549 |
| 2,270,000 | | Capital One Financial Corp., Sr. Note, 7.375%, 5/23/2014 | 2,614,237 |
| 6,460,000 | | Citigroup, Inc., Sr. Unsecd. Note, 6.875%, 3/5/2038 | 6,398,924 |
| 2,300,000 | 1,2 | Commonwealth Bank of Australia, Sr. Unsecd. Note, Series 144A, 3.75%, 10/15/2014 | 2,358,824 |
| 2,900,000 | | Goldman Sachs Group, Inc., 6.125%, 2/15/2033 | 3,006,592 |
| 1,000,000 | | Goldman Sachs Group, Inc., Sr. Unsecd. Note, 5.125%, 1/15/2015 | 1,063,431 |
| 2,100,000 | | Goldman Sachs Group, Inc., Sub. Note, 6.345%, 2/15/2034 | 1,952,785 |
| 1,000,000 | | HSBC Bank USA, Sr. Sub. Note, 4.625%, 4/1/2014 | 1,060,273 |
| 3,500,000 | | Hudson United Bancorp, 7.00%, 5/15/2012 | 3,788,718 |
| 10,900,000 | | JPMorgan Chase & Co., Sub. Note, 5.125%, 9/15/2014 | 11,644,629 |
| 1,280,000 | | M & T Bank Corp., 5.375%, 5/24/2012 | 1,340,628 |
| 3,975,000 | | Manufacturers & Traders Trust Co., Sub. Note, 5.629%, 12/1/2021 | 3,263,246 |
| 5,000,000 | | Marshall & Ilsley Bank, Milwaukee, Sr. Note, 4.40%, 3/15/2010 | 4,998,146 |
| 3,170,000 | | Merrill Lynch & Co., Inc., Sr. Unsecd. Note, 6.05%, 8/15/2012 | 3,422,284 |
| 1,000,000 | | Morgan Stanley, Sr. Unsecd. Note, 4.20%, 11/20/2014 | 1,007,235 |
| 3,300,000 | | Morgan Stanley, Sr. Unsecd. Note, 5.625%, 9/23/2019 | 3,349,933 |
| 1,500,000 | | Morgan Stanley, Sr. Unsecd. Note, 5.95%, 12/28/2017 | 1,587,875 |
| 2,450,000 | | Morgan Stanley, Sr. Unsecd. Note, 6.00%, 4/28/2015 | 2,659,600 |
| 7,350,000 | | Morgan Stanley, Sr. Unsecd. Note, 6.625%, 4/1/2018 | 8,025,131 |
| 2,650,000 | 1,2 | Nordea Bank AB, Sr. Unsecd. Note, 3.70%, 11/13/2014 | 2,693,289 |
| 1,000,000 | | PNC Funding Corp., Sr. Unsecd. Note, 4.25%, 9/21/2015 | 1,034,560 |
| 1,170,000 | | PNC Funding Corp., Sub. Note, 5.625%, 2/1/2017 | 1,188,828 |
| 10,398,302 | 1,2 | Regional Diversified Funding, 9.25%, 3/15/2030 | 5,594,806 |
| 3,870,000 | | Sovereign Bancorp, Inc., Sr. Note, 4.80%, 9/1/2010 | 3,973,676 |
| 5,580,000 | | U.S. Bank, N.A., Sub. Note, 4.95%, 10/30/2014 | 6,081,027 |
| 5,000,000 | | Wachovia Bank N.A., 4.80%, 11/1/2014 | 5,206,464 |
| 3,440,000 | | Wachovia Bank N.A., Sub. Note, 4.875%, 2/1/2015 | 3,561,177 |
| 500,000 | | Wachovia Corp., 5.75%, 2/1/2018 | 528,379 |
| 4,530,000 | | Westpac Banking Corp., Sr. Unsecd. Note, 4.875%, 11/19/2019 | 4,601,368 |
| 3,550,000 | | Wilmington Trust Corp., Sub. Note, 8.50%, 4/2/2018 | 3,539,914 |
| 1,384,528 | 1,2 | World Financial, Pass Thru Cert., Series 96 WFP, 6.91%, 9/1/2013 | 1,372,269 |
| 3,370,000 | | Zions Bancorp, Sub. Note, 5.50%, 11/16/2015 | 2,345,672 |
| | TOTAL | 130,057,258 |
Annual Shareholder Report20
|
| | Financial Institution — Brokerage – 3.2% | |
| $6,140,000 | | AMVESCAP Ltd., Note, 4.50%, 12/15/2009 | 6,145,857 |
| 5,970,000 | | Blackrock, Inc., 6.25%, 9/15/2017 | 6,613,622 |
| 1,500,000 | | Eaton Vance Corp., 6.50%, 10/2/2017 | 1,620,513 |
| 4,255,000 | 1,2 | FMR LLC, Bond, 7.57%, 6/15/2029 | 4,729,661 |
| 1,150,000 | | Janus Capital Group, Inc., Sr. Note, 6.50%, 6/15/2012 | 1,163,063 |
| 1,375,000 | | Janus Capital Group, Inc., Sr. Note, 6.95%, 6/15/2017 | 1,326,229 |
| 4,390,000 | | Jefferies Group, Inc., Sr. Unsecd. Note, 8.50%, 7/15/2019 | 4,828,121 |
| 1,200,000 | 3 | Lehman Brothers Holdings, Inc., 5.75%, 5/17/2013 | 240,000 |
| 1,500,000 | 3 | Lehman Brothers Holdings, Inc., 7.875%, 8/15/2010 | 300,000 |
| 1,020,000 | | Nuveen Investments, 5.00%, 9/15/2010 | 1,011,075 |
| 1,020,000 | | Nuveen Investments, 5.50%, 9/15/2015 | 703,800 |
| 2,990,000 | | Raymond James Financial, Inc., 8.60%, 8/15/2019 | 3,324,128 |
| 3,355,000 | | TD Ameritrade Holding Corp., Company Guarantee, 4.15%, 12/1/2014 | 3,380,902 |
| | TOTAL | 35,386,971 |
| | Financial Institution — Finance Noncaptive – 3.9% | |
| 6,930,000 | | American Express Credit Corp., 5.875%, 5/2/2013 | 7,507,357 |
| 5,000,000 | | American International Group, Inc., Sr. Note, 4.70%, 10/1/2010 | 4,953,125 |
| 3,300,000 | | Discover Bank, Sub., 8.70%, 11/18/2019 | 3,485,645 |
| 7,000,000 | | General Electric Capital Corp., 6.875%, 1/10/2039 | 7,383,216 |
| 6,000,000 | | HSBC Finance Capital Trust IX, Note, 5.911%, 11/30/2035 | 4,710,000 |
| 2,200,000 | | HSBC Finance Corp., 4.75%, 4/15/2010 | 2,227,807 |
| 2,770,000 | | HSBC Finance Corp., 5.00%, 6/30/2015 | 2,902,542 |
| 1,500,000 | 1,2 | ILFC E-Capital Trust I, 5.90%, 12/21/2065 | 705,000 |
| 3,100,000 | | International Lease Finance Corp., 4.875%, 9/1/2010 | 3,008,937 |
| 1,670,000 | | International Lease Finance Corp., 6.625%, 11/15/2013 | 1,346,855 |
| 1,170,000 | 1,2 | Macquarie Group Ltd., Note, Series 144A, 7.625%, 8/13/2019 | 1,281,674 |
| 3,250,000 | | Susa Partnership LP, 8.20%, 6/1/2017 | 3,786,333 |
| | TOTAL | 43,298,491 |
| | Financial Institution — Insurance — Health – 0.9% | |
| 810,000 | | Aetna US Healthcare, 5.75%, 6/15/2011 | 856,501 |
| 2,200,000 | | Anthem, Inc., 6.80%, 8/1/2012 | 2,435,413 |
| 2,060,000 | | CIGNA Corp., 6.35%, 3/15/2018 | 2,096,322 |
| 4,000,000 | | UnitedHealth Group, Inc., Bond, 6.00%, 2/15/2018 | 4,265,127 |
| 740,000 | | Wellpoint, Inc., 5.85%, 1/15/2036 | 725,116 |
| | TOTAL | 10,378,479 |
Annual Shareholder Report21
|
| | Financial Institution — Insurance — Life – 3.1% | |
| $2,750,000 | | AXA-UAP, Sub. Note, 8.60%, 12/15/2030 | 3,206,756 |
| 3,860,000 | 1,2 | Massachusetts Mutual Life Insurance Co., Sub. Note, 8.875%, 6/1/2039 | 4,781,986 |
| 3,570,000 | | MetLife, Inc., 6.75%, 6/1/2016 | 4,103,178 |
| 1,000,000 | | MetLife, Inc., Jr. Sub. Note, 10.75%, 8/1/2069 | 1,218,331 |
| 3,400,000 | 1,2 | New York Life Insurance Co., Sub. Note, 6.75%, 11/15/2039 | 3,441,603 |
| 2,950,000 | 1,2 | Pacific Life Global Funding, Note, 5.15%, 4/15/2013 | 3,127,891 |
| 4,000,000 | 1,2 | Pacific LifeCorp., Bond, 6.60%, 9/15/2033 | 3,408,472 |
| 2,990,000 | | Prudential Financial, Inc., 5.15%, 1/15/2013 | 3,168,924 |
| 1,530,000 | | Prudential Financial, Inc., 6.625%, 12/1/2037 | 1,583,875 |
| 2,500,000 | | Prudential Financial, Inc., Sr. Unsecd. Note, 4.75%, 9/17/2015 | 2,559,157 |
| 3,950,000 | 1 | Union Central Life Insurance Co., Note, 8.20%, 11/1/2026 | 3,712,950 |
| | TOTAL | 34,313,123 |
| | Financial Institution — Insurance — P&C – 1.8% | |
| 2,940,000 | | ACE INA Holdings, Inc., 5.60%, 5/15/2015 | 3,246,420 |
| 540,000 | | CNA Financial Corp., 6.50%, 8/15/2016 | 537,233 |
| 1,370,000 | | CNA Financial Corp., Note, 6.00%, 8/15/2011 | 1,398,670 |
| 700,000 | | CNA Financial Corp., Sr. Unsecd. Note, 7.35%, 11/15/2019 | 713,185 |
| 1,710,000 | | Horace Mann Educators Corp., Sr. Note, 6.85%, 4/15/2016 | 1,720,333 |
| 4,000,000 | 1,2 | Liberty Mutual Group, Inc., Unsecd. Note, 5.75%, 3/15/2014 | 4,041,116 |
| 1,300,000 | 1,2 | Nationwide Mutual Insurance Co., Note, Series 144A, 9.375%, 8/15/2039 | 1,359,228 |
| 1,220,000 | | The Travelers Cos., Inc., Bond, 6.25%, 3/15/2067 | 1,107,124 |
| 265,000 | | The Travelers Cos., Inc., Sr. Unsecd. Note, 5.50%, 12/1/2015 | 296,758 |
| 1,000,000 | 1,2 | USF&G Corp., 8.312%, 7/1/2046 | 873,281 |
| 5,610,000 | 1,2 | ZFS Finance USA Trust I, Jr. Sub. Note, 6.15%, 12/15/2065 | 5,034,975 |
| | TOTAL | 20,328,323 |
| | Financial Institution — REITs – 1.6% | |
| 1,750,000 | | AMB Property LP, Company Guarantee, 6.125%, 12/1/2016 | 1,773,137 |
| 1,850,000 | | Avalonbay Communities, Inc., Sr. Unsecd. Note, Series MTN, 5.70%, 3/15/2017 | 1,937,923 |
| 3,500,000 | | Boston Properties LP, Sr. Unsecd. Note, 5.875%, 10/15/2019 | 3,600,381 |
| 1,500,000 | | Equity One, Inc., Bond, 6.00%, 9/15/2017 | 1,386,208 |
| 1,535,000 | | Liberty Property LP, 6.625%, 10/1/2017 | 1,557,569 |
| 720,000 | | Prologis, Conv. Bond, 2.25%, 4/1/2037 | 667,782 |
| 1,430,000 | | Simon Property Group LP, 6.125%, 5/30/2018 | 1,505,100 |
Annual Shareholder Report22
|
| $1,840,000 | | Simon Property Group LP, 6.75%, 5/15/2014 | 2,021,148 |
| 430,000 | | Simon Property Group, Inc., 6.35%, 8/28/2012 | 464,957 |
| 2,330,000 | | Simon Property Group, Inc., Note, 5.60%, 9/1/2011 | 2,448,520 |
| | TOTAL | 17,362,725 |
| | Municipal Services – 0.3% | |
| 1,825,000 | 1,2 | Army Hawaii Family Housing, 5.524%, 6/15/2050 | 1,311,792 |
| 2,980,000 | 1,2 | Camp Pendleton & Quantico Housing LLC, 5.572%, 10/1/2050 | 2,152,513 |
| | TOTAL | 3,464,305 |
| | Sovereign – 0.7% | |
| 5,350,000 | | Corp Andina De Fomento, Bond, 7.375%, 1/18/2011 | 5,671,504 |
| 2,475,000 | 1,2 | State of Qatar, 5.25%, 1/20/2020 | 2,507,794 |
| | TOTAL | 8,179,298 |
| | Technology – 1.7% | |
| 1,400,000 | | BMC Software, Inc., 7.25%, 6/1/2018 | 1,510,019 |
| 1,320,000 | | Cisco Systems, Inc., Sr. Unsecd. Note, 5.50%, 2/22/2016 | 1,487,100 |
| 1,100,000 | | Dell Computer Corp., Deb., 7.10%, 4/15/2028 | 1,229,020 |
| 3,630,000 | | Fiserv, Inc., Sr. Note, 6.80%, 11/20/2017 | 4,102,392 |
| 6,175,000 | | Harris Corp., 5.95%, 12/1/2017 | 6,704,392 |
| 965,000 | | IBM Corp., Deb., 8.375%, 11/1/2019 | 1,296,314 |
| 2,330,000 | | KLA-Tencor Corp., 6.90%, 5/1/2018 | 2,522,139 |
| | TOTAL | 18,851,376 |
| | Transportation — Airlines – 0.2% | |
| 710,000 | | Southwest Airlines Co., 6.50%, 3/1/2012 | 749,555 |
| 1,995,000 | | Southwest Airlines Co., Deb., 7.375%, 3/1/2027 | 1,898,653 |
| | TOTAL | 2,648,208 |
| | Transportation — Railroads – 1.2% | |
| 1,200,000 | | Burlington Northern Santa Fe Corp., 4.875%, 1/15/2015 | 1,289,231 |
| 2,086,262 | | Burlington Northern Santa Fe Corp., Pass Thru Cert., 7.57%, 1/2/2021 | 2,533,903 |
| 3,150,000 | | Canadian Pacific RR, 7.125%, 10/15/2031 | 3,478,900 |
| 655,000 | | Norfolk Southern Corp., Note, 6.75%, 2/15/2011 | 697,457 |
| 700,000 | | Norfolk Southern Corp., Sr. Unsecd. Note, 5.75%, 1/15/2016 | 768,492 |
| 1,000,000 | | Norfolk Southern Corp., Sr. Unsecd. Note, 5.75%, 4/1/2018 | 1,103,767 |
| 3,580,000 | | Union Pacific Corp., 4.875%, 1/15/2015 | 3,820,177 |
| | TOTAL | 13,691,927 |
| | Transportation — Services – 0.3% | |
| 3,080,000 | 1,2 | Enterprise Rent-A-Car USA Finance Co., 6.375%, 10/15/2017 | 3,223,260 |
Annual Shareholder Report23
|
| | Utility — Electric – 6.0% | |
| $2,650,000 | | Appalachian Power Co., Sr. Unsecd. Note, 7.95%, 1/15/2020 | 3,297,870 |
| 1,530,000 | | Cleveland Electric Illuminating Co., Sr. Unsecd. Note, 5.95%, 12/15/2036 | 1,479,662 |
| 4,670,000 | | Commonwealth Edison Co., 1st Mtg. Bond, 5.80%, 3/15/2018 | 5,119,660 |
| 1,180,000 | | Commonwealth Edison Co., 1st Mtg. Bond, 6.15%, 9/15/2017 | 1,325,776 |
| 1,375,000 | | Consolidated Edison Co., Sr. Unsecd. Note, 6.65%, 4/1/2019 | 1,620,150 |
| 2,390,000 | | Consolidated Natural Gas Co., 5.00%, 12/1/2014 | 2,594,799 |
| 2,000,000 | | Dominion Resources, Inc., Unsecd. Note, 5.95%, 6/15/2035 | 2,134,981 |
| 2,765,000 | | Duke Capital Corp., Sr. Note, 6.25%, 2/15/2013 | 3,027,478 |
| 1,480,000 | | Duke Energy Indiana, Inc., 1st Mtg. Bond, 6.35%, 8/15/2038 | 1,705,064 |
| 1,830,000 | 1,2 | Enel Finance International SA, Company Guarantee, Series 144A, 3.875%, 10/7/2014 | 1,882,133 |
| 5,150,000 | | Enersis S.A., Note, 7.40%, 12/1/2016 | 5,828,127 |
| 300,000 | | FPL Group Capital, Inc., 7.875%, 12/15/2015 | 370,157 |
| 2,680,000 | 1,2 | FirstEnergy Solutions Corp., Company Guarantee, Series 144A, 6.05%, 8/15/2021 | 2,828,653 |
| 3,400,000 | 1,2 | FirstEnergy Solutions Corp., Series 144A, 4.80%, 2/15/2015 | 3,594,445 |
| 3,338,360 | 1,2 | Great River Energy, 1st Mtg. Note, 5.829%, 7/1/2017 | 3,613,714 |
| 1,000,000 | | KCP&L Greater Missouri Operations Co., Sr. Unsecd. Note, 11.875%, 7/1/2012 | 1,164,050 |
| 1,330,000 | 1,2 | Korea Hydro & Nuclear Power Co. Ltd., Sr. Unsecd. Note, 6.25%, 6/17/2014 | 1,444,686 |
| 5,350,000 | | MidAmerican Energy Holdings Co., Sr. Unsecd. Note, 5.95%, 5/15/2037 | 5,682,758 |
| 1,460,000 | | National Rural Utilities Cooperative Finance Corp., 5.45%, 2/1/2018 | 1,579,815 |
| 2,930,000 | | National Rural Utilities Cooperative Finance Corp., Collateral Trust, 5.50%, 7/1/2013 | 3,231,340 |
| 800,000 | | National Rural Utilities Cooperative Finance Corp., Sr. Unsecd. Note, 10.375%, 11/1/2018 | 1,088,360 |
| 1,835,000 | | PPL Energy Supply LLC, Sr. Unsecd. Note, 6.00%, 12/15/2036 | 1,774,968 |
| 1,000,000 | | PSEG Power LLC, Company Guarantee, 7.75%, 4/15/2011 | 1,081,539 |
| 1,670,000 | | PSI Energy, Inc., Bond, 6.05%, 6/15/2016 | 1,863,225 |
| 1,810,000 | | Progress Energy, Inc., 7.05%, 3/15/2019 | 2,111,090 |
| 2,940,000 | | Union Electric Co., 6.00%, 4/1/2018 | 3,209,368 |
| 1,000,000 | | Virginia Electric & Power Co., Sr. Unsecd. Note, 5.00%, 6/30/2019 | 1,058,804 |
| 2,020,000 | | Westar Energy, Inc., 5.875%, 7/15/2036 | 1,911,753 |
| | TOTAL | 67,624,425 |
Annual Shareholder Report24
|
| | Utility — Natural Gas Distributor – 0.6% | |
| $1,690,000 | | Atmos Energy Corp., 5.125%, 1/15/2013 | 1,818,284 |
| 195,000 | | Atmos Energy Corp., 8.50%, 3/15/2019 | 246,862 |
| 1,300,000 | | Sempra Energy, Sr. Unsecd. Note, 6.00%, 10/15/2039 | 1,290,029 |
| 2,540,000 | | Sempra Energy, Sr. Unsecd. Note, 6.50%, 6/1/2016 | 2,833,034 |
| | TOTAL | 6,188,209 |
| | Utility — Natural Gas Pipelines – 1.1% | |
| 3,080,000 | | Enbridge, Inc., Sr. Note, 5.60%, 4/1/2017 | 3,358,630 |
| 580,000 | | Enterprise Products Operating LLC, 4.60%, 8/1/2012 | 614,579 |
| 3,850,000 | | Enterprise Products Operating LLC, Company Guarantee, 9.75%, 1/31/2014 | 4,694,089 |
| 3,300,000 | | Kinder Morgan Energy Partners LP, Sr. Unsecd. Note, 5.80%, 3/15/2035 | 3,112,063 |
| 830,000 | | Kinder Morgan Energy Partners LP, Sr. Unsecd. Note, 6.85%, 2/15/2020 | 947,983 |
| | TOTAL | 12,727,344 |
| | TOTAL CORPORATE BONDS
(IDENTIFIED COST $720,565,425) | 736,609,089 |
| | Corporate Note – 0.4% | |
| | Communications — Telecom Wirelines – 0.4% | |
| 4,595,000 | | Telecom Italia Capital, Note, 4.875%, 10/1/2010
(IDENTIFIED COST $4,593,135) | 4,727,198 |
| | Mortgage-Backed Securities – 0.0% | |
| 8,960 | | Federal Home Loan Mortgage Corp., Pool C00702, 6.00%, 1/1/2029 | 9,733 |
| 10,054 | | Federal Home Loan Mortgage Corp., Pool C00748, 6.00%, 4/1/2029 | 10,921 |
| 2,802 | | Federal Home Loan Mortgage Corp., Pool C20263, 6.00%, 1/1/2029 | 3,043 |
| 5,646 | | Federal Home Loan Mortgage Corp., Pool C25621, 6.50%, 5/1/2029 | 6,159 |
| 3,496 | | Federal Home Loan Mortgage Corp., Pool G10493, 6.00%, 4/1/2011 | 3,770 |
| 8,620 | | Federal National Mortgage Association, Pool 313324, 9.00%, 6/1/2017 | 9,644 |
| 10,243 | | Federal National Mortgage Association, Pool 323159, 7.50%, 4/1/2028 | 11,343 |
| 6,165 | | Federal National Mortgage Association, Pool 421223, 7.00%, 5/1/2028 | 6,831 |
| 6,285 | | Federal National Mortgage Association, Pool 429707, 6.50%, 5/1/2013 | 6,666 |
| 10,319 | | Federal National Mortgage Association, Pool 430232, 7.00%, 8/1/2028 | 11,435 |
| 39,681 | | Federal National Mortgage Association, Pool 439947, 6.50%, 11/1/2028 | 43,315 |
| 30,853 | | Federal National Mortgage Association, Pool 489867, 6.50%, 3/1/2029 | 33,679 |
| 7,570 | | Government National Mortgage Association, Pool 449491, 7.50%, 12/15/2027 | 8,354 |
| 3,088 | | Government National Mortgage Association, Pool 486467, 7.00%, 8/15/2028 | 3,400 |
Annual Shareholder Report25
|
| $14,209 | | Government National Mortgage Association, Pool 780339, 8.00%, 12/15/2023 | 15,743 |
| 9,318 | | Government National Mortgage Association, Pool 780340, 9.00%, 11/15/2017 | 10,396 |
| 8,480 | | Government National Mortgage Association, Pool 780373, 7.00%, 12/15/2023 | 9,303 |
| | TOTAL MORTGAGE-BACKED SECURITIES
(IDENTIFIED COST $187,022) | 203,735 |
| | Municipal – 0.2% | |
| | Municipal Services – 0.2% | |
| 2,080,000 | | Tampa, FL Sports Authority, 8.02% Bonds (GTD by National
Public Finance Guarantee Corporation), 10/1/2026
(IDENTIFIED COST $2,107,040) | 2,407,163 |
| | Governments/Agencies – 1.2% | |
| | Sovereign – 1.2% | |
| 3,500,000 | | Sweden, Government of, 10.25%, 11/1/2015 | 3,785,869 |
| 6,500,000 | | United Mexican States, 6.625%, 3/3/2015 | 7,374,250 |
| 1,871,000 | | United Mexican States, 6.75%, 9/27/2034 | 2,123,882 |
| | TOTAL GOVERNMENTS/AGENCIES
(IDENTIFIED COST $13,180,334) | 13,284,001 |
| | Common Stocks – 0.0% | |
| | Utility — Electric – 0.0% | |
| 113 | 3 | NRG Energy, Inc. (IDENTIFIED COST $2,554) | 2,705 |
| | Preferred Stocks – 0.4% | |
| | Financial Institution — Brokerage – 0.0% | |
| 130,000 | 3 | Lehman Brothers Holdings, Inc., Pfd. | 26,000 |
| | Financial Institution — REITs – 0.4% | |
| 80,000 | | Prologis, Cumulative REIT Perpetual Pfd. Stock, Series C,
$4.27, Annual Dividend | 3,740,000 |
| | TOTAL PREFERRED STOCKS
(IDENTIFIED COST $9,224,680) | 3,766,000 |
| | Asset-Backed Security – 0.0% | |
| | Home Equity Loan – 0.0% | |
| 137,340 | 1,2 | 125 Home Loan Owner Trust 1998-1A, Class B1, 9.76%, 2/15/2029
(IDENTIFIED COST $137,275) | 113,992 |
| | Collateralized Mortgage Obligations – 0.0% | |
| | Non-Agency Mortgage – 0.0% | |
| 47,856 | 1,2 | SMFC Trust Asset-Backed Certificates, 1997-A, Class 4, 4.542%, 1/28/2027 (IDENTIFIED COST $102,148) | 28,714 |
Annual Shareholder Report26
|
| | Mutual FundS – 30.7%;6 | |
| 54,857,192 | | High Yield Bond Portfolio | 337,371,730 |
| 5,811,651 | 7 | Prime Value Obligations Fund, Institutional Shares, 0.22% | 5,811,651 |
| | TOTAL MUTUAL FUNDS
(IDENTIFIED COST $422,714,102) | 343,183,381 |
| | TOTAL INVESTMENTS — 98.8%
(IDENTIFIED COST $1,172,813,715)8 | 1,104,325,978 |
| | OTHER ASSETS AND LIABILITIES - NET — 1.2%9 | 12,890,200 |
| | TOTAL NET ASSETS — 100% | $1,117,216,178 |
At November 30, 2009, the Fund had the following outstanding futures contracts:
| Description | Number of
Contracts | Notional
Value | Expiration
Date | Unrealized
Depreciation |
| 3U.S. Treasury Notes 10-Year Short Futures | 300 | $35,981,250 | March 2010 | $(502,150) |
Unrealized Depreciation on Futures Contracts is included in “Other Assets and Liabilities — Net.”
| 1 | Denotes a restricted security that either: (a) cannot be offered for public sale without first being registered, or being able to take advantage of an exemption from registration, under the Securities Act of 1933; or (b) is subject to a contractual restriction on public sales. At November 30, 2009, these restricted securities amounted to $126,861,439, which represented 11.4% of total net assets. |
| 2 | Denotes a restricted security that may be resold without restriction to “qualified institutional buyers” as defined in Rule 144A under the Securities Act of 1933 and that the Fund has determined to be liquid under criteria established by the Fund's Board of Directors (the “Directors”). At November 30, 2009, these liquid restricted securities amounted to $121,837,489, which represented 10.9% of total net assets. |
| 3 | Non-income producing security. |
| 4 | Issuer in default. |
| 5 | JPMorgan Chase & Co. has fully and unconditionally guaranteed Bear Stearns' outstanding registered debt securities. |
| 6 | Affiliated companies. |
| 7 | 7-Day net yield. |
| 8 | The cost of investments for federal tax purposes amounts to $1,176,766,766. |
| 9 | Assets, other than investments in securities, less liabilities. See Statement of Assets and Liabilities. |
Note: The categories of investments are shown as a percentage of total net assets at November 30, 2009.
Annual Shareholder Report27
Various inputs are used in determining the value of the Fund's investments. These inputs are summarized in the three broad levels listed below:Level 1 — quoted prices in active markets for identical securities
Level 2 — other significant observable inputs (including quoted prices for similar securities, interest rates, prepayment speeds, credit risk, etc.)
Level 3 — significant unobservable inputs (including the Fund's own assumptions in determining the fair value of investments)
The inputs or methodology used for valuing securities are not an indication of the risk associated with investing in those securities.
The following is a summary of the inputs used, as of November 30, 2009, in valuing the Fund's assets carried at fair value:
| Valuation Inputs | | | | |
| Level 1 —
Quoted
Prices and
Investments in
Mutual Funds | Level 2 —
Other
Significant
Observable
Inputs | Level 3 —
Significant
Unobservable
Inputs | Total |
| Debt Securities: | | | | |
| Corporate Bonds | $ — | $736,609,089 | $ — | $736,609,089 |
| Corporate Note | — | 4,727,198 | — | 4,727,198 |
| Mortgage-Backed Securities | — | 203,735 | — | 203,735 |
| Municipal | — | 2,407,163 | — | 2,407,163 |
| Governments/Agencies | — | 13,284,001 | — | 13,284,001 |
| Asset-Backed Security | — | 113,992 | — | 113,992 |
| Collateralized Mortgage Obligations | — | 28,714 | — | 28,714 |
| Equity Security: | | | | |
| Domestic | 3,768,705 | — | — | 3,768,705 |
| Mutual Funds | 343,183,381 | — | — | 343,183,381 |
| TOTAL SECURITIES | $346,952,086 | $757,373,892 | $ — | $1,104,325,978 |
| OTHER FINANCIAL INSTRUMENTS* | $(502,150) | $ — | $ — | $(502,150) |
| * | Other financial instruments include futures contracts. |
The following acronyms are used throughout this portfolio:
GTD — Guaranteed
REIT — Real Estate Investment Trust
See Notes which are an integral part of the Financial Statements
Annual Shareholder Report28
Statement of Assets and Liabilities
November 30, 2009
| Assets: | | |
| Total investments in securities, at value including $343,183,381 of investments in affiliated issuers (Note 5) (identified cost $1,172,813,715) | | $1,104,325,978 |
| Cash | | 1,579,259 |
| Restricted cash (Note 2) | | 540,000 |
| Income receivable | | 11,739,907 |
| Income receivable from affiliated issuers | | 2,504,705 |
| Receivable for shares sold | | 2,279,263 |
| TOTAL ASSETS | | 1,122,969,112 |
| Liabilities: | | |
| Payable for investments purchased | $2,833,963 | |
| Payable for shares redeemed | 1,458,613 | |
| Payable for daily variation margin | 18,750 | |
| Income distribution payable | 808,521 | |
| Payable for Directors'/Trustees' fees | 4,366 | |
| Payable for distribution services fee (Note 5) | 185,069 | |
| Payable for shareholder services fee (Note 5) | 218,526 | |
| Accrued expenses | 225,126 | |
| TOTAL LIABILITIES | | 5,752,934 |
| Net assets for 126,741,834 shares outstanding | | $1,117,216,178 |
| Net Assets Consist of: | | |
| Paid-in capital | | $1,217,168,903 |
| Net unrealized depreciation of investments and futures contracts | | (68,989,887) |
| Accumulated net realized loss on investments, futures contracts and swap contracts | | (30,804,667) |
| Distributions in excess of net investment income | | (158,171) |
| TOTAL NET ASSETS | | $1,117,216,178 |
Annual Shareholder Report29
Statement of Assets and Liabilities — continued| Net Asset Value, Offering Price and Redemption Proceeds Per Share | | |
| Class A Shares: | | |
| Net asset value per share ($628,675,038 ÷ 71,469,422 shares outstanding), no par value, 500,000,000 shares authorized | | $8.80 |
| Offering price per share (100/95.50 of $8.80) | | $9.21 |
| Redemption proceeds per share | | $8.80 |
| Class B Shares: | | |
| Net asset value per share ($155,906,548 ÷ 17,648,013 shares outstanding), no par value, 500,000,000 shares authorized | | $8.83 |
| Offering price per share | | $8.83 |
| Redemption proceeds per share (94.50/100 of $8.83) | | $8.34 |
| Class C Shares: | | |
| Net asset value per share ($146,219,708 ÷ 16,548,554 shares outstanding), no par value, 500,000,000 shares authorized | | $8.84 |
| Offering price per share | | $8.84 |
| Redemption proceeds per share (99.00/100 of $8.84) | | $8.75 |
| Class F Shares: | | |
| Net asset value per share ($178,466,476 ÷ 20,172,143 shares outstanding), no par value, 500,000,000 shares authorized | | $8.85 |
| Offering price per share (100/99.00 of $8.85) | | $8.94 |
| Redemption proceeds per share (99.00/100 of $8.85) | | $8.76 |
| Institutional Shares: | | |
| Net asset value per share ($7,948,408 ÷ 903,702 shares outstanding), no par value, 500,000,000 shares authorized | | $8.80 |
| Offering price per share | | $8.80 |
| Redemption proceeds per share | | $8.80 |
See Notes which are an integral part of the Financial Statements
Annual Shareholder Report30
Statement of Operations
Year Ended November 30, 2009
| Investment Income: | | | |
| Interest (including income on securities loaned of $17,877) | | | $44,236,457 |
| Dividends (including $27,001,643 received from affiliated issuers (Note 5)) | | | 27,169,881 |
| TOTAL INCOME | | | 71,406,338 |
| Expenses: | | | |
| Investment adviser fee (Note 5) | | $7,240,538 | |
| Administrative personnel and services fee (Note 5) | | 749,074 | |
| Custodian fees | | 40,595 | |
| Transfer and dividend disbursing agent fees and expenses | | 1,181,711 | |
| Directors'/Trustees' fees | | 19,604 | |
| Auditing fees | | 25,399 | |
| Legal fees | | 10,715 | |
| Portfolio accounting fees | | 188,517 | |
| Distribution services fee — Class B Shares (Note 5) | | 1,165,545 | |
| Distribution services fee — Class C Shares (Note 5) | | 866,225 | |
| Shareholder services fee — Class A Shares (Note 5) | | 1,132,236 | |
| Shareholder services fee — Class B Shares (Note 5) | | 388,515 | |
| Shareholder services fee — Class C Shares (Note 5) | | 283,145 | |
| Shareholder services fee — Class F Shares (Note 5) | | 370,247 | |
| Account administration fee — Class A Shares | | 1,771 | |
| Account administration fee — Class C Shares | | 4,284 | |
| Account administration fee — Class F Shares | | 2,538 | |
| Share registration costs | | 113,555 | |
| Printing and postage | | 118,647 | |
| Insurance premiums | | 5,294 | |
| Taxes | | 73,730 | |
| Miscellaneous | | 14,460 | |
| TOTAL EXPENSES | | 13,996,345 | |
Annual Shareholder Report31
Statement of Operations — continued| Waivers and Reimbursements (Note 5): | | | |
| Waiver/reimbursement of investment adviser fee | $(2,093,656) | | |
| Waiver of administrative personnel and services fee | (14,401) | | |
Reimbursement of shareholder services fee —
Class A Shares | (51,753) | | |
Reimbursement of shareholder services fee —
Class F Shares | (27,562) | | |
| TOTAL WAIVERS AND REIMBURSEMENTS | | $(2,187,372) | |
| Net expenses | | | $11,808,973 |
| Net investment income | | | 59,597,365 |
| Realized and Unrealized Gain on Investments, Futures Contracts and Swap Contracts: | | | |
| Net realized gain on investments (including realized gain of $439,560 on sales of investments in affiliated issuers) (Note 5) | | | 2,580,206 |
| Net realized loss on futures contracts | | | (931,048) |
| Net realized loss on swap contracts | | | (422,715) |
| Net change in unrealized depreciation of investments | | | 213,245,485 |
| Net change in unrealized appreciation of futures contracts | | | (1,310,153) |
| Net change in unrealized appreciation of swap contracts | | | (990,444) |
| Net realized and unrealized gain on investments, futures contracts and swap contracts | | | 212,171,331 |
| Change in net assets resulting from operations | | | $271,768,696 |
See Notes which are an integral part of the Financial Statements
Annual Shareholder Report32
Statement of Changes in Net Assets
| Year Ended November 30 | 2009 | 2008 |
| Increase (Decrease) in Net Assets | | |
| Operations: | | |
| Net investment income | $59,597,365 | $57,533,357 |
| Net realized gain on investments, futures contracts and swap contracts | 1,226,443 | 2,404,369 |
| Net change in unrealized appreciation/depreciation of investments, futures contracts and swap contracts | 210,944,888 | (217,251,002) |
| CHANGE IN NET ASSETS RESULTING FROM OPERATIONS | 271,768,696 | (157,313,276) |
| Distributions to Shareholders: | | |
| Distributions from net investment income | | |
| Class A Shares | (36,488,310) | (33,491,533) |
| Class B Shares | (9,277,951) | (10,432,404) |
| Class C Shares | (6,764,502) | (5,087,165) |
| Class F Shares | (10,018,945) | (9,204,919) |
| Institutional Shares | (199,857) | (11,838) |
| CHANGE IN NET ASSETS RESULTING FROM DISTRIBUTIONS TO SHAREHOLDERS | (62,749,565) | (58,227,859) |
| Share Transactions: | | |
| Proceeds from sale of shares | 303,446,367 | 230,394,578 |
| Net asset value of shares issued to shareholders in payment of distributions declared | 51,705,234 | 46,790,712 |
| Cost of shares redeemed | (269,128,587) | (321,174,417) |
| CHANGE IN NET ASSETS RESULTING FROM SHARE TRANSACTIONS | 86,023,014 | (43,989,127) |
| Change in net assets | 295,042,145 | (259,530,262) |
| Net Assets: | | |
| Beginning of period | 822,174,033 | 1,081,704,295 |
| End of period (including undistributed (distributions in excess of) net investment income of $(158,171) and $1,988,768, respectively) | $1,117,216,178 | $822,174,033 |
See Notes which are an integral part of the Financial Statements
Annual Shareholder Report33
Notes to Financial Statements
November 30, 2009
1. ORGANIZATION
Federated Investment Series Funds, Inc. (the “Corporation”) is registered under the Investment Company Act of 1940, as amended (the “Act”), as an open-end management investment company. The Corporation consists of one diversified portfolio, Federated Bond Fund (the “Fund”). The Fund offers five classes of shares: Class A Shares, Class B Shares, Class C Shares, Class F Shares and Institutional Shares. All shares of the Fund have equal rights with respect to voting, except on class-specific matters. The financial highlights of the Institutional Shares are presented separately. The investment objective of the Fund is to provide a high level of current income as is consistent with the preservation of capital.
Effective January 28, 2008, the Fund began offering Institutional Shares.
2. SIGNIFICANT ACCOUNTING POLICIES
The following is a summary of significant accounting policies consistently followed by the Fund in the preparation of its financial statements. These policies are in conformity with U.S. generally accepted accounting principles (GAAP).
Investment Valuation
In calculating its net asset value (NAV), the Fund generally values investments as follows:
- Fixed-income securities acquired with remaining maturities greater than 60 days are fair valued using price evaluations provided by a pricing service approved by the Directors.
- Fixed-income securities acquired with remaining maturities of 60 days or less are valued at their cost (adjusted for the accretion of any discount or amortization of any premium).
- Shares of other mutual funds are valued based upon their reported NAVs.
- Equity securities listed on an exchange or traded through a regulated market system are valued at their last reported sale price or official closing price in their principal exchange or market.
- Derivative contracts listed on exchanges are valued at their reported settlement or closing price.
- Over-the-counter (OTC) derivative contracts are fair valued using price evaluations provided by a pricing service approved by the Directors.
If the Fund cannot obtain a price or price evaluation from a pricing service for an investment, the Fund may attempt to value the investment based upon the mean of bid and asked quotations or fair value the investment based on price evaluations, from one or more dealers. If any price, quotation, price evaluation or other pricing source is not readily available when the NAV is calculated, the Fund uses the fair value of the investment determined in accordance with the procedures described below. There can be no assurance that the Fund could purchase or sell an investment at the price used to calculate the Fund's NAV.
Fair Valuation and Significant Events Procedures
The Directors have authorized the use of pricing services to provide evaluations of the current fair value of certain investments for purposes of calculating the NAV. Factors considered by pricing services in evaluating an investment include the yields or prices of investments of comparable quality, coupon, maturity, call rights and other potential prepayments, terms and type, reported transactions, indications as to values from dealers, and general market conditions. Some pricing services provide a single price evaluation reflecting the bid-side of the market for an investment (a “bid” evaluation). Other pricing services offer both bid Annual Shareholder Report34
evaluations and price evaluations indicative of a price between the prices bid and asked for the investment (a “mid” evaluation). The Fund normally uses bid evaluations for U.S. Treasury and Agency securities, mortgage-backed securities and municipal securities. The Fund normally uses mid evaluations for other types of fixed-income securities and OTC derivative contracts. In the event that market quotations and price evaluations are not available for an investment, the fair value of the investment is determined in accordance with procedures adopted by the Directors.The Directors also have adopted procedures requiring an investment to be priced at its fair value whenever the Adviser determines that a significant event affecting the value of the investment has occurred between the time as of which the price of the investment would otherwise be determined and the time as of which the NAV is computed. An event is considered significant if there is both an affirmative expectation that the investment's value will change in response to the event and a reasonable basis for quantifying the resulting change in value. Examples of significant events that may occur after the close of the principal market on which a security is traded, or after the time of a price evaluation provided by a pricing service or a dealer, include:
- With respect to securities traded in foreign markets, significant trends in U.S. equity markets or in the trading of foreign securities index futures or options contracts;
- With respect to price evaluations of fixed-income securities determined before the close of regular trading on the NYSE, actions by the Federal Reserve Open Market Committee and other significant trends in U.S. fixed-income markets;
- Political or other developments affecting the economy or markets in which an issuer conducts its operations or its securities are traded; and
- Announcements concerning matters such as acquisitions, recapitalizations, litigation developments, a natural disaster affecting the issuer's operations or regulatory changes or market developments affecting the issuer's industry.
The Directors have approved the use of a pricing service to determine the fair value of equity securities traded principally in foreign markets when the Adviser determines that there has been a significant trend in the U.S. equity markets or in index futures trading. For other significant events, the Fund may seek to obtain more current quotations or price evaluations from alternative pricing sources. If a reliable alternative pricing source is not available, the Fund will determine the fair value of the investment using another method approved by the Directors.
Repurchase Agreements
It is the policy of the Fund to require the other party to a repurchase agreement to transfer to the Fund's custodian or sub-custodian eligible securities or cash with a market value (after transaction costs) at least equal to the repurchase price to be paid under the repurchase agreement. The eligible securities are transferred to accounts with the custodian or sub-custodian in which the Fund holds a “securities entitlement” and exercises “control” as those terms are defined in the Uniform Commercial Code. The Fund has established procedures for monitoring the market value of the transferred securities and requiring the transfer of additional eligible securities if necessary to equal at least the repurchase price. These procedures also allow the other party to require securities to be transferred from the account to the extent that their market value exceeds the repurchase price or in exchange for other eligible securities of equivalent market value.
Annual Shareholder Report35
With respect to agreements to repurchase U.S. government securities and cash items, the Fund treats the repurchase agreement as an investment in the underlying securities and not as an obligation of the other party to the repurchase agreement. Other repurchase agreements are treated as obligations of the other party secured by the underlying securities. Nevertheless, the insolvency of the other party or other failure to repurchase the securities may delay the disposition of the underlying securities or cause the Fund to receive less than the full repurchase price. Under the terms of the repurchase agreement, any amounts received by the Fund in excess of the repurchase price and related transaction costs must be remitted to the other party.The Fund may enter into repurchase agreements in which eligible securities are transferred into joint trading accounts maintained by the custodian or sub-custodian for investment companies and other clients advised by the Fund's Adviser and its affiliates. The Fund will participate on a pro rata basis with the other investment companies and clients in its share of the securities transferred under such repurchase agreements and in its share of proceeds from any repurchase or other disposition of such securities.
Investment Income, Gains and Losses, Expenses and Distributions
Investment transactions are accounted for on a trade-date basis. Realized gains and losses from investment transactions are recorded on an identified-cost basis. Interest income and expenses are accrued daily. Dividend income and distributions to shareholders are recorded on the ex-dividend date. Foreign dividends are recorded on the ex-dividend date or when the Fund is informed of the ex-dividend date. Distributions of net investment income are declared and paid monthly. Non-cash dividends included in dividend income, if any, are recorded at fair value. Investment income, realized and unrealized gains and losses and certain fund-level expenses are allocated to each class based on relative average daily net assets, except that each class may bear certain expenses unique to that class such as account administration, distribution services and shareholder services fees. Dividends are declared separately for each class. No class has preferential dividend rights; differences in per share dividend rates are generally due to differences in separate class expenses.
Premium and Discount Amortization/Paydown Gains and Losses
All premiums and discounts on fixed-income securities are amortized/accreted for financial statement purposes. Gains and losses realized on principal payment of mortgage-backed securities (paydown gains and losses) are classified as part of investment income.
Federal Taxes
It is the Fund's policy to comply with the Subchapter M provision of the Internal Revenue Code (the “Code”) and to distribute to shareholders each year substantially all of its income. Accordingly, no provision for federal income tax is necessary. As of and during the year ended November 30, 2009, the Fund did not have a liability for any uncertain tax positions. The Fund recognizes interest and penalties, if any, related to tax liabilities as income tax expense in the Statement of Operations. As of November 30, 2009, tax years 2006 through 2009 remain subject to examination by the Fund's major tax jurisdictions, which include the United States of America, the state of Maryland and the Commonwealth of Pennsylvania.
Other Taxes
As an open-end management investment company incorporated in the state of Maryland but domiciled in the Commonwealth of Pennsylvania, the Fund is subject to the Pennsylvania Franchise Tax. This franchise tax is assessed annually on the value of the Fund, as represented by average net assets for the tax year.
Annual Shareholder Report36
When-Issued and Delayed Delivery TransactionsThe Fund may engage in when-issued or delayed delivery transactions. The Fund records when-issued securities on the trade date and maintains security positions such that sufficient liquid assets will be available to make payment for the securities purchased. Securities purchased on a when-issued or delayed delivery basis are marked to market daily and begin earning interest on the settlement date. Losses may occur on these transactions due to changes in market conditions or the failure of counterparties to perform under the contract.
Swap Contracts
Swap contracts involve two parties that agree to exchange the returns (or the differential in rates of return) earned or realized on particular predetermined investments, instruments, indices or other measures. The gross returns to be exchanged or “swapped” between parties are generally calculated with respect to a “notional amount” for a predetermined period of time. The Fund may enter into interest rate, total return, credit default, and other swap agreements. Risks may arise upon entering into swap agreements from the potential inability of the counterparties to meet the terms of their contract from unanticipated changes in the value of the swap agreement.
The Fund uses credit default swaps to manage exposure to a given issuer or sector by either selling protection to increase exposure, or buying protection to reduce exposure. The “buyer” in a credit default swap is obligated to pay the “seller” a periodic stream of payments over the term of the contract provided that no event of default on an underlying reference obligation has occurred. If an event of default occurs, the seller must pay the buyer the full notional value, or the “par value,” of the reference obligation in exchange for the reference obligation. In connection with these agreements, securities may be identified as collateral in accordance with the terms of the respective swap agreements to provide assets of value and recourse in the event of default or bankruptcy/insolvency. Recovery values are assumed by market makers considering either industry standard recovery rates or entity specific factors and considerations until a credit event occurs. If a credit event has occurred, the recovery value is typically determined by a facilitated auction whereby a minimum number of allowable broker bids, together with a specific valuation method, are used to calculate the settlement value.The maximum amount of the payment that may occur, as a result of a credit event payable by the protection seller, is equal to the notional amount of the underlying index or security.
The Fund's maximum risk of loss from counterparty credit risk, either as the protection buyer or as the protection seller, is the fair value of the contract. This risk is mitigated by having a master netting arrangement between the Fund and the counterparty and by the posting of collateral by the counterparty to the Fund to cover the Fund's exposure to the counterparty.
Upfront payments received or paid by the Fund will be reflected as an asset or liability on the Statement of Assets and Liabilities. Changes in the value of swap contracts are included in Swaps, at value on the Statement of Assets and Liabilities, and periodic payments are reported as Net realized gain or loss on swap contracts in the Statement of Operations.
At November 30, 2009, the Fund had no outstanding swap contracts.
Annual Shareholder Report37
Futures ContractsThe Fund purchases and sells financial futures contracts to manage cash flows, enhance yield and to potentially reduce transaction costs. Upon entering into a financial futures contract with a broker, the Fund is required to deposit in a segregated account a specified amount of cash or U.S. government securities which is shown as Restricted Cash in the Statement of Assets and Liabilities. Futures contracts are valued daily and unrealized gains or losses are recorded in a “variation margin” account. Daily, the Fund receives from or pays to the broker a specified amount of cash based upon changes in the variation margin account. When a contract is closed, the Fund recognizes a realized gain or loss. Futures contracts have market risks, including the risk that the change in the value of the contract may not correlate with the changes in the value of the underlying securities. There is minimal counterparty risk to the Fund since futures are exchange traded and the exchange's clearinghouse, as counterparty to all exchange traded futures, guarantees the futures against default.
Futures contracts outstanding at period end are listed after the Fund's Portfolio of Investments.
Securities Lending
The Fund participates in a securities lending program providing for the lending of corporate bonds and government securities to qualified brokers. The Fund normally receives cash collateral for securities loaned that is invested in an affiliated money market fund. Collateral is maintained at a minimum level of 100% of the market value of investments loaned, plus interest, if applicable. Earnings on collateral are allocated between the securities lending agent, as a fee for its services under the program, and the Fund, according to agreed-upon rates.
As of November 30, 2009, the Fund had no outstanding securities on loan.
Restricted Securities
The Fund may purchase securities which are considered restricted. Restricted securities are securities that either: (a) cannot be offered for public sale without first being registered, or being able to take advantage of an exemption from registration, under the Securities Act of 1933; or (b) are subject to contractual restrictions on public sales. In some cases, when a security cannot be offered for public sale without first being registered, the issuer of the restricted security has agreed to register such securities for resale, at the issuer's expense, either upon demand by the Fund or in connection with another registered offering of the securities. Many such restricted securities may be resold in the secondary market in transactions exempt from registration. Restricted securities may be determined to be liquid under criteria established by the Directors. The Fund will not incur any registration costs upon such resales. The Fund's restricted securities are valued at the price provided by dealers in the secondary market or, if no market prices are available, at the fair value as determined in accordance with procedures established by and under the general supervision of the Directors.
Additional information on restricted securities, excluding securities purchased under Rule 144A, if applicable, that have been deemed liquid by the Directors, held at November 30, 2009, is as follows:
Annual Shareholder Report38
| Security | Acquisition Date | Acquisition Cost | Market Value |
| Fertinitro Finance, Company Guarantee, 8.29%, 4/1/2020 | 5/14/1999 | $1,443,791 | $1,311,000 |
| Union Central Life Insurance Co., Note, 8.20%, 11/1/2026 | 10/31/1996 — 3/31/1999 | $4,048,581 | $3,712,950 |
Additional Disclosure Related to Derivative Instruments
| Fair Value of Derivative Instruments |
| Asset | Liability |
| Year Ended | Statement of
Assets and
Liabilities
Location | Fair
Value | Statement of
Assets and
Liabilities
Location | Fair
Value |
| Derivatives not accounted for as hedging instruments under ASC Topic 815 | | | | |
| Interest rate contracts | $ — | $ — | Payable for daily variation margin | $502,150* |
| * | Includes cumulative appreciation/depreciation of futures contracts as reported in the footnotes to the Portfolio of Investments. Only the current day's variation margin is reported within the Statement of Assets and Liabilities. |
The Effect of Derivative Instruments on the Statement of Operations for the Year Ended November 30, 2009
| Amount of Realized Gain or (Loss) on Derivatives Recognized in Income |
| Credit
Default
Swaps | Futures | Total |
| Interest rate contracts | $ — | $(931,048) | $(931,048) |
| Credit contracts | $(422,715) | $ — | $(422,715) |
| TOTAL | $(422,715) | $(931,048) | $(1,353,763) |
Change in Unrealized Appreciation or (Depreciation) on Derivatives
Recognized in Income |
| Credit
Default
Swaps | Futures | Total |
| Interest rate contracts | $ — | $(1,310,153) | $(1,310,153) |
| Credit contracts | $(990,444) | $ — | $(990,444) |
| TOTAL | $(990,444) | $(1,310,153) | $(2,300,597) |
Other
The preparation of financial statements in conformity with GAAP requires management to make estimates and assumptions that affect the amounts of assets, liabilities, expenses and revenues reported in the financial statements. Actual results could differ from those estimated.
Annual Shareholder Report39
3. shares of beneficial interestThe following tables summarize capital stock activity:
| Year Ended November 30 | 2009 | 2008 |
| Class A Shares: | Shares | Amount | Shares | Amount |
| Shares sold | 22,949,487 | $179,956,178 | 18,152,769 | $155,216,873 |
| Shares issued to shareholders in payment of distributions declared | 3,956,959 | 31,203,068 | 3,348,264 | 27,745,544 |
| Shares redeemed | (20,038,063) | (156,745,929) | (21,570,297) | (179,522,982) |
NET CHANGE RESULTING
FROM CLASS A SHARE TRANSACTIONS | 6,868,383 | $54,413,317 | (69,264) | $3,439,435 |
| Year Ended November 30 | 2009 | 2008 |
| Class B Shares: | Shares | Amount | Shares | Amount |
| Shares sold | 2,115,652 | $16,694,977 | 2,376,504 | $20,222,630 |
| Shares issued to shareholders in payment of distributions declared | 982,901 | 7,732,332 | 1,013,160 | 8,452,440 |
| Shares redeemed | (7,044,251) | (55,706,302) | (8,347,211) | (69,982,417) |
NET CHANGE RESULTING
FROM CLASS B SHARE TRANSACTIONS | (3,945,698) | $(31,278,993) | (4,957,547) | $(41,307,347) |
| Year Ended November 30 | 2009 | 2008 |
| Class C Shares: | Shares | Amount | Shares | Amount |
| Shares sold | 7,558,907 | $59,584,453 | 3,539,802 | $29,931,524 |
| Shares issued to shareholders in payment of distributions declared | 565,347 | 4,499,185 | 390,595 | 3,239,427 |
| Shares redeemed | (3,490,897) | (27,688,050) | (3,424,887) | (28,682,566) |
NET CHANGE RESULTING
FROM CLASS C SHARE TRANSACTIONS | 4,633,357 | $36,395,588 | 505,510 | $4,488,385 |
| Year Ended November 30 | 2009 | 2008 |
| Class F Shares: | Shares | Amount | Shares | Amount |
| Shares sold | 4,921,060 | $39,389,184 | 2,855,111 | $24,661,323 |
| Shares issued to shareholders in payment of distributions declared | 1,019,023 | 8,092,364 | 880,587 | 7,341,583 |
| Shares redeemed | (3,537,719) | (28,079,360) | (5,098,851) | (42,947,379) |
NET CHANGE RESULTING
FROM CLASS F SHARE TRANSACTIONS | 2,402,364 | $19,402,188 | (1,363,153) | $(10,944,473) |
Annual Shareholder Report40
| Year Ended November 30 | 2009 | 20081 |
| Institutional Shares: | Shares | Amount | Shares | Amount |
| Shares sold | 954,358 | $7,821,575 | 41,949 | $362,228 |
| Shares issued to shareholders in payment of distributions declared | 21,208 | 178,285 | 1,462 | 11,718 |
| Shares redeemed | (110,624) | (908,946) | (4,651) | (39,073) |
NET CHANGE RESULTING
FROM INSTITUTIONAL SHARE TRANSACTIONS | 864,942 | $7,090,914 | 38,760 | $334,873 |
| NET CHANGE RESULTING FROM FUND SHARE TRANSACTIONS | 10,823,348 | $86,023,014 | (5,845,694) | $(43,989,127) |
| 1 | Reflects operations from January 28, 2008 (date of initial investment) to November 30, 2008. |
4. FEDERAL TAX INFORMATION
The timing and character of income and capital gain distributions are determined in accordance with income tax regulations, which may differ from GAAP. These differences are the result of differing treatments for discount accretion/premium amortization on debt securities, swap income, reclassification of credit default swaps and litigation settlement payments.
For the year ended November 30, 2009, permanent differences identified and reclassified among the components of net assets were as follows:
| Increase (Decrease) |
| Paid-In Capital | Undistributed
Net Investment
Income (Loss) | Accumulated
Net Realized
Gain (Loss) |
| $(78,804) | $1,005,261 | $(926,457) |
Net investment income (loss), net realized gains (losses), and net assets were not affected by this reclassification.
The tax character of distributions as reported on the Statement of Changes in Net Assets for the years ended November 30, 2009 and 2008, was as follows:
| 2009 | 2008 |
| Ordinary income | $62,749,565 | $58,227,859 |
As of November 30, 2009, the components of distributable earnings on a tax basis were as follows:
| Distributions in excess of ordinary income | $(143,004) |
| Net unrealized depreciation | $(72,440,788) |
| Capital loss carryforwards | $(27,368,933) |
The difference between book-basis and tax-basis net unrealized appreciation/depreciation is attributable in part to differing treatments for the deferral of losses on wash sales, defaulted bond interest and discount accretion/premium amortization on debt securities.
Annual Shareholder Report41
At November 30, 2009, the cost of investments for federal tax purposes was $1,176,766,766. The net unrealized depreciation of investments for federal tax purposes excluding any unrealized depreciation resulting from futures contracts was $72,440,788. This consists of net unrealized appreciation from investments for those securities having an excess of value over cost of $42,666,261 and net unrealized depreciation from investments for those securities having an excess of cost over value of $115,107,049.At November 30, 2009, the Fund had a capital loss carryforward of $27,368,933 which will reduce the Fund's taxable income arising from future net realized gains on investments, if any, to the extent permitted by the Code and thus will reduce the amount of distributions to shareholders which would otherwise be necessary to relieve the Fund of any liability for federal income tax. Pursuant to the Code, such capital loss carryforward will expire as follows:
| Expiration Year | Expiration Amount |
| 2010 | $15,739,984 |
| 2011 | $2,824,073 |
| 2014 | $5,262,184 |
| 2017 | $3,542,692 |
5. INVESTMENT ADVISER FEE AND OTHER TRANSACTIONS WITH AFFILIATES
Investment Adviser Fee
Federated Investment Management Company is the Fund's investment adviser (the “Adviser”). The advisory agreement between the Fund and the Adviser provides for an annual fee equal to 0.75% of the Fund's average daily net assets. Subject to the terms described in the Expense Limitation note, the Adviser may voluntarily choose to waive any portion of its fee. The Adviser can modify or terminate this voluntary waiver at any time at its sole discretion. For the year ended November 30, 2009, the Adviser waived $2,086,372 of its fee.
Pursuant to a settlement with the New York Attorney General, the Adviser has agreed to waive investment adviser fees in compliance with an Assurance of Discontinuance dated November 17, 2005. The net adviser fee was reduced to 0.5557% effective January 1, 2006 and may not be increased until after December 31, 2010.
Administrative Fee
Federated Administrative Services (FAS), under the Administrative Services Agreement, provides the Fund with administrative personnel and services. The fee paid to FAS is based on the average aggregate daily net assets of certain Federated funds as specified below:
| Administrative Fee | Average Aggregate Daily Net Assets
of the Federated Funds |
| 0.150% | on the first $5 billion |
| 0.125% | on the next $5 billion |
| 0.100% | on the next $10 billion |
| 0.075% | on assets in excess of $20 billion |
Annual Shareholder Report42
The administrative fee received during any fiscal year shall be at least $150,000 per portfolio and $40,000 per each additional class of Shares. Subject to the terms described in the Expense Limitation note, FAS may voluntarily choose to waive any portion of its fee. FAS can modify or terminate this voluntary waiver at any time at its sole discretion. For the year ended
November 30, 2009, the net fee paid to FAS was 0.076% of average daily net assets of the Fund. FAS waived $14,401 of its fee.
Distribution Services Fee
The Fund has adopted a Distribution Plan (the “Plan”) pursuant to Rule 12b-1 under the Act. Under the terms of the Plan, the Fund will compensate Federated Securities Corp. (FSC), the principal distributor, from the daily net assets of the Fund's Class A Shares, Class B Shares and Class C Shares to finance activities intended to result in the sale of these shares. The Plan provides that the Fund may incur distribution expenses at the following percentages of average daily net assets annually, to compensate FSC:
| Share Class Name | Percentage of Average Daily
Net Assets of Class |
| Class A Shares | 0.05% |
| Class B Shares | 0.75% |
| Class C Shares | 0.75% |
Subject to the terms described in the Expense Limitation note, FSC may voluntarily choose to waive any portion of its fee. FSC can modify or terminate this voluntary waiver at any time at its sole discretion. When FSC receives fees, it may pay some or all of them to financial intermediaries whose customers purchase shares. For the year ended November 30, 2009, FSC retained $232,782 of fees paid by the Fund. On November 15, 2007, the Fund's Directors approved an amendment to the Plan to reduce the distribution services fee for the Fund's Class A Shares from 0.25% to 0.05%. The amendment to the Plan became effective for the Fund on January 31, 2008. For the year ended November 30, 2009, the Fund's Class A Shares did not incur a distribution services fee; however, it may begin to incur this fee upon approval of the Directors.
Sales Charges
Front-end sales charges and contingent deferred sales charges (CDSC) do not represent expenses of the Fund. They are deducted from the proceeds of sales of Fund shares prior to investment or from redemption proceeds prior to remittance, as applicable. For the year ended November 30, 2009, FSC retained $158,339 in sales charges from the sale of Class A Shares. FSC also retained $5,782 relating to redemptions of Class C Shares and $3,435 relating to redemptions of Class F Shares.
Shareholder Services Fee
The Fund may pay fees (Service Fees) up to 0.25% of the average daily net assets of the Fund's Class A Shares, Class B Shares, Class C Shares and Class F Shares to financial intermediaries or to Federated Shareholder Services Company (FSSC) for providing services to shareholders and maintaining shareholder accounts. Subject to the terms described in the Expense Limitation note, FSSC may voluntarily reimburse the Fund for shareholder services fees. This voluntary reimbursement can be modified or terminated at any time. For the year ended November 30, 2009, FSSC voluntarily reimbursed $79,315 of shareholder services fees. For the year ended November 30, 2009, FSSC did not receive any fees paid by the Fund.
Annual Shareholder Report43
Expense LimitationThe Adviser and its affiliates (which may include FSC, FAS and FSSC) have voluntarily agreed to waive their fees and/or reimburse expenses so that the total operating expenses (as shown in the financial highlights) paid by the Fund's Class A Shares, Class B Shares, Class C Shares, Class F Shares and Institutional Shares (after the voluntary waivers and reimbursements) will not exceed 0.99%, 1.79%, 1.79%, 1.02% and 0.79%, respectively, through the later of (the “Termination Date”): (a) January 31, 2011; or (b) the date of the Fund's next effective Prospectus. While the Adviser and affiliates currently do not anticipate terminating these arrangements prior to the Termination Date, these arrangements may only be terminated prior to the Termination Date with the agreement of the Directors.
General
Certain Officers and Directors of the Fund are Officers and Directors or Trustees of the above companies.
Transactions with Affiliated Companies
Affiliated holdings are mutual funds which are managed by the Adviser or an affiliate of the Adviser. The Adviser has agreed to reimburse the Fund for certain investment adviser fees as a result of transactions in other affiliated mutual funds. For the year ended November 30, 2009, the Adviser reimbursed $7,284. Transactions with affiliated companies during the year ended November 30, 2009 were as follows:
| Affiliates | Balance of
Shares Held
11/30/2008 | Purchases/
Additions | Sales/
Reductions | Balance of
Shares Held
11/30/2009 | Value | Dividend
Income
|
| High Yield Bond Portfolio | 41,524,332 | 13,699,160 | 366,300 | 54,857,192 | $337,371,730 | $26,956,158 |
| Prime Value Obligations Fund, Institutional Shares | — | 227,992,398 | 222,180,747 | 5,811,651 | 5,811,651 | 45,485 |
TOTAL OF AFFILIATED
TRANSACTIONS | 41,524,332 | 241,691,558 | 222,547,047 | 60,668,843 | $343,183,381 | $27,001,643 |
Pursuant to an Exemptive Order issued by the Securities and Exchange Commission (SEC), the Fund may invest in portfolios of Federated Core Trust (Core Trust), which is managed by Federated Investment Management Company, the Fund's adviser. Core Trust is an open-end management company, registered under the Act, available only to registered investment companies and other institutional investors. The investment objective of High Yield Bond Portfolio, a portfolio of Core Trust, is to seek high current income. Federated Investors, Inc. receives no advisory or administrative fees from the Funds within the Core Trust. Income distributions from Core Trust are declared daily and paid monthly, and are recorded by the Fund as dividend income. Capital gain distributions, if any, from Core Trust are declared and paid annually, and are recorded by the Fund as capital gains. The performance of the Fund is directly affected by the performance of the Core Trust. A copy of the Core Trust's financial statements is available on the EDGAR Database on the SEC's website or upon request from the Fund.
Annual Shareholder Report44
6. Investment TRANSACTIONSPurchases and sales of investments, excluding long-term U.S. government securities and short-term obligations, for the year ended November 30, 2009, were as follows:
| Purchases | $307,560,505 |
| Sales | $237,549,853 |
7. LINE OF CREDIT
The Fund participates in a $100,000,000 unsecured, uncommitted revolving line of credit (LOC) agreement with PNC Bank. The LOC was made available for extraordinary or emergency purposes, primarily for financing redemption payments. Borrowings are charged interest at a rate offered to the Fund by PNC Bank at the time of the borrowing. As of November 30, 2009, there were no outstanding loans. During the year ended November 30, 2009, the Fund did not utilize the LOC.
8. INTERFUND LENDING
Pursuant to an Exemptive Order issued by the SEC, the Fund, along with other funds advised by subsidiaries of Federated Investors, Inc., may participate in an interfund lending program. This program provides an alternative credit facility allowing the Fund to borrow from other participating affiliated funds. As of November 30, 2009, there were no outstanding loans. During the year ended November 30, 2009, the program was not utilized.
9. Legal Proceedings
Since October 2003, Federated Investors, Inc. and related entities (collectively, “Federated”), and various Federated funds (Federated Funds) have been named as defendants in several class action lawsuits now pending in the United States District Court for the District of Maryland. The lawsuits were purportedly filed on behalf of people who purchased, owned and/or redeemed shares of Federated-sponsored mutual funds during specified periods beginning November 1, 1998. The suits are generally similar in alleging that Federated engaged in illegal and improper trading practices including market timing and late trading in concert with certain institutional traders, which allegedly caused financial injury to the mutual fund shareholders. These lawsuits began to be filed shortly after Federated's first public announcement that it had received requests for information on shareholder trading activities in the Federated Funds from the SEC, the Office of the New York State Attorney General (NYAG), and other authorities. In that regard, on November 28, 2005, Federated announced that it had reached final settlements with the SEC and the NYAG with respect to those matters. As Federated previously reported in 2004, it has already paid approximately $8.0 million to certain funds as determined by an independent consultant. As part of these settlements, Federated agreed to pay for the benefit of fund shareholders additional disgorgement and a civil money penalty in the aggregate amount of an additional $72 million. Federated entities have also been named as defendants in several additional lawsuits that are now pending in the United States District Court for the Western District of Pennsylvania, alleging, among other things, excessive advisory and Rule 12b-1 fees. The Board of the Federated Funds retained the law firm of Dickstein Shapiro LLP to represent the Federated Funds in these lawsuits. Federated and the Federated Funds, and their respective counsel have been defending this litigation, and none of the Federated Funds remains a defendant in any of the lawsuits (though some could potentially receive any recoveries as nominal defendants). Additional lawsuits based upon similar allegations may be filed in the future. The potential impact of these Annual Shareholder Report45
lawsuits, all of which seek unquantified damages, attorneys' fees and expenses, and future potential similar suits is uncertain. Although we do not believe that these lawsuits will have a material adverse effect on the Federated Funds, there can be no assurance that these suits, the ongoing adverse publicity and/or other developments resulting from the regulatory investigations will not result in increased Federated Fund redemptions, reduced sales of Federated Fund shares, or other adverse consequences for the Federated Funds.10. Subsequent events
Management has evaluated subsequent events through January 22, 2010, the date the financial statements were issued, and determined that no events have occurred that require additional disclosure.
Annual Shareholder Report46
Report of Independent Registered Public Accounting Firm
TO THE BOARD OF DIRECTORS OF Federated investment series funds, inc. AND SHAREHOLDERS OF federated bond fund:
We have audited the accompanying statement of assets and liabilities of Federated Bond Fund (the “Fund”) (the sole portfolio constituting Federated Investment Series, Inc.), including the portfolio of investments, as of November 30, 2009, and the related statement of operations for the year then ended, the statements of changes in net assets for each of the periods indicated therein, and the financial highlights for each of the periods indicated therein. These financial statements and financial highlights are the responsibility of the Fund's management. Our responsibility is to express an opinion on these financial statements and financial highlights based on our audits.
We conducted our audits in accordance with standards of the Public Company Accounting Oversight Board (United States). Those standards require that we plan and perform the audit to obtain reasonable assurance about whether the financial statements and financial highlights are free of material misstatement. We were not engaged to perform an audit of the Fund's internal control over financial reporting. Our audits included consideration of internal control over financial reporting as a basis for designing audit procedures that are appropriate in the circumstances, but not for the purpose of expressing an opinion on the effectiveness of the Fund's internal control over financial reporting. Accordingly, we express no such opinion. An audit also includes examining, on a test basis, evidence supporting the amounts and disclosures in the financial statements and financial highlights, assessing the accounting principles used and significant estimates made by management, and evaluating the overall financial statement presentation. Our procedures included confirmation of securities owned as of November 30, 2009, by correspondence with the custodian and brokers or by other appropriate auditing procedures where replies from brokers were not received. We believe that our audits provide a reasonable basis for our opinion.
In our opinion, the financial statements and financial highlights referred to above present fairly, in all material respects, the financial position of Federated Bond Fund, a portfolio of Federated Investment Series Funds, Inc., at November 30, 2009, the results of its operations for the year then ended, the changes in its net assets for each of the periods indicated therein, and the financial highlights for each of the periods indicated therein, in conformity with U.S. generally accepted accounting principles.
Boston, Massachusetts
January 22, 2010
Annual Shareholder Report47
Board of Directors and Corporation Officers
The Board is responsible for managing the Corporation's business affairs and for exercising all the Corporation's powers except those reserved for the shareholders. The following tables give information about each Board member and the senior officers of the Fund. Where required, the tables separately list Board members who are “interested persons” of the Fund (i.e., “Interested” Board members) and those who are not (i.e., “Independent” Board members). Unless otherwise noted, the address of each person listed is Federated Investors Tower, 1001 Liberty Avenue, Pittsburgh, PA 15222. The address of all Independent Board members listed is 4000 Ericsson Drive, Warrendale, PA 15086-7561; Attention: Mutual Fund Board. As of December 31, 2009, the Corporation comprised one portfolio(s), and the Federated Fund Complex consisted of 43 investment companies (comprising 145 portfolios). Unless otherwise noted, each Officer is elected annually. Unless otherwise noted, each Board member oversees all portfolios in the Federated Fund Complex and serves for an indefinite term. The Fund's Statement of Additional Information includes additional information about Corporation Directors and is available, without charge and upon request, by calling 1-800-341-7400.
Interested DIRECTORS Background
Name
Birth Date
Positions Held with Corporation
Date Service Began | Principal Occupation(s) for Past Five Years,
Other Directorships Held and Previous Position(s) |
John F. Donahue*
Birth Date: July 28, 1924
DIRECTOR
Began serving: May 1992 | Principal Occupations: Director or Trustee of the Federated Fund Complex; Chairman and Director, Federated Investors, Inc.; Chairman of the Federated Fund Complex's Executive Committee.
Previous Positions: Chairman of the Federated Fund Complex; Trustee, Federated Investment Management Company; Chairman and Director, Federated Investment Counseling. |
J. Christopher Donahue*
Birth Date: April 11, 1949
PRESIDENT AND DIRECTOR
Began serving: May 1992 | Principal Occupations: Principal Executive Officer and President of the Federated Fund Complex; Director or Trustee of some of the Funds in the Federated Fund Complex; President, Chief Executive Officer and Director, Federated Investors, Inc.; Chairman and Trustee, Federated Investment Management Company; Trustee, Federated Investment Counseling; Chairman and Director, Federated Global Investment Management Corp.; Chairman, Federated Equity Management Company of Pennsylvania and Passport Research, Ltd. (investment advisory subsidiary of Federated); Trustee, Federated Shareholder Services Company; Director, Federated Services Company.
Previous Positions: President, Federated Investment Counseling; President and Chief Executive Officer, Federated Investment Management Company, Federated Global Investment Management Corp. and Passport Research, Ltd. |
| * | Family relationships and reasons for “interested” status: John F. Donahue is the father of J. Christopher Donahue; both are “interested” due to their beneficial ownership of shares of Federated Investors, Inc. and the positions they hold with Federated and its subsidiaries. |
Annual Shareholder Report48
INDEPENDENT DIRECTORS Background
Name
Birth Date
Positions Held with Corporation
Date Service Began | Principal Occupation(s) for Past Five Years,
Other Directorships Held and Previous Position(s) |
John T. Conroy, Jr., Ph.D.
Birth Date: June 23, 1937
DIRECTOR
Began serving: May 1992 | Principal Occupations: Director or Trustee of the Federated Fund Complex; Chairman of the Board, Investment Properties Corporation; Partner or Trustee in private real estate ventures in Southwest Florida; Assistant Professor in Theology, Blessed Edmund Rice School for Pastoral Ministry.
Previous Positions: President, Investment Properties Corporation; Senior Vice President, John R. Wood and Associates, Inc., Realtors; President, Naples Property Management, Inc. and Northgate Village Development Corporation. |
Nicholas P. Constantakis
Birth Date: September 3, 1939
DIRECTOR
Began serving: February 1998 | Principal Occupation: Director or Trustee of the Federated Fund Complex.
Other Directorship Held: Director and Chairman of the Audit Committee, Michael Baker Corporation (architecture, engineering and construction services).
Previous Position: Partner, Andersen Worldwide SC. |
John F. Cunningham
Birth Date: March 5, 1943
DIRECTOR
Began serving: January 1999 | Principal Occupation: Director or Trustee of the Federated Fund Complex.
Other Directorships Held: Chairman, President and Chief Executive Officer, Cunningham & Co., Inc. (strategic business consulting); Trustee Associate, Boston College.
Previous Positions: Director, Redgate Communications and EMC Corporation (computer storage systems); Chairman of the Board and Chief Executive Officer, Computer Consoles, Inc.; President and Chief Operating Officer, Wang Laboratories; Director, First National Bank of Boston; Director, Apollo Computer, Inc. |
Maureen Lally-Green
Birth Date: July 5, 1949
DIRECTOR
Began serving: August 2009 | Principal Occupations: Director or Trustee of the Federated Fund Complex; Director, Office of Church Relations, Diocese of Pittsburgh; Adjunct Professor of Law, Duquesne University School of Law.
Other Directorships Held: Director, Auberle; Trustee St. Francis University; Director, Ireland Institute of Pittsburgh; Director, UPMC Mercy Hospital; Regent, St. Vincent Seminary; Director, Epilepsy Foundation of Western and Central Pennsylvania; Director, Saint Thomas More Society, Allegheny County; Director, Carlow University.
Previous Position: Pennsylvania Superior Court Judge. |
Annual Shareholder Report49
Name
Birth Date
Positions Held with Corporation
Date Service Began | Principal Occupation(s) for Past Five Years,
Other Directorships Held and Previous Position(s) |
Peter E. Madden
Birth Date: March 16, 1942
DIRECTOR
Began serving: May 1992 | Principal Occupation: Director or Trustee, and Chairman of the Board of Directors or Trustees, of the Federated Fund Complex.
Other Directorship Held: Board of Overseers, Babson College.
Previous Positions: Representative, Commonwealth of Massachusetts General Court; President, Chief Operating Officer and Director, State Street Bank and Trust Company and State Street Corporation (retired); Director, VISA USA and VISA International; Chairman and Director, Massachusetts Bankers Association; Director, Depository Trust Corporation; Director, The Boston Stock Exchange. |
Charles F. Mansfield, Jr.
Birth Date: April 10, 1945
DIRECTOR
Began serving: January 1999 | Principal Occupations: Director or Trustee and Chairman of the Audit Committee of the Federated Fund Complex; Management Consultant.
Previous Positions: Chief Executive Officer, PBTC International Bank; Partner, Arthur Young & Company (now Ernst & Young LLP); Chief Financial Officer of Retail Banking Sector, Chase Manhattan Bank; Senior Vice President, HSBC Bank USA (formerly, Marine Midland Bank); Vice President, Citibank; Assistant Professor of Banking and Finance, Frank G. Zarb School of Business, Hofstra University; Executive Vice President DVC Group, Inc. (marketing, communications and technology). |
R. James Nicholson
Birth Date: February 4, 1938
DIRECTOR
Began serving: January 2008 | Principal Occupations: Director or Trustee of the Federated Fund Complex; Senior Counsel, Brownstein Hyatt Farber Schrek, P.C.; Former Secretary of the U.S. Dept. of Veterans Affairs; Former U.S. Ambassador to the Holy See; Former Chairman of the Republican National Committee.
Other Directorships Held: Director, Horatio Alger Association; Director, The Daniels Fund.
Previous Positions: Colonel, U.S. Army Reserve; Partner, Calkins, Kramer, Grimshaw and Harring, P.C.; General Counsel, Colorado Association of Housing and Building; Chairman and CEO, Nicholson Enterprises, Inc. (real estate holding company); Chairman and CEO, Renaissance Homes of Colorado. |
Thomas M. O'Neill
Birth Date: June 14, 1951
DIRECTOR
Began serving: October 2006 | Principal Occupations: Director or Trustee of the Federated Fund Complex; Sole Proprietor, Navigator Management Company (investment and strategic consulting).
Other Directorships Held: Board of Overseers, Children's Hospital of Boston; Visiting Committee on Athletics, Harvard College.
Previous Positions: Chief Executive Officer and President, Managing Director and Chief Investment Officer, Fleet Investment Advisors; President and Chief Executive Officer, Aeltus Investment Management, Inc.; General Partner, Hellman, Jordan Management Co., Boston, MA; Chief Investment Officer, The Putnam Companies, Boston, MA; Credit Analyst and Lending Officer, Fleet Bank; Director and Consultant, EZE Castle Software (investment order management software); Director, Midway Pacific (lumber). |
Annual Shareholder Report50
Name
Birth Date
Positions Held with Corporation
Date Service Began | Principal Occupation(s) for Past Five Years,
Other Directorships Held and Previous Position(s) |
John S. Walsh
Birth Date: November 28, 1957
DIRECTOR
Began serving: January 1999 | Principal Occupations: Director or Trustee of the Federated Fund Complex; President and Director, Heat Wagon, Inc. (manufacturer of construction temporary heaters); President and Director, Manufacturers Products, Inc. (distributor of portable construction heaters); President, Portable Heater Parts, a division of Manufacturers Products, Inc.
Previous Position: Vice President, Walsh & Kelly, Inc. |
James F. Will
Birth Date: October 12, 1938
DIRECTOR
Began serving: April 2006 | Principal Occupations: Director or Trustee of the Federated Fund Complex; formerly, Vice Chancellor and President, Saint Vincent College.
Other Directorships Held: Trustee, Saint Vincent College; Alleghany Corporation.
Previous Positions: Chairman, President and Chief Executive Officer, Armco, Inc.; President and Chief Executive Officer, Cyclops Industries; President and Chief Operating Officer, Kaiser Steel Corporation. |
OFFICERS
Name
Birth Date
Positions Held with Corporation
Date Service Began | Principal Occupation(s) for Past Five Years
and Previous Position(s) |
John W. McGonigle
Birth Date: October 26, 1938
EXECUTIVE VICE PRESIDENT AND SECRETARY
Began serving: May 1992 | Principal Occupations: Executive Vice President and Secretary of the Federated Fund Complex; Vice Chairman, Executive Vice President, Secretary and Director, Federated Investors, Inc.
Previous Positions: Trustee, Federated Investment Management Company and Federated Investment Counseling; Director, Federated Global Investment Management Corp., Federated Services Company and Federated Securities Corp. |
Richard A. Novak
Birth Date: December 25, 1963
TREASURER
Began serving: January 2006 | Principal Occupations: Principal Financial Officer and Treasurer of the Federated Fund Complex; Senior Vice President, Federated Administrative Services; Financial and Operations Principal for Federated Securities Corp., Edgewood Services, Inc. and Southpointe Distribution Services, Inc.
Previous Positions: Controller of Federated Investors, Inc.; Vice President, Finance of Federated Services Company; held various financial management positions within The Mercy Hospital of Pittsburgh; Auditor, Arthur Andersen & Co. |
Richard B. Fisher
Birth Date: May 17, 1923
VICE PRESIDENT
Began serving: May 1992 | Principal Occupations: Vice Chairman or Vice President of some of the Funds in the Federated Fund Complex; Vice Chairman, Federated Investors, Inc.; Chairman, Federated Securities Corp.
Previous Positions: President and Director or Trustee of some of the Funds in the Federated Fund Complex; Executive Vice President, Federated Investors, Inc.; Director and Chief Executive Officer, Federated Securities Corp. |
Annual Shareholder Report51
Name
Birth Date
Positions Held with Corporation
Date Service Began | Principal Occupation(s) for Past Five Years
and Previous Position(s) |
Brian P. Bouda
Birth Date: February 28, 1947
SENIOR VICE PRESIDENT AND CHIEF COMPLIANCE OFFICER
Began serving: January 2006 | Principal Occupations: Senior Vice President and Chief Compliance Officer of the Federated Fund Complex; Vice President and Chief Compliance Officer of Federated Investors, Inc. and Chief Compliance Officer of its subsidiaries. Mr. Bouda joined Federated in 1999 and is a member of the American Bar Association and the State Bar Association of Wisconsin. |
Robert J. Ostrowski
Birth Date: April 26, 1963
CHIEF INVESTMENT OFFICER
Began serving: May 2004 | Principal Occupations: Robert J. Ostrowski joined Federated in 1987 as an Investment Analyst and became a Portfolio Manager in 1990. He was named Chief Investment Officer of taxable fixed-income products in 2004 and also serves as a Senior Portfolio Manager. He has been a Senior Vice President of the Fund's Adviser since 1997. Mr. Ostrowski is a Chartered Financial Analyst. He received his M.S. in Industrial Administration from Carnegie Mellon University. |
Joseph M. Balestrino
Birth Date: November 3, 1954
VICE PRESIDENT
Began serving: November 1998 | Principal Occupations: Joseph M. Balestrino has been the Fund's Portfolio Manager since September 1993. He is Vice President of the Corporation. Mr. Balestrino joined Federated in 1986 and has been a Senior Portfolio Manager and Senior Vice President of the Fund's Sub-Adviser since 1998. He was a Portfolio Manager and a Vice President of the Fund's Sub-Adviser from 1995 to 1998. Mr. Balestrino served as a Portfolio Manager and an Assistant Vice President of the Fund's Sub-Adviser from 1993 to 1995. Mr. Balestrino is a Chartered Financial Analyst and received his Master's Degree in Urban and Regional Planning from the University of Pittsburgh. |
Annual Shareholder Report52
Evaluation and Approval of Advisory Contract - May 2009
Federated Bond Fund (the “Fund”)
The Fund's Board reviewed the Fund's investment advisory contract at meetings held in May 2009. The Board's decision regarding the contract reflects the exercise of its business judgment on whether to continue the existing arrangements.
In this connection, the Federated funds' Board had previously appointed a Senior Officer, whose duties include specified responsibilities relating to the process by which advisory fees are to be charged to a Federated fund. The Senior Officer has the authority to retain consultants, experts, or staff as may be reasonably necessary to assist in the performance of his duties, reports directly to the Board, and may be terminated only with the approval of a majority of the independent members of the Board. The Senior Officer prepared and furnished to the Board an independent, written evaluation that covered topics discussed below. The Board considered that evaluation, along with other information, in deciding to approve the advisory contract.
During its review of the contract, the Board considered compensation and benefits received by the Adviser. This included the fees received for services provided to the Fund by other entities in the Federated organization and research services received by the Adviser from brokers that execute Federated fund trades, as well as advisory fees. The Board is also familiar with and considered judicial decisions concerning allegedly excessive investment advisory fees, which have indicated that the following factors may be relevant to an Adviser's fiduciary duty with respect to its receipt of compensation from a fund: the nature and quality of the services provided by the Adviser, including the performance of the fund; the Adviser's cost of providing the services; the extent to which the Adviser may realize “economies of scale” as a fund grows larger; any indirect benefits that may accrue to the Adviser and its affiliates as a result of the Adviser's relationship with a fund; performance and expenses of comparable funds; and the extent to which the independent Board members are fully informed about all facts the Board deems relevant bearing on the Adviser's services and fees. The Board further considered management fees (including any components thereof) charged to institutional and other clients of the Adviser for what might be viewed as like services, and the cost to the Adviser and its affiliates of supplying services pursuant to the management fee agreements, excluding any intra-corporate profit and profit margins of the Adviser and its affiliates for supplying such services. The Board was aware of these factors and was guided by them in its review of the Fund's advisory contract to the extent it considered them to be appropriate and relevant, as discussed further below.
Annual Shareholder Report53
The Board considered and weighed these circumstances in light of its substantial accumulated experience in governing the Fund and working with Federated on matters relating to the Federated funds, and was assisted in its deliberations by independent legal counsel. Throughout the year, the Board has requested and received substantial and detailed information about the Fund and the Federated organization that was in addition to the extensive materials that comprise and accompany the Senior Officer's evaluation. Federated provided much of this information at each regular meeting of the Board, and furnished additional reports in connection with the particular meeting at which the Board's formal review of the advisory contract occurred. Between regularly scheduled meetings, the Board also received information on particular matters as the need arose. Thus, the Board's consideration of the advisory contract included review of the Senior Officer's evaluation, accompanying data and additional reports covering such matters as: the Adviser's investment philosophy, revenue, profitability, personnel and processes; investment and operating strategies; the Fund's short- and long-term performance (in absolute terms, both on a gross basis and net of expenses, as well as in relationship to its particular investment program and certain competitor or “peer group” funds and/or other benchmarks, as appropriate), and comments on the reasons for performance; the Fund's investment objectives; the Fund's expenses (including the advisory fee itself and the overall expense structure of the Fund, both in absolute terms and relative to similar and/or competing funds, with due regard for contractual or voluntary expense limitations); the use and allocation of brokerage commissions derived from trading the Fund's portfolio securities (if any); and the nature, quality and extent of the advisory and other services provided to the Fund by the Adviser and its affiliates. The Board also considered the preferences and expectations of Fund shareholders and their relative sophistication; the continuing state of competition in the mutual fund industry and market practices; the range of comparable fees for similar funds in the mutual fund industry; the Fund's relationship to the Federated family of funds which include a comprehensive array of funds with different investment objectives, policies and strategies which are available for exchange without the incurrence of additional sales charges; compliance and audit reports concerning the Federated funds and the Federated companies that service them (including communications from regulatory agencies), as well as Federated's responses to any issues raised therein; and relevant developments in the mutual fund industry and how the Federated funds and/or Federated are responding to them. The Board's evaluation process is evolutionary. The criteria considered and the emphasis placed on relevant criteria change in recognition of changing circumstances in the mutual fund marketplace. With respect to the Fund's performance and expenses in particular, the Board has found the use of comparisons to other mutual funds with comparable investment programs to be particularly useful, given the high degree of competition in the mutual fund business. The Board focused on comparisons Annual Shareholder Report54
with other similar mutual funds more heavily than non-mutual fund products or services because it is believed that they are more relevant. For example, other mutual funds are the products most like the Fund, they are readily available to Fund shareholders as alternative investment vehicles, and they are the type of investment vehicle in fact chosen and maintained by the Fund's investors. The range of their fees and expenses therefore appears to be a generally reliable indication of what consumers have found to be reasonable in the precise marketplace in which the Fund competes. The Fund's ability to deliver competitive performance when compared to its peer group was a useful indicator of how the Adviser is executing the Fund's investment program, which in turn assisted the Board in reaching a conclusion that the nature, extent, and quality of the Adviser's investment management services were such as to warrant continuation of the advisory contract. In this regard, the Senior Officer has reviewed Federated's fees for providing advisory services to products outside the Federated family of funds (e.g., institutional and separate accounts). He concluded that mutual funds and institutional accounts are inherently different products. Those differences include, but are not limited to, different types of targeted investors; being subject to different laws and regulations; different legal structures; different average account sizes; different associated costs; different portfolio management techniques made necessary by different cash flows and portfolio manager time spent in review of securities pricing. The Senior Officer did not consider these fee schedules to be determinative in judging the appropriateness of mutual fund advisory contracts.The Senior Officer reviewed reports compiled by Federated, using data supplied by independent fund ranking organizations, regarding the performance of, and fees charged by, other mutual funds, noting his view that comparisons to fund peer groups are highly important in judging the reasonableness of proposed fees.
The Fund's performance fell below the median of the relevant peer group for the one-year, three-year and five-year periods covered by the report. The Board discussed the Fund's performance with the Adviser and recognized the efforts being undertaken by the Adviser. The Board will continue to monitor these efforts and the performance of the Fund.
The Board also received financial information about Federated, including reports on the compensation and benefits Federated derived from its relationships with the Federated funds. These reports covered not only the fees under the advisory contracts, but also fees received by Federated's subsidiaries for providing other services to the Federated funds under separate contracts (e.g., for serving as the Federated funds' administrator). The reports also discussed any indirect benefit Federated may derive from its receipt of research services from brokers who execute Federated fund trades. In addition, the Board considered the fact that, in order for a fund to be competitive in the marketplace, Federated and its affiliates frequently waived fees and/or reimbursed expenses and have disclosed to fund investors and/or indicated to Annual Shareholder Report55
the Board their intention to do so in the future, where appropriate. Moreover, the Board receives regular reports regarding the institution or elimination of these voluntary waivers. In this regard, it was noted that the Adviser has agreed to a reduction of 19 basis points in the Fund's advisory fee at least through December 31, 2010.Federated furnished reports, requested by the Senior Officer, that reported revenues on a fund-by-fund basis and made estimates of the allocation of expenses on a fund-by-fund basis, using allocation methodologies specified by the Senior Officer. The Senior Officer noted that, although they may apply consistent allocation processes, the inherent difficulties in allocating costs (and the unavoidable arbitrary aspects of that exercise) and the lack of consensus on how to allocate those costs may render such allocation reports unreliable. The allocation reports were considered in the analysis by the Board but were determined to be of limited use.
The Board and the Senior Officer also reviewed a report compiled by Federated comparing profitability information for Federated to other publicly held fund management companies. In this regard, the Senior Officer noted the limited availability of such information, but nonetheless concluded that Federated's profit margins did not appear to be excessive and the Board agreed.
The Senior Officer's evaluation also discussed the notion of possible realization of “economies of scale” as a fund grows larger. The Board considered in this regard that the Adviser has made significant and long-term investments in areas that support all of the Federated funds, such as personnel and processes for the portfolio management, compliance, and risk management functions; and systems technology; and that the benefits of these efforts (as well as any economies, should they exist) were likely to be enjoyed by the fund complex as a whole. Finally, the Board also noted the absence of any applicable regulatory or industry guidelines on this subject, which (as discussed in the Senior Officer's evaluation) is compounded by the lack of any common industry practice or general pattern with respect to structuring fund advisory fees with “breakpoints” that serve to reduce the fee as the fund attains a certain size. The Senior Officer did not recommend institution of breakpoints in pricing Federated's fund advisory services at this time.
It was noted in the materials for the Board meeting that for the period covered by the report, the Fund's investment advisory fee, after waivers and expense reimbursements, if any, was above the median of the relevant peer group. The Board reviewed the fees and other expenses of the Fund with the Adviser and was satisfied that the overall expense structure of the Fund remained competitive. The Board will continue to monitor advisory fees and other expenses borne by the Fund.
The Senior Officer's evaluation noted his belief that the information and observations contained in his evaluation supported a finding that the proposed management fees are reasonable, and that Federated appeared to provide appropriate administrative services to the Fund for the fees paid. Under these Annual Shareholder Report56
circumstances, no changes were recommended to, and no objection was raised to, the continuation of the Fund's advisory contract. The Board concluded that the nature, quality and scope of services provided the Fund by the Adviser and its affiliates were satisfactory.In its decision to continue an existing investment advisory contract, the Board was mindful of the potential disruptions of the Fund's operations and various risks, uncertainties and other effects that could occur as a result of a decision to terminate or not renew an advisory contract. In particular, the Board recognized that many shareholders have invested in the Fund on the strength of the Adviser's industry standing and reputation and with the expectation that the Adviser will have a continuing role in providing advisory services to the Fund. Thus, the Board's approval of the advisory contract reflected the fact that it is the shareholders who have effectively selected the Adviser by virtue of having invested in the Fund.
The Board based its decision to approve the advisory contract on the totality of the circumstances and relevant factors and with a view to past and future long-term considerations. Not all of the factors and considerations identified above were necessarily relevant to the Fund, nor did the Board consider any one of them to be determinative. With respect to the factors that were relevant, the Board's decision to approve the contract reflects its determination that Federated's performance and actions provided a satisfactory basis to support the decision to continue the existing arrangements.
Annual Shareholder Report57
Voting Proxies on Fund Portfolio Securities
A description of the policies and procedures that the Fund uses to determine how to vote proxies, if any, relating to securities held in the Fund's portfolio is available, without charge and upon request, by calling 1-800-341-7400. A report on “Form N-PX” of how the Fund voted any such proxies during the most recent 12-month period ended June 30 is available from Federated's Web site at FederatedInvestors.com. To access this information from the “Products” section of the Web site, click on the “Prospectuses and Regulatory Reports” link under “Related Information,” then select the appropriate link opposite the name of the Fund; or select the name of the Fund and from the Fund's page, click on the “Prospectuses and Regulatory Reports” link. Form N-PX filings are also available at the SEC's Web site at www.sec.gov.
Quarterly Portfolio Schedule
The Fund files with the SEC a complete schedule of its portfolio holdings, as of the close of the first and third quarters of its fiscal year, on “Form N-Q.” These filings are available on the SEC's Web site at www.sec.gov and may be reviewed and copied at the SEC's Public Reference Room in Washington, DC. (Call 1-800-SEC-0330 for information on the operation of the Public Reference Room.) You may also access this information from the “Products” section of Federated's Web site at FederatedInvestors.com by clicking on “Portfolio Holdings” under “Related Information,” then selecting the appropriate link opposite the name of the Fund; or select the name of the Fund and from the Fund's page, click on the “Portfolio Holdings” link.
Annual Shareholder Report58
Mutual funds are not bank deposits or obligations, are not guaranteed by any bank and are not insured or guaranteed by the U.S. government, the Federal Deposit Insurance Corporation, the Federal Reserve Board or any other government agency. Investment in mutual funds involves investment risk, including the possible loss of principal.
This Report is authorized for distribution to prospective investors only when preceded or accompanied by the Fund's Prospectus, which contains facts concerning its objective and policies, management fees, expenses and other information.
Federated Bond Fund
Federated Investors Funds
4000 Ericsson Drive
Warrendale, PA 15086-7561
Contact us at FederatedInvestors.com
or call 1-800-341-7400.
Federated Securities Corp., Distributor
Cusip 31420F103
Cusip 31420F202
Cusip 31420F301
Cusip 31420F400
29747 (1/10)
Federated is a registered mark of Federated Investors, Inc.
2010 © Federated Investors, Inc.
Federated Bond Fund
A Portfolio of Federated Investment Series Funds, Inc.
ANNUAL SHAREHOLDER REPORTNovember 30, 2009
Institutional Shares
FINANCIAL HIGHLIGHTS
SHAREHOLDER EXPENSE EXAMPLE
MANAGEMENT'S DISCUSSION OF FUND PERFORMANCE
PORTFOLIO OF INVESTMENTS SUMMARY TABLE
PORTFOLIO OF INVESTMENTS
STATEMENT OF ASSETS AND LIABILITIES
STATEMENT OF OPERATIONS
STATEMENT OF CHANGES IN NET ASSETS
NOTES TO FINANCIAL STATEMENTS
REPORT OF INDEPENDENT REGISTERED PUBLIC ACCOUNTING FIRM
BOARD OF DIRECTORS AND CORPORATION OFFICERS
EVALUATION AND APPROVAL OF ADVISORY CONTRACT
VOTING PROXIES ON FUND PORTFOLIO SECURITIES
QUARTERLY PORTFOLIO SCHEDULE
Financial Highlights - Institutional Shares
(For a Share Outstanding Throughout Each Period)
| Year Ended November 30 | 2009 | 20081 |
| Net Asset Value, Beginning of Period | $7.08 | $8.86 |
| Income From Investment Operations: | | |
| Net investment income | 0.54 | 0.42 |
| Net realized and unrealized gain (loss) on investments, futures contracts and swap contracts | 1.73 | (1.77) |
| TOTAL FROM INVESTMENT OPERATIONS | 2.27 | (1.35) |
| Less Distributions: | | |
| Distributions from net investment income | (0.55) | (0.43) |
| Net Asset Value, End of Period | $8.80 | $7.08 |
| Total Return2 | 33.29% | (15.84)% |
| Ratios to Average Net Assets: | | |
| Net expenses3 | 0.79% | 0.79%4 |
| Net investment income | 6.22% | 6.35%4 |
| Expense waiver/reimbursement5 | 0.20% | 0.22%4 |
| Supplemental Data: | | |
| Net assets, end of period (000 omitted) | $7,948 | $274 |
| Portfolio turnover | 28% | 21%6 |
| 1 | Reflects operations for the period from January 28, 2008 (date of initial investment) to November 30, 2008. |
| 2 | Based on net asset value, which does not reflect the sales charge, redemption fee or contingent deferred sales charge, if applicable. Total returns for periods of less than one year are not annualized. |
| 3 | Pursuant to a settlement with the New York Attorney General, the Adviser has agreed to waive investment adviser fees in compliance with an Assurance of Discontinuance dated November 17, 2005. The net investment adviser fee was reduced to 0.5557% effective January 1, 2006, and may not be increased until after December 31, 2010. |
| 4 | Computed on an annualized basis. |
| 5 | This expense decrease is reflected in both the net expense and the net investment income ratios shown above. |
| 6 | Portfolio turnover is calculated at the Fund level. Percentage indicated was calculated for the year ended November 30, 2008. |
See Notes which are an integral part of the Financial Statements
Annual Shareholder Report1
Shareholder Expense Example (unaudited)
As a shareholder of the Fund, you incur ongoing costs, including management fees and to the extent applicable, distribution (12b-1) fees and/or shareholder services fees and other Fund expenses. This Example is intended to help you to understand your ongoing costs (in dollars) of investing in the Fund and to compare these costs with the ongoing costs of investing in other mutual funds. It is based on an investment of $1,000 invested at the beginning of the period and held for the entire period from June 1, 2009 to November 30, 2009.
ACTUAL EXPENSES
The first section of the table below provides information about actual account values and actual expenses. You may use the information in this section, together with the amount you invested, to estimate the expenses that you incurred over the period. Simply divide your account value by $1,000 (for example, an $8,600 account value divided by $1,000 = 8.6), then multiply the result by the number in the first section under the heading entitled “Expenses Paid During Period” to estimate the expenses attributable to your investment during this period.
HYPOTHETICAL EXAMPLE FOR COMPARISON PURPOSES
The second section of the tables below provides information about hypothetical account values and hypothetical expenses based on the Funds' actual expense ratios and assumed rates of return of 5% per year before expenses, which are not the Funds' actual returns. Thus, you should not use the hypothetical account values and expenses to estimate the actual ending account balance or your expenses for the period. Rather, these figures are required to be provided to enable you to compare the ongoing costs of investing in the Funds with other funds. To do so, compare this 5% hypothetical example with the 5% hypothetical examples that appear in the shareholder reports of the other funds.
Annual Shareholder Report2
Please note that the expenses shown in the tables are meant to highlight your ongoing costs only. Therefore, the second section of each table is useful in comparing ongoing costs only, and will not help you determine the relative total costs of owning different funds. | Beginning
Account Value
6/1/2009 | Ending
Account Value
11/30/2009 | Expenses Paid
During Period1 |
| Actual | $1,000 | $1,154.20 | $4.27 |
Hypothetical (assuming a 5% return
before expenses) | $1,000 | $1,021.11 | $4.00 |
| 1 | Expenses are equal to the Fund's annualized net expense ratio of 0.79%, multiplied by the average account value over the period, multiplied by 183/365 (to reflect the one-half-year period). |
Annual Shareholder Report3
Performance data quoted represents past performance which is no guarantee of future results. Investment return and principal value will fluctuate so that an investor's shares, when redeemed, may be worth more or less than their original cost. Mutual fund performance changes over time and current performance may be lower or higher than what is stated. For current to the most recent month-end performance and after-tax returns, visit FederatedInvestors.com or call 1-800-341-7400.
Management's Discussion of Fund Performance (unaudited)
The Fund's total return, based on net asset value for the 12-month reporting period ended November 30, 2009, was 33.29% for the Institutional Shares. The total return of the Lipper BBB Debt Category1 average was 27.81% during the 12-month reporting period. The Fund's and the Lipper Average's total returns for the most recently completed fiscal year reflected actual cash flows, transactions costs and other expenses.
During the reporting period, the most significant factors affecting the Fund's performance were: (1) the allocation of the portfolio among securities of similar types of issuers (referred to as “sectors”); (2) individual security selection; and (3) the effect of changing interest rates (referred to as duration).2
The 33.29% total return for the Institutional Shares for the reporting period consisted of 9.00% of dividends and reinvestments, and 24.29% appreciation in the net asset value of the shares.
| 1 | Lipper figures represent the average of the total returns reported by all of the mutual funds designated by Lipper, Inc. as falling into the category indicated. These figures do not reflect sales charges. |
| 2 | Bond prices are sensitive to changes in interest rates and a rise in interest rates can cause a decline in their prices. |
Annual Shareholder Report4
MARKET OVERVIEW
From December 2008 through March 2009, the economy was deep in recessionary territory and anxiety remained in the financial markets, particularly the stock markets. The non-Treasury bond sectors, on the other hand, immediately began delivering returns well in excess of the U.S. Treasury markets, a reflection that bond investors thought that the economy's deterioration would slow. The Federal Reserve (Fed) made no official adjustments to monetary policy, keeping the Fed Funds target within its previous range of 0% to 0.25%. However, the Fed embarked on direct support to the bond market and economy by purchasing large amounts of both U.S. Treasury and agency-backed mortgage securities, in effect helping to keep overall interest rates at low historical levels. After four consecutive negative quarters for Gross Domestic Product (GDP),3 the economy exhibited positive growth in the third quarter of 2009, after many foreign economies had already begun growing again. As the reporting period came to a close, it was apparent that economic growth continued. The Fed gave no indication that higher Fed Funds rates would be occurring over the near term. As a result, U.S. interest rates fell over the reporting period, with larger declines felt in the shorter to intermediate maturity areas (i.e., two-year to ten-year), with relatively lesser declines for 30-year maturities. With many world economies growing and no near term rate hikes expected in the United States, the corporate bond markets experienced very large positive returns, both investment grade and especially high yield.
Sector
Sector allocation was a significant positive contributor to absolute performance, as the Fund continually increased the percentage of assets in high yield bonds,4 the single best performing sector of all bond markets. The Fund did, however, maintain a majority but lesser (relative to the prior year) position in high quality bonds, which also aided in performance, as its high quality bonds generated a positive return though less than the high yield holdings.
| 3 | Gross Domestic Product: A broad gauge of the economy that measures the retail value of goods and services produced in the United States. |
| 4 | High-yield, lower-rated securities generally entail greater market, credit and liquidity risks than investment-grade securities and may include higher volatility and higher risk of default. |
Annual Shareholder Report5
Security Selection
Overall security selection was a negative contributor to Fund performance. The high yield bond portion significantly underperformed the Barclays Capital High Yield Index,5 partially offsetting the positive contribution attributed to the high yield sector allocation.
Duration6
Duration was a modest negative contributor to total return, particularly over the summer months of 2009. With the economy finally exhibiting positive growth characteristics, later confirmed by a positive GDP release for the third quarter, and with corporate earnings generally exceeding analyst estimates, Fund management reduced interest rate exposure by shortening duration. In reality, interest rate levels declined over the summer months as the Fed reiterated its position to keep Fed Funds at historically low levels.
| 5 | The Barclays Capital High Yield Index covers the universe of fixed rate, publicly issued, noninvestment-grade debt registered with the SEC. All bonds included in the High Yield Index must be dollar-denominated and nonconvertible and have at least one year remaining to maturity and an outstanding par value of at least $100 million. Generally, securities must be rated Ba1 or lower by Moody's Investors Service, including defaulted issues. If no Moody's rating is available, bonds must be rated BB+ or lower by S&P; and if no S&P rating is available, bonds must be rated below investment grade by Fitch Investor's Service. A small number of unrated bonds is included in the index; to be eligible they must have previously held a high-yield rating or have been associated with a high-yield issuer, and must trade accordingly. Investments cannot be made in an index. |
| 6 | Duration is a measure of a security's price sensitivity to changes in interest rates. Securities with longer durations are more sensitive to changes in interest rates than securities of shorter durations. |
Annual Shareholder Report6
GROWTH OF $10,000 INVESTMENT - INSTITUTIONAL SHARES
The Fund's Institutional Shares commenced on January 28, 2008. The Fund offers four other classes; Class A Shares, Class B Shares, Class C Shares and Class F Shares. For the period prior to commencement of operations of the Institutional Shares, the performance information shown is for the Fund's Class A Shares. The performance of the Class A Shares has not been adjusted to reflect the expenses of the Institutional Shares, since the Institutional Shares have a lower expense ratio than the expense ratio of the Class A Shares. The performance of the Class A Shares has been adjusted to reflect the absence of sales charges and to remove any voluntary waiver of Fund expenses related to the Class A Shares that may have occurred during the period prior to commencement of operations of the Institutional Shares. The graph below illustrates the hypothetical investment of $10,0001 in the Federated Bond Fund (Institutional Shares) (the “Fund”) from October 31, 1999 to November 30, 2009, compared to the Barclays Capital U.S. Credit Bond Index (BCUSC)2 and the Lipper Corporate Debt Funds BBB Rated Average (LCDBBB).2
| Average Annual Total Returns for the Period Ended 11/30/2009 | |
| 1 Year | 33.29% |
| 5 Years | 5.42% |
| 10 Years | 6.40% |
Annual Shareholder Report7
Performance data quoted represents past performance which is no guarantee of future results. Investment return and principal value will fluctuate so that an investor's shares, when redeemed, may be worth more or less than their original cost. Mutual fund performance changes over time and current performance may be lower or higher than what is stated. For current to the most recent month-end performance and after-tax returns, visit FederatedInvestors.com or call 1-800-341-7400. Returns shown do not reflect the deduction of taxes that a shareholder would pay on Fund distributions or the redemption of Fund shares. Mutual funds are not obligations of or guaranteed by any bank and are not federally insured.
| 1 | Represents a hypothetical investment of $10,000 in the Fund. The Fund's performance assumes the reinvestment of all dividends and distributions. The BCUSC and the LCDBBB have been adjusted to reflect reinvestment of dividends on securities in the index and average. |
| 2 | The BCUSC and LCDBBB are not adjusted to reflect sales charges, expenses or other fees that the Securities and Exchange Commission (SEC) requires to be reflected in the Fund's performance. The LCDBBB represents the average of the total returns reported by all of the mutual funds designated by Lipper, Inc. as falling in the category indicated, and is not adjusted to reflect any sales charges. However, these total returns are reported net of expenses or other fees that the SEC requires to be reflected in a mutual fund's performance. The index is unmanaged and, unlike the Fund, is not affected by cash flows. It is not possible to invest directly in an index or an average. |
Annual Shareholder Report8
Portfolio of Investments Summary Table (unaudited)
At November 30, 2009, the Fund's portfolio composition1 was as follows:
| Security Type | | Percentage of
Total Net Assets2 |
| Corporate Debt Securities | | 96.1% |
| Foreign Governments/Agencies | | 1.2% |
| Municipal Securities | | 0.2% |
| Asset-Backed Securities3 | | 0.0% |
| Collateralized Mortgage Obligations3 | | 0.0% |
| Mortgage-Backed Securities3,4 | | 0.0% |
| Derivative Contracts3,5 | | (0.0)% |
| Other Security Types6 | | 0.4% |
| Cash Equivalents7 | | 0.5% |
| Other Assets and Liabilities — Net8 | | 1.6% |
| TOTAL | | 100% |
| 1 | See the Fund's Prospectus and Statement of Additional Information for a description of these security types. |
| 2 | As of the date specified above, the Fund owned shares of one or more affiliated investment companies. For purposes of these tables, the affiliated investment company (other than an affiliated money market fund) is not treated as a single portfolio security, but rather the Fund is treated as owning a pro rata portion of each security and each other asset and liability owned by the affiliated investment company. Accordingly, the percentages of total net assets shown in the table will differ from those presented on the Portfolio of Investments. |
| 3 | Represents less than 0.1%. |
| 4 | For purposes of this table, mortgage-backed securities includes mortgage-backed securities guaranteed by Government Sponsored Entities (GSEs) and adjustable rate mortgage-backed securities. |
| 5 | Based upon net unrealized appreciation (depreciation) or value of the derivative contracts as applicable. Derivative contracts may consist of futures, forwards, options and swaps. The impact of a derivative contract on the Fund's performance may be larger than its unrealized appreciation (depreciation) or value may indicate. In many cases, the notional value or amount of a derivative contract may provide a better indication of the contract's significance to the portfolio. More complete information regarding the Fund's direct investments in derivative contracts, including unrealized appreciation (depreciation), value, and notional values or amounts of such contracts, can be found in the table at the end of the Portfolio of Investments included in this report. |
| 6 | Other Security Types consist of common stock and preferred stock. |
| 7 | Cash Equivalents includes any investments in money market mutual funds and/or overnight repurchase agreements. |
| 8 | Assets, other than investments in securities and derivative contracts, less liabilities. See Statement of Assets and Liabilities. |
Annual Shareholder Report9
Portfolio of Investments
November 30, 2009
|
| Principal Amount or Shares | | | Value |
| | Corporate Bonds – 65.9% | |
| | Basic Industry — Chemicals – 1.6% | |
| $3,760,000 | | Albemarle Corp., Sr. Note, 5.10%, 2/1/2015 | 3,771,500 |
| 3,670,000 | | Dow Chemical Co., Note, 8.55%, 5/15/2019 | 4,347,614 |
| 2,600,000 | | Du Pont (E.I.) de Nemours & Co., 6.00%, 7/15/2018 | 2,963,854 |
| 1,900,000 | 1 | Fertinitro Finance, Company Guarantee, 8.29%, 4/1/2020 | 1,311,000 |
| 2,365,000 | | RPM International, Inc., 6.50%, 2/15/2018 | 2,453,607 |
| 1,885,000 | | RPM International, Inc., Sr. Unsecd. Note, 6.125%, 10/15/2019 | 1,928,206 |
| 1,525,000 | | Rohm & Haas Co., 6.00%, 9/15/2017 | 1,589,122 |
| | TOTAL | 18,364,903 |
| | Basic Industry — Metals & Mining – 2.7% | |
| 2,500,000 | | Alcoa, Inc., Note, 5.55%, 2/1/2017 | 2,515,498 |
| 1,860,000 | | Allegheny Technologies, Inc., Sr. Note, 9.375%, 6/1/2019 | 2,145,196 |
| 1,370,000 | | ArcelorMittal, 6.125%, 6/1/2018 | 1,402,678 |
| 400,000 | | BHP Finance (USA), Inc., 6.50%, 4/1/2019 | 470,443 |
| 5,000,000 | | Barrick Gold Corp., 4.875%, 11/15/2014 | 5,380,568 |
| 530,000 | | Barrick Gold Corp., 6.95%, 4/1/2019 | 620,191 |
| 3,325,000 | 1,2 | Codelco, Inc., Bond, 5.625%, 9/21/2035 | 3,224,917 |
| 4,050,000 | | Newmont Mining Corp., Company Guarantee, 5.875%, 4/1/2035 | 3,855,353 |
| 3,230,000 | | Rio Tinto Finance USA Ltd., 5.875%, 7/15/2013 | 3,516,156 |
| 2,810,000 | | Rio Tinto Finance USA Ltd., 6.50%, 7/15/2018 | 3,126,882 |
| 2,500,000 | | Xstrata Canada Corp., 6.00%, 10/15/2015 | 2,670,890 |
| 1,500,000 | 1,2 | Xstrata Finance Canada Ltd., Unsecd. Note, 5.50%, 11/16/2011 | 1,569,437 |
| | TOTAL | 30,498,209 |
| | Basic Industry — Paper – 1.1% | |
| 1,700,000 | | International Paper Co., Bond, 7.30%, 11/15/2039 | 1,695,597 |
| 1,175,000 | | International Paper Co., Sr. Unsecd. Note, 7.50%, 8/15/2021 | 1,316,285 |
| 1,330,000 | | Louisiana-Pacific Corp., 8.875%, 8/15/2010 | 1,363,250 |
| 2,850,000 | 3,4 | Pope & Talbot, Inc., 8.375%, 6/1/2013 | 26,362 |
| 4,500,000 | | Westvaco Corp., 7.65%, 3/15/2027 | 4,432,771 |
| 3,750,000 | | Weyerhaeuser Co., Deb., 7.375%, 3/15/2032 | 3,432,169 |
| | TOTAL | 12,266,434 |
| | Capital Goods — Aerospace & Defense – 0.6% | |
| 3,650,000 | 1,2 | BAE Systems Holdings, Inc., 5.20%, 8/15/2015 | 3,951,404 |
| 2,000,000 | | Boeing Co., 4.875%, 2/15/2020 | 2,084,983 |
Annual Shareholder Report10
|
| $600,000 | | Raytheon Co., Sr. Note, 4.40%, 2/15/2020 | 612,093 |
| | TOTAL | 6,648,480 |
| | Capital Goods — Building Materials – 0.5% | |
| 5,500,000 | | Masco Corp., Note, 5.875%, 7/15/2012 | 5,529,817 |
| | Capital Goods — Diversified Manufacturing – 2.8% | |
| 2,940,000 | | Briggs & Stratton Corp., Company Guarantee, 8.875%, 3/15/2011 | 3,079,650 |
| 2,065,000 | | Dover Corp., Note, 5.45%, 3/15/2018 | 2,265,667 |
| 2,020,000 | | Harsco Corp., 5.75%, 5/15/2018 | 2,136,956 |
| 2,600,000 | | Hubbell, Inc., 5.95%, 6/1/2018 | 2,759,209 |
| 768,000 | 1,2 | Hutchison Whampoa International Ltd., 6.50%, 2/13/2013 | 848,699 |
| 1,000,000 | 1,2 | Hutchison Whampoa International Ltd., 7.625%, 4/9/2019 | 1,163,835 |
| 2,300,000 | 1,2 | Hutchison Whampoa International Ltd., Company Guarantee, Series 144A, 4.625%, 9/11/2015 | 2,346,817 |
| 1,910,000 | | Ingersoll-Rand Global Holding Co. Ltd., 6.875%, 8/15/2018 | 2,161,836 |
| 2,770,000 | | Roper Industries, Inc., 6.625%, 8/15/2013 | 3,060,130 |
| 660,000 | | Roper Industries, Inc., Sr. Unsecd. Note, 6.25%, 9/1/2019 | 706,917 |
| 2,630,000 | | Textron Financial Corp., 5.40%, 4/28/2013 | 2,603,674 |
| 3,230,000 | 1,2 | Textron Financial Corp., Jr. Sub. Note, 6.00%, 2/15/2067 | 2,277,150 |
| 1,090,000 | | Thomas & Betts Corp., Sr. Unsecd. Note, 5.625%, 11/15/2021 | 1,116,299 |
| 4,230,000 | | Tyco Electronics Group SA, 5.95%, 1/15/2014 | 4,527,416 |
| | TOTAL | 31,054,255 |
| | Capital Goods — Environmental – 0.3% | |
| 500,000 | | Republic Services, Inc., Note, 6.086%, 3/15/2035 | 480,131 |
| 600,000 | | Republic Services, Inc., Note, 6.75%, 8/15/2011 | 636,978 |
| 1,000,000 | 1,2 | Republic Services, Inc., Sr. Unsecd. Note, Series 144A, 5.50%, 9/15/2019 | 1,049,965 |
| 1,275,000 | | Waste Management, Inc., 7.375%, 3/11/2019 | 1,491,983 |
| | TOTAL | 3,659,057 |
| | Communications — Media & Cable – 1.8% | |
| 900,000 | | Comcast Corp., 7.05%, 3/15/2033 | 992,561 |
| 520,000 | | Comcast Corp., Company Guarantee, 5.70%, 5/15/2018 | 557,586 |
| 5,480,000 | | Comcast Corp., Company Guarantee, 6.50%, 1/15/2017 | 6,137,333 |
| 5,010,000 | | Cox Communications, Inc., Unsecd. Note, 5.45%, 12/15/2014 | 5,462,734 |
| 2,470,000 | | Time Warner Cable, Inc., Company Guarantee, 6.75%, 6/15/2039 | 2,631,839 |
| 1,600,000 | | Time Warner Cable, Inc., Company Guarantee, 8.75%, 2/14/2019 | 1,999,756 |
| 2,250,000 | | Time Warner Cable, Inc., Sr. Unsecd. Note, 5.85%, 5/1/2017 | 2,408,834 |
| | TOTAL | 20,190,643 |
Annual Shareholder Report11
|
| | Communications — Media Noncable – 0.7% | |
| $6,880,000 | | Grupo Televisa S.A., 6.625%, 3/18/2025 | 6,933,183 |
| 500,000 | | News America Holdings, Inc., Sr. Deb., 9.25%, 2/1/2013 | 592,660 |
| | TOTAL | 7,525,843 |
| | Communications — Telecom Wireless – 1.2% | |
| 6,540,000 | | AT&T Wireless Services, Inc., 8.75%, 3/1/2031 | 8,675,400 |
| 3,100,000 | | America Movil S.A.B. de C.V., Note, 5.75%, 1/15/2015 | 3,343,112 |
| 800,000 | | Vodafone Group PLC, 5.35%, 2/27/2012 | 862,771 |
| | TOTAL | 12,881,283 |
| | Communications — Telecom Wirelines – 3.3% | |
| 1,000,000 | | AT&T, Inc., 6.70%, 11/15/2013 | 1,151,525 |
| 3,810,000 | | BellSouth Corp., 5.20%, 9/15/2014 | 4,183,948 |
| 1,540,000 | | CenturyTel, Inc., Sr. Note, 6.15%, 9/15/2019 | 1,589,279 |
| 2,620,000 | | Citizens Communications Co., 9.00%, 8/15/2031 | 2,574,150 |
| 6,380,000 | | Deutsche Telekom International Finance BV, 4.875%, 7/8/2014 | 6,839,782 |
| 4,940,000 | 1,2 | KT Corp., Note, 5.875%, 6/24/2014 | 5,285,074 |
| 2,140,000 | | Rogers Communications, Inc., 5.50%, 3/15/2014 | 2,304,513 |
| 3,870,000 | | SBC Communications, Inc., 5.10%, 9/15/2014 | 4,232,725 |
| 5,030,000 | | Telefonica SA, Sr. Note, 5.855%, 2/4/2013 | 5,559,938 |
| 3,260,000 | | Verizon Communications, Inc., Sr. Unsecd. Note, 6.35%, 4/1/2019 | 3,676,437 |
| | TOTAL | 37,397,371 |
| | Consumer Cyclical — Automotive – 2.0% | |
| 3,560,000 | 1,2 | American Honda Finance Corp., 4.625%, 4/2/2013 | 3,704,912 |
| 2,490,000 | | DaimlerChrysler North America Holding Corp., 6.50%, 11/15/2013 | 2,737,379 |
| 7,740,000 | | DaimlerChrysler North America Holding Corp., Note, 4.875%, 6/15/2010 | 7,882,119 |
| 2,100,000 | 3,4 | General Motors Corp., Note, 9.45%, 11/1/2011 | 451,500 |
| 2,710,000 | 1,2 | Hyundai Capital Services, Inc., Note, Series 144A, 6.00%, 5/5/2015 | 2,788,026 |
| 4,800,000 | 1,2 | Nissan Motor Acceptance Corp., Sr. Unsecd. Note, 5.625%, 3/14/2011 | 4,964,756 |
| | TOTAL | 22,528,692 |
| | Consumer Cyclical — Entertainment – 0.6% | |
| 2,500,000 | | Time Warner, Inc., 5.50%, 11/15/2011 | 2,676,149 |
| 3,390,000 | | Time Warner, Inc., Company Guarantee, 6.875%, 5/1/2012 | 3,758,579 |
| | TOTAL | 6,434,728 |
| | Consumer Cyclical — Lodging – 0.1% | |
| 1,530,000 | | Wyndham Worldwide Corp., Sr. Unsecd. Note, 6.00%, 12/1/2016 | 1,427,565 |
| | Consumer Cyclical — Retailers – 0.9% | |
| 2,240,000 | | Best Buy Co., Inc., Sr. Unsecd. Note, 6.75%, 7/15/2013 | 2,440,796 |
Annual Shareholder Report12
|
| $1,827,798 | 1,2 | CVS Caremark Corp., Pass Thru Cert., 5.298%, 1/11/2027 | 1,764,333 |
| 4,350,000 | | CVS Caremark Corp., Sr. Unsecd. Note, 5.75%, 6/1/2017 | 4,703,967 |
| 900,000 | | JC Penney Corp., Inc., Sr. Unsecd. Note, 5.75%, 2/15/2018 | 855,000 |
| | TOTAL | 9,764,096 |
| | Consumer Cyclical — Services – 0.8% | |
| 7,475,000 | | Boston University, 7.625%, 7/15/2097 | 8,585,875 |
| | Consumer Non-Cyclical — Food/Beverage – 1.3% | |
| 4,000,000 | 1,2 | Bacardi Ltd., Sr. Note, 7.45%, 4/1/2014 | 4,615,119 |
| 960,000 | | Diageo Capital PLC, Company Guarantee, 7.375%, 1/15/2014 | 1,132,258 |
| 2,420,000 | | General Mills, Inc., Note, 5.70%, 2/15/2017 | 2,692,483 |
| 2,000,000 | | Kraft Foods, Inc., 5.625%, 11/1/2011 | 2,144,014 |
| 740,000 | | Kraft Foods, Inc., Note, 6.25%, 6/1/2012 | 808,986 |
| 1,540,000 | | Kraft Foods, Inc., Sr. Unsecd. Note, 6.125%, 2/1/2018 | 1,664,060 |
| 1,120,000 | 1,2 | Ralcorp Holdings, Inc., Sr. Note, 6.625%, 8/15/2039 | 1,161,562 |
| | TOTAL | 14,218,482 |
| | Consumer Non-Cyclical — Health Care – 0.6% | |
| 1,060,000 | | Covidien International Finance SA, 6.55%, 10/15/2037 | 1,231,040 |
| 500,000 | | Quest Diagnostics, Inc., Sr. Unsecd. Note, 4.75%, 1/30/2020 | 507,072 |
| 500,000 | | Quest Diagnostics, Inc., Sr. Unsecd. Note, 5.75%, 1/30/2040 | 506,962 |
| 1,660,000 | | Thermo Electron Corp., Sr. Unsecd. Note, 5.00%, 6/1/2015 | 1,815,008 |
| 1,210,000 | 1,2 | Thermo Fisher Scientific, Inc. , Sr. Note, Series 144A, 2.15%, 12/28/2012 | 1,219,491 |
| 1,120,000 | | Zimmer Holdings, Inc., Sr. Note, 5.75%, 11/30/2039 | 1,150,462 |
| | TOTAL | 6,430,035 |
| | Consumer Non-Cyclical — Products – 0.6% | |
| 900,000 | | Clorox Co., Sr. Unsecd. Note, 3.55%, 11/1/2015 | 917,933 |
| 500,000 | | Philips Electronics NV, 4.625%, 3/11/2013 | 530,371 |
| 1,960,000 | | Philips Electronics NV, 5.75%, 3/11/2018 | 2,156,013 |
| 2,950,000 | | Whirlpool Corp., 5.50%, 3/1/2013 | 3,069,982 |
| | TOTAL | 6,674,299 |
| | Consumer Non-Cyclical — Supermarkets – 0.1% | |
| 1,310,000 | | Kroger Co., Bond, 6.90%, 4/15/2038 | 1,551,596 |
| | Consumer Non-Cyclical — Tobacco – 0.3% | |
| 2,900,000 | | Altria Group, Inc., 9.25%, 8/6/2019 | 3,547,150 |
| | Energy — Independent – 1.9% | |
| 460,000 | | Canadian Natural Resources Ltd., 4.90%, 12/1/2014 | 494,074 |
| 5,890,000 | | Canadian Natural Resources Ltd., 5.85%, 2/1/2035 | 5,995,347 |
Annual Shareholder Report13
|
| $1,500,000 | 1,2 | Lukoil International Finance BV, 6.356%, 6/7/2017 | 1,455,000 |
| 495,000 | | Pemex Project Funding Master, 5.75%, 12/15/2015 | 517,120 |
| 3,450,000 | | Pemex Project Funding Master, Company Guarantee, 9.125%, 10/13/2010 | 3,690,119 |
| 6,000,000 | 1,2 | Petroleos Mexicanos, 4.875%, 3/15/2015 | 6,087,334 |
| 440,000 | | XTO Energy, Inc., 6.375%, 6/15/2038 | 474,311 |
| 775,000 | | XTO Energy, Inc., 6.75%, 8/1/2037 | 874,290 |
| 1,135,000 | | XTO Energy, Inc., Sr. Unsecd. Note, 6.25%, 8/1/2017 | 1,265,380 |
| | TOTAL | 20,852,975 |
| | Energy — Integrated – 0.9% | |
| 2,750,000 | | Conoco, Inc., 7.25%, 10/15/2031 | 3,294,027 |
| 550,000 | | Husky Energy, Inc., 5.90%, 6/15/2014 | 602,310 |
| 450,000 | | Husky Oil Ltd., Deb., 7.55%, 11/15/2016 | 508,016 |
| 4,650,000 | | Petro-Canada, Bond, 5.35%, 7/15/2033 | 4,185,208 |
| 220,000 | | Petro-Canada, Deb., 7.00%, 11/15/2028 | 240,505 |
| 1,190,238 | 1,2 | Qatar Petroleum, 5.579%, 5/30/2011 | 1,228,887 |
| | TOTAL | 10,058,953 |
| | Energy — Oil Field Services – 0.4% | |
| 1,100,000 | | Nabors Industries, Inc., Company Guarantee, 9.25%, 1/15/2019 | 1,365,505 |
| 210,000 | | Noble Drilling Corp., Sr. Note, 7.50%, 3/15/2019 | 236,134 |
| 100,000 | | Weatherford International Ltd., 6.00%, 3/15/2018 | 104,617 |
| 2,700,000 | | Weatherford International Ltd., 7.00%, 3/15/2038 | 2,852,109 |
| | TOTAL | 4,558,365 |
| | Energy — Refining – 0.6% | |
| 1,000,000 | | Premcor Refining Group, Inc., 6.125%, 5/1/2011 | 1,056,537 |
| 1,665,000 | | Valero Energy Corp., 7.50%, 4/15/2032 | 1,719,593 |
| 2,870,000 | | Valero Energy Corp., 9.375%, 3/15/2019 | 3,460,131 |
| | TOTAL | 6,236,261 |
| | Financial Institution — Banking – 11.6% | |
| 4,000,000 | | Astoria Financial Corp., Note, 5.75%, 10/15/2012 | 3,774,244 |
| 870,000 | | Banc One Corp., Sub. Deb., 8.00%, 4/29/2027 | 1,044,604 |
| 1,580,000 | | Bank of America Corp., Sr. Note, 7.375%, 5/15/2014 | 1,777,837 |
| 930,000 | | Bank of America Corp., Sr. Unsecd. Note, 6.50%, 8/1/2016 | 998,078 |
| 5,000,000 | 1,2 | Barclays Bank PLC, 5.926%, 12/31/2049 | 3,625,000 |
| 4,750,000 | 5 | Bear Stearns Cos., Inc., Sr. Unsecd. Note, 7.25%, 2/1/2018 | 5,520,949 |
| 4,180,000 | | Capital One Capital IV, 6.745%, 2/17/2037 | 3,323,100 |
| 1,450,000 | | Capital One Capital V, 10.25%, 8/15/2039 | 1,598,977 |
Annual Shareholder Report14
|
| $3,140,000 | | Capital One Capital VI, 8.875%, 5/15/2040 | 3,130,549 |
| 2,270,000 | | Capital One Financial Corp., Sr. Note, 7.375%, 5/23/2014 | 2,614,237 |
| 6,460,000 | | Citigroup, Inc., Sr. Unsecd. Note, 6.875%, 3/5/2038 | 6,398,924 |
| 2,300,000 | 1,2 | Commonwealth Bank of Australia, Sr. Unsecd. Note, Series 144A, 3.75%, 10/15/2014 | 2,358,824 |
| 2,900,000 | | Goldman Sachs Group, Inc., 6.125%, 2/15/2033 | 3,006,592 |
| 1,000,000 | | Goldman Sachs Group, Inc., Sr. Unsecd. Note, 5.125%, 1/15/2015 | 1,063,431 |
| 2,100,000 | | Goldman Sachs Group, Inc., Sub. Note, 6.345%, 2/15/2034 | 1,952,785 |
| 1,000,000 | | HSBC Bank USA, Sr. Sub. Note, 4.625%, 4/1/2014 | 1,060,273 |
| 3,500,000 | | Hudson United Bancorp, 7.00%, 5/15/2012 | 3,788,718 |
| 10,900,000 | | JPMorgan Chase & Co., Sub. Note, 5.125%, 9/15/2014 | 11,644,629 |
| 1,280,000 | | M & T Bank Corp., 5.375%, 5/24/2012 | 1,340,628 |
| 3,975,000 | | Manufacturers & Traders Trust Co., Sub. Note, 5.629%, 12/1/2021 | 3,263,246 |
| 5,000,000 | | Marshall & Ilsley Bank, Milwaukee, Sr. Note, 4.40%, 3/15/2010 | 4,998,146 |
| 3,170,000 | | Merrill Lynch & Co., Inc., Sr. Unsecd. Note, 6.05%, 8/15/2012 | 3,422,284 |
| 1,000,000 | | Morgan Stanley, Sr. Unsecd. Note, 4.20%, 11/20/2014 | 1,007,235 |
| 3,300,000 | | Morgan Stanley, Sr. Unsecd. Note, 5.625%, 9/23/2019 | 3,349,933 |
| 1,500,000 | | Morgan Stanley, Sr. Unsecd. Note, 5.95%, 12/28/2017 | 1,587,875 |
| 2,450,000 | | Morgan Stanley, Sr. Unsecd. Note, 6.00%, 4/28/2015 | 2,659,600 |
| 7,350,000 | | Morgan Stanley, Sr. Unsecd. Note, 6.625%, 4/1/2018 | 8,025,131 |
| 2,650,000 | 1,2 | Nordea Bank AB, Sr. Unsecd. Note, 3.70%, 11/13/2014 | 2,693,289 |
| 1,000,000 | | PNC Funding Corp., Sr. Unsecd. Note, 4.25%, 9/21/2015 | 1,034,560 |
| 1,170,000 | | PNC Funding Corp., Sub. Note, 5.625%, 2/1/2017 | 1,188,828 |
| 10,398,302 | 1,2 | Regional Diversified Funding, 9.25%, 3/15/2030 | 5,594,806 |
| 3,870,000 | | Sovereign Bancorp, Inc., Sr. Note, 4.80%, 9/1/2010 | 3,973,676 |
| 5,580,000 | | U.S. Bank, N.A., Sub. Note, 4.95%, 10/30/2014 | 6,081,027 |
| 5,000,000 | | Wachovia Bank N.A., 4.80%, 11/1/2014 | 5,206,464 |
| 3,440,000 | | Wachovia Bank N.A., Sub. Note, 4.875%, 2/1/2015 | 3,561,177 |
| 500,000 | | Wachovia Corp., 5.75%, 2/1/2018 | 528,379 |
| 4,530,000 | | Westpac Banking Corp., Sr. Unsecd. Note, 4.875%, 11/19/2019 | 4,601,368 |
| 3,550,000 | | Wilmington Trust Corp., Sub. Note, 8.50%, 4/2/2018 | 3,539,914 |
| 1,384,528 | 1,2 | World Financial, Pass Thru Cert., Series 96 WFP, 6.91%, 9/1/2013 | 1,372,269 |
| 3,370,000 | | Zions Bancorp, Sub. Note, 5.50%, 11/16/2015 | 2,345,672 |
| | TOTAL | 130,057,258 |
Annual Shareholder Report15
|
| | Financial Institution — Brokerage – 3.2% | |
| $6,140,000 | | AMVESCAP Ltd., Note, 4.50%, 12/15/2009 | 6,145,857 |
| 5,970,000 | | Blackrock, Inc., 6.25%, 9/15/2017 | 6,613,622 |
| 1,500,000 | | Eaton Vance Corp., 6.50%, 10/2/2017 | 1,620,513 |
| 4,255,000 | 1,2 | FMR LLC, Bond, 7.57%, 6/15/2029 | 4,729,661 |
| 1,150,000 | | Janus Capital Group, Inc., Sr. Note, 6.50%, 6/15/2012 | 1,163,063 |
| 1,375,000 | | Janus Capital Group, Inc., Sr. Note, 6.95%, 6/15/2017 | 1,326,229 |
| 4,390,000 | | Jefferies Group, Inc., Sr. Unsecd. Note, 8.50%, 7/15/2019 | 4,828,121 |
| 1,200,000 | 3 | Lehman Brothers Holdings, Inc., 5.75%, 5/17/2013 | 240,000 |
| 1,500,000 | 3 | Lehman Brothers Holdings, Inc., 7.875%, 8/15/2010 | 300,000 |
| 1,020,000 | | Nuveen Investments, 5.00%, 9/15/2010 | 1,011,075 |
| 1,020,000 | | Nuveen Investments, 5.50%, 9/15/2015 | 703,800 |
| 2,990,000 | | Raymond James Financial, Inc., 8.60%, 8/15/2019 | 3,324,128 |
| 3,355,000 | | TD Ameritrade Holding Corp., Company Guarantee, 4.15%, 12/1/2014 | 3,380,902 |
| | TOTAL | 35,386,971 |
| | Financial Institution — Finance Noncaptive – 3.9% | |
| 6,930,000 | | American Express Credit Corp., 5.875%, 5/2/2013 | 7,507,357 |
| 5,000,000 | | American International Group, Inc., Sr. Note, 4.70%, 10/1/2010 | 4,953,125 |
| 3,300,000 | | Discover Bank, Sub., 8.70%, 11/18/2019 | 3,485,645 |
| 7,000,000 | | General Electric Capital Corp., 6.875%, 1/10/2039 | 7,383,216 |
| 6,000,000 | | HSBC Finance Capital Trust IX, Note, 5.911%, 11/30/2035 | 4,710,000 |
| 2,200,000 | | HSBC Finance Corp., 4.75%, 4/15/2010 | 2,227,807 |
| 2,770,000 | | HSBC Finance Corp., 5.00%, 6/30/2015 | 2,902,542 |
| 1,500,000 | 1,2 | ILFC E-Capital Trust I, 5.90%, 12/21/2065 | 705,000 |
| 3,100,000 | | International Lease Finance Corp., 4.875%, 9/1/2010 | 3,008,937 |
| 1,670,000 | | International Lease Finance Corp., 6.625%, 11/15/2013 | 1,346,855 |
| 1,170,000 | 1,2 | Macquarie Group Ltd., Note, Series 144A, 7.625%, 8/13/2019 | 1,281,674 |
| 3,250,000 | | Susa Partnership LP, 8.20%, 6/1/2017 | 3,786,333 |
| | TOTAL | 43,298,491 |
| | Financial Institution — Insurance — Health – 0.9% | |
| 810,000 | | Aetna US Healthcare, 5.75%, 6/15/2011 | 856,501 |
| 2,200,000 | | Anthem, Inc., 6.80%, 8/1/2012 | 2,435,413 |
| 2,060,000 | | CIGNA Corp., 6.35%, 3/15/2018 | 2,096,322 |
| 4,000,000 | | UnitedHealth Group, Inc., Bond, 6.00%, 2/15/2018 | 4,265,127 |
| 740,000 | | Wellpoint, Inc., 5.85%, 1/15/2036 | 725,116 |
| | TOTAL | 10,378,479 |
Annual Shareholder Report16
|
| | Financial Institution — Insurance — Life – 3.1% | |
| $2,750,000 | | AXA-UAP, Sub. Note, 8.60%, 12/15/2030 | 3,206,756 |
| 3,860,000 | 1,2 | Massachusetts Mutual Life Insurance Co., Sub. Note, 8.875%, 6/1/2039 | 4,781,986 |
| 3,570,000 | | MetLife, Inc., 6.75%, 6/1/2016 | 4,103,178 |
| 1,000,000 | | MetLife, Inc., Jr. Sub. Note, 10.75%, 8/1/2069 | 1,218,331 |
| 3,400,000 | 1,2 | New York Life Insurance Co., Sub. Note, 6.75%, 11/15/2039 | 3,441,603 |
| 2,950,000 | 1,2 | Pacific Life Global Funding, Note, 5.15%, 4/15/2013 | 3,127,891 |
| 4,000,000 | 1,2 | Pacific LifeCorp., Bond, 6.60%, 9/15/2033 | 3,408,472 |
| 2,990,000 | | Prudential Financial, Inc., 5.15%, 1/15/2013 | 3,168,924 |
| 1,530,000 | | Prudential Financial, Inc., 6.625%, 12/1/2037 | 1,583,875 |
| 2,500,000 | | Prudential Financial, Inc., Sr. Unsecd. Note, 4.75%, 9/17/2015 | 2,559,157 |
| 3,950,000 | 1 | Union Central Life Insurance Co., Note, 8.20%, 11/1/2026 | 3,712,950 |
| | TOTAL | 34,313,123 |
| | Financial Institution — Insurance — P&C – 1.8% | |
| 2,940,000 | | ACE INA Holdings, Inc., 5.60%, 5/15/2015 | 3,246,420 |
| 540,000 | | CNA Financial Corp., 6.50%, 8/15/2016 | 537,233 |
| 1,370,000 | | CNA Financial Corp., Note, 6.00%, 8/15/2011 | 1,398,670 |
| 700,000 | | CNA Financial Corp., Sr. Unsecd. Note, 7.35%, 11/15/2019 | 713,185 |
| 1,710,000 | | Horace Mann Educators Corp., Sr. Note, 6.85%, 4/15/2016 | 1,720,333 |
| 4,000,000 | 1,2 | Liberty Mutual Group, Inc., Unsecd. Note, 5.75%, 3/15/2014 | 4,041,116 |
| 1,300,000 | 1,2 | Nationwide Mutual Insurance Co., Note, Series 144A, 9.375%, 8/15/2039 | 1,359,228 |
| 1,220,000 | | The Travelers Cos., Inc., Bond, 6.25%, 3/15/2067 | 1,107,124 |
| 265,000 | | The Travelers Cos., Inc., Sr. Unsecd. Note, 5.50%, 12/1/2015 | 296,758 |
| 1,000,000 | 1,2 | USF&G Corp., 8.312%, 7/1/2046 | 873,281 |
| 5,610,000 | 1,2 | ZFS Finance USA Trust I, Jr. Sub. Note, 6.15%, 12/15/2065 | 5,034,975 |
| | TOTAL | 20,328,323 |
| | Financial Institution — REITs – 1.6% | |
| 1,750,000 | | AMB Property LP, Company Guarantee, 6.125%, 12/1/2016 | 1,773,137 |
| 1,850,000 | | Avalonbay Communities, Inc., Sr. Unsecd. Note, Series MTN, 5.70%, 3/15/2017 | 1,937,923 |
| 3,500,000 | | Boston Properties LP, Sr. Unsecd. Note, 5.875%, 10/15/2019 | 3,600,381 |
| 1,500,000 | | Equity One, Inc., Bond, 6.00%, 9/15/2017 | 1,386,208 |
| 1,535,000 | | Liberty Property LP, 6.625%, 10/1/2017 | 1,557,569 |
| 720,000 | | Prologis, Conv. Bond, 2.25%, 4/1/2037 | 667,782 |
| 1,430,000 | | Simon Property Group LP, 6.125%, 5/30/2018 | 1,505,100 |
Annual Shareholder Report17
|
| $1,840,000 | | Simon Property Group LP, 6.75%, 5/15/2014 | 2,021,148 |
| 430,000 | | Simon Property Group, Inc., 6.35%, 8/28/2012 | 464,957 |
| 2,330,000 | | Simon Property Group, Inc., Note, 5.60%, 9/1/2011 | 2,448,520 |
| | TOTAL | 17,362,725 |
| | Municipal Services – 0.3% | |
| 1,825,000 | 1,2 | Army Hawaii Family Housing, 5.524%, 6/15/2050 | 1,311,792 |
| 2,980,000 | 1,2 | Camp Pendleton & Quantico Housing LLC, 5.572%, 10/1/2050 | 2,152,513 |
| | TOTAL | 3,464,305 |
| | Sovereign – 0.7% | |
| 5,350,000 | | Corp Andina De Fomento, Bond, 7.375%, 1/18/2011 | 5,671,504 |
| 2,475,000 | 1,2 | State of Qatar, 5.25%, 1/20/2020 | 2,507,794 |
| | TOTAL | 8,179,298 |
| | Technology – 1.7% | |
| 1,400,000 | | BMC Software, Inc., 7.25%, 6/1/2018 | 1,510,019 |
| 1,320,000 | | Cisco Systems, Inc., Sr. Unsecd. Note, 5.50%, 2/22/2016 | 1,487,100 |
| 1,100,000 | | Dell Computer Corp., Deb., 7.10%, 4/15/2028 | 1,229,020 |
| 3,630,000 | | Fiserv, Inc., Sr. Note, 6.80%, 11/20/2017 | 4,102,392 |
| 6,175,000 | | Harris Corp., 5.95%, 12/1/2017 | 6,704,392 |
| 965,000 | | IBM Corp., Deb., 8.375%, 11/1/2019 | 1,296,314 |
| 2,330,000 | | KLA-Tencor Corp., 6.90%, 5/1/2018 | 2,522,139 |
| | TOTAL | 18,851,376 |
| | Transportation — Airlines – 0.2% | |
| 710,000 | | Southwest Airlines Co., 6.50%, 3/1/2012 | 749,555 |
| 1,995,000 | | Southwest Airlines Co., Deb., 7.375%, 3/1/2027 | 1,898,653 |
| | TOTAL | 2,648,208 |
| | Transportation — Railroads – 1.2% | |
| 1,200,000 | | Burlington Northern Santa Fe Corp., 4.875%, 1/15/2015 | 1,289,231 |
| 2,086,262 | | Burlington Northern Santa Fe Corp., Pass Thru Cert., 7.57%, 1/2/2021 | 2,533,903 |
| 3,150,000 | | Canadian Pacific RR, 7.125%, 10/15/2031 | 3,478,900 |
| 655,000 | | Norfolk Southern Corp., Note, 6.75%, 2/15/2011 | 697,457 |
| 700,000 | | Norfolk Southern Corp., Sr. Unsecd. Note, 5.75%, 1/15/2016 | 768,492 |
| 1,000,000 | | Norfolk Southern Corp., Sr. Unsecd. Note, 5.75%, 4/1/2018 | 1,103,767 |
| 3,580,000 | | Union Pacific Corp., 4.875%, 1/15/2015 | 3,820,177 |
| | TOTAL | 13,691,927 |
| | Transportation — Services – 0.3% | |
| 3,080,000 | 1,2 | Enterprise Rent-A-Car USA Finance Co., 6.375%, 10/15/2017 | 3,223,260 |
Annual Shareholder Report18
|
| | Utility — Electric – 6.0% | |
| $2,650,000 | | Appalachian Power Co., Sr. Unsecd. Note, 7.95%, 1/15/2020 | 3,297,870 |
| 1,530,000 | | Cleveland Electric Illuminating Co., Sr. Unsecd. Note, 5.95%, 12/15/2036 | 1,479,662 |
| 4,670,000 | | Commonwealth Edison Co., 1st Mtg. Bond, 5.80%, 3/15/2018 | 5,119,660 |
| 1,180,000 | | Commonwealth Edison Co., 1st Mtg. Bond, 6.15%, 9/15/2017 | 1,325,776 |
| 1,375,000 | | Consolidated Edison Co., Sr. Unsecd. Note, 6.65%, 4/1/2019 | 1,620,150 |
| 2,390,000 | | Consolidated Natural Gas Co., 5.00%, 12/1/2014 | 2,594,799 |
| 2,000,000 | | Dominion Resources, Inc., Unsecd. Note, 5.95%, 6/15/2035 | 2,134,981 |
| 2,765,000 | | Duke Capital Corp., Sr. Note, 6.25%, 2/15/2013 | 3,027,478 |
| 1,480,000 | | Duke Energy Indiana, Inc., 1st Mtg. Bond, 6.35%, 8/15/2038 | 1,705,064 |
| 1,830,000 | 1,2 | Enel Finance International SA, Company Guarantee, Series 144A, 3.875%, 10/7/2014 | 1,882,133 |
| 5,150,000 | | Enersis S.A., Note, 7.40%, 12/1/2016 | 5,828,127 |
| 300,000 | | FPL Group Capital, Inc., 7.875%, 12/15/2015 | 370,157 |
| 2,680,000 | 1,2 | FirstEnergy Solutions Corp., Company Guarantee, Series 144A, 6.05%, 8/15/2021 | 2,828,653 |
| 3,400,000 | 1,2 | FirstEnergy Solutions Corp., Series 144A, 4.80%, 2/15/2015 | 3,594,445 |
| 3,338,360 | 1,2 | Great River Energy, 1st Mtg. Note, 5.829%, 7/1/2017 | 3,613,714 |
| 1,000,000 | | KCP&L Greater Missouri Operations Co., Sr. Unsecd. Note, 11.875%, 7/1/2012 | 1,164,050 |
| 1,330,000 | 1,2 | Korea Hydro & Nuclear Power Co. Ltd., Sr. Unsecd. Note, 6.25%, 6/17/2014 | 1,444,686 |
| 5,350,000 | | MidAmerican Energy Holdings Co., Sr. Unsecd. Note, 5.95%, 5/15/2037 | 5,682,758 |
| 1,460,000 | | National Rural Utilities Cooperative Finance Corp., 5.45%, 2/1/2018 | 1,579,815 |
| 2,930,000 | | National Rural Utilities Cooperative Finance Corp., Collateral Trust, 5.50%, 7/1/2013 | 3,231,340 |
| 800,000 | | National Rural Utilities Cooperative Finance Corp., Sr. Unsecd. Note, 10.375%, 11/1/2018 | 1,088,360 |
| 1,835,000 | | PPL Energy Supply LLC, Sr. Unsecd. Note, 6.00%, 12/15/2036 | 1,774,968 |
| 1,000,000 | | PSEG Power LLC, Company Guarantee, 7.75%, 4/15/2011 | 1,081,539 |
| 1,670,000 | | PSI Energy, Inc., Bond, 6.05%, 6/15/2016 | 1,863,225 |
| 1,810,000 | | Progress Energy, Inc., 7.05%, 3/15/2019 | 2,111,090 |
| 2,940,000 | | Union Electric Co., 6.00%, 4/1/2018 | 3,209,368 |
| 1,000,000 | | Virginia Electric & Power Co., Sr. Unsecd. Note, 5.00%, 6/30/2019 | 1,058,804 |
| 2,020,000 | | Westar Energy, Inc., 5.875%, 7/15/2036 | 1,911,753 |
| | TOTAL | 67,624,425 |
Annual Shareholder Report19
|
| | Utility — Natural Gas Distributor – 0.6% | |
| $1,690,000 | | Atmos Energy Corp., 5.125%, 1/15/2013 | 1,818,284 |
| 195,000 | | Atmos Energy Corp., 8.50%, 3/15/2019 | 246,862 |
| 1,300,000 | | Sempra Energy, Sr. Unsecd. Note, 6.00%, 10/15/2039 | 1,290,029 |
| 2,540,000 | | Sempra Energy, Sr. Unsecd. Note, 6.50%, 6/1/2016 | 2,833,034 |
| | TOTAL | 6,188,209 |
| | Utility — Natural Gas Pipelines – 1.1% | |
| 3,080,000 | | Enbridge, Inc., Sr. Note, 5.60%, 4/1/2017 | 3,358,630 |
| 580,000 | | Enterprise Products Operating LLC, 4.60%, 8/1/2012 | 614,579 |
| 3,850,000 | | Enterprise Products Operating LLC, Company Guarantee, 9.75%, 1/31/2014 | 4,694,089 |
| 3,300,000 | | Kinder Morgan Energy Partners LP, Sr. Unsecd. Note, 5.80%, 3/15/2035 | 3,112,063 |
| 830,000 | | Kinder Morgan Energy Partners LP, Sr. Unsecd. Note, 6.85%, 2/15/2020 | 947,983 |
| | TOTAL | 12,727,344 |
| | TOTAL CORPORATE BONDS
(IDENTIFIED COST $720,565,425) | 736,609,089 |
| | Corporate Note – 0.4% | |
| | Communications — Telecom Wirelines – 0.4% | |
| 4,595,000 | | Telecom Italia Capital, Note, 4.875%, 10/1/2010
(IDENTIFIED COST $4,593,135) | 4,727,198 |
| | Mortgage-Backed Securities – 0.0% | |
| 8,960 | | Federal Home Loan Mortgage Corp., Pool C00702, 6.00%, 1/1/2029 | 9,733 |
| 10,054 | | Federal Home Loan Mortgage Corp., Pool C00748, 6.00%, 4/1/2029 | 10,921 |
| 2,802 | | Federal Home Loan Mortgage Corp., Pool C20263, 6.00%, 1/1/2029 | 3,043 |
| 5,646 | | Federal Home Loan Mortgage Corp., Pool C25621, 6.50%, 5/1/2029 | 6,159 |
| 3,496 | | Federal Home Loan Mortgage Corp., Pool G10493, 6.00%, 4/1/2011 | 3,770 |
| 8,620 | | Federal National Mortgage Association, Pool 313324, 9.00%, 6/1/2017 | 9,644 |
| 10,243 | | Federal National Mortgage Association, Pool 323159, 7.50%, 4/1/2028 | 11,343 |
| 6,165 | | Federal National Mortgage Association, Pool 421223, 7.00%, 5/1/2028 | 6,831 |
| 6,285 | | Federal National Mortgage Association, Pool 429707, 6.50%, 5/1/2013 | 6,666 |
| 10,319 | | Federal National Mortgage Association, Pool 430232, 7.00%, 8/1/2028 | 11,435 |
| 39,681 | | Federal National Mortgage Association, Pool 439947, 6.50%, 11/1/2028 | 43,315 |
| 30,853 | | Federal National Mortgage Association, Pool 489867, 6.50%, 3/1/2029 | 33,679 |
| 7,570 | | Government National Mortgage Association, Pool 449491, 7.50%, 12/15/2027 | 8,354 |
| 3,088 | | Government National Mortgage Association, Pool 486467, 7.00%, 8/15/2028 | 3,400 |
Annual Shareholder Report20
|
| $14,209 | | Government National Mortgage Association, Pool 780339, 8.00%, 12/15/2023 | 15,743 |
| 9,318 | | Government National Mortgage Association, Pool 780340, 9.00%, 11/15/2017 | 10,396 |
| 8,480 | | Government National Mortgage Association, Pool 780373, 7.00%, 12/15/2023 | 9,303 |
| | TOTAL MORTGAGE-BACKED SECURITIES
(IDENTIFIED COST $187,022) | 203,735 |
| | Municipal – 0.2% | |
| | Municipal Services – 0.2% | |
| 2,080,000 | | Tampa, FL Sports Authority, 8.02% Bonds (GTD by National
Public Finance Guarantee Corporation), 10/1/2026
(IDENTIFIED COST $2,107,040) | 2,407,163 |
| | Governments/Agencies – 1.2% | |
| | Sovereign – 1.2% | |
| 3,500,000 | | Sweden, Government of, 10.25%, 11/1/2015 | 3,785,869 |
| 6,500,000 | | United Mexican States, 6.625%, 3/3/2015 | 7,374,250 |
| 1,871,000 | | United Mexican States, 6.75%, 9/27/2034 | 2,123,882 |
| | TOTAL GOVERNMENTS/AGENCIES
(IDENTIFIED COST $13,180,334) | 13,284,001 |
| | Common Stocks – 0.0% | |
| | Utility — Electric – 0.0% | |
| 113 | 3 | NRG Energy, Inc. (IDENTIFIED COST $2,554) | 2,705 |
| | Preferred Stocks – 0.4% | |
| | Financial Institution — Brokerage – 0.0% | |
| 130,000 | 3 | Lehman Brothers Holdings, Inc., Pfd. | 26,000 |
| | Financial Institution — REITs – 0.4% | |
| 80,000 | | Prologis, Cumulative REIT Perpetual Pfd. Stock, Series C,
$4.27, Annual Dividend | 3,740,000 |
| | TOTAL PREFERRED STOCKS
(IDENTIFIED COST $9,224,680) | 3,766,000 |
| | Asset-Backed Security – 0.0% | |
| | Home Equity Loan – 0.0% | |
| 137,340 | 1,2 | 125 Home Loan Owner Trust 1998-1A, Class B1, 9.76%, 2/15/2029
(IDENTIFIED COST $137,275) | 113,992 |
| | Collateralized Mortgage Obligations – 0.0% | |
| | Non-Agency Mortgage – 0.0% | |
| 47,856 | 1,2 | SMFC Trust Asset-Backed Certificates, 1997-A, Class 4, 4.542%, 1/28/2027 (IDENTIFIED COST $102,148) | 28,714 |
Annual Shareholder Report21
|
| | Mutual FundS – 30.7%;6 | |
| 54,857,192 | | High Yield Bond Portfolio | 337,371,730 |
| 5,811,651 | 7 | Prime Value Obligations Fund, Institutional Shares, 0.22% | 5,811,651 |
| | TOTAL MUTUAL FUNDS
(IDENTIFIED COST $422,714,102) | 343,183,381 |
| | TOTAL INVESTMENTS — 98.8%
(IDENTIFIED COST $1,172,813,715)8 | 1,104,325,978 |
| | OTHER ASSETS AND LIABILITIES - NET — 1.2%9 | 12,890,200 |
| | TOTAL NET ASSETS — 100% | $1,117,216,178 |
At November 30, 2009, the Fund had the following outstanding futures contracts:
| Description | Number of
Contracts | Notional
Value | Expiration
Date | Unrealized
Depreciation |
| 3U.S. Treasury Notes 10-Year Short Futures | 300 | $35,981,250 | March 2010 | $(502,150) |
Unrealized Depreciation on Futures Contracts is included in “Other Assets and Liabilities — Net.”
| 1 | Denotes a restricted security that either: (a) cannot be offered for public sale without first being registered, or being able to take advantage of an exemption from registration, under the Securities Act of 1933; or (b) is subject to a contractual restriction on public sales. At November 30, 2009, these restricted securities amounted to $126,861,439, which represented 11.4% of total net assets. |
| 2 | Denotes a restricted security that may be resold without restriction to “qualified institutional buyers” as defined in Rule 144A under the Securities Act of 1933 and that the Fund has determined to be liquid under criteria established by the Fund's Board of Directors (the “Directors”). At November 30, 2009, these liquid restricted securities amounted to $121,837,489, which represented 10.9% of total net assets. |
| 3 | Non-income producing security. |
| 4 | Issuer in default. |
| 5 | JPMorgan Chase & Co. has fully and unconditionally guaranteed Bear Stearns' outstanding registered debt securities. |
| 6 | Affiliated companies. |
| 7 | 7-Day net yield. |
| 8 | The cost of investments for federal tax purposes amounts to $1,176,766,766. |
| 9 | Assets, other than investments in securities, less liabilities. See Statement of Assets and Liabilities. |
Note: The categories of investments are shown as a percentage of total net assets at November 30, 2009.
Annual Shareholder Report22
Various inputs are used in determining the value of the Fund's investments. These inputs are summarized in the three broad levels listed below:Level 1 — quoted prices in active markets for identical securities
Level 2 — other significant observable inputs (including quoted prices for similar securities, interest rates, prepayment speeds, credit risk, etc.)
Level 3 — significant unobservable inputs (including the Fund's own assumptions in determining the fair value of investments)
The inputs or methodology used for valuing securities are not an indication of the risk associated with investing in those securities.
The following is a summary of the inputs used, as of November 30, 2009, in valuing the Fund's assets carried at fair value:
| Valuation Inputs | | | | |
| Level 1 —
Quoted
Prices and
Investments in
Mutual Funds | Level 2 —
Other
Significant
Observable
Inputs | Level 3 —
Significant
Unobservable
Inputs | Total |
| Debt Securities: | | | | |
| Corporate Bonds | $ — | $736,609,089 | $ — | $736,609,089 |
| Corporate Note | — | 4,727,198 | — | 4,727,198 |
| Mortgage-Backed Securities | — | 203,735 | — | 203,735 |
| Municipal | — | 2,407,163 | — | 2,407,163 |
| Governments/Agencies | — | 13,284,001 | — | 13,284,001 |
| Asset-Backed Security | — | 113,992 | — | 113,992 |
| Collateralized Mortgage Obligations | — | 28,714 | — | 28,714 |
| Equity Security: | | | | |
| Domestic | 3,768,705 | — | — | 3,768,705 |
| Mutual Funds | 343,183,381 | — | — | 343,183,381 |
| TOTAL SECURITIES | $346,952,086 | $757,373,892 | $ — | $1,104,325,978 |
| OTHER FINANCIAL INSTRUMENTS* | $(502,150) | $ — | $ — | $(502,150) |
| * | Other financial instruments include futures contracts. |
The following acronyms are used throughout this portfolio:
GTD — Guaranteed
REIT — Real Estate Investment Trust
See Notes which are an integral part of the Financial Statements
Annual Shareholder Report23
Statement of Assets and Liabilities
November 30, 2009
| Assets: | | |
| Total investments in securities, at value including $343,183,381 of investments in affiliated issuers (Note 5) (identified cost $1,172,813,715) | | $1,104,325,978 |
| Cash | | 1,579,259 |
| Restricted cash (Note 2) | | 540,000 |
| Income receivable | | 11,739,907 |
| Income receivable from affiliated issuers | | 2,504,705 |
| Receivable for shares sold | | 2,279,263 |
| TOTAL ASSETS | | 1,122,969,112 |
| Liabilities: | | |
| Payable for investments purchased | $2,833,963 | |
| Payable for shares redeemed | 1,458,613 | |
| Payable for daily variation margin | 18,750 | |
| Income distribution payable | 808,521 | |
| Payable for Directors'/Trustees' fees | 4,366 | |
| Payable for distribution services fee (Note 5) | 185,069 | |
| Payable for shareholder services fee (Note 5) | 218,526 | |
| Accrued expenses | 225,126 | |
| TOTAL LIABILITIES | | 5,752,934 |
| Net assets for 126,741,834 shares outstanding | | $1,117,216,178 |
| Net Assets Consist of: | | |
| Paid-in capital | | $1,217,168,903 |
| Net unrealized depreciation of investments and futures contracts | | (68,989,887) |
| Accumulated net realized loss on investments, futures contracts and swap contracts | | (30,804,667) |
| Distributions in excess of net investment income | | (158,171) |
| TOTAL NET ASSETS | | $1,117,216,178 |
Annual Shareholder Report24
Statement of Assets and Liabilities — continued| Net Asset Value, Offering Price and Redemption Proceeds Per Share | | |
| Class A Shares: | | |
| Net asset value per share ($628,675,038 ÷ 71,469,422 shares outstanding), no par value, 500,000,000 shares authorized | | $8.80 |
| Offering price per share (100/95.50 of $8.80) | | $9.21 |
| Redemption proceeds per share | | $8.80 |
| Class B Shares: | | |
| Net asset value per share ($155,906,548 ÷ 17,648,013 shares outstanding), no par value, 500,000,000 shares authorized | | $8.83 |
| Offering price per share | | $8.83 |
| Redemption proceeds per share (94.50/100 of $8.83) | | $8.34 |
| Class C Shares: | | |
| Net asset value per share ($146,219,708 ÷ 16,548,554 shares outstanding), no par value, 500,000,000 shares authorized | | $8.84 |
| Offering price per share | | $8.84 |
| Redemption proceeds per share (99.00/100 of $8.84) | | $8.75 |
| Class F Shares: | | |
| Net asset value per share ($178,466,476 ÷ 20,172,143 shares outstanding), no par value, 500,000,000 shares authorized | | $8.85 |
| Offering price per share (100/99.00 of $8.85) | | $8.94 |
| Redemption proceeds per share (99.00/100 of $8.85) | | $8.76 |
| Institutional Shares: | | |
| Net asset value per share ($7,948,408 ÷ 903,702 shares outstanding), no par value, 500,000,000 shares authorized | | $8.80 |
| Offering price per share | | $8.80 |
| Redemption proceeds per share | | $8.80 |
See Notes which are an integral part of the Financial Statements
Annual Shareholder Report25
Statement of Operations
Year Ended November 30, 2009
| Investment Income: | | | |
| Interest (including income on securities loaned of $17,877) | | | $44,236,457 |
| Dividends (including $27,001,643 received from affiliated issuers (Note 5)) | | | 27,169,881 |
| TOTAL INCOME | | | 71,406,338 |
| Expenses: | | | |
| Investment adviser fee (Note 5) | | $7,240,538 | |
| Administrative personnel and services fee (Note 5) | | 749,074 | |
| Custodian fees | | 40,595 | |
| Transfer and dividend disbursing agent fees and expenses | | 1,181,711 | |
| Directors'/Trustees' fees | | 19,604 | |
| Auditing fees | | 25,399 | |
| Legal fees | | 10,715 | |
| Portfolio accounting fees | | 188,517 | |
| Distribution services fee — Class B Shares (Note 5) | | 1,165,545 | |
| Distribution services fee — Class C Shares (Note 5) | | 866,225 | |
| Shareholder services fee — Class A Shares (Note 5) | | 1,132,236 | |
| Shareholder services fee — Class B Shares (Note 5) | | 388,515 | |
| Shareholder services fee — Class C Shares (Note 5) | | 283,145 | |
| Shareholder services fee — Class F Shares (Note 5) | | 370,247 | |
| Account administration fee — Class A Shares | | 1,771 | |
| Account administration fee — Class C Shares | | 4,284 | |
| Account administration fee — Class F Shares | | 2,538 | |
| Share registration costs | | 113,555 | |
| Printing and postage | | 118,647 | |
| Insurance premiums | | 5,294 | |
| Taxes | | 73,730 | |
| Miscellaneous | | 14,460 | |
| TOTAL EXPENSES | | 13,996,345 | |
Annual Shareholder Report26
Statement of Operations — continued| Waivers and Reimbursements (Note 5): | | | |
| Waiver/reimbursement of investment adviser fee | $(2,093,656) | | |
| Waiver of administrative personnel and services fee | (14,401) | | |
Reimbursement of shareholder services fee —
Class A Shares | (51,753) | | |
Reimbursement of shareholder services fee —
Class F Shares | (27,562) | | |
| TOTAL WAIVERS AND REIMBURSEMENTS | | $(2,187,372) | |
| Net expenses | | | $11,808,973 |
| Net investment income | | | 59,597,365 |
| Realized and Unrealized Gain on Investments, Futures Contracts and Swap Contracts: | | | |
| Net realized gain on investments (including realized gain of $439,560 on sales of investments in affiliated issuers) (Note 5) | | | 2,580,206 |
| Net realized loss on futures contracts | | | (931,048) |
| Net realized loss on swap contracts | | | (422,715) |
| Net change in unrealized depreciation of investments | | | 213,245,485 |
| Net change in unrealized appreciation of futures contracts | | | (1,310,153) |
| Net change in unrealized appreciation of swap contracts | | | (990,444) |
| Net realized and unrealized gain on investments, futures contracts and swap contracts | | | 212,171,331 |
| Change in net assets resulting from operations | | | $271,768,696 |
See Notes which are an integral part of the Financial Statements
Annual Shareholder Report27
Statement of Changes in Net Assets
| Year Ended November 30 | 2009 | 2008 |
| Increase (Decrease) in Net Assets | | |
| Operations: | | |
| Net investment income | $59,597,365 | $57,533,357 |
| Net realized gain on investments, futures contracts and swap contracts | 1,226,443 | 2,404,369 |
| Net change in unrealized appreciation/depreciation of investments, futures contracts and swap contracts | 210,944,888 | (217,251,002) |
| CHANGE IN NET ASSETS RESULTING FROM OPERATIONS | 271,768,696 | (157,313,276) |
| Distributions to Shareholders: | | |
| Distributions from net investment income | | |
| Class A Shares | (36,488,310) | (33,491,533) |
| Class B Shares | (9,277,951) | (10,432,404) |
| Class C Shares | (6,764,502) | (5,087,165) |
| Class F Shares | (10,018,945) | (9,204,919) |
| Institutional Shares | (199,857) | (11,838) |
| CHANGE IN NET ASSETS RESULTING FROM DISTRIBUTIONS TO SHAREHOLDERS | (62,749,565) | (58,227,859) |
| Share Transactions: | | |
| Proceeds from sale of shares | 303,446,367 | 230,394,578 |
| Net asset value of shares issued to shareholders in payment of distributions declared | 51,705,234 | 46,790,712 |
| Cost of shares redeemed | (269,128,587) | (321,174,417) |
| CHANGE IN NET ASSETS RESULTING FROM SHARE TRANSACTIONS | 86,023,014 | (43,989,127) |
| Change in net assets | 295,042,145 | (259,530,262) |
| Net Assets: | | |
| Beginning of period | 822,174,033 | 1,081,704,295 |
| End of period (including undistributed (distributions in excess of) net investment income of $(158,171) and $1,988,768, respectively) | $1,117,216,178 | $822,174,033 |
See Notes which are an integral part of the Financial Statements
Annual Shareholder Report28
Notes to Financial Statements
November 30, 2009
1. ORGANIZATION
Federated Investment Series Funds, Inc. (the “Corporation”) is registered under the Investment Company Act of 1940, as amended (the “Act”), as an open-end management investment company. The Corporation consists of one diversified portfolio, Federated Bond Fund (the “Fund”). The Fund offers five classes of shares: Class A Shares, Class B Shares, Class C Shares, Class F Shares and Institutional Shares. All shares of the Fund have equal rights with respect to voting, except on class-specific matters. The financial highlights of the Institutional Shares are presented separately. The investment objective of the Fund is to provide a high level of current income as is consistent with the preservation of capital.
Effective January 28, 2008, the Fund began offering Institutional Shares.
2. SIGNIFICANT ACCOUNTING POLICIES
The following is a summary of significant accounting policies consistently followed by the Fund in the preparation of its financial statements. These policies are in conformity with U.S. generally accepted accounting principles (GAAP).
Investment Valuation
In calculating its net asset value (NAV), the Fund generally values investments as follows:
- Fixed-income securities acquired with remaining maturities greater than 60 days are fair valued using price evaluations provided by a pricing service approved by the Directors.
- Fixed-income securities acquired with remaining maturities of 60 days or less are valued at their cost (adjusted for the accretion of any discount or amortization of any premium).
- Shares of other mutual funds are valued based upon their reported NAVs.
- Equity securities listed on an exchange or traded through a regulated market system are valued at their last reported sale price or official closing price in their principal exchange or market.
- Derivative contracts listed on exchanges are valued at their reported settlement or closing price.
- Over-the-counter (OTC) derivative contracts are fair valued using price evaluations provided by a pricing service approved by the Directors.
If the Fund cannot obtain a price or price evaluation from a pricing service for an investment, the Fund may attempt to value the investment based upon the mean of bid and asked quotations or fair value the investment based on price evaluations, from one or more dealers. If any price, quotation, price evaluation or other pricing source is not readily available when the NAV is calculated, the Fund uses the fair value of the investment determined in accordance with the procedures described below. There can be no assurance that the Fund could purchase or sell an investment at the price used to calculate the Fund's NAV.
Fair Valuation and Significant Events Procedures
The Directors have authorized the use of pricing services to provide evaluations of the current fair value of certain investments for purposes of calculating the NAV. Factors considered by pricing services in evaluating an investment include the yields or prices of investments of comparable quality, coupon, maturity, call rights and other potential prepayments, terms and type, reported transactions, indications as to values from dealers, and general market conditions. Some pricing services provide a single price evaluation reflecting the bid-side of the market for an investment (a “bid” evaluation). Other pricing services offer both bid Annual Shareholder Report29
evaluations and price evaluations indicative of a price between the prices bid and asked for the investment (a “mid” evaluation). The Fund normally uses bid evaluations for U.S. Treasury and Agency securities, mortgage-backed securities and municipal securities. The Fund normally uses mid evaluations for other types of fixed-income securities and OTC derivative contracts. In the event that market quotations and price evaluations are not available for an investment, the fair value of the investment is determined in accordance with procedures adopted by the Directors.The Directors also have adopted procedures requiring an investment to be priced at its fair value whenever the Adviser determines that a significant event affecting the value of the investment has occurred between the time as of which the price of the investment would otherwise be determined and the time as of which the NAV is computed. An event is considered significant if there is both an affirmative expectation that the investment's value will change in response to the event and a reasonable basis for quantifying the resulting change in value. Examples of significant events that may occur after the close of the principal market on which a security is traded, or after the time of a price evaluation provided by a pricing service or a dealer, include:
- With respect to securities traded in foreign markets, significant trends in U.S. equity markets or in the trading of foreign securities index futures or options contracts;
- With respect to price evaluations of fixed-income securities determined before the close of regular trading on the NYSE, actions by the Federal Reserve Open Market Committee and other significant trends in U.S. fixed-income markets;
- Political or other developments affecting the economy or markets in which an issuer conducts its operations or its securities are traded; and
- Announcements concerning matters such as acquisitions, recapitalizations, litigation developments, a natural disaster affecting the issuer's operations or regulatory changes or market developments affecting the issuer's industry.
The Directors have approved the use of a pricing service to determine the fair value of equity securities traded principally in foreign markets when the Adviser determines that there has been a significant trend in the U.S. equity markets or in index futures trading. For other significant events, the Fund may seek to obtain more current quotations or price evaluations from alternative pricing sources. If a reliable alternative pricing source is not available, the Fund will determine the fair value of the investment using another method approved by the Directors.
Repurchase Agreements
It is the policy of the Fund to require the other party to a repurchase agreement to transfer to the Fund's custodian or sub-custodian eligible securities or cash with a market value (after transaction costs) at least equal to the repurchase price to be paid under the repurchase agreement. The eligible securities are transferred to accounts with the custodian or sub-custodian in which the Fund holds a “securities entitlement” and exercises “control” as those terms are defined in the Uniform Commercial Code. The Fund has established procedures for monitoring the market value of the transferred securities and requiring the transfer of additional eligible securities if necessary to equal at least the repurchase price. These procedures also allow the other party to require securities to be transferred from the account to the extent that their market value exceeds the repurchase price or in exchange for other eligible securities of equivalent market value.
Annual Shareholder Report30
With respect to agreements to repurchase U.S. government securities and cash items, the Fund treats the repurchase agreement as an investment in the underlying securities and not as an obligation of the other party to the repurchase agreement. Other repurchase agreements are treated as obligations of the other party secured by the underlying securities. Nevertheless, the insolvency of the other party or other failure to repurchase the securities may delay the disposition of the underlying securities or cause the Fund to receive less than the full repurchase price. Under the terms of the repurchase agreement, any amounts received by the Fund in excess of the repurchase price and related transaction costs must be remitted to the other party.The Fund may enter into repurchase agreements in which eligible securities are transferred into joint trading accounts maintained by the custodian or sub-custodian for investment companies and other clients advised by the Fund's Adviser and its affiliates. The Fund will participate on a pro rata basis with the other investment companies and clients in its share of the securities transferred under such repurchase agreements and in its share of proceeds from any repurchase or other disposition of such securities.
Investment Income, Gains and Losses, Expenses and Distributions
Investment transactions are accounted for on a trade-date basis. Realized gains and losses from investment transactions are recorded on an identified-cost basis. Interest income and expenses are accrued daily. Dividend income and distributions to shareholders are recorded on the ex-dividend date. Foreign dividends are recorded on the ex-dividend date or when the Fund is informed of the ex-dividend date. Distributions of net investment income are declared and paid monthly. Non-cash dividends included in dividend income, if any, are recorded at fair value. Investment income, realized and unrealized gains and losses and certain fund-level expenses are allocated to each class based on relative average daily net assets, except that each class may bear certain expenses unique to that class such as account administration, distribution services and shareholder services fees. Dividends are declared separately for each class. No class has preferential dividend rights; differences in per share dividend rates are generally due to differences in separate class expenses.
Premium and Discount Amortization/Paydown Gains and Losses
All premiums and discounts on fixed-income securities are amortized/accreted for financial statement purposes. Gains and losses realized on principal payment of mortgage-backed securities (paydown gains and losses) are classified as part of investment income.
Federal Taxes
It is the Fund's policy to comply with the Subchapter M provision of the Internal Revenue Code (the “Code”) and to distribute to shareholders each year substantially all of its income. Accordingly, no provision for federal income tax is necessary. As of and during the year ended November 30, 2009, the Fund did not have a liability for any uncertain tax positions. The Fund recognizes interest and penalties, if any, related to tax liabilities as income tax expense in the Statement of Operations. As of November 30, 2009, tax years 2006 through 2009 remain subject to examination by the Fund's major tax jurisdictions, which include the United States of America, the state of Maryland and the Commonwealth of Pennsylvania.
Other Taxes
As an open-end management investment company incorporated in the state of Maryland but domiciled in the Commonwealth of Pennsylvania, the Fund is subject to the Pennsylvania Franchise Tax. This franchise tax is assessed annually on the value of the Fund, as represented by average net assets for the tax year.
Annual Shareholder Report31
When-Issued and Delayed Delivery TransactionsThe Fund may engage in when-issued or delayed delivery transactions. The Fund records when-issued securities on the trade date and maintains security positions such that sufficient liquid assets will be available to make payment for the securities purchased. Securities purchased on a when-issued or delayed delivery basis are marked to market daily and begin earning interest on the settlement date. Losses may occur on these transactions due to changes in market conditions or the failure of counterparties to perform under the contract.
Swap Contracts
Swap contracts involve two parties that agree to exchange the returns (or the differential in rates of return) earned or realized on particular predetermined investments, instruments, indices or other measures. The gross returns to be exchanged or “swapped” between parties are generally calculated with respect to a “notional amount” for a predetermined period of time. The Fund may enter into interest rate, total return, credit default, and other swap agreements. Risks may arise upon entering into swap agreements from the potential inability of the counterparties to meet the terms of their contract from unanticipated changes in the value of the swap agreement.
The Fund uses credit default swaps to manage exposure to a given issuer or sector by either selling protection to increase exposure, or buying protection to reduce exposure. The “buyer” in a credit default swap is obligated to pay the “seller” a periodic stream of payments over the term of the contract provided that no event of default on an underlying reference obligation has occurred. If an event of default occurs, the seller must pay the buyer the full notional value, or the “par value,” of the reference obligation in exchange for the reference obligation. In connection with these agreements, securities may be identified as collateral in accordance with the terms of the respective swap agreements to provide assets of value and recourse in the event of default or bankruptcy/insolvency. Recovery values are assumed by market makers considering either industry standard recovery rates or entity specific factors and considerations until a credit event occurs. If a credit event has occurred, the recovery value is typically determined by a facilitated auction whereby a minimum number of allowable broker bids, together with a specific valuation method, are used to calculate the settlement value.The maximum amount of the payment that may occur, as a result of a credit event payable by the protection seller, is equal to the notional amount of the underlying index or security.
The Fund's maximum risk of loss from counterparty credit risk, either as the protection buyer or as the protection seller, is the fair value of the contract. This risk is mitigated by having a master netting arrangement between the Fund and the counterparty and by the posting of collateral by the counterparty to the Fund to cover the Fund's exposure to the counterparty.
Upfront payments received or paid by the Fund will be reflected as an asset or liability on the Statement of Assets and Liabilities. Changes in the value of swap contracts are included in Swaps, at value on the Statement of Assets and Liabilities, and periodic payments are reported as Net realized gain or loss on swap contracts in the Statement of Operations.
At November 30, 2009, the Fund had no outstanding swap contracts.
Futures Contracts
The Fund purchases and sells financial futures contracts to manage cash flows, enhance yield and to potentially reduce transaction costs. Upon entering into a financial futures contract with a broker, the Fund is required to deposit in a segregated account a specified amount of cash or U.S. government securities which is shown as Restricted Cash in the Statement of Annual Shareholder Report32
Assets and Liabilities. Futures contracts are valued daily and unrealized gains or losses are recorded in a “variation margin” account. Daily, the Fund receives from or pays to the broker a specified amount of cash based upon changes in the variation margin account. When a contract is closed, the Fund recognizes a realized gain or loss. Futures contracts have market risks, including the risk that the change in the value of the contract may not correlate with the changes in the value of the underlying securities. There is minimal counterparty risk to the Fund since futures are exchange traded and the exchange's clearinghouse, as counterparty to all exchange traded futures, guarantees the futures against default.Futures contracts outstanding at period end are listed after the Fund's Portfolio of Investments.
Securities Lending
The Fund participates in a securities lending program providing for the lending of corporate bonds and government securities to qualified brokers. The Fund normally receives cash collateral for securities loaned that is invested in an affiliated money market fund. Collateral is maintained at a minimum level of 100% of the market value of investments loaned, plus interest, if applicable. Earnings on collateral are allocated between the securities lending agent, as a fee for its services under the program, and the Fund, according to agreed-upon rates.
As of November 30, 2009, the Fund had no outstanding securities on loan.
Restricted Securities
The Fund may purchase securities which are considered restricted. Restricted securities are securities that either: (a) cannot be offered for public sale without first being registered, or being able to take advantage of an exemption from registration, under the Securities Act of 1933; or (b) are subject to contractual restrictions on public sales. In some cases, when a security cannot be offered for public sale without first being registered, the issuer of the restricted security has agreed to register such securities for resale, at the issuer's expense, either upon demand by the Fund or in connection with another registered offering of the securities. Many such restricted securities may be resold in the secondary market in transactions exempt from registration. Restricted securities may be determined to be liquid under criteria established by the Directors. The Fund will not incur any registration costs upon such resales. The Fund's restricted securities are valued at the price provided by dealers in the secondary market or, if no market prices are available, at the fair value as determined in accordance with procedures established by and under the general supervision of the Directors.
Additional information on restricted securities, excluding securities purchased under Rule 144A, if applicable, that have been deemed liquid by the Directors, held at November 30, 2009, is as follows:
| Security | Acquisition Date | Acquisition Cost | Market Value |
| Fertinitro Finance, Company Guarantee, 8.29%, 4/1/2020 | 5/14/1999 | $1,443,791 | $1,311,000 |
| Union Central Life Insurance Co., Note, 8.20%, 11/1/2026 | 10/31/1996 — 3/31/1999 | $4,048,581 | $3,712,950 |
Annual Shareholder Report33
Additional Disclosure Related to Derivative Instruments
| Fair Value of Derivative Instruments |
| Asset | Liability |
| Year Ended | Statement of
Assets and
Liabilities
Location | Fair
Value | Statement of
Assets and
Liabilities
Location | Fair
Value |
| Derivatives not accounted for as hedging instruments under ASC Topic 815 | | | | |
| Interest rate contracts | $ — | $ — | Payable for daily variation margin | $502,150* |
| * | Includes cumulative appreciation/depreciation of futures contracts as reported in the footnotes to the Portfolio of Investments. Only the current day's variation margin is reported within the Statement of Assets and Liabilities. |
The Effect of Derivative Instruments on the Statement of Operations for the Year Ended November 30, 2009
| Amount of Realized Gain or (Loss) on Derivatives Recognized in Income |
| Credit
Default
Swaps | Futures | Total |
| Interest rate contracts | $ — | $(931,048) | $(931,048) |
| Credit contracts | $(422,715) | $ — | $(422,715) |
| TOTAL | $(422,715) | $(931,048) | $(1,353,763) |
| Change in Unrealized Appreciation or (Depreciation) on Derivatives Recognized in Income |
| Credit
Default
Swaps | Futures | Total |
| Interest rate contracts | $ — | $(1,310,153) | $(1,310,153) |
| Credit contracts | $(990,444) | $ — | $(990,444) |
| TOTAL | $(990,444) | $(1,310,153) | $(2,300,597) |
Other
The preparation of financial statements in conformity with GAAP requires management to make estimates and assumptions that affect the amounts of assets, liabilities, expenses and revenues reported in the financial statements. Actual results could differ from those estimated.
Annual Shareholder Report34
3. shares of beneficial interestThe following tables summarize capital stock activity:
| Year Ended November 30 | 2009 | 2008 |
| Class A Shares: | Shares | Amount | Shares | Amount |
| Shares sold | 22,949,487 | $179,956,178 | 18,152,769 | $155,216,873 |
| Shares issued to shareholders in payment of distributions declared | 3,956,959 | 31,203,068 | 3,348,264 | 27,745,544 |
| Shares redeemed | (20,038,063) | (156,745,929) | (21,570,297) | (179,522,982) |
NET CHANGE RESULTING
FROM CLASS A SHARE TRANSACTIONS | 6,868,383 | $54,413,317 | (69,264) | $3,439,435 |
| Year Ended November 30 | 2009 | 2008 |
| Class B Shares: | Shares | Amount | Shares | Amount |
| Shares sold | 2,115,652 | $16,694,977 | 2,376,504 | $20,222,630 |
| Shares issued to shareholders in payment of distributions declared | 982,901 | 7,732,332 | 1,013,160 | 8,452,440 |
| Shares redeemed | (7,044,251) | (55,706,302) | (8,347,211) | (69,982,417) |
NET CHANGE RESULTING
FROM CLASS B SHARE TRANSACTIONS | (3,945,698) | $(31,278,993) | (4,957,547) | $(41,307,347) |
| Year Ended November 30 | 2009 | 2008 |
| Class C Shares: | Shares | Amount | Shares | Amount |
| Shares sold | 7,558,907 | $59,584,453 | 3,539,802 | $29,931,524 |
| Shares issued to shareholders in payment of distributions declared | 565,347 | 4,499,185 | 390,595 | 3,239,427 |
| Shares redeemed | (3,490,897) | (27,688,050) | (3,424,887) | (28,682,566) |
NET CHANGE RESULTING
FROM CLASS C SHARE TRANSACTIONS | 4,633,357 | $36,395,588 | 505,510 | $4,488,385 |
| Year Ended November 30 | 2009 | 2008 |
| Class F Shares: | Shares | Amount | Shares | Amount |
| Shares sold | 4,921,060 | $39,389,184 | 2,855,111 | $24,661,323 |
| Shares issued to shareholders in payment of distributions declared | 1,019,023 | 8,092,364 | 880,587 | 7,341,583 |
| Shares redeemed | (3,537,719) | (28,079,360) | (5,098,851) | (42,947,379) |
NET CHANGE RESULTING
FROM CLASS F SHARE TRANSACTIONS | 2,402,364 | $19,402,188 | (1,363,153) | $(10,944,473) |
Annual Shareholder Report35
| Year Ended November 30 | 2009 | 20081 |
| Institutional Shares: | Shares | Amount | Shares | Amount |
| Shares sold | 954,358 | $7,821,575 | 41,949 | $362,228 |
| Shares issued to shareholders in payment of distributions declared | 21,208 | 178,285 | 1,462 | 11,718 |
| Shares redeemed | (110,624) | (908,946) | (4,651) | (39,073) |
NET CHANGE RESULTING
FROM INSTITUTIONAL SHARE TRANSACTIONS | 864,942 | $7,090,914 | 38,760 | $334,873 |
| NET CHANGE RESULTING FROM FUND SHARE TRANSACTIONS | 10,823,348 | $86,023,014 | (5,845,694) | $(43,989,127) |
| 1 | Reflects operations from January 28, 2008 (date of initial investment) to November 30, 2008. |
4. FEDERAL TAX INFORMATION
The timing and character of income and capital gain distributions are determined in accordance with income tax regulations, which may differ from GAAP. These differences are the result of differing treatments for discount accretion/premium amortization on debt securities, swap income, reclassification of credit default swaps and litigation settlement payments.
For the year ended November 30, 2009, permanent differences identified and reclassified among the components of net assets were as follows:
| Increase (Decrease) |
| Paid-In Capital | Undistributed
Net Investment
Income (Loss) | Accumulated
Net Realized
Gain (Loss) |
| $(78,804) | $1,005,261 | $(926,457) |
Net investment income (loss), net realized gains (losses), and net assets were not affected by this reclassification.
The tax character of distributions as reported on the Statement of Changes in Net Assets for the years ended November 30, 2009 and 2008, was as follows:
| 2009 | 2008 |
| Ordinary income | $62,749,565 | $58,227,859 |
As of November 30, 2009, the components of distributable earnings on a tax basis were as follows:
| Distributions in excess of ordinary income | $(143,004) |
| Net unrealized depreciation | $(72,440,788) |
| Capital loss carryforwards | $(27,368,933) |
The difference between book-basis and tax-basis net unrealized appreciation/depreciation is attributable in part to differing treatments for the deferral of losses on wash sales, defaulted bond interest and discount accretion/premium amortization on debt securities.
Annual Shareholder Report36
At November 30, 2009, the cost of investments for federal tax purposes was $1,176,766,766. The net unrealized depreciation of investments for federal tax purposes excluding any unrealized depreciation resulting from futures contracts was $72,440,788. This consists of net unrealized appreciation from investments for those securities having an excess of value over cost of $42,666,261 and net unrealized depreciation from investments for those securities having an excess of cost over value of $115,107,049.At November 30, 2009, the Fund had a capital loss carryforward of $27,368,933 which will reduce the Fund's taxable income arising from future net realized gains on investments, if any, to the extent permitted by the Code and thus will reduce the amount of distributions to shareholders which would otherwise be necessary to relieve the Fund of any liability for federal income tax. Pursuant to the Code, such capital loss carryforward will expire as follows:
| Expiration Year | Expiration Amount |
| 2010 | $15,739,984 |
| 2011 | $2,824,073 |
| 2014 | $5,262,184 |
| 2017 | $3,542,692 |
5. INVESTMENT ADVISER FEE AND OTHER TRANSACTIONS WITH AFFILIATES
Investment Adviser Fee
Federated Investment Management Company is the Fund's investment adviser (the “Adviser”). The advisory agreement between the Fund and the Adviser provides for an annual fee equal to 0.75% of the Fund's average daily net assets. Subject to the terms described in the Expense Limitation note, the Adviser may voluntarily choose to waive any portion of its fee. The Adviser can modify or terminate this voluntary waiver at any time at its sole discretion. For the year ended November 30, 2009, the Adviser waived $2,086,372 of its fee.
Pursuant to a settlement with the New York Attorney General, the Adviser has agreed to waive investment adviser fees in compliance with an Assurance of Discontinuance dated November 17, 2005. The net adviser fee was reduced to 0.5557% effective January 1, 2006 and may not be increased until after December 31, 2010.
Administrative Fee
Federated Administrative Services (FAS), under the Administrative Services Agreement, provides the Fund with administrative personnel and services. The fee paid to FAS is based on the average aggregate daily net assets of certain Federated funds as specified below:
| Administrative Fee | Average Aggregate Daily Net Assets
of the Federated Funds |
| 0.150% | on the first $5 billion |
| 0.125% | on the next $5 billion |
| 0.100% | on the next $10 billion |
| 0.075% | on assets in excess of $20 billion |
Annual Shareholder Report37
The administrative fee received during any fiscal year shall be at least $150,000 per portfolio and $40,000 per each additional class of Shares. Subject to the terms described in the Expense Limitation note, FAS may voluntarily choose to waive any portion of its fee. FAS can modify or terminate this voluntary waiver at any time at its sole discretion. For the year ended November 30, 2009, the net fee paid to FAS was 0.076% of average daily net assets of the Fund. FAS waived $14,401 of its fee.
Distribution Services Fee
The Fund has adopted a Distribution Plan (the “Plan”) pursuant to Rule 12b-1 under the Act. Under the terms of the Plan, the Fund will compensate Federated Securities Corp. (FSC), the principal distributor, from the daily net assets of the Fund's Class A Shares, Class B Shares and Class C Shares to finance activities intended to result in the sale of these shares. The Plan provides that the Fund may incur distribution expenses at the following percentages of average daily net assets annually, to compensate FSC:
| Share Class Name | Percentage of Average Daily
Net Assets of Class |
| Class A Shares | 0.05% |
| Class B Shares | 0.75% |
| Class C Shares | 0.75% |
Subject to the terms described in the Expense Limitation note, FSC may voluntarily choose to waive any portion of its fee. FSC can modify or terminate this voluntary waiver at any time at its sole discretion. When FSC receives fees, it may pay some or all of them to financial intermediaries whose customers purchase shares. For the year ended November 30, 2009, FSC retained $232,782 of fees paid by the Fund. On November 15, 2007, the Fund's Directors approved an amendment to the Plan to reduce the distribution services fee for the Fund's Class A Shares from 0.25% to 0.05%. The amendment to the Plan became effective for the Fund on January 31, 2008. For the year ended November 30, 2009, the Fund's Class A Shares did not incur a distribution services fee; however, it may begin to incur this fee upon approval of the Directors.
Sales Charges
Front-end sales charges and contingent deferred sales charges (CDSC) do not represent expenses of the Fund. They are deducted from the proceeds of sales of Fund shares prior to investment or from redemption proceeds prior to remittance, as applicable. For the year ended November 30, 2009, FSC retained $158,339 in sales charges from the sale of Class A Shares. FSC also retained $5,782 relating to redemptions of Class C Shares and $3,435 relating to redemptions of Class F Shares.
Shareholder Services Fee
The Fund may pay fees (Service Fees) up to 0.25% of the average daily net assets of the Fund's Class A Shares, Class B Shares, Class C Shares and Class F Shares to financial intermediaries or to Federated Shareholder Services Company (FSSC) for providing services to shareholders and maintaining shareholder accounts. Subject to the terms described in the Expense Limitation note, FSSC may voluntarily reimburse the Fund for shareholder services fees. This voluntary reimbursement can be modified or terminated at any time. For the year ended November 30, 2009, FSSC voluntarily reimbursed $79,315 of shareholder services fees. For the year ended November 30, 2009, FSSC did not receive any fees paid by the Fund.
Annual Shareholder Report38
Expense LimitationThe Adviser and its affiliates (which may include FSC, FAS and FSSC) have voluntarily agreed to waive their fees and/or reimburse expenses so that the total operating expenses (as shown in the financial highlights) paid by the Fund's Class A Shares, Class B Shares, Class C Shares, Class F Shares and Institutional Shares (after the voluntary waivers and reimbursements) will not exceed 0.99%, 1.79%, 1.79%, 1.02% and 0.79%, respectively, through the later of (the “Termination Date”): (a) January 31, 2011; or (b) the date of the Fund's next effective Prospectus. While the Adviser and affiliates currently do not anticipate terminating these arrangements prior to the Termination Date, these arrangements may only be terminated prior to the Termination Date with the agreement of the Directors.
General
Certain Officers and Directors of the Fund are Officers and Directors or Trustees of the above companies.
Transactions with Affiliated Companies
Affiliated holdings are mutual funds which are managed by the Adviser or an affiliate of the Adviser. The Adviser has agreed to reimburse the Fund for certain investment adviser fees as a result of transactions in other affiliated mutual funds. For the year ended November 30, 2009, the Adviser reimbursed $7,284. Transactions with affiliated companies during the year ended November 30, 2009 were as follows:
| Affiliates | Balance of
Shares Held
11/30/2008 | Purchases/
Additions | Sales/
Reductions | Balance of
Shares Held
11/30/2009 | Value | Dividend
Income
|
| High Yield Bond Portfolio | 41,524,332 | 13,699,160 | 366,300 | 54,857,192 | $337,371,730 | $26,956,158 |
| Prime Value Obligations Fund, Institutional Shares | — | 227,992,398 | 222,180,747 | 5,811,651 | 5,811,651 | 45,485 |
TOTAL OF AFFILIATED
TRANSACTIONS | 41,524,332 | 241,691,558 | 222,547,047 | 60,668,843 | $343,183,381 | $27,001,643 |
Pursuant to an Exemptive Order issued by the Securities and Exchange Commission (SEC), the Fund may invest in portfolios of Federated Core Trust (Core Trust), which is managed by Federated Investment Management Company, the Fund's adviser. Core Trust is an open-end management company, registered under the Act, available only to registered investment companies and other institutional investors. The investment objective of High Yield Bond Portfolio, a portfolio of Core Trust, is to seek high current income. Federated Investors, Inc. receives no advisory or administrative fees from the Funds within the Core Trust. Income distributions from Core Trust are declared daily and paid monthly, and are recorded by the Fund as dividend income. Capital gain distributions, if any, from Core Trust are declared and paid annually, and are recorded by the Fund as capital gains. The performance of the Fund is directly affected by the performance of the Core Trust. A copy of the Core Trust's financial statements is available on the EDGAR Database on the SEC's website or upon request from the Fund.
Annual Shareholder Report39
6. Investment TRANSACTIONSPurchases and sales of investments, excluding long-term U.S. government securities and short-term obligations, for the year ended November 30, 2009, were as follows:
| Purchases | $307,560,505 |
| Sales | $237,549,853 |
7. LINE OF CREDIT
The Fund participates in a $100,000,000 unsecured, uncommitted revolving line of credit (LOC) agreement with PNC Bank. The LOC was made available for extraordinary or emergency purposes, primarily for financing redemption payments. Borrowings are charged interest at a rate offered to the Fund by PNC Bank at the time of the borrowing. As of November 30, 2009, there were no outstanding loans. During the year ended November 30, 2009, the Fund did not utilize the LOC.
8. INTERFUND LENDING
Pursuant to an Exemptive Order issued by the SEC, the Fund, along with other funds advised by subsidiaries of Federated Investors, Inc., may participate in an interfund lending program. This program provides an alternative credit facility allowing the Fund to borrow from other participating affiliated funds. As of November 30, 2009, there were no outstanding loans. During the year ended November 30, 2009, the program was not utilized.
9. Legal Proceedings
Since October 2003, Federated Investors, Inc. and related entities (collectively, “Federated”), and various Federated funds (Federated Funds) have been named as defendants in several class action lawsuits now pending in the United States District Court for the District of Maryland. The lawsuits were purportedly filed on behalf of people who purchased, owned and/or redeemed shares of Federated-sponsored mutual funds during specified periods beginning November 1, 1998. The suits are generally similar in alleging that Federated engaged in illegal and improper trading practices including market timing and late trading in concert with certain institutional traders, which allegedly caused financial injury to the mutual fund shareholders. These lawsuits began to be filed shortly after Federated's first public announcement that it had received requests for information on shareholder trading activities in the Federated Funds from the SEC, the Office of the New York State Attorney General (NYAG), and other authorities. In that regard, on November 28, 2005, Federated announced that it had reached final settlements with the SEC and the NYAG with respect to those matters. As Federated previously reported in 2004, it has already paid approximately $8.0 million to certain funds as determined by an independent consultant. As part of these settlements, Federated agreed to pay for the benefit of fund shareholders additional disgorgement and a civil money penalty in the aggregate amount of an additional $72 million. Federated entities have also been named as defendants in several additional lawsuits that are now pending in the United States District Court for the Western District of Pennsylvania, alleging, among other things, excessive advisory and Rule 12b-1 fees. The Board of the Federated Funds retained the law firm of Dickstein Shapiro LLP to represent the Federated Funds in these lawsuits. Federated and the Federated Funds, and their respective counsel have been defending this litigation, and none of the Federated Funds remains a defendant in any of the lawsuits (though some could potentially receive any recoveries as nominal defendants). Additional lawsuits based upon similar allegations may be filed in the future. The potential impact of these Annual Shareholder Report40
lawsuits, all of which seek unquantified damages, attorneys' fees and expenses, and future potential similar suits is uncertain. Although we do not believe that these lawsuits will have a material adverse effect on the Federated Funds, there can be no assurance that these suits, the ongoing adverse publicity and/or other developments resulting from the regulatory investigations will not result in increased Federated Fund redemptions, reduced sales of Federated Fund shares, or other adverse consequences for the Federated Funds.10. Subsequent events
Management has evaluated subsequent events through January 22, 2010, the date the financial statements were issued, and determined that no events have occurred that require additional disclosure.
Annual Shareholder Report41
Report of Independent Registered Public Accounting Firm
TO THE BOARD OF DIRECTORS OF Federated investment series funds, inc. AND SHAREHOLDERS OF federated bond fund:
We have audited the accompanying statement of assets and liabilities of Federated Bond Fund (the “Fund”) (the sole portfolio constituting Federated Investment Series, Inc.), including the portfolio of investments, as of November 30, 2009, and the related statement of operations for the year then ended, the statements of changes in net assets for each of the periods indicated therein, and the financial highlights for each of the periods indicated therein. These financial statements and financial highlights are the responsibility of the Fund's management. Our responsibility is to express an opinion on these financial statements and financial highlights based on our audits.
We conducted our audits in accordance with standards of the Public Company Accounting Oversight Board (United States). Those standards require that we plan and perform the audit to obtain reasonable assurance about whether the financial statements and financial highlights are free of material misstatement. We were not engaged to perform an audit of the Fund's internal control over financial reporting. Our audits included consideration of internal control over financial reporting as a basis for designing audit procedures that are appropriate in the circumstances, but not for the purpose of expressing an opinion on the effectiveness of the Fund's internal control over financial reporting. Accordingly, we express no such opinion. An audit also includes examining, on a test basis, evidence supporting the amounts and disclosures in the financial statements and financial highlights, assessing the accounting principles used and significant estimates made by management, and evaluating the overall financial statement presentation. Our procedures included confirmation of securities owned as of November 30, 2009, by correspondence with the custodian and brokers or by other appropriate auditing procedures where replies from brokers were not received. We believe that our audits provide a reasonable basis for our opinion.
In our opinion, the financial statements and financial highlights referred to above present fairly, in all material respects, the financial position of Federated Bond Fund, a portfolio of Federated Investment Series Funds, Inc., at November 30, 2009, the results of its operations for the year then ended, the changes in its net assets for each of the periods indicated therein, and the financial highlights for each of the periods indicated therein, in conformity with U.S. generally accepted accounting principles.
Boston, Massachusetts
January 22, 2010
Annual Shareholder Report42
Board of Directors and Corporation Officers
The Board is responsible for managing the Corporation's business affairs and for exercising all the Corporation's powers except those reserved for the shareholders. The following tables give information about each Board member and the senior officers of the Fund. Where required, the tables separately list Board members who are “interested persons” of the Fund (i.e., “Interested” Board members) and those who are not (i.e., “Independent” Board members). Unless otherwise noted, the address of each person listed is Federated Investors Tower, 1001 Liberty Avenue, Pittsburgh, PA 15222. The address of all Independent Board members listed is 4000 Ericsson Drive, Warrendale, PA 15086-7561; Attention: Mutual Fund Board. As of December 31, 2009, the Corporation comprised one portfolio(s), and the Federated Fund Complex consisted of 43 investment companies (comprising 145 portfolios). Unless otherwise noted, each Officer is elected annually. Unless otherwise noted, each Board member oversees all portfolios in the Federated Fund Complex and serves for an indefinite term. The Fund's Statement of Additional Information includes additional information about Corporation Directors and is available, without charge and upon request, by calling 1-800-341-7400.
Interested DIRECTORS Background
Name
Birth Date
Positions Held with Corporation
Date Service Began | Principal Occupation(s) for Past Five Years,
Other Directorships Held and Previous Position(s) |
John F. Donahue*
Birth Date: July 28, 1924
DIRECTOR
Began serving: May 1992 | Principal Occupations: Director or Trustee of the Federated Fund Complex; Chairman and Director, Federated Investors, Inc.; Chairman of the Federated Fund Complex's Executive Committee.
Previous Positions: Chairman of the Federated Fund Complex; Trustee, Federated Investment Management Company; Chairman and Director, Federated Investment Counseling. |
J. Christopher Donahue*
Birth Date: April 11, 1949
PRESIDENT AND DIRECTOR
Began serving: May 1992 | Principal Occupations: Principal Executive Officer and President of the Federated Fund Complex; Director or Trustee of some of the Funds in the Federated Fund Complex; President, Chief Executive Officer and Director, Federated Investors, Inc.; Chairman and Trustee, Federated Investment Management Company; Trustee, Federated Investment Counseling; Chairman and Director, Federated Global Investment Management Corp.; Chairman, Federated Equity Management Company of Pennsylvania and Passport Research, Ltd. (investment advisory subsidiary of Federated); Trustee, Federated Shareholder Services Company; Director, Federated Services Company.
Previous Positions: President, Federated Investment Counseling; President and Chief Executive Officer, Federated Investment Management Company, Federated Global Investment Management Corp. and Passport Research, Ltd. |
| * | Family relationships and reasons for “interested” status: John F. Donahue is the father of J. Christopher Donahue; both are “interested” due to their beneficial ownership of shares of Federated Investors, Inc. and the positions they hold with Federated and its subsidiaries. |
Annual Shareholder Report43
INDEPENDENT DIRECTORS Background
Name
Birth Date
Positions Held with Corporation
Date Service Began | Principal Occupation(s) for Past Five Years,
Other Directorships Held and Previous Position(s) |
John T. Conroy, Jr., Ph.D.
Birth Date: June 23, 1937
DIRECTOR
Began serving: May 1992 | Principal Occupations: Director or Trustee of the Federated Fund Complex; Chairman of the Board, Investment Properties Corporation; Partner or Trustee in private real estate ventures in Southwest Florida; Assistant Professor in Theology, Blessed Edmund Rice School for Pastoral Ministry.
Previous Positions: President, Investment Properties Corporation; Senior Vice President, John R. Wood and Associates, Inc., Realtors; President, Naples Property Management, Inc. and Northgate Village Development Corporation. |
Nicholas P. Constantakis
Birth Date: September 3, 1939
DIRECTOR
Began serving: February 1998 | Principal Occupation: Director or Trustee of the Federated Fund Complex.
Other Directorship Held: Director and Chairman of the Audit Committee, Michael Baker Corporation (architecture, engineering and construction services).
Previous Position: Partner, Andersen Worldwide SC. |
John F. Cunningham
Birth Date: March 5, 1943
DIRECTOR
Began serving: January 1999 | Principal Occupation: Director or Trustee of the Federated Fund Complex.
Other Directorships Held: Chairman, President and Chief Executive Officer, Cunningham & Co., Inc. (strategic business consulting); Trustee Associate, Boston College.
Previous Positions: Director, Redgate Communications and EMC Corporation (computer storage systems); Chairman of the Board and Chief Executive Officer, Computer Consoles, Inc.; President and Chief Operating Officer, Wang Laboratories; Director, First National Bank of Boston; Director, Apollo Computer, Inc. |
Maureen Lally-Green
Birth Date: July 5, 1949
DIRECTOR
Began serving: August 2009 | Principal Occupations: Director or Trustee of the Federated Fund Complex; Director, Office of Church Relations, Diocese of Pittsburgh; Adjunct Professor of Law, Duquesne University School of Law.
Other Directorships Held: Director, Auberle; Trustee St. Francis University; Director, Ireland Institute of Pittsburgh; Director, UPMC Mercy Hospital; Regent, St. Vincent Seminary; Director, Epilepsy Foundation of Western and Central Pennsylvania; Director, Saint Thomas More Society, Allegheny County; Director, Carlow University.
Previous Position: Pennsylvania Superior Court Judge. |
Annual Shareholder Report44
Name
Birth Date
Positions Held with Corporation
Date Service Began | Principal Occupation(s) for Past Five Years,
Other Directorships Held and Previous Position(s) |
Peter E. Madden
Birth Date: March 16, 1942
DIRECTOR
Began serving: May 1992 | Principal Occupation: Director or Trustee, and Chairman of the Board of Directors or Trustees, of the Federated Fund Complex.
Other Directorship Held: Board of Overseers, Babson College.
Previous Positions: Representative, Commonwealth of Massachusetts General Court; President, Chief Operating Officer and Director, State Street Bank and Trust Company and State Street Corporation (retired); Director, VISA USA and VISA International; Chairman and Director, Massachusetts Bankers Association; Director, Depository Trust Corporation; Director, The Boston Stock Exchange. |
Charles F. Mansfield, Jr.
Birth Date: April 10, 1945
DIRECTOR
Began serving: January 1999 | Principal Occupations: Director or Trustee and Chairman of the Audit Committee of the Federated Fund Complex; Management Consultant.
Previous Positions: Chief Executive Officer, PBTC International Bank; Partner, Arthur Young & Company (now Ernst & Young LLP); Chief Financial Officer of Retail Banking Sector, Chase Manhattan Bank; Senior Vice President, HSBC Bank USA (formerly, Marine Midland Bank); Vice President, Citibank; Assistant Professor of Banking and Finance, Frank G. Zarb School of Business, Hofstra University; Executive Vice President DVC Group, Inc. (marketing, communications and technology). |
R. James Nicholson
Birth Date: February 4, 1938
DIRECTOR
Began serving: April 2008 | Principal Occupations: Director or Trustee of the Federated Fund Complex; Senior Counsel, Brownstein Hyatt Farber Schrek, P.C.; Former Secretary of the U.S. Dept. of Veterans Affairs; Former U.S. Ambassador to the Holy See; Former Chairman of the Republican National Committee.
Other Directorships Held: Director, Horatio Alger Association; Director, The Daniels Fund.
Previous Positions: Colonel, U.S. Army Reserve; Partner, Calkins, Kramer, Grimshaw and Harring, P.C.; General Counsel, Colorado Association of Housing and Building; Chairman and CEO, Nicholson Enterprises, Inc. (real estate holding company); Chairman and CEO, Renaissance Homes of Colorado. |
Thomas M. O'Neill
Birth Date: June 14, 1951
DIRECTOR
Began serving: October 2006 | Principal Occupations: Director or Trustee of the Federated Fund Complex; Sole Proprietor, Navigator Management Company (investment and strategic consulting).
Other Directorships Held: Board of Overseers, Children's Hospital of Boston; Visiting Committee on Athletics, Harvard College.
Previous Positions: Chief Executive Officer and President, Managing Director and Chief Investment Officer, Fleet Investment Advisors; President and Chief Executive Officer, Aeltus Investment Management, Inc.; General Partner, Hellman, Jordan Management Co., Boston, MA; Chief Investment Officer, The Putnam Companies, Boston, MA; Credit Analyst and Lending Officer, Fleet Bank; Director and Consultant, EZE Castle Software (investment order management software); Director, Midway Pacific (lumber). |
Annual Shareholder Report45
Name
Birth Date
Positions Held with Corporation
Date Service Began | Principal Occupation(s) for Past Five Years,
Other Directorships Held and Previous Position(s) |
John S. Walsh
Birth Date: November 28, 1957
DIRECTOR
Began serving: January 1999 | Principal Occupations: Director or Trustee of the Federated Fund Complex; President and Director, Heat Wagon, Inc. (manufacturer of construction temporary heaters); President and Director, Manufacturers Products, Inc. (distributor of portable construction heaters); President, Portable Heater Parts, a division of Manufacturers Products, Inc.
Previous Position: Vice President, Walsh & Kelly, Inc. |
James F. Will
Birth Date: October 12, 1938
DIRECTOR
Began serving: April 2006 | Principal Occupations: Director or Trustee of the Federated Fund Complex; formerly, Vice Chancellor and President, Saint Vincent College.
Other Directorships Held: Trustee, Saint Vincent College; Alleghany Corporation.
Previous Positions: Chairman, President and Chief Executive Officer, Armco, Inc.; President and Chief Executive Officer, Cyclops Industries; President and Chief Operating Officer, Kaiser Steel Corporation. |
OFFICERS**
Name
Birth Date
Positions Held with Corporation
Date Service Began | Principal Occupation(s) and Previous Position(s) |
John W. McGonigle
Birth Date: October 26, 1938
EXECUTIVE VICE PRESIDENT AND SECRETARY
Began serving: May 1992 | Principal Occupations: Executive Vice President and Secretary of the Federated Fund Complex; Vice Chairman, Executive Vice President, Secretary and Director, Federated Investors, Inc.
Previous Positions: Trustee, Federated Investment Management Company and Federated Investment Counseling; Director, Federated Global Investment Management Corp., Federated Services Company and Federated Securities Corp. |
Richard A. Novak
Birth Date: December 25, 1963
TREASURER
Began serving: January 2006 | Principal Occupations: Principal Financial Officer and Treasurer of the Federated Fund Complex; Senior Vice President, Federated Administrative Services; Financial and Operations Principal for Federated Securities Corp., Edgewood Services, Inc. and Southpointe Distribution Services, Inc.
Previous Positions: Controller of Federated Investors, Inc.; Vice President, Finance of Federated Services Company; held various financial management positions within The Mercy Hospital of Pittsburgh; Auditor, Arthur Andersen & Co. |
Richard B. Fisher
Birth Date: May 17, 1923
VICE PRESIDENT
Began serving: May 1992 | Principal Occupations: Vice Chairman or Vice President of some of the Funds in the Federated Fund Complex; Vice Chairman, Federated Investors, Inc.; Chairman, Federated Securities Corp.
Previous Positions: President and Director or Trustee of some of the Funds in the Federated Fund Complex; Executive Vice President, Federated Investors, Inc.; Director and Chief Executive Officer, Federated Securities Corp. |
Annual Shareholder Report46
Name
Birth Date
Positions Held with Corporation
Date Service Began | Principal Occupation(s) and Previous Position(s) |
Brian P. Bouda
Birth Date: February 28, 1947
SENIOR VICE PRESIDENT AND CHIEF COMPLIANCE OFFICER
Began serving: January 2006 | Principal Occupations: Senior Vice President and Chief Compliance Officer of the Federated Fund Complex; Vice President and Chief Compliance Officer of Federated Investors, Inc. and Chief Compliance Officer of its subsidiaries. Mr. Bouda joined Federated in 1999 and is a member of the American Bar Association and the State Bar Association of Wisconsin. |
Robert J. Ostrowski
Birth Date: April 26, 1963
CHIEF INVESTMENT OFFICER
Began serving: May 2004 | Principal Occupations: Robert J. Ostrowski joined Federated in 1987 as an Investment Analyst and became a Portfolio Manager in 1990. He was named Chief Investment Officer of taxable fixed-income products in 2004 and also serves as a Senior Portfolio Manager. He has been a Senior Vice President of the Fund's Adviser since 1997. Mr. Ostrowski is a Chartered Financial Analyst. He received his M.S. in Industrial Administration from Carnegie Mellon University. |
Joseph M. Balestrino
Birth Date: November 3, 1954
VICE PRESIDENT
Began serving: November 1998 | Principal Occupations: Joseph M. Balestrino has been the Fund's Portfolio Manager since September 1993. He is Vice President of the Corporation. Mr. Balestrino joined Federated in 1986 and has been a Senior Portfolio Manager and Senior Vice President of the Fund's Sub-Adviser since 1998. He was a Portfolio Manager and a Vice President of the Fund's Sub-Adviser from 1995 to 1998. Mr. Balestrino served as a Portfolio Manager and an Assistant Vice President of the Fund's Sub-Adviser from 1993 to 1995. Mr. Balestrino is a Chartered Financial Analyst and received his Master's Degree in Urban and Regional Planning from the University of Pittsburgh. |
Annual Shareholder Report47
Evaluation and Approval of Advisory Contract - May 2009
Federated Bond Fund (the “Fund”)
The Fund's Board reviewed the Fund's investment advisory contract at meetings held in May 2009. The Board's decision regarding the contract reflects the exercise of its business judgment on whether to continue the existing arrangements.
In this connection, the Federated funds' Board had previously appointed a Senior Officer, whose duties include specified responsibilities relating to the process by which advisory fees are to be charged to a Federated fund. The Senior Officer has the authority to retain consultants, experts, or staff as may be reasonably necessary to assist in the performance of his duties, reports directly to the Board, and may be terminated only with the approval of a majority of the independent members of the Board. The Senior Officer prepared and furnished to the Board an independent, written evaluation that covered topics discussed below. The Board considered that evaluation, along with other information, in deciding to approve the advisory contract.
During its review of the contract, the Board considered compensation and benefits received by the Adviser. This included the fees received for services provided to the Fund by other entities in the Federated organization and research services received by the Adviser from brokers that execute Federated fund trades, as well as advisory fees. The Board is also familiar with and considered judicial decisions concerning allegedly excessive investment advisory fees, which have indicated that the following factors may be relevant to an Adviser's fiduciary duty with respect to its receipt of compensation from a fund: the nature and quality of the services provided by the Adviser, including the performance of the fund; the Adviser's cost of providing the services; the extent to which the Adviser may realize “economies of scale” as a fund grows larger; any indirect benefits that may accrue to the Adviser and its affiliates as a result of the Adviser's relationship with a fund; performance and expenses of comparable funds; and the extent to which the independent Board members are fully informed about all facts the Board deems relevant bearing on the Adviser's services and fees. The Board further considered management fees (including any components thereof) charged to institutional and other clients of the Adviser for what might be viewed as like services, and the cost to the Adviser and its affiliates of supplying services pursuant to the management fee agreements, excluding any intra-corporate profit and profit margins of the Adviser and its affiliates for supplying such services. The Board was aware of these factors and was guided by them in its review of the Fund's advisory contract to the extent it considered them to be appropriate and relevant, as discussed further below.
Annual Shareholder Report48
The Board considered and weighed these circumstances in light of its substantial accumulated experience in governing the Fund and working with Federated on matters relating to the Federated funds, and was assisted in its deliberations by independent legal counsel. Throughout the year, the Board has requested and received substantial and detailed information about the Fund and the Federated organization that was in addition to the extensive materials that comprise and accompany the Senior Officer's evaluation. Federated provided much of this information at each regular meeting of the Board, and furnished additional reports in connection with the particular meeting at which the Board's formal review of the advisory contract occurred. Between regularly scheduled meetings, the Board also received information on particular matters as the need arose. Thus, the Board's consideration of the advisory contract included review of the Senior Officer's evaluation, accompanying data and additional reports covering such matters as: the Adviser's investment philosophy, revenue, profitability, personnel and processes; investment and operating strategies; the Fund's short- and long-term performance (in absolute terms, both on a gross basis and net of expenses, as well as in relationship to its particular investment program and certain competitor or “peer group” funds and/or other benchmarks, as appropriate), and comments on the reasons for performance; the Fund's investment objectives; the Fund's expenses (including the advisory fee itself and the overall expense structure of the Fund, both in absolute terms and relative to similar and/or competing funds, with due regard for contractual or voluntary expense limitations); the use and allocation of brokerage commissions derived from trading the Fund's portfolio securities (if any); and the nature, quality and extent of the advisory and other services provided to the Fund by the Adviser and its affiliates. The Board also considered the preferences and expectations of Fund shareholders and their relative sophistication; the continuing state of competition in the mutual fund industry and market practices; the range of comparable fees for similar funds in the mutual fund industry; the Fund's relationship to the Federated family of funds which include a comprehensive array of funds with different investment objectives, policies and strategies which are available for exchange without the incurrence of additional sales charges; compliance and audit reports concerning the Federated funds and the Federated companies that service them (including communications from regulatory agencies), as well as Federated's responses to any issues raised therein; and relevant developments in the mutual fund industry and how the Federated funds and/or Federated are responding to them. The Board's evaluation process is evolutionary. The criteria considered and the emphasis placed on relevant criteria change in recognition of changing circumstances in the mutual fund marketplace. With respect to the Fund's performance and expenses in particular, the Board has found the use of comparisons to other mutual funds with comparable investment programs to be particularly useful, given the high degree of competition in the mutual fund business. The Board focused on comparisons Annual Shareholder Report49
with other similar mutual funds more heavily than non-mutual fund products or services because it is believed that they are more relevant. For example, other mutual funds are the products most like the Fund, they are readily available to Fund shareholders as alternative investment vehicles, and they are the type of investment vehicle in fact chosen and maintained by the Fund's investors. The range of their fees and expenses therefore appears to be a generally reliable indication of what consumers have found to be reasonable in the precise marketplace in which the Fund competes. The Fund's ability to deliver competitive performance when compared to its peer group was a useful indicator of how the Adviser is executing the Fund's investment program, which in turn assisted the Board in reaching a conclusion that the nature, extent, and quality of the Adviser's investment management services were such as to warrant continuation of the advisory contract. In this regard, the Senior Officer has reviewed Federated's fees for providing advisory services to products outside the Federated family of funds (e.g., institutional and separate accounts). He concluded that mutual funds and institutional accounts are inherently different products. Those differences include, but are not limited to, different types of targeted investors; being subject to different laws and regulations; different legal structures; different average account sizes; different associated costs; different portfolio management techniques made necessary by different cash flows and portfolio manager time spent in review of securities pricing. The Senior Officer did not consider these fee schedules to be determinative in judging the appropriateness of mutual fund advisory contracts.The Senior Officer reviewed reports compiled by Federated, using data supplied by independent fund ranking organizations, regarding the performance of, and fees charged by, other mutual funds, noting his view that comparisons to fund peer groups are highly important in judging the reasonableness of proposed fees.
The Fund's performance fell below the median of the relevant peer group for the one-year, three-year and five-year periods covered by the report. The Board discussed the Fund's performance with the Adviser and recognized the efforts being undertaken by the Adviser. The Board will continue to monitor these efforts and the performance of the Fund.
The Board also received financial information about Federated, including reports on the compensation and benefits Federated derived from its relationships with the Federated funds. These reports covered not only the fees under the advisory contracts, but also fees received by Federated's subsidiaries for providing other services to the Federated funds under separate contracts (e.g., for serving as the Federated funds' administrator). The reports also discussed any indirect benefit Federated may derive from its receipt of research services from brokers who execute Federated fund trades. In addition, the Board considered the fact that, in order for a fund to be competitive in the marketplace, Federated and its affiliates frequently waived fees and/or reimbursed expenses and have disclosed to fund investors and/or indicated to Annual Shareholder Report50
the Board their intention to do so in the future, where appropriate. Moreover, the Board receives regular reports regarding the institution or elimination of these voluntary waivers. In this regard, it was noted that the Adviser has agreed to a reduction of 19 basis points in the Fund's advisory fee at least through December 31, 2010.Federated furnished reports, requested by the Senior Officer, that reported revenues on a fund-by-fund basis and made estimates of the allocation of expenses on a fund-by-fund basis, using allocation methodologies specified by the Senior Officer. The Senior Officer noted that, although they may apply consistent allocation processes, the inherent difficulties in allocating costs (and the unavoidable arbitrary aspects of that exercise) and the lack of consensus on how to allocate those costs may render such allocation reports unreliable. The allocation reports were considered in the analysis by the Board but were determined to be of limited use.
The Board and the Senior Officer also reviewed a report compiled by Federated comparing profitability information for Federated to other publicly held fund management companies. In this regard, the Senior Officer noted the limited availability of such information, but nonetheless concluded that Federated's profit margins did not appear to be excessive and the Board agreed.
The Senior Officer's evaluation also discussed the notion of possible realization of “economies of scale” as a fund grows larger. The Board considered in this regard that the Adviser has made significant and long-term investments in areas that support all of the Federated funds, such as personnel and processes for the portfolio management, compliance, and risk management functions; and systems technology; and that the benefits of these efforts (as well as any economies, should they exist) were likely to be enjoyed by the fund complex as a whole. Finally, the Board also noted the absence of any applicable regulatory or industry guidelines on this subject, which (as discussed in the Senior Officer's evaluation) is compounded by the lack of any common industry practice or general pattern with respect to structuring fund advisory fees with “breakpoints” that serve to reduce the fee as the fund attains a certain size. The Senior Officer did not recommend institution of breakpoints in pricing Federated's fund advisory services at this time.
It was noted in the materials for the Board meeting that for the period covered by the report, the Fund's investment advisory fee, after waivers and expense reimbursements, if any, was above the median of the relevant peer group. The Board reviewed the fees and other expenses of the Fund with the Adviser and was satisfied that the overall expense structure of the Fund remained competitive. The Board will continue to monitor advisory fees and other expenses borne by the Fund.
The Senior Officer's evaluation noted his belief that the information and observations contained in his evaluation supported a finding that the proposed management fees are reasonable, and that Federated appeared to provide appropriate administrative services to the Fund for the fees paid. Under these Annual Shareholder Report51
circumstances, no changes were recommended to, and no objection was raised to, the continuation of the Fund's advisory contract. The Board concluded that the nature, quality and scope of services provided the Fund by the Adviser and its affiliates were satisfactory.In its decision to continue an existing investment advisory contract, the Board was mindful of the potential disruptions of the Fund's operations and various risks, uncertainties and other effects that could occur as a result of a decision to terminate or not renew an advisory contract. In particular, the Board recognized that many shareholders have invested in the Fund on the strength of the Adviser's industry standing and reputation and with the expectation that the Adviser will have a continuing role in providing advisory services to the Fund. Thus, the Board's approval of the advisory contract reflected the fact that it is the shareholders who have effectively selected the Adviser by virtue of having invested in the Fund.
The Board based its decision to approve the advisory contract on the totality of the circumstances and relevant factors and with a view to past and future long-term considerations. Not all of the factors and considerations identified above were necessarily relevant to the Fund, nor did the Board consider any one of them to be determinative. With respect to the factors that were relevant, the Board's decision to approve the contract reflects its determination that Federated's performance and actions provided a satisfactory basis to support the decision to continue the existing arrangements.
Annual Shareholder Report52
Voting Proxies on Fund Portfolio Securities
A description of the policies and procedures that the Fund uses to determine how to vote proxies, if any, relating to securities held in the Fund's portfolio is available, without charge and upon request, by calling 1-800-341-7400. A report on “Form N-PX” of how the Fund voted any such proxies during the most recent 12-month period ended June 30 is available from Federated's Web site at FederatedInvestors.com. To access this information from the “Products” section of the Web site, click on the “Prospectuses and Regulatory Reports” link under “Related Information,” then select the appropriate link opposite the name of the Fund; or select the name of the Fund and from the Fund's page, click on the “Prospectuses and Regulatory Reports” link. Form N-PX filings are also available at the SEC's Web site at www.sec.gov.
Quarterly Portfolio Schedule
The Fund files with the SEC a complete schedule of its portfolio holdings, as of the close of the first and third quarters of its fiscal year, on “Form N-Q.” These filings are available on the SEC's Web site at www.sec.gov and may be reviewed and copied at the SEC's Public Reference Room in Washington, DC. (Call 1-800-SEC-0330 for information on the operation of the Public Reference Room.) You may also access this information from the “Products” section of Federated's Web site at FederatedInvestors.com by clicking on “Portfolio Holdings” under “Related Information,” then selecting the appropriate link opposite the name of the Fund; or select the name of the Fund and from the Fund's page, click on the “Portfolio Holdings” link.
Annual Shareholder Report53
Mutual funds are not bank deposits or obligations, are not guaranteed by any bank and are not insured or guaranteed by the U.S. government, the Federal Deposit Insurance Corporation, the Federal Reserve Board or any other government agency. Investment in mutual funds involves investment risk, including the possible loss of principal.
This Report is authorized for distribution to prospective investors only when preceded or accompanied by the Fund's Prospectus, which contains facts concerning its objective and policies, management fees, expenses and other information.
Federated Bond Fund
Federated Investors Funds
4000 Ericsson Drive
Warrendale, PA 15086-7561
Contact us at FederatedInvestors.com
or call 1-800-341-7400.
Federated Securities Corp., Distributor
Cusip 31420F509
39832 (1/10)
Federated is a registered mark of Federated Investors, Inc.
2010 © Federated Investors, Inc.
SIGNATURES
Pursuant to the requirements of the Securities Exchange Act of 1934 and the Investment Company Act of 1940, the registrant has duly caused this report to be signed on its behalf by the undersigned, thereunto duly authorized.
| | |
| Registrant Federated Investment Series Funds, Inc. |
| |
| By | | /S/ RICHARD A. NOVAK |
| | Richard A. Novak |
| | Principal Financial Officer |
Date June 22, 2010
Pursuant to the requirements of the Securities Exchange Act of 1934 and the Investment Company Act of 1940, this report has been signed below by the following persons on behalf of the registrant and in the capacities and on the dates indicated.
| | |
| By | | /S/ J. CHRISTOPHER DONAHUE |
| | J. Christopher Donahue |
| | Principal Executive Officer |
|
| Date June 22, 2010 |
| |
| By | | /S/ RICHARD A. NOVAK |
| | Richard A. Novak |
| | Principal Financial Officer |
|
| Date June 22, 2010 |