United States
Securities and Exchange Commission
Washington, D.C. 20549
Form N-CSR
Certified Shareholder Report of Registered Management Investment Companies
811-58429
(Investment Company Act File Number)
Federated Investment Series Funds, Inc.
_______________________________________________________________
(Exact Name of Registrant as Specified in Charter)
Federated Investors Funds
4000 Ericsson Drive
Warrendale, Pennsylvania 15086-7561
(Address of Principal Executive Offices)
(412) 288-1900
(Registrant's Telephone Number)
John W. McGonigle, Esquire
Federated Investors Tower
1001 Liberty Avenue
Pittsburgh, Pennsylvania 15222-3779
(Name and Address of Agent for Service)
(Notices should be sent to the Agent for Service)
Date of Fiscal Year End: 11/30/13
Date of Reporting Period: 11/30/13
Item 1. Reports to Stockholders

Annual Shareholder Report
November 30, 2013
| Share Class | Ticker |
| A | FDBAX |
| B | FDBBX |
| C | FDBCX |
| F | ISHIX |
| Institutional | FDBIX |
Federated Bond Fund
Fund Established 1987
A Portfolio of Federated Investment Series Funds, Inc.
Dear Valued Shareholder,
I am pleased to present the Annual Shareholder Report for your fund covering the period from December 1, 2012 through November 30, 2013. This report includes Management's Discussion of Fund Performance, a complete listing of your fund's holdings, performance information and financial statements along with other important fund information.
In addition, our website, FederatedInvestors.com, offers easy access to Federated resources that include timely fund updates, economic and market insights from our investment strategists, and financial planning tools. We invite you to register to take full advantage of its capabilities.
Thank you for investing with Federated. I hope you find this information useful and look forward to keeping you informed.
Sincerely,
J. Christopher Donahue, President
Not FDIC Insured • May Lose Value • No Bank Guarantee
CONTENTS
| 1 |
| 8 |
| 9 |
| 28 |
| 33 |
| 35 |
| 36 |
| 37 |
| 50 |
| 51 |
| 53 |
| 54 |
| 60 |
| 65 |
| 65 |
Management's Discussion of Fund Performance (unaudited)
The total return of Federated Bond Fund (the “Fund”), based on net asset value, for the 12-month reporting period ended November 30, 2013, was 1.09% for Class A Shares, 0.26% for Class B Shares, 0.27% for Class C Shares, 1.15% for Class F Shares and 1.40% for Institutional Shares. The total return of a blended index comprised of 75% Barclays U.S. Credit Index and 25% Barclays U.S. Corporate High Yield 2% Issuer Capped Index (“Blended Index”),1,2 a benchmark for the Fund, was 0.67%. The total return of the Lipper Corporate Debt Funds BBB-Rated Average (LCDBBB),3 a peer group average for the Fund, was -0.86% during the same period. The Fund's and the LCDBBB's total returns for the most recently completed fiscal year reflected actual cash flows, transaction costs and other expenses which were not reflected in the total return of the Blended Index.
During the 12-month reporting period, the most significant factors affecting the Fund's performance relative to the Blended Index were: (1) the allocation of the portfolio among securities of similar types of issuers (referred to as “sectors”); (2) the selection of individual securities; and (3) the effect of changing interest rates (referred to as “duration).”4
The following discussion will focus on the performance of the Fund's Institutional Shares. During the reporting period, the Fund's Institutional Shares outperformed the Blended Index and the LCDBBB. The 1.40% total return for the Institutional Shares for the 12-month reporting period consisted of 4.61% of dividends and reinvestments and -3.21% of depreciation in the net asset value of the shares.
MARKET OVERVIEW
The 12-month reporting period began with continued concerns regarding the relatively slow global economic recovery and periodic headlines concerning the fiscal situation in Europe. Additionally, the Federal Reserve (the Fed) increased the quantitative easing (QE) program with the goal of stimulating economic growth. These were catalysts for extremely low U.S. Treasury yields, which hit calendar-year lows in early May.
Annual Shareholder Report
Around mid-year, European headlines abated, and economic growth in the United States appeared to be improving to the point that market participants began anticipating a reduction to the accommodative QE program. This led to higher Treasury yields and wider credit spreads on corporate securities as the market reassessed risk in the fixed income markets. This risk reassessment action was reversed when the Fed announced that it would not reduce the QE program at the September Open Market Committee meeting.
The net result during the reporting period was higher yields and tighter credit spreads. As points of reference, the 5-year Treasury note began the period with a yield of 0.62% and ended the period at 1.37%. The 10-year Treasury note began the period with a yield of 1.62% and ended at 2.75% and the yield on the 30-year note was 2.80% at the start of the period and ended at 3.81%. Credit spreads were generally tighter at the end of the period relative to where they began the period.
SECTOR
During the 12-month reporting period, the Fund was essentially comprised of both investment-grade5 (those corporate bonds rated from “AAA” to “BBB”) and high-yield bond asset classes5 (those corporate bonds rated “BB” and lower). For the reporting period, the Fund generally averaged over 25% of its assets in the high-yield asset class, which outperformed the investment-grade asset class. Overall, the high-yield allocation increased Fund performance relative to the Blended Index.
SECURITY SELECTION
The selection of individual securities was a positive contributor to Fund performance relative to the Blended Index. Within the investment-grade portion of the portfolio, the Fund maintained its allocation to securities within the Banking subsector, which generated strong returns. This was largely offset by the Fund's position within the Metals & Mining subsector. The high-yield portion of the portfolio outperformed the Barclays High Yield Index. Individual issuers that added to performance were: ArcelorMittal, Morgan Stanley and Goldman Sachs. Issuers with negative contribution were: Petrobras International, Gold Fields and Goldcorp.
Annual Shareholder Report
DURATION6
During the 12-month reporting period, duration was a positive contributor to Fund performance relative to the Blended Index, primarily in the summer months when overall interest rates increased significantly. The Fund maintained a fairly constant exposure to interest rates but did use the Treasury futures derivatives to reduce rate movements associated with the change in U.S. government yields.
| 1 | Please see the footnotes to the line graphs under “Fund Performance and Growth of a $10,000 Investment” below for the definition of, and more information about, the Blended Index. |
| 2 | The Fund's broad-based securities market index is the Barclays U.S. Credit Index (BUSC). Please see the footnotes to the line graphs under “Fund Performance and Growth of a $10,000 Investment” below for the definition of, and more information about, the BUSC. The BUSC's return for the 12-month reporting period was -1.85%. The Blended Index is being used for comparison purposes because, although it is not the Fund's broad-based securities market index, the Fund's Adviser believes it more closely reflects the market sectors in which the Fund invests. |
| 3 | Please see the footnotes to the line graphs under “Fund Performance and Growth of a $10,000 Investment” below for the definition of, and more information about, the LCDBBB. |
| 4 | Bond prices are sensitive to changes in interest rates, and a rise in interest rates can cause a decline in their prices. |
| 5 | Investment-grade securities are securities that are rated at least “BBB- (minus)” or unrated securities of a comparable quality. Noninvestment-grade securities are securities that are not rated at least “BBB- (minus)” or unrated securities of a comparable quality. Credit ratings are an indication of the risk that a security will default. They do not protect a security from credit risk. Lower-rated bonds typically offer higher yields to help compensate investors for the increased risk associated with them. Among these risks are lower credit-worthiness, greater price volatility, more risk to principal and income than with higher-rated securities and increased possibilities of default. |
| 6 | Duration is a measure of a security's price sensitivity to changes in interest rates. Securities with longer durations are more sensitive to changes in interest rates than securities of shorter durations. |
Annual Shareholder Report
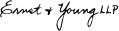
FUND PERFORMANCE AND GROWTH OF A $10,000 INVESTMENT
The Average Annual Total Return table below shows returns for each class averaged over the stated periods. The graphs below illustrate the hypothetical investment of $10,0001 in the Federated Bond Fund from November 30, 2003 to November 30, 2013, compared to the Barclays U.S. Credit Index (BUSC),2 a blend of indexes comprised of 75% Barclays U.S. Credit Index and 25% Barclays U.S. Corporate High Yield 2% Issuer Capped Index (BHY2%ICI) (the “Blended Index”)2 and the Lipper Corporate Debt Funds BBB Rated Average (LCDBBB).3
Average Annual Total Returns for the Period Ended 11/30/2013
(returns reflect all applicable sales charges and contingent deferred sales charge as specified below in footnote #1)
| Share Class | 1 Year | 5 Years | 10 Years |
| Class A Shares | -3.50% | 10.77% | 5.69% |
| Class B Shares | -5.05% | 10.62% | 5.52% |
| Class C Shares | -0.70% | 10.89% | 5.33% |
| Class F Shares | -0.84% | 11.53% | 6.05% |
| Institutional Shares4 | 1.40% | 12.02% | 6.30% |
Performance data quoted represents past performance which is no guarantee of future results. Investment return and principal value will fluctuate so that an investor's shares, when redeemed, may be worth more or less than their original cost. Mutual fund performance changes over time and current performance may be lower or higher than what is stated. For current to the most recent month-end performance and after-tax returns, visit FederatedInvestors.com or call 1-800-341-7400. Returns shown do not reflect the deduction of taxes that a shareholder would pay on Fund distributions or the redemption of Fund shares. Mutual funds are not obligations of or guaranteed by any bank and are not federally insured.
Annual Shareholder Report
Growth of a $10,000 Investment–Class A Shares
Growth of $10,000 as of November 30, 2013
| Federated Bond Fund - | Class A Shares | BUSC | Blended Index | LCDBBB |
| 11/30/2003 | 9,550 | 10,000 | 10,000 | 10,000 |
| 11/30/2004 | 10,208 | 10,504 | 10,677 | 10,610 |
| 11/30/2005 | 10,449 | 10,743 | 10,949 | 10,843 |
| 11/30/2006 | 11,229 | 11,410 | 11,747 | 11,546 |
| 11/30/2007 | 11,762 | 11,871 | 12,191 | 12,064 |
| 11/30/2008 | 9,968 | 10,843 | 10,470 | 10,692 |
| 11/30/2009 | 13,262 | 13,507 | 14,088 | 13,530 |
| 11/30/2010 | 14,772 | 14,652 | 15,568 | 14,816 |
| 11/30/2011 | 15,335 | 15,416 | 16,336 | 15,525 |
| 11/30/2012 | 17,211 | 17,203 | 18,451 | 17,393 |
| 11/30/2013 | 17,399 | 16,884 | 18,589 | 17,243 |
41 graphic description end -->
| ■ | Total returns shown include the maximum sales charge of 4.50% ($10,000 investment minus $450 sales charge = $9,550). |
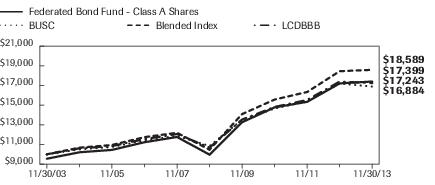
Growth of a $10,000 Investment–Class B Shares
Growth of $10,000 as of November 30, 2013
| Federated Bond Fund - | Class B Shares | BUSC | Blended Index | LCDBBB |
| 11/30/2003 | 10,000 | 10,000 | 10,000 | 10,000 |
| 11/30/2004 | 10,612 | 10,504 | 10,677 | 10,610 |
| 11/30/2005 | 10,775 | 10,743 | 10,949 | 10,843 |
| 11/30/2006 | 11,485 | 11,410 | 11,747 | 11,546 |
| 11/30/2007 | 11,931 | 11,871 | 12,191 | 12,064 |
| 11/30/2008 | 10,036 | 10,843 | 10,470 | 10,692 |
| 11/30/2009 | 13,231 | 13,507 | 14,088 | 13,530 |
| 11/30/2010 | 14,645 | 14,652 | 15,568 | 14,816 |
| 11/30/2011 | 15,077 | 15,416 | 16,336 | 15,525 |
| 11/30/2012 | 16,922 | 17,203 | 18,451 | 17,393 |
| 11/30/2013 | 17,107 | 16,884 | 18,589 | 17,243 |
41 graphic description end -->
| ■ | Total returns shown include the maximum contingent deferred sales charge of 5.50%, as applicable. |
Annual Shareholder Report
Growth of a $10,000 Investment–Class C Shares
Growth of $10,000 as of November 30, 2013

| Federated Bond Fund - | Class C Shares | BUSC | Blended Index | LCDBBB |
| 11/30/2003 | 10,000 | 10,000 | 10,000 | 10,000 |
| 11/30/2004 | 10,600 | 10,504 | 10,677 | 10,610 |
| 11/30/2005 | 10,764 | 10,743 | 10,949 | 10,843 |
| 11/30/2006 | 11,474 | 11,410 | 11,747 | 11,546 |
| 11/30/2007 | 11,920 | 11,871 | 12,191 | 12,064 |
| 11/30/2008 | 10,027 | 10,843 | 10,470 | 10,692 |
| 11/30/2009 | 13,237 | 13,507 | 14,088 | 13,530 |
| 11/30/2010 | 14,635 | 14,652 | 15,568 | 14,816 |
| 11/30/2011 | 15,067 | 15,416 | 16,336 | 15,525 |
| 11/30/2012 | 16,765 | 17,203 | 18,451 | 17,393 |
| 11/30/2013 | 16,810 | 16,884 | 18,589 | 17,243 |
41 graphic description end -->
| ■ | Total returns shown include the maximum contingent deferred sales charge of 1.00%, as applicable. |
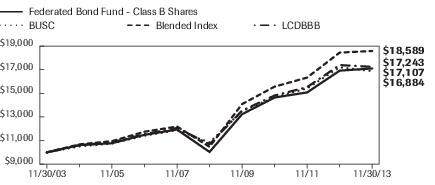
Growth of a $10,000 Investment–Class F Shares
Growth of $10,000 as of November 30, 2013
| Federated Bond Fund - | Class F Shares | BUSC | Blended Index | LCDBBB |
| 11/30/2003 | 9,900 | 10,000 | 10,000 | 10,000 |
| 11/30/2004 | 10,587 | 10,504 | 10,677 | 10,610 |
| 11/30/2005 | 10,832 | 10,743 | 10,949 | 10,843 |
| 11/30/2006 | 11,635 | 11,410 | 11,747 | 11,546 |
| 11/30/2007 | 12,179 | 11,871 | 12,191 | 12,064 |
| 11/30/2008 | 10,327 | 10,843 | 10,470 | 10,692 |
| 11/30/2009 | 13,731 | 13,507 | 14,088 | 13,530 |
| 11/30/2010 | 15,297 | 14,652 | 15,568 | 14,816 |
| 11/30/2011 | 15,870 | 15,416 | 16,336 | 15,525 |
| 11/30/2012 | 17,791 | 17,203 | 18,451 | 17,393 |
| 11/30/2013 | 17,996 | 16,884 | 18,589 | 17,243 |
41 graphic description end -->
| ■ | Total returns shown include the maximum sales charge of 1.00% ($10,000 investment minus $100 sales charge = $9,900) and maximum contingent deferred sales charge of 1.00%, as applicable. |
Annual Shareholder Report
Growth of a $10,000 Investment–iNSTITUTIONAL Shares4
Growth of $10,000 as of November 30, 2013
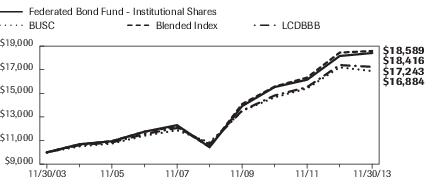
| Federated Bond Fund - | Institutional Shares | BUSC | Blended Index | LCDBBB |
| 11/30/2003 | 10,000 | 10,000 | 10,000 | 10,000 |
| 11/30/2004 | 10,689 | 10,504 | 10,677 | 10,610 |
| 11/30/2005 | 10,941 | 10,743 | 10,949 | 10,843 |
| 11/30/2006 | 11,750 | 11,410 | 11,747 | 11,546 |
| 11/30/2007 | 12,305 | 11,871 | 12,191 | 12,064 |
| 11/30/2008 | 10,441 | 10,843 | 10,470 | 10,692 |
| 11/30/2009 | 13,917 | 13,507 | 14,088 | 13,530 |
| 11/30/2010 | 15,530 | 14,652 | 15,568 | 14,816 |
| 11/30/2011 | 16,153 | 15,416 | 16,336 | 15,525 |
| 11/30/2012 | 18,163 | 17,203 | 18,451 | 17,393 |
| 11/30/2013 | 18,416 | 16,884 | 18,589 | 17,243 |
41 graphic description end -->
| 1 | Represents a hypothetical investment of $10,000 in the Fund after deducting applicable sales charges: for Class A Shares, the maximum sales charge of 4.50% ($10,000 investment minus $450 sales charge = $9,550); for Class B Shares, the maximum contingent deferred sales charge is 5.50% on any redemption less than one year from the purchase date; for Class C Shares, a 1.00% contingent deferred sales charge would be applied on any redemption less than one year from the purchase date; for Class F Shares, the maximum sales charge of 1.00% ($10,000 investment minus $100 sales charge = $9,900) and a contingent deferred sales charge of 1.00% would be applied on any redemption less than three years from the purchase date. The Fund's performance assumes the reinvestment of all dividends and distributions. The BUSC and the LCDBBB have been adjusted to reflect reinvestment of dividends on securities in the index and average. |
| 2 | The BUSC is composed of all publicly issued, fixed-rate, nonconvertible, investment-grade corporate debt and a non-corporate component that includes foreign agencies, sovereigns, supranationals and local authorities. Issues are rated at least “Baa” by Moody's Investors Service or “BBB” by Standard & Poor's, if unrated by Moody's. The Blended Index is a custom blended index comprised of 75% of the BUSC and 25% of the BHY2%ICI. The BHY2%ICI is an issuer-constrained version of the Barclays U.S. Corporate High-Yield Index that measures the market of USD-denominated, noninvestment grade, fixed-rate, taxable corporate bonds. The BHY2%ICI follows the same rules as the BUSC but limits the exposure of each issuer to 2% of the total market value and redistributes any excess market value index-wide on a pro-rata basis. The indexes are not adjusted to reflect sales loads, expenses or other fees that the Securities and Exchange Commission (SEC) requires to be reflected in the Fund's performance. The indexes are unmanaged and, unlike the Fund, are not affected by cash flows. It is not possible to invest directly in an index. |
| 3 | Lipper figures represent the average of the total returns reported by all mutual funds designated by Lipper, Inc., as falling into the respective category and is not adjusted to reflect any sales charges. These total returns are reported net of expenses and other fees that the SEC requires to be reflected in a mutual fund's performance. |
| 4 | The Fund's Institutional Shares commenced operations on January 28, 2008. The Fund offers four other classes of shares: Class A Shares, Class B Shares, Class C Shares and Class F Shares. For the period prior to the commencement of operations of Institutional Shares, the performance information shown is for the Fund's Class A Shares. In relation to the Institutional Shares, the performance of Class A Shares has not been adjusted to reflect the expenses of Institutional Shares since Institutional Shares have a lower expense ratio than the expense ratio of the Class A Shares. The performance of Class A Shares has been adjusted to remove any voluntary waiver of Fund expenses related to the Class A Shares that may have occurred during the period prior to the commencement of operations of Institutional Shares. Additionally, for Institutional Shares, the performance information shown has been adjusted to reflect the absence of sales charges applicable to Class A Shares. |
Annual Shareholder Report
Portfolio of Investments Summary Table (unaudited)
At November 30, 2013, the Fund's portfolio composition1 was as follows:
| Security Type | Percentage of
Total Net Assets2 |
| Corporate Debt Securities | 96.6% |
| Foreign Governments/Agencies | 0.5% |
| Municipal Securities | 0.4% |
| Mortgage-Backed Securities3,4 | 0.0% |
| Collateralized Mortgage Obligations4 | 0.0% |
| Other Security Types5 | 0.4% |
| Cash Equivalents6 | 1.0% |
| Other Assets and Liabilities—Net7 | 1.1% |
| TOTAL | 100.0% |
| 1 | See the Fund's Prospectus and Statement of Additional Information for a description of these security types. |
| 2 | As of the date specified above, the Fund owned shares of one or more affiliated investment companies. For purposes of this table, the affiliated investment company (other than an affiliated money market fund) is not treated as a single portfolio security, but rather the Fund is treated as owning a pro rata portion of each security and each other asset and liability owned by the affiliated investment company. Accordingly, the percentages of total net assets shown in the table will differ from those presented on the Portfolio of Investments. |
| 3 | For purposes of this table, mortgage-backed securities include mortgage-backed securities guaranteed by Government Sponsored Entities. |
| 4 | Represents less than 0.1%. |
| 5 | Other Security Types consist of common stocks, warrants and preferred stocks. |
| 6 | Cash Equivalents include any investments in money market mutual funds and/or overnight repurchase agreements. |
| 7 | Assets, other than investments in securities, less liabilities. See Statement of Assets and Liabilities. |
Annual Shareholder Report
Portfolio of Investments
November 30, 2013
Principal
Amount
or Shares | | | Value |
| | | CORPORATE BONDS—67.2% | |
| | | Basic Industry - Chemicals—0.8% | |
| $2,390,000 | | Albemarle Corp., Sr. Note, 5.10%, 2/1/2015 | $2,504,029 |
| 1,970,000 | | Dow Chemical Co., Note, 8.55%, 5/15/2019 | 2,551,577 |
| 1,600,000 | 1,2 | Incitec Pivot Finance LLC, Company Guarantee, Series 144A, 4.00%, 12/7/2015 | 1,667,589 |
| 2,220,000 | 1,2 | Incitec Pivot Finance LLC, Company Guarantee, Series 144A, 6.00%, 12/10/2019 | 2,468,200 |
| 2,365,000 | | RPM International, Inc., 6.50%, 2/15/2018 | 2,724,589 |
| 438,000 | | Rohm & Haas Co., 6.00%, 9/15/2017 | 503,417 |
| | | TOTAL | 12,419,401 |
| | | Basic Industry - Metals & Mining—4.3% | |
| 2,500,000 | | Alcoa, Inc., Note, 5.55%, 2/1/2017 | 2,708,908 |
| 1,570,000 | | Alcoa, Inc., Sr. Unsecd. Note, 5.40%, 4/15/2021 | 1,609,035 |
| 1,860,000 | | Allegheny Technologies, Inc., Sr. Note, 9.375%, 6/1/2019 | 2,300,204 |
| 2,600,000 | 1,2 | Anglo American Capital PLC, Company Guarantee, Series 144A, 2.625%, 4/3/2017 | 2,637,300 |
| 800,000 | 1,2 | Anglo American Capital PLC, Company Guarantee, Series 144A, 4.45%, 9/27/2020 | 810,046 |
| 1,000,000 | | Anglogold Ashanti Holdings PLC, Sr. Note, 6.50%, 4/15/2040 | 812,417 |
| 820,000 | | Anglogold Ashanti Holdings PLC, Sr. Unsecd. Note, 5.125%, 8/1/2022 | 726,662 |
| 2,600,000 | | Anglogold Ashanti Holdings PLC, Sr. Unsecd. Note, 8.50%, 7/30/2020 | 2,736,500 |
| 1,370,000 | | ArcelorMittal, 6.125%, 6/1/2018 | 1,493,300 |
| 2,100,000 | | ArcelorMittal, Sr. Unsecd. Note, 5.00%, 2/25/2017 | 2,239,125 |
| 4,000,000 | | ArcelorMittal, Sr. Unsecd. Note, 5.75%, 8/5/2020 | 4,230,000 |
| 750,000 | | ArcelorMittal, Sr. Unsecd. Note, 7.25%, 3/1/2041 | 716,250 |
| 1,350,000 | | Barrick Gold Corp., Sr. Unsecd. Note, 2.50%, 5/1/2018 | 1,361,962 |
| 2,400,000 | | Carpenter Technology Corp., Sr. Unsecd. Note, 4.45%, 3/1/2023 | 2,334,014 |
| 2,960,000 | | Carpenter Technology Corp., Sr. Unsecd. Note, 5.20%, 7/15/2021 | 3,065,897 |
| 3,325,000 | 1,2 | Codelco, Inc., Bond, Series 144A, 5.625%, 9/21/2035 | 3,341,133 |
| 3,100,000 | 1,2 | Gerdau S.A., Company Guarantee, Series 144A, 5.75%, 1/30/2021 | 3,177,500 |
| 2,010,000 | 1,2 | Gold Fields Orogen Holding BVI Ltd., Company Guarantee, Series 144A, 4.875%, 10/7/2020 | 1,692,764 |
| 8,000,000 | | Goldcorp, Inc., Sr. Unsecd. Note, 3.70%, 3/15/2023 | 7,334,712 |
| 2,400,000 | 1,2 | Hyundai Steel Co., Sr. Unsecd. Note, Series 144A, 4.625%, 4/21/2016 | 2,543,503 |
| 1,820,000 | 1,2 | Newcrest Finance Property Ltd., Sr. Unsecd. Note, Series 144A, 4.20%, 10/1/2022 | 1,481,072 |
Annual Shareholder Report
Principal
Amount
or Shares | | | Value |
| | | CORPORATE BONDS—continued | |
| | | Basic Industry - Metals & Mining—continued | |
| $5,350,000 | | Reliance Steel & Aluminum Co., Sr. Unsecd. Note, 4.50%, 4/15/2023 | $5,260,949 |
| 515,000 | | Rio Tinto Finance USA Ltd., Company Guarantee, 6.50%, 7/15/2018 | 615,455 |
| 1,000,000 | | Rio Tinto Finance USA Ltd., Sr. Unsecd. Note, 2.25%, 12/14/2018 | 1,006,296 |
| 1,080,000 | | Southern Copper Corp., Note, 6.75%, 4/16/2040 | 1,037,816 |
| 1,310,000 | | Southern Copper Corp., Sr. Unsecd. Note, 3.50%, 11/8/2022 | 1,216,854 |
| 4,020,000 | | Worthington Industries, Inc., Sr. Unsecd. Note, 6.50%, 4/15/2020 | 4,362,854 |
| 2,500,000 | | Xstrata Canada Corp., 6.00%, 10/15/2015 | 2,708,498 |
| | | TOTAL | 65,561,026 |
| | | Basic Industry - Paper—1.0% | |
| 1,240,000 | | International Paper Co., Bond, 7.30%, 11/15/2039 | 1,518,580 |
| 1,175,000 | | International Paper Co., Sr. Unsecd. Note, 7.50%, 8/15/2021 | 1,452,844 |
| 2,270,000 | | Plum Creek Timberlands LP, Sr. Unsecd. Note, 3.25%, 3/15/2023 | 2,077,422 |
| 1,430,000 | | Plum Creek Timberlands LP, Sr. Unsecd. Note, 4.70%, 3/15/2021 | 1,501,704 |
| 2,850,000 | 3,4,5 | Pope & Talbot, Inc., 8.375%, 12/1/2099 | 0 |
| 2,500,000 | | Westvaco Corp., 7.65%, 3/15/2027 | 2,656,238 |
| 4,750,000 | | Weyerhaeuser Co., Sr. Unsecd. Note, 7.375%, 3/15/2032 | 5,843,018 |
| | | TOTAL | 15,049,806 |
| | | Capital Goods - Aerospace & Defense—0.3% | |
| 3,650,000 | 1,2 | BAE Systems Holdings, Inc., Series 144A, 5.20%, 8/15/2015 | 3,894,652 |
| 650,000 | | Embraer SA, Sr. Unsecd. Note, 5.15%, 6/15/2022 | 650,000 |
| 400,000 | | Rockwell Collins, Inc., Sr. Unsecd. Note, 3.10%, 11/15/2021 | 389,757 |
| | | TOTAL | 4,934,409 |
| | | Capital Goods - Building Materials—0.9% | |
| 4,000,000 | | Masco Corp., Sr. Unsecd. Note, 5.85%, 3/15/2017 | 4,380,000 |
| 3,570,000 | | Masco Corp., Sr. Unsecd. Note, 5.95%, 3/15/2022 | 3,788,662 |
| 4,460,000 | | Valmont Industries, Inc., Sr. Unsecd. Note, 6.625%, 4/20/2020 | 5,059,027 |
| | | TOTAL | 13,227,689 |
| | | Capital Goods - Construction Machinery—0.2% | |
| 3,030,000 | | AGCO Corp., Sr. Unsecd. Note, 5.875%, 12/1/2021 | 3,295,585 |
| | | Capital Goods - Diversified Manufacturing—1.0% | |
| 1,000,000 | | Avery Dennison Corp., Sr. Unsecd. Note, 5.375%, 4/15/2020 | 1,035,512 |
| 4,020,000 | | Harsco Corp., 5.75%, 5/15/2018 | 4,267,379 |
| 2,100,000 | 1,2 | Hutchison Whampoa International Ltd., Company Guarantee, Series 144A, 3.50%, 1/13/2017 | 2,215,130 |
| 1,000,000 | 1,2 | Hutchison Whampoa International Ltd., Series 144A, 7.625%, 4/9/2019 | 1,233,961 |
| 3,970,000 | | Pentair, Ltd., Company Guarantee, 5.00%, 5/15/2021 | 4,210,824 |
Annual Shareholder Report
Principal
Amount
or Shares | | | Value |
| | | CORPORATE BONDS—continued | |
| | | Capital Goods - Diversified Manufacturing—continued | |
| $3,230,000 | 1,2 | Textron Financial Corp., Jr. Sub. Note, Series 144A, 6.00%, 2/15/2067 | $2,882,775 |
| | | TOTAL | 15,845,581 |
| | | Capital Goods - Environmental—0.0% | |
| 500,000 | | Republic Services, Inc., Note, 6.086%, 3/15/2035 | 546,999 |
| | | Capital Goods - Packaging—0.3% | |
| 1,700,000 | | Packaging Corp. of America, Sr. Unsecd. Note, 3.90%, 6/15/2022 | 1,664,769 |
| 1,035,000 | | Packaging Corp. of America, Sr. Unsecd. Note, 4.50%, 11/1/2023 | 1,047,830 |
| 960,000 | | Rock-Tenn Co., Sr. Unsecd. Note, 4.45%, 3/1/2019 | 1,025,221 |
| 910,000 | | Sonoco Products Co., Sr. Unsecd. Note, 5.75%, 11/1/2040 | 956,112 |
| | | TOTAL | 4,693,932 |
| | | Communications - Media & Cable—0.8% | |
| 900,000 | | Comcast Corp., 7.05%, 3/15/2033 | 1,099,757 |
| 1,480,000 | | Comcast Corp., Company Guarantee, 6.50%, 1/15/2017 | 1,710,779 |
| 1,000,000 | 1,2 | Cox Communications, Inc., Series 144A, 3.25%, 12/15/2022 | 917,064 |
| 1,603,000 | | Cox Communications, Inc., Unsecd. Note, 5.45%, 12/15/2014 | 1,682,793 |
| 3,080,000 | | DIRECTV Holdings LLC, Company Guarantee, 6.375%, 3/1/2041 | 3,133,493 |
| 1,470,000 | | NBCUniversal Media LLC, Sr. Unsecd. Note, 2.875%, 1/15/2023 | 1,376,724 |
| 1,810,000 | | Time Warner Cable, Inc., Company Guarantee, 5.50%, 9/1/2041 | 1,471,805 |
| 1,000,000 | | Time Warner Cable, Inc., Company Guarantee, 6.75%, 6/15/2039 | 932,273 |
| 360,000 | | Time Warner Cable, Inc., Company Guarantee, 8.75%, 2/14/2019 | 428,894 |
| | | TOTAL | 12,753,582 |
| | | Communications - Media Noncable—1.9% | |
| 1,900,000 | | Discovery Communications LLC, Company Guarantee, 5.05%, 6/1/2020 | 2,107,938 |
| 6,880,000 | | Grupo Televisa S.A., 6.625%, 3/18/2025 | 7,976,700 |
| 3,000,000 | | Interpublic Group of Cos., Inc., Sr. Unsecd. Note, 2.25%, 11/15/2017 | 2,981,196 |
| 460,000 | | Interpublic Group of Cos., Inc., Sr. Unsecd. Note, 4.00%, 3/15/2022 | 445,728 |
| 1,200,000 | | Moody's Corp., Sr. Unsecd. Note, 5.50%, 9/1/2020 | 1,292,779 |
| 2,000,000 | | News America Holdings, Inc., Sr. Deb., 6.75%, 1/9/2038 | 2,261,590 |
| 1,000,000 | 1,2 | News America, Inc., Sr. Unsecd. Note, Series 144A, 4.00%, 10/1/2023 | 1,002,270 |
| 2,930,000 | | Omnicom Group, Inc., Sr. Unsecd. Note, 3.625%, 5/1/2022 | 2,855,941 |
| 1,730,000 | 1,2 | Pearson Funding Five PLC, Sr. Unsecd. Note, Series 144A, 3.25%, 5/8/2023 | 1,582,644 |
| 3,000,000 | 1,2 | Pearson Funding Two PLC, Sr. Unsecd. Note, Series 144A, 4.00%, 5/17/2016 | 3,185,310 |
| 3,440,000 | | WPP Finance 2010, Sr. Unsecd. Note, 5.125%, 9/7/2042 | 3,193,331 |
| | | TOTAL | 28,885,427 |
Annual Shareholder Report
Principal
Amount
or Shares | | | Value |
| | | CORPORATE BONDS—continued | |
| | | Communications - Telecom Wireless—1.1% | |
| $400,000 | | America Movil S.A.B. de C.V., 3.125%, 7/16/2022 | $373,020 |
| 1,025,000 | | America Movil S.A.B. de C.V., Note, 5.75%, 1/15/2015 | 1,080,507 |
| 950,000 | | American Tower Corp., Sr. Unsecd. Note, 4.50%, 1/15/2018 | 1,025,081 |
| 1,365,000 | | American Tower Corp., Sr. Unsecd. Note, 5.00%, 2/15/2024 | 1,395,422 |
| 6,400,000 | 1,2 | Crown Castle Towers LLC, Sr. Secd. Note, Series 144A, 5.495%, 1/15/2017 | 7,050,873 |
| 2,030,000 | 1,2 | SBA Tower Trust, Series 144A, 5.101%, 4/17/2017 | 2,197,251 |
| 4,000,000 | | Telefonaktiebolaget LM Ericsson, Sr. Unsecd. Note, 4.125%, 5/15/2022 | 3,947,492 |
| | | TOTAL | 17,069,646 |
| | | Communications - Telecom Wirelines—3.3% | |
| 1,870,000 | | AT&T, Inc., Sr. Unsecd. Note, 5.10%, 9/15/2014 | 1,937,079 |
| 3,810,000 | | BellSouth Corp., 5.20%, 9/15/2014 | 3,948,410 |
| 4,780,000 | | CenturyLink, Inc., Sr. Unsecd. Note, 7.65%, 3/15/2042 | 4,337,850 |
| 4,500,000 | | CenturyLink, Inc., Sr. Unsecd. Note, Series S, 6.45%, 6/15/2021 | 4,713,750 |
| 2,620,000 | | Citizens Communications Co., 9.00%, 8/15/2031 | 2,652,750 |
| 4,940,000 | 1,2 | KT Corp., Note, Series 144A, 5.875%, 6/24/2014 | 5,068,618 |
| 2,700,000 | | Telefonica Emisiones SAU, Company Guarantee, 5.462%, 2/16/2021 | 2,868,828 |
| 3,100,000 | | Telefonica Emisiones SAU, Sr. Unsecd. Note, 3.192%, 4/27/2018 | 3,167,016 |
| 13,850,000 | | Verizon Communications, Inc., Sr. Unsecd. Note, 5.15%, 9/15/2023 | 14,802,395 |
| 6,340,000 | | Verizon Communications, Inc., Sr. Unsecd. Note, 6.55%, 9/15/2043 | 7,236,932 |
| | | TOTAL | 50,733,628 |
| | | Consumer Cyclical - Automotive—3.3% | |
| 5,200,000 | 1,2 | Daimler Finance NA LLC, Company Guarantee, 2.95%, 1/11/2017 | 5,396,030 |
| 1,150,000 | 1,2 | Daimler Finance NA LLC, Company Guarantee, Series 144A, 1.65%, 4/10/2015 | 1,161,581 |
| 3,500,000 | 1,2 | Daimler Finance NA LLC, Company Guarantee, Series 144A, 1.875%, 1/11/2018 | 3,487,302 |
| 2,000,000 | 1,2 | Daimler Finance NA LLC, Sr. Unsecd. Note, 2.625%, 9/15/2016 | 2,076,432 |
| 3,000,000 | | Ford Motor Co., Sr. Unsecd. Note, 4.75%, 1/15/2043 | 2,690,754 |
| 2,850,000 | | Ford Motor Credit Co., Sr. Unsecd. Note, 2.375%, 1/16/2018 | 2,890,051 |
| 4,800,000 | | Ford Motor Credit Co., Sr. Unsecd. Note, 3.00%, 6/12/2017 | 5,021,294 |
| 880,000 | | Ford Motor Credit Co., Sr. Unsecd. Note, 4.25%, 9/20/2022 | 892,783 |
| 2,500,000 | | Ford Motor Credit Co., Sr. Unsecd. Note, 4.375%, 8/6/2023 | 2,536,085 |
| 1,340,000 | 1,2 | Harley-Davidson Financial Services, Inc., Company Guarantee, Series 144A, 3.875%, 3/15/2016 | 1,421,550 |
| 1,470,000 | 1,2 | Harley-Davidson Financial Services, Inc., Sr. Unsecd. Note, Series 144A, 2.70%, 3/15/2017 | 1,519,679 |
| 2,500,000 | 1,2 | Hyundai Capital America, Sr. Unsecd. Note, Series 144A, 2.875%, 8/9/2018 | 2,541,417 |
Annual Shareholder Report
Principal
Amount
or Shares | | | Value |
| | | CORPORATE BONDS—continued | |
| | | Consumer Cyclical - Automotive—continued | |
| $2,710,000 | 1,2 | Hyundai Capital Services, Inc., Note, 6.00%, 5/5/2015 | $2,888,624 |
| 430,000 | 1,2 | Hyundai Capital Services, Inc., Sr. Unsecd. Note, Series 144A, 4.375%, 7/27/2016 | 459,614 |
| 5,200,000 | 1,2 | Nissan Motor Acceptance Corp., Note, Series 144A, 4.50%, 1/30/2015 | 5,420,964 |
| 4,590,000 | 1,2 | Nissan Motor Acceptance Corp., Sr. Unsecd. Note, Series 144A, 1.95%, 9/12/2017 | 4,607,052 |
| 2,625,000 | 1,2 | RCI Banque SA, Sr. Unsecd. Note, 3.50%, 4/3/2018 | 2,708,338 |
| 2,560,000 | 1,2 | RCI Banque SA, Sr. Unsecd. Note, Series 144A, 4.60%, 4/12/2016 | 2,718,638 |
| | | TOTAL | 50,438,188 |
| | | Consumer Cyclical - Entertainment—1.2% | |
| 1,055,000 | | Carnival Corp., Sr. Unsecd. Note, 3.95%, 10/15/2020 | 1,062,277 |
| 2,800,000 | 1 | Football Trust V, Pass Thru Cert., Series 144A, 5.35%, 10/5/2020 | 3,095,366 |
| 1,230,000 | | NBC Universal, Inc., Sr. Unsecd. Note, 5.15%, 4/30/2020 | 1,391,358 |
| 1,250,000 | | NBC Universal, Inc., Sr. Unsecd. Note, 5.95%, 4/1/2041 | 1,364,441 |
| 1,250,000 | | NBC Universal, Inc., Sr. Unsecd. Note, 6.40%, 4/30/2040 | 1,440,118 |
| 1,700,000 | | Time Warner, Inc., Company Guarantee, 6.20%, 3/15/2040 | 1,849,037 |
| 3,810,000 | | Time Warner, Inc., Company Guarantee, 6.25%, 3/29/2041 | 4,193,538 |
| 200,000 | | Time Warner, Inc., Deb., 8.375%, 3/15/2023 | 231,525 |
| 675,000 | | Viacom, Inc., Sr. Unsecd. Note, 3.50%, 4/1/2017 | 714,841 |
| 2,725,000 | | Viacom, Inc., Sr. Unsecd. Note, 4.25%, 9/1/2023 | 2,756,509 |
| | | TOTAL | 18,099,010 |
| | | Consumer Cyclical - Lodging—0.6% | |
| 2,900,000 | | Choice Hotels International, Inc., Company Guarantee, 5.70%, 8/28/2020 | 3,052,250 |
| 1,230,000 | | Hyatt Hotels Corp., Sr. Unsecd. Note, 3.375%, 7/15/2023 | 1,143,744 |
| 2,000,000 | | Marriott International, Inc., Sr. Unsecd. Note, 3.00%, 3/1/2019 | 2,035,594 |
| 1,980,000 | | Wyndham Worldwide Corp., Sr. Unsecd. Note, 4.25%, 3/1/2022 | 1,949,953 |
| 740,000 | | Wyndham Worldwide Corp., Sr. Unsecd. Note, 5.625%, 3/1/2021 | 796,054 |
| 12,000 | | Wyndham Worldwide Corp., Sr. Unsecd. Note, 6.00%, 12/1/2016 | 13,305 |
| | | TOTAL | 8,990,900 |
| | | Consumer Cyclical - Retailers—0.5% | |
| 2,500,000 | | Advance Auto Parts, Inc., 4.50%, 12/1/2023 | 2,501,740 |
| 1,070,000 | | Advance Auto Parts, Inc., Company Guarantee, 4.50%, 1/15/2022 | 1,082,635 |
| 1,447,400 | 1,2 | CVS Caremark Corp., Pass Thru Cert., Series 144A, 5.298%, 1/11/2027 | 1,599,545 |
| 600,000 | | Foot Locker, Inc., Sr. Unsecd. Note, 8.50%, 1/15/2022 | 693,000 |
| 1,150,000 | | O'Reilly Automotive, Inc., Company Guarantee, 4.875%, 1/14/2021 | 1,217,552 |
| 890,000 | | O'Reilly Automotive, Inc., Sr. Unsecd. Note, 3.85%, 6/15/2023 | 865,643 |
| | | TOTAL | 7,960,115 |
Annual Shareholder Report
Principal
Amount
or Shares | | | Value |
| | | CORPORATE BONDS—continued | |
| | | Consumer Cyclical - Services—0.7% | |
| $7,475,000 | | Boston University, Series MTNA, 7.625%, 7/15/2097 | $8,809,938 |
| 1,090,000 | | Expedia, Inc., Company Guarantee, 5.95%, 8/15/2020 | 1,179,039 |
| 1,000,000 | | University of Southern California, Sr. Unsecd. Note, 5.25%, 10/1/2111 | 1,088,148 |
| | | TOTAL | 11,077,125 |
| | | Consumer Non-Cyclical - Food/Beverage—1.6% | |
| 3,180,000 | 1,2 | Bacardi Ltd., Sr. Note, Series 144A, 7.45%, 4/1/2014 | 3,249,712 |
| 500,000 | | Bunge Ltd., Sr. Note, 8.50%, 6/15/2019 | 623,646 |
| 3,150,000 | | Coca-Cola Femsa S.A.B de C.V., Sr. Unsecd. Note, 2.375%, 11/26/2018 | 3,159,737 |
| 1,120,000 | | ConAgra Foods, Inc., 6.625%, 8/15/2039 | 1,293,744 |
| 2,700,000 | | ConAgra Foods, Inc., Sr. Unsecd. Note, 3.20%, 1/25/2023 | 2,527,732 |
| 1,600,000 | 1,2 | Grupo Bimbo SAB de CV, Sr. Unsecd. Note, Series 144A, 4.50%, 1/25/2022 | 1,619,539 |
| 6,900,000 | 1,2 | Kerry Group Financial Services, Sr. Unsecd. Note, Series 144A, 3.20%, 4/9/2023 | 6,360,109 |
| 1,130,000 | | Kraft Foods, Inc., Sr. Unsecd. Note, 6.50%, 2/9/2040 | 1,327,740 |
| 2,360,000 | 1,2 | SABMiller Holdings, Inc., Company Guarantee, Series 144A, 2.45%, 1/15/2017 | 2,436,157 |
| 1,680,000 | | Tyson Foods, Inc., Sr. Unsecd. Note, 4.50%, 6/15/2022 | 1,712,483 |
| | | TOTAL | 24,310,599 |
| | | Consumer Non-Cyclical - Health Care—0.0% | |
| 540,000 | | Zimmer Holdings, Inc., Sr. Note, 5.75%, 11/30/2039 | 595,147 |
| | | Consumer Non-Cyclical - Pharmaceuticals—0.2% | |
| 2,760,000 | | Bio-Rad Laboratories, Inc., Sr. Unsecd. Note, 4.875%, 12/15/2020 | 2,869,798 |
| 800,000 | | Dentsply International, Inc., Sr. Unsecd. Note, 2.75%, 8/15/2016 | 825,843 |
| | | TOTAL | 3,695,641 |
| | | Consumer Non-Cyclical - Products—0.2% | |
| 900,000 | | Clorox Co., Sr. Unsecd. Note, 3.55%, 11/1/2015 | 947,170 |
| 1,420,000 | | Hasbro, Inc., Sr. Unsecd. Note, 6.35%, 3/15/2040 | 1,520,390 |
| | | TOTAL | 2,467,560 |
| | | Consumer Non-Cyclical - Supermarkets—0.1% | |
| 960,000 | | Kroger Co., Bond, 6.90%, 4/15/2038 | 1,120,383 |
| 300,000 | | Safeway, Inc., Sr. Unsecd. Note, 7.45%, 9/15/2027 | 316,633 |
| | | TOTAL | 1,437,016 |
| | | Consumer Non-Cyclical - Tobacco—0.2% | |
| 250,000 | | Altria Group, Inc., 9.25%, 8/6/2019 | 333,743 |
| 1,845,000 | | Altria Group, Inc., Sr. Unsecd. Note, 4.00%, 1/31/2024 | 1,820,218 |
| 950,000 | | Lorillard Tobacco Co., Sr. Unsecd. Note, 7.00%, 8/4/2041 | 1,033,737 |
| | | TOTAL | 3,187,698 |
Annual Shareholder Report
Principal
Amount
or Shares | | | Value |
| | | CORPORATE BONDS—continued | |
| | | Energy - Independent—1.7% | |
| $1,690,000 | | Apache Corp., Sr. Unsecd. Note, 3.25%, 4/15/2022 | $1,681,219 |
| 460,000 | | Canadian Natural Resources Ltd., 4.90%, 12/1/2014 | 479,034 |
| 5,890,000 | | Canadian Natural Resources Ltd., 5.85%, 2/1/2035 | 6,267,072 |
| 495,000 | | Pemex Project Funding Master Trust, 5.75%, 12/15/2015 | 537,075 |
| 1,000,000 | | Petroleos Mexicanos, 6.50%, 6/2/2041 | 1,015,824 |
| 7,180,000 | | Petroleos Mexicanos, Company Guarantee, 5.50%, 1/21/2021 | 7,754,400 |
| 6,000,000 | | Petroleos Mexicanos, Company Guarantee, Series WI, 4.875%, 3/15/2015 | 6,315,000 |
| 440,000 | | XTO Energy, Inc., 6.375%, 6/15/2038 | 562,508 |
| 775,000 | | XTO Energy, Inc., 6.75%, 8/1/2037 | 1,028,498 |
| | | TOTAL | 25,640,630 |
| | | Energy - Integrated—2.1% | |
| 1,740,000 | | BP Capital Markets America, Inc., Company Guarantee, 4.20%, 6/15/2018 | 1,895,760 |
| 4,000,000 | | BP Capital Markets PLC, 1.375%, 5/10/2018 | 3,935,044 |
| 1,200,000 | | BP Capital Markets PLC, Company Guarantee, 3.125%, 10/1/2015 | 1,256,532 |
| 3,270,000 | | BP Capital Markets PLC, Company Guarantee, 4.742%, 3/11/2021 | 3,589,845 |
| 1,750,000 | 1,2 | CNPC Hong Kong Overseas Capital Ltd., Company Guarantee, Series 144A, 5.95%, 4/28/2041 | 1,902,442 |
| 2,500,000 | | Hess Corp., Sr. Unsecd. Note, 5.60%, 2/15/2041 | 2,629,225 |
| 2,370,000 | | Husky Energy, Inc., Sr. Unsecd. Note, 3.95%, 4/15/2022 | 2,394,961 |
| 450,000 | | Husky Oil Ltd., Deb., 7.55%, 11/15/2016 | 522,215 |
| 4,650,000 | | Petro-Canada, Bond, 5.35%, 7/15/2033 | 4,757,522 |
| 220,000 | | Petro-Canada, Deb., 7.00%, 11/15/2028 | 274,666 |
| 4,180,000 | | Petrobras Global Finance BV, Sr. Unsecd. Note, 4.375%, 5/20/2023 | 3,839,159 |
| 2,740,000 | | Petrobras International Finance Co., Company Guarantee, 6.75%, 1/27/2041 | 2,617,927 |
| 1,930,000 | | Petrobras International Finance Co., Sr. Unsecd. Note, 2.875%, 2/6/2015 | 1,966,145 |
| | | TOTAL | 31,581,443 |
| | | Energy - Oil Field Services—0.7% | |
| 700,000 | | Nabors Industries, Inc., Company Guarantee, 5.00%, 9/15/2020 | 736,444 |
| 2,500,000 | | Nabors Industries, Inc., Sr. Unsecd. Note, 4.625%, 9/15/2021 | 2,521,587 |
| 1,350,000 | 1,2 | Nabors Industries, Inc., Sr. Unsecd. Note, Series 144A, 5.10%, 9/15/2023 | 1,363,218 |
| 210,000 | | Noble Drilling Corp., Sr. Note, 7.50%, 3/15/2019 | 246,652 |
| 990,000 | | Noble Holding International Ltd., Company Guarantee, 4.90%, 8/1/2020 | 1,053,408 |
| 100,000 | | Weatherford International Ltd., 6.00%, 3/15/2018 | 113,958 |
Annual Shareholder Report
Principal
Amount
or Shares | | | Value |
| | | CORPORATE BONDS—continued | |
| | | Energy - Oil Field Services—continued | |
| $2,700,000 | | Weatherford International Ltd., 7.00%, 3/15/2038 | $2,979,561 |
| 500,000 | | Weatherford International Ltd., 9.875%, 3/1/2039 | 696,608 |
| 610,000 | | Weatherford International Ltd., Sr. Unsecd. Note, 5.95%, 4/15/2042 | 607,408 |
| 410,372 | 1,2 | Windsor Petroleum Transport Corp., Series 144A, 7.84%, 1/15/2021 | 276,951 |
| | | TOTAL | 10,595,795 |
| | | Energy - Refining—0.5% | |
| 720,000 | | Marathon Petroleum Corp., Sr. Unsecd. Note, 6.50%, 3/1/2041 | 815,677 |
| 1,665,000 | | Valero Energy Corp., 7.50%, 4/15/2032 | 1,994,625 |
| 3,870,000 | | Valero Energy Corp., 9.375%, 3/15/2019 | 5,040,389 |
| | | TOTAL | 7,850,691 |
| | | Financial Institution - Banking—13.0% | |
| 3,660,000 | | Associated Banc-Corp., Sr. Unsecd. Note, 5.125%, 3/28/2016 | 3,941,692 |
| 1,580,000 | | Bank of America Corp., Sr. Note, 7.375%, 5/15/2014 | 1,628,035 |
| 2,500,000 | | Bank of America Corp., Sr. Unsecd. Note, 3.70%, 9/1/2015 | 2,619,445 |
| 2,000,000 | | Bank of America Corp., Sr. Unsecd. Note, 4.50%, 4/1/2015 | 2,097,658 |
| 9,900,000 | | Bank of America Corp., Sr. Unsecd. Note, 5.625%, 7/1/2020 | 11,337,510 |
| 7,895,000 | | Bank of America Corp., Sr. Unsecd. Note, 5.875%, 1/5/2021 | 9,077,805 |
| 5,000,000 | | Bank of America Corp., Sr. Unsecd. Note, Series MTN, 2.00%, 1/11/2018 | 5,020,140 |
| 2,700,000 | | Bank of Montreal, Sr. Unsecd. Note, Series MTN, 1.45%, 4/9/2018 | 2,657,597 |
| 5,000,000 | 1,2 | Barclays Bank PLC, Jr. Sub. Note, Series 144A, 5.926%, 9/29/2049 | 5,312,500 |
| 4,750,000 | 6 | Bear Stearns Cos., Inc., Sr. Unsecd. Note, 7.25%, 2/1/2018 | 5,742,797 |
| 1,730,000 | | Capital One Bank, Sr. Unsecd. Note, Series BKNT, 2.15%, 11/21/2018 | 1,732,647 |
| 5,500,000 | | Capital One Bank, Sub. Note, 3.375%, 2/15/2023 | 5,180,131 |
| 2,270,000 | | Capital One Financial Corp., Sr. Note, 7.375%, 5/23/2014 | 2,342,461 |
| 4,000,000 | | Citigroup, Inc., Sr. Note, 5.375%, 8/9/2020 | 4,542,204 |
| 1,470,000 | | Citigroup, Inc., Sr. Unsecd. Note, 4.45%, 1/10/2017 | 1,604,724 |
| 1,000,000 | | Citigroup, Inc., Sr. Unsecd. Note, 4.50%, 1/14/2022 | 1,058,364 |
| 2,500,000 | | Citigroup, Inc., Sr. Unsecd. Note, 4.587%, 12/15/2015 | 2,677,310 |
| 1,440,000 | | Citigroup, Inc., Sr. Unsecd. Note, 6.00%, 12/13/2013 | 1,442,085 |
| 2,072,000 | | Citigroup, Inc., Sr. Unsecd. Note, 6.875%, 3/5/2038 | 2,600,354 |
| 1,450,000 | | City National Corp., Sr. Unsecd. Note, 5.25%, 9/15/2020 | 1,559,627 |
| 3,000,000 | | Credit Suisse AG New York, Sr. Unsecd. Note, 5.50%, 5/1/2014 | 3,063,399 |
| 2,750,000 | | Deutsche Bank AG London, Sr. Unsecd. Note, 3.25%, 1/11/2016 | 2,891,820 |
| 1,430,000 | | Fifth Third Bancorp, Sr. Unsecd. Note, 3.625%, 1/25/2016 | 1,508,311 |
| 7,000,000 | | Goldman Sachs Group, Inc., Sr. Unsecd. Note, 5.75%, 1/24/2022 | 7,910,252 |
| 2,900,000 | | Goldman Sachs Group, Inc., Sr. Unsecd. Note, 6.125%, 2/15/2033 | 3,245,445 |
Annual Shareholder Report
Principal
Amount
or Shares | | | Value |
| | | CORPORATE BONDS—continued | |
| | | Financial Institution - Banking—continued | |
| $4,200,000 | | Goldman Sachs Group, Inc., Sr. Unsecd. Note, 6.25%, 2/1/2041 | $4,836,913 |
| 2,100,000 | | Goldman Sachs Group, Inc., Sub. Note, 6.345%, 2/15/2034 | 2,141,704 |
| 1,770,000 | | HSBC Holdings PLC, Sr. Unsecd. Note, 4.00%, 3/30/2022 | 1,825,431 |
| 600,000 | | HSBC Holdings PLC, Sr. Unsecd. Note, 5.10%, 4/5/2021 | 667,300 |
| 1,000,000 | | HSBC USA, Inc., Sr. Unsecd. Note, 1.625%, 1/16/2018 | 996,736 |
| 2,900,000 | | HSBC USA, Inc., Sr. Unsecd. Note, 2.375%, 2/13/2015 | 2,964,948 |
| 780,000 | | Huntington Bancshares, Inc., Sub. Note, 7.00%, 12/15/2020 | 923,670 |
| 2,050,000 | | JPMorgan Chase & Co., Sr. Unsecd. Note, 4.50%, 1/24/2022 | 2,178,890 |
| 870,000 | | JPMorgan Chase & Co., Sub. Deb., 8.00%, 4/29/2027 | 1,140,630 |
| 740,000 | | JPMorgan Chase & Co., Sub. Note, 3.375%, 5/1/2023 | 689,034 |
| 10,900,000 | | JPMorgan Chase & Co., Sub. Note, 5.125%, 9/15/2014 | 11,280,464 |
| 3,975,000 | | Manufacturers & Traders Trust Co., Sub. Note, Series BKNT, 5.629%, 12/1/2021 | 4,163,813 |
| 6,550,000 | | Morgan Stanley, Sr. Unsecd. Note, 3.80%, 4/29/2016 | 6,943,675 |
| 1,000,000 | | Morgan Stanley, Sr. Unsecd. Note, 4.20%, 11/20/2014 | 1,034,114 |
| 1,900,000 | | Morgan Stanley, Sr. Unsecd. Note, 4.75%, 3/22/2017 | 2,090,479 |
| 2,000,000 | | Morgan Stanley, Sr. Unsecd. Note, 5.50%, 7/24/2020 | 2,260,154 |
| 3,280,000 | | Morgan Stanley, Sr. Unsecd. Note, 6.375%, 7/24/2042 | 3,833,759 |
| 5,240,000 | | Morgan Stanley, Sr. Unsecd. Note, Series GMTN, 6.625%, 4/1/2018 | 6,182,561 |
| 1,500,000 | | Morgan Stanley, Sr. Unsecd. Note, Series MTN, 5.95%, 12/28/2017 | 1,732,361 |
| 2,450,000 | | Morgan Stanley, Sr. Unsecd. Note, Series MTN, 6.00%, 4/28/2015 | 2,618,518 |
| 4,320,000 | | Morgan Stanley, Sub. Note, 4.10%, 5/22/2023 | 4,171,336 |
| 9,030,000 | | Murray Street Investment Trust I, Sr. Unsecd. Note, 4.647%, 3/9/2017 | 9,818,445 |
| 500,000 | 1,2 | PNC Preferred Funding LLC, Jr. Sub. Note, Series 144A, 1.904%, 3/29/2049 | 440,000 |
| 3,500,000 | 1,2 | RBS Citizens Financial Group, Inc., Sub. Note, Series 144A, 4.15%, 9/28/2022 | 3,413,631 |
| 4,908,256 | 1,2,5 | Regional Diversified Funding, Series 144A, 9.25%, 3/15/2030 | 3,222,270 |
| 4,100,000 | 1,2 | Santander US Debt SA Unipersonal, Bank Guarantee, Series 144A, 3.781%, 10/7/2015 | 4,235,259 |
| 1,000,000 | | SunTrust Banks, Inc., Sr. Unsecd. Note, 3.60%, 4/15/2016 | 1,059,796 |
| 2,700,000 | | Union Bank, N.A., Sr. Unsecd. Note, 2.625%, 9/26/2018 | 2,773,618 |
| 1,130,000 | | Vesey Street Investment Trust I, Sr. Unsecd. Note, 4.404%, 9/1/2016 | 1,220,253 |
| 4,500,000 | | Wachovia Bank N.A., Sub. Note, Series BKNT, 4.80%, 11/1/2014 | 4,678,681 |
| 3,440,000 | | Wachovia Bank N.A., Sub. Note, Series BKNT, 4.875%, 2/1/2015 | 3,606,290 |
| 1,100,000 | | Wells Fargo Bank, N.A., Sub. Note, Series AI, 4.75%, 2/9/2015 | 1,150,840 |
| 3,550,000 | | Wilmington Trust Corp., Sub. Note, 8.50%, 4/2/2018 | 4,268,328 |
| | | TOTAL | 197,358,214 |
Annual Shareholder Report
Principal
Amount
or Shares | | | Value |
| | | CORPORATE BONDS—continued | |
| | | Financial Institution - Brokerage—2.2% | |
| $2,500,000 | 1,2 | Cantor Fitzgerald LP, Bond, Series 144A, 7.875%, 10/15/2019 | $2,628,825 |
| 1,070,000 | | Eaton Vance Corp., Sr. Unsecd. Note, 3.625%, 6/15/2023 | 1,044,980 |
| 279,000 | | Eaton Vance Corp., Sr. Unsecd. Note, 6.50%, 10/2/2017 | 322,052 |
| 4,255,000 | 1,2 | FMR LLC, Bond, Series 144A, 7.57%, 6/15/2029 | 5,338,387 |
| 700,000 | | Franklin Resources, Inc., Sr. Unsecd. Note, 4.625%, 5/20/2020 | 765,436 |
| 1,375,000 | | Janus Capital Group, Inc., Sr. Note, 6.70%, 6/15/2017 | 1,557,661 |
| 1,650,000 | | Jefferies Group LLC, Sr. Unsecd. Note, 6.50%, 1/20/2043 | 1,626,367 |
| 2,500,000 | | Jefferies Group LLC, Sr. Unsecd. Note, 6.875%, 4/15/2021 | 2,837,500 |
| 4,390,000 | | Jefferies Group LLC, Sr. Unsecd. Note, 8.50%, 7/15/2019 | 5,377,750 |
| 1,325,000 | | Legg Mason, Inc., Sr. Unsecd. Note, 5.50%, 5/21/2019 | 1,478,942 |
| 1,020,000 | | Nuveen Investments, Inc., Sr. Unsecd. Note, 5.50%, 9/15/2015 | 1,025,100 |
| 1,370,000 | | Raymond James Financial, Inc., Sr. Unsecd. Note, 4.25%, 4/15/2016 | 1,459,941 |
| 3,500,000 | | Raymond James Financial, Inc., Sr. Unsecd. Note, 5.625%, 4/1/2024 | 3,668,350 |
| 2,990,000 | | Raymond James Financial, Inc., Sr. Unsecd. Note, 8.60%, 8/15/2019 | 3,817,895 |
| | | TOTAL | 32,949,186 |
| | | Financial Institution - Finance Noncaptive—3.8% | |
| 1,000,000 | | American Express Co., Sr. Unsecd. Note, 2.75%, 9/15/2015 | 1,037,336 |
| 2,000,000 | | American Express Credit Corp., Sr. Unsecd. Note, Series MTN, 2.80%, 9/19/2016 | 2,101,536 |
| 2,500,000 | | Discover Bank, Sr. Unsecd. Note, 2.00%, 2/21/2018 | 2,486,208 |
| 783,000 | | Discover Bank, Sub., Series BKNT, 8.70%, 11/18/2019 | 999,317 |
| 2,517,000 | | Discover Financial Services, Sr. Unsecd. Note, 3.85%, 11/21/2022 | 2,422,323 |
| 3,150,000 | 1,2 | General Electric Capital Corp. & LJ VP Holdings LLC, Sr. Unsecd. Note, Series 144A, 3.80%, 6/18/2019 | 3,344,251 |
| 7,000,000 | | General Electric Capital Corp., Sr. Unsecd. Note, 2.90%, 1/9/2017 | 7,348,180 |
| 1,500,000 | | General Electric Capital Corp., Sr. Unsecd. Note, 4.625%, 1/7/2021 | 1,654,502 |
| 2,850,000 | | General Electric Capital Corp., Sr. Unsecd. Note, 4.65%, 10/17/2021 | 3,124,723 |
| 6,500,000 | | General Electric Capital Corp., Sr. Unsecd. Note, Series GMTN, 6.875%, 1/10/2039 | 8,252,640 |
| 4,000,000 | | General Electric Capital Corp., Sr. Unsecd. Note, Series MTN, 3.10%, 1/9/2023 | 3,830,516 |
| 6,000,000 | | HSBC Finance Capital Trust IX, Note, 5.911%, 11/30/2035 | 6,255,000 |
| 3,072,000 | | HSBC Finance Corp., Sr. Sub. Note, 6.676%, 1/15/2021 | 3,580,305 |
| 1,500,000 | 1,2 | ILFC E-Capital Trust I, Floating Rate Note—Sr. Sub Note, Series 144A, 5.35%, 12/21/2065 | 1,342,500 |
| 1,500,000 | 1,2 | Lukoil International Finance BV, Series 144A, 6.356%, 6/7/2017 | 1,672,800 |
| 4,000,000 | 1,2 | Macquarie Group Ltd., Sr. Unsecd. Note, Series 144A, 6.00%, 1/14/2020 | 4,436,200 |
Annual Shareholder Report
Principal
Amount
or Shares | | | Value |
| | | CORPORATE BONDS—continued | |
| | | Financial Institution - Finance Noncaptive—continued | |
| $3,250,000 | | Susa Partnership LP, Sr. Unsecd. Note, 8.20%, 6/1/2017 | $3,881,683 |
| | | TOTAL | 57,770,020 |
| | | Financial Institution - Insurance - Health—0.1% | |
| 740,000 | | Wellpoint, Inc., 5.85%, 1/15/2036 | 797,570 |
| | | Financial Institution - Insurance - Life—3.9% | |
| 2,750,000 | | AXA-UAP, Sub. Note, 8.60%, 12/15/2030 | 3,382,869 |
| 3,100,000 | | Aflac, Inc., Sr. Unsecd. Note, 3.625%, 6/15/2023 | 3,027,507 |
| 2,715,000 | | Aflac, Inc., Sr. Unsecd. Note, 8.50%, 5/15/2019 | 3,527,282 |
| 6,220,000 | | American International Group, Inc., Sr. Unsecd. Note, 4.25%, 9/15/2014 | 6,399,061 |
| 7,500,000 | | American International Group, Inc., Sr. Unsecd. Note, 6.40%, 12/15/2020 | 8,947,463 |
| 1,000,000 | | Hartford Financial Services Group, Inc., Sr. Unsecd. Note, 5.125%, 4/15/2022 | 1,105,350 |
| 1,000,000 | | Hartford Financial Services Group, Inc., Sr. Unsecd. Note, 6.625%, 4/15/2042 | 1,227,151 |
| 1,720,000 | | Lincoln National Corp., Sr. Note, 7.00%, 6/15/2040 | 2,189,128 |
| 1,000,000 | | Lincoln National Corp., Sr. Unsecd. Note, 4.00%, 9/1/2023 | 1,003,038 |
| 1,350,000 | | Lincoln National Corp., Sr. Unsecd. Note, 4.20%, 3/15/2022 | 1,397,575 |
| 700,000 | 1,2 | Massachusetts Mutual Life Insurance Co., Sub. Note, Series 144A, 5.375%, 12/1/2041 | 731,667 |
| 3,860,000 | 1,2 | Massachusetts Mutual Life Insurance Co., Sub. Note, Series 144A, 8.875%, 6/1/2039 | 5,571,524 |
| 1,000,000 | | MetLife, Inc., Jr. Sub. Note, 10.75%, 8/1/2039 | 1,487,500 |
| 700,000 | 1,2 | New York Life Insurance Co., Sub. Note, Series 144A, 6.75%, 11/15/2039 | 866,229 |
| 4,000,000 | 1,2 | Pacific LifeCorp., Bond, Series 144A, 6.60%, 9/15/2033 | 4,504,896 |
| 1,000,000 | 1,2 | Penn Mutual Life Insurance Co., Sr. Note, Series 144A, 7.625%, 6/15/2040 | 1,277,933 |
| 1,040,000 | | Principal Financial Group, Inc., Sr. Unsecd. Note, 3.125%, 5/15/2023 | 986,981 |
| 1,190,000 | | Principal Financial Group, Inc., Sr. Unsecd. Note, 3.30%, 9/15/2022 | 1,155,304 |
| 1,530,000 | | Prudential Financial, Inc., Series MTN, 6.625%, 12/1/2037 | 1,860,351 |
| 2,500,000 | | Prudential Financial, Inc., Sr. Unsecd. Note, Series MTN, 4.75%, 9/17/2015 | 2,676,250 |
| 1,000,000 | | Prudential Financial, Inc., Sr. Unsecd. Note, Series MTN, 6.20%, 11/15/2040 | 1,164,909 |
| 3,950,000 | 1 | Union Central Life Insurance Co., Note, Series 144A, 8.20%, 11/1/2026 | 4,430,205 |
| | | TOTAL | 58,920,173 |
| | | Financial Institution - Insurance - P&C—1.3% | |
| 540,000 | | CNA Financial Corp., 6.50%, 8/15/2016 | 610,595 |
Annual Shareholder Report
Principal
Amount
or Shares | | | Value |
| | | CORPORATE BONDS—continued | |
| | | Financial Institution - Insurance - P&C—continued | |
| $1,000,000 | | CNA Financial Corp., Sr. Unsecd. Note, 5.75%, 8/15/2021 | $1,133,922 |
| 920,000 | | CNA Financial Corp., Sr. Unsecd. Note, 5.875%, 8/15/2020 | 1,057,008 |
| 700,000 | | CNA Financial Corp., Sr. Unsecd. Note, 7.35%, 11/15/2019 | 865,045 |
| 1,710,000 | | Horace Mann Educators Corp., Sr. Note, 6.85%, 4/15/2016 | 1,867,573 |
| 850,000 | 1,2 | Liberty Mutual Group, Inc., Company Guarantee, Series 144A, 5.00%, 6/1/2021 | 906,180 |
| 1,360,000 | 1,2 | Liberty Mutual Group, Inc., Series 144A, 4.95%, 5/1/2022 | 1,419,693 |
| 1,150,000 | 1,2 | Liberty Mutual Group, Inc., Sr. Unsecd. Note, Series 144A, 4.25%, 6/15/2023 | 1,129,536 |
| 4,000,000 | 1,2 | Liberty Mutual Group, Inc., Unsecd. Note, Series 144A, 5.75%, 3/15/2014 | 4,049,552 |
| 3,400,000 | 1,2 | Nationwide Mutual Insurance Co., Sub. Note, Series 144A, 9.375%, 8/15/2039 | 4,837,609 |
| 265,000 | | The Travelers Cos., Inc., Sr. Unsecd. Note, 5.50%, 12/1/2015 | 290,516 |
| 1,000,000 | 1,2 | USF&G Corp., Series 144A, 8.312%, 7/1/2046 | 1,240,285 |
| | | TOTAL | 19,407,514 |
| | | Financial Institution - REITs—2.1% | |
| 1,750,000 | | AMB Property LP, Company Guarantee, 6.125%, 12/1/2016 | 1,984,677 |
| 1,450,000 | | Alexandria Real Estate Equities, Inc., Sr. Unsecd. Note, 3.90%, 6/15/2023 | 1,375,455 |
| 1,450,000 | | Alexandria Real Estate Equities, Inc., Sr. Unsecd. Note, 4.60%, 4/1/2022 | 1,472,340 |
| 2,000,000 | | Boston Properties LP, Sr. Unsecd. Note, 3.80%, 2/1/2024 | 1,955,096 |
| 3,500,000 | | Boston Properties LP, Sr. Unsecd. Note, 5.875%, 10/15/2019 | 4,074,602 |
| 1,500,000 | | Equity One, Inc., Bond, 6.00%, 9/15/2017 | 1,698,790 |
| 500,000 | | Health Care REIT, Inc., Sr. Unsecd. Note, 4.125%, 4/1/2019 | 533,461 |
| 2,000,000 | | Health Care REIT, Inc., Sr. Unsecd. Note, 6.125%, 4/15/2020 | 2,279,798 |
| 2,300,000 | | Healthcare Trust of America, 3.70%, 4/15/2023 | 2,156,991 |
| 421,000 | | iStar Financial, Inc., Sr. Unsecd. Note, Series B, 5.70%, 3/1/2014 | 426,410 |
| 370,000 | | Liberty Property LP, 6.625%, 10/1/2017 | 428,005 |
| 2,160,000 | | Post Apartment Homes LP, Sr. Unsecd. Note, 3.375%, 12/1/2022 | 2,016,695 |
| 267,000 | | ProLogis, Inc., Sr. Unsecd. Note, 6.875%, 3/15/2020 | 316,563 |
| 500,000 | | Realty Income Corp., Sr. Unsecd. Note, 6.75%, 8/15/2019 | 594,113 |
| 1,700,000 | | Regency Centers LP, Company Guarantee, 4.80%, 4/15/2021 | 1,789,111 |
| 1,430,000 | | Simon Property Group LP, 6.125%, 5/30/2018 | 1,682,226 |
| 830,000 | | Simon Property Group LP, 6.75%, 5/15/2014 | 840,056 |
| 2,300,000 | | Tanger Properties LP, Sr. Unsecd. Note, 3.875%, 12/1/2023 | 2,255,796 |
| 2,000,000 | | Tanger Properties LP, Sr. Unsecd. Note, 6.125%, 6/1/2020 | 2,325,026 |
Annual Shareholder Report
Principal
Amount
or Shares | | | Value |
| | | CORPORATE BONDS—continued | |
| | | Financial Institution - REITs—continued | |
| $920,000 | | UDR, Inc., Company Guarantee, 4.625%, 1/10/2022 | $958,335 |
| | | TOTAL | 31,163,546 |
| | | Municipal Services—0.3% | |
| 1,825,000 | 1,2 | Army Hawaii Family Housing, Series 144A, 5.524%, 6/15/2050 | 1,795,910 |
| 2,935,000 | 1,2 | Camp Pendleton & Quantico Housing LLC, Series 144A, 5.572%, 10/1/2050 | 2,920,090 |
| | | TOTAL | 4,716,000 |
| | | Sovereign—0.4% | |
| 2,340,000 | | Corp Andina De Fomento, Sr. Unsecd. Note, 3.75%, 1/15/2016 | 2,452,222 |
| 1,100,000 | | Corp Andina De Fomento, Sr. Unsecd. Note, 4.375%, 6/15/2022 | 1,109,273 |
| 1,550,000 | | Inter-American Development Bank, Series MTN, 6.75%, 7/15/2027 | 2,062,997 |
| | | TOTAL | 5,624,492 |
| | | Technology—2.3% | |
| 1,580,000 | | Adobe Systems, Inc., Sr. Unsecd. Note, 3.25%, 2/1/2015 | 1,626,436 |
| 1,630,000 | | Agilent Technologies, Inc., Sr. Unsecd. Note, 3.20%, 10/1/2022 | 1,523,227 |
| 1,650,000 | | Agilent Technologies, Inc., Sr. Unsecd. Note, 3.875%, 7/15/2023 | 1,593,746 |
| 1,125,000 | | Apple, Inc., Sr. Unsecd. Note, 2.40%, 5/3/2023 | 1,021,263 |
| 1,400,000 | | BMC Software, Inc., 7.25%, 6/1/2018 | 1,471,750 |
| 1,400,000 | | Corning, Inc., Unsecd. Note, 4.75%, 3/15/2042 | 1,374,113 |
| 4,000,000 | | Fidelity National Information Services, Inc., Sr. Unsecd. Note, 3.50%, 4/15/2023 | 3,676,368 |
| 4,030,000 | | Fiserv, Inc., Sr. Note, 6.80%, 11/20/2017 | 4,711,586 |
| 6,175,000 | | Harris Corp., 5.95%, 12/1/2017 | 6,875,807 |
| 2,540,000 | | Ingram Micro, Inc., Sr. Unsecd. Note, 5.00%, 8/10/2022 | 2,530,747 |
| 1,000,000 | | Juniper Networks, Inc., Sr. Unsecd. Note, 5.95%, 3/15/2041 | 1,001,147 |
| 2,330,000 | | KLA-Tencor Corp., 6.90%, 5/1/2018 | 2,742,846 |
| 975,000 | | SAIC, Inc., Company Guarantee, 5.95%, 12/1/2040 | 944,401 |
| 1,380,000 | | Verisk Analytics, Inc., Sr. Unsecd. Note, 4.125%, 9/12/2022 | 1,359,329 |
| 2,830,000 | | Verisk Analytics, Inc., Sr. Unsecd. Note, 4.875%, 1/15/2019 | 3,037,504 |
| | | TOTAL | 35,490,270 |
| | | Transportation - Airlines—0.4% | |
| 26,649 | | Continental Airlines, Inc., Pass Thru Cert., Series 971A, 7.461%, 4/1/2015 | 27,582 |
| 1,995,000 | | Southwest Airlines Co., Deb., 7.375%, 3/1/2027 | 2,268,217 |
| 2,870,000 | | Southwest Airlines Co., Sr. Unsecd. Note, 5.125%, 3/1/2017 | 3,155,072 |
| | | TOTAL | 5,450,871 |
| | | Transportation - Railroads—0.7% | |
| 3,095,000 | | Burlington Northern Santa Fe Corp., Deb., 5.75%, 5/1/2040 | 3,384,645 |
Annual Shareholder Report
Principal
Amount
or Shares | | | Value |
| | | CORPORATE BONDS—continued | |
| | | Transportation - Railroads—continued | |
| $1,506,588 | | Burlington Northern Santa Fe Corp., Pass Thru Cert., Series 99-2, 7.57%, 1/2/2021 | $1,742,851 |
| 3,150,000 | | Canadian Pacific RR, 7.125%, 10/15/2031 | 3,808,051 |
| 1,325,000 | | Kansas City Southern de Mexico SA de CV, Sr. Unsecd. Note, 3.00%, 5/15/2023 | 1,233,334 |
| | | TOTAL | 10,168,881 |
| | | Transportation - Services—1.3% | |
| 3,080,000 | 1,2 | Enterprise Rent-A-Car USA Finance Co., Series 144A, 6.375%, 10/15/2017 | 3,582,641 |
| 4,440,000 | 1,2 | Enterprise Rent-A-Car USA Finance Co., Sr. Unsecd. Note, Series 144A, 5.625%, 3/15/2042 | 4,524,737 |
| 5,390,000 | 1,2 | Penske Truck Leasing Co. LP & PTL Finance Corp., Series 144A, 3.75%, 5/11/2017 | 5,692,966 |
| 1,200,000 | | Ryder System, Inc., Sr. Unsecd. Note, 3.50%, 6/1/2017 | 1,265,096 |
| 1,750,000 | | Ryder System, Inc., Sr. Unsecd. Note, Series MTN, 2.45%, 11/15/2018 | 1,751,827 |
| 925,000 | | Ryder System, Inc., Sr. Unsecd. Note, Series MTN, 2.50%, 3/1/2018 | 939,014 |
| 1,175,000 | | Ryder System, Inc., Sr. Unsecd. Note, Series MTN, 3.15%, 3/2/2015 | 1,207,670 |
| | | TOTAL | 18,963,951 |
| | | Utility - Electric—3.4% | |
| 3,050,000 | | American Electric Power Co., Inc., Sr. Unsecd. Note, Series F, 2.95%, 12/15/2022 | 2,855,300 |
| 650,000 | | Appalachian Power Co., Sr. Unsecd. Note, 7.95%, 1/15/2020 | 813,158 |
| 300,000 | | Avista Corp., 1st Mtg. Bond, 5.95%, 6/1/2018 | 350,420 |
| 435,436 | | Bruce Mansfield Unit 1 2, Pass Thru Cert., 6.85%, 6/1/2034 | 455,587 |
| 1,530,000 | | Cleveland Electric Illuminating Co., Sr. Unsecd. Note, 5.95%, 12/15/2036 | 1,543,254 |
| 1,180,000 | | Commonwealth Edison Co., 1st Mtg. Bond, 6.15%, 9/15/2017 | 1,376,294 |
| 2,000,000 | | Dominion Resources, Inc., Unsecd. Note, Series B, 5.95%, 6/15/2035 | 2,209,266 |
| 100,000 | | Duke Energy Indiana, Inc., 1st Mtg. Bond, 6.35%, 8/15/2038 | 124,450 |
| 2,100,000 | 1,2 | Enel Finance International SA, Company Guarantee, Series 144A, 3.875%, 10/7/2014 | 2,151,549 |
| 5,150,000 | | Enersis S.A., Note, 7.40%, 12/1/2016 | 5,949,826 |
| 300,000 | | Entergy Gulf States, Inc., 1st Mtg. Bond, 6.18%, 3/1/2035 | 300,059 |
| 4,100,000 | | Exelon Generation Co. LLC, Sr. Unsecd. Note, 4.25%, 6/15/2022 | 3,979,550 |
| 900,000 | | Exelon Generation Co. LLC, Sr. Unsecd. Note, 5.75%, 10/1/2041 | 868,396 |
| 300,000 | | FPL Group Capital, Inc., 7.875%, 12/15/2015 | 341,566 |
| 870,000 | | FirstEnergy Corp., Sr. Unsecd. Note, Series A, 2.75%, 3/15/2018 | 857,952 |
| 665,000 | | FirstEnergy Solutions Corp., Company Guarantee, 6.05%, 8/15/2021 | 712,554 |
| 1,055,000 | | Great Plains Energy, Inc., Note, 4.85%, 6/1/2021 | 1,114,561 |
Annual Shareholder Report
Principal
Amount
or Shares | | | Value |
| | | CORPORATE BONDS—continued | |
| | | Utility - Electric—continued | |
| $1,574,832 | 1,2 | Great River Energy, 1st Mtg. Note, Series 144A, 5.829%, 7/1/2017 | $1,679,714 |
| 1,330,000 | 1,2 | Korea Hydro & Nuclear Power Co. Ltd., Sr. Unsecd. Note, Series 144A, 6.25%, 6/17/2014 | 1,368,047 |
| 6,060,000 | | MidAmerican Energy Holdings Co., Sr. Unsecd. Note, 5.95%, 5/15/2037 | 6,679,696 |
| 1,645,000 | | National Rural Utilities Cooperative Finance Corp., Sr. Unsecd. Note, 10.375%, 11/1/2018 | 2,251,954 |
| 1,500,000 | | NextEra Energy Capital Holdings, Inc., Sr. Unsecd. Note, 3.625%, 6/15/2023 | 1,424,730 |
| 1,280,000 | | PPL Capital Funding, Inc., Sr. Unsecd. Note, 4.20%, 6/15/2022 | 1,282,599 |
| 1,835,000 | | PPL Energy Supply LLC, Sr. Unsecd. Note, 6.00%, 12/15/2036 | 1,770,527 |
| 1,200,000 | 1,2 | PPL WEM Holdings PLC, Sr. Unsecd. Note, Series 144A, 5.375%, 5/1/2021 | 1,295,161 |
| 1,425,000 | | PSEG Power LLC, Sr. Unsecd. Note, 2.45%, 11/15/2018 | 1,432,447 |
| 850,000 | | PSEG Power LLC, Sr. Unsecd. Note, 4.15%, 9/15/2021 | 871,491 |
| 200,000 | | South Carolina Electric and Gas, 1st Mtg. Bond, 6.50%, 11/1/2018 | 241,693 |
| 2,460,000 | | UIL Holdings Corp., Sr. Unsecd. Note, 4.625%, 10/1/2020 | 2,525,566 |
| 1,000,000 | | Virginia Electric & Power Co., Sr. Unsecd. Note, 5.00%, 6/30/2019 | 1,141,712 |
| 110,846 | | Waterford 3 Funding Corp., 8.09%, 1/2/2017 | 110,923 |
| 2,020,000 | | Westar Energy, Inc., 5.875%, 7/15/2036 | 2,078,604 |
| | | TOTAL | 52,158,606 |
| | | Utility - Natural Gas Distributor—0.7% | |
| 195,000 | | Atmos Energy Corp., 8.50%, 3/15/2019 | 253,459 |
| 830,000 | 1,2 | Florida Gas Transmission Co. LLC, Sr. Unsecd. Note, Series 144A, 5.45%, 7/15/2020 | 905,777 |
| 2,600,000 | | National Fuel Gas Co., Sr. Unsecd. Note, 3.75%, 3/1/2023 | 2,481,944 |
| 2,425,000 | | National Fuel Gas Co., Sr. Unsecd. Note, 4.90%, 12/1/2021 | 2,549,182 |
| 400,000 | | Sabine Pass LNG LP, Sr. Secd. Note, 7.50%, 11/30/2016 | 454,000 |
| 1,300,000 | | Sempra Energy, Sr. Unsecd. Note, 6.00%, 10/15/2039 | 1,452,732 |
| 2,540,000 | | Sempra Energy, Sr. Unsecd. Note, 6.50%, 6/1/2016 | 2,878,049 |
| | | TOTAL | 10,975,143 |
| | | Utility - Natural Gas Pipelines—1.8% | |
| 2,390,000 | | Consolidated Natural Gas Co., Series A, 5.00%, 12/1/2014 | 2,493,356 |
| 3,080,000 | | Enbridge, Inc., Sr. Note, 5.60%, 4/1/2017 | 3,463,740 |
| 3,230,000 | | Energy Transfer Partners LP, Sr. Unsecd. Note, 4.90%, 2/1/2024 | 3,324,322 |
| 1,000,000 | | Enterprise Products Operating LLC, Company Guarantee, 3.70%, 6/1/2015 | 1,043,562 |
| 2,500,000 | | Kinder Morgan Energy Partners LP, Note, 6.55%, 9/15/2040 | 2,774,758 |
| 2,900,000 | | Kinder Morgan Energy Partners LP, Sr. Unsecd. Note, 3.95%, 9/1/2022 | 2,867,894 |
Annual Shareholder Report
Principal
Amount
or Shares | | | Value |
| | | CORPORATE BONDS—continued | |
| | | Utility - Natural Gas Pipelines—continued | |
| $1,000,000 | | Kinder Morgan Energy Partners LP, Sr. Unsecd. Note, 5.00%, 12/15/2013 | $1,001,413 |
| 3,300,000 | | Kinder Morgan Energy Partners LP, Sr. Unsecd. Note, 5.80%, 3/15/2035 | 3,397,505 |
| 1,190,000 | | Kinder Morgan Energy Partners LP, Sr. Unsecd. Note, 6.375%, 3/1/2041 | 1,303,696 |
| 830,000 | | Kinder Morgan Energy Partners LP, Sr. Unsecd. Note, 6.85%, 2/15/2020 | 991,235 |
| 2,150,000 | 1,2 | Texas Eastern Transmission LP, Sr. Unsecd. Note, Series 144A, 2.80%, 10/15/2022 | 1,955,775 |
| 3,100,000 | | Williams Partners LP, 5.25%, 3/15/2020 | 3,384,825 |
| | | TOTAL | 28,002,081 |
| | | TOTAL CORPORATE BONDS
(IDENTIFIED COST $973,800,450) | 1,022,860,787 |
| | | MORTGAGE-BACKED SECURITIES—0.0% | |
| 2,845 | | Federal Home Loan Mortgage Corp., Pool C00702, 6.00%, 1/1/2029 | 3,151 |
| 3,254 | | Federal Home Loan Mortgage Corp., Pool C00748, 6.00%, 4/1/2029 | 3,608 |
| 621 | | Federal Home Loan Mortgage Corp., Pool C20263, 6.00%, 1/1/2029 | 686 |
| 2,318 | | Federal Home Loan Mortgage Corp., Pool C25621, 6.50%, 5/1/2029 | 2,599 |
| 2,109 | | Federal National Mortgage Association, Pool 313324, 9.00%, 6/1/2017 | 2,303 |
| 4,260 | | Federal National Mortgage Association, Pool 323159, 7.50%, 4/1/2028 | 5,009 |
| 2,751 | | Federal National Mortgage Association, Pool 421223, 7.00%, 5/1/2028 | 3,169 |
| 3,201 | | Federal National Mortgage Association, Pool 430232, 7.00%, 8/1/2028 | 3,709 |
| 19,516 | | Federal National Mortgage Association, Pool 439947, 6.50%, 11/1/2028 | 21,859 |
| 13,333 | | Federal National Mortgage Association, Pool 489867, 6.50%, 3/1/2029 | 14,957 |
| 3,176 | | Government National Mortgage Association, Pool 449491, 7.50%, 12/15/2027 | 3,789 |
| 1,520 | | Government National Mortgage Association, Pool 486467, 7.00%, 8/15/2028 | 1,792 |
| 6,647 | | Government National Mortgage Association, Pool 780339, 8.00%, 12/15/2023 | 7,834 |
| 2,733 | | Government National Mortgage Association, Pool 780340, 9.00%, 11/15/2017 | 2,969 |
| 3,801 | | Government National Mortgage Association, Pool 780373, 7.00%, 12/15/2023 | 4,380 |
| | | TOTAL MORTGAGE-BACKED SECURITIES
(IDENTIFIED COST $72,513) | 81,814 |
Annual Shareholder Report
Principal
Amount
or Shares | | | Value |
| | | MUNICIPAL BONDS—0.4% | |
| | | Municipal Services—0.4% | |
| $4,720,000 | | Chicago, IL, Taxable Project and Refunding (Series 2012B) GO Bonds, 5.432%, 1/1/2042 | $3,776,802 |
| 2,000,000 | | Tampa, FL Sports Authority, 8.02% Bonds (GTD by National Public Finance Guarantee Corporation), 10/1/2026 | 2,315,300 |
| | | TOTAL MUNICIPAL BONDS
(IDENTIFIED COST $6,746,000) | 6,092,102 |
| | | FOREIGN GOVERNMENTS/AGENCIES—0.5% | |
| | | Sovereign—0.5% | |
| 975,000 | | Colombia, Government of, Sr. Unsecd. Note, 4.375%, 7/12/2021 | 1,014,000 |
| 2,475,000 | 1,2 | Qatar, Government of, Series 144A, 5.25%, 1/20/2020 | 2,784,375 |
| 3,500,000 | | Sweden, Government of, 10.25%, 11/1/2015 | 3,631,915 |
| | | TOTAL FOREIGN GOVERNMENTS/AGENCIES
(IDENTIFIED COST $7,875,476) | 7,430,290 |
| | | COMMON STOCKS—0.0% | |
| | | Automotive—0.0% | |
| 8,473 | 3 | General Motors Co. | 328,159 |
| 2,127 | 3 | Motors Liquidation Co. | 99,757 |
| | | TOTAL | 427,916 |
| | | Utility - Electric—0.0% | |
| 113 | | NRG Energy, Inc. | 2,990 |
| | | TOTAL COMMON STOCKS
(IDENTIFIED COST $1,239,488) | 430,906 |
| | | WARRANTS—0.0% | |
| | | Automotive—0.0% | |
| 7,703 | 3 | General Motors Co., Warrants, Expiration Date, 7/10/2016 | 223,002 |
| 7,703 | 3 | General Motors Co., Warrants, Expiration Date, 7/10/2019 | 163,149 |
| | | TOTAL WARRANTS
(IDENTIFIED COST $1,367,883) | 386,151 |
| | | PREFERRED STOCKS—0.3% | |
| | | Financial Institution - Brokerage—0.0% | |
| 130,000 | 3,4,5 | Lehman Brothers Holdings, Inc., Pfd., Series D | 1,300 |
| | | Financial Institution - REITs—0.3% | |
| 80,000 | | ProLogis, Inc., Cumulative REIT Perpetual Pfd. Stock, Series Q, $4.27, Annual Dividend | 4,537,600 |
| | | TOTAL PREFERRED STOCKS
(IDENTIFIED COST $3,985,290) | 4,538,900 |
Annual Shareholder Report
Principal
Amount
or Shares | | | Value |
| | | COLLATERALIZED MORTGAGE OBLIGATIONS—0.0% | |
| | | Federal Home Loan Mortgage Corporation—0.0% | |
| $300,000 | | Federal Home Loan Mortgage Corp. REMIC 3051 MY, 5.50%, 10/15/2025 | $331,179 |
| | | Non-Agency Mortgage—0.0% | |
| 6,831 | 1 | SMFC Trust Asset-Backed Certificates, 1997-A, Class B1-4, 2.711%, 1/28/2027 | 6,249 |
| | | TOTAL COLLATERALIZED MORTGAGE OBLIGATIONS
(IDENTIFIED COST $356,931) | 337,428 |
| | | INVESTMENT COMPANIES—30.7%7 | |
| 8,195,212 | 8 | Federated Prime Value Obligations Fund, Institutional Shares, 0.07% | 8,195,212 |
| 68,652,085 | | High Yield Bond Portfolio | 458,595,930 |
| | | TOTAL INVESTMENT COMPANIES
(IDENTIFIED COST $531,604,873) | 466,791,142 |
| | | TOTAL INVESTMENTS—99.1%
(IDENTIFIED COST $1,527,048,904)9 | 1,508,949,520 |
| | | OTHER ASSETS AND LIABILITIES - NET—0.9%10 | 12,961,951 |
| | | TOTAL NET ASSETS—100% | $1,521,911,471 |
| 1 | Denotes a restricted security that either: (a) cannot be offered for public sale without first being registered, or being able to take advantage of an exemption from registration, under the Securities Act of 1933; or (b) is subject to a contractual restriction on public sales. At November 30, 2013, these restricted securities amounted to $206,374,838, which represented 13.6% of total net assets. |
| 2 | Denotes a restricted security that may be resold without restriction to “qualified institutional buyers” as defined in Rule 144A under the Securities Act of 1933 and that the Fund has determined to be liquid under criteria established by the Fund's Board of Directors (the “Directors”). At November 30, 2013, these liquid restricted securities amounted to $198,843,018, which represented 13.1% of total net assets. |
| 3 | Non-income-producing security. |
| 4 | Issuer in default. |
| 5 | Market quotations and price evaluations are not available. Fair value determined in accordance with procedures established by and under the general supervision of the Directors. |
| 6 | JPMorgan Chase & Co. has fully and unconditionally guaranteed Bear Stearns' outstanding registered debt securities. |
| 7 | Affiliated holdings. |
| 8 | 7-day net yield. |
| 9 | The cost of investments for federal tax purposes amounts to $1,531,075,598. |
| 10 | Assets, other than investments in securities, less liabilities. See Statement of Assets and Liabilities. |
Note: The categories of investments are shown as a percentage of total net assets at November 30, 2013.
Various inputs are used in determining the value of the Fund's investments. These inputs are summarized in the three broad levels listed below:
Level 1—quoted prices in active markets for identical securities, including investment companies with daily net asset values, if applicable.
Level 2—other significant observable inputs (including quoted prices for similar securities,
Annual Shareholder Report
interest rates, prepayment speeds, credit risk, etc.). Also includes securities valued at amortized cost.
Level 3—significant unobservable inputs (including the Fund's own assumptions in determining the fair value of investments).
The inputs or methodology used for valuing securities are not an indication of the risk associated with investing in those securities.
The following is a summary of the inputs used, as of November 30, 2013, in valuing the Fund's assets carried at fair value:
| Valuation Inputs |
| | Level 1—
Quoted
Prices and
Investments in
Investment
Companies | Level 2—
Other
Significant
Observable
Inputs | Level 3—
Significant
Unobservable
Inputs | Total |
| Debt Securities: | | | | |
| Corporate Bonds | $— | $1,019,638,517 | $3,222,270 | $1,022,860,787 |
| Mortgage-Backed Securities | — | 81,814 | — | 81,814 |
| Municipal Bonds | — | 6,092,102 | — | 6,092,102 |
| Foreign Governments/Agencies | — | 7,430,290 | — | 7,430,290 |
| Collateralized Mortgage Obligations | — | 337,4281 | — | 337,428 |
| Equity Securities: | | | | |
| Common Stocks | | | | |
| Domestic | 430,906 | — | — | 430,906 |
| Preferred Stocks | | | | |
| Domestic | 4,537,600 | — | 1,300 | 4,538,900 |
| Warrants | 386,151 | — | — | 386,151 |
| Investment Companies2 | 466,791,142 | — | — | 466,791,142 |
| TOTAL SECURITIES | $472,145,799 | $1,033,580,151 | $3,223,570 | $1,508,949,520 |
| 1 | Includes $8,293 of a collateralized mortgage obligation security transferred from Level 3 to Level 2 because observable market data was obtained for this security. This transfer represents the value of the security at the beginning of the period. |
| 2 | High Yield Bond Portfolio is an affiliated holding offered only to registered investment companies and other accredited investors. |
The following acronyms are used throughout this portfolio:
| GO | —General Obligation |
| GTD | —Guaranteed |
| MTN | —Medium Term Note |
| REIT(s) | —Real Estate Investment Trust(s) |
| REMIC | —Real Estate Mortgage Investment Conduit |
See Notes which are an integral part of the Financial Statements
Annual Shareholder Report
Financial Highlights–Class A Shares
(For a Share Outstanding Throughout Each Period)
| Year Ended November 30 | 2013 | 2012 | 2011 | 2010 | 2009 |
| Net Asset Value, Beginning of Period | $9.66 | $9.05 | $9.23 | $8.80 | $7.08 |
| Income From Investment Operations: | | | | | |
| Net investment income | 0.411 | 0.49 | 0.52 | 0.55 | 0.52 |
| Net realized and unrealized gain (loss) on investments, futures contracts and swap contracts | (0.31) | 0.60 | (0.17) | 0.42 | 1.74 |
| TOTAL FROM INVESTMENT OPERATIONS | 0.10 | 1.09 | 0.35 | 0.97 | 2.26 |
| Less Distributions: | | | | | |
| Distributions from net investment income | (0.42) | (0.48) | (0.53) | (0.54) | (0.54) |
| Regulatory Settlement Proceeds | — | — | — | 0.002,3 | — |
| Net Asset Value, End of Period | $9.34 | $9.66 | $9.05 | $9.23 | $8.80 |
| Total Return4 | 1.09% | 12.24% | 3.81% | 11.38%3 | 33.05% |
| Ratios to Average Net Assets: | | | | | |
| Net expenses5 | 0.98% | 0.98% | 0.98% | 0.99% | 0.99% |
| Net investment income | 4.36% | 5.03% | 5.79% | 5.90% | 6.40% |
| Expense waiver/reimbursement6 | 0.22% | 0.23% | 0.23% | 0.21% | 0.23% |
| Supplemental Data: | | | | | |
| Net assets, end of period (000 omitted) | $936,658 | $933,804 | $709,195 | $665,358 | $628,675 |
| Portfolio turnover | 20% | 6% | 13% | 24% | 28% |
| 1 | Per share number has been calculated using the average shares method. |
| 2 | Represents less than $0.01. |
| 3 | During the year ended November 30, 2010, the Fund received a regulatory settlement from an unaffiliated third party, which did not have any impact on the total return. |
| 4 | Based on net asset value, which does not reflect the sales charge, redemption fee or contingent deferred sales charge, if applicable. |
| 5 | Pursuant to a settlement with the New York Attorney General, the Adviser has agreed to waive investment adviser fees in compliance with an Assurance of Discontinuance dated November 17, 2005. The net investment adviser fee was reduced to 0.5557% effective January 1, 2006, and was not permitted to be increased until after December 31, 2010. |
| 6 | This expense decrease is reflected in both the net expense and the net investment income ratios shown above. |
See Notes which are an integral part of the Financial Statements
Annual Shareholder Report
Financial Highlights–Class B Shares
(For a Share Outstanding Throughout Each Period)
| Year Ended November 30 | 2013 | 2012 | 2011 | 2010 | 2009 |
| Net Asset Value, Beginning of Period | $9.71 | $9.10 | $9.28 | $8.83 | $7.11 |
| Income From Investment Operations: | | | | | |
| Net investment income | 0.341 | 0.40 | 0.46 | 0.48 | 0.46 |
| Net realized and unrealized gain (loss) on investments, futures contracts and swap contracts | (0.32) | 0.61 | (0.19) | 0.44 | 1.73 |
| TOTAL FROM INVESTMENT OPERATIONS | 0.02 | 1.01 | 0.27 | 0.92 | 2.19 |
| Less Distributions: | | | | | |
| Distributions from net investment income | (0.34) | (0.40) | (0.45) | (0.47) | (0.47) |
| Regulatory Settlement Proceeds | — | — | — | 0.002,3 | — |
| Net Asset Value, End of Period | $9.39 | $9.71 | $9.10 | $9.28 | $8.83 |
| Total Return4 | 0.26% | 11.27% | 2.95% | 10.68%3 | 31.84% |
| Ratios to Average Net Assets: | | | | | |
| Net expenses5 | 1.79% | 1.79% | 1.79% | 1.79% | 1.79% |
| Net investment income | 3.54% | 4.22% | 5.02% | 5.09% | 5.63% |
| Expense waiver/reimbursement6 | 0.18% | 0.20% | 0.20% | 0.20% | 0.22% |
| Supplemental Data: | | | | | |
| Net assets, end of period (000 omitted) | $55,068 | $89,016 | $84,448 | $122,759 | $155,907 |
| Portfolio turnover | 20% | 6% | 13% | 24% | 28% |
| 1 | Per share number has been calculated using the average shares method. |
| 2 | Represents less than $0.01. |
| 3 | During the year ended November 30, 2010, the Fund received a regulatory settlement from an unaffiliated third party, which had an impact of 0.12% on the total return. |
| 4 | Based on net asset value, which does not reflect the sales charge, redemption fee or contingent deferred sales charge, if applicable. |
| 5 | Pursuant to a settlement with the New York Attorney General, the Adviser has agreed to waive investment adviser fees in compliance with an Assurance of Discontinuance dated November 17, 2005. The net investment adviser fee was reduced to 0.5557% effective January 1, 2006, and was not permitted to be increased until after December 31, 2010. |
| 6 | This expense decrease is reflected in both the net expense and the net investment income ratios shown above. |
See Notes which are an integral part of the Financial Statements
Annual Shareholder Report
Financial Highlights–Class C Shares
(For a Share Outstanding Throughout Each Period)
| Year Ended November 30 | 2013 | 2012 | 2011 | 2010 | 2009 |
| Net Asset Value, Beginning of Period | $9.71 | $9.10 | $9.28 | $8.84 | $7.11 |
| Income From Investment Operations: | | | | | |
| Net investment income | 0.341 | 0.40 | 0.45 | 0.47 | 0.45 |
| Net realized and unrealized gain (loss) on investments, futures contracts and swap contracts | (0.32) | 0.61 | (0.18) | 0.44 | 1.75 |
| TOTAL FROM INVESTMENT OPERATIONS | 0.02 | 1.01 | 0.27 | 0.91 | 2.20 |
| Less Distributions: | | | | | |
| Distributions from net investment income | (0.34) | (0.40) | (0.45) | (0.47) | (0.47) |
| Regulatory Settlement Proceeds | — | — | — | 0.002,3 | — |
| Net Asset Value, End of Period | $9.39 | $9.71 | $9.10 | $9.28 | $8.84 |
| Total Return4 | 0.27% | 11.27% | 2.96% | 10.56%3 | 32.01% |
| Ratios to Average Net Assets: | | | | | |
| Net expenses5 | 1.79% | 1.79% | 1.79% | 1.79% | 1.79% |
| Net investment income | 3.54% | 4.22% | 4.99% | 5.10% | 5.58% |
| Expense waiver/reimbursement6 | 0.18% | 0.20% | 0.20% | 0.20% | 0.22% |
| Supplemental Data: | | | | | |
| Net assets, end of period (000 omitted) | $137,178 | $185,529 | $148,392 | $153,345 | $146,220 |
| Portfolio turnover | 20% | 6% | 13% | 24% | 28% |
| 1 | Per share number has been calculated using the average shares method. |
| 2 | Represents less than $0.01. |
| 3 | During the year ended November 30, 2010, the Fund received a regulatory settlement from an unaffiliated third party, which did not have any impact on the total return. |
| 4 | Based on net asset value, which does not reflect the sales charge, redemption fee or contingent deferred sales charge, if applicable. |
| 5 | Pursuant to a settlement with the New York Attorney General, the Adviser has agreed to waive investment adviser fees in compliance with an Assurance of Discontinuance dated November 17, 2005. The net investment adviser fee was reduced to 0.5557% effective January 1, 2006, and was not permitted to be increased until after December 31, 2010. |
| 6 | This expense decrease is reflected in both the net expense and the net investment income ratios shown above. |
See Notes which are an integral part of the Financial Statements
Annual Shareholder Report
Financial Highlights–Class F Shares
(For a Share Outstanding Throughout Each Period)
| Year Ended November 30 | 2013 | 2012 | 2011 | 2010 | 2009 |
| Net Asset Value, Beginning of Period | $9.72 | $9.11 | $9.29 | $8.85 | $7.12 |
| Income From Investment Operations: | | | | | |
| Net investment income | 0.411 | 0.47 | 0.52 | 0.54 | 0.51 |
| Net realized and unrealized gain (loss) on investments, futures contracts and swap contracts | (0.30) | 0.61 | (0.18) | 0.44 | 1.75 |
| TOTAL FROM INVESTMENT OPERATIONS | 0.11 | 1.08 | 0.34 | 0.98 | 2.26 |
| Less Distributions: | | | | | |
| Distributions from net investment income | (0.42) | (0.47) | (0.52) | (0.54) | (0.53) |
| Regulatory Settlement Proceeds | — | — | — | 0.002,3 | — |
| Net Asset Value, End of Period | $9.41 | $9.72 | $9.11 | $9.29 | $8.85 |
| Total Return4 | 1.15% | 12.11% | 3.75% | 11.40%3 | 32.96% |
| Ratios to Average Net Assets: | | | | | |
| Net expenses5 | 1.02% | 1.02% | 1.02% | 1.02% | 1.02% |
| Net investment income | 4.32% | 4.99% | 5.75% | 5.87% | 6.37% |
| Expense waiver/reimbursement6 | 0.20% | 0.21% | 0.22% | 0.22% | 0.24% |
| Supplemental Data: | | | | | |
| Net assets, end of period (000 omitted) | $201,547 | $226,542 | $192,734 | $190,504 | $178,466 |
| Portfolio turnover | 20% | 6% | 13% | 24% | 28% |
| 1 | Per share number has been calculated using the average shares method. |
| 2 | Represents less than $0.01. |
| 3 | During the year ended November 30, 2010, the Fund received a regulatory settlement from an unaffiliated third party, which did not have any impact on the total return. |
| 4 | Based on net asset value, which does not reflect the sales charge, redemption fee or contingent deferred sales charge, if applicable. |
| 5 | Pursuant to a settlement with the New York Attorney General, the Adviser has agreed to waive investment adviser fees in compliance with an Assurance of Discontinuance dated November 17, 2005. The net investment adviser fee was reduced to 0.5557% effective January 1, 2006, and was not permitted to be increased until after December 31, 2010. |
| 6 | This expense decrease is reflected in both the net expense and the net investment income ratios shown above. |
See Notes which are an integral part of the Financial Statements
Annual Shareholder Report
Financial Highlights–Institutional Shares
(For a Share Outstanding Throughout Each Period)
| Year Ended November 30 | 2013 | 2012 | 2011 | 2010 | 2009 |
| Net Asset Value, Beginning of Period | $9.66 | $9.05 | $9.23 | $8.80 | $7.08 |
| Income From Investment Operations: | | | | | |
| Net investment income | 0.431 | 0.49 | 0.55 | 0.57 | 0.54 |
| Net realized and unrealized gain (loss) on investments, futures contracts and swap contracts | (0.30) | 0.61 | (0.19) | 0.42 | 1.73 |
| TOTAL FROM INVESTMENT OPERATIONS | 0.13 | 1.10 | 0.36 | 0.99 | 2.27 |
| Less Distributions: | | | | | |
| Distributions from net investment income | (0.44) | (0.49) | (0.54) | (0.56) | (0.55) |
| Regulatory Settlement Proceeds | — | — | — | 0.002,3 | — |
| Net Asset Value, End of Period | $9.35 | $9.66 | $9.05 | $9.23 | $8.80 |
| Total Return4 | 1.40% | 12.44% | 4.01% | 11.59%3 | 33.29% |
| Ratios to Average Net Assets: | | | | | |
| Net expenses5 | 0.79% | 0.79% | 0.79% | 0.79% | 0.79% |
| Net investment income | 4.55% | 5.20% | 5.92% | 6.11% | 6.22% |
| Expense waiver/reimbursement6 | 0.18% | 0.20% | 0.20% | 0.20% | 0.20% |
| Supplemental Data: | | | | | |
| Net assets, end of period (000 omitted) | $191,461 | $242,413 | $145,292 | $55,617 | $7,948 |
| Portfolio turnover | 20% | 6% | 13% | 24% | 28% |
| 1 | Per share number has been calculated using the average shares method. |
| 2 | Represents less than $0.01. |
| 3 | During the year ended November 30, 2010, the Fund received a regulatory settlement from an unaffiliated third party, which did not have any impact on the total return. |
| 4 | Based on net asset value. |
| 5 | Pursuant to a settlement with the New York Attorney General, the Adviser has agreed to waive investment adviser fees in compliance with an Assurance of Discontinuance dated November 17, 2005. The net investment adviser fee was reduced to 0.5557% effective January 1, 2006, and was not permitted to be increased until after December 31, 2010. |
| 6 | This expense decrease is reflected in both the net expense and the net investment income ratios shown above. |
See Notes which are an integral part of the Financial Statements
Annual Shareholder Report
Statement of Assets and Liabilities
November 30, 2013
| Assets: | | |
| Total investment in securities, at value including $466,791,142 of investment in affiliated holdings (Note 5) (identified cost $1,527,048,904) | | $1,508,949,520 |
| Income receivable | | 14,150,506 |
| Income receivable from affiliated holdings | | 2,772,614 |
| Receivable for shares sold | | 2,902,361 |
| TOTAL ASSETS | | 1,528,775,001 |
| Liabilities: | | |
| Payable for investments purchased | $2,492,250 | |
| Payable for shares redeemed | 3,180,021 | |
| Income distribution payable | 410,239 | |
| Payable to adviser (Note 5) | 910 | |
| Payable for transfer agent fee | 230,016 | |
| Payable for Directors'/Trustees' fees (Note 5) | 1,216 | |
| Payable for distribution services fee (Note 5) | 119,977 | |
| Payable for shareholder services fee (Note 5) | 263,380 | |
| Accrued expenses (Note 5) | 165,521 | |
| TOTAL LIABILITIES | | 6,863,530 |
| Net assets for 162,627,604 shares outstanding | | $1,521,911,471 |
| Net Assets Consist of: | | |
| Paid-in capital | | $1,550,879,650 |
| Net unrealized depreciation of investments | | (18,099,384) |
| Accumulated net realized loss on investments, futures contracts and swap contracts | | (10,925,869) |
| Undistributed net investment income | | 57,074 |
| TOTAL NET ASSETS | | $1,521,911,471 |
Annual Shareholder Report
Statement of Assets and Liabilities–continued
| Net Asset Value, Offering Price and Redemption Proceeds Per Share | | |
| Class A Shares: | | |
| Net asset value per share ($936,657,884 ÷ 100,256,376 shares outstanding), no par value, 500,000,000 shares authorized | | $9.34 |
| Offering price per share (100/95.50 of $9.34) | | $9.78 |
| Redemption proceeds per share | | $9.34 |
| Class B Shares: | | |
| Net asset value per share ($55,068,254 ÷ 5,862,770 shares outstanding), no par value, 500,000,000 shares authorized | | $9.39 |
| Offering price per share | | $9.39 |
| Redemption proceeds per share (94.50/100 of $9.39) | | $8.87 |
| Class C Shares: | | |
| Net asset value per share ($137,177,511 ÷ 14,601,638 shares outstanding), no par value, 500,000,000 shares authorized | | $9.39 |
| Offering price per share | | $9.39 |
| Redemption proceeds per share (99.00/100 of $9.39) | | $9.30 |
| Class F Shares: | | |
| Net asset value per share ($201,546,610 ÷ 21,419,414 shares outstanding), no par value, 500,000,000 shares authorized | | $9.41 |
| Offering price per share (100/99.00 of $9.41) | | $9.51 |
| Redemption proceeds per share (99.00/100 of $9.41) | | $9.32 |
| Institutional Shares: | | |
| Net asset value per share ($191,461,212 ÷ 20,487,406 shares outstanding), no par value, 500,000,000 shares authorized | | $9.35 |
| Offering price per share | | $9.35 |
| Redemption proceeds per share | | $9.35 |
See Notes which are an integral part of the Financial Statements
Annual Shareholder Report
Statement of Operations
Year Ended November 30, 2013
| Investment Income: | | | |
| Interest | | | $52,542,461 |
| Dividends (including $35,193,374 received from affiliated holdings (Note 5) | | | 35,327,026 |
| TOTAL INCOME | | | 87,869,487 |
| Expenses: | | | |
| Investment adviser fee (Note 5) | | $11,986,066 | |
| Administrative fee (Note 5) | | 1,282,734 | |
| Custodian fees | | 61,851 | |
| Transfer agent fee | | 1,825,913 | |
| Directors'/Trustees' fees (Note 5) | | 14,660 | |
| Auditing fees | | 27,900 | |
| Legal fees | | 7,427 | |
| Portfolio accounting fees | | 246,759 | |
| Distribution services fee (Note 5) | | 1,763,516 | |
| Shareholder services fee (Note 5) | | 3,385,353 | |
| Account administration fee (Note 2) | | 20,350 | |
| Share registration costs | | 141,144 | |
| Printing and postage | | 223,769 | |
| Insurance premiums (Note 5) | | 7,531 | |
| Taxes | | 127,293 | |
| Miscellaneous (Note 5) | | 16,976 | |
| TOTAL EXPENSES | | 21,139,242 | |
| Waiver and Reimbursements (Note 5): | | | |
| Waiver/reimbursement of investment adviser fee | $(2,904,321) | | |
| Reimbursement of shareholder services fee | (474,648) | | |
| TOTAL WAIVER AND REIMBURSEMENTS | | (3,378,969) | |
| Net expenses | | | 17,760,273 |
| Net investment income | | | 70,109,214 |
| Realized and Unrealized Gain (Loss) on Investments and Swap Contracts: | | | |
| Net realized gain on investments | | | 6,464,943 |
| Net realized loss on swap contracts | | | (2,818,016) |
| Realized gain distribution from affiliated investment company shares (Note 5) | | | 2,991,307 |
| Net change in unrealized appreciation of investments | | | (62,366,264) |
| Net realized and unrealized loss on investments and swap contracts | | | (55,728,030) |
| Change in net assets resulting from operations | | | $14,381,184 |
See Notes which are an integral part of the Financial Statements
Annual Shareholder Report
Statement of Changes in Net Assets
| Year Ended November 30 | 2013 | 2012 |
| Increase (Decrease) in Net Assets | | |
| Operations: | | |
| Net investment income | $70,109,214 | $72,672,532 |
| Net realized gain (loss) on investments, futures contracts and swap contracts | 6,638,234 | (7,539,804) |
| Net change in unrealized appreciation/depreciation of investments and futures contracts | (62,366,264) | 99,706,496 |
| CHANGE IN NET ASSETS RESULTING FROM OPERATIONS | 14,381,184 | 164,839,224 |
| Distributions to Shareholders: | | |
| Distributions from net investment income | | |
| Class A Shares | (43,064,860) | (41,216,000) |
| Class B Shares | (2,489,288) | (3,526,016) |
| Class C Shares | (5,976,698) | (6,971,839) |
| Class F Shares | (9,542,430) | (10,348,791) |
| Institutional Shares | (10,159,687) | (10,061,697) |
| CHANGE IN NET ASSETS RESULTING FROM DISTRIBUTIONS TO SHAREHOLDERS | (71,232,963) | (72,124,343) |
| Share Transactions: | | |
| Proceeds from sale of shares | 473,593,672 | 637,709,714 |
| Net asset value of shares issued to shareholders in payment of distributions declared | 65,559,716 | 64,900,643 |
| Cost of shares redeemed | (637,694,837) | (398,083,286) |
| CHANGE IN NET ASSETS RESULTING FROM SHARE TRANSACTIONS | (98,541,449) | 304,527,071 |
| Change in net assets | (155,393,228) | 397,241,952 |
| Net Assets: | | |
| Beginning of period | 1,677,304,699 | 1,280,062,747 |
| End of period (including undistributed net investment income of $57,074 and $269,093, respectively) | $1,521,911,471 | $1,677,304,699 |
See Notes which are an integral part of the Financial Statements
Annual Shareholder Report
Notes to Financial Statements
November 30, 2013
1. ORGANIZATION
Federated Investment Series Funds, Inc. (the “Corporation”) is registered under the Investment Company Act of 1940, as amended (the “Act”), as an open-end management investment company. The Corporation consists of one diversified portfolio, Federated Bond Fund (the “Fund”). The Fund offers five classes of shares: Class A Shares, Class B Shares, Class C Shares, Class F Shares and Institutional Shares. All shares of the Fund have equal rights with respect to voting, except on class-specific matters. The investment objective of the Fund is to provide a high level of current income as is consistent with the preservation of capital.
2. SIGNIFICANT ACCOUNTING POLICIES
The following is a summary of significant accounting policies consistently followed by the Fund in the preparation of its financial statements. These policies are in conformity with U.S. generally accepted accounting principles (GAAP).
Investment Valuation
In calculating its net asset value (NAV), the Fund generally values investments as follows:
| ■ | Fixed-income securities acquired with remaining maturities greater than 60 days are fair valued using price evaluations provided by a pricing service approved by the Directors. |
| ■ | Fixed-income securities and repurchase agreements acquired with remaining maturities of 60 days or less are valued at their amortized cost (adjusted for the accretion of any discount or amortization of any premium), unless the issuer's creditworthiness is impaired or other factors indicate that amortized cost is not an accurate estimate of the investment's fair value, in which case it would be valued in the same manner as a longer-term security. |
| ■ | Shares of other mutual funds or non-exchange-traded investment companies are valued based upon their reported NAVs. |
| ■ | Equity securities listed on an exchange or traded through a regulated market system are valued at their last reported sale price or official closing price in their principal exchange or market. |
| ■ | Derivative contracts listed on exchanges are valued at their reported settlement or closing price. |
| ■ | Over-the-counter (OTC) derivative contracts are fair valued using price evaluations provided by a pricing service approved by the Directors. |
| ■ | For securities that are fair valued in accordance with procedures established by and under the general supervision of the Directors, certain factors may be considered such as: the purchase price of the security, information obtained by contacting the issuer, analysis of the issuer's financial statements or other available documents, fundamental analytical data, the nature and duration of restrictions on disposition, the movement of the market in which the security is normally traded and public trading in similar securities of the issuer or comparable issuers. |
Annual Shareholder Report
If the Fund cannot obtain a price or price evaluation from a pricing service for an investment, the Fund may attempt to value the investment based upon the mean of bid and asked quotations or fair value the investment based on price evaluations, from one or more dealers. If any price, quotation, price evaluation or other pricing source is not readily available when the NAV is calculated, or if the Fund cannot obtain price evaluations from a pricing service or from more than one dealer for an investment within a reasonable period of time as set forth in the Fund's valuation policies and procedures, the Fund uses the fair value of the investment determined in accordance with the procedures described below. There can be no assurance that the Fund could purchase or sell an investment at the price used to calculate the Fund's NAV.
Fair Valuation and Significant Events Procedures
The Directors have appointed a Valuation Committee comprised of officers of the Fund, Federated Investment Management Company (“Adviser”) and certain of the Adviser's affiliated companies to determine fair value of securities and in overseeing the calculation of the NAV. The Directors have also authorized the use of pricing services recommended by the Valuation Committee to provide fair value evaluations of the current value of certain investments for purposes of calculating the NAV. The Valuation Committee employs various methods for reviewing third-party pricing-service evaluations including periodic reviews of third-party pricing services' policies, procedures and valuation methods (including key inputs and assumptions), transactional back-testing, comparisons of evaluations of different pricing services, and review of price challenges by the Adviser based on recent market activity. In the event that market quotations and price evaluations are not available for an investment, the Valuation Committee determines the fair value of the investment in accordance with procedures adopted by the Directors. The Directors periodically review and approve the fair valuations made by the Valuation Committee and any changes made to the procedures.
Factors considered by pricing services in evaluating an investment include the yields or prices of investments of comparable quality, coupon, maturity, call rights and other potential prepayments, terms and type, reported transactions, indications as to values from dealers and general market conditions. Some pricing services provide a single price evaluation reflecting the bid-side of the market for an investment (a “bid” evaluation). Other pricing services offer both bid evaluations and price evaluations indicative of a price between the prices bid and asked for the investment (a “mid” evaluation). The Fund normally uses bid evaluations for U.S. Treasury and Agency securities, mortgage-backed securities and municipal securities. The Fund normally uses mid evaluations for other types of fixed-income securities and OTC derivative contracts. In the event that market quotations and price evaluations are not available for an investment, the fair value of the investment is determined in accordance with procedures adopted by the Directors.
Annual Shareholder Report
The Directors also have adopted procedures requiring an investment to be priced at its fair value whenever the Adviser determines that a significant event affecting the value of the investment has occurred between the time as of which the price of the investment would otherwise be determined and the time as of which the NAV is computed. An event is considered significant if there is both an affirmative expectation that the investment's value will change in response to the event and a reasonable basis for quantifying the resulting change in value. Examples of significant events that may occur after the close of the principal market on which a security is traded, or after the time of a price evaluation provided by a pricing service or a dealer, include:
| ■ | With respect to securities traded in foreign markets, significant trends in U.S. equity markets or in the trading of foreign securities index futures contracts; |
| ■ | Political or other developments affecting the economy or markets in which an issuer conducts its operations or its securities are traded; and |
| ■ | Announcements concerning matters such as acquisitions, recapitalizations, litigation developments, a natural disaster affecting the issuer's operations or regulatory changes or market developments affecting the issuer's industry. |
The Directors have approved the use of a pricing service to determine the fair value of equity securities traded principally in foreign markets when the Adviser determines that there has been a significant trend in the U.S. equity markets or in index futures trading. For other significant events, the Fund may seek to obtain more current quotations or price evaluations from alternative pricing sources. If a reliable alternative pricing source is not available, the Fund will determine the fair value of the investment using another method approved by the Directors.
Repurchase Agreements
The Fund may invest in repurchase agreements for short-term liquidity purposes. It is the policy of the Fund to require the other party to a repurchase agreement to transfer to the Fund's custodian or sub-custodian eligible securities or cash with a market value (after transaction costs) at least equal to the repurchase price to be paid under the repurchase agreement. The eligible securities are transferred to accounts with the custodian or sub-custodian in which the Fund holds a “securities entitlement” and exercises “control” as those terms are defined in the Uniform Commercial Code. The Fund has established procedures for monitoring the market value of the transferred securities and requiring the transfer of additional eligible securities if necessary to equal at least the repurchase price. These procedures also allow the other party to require securities to be transferred from the account to the extent that their market value exceeds the repurchase price or in exchange for other eligible securities of equivalent market value.
The insolvency of the other party or other failure to repurchase the securities may delay the disposition of the underlying securities or cause the Fund to receive less than the full repurchase price. Under the terms of the repurchase agreement, any amounts received by the Fund in excess of the repurchase price and related transaction costs must be remitted to the other party.
The Fund may enter into repurchase agreements in which eligible securities are transferred into joint trading accounts maintained by the custodian or sub-custodian for investment companies and other clients advised by the Fund's Adviser and its affiliates. The Fund will participate on a pro rata basis with the other investment companies and clients in its share of the securities transferred under such repurchase agreements and in its share of proceeds from any repurchase or other disposition of such securities.
Annual Shareholder Report
Investment Income, Gains and Losses, Expenses and Distributions
Investment transactions are accounted for on a trade-date basis. Realized gains and losses from investment transactions are recorded on an identified-cost basis. Interest income and expenses are accrued daily. Dividend income and distributions to shareholders are recorded on the ex-dividend date. Foreign dividends are recorded on the ex-dividend date or when the Fund is informed of the ex-dividend date. Distributions of net investment income are declared and paid monthly. Non-cash dividends included in dividend income, if any, are recorded at fair value. Investment income, realized and unrealized gains and losses, and certain fund-level expenses are allocated to each class based on relative average daily net assets, except that Class A Shares, Class B Shares, Class C Shares, Class F Shares and Institutional Shares may bear distribution services fees, shareholder services fees and account administration fees unique to those classes. For the year ended November 30, 2013, account administration fees for the Fund were as follows:
| | Account
Administration
Fees Incurred |
| Class A Shares | $1,433 |
| Class C Shares | 1,094 |
| Class F Shares | 17,823 |
| TOTAL | $20,350 |
Dividends are declared separately for each class. No class has preferential dividend rights; differences in per share dividend rates are generally due to differences in separate class expenses.
Premium and Discount Amortization/Paydown Gains and Losses
All premiums and discounts on fixed-income securities are amortized/accreted using the effective-interest-rate method. Gains and losses realized on principal payment of mortgage-backed securities (paydown gains and losses) are classified as part of investment income.
Federal Taxes
It is the Fund's policy to comply with the Subchapter M provision of the Internal Revenue Code (the “Code”) and to distribute to shareholders each year substantially all of its income. Accordingly, no provision for federal income tax is necessary. As of and during the year ended November 30, 2013, the Fund did not have a liability for any uncertain tax positions. The Fund recognizes interest and penalties, if any, related to tax liabilities as income tax expense in the Statement of Operations. As of November 30, 2013, tax years 2010 through 2013 remain subject to examination by the Fund's major tax jurisdictions, which include the United States of America and the state of Maryland and the Commonwealth of Pennsylvania.
Other Taxes
As an open-end management investment company incorporated in the state of Maryland but domiciled in the Commonwealth of Pennsylvania, the Fund is subject to the Pennsylvania Franchise Tax. This franchise tax is assessed annually on the value of the Fund, as represented by average net assets for the tax year.
Annual Shareholder Report
When-Issued and Delayed-Delivery Transactions
The Fund may engage in when-issued or delayed-delivery transactions. The Fund records when-issued securities on the trade date and maintains security positions such that sufficient liquid assets will be available to make payment for the securities purchased. Securities purchased on a when-issued or delayed-delivery basis are marked to market daily and begin earning interest on the settlement date. Losses may occur on these transactions due to changes in market conditions or the failure of counterparties to perform under the contract.
Swap Contracts
Swap contracts involve two parties that agree to exchange the returns (or the differential in rates of return) earned or realized on particular predetermined investments, instruments, indices or other measures. The gross returns to be exchanged or “swapped” between parties are generally calculated with respect to a “notional amount” for a predetermined period of time. The Fund enters into interest rate, total return, credit default, currency and other swap agreements. Risks may arise upon entering into swap agreements from the potential inability of the counterparties to meet the terms of their contract from unanticipated changes in the value of the swap agreement.
The Fund uses credit default swaps to manage exposure to a given issuer or sector by either selling protection to increase exposure, or buying protection to reduce exposure. The “buyer” in a credit default swap is obligated to pay the “seller” a periodic stream of payments over the term of the contract provided that no event of default on an underlying reference obligation has occurred. If an event of default occurs, the seller must pay the buyer the full notional value, or the “par value”, of the reference obligation in exchange for the reference obligation. In connection with these agreements, securities may be identified as collateral in accordance with the terms of the respective swap agreements to provide assets of value and recourse in the event of default or bankruptcy/insolvency. Recovery values are assumed by market makers considering either industry standard recovery rates or entity specific factors and considerations until a credit event occurs. If a credit event has occurred, the recovery value is typically determined by a facilitated auction whereby a minimum number of allowable broker bids, together with a specific valuation method, are used to calculate the settlement value.
Upfront payments received or paid by the Fund will be reflected as an asset or liability on the Statement of Assets and Liabilities. Changes in the value of swap contracts are included in Swaps, at value on the Statement of Assets and Liabilities, and periodic payments are reported as Net realized gain/(loss) on swap contracts in the Statement of Operations.
At November 30, 2013, the Fund had no outstanding swap contracts.
The average notional amount of credit default swaps held by the Fund throughout the period was $11,538,462. This is based on amounts held as of each month-end throughout the fiscal period.
Futures Contracts
The Fund purchases and sells financial futures contracts to manage cash flows, enhance yield and to potentially reduce transaction costs. Upon entering into a financial futures contract with a broker, the Fund is required to deposit in a segregated account a specified amount of cash or U.S. government securities. Futures contracts are valued daily and unrealized gains or losses are recorded in a “variation margin” account. Daily, the Fund receives from or pays to the broker a specified amount of cash based upon changes in the variation margin account. When a contract is closed, the Fund recognizes a realized gain or loss. Futures contracts have
Annual Shareholder Report
market risks, including the risk that the change in the value of the contract may not correlate with the changes in the value of the underlying securities. There is minimal counterparty risk to the Fund since futures are exchange traded and the exchange's clearinghouse, as counterparty to all exchange traded futures, guarantees the futures against default.
At November 30, 2013, the Fund had no outstanding futures contracts.
Securities Lending
The Fund participates in a securities lending program providing for the lending of equity securities to qualified brokers. The Fund normally receives cash collateral for securities loaned that is invested in an affiliated money market fund or in short-term securities including repurchase agreements. Collateral is maintained at a minimum level of 100% of the market value of investments loaned, plus interest, if applicable. Earnings on collateral are allocated between the borrower of the security, the securities lending agent, as a fee for its services under the program and the Fund, according to agreed-upon rates.
As of November 30, 2013, the Fund had no outstanding securities on loan.
Restricted Securities
The Fund may purchase securities which are considered restricted. Restricted securities are securities that either: (a) cannot be offered for public sale without first being registered, or being able to take advantage of an exemption from registration, under the Securities Act of 1933; or (b) are subject to contractual restrictions on public sales. In some cases, when a security cannot be offered for public sale without first being registered, the issuer of the restricted security has agreed to register such securities for resale, at the issuer's expense, either upon demand by the Fund or in connection with another registered offering of the securities. Many such restricted securities may be resold in the secondary market in transactions exempt from registration. Restricted securities may be determined to be liquid under criteria established by the Directors. The Fund will not incur any registration costs upon such resales. The Fund's restricted securities, like other securities, are priced in accordance with procedures established by and under the general supervision of the Directors.
Additional information on restricted securities, excluding securities purchased under Rule 144A that have been deemed liquid by the Directors, if applicable, held at November 30, 2013, is as follows:
| Security | Acquisition Date | Cost | Market Value |
| Football Trust V, Pass Thru Cert., Series 144A, 5.35%, 10/5/2020 | 3/24/2010 | $2,800,000 | $3,095,366 |
| SMFC Trust Asset-Backed Certificates, 1997-A, Class B1-4, 2.711%, 1/28/2027 | 2/4/1998 | $62,682 | $6,249 |
| Union Central Life Insurance Co., Note, Series 144A, 8.20%, 11/1/2026 | 10/31/1996 – 9/29/1999 | $4,048,581 | $4,430,205 |
Annual Shareholder Report
Additional Disclosure Related to Derivative Instruments
The Effect of Derivative Instruments on the Statement of Operations for the Year Ended November 30, 2013
| Amount of Realized Gain or (Loss) on Derivatives Recognized in Income |
| | Credit
Default
Swaps |
| Credit contracts | $(2,818,016) |
Other
The preparation of financial statements in conformity with GAAP requires management to make estimates and assumptions that affect the amounts of assets, liabilities, expenses and revenues reported in the financial statements. Actual results could differ from those estimated.
3. CAPITAL STOCK
The following tables summarize capital stock activity:
| Year Ended November 30 | 2013 | 2012 |
| Class A Shares: | Shares | Amount | Shares | Amount |
| Shares sold | 35,012,650 | $333,146,439 | 39,426,528 | $372,534,713 |
| Shares issued to shareholders in payment of distributions declared | 4,353,869 | 41,175,425 | 4,130,589 | 38,850,174 |
| Shares redeemed | (35,791,548) | (338,000,760) | (25,217,246) | (238,184,624) |
| NET CHANGE RESULTING FROM CLASS A SHARE TRANSACTIONS | 3,574,971 | $36,321,104 | 18,339,871 | $173,200,263 |
| Year Ended November 30 | 2013 | 2012 |
| Class B Shares: | Shares | Amount | Shares | Amount |
| Shares sold | 645,208 | $6,198,079 | 2,863,327 | $27,212,329 |
| Shares issued to shareholders in payment of distributions declared | 238,393 | 2,271,027 | 332,050 | 3,135,812 |
| Shares redeemed | (4,190,379) | (40,018,173) | (3,309,415) | (31,282,651) |
| NET CHANGE RESULTING FROM CLASS B SHARE TRANSACTIONS | (3,306,778) | $(31,549,067) | (114,038) | $(934,510) |
| Year Ended November 30 | 2013 | 2012 |
| Class C Shares: | Shares | Amount | Shares | Amount |
| Shares sold | 2,684,205 | $25,717,791 | 5,486,649 | $52,063,189 |
| Shares issued to shareholders in payment of distributions declared | 523,769 | 4,986,942 | 588,035 | 5,558,927 |
| Shares redeemed | (7,713,755) | (73,213,937) | (3,276,998) | (31,074,801) |
| NET CHANGE RESULTING FROM CLASS C SHARE TRANSACTIONS | (4,505,781) | $(42,509,204) | 2,797,686 | $26,547,315 |
Annual Shareholder Report
| Year Ended November 30 | 2013 | 2012 |
| Class F Shares: | Shares | Amount | Shares | Amount |
| Shares sold | 3,316,366 | $31,806,587 | 5,691,090 | $54,129,200 |
| Shares issued to shareholders in payment of distributions declared | 921,821 | 8,784,507 | 993,693 | 9,406,061 |
| Shares redeemed | (6,113,808) | (58,075,727) | (4,542,619) | (43,091,712) |
| NET CHANGE RESULTING FROM CLASS F SHARE TRANSACTIONS | (1,875,621) | $(17,484,633) | 2,142,164 | $20,443,549 |
| Year ended November 30 | 2013 | 2012 |
| Institutional Shares: | Shares | Amount | Shares | Amount |
| Shares sold | 8,034,518 | $76,724,776 | 14,000,648 | $131,770,283 |
| Shares issued to shareholders in payment of distributions declared | 880,269 | 8,341,815 | 842,292 | 7,949,669 |
| Shares redeemed | (13,517,671) | (128,386,240) | (5,798,325) | (54,449,498) |
| NET CHANGE RESULTING FROM INSTITUTIONAL SHARE TRANSACTIONS | (4,602,884) | $(43,319,649) | 9,044,615 | $85,270,454 |
| NET CHANGE RESULTING FROM TOTAL FUND SHARE TRANSACTIONS | (10,716,093) | $(98,541,449) | 32,210,298 | $304,527,071 |
4. FEDERAL TAX INFORMATION
The timing and character of income and capital gain distributions are determined in accordance with income tax regulations, which may differ from GAAP. These differences are due to differing treatments for swap income reclassifications, defaulted securities and discount accretion/premium amortization on debt securities.
For the year ended November 30, 2013, permanent differences identified and reclassified among the components of net assets were as follows:
| Increase (Decrease) |
Undistributed
Net Investment
Income (Loss) | Accumulated
Net Realized
Gain (Loss) |
| $911,730 | $(911,730) |
Net investment income (loss), net realized gains (losses), and net assets were not affected by this reclassification.
The tax character of distributions as reported on the Statement of Changes in Net Assets for the years ended November 30, 2013 and 2012, was as follows:
| | 2013 | 2012 |
| Ordinary income | $71,232,963 | $72,124,343 |
Annual Shareholder Report
As of November 30, 2013, the components of distributable earnings on a tax basis were as follows:
| Undistributed ordinary income | $57,074 |
| Net unrealized depreciation | $(22,126,078) |
| Capital loss carryforwards | $(6,899,175) |
The difference between book-basis and tax-basis net unrealized appreciation/depreciation is attributable in part to differing treatments for the deferral of losses on wash sales, defaulted bond interest and discount accretion/premium amortization on debt securities.
At November 30, 2013, the cost of investments for federal tax purposes was $1,531,075,598. The net unrealized depreciation of investments for federal tax purposes $22,126,078. This consists of net unrealized appreciation from investments for those securities having an excess of value over cost of $63,050,340 and net unrealized depreciation from investments for those securities having an excess of cost over value of $85,176,418.
At November 30, 2013, the Fund had a capital loss carryforward of $6,899,175 which will reduce the Fund's taxable income arising from future net realized gains on investments, if any, to the extent permitted by the Code, thereby reducing the amount of distributions to shareholders which would otherwise be necessary to relieve the Fund of any liability for federal income tax. Pursuant to the Code, a net capital loss incurred in taxable years beginning on or before December 22, 2010, is characterized as short-term and may be carried forward for a maximum of eight tax years (“Carryforward Limit”), whereas a net capital loss incurred in taxable years beginning after December 22, 2010, retains its character as either short-term or long-term, does not expire and is required to be utilized prior to the losses which have a Carryforward Limit.
The following schedule summarizes the Fund's capital loss carryforwards and expiration years:
| Expiration Year | Short-Term | Long-Term | Total |
| No Expiration | $1,003,140 | NA | $1,003,140 |
| 2014 | $1,796,342 | NA | $1,796,342 |
| 2016 | $14,339 | NA | $14,339 |
| 2017 | $4,085,354 | NA | $4,085,354 |
The Fund used capital loss carryforwards of $5,676,941 to offset capital gains realized during the year ended November 30, 2013.
5. INVESTMENT ADVISER FEE AND OTHER TRANSACTIONS WITH AFFILIATES
Investment Adviser Fee
The advisory agreement between the Fund and the Adviser provides for an annual fee equal to 0.70% of the Fund's average daily net assets. Prior to June 24, 2013, the annual advisory fee was 0.75% of the Fund's average daily net assets. Subject to the terms described in the Expense Limitation note, the Adviser may voluntarily choose to waive any portion of its fee. For the year ended November 30, 2013, the Adviser voluntarily waived $2,886,356 of its fee.
Annual Shareholder Report
Administrative Fee
Federated Administrative Services (FAS), under the Administrative Services Agreement, provides the Fund with administrative personnel and services. For purposes of determining the appropriate rate breakpoint, “Investment Complex” is defined as all of the Federated Funds subject to a fee under the Administrative Services Agreement. The fee paid to FAS is based on the average daily net assets of the Investment Complex as specified below, plus certain out-of-pocket expenses:
| Administrative Fee | Average Daily Net Assets
of the Investment Complex |
| 0.150% | on the first $5 billion |
| 0.125% | on the next $5 billion |
| 0.100% | on the next $10 billion |
| 0.075% | on assets in excess of $20 billion |
Subject to the terms described in the Expense Limitation note, FAS may voluntarily choose to waive any portion of its fee. For the year ended November 30, 2013, the fee paid to FAS was 0.078% of average daily net assets of the Fund.
Distribution Services Fee
The Fund has adopted a Distribution Plan (the “Plan”) pursuant to Rule 12b-1 under the Act. Under the terms of the Plan, the Fund will compensate Federated Securities Corp. (FSC), the principal distributor, from the daily net assets of the Fund's Class A Shares, Class B Shares and Class C Shares to finance activities intended to result in the sale of these shares. The Plan provides that the Fund may incur distribution expenses at the following percentages of average daily net assets annually, to compensate FSC:
| Share Class Name | Percentage of Average Daily
Net Assets of Class |
| Class A Shares | 0.05% |
| Class B Shares | 0.75% |
| Class C Shares | 0.75% |
Subject to the terms described in the Expense Limitation note, FSC may voluntarily choose to waive any portion of its fee. For the year ended November 30, 2013, distribution services fees for the Fund were as follows:
| | Distribution
Services Fees
Incurred |
| Class B Shares | $516,475 |
| Class C Shares | 1,247,041 |
| TOTAL | $1,763,516 |
Annual Shareholder Report
For the year ended November 30, 2013, the Fund's Class A Shares did not incur a distribution services fee; however, it may begin to incur this fee upon approval of the Directors. When FSC receives fees, it may pay some or all of them to financial intermediaries whose customers purchase shares. For the year ended November 30, 2013, FSC retained $406,158 of fees paid by the Fund.
Sales Charges
Front-end sales charges and contingent deferred sales charges (CDSC) do not represent expenses of the Fund. They are deducted from the proceeds of sales of Fund shares prior to investment or from redemption proceeds prior to remittance, as applicable. For the year ended November 30, 2013, FSC retained $81,575 and $1,658 in sales charges from the sale of Class A Shares and Class F Shares. FSC also retained $11,008 of CDSC relating to redemptions of Class A Shares, $155,787 relating to redemptions of Class B Shares, $31,406 relating to redemption of Class C Shares and $77,918 relating to redemptions of Class F Shares.
Shareholder Services Fee
The Fund may pay fees (“Service Fees”) up to 0.25% of the average daily net assets of the Fund's Class A Shares, Class B Shares, Class C Shares and Class F Shares to financial intermediaries or to Federated Shareholder Services Company (FSSC) for providing services to shareholders and maintaining shareholder accounts. Subject to the terms described in the Expense Limitation note, FSSC may voluntarily reimburse the Fund for Service Fees. For the year ended November 30, 2013, Service Fees for the Fund were as follows:
| | Service
Fees
Incurred | Service
Fees
Reimbursed |
| Class A Shares | $2,272,944 | $(433,535) |
| Class B Shares | 172,158 | — |
| Class C Shares | 414,587 | — |
| Class F Shares | 525,664 | (41,113) |
| TOTAL | $3,385,353 | $(474,648) |
For the year ended November 30, 2013, FSSC received $97,807 of fees paid by the Fund.
Expense Limitation
The Adviser and certain of its affiliates (which may include FSC, FAS and FSSC) have voluntarily agreed to waive their respective fees and/or reimburse expenses so that the total annual fund operating expenses (as shown in the financial highlights, excluding extraordinary expenses and proxy-related expenses paid by the Fund, if any) paid by the Fund's Class A Shares, Class B Shares, Class C Shares, Class F Shares and Institutional Shares (after the voluntary waivers and reimbursements) will not exceed 0.98%, 1.79%, 1.79%, 1.02% and 0.79% (the “Fee Limit”), respectively, up to but not including the later of (the “Termination Date”): (a) February 1, 2015; or (b) the date of the Fund's next effective Prospectus. While the Adviser and its applicable affiliates currently do not anticipate terminating or increasing these arrangements prior to the Termination Date, these arrangements may only be terminated or the Fee Limit increased prior to the Termination Date with the agreement of the Directors.
Annual Shareholder Report
General
Certain Officers and Directors of the Fund are Officers and Directors or Trustees of certain of the above companies. To efficiently facilitate payment, Directors'/Trustees' fees and certain expenses related to conducting meetings of the Directors/Trustees and other miscellaneous expenses are paid by an affiliate of the Adviser which in due course are reimbursed by the Fund.
Transactions Involving Affiliated Holdings
Affiliated holdings are investment companies which are managed by the Adviser or an affiliate of the Adviser. The Adviser has agreed to reimburse the Fund for certain investment adviser fees as a result of transactions in other affiliated investment companies. For the year ended November 30, 2013, the Adviser reimbursed $17,965. Transactions involving the affiliated holdings during the year ended November 30, 2013, were as follows:
| | Federated
Prime Value
Obligations Fund,
Institutional Shares | High
Yield
Bond
Portfolio | Total of
Affiliated
Transactions |
| Balance of Shares Held 11/30/2012 | 31,775,429 | 68,543,487 | 100,318,916 |
| Purchases/Additions | 361,428,609 | 2,853,241 | 364,281,850 |
| Sales/Reductions | (385,008,826) | (2,744,643) | (387,753,469) |
| Balance of Shares Held 11/30/2013 | 8,195,212 | 68,652,085 | 76,847,297 |
| Value | $8,195,212 | $458,595,930 | $466,791,142 |
| Dividend Income | $18,323 | $35,175,051 | $35,193,374 |
| Capital Gain Distributions | $— | $2,991,307 | $2,991,307 |
Pursuant to an Exemptive Order issued by the Securities and Exchange Commission (SEC), the Fund may invest in portfolios of Federated Core Trust (“Core Trust”), which is managed by the Adviser. Core Trust is an open-end management company, registered under the Act, available only to registered investment companies and other institutional investors. The investment objective of High Yield Bond Portfolio, a portfolio of Core Trust, is to provide high current income. Federated Investors, Inc. receives no advisory or administrative fees from the High Yield Bond Portfolio.. Income distributions from High Yield Bond Portfolio are declared daily and paid monthly, and are recorded by the Fund as dividend income. Capital gain distributions, if any, from High Yield Portfolio are declared and paid annually, and are recorded by the Fund as capital gains. The performance of the Fund is directly affected by the performance of High Yield Bond Portfolio in which the Fund invested 30.1% of its net assets at November 30, 2013. A copy of the Core Trust's financial statements is available on the EDGAR Database on the SEC's website or upon request from the Fund.
6. Investment TRANSACTIONS
Purchases and sales of investments, excluding long-term U.S. government securities and short-term obligations, for the year ended November 30, 2013, were as follows:
| Purchases | $273,508,072 |
| Sales | $230,790,073 |
Annual Shareholder Report
7. LINE OF CREDIT
The Fund participates in a $100,000,000 unsecured, uncommitted revolving line of credit (LOC) agreement with PNC Bank. The LOC was made available for extraordinary or emergency purposes, primarily for financing redemption payments. Borrowings are charged interest at a rate offered to the Fund by PNC Bank at the time of the borrowing. As of November 30, 2013, there were no outstanding loans. During the year ended November 30, 2013, the Fund did not utilize the LOC.
8. INTERFUND LENDING
Pursuant to an Exemptive Order issued by the SEC, the Fund, along with other funds advised by subsidiaries of Federated Investors, Inc., may participate in an interfund lending program. This program provides an alternative credit facility allowing the Fund to borrow from other participating affiliated funds. As of November 30, 2013, there were no outstanding loans. During the year ended November 30, 2013, the program was not utilized.
Annual Shareholder Report
Report of Independent Registered Public Accounting Firm
TO THE BOARD OF DIRECTORS OF Federated investment series funds, inc. AND SHAREHOLDERS OF federated bond fund:
We have audited the accompanying statement of assets and liabilities of Federated Bond Fund (the “Fund”) (the sole portfolio constituting Federated Investment Series Funds, Inc.), including the portfolio of investments, as of November 30, 2013, and the related statement of operations for the year then ended, the statement of changes in net assets for each of the two years in the period then ended, and the financial highlights for each of the five years in the period then ended. These financial statements and financial highlights are the responsibility of the Fund's management. Our responsibility is to express an opinion on these financial statements and financial highlights based on our audits.
We conducted our audits in accordance with the standards of the Public Company Accounting Oversight Board (United States). Those standards require that we plan and perform the audit to obtain reasonable assurance about whether the financial statements and financial highlights are free of material misstatement. We were not engaged to perform an audit of the Fund's internal control over financial reporting. Our audits included consideration of internal control over financial reporting as a basis for designing audit procedures that are appropriate in the circumstances, but not for the purpose of expressing an opinion on the effectiveness of the Fund's internal control over financial reporting. Accordingly, we express no such opinion. An audit also includes examining, on a test basis, evidence supporting the amounts and disclosures in the financial statements and financial highlights, assessing the accounting principles used and significant estimates made by management, and evaluating the overall financial statement presentation. Our procedures included confirmation of securities owned as of November 30, 2013, by correspondence with the custodian and others or by other appropriate auditing procedures where replies from others were not received. We believe that our audits provide a reasonable basis for our opinion.
In our opinion, the financial statements and financial highlights referred to above present fairly, in all material respects, the financial position of Federated Bond Fund, a portfolio of Federated Investment Series Funds, Inc., at November 30, 2013, the results of its operations for the year then ended, the changes in its net assets for each of the two years in the period then ended, and the financial highlights for each of the five years in the period then ended, in conformity with U.S. generally accepted accounting principles.
Boston, Massachusetts
January 24, 2014
Annual Shareholder Report
Shareholder Expense Example (unaudited)
As a shareholder of the Fund, you incur two types of costs: (1) transaction costs, including sales charges (loads) on purchase or redemption payments; and (2) ongoing costs, including management fees and to the extent applicable, distribution (12b-1) fees and/or shareholder services fees and other Fund expenses. This Example is intended to help you to understand your ongoing costs (in dollars) of investing in the Fund and to compare these costs with the ongoing costs of investing in other mutual funds. It is based on an investment of $1,000 invested at the beginning of the period and held for the entire period from June 1, 2013 to November 30, 2013.
ACTUAL EXPENSES
The first section of the table below provides information about actual account values and actual expenses. You may use the information in this section, together with the amount you invested, to estimate the expenses that you incurred over the period. Simply divide your account value by $1,000 (for example, an $8,600 account value divided by $1,000 = 8.6), then multiply the result by the number in the first section under the heading entitled “Expenses Paid During Period” to estimate the expenses attributable to your investment during this period.
HYPOTHETICAL EXAMPLE FOR COMPARISON PURPOSES
The second section of the table below provides information about hypothetical account values and hypothetical expenses based on the Fund's actual expense ratio and an assumed rate of return of 5% per year before expenses, which is not the Fund's actual return. Thus, you should not use the hypothetical account values and expenses to estimate the actual ending account balance or your expenses for the period. Rather, these figures are required to be provided to enable you to compare the ongoing costs of investing in the Fund with other funds. To do so, compare this 5% hypothetical example with the 5% hypothetical examples that appear in the shareholder reports of the other funds.
Annual Shareholder Report
Please note that the expenses shown in the table are meant to highlight your ongoing costs only and do not reflect any transaction costs, such as sales charges (loads) on purchase or redemption payments. Therefore, the second section of the table is useful in comparing ongoing costs only, and will not help you determine the relative total costs of owning different funds. In addition, if these transaction costs were included, your costs would have been higher.
| | Beginning
Account Value
6/1/2013 | Ending
Account Value
11/30/2013 | Expenses Paid
During Period1 |
| Actual: | | | |
| Class A Shares | $1,000 | $1,001.10 | $4.92 |
| Class B Shares | $1,000 | $997.00 | $8.96 |
| Class C Shares | $1,000 | $996.00 | $8.96 |
| Class F Shares | $1,000 | $1,000.90 | $5.12 |
| Institutional Shares | $1,000 | $1,002.10 | $3.96 |
Hypothetical (assuming a 5% return
before expenses): | | | |
| Class A Shares | $1,000 | $1,020.16 | $4.96 |
| Class B Shares | $1,000 | $1,016.09 | $9.05 |
| Class C Shares | $1,000 | $1,016.09 | $9.05 |
| Class F Shares | $1,000 | $1,019.95 | $5.16 |
| Institutional Shares | $1,000 | $1,021.11 | $4.00 |
| 1 | Expenses are equal to the Fund's annualized net expense ratios, multiplied by the average account value over the period, multiplied by 183/365 (to reflect the one-half-year period). The annualized net expense ratios are as follows: |
| Class A Shares | 0.98% |
| Class B Shares | 1.79% |
| Class C Shares | 1.79% |
| Class F Shares | 1.02% |
| Institutional Shares | 0.79% |
Annual Shareholder Report
Shareholder Meeting Results (unaudited)
A Special Meeting of Shareholders of Federated Investment Series Funds, Inc. (the “Corporation”), of which the Fund is a portfolio, was held on October 28, 2013. On August 29, 2013, the record date for shareholders voting at the meeting, there were 167,744,830.963 total outstanding shares of the Corporation.
The following item was considered by shareholders of the Corporation and the results of their voting were as follows:
AGENDA ITEM
Proposal to elect certain Directors of the Corporation:1
| Name | For | Withheld |
| John T. Collins | 137,131,362.060 | 1,409,888.208 |
| Maureen Lally-Green | 136,004,856.763 | 2,536,393.505 |
| Thomas M. O'Neill | 137,279,358.081 | 1,261,892.187 |
| P. Jerome Richey | 137,078,865.605 | 1,462,384.663 |
| 1 | The following Directors continued their terms:
John F. Donahue, J. Christopher Donahue, Maureen Lally-Green (having been previously appointed by the Board), Peter E. Madden, Charles F. Mansfield, Jr., Thomas M. O'Neill (having been previously appointed by the Board), and John S. Walsh. |
Board of Directors and Corporation Officers
The Board of Directors is responsible for managing the Corporation's business affairs and for exercising all the Corporation's powers except those reserved for the shareholders. The following tables give information about each Director and the senior officers of the Fund. Where required, the tables separately list Directors who are “interested persons” of the Fund (i.e., “Interested” Directors) and those who are not (i.e., “Independent” Directors). Unless otherwise noted, the address of each person listed is Federated Investors Tower, 1001 Liberty Avenue, Pittsburgh, PA 15222. The address of all Independent Directors listed is 4000 Ericsson Drive, Warrendale, PA 15086-7561; Attention: Mutual Fund Board. As of December 31, 2013, the Corporation comprised one portfolio(s), and the Federated Fund Family consisted of 42 investment companies (comprising 135 portfolios). Unless otherwise noted, each Officer is elected annually. Unless otherwise noted, each Director oversees all portfolios in the Federated Fund Family and serves for an indefinite term. The Fund's Statement of Additional Information includes additional information about Corporation Directors and is available, without charge and upon request, by calling 1-800-341-7400.
In Memoriam - John F. Cunningham, Independent Director
With deep sadness, Federated announces the passing of John F. Cunningham, who served as an independent member of the Board of the Federated Fund Family since 1999. Mr. Cunningham's savvy business acumen and incisive intellect made him a powerful force on the Federated Fund Board. He was an advocate for shareholders and a respected colleague within the Federated family. Mr. Cunningham enjoyed an outstanding career in technology, having served as President and in other Senior Executive positions with leading companies in the industry. Federated expresses gratitude to Mr. Cunningham for his fine contributions as a Board member, colleague and friend. He will be greatly missed.
Interested DIRECTORS Background
Name
Birth Date
Positions Held with Corporation
Date Service Began | Principal Occupation(s) for Past Five Years,
Other Directorships Held and Previous Position(s) |
John F. Donahue*
Birth Date: July 28, 1924
Director
Began serving: May 1992 | Principal Occupations: Director or Trustee of the Federated Fund Family; Chairman and Director, Federated Investors, Inc.; Chairman of the Federated Fund Family's Executive Committee.
Previous Positions: Chairman of the Federated Fund Family; Trustee, Federated Investment Management Company; Chairman and Director, Federated Investment Counseling. |
Annual Shareholder Report
Name
Birth Date
Positions Held with Corporation
Date Service Began | Principal Occupation(s) for Past Five Years,
Other Directorships Held and Previous Position(s) |
J. Christopher Donahue*
Birth Date: April 11, 1949
President and Director
Began serving: May 1992 | Principal Occupations: Principal Executive Officer and President of certain of the Funds in the Federated Fund Family; Director or Trustee of the Funds in the Federated Fund Family; President, Chief Executive Officer and Director, Federated Investors, Inc.; Chairman and Trustee, Federated Investment Management Company; Trustee, Federated Investment Counseling; Chairman and Director, Federated Global Investment Management Corp.; Chairman, Federated Equity Management Company of Pennsylvania and Passport Research, Ltd. (investment advisory subsidiary of Federated); Trustee, Federated Shareholder Services Company; Director, Federated Services Company.
Previous Positions: President, Federated Investment Counseling; President and Chief Executive Officer, Federated Investment Management Company, Federated Global Investment Management Corp. and Passport Research, Ltd. |
| * | Family relationships and reasons for “interested” status: John F. Donahue is the father of J. Christopher Donahue; both are “interested” due to their beneficial ownership of shares of Federated Investors, Inc. and the positions they hold with Federated and its subsidiaries. |
INDEPENDENT DIRECTORS Background
Name
Birth Date
Positions Held with Corporation
Date Service Began | Principal Occupation(s) for Past Five Years,
Other Directorships Held, Previous Position(s) and Qualifications |
John T. Collins
Birth Date: January 24, 1947
Director
Began serving: October 2013 | Principal Occupations: Director or Trustee of the Federated Fund Family; Chairman and CEO, The Collins Group, Inc. (a private equity firm).
Other Directorships Held: Chairman Emeriti, Bentley University; Director, Sterling Suffolk Downs, Inc.; Former Director, National Association of Printers and Lithographers.
Previous Positions: Director and Audit Committee Member, Bank of America Corp.
Qualifications: Business management and director experience. |
Annual Shareholder Report
Name
Birth Date
Positions Held with Corporation
Date Service Began | Principal Occupation(s) for Past Five Years,
Other Directorships Held, Previous Position(s) and Qualifications |
Maureen Lally-Green
Birth Date: July 5, 1949
Director
Began serving: August 2009 | Principal Occupations: Director or Trustee of the Federated Fund Family; Associate General Secretary and Director, Office for Church Relations, Diocese of Pittsburgh; Adjunct Professor of Law, Duquesne University School of Law; Superior Court of Pennsylvania (service began 1998 and ended July 2009).
Other Directorships Held: Director, Consol Energy (service started June 2013); Director, Auberle (service ended December 2013); Member, Pennsylvania State Board of Education; Director, Saint Vincent College; Director, Ireland Institute of Pittsburgh (service ended December 2013); Director and Chair, UPMC Mercy Hospital; Regent, St. Vincent Seminary; Director, Epilepsy Foundation of Western and Central Pennsylvania; Director, Saint Thomas More Society (service ended December 2013); Director, Our Campaign for the Church Alive!, Inc.; Director, Pennsylvania Bar Institute (2013-present); Director, Cardinal Wuerl North Catholic High School (2013-present).
Previous Position: Professor of Law, Duquesne University School of Law, Pittsburgh (1983-1998).
Qualifications: Legal and director experience. |
Peter E. Madden
Birth Date: March 16, 1942
Director
Began serving: May 1992 | Principal Occupation: Director or Trustee, and Chairman of the Board of Directors or Trustees, of the Federated Fund Family.
Previous Positions: Representative, Commonwealth of Massachusetts General Court; President, Chief Operating Officer and Director, State Street Bank and Trust Company and State Street Corporation (retired); Director, VISA USA and VISA International; Chairman and Director, Massachusetts Bankers Association; Director, Depository Trust Corporation; Director, The Boston Stock Exchange.
Qualifications: Business management, mutual fund services and director experience. |
Charles F. Mansfield, Jr.
Birth Date: April 10, 1945
Director
Began serving: January 1999 | Principal Occupations: Director or Trustee of the Federated Fund Family; Management Consultant.
Previous Positions: Chief Executive Officer, PBTC International Bank; Partner, Arthur Young & Company (now Ernst & Young LLP); Chief Financial Officer of Retail Banking Sector, Chase Manhattan Bank; Senior Vice President, HSBC Bank USA (formerly Marine Midland Bank); Vice President, Citibank; Assistant Professor of Banking and Finance, Frank G. Zarb School of Business, Hofstra University; Executive Vice President, DVC Group, Inc. (marketing, communications and technology).
Qualifications: Banking, business management, education and director experience. |
Annual Shareholder Report
Name
Birth Date
Positions Held with Corporation
Date Service Began | Principal Occupation(s) for Past Five Years,
Other Directorships Held, Previous Position(s) and Qualifications |
Thomas M. O'Neill
Birth Date: June 14, 1951
Director
Began serving: October 2006 | Principal Occupations: Director or Trustee, Vice Chairman of the Audit Committee of the Federated Fund Family; Sole Proprietor, Navigator Management Company (investment and strategic consulting).
Other Directorships Held: Board of Overseers, Children's Hospital of Boston; Visiting Committee on Athletics, Harvard College; Board of Directors, Medicines for Humanity; Board of Directors, The Golisano Children's Museum of Naples, Florida.
Previous Positions: Chief Executive Officer and President, Managing Director and Chief Investment Officer, Fleet Investment Advisors; President and Chief Executive Officer, Aeltus Investment Management, Inc.; General Partner, Hellman, Jordan Management Co., Boston, MA; Chief Investment Officer, The Putnam Companies, Boston, MA; Credit Analyst and Lending Officer, Fleet Bank; Director and Consultant, EZE Castle Software (investment order management software); Director, Midway Pacific (lumber).
Qualifications: Business management, mutual fund, director and investment experience. |
P. Jerome Richey
Birth Date: February 23, 1949
Director
Began serving: October 2013 | Principal Occupations: Director or Trustee of the Federated Fund Family; General Counsel, University of Pittsburgh.
Other Directorships Held: Board Chairman, Epilepsy Foundation of Western Pennsylvania; Board Member, World Affairs Council of Pittsburgh.
Previous Positions: Chief Legal Officer and Executive Vice President, CONSOL Energy Inc.; Shareholder, Buchanan Ingersoll & Rooney PC (a law firm).
Qualifications: Business management, legal and director experience. |
John S. Walsh
Birth Date: November 28, 1957
Director
Began serving: January 1999 | Principal Occupations: Director or Trustee, Chairman of the Audit Committee of the Federated Fund Family; President and Director, Heat Wagon, Inc. (manufacturer of construction temporary heaters); President and Director, Manufacturers Products, Inc. (distributor of portable construction heaters); President, Portable Heater Parts, a division of Manufacturers Products, Inc.
Previous Position: Vice President, Walsh & Kelly, Inc.
Qualifications: Business management and director experience. |
Annual Shareholder Report
OFFICERS
Name
Birth Date
Positions Held with Corporation
Date Service Began | Principal Occupation(s) for Past Five Years
and Previous Position(s) |
John W. McGonigle
Birth Date: October 26, 1938
EXECUTIVE VICE PRESIDENT AND SECRETARY
Officer since: May 1992 | Principal Occupations: Executive Vice President and Secretary of the Federated Fund Family; Vice Chairman, Executive Vice President, Secretary and Director, Federated Investors, Inc.
Previous Positions: Trustee, Federated Investment Management Company and Federated Investment Counseling; Director, Federated Global Investment Management Corp., Federated Services Company and Federated Securities Corp. |
Lori A. Hensler
Birth Date: January 6, 1967
TREASURER
Officer since: April 2013 | Principal Occupations: Principal Financial Officer and Treasurer of the Federated Fund Family; Senior Vice President, Federated Administrative Services; Financial and Operations Principal for Federated Securities Corp. and Edgewood Services, Inc.; and Assistant Treasurer, Federated Investors Trust Company. Ms. Hensler has received the Certified Public Accountant designation.
Previous Positions: Controller of Federated Investors, Inc.; Senior Vice President and Assistant Treasurer, Federated Investors Management Company; Treasurer, Federated Investors Trust Company; Assistant Treasurer, Federated Administrative Services, Federated Administrative Services, Inc., Federated Securities Corp., Edgewood Services, Inc., Federated Advisory Services Company, Federated Equity Management Company of Pennsylvania, Federated Global Investment Management Corp., Federated Investment Counseling, Federated Investment Management Company, Passport Research, Ltd., and Federated MDTA, LLC; Financial and Operations Principal for Federated Securities Corp., Edgewood Services, Inc. and Southpointe Distribution Services, Inc. |
Peter J. Germain
Birth Date: September 3, 1959
CHIEF LEGAL OFFICER
Officer since: January 2005 | Principal Occupations: Mr. Germain is Chief Legal Officer of the Federated Fund Family. He is General Counsel and Vice President, Federated Investors, Inc.; President, Federated Administrative Services and Federated Administrative Services, Inc.; Vice President, Federated Securities Corp.; Secretary, Federated Private Asset Management, Inc.; and Secretary, Retirement Plan Service Company of America. Mr. Germain joined Federated in 1984 and is a member of the Pennsylvania Bar Association.
Previous Positions: Deputy General Counsel, Special Counsel, Managing Director of Mutual Fund Services, Federated Investors, Inc.; Senior Vice President, Federated Services Company; and Senior Corporate Counsel, Federated Investors, Inc. |
Richard B. Fisher
Birth Date: May 17, 1923
VICE PRESIDENT
Officer since: May 1992 | Principal Occupations: Vice Chairman or Vice President of some of the Funds in the Federated Fund Family; Vice Chairman, Federated Investors, Inc.; Chairman, Federated Securities Corp.
Previous Positions: President and Director or Trustee of some of the Funds in the Federated Fund Family; Executive Vice President, Federated Investors, Inc.; Director and Chief Executive Officer, Federated Securities Corp. |
Annual Shareholder Report
Name
Birth Date
Positions Held with Corporation
Date Service Began | Principal Occupation(s) for Past Five Years
and Previous Position(s) |
Brian P. Bouda
Birth Date: February 28, 1947
CHIEF COMPLIANCE OFFICER AND SENIOR VICE PRESIDENT
Officer since: August 2004 | Principal Occupations: Senior Vice President and Chief Compliance Officer of the Federated Fund Family; Vice President and Chief Compliance Officer of Federated Investors, Inc. and Chief Compliance Officer of certain of its subsidiaries. Mr. Bouda joined Federated in 1999 and is a member of the American Bar Association and the State Bar Association of Wisconsin.
Previous Positions: Served in Senior Management positions with a large regional banking organization. |
Robert J. Ostrowski
Birth Date: April 26, 1963
Chief Investment Officer
Officer since: May 2004 | Principal Occupations: Robert J. Ostrowski joined Federated in 1987 as an Investment Analyst and became a Portfolio Manager in 1990. He was named Chief Investment Officer of Federated's taxable fixed-income products in 2004 and also serves as a Senior Portfolio Manager. Mr. Ostrowski became an Executive Vice President of the Fund's Adviser in 2009 and served as a Senior Vice President of the Fund's Adviser from 1997 to 2009. Mr. Ostrowski has received the Chartered Financial Analyst designation. He received his M.S. in Industrial Administration from Carnegie Mellon University. |
Brian S. Ruffner
Birth Date: July 18, 1966
Vice President
Office since: May 2013
Portfolio Manager since: March 2013 | Principal Occupations: Brian S. Ruffner has been the Fund's Portfolio Manager since March 2013, and is responsible for the day to day management focusing on asset allocation and investment grade bonds. He is Vice President of Federated Investment Series Funds, Inc. Mr. Ruffner joined Federated in 1994 in the Fund Accounting department and from 1997 to 2001 was a Trader on the Cash Management Desk. In 2001 Mr. Ruffner became an Investment Analyst and in 2004 was appointed Asst. Vice President of a Federated advisory subsidiary. He became a Senior Investment Analyst and was appointed Vice President of the Fund's Adviser in 2007. From 1993 through 1994 Mr. Ruffner was employed by Mellon Bank NA as Global Trade Administrator. Mr. Ruffner earned his B.S. at the Indiana University of Pennsylvania and received his M.B.A. from the Duquesne University. |
Annual Shareholder Report
Evaluation and Approval of Advisory Contract–May 2013
Federated Bond Fund (the “Fund”)
Following a review and recommendation of approval by the Fund's independent directors, the Fund's Board reviewed and approved at its May 2013 meetings the Fund's investment advisory contract for an additional one-year term. The Board's decision regarding the contract reflects the exercise of its business judgment on whether to continue the existing arrangements.
In this connection, the Federated Funds' Board had previously appointed a Senior Officer, whose duties include specified responsibilities relating to the process by which advisory fees are to be charged to a Federated fund. The Senior Officer has the authority to retain consultants, experts, or staff as may be reasonably necessary to assist in the performance of his duties, reports directly to the Board, and may be terminated only with the approval of a majority of the independent members of the Board. The Senior Officer prepared and furnished to the Board an independent, written evaluation that covered topics discussed below (the “Evaluation”). The Board considered that Evaluation, along with other information, in deciding to approve the advisory contract.
The Board is also familiar with and considered judicial decisions concerning allegedly excessive investment advisory fees, which have indicated that the following factors may be relevant to an Adviser's fiduciary duty with respect to its receipt of compensation from a fund: the nature and quality of the services provided by the Adviser to a fund and its shareholders, including the performance and expenses of the fund and of comparable funds; the Adviser's cost of providing the services, including the profitability to the Adviser of providing advisory services to a fund; the extent to which the Adviser may realize “economies of scale” as a fund grows larger and, if such economies exist, whether they have been shared with a fund and its shareholders or the family of funds; any “fall-out financial benefits” that accrue to the Adviser because of its relationship with a fund (including research services received from brokers that execute fund trades and any fees paid to affiliates of the Adviser for services rendered to a fund); comparative fee structures, including a comparison of fees paid to the Adviser with those paid by similar funds; and the extent to which the Board members are fully informed about all facts the Board deems relevant to its consideration of the Adviser's services and fees. Consistent with these judicial decisions, the Board also considered management fees charged to institutional and other clients of the Adviser for what might be viewed as like services. The Board was aware of these factors and was guided by them in its review of the Fund's advisory contract to the extent it considered them to be appropriate and relevant, as discussed further below.
Annual Shareholder Report
The Board considered and weighed these circumstances in light of its substantial accumulated experience in governing the Fund and working with Federated on matters relating to the Federated funds, and was assisted in its deliberations by independent legal counsel. Throughout the year, and in connection with its May meetings, the Board requested and received substantial and detailed information about the Fund and the Federated organization that was in addition to the extensive materials that comprise and accompany the Senior Officer's Evaluation. Federated provided much of this information at each regular meeting of the Board, and furnished additional substantial information in connection with the May meeting at which the Board's formal review of the advisory contract occurred. At this May meeting, senior management of the Adviser also met with the independent directors and their counsel to discuss the materials presented and any other matters thought relevant by the Adviser or the directors. Between regularly scheduled meetings, the Board also received information on particular matters as the need arose. Thus, the Board's consideration of the advisory contract included review of the Senior Officer's Evaluation, accompanying data and additional information covering such matters as: the Adviser's investment philosophy, revenue, profitability, personnel and processes; investment and operating strategies; the Fund's short- and long-term performance (in absolute terms, both on a gross basis and net of expenses, as well as in relationship to its particular investment program and certain competitor or “peer group” funds and/or other benchmarks, as appropriate), and comments on the reasons for performance; the Fund's investment objectives; the Fund's expenses (including the advisory fee itself and the overall expense structure of the Fund, both in absolute terms and relative to similar and/or competing funds, with due regard for contractual or voluntary expense limitations); the use and allocation of brokerage commissions derived from trading the Fund's portfolio securities (if any); and the nature, quality and extent of the advisory and other services provided to the Fund by the Adviser and its affiliates. The Board also considered the preferences and expectations of Fund shareholders; the entrepreneurial risk assumed by the Adviser in sponsoring the funds; the continuing state of competition in the mutual fund industry and market practices; the range of comparable fees for similar funds in the mutual fund industry; the Fund's relationship to the Federated family of funds which include a comprehensive array of funds with different investment objectives, policies and strategies which are available for exchange without the incurrence of additional sales charges; compliance and audit reports concerning the Federated funds and the Federated companies that service them (including communications from regulatory agencies), as well as Federated's responses to any issues raised therein; and relevant developments in the mutual fund industry and how the Federated funds and/or Federated are responding to them. The Board's evaluation process is evolutionary. The criteria considered and the emphasis placed on relevant criteria change in recognition of changing circumstances in the mutual fund marketplace.
Annual Shareholder Report
While mindful that courts have cautioned against giving such comparisons too much weight, the Board has found the use of comparisons of the Fund's fees and expenses to other mutual funds with comparable investment programs to be relevant. The Board focused on comparisons with other similar mutual funds more heavily than non-mutual fund products or services because it is believed that they are more relevant. For example, other mutual funds are the products most like the Fund, they are readily available to Fund shareholders as alternative investment vehicles, and they are the type of investment vehicle in fact chosen and maintained by the Fund's investors. The range of their fees and expenses therefore appears to be a relevant indicator of what consumers have found to be reasonable in the precise marketplace in which the Fund competes.
It was noted in the materials for the Board meeting that for the period covered by the Evaluation, the Fund's investment advisory fee, after waivers and expense reimbursements, if any, was above the median of the relevant peer group. The Board reviewed the fees and other expenses of the Fund with the Adviser, noting that the overall expense structure of the Fund, after waivers and expense reimbursements, was above the median of the relevant peer group, but the Board still was satisfied that the overall expense structure of the Fund remained competitive. The Board will continue to monitor advisory fees and other expense borne by the Fund.
By contrast, the Senior Officer has reviewed Federated's fees for providing advisory services to products outside the Federated family of funds (e.g., institutional and separate accounts). He concluded that mutual funds and institutional accounts are inherently different products. Those differences include, but are not limited to, different types of targeted investors; being subject to different laws and regulations; different legal structures; different average account sizes; different associated costs; different portfolio management techniques made necessary by different cash flows; and the time spent by portfolio managers and their teams, funds financial services, legal, compliance and risk management in reviewing securities pricing, addressing different administrative responsibilities, addressing different degrees of risk associated with management and a variety of different costs. The Senior Officer did not consider these fee schedules to be determinative in judging the appropriateness of mutual fund advisory fees.
The Fund's ability to deliver competitive performance when compared to its peer group was also deemed to be relevant by the Board as a useful indicator of how the Adviser is executing the Fund's investment program, which in turn assisted the Board in reaching a conclusion that the nature, extent, and quality of the Adviser's investment management services were such as to warrant continuation of the advisory contract.
Annual Shareholder Report
The Senior Officer reviewed information compiled by Federated, using data supplied by independent fund ranking organizations, regarding the performance of, and fees charged by, other mutual funds, noting his view that comparisons to fund peer groups are relevant, though not conclusive in judging the reasonableness of proposed fees.
For the one-year, three-year and five-year periods covered by the Evaluation, the Fund's performance was above the median of the relevant peer group.
The Board also received financial information about Federated, including information regarding the compensation and benefits Federated derived from its relationships with the Federated funds. This information covered not only the fees under the advisory contracts, but also fees received by Federated's subsidiaries for providing other services to the Federated funds under separate contracts (e.g., for serving as the Federated funds' administrator). The information also detailed any indirect benefit Federated may derive from its receipt of research services from brokers who execute Federated fund trades. In addition, the Board considered the fact that, in order for a fund to be competitive in the marketplace, Federated and its affiliates frequently waived fees and/or reimbursed expenses and have disclosed to fund investors and/or indicated to the Board their intention to do so in the future, where appropriate. Moreover, the Board receives regular reporting as to the institution, adjustment or elimination of these voluntary waivers. In this regard, the Senior Officer proposed, and the Board approved, a reduction in the contractual advisory fee of 5 basis points. This change more closely aligned the contractual fee with the net fee actually charged after the imposition of applicable voluntary waivers and was believed by both the Senior Officer and the Board to improve the market competitiveness of the Fund.
Federated furnished information, requested by the Senior Officer, that reported revenues on a fund-by-fund basis and made estimates of the allocation of expenses on a fund-by-fund basis, using allocation methodologies specified by the Senior Officer. The Senior Officer noted that, while these cost allocation reports apply consistent allocation processes, the inherent difficulties in arbitrarily allocating costs continues to cause the Senior Officer to question the precision of the process and to conclude that such reports may be unreliable, since a single change in an allocation estimate can dramatically alter the resulting estimate of cost and/or profitability of a fund. The allocation information was considered in the analysis by the Board but was determined to be of limited use.
The Board and the Senior Officer also reviewed information compiled by Federated comparing profitability information for Federated to other publicly held fund management companies. In this regard, the Senior Officer noted the limited availability of such information, but nonetheless concluded that Federated's profit margins did not appear to be excessive. The Board agreed with this assessment.
Annual Shareholder Report
The Senior Officer's Evaluation also discussed the notion of possible realization of “economies of scale” as a fund grows larger. The Board considered in this regard that the Adviser has made significant and long-term investments in areas that support all of the Federated family of funds, such as personnel and processes for the portfolio management, shareholder services, compliance, internal audit, and risk management functions; and systems technology; and that the benefits of these efforts (as well as any economies, should they exist) were likely to be enjoyed by the fund family as a whole. Finally, the Board also noted the absence of any applicable regulatory or industry guidelines on this subject, which (as discussed in the Senior Officer's Evaluation) is compounded by the lack of any common industry practice or general pattern with respect to structuring fund advisory fees with “breakpoints” that serve to reduce the fee as the fund attains a certain size.
The Senior Officer noted that, subject to the comments and recommendations made within his Evaluation, his observations and the information accompanying the Evaluation supported a finding by the Board that the management fees for each of the funds were reasonable. Under these circumstances, other than the reduction in the contractual (or gross) advisory fee noted above, no changes were recommended to, and no objection was raised to, the continuation of the Fund's advisory contract.
In its decision to continue an existing investment advisory contract, the Board was mindful of the potential disruptions of the Fund's operations and various risks, uncertainties and other effects that could occur as a result of a decision to terminate or not renew an advisory contract. In particular, the Board recognized that many shareholders have invested in the Fund on the strength of the Adviser's industry standing and reputation and with the expectation that the Adviser will have a continuing role in providing advisory services to the Fund. Thus, the Board's approval of the advisory contract reflected the fact that it is the shareholders who have effectively selected the Adviser by virtue of having invested in the Fund. The Board concluded that, in light of the factors discussed above, including the nature, quality and scope of the services provided to the Fund by the Adviser and its affiliates, continuation of the advisory contract was appropriate.
The Board based its decision to approve the advisory contract on the totality of the circumstances and relevant factors and with a view to past and future long-term considerations. Not all of the factors and considerations identified above were necessarily relevant to the Fund, nor did the Board consider any one of them to be determinative. With respect to the factors that were relevant, the Board's decision to approve the contract reflects its determination that Federated's performance and actions provided a satisfactory basis to support the decision to continue the existing arrangements.
Annual Shareholder Report
Voting Proxies on Fund Portfolio Securities
A description of the policies and procedures that the Fund uses to determine how to vote proxies, if any, relating to securities held in the Fund's portfolio is available, without charge and upon request, by calling 1-800-341-7400. A report on “Form N-PX” of how the Fund voted any such proxies during the most recent 12-month period ended June 30 is available via the Proxy Voting Record (Form N-PX) link associated with the Fund and share class name at www.Federatedinvestors.com/FundInformation. Form N-PX filings are also available at the SEC's website at www.sec.gov.
Quarterly Portfolio Schedule
The Fund files with the SEC a complete schedule of its portfolio holdings, as of the close of the first and third quarters of its fiscal year, on “Form N-Q.” These filings are available on the SEC's website at www.sec.gov and may be reviewed and copied at the SEC's Public Reference Room in Washington, DC. (Call 1-800-SEC-0330 for information on the operation of the Public Reference Room.) You may also access this information via the link to the Fund and share class name at www.Federatedinvestors.com/FundInformation.
Annual Shareholder Report
[PAGE INTENTIONALLY LEFT BLANK]
[PAGE INTENTIONALLY LEFT BLANK]
[PAGE INTENTIONALLY LEFT BLANK]
[PAGE INTENTIONALLY LEFT BLANK]
Mutual funds are not bank deposits or obligations, are not guaranteed by any bank and are not insured or guaranteed by the U.S. government, the Federal Deposit Insurance Corporation, the Federal Reserve Board or any other government agency. Investment in mutual funds involves investment risk, including the possible loss of principal.
This Report is authorized for distribution to prospective investors only when preceded or accompanied by the Fund's Prospectus, which contains facts concerning its objective and policies, management fees, expenses and other information.
Federated Bond Fund
Federated Investors Funds
4000 Ericsson Drive
Warrendale, PA 15086-7561
Contact us at FederatedInvestors.com
or call 1-800-341-7400.
Federated Securities Corp., Distributor
CUSIP 31420F103
CUSIP 31420F202
CUSIP 31420F301
CUSIP 31420F400
CUSIP 31420F509
29747 (1/14)
Federated is a registered trademark of Federated Investors, Inc.
2014 ©Federated Investors, Inc.
Item 2. Code of Ethics
(a) As of the end of the period covered by this report, the registrant has adopted a code of ethics (the "Section 406 Standards for Investment Companies - Ethical Standards for Principal Executive and Financial Officers") that applies to the registrant's Principal Executive Officer and Principal Financial Officer; the registrant's Principal Financial Officer also serves as the Principal Accounting Officer.
(c) Not Applicable
(d) Not Applicable
(e) Not Applicable
(f)(3) The registrant hereby undertakes to provide any person, without charge, upon request, a copy of the code of ethics. To request a copy of the code of ethics, contact the registrant at 1-800-341-7400, and ask for a copy of the Section 406 Standards for Investment Companies - Ethical Standards for Principal Executive and Financial Officers.
Item 3. Audit Committee Financial Expert
The registrant's Board has determined that each of the following members of the Board's Audit Committee is an “audit committee financial expert,” and is "independent," for purposes of this Item: Charles F. Mansfield, Jr., Thomas M. O'Neill and John S. Walsh.
Item 4. Principal Accountant Fees and Services
(a) Audit Fees billed to the registrant for the two most recent fiscal years:
Fiscal year ended 2013 – $29,300
Fiscal year ended 2012 - $27,900
(b) Audit-Related Fees billed to the registrant for the two most recent fiscal years:
Fiscal year ended 2013 - $0
Fiscal year ended 2012 - $36
Travel to Audit Committee Meeting.
Amount requiring approval of the registrant’s audit committee pursuant to paragraph (c)(7)(ii) of Rule 2-01 of Regulation S-X, $0 and $0 respectively.
(c) Tax Fees billed to the registrant for the two most recent fiscal years:
Fiscal year ended 2013 - $0
Fiscal year ended 2012 - $0
Amount requiring approval of the registrant’s audit committee pursuant to paragraph (c)(7)(ii) of Rule 2-01 of Regulation S-X, $0 and $0 respectively.
(d) All Other Fees billed to the registrant for the two most recent fiscal years:
Fiscal year ended 2013 - $0
Fiscal year ended 2012 - $0
Amount requiring approval of the registrant’s audit committee pursuant to paragraph (c)(7)(ii) of Rule 2-01 of Regulation S-X, $0 and $0 respectively.
(e)(1) Audit Committee Policies regarding Pre-approval of Services.
The Audit Committee is required to pre-approve audit and non-audit services performed by the independent auditor in order to assure that the provision of such services do not impair the auditor’s independence. Unless a type of service to be provided by the independent auditor has received general pre-approval, it will require specific pre-approval by the Audit Committee. Any proposed services exceeding pre-approved cost levels will require specific pre-approval by the Audit Committee.
Certain services have the general pre-approval of the Audit Committee. The term of the general pre-approval is 12 months from the date of pre-approval, unless the Audit Committee specifically provides for a different period. The Audit Committee will annually review the services that may be provided by the independent auditor without obtaining specific pre-approval from the Audit Committee and may grant general pre-approval for such services. The Audit Committee will revise the list of general pre-approved services from time to time, based on subsequent determinations. The Audit Committee will not delegate its responsibilities to pre-approve services performed by the independent auditor to management.
The Audit Committee has delegated pre-approval authority to its Chairman. The Chairman will report any pre-approval decisions to the Audit Committee at its next scheduled meeting. The Committee will designate another member with such pre-approval authority when the Chairman is unavailable.
AUDIT SERVICES
The annual Audit services engagement terms and fees will be subject to the specific pre-approval of the Audit Committee. The Audit Committee must approve any changes in terms, conditions and fees resulting from changes in audit scope, registered investment company (RIC) structure or other matters.
In addition to the annual Audit services engagement specifically approved by the Audit Committee, the Audit Committee may grant general pre-approval for other Audit Services, which are those services that only the independent auditor reasonably can provide. The Audit Committee has pre-approved certain Audit services, all other Audit services must be specifically pre-approved by the Audit Committee.
AUDIT-RELATED SERVICES
Audit-related services are assurance and related services that are reasonably related to the performance of the audit or review of the Company’s financial statements or that are traditionally performed by the independent auditor. The Audit Committee believes that the provision of Audit-related services does not impair the independence of the auditor, and has pre-approved certain Audit-related services, all other Audit-related services must be specifically pre-approved by the Audit Committee.
TAX SERVICES
The Audit Committee believes that the independent auditor can provide Tax services to the Company such as tax compliance, tax planning and tax advice without impairing the auditor’s independence. However, the Audit Committee will not permit the retention of the independent auditor in connection with a transaction initially recommended by the independent auditor, the purpose of which may be tax avoidance and the tax treatment of which may not be supported in the Internal Revenue Code and related regulations. The Audit Committee has pre-approved certain Tax services, all Tax services involving large and complex transactions must be specifically pre-approved by the Audit Committee.
ALL OTHER SERVICES
With respect to the provision of services other than audit, review or attest services the pre-approval requirement is waived if:
| (1) | The aggregate amount of all such services provided constitutes no more than five percent of the total amount of revenues paid by the registrant, the registrant’s adviser (not including any sub-adviser whose role is primarily portfolio management and is subcontracted with or overseen by another investment adviser), and any entity controlling, controlled by, or under common control with the investment adviser that provides ongoing services to the registrant to its accountant during the fiscal year in which the services are provided; |
| (2) | Such services were not recognized by the registrant, the registrant’s adviser (not including any sub-adviser whose role is primarily portfolio management and is subcontracted with or overseen by another investment adviser), and any entity controlling, controlled by, or under common control with the investment adviser that provides ongoing services to the registrant at the time of the engagement to be non-audit services; and |
| (3) | Such services are promptly brought to the attention of the Audit Committee of the issuer and approved prior to the completion of the audit by the Audit Committee or by one or more members of the Audit Committee who are members of the board of directors to whom authority to grant such approvals has been delegated by the Audit Committee. |
The Audit Committee may grant general pre-approval to those permissible non-audit services classified as All Other services that it believes are routine and recurring services, and would not impair the independence of the auditor.
The SEC’s rules and relevant guidance should be consulted to determine the precise definitions of prohibited non-audit services and the applicability of exceptions to certain of the prohibitions.
PRE-APPROVAL FEE LEVELS
Pre-approval fee levels for all services to be provided by the independent auditor will be established annually by the Audit Committee. Any proposed services exceeding these levels will require specific pre-approval by the Audit Committee.
PROCEDURES
Requests or applications to provide services that require specific approval by the Audit Committee will be submitted to the Audit Committee by both the independent auditor and the Principal Accounting Officer and/or Internal Auditor, and must include a joint statement as to whether, in their view, the request or application is consistent with the SEC’s rules on auditor independence.
(e)(2) Percentage of services identified in items 4(b) through 4(d) that were approved by the registrants audit committee pursuant to paragraph (c)(7)(i)(C) of Rule 2-01 of Regulation S-X:
4(b)
Fiscal year ended 2013 – 0%
Fiscal year ended 2012 - 0%
Percentage of services provided to the registrants investment adviser and any entity controlling, controlled by, or under common control with the investment adviser that provides ongoing services to the registrant that were approved by the registrants audit committee pursuant to paragraph (c)(7)(i)(C) of Rule 2-01 of Regulation S-X, 0% and 0% respectively.
4(c)
Fiscal year ended 2013 – 0%
Fiscal year ended 2012 – 0%
Percentage of services provided to the registrants investment adviser and any entity controlling, controlled by, or under common control with the investment adviser that provides ongoing services to the registrant that were approved by the registrants audit committee pursuant to paragraph (c)(7)(i)(C) of Rule 2-01 of Regulation S-X,0% and 0% respectively.
4(d)
Fiscal year ended 2013 – 0%
Fiscal year ended 2012 – 0%
Percentage of services provided to the registrants investment adviser and any entity controlling, controlled by, or under common control with the investment adviser that provides ongoing services to the registrant that were approved by the registrants audit committee pursuant to paragraph (c)(7)(i)(C) of Rule 2-01 of Regulation S-X, 0% and 0% respectively.
| (g) | Non-Audit Fees billed to the registrant, the registrant’s investment adviser, and certain entities controlling, controlled by or under common control with the investment adviser: |
Fiscal year ended 2013 – $107,168
Fiscal year ended 2012 - $293,685
(h) The registrant’s Audit Committee has considered that the provision of non-audit services that were rendered to the registrant’s adviser (not including any sub-adviser whose role is primarily portfolio management and is subcontracted with or overseen by another investment adviser), and any entity controlling, controlled by, or under common control with the investment adviser that provides ongoing services to the registrant that were not pre-approved pursuant to paragraph (c)(7)(ii) of Rule 2-01 of Regulation S-X is compatible with maintaining the principal accountant’s independence.
Item 5. Audit Committee of Listed Registrants
Not Applicable
Item 6. Schedule of Investments
(a) The registrant’s Schedule of Investments is included as part of the Report to Stockholders filed under Item 1 of this form.
(b) Not Applicable; Fund had no divestments during the reporting period covered since the previous Form N-CSR filing.
Item 7. Disclosure of Proxy Voting Policies and Procedures for Closed-End Management Investment Companies
Item 8. Portfolio Managers of Closed-End Management Investment Companies
Item 9. Purchases of Equity Securities by Closed-End Management Investment Company and Affiliated Purchasers
Item 10. Submission of Matters to a Vote of Security Holders
No Changes to Report
Item 11. Controls and Procedures
(a) The registrant’s President and Treasurer have concluded that the
registrant’s disclosure controls and procedures (as defined in rule 30a-3(c) under the Act) are effective in design and operation and are sufficient to form the basis of the certifications required by Rule 30a-(2) under the Act, based on their evaluation of these disclosure controls and procedures within 90 days of the filing date of this report on Form N-CSR.
(b) There were no changes in the registrant’s internal control over financial reporting (as defined in rule 30a-3(d) under the Act) during the second fiscal quarter of the period covered by this report that have materially affected, or are reasonably likely to materially affect, the registrant’s internal control over financial reporting.
Item 12. Exhibits
(a)(1) Code of Ethics- Not Applicable to this Report.
(a)(2) Certifications of Principal Executive Officer and Principal Financial Officer.
(a)(3) Not Applicable.
(b) Certifications pursuant to 18 U.S.C. Section 1350.
SIGNATURES
Pursuant to the requirements of the Securities Exchange Act of 1934 and the Investment Company Act of 1940, the registrant has duly caused this report to be signed on its behalf by the undersigned, thereunto duly authorized.
Registrant Federated Investment Series Funds, Inc.
By /S/ Lori A. Hensler
Lori A. Hensler, Principal Financial Officer
Date January 24, 2014
Pursuant to the requirements of the Securities Exchange Act of 1934 and the Investment Company Act of 1940, this report has been signed below by the following persons on behalf of the registrant and in the capacities and on the dates indicated.
By /S/ J. Christopher Donahue
J. Christopher Donahue, Principal Executive Officer
Date January 24, 2014
By /S/ Lori A. Hensler
Lori A. Hensler, Principal Financial Officer
Date January 24, 2014