EXHIBIT 99.D
DESCRIPTION OF HUNGARY
DATED SEPTEMBER 28, 2020
TABLE OF CONTENTS
| | Page |
| FOREIGN EXCHANGE | 1 |
| OVERVIEW OF HUNGARY | 2 |
| THE ECONOMY | 18 |
| PRIVATIZATION | 33 |
| BALANCE OF PAYMENTS AND FOREIGN TRADE | 34 |
| MONETARY AND FINANCIAL SYSTEM | 41 |
| PUBLIC FINANCE | 61 |
| NATIONAL DEBT | 82 |
| TABLES AND SUPPLEMENTARY INFORMATION | 93 |
FOREIGN EXCHANGE
Except as otherwise specified, all amounts in this report are expressed in Hungarian forints (“forint” or “HUF”), in euro (“euro” or “EUR”) and in U.S. dollars (“USD”). All currency conversions in this report are at the National Bank of Hungary’s (the “NBH”) official middle rate of exchange on a particular date or calculated at the average of the middle rates of exchange for a particular period. For your convenience, we have converted certain amounts from forint into USD and/or euro at the average exchange rate for each relevant period or the exchange rate in effect on a given date.
The following table sets forth the forint/USD exchange rates for the last day of the periods indicated and the average exchange rates during the periods indicated:
Table 1: Forint/USD Exchange Rate
| | | 2015 | | | 2016 | | | 2017 | | | 2018 | | | 2019 | |
| | | (HUF per USD) | |
| Year end | | | 286.63 | | | | 293.69 | | | | 258.82 | | | | 280.94 | | | | 294.74 | |
| Average for year | | | 279.46 | | | | 281.44 | | | | 274.27 | | | | 270.25 | | | | 290.65 | |
Source: NBH
The following table sets forth the forint/euro exchange rates for the last day of the periods indicated and the average exchange rates during the periods indicated:
Table 2: Forint/EUR Exchange Rate
| | | 2015 | | | 2016 | | | 2017 | | | 2018 | | | 2019 | |
| | | (HUF per EUR) | |
| Year end | | | 313.12 | | | | 311.02 | | | | 310.14 | | | | 321.51 | | | | 330.52 | |
| Average for year | | | 309.90 | | | | 311.46 | | | | 309.21 | | | | 318.87 | | | | 325.35 | |
Source: NBH
On September 24, 2020, the official middle exchange rates were HUF313.40 = USD1.00, HUF365.33 = EUR1.00 and EUR0.86 = USD1.00. For information on the convertibility of the forint, see “Monetary and Financial System—Exchange Rate Policy—Foreign Exchange and Convertibility of the Forint.”
Totals in certain tables in this report may differ from the sum of the individual items in such tables due to rounding. In addition, certain figures contained in this report are estimates prepared in accordance with procedures customarily used in Hungary for the reporting of data. Certain other figures are preliminary in nature. In each case, the actual figures may vary from the estimated or preliminary figures set forth in this report.
PRESENTATION OF INFORMATION
Unless otherwise indicated, all data in this report are presented for comparison purposes in accordance with the methodology of the International Monetary Fund (the “IMF”) (as set forth in the Manual on Government Finance Statistics, IMF 1986) (“GFS”). In order to comply with its European Union (“EU”) accession obligations, Hungary produces certain data on the basis of the European System of Accounts 95 (“ESA”). ESA methodology monitors revenues and expenditures on an accrual basis, whereas GFS methodology monitors revenues and expenditures on a cash basis. Under ESA, certain issued state guarantees are reclassified as government debt and increase the deficit. The definition of the general government sector is extended to include certain quasi-governmental institutions.
OVERVIEW OF HUNGARY
General
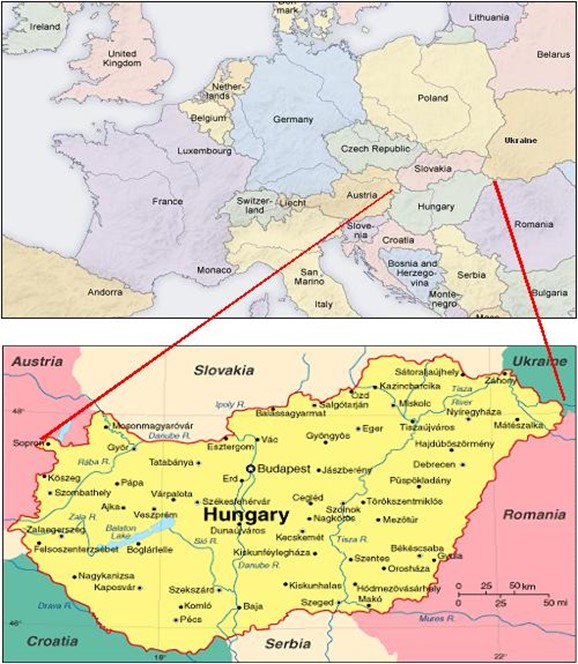
Hungary (until December 31, 2011, the country was known as “The Republic of Hungary,” hereinafter referred to as “Hungary”) lies in Central Europe and covers an area of approximately 93,000 square kilometers (“km”). Hungary is bordered by seven countries: Slovakia and Ukraine to the north, Romania to the east, Serbia and Croatia to the south and Slovenia and Austria to the west. The Danube River crosses Hungary, connecting the country with ports on the Black Sea. Hungary has historically been a nexus of social and cultural life and a trade link between Eastern and Western Europe. Hungary’s capital is Budapest.
As of January 1, 2019, the population of Hungary was 9.8 million. Approximately 70.5% of the population lived in urban areas and 1.8 million lived in Budapest, which is the political, administrative, cultural and commercial center of Hungary. While approximately 84% of the population is Magyar, there are minorities of Armenian, Bulgarian, Croat, German, Greek, Polish, Roma, Romanian, Ruthenian, Serb, Slovak, Slovenian and Ukrainian ethnicity.
The following table sets forth certain information with respect to the population growth rate in Hungary for the periods indicated:
Table 3: Population Growth Rate
| | | | 2015 | | | | 2016 | | | | 2017 | | | | 2018 | | | | 2019(1) | |
| Population (in thousand persons) | | | 9,856 | | | | 9,830 | | | | 9,798 | | | | 9,778 | | | | 9,773 | |
| Increase (decrease) in population (%) | | | (0.2 | ) | | | (0.3 | ) | | | (0.3 | ) | | | (0.2 | ) | | | (0.1 | ) |
Source: Hungarian Central Statistical Office (“CSO”)
Note: —
The following table sets forth the age distribution for the population of Hungary for the periods indicated:
Table 4: Age Distribution of the Population of Hungary
| | | | 2015 | | | | 2016 | | | | 2017 | | | | 2018 | | | | 2019(1) | |
| 0-14 | | | 1,427,186 | | | | 1,424,448 | | | | 1,422,865 | | | | 1,421,916 | | | | 1,421,739 | |
| 15-64 | | | 6,664,153 | | | | 6,609,458 | | | | 6,546,470 | | | | 6,504,490 | | | | 6,461,058 | |
| 65+ | | | 1,764,232 | | | | 1,796,579 | | | | 1,828,226 | | | | 1,851,965 | | | | 1,889,959 | |
Source: CSO
Note: —
Political System
Transformation and New Constitution
Immediately after World War II, Hungary was governed by a “grand coalition” of Hungarian political parties. By 1948, however, all non-communist parties had been abolished with the support of the Soviet Union. The Hungarian Socialist Workers’ Party dominated all facets of government until 1990.
During the late 1980s, the political system in Hungary changed dramatically. On October 23, 1989, Hungary was proclaimed a republic and, to signify the country’s change in status to a free democratic state, Hungary’s name was changed from the “Hungarian People’s Republic” to the “Republic of Hungary.” Also in 1989, the Hungarian constitution was substantially amended. Under this new constitution, Hungary instituted a multi-party democratic government, making it one of the first formerly communist countries in Central and Eastern Europe to undertake democratic reforms. Non-communist political parties were established in 1989 and, in 1990, Hungary held multi-party elections for the first time since 1947.
On April 18, 2011, Parliament adopted the Fundamental Law of Hungary as the new constitution of Hungary (“New Constitution” or, if referring to any constitution in effect at the time, the “Constitution”). The New Constitution was promulgated on April 25, 2011 and went into effect on January 1, 2012. The major developments of the New Constitution included, inter alia, the following:
| | · | the new name of the country, which is “Hungary”; |
| | · | the notion of a “Cardinal Act,” which may only be passed, modified or repealed by the votes of two-thirds of the present Members of Parliament; |
| | · | the principle of balanced, transparent and sustainable management of the budget, which principle will be enforced primarily by Parliament and the Government; |
| | · | the notion of autonomous regulatory organizations, which will be established by a Cardinal Act of Parliament; |
| | · | the main responsibilities of the Constitutional Court; |
| | · | the function of the Commissioner for Fundamental Rights; |
| | · | the framework rules for public finances; |
| | · | limitations on the level of government debt; and |
| | · | the fundamental rules for the responsibilities and composition of the Budgetary Council and rules for the appointment of its president. |
Aimed at the balanced, transparent and sustainable management of the budget, the New Constitution sets certain general rules for public finances.
Under the New Constitution, Parliament is not entitled to adopt an Act on the central budget that would result in the level of government debt exceeding 50% of the gross domestic product. Furthermore, in the course of implementation of the central budget, it is not allowed to draw a loan or undertake a financial obligation on behalf of Hungary that results in a level of government debt exceeding 50% of the gross domestic product.
The New Constitution includes certain exemptions and transitional rules in effect until the level of government debt is reduced to the above-mentioned limit.
Upon the occurrence of a “special legal order,” Parliament and the Government are entitled to deviate from the limitations described above to the extent necessary to mitigate the effects of the events and circumstances triggering the special legal order, or, in the event of a significant and enduring national economic recession, to the extent necessary to restore the balance of the national economy. “Special legal order” means a state of national crisis, state of emergency, state of preventive defense, event of unexpected attack or state of danger.
Until the level of government debt falls below 50% of gross domestic product, Parliament is obligated to adopt an Act on the central budget that provides for a decrease of the ratio of government debt to gross domestic product. Until the level of government debt falls below 50% of gross domestic product, in the course of implementation of the central budget, Parliament is not allowed to draw a loan or undertake a financial obligation on behalf of Hungary that would result in an increase of the ratio of government debt to gross domestic product from the previous calendar year.
As long as the government debt exceeds 50% of the gross domestic product, the Constitutional Court may, within its competence pursuant to the respective provisions of the New Constitution, review Acts on (i) the central budget; (ii) implementation of the central budget; (iii) central taxes; (iv) stamp duties and contributions; (v) customs duties; and (vi) the central requirements related to local taxes for the conformity, of each of the foregoing, with those aspects of the New Constitution relating to rights to life and human dignity, to the protection of personal data, to the freedom of thought, conscience and religion, or in connection with the rights related to Hungarian citizenship, and the Constitutional Court may only annul these Acts for violation of these rights. Acts governing the above matters may be annulled by the Constitutional Court without restriction if the procedural requirements laid down in the New Constitution for the creation and publication of such rules of law have not been complied with.
The method for calculating government debt and gross domestic product and the rules for implementation of the government debt limitations mentioned above are determined in an Act of Parliament.
The New Constitution prescribes that Cardinal Acts of Parliament will regulate the burden of public finances; the fundamental rules of the pension system; the establishment of autonomous regulatory organs; the detailed rules of the responsibilities, organization and operation of the Constitutional Court; the detailed rules of the operation of the Budgetary Council; and the method for calculating the level of government debt and gross domestic product.
The New Constitution provides a constitutional basis for the operation of the Budgetary Council and enhances the current statutory provisions applicable to the Council.
Subsequent to the adoption of the New Constitution, seven amendments to the new Constitution have been adopted, with the last one adopted in 2018.
As a reaction to several decisions of the Constitutional Court, the fourth amendment to the New Constitution (“Fourth Amendment”) was adopted by Parliament on March 11, 2013. The Fourth Amendment is intended, inter alia, to implement several of the Transitional Provisions of the New Constitution that were annulled by the Constitutional Court, such as the competence of Parliament to recognize religious groups as churches and the limitation of political advertising. Pursuant to the Fourth Amendment, any political advertising may be broadcast on radio or television channels free of charge and, during the campaign period preceding the national and European parliamentary elections, solely via the public radio and television channels. It therefore eliminated mandatory campaign silence and the prohibition on publishing poll numbers on and before the election day. The Fourth Amendment does not include a pre-registration requirement regarding parliamentary elections, in compliance with the previous decision of the Constitutional Court.
Furthermore, the Fourth Amendment narrowed the competence of the Constitutional Court by providing that the Constitutional Court would only undertake a review of the constitutionality of provisions of law brought before it and would not be entitled to extend its review to other provisions not challenged, unless those provisions have a close and substantial connection with a provision of law under review.
In accordance with the Fourth Amendment, decisions of the Constitutional Court that predate the date that the New Constitution went into effect were annulled; however, the legal consequences upon parties to the cases that produced such decisions were not affected.
In compliance with the Fourth Amendment, on July 5, 2013, Parliament adopted an Act on the amendment of certain laws in connection with the Fourth Amendment of the New Constitution. This Act modifies the authority of the Constitutional Court and implements new control functions of the Constitutional Court, such as preliminary control and—if initiated within 30 days by the Government, 25% of the Members of Parliament, the President of the Curia, the General Prosecutor or the parliamentary commissioner—subsequent control of laws according to the New Constitution or any amendments thereto. Furthermore, the Act provides for preliminary constitutional review of normative decrees to ensure constitutional review of the operating rules of Parliament (including technical details of submissions, interpellations, and voting), irrespective of the legal source of such rules.
The fifth amendment to the New Constitution was adopted on September 16, 2013, and provides the constitutional basis for the proposed merger of central bank functions and financial supervisory authority functions, as well as elimination of the Hungarian Financial Supervisory Authority (the “HFSA”). These functions are now all within the purview of the National Bank of Hungary (the “NBH”).
On June 7, 2016, Parliament adopted the sixth amendment to the New Constitution, which enables a two-thirds majority of the Members of Parliament present to declare a state of terrorism threat for a fixed term at the initiative of the government of Hungary (the “Government”) in the event of a significant and direct threat of a terrorist attack or in the event of an actual terrorist attack. Upon the authorization of Parliament, the Hungarian Government may pass decrees by virtue of law, suspend the application of certain laws, depart from effective statutory regulations and adopt other extraordinary measures.
The seventh amendment to the New Constitution (“Seventh Amendment”) was adopted on June 20, 2018. It prohibits the resettlement of foreign populations in Hungary and states that non-Hungarian citizens who have arrived into Hungary from a country in which they are not persecuted or not in direct danger of being persecuted may not be eligible for asylum. The Seventh Amendment also creates the organizational foundations for a separate public administration court system and creates the legal conditions for banning people from living in public spaces. Furthermore, it includes that the exercise of freedom of expression and the right of assembly shall not harm others’ private and family life and their homes. The Seventh Amendment also aims to define the main components of national identity in order to clarify the interconnection between the national and European Union powers and laws.
President
The President of Hungary is the head of the state, elected by Parliament for a term of five years. The President may, but need not, be elected from the members of Parliament (but cannot be both President and a member of Parliament at the same time). The President may be re-elected only once. The President’s authority is limited. Most actions taken by the President require the countersignature of the Prime Minister or the appropriate minister. Since January 1, 2012, the main powers of the President include:
| | · | representing the nation as head of state; |
| | · | acknowledging the binding force of international treaties and agreements with prior authorization given by Parliament1; |
| | · | attending and addressing any session of Parliament; |
| | · | acting as commander-in-chief of the armed forces; |
| | · | setting the date for Parliamentary and local elections; |
| | · | initiating certain measures in Parliament; |
| | · | appointing and removing, among others, the President and Vice-Presidents of the NBH; and |
On May 2, 2012, Parliament elected Mr. János Áder as President, and he took office on May 10, 2012. Mr. Áder was reelected on March 13, 2017. The next presidential election is expected to be held in 2022.
Government
The Government consists of the Prime Minister and other ministers forming the Cabinet (currently thirteen ministers, including three deputy prime ministers and two ministers without portfolio). The Government is charged with the executive function of Hungary and with proposing legislation to Parliament. The Prime Minister and the Government’s program is approved by a simple majority vote of Parliament. The Prime Minister is nominated by the President of Hungary and elected by Parliament to serve for four years. If the Prime Minister loses his or her office for any reason, such as resignation, death or removal through a no-confidence vote, and the Government therefore loses its mandate, a new Prime Minister would be elected by Parliament with a mandate that expires after the next general election. The other ministers are nominated by the Prime Minister and appointed and removed by the President. There is one substitute prime minister nominated by the Prime Minister, who would replace the Prime Minister if he or she loses office by reason of death, loss of voting right or conflict of interest. On May 18, 2018, the current Government was formally inaugurated. In the current governmental structure, the Minister of Finance is responsible for public finances.
Parliament
The single-chamber Hungarian Parliament is the country’s supreme legislative body. Parliament elects the President, the Prime Minister, the members of the Constitutional Court, the President and Vice-Presidents of the State Audit Office, the President of the Supreme Court, the President of the Supreme Court of Administration and the Attorney General. See “Recent Political Developments.”
| | 1 | Until December 31, 2011, the President was entitled to conclude international treaties and agreements on behalf of Hungary; however, agreements that were legislative in character still required the prior consent of Parliament. |
Members of Parliament are elected by popular vote for four-year terms. Elections are held using a combination of individual constituency voting (the candidate receiving the most votes in a particular district being elected from that district) and proportional voting (parties receiving at least 5% of the popular vote proportionally divide a fixed number of seats). Hungary last held Parliamentary elections in April 2018. The next Parliamentary elections are scheduled to be held in 2022. See “Recent Parliamentary Elections.”
On April 16, 2012, Parliament adopted the Act on Parliament, which changed the operation of Parliament, the rules of Parliamentary Members’ remuneration and the rules regarding conflicts of interest.
On April 8, 2013, Parliament adopted the Election Procedures Act, which eliminated pre-registration rules that had been ruled unconstitutional. In accordance with a decision of the Constitutional Court, Hungarian residents may participate in elections without prior registration, and non-resident citizens may apply to vote via mail, internet customer portal, or the official elections website; as a result, these citizens were able to enter the electoral roll as of August 1, 2013. The new Election Procedures Act eliminated certain restrictions on political advertising and the prohibition of the publication of poll numbers on and before the election day. The parliamentary elections in 2014 and 2018 were governed by this new Act.
In April 2014 and April 2018, pursuant to the Act on the Elections of Members of Parliament of Hungary, the 199 Members of Parliament were elected by general, equal, secret and direct ballot. The system is a mixed and one-round election system.
Judiciary
The Hungarian judiciary consists of the Curia (prior to January 1, 2012, known as the Supreme Court), the county tribunals (prior to January 1, 2012, known as the county courts), the Metropolitan Tribunal of Budapest (prior to January 1, 2012, known as the Metropolitan Court of Budapest), the district courts (prior to January 1, 2013, known as the local courts) and the labor courts. Legislation may provide for special courts to be convened for certain types of cases. Five Courts of Appeal located in Budapest, Pécs, Szeged, Debrecen and Győr have regional jurisdiction. As of January 1, 2012, new special courts were established for public administration cases. The Curia sets guidelines for the judicial process of every court. Resolutions concerning uniformity are binding on all courts. Judges are independent and are subordinate only to the law. District courts have original jurisdiction. The Courts of Appeal, the county tribunals and the Metropolitan Tribunal of Budapest have both original and appellate jurisdiction. The President of Hungary nominates, and Parliament elects, the President of the Curia. The President of the Curia nominates, and the President of Hungary appoints, the Vice-Presidents of the Curia. The President of Hungary also appoints and removes professional (non-arbitration) judges. The President of Hungary may only remove professional judges by following the causes and procedures prescribed by law.
The Constitutional Court is separate from the regular Hungarian judiciary. It decides the constitutionality of legislation and other actions as set forth in the Hungarian Constitution. The Constitutional Court may annul any law or legal measure that it determines to be unconstitutional. Any person may initiate proceedings in the Constitutional Court to address issues within its jurisdiction. The New Constitution includes changes to the main responsibilities of the Constitutional Court. The New Constitution entitles the Constitutional Court to annul a legal rule or a single judgment or to apply other specific legal consequences set forth by Cardinal Act only if such legal rule or judgment is contrary to the Constitution or an international agreement of Hungary. The New Constitution also increases the number of members on the Constitutional Court from 11 to 15 and the term of their mandates from nine years to 12 years. Members and the President of the Constitutional Court are elected by a two-thirds majority of the Members of Parliament, and Members of the Constitutional Court may not be re-elected. In June 2011, Parliament elected four new members of the Constitutional Court, who filled their positions on September 1, 2011.
Legislation facilitating and regulating the market economy is relatively new. Consequently, Hungarian courts are generally less experienced than their Western European counterparts in areas such as securities, banking and commercial law. Parties often refer disputes relating to such matters to the court of arbitration attached to the Hungarian Chamber of Commerce and Industry or other arbitration forums.
On February 11, 2013, Parliament adopted the Act on the New Civil Code (the “New Civil Code”), which went into effect on March 15, 2014. The New Civil Code abolished Act No. 4 of 1959 on the Civil Code (the “Old Civil Code”) and introduced major changes to the Old Civil Code, such as broadening its scope to include family law and company law, which previously were regulated by separate Acts. Furthermore, some new types of contracts are specified and regulated by the New Civil Code, such as intermediary (agency) contracts, trust asset management contracts, distribution contracts, franchise contracts, factoring contracts and financial lease contracts.
Several transitional provisions govern legal relationships under the Old Civil Code. For example, any legal fact or legal relationship arising or declared after March 15, 2014 (the “Effective Date”) is governed by the New Civil Code. However, for contracts and other engagements concluded before the Effective Date, the Old Civil Code continues to govern any legal fact or legal relationship arising or declared under such contracts or engagements, including those that take place after the Effective Date.
As of the Effective Date, several other Acts took effect in accordance with new institutions introduced by the New Civil Code, including the Act on Asset Managers of Trusts and Rules of Their Activities, an Act that regulates collective investment forms and their managers and an Act that governs registration of collateral or security interests.
On November 22, 2016, Parliament adopted the Act on the New Code of Civil Procedure, which went into effect on January 1, 2018. The New Code of Civil Procedure sought to modernize and professionalize litigation. Accordingly, the New Code of Civil Procedure introduces mandatory legal representation, except in some cases tried before local courts where litigants without legal representation will be aided by the use of standard forms and templates and more active judges. To promote the timely resolution of disputes and prevent parties from unduly delaying proceedings, the New Code of Civil Procedure introduces a “split” litigation structure, consisting of (i) the pre-trial phase and (ii) the trial on the merits. This structure is inspired by Roman law, where civil proceedings were conducted in two parts (“in iure” and “apud iudicem”).
Parliamentary Commissioners
On July 11, 2011, Parliament adopted the Act on the Commissioner for Fundamental Rights in compliance with the New Constitution. The Commissioner for Fundamental Rights and his two deputies replaced the former system, in which four Parliamentary Commissioners were primarily tasked with defending the public’s rights vis-à-vis the public administration. The Commissioner and his deputies are not Members of Parliament and are elected by a two-thirds majority of the Members of Parliament for a term of six years. One of the deputies is responsible for safeguarding the constitutional rights and interests of future generations, while the other deputy is responsible for safeguarding the rights of minorities living in Hungary. The Commissioner for Fundamental Rights has broader responsibility than the former Parliamentary Commissioners and may conduct special proceedings against organizations that are not public bodies (e.g., companies, banks, and social organizations) upon a complaint that such organization seriously violates a fundamental right of a large number of natural persons.
On July 11, 2011, Parliament also adopted the Act on Informational Self-Determination and Freedom of Information. Pursuant to this Act, a new independent authority was established on January 1, 2012: the National Agency for Data Protection and Freedom of Information, which replaced the Data Protection Commissioner’s Office. This Agency is responsible for supervision and facilitation of the enforcement of data protection rights and freedom of information in Hungary, including maintenance of the Data Protection Register and provision of opinions on related legislative proposals and categories of official secrets.
Local Government
Hungary is divided into administrative units, which include the capital (Budapest), counties, cities, towns and villages. Local governments are autonomous, manage local affairs democratically and may set the rates of certain limited local taxes. The Hungarian Constitution grants all local authorities the same fundamental rights; however, the duties and responsibilities of local governments may differ according to national and local legislation. Local governments consist of representative bodies, whose members are elected to five-year terms. Decisions of local authorities may only be revised if they conflict with the Constitution or national legislation. Local government elections were last held on October 13, 2019. See “Local Government Elections.”
On December 19, 2011, the Act on Local Governments of Hungary was adopted by Parliament. Under this Act, which took effect on January 1, 2012, the Government is entitled to supervise local governments through the metropolitan and county government agencies in order to control their lawful operation. The Act introduced certain restrictions relating to debt management of local governments – such as the conclusion of credit or loan agreements and issuance of local government bonds – and required that each funding transaction be approved by the Government. The annual incurrence of debt by local governments is limited to 50% of the revenues of the local government. Such rules of local government debt management have been applicable since the planning and implementation of local government budgets for calendar year 2013.
Recent Parliamentary Elections
Hungary held Parliamentary elections in April 2018. Nominees of the following parties gained mandates: the electoral partnership pairing Fidesz-Hungarian Civic Union (“Fidesz”) and the Christian Democrats People’s Party (“CDPP”), Jobbik – Movement for a Better Hungary (“Jobbik”), HSP, Democratic Coalition (“DK”), LMP – Politics Can Be Different (“LMP”) and Együtt (“Együtt”). In addition to one independent representative, one representative of Country Self-Governance of Germans in Hungary (Landesselbsverwaltung der Ungarndeutschen – “LdU”) gained mandates. Fidesz and CDPP formed an alliance before the elections and submitted a joint list of nominees. The following table sets forth the results of the 2018 Parliamentary elections as published by the Hungarian National Election Office (the “NEO”):
Table 5: Results of 2018 Parliamentary Elections
| | | Number of
seats | | | Share of
seats | |
| | | | | | (%) | |
| Fidesz - CDPP | | | 133 | | | | 66.8 | |
| Jobbik | | | 26 | | | | 13.1 | |
| HSP | | | 20 | | | | 10.1 | |
| DK | | | 9 | | | | 4.5 | |
| LMP | | | 8 | | | | 4.0 | |
| Együtt | | | 1 | | | | 0.5 | |
| LdU | | | 1 | | | | 0.5 | |
| Independent Representatives | | | 1 | | | | 0.5 | |
| Total | | | 199 | | | | 100.00 | |
Source: NEO
Fidesz-CDPP obtained a majority of the Parliamentary seats in the 2018 elections. Fidesz-CDPP formed a government with a total of 133 of the 199 Parliamentary seats. Mr. Viktor Orbán was proposed by the President of Hungary and was re-elected by Parliament to serve as the Prime Minister.
Table 6: Composition of Parliament as of December 31, 2019
| | | Number of
seats | | | Share of
seats | |
| | | | | | (%) | |
| Fidesz | | | 116 | | | | 58.9 | |
| CDPP | | | 17 | | | | 8.6 | |
| Jobbik | | | 21 | | | | 10.7 | |
| HSP | | | 15 | | | | 7.6 | |
| DK | | | 8 | | | | 4.1 | |
| LMP | | | 6 | | | | 3.0 | |
| Párbeszéd | | | 5 | | | | 2.5 | |
| LdU | | | 1 | | | | 0.5 | |
| Independent Representatives | | | 8 | | | | 4.1 | |
| Total | | | 197 | (1) | | | 100.00 | |
Source: Parliament of Hungary
Note: —
| (1) | On October 28, 2019 Tamás Pintér, a member of the Jobbik faction forfeited his mandate. On December 31, 2019, Zsolt Gréczy, a member of the DK faction forfeited his mandate. As of December 31, 2019 they had not yet been replaced. |
Table 7: Composition of Parliament as of September 23, 2020
| | | Number of
seats | | | Share of
seats | |
| | | | | | (%) | |
| Fidesz(1) | | | 115 | | | | 58.1 | |
| CDPP | | | 17 | | | | 8.6 | |
| Jobbik | | | 17 | | | | 8.6 | |
| HSP | | | 15 | | | | 7.6 | |
| DK | | | 9 | | | | 4.5 | |
| LMP | | | 6 | | | | 3.0 | |
| Párbeszéd | | | 5 | | | | 2.5 | |
| LdU | | | 1 | | | | 0.5 | |
| Independent Representatives | | | 13 | | | | 6.6 | |
| Total | | | 198 | | | | 100.00 | |
Source: Parliament of Hungary
Note: —
| (1) | On July 10, 2020, Ferenc Koncz, a member of the Fidesz faction lost his mandate due to his death. As of September 23, 2020 he had not yet been replaced. |
Recent Political Developments
On October 2, 2016, a national referendum initiated by the Government was held in Hungary on mandatory quotas determined by the migrant resettlement plan of the European Union. The number of valid ballot papers did not reach the validity threshold of the referendum, however 98% of the valid ballot papers contained ‘No’ votes for the mandatory EU migrant quotas.
On September 6, 2017, the European Court of Justice dismissed the actions brought by Slovakia and Hungary against the European Council seeking to avoid accepting refugees under an EU-wide plan to relocate 160,000 refugees from Greece and Italy over two years. Hungary and Slovakia were seeking to have the plan annulled.
COVID-19
As a response to the COVID-19 outbreak, the Government, pursuant to the powers vested in it under Article 53 of the New Constitution, introduced a special legal order in Hungary by declaring a state of danger with effect from March 11, 2020, for an indefinite period (i.e. until further notice), appointing the Hungarian Prime Minister as responsible for preventing and mitigating the negative consequences caused by the COVID-19 pandemic. Pursuant to the New Constitution of Hungary, during a state of danger, the Government is entitled to suspend the application of certain laws or derogate from the provisions of certain laws by adopting executive decrees, and may take other extraordinary measures in accordance with, and subject to the limitations stipulated in, Act CXXVIII of 2011 on Disaster Management. The Government may terminate the state of danger when the circumstances giving rise to its declaration no longer apply.
As part of the Government's efforts to protect the safety and health of people in Hungary, the Government proposed, and on March 30, 2020, Parliament approved a new law (Act XII of 2020 on Protecting against the Coronavirus) (the "Authorization Act"). The Authorization Act became effective on March 31, 2020.
The Authorization Act extends such rights of the Government in order to "guarantee for Hungarian citizens the safety of life and health, personal safety, the safety of assets and legal certainty as well as the stability of the national economy." The measures taken by the Government must be necessary and proportionate and aimed at preventing, managing, and eliminating the human epidemic or for preventing and mitigating its harmful effects. The Government must inform Parliament or, in the absence thereof, the speaker and the heads of the parliamentary groupings of the measures taken.
The Authorization Act extends the term of executive decrees adopted by the Government during the state of danger. According to the New Constitution, executive decrees shall cease to be effective within 15 days, except where the Government extends their term with the authorization of Parliament. Under the Authorization Act, Parliament has authorized the Government to extend the term of the executive decrees through the duration of the state of danger; however, such authorization may be withdrawn at any time. Executive decrees adopted during the state of danger become ineffective upon the termination of the state of danger.
The New Constitution guarantees that the democratic functioning of Hungary may not be suspended during a state of danger, the New Constitution may not be suspended or terminated and the special legal order may not affect the operation of the Constitutional Court. However, certain fundamental rights (except for the right to life and human dignity, right to integrity and right to fair trial) may be suspended or restricted. The Authorization Act introduced some further limitations, suspending any dissolution of municipal councils, and preventing midterm elections, national or local referenda from being held during the state of danger.
On March 31, 2020, the Government issued Government Decree No. 74/2020 on special rules in civil and administrative procedures. Litigation shall continue notwithstanding the state of danger and courts will hold hearings by videoconference or other technological means. These rules are applicable to all pending and newly initiated litigation from March 31, 2020 until the end of the state of danger.
Subsequently, on April 9, 2020, the Government announced the indefinite extension of restrictions on movement introduced due to the COVID-19 pandemic. The Government also granted mayors a special power, which enables them to create and introduce further special, restrictive regulations in relation to their own areas of governance for the duration of the Easter holidays. On April 17, 2020, the special power granted to mayors was extended for the coming weekend.
On April 23, 2020, the Government announced that the restrictive regulations imposed due to the coronavirus pandemic would remain in force until May 3, 2020.
On May 4, 2020, the Government announced that new rules would take effect in the country except for Budapest and Pest County. In Budapest and Pest County, the restrictions on movement would continue to remain in effect. In other counties, shops, the gardens and terraces of restaurants, outdoor bathing facilities, outdoor museums and zoos are allowed to stay open without restrictions. Subsequently, on May 18, 2020, the regulations regarding Budapest and Pest County were amended to be in line with the regulations applicable in the rest of the country.
On June 16, 2020, the Parliament adopted the law regarding the termination of the state of danger (Act LVII. of 2020) declared due to COVID-19 pandemic. On June 18, 2020, pursuant to Act LVII, the state of danger was terminated.
According to the assessment of the Monetary Council, the global COVID-19 pandemic poses extraordinary challenges to economies around the world. The macroeconomic data for the year 2020 are expected to show significant volatility and dichotomy. In the first half of 2020, growth slowed significantly, reflecting the negative economic effects of the pandemic. Domestic growth, the labor market, lending and foreign trade are expected to pick up again as the negative effects wane and lost economic activity is regained. See “Monetary and Financial System—Monetary Policy—Recent Developments in Monetary Policy” and “Public Finance—Recent Developments in Public Finance” for other measures taken by the Hungarian Government to ease the economic effects of the COVID-19 pandemic.
Local Government Elections
In localities with more than 10,000 inhabitants and in each district of Budapest, local representatives obtain seats in a mixed election system: in an individual constituency and from a compensatory list. Each voter may vote for only one individual constituency candidate. Each compensatory list is allocated a seat in proportion to the fragmentary votes received.
The Budapest Assembly, formed in October 2019, included the Lord Mayor, 23 district mayors and nine members elected from the Budapest compensatory list. The most recent local government election was held in October 2019. Mr. Gergely Karácsony, who was supported by DK, HSP, LMP, Momentum and Párbeszéd, became Lord Mayor of Budapest upon receiving a plurality of the votes (50.9% of all votes). Of the 23 seats for district mayors of Budapest, Fidesz-CDPP candidates won seven positions; candidates of DK, HSP, LMP, Momentum and Párbeszéd won 14 positions; and independent representatives won two positions. Of the nine seats from the compensatory list, Fidesz-CDPP gained six mandates and DK, HSP, LMP, Momentum and Párbeszéd gained three mandates.
The following table sets forth the composition of the Budapest Assembly following the October 2019 local government elections:
Table 8: Composition of Budapest Assembly (October 2019 results)
| | | District Mayors
and Lord Mayor | | | Compensatory
List | | | Total | |
| Fidesz-CDPP | | | 7 | | | | 6 | | | | 13 | |
| DK, HSP, LMP, Momentum and Párbeszéd | | | 15 | | | | 3 | | | | 18 | |
| Independent representatives | | | 2 | | | | 0 | | | | 2 | |
| Total | | | 24 | | | | 9 | | | | 33 | |
Source: NEO
There are 23 mayors of local capital cities in Hungary: 11 mayors were supported by Fidesz-CDPP, one mayor was supported by Fidesz, four mayors were backed by DK, HSP, LMP, Momentum and Párbeszéd and seven mayors were backed by other organizations.
There are 19 counties in Hungary. Fidesz-CDPP obtained at least a simple majority in every county assembly. The total number of representatives in the 19 county assemblies amounts to 381. The total number of representatives supported by Fidesz-CDPP is 245.
The next local government elections are scheduled to be held in late 2024.
European Parliament Elections
The first elections of Hungarian members to the European Parliament were held on June 13, 2004. The second elections of Hungarian members to the European Parliament were held on June 7, 2009. The third elections of Hungarian members to the European Parliament were held on May 25, 2014. The fourth elections of Hungarian members to the European Parliament were held on May 26, 2019. The following table shows the political affiliations of the Hungarian members of the European Parliament after the fourth elections:
Table 9: Seats in European Parliament of Hungarian Political Parties
| | | Seat | |
| Fidesz-CDPP | | | 13 | |
| Democratic Coalition | | | 4 | |
| Momentum | | | 2 | |
| HSP - Párbeszéd | | | 1 | |
| Jobbik | | | 1 | |
Source: European Parliament
International Relations
Hungary has undertaken an active foreign policy designed to further its integration into the world community and to foster regional peace and economic development. Hungary joined the United Nations organization (the “UN”) in 1955 and is a member of many of its specialized agencies, such as UNESCO, FAO, UNIDO, WHO and WTO (as defined below). In 1996, Hungary became a member of the Organization for Economic Co-operation and Development (the “OECD”), which was a decisive step towards integrating with developed nations and obtaining full EU membership. In 1999, Hungary became a full member of the North Atlantic Treaty Organization (“NATO”). Hungary maintains diplomatic relations with approximately 165 countries and is a member of a number of international organizations in addition to the UN, OECD, NATO and the EU, including the Global Environment Protection Fund, World Trade Organization (“WTO”), the International Bank for Reconstruction and Development (the “IBRD” or the “World Bank”), the Organization for Security and Co-operation in Europe, the IMF, the Council of Europe, the International Finance Corporation (“IFC”), the Central European Free Trade Agreement (“CEFTA”), the International Development Agency (“IDA”), the Food and Agriculture Organization (“FAO”), the World Health Organization (“WHO”), the European Bank for Reconstruction and Development (“EBRD”), the United Nations Educational Scientific and Cultural Organization (“UNESCO”), the United Nations Industrial Development Organization (“UNIDO”), the European Investment Bank (“EIB”) and the Council of Europe Development Bank (“CEB”). Hungary is also a member of the Central European Initiative, whose membership also consists of Austria, Croatia, the Czech Republic, Italy, Poland, Slovakia and Slovenia. The Central European Initiative addresses mainly issues of regional infrastructure development. Hungary has been a member of the Organization for Security and Co-operation in Europe (formerly referred to as the Conference on Security and Co-operation in Europe) since its formation in 1975 and was admitted to the Council of Europe in 1990.
European Union
Hungary joined the EU on May 1, 2004. After the EU parliamentary elections in 2019, the Hungarian representatives of the European Parliament assumed the following positions in July 2019: Lívia Járóka (Fidesz-CDPP) and Klára Dobrev (DK) became vice-presidents of the European Parliament; Tamás Deutsch (Fidesz-CDPP) became vice-chairman for the Committee on Budgetary Control; Kinga Gál (Fidesz-CDPP) became vice-chairperson for the Committee on Security and Defense; István Ujhelyi (HSP) became vice-chairman for the Committee on Transport and Tourism. In August 2019, the following Hungarian representative assumed the following position: Andrea Bocskor (Fidesz-CDPP) became vice-chairwoman for the Committee on Culture and Education.
Hungary is entitled to designate one member to the European Commission. The current Hungarian designee to the European Commission is Mr. Olivér Várhelyi, who assumed the position of Commissioner for Neighborhood and Enlargement on December 1, 2019.
Alongside the development of key areas of the economy, Hungary has implemented and intends to continue implementing development programs and structural reforms to accelerate the convergence process with the EU. The key program is the New Széchenyi Plan. The financial flows between Hungary and the EU from 2015 to 2019 are discussed under “Public Finance—EU Net Position.”
On July 28, 2010, the Government unveiled a consultative paper on the new Széchenyi Plan, which aimed to revive the Hungarian economy, implement the objectives of the Program of National Cooperation and replace the New Development Plan. The Government focused on two major areas: reducing unemployment and increasing the competitiveness of Hungarian businesses. The scheme, based on European Union funding, guarantees significantly more support for Hungarian small and medium enterprises (“SMEs”) than previously has been available. With this support scheme tailored to private businesses, the core objective of the new Széchenyi Plan is to create one million new jobs in 10 years.
The new Széchenyi Plan launched on January 15, 2011. At the heart of the program are the seven priority areas identified in the consultative paper, which collectively form the foundation of a long-term strategic plan in parallel with the Government’s short-term crisis management program.
The seven main areas of the new Széchenyi Plan are the following:
| | (1) | the health industry (e.g., remedial and preventive healthcare, rehabilitation, R&D, biotechnology, medical equipment manufacturing and spas); |
| | (2) | the green economy (e.g., renewables, geothermal energy, and biotech R&D); |
| | (3) | a home-building program; |
| | (4) | development of the business environment (stable economic, business and tax environment); |
| | (5) | science and innovation (aiming for R&D spending to reach 1.5% of gross domestic product (“GDP”) by 2015); |
| | (6) | employment (job creation and increased employment and productivity); and |
| | (7) | the economy of transport and logistics. |
By entering the EU, Hungary also became a member of the European Investment Bank.
Hungary plans to become a member of the European Monetary Union in accordance with the Maastricht Treaty. For information about Hungary’s strategy with respect to participation in the Exchange Rate Mechanism and the adoption of the Euro, see “Public Finance—Medium-Term Fiscal Program and the Convergence Program.”
On April 26, 2017, the Commission launched an infringement procedure against Hungary over amendments to the higher education law approved by the Hungarian Parliament in early April. Such amendments require foreign colleges and universities to operate in Hungary on the basis of an intergovernmental agreement with, and to have a main campus in, the foreign country in which they are founded. The Central European University is the primarily affected institution, as it has an accreditation both in the United States of America and in Hungary but, has no campus in the United States. The Commission’s concerns are that the regulation does not comply with the freedom to provide services and the freedom of establishment, and also that it is against the right of academic freedom. On November 11, 2017, Hungary informed the Commission that the deadline for fulfilling the new requirements under the Higher Education Act has been extended by one year. Foreign higher education institutions must therefore meet the new conditions by January 1, 2019. On December 7, 2017, the European Commission decided to refer Hungary to the Court of Justice of the EU. The hearing took place on June 24, 2019, during which the Hungarian Government disputed that the legislation is contrary to the freedom to provide services or fundamental freedoms. The opinion of the Advocate General (AG) was delivered on March 5, 2020, in which the AG concluded that Hungary infringed Article XVII of the General Agreement on Trade in Services - namely that foreign and domestic service providers must be treated equally. Judgement in the case is expected to be delivered on October 6, 2020.
On June 14, 2017, the Commission announced an infringement procedure against Hungary (as well as the Czech Republic and Poland) for non-compliance with its obligations under the 2015 Council Decisions on relocation, in which Member States committed to relocate persons in need of international protection from Italy and Greece. Hungary has not taken any action (not made pledges and not relocated any person) under the relocation scheme. Even before the infringement procedure, in 2015 the Hungarian Government had questioned the validity of the Council Decision before the Court of Justice. When the Commission initiated the infringement procedure, the court case on the validity of the Council Decision was still pending. Though the Court of Justice ruled in September 2017 that the Council Decision is valid, the Hungarian Government disputed the applicability of the Decision. On December 7, 2017, the Commission decided to refer Hungary (as well as the Czech Republic and Poland) to the Court of Justice of the EU for non-compliance with their legal obligations on relocation. The hearing took place on May 15, 2019, and the Court’s judgement was delivered on April 2, 2020, in which the Court ruled that by refusing to comply with the temporary mechanism for the relocation of applicants for international protection, Poland, Hungary and the Czech Republic failed to fulfil their obligations under European Union law. The obligations under the 2015 Council Decisions on relocation have since expired.
On July 13, 2017, the Commission launched an infringement procedure against Hungary for the new law on foreign funded non-governmental organizations adopted by the Hungarian Parliament on June 13, 2017 (the “NGO Law”). The NGO Law introduces new obligations for certain categories of non-governmental organizations (“NGOs”) receiving annual foreign funding above HUF7.2 million (approx. EUR23,000): to register and label themselves in all their publications, websites and press material as “organizations supported from abroad”, and to report specific information about the funding they receive from abroad to the Hungarian authorities. These organizations face sanctions if they fail to comply with the new reporting and transparency obligations. The Commission concluded that these rules breach EU law, in particular the right of freedom of association, the free movement of capital and the right to protection of private life and of personal data. Hungary sent its official response to the Commission on August 14, 2017. The Commission concluded that its concerns had not been addressed and accordingly issued a reasoned opinion on October 4, 2017. On December 7, 2017, the Commission referred Hungary to the Court of Justice of the EU in connection with its NGO Law. The Hungarian Government disputed that the legislation was contrary to EU law, including the freedom of capital movement or any fundamental freedoms. The Hungarian Government stressed the legitimate aim of the legislation, which is the transparency of foreign donations and organizations funded from abroad, as well as the proportionality of the measures. The opinion of the Advocate General (AG) was delivered on January 14, 2020, in which the AG deemed that the Hungarian legislation unduly restricts the free movement of capital, while some provisions of the new law also amount to an unjustified interference with several fundamental rights protected in the Charter of Fundamental Rights of the European Union. The Judgement of the Court was delivered on June 18, 2020, stating that Hungary’s adoption of the NGO Law, and the resulting obligations for NGOs, constitute discriminatory and unjustified restrictions on foreign donations to civil society organizations, in breach of the Charter of Fundamental Rights of the European Union. The Hungarian Government has started to elaborate a legal solution in order to comply with the judgement.
On May 17, 2018, the EU sent letters of formal notice to Hungary (as well as eight other EU member states) for failing to correctly transpose into domestic law certain requirements of the Spent Fuel and Radioactive Waste Directive. In its response to the formal notice, submitted in July 2018, the Hungarian Government argued that the legal provisions challenged by the Commission are understood and were implemented exactly in the same way as in the Spent Fuel and Radioactive Waste Directive. The Commission has yet to provide a formal response. In the course of the procedure, several discussions were carried out between the Commission’s and the Hungarian Government’s experts over the implementation of the two definitions in question, and the Commission accepted the explanation of the Hungarian authorities. Nevertheless the Government undertook to amend the relevant legislation in order to create a more precise formulation of the definition. The draft legislation has been sent to the Commission for approval.
On May 17, 2018, the Commission also decided to send a reasoned opinion to Hungary for granting an exemption from the public health tax to fruit distillates, such as the national drink ‘pálinka’, as well as to herbal drinks where national production is dominant. Although the Hungarian Government is of the view that the Hungarian exempting provision is justifiable on the ground of public health, and therefore it should be treated as a non-discriminatory measure, in order to avoid further steps taken by the Commission, the Parliament amended the rules in July 2018. According to the amendment (Act XLI of 2018), ‘pálinka’ will no longer be exempted from the taxation rules. The new provision will be applicable starting January 1, 2019. The case was closed on April 11, 2019.
On July 18, 2018, the Commission decided to refer Hungary to the Court of Justice of the EU for non-compliance of Hungary’s asylum and return legislation with EU law. The Commission also decided to send a letter of formal notice to Hungary concerning new Hungarian legislation which criminalizes activities that support asylum and residence applications and further restricts the right to request asylum. During the infringement procedure the Hungarian Government defended its legal provisions on asylum procedure and demonstrated why those provisions should be considered to be in compliance with the applicable Directives. The Commission did not accept these justifications and decided to refer the case to the Court of Justice.2 The action itself, however, has not yet been submitted the Court of Justice. On January 24, 2019, the Commission decided to send a reasoned opinion to Hungary concerning legislation that criminalizes activities that support asylum and residence applications and further restricts the right to request asylum. Hungary sent its official response (supported by two decisions of the Hungarian Constitutional Court) to the Commission maintaining its position that EU law has not been breached and on July 25, 2019, the Commission referred Hungary to the Court of Justice of the EU for non-compliance of its asylum and return legislation with EU law. The case is currently pending. The hearing and the delivery of the opinion of the Advocate General are expected to take place in the second half of 2020.
On July 25, 2019, the Commission also sent a letter of formal notice to Hungary concerning the situation of persons in the Hungarian transit zones at the border with Serbia. On October 10, 2019, the Commission sent a reasoned opinion maintaining its allegations. The Hungarian Government, relying on the Judgement of the ECHR in case ‘Ilias and Ahmed’, in its reply argued that the situation in the transit zones cannot be considered “detention”. On May 14, 2020, the Court of Justice of the EU ruled that keeping asylum seekers in the transit zone constitutes “detention”. The Hungarian Government has decided to close down its transit zones on the Hungarian-Serbian border.
On July 25, 2019, the Commission referred Hungary to the Court of Justice of the EU for excluding non-EU nationals with long-term resident status from exercising the veterinary profession. The case is currently pending. Nevertheless, on April 14, 2020, the Hungarian Government submitted an amendment to the Parliament in order to allow third country nationals with long-term resident status to be members of the Chamber of Veterinaries. The amendment has not yet been adopted.
Legal Proceedings
On July 22, 2019, the SEC issued an order instituting cease-and-desist proceedings against certain subsidiaries of Microsoft Corporation, including its subsidiary in Hungary, for violations of the books and records and internal accounting controls provisions of the Foreign Corrupt Practices Act of 1977 (the “FCPA”). According to the SEC's order, Microsoft's subsidiary in Hungary, among others, provided discounts on software licenses to its resellers, distributors and other third parties. Instead of passing on the discounts to Microsoft's government customers, the discounts were allegedly used to fund improper payments intended for foreign government officials to secure software license sales for Microsoft. On July 22, 2019, the Microsoft entities involved reached a resolution of the matter with the SEC and the U.S. Department of Justice. The Hungarian public prosecution service announced on August 23, 2019 that it launched an investigation into allegations of fraud against certain unidentified parties in connection with the FCPA violations. The investigation is still ongoing.
2 There are ongoing discussions in the European Union regarding the rule of law in Hungary, which are of a political nature, and the European Parliament passed a resolution to launch Article 7 procedures under the EU Treaty on September 12, 2018. The Hungarian Government maintains that none of the statements included in the resolution, individually or in their entirety, substantiate that there would be a risk of a breach by Hungary of the values on which the European Union is founded. The eventual proceedings are not expected to have any direct implications on the economic situation of Hungary.
THE ECONOMY
Background
The Hungarian economy has undergone a radical transformation since the fall of communism in 1989. As with other post-communist countries in the region, the Hungarian economy during the last thirty years can be characterized by economic dislocation at the beginning of the 1990s, with gradual improvement as reforms were implemented. The highlights of these economic reforms and trends include:
| | (1) | An ambitious privatization program – the vast majority of Hungary’s large state-owned enterprises have been privatized. See “Privatization”; |
| | (2) | A shift in exports from countries formerly participating in the Council for Mutual Economic Assistance (“COMECON”) to those of Western Europe and other industrialized countries. Currently, approximately three-quarters of Hungarian exports are to EU markets. See “Balance of Payments and Foreign Trade—Foreign Trade”; |
| | (3) | The ratios of gross and net external debt to GDP declined in the second half of the 1990s, but rose steadily from 2002 to 2009 before declining until 2014; in 2019, the gross and net external debt to GDP ratios reached 52.5% and 8.1%, respectively. Meanwhile, the ratio of public sector debt to GDP dropped from 72% in 1996 to 50.6% in 2001, but has increased since 2001, reaching 63.4% in 2019. See “National Debt”; |
| | (4) | According to data adjusted for calendar-day effect (i.e., the effect of a shift in the number of working days within the same given month or quarter), GDP grew by 3.8%, 2.1%, 4.5%, 5.1% and 4.9% in 2015, 2016, 2017, 2018 and 2019, respectively. GDP increased by 1.8% in the first quarter of 2020 and contracted by 13.6% in the second quarter of 2020. See “—Recent Economic Performance—Gross Domestic Product”; |
| | (5) | Inflation decreased dramatically from 28.3% at the end of 1995 to 2.3% as of April 2006, partly as a result of the reduction of the VAT rate. The price level dropped by 0.9% in December 2014 mainly as a result of lower energy and food prices and a significant drop in certain public administered prices. In December 2015, the inflation rate reached 0.9%, mainly as a result of increasing food prices and indirect tax hikes. During 2016, 2017, 2018 and 2019, the inflation rate increased gradually to 4.0% in December 2019, mainly due to increasing food price inflation and indirect tax hikes. In August 2020, the inflation rate decreased slightly to 3.9%. See “Recent Economic Performance—Inflation”; |
| | (6) | Foreign direct investment (the total amount of capital invested in Hungary from abroad) has generally increased since 1995, reaching EUR114.3 billion cumulatively, as of the end of the second quarter of 2020. During the first half of 2020, the balance of net direct investment amounted to a EUR835 million inflow, compared to a EUR362 million outflow during the corresponding period of 2019. See “Balance of Payments and Foreign Trade—Foreign Direct Investment”; and |
| | (7) | The general government deficit (according to ESA methodology) as a percentage of GDP reached 2.0% in 2015, decreased to 1.8% in 2016, increased to 2.5% in 2017, and decreased to 2.1% in 2018 and to 2.0% in 2019. |
| | (8) | The current account had a surplus from 2010 to 2018 and had a deficit in 2019. The surplus amounted to EUR2,648 million in 2015, EUR5,209 million in 2016, EUR2,490 million in 2017 and EUR377 million in 2018. The current account had a deficit in the amount of EUR363 million in 2019. |
Recent Economic Performance
The following table sets out certain macroeconomic statistics regarding Hungary for the periods indicated:
Table 10: Selected Macroeconomic Statistics
| | | For the year ended December 31, | | For the three- month period ended | |
| | | 2015 | | 2016 | | 2017 | | 2018 | | 2019(1) | | March 31,
2020(1) | | | June 30,
2020(1) | |
| Economic Data(2) | | | | | | | | | | | | | | | | | | | | | | | |
| Nominal GDP (HUF billions) | | | 34,785.2 | | | 35,896.3 | | | 38,835.2 | | | 42,661.8 | | | 46,786.7 | | | 10,810.6 | | | | 10,650.8 | |
| Real GDP (growth in %)(3) | | | 3.8 | | | 2.1 | | | 4.5 | | | 5.1 | | | 4.9 | | | 1.8 | | | | (13.6 | ) |
| Real exports (growth in %) | | | 7.4 | | | 3.8 | | | 6.9 | | | 4.3 | | | 6.0 | | | (0.5 | ) | | | (24.0 | ) |
| Real imports (growth in %) | | | 6.0 | | | 3.4 | | | 8.2 | | | 6.8 | | | 6.9 | | | 1.3 | | | | (15.8 | ) |
| Rate of unemployment (%) | | | 6.8 | | | 5.1 | | | 4.2 | | | 3.7 | | | 3.4 | | | 3.7 | | | | 4.6 | |
| Consumer prices (growth in %) | | | (0.1 | ) | | 0.4 | | | 2.4 | | | 2.8 | | | 3.4 | | | 4.3 | (4) | | | 3.4 | (5) |
| Producer prices (growth in %) | | | (0.9 | ) | | (1.7 | ) | | 3.3 | | | 5.5 | | | 2.1 | | | 4.0 | (4) | | | 3.4 | (5) |
| State Budget; Public and External Debt(6) | | | | | | | | | | | | | | | | | | | | | | | |
| State budget surplus/(deficit) (HUF billions) | | | (1,223.6 | ) | | (540.0 | ) | | (1,314.5 | ) | | (1,202.1 | ) | | (1,291.6 | ) | | (831.9 | )(9) | | | (1,837.0 | )(7) |
| as a % of GDP | | | (3.5 | ) | | (1.5 | ) | | (3.4 | ) | | (2.8 | ) | | (2.8 | ) | | n/a | | | | n/a | |
| Total revenues (HUF billions) | | | 16,231.8 | | | 16,405.1 | | | 17,348.1 | | | 18,455.6 | | | 19,670.1 | | | 5,290.7 | (9) | | | 10,684.5 | (7) |
| as a % of GDP | | | 46.7 | | | 45.7 | | | 44.7 | | | 43.3 | | | 42.0 | | | n/a | | | | n/a | |
| Public debt (HUF billions), unconsolidated | | | 24,699.7 | | | 25,430.0 | | | 26,746.2 | | | 28,688.2 | | | 29,682.0 | | | 30,386.8 | | | | 31,853.3 | |
| as a % of GDP | | | 71.0 | | | 70.8 | | | 68.9 | | | 67.2 | | | 63.4 | | | n/a | | | | n/a | |
| External public debt (HUF billions) | | | 7,735.8 | | | 6,256.5 | | | 5,782.5 | | | 5,724.8 | | | 5,121.2 | | | 4,786.1 | | | | 6,042.5 | |
| as a % of GDP | | | 22.2 | | | 17.4 | | | 14.9 | | | 13.4 | | | 10.9 | | | n/a | | | | n/a | |
| Balance of Payments Data(8) | | | | | | | | | | | | | | | | | | | | | | | |
| Current account (EUR billions) | | | 2.6 | | | 5.2 | | | 2.5 | | | 0.4 | | | (0.4 | ) | | 0.3 | | | | (0.8 | ) |
| as a % of GDP | | | 2.4 | | | 4.5 | | | 2.0 | | | 0.3 | | | (0.3 | ) | | n/a | | | | n/a | |
| Exports (EUR billions)(10) | | | 98.8 | | | 100.5 | | | 109.1 | | | 114.0 | | | 120.0 | | | 28.9 | | | | 22.2 | |
| Imports (EUR billions)(10) | | | 89.8 | | | 90.4 | | | 100.4 | | | 108.0 | | | 115.4 | | | 27.6 | | | | 22.4 | |
| NBH’s foreign exchange reserves (EUR billions) | | | 30.3 | | | 24.4 | | | 23.4 | | | 27.4 | | | 28.4 | | | 25.8 | | | | 30.2 | |
Sources: Hungarian Central Statistical Office, NBH, Ministry of Finance
Notes:—
| (2) | Derived from data published by the CSO. |
| (3) | Data adjusted for calendar-day effect. |
| (4) | Average data for the first three months of the year. |
| (5) | Average data for the first six months of the year. |
| (6) | Derived from the government budget as published by the Ministry of Finance, according to the GFS methodology. |
| (7) | Non-consolidated data excluding local governments, data for the first six months of 2019. |
| (8) | Derived from data published by the NBH. |
| (9) | Non-consolidated data excluding local governments, data for the first three months of 2019. |
| (10) | Including goods and services. |
Gross Domestic Product
The following table presents the nominal GDP at current market prices, as well as real GDP growth rates, per capita GDP and USD equivalents for the periods indicated:
Table 11: Gross Domestic Product
| | | For the year ended December 31, | | | For the six
months
ended
June 30, | |
| | | 2015 | | | 2016 | | | 2017 | | | 2018 | | | 2019(1) | | | 2020(1) | |
| Nominal GDP (billions) | | | 34,785.2 | | | | 35,896.3 | | | | 38,835.2 | | | | 42,661.8 | | | | 46,786.7 | | | | 21,461.4 | |
| Annual real GDP growth rate (%)(2) | | | 3.8 | | | | 2.1 | | | | 4.5 | | | | 5.1 | | | | 4.9 | | | | (6.3 | ) |
| Per capita GDP | | | 3,533,994 | | | | 3,657,657 | | | | 3,967,650 | | | | 4,364,127 | | | | 4,787,464 | | | | 2,196,765 | (3) |
| | | | | | | | | | | | | | | | | | | | | | | | | |
| GDP (USD billions) | | | 124.5 | | | | 127.5 | | | | 141.6 | | | | 157.9 | | | | 161.0 | | | | 68.5 | (4) |
| Per capita GDP (USD) | | | 12,646 | | | | 12,996 | | | | 14,466 | | | | 16,148 | | | | 16,472 | | | | 7,012 | (3)(4) |
Source: CSO
Notes:—
| (2) | Data adjusted for calendar-day effect. |
| (3) | Calculated according to population as of the beginning of the corresponding year. |
| (4) | Calculated according to the average HUF/USD exchange rate of the corresponding period calculated by the NBH. |
In 2015, GDP increased by 3.8% mainly as a result of growing consumption and investments. In 2016, the GDP growth rate decelerated to 2.1%, mainly as a result of falling investments partially offsetting the effect of growing consumption and strong external demand. In 2017, the GDP growth rate accelerated to 4.5% mainly as a result of growing consumption and increased investments. In 2018, the GDP growth rate accelerated to 5.1% mainly as a result of growing consumption and increased investments. In 2019, the GDP growth rate decreased slightly to 4.9% mainly as a result of a deceleration in investment dynamics.
In 2019, GDP increased by 4.9% according to data not adjusted for calendar-day effect. Value added by the agricultural industry declined slightly as a result of less favorable weather conditions as compared to 2018, with the sector decreasing by 0.3%. As external demand strengthened, value added by the industrial sector (i.e., manufacturing, mining and quarrying and electricity) increased by 5.0%. Construction grew by 21.4% as infrastructure investments and home building activities strengthened. Value added by the services sector grew by 4.2%. The unemployment rate was low; as a result, domestic demand was strong.
In 2019, domestic use grew by 5.6% and consumption increased by 4.1%. Gross fixed capital formation grew by 15.3%. Gross capital formation increased by 9.5%. Positive but declining net exports decreased the 5.6% growth of domestic use to a 4.9% increase of GDP. Exports grew by 6.0% and imports grew by 6.9%. The dynamics of imports exceeding that of exports was due to buoyant investment activity, rising consumption and strong external demand.
In the first half of 2020, GDP decreased by 6.1% according to data not adjusted for calendar-day effect. Value added by the agricultural sector decreased because weather conditions deteriorated, with the sector declining by 1.5%. Value added by the industrial sector (i.e., manufacturing, mining and quarrying and electricity) decreased by 9.6%. Construction decreased by 6.8%. The value added by the service sector increased by 5.2%. The ongoing pandemic significantly weakened both external and internal demand.
In the first half of 2020, domestic use decreased by 1.3% and consumption declined by 1.4%. Gross fixed capital formation fell by 9.2%, partially as a result of the national and global effects of the COVID-19 pandemic. Gross capital formation decreased by 0.8%. The 6.1% decrease of total GDP was due mainly to the decrease in net exports and domestic use. Exports declined by 22.4%, and imports decreased by 7.4%.
The following table shows the sectoral composition of GDP in each of the periods indicated:
Table 12: Sectoral Composition of GDP
| | | For the year ended December 31, | | | For the six
months
ended
June 30, | |
| | | 2015 | | | 2016 | | | 2017 | | | 2018 | | | 2019(1) | | | 2020(1) | |
| | | (percentage contribution) | |
| Agriculture, forestry and fishing | | | 3.8 | | | | 3.9 | | | | 3.8 | | | | 3.6 | | | | 3.5 | | | | 3.0 | |
| Mining and quarrying; manufacturing; electricity, gas, steam and air conditioning supply; water supply; sewerage, waste management and remediation activities | | | 22.9 | | | | 22.6 | | | | 22.0 | | | | 20.9 | | | | 20.4 | | | | 20.4 | |
| Of which: | | | | | | | | | | | | | | | | | | | | | | | | |
| Manufacturing | | | 20.3 | | | | 19.8 | | | | 19.5 | | | | 18.6 | | | | 18.2 | | | | 18.1 | |
| Construction | | | 3.6 | | | | 3.0 | | | | 3.6 | | | | 4.5 | | | | 5.5 | | | | 4.6 | |
| Services, total | | | 53.9 | | | | 55.1 | | | | 55.2 | | | | 55.5 | | | | 55.3 | | | | 56.7 | |
| Wholesale and retail trade; repair of motor vehicles and motorcycles; accommodation and food service activities | | | 10.2 | | | | 10.0 | | | | 10.2 | | | | 10.9 | | | | 11.3 | | | | 10.5 | |
| Transportation and storage | | | 5.5 | | | | 5.6 | | | | 5.3 | | | | 5.1 | | | | 5.1 | | | | 4.6 | |
| Information and communication | | | 4.1 | | | | 4.2 | | | | 4.2 | | | | 4.2 | | | | 4.1 | | | | 4.4 | |
| Financial and insurance activities | | | 3.0 | | | | 3.0 | | | | 3.1 | | | | 3.0 | | | | 2.8 | | | | 3.2 | |
| Real estate activities | | | 6.7 | | | | 6.8 | | | | 6.8 | | | | 6.6 | | | | 6.7 | | | | 7.4 | |
| Professional, scientific and technical activities; administrative and support service activities | | | 7.7 | | | | 8.1 | | | | 8.4 | | | | 8.7 | | | | 8.8 | | | | 9.0 | |
| Public administration and defense; compulsory social security; education; human health and social work activities | | | 14.2 | | | | 15.0 | | | | 14.8 | | | | 14.4 | | | | 14.0 | | | | 15.4 | |
| Arts, entertainment and recreation, repair of household goods and other services | | | 2.4 | | | | 2.4 | | | | 2.5 | | | | 2.5 | | | | 2.4 | | | | 2.3 | |
| Taxes less subsidies on products | | | 15.9 | | | | 15.4 | | | | 15.4 | | | | 15.6 | | | | 15.3 | | | | 15.3 | |
| Gross domestic product, total (at purchaser’s prices) | | | 100.0 | | | | 100.0 | | | | 100.0 | | | | 100.0 | | | | 100.0 | | | | 100.0 | |
Source: CSO
Notes:—
The following table shows GDP expenditures at current prices in each of the periods indicated:
| | | For the year ended December 31, | | | For the six
months
ended
June 30, | |
| | | 2015 | | | 2016 | | | 2017 | | | 2018 | | | 2019(1) | | | 2020(1) | |
| | | (HUF billions) | |
| Household final consumption expenditure | | | 16,418.1 | | | | 17,253.1 | | | | 18,496.7 | | | | 19,970.4 | | | | 21,713.8 | | | | 10,652.5 | |
| Social transfers in kind from government | | | 3,468.3 | | | | 3,643.8 | | | | 3,971.0 | | | | 4,212.6 | | | | 4,513.7 | | | | 2,295.2 | |
| Social transfers in kind from NPISHs2 | | | 590.1 | | | | 623.5 | | | | 735.8 | | | | 806.1 | | | | 893.9 | | | | 480.6 | |
| Actual final consumption of households | | | 20,476.5 | | | | 21,520.4 | | | | 23,203.5 | | | | 24,989.0 | | | | 27,121.3 | | | | 13,428.3 | |
| Actual final consumption of government | | | 3,424.7 | | | | 3,583.4 | | | | 3,927.8 | | | | 4,191.9 | | | | 4,551.3 | | | | 2,341.3 | |
| Actual final consumption, total | | | 23,901.2 | | | | 25,103.9 | | | | 27,131.3 | | | | 29,180.9 | | | | 31,672.6 | | | | 15,769.5 | |
| Gross fixed capital formation | | | 7,749.7 | | | | 7,058.4 | | | | 8,631.6 | | | | 10,739.3 | | | | 13,381.4 | | | | 5,499.5 | |
| Changes in inventories | | | 309.6 | | | | 542.1 | | | | 171.6 | | | | 806.2 | | | | (59.3 | ) | | | (222.0 | ) |
| Acquisitions less disposals of valuables | | | 46.1 | | | | 51.8 | | | | 70.1 | | | | 69.5 | | | | 72.3 | | | | 37.9 | |
| Gross capital formation, total | | | 8,105.5 | | | | 7,652.3 | | | | 8,873.3 | | | | 11,615.0 | | | | 13,394.4 | | | | 5,315.4 | |
| Domestic use, total | | | 32,006.7 | | | | 32,756.1 | | | | 36,004.6 | | | | 40,795.8 | | | | 45,067.0 | | | | 21,085.0 | |
| Exports | | | | | | | | | | | | | | | | | | | | | | | | |
| Goods | | | 24,316.5 | | | | 24,471.2 | | | | 26,463.2 | | | | 28,260.5 | | | | 30,228.9 | | | | 14,240.1 | |
| Services | | | 6,287.3 | | | | 6,813.0 | | | | 7,379.0 | | | | 7,976.0 | | | | 8,757.6 | | | | 3,318.4 | |
| Total | | | 30,603.8 | | | | 31,284.3 | | | | 33,842.2 | | | | 36,236.5 | | | | 38,986.5 | | | | 17,558.9 | |
| Imports | | | | | | | | | | | | | | | | | | | | | | | | |
| Goods | | | 23,057.8 | | | | 23,238.8 | | | | 25,871.6 | | | | 28,796.8 | | | | 31,111.6 | | | | 14,583.9 | |
| Services | | | 4,767.5 | | | | 4,905.3 | | | | 5,139.9 | | | | 5,573.7 | | | | 6,155.2 | | | | 2,598.2 | |
| Total | | | 27,825.3 | | | | 28,144.1 | | | | 31,011.6 | | | | 34,370.5 | | | | 37,266.8 | | | | 17,182.1 | |
| Balance | | | | | | | | | | | | | | | | | | | | | | | | |
| Goods | | | 1,258.7 | | | | 1,232.5 | | | | 591.6 | | | | (536.3 | ) | | | (882.7 | ) | | | (343.8 | ) |
| Services | | | 1,519.8 | | | | 1,907.8 | | | | 2,239.1 | | | | 2,402.2 | | | | 2,602.4 | | | | 720.2 | |
| Total | | | 2,778.5 | | | | 3,140.2 | | | | 2,830.7 | | | | 1,866.0 | | | | 1,719.7 | | | | 376.4 | |
| Gross Domestic Product, Total | | | 34,785.2 | | | | 35,896.3 | | | | 38,835.2 | | | | 42,661.8 | | | | 46,786.7 | | | | 21,461.4 | |
Source: CSO
Note:-
| (1) | Preliminary data. |
| (2) | Non-profit institutions serving households. |
The following table shows the volume indices of GDP expenditures in each of the periods indicated:
| | | For the year ended December 31, | | | For the six
months
ended
June 30, | |
| | | 2015 | | | 2016 | | | 2017 | | | 2018 | | | 2019(1) | | | 2020(1) | |
| | | (Corresponding Period of the Previous Year = 100) | |
| Household final consumption expenditure | | | 103.7 | | | | 104.9 | | | | 104.4 | | | | 104.9 | | | | 105.0 | | | | 98.1 | |
| Social transfers in kind from government | | | 102.9 | | | | 101.1 | | | | 101.7 | | | | 99.9 | | | | 101.5 | | | | 94.9 | |
| Social transfers in kind from NPISHs | | | 106.8 | | | | 103.0 | | | | 114.5 | | | | 103.1 | | | | 105.3 | | | | 101.8 | |
| Actual final consumption of households | | | 103.7 | | | | 104.2 | | | | 104.2 | | | | 104.0 | | | | 104.4 | | | | 97.7 | |
| Actual final consumption of government | | | 101.1 | | | | 100.3 | | | | 103.2 | | | | 102.0 | | | | 102.0 | | | | 104.1 | |
| Actual final consumption, total | | | 103.3 | | | | 103.7 | | | | 104.1 | | | | 103.7 | | | | 104.1 | | | | 98.6 | |
| Gross fixed capital formation | | | 104.8 | | | | 89.4 | | | | 118.7 | | | | 117.1 | | | | 115.3 | | | | 90.8 | |
| Changes in inventories | | | n/a | | | | n/a | | | | n/a | | | | n/a | | | | n/a | | | | n/a | |
| Acquisitions less disposals of valuables | | | n/a | | | | n/a | | | | n/a | | | | n/a | | | | n/a | | | | n/a | |
| Gross capital formation, total | | | 99.8 | | | | 95.9 | | | | 109.0 | | | | 118.3 | | | | 109.5 | | | | 99.2 | |
| Domestic use, total | | | 102.4 | | | | 101.7 | | | | 105.2 | | | | 107.3 | | | | 105.6 | | | | 98.7 | |
| Exports | | | | | | | | | | | | | | | | | | | | | | | | |
| Goods | | | 107.0 | | | | 101.6 | | | | 106.5 | | | | 103.8 | | | | 105.2 | | | | 90.4 | |
| Services | | | 108.8 | | | | 112.1 | | | | 108.1 | | | | 106.4 | | | | 109.1 | | | | 77.2 | |
| Total | | | 107.4 | | | | 103.8 | | | | 106.9 | | | | 104.3 | | | | 106.0 | | | | 87.6 | |
| Imports | | | | | | | | | | | | | | | | | | | | | | | | |
| Goods | | | 105.4 | | | | 103.3 | | | | 109.3 | | | | 107.1 | | | | 106.8 | | | | 93.7 | |
| Services | | | 109.3 | | | | 103.7 | | | | 103.0 | | | | 105.4 | | | | 107.5 | | | | 87.2 | |
| Total | | | 106.0 | | | | 103.4 | | | | 108.2 | | | | 106.8 | | | | 106.9 | | | | 92.6 | |
| Balance | | | | | | | | | | | | | | | | | | | | | | | | |
| Goods | | | n/a | | | | n/a | | | | n/a | | | | n/a | | | | n/a | | | | n/a | |
| Services | | | n/a | | | | n/a | | | | n/a | | | | n/a | | | | n/a | | | | n/a | |
| Total | | | n/a | | | | n/a | | | | n/a | | | | n/a | | | | n/a | | | | n/a | |
| Gross Domestic Product, Total | | | 103.8 | | | | 102.2 | | | | 104.3 | | | | 105.1 | | | | 104.9 | | | | 93.9 | |
Source: CSO
Notes:-
Inflation
The following table illustrates the year-on-year change and the yearly average change in the Consumer Price Index (the “CPI”) and the Producer Price Index (the “PPI”) for each of the years indicated:
Table 13: Inflation: CPI & PPI
| | | For the year ended December 31, | |
| | | 2015 | | | 2016 | | | 2017 | | | 2018 | | | 2019 | |
| | | (%) | |
| CPI (yearly average) | | | (0.1 | ) | | | 0.4 | | | | 2.4 | | | | 2.8 | | | | 3.4 | |
| CPI (year-on-year) | | | 0.9 | | | | 1.8 | | | | 2.1 | | | | 2.7 | | | | 4.0 | |
| PPI (yearly average) | | | (0.9 | ) | | | (1.7 | ) | | | 3.3 | | | | 5.5 | | | | 2.1 | |
| PPI (year-on-year) | | | (1.3 | ) | | | 0.5 | | | | 3.9 | | | | 4.7 | | | | 2.4 | |
Source: CSO
Deregulation since 1990 has led to a high rate of inflation in Hungary. This rate was relatively high in the 1990s compared to rates in Western Europe due to the general phasing out of price supports and the high public sector deficit. However, the rate of inflation has generally been declining since the change in monetary regime in May 2001.
In December 2015, the CPI inflation rate reached 0.9% mainly as a result of increasing food prices and indirect tax hikes. In December 2016, the CPI inflation rate increased to 1.8% mainly as a result of phasing out of base effects. In December 2017, the CPI inflation rate increased to 2.1% mainly as a result of increasing energy and food prices. In December 2018, the CPI inflation rate increased to 2.7% mainly as a result of increasing food prices and indirect tax increases. In December 2019, the CPI inflation rate increased to 2.7% mainly as a result of increasing food prices and indirect tax increases.
Price Regulation
As of the end of 2019, approximately 85% of all prices in Hungary were unregulated. The main categories of products and services that continue to have regulated prices are: electricity, gas, purchased heating, various pharmaceutical products, meals at schools, kindergartens and nurseries, the state lottery, local and long-distance passenger transport, state-owned housing rent, various household utilities (including water and sewage charges and refuse collection services) and postal services.
In line with relevant EU Directives, Hungary intends to abolish regulated pricing schemes from the increasingly market-based energy and postal sectors. Deregulation of the energy sector began in July 2004 and the entire energy sector has since been deregulated, including the residential segment; however, if electricity is provided by a so-called universal service provider, retail electricity prices are capped by regulation. Under the current rules, the deadline for deregulation of the postal services was the end of 2012.
Wages
The following table sets forth year-on-year changes in nominal and real wages for the periods indicated:
Table 14: Wages
| | | For the year ended December 31, | | | For the six
months
ended
June 30, | |
| | | 2015 | | | 2016 | | | 2017 | | | 2018 | | | 2019 | | | 2020 | |
| | | (%) | |
| Nominal net wage index | | | 4.3 | | | | 7.8 | | | | 12.9 | | | | 11.3 | | | | 11.4 | | | | 9.9 | |
| Real net wage index | | | 4.4 | | | | 7.4 | | | | 10.3 | | | | 8.3 | | | | 7.7 | | | | 6.3 | |
Source: CSO
In 2015, net real wages grew by 4.4%, partly as a result of inflation decelerating to close to zero in 2015. In 2016, net real wages grew by 7.4% mainly as a result of rising nominal gross wages and a decrease in the personal income tax rate. In 2017, net real wages grew by 10.3% as nominal gross wages increased at a rate significantly exceeding the inflation rate. In 2018, net real wages grew by 8.3% mainly as a result of rising nominal gross wages. In 2019, net real wages grew by 7.7% mainly as a result of rising nominal gross wages. In the first six months of 2020, net real wages grew by 6.3% mainly as a result of rising nominal gross wages as CPI inflation was 3.4% in the first six months of 2020.
As with GDP growth, nominal and real wage changes have not been consistent across Hungary. Relatively stronger overall economic growth in western Hungary and a generally immobile labor force (due to a general reluctance to relocate to other parts of the country) have led to a substantial decrease in unemployment in western Hungary and disproportionately higher wage increases compared to the rest of Hungary. Hungary’s incentive policies (mainly consisting of the promotion of investment in less developed regions and the development of transportation infrastructure and human resources) and utilization of the Structural and Cohesion Funds of the EU are in part designed to increase employment levels in the eastern parts of the country.
On November 22, 2016, the Ministry of National Economy (“MNE”) announced that the minimum wage and the guaranteed minimum wage were set to rise by 15% and 25%, respectively, in 2017, while employer contributions would be cut by 5 percentage points. In 2018, the minimum wage and the guaranteed minimum wage were to increase by another 8% and 12%, respectively, while contributions would be reduced by 2 percentage points. In 2018, contributions were cut by another 0.5 percentage points. See “Public Finance – Health Care System”
Employment
The following table illustrates the general composition of employment and unemployment for each of the years indicated:
Table 15: Unemployment
| | | For the year ended December 31, | | | For the three-month period ended | |
| | | 2015 | | | 2016 | | | 2017 | | | 2018 | | | 2019 | | | March 31,
2020 | | | June 30,
2020 | |
| | | (annual average, %) | |
| Population aged 15–74 (thousands) | | | 7,538 | | | | 7,508 | | | | 7,460 | | | | 7,432 | | | | 7,419 | | | | 7,411 | | | | 7,410 | |
| Participation rate | | | 59.9 | | | | 61.1 | | | | 61.8 | | | | 62.5 | | | | 63.0 | | | | 62.6 | | | | 62.4 | |
| Employment rate | | | 55.9 | | | | 58.0 | | | | 59.3 | | | | 60.1 | | | | 60.8 | | | | 60.3 | | | | 59.5 | |
| Unemployment rate(1) | | | 6.8 | | | | 5.1 | | | | 4.2 | | | | 3.7 | | | | 3.4 | | | | 3.7 | | | | 4.6 | |
Source: CSO
Note:—
| (1) | Based on the international sampling methodology pursuant to the guidelines of the International Labor Organization. |
The unemployment rate in 2015 (calculated using the guidelines of the International Labor Organization) reached 6.8%. In 2016, the unemployment rate fell to 5.1%. In addition to improving economic performance, government measures aimed at reducing unemployment played a significant role in reducing the unemployment rate. In 2017, the unemployment rate fell to 4.2%. In 2018, the unemployment rate fell further to 3.7%. In 2019, the unemployment rate fell to 3.4%. The unemployment rate increased to 3.7% in the first quarter of 2020 and increased further to 4.6% in the second quarter of 2020 mainly as a result of the COVID-19 pandemic.
In previous years, the participation rate was generally lower, partly due to the low mobility of the workforce in Hungary. Economic development has generally not been uniform throughout Hungary since 1990, with a higher concentration of jobs in Budapest and the central region of Hungary. High commuting costs (in terms of both time and the financial burden) generally discourage potential employees from travelling to distant workplaces, while discrepancies in real estate prices and inadequate housing rental opportunities have discouraged the relocation of Hungary’s workforce. This trend has been decreasing, as new infrastructure investments (particularly Hungary’s highway construction projects) have brought new investment and job opportunities to less developed regions of Hungary, thereby increasing the activity rate. Furthermore, relatively high levels of taxation have led to the formation of a relatively large “grey economy,” with many employers avoiding adequate reporting of their activities (including with respect to hiring) in order to avoid paying taxes. Labor unions have not gained any significant influence in Hungary and to date have not caused any substantial work stoppages in Hungary.
Increasing the participation rate has been an important policy goal of the Government. The Government has also taken a number of steps to reduce the unemployment rate. Laws were passed, which took effect as of August 1, 2005, making it easier to employ part-time employees. Furthermore, the Government introduced several initiatives aimed at helping currently unemployed workers find employment, including job search assistance programs and adult vocational training programs. Lastly, the Government initiated the “START” program, which is aimed at helping first-time employees find employment. The START program provides, among other things, employer contribution discounts to employers hiring graduates under a certain age and certain other first-time employees.
On January 1, 2012, a public work program called the Start Work Program (Start Munkaprogram) was introduced. The Start Work Program is based on three pillars: (1) a national public work program; (2) local government public work programs; and (3) micro-regional pilot projects.
On July 1, 2012, the New Labor Code of Hungary went into effect, which contains the fundamental regulation of employment and provides a more flexible legal relationship between employers and employees.
The following table illustrates the general composition of employment in Hungary by major sector for each of the years indicated:
Table 16: Composition of Employment by Sector
| | | For the year ended December 31, | | | For the three months ended | |
| Sector | | 2015 | | | 2016 | | | 2017 | | | 2018 | | | 2019 | | | March 31,
2020 | | | June 30,
2020 | |
| | | (in thousands of persons) | |
| Agriculture, forestry and fishing | | | 203.2 | | | | 217.0 | | | | 220.0 | | | | 214.9 | | | | 210.7 | | | | 213.1 | | | | 210.6 | |
| Mining and quarrying | | | 9.1 | | | | 8.5 | | | | 9.2 | | | | 10.5 | | | | 11.5 | | | | 10.1 | | | | 9.1 | |
| Manufacturing | | | 901.7 | | | | 938.9 | | | | 987.9 | | | | 1,003.1 | | | | 996.6 | | | | 981.4 | | | | 984.5 | |
| Electricity, gas, steam and air conditioning supply | | | 34.1 | | | | 33.8 | | | | 34.3 | | | | 40.8 | | | | 34.5 | | | | 34.3 | | | | 37.8 | |
| Water supply, sewerage, waste management and remediation activities | | | 56.5 | | | | 60.0 | | | | 55.6 | | | | 58.9 | | | | 58.2 | | | | 53.5 | | | | 58.9 | |
| Construction | | | 271.9 | | | | 277.8 | | | | 302.9 | | | | 332.6 | | | | 343.3 | | | | 357.0 | | | | 351.0 | |
| Wholesale and retail trade; repair of motor vehicles and motorcycles | | | 539.4 | | | | 544.0 | | | | 550.5 | | | | 548.6 | | | | 570.0 | | | | 571.5 | | | | 551.6 | |
| Transportation and storage | | | 268.6 | | | | 277.1 | | | | 293.6 | | | | 289.2 | | | | 303.3 | | | | 289.4 | | | | 285.9 | |
| Accommodation and food service activities | | | 183.3 | | | | 192.8 | | | | 189.4 | | | | 180.1 | | | | 186.8 | | | | 185.5 | | | | 155.7 | |
| Information and communication | | | 102.6 | | | | 119.6 | | | | 109.9 | | | | 116.3 | | | | 132.5 | | | | 125.6 | | | | 144.7 | |
| Financial and insurance activities | | | 87.4 | | | | 95.0 | | | | 93.6 | | | | 90.0 | | | | 76.4 | | �� | | 80.6 | | | | 86.2 | |
| Real estate activities | | | 18.8 | | | | 21.7 | | | | 26.0 | | | | 26.3 | | | | 24.7 | | | | 22.1 | | | | 29.8 | |
| Professional, scientific and technical activities | | | 156.9 | | | | 151.6 | | | | 156.7 | | | | 153.0 | | | | 168.4 | | | | 177.9 | | | | 183.3 | |
| Administrative and support service activities | | | 153.5 | | | | 160.5 | | | | 153.7 | | | | 149.6 | | | | 139.8 | | | | 140.7 | | | | 132.2 | |
| Public administration and defense; compulsory social security | | | 446.4 | | | | 471.8 | | | | 460.5 | | | | 424.2 | | | | 407.2 | | | | 384.2 | | | | 390.9 | |
| Education | | | 318.3 | | | | 321.8 | | | | 324.7 | | | | 343.8 | | | | 345.5 | | | | 324.9 | | | | 334.3 | |
| Human health and social work activities | | | 269.5 | | | | 277.2 | | | | 285.2 | | | | 306.1 | | | | 318.2 | | | | 324.5 | | | | 321.0 | |
| Arts, entertainment and recreation | | | 80.1 | | | | 78.9 | | | | 70.2 | | | | 79.0 | | | | 80.1 | | | | 81.4 | | | | 83.3 | |
| Other activities | | | 102.5 | | | | 100.1 | | | | 97.5 | | | | 102.6 | | | | 104.4 | | | | 107.8 | | | | 93.7 | |
| Total | | | 4,210.5 | | | | 4,351.6 | | | | 4,421.4 | | | | 4,469.5 | | | | 4,512.1 | | | | 4,465.8 | | | | 4,408.2 | |
Source: CSO
Principal Sectors of the Economy
The following table indicates the volume indices by industry sector for the periods indicated:
Table 17: Volume Indices by Industry(1)
| | | For the year ended | | | For the three months ended | |
| | | December 31,
2019 | | | March 31,
2020 | | | June 30,
2020 | |
| | | (corresponding period
of the previous year = 100) | |
| Agriculture, forestry and fishing | | | 99.7 | | | | 99.4 | | | | 97.9 | |
| Mining and quarrying; manufacturing; electricity, gas, steam and air conditioning supply; water supply; sewerage, waste management and remediation activities | | | 105.0 | | | | 101.7 | | | | 79.9 | |
| of which: | | | | | | | | | | | | |
| Manufacturing | | | 105.0 | | | | 101.3 | | | | 78.3 | |
| Construction | | | 121.4 | | | | 103.0 | | | | 86.8 | |
| Services, total | | | 104.2 | | | | 102.4 | | | | 87.8 | |
| of which: | | | | | | | | | | | | |
| Wholesale and retail trade; repair of motor vehicles and motorcycles; accommodation and food service activities | | | 108.8 | | | | 105.0 | | | | 87.4 | |
| Transportation and storage | | | 105.3 | | | | 102.6 | | | | 75.4 | |
| Information and communication | | | 106.3 | | | | 108.8 | | | | 98.2 | |
| Financial and insurance activities | | | 103.9 | | | | 104.4 | | | | 103.4 | |
| Real estate activities | | | 104.3 | | | | 102.5 | | | | 93.2 | |
| Professional, scientific and technical activities; administrative and support service activities | | | 106.7 | | | | 105.0 | | | | 85.9 | |
| Public administration and defense; compulsory social security; education; human health and social work activities | | | 98.6 | | | | 97.2 | | | | 87.0 | |
| Arts, entertainment and recreation, repair of household goods and other services | | | 102.5 | | | | 100.0 | | | | 72.9 | |
| Taxes, less subsidies on products | | | 103.8 | | | | 103.1 | | | | 88.3 | |
| GDP, Total | | | 104.9 | | | | 102.2 | | | | 86.4 | |
Source: CSO
Notes:—
| (1) | Data unadjusted for calendar-day effect. Preliminary data. |
Industry
According to volume indices compiled by CSO, industrial gross production grew by 5.5%, and total sales increased by 5.9%, in 2019. In the last six years, industrial export sales amounted to more than 60% of the total sales of the sector. In 2019, export sales increased by 6.6%, while domestic sales grew by 4.7%. In the first seven months of 2020, export sales decreased by 12.6%, while domestic sales decreased by 7.0%. As a result, total sales fell by 10.8%, and gross production decreased by 12.0%. In 2019, 95.5% of the total industrial production was attributable to manufacturing. The value of production in mining and quarrying amounted to 0.5% of the total industry’s production, and the value of production of electricity, gas, steam and air conditioning supply amounted to 3.9% of the total industrial production.
Manufacturing
In 2019, gross production in the manufacturing sector increased by 5.6% and total sales grew by 6.4%. In 2019, export sales in manufacturing increased by 6.4%, while domestic sales grew by 6.3%. In the first seven months of 2020, export sales decreased by 12.3%, and domestic sales decreased by 10.4%. As a result, total sales decreased by 11.8%, and gross production fell by 12.3%. In 2019, approximately half of manufacturing production was attributable to three subsectors: the manufacture of transport equipment; the manufacture of computer, electronic and optical products; and the manufacture of food products, beverages and tobacco products.
Manufacture of Food Products, Beverages and Tobacco Products
In 2019, gross production in this subsector grew by 5.0%, and total sales increased by 4.5%. Export sales in this subsector increased by 7.6%, and domestic sales grew by 2.6% in 2019. In the first seven months of 2020, export sales grew by 5.6%, and domestic sales decreased by 0.3%. As a result, total sales grew by 2.0%, and gross production increased by 1.4%.
Manufacture of Computer, Electronic and Optical Products
In 2019, gross production in this subsector increased by 6.8%, and total sales grew by 7.4%. Export sales in this subsector increased by 8.4%, and domestic sales declined by 13.1% in 2019. In the first seven months of 2020, export sales declined by 0.6%, and domestic sales decreased by 14.0%. As a result, total sales fell by 1.1%, and gross production decreased by 2.0%.
Manufacture of Transport Equipment
In 2019, gross production in this subsector increased by 10.3%, and total sales increased by 12.1%. Export sales in this subsector increased by 10.7%, while domestic sales grew by 25.3% in 2019. In the first seven months of 2020, export sales fell by 23.6%, and domestic sales decreased by 27.3%. As a result, total sales declined by 24.0%, and gross production decreased by 24.4%.
Energy
In 2019, total primary energy consumption amounted to 1,107.6 petajoules, a 1.5% decrease compared to 2018. The two most important energy products are oil and gas, which accounted for 61.4% of energy consumption in 2019.
Hungary’s primary external source of energy is gas and oil imported from Russia. In 2009, disputes between Russia and the Ukraine over the pricing of natural gas supplies and transit fees from Russia resulted in Russia’s cessation of natural gas deliveries to European Union countries, including Hungary, for approximately two weeks. Although Hungary primarily compensated for the energy shortage through its gas reserves, the service interruption had some adverse impact on certain sectors, including industrials.
Hungary is taking measures to reduce the impact of possible future disruptions in its energy supply by diversifying its external and internal energy sources and routes of delivery and by accumulating further gas reserves.
Hungary currently maintains a reserve of at least a 12-week supply of oil, in compliance with OECD requirements. A construction project (Turk stream 2) that is currently underway would provide a direct gas pipeline from Russia to Hungary. In addition, the European Union is negotiating the construction of a gas pipeline from the Caspian region, the Middle East and Egypt that, if completed, would provide a direct gas supply to Hungary. Also, Hungary operates a nuclear power plant and has some capability to generate renewable energy, such as the ability to produce geothermal, wind and solar energy, energy from biomass as well as hydropower, albeit limited due to the geographic properties of Hungary. In an effort to reduce Europe’s dependence on imported energy sources, the European Commission has set target levels and dates for EU members to attain renewable energy sources, including a target for Hungary of 13.0% use of renewable energy sources by 2020.
On January 14, 2014, Prime Minister Viktor Orbán announced that Hungary would construct two new nuclear plant blocks at Paks. According to the announcement, the Government of the Russian Federation was expected to cooperate in the construction and financing of the blocks and to provide a loan to Hungary of EUR10 billion, which would cover 80% of construction costs. Hungary will begin repaying the loan, over a period of 21 years, after the project is completed and once the plant is operating. The international treaty between the Government of Hungary and the Government of the Russian Federation was approved by the Hungarian Parliament on February 6, 2014. Drawdowns on the loan began in 2017. The project is still ongoing.
The Ministry of Transport, Telecommunication and Energy is also aiming to create and maintain a competitive electricity market and to fully liberalize the sector in accordance with EU Directives. All of Hungary’s natural gas distribution companies, six electricity distribution companies and all but two of its power generation companies have been privatized.
The following table provides certain information regarding the composition of consumption of the main energy resources in Hungary for the years 2015 through 2019:
Table 18: Composition of Consumption of Energy Resources
| | | For the year ended December 31, | |
| Domination(1) | | 2015 | | | 2016 | | | 2017 | | | 2018 | | | 2019
(provisional) | |
| | | (%) | |
| Coal and coal products(2) | | | 9.3 | | | | 8.5 | | | | 8.3 | | | | 7.8 | | | | 7.2 | |
| Crude oil and crude oil products | | | 27.6 | | | | 27.3 | | | | 28.2 | | | | 30.1 | | | | 30.1 | |
| Natural gas | | | 29.5 | | | | 31.2 | | | | 31.8 | | | | 30.8 | | | | 31.3 | |
| Combustible renewables and wastes(3) | | | 11.8 | | | | 11.6 | | | | 10.9 | | | | 10.3 | | | | 9.8 | |
| Nuclear(4) | | | 16.3 | | | | 16.3 | | | | 15.7 | | | | 15.3 | | | | 15.9 | |
| Hydro | | | 0.1 | | | | 0.1 | | | | 0.1 | | | | 0.1 | | | | 0.1 | |
| Wind | | | 0.2 | | | | 0.2 | | | | 0.2 | | | | 0.2 | | | | 0.2 | |
| Other non-combustible renewables(5) | | | 0.5 | | | | 0.6 | | | | 0.7 | | | | 0.8 | | | | 1.4 | |
| Electricity net import(6) | | | 4.6 | | | | 4.2 | | | | 4.1 | | | | 4.6 | | | | 4.0 | |
| | | | | | | | | | | | | | | | | | | | | |
| Total | | | 100.0 | | | | 100.0 | | | | 100.0 | | | | 100.0 | | | | 100.0 | |
| Import dependency | | | 53.5 | | | | 55.4 | | | | 62.1 | | | | 57.7 | | | | 69.3 | |
Source: Hungarian Energy Office
Notes:—
| (1) | Electricity and heat sold produced from tail gas and waste heat are included in these figures. |
| (2) | Coal briquette and coke oven coke included. |
| (3) | Biogas, biomass, municipal waste, industrial waste, biofuel. |
| (4) | Nuclear regarded as inland production (included nuclear electricity and heat). |
| (5) | Geothermal, solar thermal and photovoltaics. |
| (6) | Share of net import in primary energy consumption. |
According to data compiled by the Hungarian Energy Office, in 2019, 30.7% of Hungary’s total energy demand was supplied by domestic energy sources and 69.3% by imported energy sources. Of the total energy consumed, 7.2% was produced from coal, and 61.4% was produced from hydrocarbon (which was imported primarily from Russia) and 31.4% was produced from other resources.
Construction
In 2019, the output of the construction sector increased by 20.4% compared to 2018. Compared to 2018, the construction of buildings grew by 19.4%. Civil engineering works increased by 21.8%. Output of the construction sector in the first seven months of 2020 decreased by 9.8% compared to the same period in 2019. Civil engineering construction decreased by 10.6% in the first seven months of 2020 compared to the same period in 2019. Building construction declined by 9.2% in the first seven months of 2020 compared to the corresponding period in 2019.
Service Industries
Gross value added by services increased by 4.2% in 2019 and grew by 2.4% in the first six months of 2020.
In 2019, seven out of eight subsectors grew, and one subsector contracted. The seven subsectors that grew were (i) wholesale and retail trade; repair of motor vehicles and motorcycles; accommodation and food service activities; (ii) transportation and storage; (iii) information and communication; (iv) financial and insurance activities; (v) real estate activities; (vi) professional, scientific and technical activities; administrative and support service activities; and (vii) arts, entertainment and recreation; repair of household goods and other services. These subsectors grew by 8.8%, 5.3%, 6.3%, 3.9%, 4.3%, 6.7% and 2.5%, respectively. The only subsector that decreased was public administration and defense; compulsory social security; education; human health and social work activities. This sector declined by 1.4%.
In the first six months of 2020, six out of eight subsectors decreased, and two subsectors increased. The six subsectors that decreased were (i) wholesale and retail trade; repair of motor vehicles and motorcycles; accommodation and food service activities; (ii) transportation and storage; (iii) real estate activities; (iv) professional, scientific and technical activities; administrative and support service activities; (v) public administration and defense; compulsory social security; education; human health and social work activities; and (vi) arts, entertainment and recreation; repair of household goods and other services, decreasing by 4.7%, 11.5%, 2.2%, 5.0%, 7.9% and 4.1%, respectively. The subsectors of (i) information and communication; and (ii) financial and insurance activities increased by 3.5% and 3.9%, respectively.
The following table sets forth the composition of the service industry per individual subsector for the periods indicated:
Table 19: Composition of Service Industry per Subsector
| | | For the
year ended | | | For the three-month period
ended | |
| | | December 31,
2019 | | | March 31,
2020 | | | June 30,
2020 | |
| Wholesale and retail trade; repair of motor vehicles and motorcycles; accommodation and food service activities | | | 20.5 | | | | 17.9 | | | | 19.0 | |
| Transportation and storage | | | 9.2 | | | | 8.7 | | | | 7.4 | |
| Information and communication | | | 7.4 | | | | 8.0 | | | | 7.5 | |
| Financial and insurance activities | | | 5.1 | | | | 5.4 | | | | 5.9 | |
| Real estate activities | | | 12.2 | | | | 13.4 | | | | 12.7 | |
| Professional, scientific and technical activities; administrative and support service activities | | | 15.9 | | | | 16.2 | | | | 15.5 | |
| Public administration and defense; compulsory social security; education; human health and social work activities | | | 25.3 | | | | 25.9 | | | | 28.5 | |
| Arts, entertainment and recreation, repair of household goods and other services | | | 4.4 | | | | 4.4 | | | | 3.6 | |
| Services, total | | | 100.0 | | | | 100.0 | | | | 100.0 | |
Source: CSO
Agriculture
In 2019 total production of cereals amounted to 15.5 million tons. Production of wheat, maize and barley amounted to 5.4 million tons, 8.3 million tons and 1.4 million tons, respectively, representing an increase of 2.1%, 3.7% and 19.6%, respectively compared to the previous year. In the cases of wheat and barley, average yield increased by 3.1% and 18.1%, respectively, compared to the previous year. In the case of maize, average yield declined by 5.2% compared to 2018. In 2019, the production of sunflower seed, sugar beet, lucerne hay and rape seed amounted to 1.7 million tons, 0.8 million tons, 1.0 million tons and 0.9 million tons, respectively. The production of sunflower seed and sugar beet decreased by 7.0% and 14.3%, respectively; the production of lucerne hay and rape seed declined by 5.0% and 10.7%, respectively. The production of silage maize and green maize amounted to 2.0 million tons, representing a decrease of 0.6%.
Infrastructure
Hungary is a landlocked country and is located at the crossroads of several important transport corridors for the region. Three main roadways (forming part of the Trans-European Network), three corridor branches and various railways and waterways cross Hungary. With Budapest as a hub, several corridors connect Hungary to the Trans-European Network. Hungary plays a central role in international transport connections for Central and Eastern Europe and for Southeastern Europe towards the West and the East. However, compared to Western European countries, the transportation network in Hungary is less developed, suffering from a shortage of bridges, a lack of transversal connections, poor quality in infrastructure and a low proportion of expressways.
Since 2007, the development of the road network has been a state task, and the Government has financed construction from the central budget. Infrastructure projects are managed by the National Infrastructure Developing Private Company Limited (Nemzeti Infrastruktúra Fejlesztő Zrt.) (the “NIF Zrt.”), while the maintenance of motorways is the responsibility of the State Highway Management Company Limited by Shares (Állami Autópálya Kezelő Zrt.).
The length of national public roads amounted to 31,925 kilometers in 2015, 31,986 kilometers in 2016, 32,006 kilometers in 2017 and 32,070 kilometers in 2018. In 2019, the length of national public roads increased by 134 kilometers and reached a total of 32,204 kilometers.
Hungary has one international airport (Liszt Ferenc International Airport in Budapest), which currently meets the majority of the air traffic needs of the country. Since May 2006, several transportation companies have been providing air transportation services between European cities and airports at Sármellék, Debrecen, Győr-Pér and Pécs-Pogány. In line with international trends, the traffic at Liszt Ferenc International Airport has steadily increased over the last several years.
Navigation is possible along approximately 1,600 kilometers of the rivers in Hungary. There is commercial navigation on the Danube River and, to a very limited extent, on the Tisza River.
The telecommunications sector’s level of development, in both wired and wireless communication, approaches the average level of other EU members. In 2019, Hungary had 12.5 million mobile phone subscriptions. By the end of 2019, the number of internet subscriptions amounted to 10.3 million.
PRIVATIZATION
Status of Privatization Efforts
Since 1990, Hungary has privatized nearly 1,300 enterprises out of the 1,860 enterprises previously owned by the state. The Hungarian Privatization and State Holding Company (Állami Privatizációs és Vagyonkezelő Zrt.) (“ÁPV Zrt.”) manages these sales.
Most of the larger companies involved in the privatization program have already been partially or fully privatized. Permanent government control is anticipated for 36 companies. The scope of property that is required to remain state-owned in the long-term is defined by law as follows:
| | (1) | national public utility service providers; |
| | (2) | property or companies of strategic importance for the national economy; and |
| | (3) | property or companies that accomplish tasks or fulfill objectives for national defense or other special purposes. |
See also “Monetary and Financial System—Capital Markets—Stock Exchange.”
Methods of Privatization Used
Hungary is unique among Central European countries in that a large majority of its privatizations were conducted through public tenders, with sales for cash consideration. These outright sales, often to strategic long-term investors, were successful in bringing new management and know-how to many Hungarian enterprises. Public offerings played an important and successful role in the privatization process.
In recent years, the importance of compensation vouchers has decreased significantly. Compensation vouchers were the rights distributed to individual Hungarian citizens under the Compensation Act, which was designed to provide compensation for losses suffered, including the loss of property and personal freedom. These compensation vouchers entitled the holders to bid for shares in certain privatized entities. In 2003, in order to end the compensation voucher system, the Government decided to offer the shares of FORRÁS Trust and Investment Company (a state-owned asset management company) in exchange for the compensation vouchers. The offering was completed in June and July of 2003, and the shares of FORRÁS Trust and Investment Company have been listed on the Budapest Stock Exchange since then.
On January 1, 2012, the Act on National Assets went into effect, which provides for the protection of certain assets such as rivers, streams, channels, natural lakes, airspace above Hungary, emission reduction units, archeological finds, financial assets owned by the government or a local municipality (including corporate shares, e.g., shares of public transportation companies, forestry companies, and companies established by laws for public interest), national data assets owned by the state or local governments or their public or private organizations. The Act determines the scope and rules of management of national assets and limitations related to selling, lending and utilization of national assets, in order to ensure that such assets serve the public interest.
BALANCE OF PAYMENTS AND FOREIGN TRADE
Balance of Payments
The following tables set out the balance of payments of Hungary for the periods indicated:
Table 20: Balance of Payments
| | | For the year ended December 31, | |
| | | 2015 | | | 2016 | | | 2017 | | | 2018 | | | 2019 | |
| | | (EUR millions) | |
| 1. Current Account, net (1.A+1.B+1.C) | | | 2,648.1 | | | | 5,209.3 | | | | 2,489.6 | | | | 377.2 | | | | (362.9 | ) |
| | | | | | | | | | | | | | | | | | | | | |
| 1.A. Goods and Services, net | | | 8,959.0 | | | | 10,083.8 | | | | 8,658.6 | | | | 6,003.2 | | | | 4,572.8 | |
| Exports | | | 98,762.3 | | | | 100,466.2 | | | | 109,101.7 | | | | 114,020.5 | | | | 120,005.3 | |
| Imports | | | 89,803.3 | | | | 90,382.4 | | | | 100,443.1 | | | | 108,017.4 | | | | 115,432.5 | |
| 1.A.a. Goods, net | | | 4,051.7 | | | | 3,958.3 | | | | 1,712.0 | | | | (1,684.3 | ) | | | (2,991.7 | ) |
| Exports | | | 78,476.8 | | | | 78,588.2 | | | | 85,285.1 | | | | 88,661.9 | | | | 93,077.6 | |
| Imports | | | 74,425.1 | | | | 74,629.9 | | | | 83,573.1 | | | | 90,346.2 | | | | 96,069.2 | |
| 1.A.b. Services, net | | | 4,907.3 | | | | 6,125.5 | | | | 6,946.6 | | | | 7,687.5 | | | | 7,564.5 | |
| Exports | | | 20,285.5 | | | | 21,878.0 | | | | 23,816.6 | | | | 25,358.6 | | | | 26,927.7 | |
| Imports | | | 15,378.2 | | | | 15,752.5 | | | | 16,870.1 | | | | 17,671.1 | | | | 19,363.2 | |
| | | | | | | | | | | | | | | | | | | | | |
| 1.B. Primary Income, net | | | (5,130.9 | ) | | | (3,130.9 | ) | | | (5,062.9 | ) | | | (4,978.0 | ) | | | (3,892.0 | ) |
| 1.B.1. Compensation of employees, net | | | 2,758.5 | | | | 2,822.9 | | | | 2,627.2 | | | | 2,421.6 | | | | 2,572.4 | |
| 1.B.2. Investment income, net | | | (9,179.8 | ) | | | (7,056.5 | ) | | | (8,911.5 | ) | | | (8,599.6 | ) | | | (7,738.2 | ) |
| 1.B.2.1. Direct investment income, net | | | (7,080.5 | ) | | | (5,299.3 | ) | | | (7,386.0 | ) | | | (7,274.1 | ) | | | (6,528.5 | ) |
| 1.B.2.2. Portfolio investment income, net | | | (2,073.7 | ) | | | (1,706.1 | ) | | | (1,468.9 | ) | | | (1,314.5 | ) | | | (1,247.8 | ) |
| 1.B.2.3. Other investment income, net | | | (426.8 | ) | | | (302.9 | ) | | | (243.9 | ) | | | (203.3 | ) | | | (205.5 | ) |
| 1.B.2.4. Reserve assets, net | | | 401.2 | | | | 251.8 | | | | 187.3 | | | | 192.5 | | | | 243.7 | |
| 1.B.3. Other primary income, net | | | 1,290.4 | | | | 1,102.7 | | | | 1,221.4 | | | | 1,200.0 | | | | 1,273.7 | |
| -of which: EU transfers | | | 1,290.4 | | | | 1,102.7 | | | | 1,221.4 | | | | 1,200.0 | | | | 1,273.7 | |
| 1.C. Secondary Income, net | | | (1,180.0 | ) | | | (1,743.5 | ) | | | (1,106.1 | ) | | | (648.0 | ) | | | (1,043.7 | ) |
| -of which: EU transfers | | | 161.6 | | | | (452.4 | ) | | | 103.2 | | | | 487.4 | | | | 100.8 | |
| | | | | | | | | | | | | | | | | | | | | |
| 2. Capital Account, net | | | 5,159.5 | | | | (21.1 | ) | | | 1,075.4 | | | | 2,988.3 | | | | 2,616.5 | |
| -of which: EU transfers | | | 5,270.7 | | | | 363.1 | | | | 1,353.3 | | | | 2,188.2 | | | | 2,781.8 | |
| | | | | | | | | | | | | | | | | | | | | |
| 3. Financial Account (net assets) (3.1+3.2+3.3+3.4+3.5) | | | 6,657.6 | | | | 3,548.7 | | | | 1,864.5 | | | | 1,188.4 | | | | 916.1 | |
| | | | | | | | | | | | | | | | | | | | | |
| 3.1. Direct Investment (net assets) | | | (1,438.3 | ) | | | (2,562.6 | ) | | | (2,046.8 | ) | | | (2,734.5 | ) | | | 97.5 | |
| 3.1.k. Abroad (net assets) | | | (14,306.4 | ) | | | (7,372.6 | ) | | | 1,098.9 | | | | 4,340.5 | | | | 1,128.4 | |
| 3.1.1.k Equity (net assets) | | | (15,496.8 | ) | | | (6,276.8 | ) | | | 219.8 | | | | 4,872.5 | | | | 878.1 | |
| 3.1.1.1.ki Equity other than reinvestment of earnings (net assets) | | | (15,770.2 | ) | | | (7,336.0 | ) | | | (854.6 | ) | | | 4,015.6 | | | | 126.5 | |
| 3.1.1.2.ki Reinvestment of earnings (net assets) | | | 273.4 | | | | 1,059.2 | | | | 1,074.4 | | | | 856.9 | | | | 751.7 | |
| 3.1.2.ki Debt instruments (net assets) | | | 1,190.4 | | | | (1,095.8 | ) | | | 879.1 | | | | (532.0 | ) | | | 250.2 | |
| 3.1.2.1.ki Assets | | | 785.9 | | | | (840.4 | ) | | | 884.6 | | | | 206.5 | | | | 154.2 | |
| 3.1.2.2.ki Liabilities | | | (404.6 | ) | | | 255.4 | | | | 5.4 | | | | 738.5 | | | | (96.0 | ) |
| 3.1.t In Hungary (net liabilities) | | | (12,868.1 | ) | | | (4,809.9 | ) | | | 3,145.7 | | | | 7,075.0 | | | | 1,030.9 | |
| 3.1.1.t Equity (net liabilities) | | | 4,507.5 | | | | (826.2 | ) | | | 8,462.1 | | | | 6,411.2 | | | | 3,522.3 | |
| 3.1.1.1.be Equity other than reinvestment of earnings (net liabilities) | | | 505.6 | | | | (4,899.4 | ) | | | 2,321.9 | | | | 849.6 | | | | (1,212.5 | ) |
| 3.1.1.2.be Reinvestment of earnings (net liabilities) | | | 4,001.8 | | | | 4,073.2 | | | | 6,140.2 | | | | 5,561.6 | | | | 4,734.8 | |
| 3.1.2.be Debt instruments (net liabilities) | | | (17,375.6 | ) | | | (3,983.8 | ) | | | (5,316.4 | ) | | | 663.8 | | | | (2,491.4 | ) |
| 3.1.2.1.be Assets | | | 19,713.6 | | | | (1,296.1 | ) | | | 3,937.3 | | | | 1,123.3 | | | | (1,229.2 | ) |
| 3.1.2.2.be Liabilities | | | 2,338.0 | | | | (5,279.9 | ) | | | (1,379.1 | ) | | | 1,787.0 | | | | (3,720.6 | ) |
| | | | | | | | | | | | | | | | | | | | | |
| 3.2. Portfolio investment (net assets) | | | 5,656.7 | | | | 4,822.5 | | | | 3,761.4 | | | | (184.6 | ) | | | 1,539.0 | |
| 3.2.k Assets | | | 391.5 | | | | 999.4 | | | | 1,916.5 | | | | (140.2 | ) | | | 252.8 | |
| 3.2.t Liabilities | | | (5,265.2 | ) | | | (3,823.1 | ) | | | (1,844.9 | ) | | | 44.4 | | | | (1,286.3 | ) |
| | | | | | | | | | | | | | | | | | | | | |
| 3.3. Financial derivatives (other than reserves), net assets | | | (686.0 | ) | | | 52.9 | | | | (1,049.6 | ) | | | (932.7 | ) | | | 24.1 | |
| 3.3.k Assets | | | (6,218.4 | ) | | | (4,120.9 | ) | | | (4,616.5 | ) | | | (4,432.1 | ) | | | (3,601.2 | ) |
| 3.3.t Liabilities | | | (5,532.5 | ) | | | (4,173.8 | ) | | | (3,566.9 | ) | | | (3,499.4 | ) | | | (3,625.3 | ) |
| | | | | | | | | | | | | | | | | | | | | |
| 3.4. Other investment (net assets) | | | 8,038.5 | | | | 7,335.4 | | | | 1,171.6 | | | | 1,442.6 | | | | (1,069.9 | ) |
| 3.4.k Assets | | | 5,471.1 | | | | 6,228.6 | | | | 1,750.5 | | | | 2,436.0 | | | | 48.3 | |
| 3.4.t Liabilities | | | (2,567.4 | ) | | | (1,106.7 | ) | | | 578.9 | | | | 993.4 | | | | 1,118.1 | |
| | | | | | | | | | | | | | | | | | | | | |
| 3.5. Reserve assets | | | (4,913.4 | ) | | | (6,099.5 | ) | | | 27.9 | | | | 3,597.5 | | | | 325.4 | |
| Memorandum: | | | | | | | | | | | | | | | | | | | | |
| Net external financing capacity | | | | | | | | | | | | | | | | | | | | |
| Net external financing capacity (CA and Capital account) | | | 7,807.6 | | | | 5,188.2 | | | | 3,565.0 | | | | 3,365.4 | | | | 2,253.6 | |
| Financial account balance | | | 6,657.6 | | | | 3,548.7 | | | | 1,864.5 | | | | 1,188.4 | | | | 916.1 | |
| Difference (Net errors and omissions) | | | (1,150.1 | ) | | | (1,639.5 | ) | | | (1,700.5 | ) | | | (2,177.1 | ) | | | (1,337.5 | ) |
| | | | | | | | | | | | | | | | | | | | | |
| Reserve assets (stock) | | | 30,322.1 | | | | 24,383.9 | | | | 23,367.9 | | | | 27,402.5 | | | | 28,385.2 | |
| | | | | | | | | | | | | | | | | | | | | |
| Gross external debt denominated in foreign currencies (excl. direct investment debt instruments) | | | 60,790.6 | | | | 57,895.4 | | | | 54,354.9 | | | | 51,665.8 | | | | 51,493.9 | |
| -o/w: General government and Central bank | | | 31,161.4 | | | | 27,712.9 | | | | 22,923.7 | | | | 20,814.1 | | | | 19,822.1 | |
| | | | | | | | | | | | | | | | | | | | | |
| Net external debt denominated in foreign currencies (excl. direct investment debt instruments) | | | 10,777.8 | | | | 4,635.6 | | | | (333.4 | ) | | | (8,069.1 | ) | | | (8,820.0 | ) |
| -o/w: General government and Central bank | | | 625.7 | | | | 3,214.6 | | | | (571.7 | ) | | | (5,712.6 | ) | | | (7,498.8 | ) |
Source: NBH
The current account deficit amounted to EUR363 million in 2019, largely due to a large deficit in primary and secondary income offsetting the surplus in goods and services. During 2019, net direct investment posted an outflow, reaching EUR97 million compared to a net inflow of EUR2,734 million in 2018.
Foreign Trade
The tables below set forth Hungary’s trade in goods by territory for the periods indicated.
The EU–15 category consists of Austria, Belgium, Denmark, Finland, France, Germany, Greece, Ireland, Italy, Luxembourg, Netherlands, Portugal, Spain, Sweden and – until January 2020 – United Kingdom.
Countries joining the EU after 2004 consist of Bulgaria, Cyprus, Czech Republic, Estonia, Hungary, Latvia, Lithuania, Malta, Poland, Romania, Slovak Republic, Slovenia and Croatia. These two groups, the EU-15 and the countries joining the EU after 2004, together form European Union countries.
Table 21: Exports by Destination
| | | European
Union
countries | | | Non-EU
Countries | | | Total | | | EU-15 | | | Countries
joining
the
EU after
2004 | | | Asian
countries | | | American
countries | |
| | | (EUR millions) | |
| 2015 | | | 71,509 | | | | 18,951 | | | | 90,460 | | | | 51,442 | | | | 20,067 | | | | 5,168 | | | | 4,566 | |
| 2016 | | | 73,930 | | | | 19,060 | | | | 92,990 | | | | 53,062 | | | | 20,868 | | | | 5,403 | | | | 4,509 | |
| 2017 | | | 80,107 | | | | 20,573 | | | | 100,680 | | | | 57,341 | | | | 22,765 | | | | 5,868 | | | | 4,539 | |
| 2018 | | | 84,690 | | | | 20,165 | | | | 104,855 | | | | 60,235 | | | | 24,455 | | | | 5,329 | | | | 4,546 | |
| 2019 | | | 88,296 | | | | 20,799 | | | | 109,095 | | | | 62,990 | | | | 25,306 | | | | 5,037 | | | | 4,621 | |
| First six months of 2020 | | | 37,783 | | | | 11,018 | | | | 48,801 | | | | n/a | | | | n/a | | | | 2,603 | | | | 1,998 | |
Source: CSO
Table 22: Exports by Commodity Group
| | | Food,
beverages,
tobacco | | | Crude
materials | | | Fuels,
electric
energy | | | Manufactured
goods | | | Machinery
and
transport
equipment | | | Total | |
| | | (EUR millions) | |
| 2015 | | | 6,585 | | | | 2,054 | | | | 2,079 | | | | 28,075 | | | | 51,666 | | | | 90,460 | |
| 2016 | | | 6,568 | | | | 2,074 | | | | 1,696 | | | | 29,100 | | | | 53,552 | | | | 92,990 | |
| 2017 | | | 7,244 | | | | 2,368 | | | | 2,511 | | | | 32,337 | | | | 56,220 | | | | 100,680 | |
| 2018 | | | 7,110 | | | | 2,360 | | | | 2,953 | | | | 33,999 | | | | 58,433 | | | | 104,855 | |
| 2019 | | | 7,538 | | | | 2,502 | | | | 2,859 | | | | 33,536 | | | | 62,659 | | | | 109,095 | |
| First six months of 2020 | | | 3,949 | | | | 1,151 | | | | 1,050 | | | | 15,707 | | | | 26,944 | | | | 48,801 | |
Source: CSO
Table 23: Imports by Origin
| | | European
Union
countries | | | Non-EU
countries | | | Total | | | EU-15 | | | Countries
joining
the EU
after 2004 | | | Asian
countries | | | American
countries | |
| | | (EUR millions) | |
| 2015 | | | 62,920 | | | | 18,944 | | | | 81,865 | | | | 45,502 | | | | 17,419 | | | | 10,163 | | | | 2,218 | |
| 2016 | | | 65,056 | | | | 18,209 | | | | 83,265 | | | | 47,070 | | | | 17,986 | | | | 10,029 | | | | 2,297 | |
| 2017 | | | 70,997 | | | | 21,605 | | | | 92,602 | | | | 51,114 | | | | 19,883 | | | | 11,273 | | | | 2,443 | |
| 2018 | | | 75,086 | | | | 24,249 | | | | 99,335 | | | | 53,745 | | | | 21,341 | | | | 13,245 | | | | 2,252 | |
| 2019 | | | 77,425 | | | | 27,336 | | | | 104,761 | | | | 55,132 | | | | 22,293 | | | | 15,473 | | | | 2,660 | |
| First six months of 2020 | | | 32,947 | | | | 13,808 | | | | 46,755 | | | | n/a | | | | n/a | | | | 8,571 | | | | 1,250 | |
Source: CSO
Table 24: Imports by Commodity Group
| | | Food,
beverages,
tobacco | | | Crude
materials | | | Fuels,
electric
energy | | | Manufactured
goods | | | Machinery
and
transport
equipment | | | Total | |
| | | (EUR millions) | |
| 2015 | | | 4,226 | | | | 1,739 | | | | 6,698 | | | | 29,093 | | | | 40,109 | | | | 81,865 | |
| 2016 | | | 4,498 | | | | 1,731 | | | | 5,306 | | | | 30,274 | | | | 41,456 | | | | 83,265 | |
| 2017 | | | 4,893 | | | | 2,070 | | | | 7,191 | | | | 33,558 | | | | 44,891 | | | | 92,602 | |
| 2018 | | | 5,129 | | | | 2,123 | | | | 8,121 | | | | 36,571 | | | | 47,389 | | | | 99,335 | |
| 2019 | | | 5,558 | | | | 2,212 | | | | 8,421 | | | | 37,791 | | | | 50,779 | | | | 104,761 | |
| First five months of 2020 | | | 2,829 | | | | 990 | | | | 2,579 | | | | 18,618 | | | | 21,739 | | | | 46,755 | |
Source: CSO
Hungary’s foreign trade in goods with industrialized countries (in particular, EU countries) has increased in recent years. EU countries accounted for 81% of Hungary’s exports and 74% of imports in 2019.
China is Hungary’s largest trade partner outside the EU, with imports from China worth HUF2,071.8 billion and exports to China worth HUF481.8 billion in 2019.
Trade Policy
Hungary has taken a number of steps since the beginning of the 1990s to integrate its economy into the global trading system.
European Union
Upon accession to the EU, Hungary adopted all aspects of the Common Commercial Policy of the EU. This includes the application of the Common External Tariff, EU preferential trade agreements and regimes, WTO commitments and trade defense measures. The overall effect of these changes is that the trade regime of Hungary has become more open and transparent (for example, the average level of customs duties decreased by about 50% following Hungary’s accession to the EU, and, within the framework of the WTO, the country became a party to the Agreement on Government Procurement, the Agreement on Trade in Civil Aircraft and the Information Technology Arrangement). Further, by virtue of Hungary’s membership in the EU, it is also a member of the European Economic Area (“EEA”), along with Norway, Iceland, and Lichtenstein and the other EU-member countries.
Bilateral Trade Agreements
In addition to the multilateral trade agreements discussed above, Hungary has also entered into bilateral trade agreements with several countries, including Slovenia, Romania, Turkey, Israel, Bulgaria, Lithuania, Latvia and Estonia. Hungary has entered into trade and co-operation agreements with certain Central European countries designed to lower or eliminate trade barriers.
Foreign Direct Investment
The following table sets forth historical records of foreign direct investment (“FDI”) in Hungary and Hungarian direct investments abroad during the years indicated:
Table 25: Foreign Direct Investment Flows
| | | For the year ended December 31, | |
| | | 2015 | | | 2016 | | | 2017 | | | 2018 | | | 2019 | |
| | | (EUR millions) | |
| 3.1. Direct investment (net assets) | | | (1,438.3 | ) | | | (2,562.6 | ) | | | (2,046.8 | ) | | | (2,734.5 | ) | | | 97.5 | |
| 3.1.k. Abroad (net assets) | | | (14,306.4 | ) | | | (7,372.6 | ) | | | 1,098.9 | | | | 4,340.5 | | | | 1,128.4 | |
| 3.1.1.k Equity (net assets) | | | (15,496.8 | ) | | | (6,276.8 | ) | | | 219.8 | | | | 4,872.5 | | | | 878.1 | |
| 3.1.1.1.ki Equity other than reinvestment of earnings (net assets) | | | (15,770.2 | ) | | | (7,336.0 | ) | | | (854.6 | ) | | | 4,015.6 | | | | 126.5 | |
| 3.1.1.2.ki Reinvestment of earnings (net assets) | | | 273.4 | | | | 1,059.2 | | | | 1,074.4 | | | | 856.9 | | | | 751.7 | |
| 3.1.2.ki Debt instruments (net assets) | | | 1,190.4 | | | | (1,095.8 | ) | | | 879.1 | | | | (532.0 | ) | | | 250.2 | |
| 3.1.2.1.ki Assets | | | 785.9 | | | | (840.4 | ) | | | 884.6 | | | | 206.5 | | | | 154.2 | |
| 3.1.2.2.ki Liabilities | | | (404.6 | ) | | | 255.4 | | | | 5.4 | | | | 738.5 | | | | (96.0 | ) |
| 3.1.t In Hungary (net liabilities) | | | (12,868.1 | ) | | | (4,809.9 | ) | | | 3,145.7 | | | | 7,075.0 | | | | 1,030.9 | |
| 3.1.1.t Equity (net liabilities) | | | 4,507.5 | | | | (826.2 | ) | | | 8,462.1 | | | | 6,411.2 | | | | 3,522.3 | |
| 3.1.1.1.be Equity other than reinvestment of earnings (net liabilities) | | | 505.6 | | | | (4,899.4 | ) | | | 2,321.9 | | | | 849.6 | | | | (1,212.5 | ) |
| 3.1.1.2.be Reinvestment of earnings (net liabilities) | | | 4,001.8 | | | | 4,073.2 | | | | 6,140.2 | | | | 5,561.6 | | | | 4,734.8 | |
| 3.1.2.be Debt instruments (net liabilities) | | | (17,375.6 | ) | | | (3,983.8 | ) | | | (5,316.4 | ) | | | 663.8 | | | | (2,491.4 | ) |
| 3.1.2.1.be Assets | | | 19,713.6 | | | | (1,296.1 | ) | | | 3,937.3 | | | | 1,123.3 | | | | (1,229.2 | ) |
| 3.1.2.2.be Liabilities | | | 2,338.0 | | | | (5,279.9 | ) | | | (1,379.1 | ) | | | 1,787.0 | | | | (3,720.6 | ) |
Source: NBH
In 2015, net FDI inflow amounted to EUR1,438 million. In 2016, net FDI inflow increased significantly, reaching EUR2,563 million. In 2017, net FDI inflow decreased, reaching EUR2,047 million. In 2018, net FDI inflow increased, reaching EUR2,734 million. In 2019, net FDI posted an outflow, in the amount of EUR97 million.
As of December 31, 2019, the cumulative FDI in Hungary was EUR119.8 billion.
The following table sets forth certain information regarding FDI in Hungary and Hungarian direct investments abroad during the six months ended June 30, 2020 as compared to the same period in 2019:
Table 26: Foreign Direct Investment Flows: First Half of 2019 and 2020
| | | For the six-month period ended June 30, 2019 | | | For the six-month period ended June 30, 2020 | |
| | | (EUR millions) | |
| 3.1. Direct investment (net assets) | | | 362.5 | | | | (834.7 | ) |
| 3.1.k. Abroad (net assets) | | | 44.4 | | | | 465.7 | |
| 3.1.1.k Equity (net assets) | | | (331.3 | ) | | | 1,248.3 | |
| 3.1.1.1.ki Equity other than reinvestment of earnings (net assets) | | | (330.9 | ) | | | 868.5 | |
| 3.1.1.2.ki Reinvestment of earnings (net assets) | | | (0.4 | ) | | | 379.8 | |
| 3.1.2.ki Debt instruments (net assets) | | | 375.7 | | | | (782.6 | ) |
| 3.1.2.1.ki Assets | | | 500.1 | | | | (624.3 | ) |
| 3.1.2.2.ki Liabilities | | | 124.4 | | | | 158.3 | |
| 3.1.t In Hungary (net liabilities) | | | (318.1 | ) | | | 1,300.4 | |
| 3.1.1.t Equity (net liabilities) | | | (633.4 | ) | | | (2,406.7 | ) |
| 3.1.1.1.be Equity other than reinvestment of earnings (net liabilities) | | | (1,398.0 | ) | | | (2,629.7 | ) |
| 3.1.1.2.be Reinvestment of earnings (net liabilities) | | | 764.6 | | | | 223.0 | |
| 3.1.2.be Debt instruments (net liabilities) | | | 315.3 | | | | 3,707.1 | |
| 3.1.2.1.be Assets | | | 1,507.6 | | | | (1,862.1 | ) |
| 3.1.2.2.be Liabilities | | | 1,822.9 | | | | 1,845.0 | |
Source: NBH
During the six-month period ended June 30, 2020, the balance of net direct investment showed an inflow of EUR835 million compared to the EUR362 million net outflow during the same period of 2019.
Net foreign direct investment abroad in the first half of 2020 generated a net outflow of EUR466 million, while in the corresponding period of 2019, net foreign direct investments abroad generated a net capital outflow of EUR44 million. In the first half of 2020, net foreign direct investment abroad in the form of debt instruments amounted to a EUR783 million inflow, compared to an outflow of EUR376 million during the corresponding period of 2019. In the first half of 2020, net foreign direct investment abroad in the form of equity capital (including reinvestment of earnings and equity) amounted to a EUR1,248 million outflow; during the corresponding period of 2019, net capital inflow amounted to EUR331 million. In the first half of 2020, net foreign direct investment abroad in the form of reinvestment of earnings amounted to a EUR380 million outflow; during the corresponding period of 2019, net capital inflow amounted to EUR0 million. In the first half of 2020, net foreign direct investment abroad in the form of equity capital (excluding reinvestment of earnings) amounted to a EUR869 million outflow; during the corresponding period of 2019, net capital inflow amounted to EUR331 million.
Net foreign direct investment in Hungary in the first half of 2020 generated a net outflow of EUR1,300 million, while in the corresponding period of 2019, net foreign direct investment in Hungary generated a net capital inflow of EUR318 million. In the first half of 2020, net foreign direct investment in Hungary in the form of debt instruments amounted to a EUR3,707 million outflow; during the corresponding period of 2019, net capital outflow amounted to EUR315 million. In the first half of 2020, net foreign direct investment in Hungary in the form of equity capital (including reinvestment of earnings and equity) amounted to a EUR2,407 million inflow; during the corresponding period of 2019, net capital inflow amounted to EUR633 million. In the first half of 2020, net foreign direct investment in Hungary in the form of reinvestment of earnings amounted to a EUR223 million outflow; during the corresponding period of 2019, net capital outflow amounted to EUR765 million. In the first half of 2020, net foreign direct investment in Hungary in the form of equity capital (excluding reinvestment of earnings) amounted to a EUR2,630 million inflow; during the corresponding period of 2019, net capital inflow amounted to EUR1,398 million.
In recent years, reinvested earnings in Hungary and FDI in the form of other capital have been relatively high, amounting to approximately half of the balance of net income on equities. Further, the increasing investment by Hungarian companies in the form of equity capital abroad has primarily been a result of certain Hungarian companies seeking to increase their footprint in the Central-Eastern European region generally.
Foreign Exchange Reserves
The following table presents the level of Hungary’s gold and foreign exchange reserves as of the dates indicated:
Table 31: Gold and Foreign Exchange Reserves
| | | As of December 31, | | | As of
August 31, | |
| | | 2015 | | | 2016 | | | 2017 | | | 2018 | | | 2019 | | | 2020 | |
| | | (EUR millions) | |
| International net gold reserves(1) | | | 96.2 | | | | 0.0 | | | | 107.0 | | | | 1,129.9 | | | | 1,376.2 | | | | 1,666.7 | |
| Foreign exchange(2) | | | 30,225.9 | | | | 24,384.0 | | | | 23,261.3 | | | | 26,273.2 | | | | 27,009.5 | | | | 28,392.5 | |
| Total | | | 30,322.1 | | | | 24,384.0 | | | | 23,368.3 | | | | 27,403.1 | | | | 28,385.6 | | | | 30,059.2 | |
Source: NBH
Notes:—
| (1) | Gold valued at London rates fixed on the relevant date. |
| (2) | Consists of foreign currencies, including the counterparts of swapped gold, converted at exchange rates at the dates shown. |
MONETARY AND FINANCIAL SYSTEM
The National Bank of Hungary
The National Bank of Hungary (“NBH”) is the central bank of Hungary. The independence of the NBH and the members of its decision-making bodies in carrying out the tasks and meeting their obligations are provided for by Act CXXXIX of 2013 on the National Bank of Hungary (the “National Bank Act”). The NBH’s primary objective is to use monetary instruments to achieve and maintain price stability and, without prejudice to this objective, to support the economic policy of the Government. These instruments include:
| | (1) | setting the central bank base rate (the rate for the NBH’s main policy instrument, the two-week deposit facility and the three-months deposit facility) and the setting of rates for overnight deposit and lending facilities; |
| | (2) | establishing the minimum reserve requirements for commercial banks; |
| | (3) | conducting open market operations, which include sales and purchases of government securities from commercial banks and engaging in other similar transactions to regulate liquidity within the economy; and |
| | (4) | determining and implementing the exchange rate policy in agreement with the Government. |
The NBH is a company limited by shares, with a registered capital of HUF10 billion. The NBH is wholly owned by Hungary and is regulated by the National Bank Act. The supreme body of the NBH is the General Assembly, and the Finance Minister (previously the Minister for National Economy) represents Hungary as the sole shareholder. The Monetary Council is the highest monetary policy decision-making body of the NBH. The Monetary Council holds meetings at least once every month and makes the most important decisions concerning the general activities of the NBH, including the setting of the official interest rate.
As of October 1, 2013, the current National Bank Act went into effect including the prior amendments (members of Monetary Council and election rules of Deputy Governors) and the merger of Hungarian Financial Supervisory Authority and NBH.
Following its election on July 6, 2015, the Supervisory Board of the NBH held its inaugural meeting and began its activities. The Supervisory Board is responsible for the continuous supervision of the NBH on behalf of the owner and controls the internal audit organization within certain restrictions prescribed by the National Bank Act.
Monetary Policy
As set forth in Hungarian law, the NBH is responsible for achieving and maintaining price stability. In June 2001, the Monetary Council decided to conduct its monetary policy within the framework of inflation targeting, which is supplemented by an exchange rate regime using a wide fluctuation margin. See “Exchange Rate Policy.” The inflation target has been 3% for each year following 2006. On March 24, 2015, after a scheduled review of the NBH’s inflation target, the Monetary Council decided to improve the flexibility of the inflation targeting regime by designating a ±1 percentage point tolerance band while maintaining the inflation target defined as a 3% increase in the domestic Consumer Price Index published by the Central Statistical Office. In line with past practice, the NBH publishes an assessment of performance in meeting the inflation target each year, in the Annual Report.
On July 23, 2013, the governor of the NBH, Mr. György Matolcsy, announced that the Monetary Policy Council of the NBH will provide forward guidance regarding interest rate policy. The Monetary Policy Council of the NBH will consider (i) mid-term inflation prospects, (ii) financial stability and (iii) growth prospects in conducting interest rate policy.
On September 18, 2018, the Monetary Council announced that the NBH was also prepared for the gradual normalization of monetary policy and that the set of unconventional instruments affecting short-term yields would be simplified.
NBH terminated its three-month central bank deposits by the end of December 2018. Thereafter, required reserves have been the main policy instrument. The NBH adjusts the monetary conditions necessary to achieve the inflation target in a sustainable manner by creating an optimal combination of two of its instruments: swaps providing forint liquidity and the interest rate corridor.
As part of the fine-tuning of the unconventional policy instruments affecting long-term yields, the Monetary Council decided to phase out the monetary policy interest rate swap (“MIRS”) tenders and the mortgage bond purchase program by the end of 2018. The Funding for Growth Scheme Fix (“FGS fix”) was introduced in 2019 as planned.
According to the Quarterly Report on Inflation published on September 24, 2020, there is a high probability of achieving the 2020, 2021 and 2022 inflation target. In the Report on Inflation, the NBH estimated that the average annual inflation for 2020 would be between 3.5% and 3.6%, close to the 3% long-term inflation target rate; the inflation rate is projected to be between 3.4% and 3.6% in 2021, which is also close to the 3% long-term inflation target rate; and the inflation rate is projected to reach 3.0% in 2022, which is in line with the 3% long-term inflation target rate.
Interest Rate Policy
The main monetary policy instrument used by the NBH to keep the rate of inflation within the target band was its two-week, and, since September 2015, its three-month deposit facility. The NBH periodically accepted unlimited two-week and three-month deposits at the central bank base rate (i.e., the main official interest rate). The two-week deposit instrument was terminated in April 2016. In October 2016, the NBH began limiting the amount of bids by banks accepted at the three-month deposit tender. Subsequently, the three-month central bank deposits were terminated by the end of December 2018.
Furthermore, the NBH reduced the volatility of overnight interest rates by maintaining an interest rate band around the central bank base rate.
Since 2009, the interest rate corridor around the central bank base rate was plus or minus 100 basis points. As a result, for NBH’s counterparties, the interest rate on the overnight deposit facility was 100 basis points lower, and on the overnight collateralized loan it was 100 basis points higher than the central bank base rate. On September 24, 2015, the Monetary Council announced that effective September 25, 2015 the interest rate corridor was shifted downwards. Since then, the Monetary Council has modified the interest rate corridor around the central bank base rate several times. The following table sets forth changes of the central bank base rate, the interest rate on the overnight deposit facility and the overnight interest rate on collateralized loans:
| Date | | Central bank
base rate | | | Interest rate on
O/N collateralized
loan | | | Interest rate on
O/N deposit | |
| | | | | | percent | | | | |
| September 25, 2015 | | | 1.35 | | | | 2.10 | | | | 0.10 | |
| March 23, 2016 | | | 1.20 | | | | 1.45 | | | | (0.05 | ) |
| April 27, 2016 | | | 1.05 | | | | 1.30 | | | | (0.05 | ) |
| May 25, 2016 | | | 0.90 | | | | 1.15 | | | | (0.05 | ) |
| October 26, 2016 | | | 0.90 | | | | 1.05 | | | | (0.05 | ) |
| November 23, 2016 | | | 0.90 | | | | 0.90 | | | | (0.05 | ) |
| September 20, 2017 | | | 0.90 | | | | 0.90 | | | | (0.15 | ) |
| March 27, 2019 | | | 0.90 | | | | 0.90 | | | | (0.05 | ) |
| April 8, 2020 | | | 0.90 | | | | 1.85 | | | | (0.05 | ) |
| June 24, 2020 | | | 0.75 | | | | 1.85 | | | | (0.05 | ) |
| July 22, 2020 | | | 0.60 | | | | 1.85 | | | | (0.05 | ) |
Source: NBH
The following table sets forth indicative interest rates of the NBH as of the dates shown:
Table 32: Selected Interest Rates
| | | As of December 31, | |
| | | 2015 | | | 2016 | | | 2017 | | | 2018 | | | 2019 | |
| | | (percent) | |
| Central bank base rate | | | 1.35 | | | | 0.90 | | | | 0.90 | | | | 0.90 | | | | 0.90 | |
| Real rate(1) | | | 0.4 | | | | (0.9 | ) | | | (1.2 | ) | | | (1.8 | ) | | | (3.0 | ) |
Sources: CSO, NBH
Note:—
| (1) | The real rate is calculated as follows: (1 + central bank base rate)/(1 + year-on-year inflation rate as of year-end) – 1, where interest rates are expressed as decimal numbers. |
Minimum Reserves System
The NBH introduced a minimum reserves system in 1987. Since May 1, 2004 (the date of Hungary’s accession to the EU), the reserves have carried an interest rate equal to the central bank base rate. As a result, the profitability of the banks increased, and the indirect taxation of banks was eliminated in accordance with the guidelines of the European Central Bank (the “ECB”). On November 24, 2008, the Monetary Council decided to reduce the required reserve ratio from 5% to 2% in order to support domestic credit institutions’ forint liquidity. The 2% reserve ratio applied by the NBH is equal to the reserve ratio applied by the ECB. As of September 6, 2010, all credit institutions subject to reserve requirements were free to decide whether they wanted to satisfy their reserve requirements at the then-current 2% or a higher reserve ratio. Beginning with the November 2010 maintenance period, credit institutions subject to reserve requirements were permitted to choose a 2%, 3%, 4% or 5% reserve ratio, and could alter their choice of the reserve ratio twice a year, in April and October. The method of calculating reserves remained unchanged. Therefore, required reserves were equal to the product of the reserve base and the chosen reserve ratio.
Since December 1, 2015, the reserve ratio was set at 2% and subsequently, on December 1, 2016, the reserve ratio was reduced to 1%.
Exchange Rate Policy
On February 25, 2008, in agreement with the Government, the Monetary Council decided to abandon the flexible peg of the forint to the euro within a fluctuation band and adopt a floating exchange rate regime, effective February 26, 2008. According to the Monetary Council, the floating exchange rate regime provides NBH with better conditions to achieve its inflation target and, therefore, to meet the nominal convergence criteria to enter into the European Exchange Rate Mechanism II (“ERM II”).
Money Supply
The NBH does not use money supply targets as an instrument of monetary policy. The money supply flexibly adjusts to the money demand, which is indirectly influenced by monetary policy. Increases in monetary aggregates are slowing due to the decrease in the rate of inflation.
The following table provides information about the composition of the money supply as of the dates indicated:
Table 33: Money Supply
| | | As of December 31, | | | As of
July 31, | |
| | | 2015 | | | 2016 | | | 2017 | | | 2018 | | | 2019 | | | 2020 | |
| | | (HUF billions) | |
| M1(1) | | | 13,226 | | | | 16,306 | | | | 19,360 | | | | 21,971 | | | | 24,491 | | | | 26,321 | |
| Deposits with agreed maturity up to two years | | | 5,331 | | | | 4,083 | | | | 3,045 | | | | 3,241 | | | | 3,119 | | | | 3,316 | |
| M2(2) | | | 18,557 | | | | 20,389 | | | | 22,405 | | | | 25,212 | | | | 27,610 | | | | 29,638 | |
| Repos, money market units and debt securities up to two years | | | 1,305 | | | | 875 | | | | 523 | | | | 424 | | | | 114 | | | | 68 | |
| M3(3) | | | 19,862 | | | | 21,264 | | | | 22,928 | | | | 25,637 | | | | 27,724 | | | | 29,422 | |
Source: NBH
Notes:—
| (1) | Consists of currency in circulation outside monetary financial institutions plus overnight deposits. |
| (2) | Consists of M1 plus deposits with fixed terms of up to two years. |
| (3) | Consists of M2 plus repos, money market funds and debt securities with maturities of up to two years. |
Since the decline of the global economy in 2008, the NBH has promoted a monetary policy to bolster Hungary’s domestic banking sector. It has introduced new instruments to provide forint and foreign currency liquidity. The NBH has also broadened the range of eligible collateral for bank operations, extended the maturity of tenders for forint loans and foreign exchange (“FX”) swaps and reduced the mandatory reserve ratio. Other contributory factors to the continuing financial stability of the domestic banking sector include access to liquidity resulting from the financial support package provided by the IMF and the EU, as well as the financial commitment provided by foreign banks to their Hungarian bank subsidiaries.
Since June 2014, the potential instruments of the NBH include a floating-rate long-term collateralized forint loan facility, designed to improve access to forint liquidity.
Funding for Growth Scheme
Following the Monetary Council’s decision at its meeting on April 4, 2013, the Governor of the NBH announced the launch of the Funding for Growth Scheme. Following the announcement, the NBH conducted consultations with financial and business sector representatives and worked out the details of the scheme by taking into account the issues that arose through the consultations. These updates were approved by the Monetary Council on April 30, 2013. The Funding for Growth Scheme consists of three pillars and was completed as of August 30, 2013.
Under the first pillar, the NBH stood ready to provide collateralized refinancing loans to its monetary policy counterparties up to a total amount of HUF250 billion over a period of three months (from June 1, 2013 to August 30, 2013). The refinancing loans could be collateralized—with a haircut—by the loans that the credit institutions lend to SMEs under the Funding for Growth Scheme. The interest rate is 0% over the term of the loan. The counterparties of the NBH had equal conditions of access to the refinancing loan facility. Participation in the scheme was voluntary. Credit institutions wishing to participate in the first pillar were allowed to lend further preferential financing from the NBH to SMEs by charging an interest rate margin of a maximum of 2.5%. The interest rate margin must include all fees and commissions as well as the costs of a potential credit guarantee. The initial maturity of refinancing loans provided to credit institutions was a maximum of 10 years and was equal to the term of the loans to be provided to SMEs, which credit institutions will be free to tailor to the needs of borrowers. SMEs were allowed to use preferential rate loans exclusively to finance investment, to invest in working capital, contribute to and prepay EU financial support and to redeem such loans. In the case of redemption, the preferential loans could have been claimed not only at the bank that lent the existing loan but at all of the credit institutions taking part in the Funding for Growth Scheme.
Under the second pillar of the Funding for Growth Scheme, the NBH provided refinancing loans to convert foreign currency loans of SMEs into forint loans. The parameters of the refinancing facility and the conditions to access were identical to those described above for the first pillar. If a loan for early repayment was taken out at the same bank where the enterprise has its foreign currency loan, the NBH provided foreign currency to the bank at market rates from its foreign exchange reserves, in order to prevent the purchase of foreign currency from resulting in volatility of the forint exchange rate. The credit institutions had to commit to use the foreign currency purchased from the NBH to repay their short-term external liabilities. As a result of the foreign currency conversion by the NBH, the short-term foreign currency debt and foreign exchange reserves of the country declined to the same extent and Hungary’s reserve adequacy remained unchanged.
The aim of the third pillar of the Funding for Growth Scheme was to reduce Hungary’s gross external debt and the outstanding stock of two-week NBH bonds. The two main instruments to achieve this goal are (i) the NBH’s entering into FX swaps using its foreign exchange reserves and (ii) increased forint financing in the public sector.
On September 2, 2014, the Monetary Council announced an extension of the second phase of the Funding for Growth Scheme from HUF500 billion to HUF1,000 billion.
As of December 31, 2015, credit institutions participating in the second phase of the Funding for Growth Scheme had entered into contracts for a cumulative total amount of HUF1,402.1 billion. Of this amount, credit institutions had disbursed HUF1,330.5 billion to SMEs as of December 31, 2015.
On February 18, 2015, the NBH announced the extension of the Funding for Growth Scheme (“FGS+”). As part of its monetary policy instruments, the NBH provided liquidity to credit institutions against eligible collateral under the FGS+. Counterparties used this refinancing to expand their lending to SMEs, while the NBH assumed SME credit risk from credit institutions for a limited time and to a limited extent and amount. Under the FGS+, the NBH assumed 50% of credit losses from credit institutions, but only for up to a five-year period and maximum annually of 2.5% of the loans outstanding of the participating individual credit institutions.
On April 22, 2015, the Monetary Council extended the deadline to draw down the loans allocated in the Funding for Growth Scheme and the FGS+ to December 31, 2016. In addition, the fee for credit enhancing guarantees is not included in the loan yield maximum of 2.5%.
On October 13, 2016, the NBH announced that it would reallocate HUF60 billion, originally allotted to the second pillar, to the third phase of the Funding for Growth Scheme. According to the announcement, the participating credit institutions were entitled to draw down the reallocated amount in the first or the second pillar providing local or foreign currency denominated loans. The draw-down period for loans in the second phase of FGS and FGS+ was extended by six months to June 30, 2017, and the draw-down period for loans in the third phase of the Funding for Growth Scheme was extended to June 29, 2018.
On September 18, 2018, the Monetary Council announced the introduction of the FGS fix, which went into effect in 2019. The NBH sterilizes the liquidity provided under this program by a preferential deposit facility bearing interest at the central bank base rate. The Monetary Council launched the FGS fix with a total amount of HUF1,000 billion in early 2019. In terms of its most important parameters and operation, the new scheme was identical with the previous phases of the Funding for Growth Scheme.
On June 2, 2020, the NBH announced that credit institutions participating in FGS fix had concluded loan or leasing contracts in the amount of HUF564 billion as of May 29, 2020. The outstanding amount was HUF405 billion.
Growth Supporting Program
In January 2016, the NBH launched its Growth Supporting Program (“GSP”) designed to help domestic banks return to market-based financing by gradually phasing out the Funding for Growth Scheme and by announcing a new Market-Based Lending Scheme (“MLS”) providing a positive incentive for banks to boost their lending. In the preparatory phase of the Growth Supporting Program, several rounds of constructive consultations were held between the Hungarian Banking Association and the NBH. The NBH took into account banks’ suggestions falling within the central bank objectives and incorporated a large part of them into its program.
As a result of the above programs, the volume of corporate and targeted SME loans was expected to increase by HUF250–400 billion in 2016. By having access to the NBH’s new instruments, the banks participating in the MLS were to undertake a specified quantity of lending, thereby making it possible to draw a distinction between those banks that are active participants and those that are passive participants in the credit market.
As part of the GSP, the NBH launched the third, phasing-out stage of FGS+, consisting of two pillars. Within this framework, domestic SMEs had the opportunity to borrow from banks in the period from early January 2016 to the end of December 2016. Both pillars were announced with an overall amount of HUF300 billion.
Under Pillar 1, the NBH provided refinancing for credit institutions at a 0% interest rate, similar to the previous two phases, which they could on-lend to enterprises at a maximum 2.5% interest rate. Compared with the second phase, the range of credit objectives was reduced and the maximum amount of loans was lowered to HUF1 billion, in order to ensure that the new funding limit allows for as wide as possible a range of smaller participants to implement their investment projects.
Under Pillar 2, the NBH aimed to manage market distortions in long-term foreign currency lending, as enterprises with mainly foreign currency revenues have so far had only limited access to the scheme, while they have had access to financing on more unfavorable terms relative to their foreign competitors. The NBH also provided funding to credit institutions at a 0% interest rate, which it converted into Euros against its foreign exchange reserves in the form of a market-priced currency swap. Credit institutions were able to on-lend the funds they receive under the scheme to SMEs with natural foreign currency hedging at a maximum 2.5% interest rate.
Simultaneously with the gradual phasing-out of FGS+, the NBH announced a new package of measures containing positive incentives, supporting banks in switching to market-based lending, in order to reduce risks of low lending activity. The MLS consists of the following three elements:
| | (1) | supplementing the central bank instruments with an interest rate swap conditional on lending activity (“LIRS”) and a preferential deposit facility; |
| | (2) | creating incentives through capital adequacy requirements for banks; |
| | (3) | providing an opportunity for the banking sector to have access to the corporate credit reporting system. |
The instruments supplementing the central bank instruments provided an incentive for lending through the conditions of access, as the credit institutions participating in the program undertook to increase the volume of lending to SMEs. LIRS promoted lending by managing interest rate risks, through the partial assumption of such risks by the NBH. The overall amount allocated under LIRS was HUF1,000 billion, which was available to banks for a limited period during 2016 and at a maximum maturity of three years. Between January 1, 2016, and March 31, 2016, the allotted amount reached HUF779.6 billion. A condition of access to the facility was that banks increase their stock of (performing) loans to SMEs by one-quarter of the allocated amount annually, i.e. by HUF250 billion if the facility is fully allocated. The preferential deposit facility was a supplementary instrument, under which banks were able to place part of their liquidity in excess of the amount of required reserves on their current accounts at the NBH’s central bank base rate. The expected decline in banking sector liquidity gives a higher value to the liquidity-enhancing instruments, including the preferential deposit facility. The overall amount of preferential deposit facility introduced as a supplementary instrument was HUF500 billion.
Incentives through capital adequacy requirements for banks were also designed to contribute to an expansion in lending. A business model preferring sustainable lending to SMEs may pose smaller risks to a bank’s operations.
The gradual phasing-out of FGS+ and the introduction of the lending interest rate swaps and the preferential deposit facility was projected to raise the stock of lending to SMEs by some HUF250–400 billion in 2016.
On March 31, 2017, the Funding for Growth Scheme was terminated. From January 1, 2016 to March 31, 2017, credit institutions participating in the third phase of the FGS concluded contracts for a total amount of HUF685 billion, in 21,766 transactions with 13,934 enterprises. The total loan stock effectively outstanding – that is the loan amount not including repaid installments and undrawn parts – amounts to HUF442 billion. Since June 2013, 39,253 enterprises obtained financing amounting to almost HUF2,811 billion in the three phases of the FGS and in the FGS+ altogether.
On April 20, 2020, as part of its response to the economic effects of the COVID-19 pandemic, and to ensure access to required, affordable funding for domestic small and medium-sized enterprises, the Monetary Council announced the launch of the Funding for Growth Scheme Go! (“FGS Go!”), raising the allocation amount by HUF1,000 billion. Including the HUF500 billion undrawn under the FGS fix, the NBH will make available up to HUF1,500 billion to lend to the SME sector at a low cost under the FGS Go! program. The new scheme is identical to the earlier phases of the FGS in terms of its key parameters and the method of implementation.
Further, the NBH decided to sterilize the additional money created under the FGS Go! program using its preferential deposit facility and announced an interest rate of 4% (higher than the base rate) for additions to the stocks of loans and bonds made after April 7, 2020 under the FGS Go! program.
MARK Zrt.
On February 10, 2016, the NBH announced that according to a decision by the EU, MARK Zrt. (Hungarian Restructuring and Debt Management Company) could begin purchasing distressed commercial real estate assets from banks. The operation of the asset management company established by the central bank, pursuant to supporting its macroprudential legal mandate, was enacted to give a significant boost to the clean-up of non-performing bank portfolios, and contribute to a revival in bank lending and a recovery of the real estate market from recession. Since MARK Zrt. purchased assets at market price, based on the validation of the European Commission, the planned asset acquisition program did not contain state aid.
On April 10, 2017, the NBH announced that it intended to sell MARK Zrt. to APS Investment s. r. o.; subsequently, the transaction was concluded.
Swaps
In June 2014, the NBH introduced a forint interest rate swap facility, which enabled the counterparties of the NBH to mitigate the interest rate risk of long-term forint-denominated assets newly purchased or held.
The NBH also maintains an asset swap facility. Under this facility, the counterparties of the NBH are able to obtain foreign currency-denominated securities in exchange for long-term forint-denominated securities, which improves access to foreign exchange liquidity.
On July 7, 2015, the NBH announced the introduction of an interest rate swap facility with ten-year maturity, in addition to the three and five-year maturities already applied. The NBH decided to extend the maturity of interest rate swaps after consultations with banks. The longer-maturity interest rate swap was intended to fit easily into the self-financing scheme and was expected to contribute to the stabilization of government debt financing. As of July 7, 2015, the outstanding amount of swaps used by the majority of banks was nearly HUF550 billion. Demand for interest rate swaps increased again following the announcement of changes to the NBH’s monetary policy instruments. Banks have not only increased their holdings of government securities in return for the use of the NBH interest rate swap, but have also undertaken to maintain their existing government securities holdings for a sustained period.
On May 10, 2016, the NBH announced that the interest rate swap tenders introduced as part of the Self-Financing Program launched in spring of 2014 would be terminated in July 2016. The NBH withdrew the instrument from its operations and held its last interest rate swap tender on July 7, 2016. Banks’ obligation to hold government securities will remain valid until maturity of the swaps.
On October 17, 2016, the NBH introduced new monetary policy instruments for fine-tuning the liquidity on the interbank market, to be used on an ad hoc basis. The two new instruments were an overnight deposit instrument that pays the central bank base rate and a forint liquidity providing swap instrument allocated in a competitive tender.
The following table sets forth the stock of FX swaps used for fine-tuning the liquidity on the interbank market:
| | | Outstanding as of end
of the period indicated | |
| | | HUF billions | |
| 2016 | | 401 | |
| 2017 | | | 1,518 | |
| 2018 | | | 1,987 | |
| January 2019 | | | 1,987 | |
| February 2019 | | | 1,988 | |
| March 2019 | | | 1,989 | |
| April 2019 | | | 1,810 | |
| May 2019 | | | 1,725 | |
| June 2019 | | | 1,725 | |
| July 2019 | | | 1,704 | |
| August 2019 | | | 2,205 | |
| September 2019 | | | 2,024 | |
| October 2019 | | | 2,174 | |
| November 2019 | | | 2,274 | |
| December 2019 | | | 2,273 | |
Source: NBH
On January 18, 2018, the NBH held its first MIRS tender, and continued to hold fixed-rate tenders every two weeks, until the end of 2018, when the Monetary Council decided to phase out MIRS tenders. The Monetary Council set the annual maximum stock of MIRS equity for 2018 at HUF1,100 billion.
Regulations to Enhance Financial Stability
In December 2009, the Government introduced regulatory changes in an effort to enhance financial stability through more stringent regulation of the financial sector and lending practices. The Government implemented the following regulatory reforms:
| | · | Legislation on strengthening the institutional framework for financial supervision was approved by Parliament in December 2009. In line with this legislation, the HFSA was upgraded to an autonomous institution accountable to Parliament and controlling its own budget and human resources (including recruitment and lay-off of employees). Also, the Financial Stability Council (“FSC”) was established for the purpose of providing continuous valuation of the markets supervised by the HFSA. The members of FSC are the Chairman of the HFSA, the Governor of the NBH and the Minister responsible for regulation of financial, capital and insurance markets, which was the Minister for National Economy. Legislation was also enacted granting the FSC and the NBH the right to propose regulations to the Government or to any member of the Government and to initiate parliamentary legislation at the Government level on a “comply or explain” basis, i.e., Government officials are obliged either to adopt the proposal within 15 days, or to publicly explain the rationale for disagreeing with the proposal. When the Central Bank Act of Hungary became effective on October 1, 2013, the NBH assumed the role of the HFSA. The members of the FSC became the Governor of the NBH (as chairman), the Deputy Governors of the NBH and the directors designated by the Governor of the NBH. The representative of the Minister of Finance (previously the representative of the Minister for National Economy) and other external experts are invited by the Governor participate in meetings of FSC. The FSC holds meetings once every two months and may schedule additional meetings as needed. |
| | · | A set of amendments to the Law on Credit Institutions and Financial Enterprises was also enacted by Parliament in December 2009. These amendments, among other things, establish a regime for the removal of bank executives that no longer meet “fit and proper” criteria, stipulate an additional lower mandatory threshold for the appointment of a supervisory commissioner by the HFSA (i.e., the capital adequacy ratio falling below 4%), and clarify that only the HFSA has the power to initiate liquidation proceedings with respect to financial institutions. As described above, this role is now undertaken by the NBH. |
| | · | Though large-scale defaults on household loans have been avoided, the Government developed separate regulations to reduce risks related to lending to households in foreign currency. These regulations prescribe lower loan-to-value ratios for foreign currency loans than for forint loans, and prescribe changes to banks’ scoring systems for the approval of household loans, which imply lower monthly installments for foreign currency loans than for forint loans. |
Mortgage Lending Regulations
Based on decisions by the Monetary Council, the NBH has been helping the Hungarian banking system phase out household foreign currency loans, including their settlement and conversion into Hungarian forint, since 2014 in order to overcome unfair applications of foreign exchange spreads which increased the payments required under such loans.
Exchange rate risk no longer places a burden on households and, indirectly, on the banking sector. However, significant liquidity risks have arisen in the banking sector as a side-effect of the conversion. The reason for this is that the overwhelming majority of mortgage loans converted into forint have maturities of more than ten years, while the banking sector’s forint liabilities, typically in the form of deposits, have maturities of less than one year. To reduce the maturity mismatch, the NBH introduced the Mortgage Funding Adequacy Ratio (“MFAR”), a prospective requirement for banks to issue long-term securities, which may appear in the market mainly in the form of mortgage bonds, in 2016.
The new ratio is defined on a consolidated level as forint liabilities backed by household mortgage loans (e.g. mortgage bonds, other securities backed by household mortgage loans and refinancing mortgage loans extended by a mortgage bank) divided by the net stock of residential forint mortgage loans with residual maturity of more than one year. The required minimum level for the MFAR was initially set at 15%, i.e. at least 15% of mortgage loans must be financed by long-term liabilities. Following the Financial Stability Council’s decision, the required minimum level of the MFAR was increased from 15% to 20% as of October 1, 2018.
On January 11, 2019, the NBH announced a revision of the MFAR regulation. In addition to raising the required MFAR level to 25%, the amendment increased the required minimum maturity of accepted funds to 3 years and strengthened the quality requirements of eligible mortgage bonds. The amendments went into effect in two phases, with the first phase becoming effective on February 1, 2019, and the second phase becoming effective on October 1, 2019.
Additionally, to prevent excessive household indebtedness and a renewed build-up of foreign currency loans in the future, the NBH introduced a debt cap regulation on January 1, 2015. Under the debt cap regulation, the payment-to-income ratio (“PTI”) limits the maximum initial debt-servicing burden as a percentage of customers’ regular legal income, thereby moderating the accumulation of household debt. The loan-to-value ratio (“LTV”) caps the maximum amount of secured household lending (e.g., mortgage loans) as a percentage of the value of collateral (the value of the property).
Banks are required to calculate the PTI ratio for all new borrowing (consumption loans, mortgage loans, car loans, etc.) in excess of HUF200,000. The ratio takes into account repayment amounts in respect of all existing loans of the borrower; and only proven net income (wage, pension, family allowance, etc.) can be included in disposable income. Initially, the PTI ratio for all new forint loans taken out after January 1, 2015 could not exceed 50% and, for high-income borrowers (i.e., for those with a HUF400,000 net salary or above), it could not be higher than 60%. If there is more than one debtor, incomes and debt burdens are treated on an aggregate basis. Due to the laxer limits applied to forint loans, the new regulation presumably will not lead to a cut-back on lending; however, if an excessive increase in household borrowing is perceived by the NBH, the limits can be tightened at any time. PTI limits on euro and other foreign currency loans are much stricter, in order to offset the negative effects of potential exchange rate depreciation: 25% and 10% and, for higher-income customers, 30% and 15%, respectively.
On June 18, 2018, the NBH’s FSB decided to modify the debt cap rules relating to the PTI. Such modifications stipulated that, from October 1, 2018, the amount of monthly instalments of HUF-denominated mortgage loans with interest rate fixing periods of less than five years may not exceed 25% – or in the case of monthly income above HUF500,000, 30% – of borrowers’ regular monthly net income. The ratios for mortgage loans with interest rate fixing periods of more than five years but less than ten years may be 35% and 40%, respectively. Due to the lower interest rate risk, PTI limits on forint mortgage loans with interest rates initially fixed at least for ten years or for the full term of the loan were left unchanged at 50% and 60%, respectively. In the case of lending in currencies other than HUF, lower limits must also be applied to mortgage loans with shorter interest rate fixing periods. Simultaneously, the preferential 85% weight calculation currently used for instalments of mortgage loans with interest rate fixing periods of at least five years would be withdrawn.
The following table sets forth the PTI rules effective from October 1, 2018:
| | | Interest rate fixation period | |
| | | Less than five
years | | | At least five
years, but less
than ten years | | | At least ten
years
or fixed for
the
whole term | |
| PTI limits for HUF mortgage loans | | | | | | | | | | | | |
| Monthly net income below HUF 400,000 | | | 25 | % | | | 35 | % | | | 50 | % |
| Monthly net income at least HUF 400,000 | | | 30 | % | | | 40 | % | | | 60 | % |
The LTV ratios have been transposed into the NBH Decree, in order to ensure the continuity of the regulation. The NBH consulted with the ECB, which, in its opinion issued on June 23, 2014, gave a positive assessment of the contents of the draft Decree and its expected contribution to strengthening the stability of the domestic financial system. The NBH also consulted with market participants, and several remarks were incorporated into the draft regulation, thereby facilitating the smooth application of the Decree in the future.
The following table sets forth the required ratios under the NBH Decree:
Table 35: Required Loan-to-Value Ratios
| | | | | | HUF | | | EUR | | | Other
currency | |
| | | | Under HUF400,000 monthly income | | | 50 | % | | | 25 | % | | | 10 | % |
| PTI | | | At HUF400,000 monthly income or above | | | 60 | % | | | 30 | % | | | 15 | % |
| | | | Mortgage lending | | | 80 | % | | | 50 | % | | | 35 | % |
| LTV(1) | | | Car loans | | | 75 | % | | | 45 | % | | | 30 | % |
Source: NBH
Note:—
| (1) | LTV caps 5 percentage point higher can be applied to financial leasing. |
Foreign Funding Adequacy Ratio
The foreign funding adequacy ratio (“FFAR”) was introduced on July 1, 2012, in order to mitigate liquidity risks. The NBH has revised the content of the FFAR, its required level and the range of financial institutions subjected to the regulation. The revision has resulted in a change in the required minimum level of the FFAR and provided for its gradual increase. The adequacy ratio was raised from 65% to 75% on July 1, 2014, and thereafter by 5 percentage points semi-annually to 100% by January 1, 2017. In addition to the revision of the required minimum level, the effect of the regulation has been extended to Hungarian branches of foreign credit institutions.
On July 7, 2015, the NBH introduced new regulations intended to reduce external vulnerability. The NBH’s Financial Stability Board adopted decrees tightening the FFAR and introducing the foreign exchange coverage ratio (“FECR”). After the tightening of the FFAR, outstanding swaps can no longer be included in the ratio. The new FECR regulation limits the on-balance sheet currency mismatch to 15% of the balance sheet total, thereby reducing excessive reliance by banks on the swap market. The new NBH Decrees took effect on January 1, 2016.
On June 29, 2018, the NBH announced the modification of the regulation on FFAR. The amendment, which took effect from July 1, 2018, was intended to help banks prepare for the imposition of future EU requirements.
As of March 19, 2020, for purposes of the FFAR calculation, weights attributed to liabilities with more than a one-year maturity will be differentiated based on maturity. Additionally, the FECR was decreased from 15% to 10%.
Liquidity Coverage Requirement
On August 25, 2015, the NBH announced that it would accelerate implementation of the Liquidity Coverage Requirement to help enhance the domestic banking sector’s shock-resilience. Credit institutions were required to comply with the requirement from April 1, 2016. As the requirement became effective, the balance sheet coverage ratio and the deposit coverage ratio ceased to function and were phased out from January 1, 2016.
Systemic Risk Buffer
On November 18, 2015, the NBH announced that it had decided to introduce the Systemic Risk Buffer (“SRB”) in order to manage the risk arising from the persistently high amount and institutional concentration of problem project loans posing a key financial stability risk. The rate of the SRB was set in proportion to each individual institution’s contribution to systemic risk, and derived from the ratio of problem project loans to the domestic Pillar 1 capital requirement. The SRB was applied individually, between 0 and 2% of total domestic risk-weighted assets, and credit institutions are required to build it up at consolidated level, from Common Equity Tier 1 (“CET1”) capital, in addition to other capital buffers. A ‘de minimis’ threshold was also introduced in order to take into account systematically relevant assets; as a result, institutions with problem project exposures below HUF5 billion are exempted from the SRB requirement.
The NBH set the SRB for institutions in the form of individual decisions in the final quarter of 2016. Institutions have been required to comply with the new capital buffer requirements from January 1, 2017. This schedule was intended to allow adequate time for banks to accommodate, i.e. to effectively clean up their non-performing project loans. Even if the clean-up of portfolios did not take place, the additional capital requirement could strengthen the stability of the domestic financial intermediary system by improving the banks’ resilience to shocks. To the extent credit institutions swept out their problem portfolio by January 1, 2017, the new capital requirement was not binding for them. The NBH has held consultations with the European authorities and market participants on these capital requirements.
On September 16, 2019, the Financial Stability Council of the NBH amended the SRB requirement, effective as of January 1, 2020. While calculating the capital requirement, the NBH will take into account not only problem project loans but also non-problem foreign currency project loans in the future to prevent the potential re-emergence of systemic risks related to the unhealthy structure of commercial real estate project financing.
On December 16, 2019, the NBH announced that it would not require any credit institution to maintain an SRB after January 1, 2020.
As part of its COVID-19 mitigation measures, the NBH has exempted exposure commercial real estate loans from the SRB regulation through the end of 2020.
Capital Buffer Requirements
On December 15, 2015, the NBH introduced the countercyclical capital buffer. According to the NBH, no excessive credit growth was observed in the Hungarian banking system at that time, thus the central bank set the countercyclical capital buffer rate to 0% from January 1, 2016. The buffer rate remained unchanged at 0% through December 31, 2019.
On October 24, 2016, the NBH’s Financial Stability Board (“FSB”) decided to introduce the capital buffer for other systemically important institutions and the systemic risk buffer gradually and at a later stage. The capital add-on for systemically important institutions is to be introduced in a gradually increasing manner over a four-year period from 2017. The banks that will be required to build the systemic risk buffer to mitigate risks in relation to problem project loans will have to meet their obligations from July 1, 2017, i.e. six months later than originally scheduled.
The NBH’s FSB identified nine Hungarian banks as other systematically important institutions. In order to improve their resilience to shocks and strengthen investors’ and consumers’ confidence in financial markets, the FSB decided in the autumn of 2015 to introduce an additional capital buffer requirement. At a consolidated level, other systemically important institutions are required to hold an additional capital buffer of a maximum of 2% of their total risk-weighted assets. This buffer must be in the form of CET1 capital and sits on top of other buffers. The credit institutions concerned had to meet the new capital buffer requirement from January 1, 2017. Capital buffer requirements for other systemically important institutions were set individually, in the form of NBH Decrees, in the third quarter of 2016, based on audited data for the end of 2015. The NBH reviews the range of systemically important institutions and individual capital buffer rates annually.
On September 30, 2019, NBH announced that its Financial Stability Council had decided to maintain the countercyclical capital buffer rate applicable to domestic exposures at 0%.
On March 30, 2020, the NBH announced that the countercyclical capital buffer rate would remain at 0% after April 1, 2020. In addition, the NBH set the capital buffer rates for other systematically important institutions to 0% from July 1, 2020, until the end of 2020.
On December 2, 2019, the NBH reviewed the list of other systemically important institutions domiciled in Hungary. The following table sets forth the scheduling of capital buffer rates for those institutions:
Table 36: Capital Buffer Rates
| | | Capital buffer
rate | |
| Institution | | 2020 | |
| OTP Bank Nyrt. | | | 2.00 | % |
| UniCredit Bank Hungary Zrt. | | | 1.00 | % |
| Kereskedelmi és Hitelbank Zrt. | | | 1.00 | % |
| ERSTE BANK HUNGARY Zrt. | | | 0.50 | % |
| Raiffeisen Bank Zrt. | | | 0.50 | % |
| Magyar Takarékszövetkezeti Bank Zrt. | | | 0.50 | % |
| MKB Bank Zrt. | | | 0.50 | % |
| CIB Bank Zrt. | | | 0.50 | % |
Source: NBH
Interbank Funding Ratio
On March 28, 2018, the Monetary Council announced the introduction of a subsequent targeted macroprudential measure, the Interbank Funding Ratio (“IFR”). The measure became effective from July 1, 2018. The ratio limits funds from financial corporations, weighted according to currency and residual maturity. The ratio considers all funding received from financial corporations, but exceptions and benefits ensure that the requirement does not materially affect normal banking operations. Based on available data as of the end of March 2018, the 30% upper limit effective from July 1, 2018, would not require adjustment for the overwhelming majority of institutions; it would nevertheless act as a barrier to the build-up of excessive reliance on wholesale funding.
Mortgage Bond Market Development
In 2010, the NBH implemented a mortgage bond purchase program as a new monetary policy tool to support the development of the domestic forint mortgage lending and mortgage bond. Under the program, the NBH purchased forint mortgage bonds and undertook regulatory initiatives to develop the domestic forint mortgage lending market.
On February 15, 2012, the NBH announced that it was prepared to offset the recent weakening in banks’ capacity to lend by introducing a two-year collateralized credit facility and a new universal mortgage bond purchase scheme and by expanding the range of eligible collateral.
According to the announcement, the NBH intended to provide two-year variable-rate refinancing to credit institutions at its prevailing policy rate against securities delivered as collateral. The conditions for the provision of such refinancing had been designed to facilitate an expansion in bank lending to the corporate sector. The new instrument conforms to international practice adopted to offset a weakening in the banking sector’s capacity to lend and allows banks to access financing at maturities of limited availability in the market without the need to pay a term premium on longer-term funding. By providing a long-term lending facility, the NBH expected to contribute to a strengthening in banks’ balance sheets through an improvement in the maturity match between assets and liabilities, which in turn may offset the decline in lending activity.
In addition, the NBH intended to promote lending to the household sector by introducing a universal mortgage bond purchase scheme. According to the statement, mortgage bonds are a key factor contributing to an improvement in the maturity match between assets and liabilities. In the view of the NBH, a universal structure for mortgage bond issuance may foster the development of a more efficient mortgage bond market.
In addition to the above, by expanding the range of eligible collateral, the NBH can alleviate liquidity constraints potentially impeding lending to the corporate and household sectors through an increase in banks’ liquidity buffers. According to the statement, extending the right to issue mortgage bonds may be an important support in this area, as a result of an increase in the outstanding amount of mortgage bonds accepted as eligible collateral. Linking the minimum credit rating limit for bank and corporate bonds to the lower rating of government debt instead of the then-current “BBB-” was expected to result in a further easing in conditions.
On September 18, 2018, the Monetary Council made a decision to phase out the mortgage bond purchase program by the end of 2018. The mortgage bond program ended in two stages: purchases in the primary market continued until December 31, 2018, and purchases in the secondary market continued until September 30, 2018.
As part of its measures to combat the economic effects of the COVID-19 pandemic, the Monetary Council restarted its mortgage bond purchase program in 2020. See “—Recent Developments in Monetary Policy” for more information on the current bond purchase program.
Corporate Bond Market Development
The Monetary Council launched its corporate bond purchasing program, with a total amount of HUF300 billion, on July 1, 2019. The objective of the Bond Funding for Growth Scheme (“BGS”) is to promote the diversification of the funding to the domestic corporate sector. Under the program, the NBH will purchase bonds with a rating of at least B+ issued by domestic non-financial corporations with an original maturity between 3 years and 10 years. The NBH will neutralize excess liquidity arising from the bond purchases by using the preferential deposit facility bearing interest at the central bank base rate. The new program complements the FGS Fix launched at the beginning of 2019.
On December 17, 2019, the Monetary Council decided to raise the original total amount of HUF300 billion to HUF450 billion from January 1, 2020, with all other conditions left unchanged. As of November 2019, participating credit institutions concluded loan contracts with domestic SMEs totaling more than HUF340 billion under the BGS.
As part of the Monetary Council’s response to the economic effects of the COVID-19 pandemic, the maximum amount of exposure to a given group of corporations was raised from HUF20 billion to HUF50 billion. Maturities of securities eligible for purchase under the scheme were increased from 10 years to 20 years. The NBH decided to sterilize the additional money created under the BGS using its preferential deposit facility and announced an interest rate of 4% (higher than the base rate) for additions to the stocks of loans and bonds made after April 7, 2020 under the BGS.
On September 22, 2020, the Monetary Council raised the amount available under the Bond Funding for Growth Scheme to HUF750 billion.
Green Finance
On June 20, 2019, the NBH announced that, following a decision by the Monetary Council, a dedicated green bond portfolio within the NBH’s foreign exchange reserves would be created in the near future. The NBH intends to facilitate a growth in the domestic financial intermediary system’s support of environmental sustainability through its Green Program.
On December 18, 2019, the NBH announced a preferential capital requirement program for credit institutions to support the growth of green financial products and to improve the energy efficiency of the Hungarian building stock. The preferential regulatory treatment will be available for green housing loans granted between January 1, 2020 and December 31, 2023. A consultation with the banking sector will also be launched on the possibilities of introducing green covered bonds in Hungary.
Recent Developments in Monetary Policy
On January 10, 2020, the NBH announced that the People’s Bank of China, the central bank of the People's Republic of China, and the NBH, the central bank of Hungary, renewed their bilateral currency swap agreement, first concluded in 2013, for three years and raising its total amount from CNY 10 billion to CNY 20 billion.
According to an assessment of the Monetary Council, dated March 24, 2020, the global COVID-19 pandemic poses extraordinary challenges to economies around the world. The macroeconomic data for the year 2020 are expected to show significant volatility and dichotomy. In the first half of 2020, growth slowed significantly, reflecting the negative economic effects of the pandemic. Domestic growth, the labor market, lending and foreign trade are expected to pick up again as the negative effects wane and lost economic activity is regained.
To mitigate the pandemic’s negative economic effects and to ensure the required level of liquidity, the NBH decided to implement coordinated measures.
On March 16, 2020, the NBH announced that it would conduct FX swap auctions on a daily basis. In addition to the 1, 3, 6 and 12-month tenders announced every Monday, the NBH will also announce one-week FX swap tenders providing forint liquidity on a daily basis from March 17, 2020 until further notice in order to maintain the appropriate level of liquidity for the banking sector and to smooth liquidity developments. In March 2020, the total stock of central bank FX swap instruments rose by over HUF250 billion to close to HUF2,200 billion.
On March 16, 2020, the NBH called on Hungarian credit institutions to apply a moratorium on repayments to companies in view of the extraordinary situation caused by the ongoing global pandemic. The NBH announced a moratorium on repayment of loans provided through the FGS program allowing banks to restructure these loans and to reschedule payments. The NBH announced that it would accept corporate loans as collateral, with a haircut of 30%. As of March 23, 2020, loans to large companies can be placed as collateral. By expanding the scope of collateral coverage with loans to large corporations, the NBH increased liquidity potentially available for the banking sector by around HUF2,600 billion. In accordance with the proposal of the NBH, the Government announced a moratorium on corporate and household loan repayments as a precautionary restructuring measure to address the temporary difficulties faced by debtors. On September 23, 2020, the term of the moratorium was extended from December 31, 2020 to June 30, 2021 for parents raising children, pensioners, jobseekers, participants in public work schemes and businesses that have experiences a revenue decline of at least 25%.
On March 19, 2020, the FSB of the NBH announced seven measures to mitigate the impacts of the emergency situation related to the COVID-19 outbreak on the financial intermediary system:
| 1) | Exposure to commercial real estate loans is exempt from systemic risk buffer (SRB) regulation until the end of 2020. |
| 2) | Monitoring of banks’ internal capital adequacy (ICAAP) is suspended until September 30, 2020. |
| 3) | Violating Pillar II capital recommendations (P2G) will not cause supervisory action. |
| 4) | Minimum requirements for solvency capital (MREL) for the year 2020 are postponed by six months. |
| 5) | On-site monitoring is postponed by two months, and only the most important off-site monitoring will be performed. |
| 6) | On-site monitoring of adequacy of internal liquidity evaluation procedures (ILAAP) is postponed until December 31, 2020. |
| 7) | Requirements in case of on-going retail mortgage loan applications for real estate evaluations and notarial deeds are suspended but should be obtained after settlement. |
In addition, the NBH took the following steps:
| 1) | Dividend payments are suspended until the end of September 2020. |
| 2) | In calculating FFAR, weights attributed to liabilities with more than a one-year maturity will be differentiated based on maturity. |
| 3) | FECR is decreased from 15% to 10%. |
The measures taken by the FSB of the NBH aim to mitigate the effects of the COVID-19 pandemic on the financial intermediary sector. This package of measures reduces banks’ administrative burden related to bank supervision and ensures flexible adjustment to prudential requirements, e.g. capital requirements, on a temporary basis. Furthermore, the central bank strengthens banks’ capital position and ensures a stable funding structure for banks by modifying macro- and microprudential regulations.
The Monetary Council also took further liquidity-providing measures to enhance the effectiveness of monetary policy. The Monetary Council decided to introduce a new fixed-rate collateralized loan instrument with maturities of three, six and twelve months as well as three and five years. Lending will be provided at a fixed interest rate by the NBH with unlimited liquidity. On April 1, 2020, the NBH announced that publicly available open-ended investment funds would be eligible for the new fixed-rate collateralized loan instrument. In September 2020, the NBH decided that it would only announce tenders of its long-term collateralized lending facility with three and five-year maturities. Weekly tenders with maturities of up to one year, including three, six and twelve-month maturities, would no longer be announced. To achieve technical simplification, investment funds’ indirect access (i.e. through banking sector participants) to the collateralized lending facility will be discontinued. However, direct access will remain available for the investment funds involved.
In addition, the NBH released domestic counterparty credit institutions from their reserve requirements beginning with the reserve maintenance period in March 2020 and lasting until a further decision is made.
On March 30, 2020, the NBH announced that the countercyclical capital buffer rate would remain at 0% after April 1, 2020. In addition, the NBH set the capital buffer rates for other systematically important institutions to 0% from July 1, 2020 until the end of the year 2020.
On April 1, 2020, the NBH announced that it would hold one-week deposit auctions on a weekly basis. The interest rate offered would be the central bank base rate of 0.9%, and the first auction would take place on April 2, 2020. The following table sets forth the amount of one-week deposits as of the end of the periods indicated:
| | | Stock as of end of the month | |
| | | HUF billions | |
| April 2020 | | | 671.5 | |
| May 2020 | | | 1,066.3 | |
| June 2020 | | | 1,646.4 | |
| July 2020 | | | 2,321.7 | |
| August 2020 | | | 2,049.4 | |
| Source: NBH | | | | |
On April 2, 2020, the NBH announced that it would pay a dividend of HUF250 billion to the general government.
On April 7, 2020, the NBH announced the following comprehensive measures to help protect and restart the economy:
| · | The Monetary Council made the interest rate corridor symmetrical. The Monetary Council left the base rate and the overnight deposit rate unchanged at 0.90% and (0.05)% percent, respectively, and raised the overnight and one-week collateralized lending rates to 1.85%. The one-week deposit rate was equal to the 0.90% base rate at the time of the announcement; however, the Monetary Council decided to allow the interest rate on the instrument to deviate from the base rate upward or downward within the interest rate corridor. |
| · | The Monetary Council announced that, effective May 4, 2020, it would (i) launch a government security purchase program in the secondary market to restore the stable liquidity position of the government securities market, and (ii) relaunch its mortgage bond purchase program to improve the long-term supply of funding to the banking sector. The government security purchase program involves fixed-rate forint government securities. To prevent the NBH from becoming a dominant market participant regarding a given government securities series, the amount to be purchased of any securities series may not exceed 33% of stocks outstanding, in line with the European Central Bank’s practices. Consistent with the relevant Hungarian and EU regulations and leading central banks’ practices, the MNB’s government securities purchases take place in the secondary market at regular weekly auctions and in individual secondary market transactions outside the auctions. The NBH makes these purchases at market prices. The NBH will not restrict the scope of maturities of government securities to be purchased; however, the purchases will be focused on securities with a minimum maturity of three years. The range of counterparty institutions, eligible to participate in the program, includes banks and non-banks playing a key role in the government securities market. The Monetary Council considers the government securities purchase program as a safety net, which it intends to use if and to the extent necessary. |
The new, second phase of the mortgage bonds purchase program was launched with broadly identical strategic parameters to those of the successful program of 2018. The NBH also makes purchases in the primary and the secondary markets. Assets to be purchased under this program are fixed-rate forint mortgage bonds with a minimum original maturity of three years, with its total amount being a maximum of 50% of the issued stock.
On August 25, 2020, the NBH announced that, through its government securities purchases program, it had successfully managed to stabilize developments in the government securities market and to reduce yields. After a temporary break, the NBH made targeted government securities purchases in the segment of over 15-year maturities to ensure that the base rate cut affected the longer segment of the yield curve as well. To maintain the effectiveness of monetary transmission and the stable liquidity position of the government securities market, the Monetary Council deems it necessary to increase the amount of weekly government securities purchases, in addition to keeping the long-term collateralized lending facility. The NBH will continue to make purchases in the long-term segment to support an extension in the maturity structure of government debt.
These programs will continue to run as long as warranted by economic and financial developments resulting from the COVID-19 pandemic. The Monetary Council did not set a total amount of purchases for either program. The NBH will perform a technical revision when stock increases reach HUF1,000 billion in case of government securities and HUF300 billion in case of mortgage bonds while continuously monitoring the implementation of the asset purchase programs. The NBH is ready to fine-tune the programs, when necessary, based on updated information.
| · | Further, the Monetary Council announced that beginning with the second quarter of 2020, the NBH would not set a target amount of banking sector liquidity to be crowded out of the instruments bearing interest at the base rate. |
On April 20, 2020, to ensure access to required, affordable funding for domestic small and medium-sized enterprises, the Monetary Council announced the launch of the Funding for Growth Scheme Go! (“FGS Go!”), raising the allocation amount by HUF1,000 billion. Including the HUF500 billion undrawn under the FGS fix, the NBH will make available up to HUF1,500 billion to lend to the SME sector at a low cost under the FGS Go! program. The new scheme is identical to the earlier phases of the FGS in terms of its key parameters and the method of implementation.
The total amount available under the NBH’s corporate bond purchase program, the BGS, would remain unchanged at HUF450 billion. Half of the total amount had already been utilized previously, and as a result, about HUF200 billion was still available for the NBH to purchase bonds issued by non-financial corporations headquartered in Hungary. The maximum amount of exposure to a given group of corporations was raised from HUF20 billion to HUF50 billion. Maturities of securities eligible for purchase under the scheme were increased from 10 years to 20 years. The NBH decided to sterilize the additional money created under the FGS Go! and BGS using the preferential deposit facility. The NBH announced an interest rate of 4% (higher than the base rate) for additions to the stocks of loans and bonds made after April 7, 2020 under the FGS Go! and the BGS.
On April 30, 2020, the NBH announced that the 10 largest asset managers headquartered in Hungary managing public and open-ended investment funds would be included in the group of counterparty institutions participating in the Bond Funding for Growth Scheme and the government securities purchase program. In addition, investment funds will have access to collateralized central bank loans at all maturities, including loans with three and five-year maturities, and the range of eligible collateral has been extended with forint-denominated securities and mutual fund shares issued by investment funds.
Effective as of June 24, 2020, the Monetary Council lowered the central bank base rate from 0.90% to 0.75%, kept the overnight deposit rate unchanged at (0.05)%, and kept the overnight and the one-week collateralized lending rates at 1.85%. On July 21, 2020, the Monetary Council announced that effective July 22, 2020, the central bank base rate would be lowered from 0.75% to 0.60%. The Monetary Council kept the overnight deposit rate unchanged at (0.05)%, and kept the overnight and the one-week collateralized lending rates at 1.85%. The NBH will continue to set the one-week deposit rate at the weekly tenders. On September 22, 2020 the Monetary Council decided to keep the central bank base rate unchanged at 0.60%.
In addition, the Monetary Council decided to reallocate between its instruments affecting longer-term maturities, i.e. its long-term collateralized lending instruments and government securities purchases. Consequently, the NBH will purchase limited amounts of government securities in the segment of over 15-year maturities. In addition to improving the transmission of monetary policy, this measure is intended to support an extension in the maturity structure of government debt.
On July 23, 2020, the NBH announced that international reserves amounted to EUR30.2 billion at the end of June 2020. This level of reserves significantly exceeds all relevant benchmarks.
In addition, the NBH created an international safety net consisting of bilateral swap and repo agreements, which enables the NBH to increase foreign currency liquidity by an amount of up to EUR10 billion within a short time. The components of the safety net are: (i) a repo agreement concluded with the European Central Bank, through which the NBH can provide euro liquidity of up to EUR4 billion to Hungarian financial institutions; (ii) an FX swap agreement concluded with the People’s Bank of China in 2013, which ensures liquidity of some EUR2.5 billion; (iii) a repo agreement concluded with the Bank for International Settlements, making available liquidity of EUR2 billion; and (iv) the repo facility announced by the Federal Reserve, which can provide USD 1-2 billion of liquidity for the NBH. The safety net created by these agreements ensures additional foreign currency liquidity over central bank reserves. By building the safety net, the NBH has significantly increased its room for maneuver and is thereby able to give a quick and firm response to potential tension emerging in any sub-market while maintaining safe levels of international reserves.
On September 8, 2020, the NBH announced a swap instrument providing foreign currency liquidity, to ensure that the volatility of domestic FX swap market yields at the end of the quarter is reduced significantly and that yields are in line with the level of short-term rates set by the Monetary Council. According to the announcement, swap tenders providing central bank foreign currency liquidity will be introduced in necessary cases to facilitate monetary policy transmission, in addition to the regular announcement of swap tenders providing forint liquidity.
Furthermore, the Monetary Council took a decision on several additional technical modifications related to the central bank instruments. Due to a significant expansion in interbank liquidity, the Monetary Council decided to restore the sanctions, suspended on March 24, 2020, in response to the effects arising from the COVID-19 pandemic, to be applied in the event of credit institutions’ reserve deficiency, with effect from October 1, 2020. The Monetary Council also decided that from October 1, 2020, the interest rate on the portion above the reserve requirement on reserve accounts should be the lower of the current central bank overnight deposit rate and 0%.
On September 14, 2020, the NBH conducted fine-tuning FX swap tenders in order to adjust the liquidity on the interbank market. As a result, the forint liquidity provided by the NBH on the market amounted to HUF1,786 billion. During the course of the year, the NBH has conducted fine-tuning FX swap tenders.
On September 18, 2020, the NBH held an FX swap tender providing euro liquidity. The NBH accepted all bids in the amount of EUR575 million (equaling HUF207.23 billion) with a maturity of October 1, 2020. In addition, the central bank announced to hold another FX swap tender on September 25, 2020.
The following table sets forth the monthly data of FX swaps used for fine-tuning the liquidity on the interbank market:
| | | Stock as of end of the month | |
| | | HUF billions | |
| January 2020 | | | 2,185 | |
| February 2020 | | | 1,943 | |
| March 2020 | | | 2,009 | |
| April 2020 | | | 1,929 | |
| May 2020 | | | 1,921 | |
| June 2020 | | | 1,818 | |
| July 2020 | | | 1,787 | |
| August 2020 | | | 1,787 | |
Source: NBH
On September 22, 2020, the Monetary Council raised the amount available under the Bond Funding for Growth Scheme to HUF750 billion.
Exchange Rate Development
According to the National Bank Act, the NBH and the Government jointly determine the framework of the exchange rate regime. The NBH then decides on the exchange rate policy within that framework. Since February 25, 2008, a floating exchange rate regime has been applied.
In the first four months of 2015, the forint strengthened versus the Euro mainly as a result of improving global investor sentiment and improving growth prospects of Hungary, in addition to sound Hungarian fiscal policy. However, from the middle of April to the middle of July 2015, the forint weakened significantly mainly as a result of weakening global investor sentiment. From the middle of July 2015 to the end of December 2015 the foreign exchange rate of the forint versus the euro was stable. On December 31, 2015, the HUF/EUR exchange rate was HUF313.12/EUR.
In 2016 the foreign exchange rate of the forint versus the euro remained relatively stable. On December 31, 2016, the HUF/EUR exchange rate was HUF311.02/EUR.
In 2017, the foreign exchange rate of the forint versus the euro remained relatively stable. On December 31, 2017, the HUF/EUR exchange rate was HUF310.14/EUR.
In 2018, the foreign exchange rate of the forint versus the euro weakened significantly mainly as a result of deteriorating global investor sentiment. On December 31, 2018, the HUF/EUR exchange rate was HUF321.51/EUR.
In 2019, the foreign exchange rate of the forint versus the euro weakened significantly partly as a result of adverse global investor sentiment. On December 31, 2019, the HUF/EUR exchange rate was HUF330.52/EUR.
In the first eight months of 2020, the foreign exchange rate of the forint weakened versus the euro mainly as a result of deteriorating global investor sentiment. The ongoing COVID-19 pandemic played a significant role in the worsening of global investor sentiment. On August 31, 2020, the HUF/EUR exchange rate was HUF354.064/EUR.
Foreign Exchange and Convertibility of the Forint
Since 1996, Hungarian foreign exchange regulations have been consistent with the convertibility standards of Article VIII of the IMF and OECD regulations.
Since January 1998, Hungarian residents have been able to purchase shares and debt instruments with a maturity of at least one year issued by all OECD-based issuers, and non-residents have been able to issue such instruments denominated in foreign currency in the Hungarian securities market. Hungarian companies and individuals have also been able to receive foreign exchange denominated loans with a maturity of more than one year (with certain reporting obligations) and have been able to take out foreign exchange denominated loans with a maturity of less than one year, with approval from the NBH.
In accordance with the continuing liberalization of restrictions on capital movements, the forint has been fully convertible since June 2001, both in terms of current transactions and capital transactions. All principal restrictions relating to foreign investment have been removed; non-residents have unrestricted access to Hungarian short-term securities, HUF-denominated accounts and the onshore derivatives market, and residents have unrestricted access to offshore financial services and short-term foreign securities. Certain minor restrictions have remained, the principal objectives of which are the prevention of money laundering. The full convertibility of the forint meets all current EU requirements.
The Hungarian Banking System
In April 2000, the supervisory agencies for commercial banks, investment activities, pension funds and insurance activities were integrated under a single agency—the HFSA (in Hungarian: Pénzügyi Szervezetek Állami Felügyelete). The HFSA later merged with the NBH, which became the sole entity responsible for supervision of the banking system. However, there are separate legislative regimes for banking, insurance, pension funds and investment services. Currently, the laws for insurance, banking and pension funds are well established and generally comply with all applicable EU directives and regulations.
Since 1991, Hungary’s banking system has been subject to a regulatory and supervisory framework based on principles and guidelines of the BIS. Act CXII of 1996 on Credit Institutions and Financial Enterprises, was in effect between January 1, 1997 and January 1, 2014, and endeavored to facilitate harmonization of the Hungarian banking system with EU uniform banking standards. As of January 1, 2014, the new Act CCXXXVII of 2013 on Credit Institutions and Financial Enterprises (the “Credit Institutions Act”) went into effect, which serves to implement the relevant EU legislation of “Basel III.”
Supervision of the Hungarian Banking System
As of October 1, 2013, the NBH became solely responsible for the supervision of the banking system through the merger of NBH and HFSA.
Role of the NBH
On July 4, 2014, Parliament adopted legislation to implement the European Bank Recovery and Resolution Directive in Hungary. The Act addresses the development of the institutional framework for recovery and resolution procedures for financial institutions (such as credit institutions and investments firms, financial holding companies and financial enterprises seated in Hungary and subject to consolidated supervision), the role of the NBH acting as the supervisory authority for recovery and resolution, and the establishment of the Resolution Fund. Every financial institution subject to the Act is obliged to participate in the Resolution Fund and pay fees (0.05% of its registered share capital as a joining fee and an annual fee), which is applied toward financing the costs and measures related to recovery and resolution.
Other than credit institutions having their seat in an EU member state (which are regulated by their respective home supervisory authority), all financial institutions operating in Hungary are required to procure a license from the NBH before they may establish themselves, commence operations, establish a representative office or a subsidiary abroad, elect management, acquire shares representing a qualifying holding (10%) or terminate operations.
The NBH is responsible for verifying compliance by credit institutions operating in Hungary with the Credit Institutions Act and applicable banking regulations. The NBH is entitled to impose various sanctions on credit institutions, including issuing warnings of non-compliance, withdrawing licenses, instituting liquidation proceedings and imposing fines on credit institutions and the managers of such credit institutions.
Banking Regulations
The president of the NBH has the power to issue regulatory decrees in the scope set forth in Act CLVIII of 2010 on the HFSA, in Act CXX of 2001 on the Capital Markets (the “Capital Markets Act”) and the Credit Institutions Act. The Capital Markets Act and the Credit Institutions Act and Act CXXXVIII of 2007 on Investment and Commodity Exchange Service Providers and their Activities also set forth matters upon which the Government or Minister of Finance (previously the Minister for National Economy) may issue regulatory decrees.
The Credit Institutions Act requires Hungarian credit institutions to maintain a solvency ratio of 8%. Pursuant to its authority under the Credit Institutions Act, the Finance Minister has issued a decree on the calculation of the solvency ratio. The decree adopts BIS standards prescribing how the ratio of a bank’s regulatory capital and risk-weighted assets (on- and off-balance sheet items) must be calculated. In addition, the Finance Minister has issued decrees requiring credit institutions to create provisions based both on the quality of their assets (which include loans, investments and off-balance sheet items) and on certain foreign country risks present in their assets.
Portfolio risk provisions are calculated by categorizing the assets of a credit institution into the following categories: standard, watch, sub-standard, doubtful and bad. Assets are placed in the categories based on the performance of the asset and the financial condition of the debtor. Provisions are made based on the asset category: for standard assets, 0%; for watch assets, from 0% to less than or equal to 10%; for sub-standard assets, greater than 10% to less than or equal to 30%; for doubtful assets, greater than 30% to less than or equal to 70%; and for bad assets, greater than 70% to 100%.
Hungary has harmonized its guidelines on capital adequacy requirements for investment firms and commercial banks with EU Council Directive 93/6/EEC on the capital adequacy of investment firms and credit institutions. The adaptation of EU Directive 2006/48 and EU Directive 2006/49 (Basel II) was finalized in early 2008 and, as mentioned above, the adaptation of EU Directive 2013/36 and EU Directive 575/2013 (Basel III) was finalized in January 2014. Individual banks are required to create their own guidelines, which are to be reviewed annually.
On November 11, 2014, the Government submitted a bill on the fair banking system to Parliament. According to the bill, loans with a maturity exceeding three years must either be fixed-rate loans or the interest rate should be based on a reference rate. Parliament adopted the bill as law later that year. The law defines stricter conditions for unilateral changes in interest rates, charges and fees; it also regulates the terms of providing information prior to the conclusion of a contract and the terms of modifying contract conditions, in line with the Curia’s resolution on uniformity of the law. According to the law, only conditions such as loan interest rates, interest premia, charges and fees may be modified unilaterally in a way that adversely affects consumers. If a contract does not fulfill criteria on unilateral lender modifications, it can be declared void.
On November 17, 2014, the Government submitted a bill on converting FX loans into local currency denominated loans to Parliament. The bill was approved on November 25, 2014. On February 1, 2015, the law on the conversion of foreign exchange loans into forint-denominated instruments entered into force. The law fixed conversion rates at CHF/HUF256.47, EUR/HUF308.97 and JPY/HUF2.163 for purposes of the conversion scheme.
The converted forint loans became three-month Budapest Inter-Bank Offered Rate-linked (“BUBOR-linked”) floating rate instruments. According to the decision of Parliament, the interest rate premium must be changed to the one used at the time of taking out the loan, but it cannot be less than 1%, or more than 4.5% for a home mortgage or 6.5% for a home equity loan. Borrowers are entitled to request an exemption from the conversion scheme provided they fulfill one of four criteria: for example, if they have a contract that expires by the end of 2020 or if they would be obliged to pay a higher interest rate on the new instrument compared to the old one. Bank clients with regular income in the same currency in which their loan is denominated are also exempt, as are those who are permitted to take out a foreign exchange denominated loan based on the PTI.
Since 2010, the Government has introduced several measures in order to reduce the macroeconomic risks related to households’ indebtedness denominated in foreign currencies, including a fixed-rate repayment scheme and a fixed-rate early prepayment scheme.
On August 19, 2015, the Government and the Hungarian Banking Association concluded an agreement on converting foreign exchange denominated retail car and consumption loans into forint denominated loans. On September 18, 2015, the Government presented a bill to Parliament to convert the loans on December 1, 2015, based on the foreign exchange rates applicable on August 19, 2015 of HUF309.20/EUR1.00 and HUF287.20/CHF1.00. The burden caused by the difference between the foreign exchange rate referred to in the bill on converting FX loans into local currency denominated loans adopted by Parliament on November 25, 2014, and the foreign exchange rates of August 19, 2015 was shared equally by the state and the banking sector. For Swiss franc denominated loans, the difference is close to HUF31 per CHF1.
Also on August 19, 2015, the NBH and the Hungarian Banking Association concluded an agreement which regulates the terms and conditions of the transactions related to forint conversion. As part of this agreement, the NBH provides all financial institutions access to its Swiss franc sale tenders. The NBH’s counterparty credit institutions can access the Bank’s facility directly, while other financial institutions have access to it indirectly, through umbrella banks.
The first Swiss franc sale tender was held on August 24, 2015. Credit institutions were able to make foreign currency conversions with the NBH of up to CHF0.9 billion in spot transactions unconditionally, in accordance with their agreed needs, at the latest official NBH exchange rate effective at the time of the tender. During the tender, CHF591.9 were allocated.
Structure of the Hungarian Banking System
According to the methodology of the NBH, the Hungarian banking sector consists of three types of supervised credit institutions:
| | · | Banking groups: Credit institutions registered in Hungary, the supervision of which is performed by the NBH on a consolidated basis. Among others, it also covers subsidiary banks registered in Hungary, which operate under the control of a parent bank with a registered office in another EU member state and are supervised jointly by the NBH and the supervisory authority having competence on the basis of the parent bank's European registered office (home-host distribution of competence). |
| | · | Solo credit institutions: Credit institutions registered in Hungary, the supervision of which is performed by the NBH on an individual rather than on a consolidated basis. |
| | · | Branches: Hungarian branch offices of credit institutions registered abroad, the supervision of which is performed by the NBH jointly with the authority having competence based on the credit institution's registered office. |
As of December 31, 2019, the Hungarian banking sector supervised by the NBH consisted of 13 banking groups, 13 solo credit institutions, and 8 branch offices. Total assets of the banking sector amounted to HUF49,780 billion as of December 31, 2019 according to non-audited data. Total assets of banking groups amounted to HUF41,758 billion, total assets of solo credit institutions amounted to HUF4,518 billion and total assets of branches of foreign credit institutions amounted to HUF3,504 billion.
Only credit institutions are entitled to collect deposits from the public and provide money transmission services. In addition, banks are entitled to provide the full range of financial services listed in the Credit Institutions Act, including making loans, issuing guarantees, trading foreign currencies, issuing bank cards and providing depository services. Banks may also engage, for their own account or for the accounts of customers, in trading in government and corporate securities and derivatives, and may also provide investment services.
According to data compiled by NBH, the number of credit institutions amounted to 34 as of December 31, 2019. Specialized credit institutions are limited with respect to the scope of services they may provide and with respect to the types of clients to which they may provide such services. Specialized credit institutions in Hungary include housing savings associations and mortgage banks. There are two special state-owned institutions: the MFB (Hungarian Development Bank) and the Hungarian Eximbank.
The following table illustrates certain trends in the Hungarian banking system for the periods indicated:
Table 39: Banking System—Selected Indicators
| | | Banking Survey | |
| | | As of December 31, | | | As of
July 31, | |
| | | 2015 | | | 2016 | | | 2017 | | | 2018 | | | 2019 | | | 2020 | |
| | | (HUF billions) | |
| Domestic credit(1) | | | 13,310 | | | | 13,164 | | | | 13,849 | | | | 15,371 | | | | 17,555 | | | | 18,688 | |
| Credits to government | | | 412 | | | | 310 | | | | 455 | | | | 519 | | | | 736 | | | | 678 | |
| Credits to enterprises(2) | | | 6,979 | | | | 7,099 | | | | 7,564 | | | | 8,684 | | | | 9,696 | | | | 10,324 | |
| Credits to households(3) | | | 5,919 | | | | 5,755 | | | | 5,830 | | | | 6,168 | | | | 7,124 | | | | 7,687 | |
| Broad money (M3) | | | 19,862 | | | | 21,264 | | | | 22,928 | | | | 25,637 | | | | 27,724 | | | | 29,706 | |
Source: NBH
Notes:—
| (1) | Including loans to non-financial enterprises, loans to other financial enterprises, loans to general government, loans to households and loans to non-profit institutions serving households. |
| (2) | Including loans to non-financial enterprises and loans to other financial enterprises. |
| (3) | Including loans to households and loans to non-profit institutions serving households. |
On July 5, 2013, Parliament approved a bill on the integration of co-operative credit institutions. On the basis of the Act, a new organization, the Integration Institution of Cooperative Credit Institutions, was established. Co-operative credit institutions, the MFB and Magyar Takarékbank Zrt. are members of this institution. Membership for co-operative credit institutions is obligatory. Magyar Takarékbank Zrt. is a financial institution established by certain co-operative credit institutions. Co-operative credit institutions and other banks have a majority stake and the MFB and other investors have a minority stake in Magyar Takarékbank Zrt. According to the new Act, MFB will contribute HUF1 billion as capital for the establishment of the institution and the capital of Magyar Takarékbank Zrt. will also be increased to at least HUF3.39 billion by a contribution from Magyar Posta Zrt. (Hungarian Post). As a result of the planned capital increase, the Hungarian State will obtain an indirect majority stake in Magyar Takarékbank Zrt., through the MFB and Magyar Posta Zrt holdings. The core activity of the new institution will be the adoption, publication and enforcement of regulations binding its members. In the case of non-compliance, a member can be stripped of its membership. The Act enables Magyar Takarékbank Zrt. to act as a central credit institution for the members and set rules on core activities including risk management, strategic decisions, IT management and marketing.
On February 26, 2014, the Government declared that the merger of Magyar Takarékbank Zrt and the Hungarian Co-operative Credit Investment and Asset Management Pte. Ltd. (in Hungarian: Magyar Takarék Befektetési és Vagyongazdálkodási Zrt, “Magyar Takarék”) has national strategic importance. On March 10, 2014, MFB and Hungarian Post announced that they had sold their 54.8% share in Magyar Takarékbank Zrt. to Magyar Takarék. Co-operative credit institutions own the majority of the shares of Magyar Takarék, while FHB Jelzálogbank Nyrt. owns 25% of the shares of Magyar Takarék.
The consolidation of co-operative credit institutions was a gradual process. By the end of 2017, the number of credit institutions dropped to 15. By the end of August 2019, the number of credit institutions dropped to 11. A new credit institution named Takarékbank was set up through the merger of three credit institutions. By the end of October 2019, the remaining 11 credit institutions merged into Takarékbank.
On May 26, 2020, Budapest Bank joined the strategic cooperation between Takarékbank and MKB, in which experts are examining and preparing the framework for setting up a new, domestically owned banking group with significant market power. According to the letter of intent signed on May 26, 2020, the financial institutions would establish the Magyar Bankholding Zrt. with each party holding three equal shares therein.
In addition to the credit institutions discussed above, several other financial entities play an important role in strengthening the Hungarian banking and financial sectors. These entities include:
| | · | the National Deposit Insurance Fund, which credit institutions are required to join, and insures deposits up to HUF13 million per depositor, but does not cover the deposits of the Government or certain other entities; |
| | · | the Credit Guarantee Corporation, which guarantees loans to SMEs; |
| | · | the National Savings Cooperatives Institutions Protection Fund, which is a voluntary consortium of cooperative institutions designed to further such institutions’ mutual interests; and |
| | · | the Hungarian Export Credit Insurance Corporation, which provides insurance for export credits and exchange rate risks. |
The following table illustrates certain indicators of the Hungarian banking sector for the periods indicated:
Table 40: Selected Hungarian Banking Sector Indicators
| | | As of December 31, | | | | | | As of
June 30, | |
| | | 2015 | | | 2016 | | | 2017 | | | 2018 | | | 2019 | | | 2020 | |
| | | (HUF billions) | |
| Non-performing loans | | | 3,789 | | | | 2,794 | | | | 2,035 | | | | 1,619 | | | | 1,460 | | | | 1,609 | |
| Total loans | | | 26,003 | | | | 26,005 | | | | 27,067 | | | | 29,799 | | | | 35,916 | | | | 40,393 | |
| (%) | | | | | | | | | | | | | | | | | | | | | | | | |
| NPL ratio | | | 14.6 | | | | 10.7 | | | | 7.5 | | | | 5.4 | | | | 4.1 | | | | 4.0 | |
| CAR ratio | | | 18.2 | | | | 19.3 | | | | 19.2 | | | | 19.1 | | | | 18.4 | | | | 17.9 | |
| LTD ratio | | | 85.3 | | | | 82.8 | | | | 85.4 | | | | 84.6 | | | | 89.2 | | | | 89.3 | |
Source: NBH
Total loans amounted to HUF35,916 billion as of December 31, 2019, equaling a 20.5% increase compared to the end of 2018. The amount of non-performing loans amounted to HUF1,460 billion as of December 31, 2019. The ratio of non-performing loans (“NPL ratio”) amounted to 4.1% as of December 31, 2019.
As of December 31, 2019, the Total Capital Ratio (“CAR”) amounted to 18.4%.
As of December 31, 2019, loans-to-deposit ratio ("LTD") amounted to 89.2%.
According to audited data, credit institutions accumulated a net loss of HUF10 billion in 2015. According to audited data, credit institutions accumulated a net profit of HUF445 billion in 2016 and a net profit of HUF592 billion in 2017. According to audited data, credit institutions accumulated a net profit of HUF644 billion in 2018. According to audited data, credit institutions accumulated a net profit of HUF694 billion in 2019.
Ownership Structure of the Banking Sector
Following the dynamic growth of foreign share ownership in the banking sector in the second half of the 1990s, the proportion of registered capital held by foreign investors stabilized in 2002. According to data compiled by the NBH, 45% of the total assets of the Hungarian banking sector (excluding the MFB and the Hungarian Eximbank, which are owned by the Hungarian state) was held by non-residents as of the end of December 2018.
On July 24, 2014, the Government announced that Hungary had reached an agreement to purchase MKB Bank Zrt. from Bayerische Landesbank at a purchase price of EUR55 million. Bayerische Landesbank agreed to sell 99% of MKB shares to the state of Hungary and to increase capital by EUR270 million prior to the transfer.
On December 4, 2014, the Government announced that Hungary had reached a preliminary contract to purchase Budapest Bank Zrt. from General Electric.
On December 18, 2014, the NBH announced that it had taken control of MKB, a state-owned bank and would reorganize the credit institution, including its subsidiaries in order to restore the profitability of MKB.
On February 9, 2015, the Government of Hungary and the EBRD each purchased a 15% stake in Erste Bank Hungary Zrt., a Hungarian bank owned by Erste, an Austrian bank. The deal settled on June 29, 2015.
On June 29, 2016, NBH sold MKB Bank Zrt. at a price of HUF37 billion.
The only banks (other than the NBH) in which Hungary currently holds controlling interests are the Budapest Bank Zrt., the MFB and the Hungarian Eximbank.
Capital Markets
During the course of its transition to a market economy, Hungary attached great importance to the development of a sound capital market in order to promote economic development and to finance Hungarian enterprises. The Capital Markets Act regulates the offering and trading of securities (including government securities) and the institutional framework of the Hungarian capital market (including stock exchanges, investment funds and clearing houses). State control and supervision of the capital markets was delegated to the NBH. In line with the trend in other international markets generally, Hungary has moved towards a universal financial system when regulating the relationship between investment and banking services. Banks with proper authorization may carry on investment and financial services activities within the same organizational frameworks, thereby offering universal banking services. By the end of 2007, regulation of the capital markets in Hungary was substantially in compliance with applicable EU regulations and guidelines. The Investment Institutions Act went into effect on June 1, 2008, which implemented 2004/39/EC Directive on markets in financial instruments and investment services. Hungary implemented MiFID II3 on July 3, 2017, through the amendment of the Investment Institutions Act and other related pieces of legislation.
Stock Exchange
The Budapest Stock Exchange (the “BSE”) opened in 1990 and is a self-governing and self-regulating organization that selects its own governing bodies and officials, adopts its own regulations, defines its operating rules and fixes the fees charged for its services.
In February 2004, the BSE and the Budapest Commodity Exchange (the “BCE”) agreed to integrate their respective activities. The integration was completed in November 2005, and all exchange products formerly traded on the BCE and all members of the BCE were transferred to the BSE.
In January 2010, the BSE, in addition to the Vienna, Ljubljana and Prague Stock Exchanges, became a member of the Central East European Stock Exchange Group through the acquisition of a simple majority stake in the BSE by CEESEG AG. As a result of the acquisition, the following entities are the major shareholders of the BSE: CEESEG AG (50.45%), Österreichische Kontrollbank AG (18.34%), the NBH (6.94%) and the Hungarian Branch Office of KBC Securities (5.19%).
On November 20, 2015, the NBH agreed to purchase from CEESEG AG and Österreichische Kontrollbank AG a 68.8% ownership in the BSE for HUF13.2 billion. The transaction concluded on December 9, 2015, and as a result, the NBH's share in the BSE increased to 75.8%.
The following table sets forth selected indicators relating to the BSE as at the end of and for the periods indicated:
Table 41: Selected Budapest Stock Exchange Indicators
| | | For the year ended December 31, | |
| | | 2015 | | | 2016 | | | 2017 | | | 2018 | | | 2019 | |
| | | Number of Trades (Thousands) | |
| Equities | | | 1,554.8 | | | | 1,621.4 | | | | 1,940.4 | | | | 1,899.9 | | | | 1,817.3 | |
| Debt Securities | | | 0.3 | | | | 0.3 | | | | 0.1 | | | | 0.4 | | | | 0.0 | |
| BETa* | | | 12.1 | | | | 24.8 | | | | 15.7 | | | | 9.8 | | | | 12.4 | |
| Derivatives | | | 104.4 | | | | 84.5 | | | | 87.7 | | | | 103.0 | | | | 89.8 | |
| Commodities | | | 0.7 | | | | 0.5 | | | | 0.1 | | | | 0.0 | | | | 0.0 | |
| | | | Turnover (HUF Billions) | |
| Equities | | | 2,224.4 | | | | 2,403.6 | | | | 2,778.2 | | | | 2,892.2 | | | | 2,651.4 | |
| Debt Securities | | | 0.7 | | | | 1.5 | | | | 0.5 | | | | 60.1 | | | | 1.9 | |
| BETa* | | | 4.8 | | | | 7.1 | | | | 6.5 | | | | 2.7 | | | | 3.3 | |
| Derivatives | | | 2,739.7 | | | | 2,569.9 | | | | 2,365.1 | | | | 2,341.0 | | | | 2,317.6 | |
| Commodities | | | 23.0 | | | | 17.5 | | | | 2.9 | | | | 0.0 | | | | 0.0 | |
Source: Budapest Stock Exchange
Note: *Foreign equities.
| | 3 | Directive 2014/65/EU of the European Parliament and of the Council of Europe of May 15, 2014 on markets in financial instruments and amending Directive 2002/92/EC and Directive 2011/61/EU. |
PUBLIC FINANCE
General Information
The public finance sector in Hungary consists of the central government budget, social security funds (pension and health funds), extra-budgetary funds and local government budgets, which together are referred to as the general government budget.
Methodology
The fiscal year for the Government is the calendar year. The general government budget data are compiled in several stages by the Ministry of Finance (prior to May 2018, the Ministry for National Economy had this responsibility). In the fall of each calendar year, the Ministry of Finance is required to compile the first preliminary budget (called the “planned budget”) for the following calendar year in accordance with the budget act approved by Parliament for that year.
In January of each given calendar year, the Ministry of Finance compiles the first version of the general government budget for the previous year. This budget (compiled according to data available in January) is called the “preliminary budget.” During the course of the year, the Ministry of Finance collects additional information concerning the revenues and expenditures related to the previous year. In light of this additional information, the Ministry of Finance revises the preliminary budget (compiled in January) and compiles the second version of the general government budget for the previous year. This budget (compiled according to data available in May of a given calendar year) is called the “fact budget.” The main reason for the differences between the preliminary and fact budgets is the uncertainty in the exact amounts of revenues and expenditures of the central governmental institutions, as the balance sheets of these institutions are not compiled until May of a given calendar year. The Ministry of Finance is obligated to compile the final account by the end of August of a given calendar year using the fact budget. The final account is submitted to Parliament, and Parliament approves the final account by a simple majority vote. However, the final account submitted to Parliament may differ from the final account approved by Parliament due to amendments. After the final account is approved by Parliament, the Ministry of Finance compiles the third version of the general government budget for the previous year, known as the “final budget.” During the course of the year in light of intra-year information, the Ministry of Finance compiles on an ad hoc basis budgets containing the expected revenues and expenditures on a best effort basis. This budget is the “expected budget”.
The information included in this document with respect to the budgets for 2015, 2016, 2017, 2018 (final), 2019 (final) and 2020 (planned and expected) was derived from the budgets for 2015, 2016, 2017, 2018, 2019 and 2020 as calculated by the Ministry of Finance using data available in September 2020.
Central Government Budget Process
The Ministry of Finance is responsible for preparing the central government budget on a calendar year basis for the Government. The Government submits the central government budget to Parliament for consideration and ultimate approval. The annual central government budget for each coming year should be approved prior to the beginning of the relevant year. If Parliament does not approve the budget by such time, the Government is obligated to propose an interim central government budget without delay. If the central government budget is not approved by Parliament either, the Government is entitled to collect revenues due to the central government budget in accordance with the laws then in force and to make expenditures in line with the central government budget for the preceding calendar year, which includes uncapped appropriation for debt service, subject to generally applicable budgetary rules.
Within eight months of the end of each calendar year, the final accounts for the preceding year are compiled by the Government and are submitted to Parliament for final approval.
The major components of revenue under the central government budget comprise taxes imposed on consumption (including VAT), enterprise taxes and taxes on households (primarily personal income taxes). The major expenditure items of the central government budget comprise debt service and transfers to the social security funds, budgetary institutions, local governments and extra-budgetary funds.
Budget Trends
The following table sets forth the main fiscal trends in Hungary for the years indicated:
Table 42: General Budget Balance, consolidated(1)
| | | For the year ended December 31, | |
| | | 2015 | | | 2016 | | | 2017 | | | 2018 | | | 2019 | | | 2020 | | | 2020 | |
| | | Final | | | Final | | | Final | | | Final | | | Final | | | Planned | | | Expected | |
| | | | | | (HUF billions) | | | | |
| GFS method | | | | | | | | | | | | | | | | | | | | | | | | | | | | |
| Revenues | | | 16,231.8 | | | | 16,405.1 | | | | 17,348.1 | | | | 18,462.6 | | | | 20,273.6 | | | | 20,752.0 | | | | 19,801.4 | |
| Expenditures | | | 17,455.4 | | | | 16,945.1 | | | | 18,662.6 | | | | 19,664.7 | | | | 21,477.9 | | | | 21,164.5 | | | | 23,678.3 | |
| Balance | | | (1,223.6 | ) | | | (540.0 | ) | | | (1,314.5 | ) | | | (1,202.1 | ) | | | (1,204.2 | ) | | | (412.5 | ) | | | (3,876.8 | ) |
| Balance in % of GDP | | | (3.5 | ) | | | (1.5 | ) | | | (3.4 | ) | | | (2.8 | ) | | | (2.6 | ) | | | (0.9 | ) | | | (8.4 | ) |
| | | | | | | | | | | | | | | | | | | | | | | | | | | | | |
| ESA method | | | | | | | | | | | | | | | | | | | | | | | | | | | | |
| Revenues | | | 16,914.7 | | | | 16,293.2 | | | | 17,288.4 | | | | 18,993.6 | | | | 20,587.6 | | | | 21,505.7 | | | | 20,623.4 | |
| Expenditures | | | 17,615.4 | | | | 16,943.8 | | | | 18,242.2 | | | | 19,910.2 | | | | 21,545.6 | | | | 21,990.8 | | | | 24,307.6 | |
| Balance | | | (700.7 | ) | | | (650.6 | ) | | | (953.9 | ) | | | (916.6 | ) | | | (958.1 | ) | | | (485.1 | ) | | | (3,684.2 | ) |
| Balance in % of GDP | | | (2.0 | ) | | | (1.8 | ) | | | (2.5 | ) | | | (2.1 | ) | | | (2.0 | ) | | | (1.0 | ) | | | (8.0 | ) |
Sources: CSO and Ministry of Finance
Note:—
| (1) | For methodological remarks on planned, expected, preliminary, fact and final budgets see “Public Finance—Methodology.” |
According to data available in September 2020, the general government deficit (local governments included) amounted to HUF1,204.2 billion (2.6% of GDP) for the year 2019, according to the GFS methodology. The general government deficit for the year 2019 (local governments included), according to the ESA methodology, was HUF958.1 billion, equaling 2.0% of GDP for the year 2019.
According to the approved budget, the 2020 planned general government deficit (local governments included) is planned to be HUF412.5 billion (0.9% of GDP) according to the GFS methodology. The 2020 planned general government deficit (local governments included) is planned to be HUF485.1 billion (1.0% of GDP) according to the ESA methodology.
According to the expected budget, the 2020 expected general government deficit (local governments included) is expected to be HUF3,876.8 billion (8.4% of GDP) according to the GFS methodology. The 2020 expected general government deficit (local governments included) is expected to be HUF3,684.2 billion (8.0% of GDP) according to the ESA methodology.
In 2015, total general government revenues amounted to HUF16,231.8 billion. In 2016, 2017 and 2018, revenues increased by 1.1%, 5.7% and 6.4%, respectively, reaching HUF16,405.1 billion, HUF17,348.1 billion and HUF18,462.6 billion, respectively. In 2019, revenues increased by 9.8% reaching HUF20,273.6 billion. According to the approved budget, revenues are planned to reach HUF20,752.0 billion in 2020, an increase of 2.4% compared to the previous year. According to the expected budget, revenues are expected to reach HUF19,801.4 billion in 2020, a decrease of 2.3% compared to the previous year.
In 2015, total general government expenditures amounted to HUF17,455.4 billion. In 2016, expenditures decreased by 2.9% reaching HUF16,945.1 billion. Expenditures reached HUF18,662.6 billion in 2017, and HUF19,664.7 billion in 2018, an increase of 10.1%, and 5.4%, respectively, compared to the previous year. In 2019, expenditures increased by 9.2% reaching HUF21,477.9 billion. According to the approved budget, expenditures are planned to reach HUF21,164.5 billion in 2020, a decrease of 1.5% compared to the previous year. According to the expected budget, expenditures are expected to reach HUF23,678.3 billion in 2020, an increase of 10.2% compared to the previous year.
For a detailed description of revenues and expenditures of the general government budget see “Central Government Budget” – “Central Government Revenues and Expenditures”; “Social Security and Extra-Budgetary Funds”; and “Local Government Finance”.
Central Government Budget
The following table sets forth information concerning central government revenues and expenditures for the final budget for the years 2015, 2016, 2017, 2018, the final budget for 2019, and the planned and expected budget for 2020:
Table 54: Central Government Revenues and Expenditures(1)
| | | For the Year ended December 31, | |
| | | 2015 | | | 2016 | | | 2017 | | | 2018 | | | 2019 | | | 2020 | | | 2020 | |
| | | Final | | | Final | | | Final | | | Final | | | Final | | | Planned | | | Expected | |
| | | (HUF Billions) | |
| Revenues | | | | | | | | | | | | | | | | | | | | | | | | | | | | |
| Payments of Economic Units | | | | | | | | | | | | | | | | | | | | | | | | | | | | |
| Corporate taxes (including financial institutions) | | | 600.6 | | | | 734.4 | | | | 680.0 | | | | 440.1 | | | | 329.9 | | | | 575.4 | | | | 483.9 | |
| Mining tax (DPTT) | | | 35.0 | | | | 27.6 | | | | 28.8 | | | | 43.7 | | | | 45.6 | | | | 38.0 | | | | 31.1 | |
| Company car tax | | | 31.5 | | | | 32.0 | | | | 33.3 | | | | 35.3 | | | | 36.4 | | | | 38.2 | | | | 38.0 | |
| Gambling tax | | | 32.8 | | | | 25.0 | | | | 27.5 | | | | 29.3 | | | | 28.2 | | | | 35.6 | | | | 31.5 | |
| Eco tax | | | 23.6 | | | | 23.2 | | | | 23.9 | | | | 25.8 | | | | 5.6 | | | | 4.9 | | | | 4.9 | |
| Simplified business tax | | | 89.4 | | | | 81.1 | | | | 63.6 | | | | 54.1 | | | | 43.4 | | | | 0.0 | | | | 1.7 | |
| Tax of small enterprises | | | 11.0 | | | | 13.6 | | | | 22.4 | | | | 41.7 | | | | 70.5 | | | | 87.6 | | | | 84.0 | |
| Itemized tax of small taxpayers | | | 54.4 | | | | 69.9 | | | | 98.2 | | | | 124.9 | | | | 158.5 | | | | 192.6 | | | | 154.5 | |
| Tax on utility systems | | | 55.9 | | | | 55.0 | | | | 55.0 | | | | 54.3 | | | | 54.5 | | | | 54.0 | | | | 52.4 | |
| Advertising tax | | | 6.1 | | | | 12.6 | | | | 0.0 | | | | 12.3 | | | | 6.3 | | | | 0.5 | | | | 0.2 | |
| Other central payments | | | 393.5 | | | | 426.6 | | | | 456.1 | | | | 507.1 | | | | 560.7 | | | | 586.1 | | | | 548.0 | |
| Other payments | | | 22.2 | | | | 18.8 | | | | 18.0 | | | | 9.5 | | | | 18.1 | | | | 12.0 | | | | 15.5 | |
| Tax of financial institutions | | | 149.6 | | | | 73.2 | | | | 64.2 | | | | 53.3 | | | | 56.7 | | | | 65.0 | | | | 121.0 | |
| Extra tax of certain sectors | | | 0.3 | | | | 0.0 | | | | 1.1 | | | | 0.7 | | | | 0.1 | | | | 0.0 | | | | 45.0 | |
| Total (Economic Units) | | | 1,505.8 | | | | 1,593.2 | | | | 1,572.1 | | | | 1,431.9 | | | | 1,414.4 | | | | 1,689.9 | | | | 1,611.7 | |
| Taxes on Consumption | | | | | | | | | | | | | | | | | | | | | | | | | | | | |
| Value added tax | | | 3,285.7 | | | | 3,290.3 | | | | 3,525.3 | | | | 3,928.7 | | | | 4,532.4 | | | | 4,969.7 | | | | 4,420.0 | |
| Excises | | | 1,019.8 | | | | 1,035.5 | | | | 1,047.1 | | | | 1,137.2 | | | | 1,201.5 | | | | 1,253.0 | | | | 1,201.0 | |
| Financial transaction tax | | | 207.7 | | | | 199.1 | | | | 217.3 | | | | 233.2 | | | | 243.4 | | | | 226.3 | | | | 215.0 | |
| Public health production tax | | | 0.0 | | | | 0.0 | | | | 0.0 | | | | 0.0 | | | | 0.0 | | | | 0.0 | | | | 0.0 | |
| Insurance tax | | | 30.0 | | | | 32.4 | | | | 35.7 | | | | 39.7 | | | | 82.5 | | | | 98.0 | | | | 97.5 | |
| Telecom levy | | | 54.8 | | | | 53.2 | | | | 53.6 | | | | 53.8 | | | | 53.5 | | | | 54.0 | | | | 56.3 | |
| Tourism development contribution | | | 0.0 | | | | 0.0 | | | | 0.0 | | | | 19.0 | | | | 26.9 | | | | 35.9 | | | | 10.2 | |
| Total (Consumption Taxes) | | | 4,598.0 | | | | 4,610.4 | | | | 4,878.9 | | | | 5,411.7 | | | | 6,140.1 | | | | 6,636.9 | | | | 6,000.0 | |
| Payments of Households | | | | | | | | | | | | | | | | | | | | | | | | | | | | |
| Gross PIT revenues | | | 1,688.6 | | | | 1,717.6 | | | | 1,920.0 | | | | 2,177.4 | | | | 2,424.6 | | | | 2,608.9 | | | | 2,500.0 | |
| PIT revenues of central budget | | | 1,688.6 | | | | 1,717.6 | | | | 1,920.0 | | | | 2,177.4 | | | | 2,424.6 | | | | 2,608.9 | | | | 2,500.0 | |
| Private persons’ special tax | | | 0.0 | | | | 0.0 | | | | 0.0 | | | | 0.0 | | | | 0.0 | | | | 0.0 | | | | 0.0 | |
| 98% extraordinary tax of private persons | | | 0.0 | | | | 0.8 | | | | 1.0 | | | | 0.4 | | | | 0.0 | | | | 0.0 | | | | 0.0 | |
| Registration fee paid after domestic servants | | | 0.0 | | | | 0.0 | | | | 0.0 | | | | 0.0 | | | | 0.0 | | | | 0.0 | | | | 0.0 | |
| Tax payments | | | 8.1 | | | | 2.3 | | | | 6.9 | | | | 8.6 | | | | 7.8 | | | | 8.8 | | | | 6.8 | |
| Fees | | | 136.4 | | | | 157.7 | | | | 173.6 | | | | 191.0 | | | | 215.6 | | | | 229.5 | | | | 204.0 | |
| Vehicle tax | | | 43.9 | | | | 43.9 | | | | 45.8 | | | | 47.9 | | | | 50.4 | | | | 51.5 | | | | 86.0 | |
| Other Revenues | | | | | | | | | | | | | | | | | | | | | | | | | | | | |
| Total (Payments of Households) | | | 1,877.0 | | | | 1,922.3 | | | | 2,147.3 | | | | 2,425.3 | | | | 2,698.3 | | | | 2,898.7 | | | | 2,796.8 | |
| Central Budgetary Institutions and Chapter Administered Appropriations | | | | | | | | | | | | | | | | | | | | | | | | | | | | |
| Own revenues of the institutions | | | 2,076.1 | | | | 2,500.7 | | | | 2,389.9 | | | | 2,228.9 | | | | 2,002.7 | | | | 1,373.7 | | | | 2,028.1 | |
| Own revenues of chapter administered professional appropriations | | | 146.5 | | | | 365.6 | | | | 433.8 | | | | 122.0 | | | | 140.8 | | | | 42.5 | | | | 372.5 | |
| EU support of chapter administered professional appropriations and central investments | | | 1,165.9 | | | | 641.1 | | | | 1,124.2 | | | | 85.4 | | | | 107.6 | | | | 14.1 | | | | 1.6 | |
| Total | | | 3,388.6 | | | | 3,507.4 | | | | 3,947.8 | | | | 2,436.3 | | | | 2,251.1 | | | | 1,430.4 | | | | 2,402.2 | |
| Payments of Central Budgetary Institutions | | | 29.8 | | | | 27.4 | | | | 42.9 | | | | 30.4 | | | | 137.4 | | | | 26.0 | | | | 26.0 | |
| Payments to Central Carry-Over Fund | | | | | | | | | | | | | | | 199.8 | | | | 286.6 | | | | 0.0 | | | | 326.0 | |
| Contribution to National Social Fund | | | 0.0 | | | | 0.0 | | | | 0.0 | | | | 0.0 | | | | 0.0 | | | | 0.0 | | | | 0.0 | |
| Payments of Local Governments | | | 15.8 | | | | 15.3 | | | | 36.4 | | | | 41.7 | | | | 55.2 | | | | 43.0 | | | | 65.0 | |
| Payments of Extrabudgetary and Social Security Funds | | | 84.8 | | | | 24.6 | | | | 29.8 | | | | 13.3 | | | | 91.5 | | | | 92.2 | | | | 38.9 | |
| Revenues of International Transactions | | | 0.0 | | | | 0.0 | | | | 0.0 | | | | 0.0 | | | | 1.6 | | | | 0.0 | | | | 0.0 | |
| Payments Related to State Property | | | 170.1 | | | | 205.7 | | | | 265.5 | | | | 184.6 | | | | 217.5 | | | | 162.5 | | | | 294.7 | |
| Other Revenues | | | 34.1 | | | | 68.3 | | | | 40.8 | | | | 19.6 | | | | 37.2 | | | | 11.8 | | | | 45.2 | |
| Revenues Related to Debt Service | | | 0.0 | | | | 0.0 | | | | 0.0 | | | | 0.0 | | | | 0.0 | | | | 0.0 | | | | 0.0 | |
| Revenues from EU programs | | | | | | | | | | | | | | | 1,053.8 | | | | 1,251.4 | | | | 1,482.0 | | | | 1,628.2 | |
| Reimbursement of EU financial supports | | | 25.7 | | | | 344.0 | | | | 100.4 | | | | 260.9 | | | | 211.4 | | | | 0.0 | | | | 1.9 | |
| Customs and import duties | | | 13.6 | | | | 13.2 | | | | 12.2 | | | | 15.7 | | | | 16.0 | | | | 17.1 | | | | 14.9 | |
| Pension Reform and Debt Reduction Fund | | | 0.0 | | | | 0.0 | | | | 0.0 | | | | 0.0 | | | | 0.0 | | | | 0.0 | | | | 0.0 | |
| Total Revenues(1) | | | 11,743.3 | | | | 12,331.8 | | | | 13,074.2 | | | | 13,525.1 | | | | 14,809.9 | | | | 14,490.4 | | | | 15,251.7 | |
| Interest Revenues | | | 232.5 | | | | 148.6 | | | | 104.3 | | | | 120.5 | | | | 258.4 | | | | 32.4 | | | | 159.6 | |
| Total Revenues(2) | | | 11,975.8 | | | | 12,480.4 | | | | 13,178.4 | | | | 13,645.6 | | | | 15,068.2 | | | | 14,522.9 | | | | 15,411.3 | |
| Expenditures | | | | | | | | | | | | | | | | | | | | | | | | | | | | |
| Subsidies to Economic Units | | | 305.4 | | | | 333.6 | | | | 326.3 | | | | 383.1 | | | | 421.2 | | | | 408.0 | | | | 646.2 | |
| Support to the Media | | | 69.9 | | | | 69.9 | | | | 70.2 | | | | 71.3 | | | | 80.1 | | | | 78.5 | | | | 85.0 | |
| Consumer Price Subsidy | | | 97.8 | | | | 97.9 | | | | 94.5 | | | | 90.4 | | | | 89.1 | | | | 90.5 | | | | 62.1 | |
| Housing Grants | | | 109.3 | | | | 148.2 | | | | 184.7 | | | | 193.2 | | | | 191.2 | | | | 296.7 | | | | 241.5 | |
| Family Benefits Social Subsidies | | | | | | | | | | | | | | | | | | | | | | | | | | | | |
| Family benefits | | | 417.4 | | | | 411.5 | | | | 407.1 | | | | 402.7 | | | | 399.2 | | | | 398.0 | | | | 396.8 | |
| Income supplement benefits | | | 130.6 | | | | 126.1 | | | | 124.4 | | | | 122.2 | | | | 137.4 | | | | 152.5 | | | | 143.1 | |
| Benefits under retirement age | | | 136.6 | | | | 113.3 | | | | 94.7 | | | | 92.9 | | | | 92.5 | | | | 85.9 | | | | 91.7 | |
| Other specific subsidies | | | 24.2 | | | | 21.3 | | | | 26.8 | | | | 25.1 | | | | 25.2 | | | | 24.3 | | | | 24.3 | |
| Total | | | 708.7 | | | | 672.2 | | | | 653.0 | | | | 642.8 | | | | 654.3 | | | | 660.7 | | | | 655.8 | |
| Central Budgetary Institutions and Chapter Administered Appropriations | | | | | | | | | | | | | | | | | | | | | | | | | | | | |
| Expenditures of central budgetary institutions | | | 4,589.3 | | | | 4,600.4 | | | | 5,141.5 | | | | 5,726.8 | | | | 6,228.0 | | | | 4,726.4 | | | | 6,964.7 | |
| Chapter administered professional appropriations | | | 4,046.4 | | | | 4,132.1 | | | | 5,116.6 | | | | 4,691.7 | | | | 4,896.2 | | | | 4,408.1 | | | | 5,746.7 | |
| Central investment | | | 0.0 | | | | 0.0 | | | | 0.0 | | | | 0.0 | | | | 0.0 | | | | 0.0 | | | | 0.0 | |
| Chapter balance reserve | | | 0.0 | | | | 0.0 | | | | 0.0 | | | | 0.0 | | | | 0.0 | | | | 0.0 | | | | 0.0 | |
| Total | | | 8,635.6 | | | | 8,732.5 | | | | 10,258.1 | | | | 10,418.5 | | | | 11,124.2 | | | | 9,134.5 | | | | 12,711.4 | |
| Support to Political Parties and Other Civil Organizations | | | 3.8 | | | | 3.8 | | | | 3.8 | | | | 9.8 | | | | 5.6 | | | | 5.8 | | | | 5.0 | |
| Transfer to Social Security Funds | | | 560.0 | | | | 409.7 | | | | 623.9 | | | | 591.6 | | | | 467.6 | | | | 628.0 | | | | 628.0 | |
| Transfer to Local Governments | | | | | | | | | | | | | | | | | | | | | | | | | | | | |
| Direct transfer from the budget | | | 665.4 | | | | 675.4 | | | | 700.5 | | | | 746.8 | | | | 778.5 | | | | 739.0 | | | | 771.7 | |
| Yielded PIT revenues | | | 0.0 | | | | 0.0 | | | | 0.0 | | | | 0.0 | | | | 0.0 | | | | 0.0 | | | | 0.0 | |
| Total | | | 665.4 | | | | 675.4 | | | | 700.5 | | | | 746.8 | | | | 778.5 | | | | 739.0 | | | | 771.7 | |
| Transfer to Extrabudgetary Funds | | | 138.7 | | | | 155.0 | | | | 85.0 | | | | 92.5 | | | | 76.9 | | | | 83.6 | | | | 88.5 | |
| Expenditures of International Transactions | | | 14.6 | | | | 6.3 | | | | 4.0 | | | | 2.8 | | | | 6.1 | | | | 11.4 | | | | 11.0 | |
| Debt Service Related Expenditures | | | 41.1 | | | | 47.1 | | | | 50.3 | | | | 32.4 | | | | 38.7 | | | | 33.2 | | | | 41.6 | |
| Other Expenditures | | | 28.0 | | | | 62.9 | | | | 66.7 | | | | 63.1 | | | | 69.7 | | | | 97.8 | | | | 94.1 | |
| Reserves | | | 0.0 | | | | 0.0 | | | | 0.0 | | | | 0.0 | | | | 0.0 | | | | 543.2 | | | | 0.0 | |
| Extraordinary Expenditures | | | 0.0 | | | | 0.0 | | | | 0.0 | | | | 0.0 | | | | 0.0 | | | | 110.0 | | | | 0.0 | |
| Government Guarantees Redeemed | | | 12.6 | | | | 12.4 | | | | 17.9 | | | | 12.5 | | | | 14.8 | | | | 23.8 | | | | 19.6 | |
| Contribution to EU Budget | | | 306.0 | | | | 295.3 | | | | 260.4 | | | | 316.5 | | | | 365.3 | | | | 397.7 | | | | 450.0 | |
| Expenditures Related to State Property | | | 286.8 | | | | 387.0 | | | | 451.0 | | | | 305.6 | | | | 517.1 | | | | 461.5 | | | | 726.2 | |
| Interest Payments | | | 1,205.7 | | | | 1,118.2 | | | | 1,091.3 | | | | 1,048.4 | | | | 1,100.5 | | | | 1,077.7 | | | | 1,215.0 | |
| Total Expenditures | | | 13,189.7 | | | | 13,227.4 | | | | 14,941.5 | | | | 15,021.2 | | | | 16,000.8 | | | | 14,881.8 | | | | 18,452.7 | |
Source: Ministry of Finance
Notes:—
| | (1) | Excluding interest revenues |
| | (2) | Including interest revenues |
Roles of the Ministry of Finance, the Hungarian State Treasury and the Government Debt Management Agency
As of May 2018, the Ministry of Finance assumed responsibility from the Ministry for National Economy for supplying information to support the Government’s decision-making and for co-coordinating issues falling within the Government’s scope of authority in relation to public finances. See “Hungary—Political System—Government.” Specific responsibilities include the preparation of the Bill on the final accounts of the central government and the central government budget, which is presented to Parliament each calendar year.
The Ministry of Finance is required to ensure the execution of the central budget, the solvency of the central government, the financing of the central government and the recording of government debt, including guarantees granted and sureties undertaken by the Government, and loans and claims of the central government. These tasks are executed through the Treasury, and debt and liquidity management tasks are carried out by Államadósság Kezelő Központ Zártkörűen Működő Részvénytársaság, a special government debt management agency (the Government Debt Management Agency Private Company Limited by Shares or “GDMA Pte Ltd.”).
The Treasury was established on January 1, 1996 as a central budgetary organization. The legal and professional supervision of the Treasury is performed by the Ministry of Finance. Within its budget execution responsibilities, the Treasury’s main task is the management of budget appropriations and government cash flows and the determination of the daily financing needs of the central government. The management of budget appropriations includes the registration of annual appropriations, the monitoring of their changes and the right to authorize payments from appropriated amounts.
The cash management duties of the Treasury include account management for the budgetary institutions, which, in accordance with the Act on Public Finances, are obligated to keep their accounts with the Treasury. The Treasury administers the Single Treasury Account, which is the cash account of the Treasury held at the NBH.
The Treasury’s responsibilities also include the provision of funds for public investments, the transfer of contributions and subsidies to municipalities, and the management and collection of loans and other claims of the central government.
The Government’s borrowing needs are financed by the GDMA Pte Ltd. The Finance Minister established the GDMA Pte Ltd. in order to concentrate debt management functions into one organization. Accordingly, the GDMA Pte Ltd. manages, renews and records the forint and foreign exchange debt of the central government and, since 2003, manages the liquidity of the Single Treasury Account. For purposes of liquidity management, the GDMA Pte Ltd. introduced new secondary market operations (such as repurchase transactions on the domestic securities market).
In the domestic market, the responsibilities of the GDMA Pte Ltd. include the administration of auctions and subscriptions, and the development of the institutional framework and structure of government securities markets. Further, the GDMA Pte Ltd. provides easily accessible, up-to-date information on the government securities markets and on financing of Hungary’s borrowing needs in order to encourage transparency. With respect to foreign debt management, the GDMA Pte Ltd. acts in the name of Hungary in raising funds, manages the foreign exchange debt of the central government, ensures promptness and accuracy in respect of debt service payments and effects hedging transactions to reduce risks.
Taxation
The current Hungarian taxation system was introduced in 1988. The most important elements of the Hungarian tax system are corporate profit tax, personal income tax, value added tax, excise duty and local taxes. The Hungarian tax system has undergone moderate changes in recent years in an effort to improve competitiveness and to harmonize the Hungarian tax system with EU standards.
Hungarian tax law distinguishes between domestic and foreign taxpayers. The tax liability of a domestic taxpayer extends to income originating from both Hungary and abroad, while the tax liability of a non-Hungarian taxpayer is restricted to its Hungarian source income as defined by the relevant Hungarian tax law and also as may be affected by an applicable double taxation treaty. Hungary has entered into a double taxation treaty with more than 60 countries, including almost all of the OECD countries. Of the OECD countries, Hungary does not have a double taxation treaty with New Zealand.
Hungary, like many developing countries, has a substantial “shadow” economy that avoids paying taxes. However, the “shadow” economy has diminished in recent years, as evidenced by an increase in tax receipts that have outpaced GDP growth. Further improvement is expected as larger companies and multinational enterprises assume a greater role in the Hungarian economy.
Corporate Profit Tax and Corporate Dividend Tax
Effective January 1, 2017, the corporate tax was reduced to a flat rate of 9%, based on a tripartite agreement signed between the Government, employers, and employees represented by trade unions. Domestic entities receiving dividends are exempt from Hungarian dividend tax. Foreign entities receiving dividends, interest and royalties from local sources are not subject to withholding tax.
The rate of small business tax (KIVA) was cut from the previous 16% to 14% in 2017 and again in 2018, to 13%. The fixed-rate tax on small businesses (“KATA”) is applicable for enterprises with revenues of up to HUF12 million per year, instead of the previous amount of HUF6 million.
Personal Income Tax
Since 2013, Hungary has had a flat-rate personal income tax, subject to a family allowance. As of January 1, 2016, the flat tax rate on personal income has been 15%.
For 2019, based on the number of children in the household, the personal income tax paid by an employee can be reduced by the respective amount set forth in the following table:
Table 55: Family Personal Income Tax Allowance
| Number of Children | | HUF(1) | |
| One child | | | 10,000 | |
| Two children(2) | | | 20,000 | |
| Three or more children | | | 33,000 | |
Source: MNE
Notes:—
| | (2) | As of January 1, 2016, the tax allowance for two children is HUF12,500, as of January 1, 2017, the tax allowance for two children is HUF15,000, as of January 1, 2018, the tax allowance for two children is HUF17,500, and as of January 1, 2019, the tax allowance for two children is HUF20,000. |
As of January 1, 2014, the family personal income tax allowance may be applied as a deduction not only for purposes of personal income tax, but also for purposes of the healthcare contribution and pension contribution paid by the employee.
As of January 1, 2020, personal income tax for mothers with four or more children was reduced to zero.
Value Added Tax
As of January 1, 2012, the standard VAT rate was set to 27%. A reduced 18% VAT rate was introduced with respect to certain basic food items, and a 5% rate was set on special needs items (e.g., medicine and books). Currently, there is no tax imposed on certain services (e.g., postal and financial services). The current Hungarian VAT system is fully harmonized with all relevant applicable EU Directives.
The VAT rate on live pigs and half-carcasses was cut to 5% as of January 1, 2014. Subsequently, the VAT rate on live and slaughtered cattle, sheep and goats was cut to 5% as of January 1, 2015, and the VAT rate on unprocessed pork was cut to 5% as of January 1, 2016. Subsequently, the VAT rate on poultry, egg and milk was cut to 5%; and the VAT rate on restaurant and internet service was cut to 18% as of January 1, 2017. VAT on newly built homes was reduced to 5% for the years 2016, 2017, 2018 and 2019.
Registration Tax
Registration tax has been levied on the registration of cars since February 2004; however, in line with a relevant decision of the European Parliament, the registration tax was decreased significantly for all passenger cars. For environmental reasons, the largest reduction in tax has been for the most environment-friendly cars.
Excise Duty
An excise duty is levied on the manufacturing, importing, warehousing, storage and distribution of mineral oils, alcoholic products, beer, wine, champagne, intermediary alcohol products and tobacco products.
On April 10, 2014, the European Court of Justice declared that Hungary failed to fulfill its obligations under EU legislation relating to excise duties on alcoholic beverages. As a result, an excise duty was introduced on these items effective from January 1, 2015. The excise duty had been gradually increased since then in line with EU requirements.
Effective as of January 1, 2019, excise duty was raised to HUF18,200 per 1,000 pieces plus 24% of retail price with a floor of HUF21,200 per 1,000 pieces in the case of cigarettes; to 14% of retail price with a floor of HUF4,180 per 1,000 piece in case of cigars; and to HUF18,560 per kilogram in case of shag.
Surtax on Financial Institutions
On July 22, 2010, Parliament adopted an Act imposing a special tax on financial institutions on their 2010 income or adjusted balance sheet as of December 31, 2009 or the sum of the net value of managed funds and other managed portfolio assets (the “Surtax on Financial Institutions”). The Surtax on Financial Institutions was originally levied for the year 2011 and was applicable to all financial institutions (both domestic and foreign) with at least one set of annual financial statements prepared by July 1, 2010, including banks, insurance companies and other financial sector enterprises (e.g., investment companies, stock exchanges, commodity exchange service providers, venture capital fund managers, and investment fund managers), including their branches. The Government decided to establish the Surtax on Financial Institutions as a permanent tax.
An agreement concluded on December 15, 2011, allowed for the Surtax to be reduced by certain loss items arising from the fixed-rate repayment schedule.
In 2015, the Government submitted to Parliament an amendment to the Surtax on Financial Institutions in line with the informal guidelines of the European Commission and in accordance with the Memorandum of Understanding concluded with the EBRD. The bill reduced the highest surtax rate by 0.07 percentage points, from 0.31% to 0.24% effective as of January 1, 2016. The lower surtax rate remained unchanged at 0.15%, up to HUF50 billion. The tax base remained the modified balance sheet total of 2009. On December 15, 2015, Parliament adopted the amendment, setting a surtax rate of 0.15% to be applied to up to HUF50 billion on the adjusted balance sheet, and a rate of 0.24% above this threshold. As of January 1, 2017, the surtax rate was decreased from 0.24% to 0.21%, and, as of January 1, 2019, the surtax rate was decreased from 0.21% to 0.20% on adjusted balance sheet totals exceeding HUF50 billion.
In June 2015, the Government implemented tax relief of up to 30% of the Surtax on Financial Institutions, effective as of 2016, for lenders that had increased their volume of corporate lending since 2009. The tax relief equaled the increased amount of corporate loans outstanding, but could not exceed 30% of bank tax payable by the lender. The total reclaimable amount was capped at HUF10 billion. If requested refunds breached the HUF10 billion ceiling, the amount of refunds would be proportionately distributed among lenders that, instead of deleveraging, opted to increase lending after 2009.
The tax base and rate vary according to the type of institution and are currently as follows:
Table 56: Tax Base and Rate
| Type of Institution | | Tax Base and Rate |
| Banks | | 0.15% of the adjusted balance sheet total up to HUF50 billion and 0.20%(1) of amounts in excess of such threshold |
| Insurance companies | | —(2)(3) |
| Financial enterprises | | 6.5% of interest and 6.5% of fees and commission income |
| Investment companies | | 5.6% of the adjusted net income |
| Stock exchanges | | 5.6% of the adjusted net income |
| Commodity exchange service providers | | 5.6% of the adjusted net income |
| Venture capital fund managers | | 5.6% of the adjusted net income |
| Investment fund managers | | —(4) |
Source: Act No. LIX of 2006 on special tax and charge enhancing the balance of public finances.
Notes:—
| (1) | In 2016 the tax rate was 0.24%, and until January 1, 2015, the tax rate was 0.53%. As of January 1, 2019, the tax rate was decreased to 0.20%. |
| (2) | In 2011 and 2012, the tax rate was replaced by a three-tier progressive tax rate structure with rates of 1.5%, 3.0% and 6.4%. The lowest tier extended up to HUF1 billion, the middle tier from HUF1 billion to HUF8 billion, and the highest rate on income exceeding HUF8 billion. |
| (3) | As of January 1, 2013, surtax on insurance companies has been abolished, and uniform insurance tax has been introduced. |
| (4) | Prior to January 1, 2015, the tax rate was 0.028% levied on the sum of the net value of managed funds and other managed portfolio assets. As of January 1, 2015, investment fund managers are exempt from the surtax on financial institutions; simultaneously, a new special tax was introduced. |
Uniform Insurance Tax
On July 9, 2012, Parliament adopted the Act on Uniform Insurance Tax to decrease the number of taxes imposed on insurance companies. The tax base is the insurance fee. The rate of the tax is 15% for all-risk vehicle insurance fees and 10% for property and accident insurance fees. The amount of the tax is calculated, declared and paid by the insurance companies monthly. This Act went into effect on January 1, 2013, and with the introduction of this new type of tax, the surtax imposed on insurance companies and the fire protection contribution were abolished.
Surtax on Telecommunications and Energy Sectors
On October 20, 2010, Parliament adopted an Act approving a surtax on retail businesses, telecommunications companies and energy supply companies. Telecommunication companies are subject to a 4.5% tax on annual net sales revenues between HUF500 million and HUF5 billion and 6.5% on the excess above HUF5 billion. Energy supply companies, which are already subject to a special surtax of 8% on adjusted net profits in addition to the standard corporate income tax rate, are now subject to an additional 0.3% tax on annual net sales revenues up to HUF5 billion and 1.05% on revenues exceeding HUF5 billion.
Surtax on Certain Products Endangering Public Health
As of September 1, 2011, an Act went into effect that introduced a surtax on certain products containing high levels of sugar or salt. The surtax is imposed on the person or legal entity selling the product for the first time in Hungary (e.g., the Hungarian manufacturer or the importer). The following table sets forth the tax rates applicable since January 1, 2014:
Table 57: Surtax Rates on High Sugar or Salt Products
| Type of product | | Tax Rate |
| Soft drinks | | HUF7 or 200 per liter |
| Energy drinks | | HUF40 or 250 per liter |
| Pre-packaged product with high level of sugar | | HUF70 or 130 per kilogram |
| Salted snacks (e.g. chips) | | HUF250 per kilogram |
| Food flavoring mixes | | HUF250 per kilogram |
| Flavored beer or alcoholic beverages | | HUF20 or 100 or 300 or 500 or 700 or 900 per liter(1) |
| Marmalade | | HUF500 per kilogram |
Source: Act No. CIII of 2011 on Public Health Product Tax
Note:—
| (1) | According to the alcohol content of the beverages |
The following table sets forth the tax rates applicable as of January 1, 2019:
| Type of Product | | Tax Rate | |
| HUF/liter or HUF/kilogram | | |
| Soft drinks (syrup) | | | 240 | |
| Soft drinks (other) | | | 15 | |
| Energy drinks (containing methyl xanthine and taurine) | | | 300 | |
| Energy drinks (containing methyl xanthine) | | | 50 | |
| Cocoa powder with added sugar | | | 85 | |
| Pre-packed products (with high level of sugar) | | | 160 | |
| Salted snacks | | | 300 | |
| Food flavoring mixes | | | 300 | |
| Flavored beer | | | 25 | |
| Alcoholic refreshing drinks | | | 25 | |
| Marmalade | | | 600 | |
| Alcoholic drinks (depending on alcohol content) | | | 25-1,100 | |
Source: National Tax and Customs Administration
Financial Transaction Duty
After several amendments adopted by Parliament, the Act on Financial Transaction Duty went into effect as of January 1, 2013. The rate of duty was originally set at 0.2% of the transferred amount and 0.3% for cash withdrawals. The duty is payable by the entity providing the relevant payment service. The amount of the duty is capped at HUF6,000 per transaction. This cap is not applicable when the taxpayer is the Settlement Center of the Hungarian Post or the Hungarian Treasury, except that the duty payable with respect to each transaction at the Treasury involving the sale of government securities is also capped at HUF6,000. In accordance with the recommendation of the European Commission, the transactions of the NBH are not subject to this duty. Certain Treasury transactions are not subject to the duty (such as payments related to social security contribution funds, payments and transfers related to EU subsidies and initiated from accounts held at the Treasury, transactions involving accounts of the National Tax and Customs Administration held at the Treasury). Certain intra-group financing-related and investment service provision-related payment transactions are also exempt.
As of August 1, 2013, the financial transaction duty was increased. For cash withdrawals, the duty was increased from 0.3% to 0.6% and the cap was eliminated; for other transactions, the duty was increased from 0.2% to 0.3% and the cap remained at HUF6,000.
As of February 1, 2014, cash withdrawals from ATMs may be free of charge up to twice a month, up to a total of HUF150,000.
As of January 1, 2015, the Financial Transaction Duty became a lump-sum duty on electronic payment instruments. For contactless payment instruments, the duty is HUF500 per year and for other electronic payment instruments the duty is HUF800 per year. The duty is payable by the payment service provider upon every payment instrument used by an account holder.
On December 1, 2016, MNE announced that banks expanding their total amount of loans by at least 20% between the end of the year 2015 and the end of the year 2017 are entitled to reduce the financial transaction duty levied on the bank. The reduction was set at 0.6% of the increase of their total amount of loans. The maximum amount of reduction is HUF 300 million and may not exceed 80% of the financial transaction duty levied on the bank.
As of January 1, 2019, the Financial Transaction Duty was abolished in case of transactions of natural persons under HUF 20,000.
Public Utility Tax
As of January 1, 2013, public utilities, such as cables (electricity, phone, television, internet) and pipelines (gas, water, conduit) laid above or underneath municipal areas were subject to an additional tax. The entity owning the cable or pipeline pays this tax, except if the owner is the state or a local government, in which case the tax shall be paid by the service provider. The tax base of this tax is the total length of cables and pipelines, and the payable tax is HUF125 per meter of cable or pipeline.
Since 2014, the public utility tax rate applies to telecommunication cables according to the following three-tier system:
Table 58: Telecommunication Public Utility Tax Rates
| Length of Telecommunication Cables | | Public Utility Tax Rate |
| Up to 200,000 meters | | 0% of the standard tax is payable |
| Between 200,000 and 350,000 meters | | 30% of the standard tax is payable |
| Between 350,000 and 500,000 meters | | 75% of the standard tax is payable |
| 500,000 meters and above | | 100% of the standard tax is payable |
Source: Act No. CLXVIII of 2012
Low Tax-Bracket Enterprises and Small Enterprises Tax
As of January 1, 2013, new tax options were introduced as part of the Job Protection Action Plan for low tax-bracket enterprises and small enterprises. One of these new options for small enterprises is a tax of 16% of a tax base, including a cash-flow based profit plus wages and salaries. Businesses opting for such tax are exempt from certain taxes applicable to wages and salaries. Low tax-bracket enterprises choosing the flat rate tax payable monthly are exempt from the payment of the main central taxes, such as corporate and dividend tax, personal income tax and social contributions. As of January 1, 2018, the tax rate was reduced from 14% to 13%.
Other Central Government Revenues
Customs duties are imposed on goods imported from outside the European Union in accordance with the EU customs code. The central government levies duties on the acquisition of real estate, cars and certain other products and also on certain administrative procedures.
On June 26, 2013, Parliament adopted an Act on the amendment of certain acts related to organizing “remote” gambling. The Act provides for remote gambling (including online gambling and sports bets) services within the framework of a state regulated and supervised scheme. The national gambling organizer is entitled, by virtue of law, to organize remote gambling, while other organizers are entitled upon a concession agreement concluded as a result of a concession tender, and upon paying the concession fee stipulated by the annual budget act for the relevant year, to organize remote gambling. Since 2013, the yearly concession fee has been HUF100 million per each type of remote gambling. The Act went into effect on July 19, 2013.
As of November 15, 2013, rules related to the compulsory tendering of gambling concessions were modified. As a result of the modification, if there is an offer from a reliable gambling organizer, the responsible minister may execute a concession agreement without a concession tender, provided that the reliable gambling organizer undertakes to pay the double amount of the statutory concession fee.
On April 14, 2015, Parliament approved a bill amending the act regulating food chain safety. According to the bill, the food chain inspection fee amounts to 0.1% of total net revenues from food production including animal husbandry, plant cultivation and distribution.
Simplified Business Tax
Certain SMEs are entitled to pay a tax levied on the total revenues of the enterprise instead of paying corporate income tax. Enterprises with a total revenue of up to HUF30 million are entitled to choose to pay this tax. These enterprises are not subject to VAT.
Local Taxes
Local taxes vary among municipalities. Local governments are permitted to assess local business tax and various property taxes. Municipalities are entitled to introduce any type of community taxes beside local taxes, with the exception of tax types prohibited by law or which are already subject to an act.
Social Security and Extra-Budgetary Funds
The social security funds consist of two funds: the pension fund and the health fund. The following table sets forth the revenues and expenditures for social security and certain extra-budgetary funds:
Table 59: Social Security and Extra-Budgetary Funds, Revenues and Expenditures(1)
| | | For the Year ended December 31, | |
| | | 2015 | | | 2016 | | | 2017 | | | 2018 | | | 2019 | | | 2020 | | | 2020 | |
| | | Final | | | Final | | | Final | | | Final | | | Preliminary | | | Planned | | | Expected | |
| | | (HUF billions) | |
| Social Securities Fund | | | | | | | | | | | | | | | | | | | | | | | | | | | | |
| Revenues | | | 5,010.3 | | | | 5,133.6 | | | | 5,325.2 | | | | 5,702.9 | | | | 5,815.8 | | | | 6,269.5 | | | | 5,852.5 | |
| Expenditures | | | 5,035.8 | | | | 5,210.5 | | | | 5,468.1 | | | | 5,786.5 | | | | 6,050.7 | | | | 6,269.5 | | | | 6,514.0 | |
| Surplus (deficit) | | | (25.5 | ) | | | (76.9 | ) | | | (142.9 | ) | | | (83.7 | ) | | | (234.9 | ) | | | 0.0 | | | | (661.5 | ) |
| Extra Budgetary Funds(2) | | | | | | | | | | | | | | | | | | | | | | | | | | | | |
| Revenues | | | 511.0 | | | | 615.9 | | | | 719.6 | | | | 574.0 | | | | 658.2 | | | | 633.6 | | | | 617.4 | |
| Expenditures | | | 508.8 | | | | 617.0 | | | | 647.1 | | | | 566.4 | | | | 618.7 | | | | 641.7 | | | | 729.6 | |
| Surplus (deficit) | | | 2.2 | | | | (1.1 | ) | | | 72.5 | | | | 7.6 | | | | 39.5 | | | | (8.0 | ) | | | (112.2 | ) |
Source: Ministry of Finance
Notes:—
| (1) | For methodological remarks on planned, expected, preliminary, fact and final budgets, see “Public Finance—Methodology.” |
| (2) | Currently, these funds consist of the Nuclear Fund, the National Employment Fund, the Research and Development Fund, the National Cultural Fund, and the Bethlen Gábor Fund. |
The contribution of the central government to the social security funds was HUF560.0 billion in 2015, HUF409.7 billion in 2016, HUF623.9 billion in 2017, HUF591.6 billion in 2018, and HUF467.6 billion in 2019. The contribution of the central government to the social security funds is planned to be HUF628.0 billion in 2020 according to the approved budget. The contribution of the central government to the social security funds is expected to be HUF628.0 billion in 2020 according to the expected budget.
Social Security System
Before the fall of communism in 1989, social security in Hungary was based on the principle of solidarity and risk sharing. The provision of social, health and pension benefits through collection and reallocation was carried out by the Government. Since the change of the political and economic system, self-provision (individual private savings) has been playing an increasingly important role in Hungary’s social security system. Currently, Hungarian citizens may affect the amount of the social security benefits they receive in the future by making voluntary payments into a private investment account or joining a voluntary pension fund. The Government provides social security benefits for those incapable of self-provision.
Health Care System
The Hungarian health care system is accessible to persons who have a Hungarian social security card and make mandatory contributions to the social security system. Three levels of health care are available and are expected to be utilized in the order of basic care to more extensive care. However, treatments may begin at a higher level of care if it would be more efficient. The first level of care is the basic health care provided by the family doctor, the second level consists of specialized consulting services in out-patient care and the third level consists of in-patient care at a health care facility (e.g., hospital, clinic or sanatorium). However, disabled individuals are entitled to use ambulant services, receive sickness benefits and/or qualify for disability pensions. In addition to such disability benefits, disabled persons are entitled to additional financial and in-kind benefits, including, for instance, the right to use designated parking lots and receive financial assistance for travel.
A social contribution tax is payable by employers. The social contribution tax rate was reduced from 19.5% to 17.5% as of July 1, 2019. Subsequently the employer contribution was reduced to 15.5% as of July 1, 2020.
An 8.5% health care contribution and employment market contribution was payable by employees. Health fund contributions are similar to those for the pension fund; an employee contributes 7% of his or her income.
Effective August 1, 2013, a health care contribution is levied on interest income as well. The contribution is 6% of the interest income paid on bank deposits and securities, excluding government debt securities denominated in forint and issued by a member state of the European Economic Area. Health care contribution on interest income from bank deposits and securities has been abolished effective January 1, 2017.
Pension System
In the course of the reform of the social security system, the pension system has undergone a fundamental transformation over the last decade. The single-tier pension system was replaced by a three-tier system in 1998, pursuant to which, in addition to the pension contribution deducted from wages on a mandatory basis, private pension funds offer the possibility of self-provision. Furthermore, an employee had the possibility of joining a voluntary pension fund as well. The three pillars of this system were: compulsory state pensions; compulsory private pension funds; and voluntary private pension funds.
In November 2010, Parliament approved pension reform legislation with the ultimate goal of transforming the “three-pillar” system into a “two-pillar” system, which is closer to European practices. The “two-pillar” system would consist of the state-run compulsory pension and the voluntary private pension.
Until January 31, 2011, individuals who were participants in the compulsory private pension system could opt to transfer their private pension to the state-run pension system or opt to remain in the private pension system, although the former option is encouraged through significant incentives. The individuals remaining in the private pension system did not receive further entitlement in the state-run pension system and, therefore, with the exception of employees who already had the minimum service time of at least 20 years of employment in the state-run pension system, those individuals will receive their pensions solely from their private pension funds. Further, if the individuals opted to remain solely in a private pension fund, as of January 1, 2012, their 10% contribution was transferred to their selected private pension fund. For employees solely participating in the state pension system, the entire 10% contribution would be applied to the state pension fund.
The objective of the pension reform was to address concerns with the three-pillar system. Under such system, pension liabilities had been increasingly affecting the budget, and low net real returns on the compulsory private pensions posed a threat to future pension payments. The pension reform aimed to generate public revenue from two sources. First, the accumulated funds of individuals opting into the state pension system would contribute to a significant decrease in the explicit public debt. Second, revenues received from future pension contributions would help balance the state pension system in the long term.
The employer’s contribution (“social contribution tax”), which was reduced to 15.5% as of July 1, 2020, is paid into the state pension fund.
Effective January 1, 2010, the retirement age for both women and men was raised to 62.5 years. Until 2022, the retirement age will be gradually increased to 65 years. See “Public Finance—Budget Trends.” However, the positive effects of the pension reform on the general budget will not be apparent for at least 30 years because of delayed effectiveness.
Sustainability of the Social Security System
Health Care System
Since 2002, the in-kind benefits of the health insurance system have generally increased faster than GDP. This was the result of the rapid dissemination of innovative drugs, wage adjustments for health care employees and the rapid increase of services. Due to strict budgetary requirements in 2004, numerous short-term measures were adopted (including the freezing of pharmaceutical drug prices, digressive financing techniques and the introduction of cost-volume agreements) in order to help control the expenditures relating to the health care system.
In order to ease the burden of the state in the long-term in the financing of the health care system, the Government has reformed the health care system. The reform efforts are aimed at curbing the expenditure growth and introducing cost-effective services by changing the financing and incentive mechanisms.
Pension System
According to demographic projections, the proportion of the population over the retirement age compared to the population of the working age will increase significantly in the next decades. The increase in the retirement age (see “Pension System”) and the increase in the employment rate may result in a temporary improvement, but will not be sufficient to overturn the long-term trend.
In response to these adverse demographic trends, the Government has taken certain steps to reform the pension system. Most importantly, these steps, in addition to raising the retirement age, included the introduction of mixed financing and the application of the so-called “Swiss indexation” (the pension will increase by the simple average of wage increases and inflation) prior to 2009. After 2009, the pensions were indexed to the inflation rate.
Local Government Finance
The following table sets forth the revenues and expenditures at the local government level for the years indicated for all the local governments:
Table 60: Local Government Revenues and Expenditures
| | | For the Year ended December 31. | |
| | | 2015 | | | 2016 | | | 2017 | | | 2018 | | | 2019 | | | 2020 | | | 2020 | |
| | | Final | | | Final | | | Final | | | Final | | | Fact | | | Planned | | | Expected | |
| | | (HUF billions) | |
| Revenues | | | | | | | | | | | | | | | | | | | | | | | | | | | | |
| Own revenues | | | 1,149.1 | | | | 1,149.0 | | | | 1,170.7 | | | | 1,298.7 | | | | 1,405.1 | | | | 1,416.5 | | | | 1,304.2 | |
| Subsidies | | | 665.4 | | | | 675.4 | | | | 700.5 | | | | 746.8 | | | | 778.5 | | | | 739.0 | | | | 771.7 | |
| Other revenues | | | 1,032.0 | | | | 653.0 | | | | 1,139.0 | | | | 924.1 | | | | 894.5 | | | | 798.1 | | | | 838.2 | |
| Total revenues, GFS (excluding privatization) | | | 2,846.5 | | | | 2,477.4 | | | | 3,010.2 | | | | 2,976.8 | | | | 3,078.1 | | | | 2,953.6 | | | | 2,914.1 | |
| Privatization revenues | | | 1.1 | | | | 1.6 | | | | 2.9 | | | | 3.4 | | | | 3.5 | | | | 2.2 | | | | 3.5 | |
| Total revenues (including privatization) | | | 2,847.6 | | | | 2,479.0 | | | | 3,013.1 | | | | 2,980.2 | | | | 3,081.6 | | | | 2,955.8 | | | | 2,917.6 | |
| Expenditures | | | | | | | | | | | | | | | | | | | | | | | | | | | | |
| Wages | | | 797.4 | | | | 843.6 | | | | 861.0 | | | | 900.0 | | | | 959.4 | | | | 891.5 | | | | 962.9 | |
| Investments | | | 966.5 | | | | 356.9 | | | | 559.6 | | | | 696.8 | | | | 913.3 | | | | 927.6 | | | | 809.4 | |
| Other expenditures | | | 1,070.1 | | | | 993.5 | | | | 1,073.6 | | | | 1,133.9 | | | | 1,285.2 | | | | 1,182.1 | | | | 1,207.0 | |
| Total expenditures | | | 2,834.0 | | | | 2,194.0 | | | | 2,494.2 | | | | 2,730.7 | | | | 3,157.9 | | | | 3,001.2 | | | | 2,979.3 | |
| Surplus (deficit), GFS (excluding privatization) | | | 12.5 | | | | 283.4 | | | | 516.0 | | | | 246.1 | | | | (79.8 | ) | | | (47.6 | ) | | | (65.2 | ) |
| Surplus (deficit) (including privatization) | | | 13.6 | | | | 285.0 | | | | 518.9 | | | | 249.5 | | | | (76.3 | ) | | | (45.4 | ) | | | (61.7 | ) |
Source: Ministry of Finance
The municipalities are to a large extent autonomous, according to the Hungarian Constitution and the Local Government Act. However, the Government must take the local government deficit into account when preparing and implementing the central government budget and other parts of the public budget, over which the Government and Parliament have more direct control. Parliament can, nevertheless, influence the financial situation of local governments through the volume of budget grants (transfers) and the tax-sharing system. The debt management and debt financing of municipalities was restricted as of January 1, 2012. See “Political System—Local Government.” During 2019, the revenues of the local governments amounted to HUF3,081.6 billion, and the expenditures amounted to HUF3,157.9 billion, and the fiscal balance of the local governments, excluding proceeds from privatizations, amounted to a deficit of HUF79.8 billion for 2019.
EU Net Position
The following table sets forth certain information with respect to the budgetary relations between Hungary and the EU:
Table 61: Budgeted Financial Flows between Hungary and the EU Budget between 2015 and 2019
| | | For the year ended December 31, | |
| | | 2015 | | | 2016 | | | 2017 | | | 2018 | | | 2019 | |
| | | (HUF millions, current prices) | |
| EU resources appearing in the Hungarian budget | | | 1,165,949.0 | | | | 634,285.8 | | | | 1,032,013.8 | | | | 1,330,456.6 | | | | 1,254,769.6 | |
| National contribution (co-financing of projects) | | | 1,563,834.3 | | | | 1,382,287.1 | | | | 1,447,147.2 | | | | 475,908.2 | | | | 184,463.3 | |
EU resources out of the Hungarian budget
(mainly agricultural subsidies) | | | 402,262.2 | | | | 414,393.6 | | | | 362,415.1 | | | | 391,283.9 | | | | 492,351.0 | |
| National contribution to the EU Budget | | | 306,002.5 | | | | 295,330.3 | | | | 260,395.4 | | | | 316,469.5 | | | | 365,306.5 | |
Source: Ministry of Finance
Certain EU funds are only available for certain projects if Hungary contributes a specified percentage amount towards such project. In addition, EU funds that are not used for their designated purpose in a given year are lost and cannot be carried over to a subsequent year.
The EU Commission has criticized Hungary’s high budget deficit several times in the past following Hungary’s failure to reach its targets for reducing its budget deficit. In December 2004, the EU Commission stated that Hungary was the only country among the 10 new member states at such time not to take effective action to curb its large budget deficit. In 2004, the EU Commission initiated a so-called “excessive deficit procedure” against Hungary for failing to achieve these targets. Since Hungary is not yet a member of the Eurozone, the last two steps of the Excessive Deficit Procedure that would impose penalty payments on Hungary do not apply. However, the non-compliance with the recommendations could result in the freezing of some EU subsidies, although there is no precedent for such penalties being levied by the EU in the past. Hungary has reached its budget deficit targets in recent years. See “Table 42: General Budget Balance, consolidated”.
Medium-Term Fiscal Program and the Convergence Program
Hungary’s economic policy targets are set out in a Convergence Report submitted annually to the European Commission. The report discusses Hungary’s policy goals for achieving the criteria set by the European Commission to attain membership in the Eurozone. The European Commission regularly evaluates the Convergence Reports, including the economic targets and the achievement of such targets.
Under the EU legislation, prior to adopting the Euro, Hungary is required to have fulfilled the following convergence criteria (the “Maastricht Criteria”):
| | · | Price stability – maintain a sustainable price performance and achieve an average rate of inflation (measured over a period of one year before the examination) that does not exceed by more than 1.5% the average rate of inflation of the three member states which perform the best in terms of price stability; |
| | · | Long-term interest rates – achieve an average nominal long-term interest rate (measured over a period of one year before the examination) that does not exceed by more than 2% that of the three best-performing EU Member States in terms of price stability; |
| | · | Government budgetary position – achieve a ratio of planned or actual government deficit to GDP that does not exceed 3%, unless either (i) the ratio has declined substantially and continuously and reached a level that comes close to the reference value or (ii) the excess of the reference value is only exceptional and temporary and the ratio remains close to the reference value; |
| | · | Government debt – achieve a ratio of government debt to GDP that does not exceed 60%, unless the ratio is sufficiently diminishing and approaching the reference value at a satisfactory pace; and |
| | · | Exchange rate – participate for at least two years in the Exchange Rate Mechanism (“ERM II”) and observe the normal fluctuation margins close to central parity provided for by the mechanism for at least two years. |
The convergence required for entering the Eurozone is formally assessed annually and the final decision is subsequently made by a summit of EU Member States acting on the recommendation of the ECOFIN Council.
On May 5, 2020, the Ministry of Finance published the latest version of Hungary’s Convergence Program. According to the Program, the Government expected the budget deficit to GDP ratio (according to Excessive Deficit Procedure (EDP) methodology) to reach 3.8% in 2020, 2.7% in 2021, 2.2% in 2022, 1.6% in 2023, and 1.0% in 2024. The general government debt to GDP ratio (according to ESA methodology) was projected to reach 72.6% in 2020, 69.3% in 2021, 66.3% in 2022, 63.2% in 2023, and 59.8% in 2024. The Government plans to reduce the total revenue-to-GDP ratio from 44.0% in 2020 to 43.2% in 2021, 41.3% in 2022, 40.3% in 2023 and 38.8% in 2024. The Government plans to reduce the total expenditures-to-GDP ratio from 47.8% in 2020 to 45.9% in 2021, 43.5% in 2022, 41.9% in 2023, and 39.8% in 2024.
Future Economic Plan
On May 5, 2020, the Government also sent the 2020 National Reform Program to the European Commission. This document outlines major Government measures that have been implemented in order to meet the growth and employment objectives of the Europe 2020 strategy and comply with the country-specific recommendations of the previous year. The National Reform Program describes eight areas of importance:
| 1) | Growth-supporting policies |
| 2) | Business environment, regulations |
| 8) | Sustainable economic, climate and energy policy, transportation |
According to the program, strengthening enterprises, maintaining investments and a continuous capital accumulation – including physical infrastructure and human capital – is necessary to fight the ongoing crisis and to maintain the convergence process. Economic policies that promote enterprises’ resistance to crisis, productivity and global competitiveness, the adaptation of new technologies and domestic development are necessary. Hungary’s priorities are reaching full employment and supporting families, priorities that are supported by the development of targets for improved competitiveness. In addition, economic policy supporting sustainable and climate neutral development should be formed jointly with the European Union.
Recent Developments in Public Finance
On February 18, 2019, the Ministry for Innovation and Technology announced that the Government planned to set up a foundation in order to finance Corvinus University of Budapest. The foundation was named Maecenas Universitatis Corvini Alapítvány, and the foundation is expected to receive a 10% share of Richter (a pharmaceutical company) and a 10% share of MOL (a Hungarian oil company) (both companies are listed on BSE) previously owned directly by the state.
On May 31, 2019, the Ministry of Finance (the “MoF”) announced the launch of the Economy Protection Action Plan. The plan consists of 13+1 points:
| 1) | A 2 percentage point reduction in the social contributions tax; |
| 2) | A 1 percentage point reduction in small enterprise tax (KIVA); |
| 3) | Simplifying the tax system through the merger and abolition of taxes; |
| 4) | Abolition of advance tax payments; |
| 5) | Deferral of advertising tax; |
| 6) | A reduction of VAT on accommodation services; |
| 7) | Up to HUF5 million in VAT refunds for people constructing homes in small settlements; |
| 8) | Enterprises to receive funding for the establishment of workers’ accommodations; |
| 9) | The expansion of the development tax discount; |
| 10) | Increased capital for Garantiqa Creditguarantee Co. Ltd.; |
| 11) | Increased capital for the Agricultural Credit Guarantee Fund; |
| 12) | The development of the agricultural irrigation system; |
| 13) | An increase in research & development funding; and |
| +1) | The introduction of a new retail government bond, the Hungarian Government Bond Plus. |
On June 4, 2019, the Government submitted the planned budget for the year 2020. According to the MoF, the Government planned economic growth of 4%, inflation of 2.8% and a budget deficit target of 1% of GDP, in addition to a further, tangible reduction in the level of sovereign debt for 2020. The Government set a reserve level of 1% of GDP. Compared to 2010, HUF1,261 billion (EUR 3.89 billion) in additional funding will be available for supporting families, HUF840 billion (EUR 2.59 billion) more for pensions, HUF1,445 billion (EUR 4.46 billion) more for state sector pay rises, and HUF723 billion (EUR 2.23 billion) more for defense and law enforcement expenditure. The career model programs will continue with further pay increases, in addition to which a new, multi-step pay increase within the healthcare sector and the home nursing fee will also be increasing further. Subsequently, the budget was adopted on July 12, 2019.
On June 7, 2019, the MoF submitted a credit request to the China Exim Bank with respect to the construction of the Hungarian section of the Budapest-Belgrade railway line.
On July 29, 2019, the MoF announced that HUF500 billion (EUR 1.53 billion) in tax cuts would be realized over the next year and a half. The rate of the social contributions tax was reduced from 19.5% to 17.5% as of July 1, 2019, and was subsequently reduced to 15.5% as of July 1, 2020. The rate of advertising tax has been temporarily reduced from 7.5% to 0% between July 1, 2019 and December 31, 2022. The rate of small business tax (KIVA) decreased from 13% to 12% as of January 1, 2020, and the rate of VAT on accommodation services decreased to 5% from 18%. In addition, the lifelong exemption from the payment of personal income tax for mothers with four or more children became effective in January 2020. The simplified entrepreneurial tax (EVA) is being phased out.
As a result of the tax cuts, approximately HUF290 billion (EUR 886 million) is projected to stay in the pockets of businesses and the public compared to the previous year. The reduction of the social contributions tax will leave HUF145 billion (EUR 443 million) with businesses in 2019 and HUF300 billion (EUR 916 million) in 2020, while the remaining elements will mean a reduction of some HUF50 billion (EUR 153 million) over a period of 18 months. Due to the elimination of tax prepayments, businesses will be able to use around HUF170 billion (EUR 519 million) for an extra five months. The expansion of the development tax benefit is expected to significantly increase the willingness of small and medium-sized businesses (SMEs) to invest.
On January 9, 2020, the MoF announced that general government balance according to GFS methodology (excluding local governments) posted a HUF1,219.0 billion deficit during 2019.
On January 21, 2020, the Hungarian Debt Management Agency announced the repurchase of USD 1 billion in high interest rate USD bonds. The transaction was settled on January 31, 2020.
On March 16, 2020, Minister of Finance Mihály Varga announced that the reserves of the general government budget amount to 1% of GDP, and HUF8.8 billion was redirected to the health care system in light of the ongoing pandemic.
On March 18, 2020, Prime Minister Viktor Orbán announced several measures to combat the effects of the global COVID-19 pandemic:
| 1) | The principal and interest payment liabilities on loans taken out by private individuals and businesses up to March 18, 2020 have been suspended until the end of 2020. |
| 2) | Short-term business loans have been extended until June 30, 2020. |
| 3) | The maximum annual percentage rate for new consumer loans has been set at the central bank prime rate plus 5%. |
| 4) | In sectors already struggling with grave difficulties, such as tourism, catering, entertainment , sports, cultural services and passenger transportation, the contribution payment liabilities of employers are cancelled until June 30, 2020. At the same time, contributions by employees are being reduced significantly. Employees will not be required to pay pension contributions, and the health insurance contribution will be reduced to the statutory minimum. |
| 5) | Taxi drivers paying their taxes under the regime designed for small businesses (KATA) likewise will not be required to pay their flat-rate tax liabilities. |
| 6) | In the aforementioned sectors, the termination of rental agreements and the raising of rentals will not be allowed. |
| 7) | The tourism development contribution is cancelled until June 30, 2020. |
| 8) | Increasing the flexibility of rules of employment to make it easier for employers and employees to come to an agreement. |
On March 25, 2020, the MoF announced a new decree offering further relief measures to debtors. The primary purpose of the regulation is for the government to help customers taking advantage of the debt repayment moratorium not only in 2020, but also in 2021, when payment obligations resume. According to the regulation adopted, during the term of the moratorium, banks will not be allowed to charge compound interest, which significantly alleviates the burdens of debtors. From January 1, 2021, the amounts of the original amortization installments on such loans cannot be raised. The term is extended in such a way that the amounts of the amortization installments should remain unchanged during the term. The range of eligible loans was extended even further to employer loans and the National Asset Management Program. The payment moratorium also applies to employer loans, meaning that until December 31, 2020, employees will not be required to repay either the principal of the loan or the interest thereon to their employers. Participants in the National Asset Management Program – in addition to being granted a moratorium on the payment of purchase price instalments and rentals – also receive a housing guarantee, as the asset management company will not be allowed to terminate rental agreements due to non-payment.
On March 26, 2020, Minister of Finance Mihály Varga announced that the re-planning of the budget for 2020 was underway. According to the announcement, the economic impact of the fight against the spread of COVID-19 alters the entire budget. The economy protection measures, including the postponement of the tax payment liabilities of businesses, the suspension of executions and auctions, and the debt repayment moratorium, require a budget that provides the necessary financial coverage. According to the announcement, the goal remains to keep the deficit of the budget below 3%.
On March 27, 2020, Minister of Finance Mihály Varga announced that the Government had spent HUF245 billion to date defending against the COVID-19 pandemic. According to the statement, around HUF90 billion had remained within the Hungarian economy due to economy protection measures, and HUF157 billion were made available for the procurement of epidemiological equipment.
On April 4, 2020, the Government announced that it would reallocate HUF1,345 billion to the fund set up to protect and restart the economy. Funds reallocated from government ministries amount to HUF922 billion, and revenues reallocated from the National Employment Fund amount to HUF423 billion, totaling HUF1,345 billion expected to be available in the fund. As part of these efforts, the Government will guarantee the 20% pay raise for health visitors and health care specialists scheduled for November 2020, in addition to the extra bonus of HUF500,000 expected to be paid at the beginning of the summer. The cost of this measure is approximately HUF70 billion. Further, the Government will transfer HUF663 billion to the fund used to contain the COVID-19 pandemic, which funding would come from 50% of party grants in 2020, the trade tax payable by multinational companies, the contribution of the financial sector and the automobile tax due to local governments. According to the estimate of the Government, party grants amount to HUF1.2 billion, the tax payable by multinational companies amounts to HUF36 billion, tax payable by banks amounts to HUF55 billion, and the automobile tax redirected from local governments to the central budget would amount to HUF34 billion. These tax revenues, along with the HUF378 billion set aside from the central reserves, allow the Government to make HUF663 billion available for the fund in total. These measures will take effect by May 2020.
On April 6, 2020, Prime Minister Viktor Orbán announced a wage support program, the reintroduction of the “13th month pension,” the restarting of the national economy’s priority sectors, and the provision of subsidized credit facilities to the value of more than HUF2,000 billion for the funding of businesses. According to the announcement, the economy protection action plan will be implemented in three stages. The first phase was already introduced by the time of the announcement, including social security contribution reductions, the help provided for small businesses paying their taxes in the KATA regime, and the suspension of credit debt repayments. The three phases of the action plan will amount to 18% to 20% of GDP, including programs launched by the central bank. The deficit of the budget was raised from 1.0% to 2.7% of GDP.
Phase two started on April 6, 2020, and consists of five programs:
1) The first program is aimed at the preservation of jobs. In the case of shortened working hours, the Government is ready to foot part of the wage costs of employers as a form of wage support.
2) The second program, called Family and Pensioner Protection, consists of the reintroduction of the “13th month pension” in four installments. As a result, in February 2021, in addition to the January pension, pensioners will receive an extra week’s pension, with the same arrangement repeated in 2022, 2023 and 2024.
3) The third program supports priority sectors of the national economy which will have to be restarted. These include tourism, the health industry, the food industry, agriculture, the construction industry, logistics, transport, the film industry and the creative industry.
4) In the interest of providing funding for businesses, the Government will offer interest- and guarantee-subsidized credit facilities to Hungarian businesses to the total value of more than HUF2,000 billion.
5) In the interest of creating jobs, the Government will support projects in the amount of HUF450 billion.
On April 7, 2020, the Government announced the Economy Protection Action Plan. The most important measures are as follows:
| · | The release of 75,000 persons currently working in jobs requiring secondary qualifications because of the absence of language certificates from the obligation of taking foreign language examinations. This exemption applies to all students who will have successfully completed their higher education studies by August 31, 2020. |
| · | For the duration of the suspension of work, the state agrees to pay 70% of wages for a period of three months; however, the Government would like employees to do useful jobs in the interest of their employers during this period. |
| · | There is a 40% wage support available for three months in relation to persons in research and development jobs. |
| · | Administrative burdens and taxes are being reduced. |
| · | With a view to facilitating communication between economic actors and the government, a business information portal has been set up online. |
| · | As of July 1, 2020, the social contribution tax would be reduced by 2 percentage points. |
| · | The deadline for the submission of tax returns has been postponed to September 30, 2020. |
| · | In the Electronic Trade and Transport Control System, the Government will introduce exemptions from the provision of security. |
| · | Acceleration of VAT refunds, reducing the time limit in the case of normal taxpayers from 75 days to 30 days, while in the case of reliable taxpayers from 30 days to 20 days. |
| · | Special payment facilities, payment by installments, deferred payment and tax reduction options are being introduced, while forms are being simplified. |
| · | Due to any omission occurring during the state of danger, taxpayers cannot sustain any disadvantage in that capacity. |
| · | The documents required for sick leave can be submitted electronically. |
| · | The social insurance of workers sent on unpaid leave will not be terminated. |
| · | Calls for proposals with an allocation of hundreds of billions of forints will be released for companies retaining their work force for the purposes of technological developments, environmental protection and energy efficiency projects. |
| · | In response to company shutdowns, online training will be organized for workers. |
| · | The state will cover 95% of training fees while job-seekers are entitled to interest-free adult training student loans. |
| · | University students will be able to apply for a one-time, any-purpose, interest-free student loan in the amount of HUF500,000. |
| · | Sectors most affected by the virus and industries with extensive traditions in Hungary can expect extra funding. Accordingly, the construction industry, transport, logistics, tourism, the creative industry, the health industry and the food industry will have access to development grants and tax cuts, in addition to the availability of preferential loans and capital programs. |
| · | In order to support tourism, the tourism tax is suspended up to the end of the year. The social contribution tax on SZÉP cards (recreational benefits) is being reduced to 4% up to the end of June 2020, and the applicable limit will also increase. Refurbishment and development programs will likewise be available in this field. |
| · | The health industry will receive support. Both university and corporate research institutes will receive funding, and an Agency for Health Industry Innovation is being set up. |
| · | In the interest of protecting employers, credit guarantee and capital programs have been announced to boost corporate liquidity. Corporate credit facilities offered at preferential interest rates amount to almost HUF2,000 billion in total, with state guarantees amounting to HUF500 billion. |
| · | The deadlines attached to the home care fees for children will be extended, as will the eligibility of parents raising children with permanent illnesses for higher family allowances. |
| · | Instead of the end of the school year, this year’s eligibility for family allowance will be adjusted to the end of the state of danger. |
| · | The rules and deadlines relating to pensions and pension-like benefits will also change favorably. |
On April 9, 2020, the MoF announced that a one-time tax was levied on the banking industry equating to a rate of 0.19% of the tax base exceeding HUF50 billion (EUR 139.3 million), which will have to be paid in three installments by June 10, 2020, September 10, 2020 and December 10, 2020. The resultant revenue flowing into the budget will be HUF55 billion (EUR 153.2 million). This sum will be returned to the banking system over the next five years as deductions from the bank tax, meaning that it essentially equates to a one-time advance tax payment.
On April 28, 2020, Minister of Finance Mihály Varga announced that the credit agreement relating to the Belgrade-Budapest railway line had been signed. According to the agreement, concluded with China Eximbank, the Hungarian state will be financing 85% of the investment using credit, and the remaining 15% from its own resources and via an initial payment.
On May 5, 2020, Minister of Finance Mihály Varga announced that according to the latest Convergence Program of Hungary, GDP was projected to fall by 3% in 2020 and general government deficit was projected to reach 3.8% of GDP in 2020. Subsequently, on August 24, 2020 the Minister of Finance announced that the deficit for the year 2020 is projected to be between 7% and 9% of GDP.
On May 26, 2020, the Government submitted the budget for 2021 to the Parliament. According to the budget bill, the general government deficit according to ESA methodology (including local governments) would amount to 2.9% of GDP for the year 2021.
On June 25, 2020, Minister of Finance Mihály Varga announced that the government has allocated HUF923 billion forints for the Economy Protection Fund this year, and earmarked HUF2,550 billion for the fund for next year.
On June 29, 2020, the MoF announced that the government intends to make the regulations relating to the itemized small business tax (KATA) fairer. The level of the KATA tax would not change, the only goal is to exclude the possibility of system abuse. The most important change is a requirement of additional tax payments in certain instances. If the total value of transactions between a KATA entrepreneur and one of their business partners exceeds HUF 3 million within a given year, then a 40% tax must be paid on the sum exceeding HUF 3 million.
Effective July 1, 2020, the MoF announced that four types of tax contributions paid by employees were merged. The pension contribution, the in kind and in cash health insurance contributions, and the job market contribution (all paid by the employee) were merged into a single tax. The rate of the new unified contribution paid by the employee, the social security contribution, was set at 18.5%. Moreover, the rate of social contribution tax paid by the employer was decreased from 17.5% to 15.5%. In addition, all working pensioners were exempt from paying contributions beginning July 1, 2020.
On September 23, 2020, the Government announced an extension of the debt payment moratorium from December 31, 2020 to June 30, 2021 for parents raising children, pensioners, jobseekers, participants in public work schemes and businesses that have experiences a revenue decline of at least 25%. See “Monetary and Financial System—Recent Developments in Monetary Policy.”
NATIONAL DEBT
General Information
Traditionally, the NBH was the primary entity through which Hungary borrowed money in foreign currencies. Pursuant to the 1997 amendment to the National Bank Act, the NBH may now only incur foreign currency debt for its own purposes, and all foreign currency borrowings and debt security issuances for the central budget must be made directly by Hungary. In such respect, as of May 29, 2010, the MNE acts on behalf of Hungary (prior thereto, the Ministry of Finance had such responsibility). In turn, the MNE has delegated these debt management functions to the GDMA Pte Ltd., which was part of the Treasury until 2001, but thereafter became a separate legal entity. Since January 1, 1999, foreign currency debt issuances have been arranged by the GDMA Pte Ltd. See “Public Finance—Central Government Budget—Roles of the Ministry for National Economy, the Hungarian State Treasury and the Government Debt Management Agency.”
The NBH has remained the legal or named obligor on the outstanding foreign currency debt incurred prior to January 1, 1999. The majority of the interest rate and exchange rate risks associated with these debts and any related swaps, however, have been effectively transferred to Hungary pursuant to a series of transfer agreements, whereby Hungary has essentially agreed to pay the NBH sufficient funds to cover these obligations. Following this transfer of risk, Hungary entered into a number of swap agreements to match the currency profile of this debt portfolio to that of the currency basket (100% euro since January 2000) upon which the forint was pegged. Since January 1997, the NBH has acted in an agent role on the basis of an agency agreement, which was entered into by the NBH and Hungary, as permitted by the amended National Bank Act. The NBH was an agent of Hungary for the purposes of obtaining foreign loans and issuing securities abroad until the end of 2005.
Because of this history, all references to public debt include the debt of Hungary and the NBH. Public debt also includes the debt of the social security and other extra-budgetary funds, but does not include local government debt. External public debt refers to public debt that is denominated in a foreign currency and almost always owed to a non-Hungarian party. Internal public debt refers to public debt denominated in forint and typically owed to parties within the country. Gross external debt refers to all of the foreign currency denominated debt owed by Hungarian persons and both public and private entities to non-resident creditors. Loans between the NBH and Hungary relating to external borrowings originally made by the NBH were not added for the purposes of calculating public debt figures, to avoid double counting.
Public Debt
The following table sets out certain statistics regarding Hungarian public debt for the years indicated:
Table 62: Public Debt of Hungary(1)
| | | As of and for the year ended December 31, | |
| | | 2015 | | | 2016 | | | 2017 | | | 2018 | | | 2019(2) | |
| | | (HUF billions, except for percentages) | |
| Internal Public Debt | | | 16,207.9 | | | | 18,430.9 | | | | 20,689.4 | | | | 22,796.0 | | | | 24,357.1 | |
| % of Nominal GDP | | | 46.6 | % | | | 51.3 | % | | | 53.3 | % | | | 53.4 | % | | | 52.1 | % |
| External Public Debt | | | 7,735.8 | | | | 6,256.5 | | | | 5,782.5 | | | | 5,724.8 | | | | 5,121.2 | |
| % of Nominal GDP | | | 22.2 | % | | | 17.4 | % | | | 14.9 | % | | | 13.4 | % | | | 10.9 | % |
| Other Liabilities | | | 756.0 | | | | 742.7 | | | | 274.2 | | | | 167.4 | | | | 203.7 | |
| Total Public Debt | | | 24,699.7 | | | | 25,430.0 | | | | 26,746.2 | | | | 28,688.2 | | | | 29,682.0 | |
| % of Nominal GDP | | | 71.0 | % | | | 70.8 | % | | | 68.9 | % | | | 67.2 | % | | | 63.4 | % |
| Nominal GDP | | | 34,785.2 | | | | 35,896.3 | | | | 38,835.2.1 | | | | 42,661.8 | | | | 46,786.7 | |
Source: GDMA Pte Ltd.
Notes:—
| (1) | This table shows the public debt of Hungary from the perspective of the economic obligations of the central government. Financial derivatives and mark-to-market deposits from 2005 are included. In this table, external debt refers to government obligations denominated in foreign currency, while internal debt refers to obligations denominated in local currency. |
| (2) | Preliminary data as available at the end of September 2020. |
The government debt to GDP ratio amounted to 71.0% in 2015. In 2016 and 2017 the ratio decreased to 70.9% and 68.9%, respectively. In 2018, the ratio declined to 67.4%. In 2019, the ratio fell further to 63.4%.
The central government debt totaled HUF29,682.0 billion at the end of December 2019, showing an increase of 3.5% in nominal terms compared to HUF28,688.2 billion at the end of 2018.
The following table sets forth the maturity profile of the public debt of Hungary as of December 31, 2019:
| | | Forint
debt | | | HUF
bonds | | | Discount
Treasury
Bills | | | Retail
securities | | | HUF
loans | | | Foreign
exchange
debt | | | Foreign
currency
loans
raised
abroad | | | Domestic
foreign
currency
loans | | | Foreign
currency
bonds
issued
abroad | | | Foreign
currency
bonds
issued in
Hungary | | | Total | | | Other
debt | | | Total
central
government
debt | |
| | | (HUF Billions) | |
| 2020 | | | 5,339.7 | | | | 1,096.5 | | | | 657.3 | | | | 3,539.4 | | | | 46.5 | | | | 694.1 | | | | 31.0 | | | | 0.0 | | | | 532.4 | | | | 130.7 | | | | 6,033.8 | | | | 203.7 | | | | 6,237.5 | |
| 2021 | | | 1,903.3 | | | | 1,168.0 | | | | 0.0 | | | | 735.3 | | | | 0.0 | | | | 1,069.1 | | | | 108.2 | | | | 0.0 | | | | 762.1 | | | | 198.9 | | | | 2,972.4 | | | | 0.0 | | | | 2,972.4 | |
| 2022 | | | 3,156.5 | | | | 2,436.0 | | | | 0.0 | | | | 602.7 | | | | 117.7 | | | | 286.8 | | | | 34.0 | | | | 0.0 | | | | 0.0 | | | | 252.7 | | | | 3,443.3 | | | | 0.0 | | | | 3,443.3 | |
| 2023 | | | 1,892.8 | | | | 1,501.4 | | | | 0.0 | | | | 369.0 | | | | 22.4 | | | | 1,091.4 | | | | 99.0 | | | | 0.0 | | | | 992.4 | | | | 0.0 | | | | 2,984.2 | | | | 0.0 | | | | 2,984.2 | |
| 2024 | | | 5,765.0 | | | | 2,052.2 | | | | 0.0 | | | | 3,685.2 | | | | 27.6 | | | | 528.0 | | | | 53.0 | | | | 0.0 | | | | 475.1 | | | | 0.0 | | | | 6,293.0 | | | | 0.0 | | | | 6,293.0 | |
| 2025 | | | 1,573.4 | | | | 1,281.9 | | | | 0.0 | | | | 29.3 | | | | 262.3 | | | | 339.8 | | | | 9.3 | | | | 0.0 | | | | 330.5 | | | | 0.0 | | | | 1,913.2 | | | | 0.0 | | | | 1,913.2 | |
| 2026 | | | 987.7 | | | | 962.2 | | | | 0.0 | | | | 10.5 | | | | 15.0 | | | | 10.9 | | | | 10.9 | | | | 0.0 | | | | 0.0 | | | | 0.0 | | | | 998.6 | | | | 0.0 | | | | 998.6 | |
| 2027 | | | 1,264.9 | | | | 1,201.9 | | | | 0.0 | | | | 0.0 | | | | 62.9 | | | | 504.7 | | | | 174.1 | | | | 0.0 | | | | 330.5 | | | | 0.0 | | | | 1,769.5 | | | | 0.0 | | | | 1,769.5 | |
| 2028 | | | 734.0 | | | | 645.4 | | | | 0.0 | | | | 22.9 | | | | 65.8 | | | | 111.3 | | | | 111.3 | | | | 0.0 | | | | 0.0 | | | | 0.0 | | | | 845.3 | | | | 0.0 | | | | 845.3 | |
| 2029 | | | 77.0 | | | | 0.0 | | | | 0.0 | | | | 0.0 | | | | 77.0 | | | | 96.1 | | | | 96.1 | | | | 0.0 | | | | 0.0 | | | | 0.0 | | | | 173.0 | | | | 0.0 | | | | 173.0 | |
| 2030 | | | 889.5 | | | | 618.3 | | | | 0.0 | | | | 0.0 | | | | 271.2 | | | | 33.6 | | | | 33.6 | | | | 0.0 | | | | 0.0 | | | | 0.0 | | | | 923.1 | | | | 0.0 | | | | 923.1 | |
| 2031 | | | 410.8 | | | | 261.7 | | | | 0.0 | | | | 0.0 | | | | 149.1 | | | | 8.3 | | | | 8.3 | | | | 0.0 | | | | 0.0 | | | | 0.0 | | | | 419.1 | | | | 0.0 | | | | 419.1 | |
| 2032 | | | 77.4 | | | | 0.0 | | | | 0.0 | | | | 57.3 | | | | 20.1 | | | | 7.2 | | | | 7.2 | | | | 0.0 | | | | 0.0 | | | | 0.0 | | | | 84.6 | | | | 0.0 | | | | 84.6 | |
| 2033 | | | 76.6 | | | | 0.0 | | | | 0.0 | | | | 6.1 | | | | 70.6 | | | | 7.1 | | | | 7.1 | | | | 0.0 | | | | 0.0 | | | | 0.0 | | | | 83.7 | | | | 0.0 | | | | 83.7 | |
| 2034 | | | 4.7 | | | | 0.0 | | | | 0.0 | | | | 4.7 | | | | 0.0 | | | | 5.9 | | | | 5.9 | | | | 0.0 | | | | 0.0 | | | | 0.0 | | | | 10.5 | | | | 0.0 | | | | 10.5 | |
| 2035 | | | 4.3 | | | | 0.0 | | | | 0.0 | | | | 4.3 | | | | 0.0 | | | | 4.7 | | | | 4.7 | | | | 0.0 | | | | 0.0 | | | | 0.0 | | | | 9.0 | | | | 0.0 | | | | 9.0 | |
| 2036 | | | 3.6 | | | | 0.0 | | | | 0.0 | | | | 3.6 | | | | 0.0 | | | | 4.3 | | | | 4.3 | | | | 0.0 | | | | 0.0 | | | | 0.0 | | | | 7.9 | | | | 0.0 | | | | 7.9 | |
| 2037 | | | 2.8 | | | | 0.0 | | | | 0.0 | | | | 2.8 | | | | 0.0 | | | | 4.3 | | | | 4.3 | | | | 0.0 | | | | 0.0 | | | | 0.0 | | | | 7.1 | | | | 0.0 | | | | 7.1 | |
| 2038 | | | 193.2 | | | | 192.2 | | | | 0.0 | | | | 1.0 | | | | 0.0 | | | | 3.0 | | | | 3.0 | | | | 0.0 | | | | 0.0 | | | | 0.0 | | | | 196.2 | | | | 0.0 | | | | 196.2 | |
| 2039 | | | 0.0 | | | | 0.0 | | | | 0.0 | | | | 0.0 | | | | 0.0 | | | | 2.2 | | | | 2.2 | | | | 0.0 | | | | 0.0 | | | | 0.0 | | | | 2.2 | | | | 0.0 | | | | 2.2 | |
| 2040 | | | 0.0 | | | | 0.0 | | | | 0.0 | | | | 0.0 | | | | 0.0 | | | | 2.6 | | | | 2.6 | | | | 0.0 | | | | 0.0 | | | | 0.0 | | | | 2.6 | | | | 0.0 | | | | 2.6 | |
| 2041 | | | 0.0 | | | | 0.0 | | | | 0.0 | | | | 0.0 | | | | 0.0 | | | | 293.0 | | | | 2.6 | | | | 0.0 | | | | 290.4 | | | | 0.0 | | | | 293.0 | | | | 0.0 | | | | 293.0 | |
| 2042 | | | 0.0 | | | | 0.0 | | | | 0.0 | | | | 0.0 | | | | 0.0 | | | | 2.6 | | | | 2.6 | | | | 0.0 | | | | 0.0 | | | | 0.0 | | | | 2.6 | | | | 0.0 | | | | 2.6 | |
| 2043 | | | 0.0 | | | | 0.0 | | | | 0.0 | | | | 0.0 | | | | 0.0 | | | | 2.6 | | | | 2.6 | | | | 0.0 | | | | 0.0 | | | | 0.0 | | | | 2.6 | | | | 0.0 | | | | 2.6 | |
| 2044 | | | 0.0 | | | | 0.0 | | | | 0.0 | | | | 0.0 | | | | 0.0 | | | | 2.6 | | | | 2.6 | | | | 0.0 | | | | 0.0 | | | | 0.0 | | | | 2.6 | | | | 0.0 | | | | 2.6 | |
| 2045 | | | 0.0 | | | | 0.0 | | | | 0.0 | | | | 0.0 | | | | 0.0 | | | | 2.6 | | | | 2.6 | | | | 0.0 | | | | 0.0 | | | | 0.0 | | | | 2.6 | | | | 0.0 | | | | 2.6 | |
| 2046 | | | 0.0 | | | | 0.0 | | | | 0.0 | | | | 0.0 | | | | 0.0 | | | | 2.6 | | | | 2.6 | | | | 0.0 | | | | 0.0 | | | | 0.0 | | | | 2.6 | | | | 0.0 | | | | 2.6 | |
Source: GDMA Pte Ltd.
The following table sets forth the investor base of Hungarian government securities (including securities denominated in foreign currency, securities denominated in local currency with original maturity over 1 year and securities denominated in local currency with original maturity not exceeding 1 year) for the years indicated:
| | | As of December 31, | | | As of June
30, | |
| | | 2015 | | | 2016 | | | 2017 | | | 2018 | | | 2019 | | | 2020 | |
| | | (HUF billions) | |
| Nonfinancial corporations | | | 259.0 | | | | 278.7 | | | | 335.1 | | | | 354.8 | | | | 294.1 | | | | 263.4 | |
| Central Bank | | | 39.5 | | | | 39.4 | | | | 39.2 | | | | 39.2 | | | | 39.2 | | | | 203.5 | |
| Credit institutions | | | 6,582.8 | | | | 7,591.2 | | | | 8,612.8 | | | | 8,467.5 | | | | 8,366.0 | | | | 9,203.6 | |
| Money market funds | | | 163.2 | | | | 116.9 | | | | 68.7 | | | | 80.9 | | | | 22.7 | | | | 14.2 | |
| Other monetary financial institutions | | | 6,746.0 | | | | 7,708.1 | | | | 8,681.5 | | | | 8,548.4 | | | | 8,388.7 | | | | 9,217.8 | |
| Other financial intermediaries | | | 1,103.1 | | | | 1,107.1 | | | | 1,317.1 | | | | 1,341.0 | | | | 928.3 | | | | 799.5 | |
| Financial auxiliaries | | | 104.1 | | | | 140.1 | | | | 100.2 | | | | 101.1 | | | | 113.5 | | | | 118.6 | |
| Insurance corporations and pension funds | | | 1,985.3 | | | | 2,148.5 | | | | 2,291.9 | | | | 2,371.7 | | | | 2,428.3 | | | | 2,504.9 | |
| Financial corporations | | | 9,978.0 | | | | 11,143.3 | | | | 12,464.7 | | | | 12,401.4 | | | | 11,898.0 | | | | 12,844.3 | |
| Central government | | | 92.4 | | | | 163.8 | | | | 259.9 | | | | 252.2 | | | | 249.7 | | | | 276.3 | |
| Local government | | | 24.0 | | | | 145.2 | | | | 264.0 | | | | 284.9 | | | | 292.5 | | | | 309.1 | |
| Social security funds | | | 0.0 | | | | 0.0 | | | | 0.0 | | | | 0.0 | | | | 0.0 | | | | 0.0 | |
| General government | | | 116.4 | | | | 309.0 | | | | 523.9 | | | | 537.1 | | | | 542.2 | | | | 585.4 | |
| Households | | | 3,159.8 | | | | 4,178.8 | | | | 5,024.9 | | | | 5,778.7 | | | | 8,047.1 | | | | 8,530.9 | |
| Nonprofit institutions serving households | | | 244.2 | | | | 221.9 | | | | 189.0 | | | | 258.1 | | | | 149.4 | | | | 154.5 | |
| Rest of the world | | | 11,028.6 | | | | 10,056.7 | | | | 9,220.3 | | | | 9,336.8 | | | | 9,458.5 | | | | 9,763.0 | |
| Total | | | 24,786.0 | | | | 26,188.4 | | | | 27,757.9 | | | | 28,666.9 | | | | 30,389.3 | | | | 32,141.5 | |
Source: NBH
The following table sets forth the investor base of Hungarian government securities denominated in local currency (including securities denominated in local currency with original maturity over 1 year and securities denominated in local currency with original maturity not exceeding 1 year) for the years indicated:
| | | As of December 31, | | | As of June
30, | |
| | | 2015 | | | 2016 | | | 2017 | | | 2018 | | | 2019 | | | 2020 | |
| | | (HUF billions) | |
| Nonfinancial corporations | | | 145.4 | | | | 216.8 | | | | 302.7 | | | | 328.4 | | | | 281.0 | | | | 248.3 | |
| Central Bank | | | 39.5 | | | | 39.4 | | | | 39.2 | | | | 39.2 | | | | 39.2 | | | | 203.5 | |
| Credit institutions | | | 6,052.2 | | | | 7,123.8 | | | | 8,157.5 | | | | 8,141.1 | | | | 8,071.1 | | | | 8,3972.8 | |
| Money market funds | | | 156.3 | | | | 97.0 | | | | 59.8 | | | | 69.1 | | | | 20.3 | | | | 14.2 | |
| Other monetary financial institutions | | | 6,208.5 | | | | 7,220.9 | | | | 8,217.3 | | | | 8,210.2 | | | | 8,091.4 | | | | 8,987.1 | |
| Other financial intermediaries | | | 823.1 | | | | 943.1 | | | | 1,180.6 | | | | 1,175.3 | | | | 824.1 | | | | 651.1 | |
| Financial auxiliaries | | | 102.5 | | | | 138.5 | | | | 98.6 | | | | 99.8 | | | | 112.1 | | | | 115.9 | |
| Insurance corporations and pension funds | | | 1,914.9 | | | | 2,095.1 | | | | 2,266.4 | | | | 2,350.6 | | | | 2,410.9 | | | | 2,484.5 | |
| Financial corporations | | | 9,088.5 | | | | 10,437.0 | | | | 11,810.2 | | | | 11,875.1 | | | | 11,477.7 | | | | 12,442.0 | |
| Central government | | | 92.4 | | | | 163.8 | | | | 259.9 | | | | 252.2 | | | | 249.7 | | | | 276.3 | |
| Local government | | | 23.7 | | | | 145.0 | | | | 263.5 | | | | 284.9 | | | | 292.5 | | | | 309.1 | |
| Social security funds | | | 0.0 | | | | 0.0 | | | | 0.0 | | | | 0.0 | | | | 0.0 | | | | 0.0 | |
| General government | | | 116.2 | | | | 308.8 | | | | 523.3 | | | | 537.1 | | | | 542.2 | | | | 585.4 | |
| Households | | | 3,012.6 | | | | 4,056.5 | | | | 4,870.9 | | | | 5,604.2 | | | | 7,848.3 | | | | 8,312.8 | |
| Nonprofit institutions serving households | | | 170.2 | | | | 164.4 | | | | 194.7 | | | | 254.2 | | | | 145.0 | | | | 149.7 | |
| Rest of the world | | | 4,314.8 | | | | 3,925.1 | | | | 3,857.2 | | | | 4,181.1 | | | | 4,622.7 | | | | 4,261.5 | |
| Total | | | 16,847.7 | | | | 19,108.5 | | | | 21,550.9 | | | | 22,780.1 | | | | 24,916.8 | | | | 25,999.7 | |
Source: NBH
On March 31, 2020, the NBH published the final financial accounts for the general government and households. According to data published by the NBH, general government consolidated gross debt at nominal value (Maastricht debt) including Eximbank as of the end of December 2019 amounted to HUF 31,040 billion, equaling 66.3% of GDP.
The Maastricht measure of general government debt is defined as the sector’s consolidated gross debt at nominal value, excluding other liabilities. The following table sets forth the general government consolidated gross debt at nominal value as a percent of GDP for the years indicated:
| | | As of December 31, | |
| | | 2015 | | | 2016 | | | 2017 | | | 2018 | | | 2019 | |
| | | (Percent of GDP) | |
| Maastricht debt | | | 76.2 | % | | | 75.5 | % | | | 72.9 | % | | | 70.2 | % | | | 66.3 | % |
Source: NBH
According to data compiled by Eurostat, the government debt to GDP ratio in the European Union amounted to 77.7% as of December 31, 2019.
On January 1, 2012, the Act on Economic Stability of Hungary went into effect. The Act contains regulations related to government debt reduction rules and detailed regulation of central government debt limits, rules of governing the central government debt, the legal status of the Government Debt Management Agency, and the organizational and procedural order of the Budgetary Council. Moreover, on the same day, the Act on Public Finance went into effect, which divides the Hungarian public finance system into two subsystems: the subsystem of central government and the subsystem of municipalities. The social security funds and the separated state funds became part of the central government budget.
According to the financing plan issued by GDMA Pte Ltd. in December 2019, the net financing need for 2020 was planned to reach HUF367 billion. The total amount of government debt redemptions in 2020 was planned at HUF6,265 billion, local currency debt redemptions were planned to amount to HUF5,524 billion, and foreign currency debt redemptions were planned to amount to HUF741 billion (equaling EUR 2.2 billion). Total gross issuance was planned to reach HUF 7,335 billion in 2020. Total gross issuance in foreign currency was planned to amount to HUF332 billion, constituting 4.5% of total gross issuance. HUF1,617 billion worth of government bonds denominated in local currency would be offered at auctions, while another
HUF400 billion of bonds was expected to be sold at switch auctions. The following table sets forth the planned distribution of issuance of local currency denominated government bonds for 2020:
| | | Planned
Issuance | |
| | | (%) | |
| 3-year Bond | | | 10 | |
| Floating Rate Bonds | | | 4 | |
| 5-year Bond | | | 27 | |
| Bonds at Switch Auctions | | | 20 | |
| 10-year Bond | | | 27 | |
| 15-year Bond | | | 6 | |
| 20-year Bond | | | 6 | |
| Total | | | 100 | |
Source: GDMA Pte Ltd.
GDMA Pte Ltd. has determined the following benchmark targets for government debt management in 2020: The share of the foreign currency denominated debt within the total central government debt should remain between 10% and 20%. Foreign currency obligations after swaps should be 100% denominated in euros, with an allowance for a 5% deviation from this target. Within the forint-denominated debt, the share of the fixed rate elements should between 60% and 80%, and that of floating rate debt, which includes all short-term debt, between 20% and 40%. Within the foreign currency denominated debt, the share of the fixed rate elements should be between 60% and 80%, and that of floating rate debt between 20% and 40%. The average time to refixing of the forint debt portfolio should exceed 3.5 years. The average term to maturity of the forint debt portfolio should exceed 4 years. A minimum target balance of the Single Treasury Account has been determined and GDMA Pte Ltd.’s objective is to keep the end-of-day actual balance above this level.
On April 22, 2020, GDMA Pte Ltd. issued a revised financing plan. According to the revised financing plan, the net financing need for 2020 is planned to reach HUF1,601 billion. Total gross issuance is planned to reach HUF9,476 billion in 2020; total gross issuance in foreign currency was planned to amount to HUF1,432 billion, constituting 15.1% of total gross issuance. It is expected that HUF3,669 billion worth of government bonds denominated in local currency will be issued, while another HUF3,255 billion of retail bonds will be sold.
Subsequently on May 26, 2020, the financing plan was revised again. According to the revised financing plan issued by GDMA Pte Ltd. in May 2020, the net financing need for 2020 is planned to reach HUF1,890 billion. Total gross issuance is planned to reach HUF10,100 billion in 2020. Total gross issuance in foreign currency was planned to amount to HUF1,621 billion constituting 16% of total gross issuance. It is expected that HUF4,088 billion worth of government bonds denominated in local currency will be issued, while another HUF3,344 billion of retail bonds will be sold.
GDMA Pte Ltd. holds regular domestic bond auctions based on an annual auction calendar. Primary Dealers (currently 14 foreign and local banks) are entitled to enter the primary market. In addition to BSE listing a Mercato dei Titoli di Stato (“MTS”) trading platform is operated by GDMA Pte Ltd. and EuroMTS Limited (otherwise known as MTS Hungary, a division of MTS Cash Domestic Markets).
Hungary’s credit ratings
On November 4, 2016, Moody’s revised the rating of Hungary to “Baa3” from “Ba1” with a “stable” outlook.
On February 21, 2017, Japan Credit Rating Agency revised the rating of Hungary for long-term foreign government debt of Hungary from “BBB” to “BBB+” with a “stable” outlook.
On May 12, 2017, Fitch affirmed Hungary’s long-term foreign and local currency Issuer Default Ratings at “BBB-” with a “stable” outlook.
On August 25, 2017, Standard & Poor’s revised the outlook on Hungary’s ratings to “positive” from “stable.” The agency affirmed Hungary’s 'BBB-/A-3 long- and short-term foreign and local currency sovereign credit ratings.
On November 10, 2017, Fitch revised the outlook on the “BBB” rating assigned to the government debt of Hungary from “stable” to “positive.” The ratings were unchanged.
On August 17, 2018, Standard & Poorʼs affirmed Hungaryʼs "BBB-/A-3" long and short-term foreign and local currency sovereign credit ratings. The outlook for each remained “positive.”
On August 31, 2018, Fitch affirmed Hungary’s long-term foreign and local currency Issuer Default Ratings at “BBB-”. The outlook for each remained “positive.”
On February 15, 2019, Standard & Poor’s revised the rating assigned to the government debt of Hungary from “BBB-” to “BBB”. The outlook remained “stable”.
On February 22, 2019, Fitch revised the rating assigned to the government debt of Hungary from “BBB-” to “BBB” with a “stable” outlook.
On February 14, 2020, Standard & Poor’s revised the outlook assigned to the government debt of Hungary from “stable” to “positive”. The ratings were unchanged.
On February 21, 2020, Japan Credit Rating Agency revised the rating assigned to the long-term foreign government debt of Hungary from “BBB+” to “A-” with a “stable” outlook.
On April 28, 2020, Standard & Poor’s revised the outlook assigned to the government debt of Hungary from “positive” to “stable”. The ratings were unchanged at “BBB”.
On August 14, 2020, Standard & Poorʼs affirmed Hungary’s 'BBB/A-2' long- and short-term foreign and local currency sovereign credit ratings. The outlook on the long-term rating remains stable.
On August 14, 2020, Fitch affirmed Hungary's Long-Term Foreign-Currency Issuer Default Rating at 'BBB'. The outlook on the long-term rating remains stable.
On September 25, 2020, Moody’s revised the outlook on Hungary’s ratings from “stable” to “positive”. The agency affirmed Hungary’s long-term and senior unsecured debt ratings at Baa3.
External Public Debt
The following table sets forth the external public debt of Hungary as of December 31, 2019 by category and by currency:
Table 63: External Public Debt by Category and Currency
| By Category (financial derivatives are excluded): | | (EUR millions) | |
| Bank loans (including bank to bank and syndicated loans) | | | 752 | |
| Bonds & FRN | | | 14,751 | |
| Loans from multilateral financial institutions (e.g., IMF and World Bank) | | | 2,361 | |
| Total | | | 17,865 | |
| By Currency (financial derivatives are included): | | (%) | |
| Euro | | | 100 | |
| Other currencies (Swiss franc) | | | 0 | |
| Total | | | 100 | |
| By Currency (financial derivatives are excluded): | | Amount(1)
before swaps (%) | |
| Euro | | | 43 | |
| U.S. dollar | | | 54 | |
| Chinese renminbi | | | 2 | |
| Japanese yen | | | 1 | |
| Total | | | 100 | |
Source: GDMA Pte Ltd.
Note:—
| | (1) | Debt liabilities of the government sector that are not HUF-denominated (excluding financial derivatives but including mark-to-market deposits). |
External Public Debt Service and Schedule of Payments
Neither Hungary nor the NBH has ever defaulted on the payment of the principal of, or premium or interest on, any debt obligation issued by it.
The following table sets forth the maturity breakdown of Hungary's medium and long-term external debt by sectors (excluding SPEs) as of December 31, 2019:
Table 64: Schedule of Payments on External Public Debt as of December 31, 2019
| | | | | Central Bank and General Government | | | | Other MFIs and Other Sectors | | Public Sector:
Central bank
and General
Government and
Central |
| | | | | | | | | General Government | | | | | | Other MFIs | | Other sectors | | Government |
| | | Total | | | | Central
bank | | | | of which
HUF
denominated
bonds | | | | | | Deposit
taking
corporations
except the
central bank | | Money
market
funds | | | | Financial
corporations
other than
MFIs | | Non-
financial
corporations,
households,
and non-
profit
institutions
serving
households | | Controlled and
local
government
controlled
public
corporations
included in
Other MFIs and
Other sectors | | Private
sector:
non-public
corporations
included in
Other MFIs
and Other
sectors |
| | | (EUR million) | |
| 2020. Q1 | | 2,340 | | 1,573 | | 0 | | 1,572 | | 151 | | 768 | | 388 | | 388 | | 0 | | 380 | | 85 | | 294 | | 1,605 | | 735 |
| 2020. Q2 | | 502 | | 156 | | 0 | | 156 | | 144 | | 346 | | 110 | | 110 | | 0 | | 236 | | 71 | | 165 | | 192 | | 310 |
| 2020. Q3 | | 554 | | 214 | | 0 | | 214 | | 69 | | 340 | | 106 | | 106 | | 0 | | 234 | | 71 | | 163 | | 254 | | 300 |
| 2020. Q4 | | 1,380 | | 535 | | 0 | | 535 | | 149 | | 845 | | 433 | | 433 | | 0 | | 412 | | 90 | | 322 | | 582 | | 798 |
| 2020 | | 4,776 | | 2,478 | | 2 | | 2,477 | | 513 | | 2,298 | | 1,036 | | 1,036 | | 0 | | 1,262 | | 318 | | 944 | | 2,632 | | 2,144 |
| 2021. Q1 | | 4,332 | | 2,375 | | 0 | | 2,375 | | 0 | | 1,957 | | 1,625 | | 1,625 | | 0 | | 332 | | 75 | | 257 | | 2,406 | | 1,927 |
| 2021. Q2 | | 2,713 | | 424 | | 0 | | 424 | | 286 | | 2,289 | | 1,930 | | 1,930 | | 0 | | 359 | | 60 | | 300 | | 557 | | 2,156 |
| 2021. Q3 | | 1,633 | | 186 | | 0 | | 186 | | 7 | | 1,447 | | 997 | | 997 | | 0 | | 450 | | 51 | | 399 | | 250 | | 1,383 |
| 2021. Q4 | | 3,638 | | 1,126 | | 0 | | 1,126 | | 512 | | 2,513 | | 1,792 | | 1,792 | | 0 | | 721 | | 511 | | 209 | | 1,255 | | 2,383 |
| 2021 | | 12,316 | | 4,111 | | 0 | | 4,111 | | 805 | | 8,206 | | 6,343 | | 6,343 | | 0 | | 1,862 | | 697 | | 1,165 | | 4,467 | | 7,849 |
| 2022 | | 7,001 | | 2,830 | | 0 | | 2,830 | | 2,276 | | 4,171 | | 2,648 | | 2,648 | | 0 | | 1,522 | | 243 | | 1,280 | | 3,309 | | 3,692 |
| 2023 | | 8,146 | | 4,889 | | 0 | | 4,889 | | 778 | | 3,256 | | 1,527 | | 1,527 | | 0 | | 1,729 | | 260 | | 1,469 | | 5,335 | | 2,811 |
| 2024 | | 7,224 | | 5,142 | | 0 | | 5,142 | | 2,887 | | 2,081 | | 517 | | 517 | | 0 | | 1,564 | | 94 | | 1,470 | | 5,328 | | 1,896 |
| 2025 | | 4,393 | | 3,345 | | 0 | | 3,345 | | 2,428 | | 1,048 | | 134 | | 134 | | 0 | | 914 | | 27 | | 887 | | 3,427 | | 966 |
| 2026 | | 2,403 | | 1,262 | | 0 | | 1,262 | | 1,201 | | 1,141 | | 587 | | 587 | | 0 | | 553 | | 19 | | 535 | | 1,467 | | 936 |
| 2027 | | 4,421 | | 3,716 | | 0 | | 3,716 | | 2,156 | | 706 | | 74 | | 74 | | 0 | | 631 | | 13 | | 618 | | 3,753 | | 668 |
| 2028 | | 2,106 | | 1,439 | | 0 | | 1,439 | | 1,104 | | 667 | | 116 | | 116 | | 0 | | 551 | | 11 | | 540 | | 1,467 | | 639 |
| 2029 | | 1,981 | | 522 | | 0 | | 522 | | 233 | | 1,458 | | 456 | | 456 | | 0 | | 1,002 | | 172 | | 831 | | 544 | | 1,437 |
| 2030 | | 2,484 | | 2,309 | | 0 | | 2,309 | | 2,209 | | 175 | | 3 | | 3 | | 0 | | 172 | | 71 | | 102 | | 2,321 | | 163 |
| 2031 | | 938 | | 873 | | 0 | | 873 | | 849 | | 65 | | 3 | | 3 | | 0 | | 62 | | 5 | | 57 | | 883 | | 55 |
| After | | 4,404 | | 3,649 | | 1,222 | | 2,427 | | 378 | | 756 | | 101 | | 101 | | 0 | | 655 | | 81 | | 574 | | 3,680 | | 724 |
| Total | | 62,593 | | 36,566 | | 1,224 | | 35,343 | | 17,817 | | 26,027 | | 13,546 | | 13,546 | | 0 | | 12,481 | | 2,010 | | 10,471 | | 38,614 | | 23,979 |
Source: NBH
| | (1) | Excluding: direct investment, other capital. |
Notes:—
| | (1) | Public sector: Central bank and General government and central government controlled and local government controlled public corporations included in Other MFIs and Other sectors. |
| | (2) | Private sector: non-public corporations included in Other MFIs and Other sectors. |
The following table sets forth the international debt issuance of Hungary for the periods indicated:
| | | For the year ended December 31, | |
| | | 2015 | | | 2016 | | | 2017 | | | 2018 | | | 2019 | |
| | | (EUR millions) | |
| International Debt Issuance | | | 0 | | | | 137 | | | | 1,127 | | | | 1,483 | | | | 0 | |
Source: GDMA Pte Ltd.
Recent Developments in National Debt
On July 27, 2017, Hungary issued a CNY 1,000,000,000 bond under Chinese law maturing in July 2020.
On August 31, 2017, the Government announced that the state would partially assume the mortgage debt of families who have at least three children beginning January 1, 2018. The assumed debt will be a maximum of HUF1 million per family. According to the estimate of MNE, the budgetary effect of the mortgage debt-assumption measure will range between HUF10 billion and HUF20 billion annually.
On October 10, 2017, Hungary issued a EUR 1,000,000,000 bond maturing in October 2027 to finance the repurchase of its certain USD denominated debt as announced in a tender offer on September 26, 2017.
On February 9, 2018, MNE announced that Hungary would pre-pay EUR 78.2 million, the amount the country has hitherto drawn from the credit line provided by Russia for the construction of new nuclear reactor units (Paks II project).
On March 22, 2018, Hungary issued a JPY 30,000,000,000 bond under Japanese law maturing in March 2021.
On April 23, 2020, the Government announced the issuance of euro-denominated bonds in the amount of EUR2 billion. The two-tranche transaction consisted of the issuance of a six-year bond in the amount of EUR1 billion, and the issuance of a 12-year bond in the amount of EUR1 billion. The settlement took place on April 28, 2020.
On September 11, 2020, the Government announced the issuance of Japanese yen denominated bonds in the amount of JPY62.7 billion. The four-tranche transaction consisted of the issuance of a three-year conventional bond in the amount of JPY22.7 billion, a five-year conventional bond in the amount of JPY20.0 billion; and the issuance of a 7-year green bond in the amount of JPY15.5 billion, and a 10-year green bond in the amount of JPY4.5 billion.
Internal Public Debt
Total internal short-term debt with an original maturity of one year or less consist of Interest-bearing T-bills with half and one year maturity, Treasury Savings Bills with one year maturity and Discount T-bills. The outstanding amount of Interest-bearing T-bills, Treasury Savings Bills with one year maturity and Discount T-bills was HUF2,158.0 billion, HUF309.0 billion and HUF657.3 billion, respectively as of December 31, 2019.
As of December 31, 2019, Hungary’s total internal public debt, including the social security and extra-budgetary funds, was HUF24,357.1 billion. As of December 31, 2019, almost all of the Government’s internal debt represented either treasury bills or bonds (with 5.0% of the Government’s internal debt consisting of loans from EIB and CEB).
Within the total HUF-denominated government debt, publicly issued government securities have been playing a predominant role. Raising public funds on the domestic market depends to a large degree upon the issuance of government bonds. Of the total amount of outstanding publicly issued HUF-denominated government securities, government bonds accounted for 57.5% as of the end of December 2019.
Hungary’s policy is to finance budget deficits primarily with internal debt and partly by accessing the international markets. The type of financing is determined based on a benchmark for the debt portfolio composition. The average maturity of internal debt was 4.01 years by the end of 2015, 3.75 years by the end of 2016, 3.61 years by the end of 2017, 3.56 years by the end of 2018, and 4.15 years by the end of 2019.
The Government has also guaranteed certain Hungarian indebtedness. As of December 31, 2019, these guarantees totaled USD 15.0 billion. According to GFS methodology, guarantees are not included in the governmental debt and only affect the central governmental deficit if and when the Government is obligated to make a payment under the guarantee.
Government Obligations to the NBH
The following table shows the Government’s obligations to the NBH, as of December 31 for the years indicated and as of June 30, 2020:
Table 65: Government Obligations to the NBH
| | | As of December 31, | | | As of June | |
| | | 2015 | | | 2016 | | | 2017 | | | 2018 | | | 2019 | | | 30, 2020 | |
| | | (HUF billions) | |
| Total | | | 39.2 | | | | 39.2 | | | | 39.2 | | | | 39.2 | | | | 39.2 | | | | 204.1 | |
Source: NBH
Gross External Debt
The following table sets forth the distribution and maturity of gross external debt of Hungary as of December 31, 2019:
Table 66: Gross External Debt(1)
| | | As of December 31, 2019 | |
| | | Amount of
Debt | | | % Medium
and Long | |
| | | (EUR
millions) | | | (%) | |
| Obligor | | | | | | | | |
| NBH(2) | | | 1,825.4 | | | | 67.0 | |
| Hungary(2) | | | 36,361.7 | | | | 97.3 | |
| Private sector(2)(3) | | | 67,546.9 | | | | 83.4 | |
| Total(2)(3) | | | 105,734.0 | | | | 87.9 | |
| Financial derivative liabilities | | | 2,007.8 | | | | — | |
| Entire economy (including financial derivative liabilities) | | | 107,741.8 | | | | — | |
Source: NBH
Notes:—
| | (1) | In this table, external debt refers to obligations owed to non-resident entities. |
| | (2) | External debt as defined in External Debt Statistics: Guide for Compilers and Users (IMF 2003). Financial derivatives are not included. |
| | (3) | Direct investment debt liabilities included. |
Table 67: Selected Annual BOP and International Investment Position Figures and Debt Service Indicators of Hungary (BOP Basis)
| | | As of December 31, | |
| | | 2015 | | | 2016 | | | 2017 | | | 2018 | | | 2019 | |
| 1. Debt indicators(1) | | | | | | | | | | | | | | | | | | | | |
| Gross debt indicators | | | | | | | | | | | | | | | | | | | | |
| Gross external debt (excl. direct investment debt instruments)/GDP | | | 73.3 | | | | 68.1 | | | | 59.8 | | | | 56.0 | | | | 52.5 | |
| -o/w: General government and Central bank | | | 42.5 | | | | 38.1 | | | | 31.0 | | | | 28.8 | | | | 26.6 | |
| Gross external debt denominated in foreign currencies (excl. direct investment debt instruments)/GDP | | | 54.2 | | | | 50.2 | | | | 43.3 | | | | 38.6 | | | | 35.8 | |
| -o/w: General government and Central bank | | | 27.8 | | | | 24.0 | | | | 18.3 | | | | 15.6 | | | | 13.8 | |
| Gross external debt (incl. direct investment debt instruments)/GDP | | | 106.3 | | | | 96.3 | | | | 84.1 | | | | 80.7 | | | | 73.5 | |
| | | | | | | | | | | | | | | | | | | | | |
| Net debt indicators | | | | | | | | | | | | | | | | | | | | |
| Net external debt (excl. direct investment debt instruments)/GDP | | | 24.3 | | | | 19.0 | | | | 13.7 | | | | 8.9 | | | | 8.1 | |
| | | | | | | | | | | | | | | | | | | | | |
| -o/w: General government and Central bank | | | 12.9 | | | | 16.0 | | | | 12.2 | | | | 9.0 | | | | 7.5 | |
| Net external debt denominated in foreign currencies (excl. direct investment debt instruments)/GDP | | | 9.6 | | | | 4.0 | | | | (0.3 | ) | | | (6.0 | ) | | | (6.1 | ) |
| -o/w: General government and Central bank | | | 0.6 | | | | 2.8 | | | | (0.5 | ) | | | (4.3 | ) | | | (5.2 | ) |
| Net external debt (incl. direct investment debt instruments)/GDP | | | 19.6 | | | | 23.3 | | | | 12.9 | | | | 9.1 | | | | 7.1 | |
| | | | | | | | | | | | | | | | | | | | | |
| 2. Debt service indicators | | | | | | | | | | | | | | | | | | | | |
| Total Debt Service denominated in foreign currencies (TDS) (excl. direct investment debt instruments(2)/GDP | | | 14.1 | | | | 11.4 | | | | 10.4 | | | | 9.8 | | | | 7.9 | |
| Total Debt Service denominated in foreign currencies (TDS) (excl. direct investment debt instruments(2)/XGS | | | 16.0 | | | | 13.1 | | | | 12.0 | | | | 11.5 | | | | 9.4 | |
| Gross interest expenditures (excl. direct investment debt instruments)/GDP | | | 1.5 | | | | 1.3 | | | | 1.1 | | | | 0.9 | | | | 0.8 | |
| Net interest expenditures (excl. direct investment debt instruments)/GDP | | | 1.0 | | | | 0.8 | | | | 0.7 | | | | 0.5 | | | | 0.4 | |
| | | | | | | | | | | | | | | | | | | | | |
| Memorandum: | | | | | | | | | | | | | | | | | | | | |
| GDP (Euro millions)(3) | | | 112,247 | | | | 115,252 | | | | 125,595 | | | | 133,791 | | | | 143,804 | |
| Exports of goods and services (XGS) (Euro millions) | | | 98,762 | | | | 100,466 | | | | 109,102 | | | | 114,021 | | | | 120,005 | |
| Net external financing capacity (CA and Capital account)/GDP | | | 7.0 | | | | 4.5 | | | | 2.8 | | | | 2.5 | | | | 1.6 | |
| International reserves (RES) (Euro millions) | | | 30,322 | | | | 24,384 | | | | 23,368 | | | | 27,403 | | | | 28,385 | |
Source: NBH
Notes:—
| | (1) | External debt as defined in External Debt Statistics: Guide for Compilers and Users; equity and financial derivative instruments are excluded. |
| | (2) | (TDS) Medium-term credit amortization and gross interest expenditures. |
| | (3) | Data of CSO. |
Relations with Multilateral Financial Institutions
Asian Infrastructure Investment Bank (“AIIB”)
Hungary joined the AIIB as its 56th member state in June 2017, becoming for the first time, part of a multilateral development bank exclusively devoted to Asia’s development. As of the end of 2019, AIIB has approved development projects totaling $7.5 billion for a diverse set of countries in the mandated sectors. Beyond its shareholding role, Hungary, through certain competencies, is eager to contribute to success stories in infrastructure and business development in Asia.
European Bank for Reconstruction and Development (“EBRD”)
Since 1991, the EBRD has been involved in a number of state and non-state projects, both in the form of equity participation and loans. The total participation (net business volume) of the EBRD between 1991 and the end of 2018 was around EUR 3.1 billion in 183 projects, 98% of which were in the private sector.
According to the latest country strategy for Hungary, adopted in March 2016, the EBRD focuses on strengthening banking sector resilience and its capacity to lend, further improving Hungary’s energy security, enhancing competitiveness and addressing innovation gaps. Due to the effects of the 2008 financial crisis, the EBRD confirmed its commitment to continue to support Hungary’s financial sector. The EBRD’s engagement and activities in Hungary must also be seen in light of the Memorandum of Understanding (“MoU”) concluded between the Government of Hungary and the EBRD in February 2015. The MoU also confirms the Government’s intention to strengthen its relationship with the banking sector in order to promote a stable and predictable framework to support macroeconomic stability.
Council of Europe Development Bank (“CEB”)
Hungary joined the CEB in 1998. According to the CEB’s social mandate, the focus of the CEB’s projected activity in Hungary is mainly in the field of environmental protection, strengthening social integration and developing human capital. In the past five years (2015-2019), the CEB financed projects by granting loans totaling approximately EUR 282.7 million. In 2018 the Hungarian State and the CEB signed a loan facility in an amount of EUR 92 million.
European Investment Bank (“EIB”)
Since 1990, the EIB has been financing different government and non-government projects in Hungary. The EIB finances primarily infrastructure, environmental protection, health care and education projects. In the five-year period between 2015 and 2019 the EIB financed projects by granting loans totaling approximately EUR 4.3 billion.
In 2015, three new loan facility agreements were signed between the Hungarian State and EIB in an aggregate principal amount of up to HUF36 billion and EUR 1 billion, while HUF230.6 billion was drawn.
In 2016, three new loan facility agreements were signed between the Hungarian State and EIB in an aggregate principal amount of EUR 540 million and HUF15 billion. The Hungarian State drew an amount of EUR 402 million and HUF50 billion in 2016.
In 2017, one new loan facility agreement was signed between the Hungarian State and EIB in a principal amount of EUR 200 million. The Hungarian State drew an amount of EUR 531 million and HUF33 billion in 2017.
In 2018, two new loan facility agreements were signed between the Hungarian State and EIB in an aggregate principal amount of EUR 317 million. The Hungarian State drew an amount of EUR 289.6 million in 2018.
In 2019, two new loan facility agreements were signed between the Hungarian State and EIB in an aggregate principal amount of EUR 500 million. There has been no drawdown since signing these agreements.
International Finance Corporation (“IFC”)
In 2001, the IFC established the Hungary Energy Efficiency Co-financing Program (“HEECP”), whereby the IFC grants guarantees and provides technical assistance to projects aimed at increasing the efficiency of energy consumption in Hungary.
International Investment Bank (“IIB”)
Hungary renewed its membership in the IIB in 2015, after the shareholders and the management of the IIB decided to start a full-fledged modernization of the IIB aimed at setting up a modern development bank in line with international best practices. In December 2018, the Board of Governors of the International Investment Bank decided to relocate the headquarters of the Bank to Budapest, Hungary. The relocation took place in 2019.
Between 2016 and 2019 the IIB financed projects by granting loans and issuing guarantees to Hungarian companies totaling approximately EUR 121 million. The Hungarian Government raised its capital share in the IIB by EUR 10 million in September 2019, and by another EUR 10 million in January 2020. In 2019, the IIB successfully issued HUF denominated bonds worth HUF47.5 billion to institutional investors.
The IMF, the EU and the World Bank
In 2008, Hungary received a financial assistance package of up to USD25.1 billion in the aggregate from the IMF, the EU and the World Bank. The IMF agreed to provide a 17-month standby facility of USD15.7 billion (EUR 12.5 billion), while the EU agreed to lend USD8.1 billion (EUR 6.5 billion), and there was a possibility to draw down USD1.3 billion (EUR 1 billion) from the World Bank to assist Hungary in addressing the consequences of the global financial crisis. Hungary did not draw from the World Bank facility.
In July 2010, the Government suspended the negotiations with the IMF concerning the possible extension of the standby facility. The IMF continues to engage in regular consultations with Hungary to monitor and review economic developments. The last consultation was held in December 2019, with the IMF mission concluding that Hungary achieved further income convergence at an impressive speed and has become less vulnerable to shocks over the last decade.
The following amounts were drawn down under the facilities:
| | · | IMF: SDR6.373 billion by Hungary and SDR1.265 billion by the NBH; and |
| | · | EU: EUR 5.5 billion by Hungary. |
On July 25, 2013, the Government requested to prepay all outstanding debt borrowed from the IMF by August 2013. As of August 3, 2013, the NBH repaid all its outstanding debt borrowed from the IMF and as of August 12, 2013, Hungary repaid all outstanding debt borrowed from the IMF. As of April 6, 2016, Hungary has reimbursed all outstanding debt borrowed from the European Commission.
The IMF reviews the economic situation in Hungary on a regular basis and issues a statement based on the Article IV consultation each year. According to the latest staff report dated December 5, 2019, the IMF concluded that:
| | · | in an increasingly uncertain global economic environment, Hungary’s growth registered one of the highest rates in Europe in 2018; |
| | · | the economy now appears to be running above capacity and wages are growing rapidly amid historically low unemployment; |
| | · | it is likely that growth will slow down over the medium-term; and |
| | · | supply-side reforms can help sustain the momentum. |
TABLES AND SUPPLEMENTARY INFORMATION
Table 68: NBH External Funded Convertible Currency Debt: USD Debt (as of December 31, 2019)
| | | Interest
rate | | | Year | | | Original amount | | | Principal amount
outstanding | |
| | | (%) | | | Issue | | | Maturity(1) | | | contracted | | | (credit)/debit | |
| | | | | | | | | | | | | | | USD | |
| A. NATIONAL BANK OF HUNGARY | | | | | | | | | | | | | | | | | | | | |
| 1. U.S. Dollar Debt | | | | | | | | | | | | | | | | | | | | |
| a. Swap Arrangements | | | | | | | | | | | | | | | | | | | | |
| EUR/USD | | | 5.375 | | | | 2013 | | | | 2023 | | | | — | | | | (570,000,000 | ) |
| EUR/USD | | | 5.375 | | | | 2013 | | | | 2023 | | | | — | | | | (680,000,000 | ) |
| EUR/USD | | | 5.75 | | | | 2013 | | | | 2023 | | | | — | | | | (1,000,000,000 | ) |
| EUR/USD | | | 5.75 | | | | 2015 | | | | 2023 | | | | — | | | | (500,000,000 | ) |
| EUR/USD | | | 6.375 | | | | 2017 | | | | 2020 | | | | | | | | (340,000,000 | ) |
| EUR/USD | | | 5.375 | | | | 2018 | | | | 2024 | | | | | | | | (660,000,000 | ) |
| EUR/USD | | | 6.375 | | | | 2018 | | | | 2021 | | | | | | | | (660,000,000 | ) |
| EUR/USD | | | 7.625 | | | | 2018 | | | | 2041 | | | | | | | | (247,500,000 | ) |
| EUR/USD | | | 7.625 | | | | 2018 | | | | 2041 | | | | | | | | (127,500,000 | ) |
| EUR/USD | | | 7.625 | | | | 2018 | | | | 2041 | | | | | | | | (85,000,000 | ) |
| EUR/USD | | | 7.625 | | | | 2018 | | | | 2041 | | | | | | | | (165,000,000 | ) |
| EUR/USD | | | 6.375 | | | | 2018 | | | | 2021 | | | | | | | | (660,000,000 | ) |
| EUR/USD | | | 6.375 | | | | 2018 | | | | 2021 | | | | | | | | (634,472,000 | ) |
| EUR/USD | | | 6.25 | | | | 2018 | | | | 2020 | | | | | | | | (635,000,000 | ) |
| EUR/USD | | | 6.25 | | | | 2019 | | | | 2020 | | | | | | | | (329,489,000 | ) |
| EUR/USD | | | 6.375 | | | | 2019 | | | | 2020 | | | | | | | | (288,750,000 | ) |
| Total | | | | | | | | | | | | | | | | | | | (7,582,711,000.00 | ) |
| Total U.S. Dollar Debt | | | | | | | | | | | | | | | | | | | (7,582,711,000.00 | ) |
Table 69: NBH External Funded Convertible Currency Debt: EUR Debt (as of December 31, 2019)
| | | Interest
rate | | | Year | | | Original amount | | | Principal amount
outstanding | |
| | | (%) | | | Issue | | | Maturity | | | contracted | | | (credit)/debit | |
| | | | | | | | | | | | | | | EUR | |
| 2. Euro Debt | | | | | | | | | | | | | | | | | | | | |
| a. Swap Arrangements | | | | | | | | | | | | | | | | | | | | |
| EUR/USD | | | 4.80481 | | | | 2013 | | | | 2023 | | | | | | | 423,406,191.39 | |
| EUR/USD | | | Floating | | | | 2013 | | | | 2023 | | | | | | | 505,116,158.15 | |
| EUR/USD | | | Floating | | | | 2013 | | | | 2023 | | | | | | | 740,247,000.00 | |
| EUR/USD | | | 3.73 | | | | 2015 | | | | 2023 | | | | | | | 460,536,617.27 | |
| EUR/USD | | | Floating | | | | 2017 | | | | 2020 | | | | | | | 240,200,000.00 | |
| EUR/USD | | | 4.13375 | | | | 2018 | | | | 2024 | | | | | | | 474,240,000.00 | |
| EUR/USD | | | 6,2825 | | | | 2018 | | | | 2021 | | | | | | | 465,310,000.00 | |
| EUR/USD | | | 7.158 | | | | 2018 | | | | 2041 | | | | | | | 174,480,000.00 | |
| EUR/USD | | | Floating | | | | 2018 | | | | 2041 | | | | | | | 89,910,000.00 | |
| EUR/USD | | | Floating | | | | 2018 | | | | 2041 | | | | | | | 59,480,000.00 | |
| EUR/USD | | | 7.2575 | | | | 2018 | | | | 2041 | | | | | | | 115,460,000.00 | |
| EUR/USD | | | 6.2275 | | | | 2018 | | | | 2021 | | | | | | | 466,400,000.00 | |
| EUR/USD | | | 6.2865 | | | | 2018 | | | | 2021 | | | | | | | 447,312,373.21 | |
| EUR/USD | | | 5.695 | | | | 2018 | | | | 2020 | | | | | | | 451,539,840.91 | |
| EUR/USD | | | 5.6575 | | | | 2019 | | | | 2020 | | | | | | | 234,295,134.87 | |
| EUR/USD | | | Floating | | | | 2019 | | | | 2020 | | | | | | | 203,764,080.88 | |
| Total | | | | | | | | | | | | | | | — | | | 5,551,697,396.68 | |
| Total Euro Debt | | | | | | | | | | | | | | | | | | EUR | 5,551,697,396.68 | |
| U.S. dollar equivalent | | | | | | | | | | | | | | | | | | USD | 6,225,646,412.26 | |
| | | | | | | | | | | | | | | | | | | | | |
| NATIONAL BANK OF HUNGARY | | | | | | | | | | | | | | | | | | | | |
| Total External Funded Convertible Currency Debt | | | | | | | | | | | | | | | | | | USD | (1,357,064,587.74 | ) |
Table 70: Hungary External Funded Convertible Currency Debt: USD Debt (as of December 31, 2019)
| | | Interest rate | | | Year | | | Original amount | | | Principal amount
outstanding | |
| | | (%) | | | Issue | | | Maturity | | | contracted | | | (credit)/debit | |
| B. HUNGARY | | | | | | | | | | | | | | | | | | | | |
| 1. U.S. dollar Debt | | | | | | | | | | | | | | | | | | | | |
| a. Bonds | | | | | | | | | | | | | | | | | | | | |
| USD Bond | | | 6.250 | | | | 2010 | | | | 2020 | | | USD | 2,000,000,000 | | | USD | 964,489,000 | |
| USD Bond | | | 6.375 | | | | 2011 | | | | 2021 | | | USD | 3,000,000,000 | | | USD | 2,583,222,000 | |
| USD Bond | | | 7.625 | | | | 2011 | | | | 2041 | | | USD | 1,250,000,000 | | | USD | 1,250,000,000 | |
| | | Interest rate | | | Year | | | Original amount | | | Principal amount
outstanding | |
| | | (%) | | | Issue | | | Maturity | | | contracted | | | (credit)/debit | |
| USD Bond | | | 5.375 | | | | 2013 | | | | 2023 | | | USD | 2,000,000,000 | | | USD | 1,923,938,000 | |
| USD Bond | | | 5.75 | | | | 2013 | | | | 2023 | | | USD | 2,000,000,000 | | | USD | 2,000,000,000 | |
| USD Bond | | | 5.375 | | | | 2014 | | | | 2024 | | | USD | 2,000,000,000 | | | USD | 2,000,000,000 | |
| Total | | | | | | | | | | | | | | | | | | USD | 10,721,649,000.00 | |
| b. Swap Arrangements | | | | | | | | | | | | | | | | | | | | |
| USD/EUR | | | 7.625 | | | | 2011 | | | | 2041 | | | USD | (247,500,000 | ) | | USD | (247,500,000 | ) |
| USD/EUR | | | 7.625 | | | | 2011 | | | | 2041 | | | USD | (127,500,000 | ) | | USD | (127,500,000 | ) |
| USD/EUR | | | 7.625 | | | | 2011 | | | | 2041 | | | USD | (165,000,000 | ) | | USD | (165,000,000 | ) |
| USD/EUR | | | 7.625 | | | | 2011 | | | | 2041 | | | USD | (85,000,000 | ) | | USD | (85,000,000 | ) |
| USD/EUR | | | 5.375 | | | | 2013 | | | | 2023 | | | USD | (570,000,000 | ) | | USD | (570,000,000 | ) |
| USD/EUR | | | 5.375 | | | | 2013 | | | | 2023 | | | USD | (680,000,000 | ) | | USD | (680,000,000 | ) |
| USD/EUR | | | 5.375 | | | | 2013 | | | | 2023 | | | USD | (750,000,000 | ) | | USD | (649,938,000 | ) |
| USD/EUR | | | 5.75 | | | | 2013 | | | | 2023 | | | USD | (500,000,000 | ) | | USD | (500,000,000 | ) |
| USD/EUR | | | 5.75 | | | | 2013 | | | | 2023 | | | USD | (1,000,000,000 | ) | | USD | (1,000,000,000 | ) |
| USD/EUR | | | 5.375 | | | | 2014 | | | | 2024 | | | USD | (660,000,000 | ) | | USD | (660,000,000 | ) |
| USD/EUR | | | 5.375 | | | | 2014 | | | | 2024 | | | USD | (680,000,000 | ) | | USD | (680,000,000 | ) |
| USD/EUR | | | 5.75 | | | | 2015 | | | | 2023 | | | USD | (500,000,000 | ) | | USD | (500,000,000 | ) |
| USD/EUR | | | 6.375 | | | | 2017 | | | | 2020 | | | USD | (340,000,000 | ) | | USD | (340,000,000 | ) |
| USD/EUR | | | 6.375 | | | | 2017 | | | | 2021 | | | USD | (340,000,000 | ) | | USD | (288,750,000 | ) |
| USD/EUR | | | 6.25 | | | | 2018 | | | | 2020 | | | USD | (590,000,000 | ) | | USD | (329,489,000 | ) |
| USD/EUR | | | 6.25 | | | | 2018 | | | | 2020 | | | USD | (635,000,000 | ) | | USD | (635,000,000 | ) |
| USD/EUR | | | 6.375 | | | | 2018 | | | | 2021 | | | USD | (660,000,000 | ) | | USD | (660,000,000 | ) |
| USD/EUR | | | 6.375 | | | | 2018 | | | | 2021 | | | USD | (660,000,000 | ) | | USD | (660,000,000 | ) |
| USD/EUR | | | 6.375 | | | | 2018 | | | | 2021 | | | USD | (634,472,000 | ) | | USD | (634,472,000 | ) |
| USD/EUR | | | 5.375 | | | | 2018 | | | | 2024 | | | USD | (660,000,000 | ) | | USD | (660,000,000 | ) |
| USD/EUR | | | 7.625 | | | | 2018 | | | | 2041 | | | USD | (247,500,000 | ) | | USD | (247,500,000 | ) |
| USD/EUR | | | 7.625 | | | | 2018 | | | | 2041 | | | USD | (127,500,000 | ) | | USD | (127,500,000 | ) |
| USD/EUR | | | 7.625 | | | | 2018 | | | | 2041 | | | USD | (165,000,000 | ) | | USD | (165,000,000 | ) |
| USD/EUR | | | 7.625 | | | | 2018 | | | | 2041 | | | USD | (85,000,000 | ) | | USD | (85,000,000 | ) |
| Total | | | | | | | | | | | | | | | | | | USD | (10,697,649,000 | ) |
| Total U.S. Dollar Debt | | | | | | | | | | | | | | | | | | USD | 24,000,000.00 | |
Table 71: Hungary External Funded Convertible Currency Debt: EUR Debt (EIB & Bonds) (as of December 31, 2019)
| | | Interest
rate | | | Year | | | Original amount | | | Principal amount
outstanding | |
| | | (%) | | | Issue | | | Maturity | | | contracted | | | (credit)/debit | |
| 2. Euro Debt | | | | | | | | | | | | | | | | | | | | |
| a. EIB | | | | | | | | | | | | | | | | | | | | |
| Health Sector Development | | | 3.965 | | | | 2011 | | | | 2027 | | | EUR | 45,000,000 | | | EUR | 15,000,000 | |
| Health Sector Development B | | | 3.426 | | | | 2012 | | | | 2028 | | | EUR | 55,000,000 | | | EUR | 55,000,000 | |
| Bp Universities | | | Floating | | | | 2011 | | | | 2021 | | | EUR | 85,000,000 | | | EUR | 85,000,000 | |
| Forests | | | 3.804 | | | | 2011 | | | | 2027 | | | EUR | 200,000,000 | | | EUR | 70,000,000 | |
| Economic Competitiveness | | | MT | | | | 2011-2014 | | | | 2024-2028 | | | EUR | 440,000,000 | | | EUR | 245,297,228.79 | |
| Cohesion Fund - II | | | MT | | | | 2011-2012 | | | | 2027-2028 | | | EUR | 300,000,000 | | | EUR | 300,000,000 | |
| Education B | | | 3.924 | | | | 2011 | | | | 2027 | | | EUR | 150,000,000 | | | EUR | 50,000,000 | |
| Rural Development | | | MT | | | | 2011-20123 | | | | 2021-2023 | | | EUR | 300,000,000 | | | EUR | 300,000,000 | |
| Red Sludge | | | 3.562 | | | | 2012 | | | | 2027 | | | EUR | 63,000,000 | | | EUR | 30,000,000 | |
| Regional Operation Program | | | MT | | | | 2012-2013 | | | | 2023-2028 | | | EUR | 300,000,000 | | | EUR | 286,429,706.31 | |
| Human Capital | | | 3.302 | | | | 2013 | | | | 2029 | | | EUR | 400,000,000 | | | EUR | 120,000,000 | |
| Cohesion Fund – IIB | | | MT | | | | 2013 | | | | 2029 | | | EUR | 470,000,000 | | | EUR | 140,000,000 | |
| M3 North-East | | | 3.354 | | | | 2013 | | | | 2030 | | | EUR | 72,000,000 | | | EUR | 72,000,000 | |
| State Reform E-Admin. | | | 2.207 | | | | 2014 | | | | 2022 | | | EUR | 50,000,000 | | | EUR | 15,000,000 | |
| Total | | | | | | | | | | | | | | | | | | EUR | 1,783,726,935.10 | |
| b. Bonds | | | | | | | | | | | | | | | | | | | | |
| EUR Bond | | | 3.875 | | | | 2005 | | | | 2020 | | | EUR | 1,000,000,000 | | | EUR | 797,728,000 | |
| EUR Bond | | | 1.75 | | | | 2017 | | | | 2027 | | | EUR | 1,000,000,000 | | | EUR | 1,000,000,000 | |
| EUR Bond | | | 1.25 | | | | 2018 | | | | 2025 | | | EUR | 1,000,000,000 | | | EUR | 1,000,000,000 | |
| Total | | | | | | | | | | | | | | | | | | EUR | 2,797,728,000 | |
Table 72: Hungary External Funded Convertible Currency Debt: EUR Debt (Other Loans & Swap Agreements) (as of December 31, 2019)
| | | Interest
rate | | | Year | | | Original amount | | | Principal amount
outstanding | |
| | | (%) | | | Issue | | | Maturity | | | contracted | | | (credit)/debit | |
| c. Other loans raised | | | | | | | | | | | | | | | | | | | | |
| Council of Europe Development | | | Various | | | | 2010-11 | | | | 2020-21 | | | EUR | 409,000,000 | | | EUR | 189,982,556 | |
| State Development Corporation “VEB.RF” | | | 3.95 | | | | 2019 | | | | 2046 | | | EUR | 199,700,000 | | | EUR | 135,940,800 | |
| Total | | | | | | | | | | | | | | | | | | EUR | 325,923,356 | |
| d. Other loans assumed | | | | | | | | | | | | | | | | | | | | |
| EIB | | | Various | | | | 2002-2014 | | | | 2019-2038 | | | EUR | 515,575,457.54 | | | EUR | 387,743,756.59 | |
| Total | | | | | | | | | | | | | | | | | | EUR | 387,743,756.59 | |
| e. Swap Arrangements | | | | | | | | | | | | | | | | | | | | |
| | | Interest
rate | | | Year | | | Original amount | | Principal amount
outstanding |
| | | (%) | | | Issue | | | Maturity | | | contracted | | (credit)/debit |
| EUR/USD | | | 7.158 | | | | 2011 | | | | 2041 | | | EUR | 174,480,000 | | | EUR | 174,480,000 | |
| EUR/USD | | | Floating | | | | 2011 | | | | 2041 | | | EUR | 89,910,000 | | | EUR | 89,910,000 | |
| EUR/USD | | | 7.2575 | | | | 2011 | | | | 2041 | | | EUR | 115,460,000 | | | EUR | 115,460,000 | |
| EUR/USD | | | Floating | | | | 2011 | | | | 2041 | | | EUR | 59,480,000 | | | EUR | 59,480,000 | |
| EUR/USD | | | 4.804815 | | | | 2013 | | | | 2023 | | | EUR | 423,406,191.39 | | | EUR | 423,406,191.39 | |
| EUR/USD | | | Floating | | | | 2013 | | | | 2023 | | | EUR | 505,116,158.15 | | | EUR | 505,116,158.15 | |
| EUR/USD | | | Floating | | | | 2013 | | | | 2023 | | | EUR | 740,247,000 | | | EUR | 740,247,000 | |
| EUR/USD | | | 4.8575 | | | | 2013 | | | | 2023 | | | EUR | 556,256,000 | | | EUR | 482,042,549.50 | |
| EUR/USD | | | 4.675 | | | | 2013 | | | | 2023 | | | EUR | 369,877,000 | | | EUR | 369,877,000 | |
| EUR/USD | | | 4.1325 | | | | 2014 | | | | 2024 | | | EUR | 474,240,000 | | | EUR | 474,240,000 | |
| EUR/USD | | | 4.156 | | | | 2014 | | | | 2024 | | | EUR | 488,822,000 | | | EUR | 488,822,000 | |
| EUR/USD | | | 3.73 | | | | 2015 | | | | 2023 | | | EUR | 460,536,617.27 | | | EUR | 460,536,617.27 | |
| EUR/USD | | | Floating | | | | 2017 | | | | 2020 | | | EUR | 239,930,000 | | | EUR | 203,764,080.88 | |
| EUR/USD | | | Floating | | | | 2017 | | | | 2021 | | | EUR | 240,200,000 | | | EUR | 240,200,000 | |
| EUR/USD | | | 5.695 | | | | 2018 | | | | 2020 | | | EUR | 451,539,840.91 | | | EUR | 451,539,840.91 | |
| EUR/USD | | | 5.6575 | | | | 2018 | | | | 2020 | | | EUR | 419,540,954.55 | | | EUR | 234,295,134.87 | |
| EUR/USD | | | 4.13375 | | | | 2018 | | | | 2024 | | | EUR | 474,240,000 | | | EUR | 474,240,000 | |
| EUR/USD | | | 7.158 | | | | 2018 | | | | 2041 | | | EUR | 174,480,000 | | | EUR | 174,480,000 | |
| EUR/USD | | | Floating | | | | 2018 | | | | 2041 | | | EUR | 89,910,000 | | | EUR | 89,910,000 | |
| EUR/USD | | | 7.2575 | | | | 2018 | | | | 2041 | | | EUR | 115,460,000 | | | EUR | 115,460,000 | |
| EUR/USD | | | Floating | | | | 2018 | | | | 2041 | | | EUR | 59,480,000 | | | EUR | 59,480,000 | |
| EUR/USD | | | 6.2275 | | | | 2018 | | | | 2021 | | | EUR | 466,400,000 | | | EUR | 466,400,000 | |
| EUR/USD | | | 6.2865 | | | | 2018 | | | | 2021 | | | EUR | 447,312,373.21 | | | EUR | 447,312,373.21 | |
| EUR/USD | | | 6.2825 | | | | 2018 | | | | 2021 | | | EUR | 465,310,000 | | | EUR | 465,310,000 | |
| EUR/CNH | | | 0.68 | | | | 2017 | | | | 2020 | | | EUR | 127,370,000 | | | EUR | 127,370,000 | |
| EUR/CNH | | | 0.909 | | | | 2018 | | | | 2021 | | | EUR | 255,050,000 | | | EUR | 255,050,000 | |
| EUR/JPY | | | 0.572 | | | | 2018 | | | | 2021 | | | EUR | 227,669,000 | | | EUR | 227,669,000 | |
| EUR/EUR | | | 3.875 | | | | 2005 | | | | 2020 | | | EUR | (200,000,000 | ) | | EUR | (200,000,000 | ) |
| EUR/EUR | | | Floating | | | | 2005 | | | | 2020 | | | EUR | 200,000,000 | | | EUR | 200,000,000 | |
| EUR/EUR | | | 4.691 | | | | 2013 | | | | 2023 | | | EUR | 236,879,040 | | | EUR | 236,879,040 | |
| EUR/EUR | | | Floating | | | | 2013 | | | | 2023 | | | EUR | (236,879,040 | ) | | EUR | (236,879,040 | ) |
| EUR/EUR | | | 3.875 | | | | 2017 | | | | 2020 | | | EUR | 170,000,000 | | | EUR | 170,000,000 | |
| EUR/EUR | | | Floating | | | | 2017 | | | | 2020 | | | EUR | (170,000,000 | ) | | EUR | (170,000,000 | ) |
| EUR/EUR | | | 1.75 | | | | 2017 | | | | 2027 | | | EUR | 340,000,000 | | | EUR | 340,000,000 | |
| EUR/EUR | | | Floating | | | | 2017 | | | | 2027 | | | EUR | (340,000,000 | ) | | EUR | (340,000,000 | ) |
| EUR/EUR | | | 5.6575 | | | | 2018 | | | | 2020 | | | EUR | 300,000,000 | | | EUR | 300,000,000 | |
| EUR/EUR | | | Floating | | | | 2018 | | | | 2020 | | | EUR | (300,000,000 | | | EUR | (300,000,000 | ) |
| EUR/EUR | | | 6.2275 | | | | 2018 | | | | 2021 | | | EUR | 300,000,000 | | | EUR | 300,000,000 | |
| EUR/EUR | | | Floating | | | | 2018 | | | | 2021 | | | EUR | (300,000,000 | | | EUR | (300,000,000 | ) |
| EUR/EUR | | | 1.25 | | | | 2018 | | | | 2025 | | | EUR | 350,000,000 | | | EUR | 350,000,000 | |
| EUR/EUR | | | Floating | | | | 2018 | | | | 2025 | | | EUR | (350,000,000 | | | EUR | (350,000,000 | ) |
| Total | | | | | | | | | | | | | | | | | | EUR | 8,416,097,946.18 | |
| Total Euro Debt | | | | | | | | | | | | | | | | | | EUR | 13,711,219,993.87 | |
| U.S. dollar equivalent | | | | | | | | | | | | | | | | | | USD | 15,375,695,298.82 | |
Table 73: Hungary External Funded Convertible Currency Debt: JPY Debt & Swap Arrangements (as of December 31, 2019)
| | | Interest
rate | | | Year | | | Original amount | | Principal amount
outstanding |
| | | (%) | | | Issue | | | Maturity | | | contracted | | (credit)/debit |
| 5. Japanese Yen | | | | | | | | | | | | | | | | | | | | |
| a. Bonds | | | | | | | | | | | | | | | | | | | | |
| JPY | | | 0.37 | | | | 2018 | | | | 2021 | | | JPY | 30,000,000,000 | | | JPY | 30,000,000,000 | |
| Total | | | | | | | | | | | | | | | | | | JPY | 30,000,000,000 | |
| b. Swap Arrangements | | | | | | | | | | | | | | | | | | | | |
| JPY/EUR | | | 0.37 | | | | 2018 | | | | 2021 | | | JPY | (30,000,000,000 | ) | | JPY | (30,000,000,000 | ) |
| Total | | | | | | | | | | | | | | | | | | JPY | (30,000,000,000 | ) |
| Total Japanese Yen Debt | | | | | | | | | | | | | | | | | | JPY | 0.00 | |
| U.S. dollar equivalent | | | | | | | | | | | | | | | | | | USD | 0.00 | |
Table 74: Hungary External Funded Convertible Currency Debt: CNY Debt & Swap Arrangements (as of December 31, 2019)
| | | Interest
rate | | | Year | | | Original amount | | Principal amount
outstanding |
| | | (%) | | | Issue | | | Maturity | | | contracted | | (credit)/debit |
| 6. Chinese Renminbi Debt | | | | | | | | | | | | | | | | | | | | |
| a. Bonds | | | | | | | | | | | | | | | | | | | | |
| CNY | | | 4.80 | | | | 2017 | | | | 2020 | | | CNY | 1,000,000,000 | | | CNY | 1,000,000,000 | |
| CNY | | | 4.30 | | | | 2018 | | | | 2021 | | | CNY | 2,000,000,000 | | | CNY | 2,000,000,000 | |
| Total | | | | | | | | | | | | | | | | | | CNY | 3,000,000,000 | |
| b. Swap Arrangements | | | | | | | | | | | | | | | | | | | | |
| CNY/EUR | | | 4.85 | | | | 2017 | | | | 2020 | | | CNY | (1,000,000,000 | ) | | CNY | (1,000,000,000 | ) |
| CNY/EUR | | | 4.30 | | | | 2018 | | | | 2021 | | | CNY | (2,000,000,000 | ) | | CNY | (2,000,000,000 | ) |
| Total | | | | | | | | | | | | | | | | | | CNY | (3,000,000,000 | ) |
| Total Chinese Renminbi Debt | | | | | | | | | | | | | | | | | | CNY | 0.00 | |
| U.S. dollar equivalent | | | | | | | | | | | | | | | | | | USD | 0.00 | |
| HUNGARY | | | | | | | | | | | | | | | | | | | 15,399,695,298.82 | |
| TOTAL EXTERNAL CONVERTIBLE CURRENCY FUNDED DEBT OF THE BANK AND OF HUNGARY | | | | | | | | | | | | | | | | | | USD | 14,042,630,711.08 | |
Internally Raised Debt of Hungary
Table 75: Hungary Internal Debt (as of December 31, 2019)
| | | Interest
Rate | | | Year | | | Original amount | | Principal amount
outstanding |
| | | (%) | | | Issue | | | Maturity | | | contracted | | (credit)/debit |
| | | | | | | | | | | | (millions) | | (millions) |
| 1. HUF Debt | | | | | | | | | | | | | | | | | | | | |
| a. Loans | | | | | | | | | | | | | | | | | | | | |
| (i) from EIB | | | Fixed, Floating | | | | 2012-2019 | | | | 2020-2033 | | | EUR | 3,468.9 | | | HUF | 1,174,827.21 | |
| (ii) from CEB | | | Fixed, Floating | | | | 2009-2019 | | | | 2020-2025 | | | EUR | 100.7 | | | HUF | 33,294.36 | |
| Total Loans | | | | | | | | | | | | | | | | | | HUF | 1,208,121.56 | |
| | | | | | | | | | | | | | | | | | | USD | 4,098.94 | |
| | | | | | | | | | | | | | | | | | | | | |
| b. Hungarian Government Bonds for the purpose of: | | | | | | | | | | | | | | | | | | | | |
| (i) 1998-19 Central Budget | | | Fixed, Floating | | | | 1998-19 | | | | 2020-38 | | | | | | | HUF | 19,839,285.88 | |
| (ii) Securitization of non-interest bearing debt outstanding to the Bank | | | Floating | | | | 1994-96 | | | | 2026 | | | HUF | 417,110.0 | | | HUF | 39,177.72 | |
| Total Hungarian Government Bonds | | | | | | | | | | | | | | | | | | HUF | 19,878,463.60 | |
| | | | | | | | | | | | | | | | | | | USD | 67,444.06 | |
| | | Interest
Rate | | | Year | | | Original amount | | | Principal amount
outstanding |
| | | (%) | | | Issue | | | Maturity | | | contracted | | | (credit)/debit |
| | | | | | | | | | | | (millions) | | | (millions) |
| c. Hungarian Treasury Bills: | | | | | | | | | | | | | | | | | | | | |
| (i) Fixed interest rate | | | 2.25-3.0 | | | | 2018-19 | | | | 2020-21 | | | | | | | HUF | 2,613,220.06 | |
| (ii) Discount | | | — | | | | 2019 | | | | 2020 | | | | | | | HUF | 657,288.32 | |
| Total Hungarian Treasury Bills | | | | | | | | | | | | | | | | | | HUF | 3,270,508.38 | |
| | | | | | | | | | | | | | | | | | | USD | 11,096.25 | |
| | | | | | | | | | | | | | | | | | | | | |
| 2. EUR Debt | | | | | | | | | | | | | | | | | | | | |
| a. Hungarian Treasury Bonds for the purpose of: | | | | | | | | | | | | | | | | | | | | |
| (i) 2017-19 Central Budget (P€MAK) | | | Floating | | | | 2017-19 | | | | 2020-22 | | | | | | | EUR | 464.07 | |
| (ii) Residence Program in Hungary | | | — | | | | 2015-17 | | | | 2020-22 | | | | | | | EUR | 1,297.65 | |
| Total Bonds | | | | | | | | | | | | | | | | | | EUR | 1,761.72 | |
| Total EUR Debt | | | | | | | | | | | | | | | | | | EUR | 1,761.72 | |
| U.S. dollar equivalent(1) | | | | | | | | | | | | | | | | | | USD | 1,975.59 | |
| | | | | | | | | | | | | | | | | | | | | |
| HUNGARY’S TOTAL INTERNAL DEBT | | | | | | | | | | | | | | | | | | USD | 84,614.84 | |
Source: GDMA Pte Ltd.
Note:—
| (1) | All totals calculated on the basis of exchange rates as on December 31, 2019. The HUF/USD and the HUF/EUR exchange rates were 294.74 and 330.52 respectively on December 31, 2019. |
Guarantees Provided by Hungary
Table 76: Guarantees Provided by Hungary (as of December 31, 2019)
| Title | | Principal Amount
Outstanding |
| | | (millions) |
| Hungary Guaranteed Debt in Foreign Currency | | | | |
| (expressed in USD equivalents)(1) | | | | |
| Loans raised from international financial institutions | | USD | 0.00 | |
| Guarantees for various purposes | | USD | 15.05 | |
| Guarantees based on law | | USD | 7,100.10 | |
| Total Guarantees in Foreign Currency | | USD | 7,115.15 | |
| Title | | Principal Amount
Outstanding |
| | | (millions) |
| Hungary Guaranteed Debt in HUF | | | | |
| Guarantees for various purposes | | HUF | 81,494.42 | |
| Guarantees based on law | | HUF | 2,247,791.38 | |
| Total Guarantees in HUF | | HUF | 2,239,285.80 | |
| USD Equivalent(1) | | USD | 7,902.85 | |
| TOTAL HUNGARY FOREIGN CURRENCY AND HUF GUARANTEES | | USD | 15,018.00 | |
Source: Hungarian State Treasury
Note: The data are not audited.
| (1) | Calculated on the basis of exchange rates of the Hungarian National Bank as of December 31, 2019. The exchange rate was 294.74HUF/USD on December 31, 2019. |