EXHIBIT 99.D
DESCRIPTION OF HUNGARY
DATED October 10, 2012
TABLE OF CONTENTS
| | | | |
FOREIGN EXCHANGE | | | 3 | |
| |
PRESENTATION OF INFORMATION | | | 4 | |
| |
OVERVIEW OF HUNGARY | | | 5 | |
General | | | 5 | |
Political System | | | 6 | |
International Relations | | | 15 | |
| |
THE ECONOMY | | | 18 | |
Background | | | 18 | |
Recent Economic Performance | | | 19 | |
Principal Sectors of the Economy | | | 26 | |
| |
PRIVATISATION | | | 32 | |
Status of Privatisation Efforts | | | 32 | |
Methods of Privatisation Used | | | 32 | |
| |
BALANCE OF PAYMENTS AND FOREIGN TRADE | | | 34 | |
Balance of Payments | | | 34 | |
Methodological Changes in Calculation of Balance of Payments Statistics | | | 36 | |
Foreign Trade | | | 38 | |
Foreign Direct Investment | | | 40 | |
Foreign Exchange Reserves | | | 48 | |
| |
MONETARY AND FINANCIAL SYSTEM | | | 49 | |
National Bank of Hungary | | | 49 | |
Monetary Policy | | | 50 | |
Exchange Rate Policy | | | 57 | |
The Hungarian Banking System | | | 58 | |
Capital Markets | | | 61 | |
| |
PUBLIC FINANCE | | | 63 | |
General Information | | | 63 | |
Methodology | | | 63 | |
Budget Trends | | | 63 | |
Central Government Budget | | | 82 | |
Taxation | | | 86 | |
Social Security and Extra-Budgetary Funds | | | 89 | |
Social Security and Extra-Budgetary Funds, Revenues and Expenditures | | | 89 | |
Health Care System | | | 90 | |
1
| | | | |
Pension System | | | 91 | |
Local Government Finance | | | 92 | |
EU Net Position | | | 93 | |
Medium-Term Fiscal Programme and the Convergence Programme | | | 94 | |
Future Economic Plan | | | 94 | |
| |
NATIONAL DEBT | | | 96 | |
General Information | | | 96 | |
Public Debt | | | 96 | |
Gross External Debt | | | 101 | |
Relations with Multilateral Financial Institutions | | | 102 | |
| |
TABLES AND SUPPLEMENTARY INFORMATION | | | 105 | |
External Funded Convertible Currency Debt of the NBH and Hungary | | | 105 | |
Internal Debt of Hungary | | | 115 | |
Guarantees Provided by Hungary | | | 116 | |
2
This document is an exhibit to Hungary’s Annual Report on Form 18-K for the fiscal year ended December 31, 2011.
FOREIGN EXCHANGE
Except as otherwise specified, all amounts in this report are expressed in Hungarian forints (“forint” or “HUF”), in euro (“Euro” or “EUR”), and in U.S. dollars (“USD”). All currency conversions in this report are at the Hungarian National Bank’s (the “NBH”) official middle rate of exchange on a particular date or calculated at the average of the middle rates of exchange for a particular period. For your convenience, we have converted certain amounts from forint into USD and/or Euro at the average exchange rate for each relevant period or the exchange rate in effect on a given date.
The following table sets forth the forint/Euro exchange rates for the last day of the periods indicated and the average exchange rates during the periods indicated:
| | | | | | | | | | | | | | | | | | | | |
| | | 2007 | | | 2008 | | | 2009 | | | 2010 | | | 2011 | |
| | | (HUF per EUR) | |
Year end | | | 253.35 | | | | 264.78 | | | | 270.84 | | | | 278.75 | | | | 311.13 | |
Average for year | | | 251.31 | | | | 251.25 | | | | 280.58 | | | | 275.41 | | | | 279.21 | |
Source: NBH
The following table sets forth the forint/USD exchange rates for the last day of the periods indicated and the average exchange rates during the periods indicated:
| | | | | | | | | | | | | | | | | | | | |
| | | 2007 | | | 2008 | | | 2009 | | | 2010 | | | 2011 | |
| | | (HUF per USD) | |
Year end | | | 172.61 | | | | 187.91 | | | | 188.07 | | | | 208.65 | | | | 240.68 | |
Average for year | | | 183.83 | | | | 171.80 | | | | 202.26 | | | | 208.15 | | | | 200.94 | |
Source: NBH
On October 1, 2012, the official middle exchange rates were HUF 220.87 = USD 1.00, HUF 284.86 = EUR 1.00, and EUR 0.78 = USD 1.00. For information on the convertibility of the forint, see “Monetary and Financial System – Exchange Rate Policy – Foreign Exchange and Convertibility of the Forint.”
Totals in certain tables in this report may differ from the sum of the individual items in such tables due to rounding. In addition, certain figures contained in this report are estimates prepared in accordance with procedures customarily used in Hungary for the reporting of data. Certain other figures are preliminary in nature. In each case, the actual figures may vary from the estimated or preliminary figures set forth in this report.
3
PRESENTATION OF INFORMATION
Unless otherwise indicated, all data in this report are presented for comparison purposes in accordance with the methodology of the International Monetary Fund (the “IMF”) (as set forth in the Manual on Governance Finance Statistics, IMF 1986) (“GFS”). In order to comply with its European Union (“EU”) accession obligations, Hungary produces certain data on the basis of the European System of Accounts 95 (“ESA”). ESA methodology monitors revenues and expenditures on an accrual basis, whereas GFS methodology monitors revenues and expenditures on a cash basis. Under ESA, certain issued state guarantees are reclassified as government debt and increase the deficit. The definition of the general government sector is extended to include certain quasi-governmental institutions.
In June 2008, there was a methodological change in the calculation of the balance of payment statistics related to compensation of employees in order to bring the methodology in line with international standards. The procedure of monitoring employee income payments was replaced by estimates made on the basis of the Hungarian Central Statistical Office (“CSO”) administrative resources for the purposes of balance of payments statistics. This covers the gross earnings of employees in its entirety. Taxes and contributions paid and received in connection with wages are also shown under current transfers.
On September 30, 2008, the NBH modified the calculation methodology of the balance of payments. According to the NBH, the revision of goods data is the most significant of the areas affected by the revision. In the past, trade accredit assets in the balance of payments were determined basically by the difference between cash-based trade data reported to the NBH and accruals-based statistical data as measured by the CSO. After the change in methodology, the NBH recorded a large part of calculated turnover in trade credit as statistical error (under errors and omissions) and started to examine the causes of deviations together with the CSO. During the examination, enterprises not registered in the territory of Hungary, only obliged to declare VAT but playing an increasingly greater role in the country’s foreign trade, became the centre of attention. Such enterprises provide data for Hungary’s foreign trade statistics, in accordance with the practice of the EU. While the data must be treated as part of Hungarian foreign trade, consistent with international standards on foreign trade statistics, there are no clearly defined recommendations for their treatment in the national accounts and the balance of payments. In the view of domestic experts, in terms of the national accounts and the balance of payments, such enterprises do not constitute part of the Hungarian economy and, therefore, they should be recorded differently from the standards on foreign trade statistics. This means that trade margins on foreign trade transactions should be ignored when assessing the performance of the Hungarian economy. The NBH have revised the values of goods exports and imports recorded in the balance of payments in a way that the balance of goods has been adjusted by the amounts above. The revision has not affected the CSO’s official foreign trade statistics. As a result of this methodological change, the NBH revised the balance of payments data for the years 2006 and 2007. All balance of payments data in this report have been calculated based on the revised methodology.
4
OVERVIEW OF HUNGARY
General
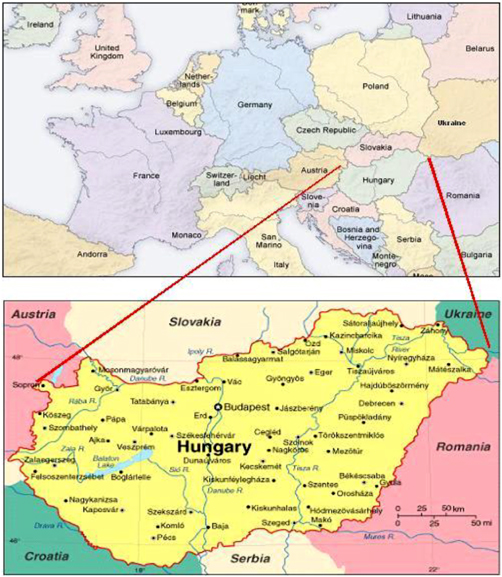
Hungary (until December 31, 2011, the country was known as “The Republic of Hungary”, hereinafter referred to as “Hungary”) lies in Central Europe and covers an area of approximately 93,000 square kilometres (“km”). Hungary is bordered by seven countries: Slovakia and Ukraine to the north, Romania to the east, Serbia and Croatia to the south, and Slovenia and Austria to the west. The Danube River crosses Hungary, connecting the country with ports on the Black Sea. Hungary has historically been a nexus of social and cultural life and a trade link between Eastern and Western Europe. Hungary’s capital is Budapest.
Currently, the population of Hungary is approximately 10.0 million. Approximately 69.6% of the population lives in urban areas and approximately 1.7 million live in Budapest, which is the political, administrative, cultural and commercial centre of Hungary. While approximately 97% of the population is Magyar, there are minorities of Croat, German, Roma, Romanian, Serb and Slovak ethnicity.
5
The following table sets forth certain information with respect to the population growth rate in Hungary for the periods indicated:
The Population of Hungary
| | | | | | | | | | | | | | | | | | | | | | | | |
| | | As of January 1, | |
| | | 2007 | | | 2008 | | | 2009 | | | 2010 | | | 2011 | | | 2012* | |
Population (in thousand persons) | | | 10,066 | | | | 10,045 | | | | 10,031 | | | | 10,014 | | | | 9,986 | | | | 9,958 | |
Increase (decrease) in population (%) | | | (0.1 | ) | | | (0.2 | ) | | | (0.1 | ) | | | (0.2 | ) | | | (0.3 | ) | | | (0.3 | ) |
Source: CSO
The following table sets forth the age distribution for the population of Hungary for the periods indicated:
The Age Distribution of the Population of Hungary
| | | | | | | | | | | | | | | | | | | | |
Age (in years) | | As of January 1, | |
| | | 2008 | | | 2009 | | | 2010 | | | 2011 | | | 2012* | |
| | | (Number of persons, in thousands) | |
0-9 | | | 966 | | | | 968 | | | | 972 | | | | 964 | | | | 957 | |
10-19 | | | 1,188 | | | | 1,135 | | | | 1,109 | | | | 1,082 | | | | 1,054 | |
20-29 | | | 1,451 | | | | 1,376 | | | | 1,350 | | | | 1,328 | | | | 1,313 | |
30-39 | | | 1,540 | | | | 1,592 | | | | 1,605 | | | | 1,611 | | | | 1,618 | |
40-49 | | | 1,264 | | | | 1,267 | | | | 1,278 | | | | 1,292 | | | | 1,309 | |
50-59 | | | 1,488 | | | | 1,470 | | | | 1,447 | | | | 1,421 | | | | 1,393 | |
60-69 | | | 1,053 | | | | 1,089 | | | | 1,110 | | | | 1,130 | | | | 1,149 | |
70-79 | | | 755 | | | | 750 | | | | 749 | | | | 752 | | | | 755 | |
80-89 | | | 324 | | | | 348 | | | | 354 | | | | 360 | | | | 362 | |
90 + | | | 40 | | | | 36 | | | | 40 | | | | 46 | | | | 52 | |
Source: CSO
Political System
Transformation and New Constitution
Immediately after World War II, Hungary was governed by a “grand coalition” of Hungarian political parties. By 1948, however, all non-communist parties had been abolished with the support of the Soviet Union. The Hungarian Socialist Workers’ Party dominated all facets of government until 1990.
During the late 1980s, the political system in Hungary changed dramatically. On October 23, 1989, Hungary was proclaimed a republic and, to signify the country’s change in status to a free democratic state, Hungary’s name was changed from the “Hungarian People’s Republic” to the “Republic of Hungary.” Also in 1989, the constitution was substantially amended to its current form. Under this new constitution, Hungary instituted a multi-party democratic government, making it one of the first formerly communist countries in Central and Eastern Europe to undertake democratic reforms. Non-communist political parties were established in 1989, and, in 1990, the first multi-party elections in the country since 1947 took place.
6
On April 18, 2011, the Parliament adopted the new constitution for Hungary. See “Recent Political Developments” below.
President
The President of Hungary is the head of the state, elected by Parliament for a term of five years. The President may, but need not, be elected from the members of Parliament (but cannot be both President and a member of Parliament at the same time). The President may only be re-elected once. The President’s authority is limited. Most of the actions taken by the President require the countersignature of the Prime Minister or the appropriate minister. The main powers of the President include:
| | • | representing the nation as head of state; |
| | • | concluding international treaties and agreements on behalf of Hungary (agreements that are legislative in character require the prior consent of Parliament); |
| | • | safeguarding the democratic operation of the political process; |
| | • | acting as commander-in-chief of the armed forces; |
| | • | setting the date for Parliamentary and local elections; |
| | • | initiating certain measures in Parliament; |
| | • | appointing and removing, among others, the President and Vice-Presidents of the NBH; and |
The most recent presidential election was held in May 2012. See “Recent Political Developments.”
Government
The government of Hungary (the “Government”) consists of the Prime Minister and other ministers forming the Cabinet (currently 9 ministers). The Government is charged with the executive function of Hungary and with proposing legislation to Parliament. The Prime Minister and the Government’s programme are approved by a simple majority vote of Parliament. The Prime Minister is nominated by the President of Hungary and elected by Parliament to serve for four years. If the Prime Minister loses his/her office for any reason, such as resignation, death or removal through a no-confidence vote, and, therefore, the Government loses its mandate, a new Prime Minister will be elected by the Parliament with a mandate that expires after the next general election. The other ministers are nominated by the Prime Minister and appointed and removed by the President. There are two substitute prime ministers, nominated by the Prime Minister, who shall replace the Prime Minister if he/she loses his/her office by reason of death, loss of his/her voting right or conflict of interest.
On May 29, 2010, Mr. Viktor Orbán submitted the government programme. On the same day, the Government was formally inaugurated. In the new governmental structure, the Minister for National Economy is responsible for public finances; previously such responsibility belonged to the Minister of Finance.
Parliament
The single-chamber Hungarian Parliament is the country’s supreme legislative body. The Parliament elects the President, the Prime Minister, the members of the Constitutional Court, the President and Vice-Presidents of the State Audit Office, the President of the Supreme Court and the Attorney General. See “Recent Political Developments.”
7
Members of Parliament are elected by popular vote for four-year terms. Elections are held using a combination of individual constituency voting (the candidate receiving the most votes in a particular district being elected from that district) and proportional voting (parties receiving at least 5% of the popular vote proportionally dividing a set number of seats). Hungary last held Parliamentary elections in April 2010. See “Recent Political Developments.” The next Parliamentary elections will occur in April 2014.
On April 16, 2012 the Parliament adopted the Act on Parliament, which changed the operation of the Parliament, the rules of Parliamentary Members’ remuneration and the rules regarding conflicts of interest.
Judiciary
The Hungarian judiciary consists of the Supreme Court, the county courts, the Metropolitan Court of Budapest and the local and labour courts. Legislation may provide for special courts to be convened for certain types of cases. Three Courts of Appeal located in Budapest, Pécs and Szeged were established with regional jurisdiction on July 1, 2003 and began their operations at that time. Two more Courts of Appeal with regional jurisdiction located in Debrecen and Győr were established in July 2004 and began their operations on January 1, 2005. The Supreme Court sets guidelines for the judicial process of every court. Resolutions of the Supreme Court concerning uniformity are binding on all courts of the Hungarian judiciary. Judges of Hungary are independent and are subordinate only to the law. Local courts have original jurisdiction. The Courts of Appeal, the county courts and the Metropolitan Court of Budapest have both appellate and original jurisdiction. The President of Hungary nominates, and Parliament elects, the President of the Supreme Court. The President of the Supreme Court nominates, and the President of Hungary appoints, the Vice-Presidents of the Supreme Court. The President of Hungary also appoints and removes professional (non-arbitration) judges. The President of Hungary may only remove professional judges for cause using procedures prescribed by law. On November 28, 2011, the Parliament adopted the Act on Organisation and Administration of Courts and a separate Act on Legal Status and Remuneration of Judges. In accordance with these Acts, the Hungarian judiciary remains a four-level court system, but the names of the courts have been changed and new special courts have been established for public administration cases. See “Recent Political Developments.”
The Constitutional Court is separate from the regular Hungarian judiciary. It decides on the constitutionality of legislation and other actions as set forth in the Hungarian Constitution. The Constitutional Court may annul any law or legal measure that it determines to be unconstitutional. Any person may initiate proceedings in the Constitutional Court to address issues within its jurisdiction. Adoption of the New Constitution (as hereinafter defined) includes changes to the main responsibilities of the Constitutional Court. The New Constitution entitles the Constitutional Court to annul a legal rule or a single judgment or to apply other specific legal consequences set forth by Cardinal Act (as hereinafter defined), only if such legal rule or judgment is contrary to the Constitution or an international agreement of Hungary. It also increases the number of members on the Constitutional Court from 11 to 15 and the term of their mandates from nine to 12 years. Members and the President of the Constitutional Court are elected by a two-thirds majority of the Members of Parliament, and Members of the Constitutional Court may not be re-elected. See “Recent Political Developments.”
Legislation facilitating and regulating the market economy is relatively new. Consequently, Hungarian courts are generally less experienced than their Western European counterparts in areas such as securities, banking and commercial law. Parties often refer disputes relating to such matters to the court of arbitration attached to the Hungarian Chamber of Commerce and Industry or the Permanent Court of Arbitration of Financial and Capital Markets.
On January 11, 2012, the European Commission commenced legal action against Hungary over new legislation that came into force on January 1, 2012 regarding the mandatory early retirement of judges and prosecutors at the age of 62 rather than 70, and the effect of that mandate on the independence of the judiciary.
8
Parliamentary Commissioners
Pursuant to the Data Protection and Freedom of Information Act of 1992 and the Act on the Parliamentary Commissioner of 1993, Parliament elects the Parliamentary Commissioner for Civil Rights, the Parliamentary Commissioner for Data Protection and Freedom of Information, and the Parliamentary Commissioner for National and Ethnic Minorities’ Rights (such commissioners are also known as Ombudsmen). Each Ombudsman is elected for a period of six years (with the first such election having taken place in 1995) and is exclusively responsible to Parliament. The principal role of the Ombudsmen is to help defend the public’s rights vis-à-vis the public administration.
Any individual who alleges that a proceeding, decision or action (including any omission to act) of, or taken by, any administrative or governmental authority and certain other entities caused the violation of his or her rights or that such violation is imminent may apply to the Ombudsmen to help protect his or her respective rights. In addition to monitoring and supervising data protection and the freedom of information in general and exercising the competence of an Ombudsman in the relevant area, the Data Protection Commissioner’s tasks also include, most importantly, the maintenance of the Data Protection Register and providing opinions on related legislative proposals and categories of official secrets. Pursuant to the Act on State and Official Secrets of 1995, the Parliamentary Commissioner for Data Protection is also entitled to change the classification of state and official secrets.
At the end of 2007, the Act on the Parliamentary Commissioner of 1993 was amended and the position of Parliamentary Commissioner for Future Generations was created. This Ombudsman is responsible for controlling the implementation of the regulation ensuring the sustainability and improvement of the environment and nature.
Local Government
Hungary is divided into administrative units, which include the capital (Budapest), counties, cities/towns and villages. Local governments are autonomous, democratically manage local affairs and may set the rates of certain limited local taxes. The Hungarian Constitution grants all local authorities the same fundamental rights; however, the duties and responsibilities of local governments may differ according to national and local legislation. Local governments consist of representative bodies, whose members are elected for four-year terms. Decisions of local authorities may only be revised if they conflict with the Constitution or national legislation. Local government elections were last held on October 3, 2010. See “Recent Political Developments.”
Recent Political Developments
Hungary held Parliamentary elections in April 2010. Nominees of the following parties gained mandates: the Hungarian Socialist Party (“HSP”), the electoral partnership comprising Fidesz-Hungarian Civic Union (“Fidesz”) and the Christian Democrats People’s Party (“CDPP”), Jobbik – Movement for a Better Hungary (“Jobbik”) and LMP – Politics Can Be Different (“LMP”). Fidesz and CDPP formed an alliance before the elections and submitted a joint list of nominees. The following table sets forth the results of the 2010 Parliamentary elections as published by the Hungarian National Election Office (the “NEO”):
| | | | | | | | |
| | | Number of
seats | | | Share
of seats
(%) | |
Fidesz-CDPP | | | 263 | | | | 68.14 | |
HSP | | | 59 | | | | 15.28 | |
Jobbik | | | 47 | | | | 12.18 | |
LMP | | | 16 | | | | 4.15 | |
Independent Representatives | | | 1 | | | | 0.26 | |
| | | | | | | | |
Total | | | 386 | | | | 100.00 | |
| | | | | | | | |
Source: NEO
9
Composition of the Parliament as of December 31, 2011
| | | | | | | | |
| | | Number of
seats | | | Share of
seats
(%) | |
Jobbik | | | 46 | | | | 11.92 | |
LMP | | | 15 | | | | 3.89 | |
Fidesz | | | 226 | | | | 58.55 | |
HSP | | | 48 | | | | 12.44 | |
CDPP | | | 37 | | | | 9.59 | |
Independent Representatives | | | 14 | | | | 3.63 | |
| | | | | | | | |
Total | | | 386 | | | | 100.00 | |
| | | | | | | | |
Source: Parliament of Hungary
Composition of the Parliament as of August 21, 2012
| | | | | | | | |
| | | Number of
seats | | | Share of
seats
(%) | |
Jobbik | | | 45 | | | | 11.66 | |
LMP | | | 15 | | | | 3.89 | |
Fidesz | | | 226 | | | | 58.55 | |
HSP | | | 48 | | | | 12.44 | |
CDPP | | | 37 | | | | 9.59 | |
Independent Representatives | | | 15 | | | | 3.89 | |
| | | | | | | | |
Total | | | 386 | | | | 100.00 | |
| | | | | | | | |
Source: Parliament of Hungary
Fidesz-CDPP obtained a majority of the Parliamentary seats in the 2010 elections. Fidesz-CDPP formed a government with a total of 263 of the 386 Parliamentary seats. Mr. Viktor Orbán was proposed by the then current President of Hungary and was elected by Parliament to serve as the new Prime Minister.
In 2010 and 2011, the Fidesz-CDPP coalition enacted the following amendments to the Hungarian Constitution:
| | • | | reduction in the number of Parliamentary seats from 386 to 200, of which 13 members representing national and ethnic minorities could be elected (such amendments to be effective commencing with the next parliamentary elections), and introduction of the position of deputy prime minister and a new category of government officials; |
| | • | | introduction of a nomination committee, composed of members proportionate to the members of the Parliamentary factions, to replace the previous method for nominating the members of the Constitutional Court; |
| | • | | amendment to the right to freedom of the press and the inclusion of the concept of pluralism and the right to be informed about public affairs, intended to foster and enrich national and European identity and Hungarian and minority languages, to strengthen national cohesion and satisfy community demands; |
10
| | • | | narrowing of the Constitutional Court’s scope of review, such that legal norms on the budget, budget execution, central taxes, duties, contributions, customs and general terms of local taxes may only be reviewed and annulled by the Constitutional Court if the initiative to review is solely based on specific constitutional rights; |
| | • | | an anti-corruption amendment providing that income sourced from public resources or bodies managing state-owned assets or from entities owned or controlled by the Government may be taxed retroactively (but limited to the five-year period preceding the applicable tax year), at a rate less than the full income; |
| | • | | granting to the chairpersons of the Hungarian Financial Supervisory Authority (the “HFSA”) and the National Media and Infocommunication Authority the authority to issue decrees to regulate the markets for which they are responsible; and |
| | • | | amendment to the election rules for the members of the Constitutional Court, increasing the number of the members from 11 to 15, extending the term of the members from nine years to 12 years and modifying the election rules for the chairperson of the Constitutional Court, who shall be elected by the Parliament. |
Mr. Pál Schmitt, who was elected as President in August 2010, handed in his resignation on April 2, 2012. Pursuant to certain constitutional rules, Mr. László Kövér, as the Chairman of the Parliament, acted as provisional acting president as from April 2, 2012 until May 10, 2012. On May 2, 2012, Mr. János Áder was elected as President by the Parliament and took his office as of May 10, 2012. The next presidential election is expected to be held in 2017.
On January 1, 2011, Hungary took over the Presidency of the Council of the European Union for the first half of 2011. The Hungarian Presidency of the Council of the European Union has built its political agenda around the human factor, focusing on four main topics: (i) growth and employment for preserving the European social model, (ii) a stronger Europe, (iii) a citizen-friendly European Union, and (iv) enlargement of the European Union and European neighbourhood policy. On January 1, 2011, Act CLXXXV of 2010 on Media Services and Mass Media and Act CIV of 2010 of Freedom of the Press and the Fundamental Rules on Media Content (collectively, the “Media Laws”) went into effect. The Media Laws established the Media Council, which is comprised of members elected by the Parliament by a two-thirds majority for a term of nine years. The Media Laws provide rules to ensure that members are independent, and the members are expected to have no ties, either formal or informal, with any political party or with the Government. The Media Laws cover a variety of media content, ranging from traditional print and radio to television and internet newspapers. Under the Media Laws, information presented in media must be balanced, media is prohibited from defaming or inciting hatred or social exclusion against any community, and the Media Council may impose fines for violating “public interest, public morals or order.” Additionally, the Media Laws establish legal protection for journalistic sources: they define rules for the protection of the professional conduct of journalists against undue interference from media owners or advertisers and create immunity for journalists committing minor offences, if unavoidable, in the course of their investigations for the benefit of the public.
On March 7, 2011, an amendment to the Media Laws was adopted by the Parliament to ensure that they comply with the relevant EU directive and to adopt the negotiated refinements. The amendment clarifies, among other things, the use of the term “offenses to minority or majority groups”, modifies the scope of the Media Laws in connection with non-Hungarian media content providers, abolishes the prior registration requirement of on-demand audiovisual services and abolishes the requirement of “providing balanced information” in the case of on-demand audiovisual services.
On April 18, 2011, the Parliament adopted the Fundamental Law of Hungary as the new constitution of Hungary (“New Constitution”). The New Constitution was promulgated on April 25, 2011 and went into effect on January 1, 2012. The major developments of the New Constitution include, inter alia, the following:
| | • | | the new name of the country, which is “Hungary”; |
11
| | • | | the notion of a “Cardinal Act”, which may only be passed, modified or repealed by the votes of two-thirds of the present Members of Parliament; |
| | • | | the principle of balanced, transparent and sustainable management of the budget, which principle will be enforced primarily by the Parliament and the Government; |
| | • | | the notion of autonomous regulatory organisations, which will be established by a Cardinal Act of the Parliament; |
| | • | | the main responsibilities of the Constitutional Court; |
| | • | | the function of the Commissioner for Fundamental Rights; |
| | • | | the framework rules for public finances; |
| | • | | limitations on the level of government debt; and |
| | • | | the fundamental rules for the responsibilities and composition of the Budgetary Council and rules for the appointment of its president. |
The New Constitution entitles the Constitutional Court to annul a legal rule or a single judgment or to apply other specific legal consequences set forth by Cardinal Act, only if such legal rule or judgment is contrary to the Constitution or an international agreement of Hungary. The New Constitution will raise the number of members on the Constitutional Court from 11 to 15 and will raise the term of their mandates from nine to 12 years. Members and the President of the Constitutional Court are elected by a two-thirds majority of the Members of Parliament, and Members of the Constitutional Court may not be re-elected.
As of January 1, 2012, the Parliamentary Commissioner of Fundamental Rights is responsible for activities aimed at protecting fundamental rights, and such functions replace the separated functions of the former Parliamentary Commissioners. The Deputy Commissioners of Fundamental Rights have undertaken the protection of the interests of future generations and the protection of minorities living in Hungary. The Commissioner and Deputy Commissioners shall be elected by a two-thirds majority of the Members of the Parliament, for a term of six years.
Aiming at the balanced, transparent and sustainable management of the budget, the New Constitution sets certain general rules for public finances, as follows:
Under the New Constitution, the Parliament will not be entitled to adopt an Act on the central budget, which would result in the level of government debt exceeding 50% of the gross domestic product. Furthermore, in the course of implementation of the central budget, it will not be allowed to draw a loan or undertake a financial obligation on behalf of Hungary that results in a level of government debt exceeding 50% of the gross domestic product.
The New Constitution includes certain exemptions and transitional rules until the actual level of government debt is reduced to the above-mentioned limit.
Upon the occurrence of a “special legal order”1 and to the extent necessary to mitigate the effects of the events and circumstances triggering the special legal order, or, in the event of a significant and enduring national economic recession, to the extent necessary to restore the balance of the national economy, the Parliament and the Government are entitled to deviate from the limitations described above.
Until the level of government debt falls below 50% of gross domestic product, the Parliament will be entitled to adopt an Act on the central budget that provides for a decrease of the government debt to gross domestic product ratio. Until the level of government debt falls below 50% of gross domestic product, in the course of implementation of the central budget, it will not however be allowed to draw a loan or undertake a financial obligation on behalf of Hungary that results in an increase of the ratio of government debt to gross domestic product from the previous calendar year.
| 1 | “Special legal order” means a state of national crisis, state of emergency, state of preventive defence, event of unexpected attack or state of danger. |
12
As long as the government debt exceeds 50% of the gross domestic product, the Constitutional Court may, within its competence pursuant to the respective provisions of the New Constitution, rule on the conformity of Acts on: (i) the central budget; (ii) the implementation of the budget; (iii) central taxes; (iv) stamp duties and contributions; (v) customs duties; and (vi) the central requirements related to local taxes, with those aspects of the New Constitution relating to rights to life and human dignity, to the protection of personal data, to the freedom of thought, conscience and religion, or in connection with the rights related to Hungarian citizenship, and it may only annul these Acts for the violation of these rights. Acts governing the above matters may be annulled by the Constitutional Court without restriction if the procedural requirements laid down in the New Constitution for the creation and publication of such rules of law have not been complied with.
The method for calculating government debt and gross domestic product and the rules for implementation of the government debt limitations mentioned above will be determined in an Act of Parliament.
The New Constitution prescribes that the burden of public finances, the fundamental rules of the pension system, the establishment of autonomous regulatory organs, the detailed rules of the responsibilities, organisation and operation of the Constitutional Court, detailed rules of the operation of the Budgetary Council and the method for calculating the level of government debt and of gross domestic product will be regulated by Cardinal Acts of the Parliament.
The New Constitution provides for a constitutional basis for the operation of the Budgetary Council and enhances the current statutory provisions applicable to the Council.
In June 2011, the Parliament elected the new members of the Constitutional Court, who filled their positions on September 1, 2011.
The following Cardinal Acts have been adopted by the Parliament:
On June 20, 2011, the Parliament adopted a new Act on State Audit Office, which went into effect on July 1, 2011. As an independent authority, the State Audit Office shall audit the implementation of the Annual Budget, the management of public finances, the utilisation of funds from public finances and the management of national assets.
On July 11, 2011, the Parliament adopted a new Act on Legal Status and Remuneration of the President of Hungary. Pursuant to the New Constitution, such Act set forth the detailed rules of resignation, declaration of his incapacitation by the Parliament, conflict of interest and remuneration.
On July 11, 2011, the Parliament adopted the Act on Informational Self-Determination and Freedom of Information. Upon such Act, a new authority, the independent National Agency for Data Protection and Freedom of Information will be established. The Agency will be responsible for supervision and facilitation of the enforcement of data protection rights and freedom of information in Hungary. The Agency replaced the Data Protection Commissioner’s Office on January 1, 2012.
On July 11, 2011, the Parliament adopted the Act on Commissioner for Fundamental Rights. The Commissioner for Fundamental Rights and his two deputies will replace the current system of the four Parliamentary Commissioners. The Commissioner shall be elected by the two-thirds majority of the Members of the Parliament, for a term of six years. One of the deputies will be responsible for safeguarding the constitutional rights and interests of future generations, while the other deputy will be responsible for safeguarding the rights of minorities living in Hungary. The Commissioner for Fundamental Rights will have a wider responsibility than the current Parliamentary Commissioners, and may conduct special proceedings against organisations which are not public bodies (e.g., companies, banks, social organisations) upon a complaint that such organisation seriously violates a fundamental right of a wider number of natural persons.
On November 14, 2011, the Parliament adopted the new Act on Constitutional Court. In accordance with the new Constitution, the number of members of the Constitutional Court was increased from 11 to 15 and their term of office lengthened from nine to 12 years. Members of the Constitutional Court may not be re-elected. Members and the president of the Constitutional Court are elected by a two-thirds majority of the Members of Parliament.
13
On November 21, 2011, the Parliament adopted the Act on the Consolidation of County Municipalities, Takeover of Institutions of County Municipalities and Certain Health Institutions of the Municipality of Budapest. According to such Act, the Hungarian State assumed the debt obligations of County Municipalities and certain debt items of the Municipality of Budapest. Upon such Act, the Hungarian State assumed HUF 197.6 billion debt as of December 30, 2011, and on the same day prepaid HUF 70.8 billion thereof. Simultaneously, Hungary became the owner of institutions of county municipalities and certain health institutions of the Municipality of Budapest. Most of the institutions taken over by Hungary are health care institutions, libraries and archive offices, which now are governed by the county offices of central government.
On November 28, 2011, the Parliament adopted the Act on Organisation and Administration of Courts and a separate Act on Legal Status and Remuneration of Judges. In accordance with these Acts, the Hungarian judiciary remains a four-level court system, but the names of the courts have been changed, and new special courts have been established for public administration cases.
On December 13, 2011, the Parliament adopted the New Labour Code of Hungary, which contains the fundamental regulation of employment, and provides a more flexible legal relationship between employers and employees. Such Act went into effect as of July 1, 2012.
On December 19, 2011, the Act on Local Governments of Hungary was adopted by the Parliament. Under this Act, the Government is entitled to supervise local governments through the metropolitan and county government agencies, in order to control their lawful operation as of January 1, 2012. The Act introduced certain restrictions relating to debt management of local governments — such as concluding credit or loan agreements or issuing local government bonds – and each funding transaction shall be approved by the Government. The annual incurrence of debt by local governments will be limited to 50% of the revenues of the local government. Such rules of local government debt management shall be applied for the planning and implementation of local government budgets for year 2013.
On December 23, 2011, the Parliament adopted the Act on Economic Stability of Hungary. Such Act contains regulations related to government debt reduction rules and detailed regulation of central government debt limits, rules of governing central government debt, the legal status of the Government Debt Management Agency, and the organisational and procedural order of the Budgetary Council.
On December 23, 2011, the Parliament adopted the Act on Public Finance, which divides the Hungarian public finance system into two subsystems, the subsystem of central government and the subsystem of municipalities. The social security funds and the separated state funds became part of the central government budget.
On December 23, 2011, the Parliament adopted the Act on National Assets, which provides for the protection of certain assets owned by the state or local governments or their public or private organisations. Such Act determines the scope and rules of management of national assets, and limitations related to selling, lending and utilisation of national assets, in order to ensure such assets serve the public interest.
On December 23, 2011, the Parliament adopted the Act on the Elections of Members of Parliament of Hungary, which stipulates that the 199 Members of the Parliament shall be elected by universal, equal, secret and direct ballot. The system is a mixed and one-round election system. This new law will be first applied at the next general elections.
On December 30, 2011, the Parliament adopted the new Act on the National Bank of Hungary, which raised the number of Monetary Council members to a minimum of five and a maximum of nine, and set the number of Deputy Governors of NBH to a minimum of two and a maximum of three; prior to the adoption of the new Act on the National Bank of Hungary, the number of Deputy Governors of NBH was set at two. Upon the proposal of the Prime Minister, Deputy Governors are appointed by the President. The Governor, the Deputy Governors and five other members elected by the Parliament constitute the Monetary Council. “See — Monetary and Financial System”.
14
With the exception of the Act on State Audit Office, each Cardinal Act went into effect on January 1, 2012.
Local Government Elections
The following table shows the results of the latest local government elections, which were held in October 2010:
Local Government Elections Results
| | | | | | | | | | | | |
| | | Budapest | | | County
government | | | Municipalities | |
| | | (percentage of total vote) | |
Independent representatives | | | 24.91 | | | | 52.17 | | | | 0.00 | |
Fidesz | | | 29.97 | | | | 19.57 | | | | 36.37 | |
CDPP | | | 23.55 | | | | 15.16 | | | | 36.37 | |
HSP | | | 11.86 | | | | 4.96 | | | | 14.55 | |
Jobbik | | | 3.09 | | | | 3.76 | | | | 9.42 | |
LMP | | | 1.61 | | | | 0.76 | | | | 1.95 | |
Other | | | 5.00 | | | | 3.61 | | | | 1.34 | |
| | | | | | | | | | | | |
Total | | | 100.00 | | | | 100.00 | | | | 100.00 | |
| | | | | | | | | | | | |
Source: NEO
The next local government elections are scheduled to take place in 2014.
European Parliament Elections
The first elections of Hungarian members to the European Parliament were held on June 13, 2004. The second elections of Hungarian members to the European Parliament were held on June 7, 2009. The following table shows the political affiliations of the Hungarian members of the European Parliament after the second elections:
Seats in European Parliament
| | | | |
| | | Seats | |
Fidesz-CDPP | | | 14 | |
Hungarian Democratic Forum | | | 1 | |
HSP | | | 4 | |
Jobbik | | | 3 | |
Source: European Parliament
The next European Parliament elections are scheduled for June 2015.
International Relations
Hungary has undertaken an active foreign policy designed to further its integration into the world community and to foster regional peace and economic development. Hungary joined the United Nations organisation (the “UN”) in 1955 and is a member of many of its specialised agencies such as UNESCO,
15
FAO, UNIDO, WHO and WTO (as described below). In 1996, Hungary officially became a member of the Organisation for Economic Co-Operation and Development (the “OECD”), which was a decisive step towards integrating with the developed nations and obtaining full EU membership. In 1999, Hungary became a full member of the North Atlantic Treaty Organization (“NATO”). Hungary maintains diplomatic relations with approximately 165 countries and is a member of a number of international organisations in addition to the UN, OECD, NATO and the EU, including the Global Environment Protection Fund, World Trade Organization (“WTO”), the International Bank for Reconstruction and Development (the “IBRD” or the “World Bank”), the Organization for Security and Co-Operation in Europe, IMF, the Council of Europe, the International Finance Corporation (“IFC”), the Central European Free Trade Agreement (“CEFTA”), the International Development Agency, Food and Agriculture Organization (“FAO”), the World Health Organization (“WHO”), the European Bank for Reconstruction and Development (“EBRD”), the United Nations Educational Scientific and Cultural Organization (“UNESCO”), the United Nations Industrial Development Organization (“UNIDO”), the European Investment Bank (“EIB”) and the Council of Europe Development Bank (“CEB”). Hungary is also a member of the Central European Initiative, the other members of which are Austria, Italy, Slovenia, Croatia, Slovakia, Poland and the Czech Republic. The Central European Initiative mainly addresses issues of regional infrastructure development. Hungary has been a member of the Organization for Security and Co-Operation in Europe (formerly referred to as the Conference on Security and Co-Operation in Europe) since its formation in 1975 and was admitted to the Council of Europe in 1990.
European Union
Hungary joined the EU on May 1, 2004. After the European Parliament elections in June 2009, the following Hungarian representatives assumed the following positions in the European Parliament: Pál Schmitt (Fidesz-CDPP) became a vice-president for the European Parliament but subsequently resigned upon being elected as Member of the Parliament of Hungary in April 2010 (from which position he subsequently resigned upon being elected President of Hungary in August 2010); Tamás Deutsch (Fidesz-CDPP) became the vice-chairman for the Committee on Budgetary Control; Kinga Gál (Fidesz-CDPP) became the vice-chairwoman for the Committee on Civil Liberties, Justice and Home Affairs; Kinga Göncz (HSP) became the vice-chairwoman for the Committee on Civil Liberties, Justice and Home Affairs; Zita Gurmai (HSP) became the vice-chairwoman for the Committee on Constitutional Affairs; Ágnes Hankiss (Fidesz-CDPP) became the vice-chairwoman for the Committee on Petitions; and Lívia Járóka (Fidesz-CDPP) became the vice-chairwoman for the Committee on Women’s Rights and Gender Equality.
Hungary is entitled to delegate one member to the European Commission. The current Hungarian delegate to the European Commission is Mr. László Andor, who assumed the position of Commissioner for Employment, Social Affairs and Inclusion on February 10, 2010.
The implementation of the Schengen System was a crucial issue in the EU accession negotiations. Hungary became fully integrated into the Schengen System in the beginning of 2008. The configuration of an information network compatible with the Schengen Information System, a principal pre-condition to integration into the Schengen System, has been completed.
Alongside the development of key areas of the economy, Hungary has implemented and intends to continue implementing development programmes and structural reforms to speed the convergence process with the EU. The key programme was the National Development Plan, which was approved on December 19, 2002 and which addressed the allocation of EU funds from 2004 to 2006. The Government published the first version of the second National Development Plan, the “New Development Plan,” which addressed the allocation of EU funds from 2007 to 2013. On September 7, 2007, the European Commission adopted the New Development Plan, which included seven regional and eight sector programmes. Overall, Hungary will derive a EUR 25 billion benefit under the New Development Plan.
On July 28, 2010, the Government unveiled a consultative paper on the new Széchenyi Plan, which aimed to revive the Hungarian economy and implement the objectives of The Programme of National Cooperation and to replace the New Development Plan. The Government focused on two major areas: reducing unemployment and creating new jobs through increasing the competitiveness of Hungarian
16
businesses. The scheme, based on European Union funding, guarantees significantly more support for Hungarian small and medium enterprises than has previously been available. With this support scheme tailored to private businesses, the core objective of the new Széchenyi Plan is to create one million new jobs in 10 years.
The new Széchenyi Plan was launched on January 15, 2011. At the heart of the programme are the seven priority areas identified in the consultative paper, which collectively form the foundation of a long-term strategic plan in parallel with the Government’s short-term crisis management programme.
The seven main areas are the following:
| 1. | The health industry (remedial and preventive healthcare, rehabilitation, R&D, biotechnology, medical equipment manufacturing, spas, etc.) |
| 2. | The green economy (renewables, geothermal energy, biotech R&D, etc.) |
| 3. | A home-building programme |
| 4. | Development of the business environment (stable economic, business and tax environment) |
| 5. | Science and innovation (R&D spending is aimed to reach 1.5% of gross domestic product (“GDP”) by 2015) |
| 6. | Employment (job creating, boosting employment and productivity) |
| 7. | The economy of transport and logistics |
Hungary plans to become a member of the European Monetary Union in accordance with the Maastricht Treaty. By entering the EU, Hungary also became a member of the European Investment Bank.
The financial flows between Hungary and the EU from 2006 to 2010 are discussed under “Public Finance – EU Net Position.”
For information about Hungary’s strategy in regards to its participation in the Exchange Rate Mechanism and the adoption of the Euro, see “Public Finance – Medium-Term Fiscal Programme and the Convergence Programme.”
17
THE ECONOMY
Background
The Hungarian economy has undergone a radical transformation since the fall of communism in 1989. As with other post-communist countries in the region, the Hungarian economy during the last 15 years can be characterized by economic dislocation at the beginning of the 1990s, with gradual improvement as reforms were implemented. The highlights of these economic reforms and trends include:
| | • | | an ambitious privatisation programme – the vast majority of Hungary’s large state-owned enterprises have already been privatised. See “Privatisation”; |
| | • | | a shift in exports from countries formerly participating in the Council for Mutual Economic Assistance (“COMECON”) to those of Western Europe and other industrialized countries. Currently, approximately three-quarters of Hungarian exports are to EU markets. See “Balance of Payments and Foreign Trade – Foreign Trade”; |
| | • | | the ratios of gross and net external debt to GDP declined in the second half of the 1990s, but have been rising since 2002, gross and net external debt to GDP ratio reaching 102.0% and 44.4%, respectively, in 2011, and the structure of external debt has changed. Meanwhile, the ratio of public sector debt to GDP dropped from 72% in 1996 to 50.6% in 2001, but has increased since 2001, reaching 74.6% in 2011. See “National Debt”; |
| | • | | the GDP growth rate adjusted for calendar-day effect reached 3.9% in 2006, albeit decreasing to 0.1% in 2007, 0.7% in 2008, contracting by 6.7% in 2009 and growing by 1.2% in 2010. The GDP increased by 1.7% in 2011. The GDP dropped by 1.2% in the first quarter of 2012 and 1.2% in the second quarter of 2012. See “The Economy – Recent Economic Performance – Gross Domestic Product”; |
| | • | | inflation decreased dramatically since the end of 1995 from 28.3% to 2.3% as of April 2006, partly as a result of the reduction of the VAT rate. The inflation rate increased to 4.7% as of December 2010, mainly as a result of food and energy price dynamics, and declined to 4.1% as of December 2011, mainly as a result of lower energy, food, fuel, alcoholic beverage and tobacco price dynamics. The inflation rate increased to 6.0% in August 2012, mainly as a result of tax increases. See “The Economy – Recent Economic Performance – Inflation”; |
| | • | | foreign direct investment (the total amount of capital invested in Hungary from abroad) has generally increased since 1995, reaching EUR 86.8 billion as of the end of 2011. During the first two quarters of 2012, the balance of net direct investment amounted to EUR 187.9 million outflow, compared to a EUR 523.4 million outflow during the same period in 2011. See “Balance of Payments and Foreign Trade – Foreign Direct Investment”; and |
| | • | | between 2002 and 2005, the general government deficit according to ESA methodology as a percentage of GDP generally decreased, reaching 7.9% of GDP in 2005, but increased to 9.5% in 2006. The government deficit as a percentage of GDP decreased in 2007 and 2008, reaching 5.1% and 3.7%, respectively, increased to 4.5% in 2009, decreased slightly to 4.4% in 2010 and, according to preliminary data, turned into a surplus of 4.2% in 2011. |
18
Recent Economic Performance
The following table sets out certain macroeconomic statistics regarding Hungary for the periods indicated:
Selected Macroeconomic Statistics
| | | | | | | | | | | | | | | | | | | | | | | | | | | | |
| | | December 31, | | | First
quarter of | | | Second
quarter of | |
| | | 2007 | | | 2008 | | | 2009 | | | 2010 | | | 2011(1) | | | 2012(1) | | | 2012(1) | |
Economic Data(2) | | | | | | | | | | | | | | | | | | | | | | | | | | | | |
Nominal GDP (HUF billions) | | | 24,991.8 | | | | 26,545.6 | | | | 25,622.9 | | | | 26,747.7 | | | | 28,080.3 | | | | 6,498.2 | | | | 7,048.2 | |
Real GDP (growth in %) | | | 0.1 | | | | 0.9 | | | | (6.8 | ) | | | 1.3 | | | | 1.6 | | | | (0.7 | ) | | | (1.3 | ) |
Real exports (growth in %) | | | 15.0 | | | | 5.7 | | | | (10.2 | ) | | | 14.3 | | | | 8.4 | | | | 1.9 | | | | 2.1 | |
Real imports (growth in %) | | | 12.8 | | | | 5.7 | | | | (14.8 | ) | | | 12.8 | | | | 6.3 | | | | (0.3 | ) | | | 0.2 | |
Rate of unemployment (as of the period end (%)) | | | 7.7 | | | | 8.0 | | | | 10.5 | | | | 10.8 | | | | 10.7 | | | | 11.7 | | | | 10.9 | |
Consumer prices (growth in %) | | | 8.0 | | | | 6.1 | | | | 4.2 | | | | 4.9 | | | | 3.9 | | | | 5.6 | (8) | | | 5.6 | (5) |
Producer prices (growth in %) | | | 0.3 | | | | 5.0 | | | | 4.9 | | | | 4.5 | | | | 4.2 | | | | 6.8. | (8) | | | 7.0 | (5) |
| | | | | | | |
State Budget; Public and External Debt(3) | | | | | | | | | | | | | | | | | | | | | | | | | | | | |
State budget surplus/(deficit) (HUF billions) | | | (1,361.4 | ) | | | (918.4 | ) | | | (528.7 | ) | | | (1,128.5 | ) | | | (1,600.7 | ) | | | (517.5 | )(4) | | | (0,2 | )(4) |
as a % of GDP | | | (5.4 | ) | | | (3.5 | ) | | | (2.1 | ) | | | (4.2 | ) | | | (5.7 | ) | | | | | | | | |
Total revenues (HUF billions) | | | 11,636.9 | | | | 12,548.1 | | | | 12,911.0 | | | | 12,410.5 | | | | 12,937.0 | | | | 3,198.8 | (4) | | | 3,580.6 | (4) |
as a % of GDP | | | 46.6 | | | | 47.3 | | | | 50.4 | | | | 46.4 | | | | 46.1 | | | | | | | | | |
Public debt (HUF billions), unconsolidated | | | 15,585.5 | | | | 18,103.9 | | | | 18,964.9 | | | | 20,041.0 | | | | 20,955.5 | | | | 20,826.8 | | | | 20,621.6 | |
as a % of GDP | | | 62.4 | | | | 68.2 | | | | 74.0 | | | | 74.9 | | | | 74.6 | | | | | | | | | |
External public debt (HUF billions) | | | 4,472.6 | | | | 6,774.8 | | | | 8,468.5 | | | | 8,842.8 | | | | 10,170.4 | | | | 9,427.7 | | | | 8,934.7 | |
as a % of GDP | | | 17.9 | | | | 25.5 | | | | 33.1 | | | | 33.1 | | | | 36.2 | | | | | | | | | |
| | | | | | | |
Balance of Payments Data(6) | | | | | | | | | | | | | | | | | | | | | | | | | | | | |
Current account (EUR billions)(7) | | | (7.2 | ) | | | (7.8 | ) | | | (0.2 | ) | | | 1.0 | | | | 0.9 | | | | 0.0 | | | | 0.5 | |
as a % of GDP | | | (7.3 | ) | | | (7.3 | ) | | | (0.2 | ) | | | 1.1 | | | | 0.9 | | | | | | | | | |
Exports (EUR billions)(7) | | | 80.4 | | | | 85.9 | | | | 70.7 | | | | 83.6 | | | | 90.8 | | | | 22.3 | | | | 23.2 | |
Imports (EUR billions)(7) | | | 79.7 | | | | 85.6 | | | | 66.3 | | | | 77.5 | | | | 84.2 | | | | 20.8 | | | | 21.0 | |
NBH’s foreign exchange reserves (EUR billions) | | | 16.4 | | | | 24.0 | | | | 30.7 | | | | 33.7 | | | | 37.8 | | | | 34.7 | | | | 35.6 | |
Sources: Hungarian Central Statistical Office, NBH, Ministry for National Economy
Notes:
| (2) | Derived from data published by the CSO. |
| (3) | Derived from the government budget as published by the Ministry for National Economy. |
19
| (4) | Non-consolidated data excluding local governments. |
| (5) | Average data for the first half of the year. |
| (6) | Derived from data published by the NBH. |
| (7) | Including goods and services. |
| (8) | Average of the first three months. |
Gross Domestic Product
The following table presents the nominal GDP at current market prices, as well as real GDP growth rates, per capita GDP and USD equivalents for the periods indicated:
Gross Domestic Product
| | | | | | | | | | | | | | | | | | | | | | | | | | | | |
| | | For the year ended December 31, | | | First
quarter of
2012 | | | Second
quarter of
2012 | |
| | | 2007 | | | 2008 | | | 2009 | | | 2010 | | | 2011 | | | |
| | | | | | | |
Nominal GDP (HUF billion) | | | 24,991.8 | | | | 26,545.6 | | | | 25,622.9 | | | | 26,747.7 | | | | 28,080.3 | | | | 6,498.2 | | | | 7,048.2 | |
Annual real GDP growth rate (%)(1) | | | 0.1 | | | | 0.7 | | | | (6.7 | ) | | | 1.2 | | | | 1.7 | | | | (1.2 | ) | | | (1.3 | ) |
Per capita GDP (in HUF)(3) | | | 2,482,759.3 | | | | 2,642,567.4 | | | | 2,554,374.4 | | | | 2,670,940.3 | | | | 2,811,969.0 | | | | 652,556.2 | | | | 708,571.8 | |
| | | | | | | |
U.S. Dollar Equivalents: | | | | | | | | | | | | | | | | | | | | | | | | | | | | |
GDP (USD billions)(2) | | | 135.9 | | | | 154.5 | | | | 126.7 | | | | 128.5 | | | | 139.7 | | | | 31.2 | | | | 35.1 | |
Per capita GDP (USD)(2)(3) | | | 13,505.6 | | | | 15,381.7 | | | | 12,629.2 | | | | 12,832.0 | | | | 13,993.7 | | | | 2,884.9 | | | | 3,087.6 | |
Source: CSO
Notes:
| (1) | Data adjusted for calendar-day effect. |
| (2) | Calculated according to the average HUF/USD exchange rate of the corresponding period calculated by the NBH. |
| (3) | Calculated according to population as of the beginning of the corresponding period. |
In 2007 and 2008, GDP growth dropped to 0.1% and 0.7%, respectively, according to data adjusted for calendar-day effect, partly as a result of tight fiscal policy. In 2009 GDP decreased by 6.7% mainly as a result of deteriorating global economic activity. In 2010 and 2011 GDP increased by 1.2% and 1.7%, respectively; the slow global economic growth rate played a significant role in the relatively low economic growth rate of Hungary.
In 2011, GDP increased by 1.6% according to data not adjusted for calendar-day effect. Value added by the agricultural industry grew significantly as a result of favourable weather conditions, with the sector increasing by 27.2%. As external demand strengthened further, value added by the industry sector (i.e., manufacturing, mining and quarrying and electricity) increased by 5.7%. Construction contracted by 7.8% as home construction continued to struggle due to continuing tightened credit constraints. The value added by the service sector fell by 0.7%. The unemployment rate and consumer sentiment did not improve, and, as a result, domestic demand was weak.
Domestic use diminished slightly by 0.6% in 2011. Consumption decreased slightly by 0.2%. Gross fixed capital formation contracted by 5.5% as a result of still unfavourable investor sentiment. Gross capital formation fell by 2.4% due to a positive change in inventories. Net exports turned the contraction of domestic use into a growth of total GDP. Exports grew by 8.4% partly as a result of the improving state of the economy in Western Europe. The dynamics of imports lagged behind that of exports due to weak investment sentiment and stagnating consumption, as import demand from investment and consumption still faltered. A 6.3% growth in imports was mainly the result of the import content of increasing exports.
20
In the first half of 2012, GDP decreased by 1.2%. Value added by the agricultural industry fell significantly as a result of worse weather conditions compared to the previous year, with the sector decreasing by 8.5%. As external demand was weaker, value added by the industry sector (i.e., manufacturing, mining and quarrying and electricity) decreased by 0.4%. Construction contracted by 10.7% as home construction continued to struggle due to continuing tightened credit constraints. The value added by the service sector decreased slightly by 0.1%. The unemployment rate and consumer sentiment did not improve significantly, and, as a result, domestic demand is weak.
Domestic use diminished by 3.2% in the first half of 2012. Consumption contracted by 1.1%. Gross fixed capital formation contracted by 5.5%, as a result of still unfavourable investor sentiment. Gross capital formation decreased by 11.7%. Net exports dampened the contraction of domestic use of 3.2% into a 1.0% fall of total GDP. Exports grew by 2.0% mainly as a result of the slightly improving state of the economy in Western Europe. Imports decreased slightly by 0.1% due to weak investment sentiment and stagnating consumption, as import demand from investment and consumption still faltered.
The following table shows the sector composition of GDP in each of the periods indicated:
Sector Composition of GDP
| | | | | | | | | | | | | | | | | | | | | | | | | | | | |
| | | December 31, | | | First
quarter
of | | | Second
quarter
of | |
| | | 2007 | | | 2008 | | | 2009 | | | 2010 | | | 2011 | | | 2012 | | | 2012 | |
| | | (percentage of contribution) | | | | | | | |
Agriculture, forestry and fishing | | | 3.6 | | | | 3.4 | | | | 2.9 | | | | 3.2 | | | | 4.6 | | | | 2.9 | | | | 4.1 | |
Mining and quarrying; manufacturing; electricity, gas, steam and air conditioning supply; water supply; sewerage, waste management and remediation activities | | | 22.4 | | | | 21.8 | | | | 20.8 | | | | 22.7 | | | | 24.4 | | | | 25.8 | | | | 24.3 | |
| | | | | | | |
Of which: | | | | | | | | | | | | | | | | | | | | | | | | | | | | |
Manufacturing | | | 18.9 | | | | 18.4 | | | | 17.0 | | | | 18.8 | | | | 20.6 | | | | 21.8 | | | | 20.9 | |
Construction | | | 4.2 | | | | 4.2 | | | | 4.1 | | | | 3.7 | | | | 3.3 | | | | 1.8 | | | | 2.7 | |
Services, total | | | 55.4 | | | | 55.9 | | | | 56.7 | | | | 54.9 | | | | 52.7 | | | | 53.5 | | | | 52.7 | |
| | | | | | | |
Of which: | | | | | | | | | | | | | | | | | | | | | | | | | | | | |
Wholesale and retail trade; repair of motor vehicles and motorcycles; accommodation and food service activities | | | 10.7 | | | | 11.1 | | | | 10.0 | | | | 9.5 | | | | 9.4 | | | | 8.5 | | | | 9.4 | |
Transportation and storage | | | 5.2 | | | | 4.9 | | | | 4.9 | | | | 4.8 | | | | 4.7 | | | | 4.5 | | | | 4.6 | |
Information and communication | | | 4.4 | | | | 4.4 | | | | 4.9 | | | | 4.8 | | | | 4.6 | | | | 4.7 | | | | 4.5 | |
Financial and insurance activities | | | 3.8 | | | | 3.5 | | | | 4.1 | | | | 4.0 | | | | 3.7 | | | | 3.9 | | | | 3.6 | |
Real estate activities | | | 7.0 | | | | 7.1 | | | | 7.6 | | | | 7.6 | | | | 7.2 | | | | 7.4 | | | | 7.1 | |
Professional, scientific and technical activities; administrative and support service activities | | | 6.6 | | | | 7.0 | | | | 7.1 | | | | 6.9 | | | | 6.5 | | | | 7.0 | | | | 6.7 | |
Public administration and defence; compulsory social security; education; human health and social work activities | | | 15.2 | | | | 15.3 | | | | 15.6 | | | | 15.0 | | | | 14.1 | | | | 15.2 | | | | 14.2 | |
Arts, entertainment and recreation, repair of household goods and other services | | | 2.5 | | | | 2.6 | | | | 2.5 | | | | 2.4 | | | | 2.4 | | | | 2.4 | | | | 2.6 | |
Taxes less subsidies on products | | | 14.4 | | | | 14.7 | | | | 15.5 | | | | 15.5 | | | | 15.0 | | | | 16.0 | | | | 16.3 | |
| | | | | | | |
GDP, total | | | 100.0 | | | | 100.0 | | | | 100.0 | | | | 100.0 | | | | 100.0 | | | | 100.0 | | | | 100.0 | |
Source: CSO
21
Inflation
The following table illustrates the year-on-year change and the yearly average change in the Consumer Price Index (the “CPI”) and the Producer Price Index (the “PPI”) for each of the years indicated:
Inflation
| | | | | | | | | | | | | | | | | | | | |
| | | 2007 | | | 2008 | | | 2009 | | | 2010 | | | 2011 | |
| | | (%) | |
CPI (yearly average) | | | 8.0 | | | | 6.1 | | | | 4.2 | | | | 4.9 | | | | 3.9 | |
CPI (year-on-year) | | | 7.4 | | | | 3.5 | | | | 5.6 | | | | 4.7 | | | | 4.1 | |
PPI (yearly average) | | | 0.3 | | | | 5.0 | | | | 4.9 | | | | 4.5 | | | | 4.2 | |
PPI (year-on-year) | | | 1.7 | | | | 5.6 | | | | 1.3 | | | | 8.1 | | | | 7.5 | |
Source: CSO
Deregulation since 1990 has led to a high rate of inflation in Hungary. This rate was relatively high in the 1990s compared to rates in Western Europe due to the general phasing out of price supports and the high public sector deficit. However, the rate of inflation has generally been declining since the change in monetary regime in May 2001.
In the first half of 2007, the inflation rate increased significantly, reaching 9.0% in March 2007, mainly as a result of base effect and a significant increase in regulated prices. The 12-month inflation rate declined to 3.5% in December 2008, mainly as a result of weak domestic demand and appreciation of the forint in the summer of 2008. The inflation rate then declined further to 2.9% in March 2009, but increased again, reaching 6.4% in January 2010 mainly as a result of VAT and excise duty changes. The inflation rate decelerated to 3.7% in August 2010 as the effect of changes in VAT and excise duties phased out. The inflation rate increased to 4.2% in November 2010, mainly as a result of increasing energy and food prices. The yearly average inflation for the year 2010 reached 4.9%. The inflation rate decreased to 3.1% in July 2011, mainly as a result of lower energy, food, fuel, alcoholic beverage and tobacco price dynamics. The inflation rate increased to 4.1% in December 2011, mainly as a result of higher energy, alcoholic beverage and tobacco price dynamics. The yearly average inflation for the year 2011 was 3.9%. The inflation rate grew to 6.0% in August 2012, mainly as a result of tax increases.
Price Regulation
As of the end of 2008, approximately 80% of all prices in Hungary were unregulated. The main categories of products and services that continue to have regulated prices are: electricity, gas, purchased heating, various pharmaceutical products, meals at schools, kindergartens and nurseries, the state lottery, local and long-distance passenger transport, state-owned housing rent, various household utilities (including water and sewage charges and refuse collection services) and postal services.
In line with relevant EU Directives, Hungary intends to abolish regulated pricing schemes from the increasingly market-based energy and postal sectors. Deregulation of the energy sector began in July 2004. The entire energy sector has been deregulated, including the residential segment; however, if electricity is provided by a so-called universal service provider, retail electricity prices are capped by regulation. In
22
February 2006, Parliament approved a bill on the temporary regulation of prices paid by Magyar Villamos Művek Zrt. (“MVM”) (a state-owned energy company in Hungary) for energy produced by power plants. Under the current rules, the deadline for deregulation of the postal services is the end of 2012.
Wages
The following table sets forth year-on-year changes in nominal and real wages for the periods indicated:
Wages
| | | | | | | | | | | | | | | | | | | | | | | | |
| | | 2007 | | | 2008 | | | 2009 | | | 2010 | | | 2011 | | | First
five
months
of 2012 | |
| | | (%) | |
Nominal net wage index | | | 3.0 | | | | 7.0 | | | | 1.8 | | | | 6.9 | | | | 6.4 | | | | 1.7 | |
Real net wage index | | | (4.6 | ) | | | 0.8 | | | | (2.3 | ) | | | 1.9 | | | | 2.2 | | | | (3.7 | ) |
Source: CSO
In 2007, real wages dropped by 4.6% compared to 2006, mainly as a result of the higher tax burden and increasing inflation rate. In 2008 and 2009, real wages dropped by 0.8% and 2.3%, respectively, primarily as a result of a strict income policy in the public sector. In 2010, there was a 1.8% increase in net real wages, mainly as a result of a lower tax burden. In 2011, net real wages grew by 2.2%, partly as a result of a lower tax burden. In the first five months of 2012, net real wages dropped by 3.7%, partly as a result of accelerating inflation.
As with GDP growth, nominal and real wage changes have not been consistent across Hungary. Relatively stronger overall economic growth in western Hungary and a generally immobile labour force (due to a general reluctance to relocate to other parts of the country) have led to a substantial decrease in unemployment in western Hungary and disproportionately higher wage increases as compared to the rest of Hungary. Hungary’s incentive policies (mainly consisting of the promotion of investment in less developed regions and the development of transportation infrastructure and of human resources) and utilisation of the Structural and Cohesion Funds of the EU are in part designed to increase employment levels in the eastern parts of the country.
Employment
The following table illustrates the general composition of employment and unemployment for each of the years indicated:
Unemployment
| | | | | | | | | | | | | | | | | | | | | | | | |
| | | 2007 | | | 2008 | | | 2009 | | | 2010 | | | 2011 | | | First
half
of
2012 | |
| | | (annual average, %) | |
Employed | | | 50.9 | | | | 50.3 | | | | 49.2 | | | | 49.2 | | | | 49.7 | | | | 50.0 | |
Unemployed | | | 4.0 | | | | 4.3 | | | | 5.5 | | | | 6.2 | | | | 6.1 | | | | 6.4 | |
Unemployment rate(1) | | | 7.4 | | | | 7.8 | | | | 10.0 | | | | 11.2 | | | | 11.0 | | | | 11.3 | |
Source: CSO
Note:
| (1) | Based on the international sampling methodology pursuant to the guidelines of the International Labour Organization. |
23
The unemployment rate in 2007 (calculated using the guidelines of the International Labour Organization) was 7.4%. The unemployment increased to 7.8% in 2008. In 2009, the unemployment rate increased to 10.0%, and in 2010 the unemployment rate reached 11.2%, primarily as a result of lay-offs, especially in the private sector. In 2011, the unemployment rate decreased slightly to 11.0%. During the first half of 2012, the unemployment rate was 11.3%. In previous years, the activity rate was generally lower, partly due to the low mobility of the workforce in Hungary. Economic development has generally not been uniform throughout Hungary since 1990, with a higher concentration of jobs in Budapest and the central region of Hungary. High commuting costs (in terms of both time and the financial burden) generally discourage potential employees from traveling to distant workplaces, while discrepancies in real estate prices and inadequate housing rental opportunities have discouraged the relocation of Hungary’s workforce. This trend has been decreasing, as new infrastructure investments (particularly Hungary’s highway construction projects) have brought new investment and job opportunities to less developed regions of Hungary, thereby increasing the activity rate. Furthermore, relatively high levels of taxation have led to the formation of a relatively large “grey economy,” with many employers avoiding adequate reporting of their activities (including with respect to hiring) in order to avoid paying taxes. Labour unions have not gained any significant influence in Hungary and to date have not caused any substantial work stoppages in Hungary. Labour unions are generally stronger in the public sectors of the economy in Hungary.
The increase of activity rate has been an important policy of the Government. The Government has taken a number of steps to reduce the unemployment rate. In order to help reduce the social contributions burden of the workforce and the importance of the so-called “grey economy,” the monthly flat-rate health care contribution was reduced from HUF 3,450 to HUF 1,950 beginning as of November 2005. As of January 1, 2010, the fixed monthly health care contribution of HUF 1,950 per employee paid by employers was abolished. See “Public Finance – Health Care System.” In addition, new laws were passed, which took effect as of August 1, 2005, making it easier to employ part-time employees. Furthermore, the Government introduced several initiatives aimed at helping currently unemployed workers find employment, including job-search assistance programmes and adult vocational training programmes. Lastly, the Government initiated the “START” programme, which is aimed at helping first-time employees find employment. The START programme provides, among other things, employer contribution discounts to employers hiring graduates under a certain age and certain other potential first-time employees.
On January 1, 2012, the new public work programme called Start Work Programme (Start Munkaprogram) was introduced. Hungary’s 2012 budget allocated HUF 132 billion for the financing of public work programmes, with the objective of providing work for more than 200,000 people. The Start Work Programme is based on three pillars: (1) national public work programme, (2) local government public work programmes, and (3) micro-regional pilot projects.
The following table illustrates the general composition of employment in Hungary by major sector for each of the years indicated:
24
Composition of Employment by Sector
| | | | | | | | |
| | | 2007 | | | 2008 | |
| | | (in thousands of persons) | |
Agriculture, hunting and forestry, fishing | | | 89.9 | | | | 86.8 | |
Of which: | | | | | | | | |
Forestry, logging and related service activities | | | 9.2 | | | | 8.6 | |
Industry | | | 745.6 | | | | 747.3 | |
Of which: | | | | | | | | |
Mining and quarrying | | | 4.7 | | | | 4.7 | |
Manufacturing | | | 692.4 | | | | 696.1 | |
Electricity, gas and water supply | | | 48.5 | | | | 46.5 | |
Construction | | | 129.6 | | | | 125.5 | |
Wholesale and retail trade; repair of motor vehicles and household goods | | | 355.0 | | | | 365.1 | |
Hotels and restaurants | | | 86.3 | | | | 88.6 | |
Transport, storage and communication | | | 214.6 | | | | 211.5 | |
Financial intermediation | | | 67.0 | | | | 70.4 | |
Real estate, renting and business activities | | | 234.8 | | | | 252.8 | |
Public administration and defence; compulsory social security | | | 267.7 | | | | 262.9 | |
Education | | | 273.4 | | | | 266.9 | |
Health and social services | | | 210.0 | | | | 201.5 | |
Of which: | | | | | | | | |
Human health activities | | | 128.9 | | | | 120.7 | |
Social work activities | | | 80.8 | | | | 80.5 | |
Other community, social and personal service activities | | | 86.7 | | | | 83.2 | |
National economy total | | | 2,760.7 | | | | 2,762.5 | |
Of which: | | | | | | | | |
Business sector | | | 1,933.3 | | | | 1,953.2 | |
Budgetary institutions | | | 748.6 | | | | 722.0 | |
Source: CSO
Composition of Employment by Sector(1)
| | | | | | | | | | | | | | | | | | | | | | | | |
| | | 2008 | | | 2009 | | | 2010 | | | 2011 | | | First
quarter
of 2012 | | | Second
quarter
of 2012 | |
| | | (in thousands of persons) | | | | |
Agriculture, forestry and fishing | | | 169.2 | | | | 175.8 | | | | 171.8 | | | | 185.1 | | | | 188.0 | | | | 188.0 | |
Mining and quarrying | | | 8.5 | | | | 8.5 | | | | 11.1 | | | | 11.1 | | | | 7.4 | | | | 7.4 | |
Manufacturing | | | 853.0 | | | | 794.6 | | | | 786.6 | | | | 809.0 | | | | 800.8 | | | | 800.8 | |
Electricity, gas, steam and air conditioning supply | | | 33.7 | | | | 38.8 | | | | 37.3 | | | | 38.1 | | | | 38.4 | | | | 38.4 | |
Water supply, sewerage, waste management and remediation activities | | | 47.0 | | | | 45.3 | | | | 48.1 | | | | 51.6 | | | | 57.6 | | | | 57.6 | |
Construction | | | 312.0 | | | | 293.3 | | | | 277.6 | | | | 264.0 | | | | 240.3 | | | | 240.3 | |
Wholesale and retail trade; repair of motor vehicles and motorcycles | | | 576.4 | | | | 549.2 | | | | 539.8 | | | | 545.7 | | | | 543.0 | | | | 543.0 | |
Transportation and storage | | | 258.3 | | | | 254.3 | | | | 259.0 | | | | 259.2 | | | | 261.0 | | | | 261.0 | |
Accommodation and food service activities | | | 157.2 | | | | 152.8 | | | | 154.5 | | | | 163.5 | | | | 162.8 | | | | 162.8 | |
25
| | | | | | | | | | | | | | | | | | | | | | | | |
Information and communication | | | 96.6 | | | | 91.0 | | | | 96.3 | | | | 91.8 | | | | 96.3 | | | | 96.3 | |
Financial and insurance activities | | | 94.1 | | | | 95.5 | | | | 91.0 | | | | 91.8 | | | | 86.6 | | | | 86.6 | |
Real estate activities | | | 20.4 | | | | 19.9 | | | | 21.0 | | | | 21.5 | | | | 22.3 | | | | 22.3 | |
Professional, scientific and technical activities | | | 145.7 | | | | 138.1 | | | | 139.0 | | | | 137.9 | | | | 130.0 | | | | 130.0 | |
Administrative and support service activities | | | 104.8 | | | | 116.3 | | | | 110.3 | | | | 114.2 | | | | 124.2 | | | | 124.2 | |
Public administration and defence; compulsory social security | | | 287.8 | | | | 304.7 | | | | 317.2 | | | | 309.6 | | | | 312.6 | | | | 312.6 | |
Education | | | 313.2 | | | | 319.1 | | | | 323.9 | | | | 316.9 | | | | 310.9 | | | | 310.9 | |
Human health and social work activities | | | 245.8 | | | | 239.6 | | | | 251.6 | | | | 255.0 | | | | 261.3 | | | | 261.3 | |
Arts, entertainment and recreation | | | 65.2 | | | | 58.4 | | | | 60.2 | | | | 62.8 | | | | 63.0 | | | | 63.0 | |
Other activities | | | 90.5 | | | | 86.7 | | | | 84.9 | | | | 83.2 | | | | 84.9 | | | | 84.9 | |
Total | | | 3,879.4 | | | | 3,781.9 | | | | 3,781.2 | | | | 3,811.9 | | | | 3,791.3 | | | | 3,791.3 | |
Source: CSO
Note:
| (1) | As of January 1, 2008, CSO used a new breakdown by sector. |
Principal Sectors of the Economy
Industry
The following table indicates the gross production indices by industry sector for the periods indicated:
Gross Production Indices by Industry(1)
| | | | | | | | | | | | |
| | | 2011 | | | First
quarter
of 2012 | | | Second
quarter
of 2012 | |
| | | (corresponding period of the previous
year = 100) | |
Agriculture, forestry and fishing | | | 127.2 | | | | 94.2 | | | | 89.6 | |
Mining and quarrying; manufacturing; electricity, gas, steam and air conditioning supply; water supply; sewerage, waste management and remediation activities | | | 105.7 | | | | 99.8 | | | | 99.3 | |
Of which: | | | | | | | | | | | | |
Manufacturing | | | 107.0 | | | | 100.3 | | | | 99.9 | |
Construction | | | 92.2 | | | | 89.1 | | | | 89.3 | |
Services, total | | | 99.3 | | | | 100.0 | | | | 99.8 | |
Of which: | | | | | | | | | | | | |
Wholesale and retail trade; repair of motor vehicles and motorcycles; accommodation and food service activities | | | 99.6 | | | | 100.3 | | | | 99.0 | |
Transportation and storage | | | 100.7 | | | | 98.2 | | | | 99.6 | |
Information and communication | | | 102.2 | | | | 103.0 | | | | 104.5 | |
26
| | | | | | | | | | | | |
Financial and insurance activities | | | 93.3 | | | | 97.5 | | | | 98.3 | |
Real estate activities | | | 98.4 | | | | 99.2 | | | | 98.7 | |
Professional, scientific and technical activities; administrative and support service activities | | | 98.1 | | | | 100.3 | | | | 100.0 | |
Public administration and defence; compulsory social security; education; human health and social work activities | | | 99.9 | | | | 100.7 | | | | 99.8 | |
Arts, entertainment and recreation, repair of household goods and other services | | | 103.0 | | | | 99.8 | | | | 99.6 | |
Taxes less subsidies on products(2) | | | x | | | | x | | | | x | |
| GDP, total | | | 101.6 | | | | 99.3 | | | | 98.7 | |
Source: CSO
Note:
| (1) | Data unadjusted for calendar-day effect. |
| (2) | For these items the volume index is not applicable. |
Industry. In 2011, industrial gross production grew by 5.6%, and total sales increased by 1.6%. In the last five years, industrial export sales amounted to approximately half of the total sales of the sector. In 2011, export sales grew by 7.9%, while domestic sales fell by 5.2%. In the first six months of 2012, export sales increased by 1.0%, while domestic sales dropped by 1.7%. As a result, total sales diminished by 0.2%, and gross production fell by 0.4%. In 2011, more than 90% of the total industrial production was attributable to manufacturing. The value of production in mining and quarrying amounted to 0.4% of the total industry’s production, and the value of production of electricity, gas, steam and air conditioning supply amounted to 6.8% of the total industrial production.
Manufacturing. In 2011, gross production in the manufacturing sector increased by 6.0% and total sales grew by 5.5%. In 2011, export sales in manufacturing increased by 8.4%, while domestic sales declined by 0.8%. In the first six months of 2012, export sales grew by 1.8%, and domestic sales decreased by 1.7%. As a result, total sales increased by 0.8%, and gross production diminished by 0.1%. In 2011, approximately 40% of the manufacturing production was attributable to the subsector of manufacture of computer, electronic and optical products and the subsector of manufacture of transport equipment.
Manufacture of computer, electronic and optical products. Gross production in this subsector fell by 5.2%, and total sales decreased by 4.7%, in 2011. In 2011, export sales in this subsector decreased by 3.8%, and domestic sales fell by 19.1%. In the first six months of 2012, export sales declined by 10.7%, and domestic sales decreased by 27.7%. As a result, total sales dropped by 11.9%, and gross production fell by 13.2%.
Manufacture of transport equipment. Gross production in this subsector grew by 12.2%, and total sales increased by 11.8%, in 2011. In 2011, export sales in this subsector increased by 12.5%, while domestic sales grew by 4.4%. In the first six months of 2012, export sales grew by 11.2%, and domestic sales increased by 2.8%. As a result, total sales increased by 10.5%, and gross production grew by 9.6%.
Energy. Energy imports in 2011 decreased by 8.2% compared to the previous year and amounted to 707.3 PetaJoule. The export of energy in 2011 increased by 9.7% compared to 2010 and amounted to 147.7 PetaJoule. The two most important energy products are oil and gas.
Energy, gas and water supply
In 2011, the total energy consumption amounted to 1,072 PetaJoule, which was 1.4% less than in 2010. Domestic energy production covered 39% of the total consumption, and imports covered 61%. The volume of domestic production decreased by 1.2% in 2011 compared to 2010. Production from renewable energy sources amounted to 18% of the total domestic production.
27
According to data compiled by the Hungarian Energy Office, in 2011 39.2% of Hungary’s total energy demand was supplied by domestic energy sources; 10.6% of the total energy consumed was produced from coal; and 64.6% of energy consumption consisted of hydrocarbon, which was imported primarily from Russia.
Hungary’s primary external source of energy is the gas and oil imported from Russia. In 2009, disputes between Russia and the Ukraine over the pricing of natural gas supplies and transit fees from Russia resulted in Russia’s cessation of natural gas deliveries to European Union countries, including Hungary, for approximately two weeks. Although Hungary primarily compensated for the energy shortage through its gas reserves, the service interruption had some adverse impact on certain sectors, including industrials.
Hungary is taking measures to reduce future disruptions in its energy supply by diversifying its external and internal energy sources and routes of delivery and further accumulating gas reserves. Hungary is currently maintaining a reserve of at least a 12-week supply of oil, in compliance with OECD requirements. A construction project that is currently under way would provide a direct gas pipeline from Russia to Hungary. In addition, the European Union is negotiating for the construction of a gas pipeline from the Caspian region, Middle East and Egypt, which, if completed, would provide a direct gas supply to Hungary. Also, Hungary operates a nuclear power plant and has some renewable energy sources, such as the ability to produce biomass and geothermal energy, as well as wind and solar energy, although its capacity for utilising hydropower is limited due to the geographic properties of Hungary. In an effort to reduce Europe’s dependence on imported energy sources, the European Commission has set target levels and dates for EU members to attain renewable energy sources, designating a 13% target for Hungary to achieve by 2020.
The Ministry of Transport, Telecommunication and Energy is also aiming to create and maintain a competitive electricity market and to fully liberalise the sector, in accordance with EU Directives. All of Hungary’s natural gas distribution companies, six electricity distribution companies and all but two of its power generation companies have been privatised.
The following table provides certain information regarding the composition of consumption of the main energy resources in Hungary in each of the years 2007 through 2011:
Composition of Consumption of Energy Resources
| | | | | | | | | | | | | | | | | | | | |
| | | 2007 | | | 2008 | | | 2009 | | | 2010 | | | 2011 | |
| | | | | | | | | (%) | | | | | | | |
Coal | | | 12.6 | | | | 12.1 | | | | 9.4 | | | | 10.2 | | | | 10.6 | |
Hydrocarbon | | | 67.5 | | | | 67.2 | | | | 68.1 | | | | 67.2 | | | | 64.6 | |
Of which: | | | | | | | | | | | | | | | | | | | | |
Crude oil and petroleum products | | | 27.5 | | | | 27.3 | | | | 31.5 | | | | 32.2 | | | | 33.4 | |
Natural gas | | | 40.0 | | | | 39.9 | | | | 35.8 | | | | 34.4 | | | | 31.2 | |
Other resources | | | 19.9 | | | | 20.7 | | | | 22.5 | | | | 22.6 | | | | 24.8 | |
| | | | | | | | | | | | | | | | | | | | |
Total | | | 100.0 | | | | 100.0 | | | | 100.0 | | | | 100.0 | | | | 100.0 | |
| | | | | | | | | | | | | | | | | | | | |
Of which: | | | | | | | | | | | | | | | | | | | | |
Domestic | | | 37.8 | | | | 38.5 | | | | 38.5 | | | | 37.4 | | | | 39.2 | |
Imports | | | 62.2 | | | | 61.5 | | | | 61.5 | | | | 62.6 | | | | 60.8 | |
Source: Hungarian Energy Office
28
Construction
In 2011, the output of the construction sector decreased by 7.9% compared to 2010, mainly as a result of a decline in the construction of dwellings and commercial and office buildings, and civil engineering works also decreased significantly. Compared to 2010, the construction of buildings fell by 11.5%, while civil engineering works decreased by 3.8%. The output of the construction sector in the first six months of 2012 fell by 10.1% compared to the same period in 2011, partly as a result of ailing home building activities. Civil engineering construction fell by 7.9% and building construction dropped by 12.0% in the first six months of 2012 compared to the corresponding period in 2011.
Service Industries
Gross value added by services decreased by 0.7% in 2011 and diminished by 0.1% in the first half of 2012. The fall in the services industry in 2012 as compared to 2011 was primarily the result of weakening domestic demand. In 2011, five out of eight subsectors contracted. The subsectors of (i) Transportation and storage; (ii) Information and communication; and (iii) Arts, entertainment and recreation, repair of household goods and other services increased by 0.7%, 2.2%, and 3.0%, respectively. The subsectors of (i) Wholesale and retail trade, repair of motor vehicles and motorcycles, accommodation and food service activities; (ii) Financial and insurance activities; (iii) Real estate activities; (iv) Professional, scientific and technical activities, administrative and support service activities; and (v) Public administration and defence, compulsory social security, education, human health and social work activities fell by 0.4%, 6.7%, 1.6%, 1.9% and 0.1%, respectively. In the first two quarters of 2012, the gross value-added in the services sector decreased by 0.1% compared to the corresponding period in 2011, as a result of ailing domestic demand. The subsectors of (i) Wholesale and retail trade, repair of motor vehicles and motorcycles, accommodation and food service activities; (ii) Transportation and storage; (iii) Financial and insurance activities; (iv) Real estate activities; and (v) Arts, entertainment and recreation, repair of household goods and other services decreased by 0.4%, 1.1%, 2.1%, 1.0% and 0.3%, respectively. The declines in these subsectors were mainly offset by the increases in the subsectors of (i) Information and communication; (ii) Professional, scientific and technical activities, administrative and support service activities; and (iii) Public administration and defence, compulsory social security, education, human health and social work activities of 3.8%, 0.1%, and 0.2%, respectively.
The following table sets forth the composition of the service industry per individual sub-sector for the periods indicated:
Composition of Service Industry per Sub-Sector
| | | | | | | | | | | | |
| | | | | | First
quarter of | | | Second
quarter of | |
| | | 2011 | | | 2012 | | | 2012 | |
Wholesale and retail trade; repair of motor vehicles and motorcycles; accommodation and food service activities | | | 17.8 | | | | 15.8 | | | | 17.9 | |
Transportation and storage | | | 8.9 | | | | 8.3 | | | | 8.7 | |
Information and communication | | | 8.7 | | | | 8.7 | | | | 8.5 | |
Financial and insurance activities | | | 7.1 | | | | 7.3 | | | | 6.9 | |
Real estate activities | | | 13.6 | | | | 13.9 | | | | 13.4 | |
Professional, scientific and technical activities; administrative and support service activities | | | 12.4 | | | | 13.1 | | | | 12.8 | |
29
| | | | | | | | | | | | |
Public administration and defence; compulsory social security; education; human health and social work activities | | | 26.9 | | | | 28.3 | | | | 26.9 | |
Arts, entertainment and recreation, repair of household goods and other services | | | 4.6 | | | | 4.5 | | | | 4.9 | |
Services, total | | | 100.0 | | | | 100.0 | | | | 100.0 | |
Source: CSO
Agriculture
The amount of harvested grain increased from 12.3 million tons in 2010 to 13.8 million tons in 2011 due to relatively favourable weather conditions. Production of maize amounted to 8.1 million tons, production of wheat amounted to 4.1 million tons. Among the grains, the average yield of maize increased by 1.9% compared to the previous year, but exceeded the average of the previous five years by 5.9%. The average yield of wheat grew by 13.5% compared to 2010. Compared to the 2006-2010 average, the average yield of wheat in 2011 increased by 4.0%. In 2011, the total amount of sugar beet, rapeseed and alfalfa hay harvest fell by 5.9%, 0.6% and 5.3%, respectively, and the amount of harvested sunflower and potatoes grew by 41.0% and 15.6%, respectively, compared to the harvested amounts in the year 2010.
In 2012, the harvested cereals amounted to 5.5 million tons, 2.0% lower then the amount of harvested cereals for the year 2011. The amount of harvested wheat fell by 3.3% and reached 4.0 million tons in 2012. The amount of harvested barley grew by 0.8% and reached 1.0 million tons in 2012. The amount of harvested oats grew by 8.7% and reached 0.1 million tons in 2012, and the amount of harvested triticale increased by 0.3% and reached 0.3 million tons in 2012.
Infrastructure
Hungary is a landlocked country and is located at the crossroads of several important transport corridors for the region. Three main roadways (forming part of the Trans-European Network), three corridor branches and various railways and waterways cross Hungary. With Budapest as a hub, several corridors connect Hungary to the Trans-European Network. Hungary plays a central role in international transport connections for Central and Eastern Europe and for South-Eastern Europe towards the West and the East. However, compared to Western European countries, the transportation network in Hungary is less developed, suffering from a shortage of bridges, a lack of transversal connections, poor quality in infrastructure and a low proportion of expressways.
As of the end of 2011, the national road network of Hungary was 31,698 km long.
In 2006, all infrastructure investments of the State Highway Management Company Limited by Shares (Állami Autópálya Kezelő Zrt.) (the “ÁAK Zrt.”) were assumed by National Motorway Company Limited by Shares (Nemzeti Autópálya Zrt.) (the “NA Zrt.”), currently National Infrastructure Developing Private Company Limited (Nemzeti Infrastruktúra Fejlesztő Zrt.) (the “NIF Zrt.”). Despite the public-private partnership (“PPP”) type financing plans, all investments were financed through bank loans, the majority of which were assumed by the central budget at the end of 2006.
In 2007, the Government changed its previous plan relating to “Programme Motorways” which was expected to be constructed by the ÁAK Zrt. using a PPP framework. The development of the road network became a state task, and the Government decided to finance the construction from the central budget. Infrastructure projects are managed by NIF Zrt., while the maintenance of motorways are the responsibility of ÁAK Zrt. Accordingly, a programme for the development of transportation for the years 2008 through 2013 was established that utilises both the sources derived from the New Development Plan and the PPP framework. In 2011, one new motorway section was completed (route M43 from Szeged to Makó).
Hungary has one international airport (Ferihegy International Airport in Budapest), which currently meets the majority of the air traffic needs of the country. Since May 2006, several transportation companies provided aerial transportation services between European cities and airports at Sármellék, Debrecen, Győr-Pér and Pécs-Pogány. In line with international trends, the traffic at Ferihegy International Airport has steadily increased over the last several years. Terminals 2A and 2B were integrated during the year 2011 with the new building of Skycourt.
30
Navigation is possible along 1,600 km of the rivers in Hungary. There is commercial navigation on the Danube River and, to a very limited extent, on the Tisza River.
The telecommunications sector’s level of development, in both wireline and wireless communication, approaches the average level of other EU members. However, compared to Western European countries, the internet connectivity is relatively low, the structure of the information-communications services market is not up-to-date and the proportion of broadband access is relatively low.
On October 4, 2010, a reservoir wall collapsed at the MAL Zrt. aluminium plant in Ajka, in the western region of Hungary, resulting in injuries and fatalities from the toxic waste spill. According to government estimates, the damage amounts to HUF 55 billion, or 0.2% of GDP. On October 6, 2010, the Government declared a state of danger for the area affected by the toxic waste spill. On October 12, 2010, the Government acquired temporary control of MAL Zrt. to mitigate the consequences of the accident and prevent further incident. A Government Commissioner was appointed to make immediate business decisions for, and manage the affairs of, MAL Zrt.
31
PRIVATISATION
Status of Privatisation Efforts
Since 1990, Hungary has privatised nearly 1,300 enterprises out of the 1,860 enterprises previously owned by the state. The Hungarian Privatisation and State Holding Company (Állami Privatizációs és Vagyonkezelő Zrt.) (“ÁPV Zrt.”) manages these sales.
Most of the larger companies involved in the privatisation programme have already been partially or fully privatised. Permanent government control is anticipated for 36 companies. The scope of property, which is required to remain state-owned in the long term, is defined by law as follows:
| | • | national public utility service providers; |
| | • | property or companies of strategic importance for the national economy; and |
| | • | property or companies that accomplish tasks or fulfil objectives for national defence or other special purposes. |
After two earlier attempts to privatise Malev Hungarian Airlines (“Malev”) in 1997 and 2007, respectively, on February 26, 2010, Hungary reacquired a 95% interest in Malev in order to provide financial stability to the Hungarian national airline following the bankruptcy of an indirect shareholder during the global economic crisis. Hungary was involved in the equity increase of Malev in part by purchasing new shares and in part by a non-capital contribution through the conversion of earlier debts. As a result, Hungary acquired a stake in the company with a total value of HUF 25.2 billion. On February 3, 2012, based on the resolution of its Board of Directors, Malev ceased its operation in order to minimize its losses. Malev has had financial struggles for several years and is reported to owe HUF 60 billion (USD 270 million) to lenders. On February 14, 2012, the Metropolitan Court of Budapest declared Malev insolvent and ordered the liquidation of the company.
On May 24, 2011, Prime Minister Viktor Orbán announced that the Hungarian state would buy a 21.2% stake of MOL (Hungarian Oil Company) from Surgutneftegas (a Russian energy company). Under a sale and purchase agreement, the Hungarian state paid EUR 1.88 billion to the seller, which corresponds to the average share price recorded during the last three months prior to the price agreement. The deal had no direct impact on Hungary’s public debt or the level of the budget deficit. The transaction became effective on June 25, 2011, when the relevant amendment of the Budget Act for the year 2011 went into effect and an affirmative resolution was adopted by the Parliament. The affirmative resolution was necessary because of the large value of the transaction. The purchase was settled on July 6, 2011.
In addition to the stake directly owned by the Hungarian state, the Pension Reform and Debt Reduction Fund currently owns a 3.39% stake of MOL, which shall be deemed as indirectly owned by Hungary. Hungary’s direct and indirect ownership of MOL totals 24.7%.
On June 9, 2011, the Government decided to sell Hungary’s 25% share of Budapest Airport to Hochtief AG for HUF 36.6 billion. The sale was completed on June 17, 2011.
Methods of Privatisation Used
Hungary is unique among Central European countries in that a large majority of its privatisations were conducted through public tenders, with sales for cash consideration. These outright sales, often to strategic long-term investors, were successful in bringing new management and know-how to many Hungarian enterprises. Public offerings played an important and successful role in the privatisation process.
In recent years, the importance of compensation vouchers has decreased significantly. Compensation vouchers were the rights distributed to individual Hungarian citizens under the Compensation Act, which was designed to provide compensation for losses suffered, including the loss of property and personal freedom. These compensation vouchers entitled the holders to bid for shares in certain privatised entities. In 2003, in order to end the compensation voucher system, the Government decided to offer the shares of
32
FORRÁS Trust and Investment Company (a state-owned asset management company) in exchange for the compensation vouchers. The offering was completed in June and July of 2003, and the shares of FORRÁS Trust and Investment Company were listed on the Budapest Stock Exchange.
33
BALANCE OF PAYMENTS AND FOREIGN TRADE
Balance of Payments
The following table sets out the balance of payments of Hungary for the periods indicated:
Balance of Payments(1)
| | | | | | | | | | | | | | | | | | | | | | | | | | | | |
| | | December 31, | | | First
Quarter
of | | | Second
Quarter
of | |
| | | 2007 | | | 2008 | | | 2009 | | | 2010 | | | 2011 | | | 2012 | | | 2012 | |
| | | (EUR millions) | | | | | | | |
I. Current account, credit | | | 87,667.2 | | | | 92,267.9 | | | | 77,442.7 | | | | 90,239.9 | | | | 98,142.8 | | | | 24,017.8 | | | | 24,924.7 | |
debit | | | 94,890.4 | | | | 100,019.6 | | | | 77,645.2 | | | | 89,206.9 | | | | 97,233.2 | | | | 24,024.8 | | | | 24,406.0 | |
net | | | (7,223.2 | ) | | | (7,751.7 | ) | | | (202.5 | ) | | | 1,033.0 | | | | 909.6 | | | | (7.0 | ) | | | 518.7 | |
1. Goods, net | | | (690.2 | ) | | | (1,208.1 | ) | | | 2,341.4 | | | | 3,214.7 | | | | 3,360.2 | | | | 994.7 | | | | 1,308.0 | |
1.1. Exports | | | 67,819.6 | | | | 72,096.2 | | | | 57,358.0 | | | | 68,977.8 | | | | 75,232.7 | | | | 18,968.7 | | | | 19,342.9 | |
1.2. Imports | | | 68,509.8 | | | | 73,304.3 | | | | 55,016.6 | | | | 65,763.1 | | | | 71,872.6 | | | | 17,974.1 | | | | 18,034.9 | |
2. Services total, credit | | | 12,575.0 | | | | 13,818.8 | | | | 13,309.4 | | | | 14,641.8 | | | | 15,587.0 | | | | 3,371.5 | | | | 3,836.4 | |
debit | | | 11,232.9 | | | | 12,301.9 | | | | 11,322.9 | | | | 11,709.5 | | | | 12,362.5 | | | | 2,785.6 | | | | 2,979.1 | |
net | | | 1,342.1 | | | | 1,516.9 | | | | 1,986.5 | | | | 2,932.3 | | | | 3,224.5 | | | | 585.9 | | | | 857.3 | |
3. Income, credit | | | 4,314.3 | | | | 4,550.6 | | | | 4,315.2 | | | | 4,188.2 | | | | 4,616.5 | | | | 1,101.9 | | | | 1,103.5 | |
debit | | | 11,686.1 | | | | 12,031.8 | | | | 9,250.1 | | | | 9,647.6 | | | | 10,771.8 | | | | 2,503.7 | | | | 2,821.9 | |
net | | | (7,371.7 | ) | | | (7,481.2 | ) | | | (4,934.9 | ) | | | (5,459.4 | ) | | | (6,155.3 | ) | | | (1,401.8 | ) | | | (1,718.4 | ) |
4. Current transfers, credit | | | 2,958.3 | | | | 1,802.4 | | | | 2,460.1 | | | | 2,432.2 | | | | 2,706.5 | | | | 575.7 | | | | 641.8 | |
debit | | | 3,461.7 | | | | 2,381.7 | | | | 2,055.7 | | | | 2,086.7 | | | | 2,226.2 | | | | 761.4 | | | | 570.0 | |
net | | | (503.4 | ) | | | (579.3 | ) | | | 404.5 | | | | 345.4 | | | | 480.3 | | | | (185.7 | ) | | | 71.8 | |
II. Capital account, credit | | | 1,031.8 | | | | 1,049.3 | | | | 1,723.9 | | | | 2,248.2 | | | | 2,474.3 | | | | 389.9 | | | | 476.3 | |
debit | | | 323.6 | | | | 33.2 | | | | 652.6 | | | | 557.2 | | | | 126.1 | | | | 56.5 | | | | 19.8 | |
net | | | 708.2 | | | | 1,016.1 | | | | 1,071.3 | | | | 1,691.0 | | | | 2,348.2 | | | | 333.4 | | | | 456.5 | |
5. Capital transfers, credit | | | 877.1 | | | | 928.1 | | | | 1,716.1 | | | | 2,229.3 | | | | 2,458.7 | | | | 389.3 | | | | 475.1 | |
debit | | | 88.2 | | | | 9.6 | | | | 47.1 | | | | 256.5 | | | | 15.3 | | | | 2.7 | | | | 4.4 | |
net | | | 788.9 | | | | 918.5 | | | | 1,669.0 | | | | 1,972.7 | | | | 2,443.4 | | | | 386.5 | | | | 470.6 | |
6. Acquisition/disposal of non-produced, non-financial assets, credit | | | 154.7 | | | | 121.2 | | | | 7.8 | | | | 18.9 | | | | 15.6 | | | | 0.6 | | | | 1.2 | |
debit | | | 235.3 | | | | 23.5 | | | | 605.6 | | | | 300.6 | | | | 110.8 | | | | 53.7 | | | | 15.3 | |
net | | | (80.6 | ) | | | 97.6 | | | | (597.8 | ) | | | (281.7 | ) | | | (95.2 | ) | | | (53.1 | ) | | | (14.1 | ) |
III. Financial account (2) | | | 6,662.7 | | | | 16,694.6 | | | | 4,942.6 | | | | 1,842.2 | | | | 2,196.3 | | | | (2,493.1 | ) | | | (1,531.3 | ) |
34
| | | | | | | | | | | | | | | | | | | | | | | | | | | | |
7. Direct investment, net | | | 209.3 | | | | 2,676.6 | | | | 128.2 | | | | 725.4 | | | | 118.5 | | | | 423.7 | | | | (611.6 | ) |
| 7.1. Abroad | | | (2,642.8 | ) | | | (1,514.1 | ) | | | (1,347.9 | ) | | | (956.9 | ) | | | (3,173.3 | ) | | | (3,387.8 | ) | | | (1,669.8 | ) |
| 7.1.1. Equity capital and reinvested earnings, net | | | (2,513.3 | ) | | | (1,530.2 | ) | | | (863.3 | ) | | | (1,026.3 | ) | | | (309.7 | ) | | | (6,330.1 | ) | | | (182.6 | ) |
| 7.1.1.1. Equity capital, net | | | (1,877.7 | ) | | | (2,235.7 | ) | | | (765.7 | ) | | | (935.9 | ) | | | (351.1 | ) | | | (6,266.1 | ) | | | (90.0 | ) |
| 7.1.1.2. Reinvested earnings, net | | | (635.6 | ) | | | 705.5 | | | | (97.7 | ) | | | (90.4 | ) | | | 41.4 | | | | (64.0 | ) | | | (92.6 | ) |
| 7.1.2. Other capital, net | | | (129.5 | ) | | | 16.1 | | | | (484.5 | ) | | | 69.3 | | | | (2,863.6 | ) | | | 2,942.3 | | | | (1,487.1 | ) |
| 7.1.2.1. Assets, net | | | (114.5 | ) | | | (149.6 | ) | | | (763.9 | ) | | | 128.4 | | | | (2,774.9 | ) | | | 3,055.4 | | | | (1,393.4 | ) |
| 7.1.2.2. Liabilities, net | | | (15.0 | ) | | | 165.7 | | | | 279.4 | | | | (59.1 | ) | | | (88.7 | ) | | | (113.1 | ) | | | (93.8 | ) |
| 7.2. In Hungary | | | 2,852.1 | | | | 4,190.7 | | | | 1,476.1 | | | | 1,682.4 | | | | 3,291.8 | | | | 3,811.5 | | | | 1,058.1 | |
| 7.2.1. Equity capital and reinvested earnings, net | | | 3,118.5 | | | | 4,166.8 | | | | (1,810.1 | ) | | | 2,967.6 | | | | 3,938.3 | | | | 1,171.3 | | | | (553.5 | ) |
| 7.2.1.1. Equity capital, net | | | 844.0 | | | | 3,271.7 | | | | (1,618.3 | ) | | | 3,130.5 | | | | 2,709.5 | | | | 958.5 | | | | 822.2 | |
| 7.2.1.2. Reinvested earnings, net | | | 2,274.5 | | | | 895.1 | | | | (191.8 | ) | | | (162.9 | ) | | | 1,228.8 | | | | 212.8 | | | | (1,375.7 | ) |
| 7.2.2. Other capital, net | | | (266.4 | ) | | | 23.9 | | | | 3,286.2 | | | | (1,285.2 | ) | | | (646.6 | ) | | | 2,640.2 | | | | 1,611.6 | |
| 7.2.2.1. Assets, net | | | (3,744.0 | ) | | | (2,270.4 | ) | | | (4,074.3 | ) | | | 304.9 | | | | (226.0 | ) | | | 2,109.9 | | | | 1,428.4 | |
| 7.2.2.2. Liabilities, net | | | 3,477.6 | | | | 2,294.3 | | | | 7,360.5 | | | | (1,590.1 | ) | | | (420.5 | ) | | | 530.3 | | | | 183.2 | |
8. Portfolio investment | | | (1,626.8 | ) | | | (2,530.8 | ) | | | (3,592.0 | ) | | | (138.0 | ) | | | 6,578.5 | | | | 406.2 | | | | (678.9 | ) |
8.1. Assets, net | | | (2,125.0 | ) | | | (2,516.8 | ) | | | (737.8 | ) | | | (376.4 | ) | | | 1,623.6 | | | | 131.0 | | | | 214.7 | |
8.1.1. Equity securities, net | | | (1,884.6 | ) | | | (2,191.4 | ) | | | (799.6 | ) | | | (505.7 | ) | | | 1,623.8 | | | | 178.9 | | | | 259.8 | |
8.1.2. Bonds and notes, net | | | (233.3 | ) | | | (319.8 | ) | | | 81.3 | | | | 117.4 | | | | 10.5 | | | | (53.9 | ) | | | (41.5 | ) |
8.1.3. Money market instruments, net | | | (7.1 | ) | | | (5.6 | ) | | | (19.5 | ) | | | 11.8 | | | | (10.7 | ) | | | 5.9 | | | | (3.6 | ) |
8.2. Liabilities, net | | | 498.2 | | | | (14.0 | ) | | | (2,854.2 | ) | | | 238.4 | | | | 4,954.9 | | | | 275.2 | | | | (893.6 | ) |
8.2.1. Equity securities, net | | | (3,634.9 | ) | | | (260.2 | ) | | | 504.2 | | | | (145.7 | ) | | | 226.0 | | | | 321.2 | | | | 277.7 | |
8.2.2. Bonds and notes, net | | | 4,054.1 | | | | 252.1 | | | | (3,505.8 | ) | | | (268.6 | ) | | | 3,167.5 | | | | (115.7 | ) | | | (307.5 | ) |
8.2.3. Money market instruments, net | | | 79.0 | | | | (5.9 | ) | | | 147.3 | | | | 652.7 | | | | 1,561.4 | | | | 69.7 | | | | (863.8 | ) |
9. Financial derivatives | | | 838.3 | | | | (671.4 | ) | | | 641.1 | | | | 624.9 | | | | (792.8 | ) | | | (232.8 | ) | | | (117.0 | ) |
9.1. Assets, net | | | 4,616.1 | | | | 7,888.4 | | | | 5,627.3 | | | | 4,919.1 | | | | 5,009.6 | | | | 1,325.8 | | | | 1,190.9 | |
9.2. Liabilities, net | | | (3,777.9 | ) | | | (8,559.7 | ) | | | (4,986.2 | ) | | | (4,294.2 | ) | | | (5,802.4 | ) | | | (1,558.6 | ) | | | (1,307.9 | ) |
10. Other investment, net | | | 7,242.0 | | | | 17,220.1 | | | | 7,765.3 | | | | 630.0 | | | | (3,707.9 | ) | | | (3,090.2 | ) | | | (123.9 | ) |
10.1. Assets, net | | | (3,911.3 | ) | | | (2,175.3 | ) | | | (423.6 | ) | | | 141.3 | | | | 1,740.8 | | | | 791.3 | | | | 1,838.4 | |
10.1.1. Short-term, net | | | (1,221.6 | ) | | | 981.7 | | | | (983.9 | ) | | | (1,175.8 | ) | | | 629.8 | | | | 726.1 | | | | 1,385.2 | |
10.1.2. Long-term, net | | | (2,689.7 | ) | | | (3,157.0 | ) | | | 560.3 | | | | 1,317.2 | | | | 1,111.0 | | | | 65.2 | | | | 453.2 | |
10.2. Liabilities, net | | | 11,153.3 | | | | 19,395.4 | | | | 8,188.9 | | | | 488.6 | | | | (5,448.7 | ) | | | (3,881.4 | ) | | | (1,962.3 | ) |
35
| | | | | | | | | | | | | | | | | | | | | | | | | | | | |
10.2.1. Short-term, net | | | 5,863.8 | | | | 2,737.6 | | | | (108.7 | ) | | | 3,807.6 | | | | (744.1 | ) | | | (2,103.7 | ) | | | (977.3 | ) |
10.2.2. Long-term, net | | | 5,289.4 | | | | 16,657.8 | | | | 8,297.6 | | | | (3,319.0 | ) | | | (4,704.6 | ) | | | (1,777.7 | ) | | | (985.0 | ) |
IV. Net errors and omissions | | | (13.5 | ) | | | (2,282.9 | ) | | | (325.4 | ) | | | (1,548.3 | ) | | | (1,580.5 | ) | | | (640.9 | ) | | | 1,045.8 | |
V. Overall balance | | | 134.2 | | | | 7,676.1 | | | | 5,485.9 | | | | 3,017.9 | | | | 3,873.6 | | | | (2,807.6 | ) | | | 489.8 | |
VI. International reserves | | | (134.2 | ) | | | (7,676.1 | ) | | | (5,485.9 | ) | | | (3,017.9 | ) | | | (3,873.6 | ) | | | 2,807.6 | | | | (489.8 | ) |
Source: NBH
Notes:
| (1) | In 2008 and 2010, there were methodological changes in the calculation of the balance of payments statistics, as discussed in further detail below. |
| (2) | Excluding international reserves. |
The current account surplus of EUR 1,033 million in 2010 decreased to EUR 910 million in 2011, largely due to an increase in the net outflow of incomes. During 2011, net direct investment was positive, and the net inflow was EUR 119 million.
In the first two quarters of 2012, the current account showed a sufficit of EUR 512 million compared to a sufficit of EUR 555 million in the first two quarters of 2011. See “—Foreign Direct Investment.”
Methodological Changes in Calculation of Balance of Payments Statistics
In 2010, Hungary implemented the methodological changes described below with respect to the calculation of the balance of payments statistics.
| | 1. | Changes in the balance of trade in goods resulting from a new method of delivery terms |
| | • | | The balance of payments method applies the value of goods at the customs border of the exporting country, while the primary source of data (i.e., the CSO’s foreign trade statistics) uses the prices charged for delivery at the Hungarian border (i.e., the value at the Hungarian border). While the two values are the same with respect to exports, the import value shown by the foreign trade sector is greater than what is required by the balance of payments method. Consequently, the import data compiled by the CSO is applied for the purposes of financial accounts following a terms of delivery adjustment. This is done in accordance with the means used for the GDP compilation, where turnover is credited by the value of goods as recorded at the border of the exporting country. |
In recent years, terms of delivery adjustment was carried out using an average adjustment factor at the national economy level in connection with financial accounts and GDP; however, the adjustment factor is reviewed from time to time due to changes in the structure of foreign trade. In 2009, the CSO and NBH launched the review process and the changes in the applied methodology. As a result, adjustments have been made in the financial accounts, reflecting higher import figures for the period from 2006 through 2010.
| | 2. | Retroactive data revisions |
| | • | | No direct sources of data are available for deposits made and loans borrowed abroad by Hungarian households. In 2010, a methodological change was implemented to retroactively adjust the statistics to reflect data (on an estimated basis) on deposits made and loans borrowed abroad by Hungarian households by using alternative data sources, including: |
| | • | | quarterly data from the monetary statistics of Oesterreichische Nationalbank and Deutsche Bundesbank on deposits and loans of Hungarian households; |
| | • | | annual data from the monetary statistics of the Swiss National Bank on deposits of Hungarian clients; |
36
| | • | | information supplied on the interest income of Hungarian private individuals by financial service providers, as well as information supplied to the Hungarian Tax and Financial Control Administration on the annual interest income of Hungarian private individuals pursuant to Council Directive 2003/48/EC; and |
| | • | | cumulative data from the balance of payment statistics and from previous cash-flow reports and carried over receivables and liabilities attributed to non-member states of the European Economic Area. |
| | • | | Changes to Hungary’s data collection system in 2008 resulted in a new method for estimating commercial loans. Prior to 2008, the current account primarily showed the CSO numbers for external trade, while the data for financial account originated from the CSO data shown under goods and were based on an algorithm created from cash-flow reports of banks made to NBH relating to goods. The new data collection system introduced in 2008 relies on CSO data under goods, using it as a data source in accordance with international standards. |
| | | Based on the data gathered by the revised data collection system, it was determined that the time series for the commercial loans obtained by the data collection system did not coincide with the new data reported. Consequently, it was necessary to modify the time series for commercial loans for the period from 2004 through 2008. The estimation relied on balance of payment statistics reported directly after 2008, as well as on the data on goods recorded in the current account. The estimate modified the time series for both trade credit receivables and trade credit debts. |
| | • | | Prior to 2008, the data collection system did not provide accurate information on declared but unpaid dividends, resulting in an accumulated debt for the period prior to 2008 relating to non-financial companies. After the introduction of the new data collection system, the NBH concluded that no additional debts resulted from approved and unpaid dividends and, accordingly, reduced the debts from approved and unpaid dividends that were recognized for the period from 2004 through 2008. |
| | 3. | Effects of a significant corporate restructuring during the fourth quarter of 2009 |
| | • | | In 2009, a restructuring by a multinational company of its Hungarian branch resulted in a revaluation of the branch in excess of its book value. For statistical recording purposes, the NBH approved the revaluated amount and recorded the data on the transactions and the international investment positions accordingly. Although the transaction has no impact on the total direct investments made in Hungary in the balance of payments statistics, the revalued amount shown under shares and other equity are recorded as net disinvestment (expenditure), while the inflow of capital of the same value appears under shares and equity and other capital transactions (as an increase in intra-group loan liabilities). In the statistics, the volume of direct investment in Hungary shows significant growth due to the overvaluation. The value of shares and other equity resulting from the above transactions and reflecting the new ownership structure does not differ significantly from the value prior to the revaluation. The difference between the original equity and the revalued capital is shown as a loan liability, as a result of which the intra-group loan liability increases significantly. |
37
Foreign Trade
The following tables set forth Hungary’s trade in goods by territory for the periods indicated:
Exports
| | | | | | | | | | | | | | | | | | | | | | | | | | | | |
| | | European
Union
countries | | | Non-EU
countries | | | Total | | | EU-15 | | | Countries
joining
the EU
after 2004 | | | Asian
countries | | | American
countries | |
| | | (EUR millions) | |
2007 | | | 54,588 | | | | 14,416 | | | | 69,004 | | | | 41,271 | | | | 13,317 | | | | 3,346 | | | | 2,047 | |
2008 | | | 57,504 | | | | 15,876 | | | | 73,380 | | | | 42,204 | | | | 15,300 | | | | 3,756 | | | | 2,194 | |
2009 | | | 46,652 | | | | 12,487 | | | | 59,139 | | | | 34,982 | | | | 11,670 | | | | 3,272 | | | | 1,799 | |
2010 | | | 55,305 | | | | 16,144 | | | | 71,449 | | | | 40,783 | | | | 14,522 | | | | 4,613 | | | | 2,143 | |
2011 | | | 60,879 | | | | 19,099 | | | | 79,978 | | | | 43,183 | | | | 17,696 | | | | 6,021 | | | | 2,364 | |
2012Q1 | | | 15,264 | | | | 4,708 | | | | 19,973 | | | | 10,978 | | | | 4,287 | | | | 1,330 | | | | 653 | |
2012Q2 | | | 15,328 | | | | 4,780 | | | | 20,108 | | | | 10,871 | | | | 4,457 | | | | 1,287 | | | | 788 | |
Source: CSO
| | | | | | | | | | | | | | | | | | | | | | | | |
| | | Food,
beverages,
tobacco | | | Crude
materials | | | Fuels,
electric
energy | | | Manufactured
goods | | | Machinery
and
transport
equipment | | | Total | |
| | | (EUR millions) | |
2007 | | | 4,320 | | | | 1,314 | | | | 2,003 | | | | 18,288 | | | | 43,079 | | | | 69,004 | |
2008 | | | 4,909 | | | | 1,726 | | | | 2,751 | | | | 19,498 | | | | 44,496 | | | | 73,380 | |
2009 | | | 4,271 | | | | 1,301 | | | | 1,523 | | | | 16,314 | | | | 35,729 | | | | 59,139 | |
2010 | | | 4,955 | | | | 1,732 | | | | 2,024 | | | | 19,724 | | | | 43,014 | | | | 71,449 | |
2011 | | | 6,020 | | | | 2,436 | | | | 2,898 | | | | 23,418 | | | | 45,205 | | | | 79,978 | |
2012Q1 | | | 1,541 | | | | 655 | | | | 787 | | | | 6,133 | | | | 10,857 | | | | 19,973 | |
2012Q2 | | | 1,633 | | | | 682 | | | | 752 | | | | 6,320 | | | | 10,720 | | | | 20,108 | |
Source: CSO
Imports
| | | | | | | | | | | | | | | | | | | | | | | | | | | | |
| | | European
Union
countries | | | Non-EU
countries | | | Total | | | EU-15 | | | Countries
joining
the EU
after 2004 | | | Asian
countries | | | American
countries | |
| | | (EUR millions) | |
2007 | | | 48,226 | | | | 20,898 | | | | 69,124 | | | | 38,548 | | | | 9,677 | | | | 11,815 | | | | 1,490 | |
2008 | | | 50,344 | | | | 23,356 | | | | 73,700 | | | | 39,541 | | | | 10,803 | | | | 11,778 | | | | 1,751 | |
2009 | | | 38,089 | | | | 17,313 | | | | 55,401 | | | | 29,617 | | | | 8,471 | | | | 9,846 | | | | 1,530 | |
2010 | | | 44,731 | | | | 21,203 | | | | 65,934 | | | | 33,718 | | | | 11,013 | | | | 12,154 | | | | 1,645 | |
2011 | | | 50,593 | | | | 22,324 | | | | 72,917 | | | | 37,254 | | | | 13,339 | | | | 10,589 | | | | 2,386 | |
2012Q1 | | | 12,790 | | | | 5,433 | | | | 18,223 | | | | 9,483 | | | | 3,307 | | | | 2,334 | | | | 691 | |
2012Q2 | | | 13,126 | | | | 5,070 | | | | 18,196 | | | | 9,782 | | | | 3,344 | | | | 2,275 | | | | 544 | |
Source: CSO
38
| | | | | | | | | | | | | | | | | | | | | | | | |
| | | Food,
beverages,
tobacco | | | Crude
materials | | | Fuels, electric
energy | | | Manufactured
goods | | | Machinery
and transport
equipment | | | Total | |
| | | (EUR millions) | |
2007 | | | 2,885 | | | | 1,169 | | | | 6,615 | | | | 22,197 | | | | 36,259 | | | | 69,124 | |
2008 | | | 3,422 | | | | 1,424 | | | | 9,393 | | | | 23,305 | | | | 36,155 | | | | 73,700 | |
2009 | | | 3,046 | | | | 897 | | | | 6,055 | | | | 17,893 | | | | 27,510 | | | | 55,401 | |
2010 | | | 3,270 | | | | 1,385 | | | | 7,064 | | | | 21,014 | | | | 33,201 | | | | 65,934 | |
2011 | | | 3,893 | | | | 1,871 | | | | 9,013 | | | | 24,370 | | | | 33,769 | | | | 72,917 | |
2012Q1 | | | 1,541 | | | | 655 | | | | 787 | | | | 6,133 | | | | 10,857 | | | | 19,973 | |
2012Q2 | | | 1,633 | | | | 682 | | | | 752 | | | | 6,320 | | | | 10,720 | | | | 20,108 | |
Source: CSO
Hungary’s foreign trade in goods with industrialized countries (in particular, EU countries) has increased in recent years. EU countries accounted for 76% and 76% of Hungary’s exports and 69% and 71% of imports in 2011 and the first six months of 2012, respectively.
Trade Policy
Hungary has taken a number of steps since the beginning of the 1990s to integrate its economy into the global trading system.
EU. Upon accession to the EU, Hungary adopted all aspects of the Common Commercial Policy of the EU. This includes the application of the Common External Tariff, EU preferential trade agreements and regimes, WTO commitments and trade defence measures. The overall effect of these changes is that the trade regime of Hungary has become more open and transparent (for example, the average level of customs duties decreased by about 50% following Hungary’s accession to the EU, and the country gained membership in the Agreement on Government Procurement, the Agreement on Trade in Civil Aircraft and the Information Technology Arrangement within the framework of the WTO). Further, by virtue of Hungary’s membership in the EU, it is also a member of the European Economic Area (“EEA”), along with Norway, Iceland, and Lichtenstein and the other EU-member countries.
Bilateral Trade Agreements. In addition to the multilateral trade agreements discussed above, Hungary has also entered into bilateral trade agreements with several countries, including Slovenia, Romania, Turkey, Israel, Bulgaria, Lithuania, Latvia and Estonia. Hungary has entered into trade and co-operation agreements with certain Central European countries designed to lower or eliminate trade barriers.
39
Foreign Direct Investment
The following table sets forth historical records of foreign direct investment (“FDI”) in Hungary and Hungarian direct investments abroad during the years indicated:
Foreign Direct Investment
| | | | | | | | | | | | | | | | | | | | | | | | | | | | |
| | | December 31, | | | First
quarter of | | | Second
quarter of | |
| | | 2007 | | | 2008 | | | 2009 | | | 2010 | | | 2011 | | | 2012 | | | 2010 | |
Direct investment | | | | | | | | | | | | | | | | | | | | | | | | | | | | |
Abroad | | | (2,642.8 | ) | | | (1,514.1 | ) | | | (1,347.9 | ) | | | (956.9 | ) | | | (3,173.3 | ) | | | (3,387.8 | ) | | | (1,669.8 | ) |
Equity capital and reinvested earnings, net | | | (2,513.3 | ) | | | (1,530.2 | ) | | | (863.3 | ) | | | (1,026.3 | ) | | | (309.7 | ) | | | (6,330.1 | ) | | | (182.6 | ) |
Other capital, net | | | (129.5 | ) | | | 16.1 | | | | (484.5 | ) | | | 69.3 | | | | (2,863.6 | ) | | | 2,942.3 | | | | (1,487.1 | ) |
In Hungary | | | 2,852.1 | | | | 4,190.7 | | | | 1,476.1 | | | | 1,682.4 | | | | 3,291.8 | | | | 3,811.5 | | | | 1,058.1 | |
Equity capital and reinvested earnings, net | | | 3,118.5 | | | | 4,166.8 | | | | (1,810.1 | ) | | | 2,967.6 | | | | 3,938.3 | | | | 1,171.3 | | | | (553.5 | ) |
Other capital, net | | | (266.4 | ) | | | 23.9 | | | | 3,286.2 | | | | (1,285.2 | ) | | | (646.6 | ) | | | 2,640.2 | | | | 1,611.6 | |
Net direct investment | | | 209.3 | | | | 2,676.6 | | | | 128.2 | | | | 725.4 | | | | 118.5 | | | | 423.7 | | | | (611.6 | ) |
Source: NBH
In 2007, the net FDI inflow was significantly lower than in previous years, partly as a result of a less favourable global investment environment. In 2008, the volume of net FDI increased to pre-2007 levels. In 2009, the volume of net FDI was close to zero, and the net inflow was EUR 128 million. The contraction in 2009 was primarily the result of credit constraints and deteriorating investor confidence and economic performance in Hungary as a result of the global financial crisis. In 2010, the volume of net FDI inflow was positive although modest compared to the volume in the years preceding 2006. In 2011, the volume of net FDI was close to zero, and the net inflow was EUR 119 million. As of December 31, 2011, the cumulative FDI was EUR 86.8 billion, which constituted 87% of the GDP in 2011. The first two quarters of 2012 showed a negative net direct investment.
40
The following table sets forth certain information regarding FDI in Hungary and Hungarian direct investments abroad during the six months ended June 30, 2012 as compared to the same period in 2011:
Foreign Direct Investment
| | | | | | | | | | | | |
| | | Six months ended June 30, | | | | |
| | | 2011 | | | 2012 | | | % | |
| | | (EUR millions) | | | change | |
Direct investment, net | | | (107.4 | ) | | | (187.9 | ) | | | 174.9 | |
Abroad, net | | | (262.2 | ) | | | (5,057.6 | ) | | | 1,928.6 | |
Equity capital and reinvested earnings, abroad, net | | | (88.6 | ) | | | (6,512.7 | ) | | | 7,347.0 | |
Equity capital, abroad, net | | | (206.2 | ) | | | (6,356.1 | ) | | | 3,081.9 | |
Reinvested earnings, abroad, net | | | 117.6 | | | | (156.6 | ) | | | (133.2 | ) |
Other capital, abroad, net | | | (173.6 | ) | | | 1,455.1 | | | | (838.2 | ) |
Assets, net | | | 69.2 | | | | 1,662.0 | | | | 2,402.1 | |
Liabilities, net | | | (242.8 | ) | | | (206.9 | ) | | | 85.2 | |
In Hungary, net | | | 154.8 | | | | 4,869.6 | | | | 3,145.8 | |
Equity capital and reinvested earnings, in Hungary, net | | | 2,488.5 | | | | 617.9 | | | | 24.8 | |
Equity capital, in Hungary, net | | | 1,347.9 | | | | 1,780.7 | | | | 132.1 | |
Reinvested earnings, in Hungary, net | | | 1,140.6 | | | | (1,162.9 | ) | | | (102.0 | ) |
Other capital, in Hungary, net | | | (2,333.7 | ) | | | 4,251.8 | | | | (182.2 | ) |
Assets, net | | | (979.0 | ) | | | 3,538.3 | | | | (361.4 | ) |
Liabilities, net | | | (1,354.7 | ) | | | 713.5 | | | | (52.7 | ) |
Source: NBH
During the six-month period ended June 30, 2012, the balance of net direct investment showed an outflow of EUR 188 million compared to the EUR 107 million net outflow during the same period of 2011.
Direct investment abroad in the first six months of 2012 generated a net outflow of EUR 5,058 million, while in the same period in 2011 direct investment abroad generated a net capital outflow of EUR 262 million. The increase of the outflow was primarily a result of the EUR 6,356 million net capital outflow with respect to net equity capital abroad in the first six months of 2012, while net equity capital abroad in the same period of 2011 generated EUR 206 million capital outflow. With respect to net other capital abroad, there was a net capital inflow of EUR 1,455 million in the first six months of 2012, while during the same period of 2012 the net capital outflow with respect to net other capital abroad amounted to EUR 174 million. In the first six months of 2012, there was a net capital outflow of EUR 157 million with respect to reinvested earnings abroad, while during the same period in 2011 there was a net capital inflow of EUR 118 million with respect to reinvested earnings abroad.
Direct investment in Hungary in the first six months of 2012 generated a net inflow of EUR 4,870 million, while in the same period in 2011 direct investment in Hungary generated a net capital inflow of EUR 155 million. The increase of the inflow was primarily a result of a net capital inflow with respect to net other capital in Hungary of EUR 4,252 million in the first six months of 2012, while during the same period in 2011, the net capital outflow with respect to net other capital in Hungary amounted to EUR 2,334 million. The EUR 1,781 million net capital inflow with respect to net equity capital movements in Hungary in the first six months of 2012, was higher than the net equity capital movements in Hungary in the same period of 2011, generating EUR 1,348 million capital inflow. In the first six months of 2012, there was a net capital outflow of EUR 1,163 million with respect to reinvested earnings in Hungary, while during the same period in 2011 there was a capital inflow of EUR 1,141 million with respect to reinvested earnings in Hungary.
In recent years, reinvested earnings in Hungary and FDI in the form of other capital have been relatively high, amounting to approximately half of the balance of net income on equities. Further, the increasing investment by Hungarian companies in the form of equity capital abroad has primarily been a result of certain Hungarian companies seeking to increase their footprint in the Central-Eastern European region generally.
41
Foreign Direct Investment by Industry(1)
FDI flows (equity capital) abroad by economic activity, net (excluding SPEs)
| | | | | | | | | | | | | | | | | | | | |
| | | 2007 | | | 2008 | | | 2009 | | | 2010 | | | 2011 | |
| | | (EUR millions) | |
AGRICULTURE, HUNTING AND FORESTRY | | | (0.9 | ) | | | 3.4 | | | | (0.2 | ) | | | (0.2 | ) | | | 0.0 | |
FISHING | | | 0.0 | | | | 0.0 | | | | 0.0 | | | | 0.0 | | | | 0.0 | |
MINING AND QUARRYING | | | 0.0 | | | | (0.1 | ) | | | 0.0 | | | | 0.1 | | | | 0.0 | |
MANUFACTURING | | | 673.1 | | | | 1088.1 | | | | 374.6 | | | | 18.5 | | | | 422.3 | |
of which: FOOD PRODUCTS; BEVERAGES AND TOBACCO | | | 1.6 | | | | 0.0 | | | | 0.0 | | | | 0.1 | | | | 0.0 | |
TEXTILES AND TEXTILE PRODUCTS | | | 0.1 | | | | 0.7 | | | | (1.0 | ) | | | 0.0 | | | | 0.0 | |
LEATHER AND LEATHER PRODUCTS | | | 0.0 | | | | 0.0 | | | | 0.5 | | | | 0.0 | | | | 0.0 | |
WOOD AND WOOD PRODUCTS | | | 0.0 | | | | 0.0 | | | | 0.2 | | | | 0.0 | | | | 0.0 | |
PAPER AND PAPER PRODUCTS; PUBLISHING AND PRINTING | | | 5.2 | | | | 19.9 | | | | 0.0 | | | | (2.3 | ) | | | 1.6 | |
COKE, REFINED PETROLEUM PRODUCTS AND NUCLEAR FUEL | | | 566.7 | | | | 927.3 | | | | 302.6 | | | | 42.6 | | | | 352.7 | |
CHEMICALS AND CHEMICAL PRODUCTS | | | 81.3 | | | | 55.0 | | | | 23.9 | | | | 409.6 | | | | 22.7 | |
RUBBER AND PLASTIC PRODUCTS | | | 3.4 | | | | 0.6 | | | | 7.0 | | | | 1.5 | | | | 5.3 | |
OTHER NON-METALLIC MINERAL PRODUCTS | | | 10.5 | | | | (6.6 | ) | | | 13.4 | | | | (7.6 | ) | | | 1.2 | |
BASIC METALS AND FABRICATED METAL PRODUCTS | | | 0.5 | | | | 9.7 | | | | 0.0 | | | | 0.5 | | | | 0.0 | |
MACHINERY AND EQUIPMENT | | | 0.0 | | | | 1.6 | | | | (0.8 | ) | | | (476.5 | ) | | | 0.3 | |
ELECTRICAL AND OPTICAL EQUIPMENT | | | 3.8 | | | | 79.9 | | | | 28.4 | | | | 140.6 | | | | 38.6 | |
TRANSPORT EQUIPMENT | | | 0.1 | | | | 0.1 | | | | 0.3 | | | | (90.0 | ) | | | 0.0 | |
MANUFACTURING NOT ELSEWHERE CLASSIFIED | | | 0.0 | | | | 0.0 | | | | 0.0 | | | | 0.0 | | | | 0.0 | |
ELECTRICITY, GAS AND WATER SUPPLY | | | 39.0 | | | | 17.2 | | | | 6.8 | | | | (218.2 | ) | | | 0.0 | |
CONSTRUCTION | | | 1.3 | | | | 0.9 | | | | 21.2 | | | | 1.7 | | | | 0.4 | |
SERVICES | | | 1093.4 | | | | 1125.4 | | | | 363.6 | | | | 1289.8 | | | | 102.1 | |
WHOLESALE AND RETAIL TRADE; REPAIR OF VEHICLES | | | 121.8 | | | | 165.9 | | | | (2.1 | ) | | | 28.5 | | | | 15.6 | |
HOTELS AND RESTAURANTS | | | (3.9 | ) | | | 0.0 | | | | 0.0 | | | | 0.0 | | | | 0.0 | |
TRANSPORT, STORAGE POSTAL SERVICES AND COMMUNICATION | | | 10.0 | | | | 29.4 | | | | 9.3 | | | | (60.9 | ) | | | 59.7 | |
FINANCIAL INTERMEDIATION | | | 216.6 | | | | 355.8 | | | | 66.1 | | | | 139.7 | | | | 118.9 | |
of which: MONETARY INTERMEDIATION | | | 199.1 | | | | 426.9 | | | | 72.9 | | | | 118.1 | | | | 146.2 | |
OTHER FINANCIAL INTERMEDIATION | | | (1.3 | ) | | | 32.1 | | | | (10.2 | ) | | | 15.2 | | | | (30.7 | ) |
INSURANCE COMPANIES, PENSION FUNDS | | | 13.8 | | | | (105.7 | ) | | | 3.4 | | | | 4.8 | | | | 3.4 | |
REAL ESTATE ACTIVITIES AND BUSINESS ACTIVITIES | | | 747.1 | | | | 567.4 | | | | 270.7 | | | | 1182.7 | | | | (92.1 | ) |
of which: REAL ESTATE | | | 19.4 | | | | 4.8 | | | | 44.6 | | | | 200.2 | | | | (17.9 | ) |
COMPUTER ACTIVITIES | | | 2.5 | | | | 31.2 | | | | (0.4 | ) | | | 11.8 | | | | 1.0 | |
OTHER BUSINESS ACTIVITIES | | | 724.5 | | | | 531.3 | | | | 226.5 | | | | 970.7 | | | | (75.2 | ) |
of which: MANAG. HOLDING COMPANIES | | | 659.9 | | | | 376.3 | | | | 230.0 | | | | 959.2 | | | | (33.2 | ) |
OTHER SERVICES | | | 1.8 | | | | 6.8 | | | | 19.6 | | | | (0.2 | ) | | | (0.1 | ) |
NOT ALLOCATED ECONOMIC ACTIVITY | | | 4.6 | | | | 0.0 | | | | 0.0 | | | | 0.0 | | | | 0.0 | |
PURCHASE AND SALE OF REAL ESTATE, DIRECT INVESTMENT OF HOUSEHOLDS ABROAD | | | 67.3 | | | | 0.8 | | | | (0.3 | ) | | | 0.1 | | | | (78.5 | ) |
TOTAL | | | 1877.7 | | | | 2235.7 | | | | 765.6 | | | | 1091.8 | | | | 446.3 | |
42
FDI flows (equity capital) in Hungary by economic activity, net (excluding SPEs)
| | | | | | | | | | | | | | | | | | | | |
| | | 2007 | | | 2008 | | | 2009 | | | 2010 | | | 2011 | |
| | | (EUR millions) | |
AGRICULTURE, HUNTING AND FORESTRY | | | 21.0 | | | | 2.7 | | | | 10.8 | | | | 35.2 | | | | 3.3 | |
FISHING | | | 0.0 | | | | 0.0 | | | | 0.0 | | | | 0.0 | | | | 0.0 | |
MINING AND QUARRYING | | | 26.7 | | | | 18.4 | | | | 77.1 | | | | 82.0 | | | | 9.3 | |
MANUFACTURING | | | 1,549.7 | | | | 143.2 | | | | (222.3 | ) | | | 439.6 | | | | (11,280.7 | ) |
of which: FOOD PRODUCTS; BEVERAGES AND TOBACCO | | | 30.7 | | | | 30.6 | | | | 76.0 | | | | (23.9 | ) | | | 7.6 | |
TEXTILES AND TEXTILE PRODUCTS | | | 8.3 | | | | 1.3 | | | | 0.2 | | | | (0.8 | ) | | | 0.7 | |
LEATHER AND LEATHER PRODUCTS | | | 0.3 | | | | (0.1 | ) | | | 7.6 | | | | 1.0 | | | | 0.0 | |
WOOD AND WOOD PRODUCTS | | | 0.2 | | | | (62.5 | ) | | | 20.5 | | | | 10.8 | | | | 5.3 | |
PAPER AND PAPER PRODUCTS; PUBLISHING AND PRINTING | | | 39.2 | | | | (12.0 | ) | | | 42.1 | | | | 8.4 | | | | (3.8 | ) |
COKE, REFINED PETROLEUM PRODUCTS AND NUCLEAR FUEL | | | 1,236.5 | | | | 0.0 | | | | 0.0 | ) | | | 0.0 | | | | (1,862.0 | ) |
CHEMICALS AND CHEMICAL PRODUCTS | | | (124.2 | ) | | | 11.1 | | | | 132.1 | | | | 58.4 | | | | 168.8 | |
RUBBER AND PLASTIC PRODUCTS | | | 130.1 | | | | (36.8 | ) | | | 19.9 | | | | 64.8 | | | | 51.6 | |
OTHER NON-METALLIC MINERAL PRODUCTS | | | 10.1 | | | | 32.9 | | | | 79.5 | | | | 257.2 | | | | 26.2 | |
BASIC METALS AND FABRICATED METAL PRODUCTS | | | 104.7 | | | | 28.9 | | | | 51.3 | | | | (194.2 | ) | | | (156.3 | ) |
MACHINERY AND EQUIPMENT | | | 0.6 | | | | 63.3 | | | | (1,034.8 | ) | | | (3.8 | ) | | | (43.4 | ) |
ELECTRICAL AND OPTICAL EQUIPMENT | | | 72.4 | | | | 59.1 | | | | 340.4 | | | | 289.0 | | | | (612.6 | ) |
TRANSPORT EQUIPMENT | | | 40.0 | | | | 27.2 | | | | 40.7 | | | | (47.3 | ) | | | (8,866.5 | ) |
MANUFACTURING NOT ELSEWHERE CLASSIFIED | | | 0.8 | | | | 0.2 | | | | 2.2 | | | | 19.9 | | | | 3.6 | |
ELECTRICITY, GAS AND WATER SUPPLY | | | (9.9 | ) | | | 57.2 | | | | 10.5 | | | | 99.4 | | | | 519.0 | |
CONSTRUCTION | | | 38.0 | | | | 145.3 | | | | 4.9 | | | | 18.4 | | | | 20.8 | |
SERVICES | | | (1,119.3 | ) | | | 2,644.8 | | | | (1,458.8 | ) | | | 2,393.8 | | | | 13,341.9 | |
WHOLESALE AND RETAIL TRADE; REPAIR OF VEHICLES | | | 22.8 | | | | (143.8 | ) | | | 325.9 | | | | 395.3 | | | | 308.2 | |
HOTELS AND RESTAURANTS | | | 19.7 | | | | 8.5 | | | | 25.9 | | | | 74.1 | | | | 5.5 | |
TRANSPORT, STORAGE POSTAL SERVICES AND COMMUNICATION | | | 7.2 | | | | 449.9 | | | | 203.4 | | | | 156.3 | | | | 222.3 | |
FINANCIAL INTERMEDIATION | | | 353.2 | | | | 761.1 | | | | 342.4 | | | | 308.6 | | | | 617.8 | |
of which: MONETARY INTERMEDIATION | | | 321.8 | | | | 113.6 | | | | 307.9 | | | | 176.9 | | | | 661.3 | |
OTHER FINANCIAL INTERMEDIATION | | | 13.9 | | | | 38.8 | | | | 19.7 | | | | 101.8 | | | | (58.8 | ) |
INSURANCE COMPANIES, PENSION FUNDS | | | 12.6 | | | | 605.2 | | | | 15.6 | | | | 9.4 | | | | 15.4 | |
REAL ESTATE ACTIVITIES AND BUSINESS ACTIVITIES | | | (1,539.2 | ) | | | 1,522.8 | | | | (2,360.4 | ) | | | 1,449.8 | | | | 12,258.2 | |
of which: REAL ESTATE | | | 205.8 | | | | 486.1 | | | | 215.5 | | | | 173.7 | | | | 39.3 | |
COMPUTER ACTIVITIES | | | 84.9 | | | | 11.8 | | | | (5.3 | ) | | | 10.8 | | | | 0.0 | |
OTHER BUSINESS ACTIVITIES | | | (1,831.3 | ) | | | 1,009.0 | | | | (2,576.9 | ) | | | 1,255.0 | | | | 12,211.9 | |
of which: MANAG. HOLDING COMPANIES | | | (2,481.7 | ) | | | 412.1 | | | | 686.6 | | | | 1,284.4 | | | | 2,643.8 | |
OTHER SERVICES | | | 17.0 | | | | 46.3 | | | | 4.0 | | | | 9.8 | | | | (70.2 | ) |
NOT ALLOCATED ECONOMIC ACTIVITY | | | 52.7 | | | | 0.0 | | | | 0.0 | | | | 0.0 | | | | 0.0 | |
PURCHASE AND SALE OF REAL ESTATE, DIRECT INVESTMENT OF HOUSEHOLDS ABROAD | | | 285.1 | | | | 260.1 | | | | 47.0 | | | | 47.6 | | | | 45.3 | |
TOTAL | | | 844.0 | | | | 3,271.7 | | | | (1,530.7 | ) | | | 3,116.0 | | | | 2,658.9 | |
43
The following table sets forth the composition of net FDI into Hungary according to the country of origin for the periods indicated:
Foreign Direct Investment by Country of Origin(1)
FDI flows (equity capital) abroad by the investments’ country, net (excluding SPEs)
| | | | | | | | | | | | | | | | | | | | |
| | | 2007 | | | 2008 | | | 2009 | | | 2010 | | | 2011 | |
| | | (EUR millions) | |
Europe | | | 1,774.1 | | | | 1,228.4 | | | | 251.2 | | | | (178.8 | ) | | | 550.5 | |
Albania | | | 0.0 | | | | 0.0 | | | | 0.0 | | | | 0.0 | | | | 0.0 | |
Austria | | | 26.8 | | | | 24.5 | | | | (33.8 | ) | | | 11.4 | | | | 7.6 | |
Belgium | | | 0.3 | | | | 0.1 | | | | 0.0 | | | | 0.0 | | | | 0.4 | |
Belarus | | | 0.0 | | | | 0.0 | | | | 0.0 | | | | 0.0 | | | | 0.0 | |
Bulgaria | | | 43.0 | | | | (46.0 | ) | | | 85.5 | | | | 13.2 | | | | 24.9 | |
Cyprus | | | 56.2 | | | | 162.7 | | | | (34.3 | ) | | | (14.5 | ) | | | 173.9 | |
Czech Republic | | | 46.8 | | | | 37.7 | | | | 1.5 | | | | 30.4 | | | | 4.5 | |
Denmark | | | 0.2 | | | | 0.0 | | | | 0.0 | | | | 0.0 | | | | 0.0 | |
United Kingdom | | | 646.9 | | | | (571.3 | ) | | | 0.0 | | | | 2.2 | | | | 0.0 | |
Estonia | | | 0.0 | | | | 0.0 | | | | (0.8 | ) | | | 0.8 | | | | 0.0 | |
Finland | | | 0.1 | | | | 0.0 | | | | 0.0 | | | | 0.0 | | | | 0.0 | |
France | | | (2.8 | ) | | | 1.5 | | | | 2.7 | | | | 100.8 | | | | 0.1 | |
Greece | | | 0.0 | | | | 0.0 | | | | 0.0 | | | | 0.0 | | | | 0.0 | |
Netherlands | | | 42.6 | | | | (656.2 | ) | | | 75.3 | | | | (61.0 | ) | | | 32.8 | |
Croatia | | | 57.3 | | | | 908.9 | | | | 31.5 | | | | (9.4 | ) | | | 139.9 | |
Iceland | | | 0.0 | ) | | | 0.0 | | | | 0.0 | | | | 0.0 | | | | 0.0 | |
Ireland | | | 0.0 | | | | 0.0 | | | | (0.1 | ) | | | 0.0 | | | | 0.0 | |
Poland | | | 3.2 | | | | 9.9 | | | | 4.0 | | | | 10.0 | | | | 18.5 | |
Latvia | | | 0.0 | | | | 0.0 | | | | (0.9 | ) | | | 0.8 | | | | 0.0 | |
Liechtenstein | | | 5.4 | | | | 0.0 | | | | 0.0 | | | | 0.0 | | | | 0.0 | |
Lithuania | | | 0.0 | | | | 0.0 | | | | (1.1 | ) | | | 1.3 | | | | 0.5 | |
Luxemburg | | | 114.0 | | | | 810.2 | | | | (19.1 | ) | | | (671.6 | ) | | | (28.3 | ) |
Macedonia | | | 0.0 | | | | 0.0 | | | | 0.0 | | | | 0.0 | | | | 0.0 | |
Malta | | | 0.0 | | | | 0.0 | | | | 0.0 | | | | 0.0 | | | | 0.0 | |
Montenegro | | | 5.9 | | | | 15.0 | | | | 15.0 | | | | 35.0 | | | | 10.0 | |
Germany | | | 32.0 | | | | 5.4 | | | | (0.3 | ) | | | (17.1 | ) | | | (2.1 | ) |
Norway | | | (0.4 | ) | | | 0.0 | | | | 0.0 | | | | 0.0 | | | | 0.0 | |
Italy | | | 470.9 | | | | 0.0 | | | | 1.3 | | | | 1.2 | | | | (1.4 | ) |
Russia | | | 33.6 | | | | 185.4 | | | | (4.9 | ) | | | (15.8 | ) | | | 4.0 | |
Portugal | | | 0.0 | | | | 0.0 | | | | 20.6 | | | | (3.2 | ) | | | (20.8 | ) |
Romania | | | 59.1 | | | | 34.9 | | | | 37.1 | | | | 108.5 | | | | 136.1 | |
Spain | | | (0.8 | ) | | | 4.5 | | | | 2.1 | | | | (8.3 | ) | | | 1.0 | |
Switzerland | | | 33.7 | | | | (1.3 | ) | | | 0.5 | | | | 255.9 | | | | 3.5 | |
Sweden | | | 0.3 | | | | 0.0 | | | | 0.0 | | | | (0.1 | ) | | | 0.0 | |
Serbia | | | 29.6 | | | | 17.3 | | | | 14.8 | | | | 6.1 | | | | 21.6 | |
Slovakia | | | 7.3 | | | | (44.1 | ) | | | (12.7 | ) | | | 4.8 | | | | 8.4 | |
Slovenia | | | 2.1 | | | | 152.6 | | | | 1.5 | | | | 4.1 | | | | 7.5 | |
Turkey | | | 0.0 | | | | 10.6 | | | | 0.3 | | | | 0.4 | | | | 4.9 | |
Ukraine | | | 40.9 | | | | 154.8 | | | | 65.0 | | | | 34.6 | | | | 2.8 | |
44
| | | | | | | | | | | | | | | | | | | | |
America | | | 23.8 | | | | 959.6 | | | | 277.8 | | | | 997.9 | | | | (33.4 | ) |
North America | | | 21.4 | | | | 1.5 | | | | (1.9 | ) | | | 42.8 | | | | (33.4 | ) |
United States | | | 21.2 | | | | 1.5 | | | | (1.9 | ) | | | 133.9 | | | | (33.4 | ) |
Canada | | | 0.3 | | | | 0.0 | | | | 0.0 | | | | (91.1 | ) | | | 0.0 | |
Central America | | | 2.2 | | | | 874.6 | | | | 235.8 | | | | 815.1 | | | | 0.0 | |
Mexico | | | 0.0 | | | | 0.0 | | | | 0.5 | | | | 0.0 | | | | 0.0 | |
South America | | | 0.2 | | | | 83.6 | | | | 44.0 | | | | 140.0 | | | | 0.0 | |
Argentina | | | 0.1 | | | | 5.2 | | | | 0.0 | | | | 1.6 | | | | 0.0 | |
Brazil | | | 0.1 | | | | 78.3 | | | | 44.0 | | | | 138.4 | | | | 0.0 | |
Chile | | | 0.0 | | | | 0.0 | | | | 0.0 | | | | 0.0 | | | | 0.0 | |
Columbia | | | 0.0 | | | | 0.0 | | | | 0.0 | | | | 0.0 | | | | 0.0 | |
Uruguay | | | 0.0 | | | | 0.0 | | | | 0.0 | | | | 0.0 | | | | 0.0 | |
Venezuela | | | 0.0 | | | | 0.0 | | | | 0.0 | | | | 0.0 | | | | 0.0 | |
Asia | | | 55.3 | | | | 34.1 | | | | 233.6 | | | | 266.0 | | | | 7.7 | |
Near and Middle East | | | 47.5 | | | | 29.6 | | | | 211.9 | | | | 103.1 | | | | 6.6 | |
Iran, Islamic Republic of | | | 0.0 | | | | 0.0 | | | | 0.0 | | | | 0.0 | | | | 0.0 | |
Israel | | | 47.3 | | | | 29.6 | | | | 0.2 | | | | 103.1 | | | | 6.4 | |
Other Asian Countries | | | 7.8 | | | | 4.5 | | | | 21.7 | | | | 162.9 | | | | 1.1 | |
South Korea | | | 0.0 | | | | (1.0 | ) | | | 0.3 | | | | 0.0 | | | | 0.0 | |
Philippines | | | 0.0 | | | | 0.0 | | | | 0.0 | | | | 0.0 | | | | 0.0 | |
Hong Kong | | | 0.0 | | | | 0.0 | | | | 0.0 | | | | 0.0 | | | | 1.0 | |
India | | | 0.0 | | | | 0.0 | | | | 0.0 | | | | 0.0 | | | | 0.0 | |
Indonesia | | | 0.0 | | | | 0.0 | | | | 0.0 | | | | 0.0 | | | | 0.0 | |
Japan | | | 6.5 | | | | 0.4 | | | | 0.0 | | | | 3.5 | | | | 0.0 | |
China | | | 1.0 | | | | 5.0 | | | | 2.5 | | | | 1.1 | | | | 0.1 | |
Malaysia | | | 0.0 | | | | 0.0 | | | | 18.9 | | | | 7.4 | | | | 0.0 | |
Singapore | | | 0.0 | | | | 0.0 | | | | 0.1 | | | | 150.8 | | | | 0.0 | |
Taiwan | | | (0.1 | ) | | | 0.0 | | | | 0.0 | | | | 0.0 | | | | 0.0 | |
Thailand | | | 0.0 | | | | 0.0 | | | | 0.0 | | | | 0.0 | | | | 0.0 | |
Africa | | | 3.7 | | | | 1.0 | | | | 0.0 | | | | 0.1 | | | | (0.8 | ) |
North Africa | | | 0.0 | | | | 0.0 | | | | 0.0 | | | | 0.0 | | | | 0.0 | |
Egypt | | | 0.0 | | | | 0.0 | | | | 0.0 | | | | 0.0 | | | | 0.0 | |
Morocco | | | 0.0 | | | | 0.0 | | | | 0.0 | | | | 0.0 | | | | 0.0 | |
Other African Countries | | | 3.7 | | | | 1.0 | | | | 0.0 | | | | 0.1 | | | | (0.8 | ) |
South Africa | | | 0.1 | | | | 0.0 | | | | 0.0 | | | | 0.0 | | | | 0.0 | |
Oceania & Polar Regions | | | 0.5 | | | | 0.0 | | | | 0.0 | | | | 0.0 | | | | 0.0 | |
Australia | | | 0.4 | | | | 0.0 | | | | 0.0 | | | | 0.0 | | | | 0.0 | |
New Zealand | | | 0.1 | | | | 0.0 | | | | 0.0 | | | | 0.0 | | | | 0.0 | |
International Organisations | | | 0.0 | | | | 0.0 | | | | 0.0 | | | | 0.0 | | | | 0.0 | |
Not allocated | | | 20.4 | | | | 12.6 | | | | 3.0 | | | | 6.6 | | | | (77.6 | ) |
Total | | | 1,877.7 | | | | 2,235.7 | | | | 765.6 | | | | 1,091.8 | | | | 446.3 | |
45
FDI flows (equity capital) in Hungary by the investors’country, net (excluding SPEs)
| | | | | | | | | | | | | | | | | | | | |
| | | 2007 | | | 2008 | | | 2009 | | | 2010 | | | 2011 | |
| | | (EUR millions) | |
Europe | | | 836.3 | | | | 2,836.4 | | | | (2,030.7 | ) | | | 2,838.1 | | | | (182.1 | ) |
Albania | | | 0.0 | | | | 0.0 | | | | 0.0 | | | | 0.0 | | | | 0.0 | |
Austria | | | 1,494.6 | | | | 1,199.6 | | | | (322.7 | ) | | | 465.8 | | | | 593.5 | |
Belgium | | | 76.2 | | | | 20.5 | | | | 136.7 | | | | 25.8 | | | | 40.1 | |
Belarus | | | 0.0 | | | | 0.0 | | | | 0.1 | | | | 0.0 | | | | 0.0 | |
Bulgaria | | | 0.2 | | | | 0.0 | | | | 0.0 | | | | 0.0 | | | | 0.0 | |
Cyprus | | | (96.5 | ) | | | 448.6 | | | | (19.7 | ) | | | 172.4 | | | | 91.7 | |
Czech Republic | | | 27.2 | | | | 5.1 | | | | (14.7 | ) | | | 13.8 | | | | 7.5 | |
Denmark | | | (3.5 | ) | | | 109.0 | | | | 117.4 | | | | 2.1 | | | | 0.0 | |
United Kingdom | | | (1,900.8 | ) | | | 2.2 | | | | 175.1 | | | | 132.2 | | | | 126.4 | |
Estonia | | | 0.0 | | | | 0.0 | | | | 0.0 | | | | 0.0 | | | | 0.0 | |
Finland | | | 8.3 | | | | 25.3 | | | | 13.8 | | | | 4.3 | | | | (686.4 | ) |
France | | | 71.9 | | | | 746.7 | | | | 126.1 | | | | 241.6 | | | | 56.3 | |
Greece | | | 0.8 | | | | 0.0 | | | | 0.0 | | | | 0.0 | | | | 0.0 | |
Netherlands | | | 310.8 | | | | 956.1 | | | | 514.6 | | | | 1,175.9 | | | | 999.0 | |
Croatia | | | 40.3 | | | | 5.3 | | | | (0.5 | ) | | | (89.9 | ) | | | 0.0 | |
Iceland | | | 0.1 | | | | 0.0 | | | | 0.0 | | | | 0.0 | | | | 0.0 | |
Ireland | | | 15.7 | | | | 5.6 | | | | 0.6 | | | | 0.0 | | | | (272.6 | ) |
Poland | | | 10.6 | | | | 37.5 | | | | 9.7 | | | | 32.6 | | | | 2.6 | |
Latvia | | | 0.1 | | | | 0.0 | | | | 0.0 | | | | 0.0 | | | | 0.0 | |
Liechtenstein | | | (18.3 | ) | | | 9.0 | | | | 42.5 | | | | (2.6 | ) | | | 2.8 | |
Lithuania | | | 0.5 | | | | 0.0 | | | | 0.0 | | | | 0.0 | | | | 0.0 | |
Luxemburg | | | 52.0 | | | | 233.7 | | | | (4,396.8 | ) | | | (455.2 | ) | | | 75.2 | |
Macedonia | | | 1.1 | | | | 0.0 | | | | 0.0 | | | | 0.0 | | | | 0.0 | |
Malta | | | 0.8 | | | | 0.0 | | | | 0.0 | | | | 0.0 | | | | (63.0 | ) |
Montenegro | | | 0.0 | | | | 0.0 | | | | 0.0 | | | | 0.0 | | | | 0.0 | |
Germany | | | 580.6 | | | | (667.6 | ) | | | 226.9 | | | | 542.7 | | | | 734.9 | |
Norway | | | 0.9 | | | | 9.2 | | | | 10.6 | | | | (1.4 | ) | | | 0.0 | |
Italy | | | 132.6 | | | | (97.3 | ) | | | 23.0 | | | | 83.1 | | | | 25.4 | |
Russia | | | 1.3 | | | | (671.5 | ) | | | 785.2 | | | | 1.2 | | | | (1,862.0 | ) |
Portugal | | | 71.8 | | | | 0.0 | | | | 11.9 | | | | 39.0 | | | | (50.7 | ) |
Romania | | | 0.6 | | | | 5.4 | | | | 98.1 | | | | 60.1 | | | | 15.6 | |
Spain | | | 233.4 | | | | 22.3 | | | | 88.3 | | | | (81.0 | ) | | | (86.2 | ) |
Switzerland | | | (311.0 | ) | | | 413.4 | | | | 450.2 | | | | 444.7 | | | | 114.6 | |
Sweden | | | 8.2 | | | | 5.9 | | | | 25.6 | | | | (29.8 | ) | | | (46.6 | ) |
Serbia | | | (0.1 | ) | | | 8.0 | | | | 3.5 | | | | 0.0 | | | | 0.0 | |
Slovakia | | | 1.1 | | | | (11.2 | ) | | | 3.4 | | | | 20.6 | | | | 0.0 | |
Slovenia | | | 3.9 | | | | 1.6 | | | | (1.2 | ) | | | (1.2 | ) | | | 0.0 | |
Turkey | | | 4.5 | | | | 0.9 | | | | (0.8 | ) | | | 0.0 | | | | 0.0 | |
Ukraine | | | 0.4 | | | | 0.0 | | | | 0.0 | | | | 0.0 | | | | 0.0 | |
46
| | | | | | | | | | | | | | | | | | | | |
America | | | (51.4 | ) | | | 320.8 | | | | 264.6 | | | | 228.7 | | | | 2,699.2 | |
North America | | | 61.2 | | | | (116.7 | ) | | | 97.1 | | | | 66.0 | | | | 96.3 | |
United States | | | 60.7 | | | | (152.8 | ) | | | (0.7 | ) | | | 118.0 | | | | 15.5 | |
Canada | | | 0.5 | | | | 36.1 | | | | 97.8 | | | | (52.0 | ) | | | 80.9 | |
Central America | | | (112.8 | ) | | | 435.8 | | | | 160.3 | | | | 157.7 | | | | 2,602.9 | |
Mexico | | | 0.0 | | | | 0.0 | | | | 0.0 | | | | 0.0 | | | | 0.0 | |
South America | | | 0.3 | | | | 1.7 | | | | 7.2 | | | | 5.0 | | | | 0.0 | |
Argentina | | | 0.1 | | | | 0.0 | | | | 0.0 | | | | 0.0 | | | | 0.0 | |
Brazil | | | 0.1 | | | | 0.0 | | | | 7.2 | | | | 0.0 | | | | 0.0 | |
Chile | | | 0.0 | ) | | | 0.0 | | | | 0.0 | | | | 0.0 | | | | 0.0 | |
Columbia | | | 0.0 | | | | 1.7 | | | | 0.0 | | | | 5.0 | | | | 0.0 | |
Uruguay | | | 0.0 | | | | 0.0 | | | | 0.0 | | | | 0.0 | | | | 0.0 | |
Venezuela | | | 0.1 | | | | 0.0 | | | | 0.0 | | | | 0.0 | | | | 0.0 | |
Asia | | | 13.8 | | | | 82.4 | | | | 203.2 | | | | 34.4 | | | | 162.6 | |
Near and Middle East | | | 14.3 | | | | (2.8 | ) | | | (9.9 | ) | | | (0.1 | ) | | | 0.0 | |
Iran, Islamic Republic of | | | 0.5 | | | | 0.0 | | | | 0.0 | | | | 0.0 | | | | 0.0 | |
Israel | | | 2.6 | | | | (7.4 | ) | | | (10.1 | ) | | | (0.5 | ) | | | 0.0 | |
Other Asian Countries | | | (0.5 | ) | | | 85.3 | | | | 213.1 | | | | 34.5 | | | | 162.6 | |
South Korea | | | 0.3 | | | | 1.6 | | | | 4.7 | | | | 10.7 | | | | 0.0 | |
Philippines | | | 0.0 | | | | 0.0 | | | | 0.0 | | | | 0.0 | | | | 0.0 | |
Hong Kong | | | (1.9 | ) | | | 1.8 | | | | 99.6 | | | | (10.0 | ) | | | 73.7 | |
India | | | 0.0 | | | | 0.0 | | | | 0.0 | | | | 0.0 | | | | 0.0 | |
Indonesia | | | 0.1 | | | | 0.0 | | | | 0.0 | | | | 0.0 | | | | 0.0 | |
Japan | | | (1.5 | ) | | | 17.4 | | | | 11.1 | | | | 11.0 | | | | 2.2 | |
China | | | 1.7 | | | | 0.9 | | | | 0.0 | | | | 9.9 | | | | 3.3 | |
Malaysia | | | 0.0 | | | | 64.3 | | | | (2.8 | ) | | | 0.0 | | | | (5.1 | ) |
Singapore | | | 0.1 | | | | (0.7 | ) | | | 100.4 | | | | 12.8 | | | | 88.5 | |
Taiwan | | | 0.0 | ) | | | 0.0 | | | | 0.0 | | | | 0.0 | | | | 0.0 | |
Thailand | | | 0.0 | | | | 0.0 | | | | 0.0 | | | | 0.0 | | | | 0.0 | |
Africa | | | (0.7 | ) | | | 29.0 | | | | 29.4 | | | | 7.0 | | | | (23.3 | ) |
North Africa | | | 0.0 | | | | 0.0 | | | | 0.0 | | | | (1.0 | ) | | | 0.0 | |
Egypt | | | 0.0 | | | | 0.0 | | | | 0.0 | | | | 0.0 | | | | 0.0 | |
Morocco | | | 0.0 | | | | 0.0 | | | | 0.0 | | | | (1.0 | ) | | | 0.0 | |
Other African Countries | | | (0.7 | ) | | | 29.0 | | | | 29.4 | | | | 8.0 | | | | (23.3 | ) |
South Africa | | | 0.0 | | | | 8.1 | | | | 24.9 | | | | 15.6 | | | | (23.3 | ) |
Oceania & Polar Regions | | | (0.4 | ) | | | 3.1 | | | | 2.8 | | | | 12.5 | | | | 2.5 | |
Australia | | | (0.3 | ) | | | 0.0 | | | | 0.0 | | | | 12.5 | | | | 2.5 | |
New Zealand | | | (0.1 | ) | | | 3.1 | | | | 2.8 | | | | 0.0 | | | | 0.0 | |
International Organisations | | | 0.0 | | | | 0.0 | | | | 0.0 | | | | (4.7 | ) | | | 0.0 | |
Not allocated | | | 46.3 | | | | 0.0 | | | | 0.0 | | | | 0.0 | | | | 0.0 | |
Total | | | 844.0 | | | | 3,271.7 | | | | (1,530.7 | ) | | | 3,116.0 | | | | 2,658.9 | |
Source: NBH
Note:
| (1) | Reinvested profits are not included. |
47
Foreign Exchange Reserves
The following table presents the level of Hungary’s gold and foreign exchange reserves as of the dates indicated:
Gold and Foreign Exchange Reserves
| | | | | | | | | | | | | | | | | | | | | | | | |
| | | December 31, | | | July 31, | |
| | | 2007 | | | 2008 | | | 2009 | | | 2010 | | | 2011 | | | 2012 | |
| | | (EUR millions) | |
International net gold reserves(1) | | | 55.8 | | | | 61.0 | | | | 75.9 | | | | 104.3 | | | | 119.3 | | | | 130.9 | |
Foreign exchange(2) | | | 16,329.7 | | | | 23,979.1 | | | | 30,600.5 | | | | 33,570.2 | | | | 38,644.3 | | | | 35,767.8 | |
| | | | | | | | | | | | | | | | | | | | | | | | |
Total | | | 16,385.5 | | | | 24,040.1 | | | | 30,676.4 | | | | 33,674.5 | | | | 38,763.6 | | | | 35,898.7 | |
| | | | | | | | | | | | | | | | | | | | | | | | |
Source: NBH
Notes:
| (1) | Gold valued at London rates fixed on the relevant date. |
| (2) | Consists of foreign currencies, including the counterparts of swapped gold, converted at exchange rates at the dates shown. |
48
MONETARY AND FINANCIAL SYSTEM
National Bank of Hungary
The NBH is the central bank of Hungary. The independence of the NBH and the members of its decision-making bodies in carrying out the tasks and meeting their obligations is provided for by Act LVIII of 2001 on the National Bank of Hungary (the “National Bank Act”). The NBH’s primary objective is to use monetary instruments to achieve and maintain price stability and, without prejudice to this objective, to support the economic policy of the Government. These instruments include:
| • | | setting the central bank base rate (the rate for the NBH’s main policy instrument, the two-week deposit facility) and the setting of rates for overnight deposit and lending facilities; |
| • | | establishing the minimum reserve requirements for commercial banks; |
| • | | conducting open market operations, which include sales and purchases of government securities from commercial banks and engaging in other similar transactions to regulate liquidity within the economy; and |
| • | | determining and implementing the exchange rate policy in agreement with the Government. |
The NBH is a company limited by shares, with a registered capital of HUF 10 billion. The NBH is wholly owned by Hungary and is regulated by the National Bank Act. The supreme body of the NBH is the General Assembly, and the Minister for National Economy (previously the Finance Minister) represents Hungary as the sole shareholder. The Monetary Council is the highest monetary policy decision-making body of the NBH. The Monetary Council holds meetings at least once every two weeks and makes the most important decisions concerning the general activities of the NBH, including the setting of the official interest rate.
In accordance with the latest regulation of the National Bank Act as amended in 2007, the number of Monetary Council members must be a minimum of five and maximum of seven. According to the new regulation, the Governor of the NBH, the Deputy Governors of the NBH and four other members can become a member of the Monetary Council. However, the other members of the Monetary Council nominated earlier are entitled to serve their term in office until the end of their respective mandates. Therefore, currently the Monetary Council consists of seven members.
On February 21, 2011, the Parliament adopted the amendment to Act LVIII of 2001 on the National Bank of Hungary, modifying the appointment procedure of the members of the Monetary Council (other than the Governor and the Deputy Governors of the NBH, who are members of the Council by virtue of their position). According to the amendment, the four Monetary Council members may be nominated by the Committee on the Economy and Information Technology (a Parliamentary committee) and elected by members of Parliament. The criteria for the appointment of Monetary Council members and the rules guaranteeing their independence with regards to tenure of office, grounds for dismissal and conflicts of interest remain unchanged. The amendment went into effect on February 25, 2011.
On December 30, 2011, the Parliament adopted the new Act on the National Bank of Hungary, which raised the number of Monetary Council members to a minimum of five and a maximum of nine, and set the number of Deputy Governors of NBH to a minimum of two and a maximum of three; prior to the adoption of the new Act on the National Bank of Hungary, the number of Deputy Governors of NBH was set at two. The Prime Minister proposes candidates for Deputy Governors, who are then appointed by the President. The Governor, the Deputy Governors and five other members elected by the Parliament constitute the Monetary Council.
On April 12, 2012 the European Central Bank announced that according to the European Central Bank, the amendment of the new Act on the National Bank of Hungary violated the independence of NBH. On April 17, 2012, the Government introduced a bill to amend this Act to the Parliament of Hungary. (In June 2012, such bill was withdrawn and a new bill was submitted on July 6, 2012.)
49
On April 17, 2012, the Government introduced an amendment to the New Constitution in the Parliament, proposing to abolish the provision of the New Constitution which allowed the merger of NBH and HFSA. Subsequently the amendment was approved by the Parliament on June 4, 2012 and entered into force on June 18, 2012.
As of July 17, 2012 the European Commission has formally closed the infringement procedure launched against Hungary on January 17, 2012, since the Hungarian Parliament adopted the new Bill on the amendment to the Central Bank Act on July 6, 2012.
Under the amendments, the Monetary Council will not be charged with executing its own decisions, will not decide on the scope of authority of deputy governors or determine the way its tasks are communicated. The amendment abolished the obligation of MNB to send the agenda of the Monetary Council to the government and also abolished the possibility of participation of a government representative on the Monetary Council’s meetings.
According to the amendment, the number of internal members (the governor and his deputies) may not reach the number of external members, while the number of external members may not reach the twice of the number of internal members.
On December 21, 2006, the NBH decided to issue two-week bonds instead of accepting two-week deposits. According to the evaluation of the NBH, the measure had no effect on the conduct of monetary policy. The reason for the change was to enhance the development of the financial sector and the liquidity management of the banks.
Monetary Policy
As set forth in Hungarian law, the NBH is responsible for achieving and maintaining price stability. In June 2001, the Monetary Council decided to conduct its monetary policy within the framework of inflation targeting, which is supplemented by an exchange rate regime using a wide fluctuation margin. See “Exchange Rate Policy.” The inflation target is 3% for each year following 2006. The NBH tolerates a deviation of plus or minus 1% from the inflation target.
The main monetary policy instrument used by the NBH to keep the rate of inflation within the target band is its two-week deposit facility. The NBH periodically accepts unlimited two-week deposits at the central bank base rate (i.e., the main official interest rate). Furthermore, the NBH reduces the volatility of overnight interest rates by maintaining an interest rate band around the central bank base rate. The width of the band is plus or minus 0.5% (the active overnight repo rate is 0.5% above and the passive overnight deposit rate is 0.5% below the official rate).
The following table sets forth indicative interest rates of the NBH as of the dates shown:
Selected Interest Rates
| | | | | | | | | | | | | | | | | | | | |
| | | December 31, | |
| | | 2007 | | | 2008 | | | 2009 | | | 2010 | | | 2011 | |
NBH base rate(1) | | | 7.5 | | | | 10.0 | | | | 6.25 | | | | 5.75 | | | | 7.00 | |
Real rate(2) | | | 0.7 | | | | 6.3 | | | | 0.6 | | | | 1.5 | | | | 2.8 | |
Sources: Central Statistical Office, NBH
Notes:
| (2) | The real rate is calculated as follows: (1 + central bank base rate)/(1 + year-on-year inflation rate as of year-end) – 1, where interest rates are expressed as decimal numbers. |
As of December 31, 2006, the central bank base rate stood at 8.00%. As inflation prospects improved in mid-2007, the NBH started to reduce the central bank base rate. As of December 31, 2007, the base rate was 7.50%. Since April 1, 2008, the NBH started raising the base rate gradually, due to higher inflation risks. On
50
October 22, 2008, NBH increased the central bank base rate by 300 basis points. In November 2008, NBH reduced the central bank base rate by 50 basis points, and in December 2008, the central bank base rate was reduced twice, by 50 basis points each time. As of December 31, 2008, the central bank base rate was 10.00%. During 2009, NBH cut the central bank base rate by 375 basis points. On December 31, 2009, the base rate stood at 6.25%. In the first half of 2010, NBH gradually cut the central bank base rate by 100 basis points. On each of November 30, 2010, December 21, 2010 and January 25, 2011, the Monetary Council raised the central bank base rate by 25 basis points, resulting in a base rate of 5.50%, 5.75% and 6.00%, respectively, due to upside risks to inflation. On each of November 30, 2011 and December 21, 2011, the Monetary Council raised the central bank base rate by 50 basis points, resulting in a base rate of 6.50% and 7.00%, respectively. On August 28, 2012, the Monetary Council decreased the central bank base rate by 25 basis points, resulting in a base rate of 6.75%. On September 25, 2012, the Monetary Council decreased the central bank base rate by 25 basis points, resulting in a base rate of 6.50%.
The Government and NBH set an inflation target of 3% plus or minus 1% for 2007 and thereafter. The annual average inflation for the year 2008 exceeded significantly the inflation target and amounted to 6.1%, mainly as a result of increasing global oil prices and rising food prices caused by poor harvest in 2007. The annual average inflation rate for 2009, 2010 and 2011 was 4.2%, 4.9% and 3.9%, respectively, and, according to the latest Quarterly Report on Inflation, published on June 28, 2012, there is a high probability of not achieving the 2012 inflation target. Although expected ailing domestic demand would push inflation downwards, the planned tax increases would increase inflation. In the Report on Inflation, the NBH estimated that the average annual inflation for 2012 and 2013 would be 5.3% and 3.5%, respectively, which is higher than the 3% long-term inflation target rate.
Since 2001, the NBH has also reformed the minimum reserves system. The required reserve ratio was reduced from 17% in 1995 to 5% in August 2002. The cut in the effective reserve ratio was intended to contribute to the narrowing of the spread between deposit and lending rates. In parallel with the reduction of the minimum reserves ratio, the NBH gradually increased the interest rate paid on the reserves. Since May 1, 2004 (the date of Hungary’s accession to the EU), the reserves carry an interest rate equal to the central bank base rate. This increase in interest on reserves was instituted with a view to increasing the profitability of the banks and to help eliminate the indirect taxation of banks in accordance with the guidelines of the European Central Bank (the “ECB”). On November 24, 2008, the Monetary Council decided to reduce the reserve ratio from 5% to 2% in order to support domestic credit institutions’ forint liquidity. The 2% reserve ratio applied by the NBH is equal to the reserve ratio applied by the ECB. On September 6, 2010, the Monetary Council decided all credit institutions subject to reserve requirements would be free to decide whether they want to satisfy their reserve requirements at the current 2% or a higher reserve ratio. Beginning with the November 2010 maintenance period, credit institutions subject to reserve requirements may choose a 2%, 3%, 4% or 5% reserve ratio, and they may alter their choice of the reserve ratio twice a year, in April and October. The method of calculating reserves will remain unchanged. Therefore, required reserves will be equal to the product of the reserve base and the chosen reserve ratio.
The NBH does not use money supply targets as an instrument of monetary policy. The money supply flexibly adjusts to the money demand, which is indirectly influenced by the monetary policy. Increases in monetary aggregates are slowing due to the decrease in the rate of inflation.
The following table provides information about the composition of the money supply as of the dates indicated:
Money Supply
| | | | | | | | | | | | | | | | | | | | | | | | |
| | | December 31, | | | As of
June 30, | |
| | | 2007 | | | 2008 | | | 2009 | | | 2010 | | | 2011 | | | 2012 | |
| | | (HUF billions) | |
M1(1) | | | 6,203 | | | | 5,962 | | | | 5,852 | | | | 6,635 | | | | 7,343 | | | | 6,787 | |
Deposits with agreed maturity of up to 2 years | | | 6,535 | | | | 8,196 | | | | 8,156 | | | | 7,716 | | | | 8,026 | | | | 7,795 | |
51
| | | | | | | | | | | | | | | | | | | | | | | | |
| | | December 31, | | | As of
June 30, | |
| | | 2007 | | | 2008 | | | 2009 | | | 2010 | | | 2011 | | | 2012 | |
| | | (HUF billions) | |
M2 (2) | | | 12,739 | | | | 14,158 | | | | 14,008 | | | | 14,351 | | | | 15,369 | | | | 14,583 | |
Repos and money market units | | | 1,269 | | | | 1,299 | | | | 1,729 | | | | 2,090 | | | | 2,049 | | | | 1,682 | |
M3 (3) | | | 14,007 | | | | 15,457 | | | | 15,737 | | | | 16,441 | | | | 17,418 | | | | 16,265 | |
Source: NBH
Notes:
| (1) | Consists of currency in circulation outside monetary financial institutions plus overnight deposits. |
| (2) | Consists of M1 plus deposits with fixed terms of up to two years. |
| (3) | Consists of M2 plus repos, money market funds and debt securities with maturities of up to two years. |
On February 25, 2008, in agreement with the Government, the Monetary Council decided to abandon the flexible peg of the forint to the euro within a fluctuation band and adopt a floating exchange rate regime, effective February 26, 2008. According to the Monetary Council, the floating exchange rate regime provides NBH with better conditions to achieve its inflation target and, therefore, meet the nominal convergence criteria to enter into the European Exchange Rate Mechanism II (“ERM II”).
In September 2008, real economic performance weakened sharply. Liquidity dried up in the financial markets and problems arose with the adequacy of bank capital, driven by a general lack of confidence, increasing risk aversion and a rapid de-leveraging of balance sheets. The deterioration in global investor sentiment in September and October 2008 had significant adverse effects on the Hungarian economy, and Hungarian foreign exchange, stock and government securities markets came under severe pressure.
As a consequence of deteriorating financial market conditions and the adverse economic environment, the Hungarian domestic banking sector was exposed to liquidity and solvency risks. The economic downturn and the depreciated forint exchange rate affected households’ ability to pay their mortgages and other debts, which are primarily denominated in foreign currency (especially Swiss francs (“CHF”)), causing a further decline in the quality of the loan portfolios of banks and leasing companies.
Since the decline of the global economy in 2008, the NBH has promoted a monetary policy to bolster its domestic banking sector. It has introduced new instruments to provide forint and foreign currency liquidity. The NBH has also broadened the range of eligible collateral for bank operations, extended the maturity of tenders for forint loans and FX swaps and reduced the mandatory reserve ratio. Other contributory factors to the continuing financial stability of the domestic banking sector include the access to liquidity resulting from the financial support package provided by the IMF and the EU, as well as the financial commitment provided by foreign banks to their Hungarian bank subsidiaries.
On October 10, 2008, the NBH announced the introduction of two-way O/N FX swap tenders. The NBH conducts its two-way FX swap tenders — providing euro and forint liquidity — under a competitive bidding scheme. On both sides, FX swaps are offered as an overnight facility. Auctions for the two sides are conducted simultaneously. Bids are evaluated such that the bid amounts accepted at the two auctions would be equal.
Moreover, the NBH and the ECB jointly announced an agreement to support the NBH’s instrument of euro liquidity provision. The NBH and the ECB have established an agreement on repurchase transactions, which will provide the NBH with a facility to borrow up to EUR 5 billion in order to provide additional support to the NBH’s operations.
In addition to these measures, effective October 16, 2008, the NBH introduced an overnight FX swap facility to provide euro liquidity until countermanded. Within the framework of the new standing facility, counterparties of the NBH may swap forint amounts for euro amounts on business days, at a pre-specified price. Also, the Monetary Council of the NBH introduced two new lending facilities. The first instrument is a weekly tender for two-week, fixed-rate secured loans for an unlimited amount. The second instrument is a regular tender for six-month, variable-rate secured loans, for a pre-specified amount.
52
The NBH also entered into an agreement with the primary dealers of government securities whereby the primary dealers undertook to provide continuous bid and offer prices on the Budapest Stock Exchange for all publicly issued forint-denominated government securities with residual maturities of more than 90 days and to increase their holdings of Hungarian government securities. The agreement expired at the end of 2008. In addition, the NBH bought government securities from primary dealers via auctions.
On October 22, 2008, the Monetary Council decided to narrow the interest rate corridor formed by the overnight deposit and collateralised lending facilities to plus or minus 50 basis points from the central bank base rate.
On November 4, 2008, the NBH and the Ministry of Finance sent a letter of intent to the IMF requesting that the IMF support the Government’s and the NBH’s programme to firmly anchor macroeconomic policies and reduce financial stress through a Stand-By Arrangement (“SBA”) for a period of 17 months in the amount of Special Drawing Rights (“SDRs”) SDR 10.5 billion (EUR 12.5 billion).
On November 24, 2008, the Monetary Council decided to reduce the reserve ratio from 5% to 2% in order to support domestic credit institutions’ forint liquidity. Effective December 2008, such reserve ratio was equal to the reserve ratio applied by the ECB.
On January 19, 2009, the NBH cut the central bank base rate by 50 basis points. The central bank base rate stood at 9.50% as of January 20, 2009. During the first three months of 2009, the forint weakened further, trading above the HUF 310/Euro level.
On January 28, 2009, the NBH announced that from February 2, 2009, until withdrawal, the NBH would introduce one-week, fixed price EUR/CHF FX swap tenders in order to provide Swiss franc liquidity. Under the tender scheme, certain credit institutions would be allowed to transact EUR/CHF FX swaps with the NBH at a fixed price on the first trading day of the week. In the starting leg of the transaction, the counterparty of the NBH would sell euros to the NBH in exchange for Swiss francs. The NBH would announce the fixed price expressed in swap points in advance. The NBH would accept bids up to EUR 5.0 billion.
On the same day, the Swiss National Bank (“SNB”) and the NBH announced the establishment of a temporary EUR/CHF swap agreement, which remained in place until the end of January 2010. The facility allowed the NBH to provide Swiss franc funding to banks in its jurisdiction in the form of foreign exchange swaps. Starting on February 2, 2009, the NBH joined the weekly EUR/CHF foreign exchange swap operations conducted under the umbrella of the SNB. Under the agreement, SNB provided the NBH with Swiss francs against the euro. The EUR/CHF swap operations would be conducted with a term of seven days at a fixed price.
Moreover, the NBH decided to broaden the range of counterparties eligible to participate in the six- month, variable-rate collateralised loan tenders.
On February 5, 2009, the NBH announced the introduction of a six-month EUR/HUF swap tender, providing euro liquidity on March 2009 up to EUR 5.0 billion.
The NBH extended the range of eligible collateral in lending to banks to include certain euro or Swiss franc denominated local authority bonds from February 20, 2009.
On March 2, 2009, the NBH announced that as of March 9, 2009, until further notice, the NBH would introduce a euro-liquidity providing three-month, variable-rate EUR/HUF FX swap tender to any amount remaining unallocated of the EUR 5.0 billion assigned to the purpose of the six-month EUR/HUF FX swap tenders.
On March 8, 2009, the NBH announced that it intended to encourage banks to increase their recourse to its forint and foreign currency liquidity-providing instruments that were newly introduced, that it would soon be converting EU funds in the market, and that it stood ready to use the full range of monetary policy instruments at its disposal.
53
On March 12, 2009, the NBH announced that, in line with the Monetary Council’s decision on March 8, 2009, the NBH would start converting the net current and capital transfers from the EU on the foreign exchange market. On the basis of the forecast of the Ministry of Finance, the NBH expected that the amount of net transfers from the EU to be converted would be approximately EUR 1.4 billion in 2009. The NBH would convert this amount on the interbank foreign exchange market in a discretionary manner over the course of the year as regular OTC transactions.
On October 20, 2009, the NBH cut the central bank base rate by 50 basis points.
On November 23, 2009, the NBH decided to widen the interest rate corridor around the central bank base rate from plus or minus 50 basis points to plus or minus 100 basis points, effective November 24, 2009. As a result, for NBH’s counterparties, the interest rate on the overnight deposit facility was 100 basis points lower, and on the overnight collateralised loan it was 100 basis points higher, than the central bank base rate. With the reduction in the central bank base rate to 6.5%, also effective November 24, 2009, the bank’s overnight standing deposit rate was set at 5.5% and the overnight collateralised loan rate was set at 7.5%. At the same time, the interest rate on the two-week central bank loan exceeded the policy rate by 50 basis points, i.e., it was set at 7.0%.
In December 2009, the Government introduced regulatory changes in an effort to enhance financial stability through more stringent regulation of the financial sector and lending practices. The Government implemented the following regulatory reforms:
| | • | | Legislation on strengthening the institutional framework for financial supervision was approved by the Parliament in December 2009. In line with this legislation, the HFSA was upgraded to an autonomous institution that is accountable to the Parliament and controls its budget and human resources. Also, the Financial Stability Council (“FSC”) was established for the purpose of providing continuous valuation of the markets supervised by the HFSA. The members of FSC are the Chairman of the HFSA, the Governor of the NBH and the Minister responsible for regulation of financial, capital and insurance markets, who is the Minister for National Economy. Legislation was also enacted granting the FSC and the NBH the right to propose regulations to the Government or to any member of the Government and to initiate parliamentary legislation at the Government on a “comply or explain” basis, i.e., Government officials are obliged either to adopt the proposal within 15 days, or to publicly explain the rationale for disagreeing with such proposal. |
| | • | | A set of amendments to the Law on Credit Institutions and Financial Enterprises was also enacted by the Parliament in December 2009. These amendments, among other things, establish a stricter regime for the removal of bank executives that no longer meet “fit and proper” criteria, stipulate an additional lower mandatory threshold for the appointment of a supervisory commissioner by the HFSA (i.e., the capital adequacy ratio falling below 4%), and clarify that only the HFSA has the power to initiate liquidation proceedings with respect to financial institutions. |
| | • | | Though large-scale defaults on household loans have been avoided, the Government developed separate regulations to reduce risks related to lending to households in foreign currency. These regulations prescribe lower loan-to-value ratios for foreign currency loans than for forint loans, and prescribe changes to banks’ scoring systems for the approval of household loans, which imply lower monthly instalments for foreign currency loans than for forint loans. The main restrictions introduced by these regulations are the following: |
| | | | | | | | |
| | | Currency | | | Ratio | |
For all types of household loans | | | | | | | | |
Maximum monthly payment-to-credit capacity(1) ratio | | | Euro | | | | 80 | % |
| | | Other currency | | | | 60 | % |
For household mortgages | | | | | | | | |
Maximum loan-to-value ratio | | | Forint | | | | 75 | % |
54
| | | | | | | | |
| | | Currency | | | Ratio | |
| | | Euro | | | | 60 | % |
| | | Other currency | | | | 45 | % |
For car purchase financing | | | | | | | | |
Maximum loan-to-value ratio | | | Forint | | | | 75 | % |
| | | Euro | | | | 60 | % |
| | | Other currency | | | | 45 | % |
Maximum maturity of car financing: 7 years | | | | | | | | |
Note:—
| (1) | Credit capacity is the maximum monthly repayment capacity of a given borrower in HUF and is to be determined in line with the in-house regulation of each bank. |
On January 18, 2010 the NBH announced that the Swiss National Bank, the European Central Bank, the Narodowy Bank Polski and the NBH would discontinue EUR/CHF foreign exchange swaps, whereby Swiss francs were provided against euros with a term of seven days. Demand for liquidity provided by this type of operation had declined and conditions in the Swiss franc funding market had improved. Therefore, the NBH conducted the last one-week EUR/CHF swap operation on January 25, 2010.
On January 25, 2010, the NBH cut the central bank base rate by 25 basis points, resulting in a rate of 6.00%.
On February 8, 2010, the NBH announced a new monetary policy tool to support the development of the domestic forint mortgage lending and mortgage bond markets (the “Mortgage Bond Purchase Programme”). The objective of the programme is to eliminate the barriers to the autonomous development of the mortgage bond market and thereby to enhance financial stability and the efficiency of the monetary transmission mechanism. Under the programme, the NBH purchases forint mortgage bonds and undertakes regulatory initiatives to develop the domestic forint mortgage lending market. In accordance with the Mortgage Bond Purchase Programme, the NBH buys domestically issued mortgage bonds listed as eligible collateral first in the secondary market and then in the primary market (up to a total notional value of HUF 100 billion).
The NBH made its first purchase of mortgage bonds under the programme in the Hungarian primary market on March 18, 2010. The NBH has indicated that it would purchase up to 20% of the bonds. Purchases by the NBH are subject to certain conditions aimed at enhancing the liquidity and transparency of the secondary mortgage bond market. Therefore, the NBH would buy parts of adequately sized mortgage bond issues in the primary market if the issuer proves that continuous market making in the bonds in the secondary market is ensured. For credit institutions undertaking market making in mortgage bonds, the NBH offers a mortgage bond lending facility on demand. All domestic credit institutions subject to reserve requirements are allowed to participate in the programme, provided that they satisfy the relevant technical requirements. The Mortgage Bond Purchase Programme expired as of December 31, 2010.
To date, the programme has resulted in positive developments. There was a significant narrowing in the interest differential between newly granted forint and foreign currency loans in recent months, resulting in improved competitiveness of forint mortgage loans. Consequently, a number of banks have introduced new forint-based mortgage lending products. Such improvements in the conditions for forint-based financing for banks and their customers marked the first step of the programme.
The NBH expects to undertake a number of other initiatives within the framework of the Mortgage Bond Purchase Programme to support the development of the forint mortgage lending market in 2010. The goal of such initiatives will be to enhance the transparency of mortgage loan products and to widen the range of institutions eligible to issue mortgage bonds.
On February 22, 2010 the NBH cut the central bank base rate by 25 basis points, resulting in a rate of 5.75%.
55
On March 29, 2010, the NBH cut the central bank base rate by 25 basis points, resulting in a rate of 5.50%.
On March 31, 2010, the NBH announced that, as of April 1, 2010, it would make available the mortgage bonds it purchased under the Mortgage Bond Purchase Programme for on-lending to domestic credit institutions with direct Real Time Gross Settlement System (“RTGS”) or Interbank Clearing System (“ICS”) membership that have entered into a written market-maker agreement.
On April 26, 2010, the NBH cut the central bank base rate by 25 basis points, resulting in a rate of 5.25%.
On November 30, 2010, the NBH raised the central bank base rate by 25 basis points, resulting in a rate of 5.50%.
On December 21, 2010, the NBH raised the central bank base rate by 25 basis points, resulting in a rate of 5.75%.
On January 25, 2011, the NBH increased the central bank base rate by 25 basis points, resulting in a rate of 6.00%.
On March 1, 2011, the mandate of four members of the Monetary Council expired. As a result the number of Monetary Council members temporarily dropped to three.
On March 7, 2011, the Parliament appointed two new members of the Monetary Council. Mr. Ferenc Gerhardt and Ms. Andrea Bártfai-Mager took their positions on March 21, 2011 and the number of Monetary Council members temporarily increased to five.
On March 21, 2011, the Parliament appointed two new members to the Monetary Council. Dr. János Béla Cinkotai assumed his position on March 22, 2011. Dr. György Kocziszky assumed his position on April 5, 2011, and the number of Monetary Council members increased to seven.
On September 20, 2011 Mr. András Simor, governor of NBH announced that according to the estimate of NBH, approximately one-fifth of foreign exchange mortgage loans of the households would be repaid at the fixed rate and NBH is ready to use the foreign exchange reserve via FX swap agreements concluded with Hungarian banks.
Subsequently, on September 30, 2011 the NBH announced that it would hold tenders to sell Euros on a weekly basis, and more frequently if needed. The banks eligible to enter the tender receive the allotted amount in Euros via a FX swap agreement. The FX swap would be rolled over on a daily basis. The rollover amount would be reduced by the amount of fixed rate repayment of the given bank. The bank is obliged to provide certain data to NBH, and to repay the short-term liabilities (with maturity below one year) first in case the bank reduces its liabilities as a consequence of fixed rate repayment.
On November 30, 2011, the NBH increased the central bank base rate by 50 basis points, resulting in a rate of 6.50%.
On December 21, 2011, the NBH increased the central bank base rate by 50 basis points, resulting in a rate of 7.00%.
Recent Developments in Monetary Policy
On February 15, 2012 the NBH announced that the NBH was prepared to offset the recent weakening in banks’ capacity to lend by introducing a two-year collateralised credit facility and a new universal mortgage bond purchase scheme and by expanding the range of eligible collateral.
According to the announcement the NBH intended to provide two-year variable-rate refinancing to credit institutions at its prevailing policy rate against securities delivered as collateral. The conditions for the provision of such refinancing had been designed to facilitate an expansion in bank lending to the corporate
56
sector. The new instrument conforms to international practice adopted to offset a weakening in the banking sector’s capacity to lend and allows banks to access to financing at maturities of limited availability in the market without the need to pay a term premium on longer-term funding. By providing a long-term lending facility, the NBH expected to contribute to a strengthening in banks’ balance sheets through an improvement in the maturity match between assets and liabilities, which in turn may offset the decline in lending activity.
In addition the NBH intended to promote lending to the household sector by introducing a universal mortgage bond purchase scheme. According to the statement mortgage bonds are a key factor contributing to an improvement in the maturity match between assets and liabilities. In the view of NBH, a universal structure for mortgage bond issuance may foster the development of a more efficient mortgage bond market. However, the benefits of the model change can only be realised if banks have adequate potential and willingness to issue mortgage bonds. Based on the experiences drawn from the previous programme in 2010, the NBH is able to effectively improve banks’ access to funding related to HUF mortgage lending via purchases in the primary market if an amendment to the regulation giving all credit institutions the right to issue mortgage bonds, drawn up in agreement with the Government, is passed by Parliament.
In addition to the above, by expanding the range of eligible collateral the NBH can alleviate liquidity constraints potentially impeding lending to the corporate and household sectors through an increase in banks’ liquidity buffers. According to the statement, extending the right to issue mortgage bonds may be an important support in this area, as a result of an increase in the outstanding amount of mortgage bonds accepted as eligible collateral. Linking the minimum credit rating limit for bank and corporate bonds to the lower rating of government debt instead of the current ���BBB-’ was expected to result in a further easing in conditions.
On August 28, 2012, the NBH cut the central bank base rate by 25 basis points resulting in a rate of 6.75%.
On September 25, 2012, the NBH cut the central bank base rate by 25 basis points resulting in a rate of 6.50%.
Exchange Rate Policy
According to the National Bank Act, the NBH and the Government jointly determine the framework of the exchange rate regime. The NBH then decides on the exchange rate policy within that framework. As a result of a joint decision in May 2001, the forint was “pegged” to the Euro such that the exchange rate was permitted to shift against the Euro in either direction by up to 15% against the central parity, which was set to HUF 276.1/Euro in May 2001. In combination with the adoption of the inflation targeting framework in June 2001, these policies were consistent with the primary objective of the NBH of achieving and maintaining price stability. These changes allowed the NBH greater flexibility to resume an anti-inflationary policy. However, on February 25, 2008, in agreement with the Government, the Monetary Council of the NBH decided to abandon the flexible peg of the forint to the Euro within a fluctuation band and adopt a floating exchange rate regime. According to the Monetary Council, the floating exchange rate regime provides NBH with better opportunity to achieve its inflation target and, through this, to meet the nominal convergence criteria and enter into ERM II.
In the first half of 2007, the forint fluctuated around HUF 250/Euro. By mid-2007, the forint depreciated to HUF 260/Euro, mainly as a result of the subprime crisis. By the end of 2007, the forint traded around HUF 255/Euro.
In the first two months of 2008, the forint depreciated further, reaching HUF 265/Euro, and in October 2008, it reached HUF 275/Euro. The weakening of the forint was mainly a result of the low global liquidity and worsened global investor sentiment. In response, the NBH increased the central bank base rate by 300 basis points. The rate hike prevented the forint from further depreciation, and it stabilized until the end of 2008 at HUF 275/Euro. As of December 31, 2008, the forint traded at HUF 265/Euro.
57
In the spring of 2009, the forint weakened further as a result of the ongoing negative impact of the global financial crisis and global economic slowdown. In March 2009, the forint weakened to HUF 315/Euro. In the second quarter of 2009, the forint strengthened as a result of a relatively high central bank base rate, decreasing expected Hungarian fiscal and current account deficit and improving global economic growth expectations. By July 2009, the forint strengthened to HUF 266.43/Euro.
However, in the second half of 2009 and the first quarter of 2010, the forint fluctuated around HUF 270/Euro. After the general elections of April 2010, the forint weakened as a result of the ongoing negative effects of the global crisis and increased uncertainty concerning the future Hungarian economic policy. In the second half of 2010, the forint fluctuated around HUF 280/Euro. As of December 31, 2010, the HUF/Euro exchange rate was HUF 278.75/Euro.
During the first eight months of 2011, the forint fluctuated between HUF 260/Euro and HUF 280/euro levels. During the last four months of the year, the forint weakened significantly partly as a result of unfavourable global investor sentiment. As of December 31, 2011, the HUF/Euro exchange rate was HUF 311.13/Euro.
In the first eight months of 2012 the forint strengthened significantly, partly as a result of favourable global investor sentiment. As of October 1, 2012, the HUF/Euro exchange rate was HUF 284.86/Euro.
Foreign Exchange and Convertibility of the Forint
Since 1996, Hungarian foreign exchange regulations have been consistent with the convertibility standards of Article VIII of the IMF and with the regulations of the OECD.
Since January 1998, Hungarian residents have been able to purchase shares and debt instruments with a maturity of at least one year issued by all OECD-based issuers, and non-residents have been able to issue such instruments denominated in foreign currency in the Hungarian securities market. Hungarian companies and individuals have also been able to receive foreign exchange denominated loans with a maturity of more than one year (with certain reporting obligations) and have been able to take out foreign exchange denominated loans with a maturity of less than one year, with approval from the NBH.
In accordance with the continuing liberalisation of restrictions on capital movements in recent years, the forint has been fully convertible since June 2001, both in terms of current transactions and capital transactions. All principal restrictions relating to foreign investment have been removed: non-residents have unrestricted access to Hungarian short-term securities, HUF-denominated accounts and the onshore derivatives market, and residents have unrestricted access to offshore financial services and short-term foreign securities. Certain minor restrictions have remained, the principal objectives of which are the prevention of money laundering. The full convertibility of the forint meets all current EU requirements.
The Hungarian Banking System
In April 2000, the supervisory agencies for commercial banks, investment activities, pension funds and insurance activities were integrated under one single agency – the HFSA (in Hungarian: Pénzügyi Szervezetek Állami Felügyelete). However, there are separate legislative regimes for banking, insurance, pension funds and investment services. Currently, the laws for insurance, banking and pension funds are well established and generally comply with all applicable EU directives and regulations.
Since 1991, Hungary’s banking system has been subject to a regulatory and supervisory framework based on principles and guidelines of the BIS. Act CXII of 1996 on Credit Institutions and Financial Enterprises (the “Credit Institutions Act”), in effect since January 1, 1997, endeavours to facilitate harmonisation of the Hungarian banking system with EU uniform banking standards.
Supervision of the Hungarian Banking System
Supervision of banking activities in Hungary has improved as the banking system has developed. The NBH supervisory responsibilities have largely been transferred to the HFSA, with the NBH retaining a more limited supervisory role.
58
Role of the NBH
While the NBH has no legal obligation to support Hungary’s credit institutions, the NBH may serve as a lender of last resort to credit institutions that encounter temporary liquidity difficulties.
Role of the Hungarian Financial Supervisory Authority
Other than credit institutions having their seat in an EU member state (which are regulated by their respective home supervisory authority) all financial institutions operating in Hungary are required to procure a license from the HFSA before they may establish themselves, commence operations, establish a representative office or a subsidiary abroad, elect its management, acquire shares representing a qualifying holding (10%) or terminate its operations.
The HFSA is responsible for verifying compliance by credit institutions operating in Hungary with the Credit Institutions Act and applicable banking regulations. The HFSA is entitled to impose various sanctions on credit institutions, including issuing warnings of non-compliance, withdrawing licenses, instituting liquidation proceedings and imposing fines on credit institutions and the managers of such credit institutions.
Banking Regulations
The president of the HFSA has the power to issue regulatory decrees in the scope set forth in Act CLVIII of 2010 on the Hungarian Financial Supervisory Authority, in Act CXX of 2001 on the Capital Markets (the “Capital Markets Act”) and the Credit Institutions Act. The Capital Markets and the Credit Institutions Act and Act CXXXVIII of 2007 on Investment and Commodity Exchange Service Providers and their Activities also set forth matters upon which the government or Minister for National Economy may issue regulatory decrees.
The Credit Institutions Act requires Hungarian credit institutions to maintain a solvency ratio of 8%. Pursuant to its authority under the Credit Institutions Act, the Finance Minister has issued a decree on the calculation of the solvency ratio. The decree adopts BIS standards prescribing how the ratio of a bank’s regulatory capital and risk-weighted assets (on- and off-balance sheet items) must be calculated. In addition, the Finance Minister has issued decrees requiring credit institutions to create provisions based both on the quality of their assets (which include loans, investments and off-balance sheet items) and on certain foreign country risks present in their assets.
Portfolio risk provisions are calculated by categorizing the assets of a credit institution into the following categories: standard, watch, sub-standard, doubtful and bad. Assets are placed in the categories based on the performance of the asset and the financial condition of the debtor. Provisions are made based on the asset category: for standard assets, 0%; for watch assets, 0% to less than or equal to 10%; for sub-standard assets, greater than 10% to less than or equal to 30%; for doubtful assets, greater than 30% to less than or equal to 70%; and for bad assets, greater than 70% to 100%.
Hungary has harmonised its guidelines on capital adequacy requirements for investment firms and commercial banks with EU Council Directive 93/6/EEC on the capital adequacy of investment firms and credit institutions. The adaptation of EU Directive 2006/48 and EU Directive 2006/49 (Basel II) was finalized in early 2008. Individual banks are required to create their own guidelines, which are to be reviewed annually.
Structure of the Hungarian Banking System
The Credit Institutions Act provides for three types of credit institutions:
| | • | | banks (credit institutions that may provide the full range of financial services); |
| | • | | specialised credit institutions (credit institutions that provide special activities, for example, mortgage banks or the Hungarian Development Bank Ltd. (the “MFB”)); and |
| | • | | co-operative credit institutions (credit co-operatives and savings co-operatives). |
59
Only credit institutions are entitled to collect deposits from the public and provide money transmission services. In addition, banks are entitled to provide the full range of financial services listed in the Credit Institutions Act, including making loans, issuing guarantees, trading foreign currencies, issuing bank cards and providing depository services. Banks may also engage, for their own account or for the accounts of customers, in trading in government and corporate securities and derivatives, and may also provide investment services. The total assets of the credit institutions amounted to HUF 28,797.3 billion and HUF 26,804.7 billion as of December 31, 2011 and June 30, 2012, respectively.
The following table illustrates certain trends in the Hungarian banking system for the periods indicated:
Banking System – Selected Indicators
| | | | | | | | | | | | | | | | | | | | | | | | |
| | | Banking survey (% change, year on year) | |
| | | 2007 | | | 2008 | | | 2009 | | | 2010 | | | 2011 | | | As of
July 31,
2012 | |
Domestic credit | | | 15,1 | | | | 23,3 | | | | (10,0 | ) | | | 4,1 | | | | (0,1 | ) | | | (5,3 | ) |
Credits to enterprises | | | 13,6 | | | | 14,8 | | | | (10,1 | ) | | | (0,8 | ) | | | 1,9 | | | | (0,8 | ) |
Credits to households | | | 27,8 | | | | 35,1 | | | | (5,6 | ) | | | 9,3 | | | | (0,9 | ) | | | (9,5 | ) |
Broad money (M3) | | | 10,8 | | | | 10,3 | | | | 1,8 | | | | 3,0 | | | | 5,9 | | | | 0,1 | |
Source: NBH
Specialised credit institutions are limited with respect to the scope of services they may provide and with respect to the types of clients to which they may provide such services. Specialised credit institutions in Hungary include housing savings associations and mortgage banks. There are two special state-owned institutions: the MFB and the Hungarian Eximbank.
Cooperative institutions may only provide limited types of financial services, primarily taking deposits and making small loans. As of December 31, 2011 and June 30, 2012, Hungarian cooperative institutions held aggregate total assets of HUF 1,745.1 billion and HUF 1,634.0 billion, respectively.
In addition to the credit institutions discussed above, several other financial entities play an important role in strengthening the Hungarian banking and financial sectors. These entities include:
| | • | | the National Deposit Insurance Fund, which credit institutions are required to join, insures deposits up to HUF 13 million per depository, but does not cover the deposits of the Government or certain other entities; |
| | • | | the Credit Guarantee Corporation, which guarantees loans to small and medium-sized businesses; |
| | • | | the National Savings Cooperatives Institutions Protection Fund, which is a voluntary consortium of cooperative institutions designed to further such institutions’ mutual interests; and |
| | • | | the Hungarian Export Credit Insurance Corporation, which provides insurance for export credits and exchange rate risks. |
Ownership Structure of the Banking Sector
Following the dynamic growth of foreign share ownership in the banking sector in the second half of the 1990s, the proportion of registered capital held by foreign investors stabilized in 2002. According to data compiled by HFSA, approximately 91% of the total equity capital of the Hungarian banking sector (excluding the MFB and the Hungarian Eximbank which were owned by the Hungarian state) was held by non-residents as at the end of June 2012.
The only banks (other than the NBH) in which Hungary currently holds controlling interests are the MFB (Hungarian Development Bank) and the Hungarian Eximbank.
60
In May 2009, Hungary acquired a special priority share in FHB JelzálogbankNyrt. issued in accordance with the Act CIV of 2008 on the strengthening of the stability of financial intermediaries. As a holder of this share, any dividend payments and resolutions required the consent of Hungary in addition to approval by a 75% of shareholders at the general shareholders meeting. However, in March 2010, such special priority share was cancelled and Hungary’s interest was dissolved.
Capital Markets
During the course of its transition to a market economy, Hungary attached great importance to the development of a sound capital market in order to promote economic development and to finance Hungarian enterprises. The Capital Markets Act regulates the offering and trading of securities (including government securities) and the institutional framework of the Hungarian capital market (including stock exchanges, investment funds and clearing houses). State control and supervision of the capital markets was delegated to the HFSA. In line with the trend in other international markets generally, Hungary has moved towards a universal financial system when regulating the relationship between investment and banking services. Banks with proper authorisation may carry on investment and financial services activities within the same organisational frameworks, thereby offering universal banking services. By the end of 2007, regulation of the capital markets in Hungary was substantially in compliance with applicable EU regulations and guidelines.
Stock Exchange
The Budapest Stock Exchange (the “BSE”) opened in 1990 and is a self-governing and self-regulating organisation that selects its own governing bodies and officials, adopts its own regulations, defines its operating rules and fixes the fees charged for its services.
In February 2004, the BSE and the Budapest Commodity Exchange (the “BCE”) agreed to integrate their respective activities. The integration was completed in November 2005, and all exchange products formerly traded on the BCE and all members of the BCE were transferred to the BSE.
In January 2010, the BSE, in addition to the Vienna, Ljubljana and Prague Stock Exchanges, became a member of the Central East European Stock Exchange Group through the acquisition of a simple majority stake in the BSE by CEESEG AG. As a result of such acquisition, the following entities are the major shareholders of the BSE: CEESEG AG (50.45%), Österreichischen Kontrollbank AG (18.34%), National Bank of Hungary (6.94%) and the Hungarian Branch Office of KBC Securities (5.19%).
The following table sets forth selected indicators relating to the BSE as at the end of and for the periods indicated:
| | | | | | | | | | | | | | | | | | | | | | |
| | | | | December 31, | |
| | | 2007 | | | 2008 | | | 2009 | | | 2010 | | | 2011 | |
Total spot turnover values (in USD millions) | | | 26,005 | | | | 15,688 | | | | 14,188 | | | | 15,931 | | | | 10,869 | |
Equities | | | 25,290 | | | | 14,334 | | | | 13,310 | | | | 15,117 | | | | 9,926 | |
Government Bonds | | | 163 | | | | 913 | | | | 388 | | | | 533 | | | | 662 | |
Corporate Bonds | | | 284 | | | | 96 | | | | 4 | | | | 6 | | | | 11 | |
Bonds of International Institutions | | | — | | | | — | | | | — | | | | — | | | | — | |
Mortgage Bonds | | | 170 | | | | 108 | | | | 52 | | | | 28 | | | | 7 | |
T-Bills | | | 42 | | | | 139 | | | | 310 | | | | 63 | | | | 42 | |
Investment Funds | | | 55 | | | | 40 | | | | 27 | | | | 28 | | | | 18 | |
Compensation Notes | | | 0 | | | | 0 | | | | 0 | | | | 0 | | | | 0 | |
61
| | | | | | | | | | | | | | | | | | | | |
| | | December 31, | |
| | | 2007 | | | 2008 | | | 2009 | | | 2010 | | | 2011 | |
Certificates | | | 0 | | | | 59 | | | | 97 | | | | 155 | | | | 204 | |
Total number of transactions | | | 1,654,992 | | | | 1,950,035 | | | | 3,476,711 | | | | 2,790,242 | | | | 2,608,683 | |
Equities | | | 1,629,373 | | | | 1,893,117 | | | | 3,349,885 | | | | 2,612,465 | | | | 2,333,671 | |
Government Bonds | | | 233 | | | | 1,106 | | | | 853 | | | | 830 | | | | 1,598 | |
Corporate Bonds | | | 14,942 | | | | 9,363 | | | | 130 | | | | 181 | | | | 424 | |
Bonds of International Institutions | | | — | | | | — | | | | — | | | | — | | | | — | |
Mortgage Bonds | | | 2,089 | | | | 2,509 | | | | 1,369 | | | | 537 | | | | 425 | |
T-Bills | | | 52 | | | | 113 | | | | 72 | | | | 94 | | | | 106 | |
Investment Funds | | | 7,177 | | | | 8,433 | | | | 10,046 | | | | 9,218 | | | | 9,125 | |
Compensation Notes | | | 1,126 | | | | 1,097 | | | | 1,107 | | | | 616 | | | | 497 | |
Certificates | | | 0 | | | | 34,297 | | | | 113,249 | | | | 166,301 | | | | 262,837 | |
Average number of daily transactions | | | 6,755 | | | | 7,959 | | | | 13,851 | | | | 10,985 | | | | 10,648 | |
Average daily turnover (in USD millions) | | | 106 | | | | 64 | | | | 57 | | | | 63 | | | | 44 | |
Average value per transaction (in USD thousands) | | | 16 | | | | 8 | | | | 4 | | | | 6 | | | | 4 | |
Number of trading days | | | 245 | | | | 251 | | | | 251 | | | | 254 | | | | 253 | |
Total Futures Turnover (in USD millions) | | | 19,367 | | | | 11,037 | | | | 9,259 | | | | 10,763 | | | | 7,027 | |
Budapest Stock Exchange Index “BUX” | | | 3,060 | | | | 1,993 | | | | 1,258 | | | | 2,272 | | | | 1,002 | |
Currencies | | | 9,499 | | | | 5,575 | | | | 5,223 | | | | 5,077 | | | | 3,926 | |
Shares | | | 6,804 | | | | 3,469 | | | | 2,778 | | | | 3,415 | | | | 2,098 | |
Interest Rates | | | 3 | | | | 0 | | | | 0 | | | | 0 | | | | 0 | |
Number of transactions | | | 435,519 | | | | 469,633 | | | | 466,346 | | | | 578,139 | | | | 410,212 | |
Total Options Turnover (in USD millions) | | | 379 | | | | 267 | | | | 162 | | | | 23 | | | | 24 | |
Equity options | | | 0 | | | | 0 | | | | 0 | | | | 0 | | | | 0 | |
Index options | | | 1 | | | | 0 | | | | 0 | | | | 0 | | | | 0 | |
Currency options | | | 378 | | | | 267 | | | | 162 | | | | 23 | | | | 24 | |
Number of trades (thousand) | | | 1,109 | | | | 936 | | | | 665 | | | | 94 | | | | 167 | |
Average exchange rate HUF/USD | | | 183.83 | | | | 171.80 | | | | 202.26 | | | | 208.15 | | | | 200.94 | |
Source: Budapest Stock Exchange
Notes:
USD values calculated based on EUR values of the Budapest Stock Exchange and the yearly average EUR/HUF and USD/HUF foreign exchange rates calculated by the NBH.
62
PUBLIC FINANCE
General Information
The public finance sector in Hungary consists of the central government budget, social security funds (pension and health funds), extra-budgetary funds and local government budgets, which together are referred to as the general government budget.
Methodology
The fiscal year for the Government is the calendar year. The general government budget data are compiled in several stages by the Ministry for National Economy (prior to May 29, 2010, the Ministry of Finance had such responsibility). In the fall of each calendar year, the Ministry for National Economy is required to compile the first preliminary budget (called the “planned budget”) for the following calendar year in accordance with the budget act approved by Parliament for such year.
In January of each given calendar year, the Ministry for National Economy compiles the first version of the general government budget for the previous year. This budget (compiled according to data available in January) is called the “preliminary budget.” During the course of the year, the Ministry for National Economy collects additional information concerning the revenues and expenditures related to the previous year. In light of this additional information, the Ministry for National Economy revises the preliminary budget (compiled in January) and compiles the second version of the general government budget for the previous year. This budget (compiled according to data available in May of a given calendar year) is called the “fact budget.” The main reason for the differences between the preliminary and fact budgets is the uncertainty of the exact amounts of revenues and expenditures of the central governmental institutions, as balance sheets of these institutions are not compiled until May of a given calendar year. The Ministry for National Economy is obliged to compile the final account by the end of August of a given calendar year using the fact budget. The final account is submitted to the Parliament, and the Parliament approves the final account with a simple majority vote. However, the final account submitted to Parliament may differ from the final account approved by Parliament due to amendments. After the final account is approved by Parliament, the Ministry for National Economy compiles the third version of the general government budget for the previous year, known as the “final budget.”
The information included in this document with respect to the budget for 2011 and 2012 was derived from the budget for 2011 and 2012 as calculated by the Ministry for National Economy (and prior to May 29, 2010, the Ministry of Finance) using data available in August 2012.
Budget Trends
The following table sets forth the main fiscal trends in Hungary for the years indicated:
Budget Trends(1)
| | | | | | | | | | | | | | | | | | | | | | | | | | | | |
| | | General government balance, consolidated | |
| | | 2007 | | | 2008 | | | 2009 | | | 2010 | | | 2011 | | | 2012 | | | 2012 | |
| | Final | | | Final | | | Final | | | Final | | | Final | | | Planned | | | Expected | |
| | | (HUF billions) | |
GFS method | | | | | | | | | | | | | | | | | | | | | | | | | | | | |
Revenues | | | 11,612.9 | | | | 12,572.7 | | | | 12,915.2 | | | | 12,417.5 | | | | 12,939.6 | | | | 14,156.6 | | | | 13,999.9 | |
Privatisation receipts | | | 24.0 | | | | 24.7 | | | | 4.1 | | | | 7.0 | | | | 2.6 | | | | 2.3 | | | | 1.8 | |
63
| | | | | | | | | | | | | | | | | | | | | | | | | | | | |
Revenues (excluding privatisation receipts) | | | 11,588.9 | | | | 12,548.1 | | | | 12,911.0 | | | | 12,410.5 | | | | 12,937.0 | | | | 14,154.3 | | | | 13,998.1 | |
Expenditures | | | 12,974.3 | | | | 13,466.4 | | | | 13,439.7 | | | | 13,539.0 | | | | 14,537.7 | | | | 14,882.8 | | | | 14,645.4 | |
Balance (excluding privatisation receipts) | | | (1,385.4 | ) | | | (918.4 | ) | | | (528.7 | ) | | | (1,128.5 | ) | | | (1,600.7 | ) | | | (728.5 | ) | | | (647.4 | ) |
Balance in % of GDP | | | (5.5 | ) | | | (3.5 | ) | | | (4.0 | ) | | | (4.2 | ) | | | (5.7 | ) | | | (2.5 | ) | | | (2.2 | ) |
General government balance – consolidated | | | | | | | | | | | | | | | | | | | | | | | | | | | | |
ESA method | | | | | | | | | | | | | | | | | | | | | | | | | | | | |
Revenues | | | 11,386.9 | | | | 12,085.8 | | | | 12,015.1 | | | | 12,085.1 | | | | 14,883.4 | | | | 13,497.8 | | | | 13,502.5 | |
Expenditures | | | 12,673.7 | | | | 13,073.2 | | | | 13,185.8 | | | | 13,210.3 | | | | 13,678.8 | | | | 14,235.8 | | | | 14,186.8 | |
Balance | | | (1,286.8 | ) | | | (987.3 | ) | | | (1,170.7 | ) | | | (1,125.2 | ) | | | 1,204.6 | | | | (738.0 | ) | | | (684.2 | ) |
Balance in % of GDP | | | (5.1 | ) | | | (3.7 | ) | | | (4.6 | ) | | | (4.2 | ) | | | 4.3 | | | | (2.5 | ) | | | (2.3 | ) |
Source: CSO and Ministry of Finance
Notes:
| (1) | For methodological remarks on planned, expected, preliminary, fact and final budgets see “Public Finance –Methodology.” |
According to final data available in August 2012, the general government deficit (including local governments) amounted to HUF 1,728.4 billion (6.1% of GDP) for the year 2011, according to the GFS methodology. The general government surplus for the year 2011, according to the ESA methodology, (local governments included) reached HUF 1,204.6 billion, equalling 4.3% of the GDP for the year 2011.
The 2012 planned general government deficit (local governments included) is HUF 726.2 billion according to the GFS methodology. The 2012 planned general government deficit (local governments included) is HUF 1,204.6 billion (2.5% of GDP) according to the ESA methodology.
On October 29, 2008, the IMF, the EU and the World Bank agreed to grant a financial assistance package of up to USD 25.1 billion to Hungary. The IMF agreed to provide a 17-month standby facility of USD 15.7 billion (EUR 12.5 billion), while the EU agreed to lend USD 8.1 billion (EUR 6.5 billion), and there is a possibility to draw down USD 1.3 billion (EUR 1 billion) from the World Bank to assist Hungary in addressing the negative impact of the global financial crisis.
A HUF 600 billion banking sector package was set up by the Parliament. The banking sector package contained provisions for added capital and funded a guarantee fund for interbank lending. Funding was divided as follows: total funding of HUF 600 billion was divided equally between the Capital Base Enhancement Fund and the Refinancing Guarantee Fund. The package was available to private Hungarian banks of systemic importance. The Capital Base Enhancement Fund was set up to bring the eligible banks’ capital adequacy ratio (CAR) up to 14%. The Guarantee Fund was meant to bring comfort to the providers of wholesale funding and secure the refinancing of the eligible banks. Its endowment of HUF 300 billion was invested in euro denominated government bonds of Euro area countries and managed by the NBH. It was available until the end of 2009, and it provided a guarantee for the rollover of loans and wholesale debt securities with an initial maturity of more than three months and up to five years, against a fee and with appropriate safeguards.
As of December 31, 2010, out of the financial assistance package provided by the IMF, SDR 0.1 billion was used for the bank rescue package, SDR 0.9 billion was used in form of loans to banks, SDR 3.2 billion was used for sovereign debt service and SDR 2.2 billion was placed at NBH as deposit. Meanwhile, out of the financial assistance package provided by the EU, EUR 5.5 billion was used for sovereign debt service. The NBH had also drawn down SDR 1.3 billion from the IMF facility as of December 31, 2010.
64
In November 2008, the Parliament approved the Act on Fiscal Responsibility. The Act set out new fiscal rules regarding the central subsystem of the Government, established the Fiscal Council and introduced guarantee elements prevailing in the planning of the budget, which ensure that, compared to the accepted medium-term expenditure ceilings, additional expenditure claims could only be planned in the event that their negative effect on the balance can be offset by the decrease of other expenditure elements or increase in revenues. The Act also determines expenditure caps and balance limitations, both for the coming years and in the long run.
In February 2009, Hungary introduced a net total revenue neutral tax reform and also undertook certain reform measures. The key structural changes included increasing the retirement age, changing pension indexation rules, establishing an upper limit for the “13th month” pension benefit of HUF 80,000, eliminating the “13th month” pension benefit for new entrants, tightening disability retirement rules, cutting interest subsidy to housing loans, restricting social policy, cutting compensation for gas and distance heating costs (consumer prices), changing family allowance, child-care pay (as abbreviated in Hungarian: GYED) and child-care aid (as abbreviated in Hungarian: GYES), and changing local government subsidies. The pension reforms aim to reduce pension expenditures by 3% (as a per cent of GDP) over a period of approximately the next 50 years.
As of January 1, 2010 the simplified business tax rate (in Hungarian: EVA) increased from 25% to 30%.
On January 5, 2010, the Ministry of Finance published the preliminary general government deficit (excluding local governments) for the year 2009, in accordance with GFS methodology. The deficit reached HUF 918.6 billion, equalling 3.6% of the projected GDP for the year 2009.
On April 1, 2010, the CSO published the preliminary general government deficit (including local governments) for the year 2009, in accordance with ESA methodology. In 2009, the deficit reached HUF 1,035.0 billion, equalling 4.0% of the preliminary 2009 GDP.
Simultaneously, the NBH published the preliminary general government debt figure (including local governments) as of the end of 2009, in accordance with ESA methodology. The debt reached HUF 20,421.2 billion, equalling 78.3% of the preliminary GDP for the year 2009.
On June 8, 2010, the Prime Minister announced a 29-point economic plan. The following table sets forth the estimated budgetary effects, to the extent available, of the announced measures on the 2010 budget.
| | | | | | | | | | | | | | | | |
| | | The estimated budgetary effects of the Government’s
29-measure Economic Plan on the 2010 budget | |
| | | Revenue
increase | | | Expenditure
increase | | | Revenue
decrease | | | Expenditure
decrease | |
| | | (HUF billion) | |
Changes in corporate income tax | | | 0.0 | | | | 0.0 | | | | 45.0 | | | | 0.0 | |
Modification related to the 10% tax for individual entrepreneurs/self-employed | | | 0.0 | | | | 0.0 | | | | 1.3 | | | | 0.0 | |
Introduction of a flat tax rate of 16% on personal income (abolishment of tax credits) | | | 0.0 | | | | 0.0 | | | | 0.0 | | | | 0.0 | |
Abolishment of tax on high value assets at the central budget level | | | 0.0 | | | | 0.0 | | | | 1.7 | | | | 0.0 | |
Modification of Act CXLIV of 2009 on flood control cooperatives | | | 0.0 | | | | 0.0 | | | | 0.0 | | | | 0.0 | |
Abolishment of some local taxes at the local government level | | | 0.0 | | | | 0.0 | | | | 0.0 | | | | 0.0 | |
65
| | | | | | | | | | | | | | | | |
| | | The estimated budgetary effects of the Government’s
29-measure Economic Plan on the 2010 budget | |
| | | Revenue
increase | | | Expenditure
increase | | | Revenue
decrease | | | Expenditure
decrease | |
| | | (HUF billion) | |
- tax on holiday resorts | | | 0.0 | | | | 0.0 | | | | 0.0 | | | | 0.0 | |
- the utility tax of entrepreneurs | | | 0.0 | | | | 0.0 | | | | 0.0 | | | | 0.0 | |
Replacement of the tax on holiday resorts with a tax on buildings (or with other local tax) | | | 0.0 | | | | 0.0 | | | | 0.0 | | | | 0.0 | |
Increase of the revenue from company cars (tax on high-power cars) | | | 0.5 | | | | 0.0 | | | | 0.0 | | | | 0.0 | |
Decrease of the tax on diesel oil for carriers | | | 0.0 | | | | 0.0 | | | | 0.0 | | | | 0.0 | |
Modification of the law on domestic work and introduction of its tax-exempt status | | | 0.0 | | | | 0.0 | | | | 3.0 | | | | 0.0 | |
Modification of the law on dues, extension of dues exemption | | | 0.0 | | | | 0.0 | | | | 0.0 | | | | 0.0 | |
- central budget | | | 0.0 | | | | 0.0 | | | | 0.8 | | | | 0.0 | |
- local government | | | 0.0 | | | | 0.0 | | | | 0.7 | | | | 0.0 | |
Abolishment of the third of the 51 permits required in the course of investment projects | | | 0.0 | | | | 0.0 | | | | 0.0 | | | | 0.0 | |
Simplified employment (related to social securities revenues) | | | 0.0 | | | | 0.3 | | | | 0.6 | | | | 0.0 | |
One does not have to become an entrepreneur to have their apartment leased | | | 0.0 | | | | 0.0 | | | | 0.0 | | | | 0.0 | |
Reduction of excise tax on alcohol distillation at households | | | 0.0 | | | | 0.0 | | | | 3.1 | | | | 0.0 | |
Abolishment of the VAT on charitable donations | | | 0.0 | | | | 0.0 | | | | 2.5 | | | | 0.0 | |
The production, processing and selling of food will be simplified for small producers | | | 0.0 | | | | 0.0 | | | | 0.0 | | | | 0.0 | |
Széchenyi card | | | 0.0 | | | | 0.4 | | | | 0.0 | | | | 0.0 | |
The radical restructuring of EU resources to benefit small and medium sized companies | | | 0.0 | | | | 0.0 | | | | 0.0 | | | | 0.0 | |
Freezing of budgetary institutions funding | | | 0.0 | | | | 0.0 | | | | 0.0 | | | | 40.5 | |
Payments of central budgetary institutions | | | 7.0 | | | | 0.0 | | | | 0.0 | | | | 0.0 | |
Withdrawal of carry-overs | | | 0.0 | | | | 0.0 | | | | 0.0 | | | | 30.0 | |
Stopping of all bonuses, review of contracts and procurements | | | 0.0 | | | | 0.0 | | | | 0.0 | | | | 12.0 | |
The negative effect of expenditure-decreasing changes on tax revenues (PIT, VAT, premiums) | | | 0.0 | | | | 0.0 | | | | 0.0 | | | | 0.0 | |
Savings at extra-budgetary funds | | | 0.0 | | | | 0.0 | | | | 0.0 | | | | 18.0 | |
Introduction of an extra tax (98% ) on severance payments, bonuses and other forms of personal income of government officials | | | 1.0 | | | | 0.0 | | | | 0.0 | | | | 0.0 | |
66
| | | | | | | | | | | | | | | | |
| | | The estimated budgetary effects of the Government’s
29-measure Economic Plan on the 2010 budget | |
| | | Revenue
increase | | | Expenditure
increase | | | Revenue
decrease | | | Expenditure
decrease | |
| | | (HUF billion) | |
Savings in the asset management chapter (in expenditures related to state property) | | | 0.0 | | | | 0.0 | | | | 0.0 | | | | 20.0 | |
Decrease of the support of political parties by 15% | | | 0.0 | | | | 0.0 | | | | 0.0 | | | | 0.2 | |
Appointment of budgetary inspectors to institutions managing significant public funds | | | 0.0 | | | | 0.0 | | | | 0.0 | | | | 0.0 | |
Establishment of the National Asset Management Corporation | | | 0.0 | | | | 0.0 | | | | 0.0 | | | | 0.0 | |
Introduction of the banking tax (solely in 2010-11) | | | 187.0 | | | | 0.0 | | | | 0.0 | | | | 0.0 | |
Loss on Corporate Tax because of the introduction of the banking tax | | | 0.0 | | | | 0.0 | | | | 20.0 | | | | 0.0 | |
Solely forint-based mortgages could be registered | | | 0.0 | | | | 0.0 | | | | 0.0 | | | | 0.0 | |
Secondary inspection of all foodstuff | | | 0.0 | | | | 0.0 | | | | 0.0 | | | | 0.0 | |
Ordering of the freeze of utility charges | | | 0.0 | | | | 0.0 | | | | 0.0 | | | | 0.0 | |
Ordering the stop of all evictions until December, 31, 2010 | | | 0.0 | | | | 0.0 | | | | 0.0 | | | | 0.0 | |
Total | | | 195.5 | | | | 0.7 | | | | 78.7 | | | | 120.7 | |
| | | | | | | | | | | | | | | | |
Total effect on the balance of the budget | | | | | | | | | | | | | | | 236.8 | |
| | | | | | | | | | | | | | | | |
Source: Ministry for National Economy
On July 22, 2010, the Parliament approved the Act XC of 2010 that levied a special tax on financial institutions. See “Public Finance – Taxation” for further details on the special tax. According to an estimate compiled by the Fiscal Council, the levy will generate additional revenue in the aggregate amount of HUF 185.6 billion in the years 2010 and 2011.
On October 13, 2010, the Government announced that a special tax will be levied on retail businesses, telecommunication companies and energy supply companies. See “Public Finance – Taxation” for further details on the special tax. The tax is expected to generate additional revenue of HUF 61 billion from telecommunication companies, HUF 70 billion from energy supply companies and HUF 30 billion from retail businesses. The tax will be levied temporarily in the years 2010, 2011 and 2012.
On October 13, 2010, the Government announced that mandatory payments of participants in private pension funds will be withheld by the government for a 14-month period, which commenced on November 1, 2010. Such payments, estimated to be in the amount of HUF 30 billion per month, are expected to reduce the deficit of the annual budget of 2010 and 2011.
On October 30, 2010, Mr. György Matolcsy, Minister for National Economy, submitted the budget proposal for the year 2011. According to the proposal, the accrual-based (according to ESA methodology) general government deficit, including local governments, for the year 2011 will amount to 2.9% of the expected GDP. The Parliament approved the budget on December 23, 2010.
67
On December 13, 2010, the Parliament approved an act on the establishment of the Pension Reform and Debt Reduction Fund. According to the new legislation, participants in a mandatory private pension fund can choose to remain in the “three-pillar” system or elect to be in a “two-pillar” system. The portfolio of the participants in the private pension funds who choose the “two-pillar” system will be transferred to a state pension fund. See “Pension System” for further details on the recent pension reforms.
On December 13, 2010, Parliament also approved a special act (Act CLIII of 2010 on the Amendment of Certain Acts to Establish the Budget of the Republic of Hungary of 2011) changing the composition of the Fiscal Council to consist of the Governor of the NBH, the President of the State Audit Office and an economist of outstanding knowledge nominated by the President of Hungary. The Fiscal Council is an independent fiscal body, whose members assess the appropriateness and sustainability of the Government’s budget proposals by utilising the expertise of the institutions such members lead. The amendment broadens the range of expertise available to the Fiscal Council and enhances its authority, such as by providing the Fiscal Council the right to send budget proposals back to the Government for further consideration.
On January 7, 2011, the Ministry for National Economy published the preliminary general government deficit (excluding local governments) for the year 2010, in accordance with GFS methodology. The deficit reached HUF 869.8 billion, equalling 3.2% of the projected GDP for the year 2010.
On February 11, 2011 the Government announced the creation of a stability reserve fund in the amount of HUF 250 billion. The measure includes the freezing of the funds of certain ministries in the amount of HUF 187 billion altogether.
On March 1, 2011, the Government announced a structural reform package called the “Széll Kálmán Plan”.
The primary objective is to reduce Hungary’s public debt mostly via permanent cuts on the expenditure side. In addition, the Government is hopeful that such measures will strengthen potential growth and stimulate employment. The most affected fields are:
Labour market: The aim is to encourage inactive groups to re-enter the labour market. To this goal the unemployment benefit system is to be redesigned (shortened period covered, capped benefit level), active labour market policies will be financed by EU funds, in terms of social transfers a maximum allowance will be introduced (capping) that will cover each type of support, family supports in parallel shall be maintained at the present nominal level, vocational training and higher education system changes to address market needs.
Pension system: The main aim is to improve its sustainability in a way that contributes to increasing the activity rate. To this end the early retirement schemes are to be radically tightened (in the case of armed forces, police, fire services, etc.); disability pension expenditures must be revised; introduction of full CPI indexation is to be considered.
Public transport: Parallel services between the public transport companies must be abolished by establishing a holding company, the National Transport Company. At the same time, the wide spread price-subsidy system shall be cut back (free transport for the family members of transport employees is to be abolished, benefits shall be the responsibility of the new holding company, except for the transport for the 65+ population).
Higher education: Must be attuned to the needs of the economy and the labour market. The number of participants in the various courses must match the expectations of the labour market. To this end the proportion of scientific and technological degrees must be raised – meanwhile unnecessary faculties with their infrastructures shall be abolished. Tuition and institutional system shall be modernised taken into account the scrutinized number of state-sponsored students.
Prescription drug subsidy system: Within the medicine budget of HUF 343.5 billion in 2011 the objective is to reach a savings of HUF 120 billion within three years’ time by transformation of the medicine subsidising system.
68
State and local government finance: The efficiency of local government system must be increased by reducing fragmentation. Credit taking for local governments shall be strictly regulated and conditional to governmental authorisation. In terms of state level administration public procurement law is to be modified, in parallel with the abolishment of the practice of having subcontracts, which are in connection with tasks carried out via government or central administrative staff. The efficiency of tax collection must be improved.
Cuts in administrative costs: The ‘First Strike’ measures aimed at cutting administrative burdens of enterprises in nine prioritised areas devised in cooperation with a wide range of entrepreneurs. Its effect is targeted to reach HUF 100 billion (non-budgetary effect).
The following table sets forth the planned budgetary effect of the measures contained in the Széll Kálmán Plan, as estimated by the Ministry for National Economy.
| | | | | | | | | | | | | | | | |
| | | 2011 | | | 2012 | | | 2013 | | | 2014 | |
| | | (HUF billion) | |
Employment and labour market | | | 0 | | | | 195 | | | | 213 | | | | 213 | |
Pension system reform | | | 12 | | | | 93 | | | | 129 | | | | 129 | |
Public transport | | | 0 | | | | 45 | | | | 60 | | | | 60 | |
Higher education | | | 0 | | | | 12 | | | | 38 | | | | 38 | |
Prescription drug subsidy system | | | 0 | | | | 83 | | | | 120 | | | | 120 | |
State and municipal funding | | | 0 | | | | 32 | | | | 122 | | | | 122 | |
Contributions to the fund established to reduce public debt | | | 0 | | | | 90 | | | | 220 | | | | 220 | |
| | | | | | | | | | | | | | | | |
Total | | | 12 | | | | 550 | | | | 902 | | | | 902 | |
| | | | | | | | | | | | | | | | |
Source: Ministry for National Economy
The Government expects the budget deficit to GDP ratio to shrink to 2.9% in 2011, 2.5% in 2012, 2.2% in 2013 and 1.9% in 2014. As a result of one-off revenues the budget surplus can reach 4% of the GDP in the year 2011. As a result the public debt to GDP ratio will fall to 80% in 2011, 72% in 2012, 68% in 2013 and 66% in 2014. The Government plans to reduce income centralisation to GDP ratio to 42% in 2012, 40% in 2013 and 39% in 2014, and to reduce redistribution to GDP ratio to 44% in 2012, 42% in 2013 and 41% in 2014.
The following table sets forth legislative measures that have been undertaken to implement the Széll Kálmán Plan as of December 31, 2011:
| | |
Date | | Action |
| |
June 14, 2011 | | The Parliament adopted the amendment to the Criminal Code and as of January 1, 2012, the perpetrator of the sick pay fraud will be punishable by imprisonment of up to 2 years. |
| |
June 30, 2011 | | The Government Resolution No. 1226/2011 (VI.30.) on legislation programme for 2012 and 2013 in order to the implement of the pharmaceutical subsidy system transformation was adopted, after the consultations conducted between the Government and the relevant parties. |
| |
July 1, 2011 | | Amendment to regulation of electricity and natural gas prices went into effect. |
| |
July 1, 2011 | | The Act LXXXI of 2011 on the Amendment of Certain Health Related Acts went into effect. Such Act reregulates sick pay transfers and funding system of prescription drugs. |
69
| | |
| Date | | Action |
| |
| July 11, 2011 | | The Hungarian Parliament adopted the new Act on Public Procurement, which will go into effect on January 1, 2012. |
| |
| July, 11, 2011 | | The Parliament adopted the Act on Public Employment and the amendment to acts related to public employment. |
| |
| September 30, 2011 | | The Minister of National Development issued a new decree on district heating prices. According to the decree the retail district heating prices has been fixed as of March 31, 2011. |
| |
| November 28, 2011 | | The Parliament adopted the Act on abolishment of early retirement pensions, new regulation for early retirement benefits and social services of retired officers. |
| |
| December 5, 2011 | | Act on amendment to Health Act, prescription drug subsidy system and certain other acts was adopted by the Parliament. |
| |
| December 20, 2011 | | Act on national public education was adopted by the Parliament. |
| |
| December 20, 2011 | | Act on benefits of persons with reduced capacity to work and amendment to certain acts was adopted by the Parliament. |
| |
| December 20, 2011 | | Act on public administration officers was adopted by the Parliament, and went into effect as of March 1, 2012. |
| |
| December 23, 2011 | | The Parliament adopted the Act on national higher education, which significantly reduces the number of students supported and financed by the state. |
| |
| December 23, 2011 | | The Parliament adopted the Act on amendment to bankruptcy and liquidation proceedings law, business association law, corporate transparency, company registration and insolvency law and certain other laws related thereto, which result in a more efficient foreclosure and transparent liquidation and procedural rules. |
| |
| December 23, 2011 | | The Parliament adopted the Act on national mobile payment system, which centralises mobile distribution services via a mobile payment system and went into effect on May 1, 2012. |
| |
| December 30, 2011 | | The Hungarian State assumed certain debt items of MÁV. |
The table below sets forth the legislative measures planned in order to implement the Széll Kálmán Plan:
| | |
| Originally planned date | | Action |
| |
| By December 31, 2011 | | Hungary will have worked out those Acts which are necessary for the operation of the new pension system |
| |
| By December 31, 2011 | | The Ministry for National Economy will have implemented those further measures which will result in a further reduction in the tax liabilities of enterprises |
| |
| By December 31, 2011 | | The Ministry for National Development will have completed the plan aimed at the debt restructuring and reorganisation of the MÁV |
| |
| By December 31, 2011 | | The Ministry of Justice and Public Administration will have worked out those Acts which will reduce the burdens of the enterprises by making foreclosure and liquidation procedures faster and more transparent |
| |
| By January 1, 2012 | | Hungary will have revised the former classifications in the framework of the new, transparent system for the certification and registry of disabled persons in a fair and systematic way |
| |
| By January 1, 2012 | | The National Transport Holding Company will be established and the structural consolidation of public transport will begin |
70
| | |
| Date | | Action |
| |
| By January 1, 2012 | | Hungary will have launched the new system of public employment |
| |
| By January 1, 2012 | | The new, sustainable pension system will be launched |
| |
| | The amount of political parties’ nominal funding will be frozen at the level of 2011 |
| |
| | As soon as the new Constitution goes into effect, we will implement a system aimed at tax reduction |
| |
| On September 1, 2012 | | The new Act on public education will enter into force |
| |
| Starting September 1, 2012 | | The new system of higher education will be launched |
| |
| On January 1, 2013 | | New electronic toll system which will be based on road utilisation will be launched |
| |
| From 2014 | | Hungary will vote a 200-strong National Assembly |
Source: Parliament and Ministry for National Economy
On May 24, 2011, Prime Minister Mr. Viktor Orbán announced that Hungary will purchase shares of the Hungarian oil company MOL amounting to 21.2% of total shares worth EUR 1.88 billion. The purchase was effective as of July 6, 2011.
On May 30, 2011, Prime Minister Mr. Viktor Orbán announced that the Government had reached an agreement with the Banking Association. According to the announcement, households would be entitled to pay foreign currency denominated mortgage debt service at a fixed exchange rate. In case of EUR, the exchange rate would be HUF 250/EUR; in case of Swiss franc, the exchange rate would be HUF 180/CHF; and in the case of Japanese Yen, the exchange rate would be HUF 2/JPY. The difference between the actual and the fixed exchange rate would be financed by the bank in HUF. The debtor would start repaying this debt in 2015. The Government would set up a company that would build residential buildings and would buy and re-lend part of the homes of the households in serious indebtedness. The moratorium for foreclosures would be abolished gradually and a quota would be set. In case of buildings worth more than HUF 30 million, the moratorium ended on July 1, 2011. In case of buildings worth less than HUF 30 million a quota would be set up for each quarter. In the 4th quarter of 2011 2% of such buildings can be sold; in the 1st quarter of 2012 3%; in the 2nd quarter of 2012 4%; in the 3rd quarter of 2012 5% of such buildings can be sold. Afterwards 5% of such buildings can be sold quarterly. Financial intermediaries would be able to issue loans denominated in foreign currency but only to clients with income exceeding 15 times the average wage. Interest payments would be subsidised by Hungary in case the debtor sells the residential building in order to move to a smaller residential building.
The following table sets forth the quotas and the exploitation rates for the periods indicated.
| | | | | | | | | | | | | | | | |
| | | Basis of the quota | | | Number of retail properties that can be designated according to the quota | | | Number of retail properties designated for forced liquidation | | | Utilisation of the quota (%) | |
2011 Q4 | | | 100,268 | | | | 2,664 | | | | 1,928 | | | | 72.4 | % |
2012 Q1 | | | 99,771 | | | | 3,564 | | | | 2,943 | | | | 82.6 | % |
2012 Q2 | | | 107,180 | | | | 3,802 | | | | 3,177 | | | | 83.6 | % |
2012 Q3 | | | 113,840 | | | | 4,053 | | | | 2,866 | | | | 70.7 | % |
Source: HFSA
71
On June 9, 2011, the Government decided to sell Hungary’s 25% share of Budapest Airport to Hochtief AG for HUF 36.6 billion. The sale was completed on June 17, 2011.
On July 28, 2011, the European Union declared that certain Hungarian legislation concerning VAT violates the legislation of the European Union. As a result, Hungary will have to pay back certain withheld value-added tax receipts to private enterprises. According to calculations compiled by the Ministry of National Economy, the effect would be approximately HUF 255 billion additional expenditure.
On September 6, 2011, Prime Minister Mr. Viktor Orbán announced that additional deficit reduction measures amounting to approximately HUF 100 billion are needed to achieve the deficit target for 2011.
In order to achieve the deficit target, the government announced measures aimed at amending the budget position by HUF 100 billion. These measures focus on four key fields. Due to the abuse of VAT regulations, the state loses an estimated HUF 600 billion in tax revenues each year. The Hungarian national tax authority is committed to boosting the focused collection of VAT liabilities from concealed incomes that will improve the balance of the budget by HUF 40 billion. The government will save another HUF 40 billion by speeding up the reform of public administration and by limiting public sector procurements. The government can ensure extra revenues by raising the excise tax on some goods and the tax on gambling. The budget will also benefit from dividends from foreign equities of the portfolio of private pension funds, and that will also contribute to improving the balance. The following table sets forth the expected results of the announced measures:
| | | | |
| Field | | Measure | | Expected revenues |
| VAT | | Improving efficiency of tax collection | | HUF 40bn |
| State administration | | Speeding up reform, limiting public procurements | | HUF 40bn |
| Excise tax | | Raising tax on gambling by 50% | | HUF 1bn |
| | Raising tax on tobacco by 7% | | HUF 5bn |
| | Raising the excise tax of alcohol by 5% | | HUF 1bn |
| | Raising tax on flavoured alcoholic beverages by 50% | | |
| | Raising the excise tax on gasoline from 97 HUF to 110 HUF per litre | | HUF 3bn |
| Dividends from shares | | Dividends received from foreign equities by the private pension fund reform | | HUF 10bn |
Source: Ministry for National Economy
On September 12, 2011, Prime Minister Mr. Viktor Orbán announced that households would be entitled to repay their foreign currency denominated mortgage debt at a fixed exchange rate. In case of EUR the exchange rate would be HUF 250/EUR; in case of Swiss franc, the exchange rate would be HUF 180/CHF; and in the case of Japanese Yen, the exchange rate would be HUF 2/JPY. The creditors would not be forced to provide loans denominated in local currency to the debtor. In case of foreign currency denominated debt, the interest rate should be based on a reference interest rate, and the yield (according to standard national definition “THM”) would be maximized at 30%. The banking sector should use a positive debtor list in case of natural persons. Subsequently on September 15, 2011 the Government announced that debtors should apply for repayment until the end of the year 2011.
On September 16, 2011, Minister for National Economy Mr. György Matolcsy announced that the general government deficit for the year 2012 is planned to reach 2.5% of GDP. Even as circumstances have changed, the Government is committed to uphold the deficit target of 2.5% of GDP. In order to achieve this, improvements in the budget balance totalling HUF 550 billion had been announced. The estimates of the budgetary effects of the measures were based on the expected economic environment described in the Széll Kálmán Plan. On the basis of recent developments, however, further measures are needed to improve the balance by HUF 1,000 billion. The majority of these measures will be achieved by the reduction of expenditures.
72
The Stability Fund of HUF 250 billion set up in February 2011 and additional measures of HUF 303 billion is meant to reduce expenditures. In addition, measures of HUF 445 billion would increase revenues.
Compared to 2011, the 2012 balance is expected to improve by an additional HUF 750 billion on top of the Stability Fund, which has been included in the base calculations for 2011. The amount of HUF 750 billion is comprised of two main items: an improvement of the budget balance by HUF 600 billion, and a new Financial Protection Fund of HUF 150 billion that provides a buffer in order to secure the targets in case of less favourable scenarios. This fund would be financed by higher VAT rates. A higher safety margin would be provided by the radical reduction of public debt, and the interest payments will decrease by HUF 50 billion, a figure which had not been included in the preliminary calculations. This amount, however, would remain a buffer to address unforeseen future events.
On October 12, 2011 Prime Minister Mr. Viktor Orbán announced that the Government plans to introduce a social benefit to encourage home ownership by families. The social benefit will be a one-time financial grant towards the building or purchase of a new home to a family if the family does not currently own a home and at least one of the parents has been employed in the previous six months. If the family builds a new house, the expenditures must be confirmed with receipts. Persons who owe money to the state (for example, overdue taxes) are not eligible for the social benefit. The grant would equal HUF 0.8-1.3 million for a family consisting of two children and parents, HUF 1.2-2.0 million for a family with three children, and HUF 1.6-2.5 million for a family with four or more children. According to estimate of the Ministry of National Economy the total expenditures of the state related to this measure for the year 2012 will equal approximately HUF 5.2 billion. In addition to this initiative, the Government also plans to introduce interest payment support equal to HUF 1.3 billion in the year 2012.
On October 28, 2011 the Ministry of National Economy issued a summary on the projected effect of measures introduced during the course of the year 2011 on the budget for the year 2012. According to the summary, 83% of the savings planned in the Széll Kálmán Plan is included in the 2012 budget. The following table sets forth the impact of the measures introduced during the course of the year 2011 on the budget for the year 2012:
| | | | | | | | |
| | | Billion HUF | | | Per cent of GDP | |
Employment and labour market | | | 158 | | | | 0.54 | |
Pension system | | | 42 | | | | 0.14 | |
Public transport | | | 26 | | | | 0.09 | |
Higher education | | | 12 | | | | 0.04 | |
Health | | | 83 | | | | 0.29 | |
Public and local government financing | | | 44 | | | | 0.15 | |
Contribution to the Debt Reduction Fund | | | 90 | | | | 0.31 | |
Total | | | 455 | | | | 1.56 | |
Source: Ministry for National Economy
Further to the important structural reforms that mainly bring benefits in the medium to longer term, appropriations in the Budget Bill were determined in line with the prudent planning described in the Convergence Programme:
• Nominal wages have been frozen in the public sector. The wage supplement compensating for the abolishment of tax credits for low earners remains in effect.
• In addition to the freezing of family subsidies, other social transfers do not increase either.
• Appropriations of budgetary chapters are based on the levels decreased by the 2011 stability reserve, making those measures structural.
73
The following table sets forth the impact of the measures included in the Convergence Programme on the 2012 budget:
| | | | | | | | |
| | | Billion HUF | | | Per cent of GDP | |
Freezing wages with the compensation of low income employees for the elimination of tax credit | | | 43 | | | | 0.54 | |
Freezing social benefits other than family benefits | | | 8 | | | | 0.03 | |
Freezing chapter reserves of constitutional chapters and reserves of the Media Service and Asset Fund | | | 13 | | | | 0.04 | |
Elimination of spending included in the “stability reserve” | | | 241 | | | | 0.83 | |
Total | | | 305 | | | | 1.05 | |
Source: Ministry for National Economy
On December 30, 2011, the debt of MÁV was partially taken over by Hungary in the amount of HUF 50 billion.
In view of the increased risks surrounding the macroeconomic projections, the Budget Bill includes substantially higher reserves than what was assumed in the Convergence Programme. Apart from the general reserve (HUF 100 billion) to be used for exceptional measures by the government, i.e., to cover unforeseeable expenditures and/or revenue shortfalls, a new, special reserve for interest expenditures (HUF 50 billion) caters for any risks arising from potentially adverse global financial market developments. Furthermore, an additional safety reserve of HUF 150 billion (0.5% of GDP) is set aside to tackle any unexpected revenue shortfalls or expenditure overruns due to possibly worsening macroeconomic conditions. Sensitivity analyses suggest that a 1% slower GDP growth implies a deterioration of only around 0.4 percentage point, even if the deceleration is taking place in the worst structure, i.e., with the most negative effect on the balance (a weaker domestic demand). If a weaker growth path is accompanied by higher inflation, higher VAT revenues would partly offset the deterioration of the budget balance. On top of the overall HUF 300 billion (1% of GDP) effective reserves, additional earmarked reserves of HUF 154 billion (0.5% of GDP) are also included in the Budget, that cover principally the compensation related to the changes in the tax system.
In light of the weaker growth outlook and also due to the decision of the Government to create sizable extraordinary reserves in the budget, the measures included in the Convergence Programme would not have ensured the attainment of the deficit target (net of the reserves). Against this backdrop, the Budget Bill contains further balance improving measures both on the expenditure and revenue side.
The following table sets forth the impact of the additional measures not included in the Széll Kálmán Plan and/or the Convergence Programme on the 2012 budget:
| | | | | | | | |
| | | Billion HUF | | | As a percentage of GDP | |
Expenditure side | | | | | | | | |
| | |
Narrowing of tasks in chapter managed appropriations and increase of own resources (fee revenues) | | | 35 | | | | 0.12 | |
| | |
Review and more efficient management of public tasks and duties reduction and abolishment of certain public tasks | | | 110 | | | | 0.38 | |
74
| | | | | | | | |
| | | Billion HUF | | | As a percentage of GDP | |
Reduction of social subsidies granted at local level (decrease in employment substitute benefit) | | | 18 | | | | 0.06 | |
| | |
Reduction of spending related to public assets | | | 5 | | | | 0.02 | |
| | |
Expenditure reduction | | | 168 | | | | 0.58 | |
| | |
Revenue side | | | | | | | | |
| | |
Increase of the standard VAT rate from 25% to 27% | | | 140 | | | | 0.48 | |
| | |
Increase of excises (tobacco* alcohol gasoline) | | | 42 | | | | 0.14 | |
| | |
Increase of gambling tax and taxing of on-line gambling | | | 32 | | | | 0.11 | |
| | |
Increase in employee’s contribution by 1 percentage point and broadening of the base of contributions | | | 112 | | | | 0.38 | |
| | |
Broadening of the PIT base | | | 16 | | | | 0.05 | |
| | |
Stricter condition on accounting losses in the CIT and increase of the company car tax | | | 50 | | | | 0.17 | |
| | |
Increase of tax on unhealthy foods and broadening of tax base | | | 10 | | | | 0.03 | |
| | |
Introduction of (insurance) tax on car accidents | | | 27 | | | | 0.09 | |
| | |
Increase of other fees | | | 11 | | | | 0.04 | |
| | |
Increase of product fees | | | 36 | | | | 0.12 | |
| | |
Change of licence plates | | | 12 | | | | 0.04 | |
| | |
Revenue increase | | | 488 | | | | 1.68 | |
| | |
Total additional adjustment | | | 656 | | | | 2.25 | |
Source: Ministry for National Economy
| * | The impact of the increase of excise duty on tobacco was partly already included in the Convergence Programme projections. |
On November 17, 2011 the Government announced that within the regular annual economic policy consultations with the IMF, the Government has launched negotiations about this type of cooperation.
On December 15, 2011 the Government announced new measures to achieve the deficit target for 2012. The new measures seek to compensate for a lower growth and weaker exchange-rate targets for 2012. The government rebased its 2012 budget on economic growth of 0.5% and an exchange rate of 299HUF/EUR. The new assumptions mean that a gap of HUF 320 billion must be covered in order to achieve the targeted deficit. New measures include tapping HUF 200 billion of reserves while generating an extra HUF 120 billion by diverting private-pension contributions next year, raising HUF 20 billion by
75
raising the excise duty on tobacco products and cutting HUF 52 billion from ministry reserves intended to cover unforeseen expenditures. According to the announcement, the future of the entire pension system should be reconsidered. The government had approved measures aiming to keep the budget deficit at 2.5% of GDP for the year 2012.
On December 15, 2011 the Government and the commercial banks of Hungary concluded an agreement on the bail-out of mortgage debtors indebted in foreign currency. In case of debtors with an at least 90 days delinquency 25% of the debt is remitted in case the mortgage was backed by real estates worth HUH 20 million maximum. In case of debtors with less than 90 days delinquency a fixed-rate repayment schedule will be set up. According to the calculations of the Government the losses stemming from the depreciation of the forint will be born by the state by one-third, the lender by one-third and the debtor by one-third in case the foreign exchange rate do not exceed a threshold. In case the exchange rate exceeds the thresholds of 270HUF/CHF, 340HUF/EUR or 3.3HUF/JPY the losses stemming from the depreciation of the forint to the thresholds of 270HUF/CHF, 340HUF/EUR or 3.3HUF/JPY will be born by the state, the debtor and the lender on an equal basis. The losses stemming from the depreciation of the forint over the thresholds of 270HUF/CHF, 340HUF/EUR or 3.3HUF/JPY will be born by the state exclusively. Commercial banks will be entitled to reduce the surtax by one-third of their losses stemming from the fixed-rate repayment schedule.
On December 16, 2011, the delegation representing the EU and the IMF suspended the negotiations with the Government of Hungary.
As of December 31, 2011, out of the financial assistance package provided by the IMF, SDR 0.1 billion was used for the bank rescue package, SDR 0.9 billion was used in form of loans to banks, and SDR 3.2 billion was used for sovereign debt service. Meanwhile, out of the financial assistance package provided by the EU, EUR 5.5 billion was used for sovereign debt service. The NBH had also drawn down SDR 1.3 billion from the IMF facility as of December 31, 2011.
On January 5, 2012, the Hungarian Government indicated it would conclude an EU-IMF financial assistance package within a reasonable time.
On January 9, 2012, the Ministry for National Economy published the preliminary general government deficit (excluding local governments) for the year 2011, in accordance with GFS methodology. According to the preliminary data available in January 2012, the deficit reached HUF 1,734.4 billion.
On January 11, 2012, the European Commission commenced legal action against Hungary over new legislation that came into force on January 1, 2012. The infringement proceedings concern the following three areas: the independence of the judiciary as regards mandatory early retirement of judges and prosecutors at the age of 62 instead of 70; the independence of the national data protection authority; and the independence of NBH.
On February 21, 2012, the Government announced deficit contracting measures to secure the deficit targets for the year 2012 and 2013. According to the decree of the government the ministers of the corresponding portfolio should elaborate proposals to
1) cut the amount of drug subsidies for the year 2012
2) additional savings for the year 2013
3) cut the expenditures related to the public transportation in the capital of Hungary
4) introduce the electronic road toll system in the middle of the year 2013
5) cut the expenditures of chapter-administered appropriations and other central government expenditures
76
6) a partial suspension of public procurements
On February 22, 2012, the European Commission proposed to freeze transfers from the Cohesion Fund in the amount of EUR 495 million for the year 2013 as a consequence of non-compliance concerning the Excessive Deficit Procedure against Hungary.
On March 6, 2012, the European Commission accepted proposals to Hungary to ensure the deficit target for the year 2012.
On March 13, 2012, the ECOFIN approved the European Commission’s proposal of February 22, 2012 to freeze transfers from the Cohesion Fund.
Subsequently on May 30, 2012, the European Commission published the final recommendation for a Council Recommendation on Hungary’s 2012 national reform programme and delivered a Council opinion on Hungary’s convergence programme for 2012-2015. According to the final recommendation, Hungary should take the following actions:
| | 1. | Correct the excessive deficit by 2012 in a durable manner, by implementing the 2012 budget and reducing reliance on one-off measures. Thereafter, specify all structural measures necessary to ensure a durable correction of the excessive deficit and to make sufficient progress towards the medium-term budgetary objective, including meeting the expenditure benchmark, and ensure sufficient progress towards compliance with the debt reduction benchmark. To mitigate the accumulated macroeconomic imbalances, put the public debt ratio on a firm downward path. |
| | 2. | Revise the Cardinal Act on Economic Stability of Hungary by putting the new numerical rules into a binding medium-term budgetary framework. Continue to broaden the analytical remit of the Fiscal Council, with a view to increasing the transparency of public finances. |
| | 3. | Make the taxation of labour more employment-friendly by alleviating the impact of the 2011 and 2012 tax changes on low earners in a sustainable, budget-neutral manner, for example, by shifting part of the tax burden to energy taxes and recurrent taxes on property. Strengthen measures to encourage women’s participation in the labour market, particularly by expanding childcare and pre-school facilities. |
| | 4. | Strengthen the capacity of the Public Employment Service to increase the quality and effectiveness of training, job search assistance and individualised services, with particular regard for disadvantaged groups. Strengthen the activation element in the public work scheme through effective training and job search assistance. Implement the National Roma Integration Strategy, and mainstream it with other policies. |
| | 5. | Implement measures envisaged to reduce the administrative burden. Ensure that public procurement and the legislative process support market competition and ensure a stable regulatory and business-friendly environment for financial and nonfinancial enterprises, including foreign direct investors. Reduce tax compliance costs and establish a stable, lawful and non-distortive framework for corporate taxation. Remove unjustifiable restrictions on the establishment of large-scale retail premises. Provide specific well-targeted incentive schemes to support innovative small- and medium-sized enterprises in the new innovation strategy. |
| | 6. | Prepare and implement a national strategy on early school-leaving by ensuring adequate financing. Ensure that the implementation of the higher education reform improves access to education for disadvantaged groups. |
77
| | 7. | Reform the public transport system to make it more cost efficient. Increase the crossborder capacities of the electricity network, ensure the independence of the energy regulator and gradually abolish regulated energy prices. |
On March 7, 2012, the European Commission announced that it would take the next step in the infringement procedure against Hungary relating to the independence of the data protection authority and in the case of lowering the retirement age of judges. In the procedure relating to the independence of NBH, the European Commission has requested additional information from the Government of Hungary.
On March 22, 2012, The Hungarian Government announced that the European Commission did not accept the legal arguments of the Hungarian reply of 29 November 2011, which had responded to the detailed EC statement in regard to the infringement procedure on the extra tax for the telecom sector, and it decided to refer the case to the European Court of Justice. However, the Hungarian government is convinced that the Hungarian regulations currently in force are fully compliant with EU law.
On April 2, 2012 the fixed exchange rate loan system for FX debtors was opened. According to the announcement of the Ministry for National Economy the objective of the fixed exchange rate loan system is to cushion the impact of the substantial volatility of the exchange rates of certain foreign currencies and make more calculable the situation of FX debtors. People involved could request participation in the scheme beginning April 2, 2012 from the financial institution which has provided the loan. According to the conditions of the fixed exchange rate loan system, the difference between instalments calculated at a fixed exchange rate and the instalments which are payable according to the actual exchange rate will be booked at two separate accounts. At one of them the difference between the principal repayments and at the other the interest repayment liabilities according to the fixed rate scheme and the actual exchange rate will be registered. Debtors are exempt from paying the latter. The joint capital account which registers the liabilities of a customer will charge interest on the basis of interbank rates and consequently at a discounted rate. A debtor who albeit assuming more difficulties but can still pay the instalments in spite of the higher Swiss franc exchange rate had better continue to repay according to the original contract conditions. Therefore, the fixed exchange rate loan system is the most optimal solution for debtors who have been in such a situation by now which make it impossible for them to repay their debt in the near future according to the statement.
On April 2, 2012, the CSO published the preliminary general government balance (including local governments) for the year 2011, in accordance with ESA methodology. In 2011, the surplus reached HUF 1,180.1 billion, equalling 4.2% of the preliminary 2011 GDP.
From the assets of private pension funds – except for real returns and additional membership fees – HUF 2,677.7 billion, and related to this, HUF 44.0 billion of other revenues were accounted in the system of national accounts as the revenues of the general government sector in 2011. Without the transfer of assets of private pension funds the revenues of the general government sector amounted to HUF 12,161.7 billion, the deficit to HUF 1,541.6 billion, the latter of which is 5.5% of GDP. The deficit increased by HUF 395.5 billion, 1.2 percentage points of GDP compared to 2010.
Simultaneously, the NBH published the preliminary general government debt figure (including local governments) as of the end of 2011, in accordance with ESA methodology. The debt reached HUF 22,692 billion, equalling 80.6% of the preliminary GDP for the year 2011.
The following table sets forth those legislative measures that have been undertaken to implement the Széll Kálmán Plan as of October 1, 2012:
78
| | |
| Date | | Action |
| |
| February 1, 2012 | | The new public employment system has been launched. |
| |
| On April 3, 2012 | | The Government made a resolution on government guarantee for a maximum amount of HUF 63 billion to support the surety of Municipality of Budapest provided as security to the restructuring loans of Budapest Public Transport Company (BKV). |
| |
| September 1, 2012 | | The new system of higher education has been launched. |
| |
| September 1, 2012 | | The new Act on public education entered into force. |
On April 23, 2012, the Hungarian government adopted the programme entitled “Next Step: Széll Kálmán Plan 2.0”, which includes the Convergence Programme and the National Reform Programme. In 2012 the first Széll Kálmán Plan aimed for a fiscal adjustment of HUF 550 billion, 83.4% of which was achieved according to the statement issued by the government of Hungary on April 23, 2012. The measures in the Széll Kálmán Plan 2.0 target additional fiscal adjustments totalling HUF 150 billion in 2012. According to the programme, 73% of the objectives of the first Széll Kálmán Plan – as a consequence of government measures – will be met by 2013, whereas in 2013 the government of Hungary will further improve the situation of the state budget by approximately HUF 600 billion (government estimate implies a range of HUF 567 billion – HUF 665 billion) through the Széll Kálmán Plan 2.0. Consequently, Hungary is carrying out a structural adjustment programme totalling 2% of GDP in 2012 and 4% of GDP in 2013.
The government of Hungary approved additional measures in April 2012 which are expected to bring the expected improvement of the general government deficit for the year 2012 together with the measures taken in February and the forecast of a better-than-calculated balance for the 2012 budget at the local government subsystem.
The following table sets forth the measures announced in the Széll Kálmán Plan 2.0 and their estimated effect on the general government deficit for the years 2012 and 2013, respectively:
| | | | | | | | |
| | | 2012 | | | 2013 | |
| | | (HUF billion) | |
Reduction of expenditures of budgetary institutions, chapter-and other centrally administered appropriations | | | 44.7 | | | | 44.7 | |
Reduction of pharmaceutical subsidies | | | 10.0 | | | | 40.0 | |
Balance improvement of local governments | | | 60.0 | | | | 90.0 | |
Introduction of a telecommunication services tax | | | 30.0 | | | | 52.0 | |
Introduction of reverse charge VAT in agriculture | | | 10.0 | | | | 15.0 | |
Launching the electronic road toll at an increased level | | | 0.0 | | | | 75.0 | |
Reduction of central subsidies to metropolitan public transportation | | | 0.0 | | | | 10.0 | |
Elimination of central subsidies to the Research and Technological Innovation Fund | | | 0.0 | | | | 25.2 | |
Amendment of public tasks performed by state-owned companies | | | 0.0 | | | | 20.0 | |
Introduction of a financial transaction levy | | | 0.0 | | | | 130.0-228.0 | |
Maintaining and extending the income tax levied on energy providers | | | 0.0 | | | | 55.0 | |
79
| | | | | | | | |
Merging and transforming current taxes levied on insurance companies | | | 0.0 | | | | 15.0 | |
Reduction of the number of minor taxes | | | 0.0 | | | | -5.0 | |
Total: | | | 154.7 | | | | 567-665 | |
Source: Ministry for National Economy
Furthermore, the surtax on financial institutions will be halved, in accordance with an agreement concluded between the government of Hungary and the Hungarian Banking Association. By implementing the Széll Kálmán Plan 2.0 the government of Hungary intends to finalise the transition to a tax system that enables reduction of taxes on labour by increasing taxes on consumption and sales. This would be a minor burden on individuals but would contribute significantly to the budget as a whole. The new tax measures are structural, and thus they will enable the government of Hungary to create sustainable stability on the revenue side of the budget.
The Széll Kálmán Plan 2.0 also includes the National Reform Programme of Hungary for 2012. The National Reform Programme introduces measures which aim to achieve the objectives of the Europe 2020 Strategy on the fields of labour market policy, research – development – innovation, climate policy and energy efficiency, education and social inclusion.
On April 23, 2012, the Parliament of Hungary accepted the Act on Takeover of Special Institutions for Inpatients of Local Governments and the Amendment of Certain Acts Related Thereto. Due to this Act, the assets and debt of 70 health care institutions shall be transferred to the central government. The date of devolution of the assets was May 1, 2012. The assumption of debt should have taken effect on July 31, 2012; however, the assumption agreements have not been settled as of September 20, 2012.
On April 25, 2012, the European Commission announced that according to the assessment of the European Commission Hungary has taken sufficient action and commitments to enter into negotiations on precautionary balance of payment assistance. This decision has been taken in light of commitments by Hungary, confirmed by Mr. Viktor Orbán, Prime Minister of Hungary on April 24, 2012 after his meeting with Jose Manuel Barroso, President of the European Commission, to take tangible steps to ensure compliance with EU law on all the issues that are relevant for the stable and independent legal environment that lies at the heart of investors’ confidence and influences macroeconomic stability. Based on Hungary’s reply to the European Commission’s administrative letter on this matter, the European Commission agreed on April 25, 2012 to close the infringement case on the independence of the Central Bank once the relevant legislation is adopted. The Hungarian authorities have also committed to continue consultations with the European Central Bank in view of reaching agreement on the remaining open issues. Hungary has also committed to address promptly and fully the recommendations of the Venice Commission on key priority areas in the field of the judiciary reform. Before the negotiations regarding the EU-IMF financial assistance for Hungary can be concluded, the European Commission expects that the commitments to be fully implemented.
On May 11 2012, the Government submitted three new Bills (on Telecom Tax, on Uniform Insurance Tax, on Financial Transaction Duty Tax) to the Parliament of Hungary to introduce the taxes announced in the Széll Kálmán Plan 2.0.
On May 18, 2012, the Parliament adopted the Act on Telecom Tax. As of July 1, 2012, the telecom tax is imposed on calls via mobile phone and messages (‘SMS’ and ‘MMS’). The tax rate is HUF 2 per minute and per message, though for individuals the first 10 minutes is tax-free in every month, and the tax is capped at HUF 700 for individuals and HUF 2,500 for companies per month.
On May 30, 2012, the European Commission adopted a proposal for a Council decision to lift the suspension of commitments from the Cohesion Fund for Hungary, after concluding that the country has taken the necessary action to correct its excessive deficit, in line with the Council Recommendation of March 13, 2012.
80
On June 14, 2012, the Government of Hungary approved the first draft of the budget for the year 2013. According to the first draft, the general government deficit for the year will equal HUF 660 billion, total revenues will equal HUF 14,840 billion, and total expenditures will equal HUF 15,500 billion. The draft budget was based on assumptions of a 4.2% inflation rate, 1.6% real growth rate and a foreign exchange rate of HUF 299.4/Eur.
On June 21, 2012, the Government of Hungary submitted a proposal for the Parliament to amend the legislation regarding NBH. The IMF announced that the IMF would examine the proposal together with the European Commission and the European Central Bank to determine if the proposal is sufficient to ensure central bank independence.
On June 28, 2012, Mr. Antal Rogán, the leader of the parliamentary faction of the majority governing party Fidesz announced that the Ministry for National Economy and the parliamentary factions of Fidesz and the minority governing party CDPP had concluded an agreement whereby the Government will reduce tax burdens in the amount of HUF 300 billion. Taxes on labour will be reduced in case of employees below the age of 25 and above the age of 55, and blue-collar workers. Small enterprises will be entitled to choose to pay a favourable tax instead of paying taxes normally. To cover the additional expenditures the Government will extend the base of the financial transaction duty; contrary to the original plans the Hungarian State Treasury and the Hungarian Central Bank will not be exempt from the tax. According to the calculations of the Ministry for National Economy this will generate an additional HUF 200 billion. According to the Ministry for National Economy the interest rate expenditures would be significantly lower than planned originally, covering an additional HUF 100 billion of revenue loss. Moreover the financial transaction duty would be capped at HUF 6000 per transaction except for transactions by the Hungarian State Treasury and the NBH. As a result the expected revenue would be HUF 140 billion instead of HUF 280 billion planned originally. The lower than expected interest revenues would cover HUF 50 billion of the revenue loss. The expected 2% real growth rate (higher than the 1.6% real growth rate planned originally) would cover the revenue loss in the amount of HUF 50 billion. Moreover the expected revenue from the financial transactions duty paid by the Hungarian State Treasury and the NBH would be HUF 40 billion higher than originally planned. As a result the measures will not increase the general government deficit.
On July 9, 2012, the Parliament adopted the Act on Financial Transaction Duty, which will go into effect on 1 January 2013. The new duty will be levied on those payment service providers (PSPs) which have their registered seat or branch office in Hungary, with special rules for the National Bank of Hungary. NBH shall pay the duty solely upon the issuance of NBH securities with a term not exceeding two weeks and upon accepting NBH deposits with a maturity of between one day and two weeks. The duty shall be paid monthly, and the general duty rate will be 0.1% of the amount of the financial transaction, however, the duty – with the exception of transactions by NBH or Hungarian Treasury or Settlement Center of the Post Office—cannot exceed HUF 6,000 per transaction. In the case of one day deposits at NBH, the duty rate will be 0.01%. Also on July 9, 2012 the Parliament adopted the Act on Uniform Insurance Tax in order to decrease the number of taxes imposed on insurance companies at present. This Act will go into effect on 1 January 2013, and by introduction of this new type of tax, the surtax imposed on insurance companies and the fire protection contribution will be abolished.
On July 12, 2012 the Parliament approved the principal figures of the budget for the year 2013. According to the decision the total revenues of the general government will amount to HUF 15,083 billion, the total expenditures will amount to HUF 15,733 billion. As a result, the general government deficit for the year 2013 will be HUF 653 billion.
On July 17, 2012 negotiations started among the Government of Hungary, the IMF and the EC; delegates from the European Central Bank took part in the negotiations as observers. The negotiations ended on July 25, 2012 as planned. According to the press release issued by the European Commission on July 26, 2012, the Hungarian Government’s commitment to further fiscal consolidation is to be welcomed. At the
81
same time, meeting the targets in the Convergence Programme in a durable and balanced manner as recommended by the European Council will require decisive steps. Moreover, in order to put the public debt ratio onto a firm downward path and maintain macroeconomic stability, a stable policy and institutional framework is needed based on a more business friendly environment and continued structural reforms that enhance growth and employment. According to the press release, the European Commission plans to continue the constructive negotiations with the authorities on these issues in cooperation with the IMF and the ECB in the period ahead.
On August 7, 2012, the Ministry for National Economy published the preliminary general government deficit (excluding local governments) for the first seven months of the year 2012, in accordance with GFS methodology. The deficit reached HUF 437.5 billion, equalling 75.9% of the planned deficit for the year 2012.
On September 6, 2012, the Ministry for National Economy published the preliminary general government deficit (excluding local governments) for the first eight months of 2012, in accordance with GFS methodology. The deficit reached HUF 559.5 billion, equalling 97.1% of the targeted deficit for the year 2012.
On September 7, 2012, the Bill on Second Amendment to Fundamental Law (New Constitution of Hungary) was introduced to the Parliament. Pursuant to such Amendment, the retirement age of the judges and prosecutors will be modified from 62 (general retirement age) to 65 years; however, the retirement age of heads of courts and judicial divisions will be 62 years.
On September 11, 2012, the Bill on amendment to the Act on Central Budget of Hungary for year 2012 was adopted by the Parliament, which provides for a HUF 150 billion loan to Hungarian Eximbank provided by the state as owner.
Central Government Budget
The following table sets forth information concerning central government revenues and expenditures for the final budget for the years 2007, 2008, 2009, 2010 and 2011, and the planned and preliminary budgets for 2012:
Central Government Revenues and Expenditures(1)
| | | | | | | | | | | | | | | | | | | | | | | | | | | | |
| | | Revenues and expenditures of the central budget | |
| | | 2007 | | | 2008 | | | 2009 | | | 2010 | | | 2011 | | | 2012 | | | 2012 | |
| | Final | | | Final | | | Final | | | Final | | | Final | | | Planned | | | Expected | |
| | | (HUF billions) | |
Revenues | | | | | | | | | | | | | | | | | | | | | | | | | | | | |
Payments of Economic Units | | | | | | | | | | | | | | | | | | | | | | | | | | | | |
Corporate taxes (including financial institutions) | | | 700.3 | | | | 699.9 | | | | 597.2 | | | | 343.9 | | | | 352.0 | | | | 424.3 | | | | 425.8 | |
DPTT | | | 31.5 | | | | 38.8 | | | | 26.6 | | | | 108.9 | | | | 111.5 | | | | 94.0 | | | | 110.0 | |
Gambling tax | | | 71.5 | | | | 72.7 | | | | 66.7 | | | | 53.4 | | | | 51.6 | | | | 78.4 | | | | 58.4 | |
Eco tax | | | 19.9 | | | | 25.2 | | | | 23.9 | | | | 23.5 | | | | 23.5 | | | | 26.4 | | | | 25.9 | |
Simplified business tax | | | 152.8 | | | | 166.5 | | | | 169.7 | | | | 181.9 | | | | 172.3 | | | | 225.0 | | | | 170.0 | |
Other central payments | | | 124.1 | | | | 139.2 | | | | 111.6 | | | | 44.1 | | | | 108.6 | | | | 178.5 | | | | 178.5 | |
Other payments | | | 19.3 | | | | 30.1 | | | | 21.7 | | | | 36.3 | | | | 32.0 | | | | 33.0 | | | | 33.0 | |
82
| | | | | | | | | | | | | | | | | | | | | | | | | | | | |
Surtax on Financial Institutions | | | 0.0 | | | | 0.0 | | | | 0.0 | | | | 182.3 | | | | 186.5 | | | | 187.0 | | | | 51.2 | |
Surtax on Retail, Telecommunications and Energy Sectors | | | 0.0 | | | | 0.0 | | | | 0.0 | | | | 151.7 | | | | 171.9 | | | | 155.0 | | | | 160.0 | |
| | | | | | | | | | | | | | | | | | | | | | | | | | | | |
Total | | | 1,119.2 | | | | 1,172.4 | | | | 1,017.5 | | | | 1,125.8 | | | | 1,209.9 | | | | 1,401.6 | | | | 1,212.8 | |
| | | | | | | | | | | | | | | | | | | | | | | | | | | | |
Taxes on Consumption | | | | | | | | | | | | | | | | | | | | | | | | | | | | |
Value added tax | | | 1,979.4 | | | | 2,114.1 | | | | 2,168.5 | | | | 2,313.6 | | | | 2,219.5 | | | | 2,722.0 | | | | 2,867.6 | |
Excises | | | 912.0 | | | | 929.7 | | | | 902.4 | | | | 886.6 | | | | 909.6 | | | | 927.9 | | | | 919.5 | |
Public health production tax | | | | | | | | | | | | | | | | | | | 3.3 | | | | | | | | | |
Telecom levy | | | | | | | | | | | | | | | | | | | | | | | | | | | 14.7 | |
| | | | | | | | | | | | | | | | | | | | | | | | | | | | |
Total | | | 2,891.4 | | | | 3,043.8 | | | | 3,070.9 | | | | 3,200.1 | | | | 3,132.3 | | | | 3,649.9 | | | | 3,801.8 | |
| | | | | | | | | | | | | | | | | | | | | | | | | | | | |
Payments of Households | | | | | | | | | | | | | | | | | | | | | | | | | | | | |
Gross PIT revenues | | | 1,800.0 | | | | 1,998.9 | | | | 1,874.2 | | | | 1,767.9 | | | | 1,382.8 | | | | 1,574.3 | | | | 1,521.0 | |
PIT revenues of central budget(1) | | | 1,697.3 | | | | 1,872.4 | | | | 1,744.4 | | | | 1,632.0 | | | | 1,256.4 | | | | 1,461.2 | | | | 1,407.8 | |
Private persons’ special tax | | | 20.8 | | | | 27.6 | | | | 25.5 | | | | 6.1 | | | | 0.3 | | | | 0.0 | | | | 0.0 | |
Tax payments | | | 5.6 | | | | 5.8 | | | | 8.3 | | | | 3.0 | | | | 0.2 | | | | 0.2 | | | | 0.2 | |
Fees | | | 118.8 | | | | 131.0 | | | | 112.2 | | | | 83.5 | | | | 75.3 | | | | 102.5 | | | | 98.5 | |
Other Revenues | | | | | | | | | | | | | | | | | | | 3.7 | | | | 0.2 | | | | 1.4 | |
| | | | | | | | | | | | | | | | | | | | | | | | | | | | |
Total | | | 1,945.3 | | | | 2,163.3 | | | | 2,020.2 | | | | 1,860.5 | | | | 1,462.3 | | | | 1,677.2 | | | | 1,621.0 | |
| | | | | | | | | | | | | | | | | | | | | | | | | | | | |
Central Budgetary Institutions and Chapter Administered Appropriations | | | | | | | | | | | | | | | | | | | | | | | | | | | | |
Revenue of the central budgetary institutions | | | 828.8 | | | | 778.2 | | | | 794.2 | | | | 890.6 | | | | 925.7 | | | | 952.1 | | | | 1,252.1 | |
Own revenues of chapter administered professional appropriations | | | 150.8 | | | | 144.5 | | | | 227.9 | | | | 165.3 | | | | 353.8 | | | | 16.1 | | | | 90.9 | |
EU support of chapter administered professional appropriations | | | 287.4 | | | | 329.0 | | | | 602.7 | | | | 814.0 | | | | 890.1 | | | | 1,527.7 | | | | 1,357.9 | |
| | | | | | | | | | | | | | | | | | | | | | | | | | | | |
Total | | | 1,266.9 | | | | 1,251.7 | | | | 1,624.8 | | | | 1,869.9 | | | | 2,169.6 | | | | 2,495.9 | | | | 2,700.9 | |
| | | | | | | | | | | | | | | | | | | | | | | | | | | | |
Payments of Central Budgetary Institutions | | | 49.5 | | | | 94.4 | | | | 65.5 | | | | 57.3 | | | | 45.5 | | | | 32.3 | | | | 33.3 | |
Contribution to National Social Fund | | | | | | | | | | | | | | | | | | | | | | | 17.7 | | | | 17.7 | |
Payments of Local Governments | | | 11.3 | | | | 17.0 | | | | 14.9 | | | | 11.6 | | | | 7.2 | | | | 0.0 | | | | 6.6 | |
Payments of Extrabudgetary and Social Security Funds | | | 135.9 | | | | 143.4 | | | | 146.1 | | | | 8.0 | | | | 0.0 | | | | 0.0 | | | | 0.0 | |
Revenues of International Transactions | | | 3.5 | | | | 1.5 | | | | 2.1 | | | | 1.3 | | | | 4.2 | | | | 0.6 | | | | 0.4 | |
Payments Related to State Property | | | 48.8 | | | | 71.7 | | | | 143.4 | | | | 71.0 | | | | 40.0 | | | | 50.4 | | | | 106.8 | |
Other Revenues | | | 20.3 | | | | 47.7 | | | | 39.9 | | | | 125.2 | | | | 39.5 | | | | 19.3 | | | | 8.6 | |
Revenues Related to Debt Service | | | 0.2 | | | | 9.7 | | | | 0.1 | | | | 0.0 | | | | 0.0 | | | | 0.0 | | | | 0.0 | |
Lump Sum Cash Flow Facility from EU | | | 0.0 | | | | 51.1 | | | | 28.7 | | | | -8.7 | | | | 22.9 | | | | 39.8 | | | | 20.1 | |
83
| | | | | | | | | | | | | | | | | | | | | | | | | | | | |
Customs and import duties | | | 9.2 | | | | 9.8 | | | | 8.2 | | | | 8.6 | | | | 9.6 | | | | 8.8 | | | | 9.3 | |
| | | | | | | | | | | | | | | | | | | | | | | | | | | | |
Pension Reform and Debt Reduction Fund | | | 0.0 | | | | 0.0 | | | | 0.0 | | | | 0.0 | | | | 95.6 | | | | 0.0 | | | | 0.0 | |
| | | | | | | | | | | | | | | | | | | | | | | | | | | | |
Total Revenues(2) | | | 7,501.6 | | | | 8,077.3 | | | | 8,182.1 | | | | 8,330.7 | | | | 8,238.7 | | | | 9,393.5 | | | | 9,539.3 | |
| | | | | | | | | | | | | | | | | | | | | | | | | | | | |
Interest Revenues | | | 92.7 | | | | 82.0 | | | | 142.3 | | | | 130.5 | | | | 103.5 | | | | 59.3 | | | | 112.0 | |
| | | | | | | | | | | | | | | | | | | | | | | | | | | | |
Total Revenues(3) | | | 7,594.3 | | | | 8,159.3 | | | | 8,324.3 | | | | 8,461.1 | | | | 8,342.2 | | | | 9,452.8 | | | | 9,651.3 | |
| | | | | | | | | | | | | | | | | | | | | | | | | | | | |
Expenditures | | | | | | | | | | | | | | | | | | | | | | | | | | | | |
Subsidiaries to Economic Units | | | 197.4 | | | | 203.1 | | | | 178.6 | | | | 201.4 | | | | 212.0 | | | | 237.5 | | | | 236.6 | |
Support to the Media | | | 52.2 | | | | 51.3 | | | | 53.7 | | | | 45.8 | | | | 53.7 | | | | 61.8 | | | | 61.8 | |
Consumer Price Subsidy | | | 111.9 | | | | 107.6 | | | | 107.4 | | | | 107.3 | | | | 108.3 | | | | 93.0 | | | | 94.0 | |
Housing Grants | | | 228.5 | | | | 185.6 | | | | 199.3 | | | | 147.4 | | | | 129.1 | | | | 120.1 | | | | 168.3 | |
Family Benefits Social Subsidiaries | | | | | | | | | | | | | | | | | | | | | | | | | | | | |
Family benefits | | | 508.1 | | | | 503.0 | | | | 464.6 | | | | 461.5 | | | | 454.9 | | | | 456.1 | | | | 453.3 | |
Income supplement benefits | | | 151.7 | | | | 156.6 | | | | 149.9 | | | | 144.1 | | | | 136.6 | | | | 68.0 | | | | 64.1 | |
Under-age benefits | | | | | | | | | | | | | | | | | | | | | | | 303.7 | | | | 290.7 | |
Other specific subsidies | | | 26.5 | | | | 26.3 | | | | 26.5 | | | | 26.8 | | | | 27.5 | | | | 24.9 | | | | 29.6 | |
| | | | | | | | | | | | | | | | | | | | | | | | | | | | |
Total | | | 686.3 | | | | 685.9 | | | | 641.0 | | | | 632.4 | | | | 618.9 | | | | 852.6 | | | | 837.6 | |
| | | | | | | | | | | | | | | | | | | | | | | | | | | | |
Central Budgetary Institutions and Chapter Administered Appropriations | | | | | | | | | | | | | | | | | | | | | | | | | | | | |
Expenditures of central budgetary institutions | | | 2,382.6 | | | | 2,348.9 | | | | 2,239.2 | | | | 2,371.7 | | | | 2,521.0 | | | | 2,415.7 | | | | 2,795.9 | |
Chapter administered professional appropriations | | | 1,814.5 | | | | 1,647.0 | | | | 1,808.0 | | | | 1,833.1 | | | | 2,209.7 | | | | 2,445.6 | | | | 2,422.7 | |
Central investment | | | 37.3 | | | | 0.0 | | | | 0.0 | | | | 0.0 | | | | 0.0 | | | | 0.0 | | | | 0.0 | |
Chapter balance reserve | | | 0.0 | | | | 0.0 | | | | 0.0 | | | | 0.0 | | | | 0.0 | | | | 0.0 | | | | 0.0 | |
| | | | | | | | | | | | | | | | | | | | | | | | | | | | |
Total | | | 4,234.4 | | | | 3,995.8 | | | | 4,047.2 | | | | 4,204.8 | | | | 4,730.7 | | | | 4,861.4 | | | | 5,218.6 | |
| | | | | | | | | | | | | | | | | | | | | | | | | | | | |
Support to Political Parties and Other Civil Organisations | | | 5.2 | | | | 5.2 | | | | 5.3 | | | | 5.0 | | | | 3.8 | | | | 3.8 | | | | 3.8 | |
Transfer to Social Security Funds | | | 777.8 | | | | 835.0 | | | | 913.8 | | | | 1,147.5 | | | | 637.8 | | | | 675.5 | | | | 679.2 | |
Transfer to Local Governments | | | | | | | | | | | | | | | | | | | | | | | | | | | | |
Direct transfer from the budget | | | 1,251.9 | | | | 1,295.3 | | | | 1,178.5 | | | | 1,123.5 | | | | 1,069.2 | | | | 916.8 | | | | 938.5 | |
Yielded PIT revenues | | | 102.6 | | | | 126.4 | | | | 129.9 | | | | 135.9 | | | | 126.4 | | | | 113.1 | | | | 113.1 | |
| | | | | | | | | | | | | | | | | | | | | | | | | | | | |
Total | | | 1,354.5 | | | | 1,421.7 | | | | 1,308.4 | | | | 1,259.4 | | | | 1,195.6 | | | | 1,029.9 | | | | 1,051.6 | |
| | | | | | | | | | | | | | | | | | | | | | | | | | | | |
Transfer to Extrabudgetary Funds | | | 27.9 | | | | 32.8 | | | | 40.6 | | | | 17.6 | | | | 89.1 | | | | 72.5 | | | | 93.8 | |
Expenditures of International Transactions | | | 14.6 | | | | 14.2 | | | | 9.5 | | | | 2.6 | | | | 0.9 | | | | 2.3 | | | | 4.7 | |
Debt Service Related Expenditures | | | 10.3 | | | | 20.6 | | | | 18.4 | | | | 9.9 | | | | 11.8 | | | | 13.7 | | | | 13.7 | |
Other Expenditures | | | 22.5 | | | | 26.1 | | | | 22.6 | | | | 29.4 | | | | 14.7 | | | | 18.2 | | | | 18.7 | |
84
| | | | | | | | | | | | | | | | | | | | | | | | | | | | |
Reserves | | | | | | | | | | | | | | | | | | | | | | | 412.1 | | | | 28.4 | |
Extraordinary Expenditures | | | 73.2 | | | | 16.0 | | | | 16.9 | | | | 9.2 | | | | 266.0 | | | | 10.0 | | | | 10.0 | |
Government Guarantees Redeemed | | | 10.3 | | | | 17.1 | | | | 20.4 | | | | 33.5 | | | | 29.4 | | | | 40.2 | | | | 46.3 | |
Contribution to EU Budget | | | 189.5 | | | | 210.6 | | | | 223.7 | | | | 230.2 | | | | 233.0 | | | | 264.3 | | | | 264.3 | |
Expenditures Related to State Property | | | 0.0 | | | | 67.0 | | | | 99.3 | | | | 95.4 | | | | 633.3 | | | | 114.6 | | | | 146.2 | |
Interest Payments | | | 995.7 | | | | 1,133.5 | | | | 1,161.8 | | | | 1,136.4 | | | | 1,101.1 | | | | 1,163.0 | | | | 1,226.0 | |
| | | | | | | | | | | | | | | | | | | | | | | | | | | | |
Total Expenditures | | | 8,992.3 | | | | 9,029.3 | | | | 9,067.9 | | | | 9,315.1 | | | | 10,069.3 | | | | 10,046.6 | | | | 10,203.7 | |
| | | | | | | | | | | | | | | | | | | | | | | | | | | | |
Source: Ministry of Finance
Notes:—
| (1) | The PIT share to local governments will be reduced from 40% to 8% in 2012; base corrections between 2007 and 2011: the yearly differences have been moved from Own revenues into Subsidies. |
| (2) | Excluding interest revenues. |
| (3) | Including interest revenues |
Central Government Budget Process
The Ministry for National Economy is responsible for preparing the central government budget on a calendar year basis for the Government. The Government submits the central government budget to Parliament for consideration and ultimate approval. The annual central government budget for each coming year is supposed to be approved prior to the beginning of the relevant year. If Parliament does not approve the budget by such time, the Government is obliged to propose a bill on an interim central government budget without delay. If the bill on the interim central government budget is not approved by Parliament either, the Government is entitled to collect revenues due to the central government budget in accordance with the laws then in force and to make expenditures in line with the central government budget for the preceding calendar year.
Within eight months following the end of each calendar year, the final accounts for the preceding year are compiled by the Government and are submitted to Parliament for final approval.
The major components of revenue under the central government budget are comprised of taxes imposed on consumption (including VAT), enterprise taxes and taxes on households (primarily personal income taxes). The major expenditure items of the central government budget are comprised of debt service and transfers to the social security funds, budgetary institutions, local governments and extra-budgetary funds.
Roles of the Ministry for National Economy, the Hungarian State Treasury and the Government Debt Management Agency
As of May 29, 2010, the Ministry for National Economy assumed responsibility from the Ministry of Finance for supplying information to support the Government’s decision-making and for coordinating issues falling within the Government’s scope of authority in relation to public finances. See “Hungary – Political System – Government”. Specific responsibilities include the preparation of the bill on the final accounts of the central government and the central government budget, which is presented to the Parliament each calendar year.
85
The Ministry for National Economy is required to ensure the execution of the central budget, the solvency of the central government, the financing of the central government and the recording of government debt, including guarantees granted and sureties undertaken by the Government, and loans and claims of the central government. These tasks are executed through the Treasury, and debt and liquidity management tasks are carried out by Államadósság Kezelő Központ Zártkörűen Működő Részvénytársaság, a special government debt management agency (the Government Debt Management Agency Private Company Limited by Shares or “GDMA Pte Ltd.”).
The Treasury was established on January 1, 1996 as a central budgetary organisation. The legal and professional supervision of the Treasury is performed by the Ministry for National Economy. Within its budget execution responsibilities, the Treasury’s main task is the management of budget appropriations and government cash flows and the determination of the daily financing needs of the central government. The management of budget appropriations includes the registration of annual appropriations, the monitoring of their changes and the right to authorise payments from appropriated amounts.
The cash management duties of the Treasury include account management for the budgetary institutions, which, in accordance with the Act on Public Finances, are obliged to keep their accounts with the Treasury. The Treasury administers the Single Treasury Account, which is the cash account of the Treasury held at the NBH.
The Treasury’s responsibilities also include the provision of funds for public investments, the transfer of contributions and subsidies to municipalities, and the management and collection of loans and other claims of the central government.
The Government’s borrowing needs are financed by the GDMA Pte Ltd. The Finance Minister established the GDMA Pte Ltd. in order to concentrate debt management functions into one organisation. Accordingly, the GDMA Pte Ltd. manages, renews and records the forint and foreign exchange debt of the central government and, pursuant to the amendment of the Public Financing Act of 2003, manages the liquidity of the Single Treasury Account. In the context of liquidity management, the GDMA Pte Ltd. introduced new secondary market operations (such as repurchase transactions on the domestic securities market).
In the domestic market, the responsibilities of the GDMA Pte Ltd. include the administration of auctions and subscriptions, and the development of the institutional framework and structure of government securities markets. Further, the GDMA Pte Ltd. provides easily accessible, up-to-date information on the government securities markets and on financing of Hungary’s borrowing needs in order to encourage transparency. With respect to foreign debt management, the GDMA Pte Ltd. acts in the name of Hungary in raising funds, manages the foreign exchange debt of the central government, ensures promptness and accuracy in respect of debt service payments and effects hedging transactions to reduce risks.
Taxation
The current Hungarian taxation system was introduced in 1988. The most important elements of the Hungarian tax system are corporate profit tax, personal income tax, value added tax, excise duty and local taxes. The Hungarian tax system has undergone moderate changes in recent years in an effort to improve competitiveness and to harmonise the Hungarian tax system with EU standards.
Hungarian tax law distinguishes between domestic and foreign taxpayers. The tax liability of a domestic taxpayer extends to income originating from both Hungary and abroad, while the tax liability of a non-Hungarian taxpayer is restricted to its Hungarian source of income as defined by the respective Hungarian tax law and is also generally affected by the applicable double taxation treaty. Hungary has entered into a double taxation treaty with more than 60 countries, including almost all of the OECD countries. Of the OECD countries, Hungary does not have a double taxation treaty with New Zealand and Mexico.
Hungary, like many developing countries, has a substantial “shadow” economy, which is able to avoid paying taxes. However, such “shadow” economy has diminished in recent years, as evidenced by increases in tax receipts that have outpaced GDP growth. Further improvement is expected as larger companies and multinational enterprises assume a greater role in the Hungarian economy.
86
On July 9, 2012, the Parliament adopted the Act on Financial Transaction Duty, which will go into effect on January 1, 2013. The new duty will be levied on those payment service providers (PSPs) which have their registered seat or branch office in Hungary, with special rules for the NBH. NBH shall pay the duty solely upon the issuance of NBH securities with a term not exceeding two weeks and upon accepting NBH deposits with a maturity of between one day and two weeks. The duty shall be paid monthly, and the general duty rate will be 0.1% of the amount of the financial transaction, however, the duty – with the exception of transactions by NBH or Hungarian Treasury or Settlement Center of the Post Office – cannot exceed HUF 6,000 per transaction. In the case of one day deposits at NBH, the duty rate will be 0.01%. Also on July 9, 2012 the Parliament adopted the Act on Uniform Insurance Tax in order to decrease the number of taxes imposed on insurance companies at present. This Act will go into effect on January 1, 2013, and by introduction of this new type of tax, the surtax imposed on insurance companies and the fire protection contribution will be abolished.
Corporate Profit Tax and Corporate Dividend Tax
As of January 1, 2010, the general corporate tax rate on profits increased from 16% to 19%, but taxpayers may take advantage of certain tax preferences. As of July 1, 2010, the availability of the lower 10% corporate tax rate for companies generating revenues of up to HUF 50 million was expanded to apply to companies generating revenues of up to HUF 500 million. Domestic entities receiving dividends are exempted from Hungarian dividend tax. A foreign entity receiving dividend, interest and royalties from a local source is not subject to withholding tax. Pursuant to legislation enacted by Parliament on November 16, 2010, from January 1, 2013 the corporate tax rate will be reduced to a flat rate of 10%.
Personal Income Tax
Until 2005, Hungary had a three-tier graduated personal income tax rate structure with rates of 18%, 26% and 38%. On January 1, 2005, the second tier personal income tax rate (26%) was abolished. In January 1, 2006, the upper tier rate was reduced from 38% to 36%. In January 2009, the personal income tax base broadened, while the first tier rate decreased from 18% to 17% and the upper tier rate decreased from 36% to 32%. As of January 1, 2010, the tax bracket was increased from HUF 1.9 million to HUF 5 million and the basis of tax payment was simultaneously broadened.
As of January 1, 2011, Hungary’s personal income tax rate structure was simplified with the introduction of a one-tier tax rate system, with a flat tax rate of 16% on personal income.
Value Added Tax
As of September 1, 2006, the 15% VAT rate (VAT rate lower than the standard rate imposed on certain items) was increased to 20%, while the standard VAT rate decreased from 25% to 20%, and the 5% rate on special needs items (e.g., medicine and books) remained unchanged. As of July 1, 2009, the standard VAT rate was increased to 25%. A reduced 18% VAT rate was introduced with respect to certain basic food items. Currently, there is no tax imposed on some services (e.g., postal and financial services). The current Hungarian VAT system is fully harmonised with all relevant applicable EU Directives. The standard VAT rate was increased to 27% as of January 1, 2012.
Registration Tax
Registration tax has been levied on the registration of cars since February 2004; however, in line with a recent decision of the European Parliament, this tax will be abolished gradually by 2016.
Excise Tax
An excise duty is levied on the manufacturing, importing, warehousing, storage and distribution of mineral oils, alcoholic products, beer, wine, champagne, intermediary alcohol products and tobacco products. As of January 1, 2010, excise duty levied on petrol and alcoholic beverages increased by 10% and on diesel by 7.6% and the minimum tax on cigarettes decreased by 8.3%. As of November 1, 2011, excise duty levied on gasoline increased by 13%, on alcohol spirits increased by 5%- 50%, on cigarettes increased by 8% and on tobacco increased by 12%.
87
Luxury Tax
In January 2006, the Government introduced a tax on the purchase of expensive residential buildings with a value in excess of HUF 100 million. On December 17, 2008, the Constitutional Court of Hungary held the Act on Luxury Tax to be unconstitutional and set aside the regulation retroactively. As of January 1, 2010, a new tax was levied on certain assets of high value (e.g., residential real property, watercraft, aircraft and high performance cars). On January 28, 2010, the Constitutional Court of Hungary in its final and non-appealable decision, ruled that such law imposing taxes on high-value residential real property is unconstitutional under the laws of Hungary due to uncertainties in assessing the market value of residential real property. The Constitutional Court did not overturn the tax on other high-value assets (e.g., watercraft, aircraft and high performance cars). As of August 16, 2010, the tax on high-value assets (e.g., watercraft, aircraft and high performance cars) was abolished by the Government.
Solidarity Surtax
As of January 1, 2010, the Government abolished the 4% solidarity surtax, which was in effect since September 1, 2006 and was payable by entities subject to corporate tax and natural persons with incomes above a certain level.
Surtax on Financial Institutions
On July 22, 2010, the Parliament adopted an act imposing a special tax on financial institutions on their 2010 income or adjusted balance sheet as of December 31, 2009 or the sum of the net value of managed funds and other managed portfolio assets. Such surtax will also be levied for the year 2011 and is applicable to all financial institutions (both domestic and foreign) with at least one set of annual financial statements prepared by July 1, 2010, including banks, insurance companies and other financial sector enterprises (e.g., investment companies, stock exchanges, commodity exchange service providers, venture capital fund managers, investment fund managers), including branches. The Government intends to maintain the financial institution surtax in 2012, with the scope, rate and base to be determined by future legislation.
The tax base and rate vary according to the type of institution as follows:
| | |
Type of Institution | | Tax Base and Rate |
| |
Banks | | 0.15% of the adjusted balance sheet total up to HUF 50 billion and 0.5%(1) of amounts in excess of such threshold |
| |
Insurance companies | | 6.2%(2) of the adjusted premium income |
| |
Financial enterprises | | 6.5% of interest and 6.5% of fees and commission income |
| |
Investment companies | | 5.6% of the adjusted net income |
| |
Stock exchanges | | 5.6% of the adjusted net income |
| |
Commodity exchange service providers | | 5.6% of the adjusted net income |
| |
Venture capital fund managers | | 5.6% of the adjusted net income |
| |
Investment fund managers | | 0.028% of the sum of the net value of managed funds and other managed portfolio assets |
Notes:—
| (1) | As of 2011, such tax rate has been increased to 0.53%. |
| (2) | As of 2011, such tax rate has been replaced by a three-tier progressive tax rate structure with rates of 1.5%, 3.0% and 6.4%. The lowest tier extends up to HUF 1 billion, the middle tier from HUF 1 billion up to HUF 8 billion, and the highest rate on income exceeding HUF 8 billion. |
According to the agreement concluded on December 15, 2011 the surtax imposed on credit institutions can be reduced by certain loss items arising from the fixed rate repayment schedule.
88
Surtax on Retail, Telecommunications and Energy Sectors
On October 20, 2010, the Parliament adopted an act approving a surtax on retail businesses, telecommunications companies and energy supply companies. Retail businesses are subject to a progressive tax at 0.1% on net sales revenues between HUF 500 million and HUF 30 billion, 0.4% between HUF 30 billion and HUF 100 billion, and 2.5% above that level. Telecommunication companies are subject to a 4.5% tax on annual net sales revenues between HUF 500 million and HUF 5 billion and 6.5% on the excess above HUF 5 billion. Energy supply companies, which are already subject to a special surtax of 8% on adjusted net profits in addition to the standard corporate income tax rate, are now subject to an additional 0.3% tax on annual net sales revenues up to HUF 5 billion and 1.05% on revenues exceeding HUF 5 billion. According to the Government’s current plans, these special taxes will remain in effect for three years.
Surtax on certain products endangering public health
As of September 1, 2011 a new Act has gone into effect that introduces a surtax on certain products containing high level of sugar or salt. Such surtax is payable by the person or legal entity selling the product for the first time in Hungary (e.g., the Hungarian manufacturer or the importer). The rates of the surtax vary by the type of the product as follows:
| | |
Type of product | | Tax Rate |
| Soft drinks | | HUF 5 per litre |
| Energy drinks | | HUF 250 per litre |
| Pre-packaged product with high level of sugar | | HUF 100 per kilogram |
| Salted snacks (e.g., chips) | | HUF 200 per kilogram |
| Food flavouring mixes | | HUF 200 per kilogram |
Other Central Government Revenues
Customs duties are imposed on goods imported from outside the European Union in accordance with the EU customs code. The central government levies duties on the acquisition of real estate, cars and certain other products and also on certain administrative procedures.
Local Taxes
Local taxes vary between municipalities. Local governments are permitted to assess local business tax and various property taxes.
Social Security and Extra-Budgetary Funds
The social security funds consist of two funds: the pension fund and the health fund. The following table sets forth the revenues and expenditures for social security and certain extra-budgetary funds:
Social Security and Extra-Budgetary Funds, Revenues and Expenditures
| | | | | | | | | | | | | | | | | | | | | | | | | | | | |
| | | 2007 | | | 2008 | | | 2009 | | | 2010 | | | 2011 | | | 2012 | | | 2012 | |
| | | Final | | | Final | | | Final | | | Final | | | Final | | | Planned | | | Expected | |
| | | (HUF billions) | |
Social Securities Fund | | | | | | | | | | | | | | | | | | | | | | | | | | | | |
Revenues | | | 4,318.7 | | | | 4,302.8 | | | | 4,128.9 | | | | 4,299.6 | | | | 4,451.7 | | | | 4,449.7 | | | | 4,466.5 | |
Expenditures | | | 4,291.1 | | | | 4,370.3 | | | | 4,285.6 | | | | 4,394.9 | | | | 4,535.3 | | | | 4,485.0 | | | | 4,543.2 | |
89
| | | | | | | | | | | | | | | | | | | | | | | | | | | | |
Surplus (deficit) | | | 27.6 | | | | (67.5 | ) | | | (156.7 | ) | | | (95.4 | ) | | | (83.7 | ) | | | (35.3 | ) | | | (76.7 | ) |
Extra Budgetary Funds(2) | | | | | | | | | | | | | | | | | | | | | | | | | | | | |
Revenues | | | 459.5 | | | | 485.4 | | | | 465.2 | | | | 407.7 | | | | 428.8 | | | | 438.5 | | | | 472.0 | |
Expenditures | | | 396.6 | | | | 457.2 | | | | 496.5 | | | | 347.9 | | | | 359.6 | | | | 385.5 | | | | 398.4 | |
Surplus (deficit) | | | 62.9 | | | | 28.2 | | | | (31.4 | ) | | | 59.8 | | | | 69.2 | | | | 53.0 | | | | 73.6 | |
Source: Ministry of Finance
Notes:—
| (1) | For methodological remarks on planned, expected, preliminary, fact and final budgets, see “Public Finance –Methodology.” |
| (2) | Currently, these funds consist of the Nuclear Fund, the National Employment Fund, the Wesselényi Miklós’ Flood and Inland Waters Compensation Fund, the Research and Development Fund, the National Cultural Fund, and the Bethlen Gábor Fund. |
The contribution of the central government to the social security funds was HUF 422.4 billion in 2005, HUF 890.6 billion in 2006, HUF 777.8 billion in 2007, HUF 835.0 billion in 2008, 913.8 billion in 2009, HUF 1,147.5 billion in 2010 and, according to preliminary data, HUF 637.8 billion in 2011. The contribution of the central government to the social security funds will be HUF 675.5 billion in 2012 according to the planned budget.
Social Security System
Before the fall of communism in 1989, social security in Hungary was based on the principle of solidarity and risk sharing. The provision of social, health and pension benefits through collection and reallocation was carried out by the Hungarian state. Since the change of the political and economic system, self-provision has been playing an increasingly important role in Hungary’s social security system. Currently, Hungarian citizens may affect the social security benefits they receive in the future by making voluntary payments into a private investment account or joining a voluntary pension fund. The Hungarian state provides social security benefits for those incapable of self-provision.
Health Care System
The Hungarian health care system is accessible to persons who have a Hungarian social security card and make mandatory contributions to the social security system. Three levels of health care are available and are expected to be utilised in the order of basic care to more serious care. However, treatments can commence at a higher level of care if it would be more efficient. The first level of care is the basic health care provided by the family doctor, the second level consists of specialised consulting services in out-patient care, and the third level consists of in-patient care at a health care facility (e.g., hospital, clinics or sanatorium). However, disabled individuals are entitled to use ambulant services, receive sickness benefit and/or qualify for disability pension. In addition to such disability benefits, disabled persons are entitled to additional financial and in-kind benefits, including, for instance, the right to use designated parking lots and receive financial assistance for travel.
Several changes to the health insurance system were implemented in recent years. For example, the amount of social security contributions increased; the availability of free or low-cost health care servicing for the indigent population was limited to the neediest; and household contribution towards the financing of health services increased. The number of days of sick payment paid by employers has generally decreased in recent years, but the contribution of the employer to the amount paid to the patient has increased. Prior to January 1, 2010, employers paid 5% of an employee’s income and the employee contributed 56%. In addition, there was a fixed monthly health care contribution by employers of HUF 1,950 per employee. As of January 1, 2010, the contribution system was simplified. Until December 31, 2011, a 27% social security
90
contribution contains a 24% pension insurance contribution and a 3% health insurance and employment market contribution. The requirement for contributions by employers, employees and entrepreneurs has been abolished. As of January 1, 2012, the 27% social security contribution has been abolished, and a 27% social contribution tax has been introduced, which shall be paid by the employer.
Pension System
In the course of the reform of the social security system, the pension system has undergone the most fundamental transformation over the last decade. The single-tier pension system was replaced by a three-tier system in 1998, pursuant to which in addition to the pension contribution deducted from wages on a mandatory basis, private pension funds offer the possibility of self-provision. Furthermore, an employee had the possibility of joining a voluntary pension fund as well. The three pillars of this system were: compulsory state pensions; compulsory private pension funds; and voluntary private pension funds.
In November 2010, the Parliament approved pension reform legislation, with the ultimate goal of transforming the “three-pillar” system into a “two-pillar” system, which is closer to European practices. The “two-pillar” system would consist of the state-run compulsory pension and the voluntary private pension. Until January 31, 2011, individuals who were participants in the compulsory private pension system could opt to transfer their private pension to the state-run pension system or opt to remain in the private pension system, although the former option is encouraged through significant incentives. In regards to the latter option, the remaining participants will not receive further entitlement in the state-run pension system and, therefore with the exception of employees who have already had the minimum service time in the state-run pension system, will receive their pensions solely from their private pension’s funds.
The objective of the pension reform is to address concerns with the three-pillar system. Under such system, pension liabilities have been increasingly affecting the budget and low net real returns on the compulsory private pensions pose a threat to future pension payments.
Under the “two-pillar” pension system, payments are made into the state pension fund and to a private pension fund selected by the employee. The total pension contribution equals 34% of an employee’s monthly salary (which is a slight increase from the 33.5% under the old system), out of which 10% (previously 9.5%) is paid by the employee and 24% by the employer. The employer’s contribution is paid into the state pension fund. If the employee opts to remain solely in a private pension fund, as of January 1, 2012,the employee’s 10% contribution will be transferred to the private pension fund selected by the employee. For employees solely participating in the state pension system, the entire 10% contribution would be applied to the state pension fund. Due to the transitional provisions of the pension reform legislation, employees’ contribution shall be transferred to the state pension fund during the period from November 1, 2010 to December 31, 2011 irrespective of employees’ selection between the state pension system and the private pension system. Such transitional suspension of contribution payments to private pension funds aims to facilitate the correction of the annual budget and to keep the annual deficit target of 2010 and 2011.
The pension reform is expected to generate public revenue from two sources. First, the accumulated funds of individuals opting into the state pension system are expected to contribute to a significant decrease in the explicit public debt. Second, permanent revenues received from future pension contributions is expected to help balance the state pension system in the long term.
Effective January 1, 2010, the retirement age for both women and men was raised to 62.5 years. Within the next six years, the retirement age will be gradually increased to 65 years. See “Public Finance – Budget Trends.” However, the positive effects of the pension reform on the general budget will not be apparent for at least 30 years, due to the delayed effect.
On December 23, 2011, the Parliament adopted the Act on Economic Stability of Hungary. According to the Act, the participants of private pension funds and their employers shall pay the 34% to the state pension fund, and they will be entitled to receive 75% of their pension from the state pension fund. Based on such Act, the participants of private pension funds could opt to transfer their private pension to the state-run pension system until March 31, 2012, in order to receive their pensions solely from state pension fund.
91
Sustainability of the Social Security System
Health Care System. Since 2002, the in-kind benefits of the health insurance system have generally increased faster than GDP. This was the result of the rapid dissemination of innovative drugs, wage adjustments for health care employees and the rapid increase of services. Due to the strict budgetary requirements in 2004, numerous short-term measures were adopted (including the freezing of pharmaceutical drug prices, digressive financing techniques and the introduction of cost-volume agreements) in order to help control the expenditures relating to the health care system.
In order to ease the burden of the state in the long-term in the financing of the health care system, the Government has started preparations for a financing reform of the health care system. The reform efforts will be aimed at curbing the expenditure growth and introducing cost-effective services by changing the financing and incentive mechanisms.
Pension System. According to demographic projections, the proportion of the population over the retirement age compared to the population of the working age will increase significantly in the next decades. The increase in the retirement age (see “Pension System”) and the increase in the employment rate may result in a temporary improvement, but will not be sufficient to overturn the long-term trend.
In response to these adverse demographic trends, the Government has taken certain steps to reform the pension system. Most importantly, these steps include (in addition to raising the retirement age) the introduction of mixed financing and the application of the so-called Swiss indexation (50% of wage increases, and 50% of inflation).
Local Government Finance
The following table sets forth the revenues and expenditures at the local government level for the years indicated for all the local governments:
Local Government Revenues and Expenditures
| | | | | | | | | | | | | | | | | | | | | | | | | | | | |
| | | As of year ended December 31, | |
| | | 2007 | | | 2008 | | | 2009 | | | 2010 | | | 2011 | | | 2012 | | | 2012 | |
| | | Final | | | Final | | | Final | | | Final | | | Final | | | Planned | | | Expected | |
| | | (HUF billions) | |
Revenues | | | | | | | | | | | | | | | | | | | | | | | | | | | | |
Own revenues1 | | | 1,079.1 | | | | 1,210.7 | | | | 1,251.8 | | | | 1,234.4 | | | | 1,233.9 | | | | 1,214.6 | | | | 1,178.5 | |
Subsidies | | | 1,251.9 | | | | 1,295.3 | | | | 1,178.5 | | | | 1,123.5 | | | | 1,069.2 | | | | 916.8 | | | | 938.5 | |
Other revenues | | | 725.8 | | | | 737.5 | | | | 692.0 | | | | 808.6 | | | | 1,026.3 | | | | 660.2 | | | | 635.1 | |
Total revenues, GFS (excluding privatisation) | | | 3,056.8 | | | | 3,243.5 | | | | 3,122.3 | | | | 3,166.5 | | | | 3,329.4 | | | | 2,791.6 | | | | 2,752.1 | |
Privatisation revenues | | | 23.9 | | | | 24.7 | | | | 4.1 | | | | 7.0 | | | | 2.6 | | | | 1.8 | | | | 2.6 | |
Total revenues (including privatisation) | | | 3,080.7 | | | | 3,268.2 | | | | 3,126.4 | | | | 3,173.5 | | | | 3,332.0 | | | | 2,793.4 | | | | 2,754.7 | |
Expenditures | | | | | | | | | | | | | | | | | | | | | | | | | | | | |
Wages | | | 1,477.9 | | | | 1,502.7 | | | | 1,407.9 | | | | 1,388.6 | | | | 1,286.6 | | | | 1,085.8 | | | | 1,073.9 | |
Investments | | | 583.7 | | | | 550.6 | | | | 573.6 | | | | 694.1 | | | | 605.2 | | | | 599.4 | | | | 633.8 | |
Other expenditures | | | 1,073.0 | | | | 1,199.3 | | | | 1,227.4 | | | | 1,322.8 | | | | 1,296.7 | | | | 1,258.2 | | | | 1,137.0 | |
92
| | | | | | | | | | | | | | | | | | | | | | | | | | | | |
Total expenditures | | | 3,134.6 | | | | 3,252.6 | | | | 3,208.9 | | | | 3,405.5 | | | | 3,188.5 | | | | 2,943.4 | | | | 2,844.7 | |
Surplus (deficit), GFS (excluding privatisation) | | | (77.8 | ) | | | (9.1 | ) | | | (86.6 | ) | | | (239.0 | ) | | | 140.9 | | | | (151.8 | ) | | | (92.6 | ) |
Surplus (deficit) (including privatisation) | | | (53.9 | ) | | | 15.6 | | | | (82.5 | ) | | | (232.0 | ) | | | 143.5 | | | | (150.0 | ) | | | (90.0 | ) |
| | | | | | | | | | | | | | | | | | | | | | | | | | | | |
Source: Ministry for National Economy
| (1) | GFS excludes privatisation revenues. |
The municipalities are to a large extent autonomous according to the Hungarian Constitution and the Local Government Act. However, the Government must take the local government deficit into account when preparing and implementing the central government budget and other parts of the public budget, over which the Government and Parliament have more direct control. Parliament can, nevertheless, influence the financial situation of local governments through the volume of budget grants (transfers) and the tax-sharing system.
During 2011, the revenues of the local governments amounted to HUF 3,329.4 billion, the expenditures amounted to HUF 3,188.5 billion, and thus the fiscal deficit of the local governments amounted to HUF 140.9 billion for 2011.
EU Net Position
The following table sets forth certain information with respect to the budgetary relations between Hungary and the EU:
Budgeted financial flows between Hungary and the EU budget between 2007 and 2011
| | | | | | | | | | | | | | | | | | | | |
| | | 2007 | | | 2008 | | | 2009 | | | 2010 | | | 2011 | |
| | | (HUF millions, current prices) | |
EU resources appearing in the Hungarian budget | | | 287,396.2 | | | | 380,107.6 | | | | 631,412.0 | | | | 805,243.9 | | | | 913,026.3 | |
National contribution (co-financing of projects) | | | 171,615.3 | | | | 139,991.4 | | | | 226,505.6 | | | | 226,759.1 | | | | 400,948.5 | |
EU resources out of the Hungarian budget (mainly agricultural subsidies) | | | 167,645.3 | | | | 203,796.7 | | | | 320,133.1 | | | | 297,160.7 | | | | 197,852.9 | |
National contribution to the EU Budget | | | 189,520.0 | | | | 210,581.0 | | | | 223,657.8 | | | | 230,186.7 | | | | 233,047.6 | |
Source: Ministry for National Economy
Certain EU funds are only available for certain projects if Hungary contributes a certain percentage amount towards such project. In addition, EU funds that are not used for their designated purpose in a given year are lost and cannot be carried over to a subsequent year.
The EU Commission has criticised Hungary’s high budget deficit several times in recent years, following Hungary’s failure to reach its targets for reducing its budget deficit. In December 2004, the EU Commission stated that Hungary was the only country among the 10 new member states at such time not to take effective action to curb its large budget deficit. In 2004, the EU Commission initiated a so-called “excessive deficit procedure” against Hungary for failing to achieve these targets. Since Hungary is not yet a member of the Eurozone, the last two steps of the excessive deficit procedure that would impose penalty payments on Hungary do not apply. However, the non-compliance with the recommendations could end in the freezing of some EU subsidies, although there is no precedent for such penalties being levied by the EU in the past.
93
Medium-Term Fiscal Programme and the Convergence Programme
Hungary’s economic policy targets are set out in a Convergence Report submitted annually to the European Commission. The report discusses Hungary’s policy goals for achieving the criteria set by the European Commission to attain membership in the Eurozone. The European Commission regularly evaluates the Convergence Reports, including the economic targets and the achievement of such targets.
Under EU legislation, prior to adopting the Euro, Hungary is required to have fulfilled the following convergence criteria (the “Maastricht Criteria”):
| | • | | price stability — maintain a sustainable price performance and achieve an average rate of inflation (measured over a period of one year before the examination) that does not exceed by more than 1.5% the average rate of inflation of the three member states which perform the best in terms of price stability; |
| | • | | long-term interest rates — achieve an average nominal long-term interest rate (measured over a period of one year before the examination) that does not exceed by more than 2% that of the three best performing EU Member States in terms of price stability; |
| | • | | the Government budgetary position — achieve a ratio of planned or actual government deficit to GDP that does not exceed 3%, unless either (i) the ratio has declined substantially and continuously and reached a level that comes close to the reference value or (ii) the excess of the reference value is only exceptional and temporary and the ratio remains close to the reference value; |
| | • | | government debt — achieve a ratio of government debt to GDP that does not exceed 60%, unless the ratio is sufficiently diminishing and approaching the reference value at a satisfactory pace; and |
| | • | | exchange rate — participate for at least two years in the Exchange Rate Mechanism (“ERM II”) and observe the normal fluctuation margins close to central parity provided for by the mechanism for at least two years. |
The convergence required for entering the Eurozone is formally assessed annually and the final decision is subsequently made by a summit of EU Member States acting on the recommendation of the ECOFIN Council.
On April 15, 2011, the Ministry for National Economy published the latest version of Hungary’s Convergence Programme. The Convergence Programme is based on the Széll Kálmán plan described in “Public Finance – Budget Trends”. The updated Convergence Programme includes a conservative and a dynamic GDP growth rate path. According to the conservative path, GDP would grow by 3.1% in 2011, 3.0% in 2012, 3.2% in 2013, 3.3% in 2014 and 3.5% in 2015. According to the dynamic path, GDP would grow by 3.2% in 2011, 3.6% in 2012, 4.8% in 2013, 5.2% in 2014 and 5.5% in 2015. The general government deficit to GDP ratio according to ESA methodology (including local governments) would reach 2.5% in 2012, 2.2% in 2013, 1.9% in 2014 and 1.5% in 2015. The gross public debt to GDP ratio would reach 72.1% in 2012, 69.7% in 2013, 66.7% in 2014 and 64.1% in 2015. Hungarian public finance is closely monitored on a quarterly basis by the IMF and EU in connection with the financial assistance package provided to Hungary by such organisations. See “Future Economic Plan” and “National Debt— Relations with Multilateral Financial Institutions — The IMF, the EU and the World Bank.”
Future Economic Plan
In September 2011, the Ministry for National Economy revised the macroeconomic outlook. Since the announcement of the Széll Kálmán Plan, the global and domestic economic environment has changed significantly in the following aspects:
| | • | | Risks to growth have become graver. The growth of our key foreign trading partners is expected to slow down substantially, |
| | • | | Financial risks have become more pronounced. The uncertainty in global financial markets needs to be monitored more closely, |
94
| | • | | One positive development is that Hungary has been one of the very few countries in Europe for which interest payments on public debt have declined following the reduction of public debt. |
Consequently, in light of the new circumstances, the Government decided to revise its macroeconomic forecast and, in order to achieve its ultimate objective, to implement the necessary measures. The revised macroeconomic forecast which serves as a basis for the calculations of the 2012 Budget includes the impact of the new measures, and displays weaker growth prospects. These, however, are mainly driven by external factors.
| | • | | The growth rate goal of the government for 2012 remains 2%, in line with market expectations. However, having considered the prevailing risk factors as well as the impact of new measures, the Government assumes a GDP growth of 1.5% for the 2012 budget calculations. |
| | • | | The Government projects a 4.2% CPI inflation for 2012, which signals a slight rise. |
| | • | | The Government will pursue a deficit target of 2.5% of GDP which facilitates a further reduction of public debt, down from 73.2% at the end of 2011 to 72% at the end of 2012. |
| | • | | Due to the measures aimed at reducing the level of public debt and the ensuing improving financing conditions, the interest payments for public debt continue to decrease further to 3.6% of GDP from the current 3.8%. |
| | • | | Household consumption growth is expected to remain positive in 2012 by 0.2%. |
| | • | | After the 2% decrease in investments in 2011, the Government expects investments to rise by 3.2% in 2012. |
| | • | | Our external position will remain strongly positive: we expect both the foreign trade balance and the current account to be in surplus in 2012. |
| | • | | Labour market conditions are expected to improve further: payroll numbers will rise by 1.5% and the employment rate by 1 percentage point, whereas the unemployment rate will continue to decline steadily, to levels below 11%. |
95
NATIONAL DEBT
General Information
Traditionally, the NBH was the primary entity through which Hungary borrowed money in foreign currencies. Pursuant to the 1997 amendment to the National Bank Act, the NBH may now only incur foreign currency debt for its own purposes and all foreign currency borrowings and debt security issuances for the central budget must be made directly by Hungary. In such respect, as of May 29, 2010, the Ministry for National Economy acts on behalf of Hungary (prior thereto, the Ministry of Finance had such responsibility). In turn, such Ministry has delegated these debt management functions to the GDMA Pte Ltd., which was part of the Treasury until 2001, but thereafter became a separate legal entity. Since January 1, 1999, foreign currency debt issuances have been arranged by the GDMA Pte Ltd. See “Public Finance – Central Government Budget – Roles of the Ministry for National Economy, the Hungarian State Treasury and the Government Debt Management Agency.”
The NBH has remained the legal or named obligor on the outstanding foreign currency debt incurred prior to January 1, 1999. The majority of the interest rate and exchange rate risks associated with these debts and any related swaps, however, have been effectively transferred to Hungary pursuant to a series of transfer agreements, whereby Hungary has essentially agreed to pay the NBH sufficient funds to cover these obligations. Following this transfer of risk, Hungary entered into a number of swap agreements to match the currency profile of this debt portfolio to that of the currency basket (100% Euro since January 2000) upon which the forint is pegged. The NBH may still act as an agent of Hungary for the purposes of obtaining foreign loans and issuing securities abroad. Since January 1997, the NBH has acted in this agency role on the basis of an agency agreement, which was entered into by the NBH and Hungary, as permitted by the amended National Bank Act.
Because of this history, all references to public debt include debt of Hungary and the NBH. Public debt also includes debt of the social security and other extra-budgetary funds, but does not include local government debt. External public debt refers to public debt that is denominated in a foreign currency and almost always owed to a non-Hungarian party. Internal public debt refers to public debt denominated in forint and typically owed to parties within the country. Gross external debt refers to all of the foreign currency denominated debt owed by Hungarian persons and both public and private entities to non-resident creditors. Loans between the NBH and Hungary relating to external borrowings originally made by the NBH were not added for the purposes of calculating public debt figures, to avoid double counting.
Public Debt
The following table sets out certain statistics regarding Hungarian public debt for the years indicated:
| | | | | | | | | | | | | | | | | | | | |
| | | December 31(1) | |
| | | 2007 | | | 2008 | | | 2009 | | | 2010 | | | 2011(2) | |
| | | (HUF billions, except for percentages) | |
Internal Public Debt | | | 11,103.8 | | | | 11,250.6 | | | | 10,476.2 | | | | 10,978.2 | | | | 10,362.2 | |
% of Nominal GDP | | | 44.4 | % | | | 42.4 | % | | | 40.9 | % | | | 41.0 | % | | | 36.9 | % |
External Public Debt | | | 4,472.6 | | | | 6,774.8 | | | | 8,468.5 | | | | 8,842.8 | | | | 10,170.4 | |
% of Nominal GDP | | | 17.9 | % | | | 25.5 | % | | | 33.1 | % | | �� | 33.1 | % | | | 36.2 | % |
Other Liabilities(3) | | | 9.1 | | | | 78.5 | | | | 20.1 | | | | 220.0 | | | | 422.9 | |
Total Public Debt | | | 15,585.5 | | | | 18,103.9 | | | | 18,964.9 | | | | 20,041.0 | | | | 19,987.6 | |
% of Nominal GDP | | | 62.4 | % | | | 68.2 | % | | | 74.0 | % | | | 74.9 | % | | | 71.2 | % |
Nominal GDP | | | 24,992 | | | | 26,546 | | | | 25,623 | | | | 26,748 | | | | 28,080 | |
96
Source: GDMA Pte Ltd.
| (1) | This table shows the public debt of Hungary from the perspective of the economic obligations of the central government. Financial derivatives and mark-to-market deposits from 2005 are included. In this table, external debt refers to government obligations denominated in foreign currency, while internal debt refers to obligations denominated in local currency. |
| (2) | Preliminary data as at the end of December 2011. |
| (3) | Including a special item in connection with a debt assumption in 2006. |
Although the central government’s gross debt to GDP ratio decreased substantially between 1996 and 2001 as a result of a primary budget surplus, the debt redemption effected from privatisation proceeds and significant real GDP growth, this trend has reversed since 2002. In 2002, 2003 and 2004, the central government gross debt to GDP ratio grew due to the expansionary fiscal policy. The fiscal restrictions introduced by the Minister of Finance in 2006 were set to diminish the budget deficit and thus reduce the central government gross debt to GDP ratio. The total central government debt totalled HUF 18,964.9 billion at the end of 2009, showing an increase of 4.8% in nominal terms compared to HUF 18,103.9 billion at the end of 2008, which was partly as a result of draw-downs from the financial assistance package. The government gross debt to GDP ratio in 2009 was 74.0%, as compared to 68.2% as at the end of 2008 and 62.4% at the end of 2007. The government gross debt to GDP ratio increased slightly to 74.9% in 2010.
The central government debt totalled HUF 20,955.5 billion at the end of December 2011, showing an increase of 4.6% in nominal terms compared to HUF 20,041.0 billion at the end of 2010. The government gross debt to GDP ratio at the end of December 2011 was 74.4%, as compared to 74.9% as at the end of 2010.
On November 5, 2007, Fitch Ratings Ltd. (“Fitch”) changed its foreign currency and local currency sovereign credit ratings outlook of Hungary from “negative” to “stable,” but affirmed its ratings of “BBB+”.
On March 14, 2008, Standard & Poor’s Ratings Services (“S&P”) changed its long term foreign currency and local currency debt outlook of Hungary from “stable” to “negative,” but the rating remained “BBB+.”
On October 15, 2008, S&P put the sovereign credit rating of Hungary on the negative watch list.
On October 17, 2008, Fitch changed its foreign currency and local currency sovereign credit ratings outlook of Hungary from “stable” to “negative,” but affirmed its ratings of “BBB+”.
On November 7, 2008, Moody’s Investors Service, Inc. (“Moody’s”) lowered its local and foreign currency government bond ratings and the country ceiling for foreign currency bank deposits of Hungary from A2 to A3 with a “negative” outlook.
On November 10, 2008, Fitch changed its foreign currency and local currency sovereign credit ratings of Hungary to “BBB” and “BBB+”, respectively, carrying a “stable” outlook.
On November 17, 2008, S&P changed its long term foreign currency and local currency debt rating of Hungary from “BBB+” to “BBB,” with a “negative” outlook.
On March 2, 2009, Fitch changed its foreign currency and local currency sovereign credit ratings outlook of Hungary from “stable” to “negative.”
On March 30, 2009, S&P changed its long term foreign currency and local currency debt rating of Hungary from “BBB” to “BBB–,” with a “negative” outlook.
On March 31, 2009, Moody’s changed its long term foreign and local currency debt rating of Hungary from “A3” to “Baa1,” with a “negative” outlook.
97
On October 2, 2009, Standard & Poor’s revised its “negative” outlook to “stable” while it affirmed a debt rating of “BBB-” for the long-term foreign currency and local currency.
On December 6, 2010, Moody’s changed its long term foreign and local currency debt rating of Hungary from “Baa1” to “Baa3,” with a “negative” outlook.
On December 23, 2010, Fitch changed its foreign currency sovereign credit ratings of Hungary from “BBB” to “BBB-”, carrying a “negative” outlook.
On June 6, 2011, Fitch changed the outlook on Hungary’s foreign and local currency sovereign credit ratings from “negative” to “stable”, while affirming the long term foreign and local currency rating at “BBB-” and “BBB,” respectively.
On November 11, 2011, Fitch changed the outlook on Hungary’s foreign and local currency sovereign credit ratings from “stable” to “negative,” while affirming the long term foreign and local currency rating at “BBB-” and “BBB,” respectively.
On November 11, 2011, Standard & Poor’s placed its “BBB-/A-3” foreign and local currency credit ratings on Hungary on CreditWatch with negative implications.
On November 24, 2011, Moody’s downgraded Hungary’s foreign and local currency credit ratings to “Ba” from “Baa3” and maintained the “negative” outlook.
On December 21, 2011, Standard & Poor’s lowered its long- and short-term foreign- and local-currency sovereign credit ratings on Hungary to “BB+/B” from “BBB-/A-3”. The outlook remained “negative.”
On January 9, 2012, Fitch downgraded the long-term foreign and local currency ratings of Hungary to “BB+” and “BBB-,” respectively. The outlook remained “negative.”
External Public Debt
The following table sets forth the external public debt as of December 31, 2011 by category and by currency:
| | | | |
| | | Amount(1) | |
| | | (EUR million) | |
By Category (financial derivatives are excluded): | | | | |
Bank loans (including bank to bank and syndicated loans) | | | 1,745 | |
Bonds + FRN | | | 18,743 | |
Loans from multilateral financial institutions (e.g., IMF and World Bank) | | | 14,331 | |
| | | | |
Total | | | 34,819 | |
| | | | |
By Currency (financial derivatives are included): | | | ( | %) |
Euro | | | 86 | |
US Dollar | | | 0 | |
British Pound | | | 0 | |
Other currencies (SDR) | | | 14 | |
| | | | |
Total | | | 100 | |
| | | | |
98
| | | | |
| | | before swaps | |
| By Currency (financial derivatives are excluded): | | | ( | %) |
Euro | | | 48 | |
JPY | | | 4 | |
US Dollar | | | 18 | |
Swiss Franc | | | 2 | |
British Pound | | | 5 | |
SDR | | | 23 | |
| | | | |
Total | | | 100 | |
| | | | |
Source: GDMA Pte Ltd.
| (1) | Debt liabilities of the government sector that are not HUF-denominated (including mark-to-market deposits). |
In January 2007, Hungary issued a EUR 1.0 billion bond due in 2017. In October 2007, Hungary issued JPY 25 billion Samurai bonds due in 2017. In April 2008, Hungary issued a two-tranche bond totalling CHF 350 million maturing in 2013 and in 2016. In June 2008, Hungary issued a EUR 1.5 billion bond due in 2018. In July 2009, Hungary issued a EUR 1.0 billion bond due in 2014. In January 2010, Hungary issued a USD 2.0 billion bond due in 2020. On March 29, 2011, Hungary issued two tranches of bonds, one tranche maturing in 2021 in the amount of USD 3.0 billion that the other tranche maturing in 2041 in the amount of USD 0.75 billion. Hungary reopened the tranche maturing in 2041 on April 6, 2011 with an increase of USD 500 million. In May 2011, Hungary issued a EUR 1.0 billion bond due in 2019.
External Public Debt Service and Schedule of Payments
Neither Hungary nor the NBH has ever defaulted on the payment of the principal of, or premium or interest on, any debt obligation issued by it.
The following table sets forth the schedule of payments on external public debt as of June 30, 2011:
Schedule of Payments on External Public Debt as of March 31, 2012(1)
| | | | | | | | | | | | | | | | | | | | | | | | | | | | | | | | |
| Date of maturity | | Total | | | Central bank
and General
government | | | Central
bank | | | General
government | | | Forint
denominated
bonds | | | Other
monetary
institutions
and other
sectors | | | Other
monetary
institutions | | | Other
sectors | |
Second quarter 2012 | | | 2,673 | | | | 1,243 | | | | 2 | | | | 1,241 | | | | 279 | | | | 1,430 | | | | 953 | | | | 476 | |
Third quarter 2012 | | | 3,230 | | | | 1,563 | | | | 185 | | | | 1,378 | | | | 0 | | | | 1,667 | | | | 1,420 | | | | 247 | |
Fourth quarter 2012 | | | 3,764 | | | | 2,235 | | | | 185 | | | | 2,050 | | | | 304 | | | | 1,530 | | | | 1,022 | | | | 507 | |
2012 | | | 9,667 | | | | 5,041 | | | | 372 | | | | 4,669 | | | | 583 | | | | 4,626 | | | | 3,396 | | | | 1,231 | |
99
| | | | | | | | | | | | | | | | | | | | | | | | | | | | | | | | |
First quarter 2013 | | | 4,242 | | | | 2,913 | | | | 185 | | | | 2,728 | | | | 465 | | | | 1,329 | | | | 914 | | | | 416 | |
Second quarter 2013 | | | 2,288 | | | | 1,218 | | | | 183 | | | | 1,035 | | | | 0 | | | | 1,070 | | | | 885 | | | | 185 | |
Third quarter 2013 | | | 2,160 | | | | 1,116 | | | | 183 | | | | 933 | | | | 0 | | | | 1,043 | | | | 833 | | | | 210 | |
Fourth quarter 2013 | | | 3,347 | | | | 1,657 | | | | 253 | | | | 1,403 | | | | 431 | | | | 1,691 | | | | 1,439 | | | | 252 | |
2013 | | | 12,037 | | | | 6,904 | | | | 805 | | | | 6,099 | | | | 896 | | | | 5,133 | | | | 4,071 | | | | 1,063 | |
2014 | | | 14,070 | | | | 8,724 | | | | 366 | | | | 8,358 | | | | 2,431 | | | | 5,345 | | | | 3,332 | | | | 2,013 | |
2015 | | | 5,750 | | | | 2,560 | | | | 52 | | | | 2,508 | | | | 1,112 | | | | 3,190 | | | | 1,289 | | | | 1,901 | |
2016 | | | 8,775 | | | | 5,023 | | | | 0 | | | | 5,023 | | | | 1,295 | | | | 3,752 | | | | 1,343 | | | | 2,409 | |
2017 | | | 6,895 | | | | 4,250 | | | | 0 | | | | 4,250 | | | | 2,197 | | | | 2,644 | | | | 957 | | | | 1,687 | |
2018 | | | 2,842 | | | | 1,749 | | | | 0 | | | | 1,749 | | | | 0 | | | | 1,093 | | | | 601 | | | | 492 | |
2019 | | | 2,550 | | | | 1,842 | | | | 0 | | | | 1,842 | | | | 797 | | | | 708 | | | | 406 | | | | 302 | |
2020 | | | 3,961 | | | | 3,122 | | | | 0 | | | | 3,122 | | | | 728 | | | | 839 | | | | 612 | | | | 227 | |
2021 | | | 3,901 | | | | 2,438 | | | | 0 | | | | 2,438 | | | | 0 | | | | 1,463 | | | | 1,196 | | | | 267 | |
2022 | | | 1,323 | | | | 1,006 | | | | 0 | | | | 1,006 | | | | 594 | | | | 317 | | | | 96 | | | | 220 | |
After | | | 5,714 | | | | 2,944 | | | | 0 | | | | 2,944 | | | | 360 | | | | 2,771 | | | | 933 | | | | 1,838 | |
| | | | | | | | | | | | | | | | | | | | | | | | | | | | | | | | |
Total | | | 77,485 | | | | 45,604 | | | | 1,594 | | | | 44,010 | | | | 10,994 | | | | 31,881 | | | | 18,232 | | | | 13,649 | |
| | | | | | | | | | | | | | | | | | | | | | | | | | | | | | | | |
Source: NBH
| (1) | Excluding: Direct investment, other capital. |
Internal Public Debt
As of December 31, 2011, Hungary’s total internal public debt, including the social security and extra-budgetary funds, was HUF 10,362.2 billion. As of December 31, 2011, almost all of the Government’s internal debt represented either treasury bills or bonds (with 5.7% of the Government’s internal debt consisting of loans from EIB and CEB).
Within the total HUF-denominated government debt, publicly issued government securities have been playing a predominant role. Raising public funds on the domestic market depends to a large degree upon the issuance of government bonds. Of the total amount of outstanding publicly issued HUF-denominated government securities, government bonds accounted for approximately 75% as of the end of December 2011.
Hungary’s policy is to finance budget deficits partly with internal debt and partly by accessing the international markets. The determination as to the type of financing is based on a benchmark for the debt portfolio composition. The weight of internal debt (domestic currency) ranges between 68% and 75% in the benchmark portfolio; the weight of external debt (foreign currency) ranges between 25% and 32%. The average maturity of internal debt was increased to 4.01 years by the end of 2007, 3.88 years by the end of 2008, 3.93 years by the end of 2009, 4.05 years by the end of 2010 and 3.90 years by the end of 2011.
The Government has also guaranteed certain Hungarian indebtedness. As of December 31, 2011, these guarantees totalled HUF 1,282.3 billion. According to GFS methodology, guarantees are not included in the governmental debt and only affect the central governmental deficit if and when the Government is obliged to make a payment under the guarantee.
100
Government Obligations to the NBH
The following table shows the Government’s obligations to the NBH, including those due to net foreign currency losses, as of December 31 for the years indicated and as of August 31, 2012:
| | | | | | | | | | | | | | | | | | | | | | | | |
| | | As of December 31, | | | As of August 31, | |
| | | 2007 | | | 2008 | | | 2009 | | | 2010 | | | 2011 | | | 2012 | |
Short-term | | | 146.7 | | | | 360.0 | | | | 279.0 | | | | 249.5 | | | | 168.5 | | | | 168.5 | |
Long-term | | | 0.0 | | | | 0.0 | | | | 0.0 | | | | 0.0 | | | | 0.0 | | | | 0.0 | |
| | | | | | | | | | | | | | | | | | | | | | | | |
Total | | | 146.7 | | | | 360.0 | | | | 279.0 | | | | 249.5 | | | | 168.5 | | | | 168.5 | |
| | | | | | | | | | | | | | | | | | | | | | | | |
Source: NBH
Gross External Debt
The following table sets forth the distribution and maturity of gross external debt of Hungary as of December 31, 2011:
Gross External Debt(1)
| | | | | | | | |
| | | December 31, 2011 | |
| | | Amount of
Debt | | | % Medium
and Long | |
| | | (EUR
millions) | | | (%) | |
Obligor | | | | | | | | |
National Bank of Hungary(2) | | | 6,129.9 | | | | 26.6 | |
Hungary(2) | | | 48,107.5 | | | | 90.4 | |
Private sector(2) (3) | | | 77,421.5 | | | | 80.3 | |
| | | | | | | | |
Total(2) (3) | | | 131,658.9 | | | | 81.5 | |
| | | | | | | | |
Financial derivative liabilities | | | 5,342.5 | | | | | |
Entire economy (including financial derivative liabilities) | | | 137,001.4 | | | | | |
Source: NBH
Notes:
| (1) | In this table, external debt refers to obligations owed to non-resident entities. |
| (2) | External debt as defined in External Debt Statistics: Guide for Compilers and Users (IMF 2003). Financial derivatives are not included. |
| (3) | Direct investment debt liabilities included. |
Selected Annual BOP and IIP Figures and Debt Service Indicators of Hungary (BOP Basis)(1)
| | | | | | | | | | | | | | | | | | | | |
| | | 2007 | | | 2008 | | | 2009 | | | 2010 | | | 2011(3) | |
Debt Indicators(1) | | | | | | | | | | | | | | | | | | | | |
Gross debt indicators | | | | | | | | | | | | | | | | | | | | |
Gross external debt (excl. FDI other loans)/GDP | | | 88.0 | | | | 93.8 | | | | 114.0 | | | | 110.4 | | | | 101.7 | |
101
| | | | | | | | | | | | | | | | | | | | |
| | | 2007 | | | 2008 | | | 2009 | | | 2010 | | | 2011(3) | |
Of which: General government and central bank | | | 34.8 | | | | 37.4 | | | | 51.5 | | | | 53.5 | | | | 53.8 | |
Gross external debt denominated in foreign currencies (excl. FDI other loans)/GDP | | | 58.9 | | | | 78.5 | | | | 97.7 | | | | 92.9 | | | | 80.9 | |
Of which: General government and central bank | | | 19.5 | | | | 26.9 | | | | 39.6 | | | | 40.6 | | | | 37.9 | |
Gross external debt (incl. FDI other loans)/GDP | | | 104.6 | | | | 116.8 | | | | 150.2 | | | | 142.3 | | | | 130.4 | |
Net debt indicators | | | | | | | | | | | | | | | | | | | | |
Net external debt (excl. FDI other loans)/GDP | | | 44.5 | | | | 50.9 | | | | 56.2 | | | | 52.6 | | | | 44.3 | |
Of which: General government and central bank | | | 17.3 | | | | 13.5 | | | | 16.1 | | | | 16.9 | | | | 15.1 | |
Net external debt denominated in foreign currencies (excl. FDI other loans)/GDP | | | 28.2 | | | | 37.8 | | | | 42.9 | | | | 38.2 | | | | 27.1 | |
Of which: General government and central bank | | | 2.3 | | | | 3.4 | | | | 5.1 | | | | 5.2 | | | | -0.1 | |
Net external debt (incl. FDI other loans)/GDP | | | 50.4 | | | | 54.5 | | | | 64.4 | | | | 59.0 | | | | 45.6 | |
Debt Service Indicators | | | | | | | | | | | | | | | | | | | | |
Total debt service denominated in foreign currencies (TDS) (excl. FDI other loans(2))/GDP | | | 10.1 | | | | 14.0 | | | | 21.3 | | | | 19.4 | | | | 22.2 | |
Total debt service denominated in foreign currencies (TDS) (excl. FDI other loans(2))/XGS | | | 12.5 | | | | 17.3 | | | | 27.5 | | | | 22.5 | | | | 24.2 | |
Gross interest expenditure (excl. FDI other loans) GDP | | | 3.3 | | | | 4.2 | | | | 4.0 | | | | 3.4 | | | | 3.8 | |
Net interest expenditures (excl. FDI other loans) GDP | | | 1.8 | | | | 2.7 | | | | 2.5 | | | | 2.1 | | | | 2.5 | |
Memorandum | | | | | | | | | | | | | | | | | | | | |
GDP(3) (Euro millions) | | | 99,446 | | | | 105,653 | | | | 91,322 | | | | 97,119 | | | | 100,836 | |
Exports of goods and services (XGS) (Euro millions) | | | 80,395 | | | | 85,915 | | | | 70,667 | | | | 83,620 | | | | 92,560 | |
Net external financing capacity/GDP | | | -6.6 | | | | -6.4 | | | | 1.0 | | | | 3.0 | | | | 3.6 | |
International reserves (RES) (Euro millions) | | | 16,385 | | | | 24,040 | | | | 30,677 | | | | 33,674 | | | | 37,774 | |
Source: NBH
| (1) | External debt as defined in External Debt Statistics: Guide for Compilers and Users: equity and financial derivative instruments are excluded. |
| (2) | (TDS) Medium-term credit amortization and gross interest expenditures. |
| (3) | GDP figures for 2011 are preliminary data of CSO. |
Relations with Multilateral Financial Institutions
European Bank for Reconstruction and Development (“EBRD”)
Since 1991, the EBRD has been involved in a number of state and non-state projects, both in the form of equity participation and loans. The total participation (net business volume) of the EBRD between 1991 and the end of 2010 was close to EUR 2.5 billion in more than 100 projects, more than 90% of which was in the private sector. EUR 50 million of that amount was approved for one project in 2010. According to the latest country strategy for Hungary, the bank prefers to finance infrastructure and energy related projects. In the meantime, due to the effects of the financial crisis, the EBRD confirmed its commitment to continue to support Hungary’s financial sector.
102
Council of Europe Development Bank (“CEB”)
Hungary joined the CEB in 1998. According to the CEB’s social mandate, the focus of the CEB’s projected activity in Hungary is mainly the co-financing of EU-supported investments in 2007-2013 and projects in the field of environmental protection, strengthening social integration and developing human capital. Since Hungary’s accession to the CEB, the bank has provided EUR 1.7 billion (90% of which was allocated to the public sector). In 2009, Hungary and the CEB signed three framework loan agreements for an aggregate principal amount of EUR 228 million.
European Investment Bank (“EIB”)
Since 1990, the EIB has been financing different government and non-government projects in Hungary. In the past five years, the EIB financed projects by granting loans approximately totalling EUR 7.5 billion.
The EIB finances primarily infrastructure, environmental protection, healthcare and education projects. In 2009, three new loan facility agreements were signed for an aggregate principal amount of up to EUR 790 million. In 2010, three new loan facility agreements were signed for an aggregate principal amount of up to EUR 400 million.
International Finance Corporation (“IFC”)
In 2001, the IFC established the Hungary Energy Efficiency Co-financing Programme (HEECP), whereby the IFC grants guarantees and provides technical assistance to projects aimed at increasing the efficiency of energy consumption in Hungary.
The IMF, the EU and the World Bank
In 2008, Hungary received a financial assistance package of up to USD 25.1 billion in the aggregate from the IMF, the EU and the World Bank. The IMF agreed to provide a 17-month standby facility of USD 15.7 billion (EUR 12.5 billion), while the EU agreed to lend USD 8.1 billion (EUR 6.5 billion), and there was a possibility to draw down USD 1.3 billion (EUR 1 billion) from the World Bank to assist Hungary in addressing the consequences of the global financial crisis.
In July 2010, the Government suspended the negotiations with the IMF concerning the possible extension of the standby facility. The IMF continues to engage in regular consultations with Hungary to monitor and review economic developments. The last consultation was held in October 2010, with the IMF mission concluding that Hungary’s determination to adhere to fiscal targets is encouraging, but expressing some concern regarding temporary measures introduced and implemented by Hungary to reach its fiscal targets.
As of December 31, 2011, the following amounts have been drawn down under the facilities:
| | • | | IMF: SDR 6.373 billion by Hungary and SDR 1.265 billion by the NBH; and |
| | • | | EU: EUR 5.5 billion by Hungary. |
No disbursements were made in 2010 under either facility. The IMF standby facility expired in October 2010 and the EU facility expired in November 2010.
On November 17, 2011 the Ministry for National Economy announced that Hungary would start negotiations for a new co-operation with IMF.
On February 22, 2012, the European Commission proposed to freeze transfers from the Cohesion Fund in the amount of EUR 495 million for the year 2013 as a consequence of non-compliance concerning the Excessive Deficit Procedure against Hungary.
On May 30, 2012, the European Commission adopted a proposal for a Council decision to lift the suspension of commitments from the Cohesion Fund for Hungary, after concluding that the country has taken the necessary action to correct its excessive deficit, in line with the Council Recommendation of March 13, 2012.
103
An IMF mission visited Budapest between July 17-25, 2012, in order to start discussions on an IMF/EU-supported programme following a request by the Hungarian authorities. Further discussions are expected to be held in the fourth quarter of 2012.
104
TABLES AND SUPPLEMENTARY INFORMATION
External Funded Convertible Currency Debt of the NBH and Hungary
(As of December 31, 2011)
| | | | | | | | | | | | | | | | | | | | | | | | | | |
Title | | Interest
rate (%) | | | Year | | | Original
amount
contracted | | | Principal amount
outstanding | |
| | | | | | Issue | | | Maturity(1) | | | | | | | |
A. NATIONAL BANK OF HUNGARY | | | | | | | | | | | | | | | | | | | | | | | |
1. U.S. Dollar Debt | | | | | | | | | | | | | | | | | | | | | | | | | | |
a. Bonds | | | | | | | | | | | | | | | | | | | | | | | |
USD Bond | | | 8.875 | | | | 1993 | | | | 2013 | | | | — | | | USD | | | | 200,000,000.00 | |
| | | | | | | | | | | | | | | | | | | | | | | | | | |
Total | | | USD | | | | 200,000,000.00 | |
| | | | | | | | | | | | | | | | | | | | | | | | | | |
| (1) | In certain cases, this column refers to the dates of scheduled instalment payments. Any such payments made prior to December 31, 2011 are reflected as the difference between the amounts in the columns titled “Original Amount Contracted” and “Principal Amount Outstanding.” |
| | | | | | | | | | | | | | | | | | | | | | | | |
Title | | Interest
rate (%) | | | Year | | | Original
amount
contracted | | | Principal amount
outstanding | |
| | | | | | Issue | | | Maturity | | | | | | | | | | |
| | | | | | | | | | | | | | | (credit)/debit | |
b. Swap Arrangements | | | | | | | | | | | | | | | | | | | | | | | | |
USD/EUR | | | 7.334329 | | | | 1999 | | | | 2012 | | | | — | | | | USD | | | | (2,020,038.83 | ) |
USD/EUR | | | 6.226404 | | | | 1999 | | | | 2013 | | | | — | | | | USD | | | | (11,052,785.60 | ) |
USD/USD | | | 4.500 | | | | 2004 | | | | 2013 | | | | — | | | | USD | | | | 109,415,000.00 | |
USD/USD | | | Floating | | | | 2004 | | | | 2013 | | | | — | | | | USD | | | | (109,415,000.00 | ) |
USD/EUR | | | 8.875 | | | | 1999 | | | | 2012 | | | | — | | | | USD | | | | (200,000,000.00 | ) |
| | | | | | | | | | | | | | | | | | | | | | | | |
Total | | | | | | | | | | | | | | | | | | | USD | | | | (213.072.824,43 | ) |
| | | | | | | | | | | | | | | | | | | | | | | | |
Total U.S. Dollar Debt | | | | | | | | | | | | | | | | | | | USD | | | | (13.072.824,43 | ) |
| | | | | | | | | | | | | | | | | | | | | | | | |
| | | Interest | | | Year | | | Original
amount | | | Principal amount | |
Title | | rate (%) | | | Issue | | | Maturity | | | contracted | | | outstanding | |
| | | | | | | | | | | | | | | (credit)/debit | |
2. Euro Debt | | | | | | | | | | | | | | | | | | | | | | | | |
a. Swap Arrangements | | | | | | | | | | | | | | | | | | | | | | | | |
EUR/USD | | | 5.495 | | | | 1999 | | | | 2012 | | | | — | | | | EUR | | | | 1,932,117,79 | |
EUR/USD | | | 4.4325 | | | | 1999 | | | | 2013 | | | | — | | | | EUR | | | | 10,582,264,78 | |
EUR/USD | | | 7.0295 | | | | 1999 | | | | 2012 | | | | — | | | | EUR | | | | 191,410,443.20 | |
EUR/EUR | | | Floating | | | | 1999 | | | | 2013 | | | | — | | | | EUR | | | | 191,410,443.10 | |
EUR/EUR | | | 7.0295 | | | | 1999 | | | | 2013 | | | | — | | | | EUR | | | | (191,410,443.10 | ) |
EUR/EUR | | | Floating | | | | 2011 | | | | 2012 | | | | — | | | | EUR | | | | (30,452,000.00 | ) |
EUR/EUR | | | 5.368 | | | | 2011 | | | | 2012 | | | | — | | | | EUR | | | | 30,452,000.00 | |
EUR/EUR | | | 5.28 | | | | 2008 | | | | 2014 | | | | — | | | | EUR | | | | 30,000,000.00 | |
105
| | | | | | | | | | | | | | | | | | | | | | | | |
Title | | Interest | | | Year | | | Original
amount | | | Principal amount | |
| | | rate (%) | | | Issue | | | Maturity | | | contracted | | | outstanding | |
| | | | | | | | | | | | | | | (credit)/debit | |
EUR/EUR | | | Floating | | | | 2008 | | | | 2014 | | | | — | | | | EUR | | | | (30,000,000.00 | ) |
EUR/EUR | | | Floating | | | | 2009 | | | | 2012 | | | | — | | | | EUR | | | | (20,000,000.00 | ) |
EUR/EUR | | | 2.25 | | | | 2009 | | | | 2012 | | | | — | | | | EUR | | | | 20,000,000.00 | |
EUR/EUR | | | 3.183 | | | | 2010 | | | | 2012 | | | | — | | | | EUR | | | | 20,000,000.00 | |
EUR/EUR | | | Floating | | | | 2010 | | | | 2012 | | | | — | | | | EUR | | | | (20,000,000.00 | ) |
EUR/EUR | | | 1.867 | | | | 2010 | | | | 2012 | | | | — | | | | EUR | | | | 50,000,000.00 | |
EUR/EUR | | | Floating | | | | 2010 | | | | 2012 | | | | — | | | | EUR | | | | (50,000,000.00 | ) |
EUR/EUR | | | 1.871 | | | | 2010 | | | | 2015 | | | | — | | | | EUR | | | | 50,000,000.00 | |
EUR/EUR | | | Floating | | | | 2010 | | | | 2015 | | | | — | | | | EUR | | | | (50,000,000.00 | ) |
EUR/EUR | | | 1.872 | | | | 2010 | | | | 2015 | | | | — | | | | EUR | | | | 50,000,000.00 | |
EUR/EUR | | | Floating | | | | 2010 | | | | 2015 | | | | — | | | | EUR | | | | (50,000,000.00 | ) |
EUR/EUR | | | 1.953 | | | | 2010 | | | | 2012 | | | | — | | | | EUR | | | | 40,000,000.00 | |
EUR/EUR | | | Floating | | | | 2010 | | | | 2012 | | | | — | | | | EUR | | | | (40,000,000.00 | ) |
EUR/EUR | | | 3,0197 | | | | 2011 | | | | 2016 | | | | — | | | | EUR | | | | 50,000,000.00 | |
EUR/EUR | | | Floating | | | | 2011 | | | | 2016 | | | | — | | | | EUR | | | | (50,000,000.00 | ) |
EUR/EUR | | | 3,0187 | | | | 2011 | | | | 2016 | | | | — | | | | EUR | | | | 50,000,000.00 | |
EUR/EUR | | | Floating | | | | 2011 | | | | 2016 | | | | — | | | | EUR | | | | (50,000,000.00 | ) |
EUR/EUR | | | 3,0877 | | | | 2011 | | | | 2016 | | | | — | | | | EUR | | | | 50,000,000.00 | |
EUR/EUR | | | Floating | | | | 2011 | | | | 2016 | | | | — | | | | EUR | | | | (50,000,000.00 | ) |
| | | | | | | | | | | | | | | | | | | | | | | | |
Total | | | | | | | | | | | | | | | — | | | | EUR | | | | 203,924,825.77 | |
| | | | | | | | | | | | | | | | | | | | | | | | |
Total Euro Debt | | | | | | | | | | | | | | | | | | | EUR | | | | 203,924,825.77 | |
| | | | | | | | | | | | | | | | | | | | | | | | |
U.S. Dollar equivalent | | | | | | | | | | | | | | | | | | | USD | | | | 263,616,133.63 | |
| | | | | | | | | | | | | | | | | | | | | | | | |
106
| | | | | | | | | | | | | | | | | | | | | | | | |
| | | Interest | | | Year | | | Original
amount
contracted | | | Principal | |
Title | | rate (%) | | | Issue | | | Maturity | | | | amount outstanding | |
| | | | | | | | | | | | | | | | | | | (credit)/debit | |
3. Japanese Yen Debt | | | | | | | | | | | | | | | | | | | | | | | | |
a. Bonds | | | | | | | | | | | | | | | | | | | | | | | | |
JPY Bond | | | 6.000 | | | | 1995 | | | | 2015 | | | | — | | | | JPY | | | | 10,000,000,000 | |
| | | | | | | | | | | | | | | | | | | | | | | | |
Total | | | | | | | | | | | | | | | | | | | JPY | | | | 10,000,000,000 | |
| | | | | | | | | | | | | | | | | | | | | | | | |
b. Swap Arrangements | | | | | | | | | | | | | | | | | | | | | | | | |
JPY/JPY | | | Floating | | | | 2010 | | | | 2015 | | | | — | | | | JPY | | | | 10,000,000,000 | |
JPY/JPY | | | 6.012 | | | | 2010 | | | | 2015 | | | | — | | | | JPY | | | | (10,000,000,000 | ) |
Total | | | | | | | | | | | | | | | | | | | JPY | | | | 0 | |
| | | | | | | | | | | | | | | | | | | | | | | | |
Total Japanese Yen Debt | | | | | | | | | | | | | | | | | | | JPY | | | | 10,000,000,000 | |
| | | | | | | | | | | | | | | | | | | | | | | | |
U.S. Dollar equivalent | | | | | | | | | | | | | | | | | | | USD | | | | 129,013,628.05 | |
| | | | | | | | | | | | | | | | | | | | | | | | |
| | | Interest | | | Year | | | Original
amount
contracted | | | Principal | |
Title | | rate (%) | | | Issue | | | Maturity | | | | amount outstanding | |
| | | | | | | | | | | | | | | | | | | (credit)/debit | |
4. SDR Debt | | | | | | | | | | | | | | | | | | | | | | | | |
a. Loan | | | | | | | | | | | | | | | | | | | | | | | | |
SDR Loan | | | Floating | | | | 2009 | | | | 2014 | | | | | | | | SDR | | | | 1,264,500,000 | |
Total | | | | | | | | | | | | | | | | | | | SDR | | | | 1,264,500,000 | |
| | | | | | | | | | | | | | | | | | | | | | | | |
Total SDR Debt | | | | | | | | | | | | | | | | | | | SDR | | | | 1,264,500,000 | |
| | | | | | | | | | | | | | | | | | | | | | | | |
U.S. Dollar equivalent | | | | | | | | | | | | | | | | | | | USD | | | | 1,941,348,915.00 | |
| | | | | | | | | | | | | | | | | | | | | | | | |
NATIONAL BANK OF HUNGARY | | | | | | | | | | | | | | | | | | | | | | | | |
Total External Funded Convertible Currency Debt | | | | | | | | | | | | | | | | | | | USD | | | | 2,320,905,852.25 | |
| | | | | | | | | | | | | | | | | | | | | | | | |
107
| | | | | | | | | | | | | | | | | | | | | | | | | | | | |
Title | | Interest
rate (%) | | | Year | | | Original | | | Principal | |
| | | Issue | | | Maturity | | | Amount Contracted | | | Amount Outstanding | |
B. HUNGARY | | | | | | | | | | | | | | | | | | | | | | | | | | | | |
1. U.S. dollar Debt | | | | | | | | | | | | | | | | | | | | | | | | | | | | |
a. EIB | | | | | | | | | | | | | | | | | | | | | | | | | | | | |
Roads I | | | MT | | | | 1992 | | | | 2012 | | | | ECU | | | | 50,000,000 | | | | USD | | | | 2,020,038.74 | |
Roads II | | | MT | | | | 1993 | | | | 2013 | | | | ECU | | | | 72,000,000 | | | | USD | | | | 11,052,785.37 | |
| | | | | | | | | | | | | | | | | | | | | | | | | | | | |
Total | | | | USD | | | | 13,072,824.11 | |
| | | | | | | | | | | | | | | | | | | | | | | | | | | | |
b. Bonds | | | | | | | | | | | | | | | | | | | | | | | | | | | | |
USD Bond | | | 4.750 | | | | 2005 | | | | 2015 | | | | USD | | | | 1,500,000,000 | | | | USD | | | | 1,500,000,000.00 | |
USD Bond | | | 6,250 | | | | 2010 | | | | 2020 | | | | USD | | | | 2,000,000,000 | | | | USD | | | | 2,000,000,000.00 | |
USD Bond | | | 2.750 | | | | 1975 | | | | 2027 | | | | USD | | | | 669,500 | | | | USD | | | | 52,400.00 | |
USD Bond | | | 6.375 | | | | 2011 | | | | 2021 | | | | USD | | | | 3,000,000,000 | | | | USD | | | | 3,000,000,000 | |
USD Bond | | | 7.625 | | | | 2011 | | | | 2041 | | | | USD | | | | 1,250,000,000 | | | | USD | | | | 1,250,000,000 | |
| | | | | | | | | | | | | | | | | | | | | | | | | | | | |
Total | | | | USD | | | | 7,750,052,400.00 | |
| | | | | | | | | | | | | | | | | | | | | | | | | | | | |
c. Swap Arrangements | | | | | | | | | | | | | | | | | | | | | | | | | | | | |
USD/EUR | | | 7.33 | | | | 2000 | | | | 2012 | | | | USD | | | | (50,500,971 | ) | | | USD | | | | (2,020,038.83 | ) |
USD/EUR | | | 6.23 | | | | 2000 | | | | 2013 | | | | USD | | | | (77,369,499 | ) | | | USD | | | | (8,289,589.20 | ) |
USD/EUR | | | 4.75 | | | | 2005 | | | | 2015 | | | | USD | | | | (500,000,000 | ) | | | USD | | | | (500,000,000 | ) |
USD/EUR | | | Floating | | | | 2009 | | | | 2013 | | | | USD | | | | (283,598,342.78 | ) | | | USD | | | | (283,598,342.78 | ) |
USD/EUR | | | Floating | | | | 2009 | | | | 2014 | | | | USD | | | | (34,830,517.87 | ) | | | USD | | | | (34,830,517.87 | ) |
USD/EUR | | | Floating | | | | 2009 | | | | 2014 | | | | USD | | | | (453,873,616.43 | ) | | | USD | | | | (453,873,616.43 | ) |
USD/EUR | | | Floating | | | | 2009 | | | | 2014 | | | | USD | | | | (453,873,616.44 | ) | | | USD | | | | (453,873,616.44 | ) |
USD/EUR | | | 4,75 | | | | 2009 | | | | 2015 | | | | USD | | | | (500,000,000 | ) | | | USD | | | | (500,000,000 | ) |
USD/EUR | | | Floating | | | | 2010 | | | | 2013 | | | | USD | | | | (323,860,000 | ) | | | USD | | | | (323,860,000 | ) |
USD/EUR | | | Floating | | | | 2010 | | | | 2013 | | | | USD | | | | (323,859,342.11 | ) | | | USD | | | | (323,859,342.11 | ) |
USD/EUR | | | 6,25 | | | | 2010 | | | | 2020 | | | | USD | | | | (340,000,000 | ) | | | USD | | | | (340,000,000 | ) |
USD/EUR | | | 6,25 | | | | 2010 | | | | 2020 | | | | USD | | | | (340,000,000 | ) | | | USD | | | | (340,000,000 | ) |
USD/EUR | | | 6,25 | | | | 2010 | | | | 2020 | | | | USD | | | | (660,000,000 | ) | | | USD | | | | (660,000,000 | ) |
USD/EUR | | | 6,25 | | | | 2010 | | | | 2020 | | | | USD | | | | (660,000,000 | ) | | | USD | | | | (660,000,000 | ) |
USD/EUR | | | Floating | | | | 2011 | | | | 2013 | | | | USD | | | | (570,440,889 | ) | | | USD | | | | (570,440,889 | ) |
USD/EUR | | | Floating | | | | 2011 | | | | 2013 | | | | USD | | | | (570,440,889 | ) | | | USD | | | | (570,440,889 | ) |
USD/EUR | | | 6,375 | | | | 2011 | | | | 2021 | | | | USD | | | | (660,000,000 | ) | | | USD | | | | (660,000,000 | ) |
USD/EUR | | | 6,375 | | | | 2011 | | | | 2021 | | | | USD | | | | (660,000,000 | ) | | | USD | | | | (660,000,000 | ) |
USD/EUR | | | 6,375 | | | | 2011 | | | | 2021 | | | | USD | | | | (660,000,000 | ) | | | USD | | | | (660,000,000 | ) |
USD/EUR | | | 6,375 | | | | 2011 | | | | 2021 | | | | USD | | | | (340,000,000 | ) | | | USD | | | | (340,000,000 | ) |
USD/EUR | | | 6,375 | | | | 2011 | | | | 2021 | | | | USD | | | | (340,000,000 | ) | | | USD | | | | (340,000,000 | ) |
USD/EUR | | | 6,375 | | | | 2011 | | | | 2021 | | | | USD | | | | (340,000,000 | ) | | | USD | | | | (340,000,000 | ) |
USD/EUR | | | 7,625 | | | | 2011 | | | | 2041 | | | | USD | | | | (247,500,000 | ) | | | USD | | | | (247,500,000 | ) |
USD/EUR | | | 7,625 | | | | 2011 | | | | 2041 | | | | USD | | | | (127,500,000 | ) | | | USD | | | | (127,500,000 | ) |
USD/EUR | | | 7,625 | | | | 2011 | | | | 2041 | | | | USD | | | | (247,500,000 | ) | | | USD | | | | (247,500,000 | ) |
USD/EUR | | | 7,625 | | | | 2011 | | | | 2041 | | | | USD | | | | (127,500,000 | ) | | | USD | | | | (127,500,000 | ) |
USD/EUR | | | 7,625 | | | | 2011 | | | | 2041 | | | | USD | | | | (165,000,000 | ) | | | USD | | | | (165,000,000 | ) |
USD/EUR | | | 7,625 | | | | 2011 | | | | 2041 | | | | USD | | | | (165,000,000 | ) | | | USD | | | | (165,000,000 | ) |
USD/EUR | | | 7,625 | | | | 2011 | | | | 2041 | | | | USD | | | | (85,000,000 | ) | | | USD | | | | (85,000,000 | ) |
USD/EUR | | | 7,625 | | | | 2011 | | | | 2041 | | | | USD | | | | (85,000,000 | ) | | | USD | | | | (85,000,000 | ) |
Total | | | | USD | | | | (10,275,086,841.66 | ) |
| | | | | | | | | | | | | | | | | | | | | | | | | | | | |
Total U.S. Dollar Debt | | | | USD | | | | (2,511,961,617.55 | ) |
| | | | | | | | | | | | | | | | | | | | | | | | | | | | |
108
| | | | | | | | | | | | | | | | | | | | | | | | | | | | |
| | | Interest | | | Year | | | Original | | | Principal | |
Title | | rate (%) | | | Issue | | | Maturity | | | Amount Contracted | | | Amount Outstanding | |
2. Euro Debt | | | | | | | | | | | | | | | | | | | | | | | | | | | | |
a. EIB | | | | | | | | | | | | | | | | | | | | | | | | | | | | |
Bp Wastewater | | | Floating | | | | 2006 | | | | 2017 | | | | EUR | | | | 94,000,000 | | | | EUR | | | | 94,000,000 | |
Environment | | | 4.67 | | | | 2002 | | | | 2013 | | | | EUR | | | | 43,000,000 | | | | EUR | | | | 14,333,333.32 | |
Environment II | | | Floating | | | | 2003-7 | | | | 2013-17 | | | | EUR | | | | 80,000,000 | | | | EUR | | | | 80,000,000 | |
Environment III | | | 4.49 | | | | 2004 | | | | 2014 | | | | EUR | | | | 45,900,000 | | | | EUR | | | | 45,900,000 | |
Environment IV | | | Floating | | | | 2008 | | | | 2018 | | | | EUR | | | | 11,500,000 | | | | EUR | | | | 11,500,000 | |
Flood protection | | | Floating | | | | 2002 | | | | 2012 | | | | EUR | | | | 60,000,000 | | | | EUR | | | | 10,000,000 | |
Railways I-A | | | MT | | | | 1999 | | | | 2017 | | | | EUR | | | | 60,000,000 | | | | EUR | | | | 22,758,620.82 | |
Railways I-B | | | Floating | | | | 2002 | | | | 2012 | | | | EUR | | | | 40,000,000 | | | | EUR | | | | 6,666,666.65 | |
Railways II-B | | | Floating | | | | 2002 | | | | 2013 | | | | EUR | | | | 90,000,000 | | | | EUR | | | | 36,000,000 | |
Railways III | | | Floating | | | | 2004 | | | | 2014 | | | | EUR | | | | 40,000,000 | | | | EUR | | | | 40,000,000 | |
Railways IV | | | Floating | | | | 2004-9 | | | | 2014 | | | | EUR | | | | 170,000,000 | | | | EUR | | | | 36,750,000 | |
Railways V | | | Floating | | | | 2005 | | | | 2015 | | | | EUR | | | | 27,000,000 | | | | EUR | | | | 27,000,000 | |
Roads III | | | Floating | | | | 2003-4 | | | | 2014 | | | | EUR | | | | 75,000,000 | | | | EUR | | | | 75,000,000 | |
Roads IV | | | Floating | | | | 2003 | | | | 2014 | | | | EUR | | | | 190,000,000 | | | | EUR | | | | 119,000,000 | |
M0 Motorway | | | Floating | | | | 2005 | | | | 2015 | | | | EUR | | | | 50,000,000 | | | | EUR | | | | 50,000,000 | |
M3 Motorway | | | Floating | | | | 2007 | | | | 2017 | | | | EUR | | | | 320,000,000 | | | | EUR | | | | 1,966,523.26 | |
M4 Underground | | | Floating | | | | 2005-6 | | | | 2016 | | | | EUR | | | | 691,000,000 | | | | EUR | | | | 472,000,000 | |
Structural funds | | | Floating | | | | 2004-8 | | | | 2014-18 | | | | EUR | | | | 445,000,000 | | | | EUR | | | | 445,000,000 | |
Research and innovation | | | Floating | | | | 2007 | | | | 2012 | | | | EUR | | | | 165,000,000 | | | | EUR | | | | 962,288.17 | |
Education A | | | Floating | | | | 2008 | | | | 2018 | | | | EUR | | | | 150,000,000 | | | | EUR | | | | 100,000,000 | |
Health Sector Development | | | Floating | | | | 2008-11 | | | | 2019-27 | | | | EUR | | | | 45,000,000 | | | | EUR | | | | 30,000,000 | |
Hungary Innovation Support | | | Floating | | | | 2008 | | | | 2016 | | | | EUR | | | | 275,000,000 | | | | EUR | | | | 175,423,025.86 | |
Debrecen University | | | Floating | | | | 2008 | | | | 2017 | | | | EUR | | | | 50,000,000 | | | | EUR | | | | 50,000,000 | |
Pécs – 2010 | | | Floating | | | | 2008 | | | | 2019 | | | | EUR | | | | 11,000,000 | | | | EUR | | | | 11,000,000 | |
Cohesion Fund - A | | | Floating | | | | 2010 | | | | 2015 | | | | EUR | | | | 100,000,000 | | | | EUR | | | | 2,587,281.80 | |
Bp Universities | | | Floating | | | | 2011 | | | | 2021 | | | | EUR | | | | 85,000,000 | | | | EUR | | | | 85,000,000 | |
Forests | | | 3.804 | | | | 2011 | | | | 2027 | | | | EUR | | | | 200,000,000 | | | | EUR | | | | 70,000,000 | |
Economic Competitiveness | | | 3.934 | | | | 2011 | | | | 2027 | | | | EUR | | | | 440,000,000 | | | | EUR | | | | 98,000,000 | |
Cohesion Fund - II | | | 3,903 | | | | 2011 | | | | 2027 | | | | EUR | | | | 300,000,000 | | | | EUR | | | | 231,000,000 | |
Education B | | | 3,924 | | | | 2011 | | | | 2027 | | | | EUR | | | | 150,000,000 | | | | EUR | | | | 50,000,000 | |
Rural Development | | | 3.486 | | | | 2011 | | | | 2021 | | | | EUR | | | | 150,000,000 | | | | EUR | | | | 90,000,000 | |
| | | | | | | | | | | | | | | | | | | | | | | | | | | | |
Total | | | | | | | | | | | | | | | | | | | | | | | EUR | | | | 2,596,847,739.88 | |
| | | | | | | | | | | | | | | | | | | | | | | | | | | | |
b. Bonds | | | | | | | | | | | | | | | | | | | | | | | | | | | | |
EUR Bond | | | 4.500 | | | | 2003 | | | | 2013 | | | | EUR | | | | 1,000,000,000 | | | | EUR | | | | 981,000,000 | |
EUR Bond | | | 4.500 | | | | 2004 | | | | 2014 | | | | EUR | | | | 1,000,000,000 | | | | EUR | | | | 994,600,000 | |
EUR Bond | | | 3.875 | | | | 2005 | | | | 2020 | | | | EUR | | | | 1,000,000,000 | | | | EUR | | | | 1,000,000,000 | |
EUR Bond | | | Floating | | | | 2005-06 | | | | 2012 | | | | EUR | | | | 1,000,000,000 | | | | EUR | | | | 996,884,000 | |
EUR Bond | | | 3.5 | | | | 2006 | | | | 2016 | | | | EUR | | | | 1,000,000,000 | | | | EUR | | | | 1,000,000,000 | |
EUR Bond | | | 4.375 | | | | 2007 | | | | 2017 | | | | EUR | | | | 1,000,000,000 | | | | EUR | | | | 1,000,000,000 | |
EUR Bond | | | 5.75 | | | | 2008 | | | | 2018 | | | | EUR | | | | 1,500,000,000 | | | | EUR | | | | 1,500,000,000 | |
EUR Bond | | | 6.75 | | | | 2009 | | | | 2014 | | | | EUR | | | | 1,000,000,000 | | | | EUR | | | | 1,000,000,000 | |
EUR Bond | | | 6 | | | | 2011 | | | | 2019 | | | | EUR | | | | 1,000,000,000 | | | | EUR | | | | 1,000,000,000 | |
| | | | | | | | | | | | | | | | | | | | | | | | | | | | |
Total | | | | | | | | | | | | | | | | | | | | | | | EUR | | | | 9,472,484,000 | |
| | | | | | | | | | | | | | | | | | | | | | | | | | | | |
109
| | | | | | | | | | | | | | | | | | | | | | | | | | | | |
| | | Interest | | | Year | | | Original Amount | | | Principal | |
Title | | rate (%) | | | Issue | | | Maturity | | | Contracted | | | Amount Outstanding | |
c. Other loans raised | | | | | | | | | | | | | | | | | | | | | | | | | | | | |
Council of Europe Development | | | Various | | | | 2002-11 | | | | 2012-21 | | | | EUR | | | | 1,074,412,698 | | | | EUR | | | | 523,999,457 | |
Bank loans | | | | | | | | | | | | | | | | | | | | | | | | | | | | |
EBRD loans | | | Floating | | | | 2003 | | | | 2014 | | | | EUR | | | | 4,739,006 | | | | EUR | | | | 1,113,077.70 | |
KfW DEM loan | | | 6.0583 | | | | 2001 | | | | 2015 | | | | DEM | | | | 120,000,000 | | | | EUR | | | | 18,878,419.82 | |
European Community | | | Various | | | | 2008-09 | | | | 2011-14 | | | | EUR | | | | 5,500,000,000 | | | | EUR | | | | 3,500,000,000 | |
| | | | | | | | | | | | | | | | | | | | | | | | | | | | |
Total | | | | EUR | | | | 4,043,990,954.52 | |
| | | | | | | | | | | | | | | | | | | | | | | | | | | | |
d. Other loans assumed | | | | | | | | | | | | | | | | | | | | | | | | | | | | |
EIB/Railways II-A | | | Various | | | | 2002 | | | | 2015 | | | | EUR | | | | 40,000,000 | | | | EUR | | | | 13,500,000 | |
EIB/M3 Toll Motorway | | | MT | | | | 2002 | | | | 2015 | | | | EUR | | | | 49,599,224 | | | | EUR | | | | 15,261,299.48 | |
EIB/Bp Health | | | Floating | | | | 2011 | | | | 2034 | | | | EUR | | | | 28,027,432 | | | | EUR | | | | 28,027,432 | |
EUR loans | | | Various | | | | 2002-11 | | | | 2014-308 | | | | EUR | | | | 243,498,603.52 | | | | EUR | | | | 219,205,944.87 | |
| | | | | | | | | | | | | | | | | | | | | | | | | | | | |
Total | | | | EUR | | | | 275,994,676.35 | |
| | | | | | | | | | | | | | | | | | | | | | | | | | | | |
e. Swap Arrangements | | | | | | | | | | | | | | | | | | | | | | | | | | | | |
| | | | | | | |
EUR/USD | | | 5.50 | | | | 2000 | | | | 2012 | | | | EUR | | | | 48,302,945 | | | | EUR | | | | 1,932,117.79 | |
EUR/USD | | | 4.4325 | | | | 2000 | | | | 2013 | | | | EUR | | | | 74,075,853 | | | | EUR | | | | 10,582,264.95 | |
EUR/USD | | | 3.8075 | | | | 2005 | | | | 2015 | | | | EUR | | | | 383,612,000 | | | | EUR | | | | 383,612,000 | |
EUR/USD | | | Floating | | | | 2009 | | | | 2015 | | | | EUR | | | | 383,612,000 | | | | EUR | | | | 383,612,000 | |
EUR/USD | | | Floating | | | | 2009 | | | | 2013 | | | | EUR | | | | 202,093,880.70 | | | | EUR | | | | 202,093,880.70 | |
EUR/USD | | | Floating | | | | 2009 | | | | 2014 | | | | EUR | | | | 23,383,000 | | | | EUR | | | | 23,383,000 | |
EUR/USD | | | 3.922 | | | | 2009 | | | | 2014 | | | | EUR | | | | 301,047,000 | | | | EUR | | | | 301,047,000 | |
EUR/USD | | | 3.915 | | | | 2009 | | | | 2014 | | | | EUR | | | | 301,047,000 | | | | EUR | | | | 301,047,000 | |
EUR/USD | | | 1.385 | | | | 2010 | | | | 2013 | | | | EUR | | | | 264,074,000 | | | | EUR | | | | 264,074,000 | |
EUR/USD | | | 1.3855 | | | | 2010 | | | | 2013 | | | | EUR | | | | 242,937,000 | | | | EUR | | | | 242,937,000 | |
EUR/USD | | | 5.6575 | | | | 2010 | | | | 2020 | | | | EUR | | | | 469,317,000 | | | | EUR | | | | 469,317,000 | |
EUR/USD | | | 5.695 | | | | 2010 | | | | 2020 | | | | EUR | | | | 469,317,000 | | | | EUR | | | | 469,317,000 | |
EUR/USD | | | Floating | | | | 2010 | | | | 2020 | | | | EUR | | | | 241,460,000 | | | | EUR | | | | 241,460,000 | |
EUR/USD | | | Floating | | | | 2010 | | | | 2020 | | | | EUR | | | | 241,460,000 | | | | EUR | | | | 241,460,000 | |
EUR/USD | | | 2.0048 | | | | 2011 | | | | 2013 | | | | EUR | | | | 393,860,000 | | | | EUR | | | | 393,900,000 | |
EUR/USD | | | 2.0048 | | | | 2011 | | | | 2013 | | | | EUR | | | | 393,860,000 | | | | EUR | | | | 393,900,000 | |
EUR/USD | | | Floating | | | | 2011 | | | | 2021 | | | | EUR | | | | 239,900,000 | | | | EUR | | | | 239,900,000 | |
EUR/USD | | | 6,2275 | | | | 2011 | | | | 2021 | | | | EUR | | | | 466,400,000 | | | | EUR | | | | 466,400,000 | |
EUR/USD | | | 6,2865 | | | | 2011 | | | | 2021 | | | | EUR | | | | 465,310,000 | | | | EUR | | | | 465,310,000 | |
EUR/USD | | | 6,2825 | | | | 2011 | | | | 2021 | | | | EUR | | | | 465,310,000 | | | | EUR | | | | 465,310,000 | |
EUR/USD | | | Floating | | | | 2011 | | | | 2021 | | | | EUR | | | | 240,200,000 | | | | EUR | | | | 240,200,000 | |
EUR/USD | | | Floating | | | | 2011 | | | | 2021 | | | | EUR | | | | 240,200,000 | | | | EUR | | | | 240,200,000 | |
EUR/USD | | | 7.158 | | | | 2011 | | | | 2041 | | | | EUR | | | | 174,480,000 | | | | EUR | | | | 174,480,000 | |
EUR/USD | | | 7.158 | | | | 2011 | | | | 2041 | | | | EUR | | | | 174,480,000 | | | | EUR | | | | 174,480,000 | |
EUR/USD | | | Floating | | | | 2011 | | | | 2041 | | | | EUR | | | | 89,910,000 | | | | EUR | | | | 89,910,000 | |
EUR/USD | | | Floating | | | | 2011 | | | | 2041 | | | | EUR | | | | 89,910,000 | | | | EUR | | | | 89,910,000 | |
EUR/USD | | | 7,2575 | | | | 2011 | | | | 2041 | | | | EUR | | | | 115,460,000 | | | | EUR | | | | 115,460,000 | |
EUR/USD | | | 7,2575 | | | | 2011 | | | | 2041 | | | | EUR | | | | 115,460,000 | | | | EUR | | | | 115,460,000 | |
EUR/USD | | | Floating | | | | 2011 | | | | 2041 | | | | EUR | | | | 59,480,000 | | | | EUR | | | | 59,480,000 | |
EUR/USD | | | Floating | | | | 2011 | | | | 2041 | | | | EUR | | | | 59,480,000 | | | | EUR | | | | 59,480,000 | |
EUR/GBP | | | 4.495 | | | | 2004 | | | | 2014 | | | | EUR | | | | 753,200,000 | | | | EUR | | | | 753,200,000 | |
EUR/GBP | | | 3.82 | | | | 2005 | | | | 2017 | | | | EUR | | | | 486,948,000 | | | | EUR | | | | 486,948,000 | |
EUR/GBP | | | Floating | | | | 2005 | | | | 2017 | | | | EUR | | | | 250,852,000 | | | | EUR | | | | 250,852,000 | |
EUR/GBP | | | 4.14 | | | | 2006 | | | | 2016 | | | | EUR | | | | 478,599,000 | | | | EUR | | | | 478,599,000 | |
EUR/GBP | | | Floating | | | | 2006 | | | | 2016 | | | | EUR | | | | 246,551,000 | | | | EUR | | | | 246,551,000 | |
110
| | | | | | | | | | | | | | | | | | | | | | | | | | | | |
| | | Interest | | | Year | | | Original | | | Principal | |
Title | | rate (%) | | | Issue | | | Maturity | | | Amount Contracted | | | Amount Outstanding | |
EUR/GBP | | | Floating | | | | 2009 | | | | 2013 | | | | EUR | | | | 54,548,325.02 | | | | EUR | | | | 54,548,325.02 | |
EUR/GBP | | | Floating | | | | 2009 | | | | 2014 | | | | EUR | | | | 6,073,000 | | | | EUR | | | | 6,073,000 | |
EUR/GBP | | | 3.970 | | | | 2009 | | | | 2014 | | | | EUR | | | | 206,472,000 | | | | EUR | | | | 206,472,000 | |
EUR/GBP | | | 1.3625 | | | | 2010 | | | | 2013 | | | | EUR | | | | 64,333,000 | | | | EUR | | | | 64,333,000 | |
EUR/GBP | | | 1,19 | | | | 2010 | | | | 2013 | | | | EUR | | | | 63,266,000 | | | | EUR | | | | 63,266,000 | |
EUR/GBP | | | 1,789 | | | | 2011 | | | | 2013 | | | | EUR | | | | 212,440,000 | | | | EUR | | | | 212,440,000 | |
EUR/JPY | | | 3.092 | | | | 2005 | | | | 2012 | | | | EUR | | | | 338,320,000 | | | | EUR | | | | 338,320,000 | |
EUR/JPY | | | 3.821 | | | | 2006 | | | | 2013 | | | | EUR | | | | 355,745,000 | | | | EUR | | | | 355,745,000 | |
EUR/JPY | | | 4.9855 | | | | 2007 | | | | 2017 | | | | EUR | | | | 151,112,000 | | | | EUR | | | | 151,112,000 | |
EUR/JPY | | | Floating | | | | 2009 | | | | 2013 | | | | EUR | | | | 52,144,648.29 | | | | EUR | | | | 52,144,648.29 | |
EUR/JPY | | | Floating | | | | 2009 | | | | 2014 | | | | EUR | | | | 5,879,000 | | | | EUR | | | | 5,879,000 | |
EUR/JPY | | | 4.080 | | | | 2009 | | | | 2014 | | | | EUR | | | | 279,518,000 | | | | EUR | | | | 279,518,000 | |
EUR/JPY | | | 1.7775 | | | | 2010 | | | | 2013 | | | | EUR | | | | 70,043,000 | | | | EUR | | | | 70,043,000 | |
EUR/JPY | | | 2.32 | | | | 2011 | | | | 2013 | | | | EUR | | | | 176,720,000 | | | | EUR | | | | 176,720,000 | |
EUR/EUR | | | 5.28 | | | | 2002 | | | | 2014 | | | | EUR | | | | 30,000,000 | | | | EUR | | | | 30,000,000 | |
EUR/EUR | | | Floating | | | | 2002 | | | | 2014 | | | | EUR | | | | (30,000,000 | ) | | | EUR | | | | (30,000,000 | ) |
EUR/EUR | | | 5.368 | | | | 2002 | | | | 2015 | | | | EUR | | | | 30,452,000 | | | | EUR | | | | 30,452,000 | |
EUR/EUR | | | Floating | | | | 2002 | | | | 2015 | | | | EUR | | | | (30,452,000 | ) | | | EUR | | | | (30,452,000 | ) |
EUR/EUR | | | 4.500 | | | | 2004 | | | | 2014 | | | | EUR | | | | (300,000,000 | ) | | | EUR | | | | (300,000,000 | ) |
EUR/EUR | | | Floating | | | | 2004 | | | | 2014 | | | | EUR | | | | 300,000,000 | | | | EUR | | | | 300,000,000 | |
EUR/EUR | | | 4.500 | | | | 2004 | | | | 2014 | | | | EUR | | | | (700,000,000 | ) | | | EUR | | | | (700,000,000 | ) |
EUR/EUR | | | Floating | | | | 2004 | | | | 2014 | | | | EUR | | | | 700,000,000 | | | | EUR | | | | 700,000,000 | |
EUR/EUR | | | 4.495 | | | | 2004 | | | | 2014 | | | | EUR | | | | (300,000,000 | ) | | | EUR | | | | (300,000,000 | ) |
EUR/EUR | | | Floating | | | | 2004 | | | | 2014 | | | | EUR | | | | 300,000,000 | | | | EUR | | | | 300,000,000 | |
EUR/EUR | | | 3.253 | | | | 2005 | | | | 2012 | | | | EUR | | | | 250,000,000 | | | | EUR | | | | 250,000,000 | |
EUR/EUR | | | Floating | | | | 2005 | | | | 2012 | | | | EUR | | | | (250,000,000 | ) | | | EUR | | | | (250,000,000 | |
EUR/EUR | | | 3.259 | | | | 2005 | | | | 2012 | | | | EUR | | | | 250,000,000 | | | | EUR | | | | 250,000,000 | |
EUR/EUR | | | Floating | | | | 2005 | | | | 2012 | | | | EUR | | | | (250,000,000 | ) | | | EUR | | | | (250,000,000 | ) |
EUR/EUR | | | 3.875 | | | | 2005 | | | | 2020 | | | | EUR | | | | (200,000,000 | ) | | | EUR | | | | (200,000,000 | ) |
EUR/EUR | | | Floating | | | | 2005 | | | | 2020 | | | | EUR | | | | 200,000,000 | | | | EUR | | | | 200,000,000 | |
EUR/EUR | | | 3.893 | | | | 2006 | | | | 2012 | | | | EUR | | | | 330,000,000 | | | | EUR | | | | 330,000,000 | |
EUR/EUR | | | Floating | | | | 2006 | | | | 2012 | | | | EUR | | | | (330,000,000 | ) | | | EUR | | | | (330,000,000 | ) |
EUR/EUR | | | 3.3959 | | | | 2006 | | | | 2014 | | | | EUR | | | | 250,000,000 | | | | EUR | | | | 250,000,000 | |
EUR/EUR | | | Floating | | | | 2006 | | | | 2014 | | | | EUR | | | | (250,000,000 | ) | | | EUR | | | | (250,000,000 | ) |
EUR/EUR | | | 4.9899 | | | | 2006 | | | | 2014 | | | | EUR | | | | 350,000,000 | | | | EUR | | | | 350,000,000 | |
EUR/EUR | | | Floating | | | | 2006 | | | | 2014 | | | | EUR | | | | (350,000,000 | ) | | | EUR | | | | (350,000,000 | ) |
EUR/EUR | | | 3.5 | | | | 2006 | | | | 2016 | | | | EUR | | | | 340,000,000 | | | | EUR | | | | 340,000,000 | |
EUR/EUR | | | Floating | | | | 2006 | | | | 2016 | | | | EUR | | | | (340,000,000 | ) | | | EUR | | | | (340,000,000 | ) |
EUR/EUR | | | 4.375 | | | | 2007 | | | | 2017 | | | | EUR | | | | 340,000,000 | | | | EUR | | | | 340,000,000 | |
EUR/EUR | | | Floating | | | | 2007 | | | | 2017 | | | | EUR | | | | (340,000,000 | ) | | | EUR | | | | (340,000,000 | ) |
EUR/EUR | | | 5.374 | | | | 2007 | | | | 2014 | | | | EUR | | | | 170,000,000 | | | | EUR | | | | 170,000,000 | |
EUR/EUR | | | Floating | | | | 2007 | | | | 2014 | | | | EUR | | | | (170,000,000 | ) | | | EUR | | | | (170,000,000 | ) |
EUR/EUR | | | 5.75 | | | | 2008 | | | | 2018 | | | | EUR | | | | 500,000,000 | | | | EUR | | | | 500,000,000 | |
EUR/EUR | | | Floating | | | | 2008 | | | | 2018 | | | | EUR | | | | (500,000,000 | ) | | | EUR | | | | (500,000,000 | ) |
EUR/EUR | | | 3.625 | | | | 2009 | | | | 2016 | | | | EUR | | | | 510,000,000 | | | | EUR | | | | 510,000,000 | |
EUR/EUR | | | Floating | | | | 2009 | | | | 2016 | | | | EUR | | | | (510,000,000 | ) | | | EUR | | | | (510,000,000 | ) |
EUR/EUR | | | 3.250 | | | | 2009 | | | | 2014 | | | | EUR | | | | 680,000,000 | | | | EUR | | | | 680,000,000 | |
111
| | | | | | | | | | | | | | | | | | | | | | | | | | | | |
| | | Interest | | | Year | | | Original | | | Principal | |
Title | | rate (%) | | | Issue | | | Maturity | | | Amount Contracted | | | Amount Outstanding | |
EUR/EUR | | | Floating | | | | 2009 | | | | 2014 | | | | EUR | | | | (680,000,000 | ) | | | EUR | | | | (680,000,000 | ) |
EUR/EUR | | | 6.00 | | | | 2011 | | | | 2019 | | | | EUR | | | | 340,000,000 | | | | EUR | | | | 340,000,000 | |
EUR/EUR | | | Floating | | | | 2011 | | | | 2019 | | | | EUR | | | | (340,000,000 | ) | | | EUR | | | | (340,000,000 | ) |
EUR/CHF | | | Floating | | | | 2008 | | | | 2013 | | | | EUR | | | | 47,393,000 | | | | EUR | | | | 47,393,000 | |
EUR/CHF | | | Floating | | | | 2008 | | | | 2016 | | | | EUR | | | | 63,191,000 | | | | EUR | | | | 63,191,000 | |
| | | | | | | | | | | | | | | | | | | | | | | | | | | | |
Total | | | | | | | | | | | | | | | | | | | | | | | EUR | | | | 11,683,002,236.75 | |
| | | | | | | | | | | | | | | | | | | | | | | | | | | | |
Total Euro Debt | | | | | | | | | | | | | | | | | | | | | | | | | | | | |
| | | | | | | | | | | | | | | | | | | | | | | EUR | | | | 28,072,319,607,50 | |
| | | | | | | | | | | | | | | | | | | | | | | | | | | | |
U.S. Dollar equivalent | | | | | | | | | | | | | | | | | | | | | | | USD | | | | 36,289,433,270.24 | |
| | | | | | | | | | | | | | | | | | | | | | | | | | | | |
| | | | |
| | | Interest | | | Year | | | Original | | | Principal | |
Title | | rate (%) | | | Issue | | | Maturity | | | Amount Contracted | | | Amount Outstanding | |
3. Pound Sterling Debt | | | | | | | | | | | | | | | | | | | | | | | | | | | | |
a. Bonds | | | | | | | | | | | | | | | | | | | | | | | | | | | | |
GBP Bond | | | 5.500 | | | | 2004 | | | | 2014 | | | | GBP | | | | 500,000,000 | | | | GBP | | | | 500,000,000 | |
GBP Bond | | | 5.000 | | | | 2005 | | | | 2017 | | | | GBP | | | | 500,000,000 | | | | GBP | | | | 500,000,000 | |
GBP Bond | | | 5.000 | | | | 2006 | | | | 2016 | | | | GBP | | | | 500,000,000 | | | | GBP | | | | 500,000,000 | |
| | | | | | | | | | | | | | | | | | | | | | | | | | | | |
Total | | | | | | | | | | | | | | | | | | | | | | | GBP | | | | 1,500,000,000 | |
| | | | | | | | | | | | | | | | | | | | | | | | | | | | |
b. Swap Arrangements | | | | | | | | | | | | | | | | | | | | | | | | | | | | |
GBP/EUR | | | 5.50 | | | | 2004 | | | | 2014 | | | | GBP | | | | (500,000,000 | ) | | | GBP | | | | (500,000,000 | ) |
GBP/EUR | | | 5.00 | | | | 2005 | | | | 2017 | | | | GBP | | | | (170,000,000 | ) | | | GBP | | | | (170,000,000 | ) |
GBP/EUR | | | 5.00 | | | | 2006 | | | | 2016 | | | | GBP | | | | (330,000,000 | ) | | | GBP | | | | (330,000,000 | ) |
GBP/EUR | | | 5.00 | | | | 2006 | | | | 2016 | | | | GBP | | | | (170,000,000 | ) | | | GBP | | | | (170,000,000 | ) |
GBP/EUR | | | 5.00 | | | | 2006 | | | | 2016 | | | | GBP | | | | (330,000,000 | ) | | | GBP | | | | (330,000,000 | ) |
GBP/EUR | | | Floating | | | | 2009 | | | | 2013 | | | | GBP | | | | (47,137,389.58 | ) | | | GBP | | | | (47,137,389.58 | ) |
GBP/EUR | | | Floating | | | | 2009 | | | | 2014 | | | | GBP | | | | (5,437,522.86 | ) | | | GBP | | | | (5,437,522.86 | ) |
GBP/EUR | | | Floating | | | | 2009 | | | | 2014 | | | | GBP | | | | (186,402,554.96 | ) | | | GBP | | | | (186,402,554.96 | ) |
GBP/EUR | | | Floating | | | | 2010 | | | | 2013 | | | | GBP | | | | (53,800,000 | ) | | | GBP | | | | (53,800,000 | ) |
GBP/EUR | | | Floating | | | | 2010 | | | | 2013 | | | | GBP | | | | (53,801,530.28 | ) | | | GBP | | | | (53,801,530.28 | ) |
GBP/EUR | | | Floating | | | | 2011 | | | | 2013 | | | | GBP | | | | (192,049,924.78 | ) | | | GBP | | | | (192,049,924.78 | ) |
| | | | | | | | | | | | | | | | | | | | | | | | | | | | |
Total | | | | | | | | | | | | | | | | | | | | | | | GBP | | | | (2,038,628,922.46 | ) |
| | | | | | | | | | | | | | | | | | | | | | | | | | | | |
Total Pound Sterling Debt | | | | | | | | | | | | | | | | | | | | | | | GBP | | | | (538,628,922.46 | ) |
| | | | | | | | | | | | | | | | | | | | | | | | | | | | |
U.S. Dollar equivalent | | | | | | | | | | | | | | | | | | | | | | | USD | | | | (830,613,780 | ) |
| | | | | | | | | | | | | | | | | | | | | | | | | | | | |
| | | | |
| | | Interest | | | Year | | | Original | | | Principal | |
Title | | rate (%) | | | Issue | | | Maturity | | | Amount Contracted | | | Amount Outstanding | |
4. Japanese Yen Debt | | | | | | | | | | | | | | | | | | | | | | | | | | | | |
a. Bonds | | | | | | | | | | | | | | | | | | | | | | | | | | | | |
JPY Bond | | | 0.96 | | | | 2005 | | | | 2012 | | | | JPY | | | | 45,000,000,000 | | | | JPY | | | | 45,000,000,000 | |
112
| | | | | | | | | | | | | | | | | | | | | | | | | | | | |
| | | Interest | | | Year | | | Original | | | Principal | |
Title | | rate (%) | | | Issue | | | Maturity | | | Amount Contracted | | | Amount Outstanding | |
JPY Bond | | | 1.67 | | | | 2006 | | | | 2013 | | | | JPY | | | | 50,000,000,000 | | | | JPY | | | | 50,000,000,000 | |
JPY Bond | | | 2.11 | | | | 2007 | | | | 2017 | | | | JPY | | | | 25,000,000,000 | | | | JPY | | | | 25,000,000,000 | |
| | | | | | | | | | | | | | | | | | | | | | | | | | | | |
Total | | | | | | | | | | | | | | | | | | | | | | | JPY | | | | 120,000,000,000 | |
| | | | | | | | | | | | | | | | | | | | | | | | | | | | |
b. Swap Arrangements | | | | | | | | | | | | | | | | | | | | | | | | | | | | |
JPY/EUR | | | 0.96 | | | | 2005 | | | | 2012 | | | | JPY | | | | (45,000,000,000 | ) | | | JPY | | | | (45,000,000,000 | ) |
JPY/EUR | | | 1.67 | | | | 2006 | | | | 2013 | | | | JPY | | | | (50,000,000,000 | ) | | | JPY | | | | (50,000,000,000 | ) |
JPY/EUR | | | 2.11 | | | | 2007 | | | | 2017 | | | | JPY | | | | (25,000,000,000 | ) | | | JPY | | | | (25,000,000,000 | ) |
JPY/EUR | | | Floating | | | | 2009 | | | | 2013 | | | | JPY | | | | (6,971,218,030 | ) | | | JPY | | | | (6,971,218,030 | ) |
JPY/EUR | | | Floating | | | | 2009 | | | | 2014 | | | | JPY | | | | (789,781,661 | ) | | | JPY | | | | (789,781,661 | ) |
JPY/EUR | | | Floating | | | | 2009 | | | | 2014 | | | | JPY | | | | (36,876,909,302 | ) | | | JPY | | | | (36,876,909,302 | ) |
JPY/EUR | | | Floating | | | | 2010 | | | | 2013 | | | | JPY | | | | (7,958,970,000 | ) | | | JPY | | | | (7,958,970,000 | ) |
JPY/EUR | | | Floating | | | | 2011 | | | | 2013 | | | | JPY | | | | (20,578,079,439 | ) | | | JPY | | | | (20,578,079,439 | ) |
Total | | | | | | | | | | | | | | | | | | | | | | | JPY | | | | (193,174,958,432 | ) |
| | | | | | | | | | | | | | | | | | | | | | | | | | | | |
Total Japanese Yen Debt | | | | | | | | | | | | | | | | | | | | | | | JPY | | | | (73,174,958,432 | ) |
| | | | | | | | | | | | | | | | | | | | | | | | | | | | |
U.S. Dollar equivalent | | | | | | | | | | | | | | | | | | | | | | | USD | | | | (944,056,687 | ) |
| | | | | | | | | | | | | | | | | | | | | | | | | | | | |
| | | | |
| | | Interest | | | Year | | | Original | | | Principal | |
Title | | rate (%) | | | Issue | | | Maturity | | | Amount Contracted | | | Amount Outstanding | |
5. Swiss franc Debt | | | | | | | | | | | | | | | | | | | | | | | | | | | | |
a. Loans | | | | | | | | | | | | | | | | | | | | | | | | | | | | |
Assumed loans | | | Various | | | | 2011 | | | | 2028 | | | | CHF | | | | 150,000,000 | | | | CHF | | | | 299,503,881.97 | |
| | | | | | | | | | | | | | | | | | | | | | | | | | | | |
Total | | | | | | | | | | | | | | | | | | | | | | | CHF | | | | 299,503,881.97 | |
| | | | | | | | | | | | | | | | | | | | | | | | | | | | |
b. Bonds | | | | | | | | | | | | | | | | | | | | | | | | | | | | |
CHF Bond | | | 3.5 | | | | 2008 | | | | 2013 | | | | CHF | | | | 150,000,000 | | | | CHF | | | | 150,000,000 | |
CHF Bond | | | 4 | | | | 2008 | | | | 2016 | | | | CHF | | | | 200,000,000 | | | | CHF | | | | 200,000,000 | |
| | | | | | | | | | | | | | | | | | | | | | | | | | | | |
Total | | | | | | | | | | | | | | | | | | | | | | | CHF | | | | 350,000,000 | |
| | | | | | | | | | | | | | | | | | | | | | | | | | | | |
c. Swap Arrangements | | | | | | | | | | | | | | | | | | | | | | | | | | | | |
| | | | | | | |
CHF/EUR | | | 3.5 | | | | 2008 | | | | 2013 | | | | CHF | | | | (75,000,000 | ) | | | CHF | | | | (75,000,000 | ) |
CHF/EUR | | | 4.0 | | | | 2008 | | | | 2016 | | | | CHF | | | | (100,000,000 | ) | | | CHF | | | | (100,000,000 | ) |
| | | | | | | | | | | | | | | | | | | | | | | | | | | | |
Total | | | | | | | | | | | | | | | | | | | | | | | CHF | | | | (175,000,000 | ) |
| | | | | | | | | | | | | | | | | | | | | | | | | | | | |
Total Swiss Franc Debt | | | | | | | | | | | | | | | | | | | | | | | CHF | | | | 474,503,881.97 | |
| | | | | | | | | | | | | | | | | | | | | | | | | | | | |
U.S. Dollar equivalent | | | | | | | | | | | | | | | | | | | | | | | USD | | | | 504,530,033.38 | |
| | | | | | | | | | | | | | | | | | | | | | | | | | | | |
| | | | |
| | | Interest | | | Year | | | Original | | | | |
Title | | rate (%) | | | Issue | | | Maturity | | | Amount Contracted | | | Principal Amount Outstanding | |
6. Special Drawing Right Debt | | | | | | | | | | | | | | | | | | | | | | | | | | | | |
IMF | | | Floating | | | | 2008-09 | | | | 2014 | | | | SDR | | | | 6,372,500,000 | | | | SDR | | | | 6,372,500,000 | |
| | | | | | | | | | | | | | | | | | | | | | | | | | | | |
Total Special Drawing Right Debt | | | | | | | | | | | | | | | | | | | | | | | SDR | | | | 6,372,500,000 | |
| | | | | | | | | | | | | | | | | | | | | | | | | | | | |
U.S. Dollar equivalent | | | | | | | | | | | | | | | | | | | | | | | USD | | | | 9,783,508,075 | |
| | | | | | | | | | | | | | | | | | | | | | | | | | | | |
113
| | | | | | | | | | | | | | | | |
| | | Interest | | Year | | Original | | Principal | |
Title | | rate (%) | | Issue | | Maturity | | Amount Contracted | | Amount Outstanding | |
HUNGARY | | | | | | | | | | | | | | | | |
Total External Funded Convertible Currency Debt | | | | | | | | | | | USD | | | | 42,290,839,294.07 | |
| | | | | | | | | | | | | | | | |
TOTAL EXTERNAL CONVERTIBLE CURRENCY FUNDED DEBT OF THE BANK AND OF HUNGARY | | | | | | | | | | | USD | | | | 44,611,745,146.32 | |
| | | | | | | | | | | | | | | | |
114
Internal Debt of Hungary
(As at December 31, 2011)
| | | | | | | | | | | | | | | | | | | | | | | | | | | | |
Title | | Interest
Rate (%) | | | Year | | | Original Amount
Contracted | | | | |
| | | Issue | | | Maturity | | | | Principal Amount
Outstanding | |
| | | | | | | | | | | | (HUF, EUR and USD millions) | |
1. Loans | | | | | | | | | | | | | | | | | | | | | | | | | | | | |
a. from EIB | | | Fixed, Floating | | | | 2007-2010 | | | | 2025 | | | | EUR | | | | 2,570 | | | | HUF | | | | 480,992.2 | |
b. assumed loans | | | Floating | | | | 2011 | | | | 2016 | | | | HUF | | | | 50,000.0 | | | | HUF | | | | 50,000.0 | |
c. from CEB | | | Fixed, Floating | | | | 2009 | | | | 2019 | | | | EUR | | | | 433 | | | | HUF | | | | 59,833.2 | |
| | | | | | | | | | | | | | | | | | | | | | | | |
Total Loans | | | | HUF | | | | 590,825.5 | |
| | | | USD | | | | 2,454.8 | |
| | | | | | | | | | | | | | | | | | | | | | | | | | | | |
2. Hungarian Treasury Bonds for the purpose of: | | | | | | | | | | | | | | | | | | | | | | | | |
a. 1998-11 Central Budget | | | Fixed Floating | | | | 1998-11 | | | | 2011-28 | | | | HUF | | | | | | | | HUF | | | | 7,519,618.0 | |
b. Housing Loans | | | Floating | | | | 1992 | | | | 2016 | | | | HUF | | | | 83,200.0 | | | | HUF | | | | 16,700.0 | |
c. Purchase of net rouble receivables held by the Bank | | | 8.4 | | | | 1992 | | | | 2012 | | | | HUF | | | | 48,300.0 | | | | HUF | | | | 1,426.4 | |
d. Loan Consolidation Programme and Bank Consolidation Programme | | | Floating | | | | 1993-96 | | | | 2013-16 | | | | HUF | | | | 395,000.0 | | | | HUF | | | | 259,783.0 | |
e. Securitization of non-interest bearing debt outstanding to the Bank | | | Floating | | | | 1994-96 | | | | 2026 | | | | HUF | | | | 417,110.0 | | | | HUF | | | | 125,317.8 | |
| | | | | | | | | | | | | | | | | | | | | | | | |
Total Hungarian Treasury Bonds | | | | | | | | | | | | | | | | | | | | | | | HUF | | | | 7,922,845.2 | |
| | | | USD | | | | 32,918.6 | |
| | | | | | | | | | | | | | | | | | | | | | | | |
3. Hungarian Treasury Bills: | | | | | | | | | | | | | | | | | | | | | | | | |
a. Fixed interest rate | | | 5.25-7.0 | | | | 2010-11 | | | | 2012-13 | | | | | | | | | | | | HUF | | | | 307,604.4 | |
b. Discount | | | — | | | | 2011 | | | | 2012 | | | | | | | | | | | | HUF | | | | 1,540,917.8 | |
| | | | | | | | | | | | | | | | | | | | | | | | |
Total Hungarian Treasury Bills | | | | | | | | | | | | | | | | | | | | | | | HUF | | | | 1,848,522.3 | |
| | | | USD | | | | 7,680.4 | |
| | | | | | | | | | | | | | | | | | | | | | | | |
HUNGARY’S TOTAL INTERNAL DEBT | | | | HUF | | | | 10,362,193.0 | |
U.S. Dollar Equivalent(1) | | | | USD | | | | 43,053.8 | |
| | | | | | | | | | | | | | | | | | | | | | | | |
Source: GDMA Pte Ltd.
Note:
| (1) | All totals calculated on the basis of exchange rates as on December 31, 2011. The exchange rate was 240.68 HUF/USD on December 31, 2011. |
115
Guarantees Provided by Hungary
(As of December 31, 2011)
| | | | | | | | |
Title | | Principal Amount Outstanding | |
| | | (millions) | |
Hungary Guaranteed Debt in Foreign Currency (expressed in USD equivalents)(1) | | | | |
Loans raised from international financial institutions | | | USD | | | | 549.96 | |
Guarantees for various purposes | | | USD | | | | 323.42 | |
Guarantees based on law | | | USD | | | | 4,060.20 | |
| | | | |
Total Guarantees in Foreign Currency | | | USD | | | | 4,933.58 | |
| | | | |
Hungary Guaranteed Debt in HUF | | | | | | | | |
Guarantees for various purposes | | | HUF | | | | 116,022.00 | |
Guarantees based on law | | | HUF | | | | 1,166,260.60 | |
| | | | |
Total Guarantees in HUF | | | HUF | | | | 1,282,282.60 | |
USD Equivalent(1) | | | USD | | | | 5,327.75 | |
| | | | |
TOTAL FOREIGN CURRENCY AND HUF GUARANTEES | | | USD | | | | 10,261.33 | |
| | | | |
| (1) | Calculated on the basis of exchange rate as of December 31, 2011. |
116