UNITED STATES
SECURITIES AND EXCHANGE COMMISSION
Washington, D.C. 20549
FORM N-CSR
CERTIFIED SHAREHOLDER REPORT OF REGISTERED
MANAGEMENT INVESTMENT COMPANIES
Investment Company Act file number 811-06740
Legg Mason Partners Institutional Trust
(Exact name of registrant as specified in charter)
620 Eighth Avenue, 47th Floor, New York, NY 10018
(Address of principal executive offices) (Zip code)
Marc A. De Oliveira
Franklin Templeton
100 First Stamford Place
Stamford, CT 06902
(Name and address of agent for service)
Registrant’s telephone number, including area code: 877-6LM-FUND/656-3863
Date of fiscal year end: December 31
Date of reporting period: December 31, 2022
| ITEM 1. | REPORT TO STOCKHOLDERS. |
The Annual Report to Stockholders is filed herewith.

| | |
| Annual Report | | December 31, 2022 |
WESTERN ASSET
SMASh SERIES CORE PLUS COMPLETION FUND

|
| INVESTMENT PRODUCTS: NOT FDIC INSURED • NO BANK GUARANTEE • MAY LOSE VALUE |
Fund objective
The Fund seeks to maximize total return consisting of capital appreciation and income, consistent with prudent investment management.
Letter from the president

Dear Shareholder,
We are pleased to provide the short-period annual report of Western Asset SMASh Series Core Plus Completion Fund for the ten-month period from March 1, 2022 through December 31, 2022. The shortened reporting period is the result of a recent change to the Fund’s fiscal year end from February 28th to December 31st that was proposed by the Fund’s manager, Legg Mason Partners Fund Advisor, LLC, and approved by the Fund’s Board of Trustees. Please read on for a detailed look at prevailing economic and market conditions during the Fund’s reporting period and to learn how those conditions have affected Fund performance.
As always, thank you for your confidence in our stewardship of your assets.
Sincerely,

Jane Trust, CFA
President and Chief Executive Officer
January 31, 2023
| | |
II | | Western Asset SMASh Series Core Plus Completion Fund |
Fund overview
Q. What is the Fund’s investment strategy?
A. The Fund seeks to maximize total return consisting of capital appreciation and income, consistent with prudent investment management. The Fund has a flexible investment strategy and invests in a variety of securities and instruments and uses a variety of investment techniques in pursuing its objective. Under normal market conditions, the Fund expects to invest primarily in any combination of U.S. dollar denominated and non-U.S. dollar denominated debt obligations (including loans and loan participations) of both U.S and non-U.S. issuers (including emerging market issuers) and in derivatives and other instruments relating to such investments. The Fund may at times invest in the securities of issuers located in only one country or in a relatively small number of countries, including in any emerging market country or countries. Currently, the Fund does not contemplate investing 25% or more of its assets in a single country or a small number of countries, except in the United States. We may invest a significant portion of the Fund’s assets in various industry sectors, to the extent consistent with the Fund’s fundamental investment restrictions.
In purchasing debt obligations for the Fund, we may take full advantage of the entire range of maturities and durations, and may adjust the average maturity or duration of the Fund’s investments from time to time. The Fund may invest without limit in both investment grade (that is, rated in the Baa/BBB categories or above or, if unrated, that we determined to be of comparable credit quality) securities and below investment grade securities rated in the C category or above or unrated securities that we determined to be of comparable credit quality. Below investment grade debt obligations are sometimes referred to as “junk bonds” or “high yield securities”. The Fund may invest without limit in loans, loan participations and fixed income securities that pay interest at rates that float or reset periodically at a margin above a generally recognized base lending rate such as the Prime Rate, the London Inter-Bank Offered Rate or another generally recognized base lending rate. The Fund may also invest in structured notes, including total return swaps and credit-linked notes.
Instead of, and/or in addition to, investing directly in particular securities, the Fund may use instruments such as derivatives, including options, interest rate swaps, credit default swaps and options on credit default swaps, foreign currency futures, forwards and options, and futures contracts, and other synthetic instruments that are intended to provide economic exposure to the securities or the issuer or to be used as a hedging technique. The Fund may use one or more types of these instruments without limit. The Fund may also engage in a variety of transactions using derivatives in order to change the investment characteristics of its portfolio (such as shortening or lengthening duration) and for other purposes. The Fund may borrow money to increase portfolio holdings, to the extent consistent with the Fund’s fundamental investment restrictions.
At Western Asset Management Company, LLC (“Western Asset”), the Fund’s subadviser, we utilize a fixed income team approach, with decisions derived from interaction among various investment management sector specialists. The sector teams are comprised of
| | | | |
| Western Asset SMASh Series Core Plus Completion Fund 2022 Annual Report | | | | 1 |
Fund overview (cont’d)
Western Asset’s senior portfolio management personnel, research analysts and an in-house economist. Under this team approach, management of client fixed income portfolios will reflect a consensus of interdisciplinary views within the Western Asset organization.
Q. What were the overall market conditions during the Fund’s reporting period?
A. Fixed income markets experienced periods of volatility and, overall, declined over the period from March 1, 2022 through December 31, 2022 (the “reporting period”). The market’s decline was driven by a number of factors, including elevated and persistent inflation, aggressive Federal Reserve Board (the “Fed”) monetary policy tightening, the repercussions from the COVID-19 pandemic and its variants, the weakening global economy, and the war in Ukraine.
Short-term U.S. Treasury yields moved sharply higher as the Fed began to raise interest rates in March 2022 in attempt to rein in inflation. Over the next nine months, the central bank hiked rates an additional six times, bringing the federal funds rate to a range between 4.25% and 4.50% — the highest level since 2008. The yield for the two-year Treasury note began the reporting period at 1.44% and ended the period at 4.41%. The low of 1.31% took place on March 1, 2022 and the peak of 4.72% occurred on November 7, 2022. The yield for the ten-year Treasury note began the reporting period at 1.83% and ended the period at 3.88%. The low of 1.67% took place on February 28, 2022 and the peak of 4.25% occurred on October 24, 2022. All told, the Bloomberg U.S. Aggregate Indexi returned -10.09% for the reporting period.
Q. How did we respond to these changing market conditions?
A. A number of adjustments were made to the Fund during the reporting period. We tactically managed the Fund’s duration as yields fluctuated, maintaining an overall long position relative to the Bloomberg U.S. Aggregate Index throughout the reporting period. The Fund also added agency mortgage-backed securities (“MBS”) throughout the reporting period, reducing its underweight exposure to neutral versus the Bloomberg U.S. Aggregate Index, as spreads widened due to quantitative tightening and increased rate volatility. In terms of reductions, the Fund tactically pared its emerging markets exposure, reducing local-currency and U.S. dollar sovereign exposure during the first half of 2022. The Fund also trimmed its allocations to high yield bonds and bank loans given growth concerns. Finally, the Fund added investment-grade credit, primarily during the second and third quarters of 2022 as spreads widened. This exposure was then pared back in the fourth quarter of 2022 as spreads tightened, resulting in a net reduction for the reporting period as a whole.
During the reporting period, the Fund used interest rate futures, options and swaps to manage its duration and yield curve exposure, which significantly detracted from results. Credit default swaps on both investment-grade and high yield issuers and indices were used to manage the Fund’s credit exposures and slightly contributed to results. Finally, the Fund’s use of currency forwards, options and futures, to take outright currency positions as well as to hedge non-U.S. dollar currency exposures, in aggregate, detracted from returns.
| | | | |
2 | | | | Western Asset SMASh Series Core Plus Completion Fund 2022 Annual Report |
Performance review
For the ten months ended December 31, 2022, Western Asset SMASh Series Core Plus Completion Fund returned -22.01%. The Fund’s unmanaged benchmark, the Bloomberg U.S. Aggregate Index, returned -10.09% for the same period.
| | | | | | | | |
Performance Snapshot as of December 31, 2022
(unaudited) | |
| | | 6 months | | | 10 months | |
| Western Asset SMASh Series Core Plus Completion Fund | | | -4.04 | % | | | -22.01 | % |
| Bloomberg U.S. Aggregate Index | | | -2.97 | % | | | -10.09 | % |
The performance shown represents past performance. Past performance is no guarantee of future results and current performance may be higher or lower than the performance shown above. Principal value, investment returns and yields will fluctuate and investors’ shares, when redeemed, may be worth more or less than their original cost. To obtain performance data current to the most recent month-end, please call the Fund at 877-6LM-FUND/656-3863.
Fund returns assume the reinvestment of all distributions, including returns of capital, at net asset value and the deduction of all Fund expenses. Returns have not been adjusted to include the deduction of taxes that a shareholder would pay on Fund distributions. Performance figures for periods shorter than one year represent cumulative figures and are not annualized.
Investors should understand that the Fund is managed within the context of a separately managed account and not with the objective of matching or exceeding the Fund’s stated benchmark, which is used for Fund reporting purposes. As such, comparisons of the Fund’s performance to that of the indicated benchmark are not likely to be meaningful. Additionally, performance figures do not reflect the effect of fees and expenses associated with a separately managed account or the management fee or other operating expenses of the Fund. Such management fees are paid directly or indirectly by the separately managed account sponsor to the Fund’s manager or subadviser. All operating expenses of the Fund (other than interest, brokerage, taxes and extraordinary expenses) are reimbursed by the manager.
|
| Total Annual Operating Expenses (unaudited) |
As of the Fund’s current prospectus dated June 28, 2022, the gross total annual fund operating expense ratio was 0.03%.
Actual expenses may be higher. For example, expenses may be higher than those shown if average net assets decrease. Net assets are more likely to decrease and Fund expense ratios are more likely to increase when markets are volatile.
The Fund’s manager has entered into an expense reimbursement arrangement with the Fund pursuant to which the Fund’s manager has agreed to reimburse 100% of the Fund’s ordinary operating expenses. The expense reimbursement arrangement does not cover interest, brokerage, taxes and extraordinary expenses. This expense reimbursement arrangement cannot be terminated prior to December 31, 2024 without the Board of Trustees’ consent. However, all Fund shareholders are participating in separately managed account programs and pay fees to program sponsors for the costs and expenses of the
| | | | |
| Western Asset SMASh Series Core Plus Completion Fund 2022 Annual Report | | | | 3 |
Fund overview (cont’d)
program, including fees for investment advice and portfolio execution, some of which are used to compensate the Fund’s manager or subadviser for managing the Fund and to reimburse the Fund for all operating expenses.
Q. What were the leading contributors to performance?
A. The largest contributor to the Fund’s relative performance during the reporting period was its yield curve positioning. During the period, the Fund was focused on an overweight to the very long end of the yield curve as short-term rates rose more than long-term rates.
The Fund’s overweight exposure to emerging markets contributed, mainly due to favorable selection within local currency exposures, as U.S. dollar-denominated emerging market bond spreads widened, and emerging market currencies were mixed versus the U.S. dollar. An overweight exposure to investment-grade corporate credit was beneficial, due to favorable subsector selection and tactical additions at wider spread levels during the fourth quarter of 2022. Finally, an underweight to agency MBS for most of the period contributed to performance as spreads widened.
Q. What were the leading detractors from performance?
A. The most significant detractor from performance was the Fund’s duration positioning as yields rose sharply during the reporting period. The Fund’s exposures to non-U.S. developed markets was also a headwind for results, as the U.S. dollar strengthened against most developed market currencies. Finally, an allocation to non-agency residential MBS detracted from performance as their spreads widened.
Thank you for your investment in Western Asset SMASh Series Core Plus Completion Fund. As always, we appreciate that you have chosen us to manage your assets and we remain focused on achieving the Fund’s investment goals.
Sincerely,
Western Asset Management Company, LLC
January 20, 2023
RISKS: Investments in fixed income securities are subject to interest rate and credit risks. As interest rates rise, bond prices fall, reducing the value of the Fund’s share price. There is also a risk that an issuer will be unable to make principal and/or interest payments. High yield bonds, commonly known as “junk bonds”, involve greater credit and liquidity risks than investment grade bonds. Foreign securities are subject to the additional risks of fluctuations in foreign exchange rates, changes in political and economic conditions, foreign taxation and differences in auditing and financial standards. These risks are magnified in emerging markets. Emerging market countries tend to have economic, political, and legal systems that are less developed and are less stable than those of more developed countries. The Fund may use derivatives, such as futures and options, which can be illiquid, may disproportionately increase losses and have a potentially large impact on Fund performance. As a non-diversified Fund, the Fund is permitted to invest a larger percentage of its assets in a smaller number of issuers than a diversified fund,
| | | | |
4 | | | | Western Asset SMASh Series Core Plus Completion Fund 2022 Annual Report |
which may increase its vulnerability to the negative events affecting a particular issuer. Please see the Fund’s prospectus for a more complete discussion of these and other risks and the Fund’s investment strategies.
The mention of sector breakdowns is for informational purposes only and should not be construed as a recommendation to purchase or sell any securities. The information provided regarding such sectors is not a sufficient basis upon which to make an investment decision. Investors seeking financial advice regarding the appropriateness of investing in any securities or investment strategies discussed should consult their financial professional. Portfolio holdings are subject to change at any time and may not be representative of the portfolio managers’ current or future investments. The Fund’s top five sector holdings (as a percentage of net assets) as of December 31, 2022 were: sovereign bonds (21.7%), collateralized mortgage obligations (18.4%), industrials (7.6%), health care (6.6%) and consumer discretionary (5.3%). The Fund’s portfolio composition is subject to change at any time.
All investments are subject to risk including the possible loss of principal. Past performance is no guarantee of future results. All index performance reflects no deduction for fees, expenses or taxes. Please note that an investor cannot invest directly in an index.
The information provided is not intended to be a forecast of future events, a guarantee of future results or investment advice. Views expressed may differ from those of the firm as a whole.
| i | The Bloomberg U.S. Aggregate Index is a broad-based bond index comprised of government, corporate, mortgage- and asset-backed issues, rated investment grade or higher, and having at least one year to maturity. |
| | | | | | |
| Western Asset SMASh Series Core Plus Completion Fund 2022 Annual Report | | | | | 5 | |
Fund at a glance† (unaudited)
Investment breakdown (%) as a percent of total investments
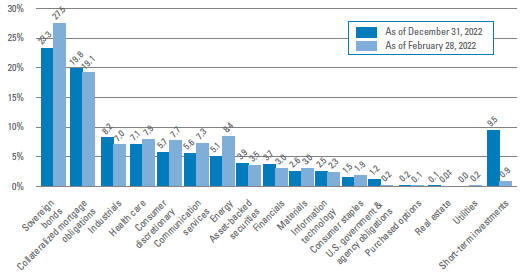
| † | The bar graph above represents the composition of the Fund’s investments as of December 31, 2022 and February 28, 2022 and does not include derivatives, such as written options, futures contracts, forward foreign currency contracts and swap contracts. The Fund is actively managed. As a result, the composition of the Fund’s investments is subject to change at any time. |
| ‡ | Represents less than 0.1%. |
| | | | |
6 | | | | Western Asset SMASh Series Core Plus Completion Fund 2022 Annual Report |
Fund expenses (unaudited)
Example
As a shareholder of the Fund, you may incur two types of costs: (1) transaction costs and (2) ongoing costs and other Fund expenses. This example is intended to help you understand your ongoing costs (in dollars) of investing in the Fund and to compare these costs with the ongoing costs of investing in other mutual funds.
This example is based on an investment of $1,000 invested on July 1, 2022 and held for the six months ended December 31, 2022.
Actual expenses
The table below titled “Based on actual total return” provides information about actual account values and actual expenses. You may use the information provided in this table, together with the amount you invested, to estimate the expenses that you paid over the period. To estimate the expenses you paid on your account, divide your ending account value by $1,000 (for example, an $8,600 ending account value divided by $1,000 = 8.6), then multiply the result by the number under the heading entitled “Expenses Paid During the Period”.
Hypothetical example for comparison purposes
The table below titled “Based on hypothetical total return” provides information about hypothetical account values and hypothetical expenses based on the actual expense ratio and an assumed rate of return of 5.00% per year before expenses, which is not the Fund’s actual return. The hypothetical account values and expenses may not be used to estimate the actual ending account balance or expenses you paid for the period. You may use the information provided in this table to compare the ongoing costs of investing in the Fund and other funds. To do so, compare the 5.00% hypothetical example relating to the Fund with the 5.00% hypothetical examples that appear in the shareholder reports of the other funds.
Please note that the expenses shown in the table below are meant to highlight your ongoing costs only and do not reflect any transactional costs. Therefore, the table is useful in comparing ongoing costs only, and will not help you determine the relative total costs of owning different funds. In addition, if these transaction costs were included, your costs would have been higher.
| | | | | | | | | | | | | | | | | | | | | | | | | | | | | | | | | | | | | | | | | | | | | | | | | | |
| | | |
| Based on actual total return1 | | | | | | Based on hypothetical total return1 |
Actual
Total
Return2,3 | | Beginning
Account
Value | | Ending
Account
Value | | Annualized
Expense
Ratio3 | | Expenses
Paid During
the Period3,4 | | | | Hypothetical
Annualized
Total Return | | Beginning
Account
Value | | Ending
Account
Value | | Annualized
Expense
Ratio3 | | Expenses
Paid During
the Period3,4 |
| | | -4.04% | | | | $ | 1,000.00 | | | | $ | 959.60 | | | | | 0.00 | % | | | $ | 0.00 | | | | | | | 5.00 | % | | | | $1,000.00 | | | | $ | 1,025.21 | | | | | 0.00 | % | | | $ | 0.00 | |
| 1 | For the six months ended December 31, 2022. |
| 2 | Total return is not annualized, as it may not be representative of the total return for the year. Past performance is no guarantee of future results. Performance figures do not reflect any fees stated below in Note 3. If such fees were included, the return shown would have been lower. |
| 3 | All figures do not reflect the effect of fees and expenses associated with a separately managed account, nor a management fee or other operating expenses of the Fund. Such management fees are paid directly or indirectly by the separately managed account sponsor to the Fund’s manager or subadvisers. All operating expenses of the Fund were reimbursed by the manager, pursuant to an expense reimbursement arrangement between the Fund and the manager. The expense reimbursement arrangement does not cover interest, brokerage, taxes and extraordinary expenses. |
| 4 | Expenses (net of compensating balance arrangements, fee waivers and/or expense reimbursements) are equal to the Fund’s annualized expense ratio multiplied by the average account value over the period, multiplied by the number of days in the most recent fiscal half-year (184), then divided by 365. |
| | | | |
| Western Asset SMASh Series Core Plus Completion Fund 2022 Annual Report | | | | 7 |
Fund performance (unaudited)
| | | | |
| Average annual total returns1 | | | |
| Twelve Months Ended 12/31/22 | | | -29.11 | % |
| Five Years Ended 12/31/22 | | | -3.46 | |
| Ten Years Ended 12/31/22 | | | 1.59 | |
| | | | |
| Cumulative total returns1 | | | |
| 12/31/12 through 12/31/22 | | | 17.09 | % |
All figures represent past performance and are not a guarantee of future results. Investment return and principal value of an investment will fluctuate so that an investor’s shares, when redeemed, may be worth more or less than their original cost. The returns shown do not reflect the deduction of taxes that a shareholder would pay on Fund distributions or the redemption of Fund shares. Performance figures may reflect compensating balance arrangements, fee waivers and/or expense reimbursements. In the absence of compensating balance arrangements, fee waivers and/or expense reimbursements, the total return would have been lower. Performance figures do not reflect the effect of fees and expenses associated with a separately managed account or a management fee or other operating expenses of the Fund. Such management fees are paid directly or indirectly by the separately managed account sponsor to the Fund’s manager or subadviser. All operating expenses of the Fund (other than interest, brokerage, taxes and extraordinary expenses) were reimbursed by the manager due to an expense reimbursement arrangement between the Fund and the manager. This arrangement cannot be terminated prior to December 31, 2024 without the Board of Trustees’ consent.
| 1 | Assumes the reinvestment of all distributions, including returns of capital, if any, at net asset value. |
| | | | |
8 | | | | Western Asset SMASh Series Core Plus Completion Fund 2022 Annual Report |
Historical performance
Value of $10,000 invested in
Shares of Western Asset SMASh Series Core Plus Completion Fund vs. Bloomberg U.S. Aggregate Index† — December 2012 - December 31, 2022
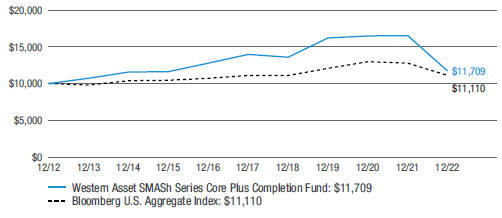
All figures represent past performance and are not a guarantee of future results. Investment return and principal value of an investment will fluctuate so that an investor’s shares, when redeemed, may be worth more or less than their original cost. The returns shown do not reflect the deduction of taxes that a shareholder would pay on Fund distributions or the redemption of Fund shares. Performance figures may reflect compensating balance arrangements, fee waivers and/or expense reimbursements. In the absence of compensating balance arrangements, fee waivers and/or expense reimbursements, the total return would have been lower. Performance figures do not reflect the effect of fees and expenses associated with a separately managed account or a management fee or other operating expenses of the Fund. Such management fees are paid directly or indirectly by the separately managed account sponsor to the Fund’s manager or subadviser. All operating expenses of the Fund (other than interest, brokerage, taxes and extraordinary expenses) were reimbursed by the manager due to an expense reimbursement arrangement between the Fund and the manager. This arrangement cannot be terminated prior to December 31, 2024 without the Board of Trustees’ consent.
| † | Hypothetical illustration of $10,000 invested in Western Asset SMASh Series Core Plus Completion Fund on December 31, 2012, assuming the reinvestment of all distributions, including returns of capital, if any, at net asset value through December 31, 2022. The hypothetical illustration also assumes a $10,000 investment in the Bloomberg U.S. Aggregate Index. The Bloomberg U.S. Aggregate Index (the “Index”) is a broad-based bond index comprised of government, corporate, mortgage- and asset-backed issues, rated investment grade or higher, and having at least one year to maturity. The Index is unmanaged and is not subject to the same management and trading expenses as a mutual fund. Please note that an investor cannot invest directly in an index. |
| | | | |
| Western Asset SMASh Series Core Plus Completion Fund 2022 Annual Report | | | | 9 |
Schedule of investments
December 31, 2022
Western Asset SMASh Series Core Plus Completion Fund
(Percentages shown based on Fund net assets)
| | | | | | | | | | | | | | | | |
| Security | | Rate | | | Maturity
Date | | | Face Amount† | | | Value | |
| Sovereign Bonds — 21.7% | | | | | | | | | | | | | | | | |
Argentina — 0.3% | | | | | | | | | | | | | | | | |
Argentine Republic Government International Bond, Senior Notes | | | 1.000 | % | | | 7/9/29 | | | | 730,361 | | | $ | 195,706 | |
Argentine Republic Government International Bond, Senior Notes, Step bond (0.500% to 7/9/23 then 0.750%) | | | 0.500 | % | | | 7/9/30 | | | | 16,237,114 | | | | 4,419,574 | |
Argentine Republic Government International Bond, Senior Notes, Step bond (1.500% to 7/9/23 then 3.625%) | | | 1.500 | % | | | 7/9/35 | | | | 1,102,485 | | | | 282,397 | |
Provincia de Buenos Aires, Senior Notes, Step bond (5.250% to 9/1/23 then 6.375%) | | | 5.250 | % | | | 9/1/37 | | | | 8,024,786 | | | | 2,798,644 | (a) |
Total Argentina | | | | | | | | | | | | | | | 7,696,321 | |
Brazil — 2.5% | | | | | | | | | | | | | | | | |
Brazil Notas do Tesouro Nacional Serie F, Notes | | | 10.000 | % | | | 1/1/27 | | | | 130,000,000 | BRL | | | 22,745,691 | |
Brazil Notas do Tesouro Nacional Serie F, Notes | | | 10.000 | % | | | 1/1/33 | | | | 143,857,000 | BRL | | | 23,403,413 | |
Brazilian Government International Bond, Senior Notes | | | 5.625 | % | | | 1/7/41 | | | | 3,180,000 | | | | 2,701,169 | |
Brazilian Government International Bond, Senior Notes | | | 4.750 | % | | | 1/14/50 | | | | 21,630,000 | | | | 15,223,536 | |
Total Brazil | | | | | | | | | | | | | | | 64,073,809 | |
China — 3.5% | | | | | | | | | | | | | | | | |
China Government Bond | | | 3.290 | % | | | 5/23/29 | | | | 587,240,000 | CNY | | | 87,392,317 | |
China Government Bond, Senior Notes | | | 3.390 | % | | | 5/21/25 | | | | 32,000,000 | CNH | | | 4,699,224 | (b) |
Total China | | | | | | | | | | | | | | | 92,091,541 | |
Colombia — 0.2% | | | | | | | | | | | | | | | | |
Colombia Government International Bond, Senior Notes | | | 4.125 | % | | | 2/22/42 | | | | 8,600,000 | | | | 5,407,890 | |
Colombia Government International Bond, Senior Notes | | | 5.625 | % | | | 2/26/44 | | | | 500,000 | | | | 369,186 | |
Total Colombia | | | | | | | | | | | | | | | 5,777,076 | |
Indonesia — 3.9% | | | | | | | | | | | | | | | | |
Indonesia Treasury Bond | | | 7.000 | % | | | 5/15/27 | | | | 544,513,000,000 | IDR | | | 35,898,274 | |
Indonesia Treasury Bond | | | 6.500 | % | | | 2/15/31 | | | | 875,398,000,000 | IDR | | | 54,714,132 | |
See Notes to Financial Statements.
| | | | |
10 | | | | Western Asset SMASh Series Core Plus Completion Fund 2022 Annual Report |
Western Asset SMASh Series Core Plus Completion Fund
(Percentages shown based on Fund net assets)
| | | | | | | | | | | | | | | | |
| Security | | Rate | | | Maturity
Date | | | Face Amount† | | | Value | |
Indonesia — continued | | | | | | | | | | | | | | | | |
Indonesia Treasury Bond | | | 6.375 | % | | | 4/15/32 | | | | 57,165,000,000 | IDR | | $ | 3,539,512 | |
Indonesia Treasury Bond | | | 7.500 | % | | | 6/15/35 | | | | 100,987,000,000 | IDR | | | 6,693,125 | |
Total Indonesia | | | | | | | | | | | | | | | 100,845,043 | |
Kenya — 0.5% | | | | | | | | | | | | | | | | |
Republic of Kenya Government International Bond, Senior Notes | | | 6.875 | % | | | 6/24/24 | | | | 4,260,000 | | | | 3,932,981 | (b) |
Republic of Kenya Government International Bond, Senior Notes | | | 7.250 | % | | | 2/28/28 | | | | 910,000 | | | | 800,536 | (a) |
Republic of Kenya Government International Bond, Senior Notes | | | 6.300 | % | | | 1/23/34 | | | | 11,470,000 | | | | 8,889,135 | (a) |
Total Kenya | | | | | | | | | | | | | | | 13,622,652 | |
Mexico — 9.6% | | | | | | | | | | | | | | | | |
Mexican Bonos, Bonds | | | 8.000 | % | | | 11/7/47 | | | | 3,200,030,000 | MXN | | | 146,570,948 | |
Mexican Bonos, Senior Notes | | | 7.750 | % | | | 11/23/34 | | | | 1,718,650,000 | MXN | | | 79,748,570 | |
Mexican Bonos, Senior Notes | | | 7.750 | % | | | 11/13/42 | | | | 479,171,500 | MXN | | | 21,480,526 | |
Mexico Government International Bond, Senior Notes | | | 4.750 | % | | | 3/8/44 | | | | 3,380,000 | | | | 2,740,741 | |
Total Mexico | | | | | | | | | | | | | | | 250,540,785 | |
Nigeria — 0.1% | | | | | | | | | | | | | | | | |
Nigeria Government International Bond, Senior Notes | | | 7.143 | % | | | 2/23/30 | | | | 4,970,000 | | | | 3,823,694 | (a) |
Paraguay — 0.2% | | | | | | | | | | | | | | | | |
Paraguay Government International Bond, Senior Notes | | | 3.849 | % | | | 6/28/33 | | | | 4,570,000 | | | | 4,028,801 | (a) |
Peru — 0.0%†† | | | | | | | | | | | | | | | | |
Peruvian Government International Bond, Senior Notes | | | 6.550 | % | | | 3/14/37 | | | | 510,000 | | | | 539,209 | |
Russia — 0.9% | | | | | | | | | | | | | | | | |
Russian Federal Bond — OFZ | | | 7.750 | % | | | 9/16/26 | | | | 659,350,000 | RUB | | | 2,413,891 | *(c) |
Russian Federal Bond — OFZ | | | 8.150 | % | | | 2/3/27 | | | | 613,510,000 | RUB | | | 2,246,070 | *(c) |
Russian Federal Bond — OFZ | | | 7.050 | % | | | 1/19/28 | | | | 2,374,777,000 | RUB | | | 8,694,099 | *(c) |
Russian Federal Bond — OFZ | | | 6.900 | % | | | 5/23/29 | | | | 786,393,000 | RUB | | | 2,878,998 | *(c) |
Russian Federal Bond — OFZ | | | 7.650 | % | | | 4/10/30 | | | | 1,497,220,000 | RUB | | | 5,481,348 | *(c) |
Russian Federal Bond — OFZ | | | 7.250 | % | | | 5/10/34 | | | | 93,150,000 | RUB | | | 341,024 | *(c) |
Total Russia | | | | | | | | | | | | | | | 22,055,430 | |
Total Sovereign Bonds (Cost — $698,873,502) | | | | | | | | 565,094,361 | |
See Notes to Financial Statements.
| | | | |
| Western Asset SMASh Series Core Plus Completion Fund 2022 Annual Report | | | | 11 |
Schedule of investments (cont’d)
December 31, 2022
Western Asset SMASh Series Core Plus Completion Fund
(Percentages shown based on Fund net assets)
| | | | | | | | | | | | | | | | |
| Security | | Rate | | | Maturity
Date | | | Face
Amount† | | | Value | |
| Corporate Bonds & Notes — 19.8% | | | | | | | | | | | | | | | | |
| Communication Services — 3.2% | | | | | | | | | | | | | | | | |
Diversified Telecommunication Services — 0.1% | | | | | | | | | | | | | | | | |
Altice France SA, Senior Secured Notes | | | 5.500 | % | | | 1/15/28 | | | | 200,000 | | | $ | 157,054 | (a) |
Altice France SA, Senior Secured Notes | | | 5.500 | % | | | 10/15/29 | | | | 2,650,000 | | | | 2,025,435 | (a) |
Total Diversified Telecommunication Services | | | | | | | | 2,182,489 | |
Entertainment — 0.1% | | | | | | | | | | | | | | | | |
Netflix Inc., Senior Notes | | | 5.875 | % | | | 2/15/25 | | | | 2,845,000 | | | | 2,885,484 | |
Interactive Media & Services — 0.3% | | | | | | | | | | | | | | | | |
Tencent Holdings Ltd., Senior Notes | | | 3.840 | % | | | 4/22/51 | | | | 10,990,000 | | | | 7,807,088 | (a) |
Media — 1.2% | | | | | | | | | | | | | | | | |
CCO Holdings LLC/CCO Holdings Capital Corp., Senior Notes | | | 4.750 | % | | | 2/1/32 | | | | 5,350,000 | | | | 4,348,186 | (a) |
CCO Holdings LLC/CCO Holdings Capital Corp., Senior Notes | | | 4.500 | % | | | 5/1/32 | | | | 8,260,000 | | | | 6,590,860 | |
CCO Holdings LLC/CCO Holdings Capital Corp., Senior Notes | | | 4.500 | % | | | 6/1/33 | | | | 2,220,000 | | | | 1,707,724 | (a) |
Charter Communications Operating LLC/Charter Communications Operating Capital Corp., Senior Secured Notes | | | 4.908 | % | | | 7/23/25 | | | | 100,000 | | | | 98,107 | |
Charter Communications Operating LLC/Charter Communications Operating Capital Corp., Senior Secured Notes | | | 6.484 | % | | | 10/23/45 | | | | 2,000,000 | | | | 1,812,044 | |
DISH DBS Corp., Senior Notes | | | 5.875 | % | | | 11/15/24 | | | | 5,100,000 | | | | 4,749,599 | |
DISH DBS Corp., Senior Notes | | | 7.750 | % | | | 7/1/26 | | | | 1,220,000 | | | | 986,309 | |
DISH DBS Corp., Senior Notes | | | 5.125 | % | | | 6/1/29 | | | | 3,150,000 | | | | 2,038,003 | |
DISH DBS Corp., Senior Secured Notes | | | 5.250 | % | | | 12/1/26 | | | | 2,260,000 | | | | 1,907,914 | (a) |
DISH DBS Corp., Senior Secured Notes | | | 5.750 | % | | | 12/1/28 | | | | 420,000 | | | | 336,000 | (a) |
Fox Corp., Senior Notes | | | 5.476 | % | | | 1/25/39 | | | | 2,000,000 | | | | 1,827,682 | |
Time Warner Cable LLC, Senior Secured Notes | | | 7.300 | % | | | 7/1/38 | | | | 2,500,000 | | | | 2,489,439 | |
Virgin Media Secured Finance PLC, Senior Secured Notes | | | 5.500 | % | | | 5/15/29 | | | | 3,300,000 | | | | 2,963,614 | (a) |
Total Media | | | | | | | | | | | | | | | 31,855,481 | |
See Notes to Financial Statements.
| | | | |
12 | | | | Western Asset SMASh Series Core Plus Completion Fund 2022 Annual Report |
Western Asset SMASh Series Core Plus Completion Fund
(Percentages shown based on Fund net assets)
| | | | | | | | | | | | | | | | |
| Security | | Rate | | | Maturity
Date | | | Face
Amount† | | | Value | |
Wireless Telecommunication Services — 1.5% | | | | | | | | | | | | | | | | |
America Movil SAB de CV, Senior Notes | | | 6.125 | % | | | 3/30/40 | | | | 1,500,000 | | | $ | 1,550,734 | |
CSC Holdings LLC, Senior Notes | | | 4.125 | % | | | 12/1/30 | | | | 650,000 | | | | 460,223 | (a) |
CSC Holdings LLC, Senior Notes | | | 3.375 | % | | | 2/15/31 | | | | 1,150,000 | | | | 751,836 | (a) |
CSC Holdings LLC, Senior Notes | | | 4.500 | % | | | 11/15/31 | | | | 11,490,000 | | | | 7,993,467 | (a) |
Sprint Capital Corp., Senior Notes | | | 6.875 | % | | | 11/15/28 | | | | 650,000 | | | | 676,127 | |
Sprint Capital Corp., Senior Notes | | | 8.750 | % | | | 3/15/32 | | | | 5,490,000 | | | | 6,546,029 | |
Sprint LLC, Senior Notes | | | 7.875 | % | | | 9/15/23 | | | | 180,000 | | | | 182,913 | |
Sprint LLC, Senior Notes | | | 7.625 | % | | | 2/15/25 | | | | 1,973,000 | | | | 2,041,135 | |
T-Mobile USA Inc., Senior Notes | | | 2.250 | % | | | 2/15/26 | | | | 1,350,000 | | | | 1,230,540 | |
T-Mobile USA Inc., Senior Notes | | | 2.625 | % | | | 2/15/29 | | | | 4,230,000 | | | | 3,586,536 | |
T-Mobile USA Inc., Senior Notes | | | 3.375 | % | | | 4/15/29 | | | | 3,880,000 | | | | 3,424,855 | |
T-Mobile USA Inc., Senior Notes | | | 3.500 | % | | | 4/15/31 | | | | 9,200,000 | | | | 7,964,665 | |
T-Mobile USA Inc., Senior Notes | | | 3.000 | % | | | 2/15/41 | | | | 1,000,000 | | | | 709,413 | |
Vmed O2 UK Financing I PLC, Senior Secured Notes | | | 4.750 | % | | | 7/15/31 | | | | 730,000 | | | | 594,442 | (a) |
Total Wireless Telecommunication Services | | | | | | | | 37,712,915 | |
Total Communication Services | | | | | | | | | | | | | | | 82,443,457 | |
| Consumer Discretionary — 2.4% | | | | | | | | | | | | | | | | |
Automobiles — 1.1% | | | | | | | | | | | | | | | | |
Ford Motor Co., Senior Notes | | | 3.250 | % | | | 2/12/32 | | | | 150,000 | | | | 112,758 | |
Ford Motor Co., Senior Notes | | | 6.100 | % | | | 8/19/32 | | | | 4,770,000 | | | | 4,413,598 | |
Ford Motor Credit Co. LLC, Senior Notes | | | 5.125 | % | | | 6/16/25 | | | | 200,000 | | | | 192,708 | |
Ford Motor Credit Co. LLC, Senior Notes | | | 3.375 | % | | | 11/13/25 | | | | 5,580,000 | | | | 5,054,268 | |
Ford Motor Credit Co. LLC, Senior Notes | | | 4.950 | % | | | 5/28/27 | | | | 2,750,000 | | | | 2,570,618 | |
Ford Motor Credit Co. LLC, Senior Notes | | | 3.815 | % | | | 11/2/27 | | | | 250,000 | | | | 220,130 | |
Ford Motor Credit Co. LLC, Senior Notes | | | 2.900 | % | | | 2/16/28 | | | | 2,130,000 | | | | 1,761,817 | |
Ford Motor Credit Co. LLC, Senior Notes | | | 2.900 | % | | | 2/10/29 | | | | 200,000 | | | | 160,007 | |
Ford Motor Credit Co. LLC, Senior Notes | | | 5.113 | % | | | 5/3/29 | | | | 230,000 | | | | 208,794 | |
See Notes to Financial Statements.
| | | | |
| Western Asset SMASh Series Core Plus Completion Fund 2022 Annual Report | | | | 13 |
Schedule of investments (cont’d)
December 31, 2022
Western Asset SMASh Series Core Plus Completion Fund
(Percentages shown based on Fund net assets)
| | | | | | | | | | | | | | | | |
| Security | | Rate | | | Maturity
Date | | | Face
Amount† | | | Value | |
Automobiles — continued | | | | | | | | | | | | | | | | |
Ford Motor Credit Co. LLC, Senior Notes | | | 4.000 | % | | | 11/13/30 | | | | 12,260,000 | | | $ | 10,087,589 | |
Ford Motor Credit Co. LLC, Senior Notes | | | 3.625 | % | | | 6/17/31 | | | | 5,820,000 | | | | 4,579,514 | |
Total Automobiles | | | | | | | | | | | | | | | 29,361,801 | |
Diversified Consumer Services — 0.1% | | | | | | | | | | | | | | | | |
Service Corp. International, Senior Notes | | | 7.500 | % | | | 4/1/27 | | | | 1,370,000 | | | | 1,407,406 | |
Hotels, Restaurants & Leisure — 0.5% | | | | | | | | | | | | | | | | |
1011778 BC ULC/New Red Finance Inc., Senior Secured Notes | | | 3.875 | % | | | 1/15/28 | | | | 460,000 | | | | 412,505 | (a) |
1011778 BC ULC/New Red Finance Inc., Senior Secured Notes | | | 3.500 | % | | | 2/15/29 | | | | 1,960,000 | | | | 1,683,766 | (a) |
GLP Capital LP/GLP Financing II Inc., Senior Notes | | | 5.375 | % | | | 4/15/26 | | | | 310,000 | | | | 304,636 | |
VOC Escrow Ltd., Senior Secured Notes | | | 5.000 | % | | | 2/15/28 | | | | 3,540,000 | | | | 3,050,347 | (a) |
Wynn Macau Ltd., Senior Notes | | | 5.625 | % | | | 8/26/28 | | | | 7,740,000 | | | | 6,627,723 | (a) |
Wynn Macau Ltd., Senior Notes | | | 5.125 | % | | | 12/15/29 | | | | 1,110,000 | | | | 899,905 | (a) |
Total Hotels, Restaurants & Leisure | | | | | | | | | | | | | | | 12,978,882 | |
Household Durables — 0.0%†† | | | | | | | | | | | | | | | | |
MDC Holdings Inc., Senior Notes | | | 6.000 | % | | | 1/15/43 | | | | 1,650,000 | | | | 1,346,447 | |
Internet & Direct Marketing Retail — 0.6% | | | | | | | | | | | | | | | | |
Prosus NV, Senior Notes | | | 3.061 | % | | | 7/13/31 | | | | 19,380,000 | | | | 14,988,315 | (a) |
Textiles, Apparel & Luxury Goods — 0.1% | | | | | | | | | | | | | | | | |
Hanesbrands Inc., Senior Notes | | | 4.625 | % | | | 5/15/24 | | | | 450,000 | | | | 436,571 | (a) |
Hanesbrands Inc., Senior Notes | | | 4.875 | % | | | 5/15/26 | | | | 1,840,000 | | | | 1,647,390 | (a) |
Total Textiles, Apparel & Luxury Goods | | | | | | | | 2,083,961 | |
Total Consumer Discretionary | | | | | | | | | | | | | | | 62,166,812 | |
| Consumer Staples — 1.1% | | | | | | | | | | | | | | | | |
Food Products — 0.3% | | | | | | | | | | | | | | | | |
Kraft Heinz Foods Co., Senior Notes | | | 4.250 | % | | | 3/1/31 | | | | 1,360,000 | | | | 1,275,163 | |
Kraft Heinz Foods Co., Senior Notes | | | 6.750 | % | | | 3/15/32 | | | | 432,000 | | | | 470,209 | |
Kraft Heinz Foods Co., Senior Notes | | | 6.875 | % | | | 1/26/39 | | | | 1,130,000 | | | | 1,230,992 | |
Kraft Heinz Foods Co., Senior Notes | | | 7.125 | % | | | 8/1/39 | | | | 330,000 | | | | 364,208 | (a) |
See Notes to Financial Statements.
| | | | |
14 | | | | Western Asset SMASh Series Core Plus Completion Fund 2022 Annual Report |
Western Asset SMASh Series Core Plus Completion Fund
(Percentages shown based on Fund net assets)
| | | | | | | | | | | | | | | | |
| Security | | Rate | | | Maturity
Date | | | Face
Amount† | | | Value | |
Food Products — continued | | | | | | | | | | | | | | | | |
Kraft Heinz Foods Co., Senior Notes | | | 4.625 | % | | | 10/1/39 | | | | 330,000 | | | $ | 290,836 | |
Kraft Heinz Foods Co., Senior Notes | | | 5.000 | % | | | 6/4/42 | | | | 1,810,000 | | | | 1,645,365 | |
Kraft Heinz Foods Co., Senior Notes | | | 4.375 | % | | | 6/1/46 | | | | 2,160,000 | | | | 1,765,133 | |
Kraft Heinz Foods Co., Senior Notes | | | 5.500 | % | | | 6/1/50 | | | | 2,730,000 | | | | 2,624,114 | |
Total Food Products | | | | | | | | | | | | | | | 9,666,020 | |
Tobacco — 0.8% | | | | | | | | | | | | | | | | |
Altria Group Inc., Senior Notes | | | 5.800 | % | | | 2/14/39 | | | | 5,000,000 | | | | 4,629,833 | |
Altria Group Inc., Senior Notes | | | 5.950 | % | | | 2/14/49 | | | | 7,500,000 | | | | 6,703,914 | |
Altria Group Inc., Senior Notes | | | 6.200 | % | | | 2/14/59 | | | | 792,000 | | | | 744,901 | |
BAT Capital Corp., Senior Notes | | | 3.734 | % | | | 9/25/40 | | | | 10,000,000 | | | | 6,823,105 | |
BAT Capital Corp., Senior Notes | | | 3.984 | % | | | 9/25/50 | | | | 2,500,000 | | | | 1,645,415 | |
Total Tobacco | | | | | | | | | | | | | | | 20,547,168 | |
Total Consumer Staples | | | | | | | | | | | | | | | 30,213,188 | |
| Energy — 4.8% | | | | | | | | | | | | | | | | |
Oil, Gas & Consumable Fuels — 4.8% | | | | | | | | | | | | | | | | |
Apache Corp., Senior Notes | | | 5.100 | % | | | 9/1/40 | | | | 6,268,000 | | | | 5,208,504 | |
Cameron LNG LLC, Senior Secured Notes | | | 3.302 | % | | | 1/15/35 | | | | 4,820,000 | | | | 3,897,481 | (a) |
Cheniere Energy Inc., Senior Notes | | | 4.625 | % | | | 10/15/28 | | | | 3,160,000 | | | | 2,862,304 | |
Cheniere Energy Partners LP, Senior Notes | | | 3.250 | % | | | 1/31/32 | | | | 7,030,000 | | | | 5,596,279 | |
Continental Resources Inc., Senior Notes | | | 4.375 | % | | | 1/15/28 | | | | 10,830,000 | | | | 9,940,749 | |
Devon Energy Corp., Senior Notes | | | 8.250 | % | | | 8/1/23 | | | | 320,000 | | | | 324,420 | |
Devon Energy Corp., Senior Notes | | | 5.250 | % | | | 10/15/27 | | | | 170,000 | | | | 168,514 | |
Devon Energy Corp., Senior Notes | | | 5.875 | % | | | 6/15/28 | | | | 720,000 | | | | 728,880 | |
Devon Energy Corp., Senior Notes | | | 5.000 | % | | | 6/15/45 | | | | 1,250,000 | | | | 1,084,990 | |
Ecopetrol SA, Senior Notes | | | 4.625 | % | | | 11/2/31 | | | | 21,540,000 | | | | 16,497,160 | |
Ecopetrol SA, Senior Notes | | | 5.875 | % | | | 5/28/45 | | | | 1,170,000 | | | | 817,167 | |
Energy Transfer LP, Junior Subordinated Notes (6.250% to 2/15/23 then 3 mo. USD LIBOR + 4.028%) | | | 6.250 | % | | | 2/15/23 | | | | 2,880,000 | | | | 2,451,600 | (d)(e) |
See Notes to Financial Statements.
| | | | |
| Western Asset SMASh Series Core Plus Completion Fund 2022 Annual Report | | | | 15 |
Schedule of investments (cont’d)
December 31, 2022
Western Asset SMASh Series Core Plus Completion Fund
(Percentages shown based on Fund net assets)
| | | | | | | | | | | | | | | | |
| Security | | Rate | | | Maturity
Date | | | Face
Amount† | | | Value | |
Oil, Gas & Consumable Fuels — continued | | | | | | | | | | | | | | | | |
Energy Transfer LP, Junior Subordinated Notes (6.500% to 11/15/26 then 5 year Treasury Constant Maturity Rate + 5.694%) | | | 6.500 | % | | | 11/15/26 | | | | 3,170,000 | | | $ | 2,734,125 | (d)(e) |
Energy Transfer LP, Junior Subordinated Notes (6.750% to 5/15/25 then 5 year Treasury Constant Maturity Rate + 5.134%) | | | 6.750 | % | | | 5/15/25 | | | | 600,000 | | | | 521,250 | (d)(e) |
Energy Transfer LP, Junior Subordinated Notes (7.125% to 5/15/30 then 5 year Treasury Constant Maturity Rate + 5.306%) | | | 7.125 | % | | | 5/15/30 | | | | 8,010,000 | | | | 6,708,375 | (d)(e) |
EQM Midstream Partners LP, Senior Notes | | | 5.500 | % | | | 7/15/28 | | | | 490,000 | | | | 439,017 | |
EQT Corp., Senior Notes | | | 3.900 | % | | | 10/1/27 | | | | 2,520,000 | | | | 2,331,920 | |
EQT Corp., Senior Notes | | | 5.000 | % | | | 1/15/29 | | | | 180,000 | | | | 169,592 | |
KazMunayGas National Co. JSC, Senior Notes | | | 5.375 | % | | | 4/24/30 | | | | 500,000 | | | | 449,410 | (a) |
KazMunayGas National Co. JSC, Senior Notes | | | 6.375 | % | | | 10/24/48 | | | | 2,850,000 | | | | 2,364,750 | (a) |
Kinder Morgan Inc., Senior Notes | | | 7.750 | % | | | 1/15/32 | | | | 300,000 | | | | 338,261 | |
Kinder Morgan Inc., Senior Notes | | | 5.550 | % | | | 6/1/45 | | | | 2,000,000 | | | | 1,832,983 | |
Occidental Petroleum Corp., Senior Notes | | | 6.200 | % | | | 3/15/40 | | | | 11,829,000 | | | | 11,596,806 | |
Occidental Petroleum Corp., Senior Notes | | | 6.600 | % | | | 3/15/46 | | | | 5,000,000 | | | | 5,156,225 | |
Petrobras Global Finance BV, Senior Notes | | | 5.500 | % | | | 6/10/51 | | | | 7,380,000 | | | | 5,668,333 | |
Petroleos Mexicanos, Senior Notes | | | 6.875 | % | | | 8/4/26 | | | | 1,650,000 | | | | 1,562,050 | |
Petroleos Mexicanos, Senior Notes | | | 6.625 | % | | | 6/15/35 | | | | 1,000,000 | | | | 727,782 | |
Petroleos Mexicanos, Senior Notes | | | 5.500 | % | | | 6/27/44 | | | | 330,000 | | | | 194,469 | |
Range Resources Corp., Senior Notes | | | 4.875 | % | | | 5/15/25 | | | | 1,680,000 | | | | 1,598,576 | |
Range Resources Corp., Senior Notes | | | 8.250 | % | | | 1/15/29 | | | | 1,780,000 | | | | 1,836,586 | |
Sabine Pass Liquefaction LLC, Senior Secured Notes | | | 5.750 | % | | | 5/15/24 | | | | 1,300,000 | | | | 1,301,018 | |
Southwestern Energy Co., Senior Notes | | | 5.375 | % | | | 3/15/30 | | | | 1,510,000 | | | | 1,380,055 | |
Southwestern Energy Co., Senior Notes | | | 4.750 | % | | | 2/1/32 | | | | 2,580,000 | | | | 2,209,809 | |
See Notes to Financial Statements.
| | | | |
16 | | | | Western Asset SMASh Series Core Plus Completion Fund 2022 Annual Report |
Western Asset SMASh Series Core Plus Completion Fund
(Percentages shown based on Fund net assets)
| | | | | | | | | | | | | | | | |
| Security | | Rate | | | Maturity
Date | | | Face
Amount† | | | Value | |
Oil, Gas & Consumable Fuels — continued | | | | | | | | | | | | | | | | |
Tallgrass Energy Partners LP/ Tallgrass Energy Finance Corp., Senior Notes | | | 6.000 | % | | | 12/31/30 | | | | 330,000 | | | $ | 285,790 | (a) |
Targa Resources Partners LP/Targa Resources Partners Finance Corp., Senior Notes | | | 6.875 | % | | | 1/15/29 | | | | 830,000 | | | | 838,074 | |
Targa Resources Partners LP/Targa Resources Partners Finance Corp., Senior Notes | | | 4.875 | % | | | 2/1/31 | | | | 3,590,000 | | | | 3,246,437 | |
Targa Resources Partners LP/Targa Resources Partners Finance Corp., Senior Notes | | | 4.000 | % | | | 1/15/32 | | | | 560,000 | | | | 471,934 | |
Venture Global Calcasieu Pass LLC, Senior Secured Notes | | | 3.875 | % | | | 11/1/33 | | | | 4,040,000 | | | | 3,307,730 | (a) |
Western Midstream Operating LP, Senior Notes | | | 5.300 | % | | | 3/1/48 | | | | 13,140,000 | | | | 10,827,385 | |
Western Midstream Operating LP, Senior Notes | | | 5.500 | % | | | 8/15/48 | | | | 2,000,000 | | | | 1,665,975 | |
Williams Cos. Inc., Senior Notes | | | 4.550 | % | | | 6/24/24 | | | | 230,000 | | | | 227,616 | |
Williams Cos. Inc., Senior Notes | | | 7.500 | % | | | 1/15/31 | | | | 152,000 | | | | 166,869 | |
Williams Cos. Inc., Senior Notes | | | 5.750 | % | | | 6/24/44 | | | | 2,930,000 | | | | 2,805,517 | |
Total Energy | | | | | | | | | | | | | | | 124,542,767 | |
| Financials — 0.4% | | | | | | | | | | | | | | | | |
Banks — 0.2% | | | | | | | | | | | | | | | | |
Bank of Nova Scotia, Subordinated Notes (4.588% to 5/4/32 then 5 year Treasury Constant Maturity Rate + 2.050%) | | | 4.588 | % | | | 5/4/37 | | | | 3,620,000 | | | | 3,098,562 | (e) |
Cooperatieve Rabobank UA, Senior Notes (3.758% to 4/6/32 then 1 year Treasury Constant Maturity Rate + 1.420%) | | | 3.758 | % | | | 4/6/33 | | | | 750,000 | | | | 640,929 | (a)(e) |
Wells Fargo & Co., Senior Notes (5.013% to 4/4/50 then SOFR + 4.502%) | | | 5.013 | % | | | 4/4/51 | | | | 1,000,000 | | | | 886,023 | (e) |
Wells Fargo & Co., Subordinated Notes | | | 4.750 | % | | | 12/7/46 | | | | 2,000,000 | | | | 1,684,176 | |
Total Banks | | | | | | | | | | | | | | | 6,309,690 | |
See Notes to Financial Statements.
| | | | |
| Western Asset SMASh Series Core Plus Completion Fund 2022 Annual Report | | | | 17 |
Schedule of investments (cont’d)
December 31, 2022
Western Asset SMASh Series Core Plus Completion Fund
(Percentages shown based on Fund net assets)
| | | | | | | | | | | | | | | | |
| Security | | Rate | | | Maturity
Date | | | Face
Amount† | | | Value | |
Capital Markets — 0.0%†† | | | | | | | | | | | | | | | | |
Credit Suisse Group AG, Senior Notes (9.016% to 11/15/32 then SOFR + 5.020%) | | | 9.016 | % | | | 11/15/33 | | | | 890,000 | | | $ | 913,718 | (a)(e) |
Diversified Financial Services — 0.2% | | | | | | | | | | | | | | | | |
Park Aerospace Holdings Ltd., Senior Notes | | | 4.500 | % | | | 3/15/23 | | | | 1,210,000 | | | | 1,207,104 | (a) |
Park Aerospace Holdings Ltd., Senior Notes | | | 5.500 | % | | | 2/15/24 | | | | 2,840,000 | | | | 2,804,234 | (a) |
Total Diversified Financial Services | | | | | | | | | | | | | | | 4,011,338 | |
Total Financials | | | | | | | | | | | | | | | 11,234,746 | |
| Health Care — 2.2% | | | | | | | | | | | | | | | | |
Health Care Providers & Services — 0.5% | | | | | | | | | | | | | | | | |
Fresenius Medical Care U.S. Finance II Inc., Senior Notes | | | 4.750 | % | | | 10/15/24 | | | | 5,070,000 | | | | 4,978,454 | (a) |
HCA Inc., Senior Notes | | | 3.500 | % | | | 9/1/30 | | | | 7,660,000 | | | | 6,624,565 | |
HCA Inc., Senior Notes | | | 5.500 | % | | | 6/15/47 | | | | 190,000 | | | | 169,638 | |
HCA Inc., Senior Notes | | | 7.500 | % | | | 11/15/95 | | | | 10,000 | | | | 10,766 | |
Tenet Healthcare Corp., Senior Secured Notes | | | 4.375 | % | | | 1/15/30 | | | | 330,000 | | | | 286,216 | (a) |
Total Health Care Providers & Services | | | | | | | | 12,069,639 | |
Pharmaceuticals — 1.7% | | | | | | | | | | | | | | | | |
Bausch Health Americas Inc., Senior Notes | | | 9.250 | % | | | 4/1/26 | | | | 540,000 | | | | 378,853 | (a) |
Bausch Health Americas Inc., Senior Notes | | | 8.500 | % | | | 1/31/27 | | | | 830,000 | | | | 435,526 | (a) |
Bausch Health Cos. Inc., Senior Notes | | | 6.250 | % | | | 2/15/29 | | | | 5,160,000 | | | | 2,492,603 | (a) |
Bausch Health Cos. Inc., Senior Notes | | | 7.250 | % | | | 5/30/29 | | | | 280,000 | | | | 135,639 | (a) |
Bausch Health Cos. Inc., Senior Notes | | | 5.250 | % | | | 1/30/30 | | | | 2,160,000 | | | | 1,039,597 | (a) |
Bausch Health Cos. Inc., Senior Secured Notes | | | 5.500 | % | | | 11/1/25 | | | | 350,000 | | | | 298,052 | (a) |
Teva Pharmaceutical Finance Netherlands III BV, Senior Notes | | | 2.800 | % | | | 7/21/23 | | | | 150,000 | | | | 146,929 | |
Teva Pharmaceutical Finance Netherlands III BV, Senior Notes | | | 7.125 | % | | | 1/31/25 | | | | 3,920,000 | | | | 3,904,398 | |
Teva Pharmaceutical Finance Netherlands III BV, Senior Notes | | | 3.150 | % | | | 10/1/26 | | | | 35,960,000 | | | | 31,520,019 | |
See Notes to Financial Statements.
| | | | |
18 | | | | Western Asset SMASh Series Core Plus Completion Fund 2022 Annual Report |
Western Asset SMASh Series Core Plus Completion Fund
(Percentages shown based on Fund net assets)
| | | | | | | | | | | | | | | | |
| Security | | Rate | | | Maturity
Date | | | Face
Amount† | | | Value | |
Pharmaceuticals — continued | | | | | | | | | | | | | | | | |
Teva Pharmaceutical Finance Netherlands III BV, Senior Notes | | | 4.750 | % | | | 5/9/27 | | | | 710,000 | | | $ | 642,656 | |
Teva Pharmaceutical Finance Netherlands III BV, Senior Notes | | | 5.125 | % | | | 5/9/29 | | | | 4,690,000 | | | | 4,182,763 | |
Total Pharmaceuticals | | | | | | | | | | | | | | | 45,177,035 | |
Total Health Care | | | | | | | | | | | | | | | 57,246,674 | |
| Industrials — 3.1% | | | | | | | | | | | | | | | | |
Aerospace & Defense — 0.0%†† | | | | | | | | | | | | | | | | |
Boeing Co., Senior Notes | | | 5.705 | % | | | 5/1/40 | | | | 1,000,000 | | | | 957,850 | |
Airlines — 2.3% | | | | | | | | | | | | | | | | |
Delta Air Lines Inc., Senior Secured Notes | | | 7.000 | % | | | 5/1/25 | | | | 24,450,000 | | | | 25,008,644 | (a) |
Delta Air Lines Inc./SkyMiles IP Ltd., Senior Secured Notes | | | 4.500 | % | | | 10/20/25 | | | | 5,930,000 | | | | 5,788,421 | (a) |
Delta Air Lines Inc./SkyMiles IP Ltd., Senior Secured Notes | | | 4.750 | % | | | 10/20/28 | | | | 5,390,000 | | | | 5,074,736 | (a) |
Hawaiian Brand Intellectual Property Ltd./HawaiianMiles Loyalty Ltd., Senior Secured Notes | | | 5.750 | % | | | 1/20/26 | | | | 700,000 | | | | 634,830 | (a) |
Mileage Plus Holdings LLC/ Mileage Plus Intellectual Property Assets Ltd., Senior Secured Notes | | | 6.500 | % | | | 6/20/27 | | | | 6,903,445 | | | | 6,878,605 | (a) |
Spirit Loyalty Cayman Ltd./Spirit IP Cayman Ltd., Senior Secured Notes | | | 8.000 | % | | | 9/20/25 | | | | 4,907,999 | | | | 4,932,392 | (a) |
United Airlines Inc., Senior Secured Notes | | | 4.375 | % | | | 4/15/26 | | | | 4,390,000 | | | | 4,076,668 | (a) |
United Airlines Inc., Senior Secured Notes | | | 4.625 | % | | | 4/15/29 | | | | 6,756,000 | | | | 5,894,277 | (a) |
Total Airlines | | | | | | | | | | | | | | | 58,288,573 | |
Building Products — 0.0%†† | | | | | | | | | | | | | | | | |
Builders FirstSource Inc., Senior Notes | | | 4.250 | % | | | 2/1/32 | | | | 1,070,000 | | | | 869,357 | (a) |
Commercial Services & Supplies — 0.0%†† | | | | | | | | | | | | | | | | |
Allied Universal Holdco LLC/Allied Universal Finance Corp., Senior Secured Notes | | | 6.625 | % | | | 7/15/26 | | | | 330,000 | | | | 302,630 | (a) |
CoreCivic Inc., Senior Notes | | | 4.750 | % | | | 10/15/27 | | | | 210,000 | | | | 182,599 | |
Total Commercial Services & Supplies | | | | | | | | 485,229 | |
See Notes to Financial Statements.
| | | | |
| Western Asset SMASh Series Core Plus Completion Fund 2022 Annual Report | | | | 19 |
Schedule of investments (cont’d)
December 31, 2022
Western Asset SMASh Series Core Plus Completion Fund
(Percentages shown based on Fund net assets)
| | | | | | | | | | | | | | | | |
| Security | | Rate | | | Maturity
Date | | | Face
Amount† | | | Value | |
Electrical Equipment — 0.1% | | | | | | | | | | | | | | | | |
Vertiv Group Corp., Senior Secured Notes | | | 4.125 | % | | | 11/15/28 | | | | 2,070,000 | | | $ | 1,761,942 | (a) |
Road & Rail — 0.0%†† | | | | | | | | | | | | | | | | |
XPO Inc., Senior Notes | | | 6.250 | % | | | 5/1/25 | | | | 456,000 | | | | 462,201 | (a) |
Trading Companies & Distributors — 0.7% | | | | | | | | | | | | | | | | |
H&E Equipment Services Inc., Senior Notes | | | 3.875 | % | | | 12/15/28 | | | | 1,080,000 | | | | 921,829 | (a) |
United Rentals North America Inc., Senior Notes | | | 4.875 | % | | | 1/15/28 | | | | 13,060,000 | | | | 12,405,106 | |
United Rentals North America Inc., Senior Notes | | | 5.250 | % | | | 1/15/30 | | | | 100,000 | | | | 94,135 | |
United Rentals North America Inc., Senior Notes | | | 3.875 | % | | | 2/15/31 | | | | 1,620,000 | | | | 1,361,683 | |
United Rentals North America Inc., Senior Notes | | | 3.750 | % | | | 1/15/32 | | | | 4,220,000 | | | | 3,448,289 | |
Total Trading Companies & Distributors | | | | | | | | 18,231,042 | |
Total Industrials | | | | | | | | | | | | | | | 81,056,194 | |
| Information Technology — 0.2% | | | | | | | | | | | | | | | | |
Communications Equipment — 0.2% | | | | | | | | | | | | | | | | |
CommScope Inc., Senior Secured Notes | | | 6.000 | % | | | 3/1/26 | | | | 1,150,000 | | | | 1,063,693 | (a) |
CommScope Inc., Senior Secured Notes | | | 4.750 | % | | | 9/1/29 | | | | 1,980,000 | | | | 1,599,988 | (a) |
CommScope Technologies LLC, Senior Notes | | | 5.000 | % | | | 3/15/27 | | | | 2,000,000 | | | | 1,361,563 | (a) |
Total Communications Equipment | | | | | | | | | | | | | | | 4,025,244 | |
Software — 0.0%†† | | | | | | | | | | | | | | | | |
Open Text Holdings Inc., Senior Notes | | | 4.125 | % | | | 2/15/30 | | | | 320,000 | | | | 257,261 | (a) |
Open Text Holdings Inc., Senior Notes | | | 4.125 | % | | | 12/1/31 | | | | 400,000 | | | | 311,496 | (a) |
Total Software | | | | | | | | | | | | | | | 568,757 | |
Total Information Technology | | | | | | | | | | | | | | | 4,594,001 | |
| Materials — 2.3% | | | | | | | | | | | | | | | | |
Chemicals — 0.9% | | | | | | | | | | | | | | | | |
OCP SA, Senior Notes | | | 4.500 | % | | | 10/22/25 | | | | 1,180,000 | | | | 1,155,152 | (a) |
OCP SA, Senior Notes | | | 3.750 | % | | | 6/23/31 | | | | 4,000,000 | | | | 3,364,840 | (a) |
OCP SA, Senior Notes | | | 5.125 | % | | | 6/23/51 | | | | 4,630,000 | | | | 3,532,158 | (a) |
See Notes to Financial Statements.
| | | | |
20 | | | | Western Asset SMASh Series Core Plus Completion Fund 2022 Annual Report |
Western Asset SMASh Series Core Plus Completion Fund
(Percentages shown based on Fund net assets)
| | | | | | | | | | | | | | | | |
| Security | | Rate | | | Maturity
Date | | | Face
Amount† | | | Value | |
Chemicals — continued | | | | | | | | | | | | | | | | |
Orbia Advance Corp. SAB de CV, Senior Notes | | | 1.875 | % | | | 5/11/26 | | | | 10,430,000 | | | $ | 9,023,410 | (a) |
Orbia Advance Corp. SAB de CV, Senior Notes | | | 2.875 | % | | | 5/11/31 | | | | 9,900,000 | | | | 7,748,680 | (a) |
Total Chemicals | | | | | | | | | | | | | | | 24,824,240 | |
Containers & Packaging — 0.2% | | | | | | | | | | | | | | | | |
Ardagh Packaging Finance PLC/ Ardagh Holdings USA Inc., Senior Notes | | | 5.250 | % | | | 8/15/27 | | | | 590,000 | | | | 442,100 | (a) |
Ball Corp., Senior Notes | | | 4.000 | % | | | 11/15/23 | | | | 310,000 | | | | 304,342 | |
Ball Corp., Senior Notes | | | 3.125 | % | | | 9/15/31 | | | | 4,730,000 | | | | 3,804,954 | |
Total Containers & Packaging | | | | | | | | | | | | | | | 4,551,396 | |
Metals & Mining — 0.6% | | | | | | | | | | | | | | | | |
ArcelorMittal SA, Senior Notes | | | 7.000 | % | | | 10/15/39 | | | | 2,000,000 | | | | 2,038,046 | |
Freeport-McMoRan Inc., Senior Notes | | | 4.625 | % | | | 8/1/30 | | | | 2,030,000 | | | | 1,894,141 | |
Freeport-McMoRan Inc., Senior Notes | | | 5.450 | % | | | 3/15/43 | | | | 7,950,000 | | | | 7,189,145 | |
Southern Copper Corp., Senior Notes | | | 5.250 | % | | | 11/8/42 | | | | 500,000 | | | | 478,264 | |
Teck Resources Ltd., Senior Notes | | | 6.000 | % | | | 8/15/40 | | | | 240,000 | | | | 230,032 | |
Vale Canada Ltd., Senior Notes | | | 7.200 | % | | | 9/15/32 | | | | 1,254,000 | | | | 1,366,860 | |
Vale Overseas Ltd., Senior Notes | | | 6.875 | % | | | 11/21/36 | | | | 1,368,000 | | | | 1,446,507 | |
Total Metals & Mining | | | | | | | | | | | | | | | 14,642,995 | |
Paper & Forest Products — 0.6% | | | | | | | | | | | | | | | | |
Suzano Austria GmbH, Senior Notes | | | 3.750 | % | | | 1/15/31 | | | | 13,710,000 | | | | 11,532,598 | |
Suzano Austria GmbH, Senior Notes | | | 3.125 | % | | | 1/15/32 | | | | 5,160,000 | | | | 4,030,213 | |
Total Paper & Forest Products | | | | | | | | | | | | | | | 15,562,811 | |
Total Materials | | | | | | | | | | | | | | | 59,581,442 | |
| Real Estate — 0.1% | | | | | | | | | | | | | | | | |
Equity Real Estate Investment Trusts (REITs) — 0.1% | | | | | | | | | | | | | | | | |
CTR Partnership LP/CareTrust | | | | | | | | | | | | | | | | |
Capital Corp., Senior Notes | | | 3.875 | % | | | 6/30/28 | | | | 1,310,000 | | | | 1,112,369 | (a) |
VICI Properties LP/VICI Note Co. Inc., Senior Notes | | | 4.500 | % | | | 1/15/28 | | | | 1,225,000 | | | | 1,130,886 | (a) |
Total Real Estate | | | | | | | | | | | | | | | 2,243,255 | |
Total Corporate Bonds & Notes (Cost — $601,165,776) | | | | 515,322,536 | |
See Notes to Financial Statements.
| | | | |
| Western Asset SMASh Series Core Plus Completion Fund 2022 Annual Report | | | | 21 |
Schedule of investments (cont’d)
December 31, 2022
Western Asset SMASh Series Core Plus Completion Fund
(Percentages shown based on Fund net assets)
| | | | | | | | | | | | | | | | |
| Security | | Rate | | | Maturity
Date | | | Face
Amount† | | | Value | |
| Senior Loans — 19.4% | | | | | | | | | | | | | | | | |
| Communication Services — 2.1% | | | | | | | | | | | | | | | | |
Diversified Telecommunication Services — 0.1% | | | | | | | | | | | | | | | | |
Level 3 Financing Inc., 2027 Term Loan B (1 mo. USD LIBOR + 1.750%) | | | 6.134 | % | | | 3/1/27 | | | | 2,349,878 | | | $ | 2,257,774 | (e)(f)(g) |
Interactive Media & Services — 0.2% | | | | | | | | | | | | | | | | |
Rackspace Technology Global Inc., Term Loan B (3 mo. USD LIBOR + 2.750%) | | | 7.380 | % | | | 2/15/28 | | | | 8,082,402 | | | | 5,092,358 | (e)(f)(g) |
Media — 1.8% | | | | | | | | | | | | | | | | |
Charter Communications Operating LLC, Term Loan B1 (1 mo. USD LIBOR + 1.750%) | | | 6.140 | % | | | 4/30/25 | | | | 2,750,209 | | | | 2,742,040 | (e)(f)(g) |
Charter Communications Operating LLC, Term Loan B2 (1 mo. USD LIBOR + 1.750%) | | | 6.140 | % | | | 2/1/27 | | | | 12,726,806 | | | | 12,446,816 | (e)(f)(g) |
iHeartCommunications Inc., New Term Loan (1 mo. USD LIBOR + 3.000%) | | | 7.384 | % | | | 5/1/26 | | | | 10,303,660 | | | | 9,476,173 | (e)(f)(g) |
Nexstar Broadcasting Inc., Term Loan B4 (1 mo. USD LIBOR + 2.500%) | | | 6.884 | % | | | 9/18/26 | | | | 4,379,655 | | | | 4,351,735 | (e)(f)(g) |
Terrier Media Buyer Inc., 2021 Refinancing Term Loan B (3 mo. USD LIBOR + 3.500%) | | | 8.230 | % | | | 12/17/26 | | | | 1,709,725 | | | | 1,605,620 | (e)(f)(g) |
Virgin Media Bristol LLC, Term Loan Facility N (1 mo. USD LIBOR + 2.500%) | | | 6.818 | % | | | 1/31/28 | | | | 13,686,685 | | | | 13,482,617 | (e)(f)(g) |
Virgin Media Bristol LLC, Term Loan Facility Q (1 mo. USD LIBOR + 3.250%) | | | 7.568 | % | | | 1/31/29 | | | | 1,910,000 | | | | 1,896,153 | (e)(f)(g) |
Ziggo Financing Partnership, Term Loan I (1 mo. USD LIBOR + 2.500%) | | | 6.818 | % | | | 4/30/28 | | | | 638,000 | | | | 623,597 | (e)(f)(g) |
Total Media | | | | | | | | | | | | | | | 46,624,751 | |
Total Communication Services | | | | | | | | | | | | | | | 53,974,883 | |
| Consumer Discretionary — 2.9% | | | | | | | | | | | | | | | | |
Auto Components — 0.6% | | | | | | | | | | | | | | | | |
Clarios Global LP, First Lien Amendment No. 1 Dollar Term Loan (1 mo. USD LIBOR + 3.250%) | | | 7.634 | % | | | 4/30/26 | | | | 16,362,550 | | | | 16,089,869 | (e)(f)(g) |
See Notes to Financial Statements.
| | | | |
22 | | | | Western Asset SMASh Series Core Plus Completion Fund 2022 Annual Report |
Western Asset SMASh Series Core Plus Completion Fund
(Percentages shown based on Fund net assets)
| | | | | | | | | | | | | | | | |
| Security | | Rate | | | Maturity
Date | | | Face
Amount† | | | Value | |
Diversified Consumer Services — 0.3% | | | | | | | | | | | | | | | | |
Prime Security Services Borrower LLC, 2021 Refinancing Term Loan B1 (3 mo. USD LIBOR + 2.750%) | | | 6.505 | % | | | 9/23/26 | | | | 8,414,734 | | | $ | 8,351,623 | (e)(f)(g) |
Hotels, Restaurants & Leisure — 1.4% | | | | | | | | | | | | | | | | |
1011778 BC Unlimited Liability Co., Term Loan B4 | | | 6.134-6.165 | % | | | 11/19/26 | | | | 1,060,997 | | | | 1,044,795 | (e)(f)(g) |
8th Avenue Food & Provisions Inc., First Lien Term Loan (1 mo. USD LIBOR + 3.750%) | | | 8.134 | % | | | 10/1/25 | | | | 972,152 | | | | 817,065 | (e)(f)(g) |
Alterra Mountain Co., 2028 Term Loan B (1 mo. USD LIBOR + 3.500%) | | | 7.884 | % | | | 8/17/28 | | | | 5,130,461 | | | | 5,080,773 | (e)(f)(g) |
Caesars Resort Collection LLC, Term Loan B (1 mo. USD LIBOR + 2.750%) | | | 7.134 | % | | | 12/23/24 | | | | 2,030,902 | | | | 2,028,952 | (e)(f)(g) |
Caesars Resort Collection LLC, Term Loan B1 (1 mo. USD LIBOR + 3.500%) | | | 7.884 | % | | | 7/21/25 | | | | 183,572 | | | | 183,353 | (e)(f)(g) |
Entain Holdings Gibraltar Ltd., Term Loan Facility B (3 mo. USD LIBOR + 2.500%) | | | 6.860 | % | | | 3/29/27 | | | | 1,817,236 | | | | 1,806,732 | (e)(f)(g) |
PCI Gaming Authority, Term Loan Facility B (1 mo. USD LIBOR + 2.500%) | | | 6.884 | % | | | 5/29/26 | | | | 5,244,030 | | | | 5,222,189 | (e)(f)(g) |
Scientific Games International Inc., Initial Term Loan B (1 mo. Term SOFR + 3.100%) | | | 7.417 | % | | | 4/13/29 | | | | 12,288,250 | | | | 12,152,219 | (e)(f)(g) |
Station Casinos LLC, Term Loan Facility B1 (1 mo. USD LIBOR + 2.250%) | | | 6.640 | % | | | 2/8/27 | | | | 8,135,327 | | | | 7,955,658 | (e)(f)(g) |
Total Hotels, Restaurants & Leisure | | | | | | | | 36,291,736 | |
Specialty Retail — 0.6% | | | | | | | | | | | | | | | | |
Great Outdoors Group LLC, Term Loan B2 (1 mo. USD LIBOR + 3.750%) | | | 8.134 | % | | | 3/6/28 | | | | 4,106,593 | | | | 3,955,162 | (e)(f)(g) |
Harbor Freight Tools USA Inc., 2021 Refinancing Term Loan (1 mo. USD LIBOR + 2.750%) | | | 7.134 | % | | | 10/19/27 | | | | 10,365,084 | | | | 9,900,988 | (e)(f)(g) |
Total Specialty Retail | | | | | | | | | | | | | | | 13,856,150 | |
Total Consumer Discretionary | | | | | | | | | | | | | | | 74,589,378 | |
See Notes to Financial Statements.
| | | | |
| Western Asset SMASh Series Core Plus Completion Fund 2022 Annual Report | | | | 23 |
Schedule of investments (cont’d)
December 31, 2022
Western Asset SMASh Series Core Plus Completion Fund
(Percentages shown based on Fund net assets)
| | | | | | | | | | | | | | | | |
| Security | | Rate | | | Maturity
Date | | | Face
Amount† | | | Value | |
| Consumer Staples — 0.2% | | | | | | | | | | | | | | | | |
Beverages — 0.1% | | | | | | | | | | | | | | | | |
Triton Water Holdings Inc., First Lien Initial Term Loan (3 mo. USD LIBOR + 3.500%) | | | 8.230 | % | | | 3/31/28 | | | | 4,438,616 | | | $ | 4,142,893 | (e)(f)(g) |
Household Products — 0.1% | | | | | | | | | | | | | | | | |
Energizer Holdings Inc., Term Loan (1 mo. USD LIBOR + 2.250%) | | | 6.625 | % | | | 12/22/27 | | | | 2,615,733 | | | | 2,573,227 | (e)(f)(g) |
Total Consumer Staples | | | | | | | | | | | | | | | 6,716,120 | |
| Financials — 3.0% | | | | | | | | | | | | | | | | |
Capital Markets — 0.8% | | | | | | | | | | | | | | | | |
Allspring Buyer LLC, Term Loan (3 mo. USD LIBOR + 3.000%) | | | 7.750 | % | | | 11/1/28 | | | | 6,536,605 | | | | 6,459,800 | (e)(f)(g) |
Edelman Financial Engines Center LLC, 2021 Refinancing Term Loan (1 mo. USD LIBOR + 3.500%) | | | 7.884 | % | | | 4/7/28 | | | | 2,943,029 | | | | 2,753,940 | (e)(f)(g) |
Finco I LLC, 2020 Term Loan (1 mo. USD LIBOR + 2.500%) | | | 6.884 | % | | | 6/27/25 | | | | 943,617 | | | | 941,847 | (e)(f)(g) |
First Eagle Holdings Inc., 2018 Refinancing Term Loan B (3 mo. USD LIBOR + 2.500%) | | | 7.230 | % | | | 2/1/27 | | | | 2,116,082 | | | | 2,067,676 | (e)(f)(g) |
Focus Financial Partners LLC, Term Loan B5 (1 mo. Term SOFR + 3.250%) | | | 7.573 | % | | | 6/30/28 | | | | 10,400,812 | | | | 10,298,988 | (e)(f)(g) |
Total Capital Markets | | | | | | | | | | | | | | | 22,522,251 | |
Diversified Financial Services — 1.6% | | | | | | | | | | | | | | | | |
Citadel Securities LP, 2021 Term Loan (1 mo. Term SOFR + 2.614%) | | | 6.938 | % | | | 2/2/28 | | | | 10,464,777 | | | | 10,292,109 | (e)(f)(g) |
Deerfield Dakota Holding LLC, First Lien Initial Dollar Term Loan (1 mo. Term SOFR + 3.750%) | | | 8.073 | % | | | 4/9/27 | | | | 9,016,643 | | | | 8,443,275 | (e)(f)(g) |
Jane Street Group LLC, Dollar Term Loan (1 mo. USD LIBOR + 2.750%) | | | 7.134 | % | | | 1/26/28 | | | | 2,380,196 | | | | 2,314,181 | (e)(f)(g) |
Setanta Aircraft Leasing DAC, Term Loan (3 mo. USD LIBOR + 2.000%) | | | 6.730 | % | | | 11/5/28 | | | | 5,000,000 | | | | 4,985,000 | (e)(f)(g) |
Trans Union LLC, Term Loan B5 | | | — | | | | 11/16/26 | | | | 2,991,210 | | | | 2,954,089 | (h) |
UFC Holdings LLC, Term Loan B3 (3 mo. USD LIBOR + 2.750%) | | | 7.110 | % | | | 4/29/26 | | | | 7,243,164 | | | | 7,161,678 | (e)(f)(g) |
VFH Parent LLC, Initial Term Loan (1 mo. Term SOFR + 3.000%) | | | 7.321 | % | | | 1/13/29 | | | | 5,500,000 | | | | 5,370,750 | (e)(f)(g) |
Total Diversified Financial Services | | | | | | | | | | | | | | | 41,521,082 | |
See Notes to Financial Statements.
| | | | |
24 | | | | Western Asset SMASh Series Core Plus Completion Fund 2022 Annual Report |
Western Asset SMASh Series Core Plus Completion Fund
(Percentages shown based on Fund net assets)
| | | | | | | | | | | | | | | | |
| Security | | Rate | | | Maturity
Date | | | Face
Amount† | | | Value | |
Insurance — 0.6% | | | | | | | | | | | | | | | | |
AmWINS Group Inc., Term Loan (1 mo. USD LIBOR + 2.250%) | | | 6.634 | % | | | 2/19/28 | | | | 2,817,452 | | | $ | 2,771,006 | (e)(f)(g) |
Asurion LLC, New Term Loan B7 (1 mo. USD LIBOR + 3.000%) | | | 7.384 | % | | | 11/3/24 | | | | 627,060 | | | | 610,600 | (e)(f)(g) |
Asurion LLC, New Term Loan B8 (1 mo. USD LIBOR + 3.250%) | | | 7.634 | % | | | 12/23/26 | | | | 7,368,212 | | | | 6,586,887 | (e)(f)(g) |
Asurion LLC, New Term Loan B9 (1 mo. USD LIBOR + 3.250%) | | | 7.634 | % | | | 7/31/27 | | | | 4,794,600 | | | | 4,210,282 | (e)(f)(g) |
Asurion LLC, New Term Loan B10 (1 mo. Term SOFR + 4.100%) | | | 8.680 | % | | | 8/21/28 | | | | 1,281,611 | | | | 1,146,721 | (e)(f)(g) |
Total Insurance | | | | | | | | | | | | | | | 15,325,496 | |
Total Financials | | | | | | | | | | | | | | | 79,368,829 | |
| Health Care — 4.4% | | | | | | | | | | | | | | | | |
Health Care Equipment & Supplies — 0.3% | | | | | | | | | | | | | | | | |
Medline Borrower LP, Initial Dollar Term Loan (1 mo. USD LIBOR + 3.250%) | | | 7.634 | % | | | 10/23/28 | | | | 8,209,321 | | | | 7,816,136 | (e)(f)(g) |
Health Care Providers & Services — 1.8% | | | | | | | | | | | | | | | | |
EyeCare Partners LLC, First Lien Initial Term Loan (3 mo. USD LIBOR + 3.750%) | | | 8.480 | % | | | 2/18/27 | | | | 2,589,220 | | | | 2,105,904 | (e)(f)(g) |
Global Medical Response Inc., 2020 Term Loan (1 mo. USD LIBOR + 4.250%) | | | 8.422 | % | | | 10/2/25 | | | | 4,777,004 | | | | 3,376,768 | (e)(f)(g) |
Grifols Worldwide Operations USA Inc., Dollar Term Loan B (1 mo. USD LIBOR + 2.000%) | | | 6.384 | % | | | 11/15/27 | | | | 13,980,046 | | | | 13,549,041 | (e)(f)(g) |
Phoenix Guarantor Inc., Term Loan B1 (1 mo. USD LIBOR + 3.250%) | | | 7.634 | % | | | 3/5/26 | | | | 7,734,881 | | | | 7,270,788 | (e)(f)(g) |
Phoenix Guarantor Inc., Term Loan B3 (1 mo. USD LIBOR + 3.500%) | | | 7.884 | % | | | 3/5/26 | | | | 7,561,360 | | | | 7,133,425 | (e)(f)(g) |
Phoenix Newco Inc., First Lien Initial Term Loan (1 mo. USD LIBOR + 3.250%) | | | 7.634 | % | | | 11/15/28 | | | | 1,106,662 | | | | 1,068,239 | (e)(f)(g) |
Sotera Health Holdings LLC, Term Loan (3 mo. USD LIBOR + 2.750%) | | | 7.165 | % | | | 12/11/26 | | | | 13,820,000 | | | | 12,818,050 | (e)(f)(g) |
Total Health Care Providers & Services | | | | | | | | 47,322,215 | |
See Notes to Financial Statements.
| | | | |
| Western Asset SMASh Series Core Plus Completion Fund 2022 Annual Report | | | | 25 |
Schedule of investments (cont’d)
December 31, 2022
Western Asset SMASh Series Core Plus Completion Fund
(Percentages shown based on Fund net assets)
| | | | | | | | | | | | | | | | |
| Security | | Rate | | | Maturity
Date | | | Face
Amount† | | | Value | |
Health Care Technology — 0.5% | | | | | | | | | | | | | | | | |
AthenaHealth Group Inc., Initial Delayed Draw Term Loan | | | — | | | | 2/15/29 | | | | 2,200,365 | | | $ | 1,992,123 | (h) |
AthenaHealth Group Inc., Initial Term Loan (1 mo. Term SOFR + 3.500%) | | | 7.821 | % | | | 2/15/29 | | | | 12,917,245 | | | | 11,694,756 | (e)(f)(g) |
Total Health Care Technology | | | | | | | | | | | | | | | 13,686,879 | |
Life Sciences Tools & Services — 0.4% | | | | | | | | | | | | | | | | |
ICON Luxembourg Sarl, Term Loan (3 mo. USD LIBOR + 2.250%) | | | 7.000 | % | | | 7/3/28 | | | | 8,318,187 | | | | 8,303,672 | (e)(f)(g) |
PRA Health Sciences Inc., Term Loan (3 mo. USD LIBOR + 2.250%) | | | 7.000 | % | | | 7/3/28 | | | | 2,072,482 | | | | 2,068,865 | (e)(f)(g) |
Total Life Sciences Tools & Services | | | | | | | | | | | | | | | 10,372,537 | |
Pharmaceuticals — 1.4% | | | | | | | | | | | | | | | | |
Gainwell Acquisition Corp., Term Loan B (3 mo. USD LIBOR + 4.000%) | | | 8.730 | % | | | 10/1/27 | | | | 7,480,451 | | | | 7,040,975 | (e)(f)(g) |
Horizon Therapeutics USA Inc., Incremental Term Loan B2 (1 mo. USD LIBOR + 1.750%) | | | 6.188 | % | | | 3/15/28 | | | | 17,694,825 | | | | 17,699,603 | (e)(f)(g) |
Jazz Financing Lux Sarl, Initial Dollar Term Loan (1 mo. USD LIBOR + 3.500%) | | | 7.884 | % | | | 5/5/28 | | | | 11,632,565 | | | | 11,548,054 | (e)(f)(g) |
Total Pharmaceuticals | | | | | | | | | | | | | | | 36,288,632 | |
Total Health Care | | | | | | | | | | | | | | | 115,486,399 | |
| Industrials — 4.5% | | | | | | | | | | | | | | | | |
Aerospace & Defense — 0.2% | | | | | | | | | | | | | | | | |
Avolon TLB Borrower 1 (US) LLC, Term Loan B5 (1 mo. USD LIBOR + 2.250%) | | | 6.603 | % | | | 12/1/27 | | | | 4,390,400 | | | | 4,388,446 | (e)(f)(g) |
Transdigm Inc., Refinancing Term Loan F (3 mo. USD LIBOR + 2.250%) | | | 6.980 | % | | | 12/9/25 | | | | 665,207 | | | | 658,389 | (e)(f)(g) |
Total Aerospace & Defense | | | | | | | | | | | | | | | 5,046,835 | |
Airlines — 0.5% | | | | | | | | | | | | | | | | |
Delta Air Lines Inc., Initial Term Loan (3 mo. USD LIBOR + 3.750%) | | | 7.993 | % | | | 10/20/27 | | | | 1,910,000 | | | | 1,950,473 | (e)(f)(g) |
United Airlines Inc., Term Loan B (3 mo. USD LIBOR + 3.750%) | | | 8.108 | % | | | 4/21/28 | | | | 10,424,325 | | | | 10,322,271 | (e)(f)(g) |
Total Airlines | | | | | | | | | | | | | | | 12,272,744 | |
See Notes to Financial Statements.
| | | | |
26 | | | | Western Asset SMASh Series Core Plus Completion Fund 2022 Annual Report |
Western Asset SMASh Series Core Plus Completion Fund
(Percentages shown based on Fund net assets)
| | | | | | | | | | | | | | | | |
| Security | | Rate | | | Maturity
Date | | | Face
Amount† | | | Value | |
Building Products — 0.8% | | | | | | | | | | | | | | | | |
Hunter Douglas Holding BV, Term Loan B1 (3 mo. Term SOFR + 3.500%) | | | 7.859 | % | | | 2/26/29 | | | | 16,602,809 | | | $ | 14,691,992 | (e)(f)(g) |
Quikrete Holdings Inc., Fourth Amendment Term Loan B1 (1 mo. USD LIBOR + 3.000%) | | | 7.384 | % | | | 6/9/28 | | | | 5,915,300 | | | | 5,876,939 | (e)(f)(g) |
Total Building Products | | | | | | | | | | | | | | | 20,568,931 | |
Commercial Services & Supplies — 2.1% | | | | | | | | | | | | | | | | |
Ali Group North America Co., Initial Term Loan B (1 mo. Term SOFR + 2.114%) | | | 6.438 | % | | | 7/30/29 | | | | 4,422,222 | | | | 4,394,583 | (e)(f)(g) |
Allied Universal Holdco LLC, USD Term Loan (1 mo. Term SOFR + 3.750%) | | | 8.173 | % | | | 5/12/28 | | | | 11,459,080 | | | | 10,909,102 | (e)(f)(g) |
APi Group DE Inc., Initial Term Loan (1 mo. USD LIBOR + 2.500%) | | | 6.884 | % | | | 10/1/26 | | | | 13,276,651 | | | | 13,207,480 | (e)(f)(g) |
Garda World Security Corp., Term Loan B2 (3 mo. USD LIBOR + 4.250%) | | | 8.930 | % | | | 10/30/26 | | | | 3,964,367 | | | | 3,867,240 | (e)(f)(g) |
GFL Environmental Inc., 2020 Term Loan (3 mo. USD LIBOR + 3.000%) | | | 7.415 | % | | | 5/30/25 | | | | 5,843,494 | | | | 5,852,814 | (e)(f)(g) |
Verscend Holding Corp., New Term Loan B (1 mo. USD LIBOR + 4.000%) | | | 8.384 | % | | | 8/27/25 | | | | 16,581,957 | | | | 16,509,410 | (e)(f)(g) |
Total Commercial Services & Supplies | | | | | | | | 54,740,629 | |
Construction & Engineering — 0.3% | | | | | | | | | | | | | | | | |
Brown Group Holding LLC, Initial Term Loan (1 mo. USD LIBOR + 2.500%) | | | 6.884 | % | | | 6/7/28 | | | | 7,281,272 | | | | 7,160,949 | (e)(f)(g) |
Road & Rail — 0.6% | | | | | | | | | | | | | | | | |
Genesee & Wyoming Inc., Initial Term Loan (3 mo. USD LIBOR + 2.000%) | | | 6.730 | % | | | 12/30/26 | | | | 9,145,139 | | | | 9,109,152 | (e)(f)(g) |
XPO Logistics Inc., Refinancing Term Loan (1 mo. USD LIBOR + 1.750%) | | | 5.935 | % | | | 2/24/25 | | | | 8,065,000 | | | | 8,039,152 | (e)(f)(g) |
Total Road & Rail | | | | | | | | | | | | | | | 17,148,304 | |
Trading Companies & Distributors — 0.0%†† | | | | | | | | | | | | | | | | |
Delos Finance SARL, 2018 Term Loan (3 mo. USD LIBOR + 1.750%) | | | 6.480 | % | | | 10/6/23 | | | | 275,000 | | | | 274,948 | (e)(f)(g) |
Total Industrials | | | | | | | | | | | | | | | 117,213,340 | |
See Notes to Financial Statements.
| | | | |
| Western Asset SMASh Series Core Plus Completion Fund 2022 Annual Report | | | | 27 |
Schedule of investments (cont’d)
December 31, 2022
Western Asset SMASh Series Core Plus Completion Fund
(Percentages shown based on Fund net assets)
| | | | | | | | | | | | | | | | |
| Security | | Rate | | | Maturity
Date | | | Face
Amount† | | | Value | |
| Information Technology — 2.2% | | | | | | | | | | | | | | | | |
Communications Equipment — 0.1% | | | | | | | | | | | | | | | | |
CommScope Inc., Initial Term Loan (1 mo. USD LIBOR + 3.250%) | | | 7.634 | % | | | 4/6/26 | | | | 3,685,251 | | | $ | 3,483,484 | (e)(f)(g) |
Electronic Equipment, Instruments & Components — 0.4% | | | | | | | | | | | | | | | | |
II-VI Inc., Term Loan B (1 mo. USD LIBOR + 2.750%) | | | 7.134 | % | | | 7/2/29 | | | | 9,982,561 | | | | 9,902,700 | (e)(f)(g) |
Software — 1.7% | | | | | | | | | | | | | | | | |
DCert Buyer Inc., First Lien Initial Term Loan (3 mo. Term SOFR + 4.000%) | | | 8.696 | % | | | 10/16/26 | | | | 14,075,601 | | | | 13,628,208 | (e)(f)(g) |
Magenta Buyer LLC, First Lien Initial Term Loan (3 mo. USD LIBOR + 4.750%) | | | 9.170 | % | | | 7/27/28 | | | | 18,074,600 | | | | 15,561,146 | (e)(f)(g) |
Peraton Corp., First Lien Term Loan B (1 mo. USD LIBOR + 3.750%) | | | 8.134 | % | | | 2/1/28 | | | | 14,147,059 | | | | 13,840,563 | (e)(f)(g) |
Total Software | | | | | | | | | | | | | | | 43,029,917 | |
Total Information Technology | | | | | | | | | | | | | | | 56,416,101 | |
| Materials — 0.1% | | | | | | | | | | | | | | | | |
Paper & Forest Products — 0.1% | | | | | | | | | | | | | | | | |
Asplundh Tree Expert LLC, 2021 Refinancing Term Loan (1 mo. USD LIBOR + 1.750%) | | | 6.134 | % | | | 9/7/27 | | | | 2,145,515 | | | | 2,144,614 | (e)(f)(g) |
Total Senior Loans (Cost — $525,527,812) | | | | | | | | 505,909,664 | |
| Collateralized Mortgage Obligations (i) —18.4% | | | | | | | | | | | | | | | | |
Alternative Loan Trust, 2007-OA8 1A1 (1 mo. USD LIBOR + 0.360%) | | | 4.749 | % | | | 6/25/47 | | | | 3,162,401 | | | | 2,537,274 | (e) |
AOA Mortgage Trust, 2021-1177 A (1 mo. USD LIBOR + 0.874%) | | | 5.192 | % | | | 10/15/38 | | | | 8,235,000 | | | | 7,646,284 | (a)(e) |
BAMLL Re-REMIC Trust, 2016- GG10 AJA | | | 5.621 | % | | | 8/10/45 | | | | 9,921,268 | | | | 2,593,060 | (a)(e) |
Banc of America Funding Corp., 2015-R3 1A2 | | | 4.543 | % | | | 3/27/36 | | | | 29,491,790 | | | | 23,374,777 | (a)(e) |
Banc of America Funding Trust, 2014-R2 2A2 (1 mo. USD LIBOR + 0.210%) | | | 4.599 | % | | | 5/26/37 | | | | 8,812,080 | | | | 7,552,202 | (a)(e) |
Banc of America Funding Trust, 2015-R2 9A2 | | | 4.007 | % | | | 3/27/36 | | | | 12,659,626 | | | | 10,592,083 | (a)(e) |
Barclays Commercial Mortgage Trust, 2019-C5 A4 | | | 3.063 | % | | | 11/15/52 | | | | 25,110,000 | | | | 22,125,272 | |
See Notes to Financial Statements.
| | | | |
28 | | | | Western Asset SMASh Series Core Plus Completion Fund 2022 Annual Report |
Western Asset SMASh Series Core Plus Completion Fund
(Percentages shown based on Fund net assets)
| | | | | | | | | | | | | | | | |
| Security | | Rate | | | Maturity
Date | | | Face
Amount† | | | Value | |
| Collateralized Mortgage Obligations (i) — continued | | | | | | | | | | | | | | | | |
BCAP LLC Trust, 2013-RR3 4A2 (1 mo. USD LIBOR + 0.160%) | | | 3.251 | % | | | 11/26/36 | | | | 3,391,989 | | | $ | 3,325,298 | (a)(e) |
BCAP LLC Trust, 2014-RR5 1A2 (1 mo. USD LIBOR + 0.225%) | | | 4.055 | % | | | 1/26/36 | | | | 20,688,155 | | | | 18,763,066 | (a)(e) |
BX Commercial Mortgage Trust, 2019-IMC F (1 mo. USD LIBOR + 2.900%) | | | 7.218 | % | | | 4/15/34 | | | | 3,210,000 | | | | 3,000,382 | (a)(e) |
BX Commercial Mortgage Trust, 2020-VIVA E | | | 3.549 | % | | | 3/11/44 | | | | 6,847,863 | | | | 4,991,437 | (a)(e) |
BX Commercial Mortgage Trust, 2021-21M A (1 mo. USD LIBOR + 0.730%) | | | 5.048 | % | | | 10/15/36 | | | | 9,469,097 | | | | 9,112,521 | (a)(e) |
BX Commercial Mortgage Trust, 2021-ACNT A (1 mo. USD LIBOR + 0.850%) | | | 5.168 | % | | | 11/15/38 | | | | 7,780,000 | | | | 7,497,020 | (a)(e) |
BX Commercial Mortgage Trust, 2021-XL2 J (1 mo. USD LIBOR + 3.890%) | | | 8.208 | % | | | 10/15/38 | | | | 9,267,151 | | | | 8,442,131 | (a)(e) |
BX Trust, 2021-BXMF A (1 mo. USD LIBOR + 0.636%) | | | 4.954 | % | | | 10/15/26 | | | | 24,640,000 | | | | 23,657,428 | (a)(e) |
Citigroup Commercial Mortgage Trust, 2019-C7 A4 | | | 3.102 | % | | | 12/15/72 | | | | 15,000,000 | | | | 13,118,706 | |
Commercial Mortgage Trust, 2014- CR20 B | | | 4.239 | % | | | 11/10/47 | | | | 720,000 | | | | 671,948 | (e) |
CSMC OA LLC, 2014-USA F | | | 4.373 | % | | | 9/15/37 | | | | 1,100,000 | | | | 559,113 | (a) |
CSMC Trust, 2014-11R 15A2 | | | 3.683 | % | | | 1/27/36 | | | | 3,474,978 | | | | 3,168,036 | (a)(e) |
CSMC Trust, 2014-USA E | | | 4.373 | % | | | 9/15/37 | | | | 530,000 | | | | 297,019 | (a) |
CSMC Trust, 2017-CHOP G (1 mo. USD LIBOR + 5.350%) | | | 9.668 | % | | | 7/15/32 | | | | 11,706,000 | | | | 10,638,605 | (a)(e) |
CSMC Trust, 2020-TMIC A (1 mo. USD LIBOR + 3.000%) | | | 7.818 | % | | | 12/15/35 | | | | 6,870,000 | | | | 6,850,292 | (a)(e) |
Deutsche Mortgage Securities Inc., 2006-PR1 5AS2, IO | | | 5.193 | % | | | 4/15/36 | | | | 2,527,241 | | | | 433,152 | (a)(e) |
ELP Commercial Mortgage Trust, 2021-ELP D (1 mo. USD LIBOR + 1.519%) | | | 5.837 | % | | | 11/15/38 | | | | 15,900,000 | | | | 14,788,221 | (a)(e) |
Federal Home Loan Mortgage Corp. (FHLMC) REMIC, Structured Agency Credit Risk Debt Notes, 2021- DNA5 B1 (30 Day Average SOFR + 3.050%) | | | 6.978 | % | | | 1/25/34 | | | | 9,670,000 | | | | 8,860,975 | (a)(e) |
See Notes to Financial Statements.
| | | | |
| Western Asset SMASh Series Core Plus Completion Fund 2022 Annual Report | | | | 29 |
Schedule of investments (cont’d)
December 31, 2022
Western Asset SMASh Series Core Plus Completion Fund
(Percentages shown based on Fund net assets)
| | | | | | | | | | | | | | | | |
| Security | | Rate | | | Maturity
Date | | | Face
Amount† | | | Value | |
| Collateralized Mortgage Obligations (i) — continued | | | | | | | | | | | | | | | | |
Federal Home Loan Mortgage Corp. (FHLMC) Structured Agency Credit Risk Debt Notes, 2018-HRP1 B2 (1 mo. USD LIBOR + 11.750%) | | | 16.139 | % | | | 5/25/43 | | | | 17,209,211 | | | $ | 17,945,177 | (a)(e) |
Federal Home Loan Mortgage Corp. (FHLMC) Structured Agency Credit Risk Debt Notes, 2017-HRP1 B1 (1 mo. USD LIBOR + 4.600%) | | | 8.989 | % | | | 12/25/42 | | | | 2,610,000 | | | | 2,664,447 | (e) |
Federal National Mortgage Association (FNMA) — CAS, 2017- C03 1B1 (1 mo. USD LIBOR + 4.850%) | | | 9.239 | % | | | 10/25/29 | | | | 16,410,000 | | | | 17,351,317 | (a)(e) |
Federal National Mortgage Association (FNMA) — CAS, 2018- R07 1B1 (1 mo. USD LIBOR + 4.350%) | | | 8.739 | % | | | 4/25/31 | | | | 2,414,000 | | | | 2,456,863 | (a)(e) |
Federal National Mortgage Association (FNMA) — CAS, 2021- R01 1B1 (30 Day Average SOFR + 3.100%) | | | 7.028 | % | | | 10/25/41 | | | | 8,870,000 | | | | 8,360,483 | (a)(e) |
Government National Mortgage Association (GNMA), 2014-157 IO, IO | | | 0.192 | % | | | 5/16/55 | | | | 2,214,412 | | | | 18,294 | (e) |
GS Mortgage Securities Corp., 2014-2R 3B (1 mo. USD LIBOR + 0.610%) | | | 4.626 | % | | | 11/26/37 | | | | 15,882,574 | | | | 13,835,008 | (a)(e) |
GS Mortgage Securities Corp. Trust, 2018-LUAU G (1 mo. USD LIBOR + 4.450%) | | | 8.768 | % | | | 11/15/32 | | | | 10,000,000 | | | | 9,298,795 | (a)(e) |
Hilton USA Trust, 2016-HHV D | | | 4.194 | % | | | 11/5/38 | | | | 2,800,000 | | | | 2,476,957 | (a)(e) |
IMPAC Secured Assets Corp., 2006-3 A7 (1 mo. USD LIBOR + 0.540%) | | | 4.929 | % | | | 11/25/36 | | | | 18,896,359 | | | | 14,038,340 | (e) |
JPMBB Commercial Mortgage Securities Trust, 2014-C25 C | | | 4.436 | % | | | 11/15/47 | | | | 3,940,000 | | | | 3,427,317 | (e) |
JPMorgan Chase Commercial Mortgage Securities Trust, 2006- LDP9 AMS | | | 5.337 | % | | | 5/15/47 | | | | 3,618,197 | | | | 3,379,305 | |
JPMorgan Chase Commercial Mortgage Securities Trust, 2007- LD12 AJ | | | 6.514 | % | | | 2/15/51 | | | | 15,868 | | | | 14,150 | (e) |
See Notes to Financial Statements.
| | | | |
30 | | | | Western Asset SMASh Series Core Plus Completion Fund 2022 Annual Report |
Western Asset SMASh Series Core Plus Completion Fund
(Percentages shown based on Fund net assets)
| | | | | | | | | | | | | | | | |
| Security | | Rate | | | Maturity
Date | | | Face Amount† | | | Value | |
| Collateralized Mortgage Obligations (i) — continued | | | | | | | | | | | | | |
JPMorgan Chase Commercial Mortgage Securities Trust, 2020- NNN FFX | | | 4.625 | % | | | 1/16/37 | | | | 39,120,000 | | | $ | 31,996,021 | (a) |
JPMorgan Chase Commercial Mortgage Securities Trust, 2020- NNN GFX | | | 4.688 | % | | | 1/16/37 | | | | 38,360,000 | | | | 30,719,056 | (a)(e) |
JPMorgan Chase Commercial Mortgage Securities Trust, 2021- NYAH H (1 mo. USD LIBOR + 3.390%) | | | 7.708 | % | | | 6/15/38 | | | | 7,960,000 | | | | 7,391,720 | (a)(e) |
KIND Trust, 2021-KIND D (1 mo. USD LIBOR + 2.300%) | | | 6.618 | % | | | 8/15/38 | | | | 21,226,588 | | | | 19,154,128 | (a)(e) |
KIND Trust, 2021-KIND XCP, IO | | | 0.000 | % | | | 8/15/38 | | | | 78,050,000 | | | | 82 | (a)(e) |
ML-CFC Commercial Mortgage Trust, 2007-5 AJ | | | 5.450 | % | | | 8/12/48 | | | | 693,350 | | | | 178,823 | (e) |
ML-CFC Commercial Mortgage Trust, 2007-5 AJFL | | | 5.450 | % | | | 8/12/48 | | | | 303,003 | | | | 78,148 | (a)(e) |
ML-CFC Commercial Mortgage Trust, 2007-9 AJ | | | 6.193 | % | | | 9/12/49 | | | | 25,618 | | | | 25,186 | (e) |
Morgan Stanley Bank of America Merrill Lynch Trust, 2017-C34 B | | | 4.111 | % | | | 11/15/52 | | | | 6,250,000 | | | | 5,415,963 | (e) |
MRCD Mortgage Trust, 2019-PARK A | | | 2.718 | % | | | 12/15/36 | | | | 7,980,000 | | | | 7,344,317 | (a) |
NYO Commercial Mortgage Trust, 2021-1290 C (1 mo. USD LIBOR + 1.995%) | | | 6.313 | % | | | 11/15/38 | | | | 9,150,000 | | | | 8,085,157 | (a)(e) |
PMT Credit Risk Transfer Trust, 2019-2R A (1 mo. USD LIBOR + 2.750%) | | | 7.137 | % | | | 5/27/23 | | | | 10,804,922 | | | | 10,380,115 | (a)(e) |
PMT Credit Risk Transfer Trust, 2019-3R A (1 mo. USD LIBOR + 3.700%) | | | 8.087 | % | | | 11/27/31 | | | | 3,655,542 | | | | 3,509,766 | (a)(e) |
PMT Credit Risk Transfer Trust, 2021-1R A (1 mo. USD LIBOR + 2.900%) | | | 7.287 | % | | | 2/27/24 | | | | 7,185,950 | | | | 6,890,609 | (a)(e) |
Prime Mortgage Trust, 2006-DR1 2A1 | | | 5.500 | % | | | 5/25/35 | | | | 863,443 | | | | 742,594 | (a) |
RBSSP Resecuritization Trust, 2013-4 1A2 (1 mo. USD LIBOR + 1.500%) | | | 5.516 | % | | | 12/26/37 | | | | 18,067,145 | | | | 12,858,057 | (a)(e) |
See Notes to Financial Statements.
| | | | |
| Western Asset SMASh Series Core Plus Completion Fund 2022 Annual Report | | | | 31 |
Schedule of investments (cont’d)
December 31, 2022
Western Asset SMASh Series Core Plus Completion Fund
(Percentages shown based on Fund net assets)
| | | | | | | | | | | | | | | | |
| Security | | Rate | | | Maturity
Date | | | Face
Amount† | | | Value | |
| Collateralized Mortgage Obligations (i) — continued | | | | | | | | | | | | | |
Residential Accredit Loans Inc., 2007-QS7 1A7 (1 mo. USD LIBOR + 0.550%) | | | 4.939 | % | | | 5/25/37 | | | | 4,542,709 | | | $ | 3,358,596 | (e) |
SFO Commercial Mortgage Trust, 2021-555 D (1 mo. USD LIBOR + 2.400%) | | | 6.718 | % | | | 5/15/38 | | | | 7,960,000 | | | | 6,885,339 | (a)(e) |
Soho Trust, 2021-SOHO C | | | 2.697 | % | | | 8/10/38 | | | | 15,108,500 | | | | 10,219,014 | (a)(e) |
TBW Mortgage-Backed Pass- Through Certificates, 2006-3 4A3, IO (-1.000 x 1 mo. USD LIBOR + 7.100%) | | | 2.711 | % | | | 7/25/36 | | | | 18,810,633 | | | | 1,095,543 | (e) |
Wells Fargo Commercial Mortgage Trust, 2014-LC16 A5 | | | 3.817 | % | | | 8/15/50 | | | | 980,000 | | | | 951,906 | |
WFRBS Commercial Mortgage Trust, 2014-C24 AS | | | 3.931 | % | | | 11/15/47 | | | | 1,270,000 | | | | 1,211,381 | |
WFRBS Commercial Mortgage Trust, 2014-C24 C | | | 4.290 | % | | | 11/15/47 | | | | 1,630,000 | | | | 1,325,878 | (e) |
Total Collateralized Mortgage Obligations (Cost — $532,359,704) | | | | 479,680,154 | |
| Asset-Backed Securities — 3.7% | | | | | | | | | | | | | | | | |
Accredited Mortgage Loan Trust, 2006-2 M1 (1 mo. USD LIBOR + 0.270%) | | | 4.659 | % | | | 9/25/36 | | | | 16,246,000 | | | | 14,785,808 | (e) |
Bravo Mortgage Asset Trust, 2006-1A M1 (1 mo. USD LIBOR + 0.600%) | | | 4.989 | % | | | 7/25/36 | | | | 29,530,292 | | | | 25,087,932 | (a)(e) |
CIT Mortgage Loan Trust, 2007-1 1M1 (1 mo. USD LIBOR + 1.500%) | | | 5.889 | % | | | 10/25/37 | | | | 8,350,000 | | | | 7,951,288 | (a)(e) |
Fremont Home Loan Trust, 2006-B 1A (1 mo. USD LIBOR + 0.300%) | | | 4.689 | % | | | 8/25/36 | | | | 15,051,944 | | | | 6,377,751 | (e) |
GSAMP Trust, 2005-SEA1 M2 (1 mo. USD LIBOR + 1.350%) | | | 5.739 | % | | | 1/25/35 | | | | 3,613,103 | | | | 3,575,067 | (a)(e) |
Home Equity Asset Trust, 2005-6 M5 (1 mo. USD LIBOR + 0.945%) | | | 5.334 | % | | | 12/25/35 | | | | 2,980,000 | | | | 2,752,387 | (e) |
JPMorgan Mortgage Acquisition Trust, 2007-CH4 M2 (1 mo. USD LIBOR + 0.240%) | | | 4.629 | % | | | 5/25/37 | | | | 12,625,000 | | | | 11,247,931 | (e) |
KREF Ltd., 2021-FL2 D (1 mo. USD LIBOR + 2.200%) | | | 6.526 | % | | | 2/15/39 | | | | 3,130,000 | | | | 2,980,062 | (a)(e) |
Morgan Stanley ABS Capital Inc. Trust, 2004-HE7 M1 (1 mo. USD LIBOR + 0.900%) | | | 5.289 | % | | | 8/25/34 | | | | 5,912,536 | | | | 5,509,936 | (e) |
See Notes to Financial Statements.
| | | | |
32 | | | | Western Asset SMASh Series Core Plus Completion Fund 2022 Annual Report |
Western Asset SMASh Series Core Plus Completion Fund
(Percentages shown based on Fund net assets)
| | | | | | | | | | | | | | | | |
| Security | | Rate | | | Maturity
Date | | | Face
Amount† | | | Value | |
| Asset-Backed Securities — continued | | | | | | | | | | | | | |
PFCA Home Equity Investment Trust, 2003-IFC5 A | | | 4.489 | % | | | 1/22/35 | | | | 8,495,446 | | | $ | 8,423,613 | (a)(e) |
RAMP Trust, 2006-RZ3 M1 (1 mo. USD LIBOR + 0.350%) | | | 4.739 | % | | | 8/25/36 | | | | 6,830,270 | | | | 6,589,087 | (e) |
Total Asset-Backed Securities (Cost — $102,492,216) | | | | 95,280,862 | |
| U.S. Government & Agency Obligations — 1.1% | | | | | | | | | |
U.S. Government Obligations — 1.1% | | | | | | | | | | | | | |
U.S. Treasury Bonds | | | 4.000 | % | | | 11/15/42 | | | | 22,590,000 | | | | 22,124,081 | |
U.S. Treasury Bonds | | | 3.750 | % | | | 11/15/43 | | | | 4,420,000 | | | | 4,146,858 | (j)(k) |
U.S. Treasury Bonds | | | 3.000 | % | | | 8/15/52 | | | | 2,310,000 | | | | 1,903,945 | |
Total U.S. Government & Agency Obligations (Cost — $29,670,888) | | | | 28,174,884 | |
| | | | |
| | | Expiration
Date | | | Contracts | | | Notional
Amount† | | | | |
| Purchased Options — 0.2% | | | | | | | | | | | | | | | | |
| Exchange-Traded Purchased Options — 0.2% | | | | | | | | | | | | | |
| Australian Dollar Futures, Call @ $68.00 | | | 2/3/23 | | | | 54 | | | | 54,000 | | | | 68,040 | |
| Euro-Bund Futures, Call @ 133.50 EUR | | | 1/27/23 | | | | 108 | | | | 10,800,000 | EUR | | | 142,198 | |
| SOFR 1-Year Mid-Curve Futures, Put @ $95.63 | | | 1/13/23 | | | | 4,061 | | | | 10,152,500 | | | | 533,006 | |
| SOFR 1-Year Mid-Curve Futures, Put @ $95.88 | | | 1/13/23 | | | | 4,162 | | | | 10,405,000 | | | | 1,508,725 | |
| U.S. Treasury 5-Year Notes Futures, Call @ $108.00 | | | 1/27/23 | | | | 319 | | | | 319,000 | | | | 191,899 | |
| U.S. Treasury 5-Year Notes Futures, Call @ $108.25 | | | 1/27/23 | | | | 360 | | | | 360,000 | | | | 174,375 | |
| U.S. Treasury 5-Year Notes Futures, Call @ $108.75 | | | 1/27/23 | | | | 236 | | | | 236,000 | | | | 70,063 | |
| U.S. Treasury 5-Year Notes Futures, Call @ $109.50 | | | 1/27/23 | | | | 367 | | | | 367,000 | | | | 48,742 | |
| U.S. Treasury 10-Year Notes Futures, Call @ $112.25 | | | 1/27/23 | | | | 160 | | | | 160,000 | | | | 155,000 | |
| U.S. Treasury 10-Year Notes Futures, Call @ $112.50 | | | 1/27/23 | | | | 320 | | | | 320,000 | | | | 270,000 | |
| U.S. Treasury 10-Year Notes Futures, Call @ $112.75 | | | 1/27/23 | | | | 127 | | | | 127,000 | | | | 91,281 | |
| U.S. Treasury 10-Year Notes Futures, Call @ $114.00 | | | 1/27/23 | | | | 541 | | | | 541,000 | | | | 169,063 | |
See Notes to Financial Statements.
| | | | |
| Western Asset SMASh Series Core Plus Completion Fund 2022 Annual Report | | | | 33 |
Schedule of investments (cont’d)
December 31, 2022
Western Asset SMASh Series Core Plus Completion Fund
(Percentages shown based on Fund net assets)
| | | | | | | | | | | | | | | | |
| Security | | Expiration
Date | | | Contracts | | | Notional
Amount† | | | Value | |
| Exchange-Traded Purchased Options — continued | | | | | |
U.S. Treasury 10-Year Notes Futures, Put @ $112.00 | | | 1/27/23 | | | | 320 | | | | 320,000 | | | $ | 255,000 | |
U.S. Treasury 10-Year Notes Futures, Put @ $112.25 | | | 1/27/23 | | | | 119 | | | | 119,000 | | | | 109,703 | |
U.S. Treasury 10-Year Notes Futures, Put @ $113.00 | | | 1/27/23 | | | | 88 | | | | 88,000 | | | | 115,500 | |
U.S. Treasury Long-Term Bonds Futures, Call @ $125.00 | | | 1/27/23 | | | | 80 | | | | 80,000 | | | | 167,500 | |
U.S. Treasury Long-Term Bonds Futures, Call @ $126.00 | | | 1/27/23 | | | | 120 | | | | 120,000 | | | | 189,375 | |
U.S. Treasury Long-Term Bonds Futures, Call @ $129.00 | | | 1/27/23 | | | | 38 | | | | 38,000 | | | | 22,563 | |
U.S. Treasury Long-Term Bonds Futures, Call @ $131.00 | | | 1/27/23 | | | | 117 | | | | 117,000 | | | | 34,734 | |
Total Purchased Options (Cost — $6,416,478) | | | | | | | | 4,316,767 | |
Total Investments before Short-Term Investments (Cost — $2,496,506,376) | | | | 2,193,779,228 | |
| | | | |
| | | Rate | | | | | | Shares | | | | |
| Short-Term Investments — 8.9% | | | | | | | | | | | | | | | | |
BNY Mellon Cash Reserve Fund (Cost — $230,160,089) | | | 2.000 | % | | | | | | | 230,160,089 | | | | 230,160,089 | (l) |
Total Investments — 93.2% (Cost — $2,726,666,465) | | | | 2,423,939,317 | |
Other Assets in Excess of Liabilities — 6.8% | | | | | | | | 177,330,122 | |
Total Net Assets — 100.0% | | | | | | | | | | | | | | $ | 2,601,269,439 | |
See Notes to Financial Statements.
| | | | |
34 | | | | Western Asset SMASh Series Core Plus Completion Fund 2022 Annual Report |
Western Asset SMASh Series Core Plus Completion Fund
| † | Face amount/notional amount denominated in U.S. dollars, unless otherwise noted. |
| †† | Represents less than 0.1%. |
| * | Non-income producing security. |
| (a) | Security is exempt from registration under Rule 144A of the Securities Act of 1933. This security may be resold in transactions that are exempt from registration, normally to qualified institutional buyers. This security has been deemed liquid pursuant to guidelines approved by the Board of Trustees. |
| (b) | Security is exempt from registration under Regulation S of the Securities Act of 1933. Regulation S applies to securities offerings that are made outside of the United States and do not involve direct selling efforts in the United States. This security has been deemed liquid pursuant to guidelines approved by the Board of Trustees. |
| (c) | The coupon payment on this security is currently in default as of December 31, 2022. |
| (d) | Security has no maturity date. The date shown represents the next call date. |
| (e) | Variable rate security. Interest rate disclosed is as of the most recent information available. Certain variable rate securities are not based on a published reference rate and spread but are determined by the issuer or agent and are based on current market conditions. These securities do not indicate a reference rate and spread in their description above. |
| (f) | Interest rates disclosed represent the effective rates on senior loans. Ranges in interest rates are attributable to multiple contracts under the same loan. |
| (g) | Senior loans may be considered restricted in that the Fund ordinarily is contractually obligated to receive approval from the agent bank and/or borrower prior to the disposition of a senior loan. |
| (h) | All or a portion of this loan is unfunded as of December 31, 2022. The interest rate for fully unfunded term loans is to be determined. |
| (i) | Collateralized mortgage obligations are secured by an underlying pool of mortgages or mortgage pass-through certificates that are structured to direct payments on underlying collateral to different series or classes of the obligations. The interest rate may change positively or inversely in relation to one or more interest rates, financial indices or other financial indicators and may be subject to an upper and/or lower limit. |
| (j) | All or a portion of this security is held at the broker as collateral for open centrally cleared swap contracts. |
| (k) | All or a portion of this security is held at the broker as collateral for open futures contracts and exchange-traded options. |
| (l) | Rate shown is one-day yield as of the end of the reporting period. |
See Notes to Financial Statements.
| | | | |
| Western Asset SMASh Series Core Plus Completion Fund 2022 Annual Report | | | | 35 |
Schedule of investments (cont’d)
December 31, 2022
Western Asset SMASh Series Core Plus Completion Fund
| | |
Abbreviation(s) used in this schedule: |
| |
| BRL | | — Brazilian Real |
| |
| CAS | | — Connecticut Avenue Securities |
| |
| CNH | | — Chinese Offshore Yuan |
| |
| CNY | | — Chinese Yuan Renminbi |
| |
| EUR | | — Euro |
| |
| IDR | | — Indonesian Rupiah |
| |
| IO | | — Interest Only |
| |
| JSC | | — Joint Stock Company |
| |
| LIBOR | | — London Interbank Offered Rate |
| |
| MXN | | — Mexican Peso |
| |
| OFZ | | — Obligatsyi Federal’novo Zaima (Russian Federal Loan Obligation) |
| |
| REMIC | | — Real Estate Mortgage Investment Conduit |
| |
| Re-REMIC | | — Resecuritization of Real Estate Mortgage Investment Conduit |
| |
| RUB | | — Russian Ruble |
| |
| SOFR | | — Secured Overnight Financing Rate |
| |
| USD | | — United States Dollar |
At December 31, 2022, the Fund had the following written options contracts:
| | | | | | | | | | | | | | | | | | | | |
| Exchange-Traded Written Options | |
| Security | | Expiration
Date | | | Strike
Price | | | Contracts | | | Notional
Amount† | | | Value | |
| Euro-Bund Futures, Call | | | 1/27/23 | | | | 134.00 | EUR | | | 163 | | | | 16,300,000 | EUR | | $ | (177,973 | ) |
| Euro-Bund Futures, Put | | | 1/27/23 | | | | 136.00 | EUR | | | 318 | | | | 31,800,000 | EUR | | | (1,194,815 | ) |
| Euro-Bund Futures, Put | | | 1/27/23 | | | | 138.00 | EUR | | | 106 | | | | 10,600,000 | EUR | | | (594,571 | ) |
| U.S. Treasury 5-Year Notes Futures, Call | | | 1/27/23 | | | $ | 108.50 | | | | 599 | | | | 599,000 | | | | (229,305 | ) |
| U.S. Treasury 5-Year Notes Futures, Call | | | 1/27/23 | | | | 109.75 | | | | 395 | | | | 395,000 | | | | (40,117 | ) |
| U.S. Treasury 5-Year Notes Futures, Put | | | 1/27/23 | | | | 109.00 | | | | 779 | | | | 779,000 | | | | (1,010,266 | ) |
| U.S. Treasury 10-Year Notes Futures, Call | | | 1/27/23 | | | | 113.50 | | | | 233 | | | | 233,000 | | | | (101,938 | ) |
| U.S. Treasury 10-Year Notes Futures, Call | | | 1/27/23 | | | | 113.75 | | | | 160 | | | | 160,000 | | | | (60,000 | ) |
| U.S. Treasury 10-Year Notes Futures, Call | | | 1/27/23 | | | | 114.25 | | | | 159 | | | | 159,000 | | | | (39,750 | ) |
| U.S. Treasury 10-Year Notes Futures, Call | | | 1/27/23 | | | | 114.50 | | | | 355 | | | | 355,000 | | | | (72,109 | ) |
| U.S. Treasury 10-Year Notes Futures, Call | | | 1/27/23 | | | | 115.00 | | | | 503 | | | | 503,000 | | | | (70,734 | ) |
| U.S. Treasury 10-Year Notes Futures, Call | | | 1/27/23 | | | | 115.50 | | | | 940 | | | | 940,000 | | | | (102,812 | ) |
See Notes to Financial Statements.
| | | | |
36 | | | | Western Asset SMASh Series Core Plus Completion Fund 2022 Annual Report |
Western Asset SMASh Series Core Plus Completion Fund
| | | | | | | | | | | | | | | | | | | | |
| Exchange-Traded Written Options (cont’d) | |
Security | | Expiration Date | | | Strike Price | | | Contracts | | | Notional Amount† | | | Value | |
| U.S. Treasury 10-Year Notes Futures, Call | | | 1/27/23 | | | $ | 116.00 | | | | 585 | | | | 585,000 | | | $ | (45,703 | ) |
| U.S. Treasury 10-Year Notes Futures, Put | | | 1/27/23 | | | | 114.00 | | | | 862 | | | | 862,000 | | | | (1,737,469 | ) |
| U.S. Treasury Long-Term Bonds Futures, Call | | | 1/27/23 | | | | 125.50 | | | | 1 | | | | 1,000 | | | | (1,828 | ) |
| U.S. Treasury Long-Term Bonds Futures, Call | | | 1/27/23 | | | | 128.00 | | | | 518 | | | | 518,000 | | | | (437,062 | ) |
| U.S. Treasury Long-Term Bonds Futures, Call | | | 1/27/23 | | | | 132.00 | | | | 468 | | | | 468,000 | | | | (95,063 | ) |
| U.S. Treasury Long-Term Bonds Futures, Call | | | 1/27/23 | | | | 133.00 | | | | 78 | | | | 78,000 | | | | (12,188 | ) |
| U.S. Treasury Long-Term Bonds Futures, Put | | | 1/27/23 | | | | 130.00 | | | | 468 | | | | 468,000 | | | | (2,369,250 | ) |
| Total Exchange-Traded Written Options (Premiums received — $6,200,551) | | | $ | (8,392,953 | ) |
| † | Notional amount denominated in U.S. dollars, unless otherwise noted. |
| | |
Abbreviation(s) used in this schedule: |
| |
| EUR | | — Euro |
At December 31, 2022, the Fund had the following open futures contracts:
| | | | | | | | | | | | | | | | | | | | |
| | | Number of
Contracts | | | Expiration Date | | | Notional Amount | | | Market Value | | | Unrealized Appreciation (Depreciation) | |
| Contracts to Buy: | | | | | | | | | | | | | |
| 3-Month SOFR | | | 10 | | | | 9/23 | | | $ | 2,411,521 | | | $ | 2,376,000 | | | $ | (35,521) | |
| 3-Month SOFR | | | 4,085 | | | | 3/25 | | | | 988,261,244 | | | | 987,140,250 | | | | (1,120,994) | |
| 3-Month SOFR | | | 1,052 | | | | 3/26 | | | | 253,494,001 | | | | 254,636,600 | | | | 1,142,599 | |
| 90-Day Eurodollar | | | 1,298 | | | | 3/23 | | | | 308,503,575 | | | | 308,031,625 | | | | (471,950) | |
| 90-Day Eurodollar | | | 755 | | | | 9/23 | | | | 186,988,523 | | | | 179,170,937 | | | | (7,817,586) | |
| 90-Day Eurodollar | | | 12 | | | | 12/23 | | | | 2,905,975 | | | | 2,856,300 | | | | (49,675) | |
| Australian 10-Year Bonds | | | 1,371 | | | | 3/23 | | | | 114,193,901 | | | | 107,982,311 | | | | (6,211,590) | |
| Australian Dollar | | | 4,479 | | | | 3/23 | | | | 307,314,745 | | | | 305,848,515 | | | | (1,466,230) | |
| British Pound | | | 991 | | | | 3/23 | | | | 77,071,309 | | | | 74,845,275 | | | | (2,226,034) | |
| Euro | | | 795 | | | | 3/23 | | | | 106,554,364 | | | | 106,867,875 | | | | 313,511 | |
| Euro-Bobl | | | 777 | | | | 3/23 | | | | 99,812,496 | | | | 96,273,864 | | | | (3,538,632) | |
| Euro-Bund | | | 943 | | | | 3/23 | | | | 138,947,231 | | | | 134,184,108 | | | | (4,763,123) | |
| Euro-OAT | | | 555 | | | | 3/23 | | | | 81,469,612 | | | | 75,628,899 | | | | (5,840,713) | |
| Japanese Yen | | | 2,174 | | | | 3/23 | | | | 202,837,498 | | | | 209,437,725 | | | | 6,600,227 | |
See Notes to Financial Statements.
| | | | |
| Western Asset SMASh Series Core Plus Completion Fund 2022 Annual Report | | | | 37 |
Schedule of investments (cont’d)
December 31, 2022
Western Asset SMASh Series Core Plus Completion Fund
| | | | | | | | | | | | | | | | | | | | |
| | | Number of Contracts | | | Expiration Date | | | Notional Amount | | | Market Value | | | Unrealized Appreciation (Depreciation) | |
| Contracts to Buy continued | | | | | | | | | | | | | |
| Mexican Peso | | | 1,921 | | | | 3/23 | | | $ | 47,799,283 | | | $ | 48,620,511 | | | $ | 821,228 | |
| U.S. Treasury 5-Year Notes | | | 10,478 | | | | 3/23 | | | | 1,136,336,869 | | | | 1,130,887,292 | | | | (5,449,577) | |
| U.S. Treasury 10-Year Notes | | | 872 | | | | 3/23 | | | | 97,982,488 | | | | 97,922,879 | | | | (59,609) | |
| U.S. Treasury Long- Term Bonds | | | 779 | | | | 3/23 | | | | 99,546,603 | | | | 97,642,781 | | | | (1,903,822) | |
| U.S. Treasury Ultra Long-Term Bonds | | | 8,774 | | | | 3/23 | | | | 1,181,654,868 | | | | 1,178,457,875 | | | | (3,196,993) | |
| United Kingdom Long Gilt Bonds | | | 758 | | | | 3/23 | | | | 96,604,373 | | | | 91,546,772 | | | | (5,057,601) | |
| | | | | | | | | | | | | | | | | | | | (40,332,085) | |
| Contracts to Sell: | | | | | | | | | | | | | | | | | | | | |
| 30-Day Federal Funds | | | 2,516 | | | | 1/23 | | | | 1,002,963,534 | | | | 1,003,020,735 | | | | (57,201) | |
| 3-Month SOFR | | | 12,357 | | | | 3/24 | | | | 2,963,725,441 | | | | 2,949,306,975 | | | | 14,418,466 | |
| Euro-Buxl | | | 257 | | | | 3/23 | | | | 44,098,078 | | | | 37,205,288 | | | | 6,892,790 | |
| Japanese 10-Year Bonds | | | 164 | | | | 3/23 | | | | 184,991,457 | | | | 181,769,582 | | | | 3,221,875 | |
| U.S. Treasury 2-Year Notes | | | 3,072 | | | | 3/23 | | | | 630,160,210 | | | | 630,000,003 | | | | 160,207 | |
| U.S. Treasury Ultra 10-Year Notes | | | 1,906 | | | | 3/23 | | | | 226,175,378 | | | | 225,444,063 | | | | 731,315 | |
| | | | | | | | | | | | | | | | | | | | 25,367,452 | |
| Net unrealized depreciation on open futures contracts | | | $ | (14,964,633) | |
| | |
Abbreviation(s) used in this table: |
| |
| Bobl | | — Bundesobligation |
| |
| OAT | | — Obligations Assimilables du Trésor (French Treasury Bonds) |
| |
| SOFR | | — Secured Overnight Financing Rate |
At December 31, 2022, the Fund had the following open forward foreign currency contracts:
| | | | | | | | | | | | | | | | | | | | |
Currency Purchased | | | Currency Sold | | | Counterparty | | Settlement
Date | | | Unrealized Appreciation
(Depreciation) | |
| MXN | | | 290,000,000 | | | USD | | | 14,545,090 | | | Bank of America N.A. | | | 1/18/23 | | | $ | 282,602 | |
| MXN | | | 537,370,461 | | | USD | | | 26,375,305 | | | Bank of America N.A. | | | 1/18/23 | | | | 1,100,432 | |
| GBP | | | 9,800,000 | | | USD | | | 11,809,980 | | | Goldman Sachs Group Inc. | | | 1/18/23 | | | | 43,947 | |
| USD | | | 3,029,725 | | | GBP | | | 2,500,000 | | | Goldman Sachs Group Inc. | | | 1/18/23 | | | | 5,764 | |
| USD | | | 3,164,936 | | | GBP | | | 2,750,145 | | | Goldman Sachs Group Inc. | | | 1/18/23 | | | | (161,597) | |
See Notes to Financial Statements.
| | | | |
38 | | | | Western Asset SMASh Series Core Plus Completion Fund 2022 Annual Report |
Western Asset SMASh Series Core Plus Completion Fund
| | | | | | | | | | | | | | | | | | | | |
Currency Purchased | | | Currency Sold | | | Counterparty | | Settlement
Date | | | Unrealized Appreciation
(Depreciation) | |
| USD | | | 4,261,276 | | | GBP | | | 3,850,000 | | | Goldman Sachs Group Inc. | | | 1/18/23 | | | $ | (395,623) | |
| USD | | | 1,815,941 | | | JPY | | | 239,341,000 | | | Goldman Sachs Group Inc. | | | 1/18/23 | | | | (12,430) | |
| USD | | | 13,073,352 | | | JPY | | | 1,868,763,699 | | | Goldman Sachs Group Inc. | | | 1/18/23 | | | | (1,202,487) | |
| ZAR | | | 284,980,000 | | | USD | | | 15,820,796 | | | Goldman Sachs Group Inc. | | | 1/18/23 | | | | 922,630 | |
| CNH | | | 384,131,177 | | | USD | | | 53,957,071 | | | JPMorgan Chase & Co. | | | 1/18/23 | | | | 1,634,027 | |
| JPY | | | 10,010,488,040 | | | USD | | | 69,914,187 | | | JPMorgan Chase & Co. | | | 1/18/23 | | | | 6,557,822 | |
| NOK | | | 644,050,549 | | | EUR | | | 61,458,665 | | | JPMorgan Chase & Co. | | | 1/18/23 | | | | (83,105) | |
| USD | | | 76,566,011 | | | CNH | | | 544,108,700 | | | JPMorgan Chase & Co. | | | 1/18/23 | | | | (2,176,881) | |
| USD | | | 1,383,497 | | | CNY | | | 9,800,000 | | | JPMorgan Chase & Co. | | | 1/18/23 | | | | (28,383) | |
| USD | | | 6,640,098 | | | CNY | | | 47,323,979 | | | JPMorgan Chase & Co. | | | 1/18/23 | | | | (177,839) | |
| USD | | | 12,222,300 | | | CNY | | | 86,980,000 | | | JPMorgan Chase & Co. | | | 1/18/23 | | | | (308,855) | |
| USD | | | 61,020,682 | | | CNY | | | 432,240,000 | | | JPMorgan Chase & Co. | | | 1/18/23 | | | | (1,251,869) | |
| USD | | | 9,152,782 | | | IDR | | | 139,891,117,624 | | | JPMorgan Chase & Co. | | | 1/18/23 | | | | 168,557 | |
| USD | | | 15,475,293 | | | IDR | | | 236,075,600,000 | | | JPMorgan Chase & Co. | | | 1/18/23 | | | | 313,815 | |
| AUD | | | 73,895,636 | | | USD | | | 47,736,581 | | | Morgan Stanley & Co. Inc. | | | 1/18/23 | | | | 2,615,708 | |
| CAD | | | 443,820,238 | | | USD | | | 325,007,314 | | | Morgan Stanley & Co. Inc. | | | 1/18/23 | | | | 2,807,226 | |
| EUR | | | 3,700,000 | | | USD | | | 3,937,986 | | | Morgan Stanley & Co. Inc. | | | 1/18/23 | | | | 27,981 | |
| EUR | | | 3,950,000 | | | USD | | | 3,865,054 | | | Morgan Stanley & Co. Inc. | | | 1/18/23 | | | | 368,885 | |
| EUR | | | 7,454,501 | | | USD | | | 7,489,835 | | | Morgan Stanley & Co. Inc. | | | 1/18/23 | | | | 500,519 | |
| INR | | | 1,625,339,626 | | | USD | | | 19,705,266 | | | Morgan Stanley & Co. Inc. | | | 1/18/23 | | | | (80,301) | |
| USD | | | 11,198,436 | | | CAD | | | 15,348,240 | | | Morgan Stanley & Co. Inc. | | | 1/18/23 | | | | (138,083) | |
| USD | | | 16,301,473 | | | CAD | | | 22,449,900 | | | Morgan Stanley & Co. Inc. | | | 1/18/23 | | | | (280,474) | |
| USD | | | 27,015,334 | | | CAD | | | 37,086,920 | | | Morgan Stanley & Co. Inc. | | | 1/18/23 | | | | (377,810) | |
| USD | | | 71,672,003 | | | CNH | | | 514,820,000 | | | Morgan Stanley & Co. Inc. | | | 1/18/23 | | | | (2,832,256) | |
| USD | | | 3,484,081 | | | EUR | | | 3,300,000 | | | Morgan Stanley & Co. Inc. | | | 1/18/23 | | | | (53,134) | |
| USD | | | 7,616,053 | | | EUR | | | 7,300,000 | | | Morgan Stanley & Co. Inc. | | | 1/18/23 | | | | (208,694) | |
| USD | | | 75,707,922 | | | GBP | | | 62,882,945 | | | Morgan Stanley & Co. Inc. | | | 1/18/23 | | | | (354,305) | |
| USD | | | 127,975,331 | | | JPY | | | 16,960,954,500 | | | Morgan Stanley & Co. Inc. | | | 1/18/23 | | | | (1,592,605) | |
| Total | | | | | | | | | | | | $ | 5,633,184 | |
See Notes to Financial Statements.
| | | | |
| Western Asset SMASh Series Core Plus Completion Fund 2022 Annual Report | | | | 39 |
Schedule of investments (cont’d)
December 31, 2022
Western Asset SMASh Series Core Plus Completion Fund
| | |
Abbreviation(s) used in this table: |
| |
| AUD | | — Australian Dollar |
| |
| CAD | | — Canadian Dollar |
| |
| CNH | | — Chinese Offshore Yuan |
| |
| CNY | | — Chinese Yuan Renminbi |
| |
| EUR | | — Euro |
| |
| GBP | | — British Pound |
| |
| IDR | | — Indonesian Rupiah |
| |
| INR | | — Indian Rupee |
| |
| JPY | | — Japanese Yen |
| |
| MXN | | — Mexican Peso |
| |
| NOK | | — Norwegian Krone |
| |
| USD | | — United States Dollar |
| |
| ZAR | | — South African Rand |
At December 31, 2022, the Fund had the following open swap contracts:
| | | | | | | | | | | | | | | | | | |
| CENTRALLY CLEARED INTEREST RATE SWAPS | |
Notional Amount* | | | Termination Date | | | Payments Made by the Fund† | | Payments Received by the Fund† | | Upfront Premiums
Paid (Received) | | | Unrealized Appreciation (Depreciation) | |
| | 452,327,000 | | | | 8/15/28 | | | 1.130% annually | | Daily SOFR Compound annually | | $ | 2,267,946 | | | $ | 55,372,849 | |
| | 719,995,000 | | | | 2/15/29 | | | 2.850% annually | | Daily SOFR Compound annually | | | 15,914,583 | | | | 16,255,235 | |
| | 141,813,000 | | | | 4/30/29 | | | 3.270% annually | | Daily SOFR Compound annually | | | (1,608,482 | ) | | | 4,383,736 | |
| | 193,808,000 | | | | 6/30/29 | | | 3.850% annually | | Daily SOFR Compound annually | | | 192,434 | | | | (2,420,383 | ) |
| | 1,482,510,000 | MXN | | | 7/18/29 | | | 28-Day MXN TIIE - Banxico every 28 days | | 7.450% every 28 days | | | 418,552 | | | | (5,299,076 | ) |
| | 1,560,270,000 | MXN | | | 7/20/29 | | | 28-Day MXN TIIE - Banxico every 28 days | | 7.440% every 28 days | | | 534,064 | | | | (5,712,395 | ) |
| | 80,113,000 | | | | 3/18/32 | | | 2.000% annually | | Daily SOFR Compound annually | | | 649,374 | | | | 8,890,411 | |
| | 213,837,000 | | | | 2/15/47 | | | 1.520% annually | | Daily SOFR Compound annually | | | (5,342,490 | ) | | | 68,188,880 | |
See Notes to Financial Statements.
| | | | |
40 | | | | Western Asset SMASh Series Core Plus Completion Fund 2022 Annual Report |
Western Asset SMASh Series Core Plus Completion Fund
| | | | | | | | | | | | | | | | | | |
| | | | CENTRALLY CLEARED INTEREST RATE SWAPS (cont’d) | |
Notional
Amount* | | | Termination
Date | | | Payments
Made by
the Fund† | | Payments
Received by
the Fund† | | Upfront
Premiums
Paid
(Received) | | | Unrealized
Appreciation
(Depreciation) | |
| | 13,280,000 | | | | 2/15/47 | | | 1.729% annually | | Daily SOFR Compound annually | | | — | | | $ | 3,450,871 | |
| | 56,426,000 | | | | 8/15/47 | | | 1.650% annually | | Daily SOFR Compound annually | | $ | 5,672,650 | | | | 9,806,200 | |
| | 70,733,000 | | | | 2/15/48 | | | 2.600% annually | | Daily SOFR Compound annually | | | 4,862,040 | | | | 3,371,181 | |
| | 28,722,000 | | | | 2/15/48 | | | 2.620% annually | | Daily SOFR Compound annually | | | 32,740 | | | | 3,215,154 | |
| | 53,810,000 | | | | 2/15/48 | | | 3.050% annually | | Daily SOFR Compound annually | | | 1,658,769 | | | | 811,618 | |
| | 67,210,000 | | | | 4/21/52 | | | 2.500% annually | | Daily SOFR Compound annually | | | 114,960 | | | | 8,507,439 | |
| | Total | | | | | | | | | | | $ | 25,367,140 | | | $ | 168,821,720 | |
| | | | | | | | | | | | | | | | | | | | | | | | | | |
| CENTRALLY CLEARED CREDIT DEFAULT SWAPS ON CORPORATE ISSUES — SELL PROTECTION1 | |
| Reference Entity | | Notional
Amount2 | | | Termination
Date | | | Implied Credit Spread at December 31,
20223 | | Periodic
Payments
Received by the Fund† | | | Market Value | | | Upfront
Premiums
Paid
(Received) | | | Unrealized
Appreciation (Depreciation) | |
| Apache Corp., 4.875%,due 11/15/27 | | $ | 9,404,000 | | | | 6/20/26 | | | 1.563% | | | 1.000% quarterly | | | $ | (166,389) | | | $ | (328,106) | | | $ | 161,717 | |
| Apache Corp., 4.875%,due 11/15/27 | | | 26,989,000 | | | | 12/20/26 | | | 1.696% | | | 1.000% quarterly | | | | (664,148) | | | | (644,033) | | | | (20,115) | |
| Total | | $ | 36,393,000 | | | | | | | | | | | | | $ | (830,537) | | | $ | (972,139) | | | $ | 141,602 | |
See Notes to Financial Statements.
| | | | |
| Western Asset SMASh Series Core Plus Completion Fund 2022 Annual Report | | | | 41 |
Schedule of investments (cont’d)
December 31, 2022
Western Asset SMASh Series Core Plus Completion Fund
| | | | | | | | | | | | | | | | | | | | | | |
| CENTRALLY CLEARED CREDIT DEFAULT SWAPS ON CREDIT INDICES — SELL PROTECTION1 | |
| Reference Entity | | Notional Amount2 | | | Termination
Date | | | Periodic
Payments
Received by the Fund† | | Market Value4 | | | Upfront
Premiums Paid (Received) | | | Unrealized
Appreciation (Depreciation) | |
| Markit CDX.NA.HY.39 Index | | $ | 40,473,200 | | | | 12/20/27 | | | 5.000% quarterly | | $ | 235,718 | | | $ | 765,313 | | | $ | (529,595) | |
| Markit CDX.NA.IG.39 Index | | | 1,445,348,000 | | | | 12/20/27 | | | 1.000% quarterly | | | 11,519,525 | | | | (1,951,180) | | | | 13,470,705 | |
| Total | | $ | 1,485,821,200 | | | | | | | | | $ | 11,755,243 | | | $ | (1,185,867) | | | $ | 12,941,110 | |
| | | | | | | | | | | | | | | | | | | | |
| OTC TOTAL RETURN SWAPS | |
Swap Counterparty | | Notional Amount | | | Termination Date | | | Periodic Payments Made by the Fund‡ | | Periodic Payments Received by the Fund† | | Upfront Premiums Paid (Received) | | | Unrealized Depreciation | |
| JPMorgan Chase & Co. | | $ | 55,560,000 | | | | 8/21/23 | | | Daily SOFR Compound + 0.100%** | | U.S. Treasury
Bonds, 2.375%,
due May 15,
2051** | | | — | | | $ | (7,408,267) | |
See Notes to Financial Statements.
| | | | |
42 | | | | Western Asset SMASh Series Core Plus Completion Fund 2022 Annual Report |
Western Asset SMASh Series Core Plus Completion Fund
| 1 | If the Fund is a seller of protection and a credit event occurs, as defined under the terms of that particular swap agreement, the Fund will either (i) pay to the buyer of protection an amount equal to the notional amount of the swap and take delivery of the referenced obligation or underlying securities comprising the referenced index or (ii) pay a net settlement amount in the form of cash or securities equal to the notional amount of the swap less the recovery value of the referenced obligation or underlying securities comprising the referenced index. |
| 2 | The maximum potential amount the Fund could be required to pay as a seller of credit protection or receive as a buyer of credit protection if a credit event occurs as defined under the terms of that particular swap agreement. |
| 3 | Implied credit spreads, utilized in determining the market value of credit default swap agreements on corporate or sovereign issues as of period end, serve as an indicator of the current status of the payment/performance risk and represent the likelihood or risk of default for the credit derivative. The implied credit spread of a particular referenced entity reflects the cost of buying/selling protection and may include upfront payments required to be made to enter into the agreement. Wider credit spreads represent a deterioration of the referenced entity’s credit soundness and a greater likelihood or risk of default or other credit event occurring as defined under the terms of the agreement. A credit spread identified as “Defaulted” indicates a credit event has occurred for the referenced entity or obligation. |
| 4 | The quoted market prices and resulting values for credit default swap agreements on asset-backed securities and credit indices serve as an indicator of the current status of the payment/performance risk and represent the likelihood of an expected loss (or profit) for the credit derivative had the notional amount of the swap agreement been closed/sold as of the period end. Decreasing market values (sell protection) or increasing market values (buy protection) when compared to the notional amount of the swap, represent a deterioration of the referenced entity’s credit soundness and a greater likelihood or risk of default or other credit event occurring as defined under the terms of the agreement. |
| † | Percentage shown is an annual percentage rate. |
| ‡ | Periodic payments made/received by the Fund are based on the total return of the referenced entity. |
| * | Notional amount denominated in U.S. dollars, unless otherwise noted. |
| ** | One time payment made at termination date. |
| | |
Abbreviation(s) used in this table: |
| |
| MXN | | — Mexican Peso |
| |
| SOFR | | — Secured Overnight Financing Rate |
| |
| TIIE | | — Equilibrium Interbanking Interest Rate (Tasa de Intere’s Interbancaria de Equilibrio) |
See Notes to Financial Statements.
| | | | |
| Western Asset SMASh Series Core Plus Completion Fund 2022 Annual Report | | | | 43 |
Statement of assets and liabilities
December 31, 2022
| | | | |
| Assets: | | | |
Investments, at value (Cost — $2,726,666,465) | | $ | 2,423,939,317 | |
Foreign currency, at value (Cost — $15,494,750) | | | 15,728,378 | |
Deposits with brokers for centrally cleared swap contracts | | | 99,414,470 | |
Deposits with brokers for open futures contracts and exchange-traded options | | | 46,229,401 | |
Foreign currency collateral for open futures contracts and exchange-traded options, at value (Cost — $25,034,183) | | | 26,674,636 | |
Interest receivable | | | 19,392,972 | |
Unrealized appreciation on forward foreign currency contracts | | | 17,349,915 | |
Deposits with brokers for OTC derivatives | | | 8,560,000 | |
Receivable for securities sold | | | 8,009,345 | |
Receivable for Fund shares sold | | | 3,648,303 | |
Receivable for premiums on written options | | | 761,197 | |
Receivable from investment manager | | | 24,021 | |
Prepaid expenses | | | 181 | |
Total Assets | | | 2,669,732,136 | |
| |
| Liabilities: | | | | |
Payable for securities purchased | | | 31,967,441 | |
Unrealized depreciation on forward foreign currency contracts | | | 11,716,731 | |
Written options, at value (premiums received — $6,200,551) | | | 8,392,953 | |
OTC swaps, at value (premiums received — $0) | | | 7,408,267 | |
Payable for Fund shares repurchased | | | 3,753,040 | |
Payable to brokers — net variation margin on centrally cleared swap contracts | | | 3,025,503 | |
Payable to brokers — net variation margin on open futures contracts | | | 758,577 | |
Payable for open OTC swap contracts | | | 595,156 | |
Payable to broker for option premiums | | | 383,521 | |
Accrued foreign capital gains tax | | | 136,798 | |
Trustees’ fees payable | | | 14,907 | |
Accrued expenses | | | 309,803 | |
Total Liabilities | | | 68,462,697 | |
| Total Net Assets | | $ | 2,601,269,439 | |
| |
| Net Assets: | | | | |
Par value (Note 5) | | $ | 4,165 | |
Paid-in capital in excess of par value | | | 3,874,912,489 | |
Total distributable earnings (loss) | | | (1,273,647,215) | |
| Total Net Assets | | $ | 2,601,269,439 | |
| |
| Shares Outstanding | | | 416,482,741 | |
| |
| Net Asset Value | | | $6.25 | |
See Notes to Financial Statements.
| | | | |
44 | | | | Western Asset SMASh Series Core Plus Completion Fund 2022 Annual Report |
Statements of operations
For the Period Ended December 31, 2022 and the Year Ended February 28, 2022
| | | | | | | | |
| | | 2022† | | | 2022 | |
| | |
| Investment Income: | | | | | | | | |
Interest | | $ | 121,096,456 | | | $ | 150,684,631 | |
Less: Foreign taxes withheld | | | — | | | | (1,655,710) | |
Total Investment Income | | | 121,096,456 | | | | 149,028,921 | |
| | |
| Expenses: | | | | | | | | |
Custody fees | | | 316,981 | | | | 286,181 | |
Fund accounting fees | | | 177,717 | | | | 243,552 | |
Registration fees | | | 94,212 | | | | 113,966 | |
Legal fees | | | 77,485 | | | | 96,859 | |
Trustees’ fees | | | 58,747 | | | | 63,112 | |
Audit and tax fees | | | 54,050 | | | | 54,000 | |
Transfer agent fees | | | 29,735 | | | | 38,837 | |
Interest expense | | | 28,681 | | | | 52,184 | |
Commitment fees (Note 6) | | | 26,033 | | | | 21,264 | |
Shareholder reports | | | 24,057 | | | | 28,411 | |
Commodity pool reports | | | 10,000 | | | | 7,333 | |
Insurance | | | — | | | | 16,384 | |
Miscellaneous expenses | | | 15,061 | | | | 6,648 | |
Total Expenses | | | 912,759 | | | | 1,028,731 | |
Less: Fee waivers and/or expense reimbursements (Note 2) | | | (912,759) | | | | (1,028,731) | |
Net Expenses | | | — | | | | — | |
| Net Investment Income | | | 121,096,456 | | | | 149,028,921 | |
| | |
Realized and Unrealized Gain (Loss) on Investments, Futures Contracts, Written Options, Swap Contracts, Forward Foreign Currency Contracts and Foreign Currency Transactions (Notes 1, 3 and 4): | | | | | | | | |
Net Realized Gain (Loss) From: | | | | | | | | |
Investment transactions | | | (199,737,157) | | | | (83,395,076) | |
Futures contracts | | | (1,127,046,744) | | | | (167,371,273) | |
Written options | | | 226,340,133 | | | | 93,430,305 | |
Swap contracts | | | 116,313,185 | | | | 59,840,492 | |
Forward foreign currency contracts | | | (80,936,012) | | | | 25,085,080 | |
Foreign currency transactions | | | (3,145,128) | | | | (1,054,504) | |
Net Realized Loss | | | (1,068,211,723) | | | | (73,464,976) | |
Change in Net Unrealized Appreciation (Depreciation) From: | | | | | | | | |
Investments | | | (164,109,161) | ‡ | | | (142,831,268) | ‡ |
Futures contracts | | | 50,992,221 | | | | (56,989,903) | |
Written options | | | 5,681,973 | | | | (8,827,908) | |
Swap contracts | | | 151,543,146 | | | | (20,127,629) | |
Forward foreign currency contracts | | | 69,389,133 | | | | (63,735,396) | |
Foreign currencies | | | 3,680,977 | | | | (3,648,424) | |
Change in Net Unrealized Appreciation (Depreciation) | | | 117,178,289 | | | | (296,160,528) | |
| Net Loss on Investments, Futures Contracts, Written Options, Swap Contracts, Forward Foreign Currency Contracts and Foreign Currency Transactions | | | (951,033,434) | | | | (369,625,504) | |
See Notes to Financial Statements.
| | | | |
| Western Asset SMASh Series Core Plus Completion Fund 2022 Annual Report | | | | 45 |
Statements of operations (cont’d)
For the Period Ended December 31, 2022 and the Year Ended February 28, 2022
| | | | | | | | |
| | | 2022† | | | 2022 | |
| Decrease in Net Assets From Operations | | $ | (829,936,978) | | | $ | (220,596,583) | |
| † | For the period March 1, 2022 through December 31, 2022. |
| ‡ | Net of change in accrued foreign capital gains tax of $(178,995) and $315,793 for the period and year ended December 31, 2022 and February 28, 2022, respectively. |
See Notes to Financial Statements.
| | | | |
46 | | | | Western Asset SMASh Series Core Plus Completion Fund 2022 Annual Report |
Statements of changes in net assets
| | | | | | | | | | | | |
For the Period Ended December 31, 2022 and the Years Ended February 28, | | 2022† | | | 2022 | | | 2021 | |
| | | |
| Operations: | | | | | | | | | | | | |
Net investment income | | $ | 121,096,456 | | | $ | 149,028,921 | | | $ | 109,193,113 | |
Net realized loss | | | (1,068,211,723) | | | | (73,464,976) | | | | (76,277,242) | |
Change in net unrealized appreciation (depreciation) | | | 117,178,289 | | | | (296,160,528) | | | | 32,848,581 | |
Increase (Decrease) in Net Assets From Operations | | | (829,936,978) | | | | (220,596,583) | | | | 65,764,452 | |
| | | |
| Distributions to Shareholders From (Note 1): | | | | | | | | | | | | |
Total distributable earnings | | | (17,375,196) | | | | (239,592,019) | | | | (23,159,641) | |
Return of capital | | | (4,227,285) | | | | — | | | | — | |
Decrease in Net Assets From Distributions to Shareholders | | | (21,602,481) | | | | (239,592,019) | | | | (23,159,641) | |
| | | |
| Fund Share Transactions (Note 5): | | | | | | | | | | | | |
Net proceeds from sale of shares | | | 1,048,234,756 | | | | 1,619,525,396 | | | | 1,570,734,058 | |
Cost of shares repurchased | | | (1,227,358,615) | | | | (962,085,023) | | | | (582,533,650) | |
Increase (Decrease) in Net Assets From Fund Share Transactions | | | (179,123,859) | | | | 657,440,373 | | | | 988,200,408 | |
Increase (Decrease) in Net Assets | | | (1,030,663,318) | | | | 197,251,771 | | | | 1,030,805,219 | |
| | | |
| Net Assets: | | | | | | | | | | | | |
Beginning of period | | | 3,631,932,757 | | | | 3,434,680,986 | | | | 2,403,875,767 | |
End of period | | $ | 2,601,269,439 | | | $ | 3,631,932,757 | | | $ | 3,434,680,986 | |
| † | For the period March 1, 2022 through December 31, 2022. |
See Notes to Financial Statements.
| | | | |
| Western Asset SMASh Series Core Plus Completion Fund 2022 Annual Report | | | | 47 |
Financial highlights
| | | | | | | | | | | | | | | | | | | | | | | | |
For a share of beneficial interest outstanding throughout each year ended December 31,
unless otherwise noted: | |
| | | 20221,2 | | | 20221,3 | | | 20211,3 | | | 20201,4 | | | 20191,3 | | | 20181,3 | |
| | | | | | |
| Net asset value, beginning of period | | | $8.07 | | | | $9.08 | | | | $9.27 | | | | $8.91 | | | | $9.18 | | | | $9.20 | |
| | | | | | |
| Income (loss) from operations: | | | | | | | | | | | | | | | | | | | | | | | | |
Net investment income | | | 0.27 | | | | 0.36 | | | | 0.33 | | | | 0.45 | | | | 0.44 | | | | 0.45 | |
Net realized and unrealized gain (loss) | | | (2.04) | | | | (0.80) | | | | (0.44) | | | | 0.69 | | | | (0.31) | | | | 0.23 | |
Total income (loss) from operations | | | (1.77) | | | | (0.44) | | | | (0.11) | | | | 1.14 | | | | 0.13 | | | | 0.68 | |
| | | | | | |
| Less distributions from: | | | | | | | | | | | | | | | | | | | | | | | | |
Net investment income | | | (0.04) | | | | (0.45) | | | | (0.06) | | | | (0.64) | | | | (0.40) | | | | (0.70) | |
Net realized gains | | | — | | | | (0.12) | | | | (0.02) | | | | (0.14) | | | | — | | | | — | |
Return of capital | | | (0.01) | | | | — | | | | — | | | | — | | | | — | | | | — | |
Total distributions | | | (0.05) | | | | (0.57) | | | | (0.08) | | | | (0.78) | | | | (0.40) | | | | (0.70) | |
| | | | | | |
| Net asset value, end of period | | | $6.25 | | | | $8.07 | | | | $9.08 | | | | $9.27 | | | | $8.91 | | | | $9.18 | |
Total return5 | | | (22.01) | % | | | (5.37) | % | | | (1.08) | % | | | 13.16 | % | | | 1.44 | % | | | 7.49 | % |
| | | | | | |
| Net assets, end of period (millions) | | | $2,601 | | | | $3,632 | | | | $3,435 | | | | $2,404 | | | | $1,845 | | | | $1,735 | |
| | | | | | |
| Ratios to average net assets: | | | | | | | | | | | | | | | | | | | | | | | | |
Gross expenses6 | | | 0.04 | %7 | | | 0.03 | % | | | 0.04 | % | | | 0.04 | % | | | 0.04 | % | | | 0.04 | % |
Net expenses8,9 | | | 0.00 | 7 | | | 0.00 | | | | 0.00 | | | | 0.00 | | | | 0.00 | | | | 0.00 | |
Net investment income | | | 4.76 | 7 | | | 3.96 | | | | 3.74 | | | | 4.88 | | | | 5.09 | | | | 4.80 | |
| | | | | | |
| Portfolio turnover rate | | | 53 | % | | | 106 | %10 | | | 69 | % | | | 31 | % | | | 37 | % | | | 26 | % |
| 1 | Per share amounts have been calculated using the average shares method. |
| 2 | For the period March 1, 2022 through December 31, 2022 |
| 3 | For the year ended February 28. |
| 4 | For the year ended February 29. |
| 5 | Performance figures do not reflect the effect of fees and expenses associated with a separately managed account, nor a management fee or other operating expenses of the Fund. Such management fees are paid directly or indirectly by the separately managed account sponsor to the Fund’s manager or subadvisers. All operating expenses of the Fund were reimbursed by the manager, pursuant to an expense reimbursement arrangement between the Fund and the manager. If such fees were included, the total return would have been lower. Past performance is no guarantee of future results. Total returns for periods of less than one year are not annualized. |
| 6 | Gross expenses do not include management fees paid to the manager and subadvisers. Management fees are paid directly or indirectly by the separately managed account sponsor. |
| 8 | The Fund’s manager has entered into an expense reimbursement arrangement with the Fund, pursuant to which the Fund’s manager has agreed to reimburse 100% of the Fund’s ordinary operating expenses. The expense reimbursement arrangement does not cover interest, brokerage, taxes and extraordinary expenses. This arrangement cannot be terminated prior to December 31, 2024 without the Board of Trustees’ consent. |
| 9 | Reflects fee waivers and/or expense reimbursements. |
| 10 | Excluding mortgage dollar roll transactions. If mortgage dollar roll transactions had been included, the portfolio turnover rate would have been 150% for the year ended February 28, 2022. |
See Notes to Financial Statements.
| | | | |
48 | | | | Western Asset SMASh Series Core Plus Completion Fund 2022 Annual Report |
Notes to financial statements
1. Organization and significant accounting policies
Western Asset SMASh Series Core Plus Completion Fund (the “Fund”) is a separate non-diversified investment series of Legg Mason Partners Institutional Trust (the “Trust”). The Trust, a Maryland statutory trust, is registered under the Investment Company Act of 1940, as amended (the “1940 Act”), as an open-end management investment company. At a meeting held in September 2022, the Fund’s Board of Trustees approved changing the Fund’s fiscal year end from February 28th to December 31st. This change resulted in a short-period annual report for the ten-month period from February 28th to December 31st.
Shares of the Fund may be purchased only by or on behalf of separately managed account clients where an affiliate of Legg Mason Partners Fund Advisor, LLC (“LMPFA”) has an agreement to serve as investment adviser or subadviser (each affiliate, a “Managed Account Adviser”) to the account with the managed account program sponsor (the “Program Sponsor”) (typically, a registered investment adviser or broker/dealer) or directly with the client. Shareholders of the Fund pay fees to their separately managed account sponsor, some of which are paid to affiliates of LMPFA. LMPFA and the subadvisers do not charge investment management fees to the Fund.
The Fund follows the accounting and reporting guidance in Financial Accounting Standards Board (“FASB”) Accounting Standards Codification Topic 946, Financial Services – Investment Companies (“ASC 946”). The following are significant accounting policies consistently followed by the Fund and are in conformity with U.S. generally accepted accounting principles (“GAAP”), including, but not limited to, ASC 946. Estimates and assumptions are required to be made regarding assets, liabilities and changes in net assets resulting from operations when financial statements are prepared. Changes in the economic environment, financial markets and any other parameters used in determining these estimates could cause actual results to differ. Subsequent events have been evaluated through the date the financial statements were issued.
(a) Investment valuation. The valuations for fixed income securities (which may include, but are not limited to, corporate, government, municipal, mortgage-backed, collateralized mortgage obligations and asset-backed securities) and certain derivative instruments are typically the prices supplied by independent third party pricing services, which may use market prices or broker/dealer quotations or a variety of valuation techniques and methodologies. The independent third party pricing services typically use inputs that are observable such as issuer details, interest rates, yield curves, prepayment speeds, credit risks/spreads, default rates and quoted prices for similar securities. Investments in open-end funds are valued at the closing net asset value per share of each fund on the day of valuation. Futures contracts are valued daily at the settlement price established by the board of trade or exchange on which they are traded. Equity securities for which market quotations are available are valued at the last reported sales price or official closing price on the primary market or exchange on which they trade. When the Fund holds securities or other assets that are denominated in a foreign currency, the Fund will normally use the
| | | | |
| Western Asset SMASh Series Core Plus Completion Fund 2022 Annual Report | | | | 49 |
Notes to financial statements (cont’d)
currency exchange rates as of 4:00 p.m. (Eastern Time). If independent third party pricing services are unable to supply prices for a portfolio investment, or if the prices supplied are deemed by the manager to be unreliable, the market price may be determined by the manager using quotations from one or more broker/dealers or at the transaction price if the security has recently been purchased and no value has yet been obtained from a pricing service or pricing broker. When reliable prices are not readily available, such as when the value of a security has been significantly affected by events after the close of the exchange or market on which the security is principally traded, but before the Fund calculates its net asset value, the Fund values these securities as determined in accordance with procedures approved by the Fund’s Board of Trustees.
Pursuant to policies adopted by the Board of Trustees, the Fund’s manager has been designated as the valuation designee and is responsible for the oversight of the daily valuation process. The Fund’s manager is assisted by the Global Fund Valuation Committee (the “Valuation Committee”). The Valuation Committee is responsible for making fair value determinations, evaluating the effectiveness of the Fund’s pricing policies, and reporting to the Fund’s manager and the Board of Trustees. When determining the reliability of third party pricing information for investments owned by the Fund, the Valuation Committee, among other things, conducts due diligence reviews of pricing vendors, monitors the daily change in prices and reviews transactions among market participants.
The Valuation Committee will consider pricing methodologies it deems relevant and appropriate when making fair value determinations. Examples of possible methodologies include, but are not limited to, multiple of earnings; discount from market of a similar freely traded security; discounted cash-flow analysis; book value or a multiple thereof; risk premium/yield analysis; yield to maturity; and/or fundamental investment analysis. The Valuation Committee will also consider factors it deems relevant and appropriate in light of the facts and circumstances. Examples of possible factors include, but are not limited to, the type of security; the issuer’s financial statements; the purchase price of the security; the discount from market value of unrestricted securities of the same class at the time of purchase; analysts’ research and observations from financial institutions; information regarding any transactions or offers with respect to the security; the existence of merger proposals or tender offers affecting the security; the price and extent of public trading in similar securities of the issuer or comparable companies; and the existence of a shelf registration for restricted securities.
For each portfolio security that has been fair valued pursuant to the policies adopted by the Board of Trustees, the fair value price is compared against the last available and next available market quotations. The Valuation Committee reviews the results of such back testing monthly and fair valuation occurrences are reported to the Board of Trustees quarterly.
The Fund uses valuation techniques to measure fair value that are consistent with the market approach and/or income approach, depending on the type of security and the
| | | | |
50 | | | | Western Asset SMASh Series Core Plus Completion Fund 2022 Annual Report |
particular circumstance. The market approach uses prices and other relevant information generated by market transactions involving identical or comparable securities. The income approach uses valuation techniques to discount estimated future cash flows to present value.
GAAP establishes a disclosure hierarchy that categorizes the inputs to valuation techniques used to value assets and liabilities at measurement date. These inputs are summarized in the three broad levels listed below:
| • | | Level 1 — unadjusted quoted prices in active markets for identical investments |
| • | | Level 2 — other significant observable inputs (including quoted prices for similar investments, interest rates, prepayment speeds, credit risk, etc.) |
| • | | Level 3 — significant unobservable inputs (including the Fund’s own assumptions in determining the fair value of investments) |
The inputs or methodologies used to value securities are not necessarily an indication of the risk associated with investing in those securities.
The following is a summary of the inputs used in valuing the Fund’s assets and liabilities carried at fair value:
| | | | | | | | | | | | | | | | |
| | | ASSETS | | | | | | | |
| Description | | Quoted Prices
(Level 1) | | | Other Significant
Observable Inputs
(Level 2) | | | Significant
Unobservable
Inputs (Level 3) | | | Total | |
| Long-Term Investments†: | | | | | | | | | | | | | | | | |
Sovereign Bonds | | | — | | | $ | 565,094,361 | | | | — | | | $ | 565,094,361 | |
Corporate Bonds & Notes | | | — | | | | 515,322,536 | | | | — | | | | 515,322,536 | |
Senior Loans | | | — | | | | 505,909,664 | | | | — | | | | 505,909,664 | |
Collateralized Mortgage Obligations | | | — | | | | 479,680,154 | | | | — | | | | 479,680,154 | |
Asset-Backed Securities | | | — | | | | 95,280,862 | | | | — | | | | 95,280,862 | |
U.S. Government & Agency Obligations | | | — | | | | 28,174,884 | | | | — | | | | 28,174,884 | |
Purchased Options | | $ | 4,316,767 | | | | — | | | | — | | | | 4,316,767 | |
| Total Long-Term Investments | | | 4,316,767 | | | | 2,189,462,461 | | | | — | | | | 2,193,779,228 | |
| Short-Term Investments† | | | — | | | | 230,160,089 | | | | — | | | | 230,160,089 | |
| Total Investments | | $ | 4,316,767 | | | $ | 2,419,622,550 | | | | — | | | $ | 2,423,939,317 | |
| | | | |
| Western Asset SMASh Series Core Plus Completion Fund 2022 Annual Report | | | | 51 |
Notes to financial statements (cont’d)
| | | | | | | | | | | | | | | | |
| | | ASSETS (cont’d) | | | | | | | |
| Description | | Quoted Prices
(Level 1) | | | Other Significant
Observable Inputs
(Level 2) | | | Significant
Unobservable
Inputs (Level 3) | | | Total | |
| Other Financial Instruments: | | | | | | | | | | | | | | | | |
Futures Contracts†† | | $ | 34,302,218 | | | | — | | | | — | | | $ | 34,302,218 | |
Forward Foreign Currency Contracts†† | | | — | | | $ | 17,349,915 | | | | — | | | | 17,349,915 | |
Centrally Cleared Interest Rate Swaps†† | | | — | | | | 182,253,574 | | | | — | | | | 182,253,574 | |
Centrally Cleared Credit Default Swaps on Corporate Issues — Sell Protection†† | | | — | | | | 161,717 | | | | — | | | | 161,717 | |
Centrally Cleared Credit Default Swaps on Credit Indices — Sell Protection†† | | | — | | | | 13,470,705 | | | | — | | | | 13,470,705 | |
| Total Other Financial Instruments | | $ | 34,302,218 | | | $ | 213,235,911 | | | | — | | | $ | 247,538,129 | |
| Total | | $ | 38,618,985 | | | $ | 2,632,858,461 | | | | — | | | $ | 2,671,477,446 | |
| | | |
| | | LIABILITIES | | | | | | | |
| Description | | Quoted Prices
(Level 1) | | | Other Significant
Observable Inputs
(Level 2) | | | Significant
Unobservable
Inputs (Level 3) | | | Total | |
| Other Financial Instruments: | | | | | | | | | | | | | | | | |
Written Options | | $ | 8,392,953 | | | | — | | | | — | | | $ | 8,392,953 | |
Futures Contracts†† | | | 49,266,851 | | | | — | | | | — | | | | 49,266,851 | |
Forward Foreign Currency Contracts†† | | | — | | | $ | 11,716,731 | | | | — | | | | 11,716,731 | |
Centrally Cleared Interest Rate Swaps†† | | | — | | | | 13,431,854 | | | | — | | | | 13,431,854 | |
Centrally Cleared Credit Default Swaps on Corporate Issues — Sell Protection†† | | | — | | | | 20,115 | | | | — | | | | 20,115 | |
Centrally Cleared Credit Default Swaps on Credit Indices — Sell Protection†† | | | — | | | | 529,595 | | | | — | | | | 529,595 | |
OTC Total Return Swaps‡ | | | — | | | | 7,408,267 | | | | — | | | | 7,408,267 | |
| Total | | $ | 57,659,804 | | | $ | 33,106,562 | | | | — | | | $ | 90,766,366 | |
| † | See Schedule of Investments for additional detailed categorizations. |
| †† | Reflects the unrealized appreciation (depreciation) of the instruments. |
| ‡ | Value includes any premium paid or received with respect to swap contracts. |
| | | | |
52 | | | | Western Asset SMASh Series Core Plus Completion Fund 2022 Annual Report |
(b) Purchased options. When the Fund purchases an option, an amount equal to the premium paid by the Fund is recorded as an investment on the Statement of Assets and Liabilities, the value of which is marked-to-market to reflect the current market value of the option purchased. If the purchased option expires, the Fund realizes a loss equal to the amount of premium paid. When an instrument is purchased or sold through the exercise of an option, the related premium paid is added to the basis of the instrument acquired or deducted from the proceeds of the instrument sold. The risk associated with purchasing put and call options is limited to the premium paid.
(c) Written options. When the Fund writes an option, an amount equal to the premium received by the Fund is recorded as a liability, the value of which is marked-to-market daily to reflect the current market value of the option written. If the option expires, the premium received is recorded as a realized gain. When a written call option is exercised, the difference between the premium received plus the option exercise price and the Fund’s basis in the underlying security (in the case of a covered written call option), or the cost to purchase the underlying security (in the case of an uncovered written call option), including brokerage commission, is recognized as a realized gain or loss. When a written put option is exercised, the amount of the premium received is subtracted from the cost of the security purchased by the Fund from the exercise of the written put option to form the Fund’s basis in the underlying security purchased. The writer or buyer of an option traded on an exchange can liquidate the position before the exercise of the option by entering into a closing transaction. The cost of a closing transaction is deducted from the original premium received resulting in a realized gain or loss to the Fund.
The risk in writing a covered call option is that the Fund may forego the opportunity of profit if the market price of the underlying security increases and the option is exercised. The risk in writing a put option is that the Fund may incur a loss if the market price of the underlying security decreases and the option is exercised. The risk in writing an uncovered call option is that the Fund is exposed to the risk of loss if the market price of the underlying security increases. In addition, there is the risk that the Fund may not be able to enter into a closing transaction because of an illiquid secondary market.
(d) Options on futures contracts. An option on a futures contract gives the purchaser the right, in return for the premium paid, to assume a position in the underlying futures contract at the specified option exercise price at any time prior to the expiration date of the option. Upon exercise of an option, the delivery of the futures position by the writer of the option to the holder of the option will be accompanied by delivery of the accumulated balance in the writer’s futures margin account that represents the amount by which the market price of the futures contract exceeds (in the case of a call) or is less than (in the case of a put) the exercise price of the option on the futures contract. The potential for loss related to the purchase of an option on a futures contract is limited to the premium paid for the option plus transaction costs. Because the value of the option is fixed at the point of purchase, there are no daily cash payments by the purchaser to reflect changes in the value of the
| | | | |
| Western Asset SMASh Series Core Plus Completion Fund 2022 Annual Report | | | | 53 |
Notes to financial statements (cont’d)
underlying contract; however, the value of the option changes daily and that change would be reflected in the net asset value of the Fund. The potential for loss related to writing call options is unlimited. The potential for loss related to writing put options is limited only by the aggregate strike price of the put option less the premium received.
(e) Futures contracts. The Fund uses futures contracts generally to gain exposure to, or hedge against, changes in interest rates or gain exposure to, or hedge against, changes in certain asset classes. A futures contract represents a commitment for the future purchase or sale of an asset at a specified price on a specified date.
Upon entering into a futures contract, the Fund is required to deposit cash or securities with a broker in an amount equal to a certain percentage of the contract amount. This is known as the ‘‘initial margin’’ and subsequent payments (‘‘variation margin’’) are made or received by the Fund each day, depending on the daily fluctuation in the value of the contract. For certain futures, including foreign denominated futures, variation margin is not settled daily, but is recorded as a net variation margin payable or receivable. The daily changes in contract value are recorded as unrealized appreciation or depreciation in the Statement of Operations and the Fund recognizes a realized gain or loss when the contract is closed.
Futures contracts involve, to varying degrees, risk of loss in excess of the amounts reflected in the financial statements. In addition, there is the risk that the Fund may not be able to enter into a closing transaction because of an illiquid secondary market.
(f) Forward foreign currency contracts. The Fund enters into a forward foreign currency contract to hedge against foreign currency exchange rate risk on its non-U.S. dollar denominated securities or to facilitate settlement of a foreign currency denominated portfolio transaction. A forward foreign currency contract is an agreement between two parties to buy and sell a currency at a set price with delivery and settlement at a future date. The contract is marked-to-market daily and the change in value is recorded by the Fund as an unrealized gain or loss. When a forward foreign currency contract is closed, through either delivery or offset by entering into another forward foreign currency contract, the Fund recognizes a realized gain or loss equal to the difference between the value of the contract at the time it was opened and the value of the contract at the time it is closed.
Non-deliverable forward foreign currency exchange contracts are settled with the counterparty in cash without the delivery of foreign currency.
Forward foreign currency contracts involve elements of market risk in excess of the amounts reflected on the Statement of Assets and Liabilities. The Fund bears the risk of an unfavorable change in the foreign exchange rate underlying the forward foreign currency contract. Risks may also arise upon entering into these contracts from the potential inability of the counterparties to meet the terms of their contracts.
(g) Swap agreements. The Fund invests in swaps for the purpose of managing its exposure to interest rate, credit or market risk, or for other purposes, including to increase
| | | | |
54 | | | | Western Asset SMASh Series Core Plus Completion Fund 2022 Annual Report |
the Fund’s return. The use of swaps involves risks that are different from those associated with other portfolio transactions. Swap agreements are privately negotiated in the over-the-counter market and may be entered into as a bilateral contract (“OTC Swaps”) or centrally cleared (“Centrally Cleared Swaps”). Unlike Centrally Cleared Swaps, the Fund has credit exposure to the counterparties of OTC Swaps.
In a Centrally Cleared Swap, immediately following execution of the swap, the swap agreement is submitted to a clearinghouse or central counterparty (the “CCP”) and the CCP becomes the ultimate counterparty of the swap agreement. The Fund is required to interface with the CCP through a broker, acting in an agency capacity. All payments are settled with the CCP through the broker. Upon entering into a Centrally Cleared Swap, the Fund is required to deposit initial margin with the broker in the form of cash or securities.
Swap contracts are marked-to-market daily and changes in value are recorded as unrealized appreciation (depreciation). The daily change in valuation of Centrally Cleared Swaps, if any, is recorded as a net receivable or payable for variation margin on the Statement of Assets and Liabilities. Gains or losses are realized upon termination of the swap agreement. Collateral, in the form of restricted cash or securities, may be required to be held in segregated accounts with the Fund’s custodian in compliance with the terms of the swap contracts. Securities posted as collateral for swap contracts are identified in the Schedule of Investments and restricted cash, if any, is identified on the Statement of Assets and Liabilities. Risks may exceed amounts recorded in the Statement of Assets and Liabilities. These risks include changes in the returns of the underlying instruments, failure of the counterparties to perform under the contracts’ terms, and the possible lack of liquidity with respect to the swap agreements.
OTC Swap payments received or made at the beginning of the measurement period are reflected as a premium or deposit, respectively, on the Statement of Assets and Liabilities. These upfront payments are amortized over the life of the swap and are recognized as realized gain or loss in the Statement of Operations. Net periodic payments received or paid by the Fund are recognized as a realized gain or loss in the Statement of Operations.
The Fund’s maximum exposure in the event of a defined credit event on a credit default swap to sell protection is the notional amount. As of December 31, 2022, the total notional value of all credit default swaps to sell protection was $1,522,214,200. This amount would be offset by the value of the swap’s reference entity, upfront premiums received on the swap and any amounts received from the settlement of a credit default swap where the Fund bought protection for the same referenced security/entity.
For average notional amounts of swaps held during the period ended December 31, 2022, see Note 4.
Credit default swaps
The Fund enters into credit default swap (“CDS”) contracts for investment purposes, to manage its credit risk or to add leverage. CDS agreements involve one party making a
| | | | |
| Western Asset SMASh Series Core Plus Completion Fund 2022 Annual Report | | | | 55 |
Notes to financial statements (cont’d)
stream of payments to another party in exchange for the right to receive a specified return in the event of a default by a third party, typically corporate or sovereign issuers, on a specified obligation, or in the event of a write-down, principal shortfall, interest shortfall or default of all or part of the referenced entities comprising a credit index. The Fund may use a CDS to provide protection against defaults of the issuers (i.e., to reduce risk where the Fund has exposure to an issuer) or to take an active long or short position with respect to the likelihood of a particular issuer’s default. As a seller of protection, the Fund generally receives an upfront payment or a stream of payments throughout the term of the swap provided that there is no credit event. If the Fund is a seller of protection and a credit event occurs, as defined under the terms of that particular swap agreement, the maximum potential amount of future payments (undiscounted) that the Fund could be required to make under a CDS agreement would be an amount equal to the notional amount of the agreement. These amounts of potential payments will be partially offset by any recovery of values from the respective referenced obligations. As a seller of protection, the Fund effectively adds leverage to its portfolio because, in addition to its total net assets, the Fund is subject to investment exposure on the notional amount of the swap. As a buyer of protection, the Fund generally receives an amount up to the notional value of the swap if a credit event occurs.
Implied spreads are the theoretical prices a lender receives for credit default protection. When spreads rise, market perceived credit risk rises and when spreads fall, market perceived credit risk falls. The implied credit spread of a particular referenced entity reflects the cost of buying/selling protection and may include upfront payments required to enter into the agreement. Wider credit spreads and decreasing market values, when compared to the notional amount of the swap, represent a deterioration of the referenced entity’s credit soundness and a greater likelihood or risk of default or other credit event occurring as defined under the terms of the agreement. Credit spreads utilized in determining the period end market value of CDS agreements on corporate or sovereign issues are disclosed in the Schedule of Investments and serve as an indicator of the current status of the payment/ performance risk and represent the likelihood or risk of default for credit derivatives. For CDS agreements on asset-backed securities and credit indices, the quoted market prices and resulting values, particularly in relation to the notional amount of the contract as well as the annual payment rate, serve as an indication of the current status of the payment/ performance risk.
The Fund’s maximum risk of loss from counterparty risk, as the protection buyer, is the fair value of the contract (this risk is mitigated by the posting of collateral by the counterparty to the Fund to cover the Fund’s exposure to the counterparty). As the protection seller, the Fund’s maximum risk is the notional amount of the contract. CDS are considered to have credit risk-related contingent features since they require payment by the protection seller to the protection buyer upon the occurrence of a defined credit event.
| | | | |
56 | | | | Western Asset SMASh Series Core Plus Completion Fund 2022 Annual Report |
Entering into a CDS agreement involves, to varying degrees, elements of credit, market and documentation risk in excess of the related amounts recognized on the Statement of Assets and Liabilities. Such risks involve the possibility that there will be no liquid market for these agreements, that the counterparty to the agreement may default on its obligation to perform or disagree as to the meaning of the contractual terms in the agreement, and that there will be unfavorable changes in net interest rates.
Interest rate swaps
The Fund enters into interest rate swap contracts to manage its exposure to interest rate risk. Interest rate swaps are agreements between two parties to exchange cash flows based on a notional principal amount. The Fund may elect to pay a fixed rate and receive a floating rate, receive a fixed rate and pay a floating rate, or pay and receive a floating rate, on a notional principal amount. Interest rate swaps are marked-to-market daily based upon quotations from market makers and the change, if any, is recorded as an unrealized appreciation or depreciation in the Statement of Operations. When a swap contract is terminated early, the Fund records a realized gain or loss equal to the difference between the original cost and the settlement amount of the closing transaction.
The risks of interest rate swaps include changes in market conditions that will affect the value of the contract or changes in the present value of the future cash flow streams and the possible inability of the counterparty to fulfill its obligations under the agreement. The Fund’s maximum risk of loss from counterparty credit risk is the discounted net value of the cash flows to be received from the counterparty over the contract’s remaining life, to the extent that amount is positive. This risk is mitigated by the posting of collateral by the counterparty to the Fund to cover the Fund’s exposure to the counterparty.
Total return swaps
The Fund enters into total return swaps for investment purposes. Total return swaps are agreements to exchange the return generated by one instrument for the return generated by another instrument. For example, the agreement to pay a predetermined or fixed interest rate in exchange for a market-linked return based on a notional amount. To the extent the total return of a referenced index or instrument exceeds the offsetting interest obligation, the Fund will receive a payment from the counterparty. To the extent it is less, the Fund will make a payment to the counterparty.
(h) Loan participations. The Fund may invest in loans arranged through private negotiation between one or more financial institutions. The Fund’s investment in any such loan may be in the form of a participation in or an assignment of the loan. In connection with purchasing participations, the Fund generally will have no right to enforce compliance by the borrower with the terms of the loan agreement related to the loan, or any rights of off-set against the borrower and the Fund may not benefit directly from any collateral supporting the loan in which it has purchased the participation.
| | | | |
| Western Asset SMASh Series Core Plus Completion Fund 2022 Annual Report | | | | 57 |
Notes to financial statements (cont’d)
The Fund assumes the credit risk of the borrower, the lender that is selling the participation and any other persons interpositioned between the Fund and the borrower. In the event of the insolvency of the lender selling the participation, the Fund may be treated as a general creditor of the lender and may not benefit from any off-set between the lender and the borrower.
(i) Unfunded loan commitments. The Fund may enter into certain credit agreements where all or a portion of the total amount committed may be unfunded. The Fund is obligated to fund these commitments at the borrower’s discretion. The commitments are disclosed in the accompanying Schedule of Investments. At December 31, 2022, the Fund had sufficient cash and/or securities to cover these commitments.
(j) Stripped securities. The Fund may invest in ‘‘Stripped Securities,’’ a term used collectively for components, or strips, of fixed income securities. Stripped Securities can be principal only securities (“PO”), which are debt obligations that have been stripped of unmatured interest coupons, or interest only securities (“IO”), which are unmatured interest coupons that have been stripped from debt obligations. The market value of Stripped Securities will fluctuate in response to changes in economic conditions, rates of prepayment, interest rates and the market’s perception of the securities. However, fluctuations in response to interest rates may be greater in Stripped Securities than for debt obligations of comparable maturities that pay interest currently. The amount of fluctuation may increase with a longer period of maturity.
The yield to maturity on IO’s is sensitive to the rate of principal repayments (including prepayments) on the related underlying debt obligation and principal payments may have a material effect on yield to maturity. If the underlying debt obligation experiences greater than anticipated prepayments of principal, the Fund may not fully recoup its initial investment in IO’s.
(k) Foreign currency translation. Investment securities and other assets and liabilities denominated in foreign currencies are translated into U.S. dollar amounts based upon prevailing exchange rates on the date of valuation. Purchases and sales of investment securities and income and expense items denominated in foreign currencies are translated into U.S. dollar amounts based upon prevailing exchange rates on the respective dates of such transactions.
The Fund does not isolate that portion of the results of operations resulting from fluctuations in foreign exchange rates on investments from the fluctuations arising from changes in market prices of securities held. Such fluctuations are included with the net realized and unrealized gain or loss on investments.
Net realized foreign exchange gains or losses arise from sales of foreign currencies, including gains and losses on forward foreign currency contracts, currency gains or losses realized between the trade and settlement dates on securities transactions, and the difference between the amounts of dividends, interest, and foreign withholding taxes
| | | | |
58 | | | | Western Asset SMASh Series Core Plus Completion Fund 2022 Annual Report |
recorded on the Fund’s books and the U.S. dollar equivalent of the amounts actually received or paid. Net unrealized foreign exchange gains and losses arise from changes in the values of assets and liabilities, other than investments in securities, on the date of valuation, resulting from changes in exchange rates.
Foreign security and currency transactions may involve certain considerations and risks not typically associated with those of U.S. dollar denominated transactions as a result of, among other factors, the possibility of lower levels of governmental supervision and regulation of foreign securities markets and the possibility of political or economic instability.
(l) Credit and market risk. Investments in securities that are collateralized by real estate mortgages are subject to certain credit and liquidity risks. When market conditions result in an increase in default rates of the underlying mortgages and the foreclosure values of underlying real estate properties are materially below the outstanding amount of these underlying mortgages, collection of the full amount of accrued interest and principal on these investments may be doubtful. Such market conditions may significantly impair the value and liquidity of these investments and may result in a lack of correlation between their credit ratings and values.
The Fund invests in high-yield and emerging market instruments that are subject to certain credit and market risks. The yields of high-yield and emerging market debt obligations reflect, among other things, perceived credit and market risks. The Fund’s investments in securities rated below investment grade typically involve risks not associated with higher rated securities including, among others, greater risk related to timely and ultimate payment of interest and principal, greater market price volatility and less liquid secondary market trading. The consequences of political, social, economic or diplomatic changes may have disruptive effects on the market prices of investments held by the Fund. The Fund’s investments in non-U.S. dollar denominated securities may also result in foreign currency losses caused by devaluations and exchange rate fluctuations.
(m) Foreign investment risks. The Fund’s investments in foreign securities may involve risks not present in domestic investments. Since securities may be denominated in foreign currencies, may require settlement in foreign currencies or may pay interest or dividends in foreign currencies, changes in the relationship of these foreign currencies to the U.S. dollar can significantly affect the value of the investments and earnings of the Fund. Foreign investments may also subject the Fund to foreign government exchange restrictions, expropriation, taxation or other political, social or economic developments, all of which affect the market and/or credit risk of the investments.
(n) Counterparty risk and credit-risk-related contingent features of derivative instruments. The Fund may invest in certain securities or engage in other transactions where the Fund is exposed to counterparty credit risk in addition to broader market risks. The Fund may invest in securities of issuers, which may also be considered counterparties
| | | | |
| Western Asset SMASh Series Core Plus Completion Fund 2022 Annual Report | | | | 59 |
Notes to financial statements (cont’d)
as trading partners in other transactions. This may increase the risk of loss in the event of default or bankruptcy by the counterparty or if the counterparty otherwise fails to meet its contractual obligations. The Fund’s subadviser attempts to mitigate counterparty risk by (i) periodically assessing the creditworthiness of its trading partners, (ii) monitoring and/or limiting the amount of its net exposure to each individual counterparty based on its assessment and (iii) requiring collateral from the counterparty for certain transactions. Market events and changes in overall economic conditions may impact the assessment of such counterparty risk by the subadviser. In addition, declines in the values of underlying collateral received may expose the Fund to increased risk of loss.
With exchange traded and centrally cleared derivatives, there is less counterparty risk to the Fund since the exchange or clearinghouse, as counterparty to such instruments, guarantees against a possible default. The clearinghouse stands between the buyer and the seller of the contract; therefore, the credit risk is limited to failure of the clearinghouse. While offset rights may exist under applicable law, the Fund does not have a contractual right of offset against a clearing broker or clearinghouse in the event of a default of the clearing broker or clearinghouse.
The Fund has entered into master agreements, such as an International Swaps and Derivatives Association, Inc. Master Agreement (“ISDA Master Agreement”) or similar agreement, with certain of its derivative counterparties that govern over-the-counter (“OTC”) derivatives and provide for general obligations, representations, agreements, collateral posting terms, netting provisions in the event of default or termination and credit related contingent features. The credit related contingent features include, but are not limited to, a percentage decrease in the Fund’s net assets or net asset value per share over a specified period of time. If these credit related contingent features were triggered, the derivatives counterparty could terminate the positions and demand payment or require additional collateral.
Under an ISDA Master Agreement, the Fund may, under certain circumstances, offset with the counterparty certain derivative financial instruments’ payables and/or receivables with collateral held and/or posted and create one single net payment. However, absent an event of default by the counterparty or a termination of the agreement, the terms of the ISDA Master Agreements do not result in an offset of reported amounts of financial assets and financial liabilities in the Statement of Assets and Liabilities across transactions between the Fund and the applicable counterparty. The enforceability of the right to offset may vary by jurisdiction.
Collateral requirements differ by type of derivative. Collateral or margin requirements are set by the broker or exchange clearinghouse for exchange traded derivatives while collateral terms are contract specific for OTC traded derivatives. Cash collateral that has been pledged to cover obligations of the Fund under derivative contracts, if any, will be reported separately in the Statement of Assets and Liabilities. Securities pledged as collateral, if any, for the same purpose are noted in the Schedule of Investments.
| | | | |
60 | | | | Western Asset SMASh Series Core Plus Completion Fund 2022 Annual Report |
As of December 31, 2022, the Fund held forward foreign currency contracts and OTC total return swaps which had a liability position of $19,124,998. If a contingent feature in the master agreements would have been triggered, the Fund would have been required to pay this amount to its derivatives counterparties. As of December 31, 2022, the Fund had posted with its counterparties cash and/or securities as collateral to cover the net liability of these derivatives amounting to $8,560,000 which could be used to reduce the required payment.
(o) Security transactions and investment income. Security transactions are accounted for on a trade date basis. Interest income (including interest income from payment-in-kind securities), adjusted for amortization of premium and accretion of discount, is recorded on the accrual basis. Paydown gains and losses on mortgage- and asset-backed securities are recorded as adjustments to interest income. Dividend income is recorded on the ex-dividend date for dividends received in cash and/or securities. Foreign dividend income is recorded on the ex-dividend date or as soon as practicable after the Fund determines the existence of a dividend declaration after exercising reasonable due diligence. The cost of investments sold is determined by use of the specific identification method. To the extent any issuer defaults or a credit event occurs that impacts the issuer, the Fund may halt any additional interest income accruals and consider the realizability of interest accrued up to the date of default or credit event.
(p) Distributions to shareholders. Distributions from net investment income of the Fund, if any, are declared and paid on a monthly basis. Distributions of net realized gains, if any, are declared at least annually. Distributions to shareholders of the Fund are recorded on the ex-dividend date and are determined in accordance with income tax regulations, which may differ from GAAP.
(q) Compensating balance arrangements. The Fund has an arrangement with its custodian bank whereby a portion of the custodian’s fees are paid indirectly by credits earned on the Fund’s cash on deposit with the bank.
(r) Federal and other taxes. It is the Fund’s policy to comply with the federal income and excise tax requirements of the Internal Revenue Code of 1986 (the “Code”), as amended, applicable to regulated investment companies. Accordingly, the Fund intends to distribute its taxable income and net realized gains, if any, to shareholders in accordance with timing requirements imposed by the Code. Therefore, no federal or state income tax provision is required in the Fund’s financial statements.
Management has analyzed the Fund’s tax positions taken on income tax returns for all open tax years and has concluded that as of December 31, 2022, no provision for income tax is required in the Fund’s financial statements. The Fund’s federal and state income and federal excise tax returns for tax years for which the applicable statutes of limitations have not expired are subject to examination by the Internal Revenue Service and state departments of revenue.
| | | | |
| Western Asset SMASh Series Core Plus Completion Fund 2022 Annual Report | | | | 61 |
Notes to financial statements (cont’d)
Under the applicable foreign tax laws, a withholding tax may be imposed on interest, dividends and capital gains at various rates. As of December 31, 2022, there were $136,798 of capital gains tax liabilities accrued on unrealized gains.
(s) Reclassification. GAAP requires that certain components of net assets be reclassified to reflect permanent differences between financial and tax reporting. These reclassifications have no effect on net assets or net asset value per share. During the current period, the Fund had no reclassifications.
2. Investment management agreement and other transactions with affiliates
LMPFA is the Fund’s investment manager. Western Asset Management Company, LLC (“Western Asset”), Western Asset Management Company Pte. Ltd. in Singapore (“Western Asset Singapore”), Western Asset Management Company Ltd in Japan (“Western Asset Japan”) and Western Asset Management Company Limited in London (“Western Asset London”) are the Fund’s subadvisers. LMPFA, Western Asset, Western Asset Singapore, Western Asset Japan and Western Asset London are indirect, wholly-owned subsidiaries of Franklin Resources, Inc. (“Franklin Resources”).
LMPFA and the subadvisers do not charge investment management fees to the Fund. However, the Fund is an integral part of the separately managed account program, and LMPFA and the subadvisers will be compensated directly or indirectly by separately managed account program sponsors. LMPFA provides administrative and certain oversight services to the Fund. LMPFA delegates to the subadvisers the day-to-day portfolio management of the Fund.
LMPFA has entered into an expense reimbursement arrangement with the Fund, pursuant to which LMPFA has agreed to reimburse 100% of the Fund’s ordinary operating expenses. The expense reimbursement arrangement does not cover interest, brokerage, taxes and extraordinary expenses. This expense reimbursement arrangement cannot be terminated prior to December 31, 2024 without the Board of Trustees’ consent.
During the period ended December 31, 2022, fees waived and/or expenses reimbursed amounted to $912,759.
During the year ended February 28, 2022, fees waived and/or expenses reimbursed amounted to $1,028,731.
Franklin Templeton Investor Services, LLC (“Investor Services”) serves as the Fund’s shareholder servicing agent and acts as the Fund’s transfer agent and dividend-paying agent. Investor Services is an indirect, wholly-owned subsidiary of Franklin Resources. Franklin Distributors, LLC (“Franklin Distributors”) serves as the Fund’s sole and exclusive distributor. Franklin Distributors is an indirect, wholly-owned broker-dealer subsidiary of Franklin Resources.
All officers and one Trustee of the Trust are employees of Franklin Resources or its affiliates and do not receive compensation from the Trust.
| | | | |
62 | | | | Western Asset SMASh Series Core Plus Completion Fund 2022 Annual Report |
3. Investments
During the period ended December 31, 2022, the aggregate cost of purchases and proceeds from sales of investments (excluding short-term investments) and U.S. Government & Agency Obligations were as follows:
| | | | | | | | |
| | | Investments | | | U.S. Government &
Agency Obligations | |
| Purchases | | $ | 300,933,940 | | | $ | 1,114,473,223 | |
| Sales | | | 1,240,946,499 | | | | 1,101,352,604 | |
At December 31, 2022, the aggregate cost of investments and the aggregate gross unrealized appreciation and depreciation of investments for federal income tax purposes were as follows:
| | | | | | | | | | | | | | | | |
| | | Cost/Premiums
Paid (Received) | | | Gross
Unrealized
Appreciation | | | Gross
Unrealized
Depreciation | | | Net
Unrealized
Appreciation
(Depreciation) | |
| Securities | | $ | 2,740,191,708 | | | $ | 6,281,763 | | | $ | (322,534,154) | | | $ | (316,252,391) | |
| Written options | | | (6,200,551) | | | | 2,347,699 | | | | (4,540,101) | | | | (2,192,402) | |
| Futures contracts | | | — | | | | 34,302,218 | | | | (49,266,851) | | | | (14,964,633) | |
| Forward foreign currency contracts | | | — | | | | 17,349,915 | | | | (11,716,731) | | | | 5,633,184 | |
| Swap contracts | | | 23,209,134 | | | | 195,885,996 | | | | (21,389,831) | | | | 174,496,165 | |
4. Derivative instruments and hedging activities
Below is a table, grouped by derivative type, that provides information about the fair value and the location of derivatives within the Statement of Assets and Liabilities at December 31, 2022.
| | | | | | | | | | | | | | | | |
| ASSET DERIVATIVES1 | |
| | | Interest
Rate Risk | | | Foreign
Exchange Risk | | | Credit Risk | | | Total | |
| Purchased options2 | | $ | 4,248,727 | | | $ | 68,040 | | | | — | | | $ | 4,316,767 | |
| Futures contracts3 | | | 26,567,252 | | | | 7,734,966 | | | | — | | | | 34,302,218 | |
| Forward foreign currency contracts | | | — | | | | 17,349,915 | | | | — | | | | 17,349,915 | |
| Centrally cleared swap contracts4 | | | 182,253,574 | | | | — | | | $ | 13,632,422 | | | | 195,885,996 | |
| Total | | $ | 213,069,553 | | | $ | 25,152,921 | | | $ | 13,632,422 | | | $ | 251,854,896 | |
| | | | | | | | | | | | | | | | |
| LIABILITY DERIVATIVES1 | |
| | | Interest
Rate Risk | | | Foreign
Exchange Risk | | | Credit Risk | | | Total | |
| Written options | | $ | 8,392,953 | | | | — | | | | — | | | $ | 8,392,953 | |
| Futures contracts3 | | | 45,574,587 | | | $ | 3,692,264 | | | | — | | | | 49,266,851 | |
| Forward foreign currency contracts | | | — | | | | 11,716,731 | | | | — | | | | 11,716,731 | |
| OTC swap contracts5 | | | 7,408,267 | | | | — | | | | — | | | | 7,408,267 | |
| Centrally cleared swap contracts4 | | | 13,431,854 | | | | — | | | $ | 549,710 | | | | 13,981,564 | |
| Total | | $ | 74,807,661 | | | $ | 15,408,995 | | | $ | 549,710 | | | $ | 90,766,366 | |
| | | | |
| Western Asset SMASh Series Core Plus Completion Fund 2022 Annual Report | | | | 63 |
Notes to financial statements (cont’d)
| 1 | Generally, the balance sheet location for asset derivatives is receivables/net unrealized appreciation and for liability derivatives is payables/net unrealized depreciation. |
| 2 | Market value of purchased options is reported in Investments at value in the Statement of Assets and Liabilities. |
| 3 | Includes cumulative unrealized appreciation (depreciation) of futures contracts as reported in the Schedule of Investments. Only net variation margin is reported within the receivables and/or payables on the Statement of Assets and Liabilities. |
| 4 | Includes cumulative unrealized appreciation (depreciation) of centrally cleared swap contracts as reported in the Schedule of Investments. Only net variation margin is reported within the receivables and/or payables on the Statement of Assets and Liabilities. |
| 5 | Values include premiums paid (received) on swap contracts which are shown separately in the Statement of Assets and Liabilities. |
The following tables provide information about the effect of derivatives and hedging activities on the Fund’s Statement of Operations for the period ended December 31, 2022. The first table provides additional detail about the amounts and sources of gains (losses) realized on derivatives during the period. The second table provides additional information about the change in net unrealized appreciation (depreciation) resulting from the Fund’s derivatives and hedging activities during the period.
| | | | | | | | | | | | | | | | |
| AMOUNT OF NET REALIZED GAIN (LOSS) ON DERIVATIVES RECOGNIZED | |
| | | Interest
Rate Risk | | | Foreign
Exchange Risk | | | Credit Risk | | | Total | |
| Purchased options1 | | $ | (75,309,519) | | | $ | (4,282,220) | | | | — | | | $ | (79,591,739) | |
| Futures contracts | | | (1,070,399,387) | | | | (56,647,357) | | | | — | | | | (1,127,046,744) | |
| Written options | | | 220,577,171 | | | | 5,762,962 | | | | — | | | | 226,340,133 | |
| Swap contracts | | | 137,116,021 | | | | — | | | $ | (20,802,836) | | | | 116,313,185 | |
| Forward foreign currency contracts | | | — | | | | (80,936,012) | | | | — | | | | (80,936,012) | |
| Total | | $ | (788,015,714) | | | $ | (136,102,627) | | | $ | (20,802,836) | | | $ | (944,921,177) | |
| 1 | Net realized gain (loss) from purchased options is reported in Net Realized Gain (Loss) From Investment transactions in the Statement of Operations. |
| | | | | | | | | | | | | | | | |
| CHANGE IN NET UNREALIZED APPRECIATION (DEPRECIATION) ON DERIVATIVES RECOGNIZED | |
| | | Interest Rate
Risk | | | Foreign
Exchange Risk | | | Credit Risk | | | Total | |
| Purchased options1 | | $ | (2,741,307) | | | $ | (254,185) | | | | — | | | $ | (2,995,492) | |
| Futures contracts | | | 39,317,375 | | | | 11,674,846 | | | | — | | | | 50,992,221 | |
| Written options | | | 5,719,098 | | | | (37,125) | | | | — | | | | 5,681,973 | |
| Swap contracts | | | 121,529,428 | | | | — | | | $ | 30,013,718 | | | | 151,543,146 | |
| Forward foreign currency contracts | | | — | | | | 69,389,133 | | | | — | | | | 69,389,133 | |
| Total | | $ | 163,824,594 | | | $ | 80,772,669 | | | $ | 30,013,718 | | | $ | 274,610,981 | |
| 1 | The change in net unrealized appreciation (depreciation) from purchased options is reported in the Change in Net Unrealized Appreciation (Depreciation) From Investments in the Statement of Operations. |
| | | | |
64 | | | | Western Asset SMASh Series Core Plus Completion Fund 2022 Annual Report |
The following tables provide information about the effect of derivatives and hedging activities on the Fund’s Statement of Operations for the year ended February 28, 2022. The first table provides additional detail about the amounts and sources of gains (losses) realized on derivatives during the period. The second table provides additional information about the change in net unrealized appreciation (depreciation) resulting from the Fund’s derivatives and hedging activities during the period.
| | | | | | | | | | | | | | | | |
| AMOUNT OF NET REALIZED GAIN (LOSS) ON DERIVATIVES RECOGNIZED | |
| | | Interest
Rate Risk | | | Foreign
Exchange Risk | | | Credit Risk | | | Total | |
| Purchased options1 | | $ | (41,024,678) | | | $ | (14,418,521) | | | | — | | | $ | (55,443,199) | |
| Futures contracts | | | (128,952,455) | | | | (38,418,818) | | | | — | | | | (167,371,273) | |
| Written options | | | 89,961,751 | | | | 3,468,554 | | | | — | | | | 93,430,305 | |
| Swap contracts | | | 9,588,020 | | | | — | | | $ | 50,252,472 | | | | 59,840,492 | |
| Forward foreign currency contracts | | | — | | | | 25,085,080 | | | | — | | | | 25,085,080 | |
| Total | | $ | (70,427,362) | | | $ | (24,283,705) | | | $ | 50,252,472 | | | $ | (44,458,595) | |
| 1 | Net realized gain (loss) from purchased options is reported in Net Realized Gain (Loss) From Investment transactions in the Statement of Operations. |
| | | | | | | | | | | | | | | | |
| CHANGE IN NET UNREALIZED APPRECIATION (DEPRECIATION) ON DERIVATIVES RECOGNIZED | |
| | | Interest
Rate Risk | | | Foreign
Exchange Risk | | | Credit Risk | | | Total | |
| Purchased options1 | | $ | (376,017) | | | $ | 1,068,667 | | | | — | | | $ | 692,650 | |
| Futures contracts | | | (44,631,256) | | | | (12,358,647) | | | | — | | | | (56,989,903) | |
| Written options | | | (8,676,840) | | | | (151,068) | | | | — | | | | (8,827,908) | |
| Swap contracts | | | 15,466,231 | | | | — | | | $ | (35,593,860) | | | | (20,127,629) | |
| Forward foreign currency contracts | | | — | | | | (63,735,396) | | | | — | | | | (63,735,396) | |
| Total | | $ | (38,217,882) | | | $ | (75,176,444) | | | $ | (35,593,860) | | | $ | (148,988,186) | |
| 1 | The change in net unrealized appreciation (depreciation) from purchased options is reported in the Change in Net Unrealized Appreciation (Depreciation) From Investments in the Statement of Operations. |
During the period ended December 31, 2022, the volume of derivative activity for the Fund was as follows:
| | | | |
| | | Average Market
Value | |
| Purchased options | | $ | 3,845,772 | |
| Written options | | | 20,053,542 | |
| Futures contracts (to buy) | | | 10,726,332,247 | |
| Futures contracts (to sell) | | | 3,407,225,257 | |
| Forward foreign currency contracts (to buy) | | | 902,372,614 | |
| Forward foreign currency contracts (to sell) | | | 556,953,082 | |
| | | | |
| Western Asset SMASh Series Core Plus Completion Fund 2022 Annual Report | | | | 65 |
Notes to financial statements (cont’d)
| | | | |
| | | Average Notional
Balance | |
| Interest rate swap contracts | | $ | 3,896,651,258 | |
| Credit default swap contracts (buy protection)† | | | 4,525,855 | |
| Credit default swap contracts (sell protection) | | | 1,937,705,602 | |
| Total return swap contracts | | | 25,254,545 | |
| † | At December 31, 2022, there were no open positions held in this derivative. |
The following table presents the Fund’s OTC derivative assets and liabilities by counterparty net of amounts available for offset under an ISDA Master Agreement and net of the related collateral pledged (received) by the Fund as of December 31, 2022.
| | | | | | | | | | | | | | | | | | | | |
| Counterparty | | Gross Assets Subject to Master Agreements1 | | | Gross Liabilities Subject to Master Agreements1 | | | Net Assets (Liabilities) Subject to Master Agreements | | | Collateral
Pledged
(Received)2,3 | | | Net
Amount4,5 | |
| Bank of America N.A. | | $ | 1,383,034 | | | | — | | | $ | 1,383,034 | | | | — | | | $ | 1,383,034 | |
| Goldman Sachs Group Inc. | | | 972,341 | | | $ | (1,772,137) | | | | (799,796) | | | | — | | | | (799,796) | |
| JPMorgan Chase & Co. | | | 8,674,221 | | | | (11,435,199) | | | | (2,760,978) | | | $ | 8,410,000 | | | | 5,649,022 | |
| Morgan Stanley & Co. Inc. | | | 6,320,319 | | | | (5,917,662) | | | | 402,657 | | | | 150,000 | | | | 552,657 | |
| Total | | $ | 17,349,915 | | | $ | (19,124,998) | | | $ | (1,775,083) | | | $ | 8,560,000 | | | $ | 6,784,917 | |
| 1 | Absent an event of default or early termination, derivative assets and liabilities are presented gross and not offset in the Statement of Assets and Liabilities. |
| 2 | Gross amounts are not offset in the Statement of Assets and Liabilities. |
| 3 | In some instances, the actual collateral received and/or pledged may be more than the amount shown here due to overcollateralization. |
| 4 | Net amount may also include forward foreign currency exchange contracts that are not required to be collateralized. |
| 5 | Represents the net amount receivable (payable) from (to) the counterparty in the event of default. |
5. Shares of beneficial interest
At December 31, 2022, the Trust had an unlimited number of shares of beneficial interest authorized with a par value of $0.00001 per share. Each share represents an identical interest and has the same rights.
Transactions in shares of the Fund were as follows:
| | | | | | | | | | | | |
| | | Period Ended
December 31, 2022† | | | Year Ended
February 28, 2022 | | | Year Ended
February 28, 2021 | |
| Shares sold | | | 152,799,257 | | | | 178,915,808 | | | | 186,109,533 | |
| Shares repurchased | | | (186,254,299) | | | | (107,108,764) | | | | (67,178,862) | |
| Net increase (decrease) | | | (33,455,042) | | | | 71,807,044 | | | | 118,930,671 | |
| † | For the period March 1, 2022 through December 31, 2022. |
| | | | |
66 | | | | Western Asset SMASh Series Core Plus Completion Fund 2022 Annual Report |
6. Redemption facility
The Fund and certain other participating funds within the Trust, together with other U.S. registered and foreign investment funds (collectively, the “Borrowers”) managed by LMPFA or Franklin Resources, are borrowers in a joint syndicated senior unsecured credit facility totaling $2.675 billion (the “Global Credit Facility”). The Global Credit Facility provides a source of funds to the Borrowers for temporary and emergency purposes, including the ability to meet future unanticipated or unusually large redemption requests. Unless renewed, the Global Credit Facility will terminate on February 2, 2024.
Under the terms of the Global Credit Facility, the Fund shall, in addition to interest charged on any borrowings made by the Fund and other costs incurred by the Fund, pay its share of fees and expenses incurred in connection with the implementation and maintenance of the Global Credit Facility, based upon its relative share of the aggregate net assets of all the Borrowers, including an annual commitment fee of 0.15% based upon the unused portion of the Global Credit Facility. These fees are reflected in the Statement of Operations. The Fund did not utilize the Global Credit Facility during the year ended December 31, 2022.
7. Income tax information and distributions to shareholders
The tax character of distributions paid during the fiscal period ended December 31 and the fiscal years ended February 28, 2022 and 2021, was as follows:
| | | | | | | | | | | | |
| | | 2022 | | | 2022 | | | 2021 | |
| Distributions paid from: | | | | | | | | | | | | |
| Ordinary income | | $ | 17,375,196 | | | $ | 239,592,019 | | | $ | 16,152,998 | |
| Net long-term capital gains | | | — | | | | — | | | | 7,006,643 | |
| Tax return of capital | | | 4,227,285 | | | | — | | | | — | |
| Total distributions paid | | $ | 21,602,481 | | | $ | 239,592,019 | | | $ | 23,159,641 | |
As of December 31, 2022, the components of distributable earnings (loss) on a tax basis were as follows:
| | | | |
| Deferred capital losses* | | $ | (1,121,635,143) | |
| Other book/tax temporary differences(a) | | | (857,775) | |
| Unrealized appreciation (depreciation)(b) | | | (151,154,297) | |
| Total distributable earnings (loss) — net | | $ | (1,273,647,215) | |
| | | | |
| Western Asset SMASh Series Core Plus Completion Fund 2022 Annual Report | | | | 67 |
Notes to financial statements (cont’d)
| * | These capital losses have been deferred in the current year as either short-term or long-term losses. The losses will be deemed to occur on the first day of the next taxable year in the same character as they were originally deferred and will be available to offset future taxable capital gains. |
| (a) | Other book/tax temporary differences are attributable to the tax deferral of losses on straddles, the realization for tax purposes of unrealized gains (losses) on certain futures, options and foreign currency contracts, the deferral of certain late year losses for tax purposes and book/tax differences in the timing of the deductibility of various expenses. |
| (b) | The difference between book-basis and tax-basis unrealized appreciation (depreciation) is attributable to the tax deferral of losses on wash sales, the difference between book and tax amortization methods for premium on fixed income securities, book/tax differences in the accrual of interest income on securities in default and other book/tax basis adjustments. |
8. Recent accounting pronouncement
In March 2020, the Financial Accounting Standards Board (FASB) issued Accounting Standards Update (ASU) No. 2020-04, Reference Rate Reform (Topic 848) – Facilitation of the Effects of Reference Rate Reform on Financial Reporting. In January 2021, the FASB issued ASU No. 2021-01, with further amendments to Topic 848. The amendments in the ASUs provide optional temporary accounting recognition and financial reporting relief from the effect of certain types of contract modifications due to the planned discontinuation of the LIBOR and other interbank-offered based reference rates as of the end of 2021 and 2023. The ASUs are effective for certain reference rate-related contract modifications that occur during the period March 12, 2020 through December 31, 2022. Management has reviewed the requirements and believes the adoption of these ASUs will not have a material impact on the financial statements.
9. Other matters
The outbreak of the respiratory illness COVID-19 (commonly referred to as “coronavirus”) has continued to rapidly spread around the world, causing considerable uncertainty for the global economy and financial markets. The ultimate economic fallout from the pandemic, and the long-term impact on economies, markets, industries and individual issuers, are not known. The COVID-19 pandemic could adversely affect the value and liquidity of the Fund’s investments, impair the Fund’s ability to satisfy redemption requests, and negatively impact the Fund’s performance. In addition, the outbreak of COVID-19, and measures taken to mitigate its effects, could result in disruptions to the services provided to the Fund by its service providers.
* * *
The Fund’s investments, payment obligations, and financing terms may be based on floating rates, such as the London Interbank Offered Rate, or “LIBOR,” which is the offered rate for short-term Eurodollar deposits between major international banks. On March 5, 2021, the ICE Benchmark Administration, the administrator of LIBOR, stated that it will cease the publication of the overnight and one-, three-, six- and twelve-month USD LIBOR settings immediately following the LIBOR publication on Friday, June 30, 2023. All other LIBOR settings, including the one-week and two-month USD LIBOR settings, have ceased
| | | | |
68 | | | | Western Asset SMASh Series Core Plus Completion Fund 2022 Annual Report |
publication as of January 1, 2022. In March 2022, the U.S. federal government enacted legislation to establish a process for replacing LIBOR in certain existing contracts that do not already provide for the use of a clearly defined or practicable replacement benchmark rate as described in the legislation. Generally speaking, for contracts that do not contain a fallback provision as described in the legislation, a benchmark replacement recommended by the Federal Reserve Board will effectively automatically replace the USD LIBOR benchmark in the contract after June 30, 2023. The recommended benchmark replacement will be based on the Secured Overnight Financing Rate (SOFR) published by the Federal Reserve Bank of New York, including certain spread adjustments and benchmark replacement conforming changes. There remains uncertainty regarding the impact of the transition from LIBOR on the Fund’s transactions and the financial markets generally.
* * *
Russia’s military invasion of Ukraine in February 2022, the resulting responses by the United States and other countries, and the potential for wider conflict could increase volatility and uncertainty in the financial markets and adversely affect regional and global economies. The United States and other countries have imposed broad-ranging economic sanctions on Russia and certain Russian individuals, banking entities and corporations as a response to its invasion of Ukraine. The United States and other countries have also imposed economic sanctions on Belarus and may impose sanctions on other countries that support Russia’s military invasion. These sanctions, as well as any other economic consequences related to the invasion, such as additional sanctions, boycotts or changes in consumer or purchaser preferences or cyberattacks on governments, companies or individuals, may further decrease the value and liquidity of certain Russian securities and securities of issuers in other countries that are subject to economic sanctions related to the invasion. To the extent that the Fund has exposure to Russian investments or investments in countries affected by the invasion, the Fund’s ability to price, buy, sell, receive or deliver such investments was impaired. The Fund could determine at any time that certain of the most affected securities have little or no value. In addition, any exposure that the Fund may have to counterparties in Russia or in countries affected by the invasion could negatively impact the Fund’s portfolio. The extent and duration of Russia’s military actions and the repercussions of such actions (including any retaliatory actions or countermeasures that may be taken by those subject to sanctions) are impossible to predict, but could result in significant market disruptions, including in the oil and natural gas markets, and may negatively affect global supply chains, inflation and global growth. These and any related events could significantly impact the Fund’s performance and the value of an investment in the Fund, even beyond any direct exposure the Fund may have to Russian issuers or issuers in other countries affected by the invasion. At December 31, 2022, the Fund had 0.85% of its net assets invested in securities with significant economic risk or exposure to Russia.
| | | | |
| Western Asset SMASh Series Core Plus Completion Fund 2022 Annual Report | | | | 69 |
Report of independent registered public accounting firm
To the Board of Trustees of Legg Mason Partners Institutional Trust and Shareholders of Western Asset SMASh Series Core Plus Completion Fund
Opinion on the Financial Statements
We have audited the accompanying statement of assets and liabilities, including the schedule of investments, of Western Asset SMASh Series Core Plus Completion Fund (one of the funds constituting Legg Mason Partners Institutional Trust, referred to hereafter as the “Fund”) as of December 31, 2022, the related statement of operations for the period March 1, 2022 through December 31, 2022 and the year ended February 28, 2022, the statement of changes in net assets for the period March 1, 2022 through December 31, 2022 and each of the two years in the period ended February 28, 2022, including the related notes, and the financial highlights for the period March 1, 2022 through December 31, 2022 and each of the five years in the period ended February 28, 2022 (collectively referred to as the “financial statements”). In our opinion, the financial statements present fairly, in all material respects, the financial position of the Fund as of December 31, 2022, the results of its operations for the period March 1, 2022 through December 31, 2022 and the year ended February 28, 2022, the changes in its net assets for the period March 1, 2022 through December 31, 2022 and the each of the two years in the period ended February 28, 2022 and the financial highlights for the period March 1, 2022 through December 31, 2022 and each of the five years in the period ended February 28, 2022 in conformity with accounting principles generally accepted in the United States of America.
Basis for Opinion
These financial statements are the responsibility of the Fund’s management. Our responsibility is to express an opinion on the Fund’s financial statements based on our audits. We are a public accounting firm registered with the Public Company Accounting Oversight Board (United States) (PCAOB) and are required to be independent with respect to the Fund in accordance with the U.S. federal securities laws and the applicable rules and regulations of the Securities and Exchange Commission and the PCAOB.
We conducted our audits of these financial statements in accordance with the standards of the PCAOB. Those standards require that we plan and perform the audit to obtain reasonable assurance about whether the financial statements are free of material misstatement, whether due to error or fraud.
Our audits included performing procedures to assess the risks of material misstatement of the financial statements, whether due to error or fraud, and performing procedures that respond to those risks. Such procedures included examining, on a test basis, evidence regarding the amounts and disclosures in the financial statements. Our audits also included evaluating the accounting principles used and significant estimates made by management, as well as evaluating the overall presentation of the financial statements. Our procedures included confirmation of securities owned as of December 31, 2022 by correspondence with the custodian, agent banks and brokers; when replies were not received, we performed other auditing procedures. We believe that our audits provide a reasonable basis for our opinion.
/s/PricewaterhouseCoopers LLP
Baltimore, Maryland
February 22, 2023
We have served as the auditor of one or more investment companies in the Franklin Templeton Group of Funds since 1948.
| | | | |
70 | | | | Western Asset SMASh Series Core Plus Completion Fund 2022 Annual Report |
Additional information (unaudited)
Information about Trustees and Officers
The business and affairs of Western Asset SMASh Series Core Plus Completion Fund (the “Fund”) are conducted by management under the supervision and subject to the direction of its Board of Trustees. The business address of each Trustee is c/o Jane Trust, Franklin Templeton, 100 International Drive, 11th Floor, Baltimore, Maryland 21202.
Information pertaining to the Trustees and officers of the Fund is set forth below. The Statement of Additional Information includes additional information about Trustees and is available, without charge, upon request by calling the Fund at
877-6LM-FUND/656-3863.
| | |
| Independent Trustees† | | |
| |
| Robert Abeles, Jr. | | |
| |
| Year of birth | | 1945 |
| Position(s) with Fund | | Trustee |
| Term of office1 and length of time served2 | | Since 2013 |
| Principal occupation(s) during the past five years | | Senior Vice President Emeritus (since 2016) and formerly, Senior Vice President, Finance and Chief Financial Officer (2009 to 2016) at University of Southern California; Board Member of Excellent Education Development (since 2012); and formerly, Board Member of Great Public Schools Now (2018 to 2022) |
| Number of funds in fund complex overseen by Trustee3 | | 51 |
| Other Trusteeships held by Trustee during the past five years | | None |
| |
| Jane F. Dasher | | |
| |
| Year of birth | | 1949 |
| Position(s) with Fund | | Trustee |
| Term of office1 and length of time served2 | | Since 1999 |
| Principal occupation(s) during the past five years | | Director (since 2022) and formerly Chief Financial Officer, Long Light Capital, LLC, formerly known as Korsant Partners, LLC (a family investment company) (since 1997) |
| Number of funds in fund complex overseen by Trustee3 | | 51 |
| Other Trusteeships held by Trustee during the past five years | | Director, Visual Kinematics, Inc. (2018 to 2022) |
| |
| Anita L. DeFrantz | | |
| |
| Year of birth | | 1952 |
| Position(s) with Fund | | Trustee |
| Term of office1 and length of time served2 | | Since 1998 |
| Principal occupation(s) during the past five years | | President of Tubman Truth Corp. (since 2015); President Emeritus (since 2015) and formerly, President (1987 to 2015) and Director (1990 to 2015) of LA84 (formerly Amateur Athletic Foundation of Los Angeles); Member (since 1986), Member of the Executive Board (since 2013) and Vice President (since 2017) of the International Olympic Committee |
| Number of funds in fund complex overseen by Trustee3 | | 51 |
| Other Trusteeships held by Trustee during the past five years | | None |
| | | | |
| Western Asset SMASh Series Core Plus Completion Fund | | | | 71 |
Additional information (unaudited) (cont’d)
Information about Trustees and Officers
| | |
| Independent Trustees† (cont’d) | | |
| |
| Susan B. Kerley | | |
| |
| Year of birth | | 1951 |
| |
| Position(s) with Fund | | Trustee |
| |
| Term of office1 and length of time served2 | | Since 1992 |
| |
| Principal occupation(s) during the past five years | | Investment Consulting Partner, Strategic Management Advisors, LLC (investment consulting) (since 1990) |
| |
| Number of funds in fund complex overseen by Trustee3 | | 51 |
| |
| Other Trusteeships held by Trustee during the past five years | | Director and Trustee (since 1990) and Chairman (since 2017 and 2005 to 2012) of various series of MainStay Family of Funds (66 funds); formerly, Investment Company Institute (ICI) Board of Governors (2006 to 2014); ICI Executive Committee (2011 to 2014); and Chairman of the Independent Directors Council (2012 to 2014) |
| |
| Michael Larson | | |
| |
| Year of birth | | 1959 |
| Position(s) with Fund | | Trustee |
| Term of office1 and length of time served2 | | Since 2004 |
| Principal occupation(s) during the past five years | | Chief Investment Officer for William H. Gates III (since 1994)4 |
| Number of funds in fund complex overseen by Trustee3 | | 51 |
| Other Trusteeships held by Trustee during the past five years | | Republic Services, Inc. (since 2009); Fomento Economico Mexicano, SAB (since 2011); Ecolab Inc. (since 2012); and formerly, AutoNation, Inc. (2010 to 2018) |
| |
| Avedick B. Poladian | | |
| |
| Year of birth | | 1951 |
| Position(s) with Fund | | Trustee |
| Term of office1 and length of time served2 | | Since 2007 |
| Principal occupation(s) during the past five years | | Director and Advisor (since 2017) and former Executive Vice President and Chief Operating Officer (2002 to 2016) of Lowe Enterprises, Inc. (privately held real estate and hospitality firm); formerly, Partner, Arthur Andersen, LLP (1974 to 2002) |
| Number of funds in fund complex overseen by Trustee3 | | 51 |
| Other Trusteeships held by Trustee during the past five years | | Occidental Petroleum Corporation (since 2008); California Resources Corporation (2014 to 2021); and Public Storage (since 2010) |
| | | | |
72 | | | | Western Asset SMASh Series Core Plus Completion Fund |
| | |
| Independent Trustees† (cont’d) | | |
| |
| William E.B. Siart | | |
| |
| Year of birth | | 1946 |
| Position(s) with Fund | | Trustee and Chairman of the Board |
| Term of office1 and length of time served2 | | Since 1997 (Chairman of the Board since 2020) |
| Principal occupation(s) during the past five years | | Chairman of Excellent Education Development (since 2000); formerly, Chairman of Great Public Schools Now (2015 to 2020); Trustee of The Getty Trust (since 2005 to 2017); Chairman of Walt Disney Concert Hall, Inc. (1998 to 2006) |
| Number of funds in fund complex overseen by Trustee3 | | 51 |
| Other Trusteeships held by Trustee during the past five years | | Trustee, University of Southern California (since 1994); and formerly, Member of Board of United States Golf Association, Executive Committee Member (2017 to 2021) |
| |
| Jaynie Miller Studenmund | | |
| |
| Year of birth | | 1954 |
| Position(s) with Fund | | Trustee |
| Term of office1 and length of time served2 | | Since 2004 |
| Principal occupation(s) during the past five years | | Corporate Board Member and Advisor (since 2004); formerly, Chief Operating Officer of Overture Services, Inc. (publicly traded internet company that created search engine marketing) (2001 to 2004); President and Chief Operating Officer, PayMyBills (internet innovator in bill presentment/payment space) (1999 to 2001); Executive vice president for consumer and business banking for three national financial institutions (1984 to 1997) |
| Number of funds in fund complex overseen by Trustee3 | | 51 |
| Other Trusteeships held by Trustee during the past five years | | Director of Pacific Premier Bancorp Inc. and Pacific Premier Bank (since 2019); Director of EXL (operations management and analytics company) (since 2018); Director of CoreLogic, Inc. (information, analytics and business services company) (2012 to 2021); formerly, Director of Pinnacle Entertainment, Inc. (gaming and hospitality company) (2012 to 2018); and Director of LifeLock, Inc. (identity theft protection company) (2015 to 2017) |
| |
| Peter J. Taylor | | |
| |
| Year of birth | | 1958 |
| Position(s) with Fund | | Trustee |
| Term of office1 and length of time served2 | | Since 2019 |
| Principal occupation(s) during the past five years | | Retired; formerly, President, ECMC Foundation (nonprofit organization) (2014 to 2023); and Executive Vice President and Chief Financial Officer for University of California system (2009 to 2014) |
| Number of funds in fund complex overseen by Trustee3 | | 51 |
| Other Trusteeships held by Trustee during the past five years | | Director of 23andMe, Inc. (genetics and health care services company) (since 2021); Director of Pacific Mutual Holding Company5 (since 2016); Member of the Board of Trustees of California State University system (2015 to 2022); Ralph M. Parson Foundation (since 2015); Kaiser Family Foundation (2012 to 2022); and Edison International (since 2011) |
| | | | |
| Western Asset SMASh Series Core Plus Completion Fund | | | | 73 |
Additional information (unaudited) (cont’d)
Information about Trustees and Officers
| | |
| Interested Trustee | | |
| |
| Ronald L. Olson6 | | |
| |
| Year of birth | | 1941 |
| Position(s) with Fund | | Trustee |
| Term of office1 and length of time served2 | | Since 2005 |
| Principal occupation(s) during the past five years | | Partner of Munger, Tolles & Olson LLP (law partnership) (since 1968) |
| Number of funds in fund complex overseen by Trustee3 | | 51 |
| Other Trusteeships held by Trustee during the past five years | | Director of Berkshire Hathaway, Inc. (since 1997); and Director of Provivi, Inc. (since 2017) |
| | |
| Interested Trustee and Officer | | |
| |
| Jane Trust, CFA7 | | |
| |
| Year of birth | | 1962 |
| Position(s) with Fund | | Trustee, President and Chief Executive Officer |
| Term of office1 and length of time served2 | | Since 2015 |
| Principal occupation(s) during the past five years | | Senior Vice President, Fund Board Management, Franklin Templeton (since 2020); Officer and/or Trustee/Director of 127 funds associated with LMPFA or its affiliates (since 2015); President and Chief Executive Officer of LMPFA (since 2015); formerly, Senior Managing Director (2018 to 2020) and Managing Director (2016 to 2018) of Legg Mason & Co., LLC (“Legg Mason & Co.”); Senior Vice President of LMPFA (2015) |
| Number of funds in fund complex overseen by Trustee3 | | 127 |
| Other Trusteeships held by Trustee during the past five years | | None |
| | |
| Additional Officers | | |
| |
| Ted P. Becker | | |
| |
Franklin Templeton 280 Park Avenue, 8th Floor, New York, NY 10017 | | |
| |
| Year of birth | | 1951 |
| Position(s) with Fund | | Chief Compliance Officer |
| Term of office1 and length of time served2 | | Since 2007 |
| Principal occupation(s) during the past five years | | Vice President, Global Compliance of Franklin Templeton (since 2020); Chief Compliance Officer of LMPFA (since 2006); Chief Compliance Officer of certain funds associated with Legg Mason & Co. or its affiliates (since 2006); formerly, Director of Global Compliance at Legg Mason, Inc. (2006 to 2020); Managing Director of Compliance of Legg Mason & Co. (2005 to 2020) |
| | | | |
74 | | | | Western Asset SMASh Series Core Plus Completion Fund |
| | |
| Additional Officers (cont’d) | | |
| |
| Susan Kerr | | |
| |
Franklin Templeton 280 Park Avenue, 8th Floor, New York, NY 10017 | | |
| |
| Year of birth | | 1949 |
| Position(s) with Fund | | Chief Anti-Money Laundering Compliance Officer |
| Term of office1 and length of time served2 | | Since 2013 |
| Principal occupation(s) during the past five years | | Senior Compliance Analyst, Franklin Templeton (since 2020); Chief Anti-Money Laundering Compliance Officer of certain funds associated with Legg Mason & Co. or its affiliates (since 2013) and Anti-Money Laundering Compliance Officer (since 2012), Senior Compliance Officer (since 2011) and Assistant Vice President (since 2010) of Franklin Distributors, LLC; formerly, Assistant Vice President of Legg Mason & Co. (2010 to 2020) |
| |
| Marc A. De Oliveira | | |
| |
Franklin Templeton 100 First Stamford Place, 6th Floor, Stamford, CT 06902 | | |
| |
| Year of birth | | 1971 |
| Position(s) with Fund | | Secretary and Chief Legal Officer |
| Term of office1 and length of time served2 | | Since 2020 |
| Principal occupation(s) during the past five years | | Associate General Counsel of Franklin Templeton (since 2020); Assistant Secretary of certain funds associated with Legg Mason & Co. or its affiliates (since 2006); formerly, Managing Director (2016 to 2020) and Associate General Counsel of Legg Mason & Co. (2005 to 2020) |
| |
| Thomas C. Mandia | | |
| |
Franklin Templeton 100 First Stamford Place, 6th Floor, Stamford, CT 06902 | | |
| |
| Year of birth | | 1962 |
| Position(s) with Fund | | Senior Vice President |
| Term of office1 and length of time served2 | | Since 2020 |
| Principal occupation(s) during the past five years | | Senior Associate General Counsel of Franklin Templeton (since 2020); Secretary of LMPFA (since 2006); Assistant Secretary of certain funds associated with Legg Mason & Co. or its affiliates (since 2006); Secretary of LM Asset Services, LLC (“LMAS”) (since 2002) and Legg Mason Fund Asset Management, Inc. (“LMFAM”) (since 2013) (formerly registered investment advisers); formerly, Managing Director and Deputy General Counsel of Legg Mason & Co. (2005 to 2020) |
| | | | |
| Western Asset SMASh Series Core Plus Completion Fund | | | | 75 |
Additional information (unaudited) (cont’d)
Information about Trustees and Officers
| | |
| Additional Officers (cont’d) | | |
| |
| Christopher Berarducci | | |
| |
Franklin Templeton 280 Park Avenue, 8th Floor, New York, NY 10017 | | |
| |
| Year of birth | | 1974 |
| Position(s) with Fund | | Treasurer and Principal Financial Officer |
| Term of office1 and length of time served2 | | Since 2019 |
| Principal occupation(s) during the past five years | | Vice President, Fund Administration and Reporting, Franklin Templeton (since 2020); Treasurer (since 2010) and Principal Financial Officer (since 2019) of certain funds associated with Legg Mason & Co. or its affiliates; formerly, Managing Director (2020), Director (2015 to 2020), and Vice President (2011 to 2015) of Legg Mason & Co. |
| |
| Jeanne M. Kelly | | |
| |
Franklin Templeton 280 Park Avenue, 8th Floor, New York, NY 10017 | | |
| |
| Year of birth | | 1951 |
| Position(s) with Fund | | Senior Vice President |
| Term of office1 and length of time served2 | | Since 2007 |
| Principal occupation(s) during the past five years | | U.S. Fund Board Team Manager, Franklin Templeton (since 2020); Senior Vice President of certain funds associated with Legg Mason & Co. or its affiliates (since 2007); Senior Vice President of LMPFA (since 2006); President and Chief Executive Officer of LMAS and LMFAM (since 2015); formerly, Managing Director of Legg Mason & Co. (2005 to 2020); Senior Vice President of LMFAM (2013 to 2015) |
| † | Trustees who are not “interested persons” of the Fund within the meaning of Section 2(a)(19) of the Investment Company Act of 1940, as amended (the “1940 Act”). |
| 1 | Each Trustee and officer serves until his or her respective successor has been duly elected and qualified or until his or her earlier death, resignation, retirement or removal. |
| 2 | Indicates the earliest year in which the Trustee became a board member for a fund in the Legg Mason fund complex or the officer took such office. |
| 3 | Each board member also serves as a Director of Western Asset Investment Grade Income Fund Inc. and a Trustee of Western Asset Premier Bond Fund (closed-end investment companies), which are considered part of the same fund complex. Additionally, each board member serves as a Trustee of Western Asset Inflation-Linked Income Fund and Western Asset Inflation-Linked Opportunities & Income Fund, closed-end investment companies that are part of the same fund complex. |
| 4 | Mr. Larson is the chief investment officer for William H. Gates III and in that capacity oversees the investments of Mr. Gates and the investments of the Bill and Melinda Gates Foundation Trust (such combined investments are referred to as the “Accounts”). Since 1997, Western Asset has provided discretionary investment advice with respect to one or more Accounts. |
| 5 | Western Asset and its affiliates provide investment advisory services with respect to registered investment companies sponsored by an affiliate of Pacific Mutual Holding Company (“Pacific Holdings”). Affiliates of Pacific Holdings receive compensation from LMPFA or its affiliates for shareholder or distribution services provided with respect to registered investment companies for which Western Asset or its affiliates serve as investment adviser. |
| | | | |
76 | | | | Western Asset SMASh Series Core Plus Completion Fund |
| 6 | Mr. Olson is an “interested person” of the Fund, as defined in the 1940 Act, because his law firm has provided legal services to Western Asset. |
| 7 | Ms. Trust is an “interested person” of the Fund, as defined in the 1940 Act, because of her position with LMPFA and/or certain of its affiliates. |
| | | | |
| Western Asset SMASh Series Core Plus Completion Fund | | | | 77 |
Important tax information (unaudited)
By mid-February, tax information related to a shareholder’s proportionate share of distributions paid during the preceding calendar year will be received, if applicable. Please also refer to www.franklintempleton.com for per share tax information related to any distributions paid during the preceding calendar year. Shareholders are advised to consult with their tax advisors for further information on the treatment of these amounts on their tax returns.
The following tax information for the Fund is required to be furnished to shareholders with respect to income earned and distributions paid during its fiscal year.
The Fund hereby reports the following amounts, or if subsequently determined to be different, the maximum allowable amounts, for the fiscal period ended December 31, 2022:
| | | | | | | | |
| | | Pursuant to: | | | Amount Reported | |
| Qualified Net Interest Income (QII) | | | §871(k)(1)(C) | | | | $ 58,480,280 | |
| Section 163(j) Interest Earned | | | § 163(j) | | | | $118,723,896 | |
| Interest Earned from Federal Obligations | | | Note (1) | | | | $ 227,738 | |
Note (1) - The law varies in each state as to whether and what percentage of dividend income attributable to Federal obligations is exempt from state income tax. Shareholders are advised to consult with their tax advisors to determine if any portion of the dividends received is exempt from state income taxes.
| | | | |
78 | | | | Western Asset SMASh Series Core Plus Completion Fund |
Western Asset
SMASh Series Core Plus Completion Fund
Trustees
Robert Abeles, Jr.
Jane F. Dasher
Anita L. DeFrantz
Susan B. Kerley
Michael Larson
Ronald L. Olson
Avedick B. Poladian
William E.B. Siart
Chairman
Jaynie M. Studenmund
Peter J. Taylor
Jane Trust
Investment manager
Legg Mason Partners Fund Advisor, LLC
Subadvisers
Western Asset Management Company, LLC
Western Asset Management Company Limited
Western Asset Management Company Pte. Ltd.
Western Asset Management Company Ltd
Distributor
Franklin Distributors, LLC
Custodian
The Bank of New York Mellon
Transfer agent
Franklin Templeton Investor
Services, LLC
3344 Quality Drive
Rancho Cordova, CA 95670-7313
Independent registered public accounting firm
PricewaterhouseCoopers LLP
Baltimore, MD
Western Asset SMASh Series Core Plus Completion Fund
The Fund is a separate investment series of Legg Mason Partners Institutional Trust, a Maryland statutory trust.
Western Asset SMASh Series Core Plus Completion Fund
Legg Mason Funds
620 Eighth Avenue, 47th Floor
New York, NY 10018
The Fund files its complete schedule of portfolio holdings with the Securities and Exchange Commission (“SEC”) for the first and third quarters of each fiscal year as an exhibit to its reports on Form N-PORT. The Fund’s Forms N-PORT are available on the SEC’s website at www.sec.gov. To obtain information on Form N-PORT, shareholders can call the Fund at 877-6LM-FUND/656-3863.
Information on how the Fund voted proxies relating to portfolio securities during the prior 12-month period ended June 30th of each year and a description of the policies and procedures that the Fund uses to determine how to vote proxies related to portfolio transactions are available (1) without charge, upon request, by calling the Fund at 877-6LM-FUND/656-3863, (2) at www.franklintempleton.com and (3) on the SEC’s website at www.sec.gov.
This report is submitted for the general information of the shareholders of Western Asset SMASh Series Core Plus Completion Fund and is not intended for distribution to prospective investors.
This report must be preceded or accompanied by a free prospectus. Investors should consider the Fund’s investment objectives, risks, charges and expenses carefully before investing. The prospectus contains this and other important information about the Fund. Please read the prospectus carefully before investing.
www.franklintempleton.com
© 2023 Franklin Distributors, LLC, Member FINRA/SIPC. All rights reserved.
Legg Mason Funds Privacy and Security Notice
Your Privacy Is Our Priority
Franklin Templeton* is committed to safeguarding your personal information. This notice is designed to provide you with a summary of the non-public personal information Franklin Templeton may collect and maintain about current or former individual investors; our policy regarding the use of that information; and the measures we take to safeguard the information. We do not sell individual investors’ non-public personal information to anyone and only share it as described in this notice.
Information We Collect
When you invest with us, you provide us with your non-public personal information. We collect and use this information to service your accounts and respond to your requests. The non-public personal information we may collect falls into the following categories:
| • | | Information we receive from you or your financial intermediary on applications or other forms, whether we receive the form in writing or electronically. For example, this information may include your name, address, tax identification number, birth date, investment selection, beneficiary information, and your personal bank account information and/or email address if you have provided that information. |
| • | | Information about your transactions and account history with us, or with other companies that are part of Franklin Templeton, including transactions you request on our website or in our app. This category also includes your communications to us concerning your investments. |
| • | | Information we receive from third parties (for example, to update your address if you move, obtain or verify your email address or obtain additional information to verify your identity). |
| • | | Information collected from you online, such as your IP address or device ID and data gathered from your browsing activity and location. (For example, we may use cookies to collect device and browser information so our website recognizes your online preferences and device information.) Our website contains more information about cookies and similar technologies and ways you may limit them. |
| • | | Other general information that we may obtain about you such as demographic information. |
Disclosure Policy
To better service your accounts and process transactions or services you requested, we may share non-public personal information with other Franklin Templeton companies. From time to time we may also send you information about products/services offered by other Franklin Templeton companies although we will not share your non-public personal information with these companies without first offering you the opportunity to prevent that sharing.
We will only share non-public personal information with outside parties in the limited circumstances permitted by law. For example, this includes situations where we need to share information with companies who work on our behalf to service or maintain your account or process transactions you requested, when the disclosure is to companies assisting us with our own marketing efforts, when the disclosure is to a party representing you, or when required by law (for example, in response to legal process). Additionally, we will ensure that any outside
|
| NOT PART OF THE ANNUAL REPORT |
Legg Mason Funds Privacy and Security Notice (cont’d)
companies working on our behalf, or with whom we have joint marketing agreements, are under contractual obligations to protect the confidentiality of your information, and to use it only to provide the services we asked them to perform.
Confidentiality and Security
Our employees are required to follow procedures with respect to maintaining the confidentiality of our investors’ non-public personal information. Additionally, we maintain physical, electronic and procedural safeguards to protect the information. This includes performing ongoing evaluations of our systems containing investor information and making changes when appropriate.
At all times, you may view our current privacy notice on our website at franklintempleton.com or contact us for a copy at (800) 632-2301.
*For purposes of this privacy notice Franklin Templeton shall refer to the following entities:
Fiduciary Trust International of the South (FTIOS), as custodian for individual retirement plans Franklin Advisers, Inc.
Franklin Distributors, LLC, including as program manager of the Franklin Templeton 529 College Savings Plan and the NJBEST 529 College Savings Plan
Franklin Mutual Advisers, LLC
Franklin, Templeton and Mutual Series Funds
Franklin Templeton Institutional, LLC
Franklin Templeton Investments Corp., Canada
Franklin Templeton Investments Management, Limited UK
Franklin Templeton Portfolio Advisors, Inc.
Legg Mason Funds serviced by Franklin Templeton Investor Services, LLC
Templeton Asset Management, Limited
Templeton Global Advisors, Limited
Templeton Investment Counsel, LLC
If you are a customer of other Franklin Templeton affiliates and you receive notices from them, you will need to read those notices separately.
|
| NOT PART OF THE ANNUAL REPORT |
www.franklintempleton.com
© 2023 Franklin Distributors, LLC, Member FINRA/SIPC. All rights reserved.
AMXX010550 2/23 SR23-4612
The registrant has adopted a code of ethics that applies to the registrant’s principal executive officer, principal financial officer, principal accounting officer or controller.
| ITEM 3. | AUDIT COMMITTEE FINANCIAL EXPERT. |
The Board of Trustees of the registrant has determined that Robert Abeles, Jr., possess the technical attributes identified in Instruction 2(b) of Item 3 to Form N-CSR to qualify an “audit committee financial experts,” and has designated Mr. Abeles, Jr. as the Audit Committee’s financial experts. Mr. Abeles, Jr. is an “independent” Trustees pursuant to paragraph (a) (2) of Item 3 to Form N-CSR.
| ITEM 4. | PRINCIPAL ACCOUNTANT FEES AND SERVICES. |
a) Audit Fees. The aggregate fees billed in the last two fiscal years ending February 28, 2022 and December 31, 2022 (the “Reporting Periods”) for professional services rendered by the Registrant’s principal accountant (the “Auditor”) for the audit of the Registrant’s annual financial statements, or services that are normally provided by the Auditor in connection with the statutory and regulatory filings or engagements for the Reporting Periods, were $199,262 in February 28, 2022 and $50,000 for the 10 month period ended December 31, 2022.
b) Audit-Related Fees. The aggregate fees billed in the Reporting Period for assurance and related services by the Auditor that are reasonably related to the performance of the Registrant’s financial statements were $0 in February 28, 2022 and $0 for the 10 month period ended December 31, 2022.
(c) Tax Fees. The aggregate fees billed in the Reporting Periods for professional services rendered by the Auditor for tax compliance, tax advice and tax planning (“Tax Services”) were $50,000 in February 28, 2022 and $10,000 for the 10 month period ended December 31, 2022. These services consisted of (i) review or preparation of U.S. federal, state, local and excise tax returns; (ii) U.S. federal, state and local tax planning, advice and assistance regarding statutory, regulatory or administrative developments, and (iii) tax advice regarding tax qualification matters and/or treatment of various financial instruments held or proposed to be acquired or held. There were no fees billed for tax services by the Auditors to service affiliates during the Reporting Periods that required pre-approval by the Audit Committee.
d) All Other Fees. The aggregate fees billed in the Reporting Periods for products and services provided by the Auditor, other than the services reported in paragraphs (a) through (c) for the Item 4 for the Legg Mason Partners Institutional Trust were $0 in February 28, 2022 and $0 for the 10 month period ended December 31, 2022.
All Other Fees. There were no other non-audit services rendered by the Auditor to Legg Mason Partners Fund Advisors, LLC (“LMPFA”), and any entity controlling, controlled by or under common control with LMPFA that provided ongoing services to Legg Mason Partners Institutional Trust requiring pre-approval by the Audit Committee in the Reporting Period.
(e) Audit Committee’s pre–approval policies and procedures described in paragraph (c) (7) of Rule 2-01 of Regulation S-X.
(1) The Charter for the Audit Committee (the “Committee”) of the Board of each registered investment company (the “Fund”) advised by LMPFA or one of their affiliates (each, an “Adviser”) requires that the Committee shall approve (a) all audit and permissible non-audit services to be provided to the Fund and (b) all permissible non-audit services to be provided by
the Fund’s independent auditors to the Adviser and any Covered Service Providers if the engagement relates directly to the operations and financial reporting of the Fund. The Committee may implement policies and procedures by which such services are approved other than by the full Committee.
The Committee shall not approve non-audit services that the Committee believes may impair the independence of the auditors. As of the date of the approval of this Audit Committee Charter, permissible non-audit services include any professional services (including tax services), that are not prohibited services as described below, provided to the Fund by the independent auditors, other than those provided to the Fund in connection with an audit or a review of the financial statements of the Fund. Permissible non-audit services may not include: (i) bookkeeping or other services related to the accounting records or financial statements of the Fund; (ii) financial information systems design and implementation; (iii) appraisal or valuation services, fairness opinions or contribution-in-kind reports; (iv) actuarial services; (v) internal audit outsourcing services; (vi) management functions or human resources; (vii) broker or dealer, investment adviser or investment banking services; (viii) legal services and expert services unrelated to the audit; and (ix) any other service the Public Company Accounting Oversight Board determines, by regulation, is impermissible.
Pre-approval by the Committee of any permissible non-audit services is not required so long as: (i) the aggregate amount of all such permissible non-audit services provided to the Fund, the Adviser and any service providers controlling, controlled by or under common control with the Adviser that provide ongoing services to the Fund (“Covered Service Providers”) constitutes not more than 5% of the total amount of revenues paid to the independent auditors during the fiscal year in which the permissible non-audit services are provided to (a) the Fund, (b) the Adviser and (c) any entity controlling, controlled by or under common control with the Adviser that provides ongoing services to the Fund during the fiscal year in which the services are provided that would have to be approved by the Committee; (ii) the permissible non-audit services were not recognized by the Fund at the time of the engagement to be non-audit services; and (iii) such services are promptly brought to the attention of the Committee and approved by the Committee (or its delegate(s)) prior to the completion of the audit.
(2) None of the services described in paragraphs (b) through (d) of this Item were performed in reliance on paragraph (c)(7)(i)(C) of Rule 2-01 of Regulation S-X.
(f) Not applicable.
(g) Non-audit fees billed by the Auditor for services rendered to Legg Mason Partners Institutional Trust, LMPFA and any entity controlling, controlled by, or under common control with LMPFA that provides ongoing services to Legg Mason Partners Institutional Trust during the reporting period were $343,489 in February 28, 2022 and $350,359 for the 10 month period ended December 31, 2022.
(h) Yes. Legg Mason Partners Institutional Trust’s Audit Committee has considered whether the provision of non-audit services that were rendered to Service Affiliates, which were not pre-approved (not requiring pre-approval), is compatible with maintaining the Accountant’s independence. All services provided by the Auditor to the Legg Mason Partners Institutional Trust or to Service Affiliates, which were required to be pre-approved, were pre-approved as required.
(i) Not applicable.
(j) Not applicable.
| ITEM 5. | AUDIT COMMITTEE OF LISTED REGISTRANTS. |
| | a) | The independent board members are acting as the registrant’s audit committee as specified in Section 3(a)(58)(B) of the Exchange Act. The Audit Committee consists of the following Board members: |
Robert Abeles, Jr.
Jane F. Dasher
Anita L. DeFrantz
Susan B. Kerley
Michael Larson
Avedick B. Poladian
William E.B. Siart
Jaynie M. Studenmund
Peter J. Taylor
| ITEM 6. | SCHEDULE OF INVESTMENTS. |
Included herein under Item 1.
| ITEM 7. | DISCLOSURE OF PROXY VOTING POLICIES AND PROCEDURES FOR CLOSED-END MANAGEMENT INVESTMENT COMPANIES. |
Not applicable.
| ITEM 8. | PORTFOLIO MANAGERS OF CLOSED-END MANAGEMENT INVESTMENT COMPANIES. |
Not applicable.
| ITEM 9. | PURCHASES OF EQUITY SECURITIES BY CLOSED-END MANAGEMENT INVESTMENT COMPANY AND AFFILIATED PURCHASERS. |
Not applicable.
| ITEM 10. | SUBMISSION OF MATTERS TO A VOTE OF SECURITY HOLDERS. |
Not applicable.
| ITEM 11. | CONTROLS AND PROCEDURES. |
| | (a) | The registrant’s principal executive officer and principal financial officer have concluded that the registrant’s disclosure controls and procedures (as defined in Rule 30a- 3(c) under the Investment Company Act of 1940, as amended (the “1940 Act”)) are effective as of a date within 90 days of the filing date of this report that includes the disclosure required by this paragraph, based on their evaluation of the disclosure controls and procedures required by Rule 30a-3(b) under the 1940 Act and 15d-15(b) under the Securities Exchange Act of 1934. |
| | (b) | There were no changes in the registrant’s internal control over financial reporting (as defined in Rule 30a-3(d) under the 1940 Act) that occurred during the period covered by |
| | this report that have materially affected, or are likely to materially affect the registrant’s internal control over financial reporting. |
| ITEM 12. | DISCLOSURE OF SECURITIES LENDING ACTIVITIES FOR CLOSED-END MANAGEMENT INVESTMENT COMPANIES. |
Not applicable.
(a)(1) Code of Ethics attached hereto.
Exhibit 99.CODE ETH
(a) (2) Certifications pursuant to section 302 of the Sarbanes-Oxley Act of 2002 attached hereto.
Exhibit 99.CERT
(b) Certifications pursuant to Section 906 of the Sarbanes-Oxley Act of 2002 attached hereto.
Exhibit 99.906CERT
SIGNATURES
Pursuant to the requirements of the Securities Exchange Act of 1934 and the Investment Company Act of 1940, the registrant has duly caused this Report to be signed on its behalf by the undersigned, there unto duly authorized.
Legg Mason Partners Institutional Trust
| | |
| By: | | /s/ Jane Trust |
| | Jane Trust |
| | Chief Executive Officer |
Date: February 28, 2023
Pursuant to the requirements of the Securities Exchange Act of 1934 and the Investment Company Act of 1940, this report has been signed below by the following persons on behalf of the registrant and in the capacities and on the dates indicated.
| | |
| By: | | /s/ Jane Trust |
| | Jane Trust |
| | Chief Executive Officer |
|
| Date: February 28, 2023 |
| |
| By: | | /s/ Christopher Berarducci |
| | Christopher Berarducci |
| | Principal Financial |
|
| Date: February 28, 2023 |