UNITED STATES
SECURITIES AND EXCHANGE COMMISSION
Washington, D.C. 20549
FORM N-CSR
CERTIFIED SHAREHOLDER REPORT OF REGISTERED
MANAGEMENT INVESTMENT COMPANIES
Investment Company Act file number 811-06740
Legg Mason Partners Institutional Trust
(Exact name of registrant as specified in charter)
620 Eighth Avenue, 47th Floor, New York, NY 10018
(Address of principal executive offices) (Zip code)
Marc A. De Oliveira
Franklin Templeton
100 First Stamford Place
Stamford, CT 06902
(Name and address of agent for service)
Registrant’s telephone number, including area code: 877-6LM-FUND/656-3863
Date of fiscal year end: February 29
Date of reporting period: February 29, 2024
| ITEM 1. | REPORT TO STOCKHOLDERS. |
The Annual Report to Stockholders is filed herewith.

| | |
| Annual Report | | February 29, 2024 |
WESTERN ASSET
SMASh SERIES TF FUND
The Securities and Exchange Commission has adopted new regulations that will result in changes to the design and delivery of annual and semi-annual shareholder reports beginning in July 2024.
If you have previously elected to receive shareholder reports electronically, you will continue to do so and need not take any action.
Otherwise, paper copies of the Fund’s shareholder reports will be mailed to you beginning in July 2024. If you would like to receive shareholder reports and other communications from the Fund electronically instead of by mail, you may make that request at any time by contacting your financial intermediary (such as a broker-dealer or bank).

|
| INVESTMENT PRODUCTS: NOT FDIC INSURED • NO BANK GUARANTEE • MAY LOSE VALUE |
Fund objective
The Fund seeks to maximize current interest income that is excluded from gross income for regular federal income tax purposes.
Letter from the president

Dear Shareholder,
We are pleased to provide the annual report of Western Asset SMASh Series TF Fund for the twelve-month reporting period ended February 29, 2024. Please read on for a detailed look at prevailing economic and market conditions during the Fund’s reporting period and to learn how those conditions have affected Fund performance.
Special shareholder notice
Effective March 1, 2024, Michael C. Buchanan and Ryan K. Brist joined the Fund’s portfolio management team and S. Kenneth Leech no longer serves as a member of the Fund’s portfolio management team. For more information, please see the Fund’s prospectus supplement dated March 1, 2024.
As always, thank you for your confidence in our stewardship of your assets.
Sincerely,

Jane Trust, CFA
President and Chief Executive Officer
March 28, 2024
| | |
II | | Western Asset SMASh Series TF Fund |
Fund overview
Q. What is the Fund’s investment strategy?
A. The Fund seeks to maximize current interest income that is excluded from gross income for regular federal income tax purposes. Under normal circumstances, the Fund invests at least 80% of its assets in municipal securities and other investments with similar economic characteristics, the interest on which is exempt from regular federal income tax but which may be subject to the federal alternative minimum tax. Municipal securities include debt obligations issued by any of the 50 states and certain other municipal issuers and their political subdivisions, agencies and public authorities, certain other governmental issuers (such as Puerto Rico, the U.S. Virgin Islands and Guam) and other qualifying issuers. These securities include participation or other interests in municipal securities issued or backed by banks, insurance companies and other financial institutions.
Although the Fund may invest in securities of any maturity, it normally invests in intermediate-term and long-term municipal securities that have remaining maturities from one to more than thirty years at the time of purchase. The Fund typically focuses on investment grade bonds (that is, securities rated in the Baa/BBB categories or above or, if unrated, that we determined to be of comparable credit quality) but may from time to time invest, to no specified limit, in below investment grade bonds (commonly known as “high yield” or “junk” bonds).
Some municipal securities, such as general obligation issues, are backed by the issuer’s taxing authority, while other municipal securities, such as revenue issues, are backed only by revenues from certain facilities or other sources and not by the issuer itself.
Instead of, and/or in addition to, investing directly in particular securities, the Fund may use instruments such as derivatives, including options, futures contracts and inverse floating rate instruments issued in tender option bond transactions, and other synthetic instruments that are intended to provide economic exposure to the securities or the issuer or to be used as a hedging technique. The Fund may use one or more types of these instruments without limit, except that these instruments are taken into account when determining compliance with the Fund’s 80% investment policy. The Fund may also engage in a variety of transactions using derivatives in order to change the investment characteristics of its portfolio (such as shortening or lengthening duration) and for other purposes. The Fund may leverage its assets by investing proceeds received through tender option bond transactions, which is considered a form of borrowing.
The fund is classified as “non-diversified,” which means it may invest a larger percentage of its assets in a smaller number of issuers than a diversified fund.
At Western Asset Management Company, LLC (“Western Asset”), the Fund’s subadviser, we utilize a fixed income team approach, with decisions derived from interaction among various investment management sector specialists. The sector teams are comprised of Western Asset’s senior portfolio management personnel, research analysts and an in-house
| | | | | | |
| Western Asset SMASh Series TF Fund 2024 Annual Report | | | | | 1 | |
Fund overview (cont’d)
economist. Under this team approach, management of client fixed income portfolios will reflect a consensus of interdisciplinary views within the Western Asset organization.
Q. What were the overall market conditions during the Fund’s reporting period?
A. The fixed income market experienced periods of elevated volatility and posted a positive return during the twelve-month reporting period ended February 29, 2024. The market was impacted by several factors, including initial fears of an economic recession, persistent inflation, and shifting expectations for Federal Reserve Board (the “Fed”) monetary policy. There was also brief turmoil in the regional banking industry and a host of geopolitical issues that impacted investor sentiment. The market ended 2023 on a positive note, as the Fed indicated it would likely pivot from raising rates to cutting rates in 2024. However, the Fed appears to be taking a measured approach, which has pushed back expectations in terms of the timing for rate cuts in 2024. Meanwhile, there are signs that the central bank may orchestrate a “soft landing” for the economy.
Short-term U.S. Treasury yields declined as inflation moderated and the Fed indicated the likely end of its rate hike cycle. The yield for the two-year Treasury note began the reporting period at 4.81% and ended the period at 4.64%. The low of 3.75% was on May 4, 2023, and the peak of 5.19% occurred on October 17 and 18, 2023. The yield for the ten-year Treasury note began the reporting period at 3.92% and ended the period at 4.25%. The low of 3.30% was on April 5 and 6, 2023, and the peak of 4.98% occurred on October 19, 2023.
The municipal bond market generated a positive return and outperformed its taxable bond counterpart during the twelve-month reporting period. Over that time, the Bloomberg Municipal Bond Indexi and the Bloomberg U.S. Aggregate Indexii returned 5.42% and 3.33%, respectively. Both the taxable and tax-free markets were impacted by rising interest rates.
Q.How did we respond to these changing market conditions?
A. There were several adjustments to the Fund during the reporting period. We increased the Fund’s duration over the period. Elsewhere, we increased the Fund’s allocations to the industrial revenue sector, whereas we pared its health care exposure. From a quality perspective, we added to Fund’s allocation to AA-rated bonds, while paring exposure to BBB-rated bonds.
Performance review
For the twelve months ended February 29, 2024, Western Asset SMASh Series TF Fund returned 6.99%. The Fund’s unmanaged benchmark, the Bloomberg Municipal Bond Index, returned 5.42% for the same period.
| | | | | | | | |
Performance Snapshot as of February 29, 2024
(unaudited) | |
| | | 6 months | | | 12 months | |
| Western Asset SMASh Series TF Fund | | | 5.48 | % | | | 6.99 | % |
| Bloomberg Municipal Bond Index | | | 4.33 | % | | | 5.42 | % |
| | | | |
2 | | | | Western Asset SMASh Series TF Fund 2024 Annual Report |
The performance shown represents past performance. Past performance is no guarantee of future results and current performance may be higher or lower than the performance shown above. Principal value, investment returns and yields will fluctuate and investors’ shares, when redeemed, may be worth more or less than their original cost. To obtain performance data current to the most recent month-end, please call the Fund at 877-6LM-FUND/656-3863.
Fund returns assume the reinvestment of all distributions at net asset value and the deduction of all Fund expenses. Returns have not been adjusted to include the deduction of taxes that a shareholder would pay on Fund distributions. Performance figures for periods shorter than one year represent cumulative figures and are not annualized.
Investors should understand that the Fund is managed within the context of a separately managed account and not with the objective of matching or exceeding the Fund’s stated benchmark, which is used for Fund reporting purposes. As such, comparisons of the Fund’s performance to that of the indicated benchmark are not likely to be meaningful. Additionally, performance figures do not reflect the effect of fees and expenses associated with a separately managed account or the management fee or other operating expenses of the Fund. Such management fees are paid directly or indirectly by the separately managed account sponsor to the Fund’s manager or subadviser. All operating expenses of the Fund (other than interest, brokerage, taxes and extraordinary expenses) are reimbursed by the manager.
|
| Total Annual Operating Expenses (unaudited) |
As of the Fund’s current prospectus dated June 29, 2023, the gross total annual fund operating expense ratio for the Fund was 0.21%.
Actual expenses may be higher. For example, expenses may be higher than those shown if average net assets decrease. Net assets are more likely to decrease and Fund expense ratios are more likely to increase when markets are volatile.
The Fund’s manager has entered into an expense reimbursement arrangement with the Fund, pursuant to which the Fund’s manager has agreed to reimburse 100% of the Fund’s ordinary operating expenses. The expense reimbursement arrangement does not cover interest, brokerage, taxes and extraordinary expenses. This expense reimbursement arrangement cannot be terminated prior to December 31, 2025 without the Board of Trustees’ consent. However, all Fund shareholders are participating in separately managed account programs and pay fees to program sponsors for the costs and expenses of the program, including fees for investment advice and portfolio execution, some of which are used to compensate the Fund’s manager or subadviser for managing the Fund and to reimburse the Fund for all operating expenses.
Q. What were the leading contributors to performance?
A. The largest contributor to the Fund’s relative performance during the reporting period was its security selection within a number of areas. Specifically, selection within the state general obligation, local general obligation and special tax obligation sectors was beneficial, as was selection within AA and BBB-rated bonds. Additionally, an overweight to BBB-rated securities and to the industrial revenue sector contributed to results.
| | | | | | |
| Western Asset SMASh Series TF Fund 2024 Annual Report | | | | | 3 | |
Fund overview (cont’d)
Q. What were the leading detractors from performance?
A. Looking at sector positioning, security selection within the power sector detracted from returns, as did an overweight to the special tax obligation sector. An allocation to cash securities also detracted from results.
Thank you for your investment in the Western Asset SMASh Series TF Fund. As always, we appreciate that you have chosen us to manage your assets and we remain focused on achieving the Fund’s investment goals.
Sincerely,
Western Asset Management Company, LLC
March 13, 2024
RISKS: Investments in fixed income securities are subject to interest rate and credit risks. As interest rates rise, bond prices fall, thereby reducing the value of the Fund’s share price. High yield (“junk”) bonds possess greater price volatility, illiquidity and possibility of default. Municipal securities purchased by the Fund may be adversely affected by changes in the financial condition of municipal issuers and insurers, regulatory and political developments, uncertainties and public perceptions, and other factors. The Fund may use derivatives, such as options and futures, which can be illiquid, may disproportionately increase losses and have a potentially large impact on Fund performance. The use of leverage may increase volatility and possibility of loss. The Fund is classified as “non-diversified,” which means it may invest a larger percentage of its assets in a smaller number of issuers than a diversified fund. To the extent the Fund invests its assets in a small number of issuers, the Fund will be more susceptible to negative events affecting those issuers. The Fund may enter into tender option bond (“TOB”) transactions, which expose the Fund to leverage and credit risk, and generally involve greater risk than investments in fixed rate municipal bonds, including the risk of loss of principal. The interest payments that the Fund would typically receive on inverse floaters acquired in such transactions vary inversely with short-term interest rates and will be reduced (and potentially eliminated) when short-term interest rates increase. Inverse floaters will generally underperform the market for fixed rate municipal securities when interest rates rise. The value and market for inverse floaters can be volatile, and inverse floaters can have limited liquidity. Investments in inverse floaters issued in TOB transactions are derivative instruments and, therefore, are also subject to the risks generally applicable to investments in derivatives. The market values of securities or other assets will fluctuate, sometimes sharply and unpredictably, due to changes in general market conditions, overall economic trends or events, governmental actions or intervention, actions taken by the U.S. Federal Reserve or foreign central banks, market disruptions caused by trade disputes or other factors, political developments, armed conflicts, economic sanctions and countermeasures in response to sanctions, major cybersecurity events, investor sentiment, the global and domestic effects of a pandemic, and other factors that may or may not be related to the issuer of the security or other asset. Please see the Fund’s prospectus for a more complete discussion of these and other risks and the Fund’s investment strategies.
| | | | |
4 | | | | Western Asset SMASh Series TF Fund 2024 Annual Report |
The mention of sector breakdowns is for informational purposes only and should not be construed as a recommendation to purchase or sell any securities. The information provided regarding such sectors is not a sufficient basis upon which to make an investment decision. Investors seeking financial advice regarding the appropriateness of investing in any securities or investment strategies discussed should consult their financial professional. Portfolio holdings are subject to change at any time and may not be representative of the portfolio managers’ current or future investments. The Fund’s top five sector holdings (as a percentage of net assets) as of February 29, 2024 were: transportation (17.3%), industrial revenue (14.1%), special tax obligation (10.8%), leasing (9.6%) and local general obligation (8.9%). The Fund’s portfolio composition is subject to change at any time.
All investments are subject to risk including the possible loss of principal. Past performance is no guarantee of future results. All index performance reflects no deduction for fees, expenses or taxes. Please note that an investor cannot invest directly in an index.
The information provided is not intended to be a forecast of future events, a guarantee of future results or investment advice. Views expressed may differ from those of the firm as a whole.
| i | The Bloomberg Municipal Bond Index is a market value weighted index of investment grade municipal bonds with maturities of one year or more. |
| ii | The Bloomberg U.S. Aggregate Index is a broad-based bond index comprised of government, corporate, mortgage-and asset-backed issues, rated investment grade or higher, and having at least one year to maturity. |
| | | | | | |
| Western Asset SMASh Series TF Fund 2024 Annual Report | | | | | 5 | |
Fund at a glance† (unaudited)
Investment breakdown (%) as a percent of total investments
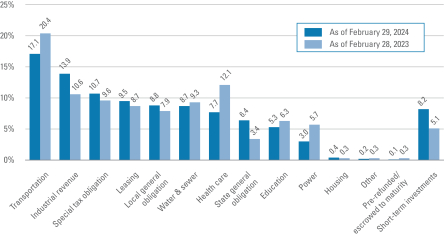
| † | The bar graph above represents the composition of the Fund’s investments as of February 29, 2024 and February 28, 2023 and does not include derivatives, such as futures contracts. The Fund is actively managed. As a result, the composition of the Fund’s investments is subject to change at any time. |
| | | | |
6 | | | | Western Asset SMASh Series TF Fund 2024 Annual Report |
Fund expenses (unaudited)
Example
As a shareholder of the Fund, you may incur two types of costs: (1) transaction costs and (2) ongoing costs and other Fund expenses. This example is intended to help you understand your ongoing costs (in dollars) of investing in the Fund and to compare these costs with the ongoing costs of investing in other mutual funds.
This example is based on an investment of $1,000 invested on September 1, 2023 and held for the six months ended February 29, 2024.
Actual expenses
The table below titled “Based on actual total return” provides information about actual account values and actual expenses. You may use the information provided in this table, together with the amount you invested, to estimate the expenses that you paid over the period. To estimate the expenses you paid on your account, divide your ending account value by $1,000 (for example, an $8,600 ending account value divided by $1,000 = 8.6), then multiply the result by the number under the heading entitled “Expenses Paid During the Period”.
Hypothetical example for comparison purposes
The table below titled “Based on hypothetical total return” provides information about hypothetical account values and hypothetical expenses based on the actual expense ratio and an assumed rate of return of 5.00% per year before expenses, which is not the Fund’s actual return. The hypothetical account values and expenses may not be used to estimate the actual ending account balance or expenses you paid for the period. You may use the information provided in this table to compare the ongoing costs of investing in the Fund and other funds. To do so, compare the 5.00% hypothetical example relating to the Fund with the 5.00% hypothetical examples that appear in the shareholder reports of the other funds.
Please note that the expenses shown in the table below are meant to highlight your ongoing costs only and do not reflect any transactional costs. Therefore, the table is useful in comparing ongoing costs only, and will not help you determine the relative total costs of owning different funds. In addition, if these transaction costs were included, your costs would have been higher.
| | | | | | | | | | | | | | | | | | | | | | | | | | | | | | | | | | | | | | | | | | | | | | | | | | |
| | |
| Based on actual total return1 | | | | Based on hypothetical total return1 |
Actual
Total
Return2,3 | | Beginning
Account
Value | | Ending
Account
Value | | Annualized
Expense
Ratio3 | | Expenses
Paid During
the Period3,4 | | | | Hypothetical
Annualized
Total Return | | Beginning
Account
Value | | Ending
Account
Value | | Annualized
Expense
Ratio3 | | Expenses
Paid During
the Period3,4 |
| | | 5.48% | | | | $ | 1,000.00 | | | | $ | 1,054.80 | | | | | 0.05 | %5 | | | $ | 0.26 | | | | | | | 5.00 | % | | | | $1,000.00 | | | | $ | 1,024.61 | | | | | 0.05 | %5 | | | $ | 0.25 | |
| 1 | For the six months ended February 29, 2024. |
| 2 | Total return is not annualized, as it may not be representative of the total return for the year. Past performance is no guarantee of future results. Performance figures do not reflect any fees stated below in Note 3. If such fees were included, the return shown would have been lower. |
| 3 | All figures do not reflect the effect of fees and expenses associated with a separately managed account, nor a management fee or other operating expenses of the Fund. Such management fees are paid directly or indirectly by the separately managed account sponsor to the Fund’s manager or subadviser. All operating expenses of the Fund were reimbursed by the manager, pursuant to an expense reimbursement arrangement between the Fund and the manager. The expense reimbursement arrangement does not cover interest, brokerage, taxes and extraordinary expenses. |
| 4 | Expenses (net of compensating balance arrangements, fee waivers and/or expense reimbursements) are equal to the Fund’s annualized expense ratio multiplied by the average account value over the period, multiplied by the number of days in the most recent fiscal half-year (182), then divided by 366. |
| 5 | Expense ratio reflects the impact of interest expense related to tender option bond transactions accounted for as secured borrowings for financial reporting purposes. Refer to Note 1 in the Notes to Financial Statements. |
| | | | | | |
| Western Asset SMASh Series TF Fund 2024 Annual Report | | | | | 7 | |
Fund performance (unaudited)
| | | | |
| Average annual total returns1 | |
| Twelve Months Ended 2/29/24 | | | 6.99 | % |
| Five Years Ended 2/29/24 | | | 2.55 | |
| Inception date of 12/23/15 through 2/29/24 | | | 2.66 | |
| | | | |
| Cumulative total returns1 | |
| Inception date of 12/23/15 through 2/29/24 | | | 24.00 | % |
All figures represent past performance and are not a guarantee of future results. Investment return and principal value of an investment will fluctuate so that an investor’s shares, when redeemed, may be worth more or less than their original cost. The returns shown do not reflect the deduction of taxes that a shareholder would pay on Fund distributions or the redemption of Fund shares. Performance figures may reflect compensating balance arrangements, fee waivers and/or expense reimbursements. In the absence of compensating balance arrangements, fee waivers and/or expense reimbursements, the total return would have been lower. Performance figures do not reflect the effect of fees and expenses associated with a separately managed account or a management fee or other operating expenses of the Fund. Such management fees are paid directly or indirectly by the separately managed account sponsor to the Fund’s manager or subadviser. All operating expenses of the Fund (other than interest, brokerage, taxes and extraordinary expenses) were reimbursed by the manager due to an expense reimbursement arrangement between the Fund and the manager. This arrangement cannot be terminated prior to December 31, 2025 without the Board of Trustees’ consent.
| 1 | Assumes the reinvestment of all distributions, including returns of capital, if any, at net asset value. |
| | | | |
8 | | | | Western Asset SMASh Series TF Fund 2024 Annual Report |
Historical performance
Value of $10,000 invested in
Shares of Western Asset SMASh Series TF Fund vs. Bloomberg Municipal Bond Index† — December 23, 2015 - February 29, 2024
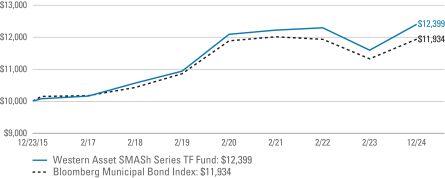
All figures represent past performance and are not a guarantee of future results. Investment return and principal value of an investment will fluctuate so that an investor’s shares, when redeemed, may be worth more or less than their original cost. The returns shown do not reflect the deduction of taxes that a shareholder would pay on Fund distributions or the redemption of Fund shares. Performance figures may reflect compensating balance arrangements, fee waivers and/or expense reimbursements. In the absence of compensating balance arrangements, fee waivers and/or expense reimbursements, the total return would have been lower. Performance figures do not reflect the effect of fees and expenses associated with a separately managed account or a management fee or other operating expenses of the Fund. Such management fees are paid directly or indirectly by the separately managed account sponsor to the Fund’s manager or subadviser. All operating expenses of the Fund (other than interest, brokerage, taxes and extraordinary expenses) were reimbursed by the manager due to an expense reimbursement arrangement between the Fund and the manager. This arrangement cannot be terminated prior to December 31, 2025 without the Board of Trustees’ consent.
| † | Hypothetical illustration of $10,000 invested in Western Asset SMASh Series TF Fund on December 23, 2015 (inception date), assuming the reinvestment of all distributions, including returns of capital, if any, at net asset value through February 29, 2024. The hypothetical illustration also assumes a $10,000 investment in the Bloomberg Municipal Bond Index. The Bloomberg Municipal Bond Index (the “Index”) is a market value weighted index of investment grade municipal bonds with maturities of one year or more. The Index is unmanaged and is not subject to the same management and trading expenses as a mutual fund. Please note that an investor cannot invest directly in an index. |
| | | | | | |
| Western Asset SMASh Series TF Fund 2024 Annual Report | | | | | 9 | |
Schedule of investments
February 29, 2024
Western Asset SMASh Series TF Fund
(Percentages shown based on Fund net assets)
| | | | | | | | | | | | | | | | |
| Security | | Rate | | | Maturity
Date | | | Face
Amount | | | Value | |
| Municipal Bonds — 90.9% | | | | | | | | | | | | | | | | |
Alabama — 5.2% | | | | | | | | | | | | | | | | |
Black Belt Energy Gas District, AL, Gas Project Revenue Bonds: | | | | | | | | | | | | | | | | |
Project No 6, Series B | | | 4.000 | % | | | 12/1/26 | | | $ | 80,000 | | | $ | 80,119 | (a)(b) |
Series D-1, Refunding | | | 5.500 | % | | | 2/1/29 | | | | 200,000 | | | | 213,053 | (a)(b) |
Series F | | | 5.500 | % | | | 12/1/28 | | | | 750,000 | | | | 797,179 | (a)(b) |
Energy Southeast, A Cooperative District Energy, AL, Supply Revenue, Series B-1 | | | 5.750 | % | | | 11/1/31 | | | | 1,000,000 | | | | 1,112,128 | (a)(b) |
Hoover, AL, IDA Revenue, United States Steel Corp. Project, Series 2019 | | | 5.750 | % | | | 10/1/49 | | | | 100,000 | | | | 103,409 | (c) |
Jefferson County, AL, Sewer Revenue: | | | | | | | | | | | | | | | | |
Warrants, Series 2024, Refunding | | | 5.250 | % | | | 10/1/49 | | | | 1,000,000 | | | | 1,076,431 | |
Warrants, Series 2024, Refunding | | | 5.500 | % | | | 10/1/53 | | | | 750,000 | | | | 820,306 | |
Southeast Alabama Gas Supply District, Gas Supply Revenue: | | | | | | | | | | | | | | | | |
Project No 1, Series A, Refunding | | | 5.000 | % | | | 4/1/32 | | | | 500,000 | | | | 532,811 | |
Project No 2, Series A | | | 4.000 | % | | | 6/1/24 | | | | 645,000 | | | | 645,375 | (a)(b) |
Total Alabama | | | | | | | | | | | | | | | 5,380,811 | |
Alaska — 0.2% | | | | | | | | | | | | | | | | |
Alaska State Housing Finance Corp. Revenue, State Capital Project II, Series B, Refunding | | | 5.000 | % | | | 12/1/37 | | | | 75,000 | | | | 80,781 | |
Anchorage, AK, Port Revenue, Series A | | | 5.000 | % | | | 12/1/50 | | | | 150,000 | | | | 154,101 | (c) |
Total Alaska | | | | | | | | | | | | | | | 234,882 | |
Arizona — 3.4% | | | | | | | | | | | | | | | | |
Arizona State IDA, Education Revenue: | | | | | | | | | | | | | | | | |
Academies Math & Science Project, Refunding, SD Credit Program | | | 5.000 | % | | | 7/1/37 | | | | 45,000 | | | | 46,465 | |
Academies Math & Science Project, Refunding, SD Credit Program | | | 5.000 | % | | | 7/1/38 | | | | 500,000 | | | | 515,796 | |
Academies Math & Science Project, Series S, Refunding, SD Credit Program | | | 5.000 | % | | | 7/1/47 | | | | 50,000 | | | | 50,684 | |
Chandler, AZ, IDA Revenue: | | | | | | | | | | | | | | | | |
Intel Corp. Project | | | 3.800 | % | | | 6/15/28 | | | | 1,000,000 | | | | 1,017,862 | (a)(b) |
Intel Corp. Project | | | 4.100 | % | | | 6/15/28 | | | | 250,000 | | | | 252,519 | (a)(b)(c) |
Maricopa County, AZ, IDA, Legacy Traditional School Projects, Series A, Refunding, SD Credit Program | | | 4.000 | % | | | 7/1/34 | | | | 400,000 | | | | 406,172 | |
Phoenix, AZ, IDA, Great Hearts Academies, Refunding | | | 5.000 | % | | | 7/1/36 | | | | 75,000 | | | | 75,414 | |
See Notes to Financial Statements.
| | | | |
10 | | | | Western Asset SMASh Series TF Fund 2024 Annual Report |
Western Asset SMASh Series TF Fund
(Percentages shown based on Fund net assets)
| | | | | | | | | | | | | | | | |
| Security | | Rate | | | Maturity
Date | | | Face
Amount | | | Value | |
Arizona — continued | | | | | | | | | | | | | | | | |
Queen Creek, AZ, Excise Tax & State Shared Revenue, Series A | | | 5.000 | % | | | 8/1/47 | | | $ | 585,000 | | | $ | 617,881 | |
Salt Verde, AZ, Financial Corp., Natural Gas Revenue, Series 2007 | | | 5.000 | % | | | 12/1/32 | | | | 495,000 | | | | 529,571 | |
Total Arizona | | | | | | | | | | | | | | | 3,512,364 | |
Arkansas — 0.2% | | | | | | | | | | | | | | | | |
Arkansas State Development Finance Authority, Environmental Improvement Revenue, United States Steel Corporation Project, Green Bonds | | | 5.700 | % | | | 5/1/53 | | | | 200,000 | | | | 207,349 | (c) |
California — 4.6% | | | | | | | | | | | | | | | | |
Alameda, CA, Corridor Transportation Authority Revenue: | | | | | | | | | | | | | | | | |
Second Subordinated Lien, Series B, Refunding | | | 5.000 | % | | | 10/1/34 | | | | 50,000 | | | | 51,375 | |
Second Subordinated Lien, Series B, Refunding | | | 5.000 | % | | | 10/1/36 | | | | 50,000 | | | | 51,232 | |
Second Subordinated Lien, Series B, Refunding | | | 5.000 | % | | | 10/1/37 | | | | 200,000 | | | | 204,681 | |
Bay Area Toll Authority, CA, Toll Bridge Revenue, San Francisco Bay Area, Series B-1 (SIFMA Municipal Swap Index Yield + 1.100%) | | | 4.400 | % | | | 4/1/24 | | | | 160,000 | | | | 160,017 | (a)(b) |
California State Community Choice Financing Authority Revenue: | | | | | | | | | | | | | | | | |
Clean Energy Project, Green Bonds, Series A-1 | | | 4.000 | % | | | 8/1/28 | | | | 200,000 | | | | 201,265 | (a)(b) |
Clean Energy Project, Green Bonds, Series B-1 | | | 5.000 | % | | | 8/1/29 | | | | 500,000 | | | | 527,358 | (a)(b) |
California State MFA Revenue: | | | | | | | | | | | | | | | | |
Senior Lien, LINXS APM Project, Series A | | | 5.000 | % | | | 12/31/34 | | | | 100,000 | | | | 102,947 | (c) |
Senior Lien, LINXS APM Project, Series A | | | 5.000 | % | | | 12/31/43 | | | | 100,000 | | | | 100,008 | (c) |
California State MFA Special Facility Revenue, United Airlines, Inc., Los Angeles International Airport Project | | | 4.000 | % | | | 7/15/29 | | | | 75,000 | | | | 74,018 | (c) |
California State, GO: | | | | | | | | | | | | | | | | |
Various Purpose, Refunding | | | 5.000 | % | | | 10/1/45 | | | | 500,000 | | | | 568,888 | (d) |
Various Purpose, Refunding | | | 4.000 | % | | | 10/1/50 | | | | 500,000 | | | | 503,519 | |
Eastern Municipal Water District Financing Authority, CA, Water & Wastewater Revenue, Series D | | | 5.000 | % | | | 7/1/47 | | | | 50,000 | | | | 52,485 | |
Long Beach, CA, Bond Finance Authority Revenue, Natural Gas Purchase, Series A | | | 5.500 | % | | | 11/15/37 | | | | 50,000 | | | | 57,352 | |
Los Angeles, CA, Department of Airports Revenue, Subordinated, Los Angeles International Airport, Series C | | | 5.000 | % | | | 5/15/37 | | | | 95,000 | | | | 99,261 | (c) |
See Notes to Financial Statements.
| | | | | | |
| Western Asset SMASh Series TF Fund 2024 Annual Report | | | | | 11 | |
Schedule of investments (cont’d)
February 29, 2024
Western Asset SMASh Series TF Fund
(Percentages shown based on Fund net assets)
| | | | | | | | | | | | | | | | |
| Security | | Rate | | | Maturity
Date | | | Face
Amount | | | Value | |
California — continued | | | | | | | | | | | | | | | | |
Los Angeles, CA, Wastewater System Revenue, Green Bonds, Subordinated, Series A | | | 5.000 | % | | | 6/1/48 | | | $ | 100,000 | | | $ | 105,766 | |
M-S-R Energy Authority, CA, Natural Gas Revenue: | | | | | | | | | | | | | | | | |
Series A | | | 6.125 | % | | | 11/1/29 | | | | 45,000 | | | | 48,357 | |
Series B | | | 6.125 | % | | | 11/1/29 | | | | 125,000 | | | | 134,325 | |
Northern California Energy Authority, Commodity Supply Revenue, Series A | | | 4.000 | % | | | 7/1/24 | | | | 250,000 | | | | 250,100 | (a)(b) |
River Islands, CA, Public Financing Authority, Special Tax Revenue: | | | | | | | | | | | | | | | | |
Community Facilities District No 2003-1, Series A-1, Refunding, AGM | | | 5.250 | % | | | 9/1/52 | | | | 250,000 | | | | 272,832 | |
Community Facilities District No 2023-1 | | | 5.500 | % | | | 9/1/48 | | | | 250,000 | | | | 256,038 | |
Riverside County, CA, Transportation Commission Sales Tax Revenue, Series B, Refunding | | | 5.000 | % | | | 6/1/37 | | | | 100,000 | | | | 107,816 | |
Riverside, CA, Electric Revenue, Series A, Refunding | | | 5.000 | % | | | 10/1/48 | | | | 100,000 | | | | 107,183 | |
San Francisco, CA, City & County Airport Commission, International Airport Revenue: | | | | | | | | | | | | | | | | |
Second Series A, Refunding | | | 5.000 | % | | | 5/1/47 | | | | 400,000 | | | | 407,928 | (c) |
SFO Fuel Co. LLC, Series A, Refunding | | | 5.000 | % | | | 1/1/33 | | | | 100,000 | | | | 107,505 | (c) |
San Mateo County, CA, Joint Powers Financing Authority, Lease Revenue, Capital Project, Series A | | | 5.000 | % | | | 7/15/43 | | | | 50,000 | | | | 53,803 | |
Sanger, CA, USD Revenue, COP, Capital Projects, AGM | | | 5.000 | % | | | 6/1/52 | | | | 20,000 | | | | 20,002 | |
Tobacco Securitization Authority of Southern California Revenue, Asset Backed Refunding, San Diego County Tobacco Asset Securitization Corporation, Class 1, Series A | | | 5.000 | % | | | 6/1/48 | | | | 100,000 | | | | 104,637 | |
Total California | | | | | | | | | | | | | | | 4,730,698 | |
Colorado — 1.7% | | | | | | | | | | | | | | | | |
Colorado Springs, CO, Utilities System Revenue, Series B | | | 4.000 | % | | | 11/15/46 | | | | 325,000 | | | | 325,085 | |
Colorado State Educational & Cultural Facilities Authority Revenue, University of Denver Project, Series A | | | 5.000 | % | | | 3/1/43 | | | | 50,000 | | | | 51,730 | |
Colorado State Health Facilities Authority Revenue: | | | | | | | | | | | | | | | | |
Commonspirit Health Project, Series A | | | 5.500 | % | | | 11/1/47 | | | | 150,000 | | | | 163,760 | |
Commonspirit Health Project, Series A | | | 5.250 | % | | | 11/1/52 | | | | 150,000 | | | | 159,013 | |
See Notes to Financial Statements.
| | | | |
12 | | | | Western Asset SMASh Series TF Fund 2024 Annual Report |
Western Asset SMASh Series TF Fund
(Percentages shown based on Fund net assets)
| | | | | | | | | | | | | | | | |
| Security | | Rate | | | Maturity
Date | | | Face
Amount | | | Value | |
Colorado — continued | | | | | | | | | | | | | | | | |
Improvement and Refunding Revenue, Bethesda Project, Series A | | | 5.000 | % | | | 9/15/48 | | | $ | 50,000 | | | $ | 44,559 | |
Colorado State High Performance Transportation Enterprise Revenue: | | | | | | | | | | | | | | | | |
C-470 Express Lanes | | | 5.000 | % | | | 12/31/47 | | | | 100,000 | | | | 100,298 | |
C-470 Express Lanes | | | 5.000 | % | | | 12/31/51 | | | | 230,000 | | | | 230,611 | |
Denver, CO, City & County Airport System Revenue, Subordinated, Series B, Refunding | | | 5.000 | % | | | 11/15/32 | | | | 500,000 | | | | 563,688 | (c) |
Denver, CO, City & County Special Facility Apartment Revenue, United Airlines Inc. Project, Refunding | | | 5.000 | % | | | 10/1/32 | | | | 100,000 | | | | 99,993 | (c) |
Total Colorado | | | | | | | | | | | | | | | 1,738,737 | |
Connecticut — 1.3% | | | | | | | | | | | | | | | | |
Connecticut State HEFA Revenue, Sacred Heart University Issue, Series I-1, Refunding | | | 5.000 | % | | | 7/1/36 | | | | 50,000 | | | | 52,134 | |
Connecticut State Special Tax Revenue, Transportation Infrastructure, Series A | | | 5.000 | % | | | 1/1/37 | | | | 500,000 | | | | 535,026 | |
Connecticut State, GO: | | | | | | | | | | | | | | | | |
Series A | | | 4.000 | % | | | 4/15/37 | | | | 125,000 | | | | 128,547 | |
Series B | | | 4.000 | % | | | 1/15/43 | | | | 500,000 | | | | 506,675 | |
University of Connecticut, Student Fee Revenue, Series A | | | 5.000 | % | | | 11/15/43 | | | | 100,000 | | | | 106,373 | |
Total Connecticut | | | | | | | | | | | | | | | 1,328,755 | |
District of Columbia — 0.1% | | | | | | | | | | | | | | | | |
District of Columbia Revenue, KIPP DC Project, Series B, Refunding | | | 5.000 | % | | | 7/1/42 | | | | 75,000 | | | | 76,586 | |
Florida — 4.6% | | | | | | | | | | | | | | | | |
Broward County, FL, Airport System Revenue: | | | | | | | | | | | | | | | | |
Series 2017 | | | 5.000 | % | | | 10/1/47 | | | | 50,000 | | | | 51,114 | (c) |
Series A | | | 5.000 | % | | | 10/1/45 | | | | 250,000 | | | | 251,397 | (c) |
Broward County, FL, Port Facilities Revenue, Series B | | | 5.000 | % | | | 9/1/31 | | | | 200,000 | | | | 215,370 | (c) |
Florida State Insurance Assistance Interlocal Agency Inc. Revenue, Series A-1 | | | 5.000 | % | | | 9/1/26 | | | | 750,000 | | | | 778,190 | |
Fort Pierce, FL, Utilities Authority Revenue, Series A, Refunding, AGM | | | 4.000 | % | | | 10/1/52 | | | | 100,000 | | | | 94,230 | |
Greater Orlando, FL, Aviation Authority, Airport Facilities Revenue, Priority Subordinated, Series A | | | 5.000 | % | | | 10/1/47 | | | | 25,000 | | | | 25,582 | (c) |
See Notes to Financial Statements.
| | | | | | |
| Western Asset SMASh Series TF Fund 2024 Annual Report | | | | | 13 | |
Schedule of investments (cont’d)
February 29, 2024
Western Asset SMASh Series TF Fund
(Percentages shown based on Fund net assets)
| | | | | | | | | | | | | | | | |
| Security | | Rate | | | Maturity
Date | | | Face
Amount | | | Value | |
Florida — continued | | | | | | | | | | | | | | | | |
Hillsborough County, FL, Aviation Authority Revenue, Tampa International Airport, Series E | | | 5.000 | % | | | 10/1/43 | | | $ | 200,000 | | | $ | 207,128 | (c) |
Miami-Dade County, FL, Aviation Revenue: | | | | | | | | | | | | | | | | |
Series A, Refunding | | | 4.000 | % | | | 10/1/41 | | | | 150,000 | | | | 150,719 | |
Series A, Refunding | | | 5.000 | % | | | 10/1/49 | | | | 300,000 | | | | 308,076 | (c) |
Series B, Refunding | | | 5.000 | % | | | 10/1/40 | | | | 200,000 | | | | 204,595 | (c) |
Miami-Dade County, FL, Seaport Revenue, Senior Bonds, Series A, Refunding | | | 5.250 | % | | | 10/1/52 | | | | 650,000 | | | | 689,339 | (c) |
Orange County, FL, Health Facilities Authority Revenue, Orlando Health Inc., Series A | | | 5.000 | % | | | 10/1/53 | | | | 250,000 | | | | 266,184 | |
Palm Beach County, FL, Health Facilities Authority Revenue: | | | | | | | | | | | | | | | | |
ACTS Retirement-Life Communities, Series B | | | 5.000 | % | | | 11/15/42 | | | | 500,000 | | | | 521,627 | |
Jupiter Medical Center Project, Series A | | | 5.000 | % | | | 11/1/34 | | | | 200,000 | | | | 216,038 | |
Volusia County, FL, EFA Revenue, Educational Facilities Embry-Riddle Aeronautical University Inc. Project, Refunding | | | 5.000 | % | | | 10/15/47 | | | | 500,000 | | | | 514,923 | |
Wildwood, FL, Village Community Development District No 15, Special Assessment Revenue | | | 5.250 | % | | | 5/1/54 | | | | 250,000 | | | | 256,960 | |
Total Florida | | | | | | | | | | | | | | | 4,751,472 | |
Georgia — 1.2% | | | | | | | | | | | | | | | | |
Cobb County, GA, Kennestone Hospital Authority Revenue, Wellstar Health System, Inc. Project, Series A, Refunding | | | 5.000 | % | | | 4/1/50 | | | | 250,000 | | | | 260,772 | |
Georgia State Higher Education Facilities Authority Revenue, USG Real Estate, Refunding | | | 5.000 | % | | | 6/15/33 | | | | 50,000 | | | | 54,827 | |
Georgia State Municipal Electric Authority, Power Revenue: | | | | | | | | | | | | | | | | |
Plant Vogtle Units 3&4, Project M, Series A | | | 5.250 | % | | | 7/1/64 | | | | 200,000 | | | | 211,487 | |
Plant Vogtle Units 3&4, Project P, Series A | | | 5.500 | % | | | 7/1/64 | | | | 150,000 | | | | 158,522 | |
Project One, Subordinated, Series A, Refunding | | | 5.000 | % | | | 1/1/45 | | | | 100,000 | | | | 105,454 | |
Main Street Natural Gas Inc., GA, Gas Project Revenue: | | | | | | | | | | | | | | | | |
Series A | | | 5.000 | % | | | 5/15/43 | | | | 200,000 | | | | 205,171 | |
Series C | | | 5.000 | % | | | 9/1/30 | | | | 250,000 | | | | 266,176 | (a)(b) |
Total Georgia | | | | | | | | | | | | | | | 1,262,409 | |
Idaho — 0.1% | | | | | | | | | | | | | | | | |
Idaho State Health Facilities Authority Revenue, Trinity Health Credit Group, Series A | | | 5.000 | % | | | 12/1/47 | | | | 100,000 | | | | 102,342 | |
See Notes to Financial Statements.
| | | | |
14 | | | | Western Asset SMASh Series TF Fund 2024 Annual Report |
Western Asset SMASh Series TF Fund
(Percentages shown based on Fund net assets)
| | | | | | | | | | | | | | | | |
| Security | | Rate | | | Maturity
Date | | | Face
Amount | | | Value | |
Illinois — 12.7% | | | | | | | | | | | | | | | | |
Chicago, IL, Board of Education, Dedicated Capital Improvement, Special Tax Revenue: | | | | | | | | | | | | | | | | |
Series 2018 | | | 5.000 | % | | | 4/1/42 | | | $ | 100,000 | | | $ | 102,438 | |
Series 2023 | | | 5.750 | % | | | 4/1/48 | | | | 750,000 | | | | 829,192 | |
Chicago, IL, Board of Education, GO: | | | | | | | | | | | | | | | | |
Dedicated, Series A | | | 5.875 | % | | | 12/1/47 | | | | 500,000 | | | | 551,639 | |
Dedicated, Series H | | | 5.000 | % | | | 12/1/46 | | | | 850,000 | | | | 851,184 | |
Series A | | | 5.000 | % | | | 12/1/40 | | | | 1,100,000 | | | | 1,127,744 | |
Series C, Refunding | | | 5.000 | % | | | 12/1/25 | | | | 100,000 | | | | 101,529 | |
Series C, Refunding, AGM | | | 5.000 | % | | | 12/1/32 | | | | 250,000 | | | | 265,199 | |
Chicago, IL, GO: | | | | | | | | | | | | | | | | |
Chicago Works, Series A | | | 5.500 | % | | | 1/1/39 | | | | 1,000,000 | | | | 1,094,623 | |
Series A | | | 5.500 | % | | | 1/1/35 | | | | 385,000 | | | | 416,168 | |
Series A | | | 5.000 | % | | | 1/1/44 | | | | 125,000 | | | | 128,168 | |
Series A, Refunding | | | 5.625 | % | | | 1/1/29 | | | | 250,000 | | | | 261,893 | |
Series C, Refunding | | | 5.000 | % | | | 1/1/25 | | | | 30,000 | | | | 30,298 | |
Chicago, IL, O’Hare International Airport Revenue: | | | | | | | | | | | | | | | | |
Series C, Refunding | | | 5.000 | % | | | 1/1/43 | | | | 250,000 | | | | 264,641 | (c) |
Series D, Refunding | | | 5.000 | % | | | 1/1/46 | | | | 10,000 | | | | 10,069 | |
TrIPS Obligated Group | | | 5.000 | % | | | 7/1/48 | | | | 50,000 | | | | 50,316 | (c) |
Chicago, IL, Transit Authority, Sales Tax Receipts Revenue, Second Lien, Series A, Refunding | | | 5.000 | % | | | 12/1/45 | | | | 50,000 | | | | 52,074 | |
Chicago, IL, Wastewater Transmission Revenue, Second Lien, Series A, Refunding | | | 5.000 | % | | | 1/1/47 | | | | 35,000 | | | | 35,576 | |
Chicago, IL, Waterworks Revenue: | | | | | | | | | | | | | | | | |
Second Lien, Series 2017, Refunding | | | 5.000 | % | | | 11/1/29 | | | | 30,000 | | | | 31,692 | |
Second Lien, Series 2017-2, Refunding, AGM | | | 5.000 | % | | | 11/1/32 | | | | 60,000 | | | | 64,064 | |
Elk Grove Village, IL, GO, Cook and DuPage Counties, Refunding | | | 5.000 | % | | | 1/1/36 | | | | 35,000 | | | | 36,909 | |
Illinois State Finance Authority Revenue: | | | | | | | | | | | | | | | | |
Benedictine University, Refunding | | | 4.000 | % | | | 10/1/33 | | | | 100,000 | | | | 89,007 | |
Northshore University Healthsystem, Series A, Refunding | | | 5.000 | % | | | 8/15/32 | | | | 100,000 | | | | 112,360 | |
University of Illinois at Urbana, Academic Facilities Lease Revenue Bonds | | | 5.000 | % | | | 10/1/49 | | | | 50,000 | | | | 51,192 | |
University of Illinois, Health Services Facility Lease Revenue Bonds | | | 5.000 | % | | | 10/1/30 | | | | 250,000 | | | | 269,203 | |
Illinois State Sports Facilities Authority Revenue, Sport Facilities Project, Series 2019, Refunding, BAM | | | 5.000 | % | | | 6/15/29 | | | | 50,000 | | | | 53,718 | |
See Notes to Financial Statements.
| | | | | | |
| Western Asset SMASh Series TF Fund 2024 Annual Report | | | | | 15 | |
Schedule of investments (cont’d)
February 29, 2024
Western Asset SMASh Series TF Fund
(Percentages shown based on Fund net assets)
| | | | | | | | | | | | | | | | |
| Security | | Rate | | | Maturity
Date | | | Face
Amount | | | Value | |
Illinois — continued | | | | | | | | | | | | | | | | |
Illinois State Toll Highway Authority Revenue, Series A, Refunding | | | 5.000 | % | | | 1/1/39 | | | $ | 500,000 | | | $ | 581,316 | |
Illinois State, GO: | | | | | | | | | | | | | | | | |
Series 2016 | | | 5.000 | % | | | 1/1/33 | | | | 25,000 | | | | 25,644 | |
Series 2016, Refunding | | | 5.000 | % | | | 2/1/27 | | | | 25,000 | | | | 26,213 | |
Series 2016, Refunding | | | 5.000 | % | | | 2/1/29 | | | | 20,000 | | | | 21,024 | |
Series A | | | 5.000 | % | | | 5/1/36 | | | | 250,000 | | | | 263,573 | |
Series A | | | 5.000 | % | | | 3/1/46 | | | | 400,000 | | | | 422,113 | |
Series A, Refunding | | | 5.000 | % | | | 10/1/29 | | | | 150,000 | | | | 162,308 | |
Series A, Refunding | | | 5.000 | % | | | 10/1/30 | | | | 350,000 | | | | 378,861 | |
Series C | | | 5.000 | % | | | 12/1/41 | | | | 1,250,000 | | | | 1,366,963 | |
Series D | | | 5.000 | % | | | 11/1/27 | | | | 225,000 | | | | 239,348 | |
Kane County, IL, School District No 131 Aurora East Side, GO, Series A, AGM | | | 4.000 | % | | | 12/1/34 | | | | 725,000 | | | | 750,961 | |
Metropolitan Pier & Exposition Authority, IL, Revenue: | | | | | | | | | | | | | | | | |
McCormick Place Expansion Project, Series A, Refunding | | | 5.000 | % | | | 12/15/45 | | | | 500,000 | | | | 519,125 | |
McCormick Place Expansion Project, Series A, Refunding | | | 4.000 | % | | | 12/15/47 | | | | 500,000 | | | | 474,919 | |
McCormick Place Expansion Project, Series B, Refunding | | | 5.000 | % | | | 6/15/42 | | | | 60,000 | | | | 63,196 | |
McCormick Place Expansion Project, Series B, Refunding, AGM | | | 0.000 | % | | | 6/15/45 | | | | 1,000,000 | | | | 381,055 | |
McCormick Place Expansion Project, Series B, Refunding, AGM | | | 0.000 | % | | | 12/15/56 | | | | 310,000 | | | | 63,926 | |
Regional Transportation Authority, IL, GO, Series A, Refunding, NATL | | | 6.000 | % | | | 7/1/29 | | | | 415,000 | | | | 462,045 | |
Total Illinois | | | | | | | | | | | | | | | 13,083,486 | |
Indiana — 2.3% | | | | | | | | | | | | | | | | |
Indiana State Finance Authority Revenue: | | | | | | | | | | | | | | | | |
Marion General Hospital, Series A | | | 4.000 | % | | | 7/1/45 | | | | 100,000 | | | | 93,183 | |
Midwestern Disaster Relief, Ohio Valley Electric Corp. Project, Series A | | | 4.250 | % | | | 11/1/30 | | | | 100,000 | | | | 100,604 | |
Indiana State Finance Authority Wastewater Utility Revenue: | | | | | | | | | | | | | | | | |
CWA Authority Project, Green Bonds, Series A | | | 5.000 | % | | | 10/1/46 | | | | 325,000 | | | | 331,489 | |
CWA Authority Project, Series A, Refunding | | | 5.000 | % | | | 10/1/38 | | | | 650,000 | | | | 745,344 | |
CWA Authority Project, Series A, Refunding | | | 5.000 | % | | | 10/1/40 | | | | 650,000 | | | | 717,455 | (e) |
See Notes to Financial Statements.
| | | | |
16 | | | | Western Asset SMASh Series TF Fund 2024 Annual Report |
Western Asset SMASh Series TF Fund
(Percentages shown based on Fund net assets)
| | | | | | | | | | | | | | | | |
| Security | | Rate | | | Maturity
Date | | | Face
Amount | | | Value | |
Indiana — continued | | | | | | | | | | | | | | | | |
Indianapolis, IN, Local Public Improvement Bond Bank: | | | | | | | | | | | | | | | | |
Courthouse and Jail Project, Series A | | | 4.000 | % | | | 2/1/44 | | | $ | 100,000 | | | $ | 100,291 | |
Courthouse and Jail Project, Series A | | | 5.000 | % | | | 2/1/54 | | | | 300,000 | | | | 313,194 | |
Total Indiana | | | | | | | | | | | | | | | 2,401,560 | |
Iowa — 0.4% | | | | | | | | | | | | | | | | |
Iowa State Finance Authority Revenue, Midwestern Disaster Area, Iowa Fertilizer Co. Project, Refunding | | | 5.000 | % | | | 12/1/42 | | | | 300,000 | | | | 317,164 | (a)(b) |
Iowa State Tobacco Settlement Authority Revenue, Asset Backed Senior Bonds, Class 1, Series A-2, Refunding | | | 4.000 | % | | | 6/1/49 | | | | 100,000 | | | | 95,106 | |
Total Iowa | | | | | | | | | | | | | | | 412,270 | |
Kentucky — 1.1% | | | | | | | | | | | | | | | | |
Kentucky State Economic Development Finance Authority Revenue, Louisville Arena, Louisville Arena Authority Inc., Refunding, AGM | | | 5.000 | % | | | 12/1/45 | | | | 100,000 | | | | 104,148 | |
Kentucky State PEA, Gas Supply Revenue: | | | | | | | | | | | | | | | | |
Series A | | | 4.000 | % | | | 6/1/26 | | | | 300,000 | | | | 299,814 | (a)(b) |
Series C | | | 4.000 | % | | | 6/1/25 | | | | 200,000 | | | | 200,306 | (a)(b) |
Louisville/Jefferson County, KY, Metropolitan Government Health System Revenue, Norton Healthcare Inc., Series A | | | 4.000 | % | | | 10/1/40 | | | | 500,000 | | | | 489,056 | |
Total Kentucky | | | | | | | | | | | | | | | 1,093,324 | |
Louisiana — 0.9% | | | | | | | | | | | | | | | | |
Lafayette Parish, LA, School Board Sales Tax Revenue, Series 2023 | | | 4.000 | % | | | 4/1/53 | | | | 250,000 | | | | 241,370 | |
Louisiana State PFA, Lease Revenue, Provident Group, Flagship Properties | | | 5.000 | % | | | 7/1/42 | | | | 50,000 | | | | 51,302 | |
Shreveport, LA, Water & Sewer Revenue, Series A, AGM | | | 5.000 | % | | | 12/1/41 | | | | 10,000 | | | | 10,419 | |
St. John the Baptist Parish, LA, State Revenue: | | | | | | | | | | | | | | | | |
Marathon Oil Corp. Project, Series A-3, Refunding | | | 2.200 | % | | | 7/1/26 | | | | 150,000 | | | | 142,810 | (a)(b) |
Marathon Oil Corp. Project, Series B-2, Refunding | | | 2.375 | % | | | 7/1/26 | | | | 525,000 | | | | 501,843 | (a)(b) |
Total Louisiana | | | | | | | | | | | | | | | 947,744 | |
Maryland — 0.2% | | | | | | | | | | | | | | | | |
Maryland State Stadium Authority, Built to Learn Revenue, Series 2021 | | | 4.000 | % | | | 6/1/46 | | | | 250,000 | | | | 247,812 | |
See Notes to Financial Statements.
| | | | | | |
| Western Asset SMASh Series TF Fund 2024 Annual Report | | | | | 17 | |
Schedule of investments (cont’d)
February 29, 2024
Western Asset SMASh Series TF Fund
(Percentages shown based on Fund net assets)
| | | | | | | | | | | | | | | | |
| Security | | Rate | | | Maturity
Date | | | Face
Amount | | | Value | |
Massachusetts — 1.9% | | | | | | | | | | | | | | | | |
Commonwealth of Massachusetts, GO, Consolidated Loan, Series A | | | 5.000 | % | | | 1/1/54 | | | $ | 1,000,000 | | | $ | 1,089,451 | |
Massachusetts State DFA Revenue: | | | | | | | | | | | | | | | | |
Boston Medical Center, Sustainability Bonds, Series G, Refunding | | | 5.250 | % | | | 7/1/52 | | | | 250,000 | | | | 269,863 | |
UMass Boston Student Housing Project | | | 5.000 | % | | | 10/1/28 | | | | 10,000 | | | | 10,291 | |
Worcester Polytechnic Institute, Series B, Refunding | | | 5.000 | % | | | 9/1/42 | | | | 75,000 | | | | 78,256 | |
Massachusetts State Port Authority Revenue: | | | | | | | | | | | | | | | | |
Series A, Refunding | | | 5.000 | % | | | 7/1/33 | | | | 55,000 | | | | 59,786 | (c) |
Series A, Refunding | | | 5.000 | % | | | 7/1/36 | | | | 160,000 | | | | 172,119 | (c) |
Series E | | | 5.000 | % | | | 7/1/46 | | | | 250,000 | | | | 263,132 | (c) |
Massachusetts State Water Resources Authority Revenue, Series B, Refunding | | | 5.000 | % | | | 8/1/40 | | | | 50,000 | | | | 52,705 | (f) |
Total Massachusetts | | | | | | | | | | | | | | | 1,995,603 | |
Michigan — 2.1% | | | | | | | | | | | | | | | | |
Detroit, MI, Downtown Development Authority Revenue, Catalyst Development, Series A, Refunding, AGM | | | 5.000 | % | | | 7/1/48 | | | | 100,000 | | | | 98,407 | |
Great Lakes Water Authority, MI, Water Supply System Revenue: | | | | | | | | | | | | | | | | |
Senior Lien, Series A | | | 5.000 | % | | | 7/1/45 | | | | 750,000 | | | | 811,079 | |
Senior Lien, Series A | | | 5.000 | % | | | 7/1/49 | | | | 650,000 | | | | 693,777 | |
Senior Lien, Series B | | | 5.000 | % | | | 7/1/39 | | | | 300,000 | | | | 346,771 | |
Michigan State Finance Authority Revenue: | | | | | | | | | | | | | | | | |
Henry Ford Health System, Series A | | | 4.000 | % | | | 11/15/50 | | | | 100,000 | | | | 91,214 | |
Tobacco Settlement Asset Backed Senior Bonds, Series B-1, Refunding | | | 5.000 | % | | | 6/1/49 | | | | 25,000 | | | | 25,777 | |
Michigan State Strategic Fund Limited Obligation Revenue, I-75 Improvement Project | | | 5.000 | % | | | 12/31/43 | | | | 100,000 | | | | 102,071 | (c) |
Total Michigan | | | | | | | | | | | | | | | 2,169,096 | |
Missouri — 0.0%†† | | | | | | | | | | | | | | | | |
Missouri State HEFA Revenue, Senior Living Facilities, Lutheran Senior Services Projects, Series A | | | 5.000 | % | | | 2/1/42 | | | | 50,000 | | | | 49,013 | |
See Notes to Financial Statements.
| | | | |
18 | | | | Western Asset SMASh Series TF Fund 2024 Annual Report |
Western Asset SMASh Series TF Fund
(Percentages shown based on Fund net assets)
| | | | | | | | | | | | | | | | |
| Security | | Rate | | | Maturity
Date | | | Face
Amount | | | Value | |
Nebraska — 0.7% | | | | | | | | | | | | | | | | |
Douglas County, NE, Hospital Authority No 2 Revenue, Children’s Hospital Obligated Group, Series A, Refunding | | | 4.000 | % | | | 11/15/36 | | | $ | 425,000 | | | $ | 432,406 | |
Omaha, NE, Public Power District, Electric System Revenue, Series B, Refunding | | | 4.000 | % | | | 2/1/46 | | | | 250,000 | | | | 251,586 | |
Total Nebraska | | | | | | | | | | | | | | | 683,992 | |
Nevada — 0.2% | | | | | | | | | | | | | | | | |
Sparks, NV, Tourism Improvement, Senior Sales Tax Anticipation Revenue, Series A, Refunding | | | 2.750 | % | | | 6/15/28 | | | | 225,000 | | | | 217,228 | (g) |
New Jersey — 5.8% | | | | | | | | | | | | | | | | |
New Jersey State EDA Revenue: | | | | | | | | | | | | | | | | |
Private Activity-The Goethals Bridge Replacement Project, AGM | | | 5.125 | % | | | 1/1/39 | | | | 85,000 | | | | 85,008 | (c) |
Private Activity-The Goethals Bridge Replacement Project, AGM | | | 5.125 | % | | | 7/1/42 | | | | 150,000 | | | | 150,014 | (c) |
School Facilities Construction, Series DDD | | | 5.000 | % | | | 6/15/33 | | | | 50,000 | | | | 53,786 | (f) |
School Facilities Construction, Series SSS, Refunding | | | 5.250 | % | | | 6/15/36 | | | | 500,000 | | | | 594,562 | (e) |
Special Facility, Port Newark Container Terminal LLC Project, Refunding | | | 5.000 | % | | | 10/1/37 | | | | 500,000 | | | | 515,478 | (c) |
New Jersey State EDA, Lease Revenue, Health Department and Taxation Division Office Project, Series A | | | 5.000 | % | | | 6/15/33 | | | | 105,000 | | | | 112,138 | |
New Jersey State Transportation Trust Fund Authority Revenue: | | | | | | | | | | | | | | | | |
Transportation Program, Series AA | | | 5.250 | % | | | 6/15/43 | | | | 100,000 | | | | 105,625 | |
Transportation Program, Series AA | | | 5.000 | % | | | 6/15/45 | | | | 100,000 | | | | 100,945 | |
Transportation Program, Series AA | | | 4.000 | % | | | 6/15/50 | | | | 500,000 | | | | 480,830 | |
Transportation Program, Series BB | | | 4.000 | % | | | 6/15/36 | | | | 500,000 | | | | 514,920 | |
Transportation System, CAB, Series C, NATL | | | 0.000 | % | | | 12/15/31 | | | | 2,500,000 | | | | 1,949,180 | |
Transportation System, Series A, BAM | | | 0.000 | % | | | 12/15/38 | | | | 1,000,000 | | | | 571,995 | |
Transportation System, Series A, Refunding | | | 5.000 | % | | | 12/15/28 | | | | 150,000 | | | | 164,775 | |
Transportation System, Series A, Refunding | | | 4.250 | % | | | 6/15/40 | | | | 350,000 | | | | 364,218 | |
Tobacco Settlement Financing Corp., NJ, Revenue: | | | | | | | | | | | | | | | | |
Series A, Refunding | | | 5.000 | % | | | 6/1/46 | | | | 170,000 | | | | 173,989 | |
Series A, Refunding | | | 5.250 | % | | | 6/1/46 | | | | 30,000 | | | | 31,108 | |
Total New Jersey | | | | | | | | | | | | | | | 5,968,571 | |
See Notes to Financial Statements.
| | | | | | |
| Western Asset SMASh Series TF Fund 2024 Annual Report | | | | | 19 | |
Schedule of investments (cont’d)
February 29, 2024
Western Asset SMASh Series TF Fund
(Percentages shown based on Fund net assets)
| | | | | | | | | | | | | | | | |
| Security | | Rate | | | Maturity
Date | | | Face
Amount | | | Value | |
New York — 16.3% | | | | | | | | | | | | | | | | |
Hempstead Town, NY, Local Development Corp. Revenue, Hofstra University Project, Refunding | | | 5.000 | % | | | 7/1/42 | | | $ | 100,000 | | | $ | 103,795 | |
Long Island, NY, Power Authority Electric System Revenue, Series B, | | | 1.650 | % | | | 9/1/24 | | | | 250,000 | | | | 246,924 | (a)(b) |
MTA, NY, Transportation Revenue: | | | | | | | | | | | | | | | | |
Green Bonds, Series E, Refunding | | | 5.000 | % | | | 11/15/33 | | | | 250,000 | | | | 278,837 | |
Series A-2 | | | 5.000 | % | | | 5/15/30 | | | | 335,000 | | | | 364,795 | (a)(b) |
New York City, NY, GO: | | | | | | | | | | | | | | | | |
Series A | | | 4.125 | % | | | 8/1/53 | | | | 1,500,000 | | | | 1,477,291 | |
Subseries A-1 | | | 5.000 | % | | | 8/1/47 | | | | 250,000 | | | | 268,704 | |
Subseries B-1 | | | 5.250 | % | | | 10/1/43 | | | | 500,000 | | | | 562,899 | |
New York City, NY, HDC, Impact Revenue, Sustainable Development Bonds, Series A, HUD Section 8 | | | 4.800 | % | | | 2/1/53 | | | | 250,000 | | | | 256,047 | |
New York City, NY, Industrial Development Agency Revenue, Yankee Stadium Project, Refunding | | | 4.000 | % | | | 3/1/45 | | | | 100,000 | | | | 95,806 | |
New York City, NY, Municipal Water Finance Authority, Water & Sewer System Revenue: | | | | | | | | | | | | | | | | |
Second General Resolution Fiscal 2022, Series AA, Subseries AA-1 | | | 4.000 | % | | | 6/15/51 | | | | 500,000 | | | | 488,955 | |
Second General Resolution, Series CC-1, Refunding | | | 5.000 | % | | | 6/15/46 | | | | 1,000,000 | | | | 1,029,510 | |
New York City, NY, TFA, Future Tax Secured Revenue: | | | | | | | | | | | | | | | | |
Subordinated, Series F, Subseries F-1 | | | 5.000 | % | | | 2/1/47 | | | | 2,075,000 | | | | 2,253,988 | |
Subordinated, Subseries C-1 | | | 5.000 | % | | | 2/1/47 | | | | 250,000 | | | | 271,565 | |
New York State Dormitory Authority Revenue: | | | | | | | | | | | | | | | | |
New York University, Series A, Refunding | | | 5.000 | % | | | 7/1/43 | | | | 50,000 | | | | 52,323 | |
Non-State Supported Debt, Memorial Sloan- Kettering Cancer Center, Series B-1 | | | 4.000 | % | | | 7/1/51 | | | | 250,000 | | | | 241,261 | |
New York State Dormitory Authority, Income Tax Revenue, Series B, Refunding | | | 5.000 | % | | | 2/15/41 | | | | 100,000 | | | | 104,809 | |
New York State Dormitory Authority, Sales Tax Revenue: | | | | | | | | | | | | | | | | |
Bidding Group 3, Series E, Refunding | | | 5.000 | % | | | 3/15/38 | | | | 100,000 | | | | 107,432 | |
Bidding Group 4, Series E, Refunding | | | 5.000 | % | | | 3/15/44 | | | | 100,000 | | | | 106,020 | |
New York State Liberty Development Corp., Revenue, 3 World Trade Center Project, Class 1, Refunding | | | 5.000 | % | | | 11/15/44 | | | | 100,000 | | | | 100,027 | (g) |
See Notes to Financial Statements.
| | | | |
20 | | | | Western Asset SMASh Series TF Fund 2024 Annual Report |
Western Asset SMASh Series TF Fund
(Percentages shown based on Fund net assets)
| | | | | | | | | | | | | | | | |
| Security | | Rate | | | Maturity
Date | | | Face
Amount | | | Value | |
New York — continued | | | | | | | | | | | | | | | | |
New York State Thruway Authority General Revenue, Junior Indebtedness Obligations, Junior Lien, Series A | | | 5.000 | % | | | 1/1/46 | | | $ | 50,000 | | | $ | 50,823 | |
New York State Transportation Development Corp., Special Facilities Revenue: | | | | | | | | | | | | | | | | |
Delta Air Lines Inc., LaGuardia Airport Terminals C and D Redevelopment Project | | | 5.000 | % | | | 1/1/30 | | | | 75,000 | | | | 77,632 | (c) |
Delta Air Lines Inc., LaGuardia Airport Terminals C and D Redevelopment Project | | | 5.000 | % | | | 1/1/32 | | | | 45,000 | | | | 46,533 | (c) |
Delta Air Lines Inc., LaGuardia Airport Terminals C and D Redevelopment Project, Series 2020 | | | 4.375 | % | | | 10/1/45 | | | | 250,000 | | | | 246,682 | (c) |
Delta Air Lines Inc., LaGuardia Airport Terminals C and D Redevelopment Project, Series 2023 | | | 6.000 | % | | | 4/1/35 | | | | 750,000 | | | | 847,010 | (c) |
Delta Air Lines Inc., LaGuardia Airport Terminals C and D Redevelopment Project, Series 2023 | | | 5.625 | % | | | 4/1/40 | | | | 700,000 | | | | 760,577 | (c) |
John F. Kennedy International Airport New Terminal One Project, Green Bonds | | | 6.000 | % | | | 6/30/54 | | | | 1,000,000 | | | | 1,101,469 | (c) |
John F. Kennedy International Airport New Terminal One Project, Green Bonds | | | 5.375 | % | | | 6/30/60 | | | | 250,000 | | | | 262,469 | (c) |
John F. Kennedy International Airport New Terminal One Project, Green Bonds, AGM | | | 5.000 | % | | | 6/30/49 | | | | 750,000 | | | | 787,502 | (c) |
LaGuardia Airport Terminal B Redevelopment Project | | | 5.000 | % | | | 7/1/30 | | | | 50,000 | | | | 50,109 | (c) |
LaGuardia Airport Terminal B Redevelopment Project, Series A | | | 5.000 | % | | | 7/1/41 | | | | 25,000 | | | | 24,998 | (c) |
LaGuardia Airport Terminal B Redevelopment Project, Series A | | | 5.000 | % | | | 7/1/46 | | | | 750,000 | | | | 745,976 | (c) |
Terminal 4 John F. Kennedy International Airport Project, Series A, Refunding | | | 4.000 | % | | | 12/1/40 | | | | 300,000 | | | | 287,286 | (c) |
New York State Urban Development Corp. Revenue, Personal Income Tax, Series C, Refunding | | | 3.000 | % | | | 3/15/48 | | | | 250,000 | | | | 198,702 | |
Oneida County, NY, Local Development Corp. Revenue, Mohawk Valley Health System Project, Series A, Refunding, AGM | | | 4.000 | % | | | 12/1/49 | | | | 635,000 | | | | 590,631 | |
Port Authority of New York & New Jersey Revenue: | | | | | | | | | | | | | | | | |
Consolidated Series 185 | | | 5.000 | % | | | 9/1/25 | | | | 10,000 | | | | 10,070 | (c) |
See Notes to Financial Statements.
| | | | | | |
| Western Asset SMASh Series TF Fund 2024 Annual Report | | | | | 21 | |
Schedule of investments (cont’d)
February 29, 2024
Western Asset SMASh Series TF Fund
(Percentages shown based on Fund net assets)
| | | | | | | | | | | | | | | | |
| Security | | Rate | | | Maturity
Date | | | Face
Amount | | | Value | |
New York — continued | | | | | | | | | | | | | | | | |
Consolidated Series 221 | | | 4.000 | % | | | 7/15/45 | | | $ | 1,000,000 | | | $ | 959,903 | (c) |
Triborough Bridge & Tunnel Authority, NY, Revenue, General-MTA Bridges & Tunnels, Series A | | | 5.000 | % | | | 11/15/49 | | | | 1,000,000 | | | | 1,072,225 | (d) |
Troy, NY, Capital Resource Corp., Rensselaer Polytechnic Institute Project, Series A, Refunding | | | 5.000 | % | | | 9/1/28 | | | | 325,000 | | | | 349,589 | |
Total New York | | | | | | | | | | | | | | | 16,881,174 | |
North Carolina — 0.2% | | | | | | | | | | | | | | | | |
Charlotte, NC, Lease Revenue, COP, Convention Facility Project, Series A, Refunding | | | 4.000 | % | | | 6/1/49 | | | | 70,000 | | | | 69,024 | |
North Carolina State Medical Care Commission, Retirement Facilities Revenue, The Forest at Duke Project | | | 4.000 | % | | | 9/1/41 | | | | 160,000 | | | | 136,800 | |
North Carolina State Turnpike Authority, Monroe Expressway Toll Revenue, Series A, Refunding | | | 5.000 | % | | | 7/1/42 | | | | 5,000 | | | | 5,095 | |
Total North Carolina | | | | | | | | | | | | | | | 210,919 | |
North Dakota — 0.4% | | | | | | | | | | | | | | | | |
Grand Forks, ND, Health Care System Revenue, Altru Health System, Refunding, AGM | | | 3.000 | % | | | 12/1/46 | | | | 550,000 | | | | 421,503 | |
Ohio — 2.1% | | | | | | | | | | | | | | | | |
American Municipal Power Inc., OH, Revenue, AMP Fremont Energy Center Project, Series A, Refunding | | | 4.000 | % | | | 2/15/38 | | | | 250,000 | | | | 255,552 | |
Buckeye, OH, Tobacco Settlement Financing Authority Revenue, Senior Bonds, Series B-2, Refunding | | | 5.000 | % | | | 6/1/55 | | | | 250,000 | | | | 238,590 | |
Ohio State Air Quality Development Authority Revenue: | | | | | | | | | | | | | | | | |
American Electric Co. Project, Series B, Refunding | | | 2.500 | % | | | 10/1/29 | | | | 100,000 | | | | 88,956 | (a)(b)(c) |
American Electric Co. Project, Series D, Refunding | | | 2.100 | % | | | 10/1/24 | | | | 250,000 | | | | 245,354 | (a)(b)(c) |
AMG Vanadium Project, Series 2019 | | | 5.000 | % | | | 7/1/49 | | | | 500,000 | | | | 456,468 | (c) |
Duke Energy Corp. Project, Series B, Refunding | | | 4.250 | % | | | 6/1/27 | | | | 100,000 | | | | 101,029 | (a)(b)(c) |
Ohio State Higher Educational Facility Commission College & University Revenue, University of Dayton 2018 Project, Series B, Refunding | | | 5.000 | % | | | 12/1/34 | | | | 500,000 | | | | 537,110 | |
See Notes to Financial Statements.
| | | | |
22 | | | | Western Asset SMASh Series TF Fund 2024 Annual Report |
Western Asset SMASh Series TF Fund
(Percentages shown based on Fund net assets)
| | | | | | | | | | | | | | | | |
| Security | | Rate | | | Maturity
Date | | | Face
Amount | | | Value | |
Ohio — continued | | | | | | | | | | | | | | | | |
Ohio State Hospital Revenue, University Hospitals Health Systems Inc., Series E, Refunding | | | 4.000 | % | | | 1/15/37 | | | $ | 100,000 | | | $ | 101,693 | |
Warrensville Heights, OH, School District, GO, Refunding, BAM | | | 5.000 | % | | | 12/1/44 | | | | 175,000 | | | | 176,252 | |
Total Ohio | | | | | | | | | | | | | | | 2,201,004 | |
Oregon — 0.2% | | | | | | | | | | | | | | | | |
Salem, OR, Hospital Facility Authority Revenue, Capital Manor Project, Refunding | | | 4.000 | % | | | 5/15/32 | | | | 185,000 | | | | 177,236 | |
Pennsylvania — 3.8% | | | | | | | | | | | | | | | | |
Allegheny County, PA, HDA Revenue, University Pittsburgh Medical Center, Series A, Refunding | | | 4.000 | % | | | 7/15/39 | | | | 150,000 | | | | 150,577 | |
Berks County, PA, IDA, Healthcare Facilities Revenue, Highlands at Wyomissing, Refunding | | | 5.000 | % | | | 5/15/32 | | | | 50,000 | | | | 50,868 | |
Commonwealth Financing Authority, PA, Tobacco Master Settlement Payment Revenue | | | 5.000 | % | | | 6/1/30 | | | | 50,000 | | | | 53,784 | |
Lancaster County, PA, Convention Center Authority Revenue, Hotel Room Rental Tax, Series B, Refunding, County GTD | | | 4.750 | % | | | 5/1/57 | | | | 250,000 | | | | 251,754 | |
Pennsylvania State Economic Development Financing Authority Revenue: | | | | | | | | | | | | | | | | |
Presbyterian Senior Living Project, Series B-1 | | | 5.250 | % | | | 7/1/49 | | | | 200,000 | | | | 206,103 | |
Solid Waste Disposal, Waste Management Inc. Project | | | 2.150 | % | | | 7/1/24 | | | | 100,000 | | | | 98,845 | (a)(b)(c) |
Tax-Exempt Private Activity, The Penndot Major Bridges Package One Project | | | 5.250 | % | | | 6/30/53 | | | | 1,350,000 | | | | 1,443,275 | (c) |
Pennsylvania State Turnpike Commission Revenue: | | | | | | | | | | | | | | | | |
Series A | | | 5.000 | % | | | 12/1/44 | | | | 175,000 | | | | 187,682 | |
Series A-1 | | | 5.000 | % | | | 12/1/47 | | | | 25,000 | | | | 26,059 | |
Series B | | | 5.000 | % | | | 12/1/45 | | | | 500,000 | | | | 540,729 | |
Series B, Refunding | | | 5.250 | % | | | 12/1/47 | | | | 250,000 | | | | 279,423 | |
Subordinated, Series B | | | 5.000 | % | | | 12/1/48 | | | | 100,000 | | | | 104,010 | |
Philadelphia, PA, Authority for IDR: | | | | | | | | | | | | | | | | |
Charter School Revenue, Philadelphia Performing Arts: A String Theory Charter School Project, Refunding | | | 5.000 | % | | | 6/15/50 | | | | 100,000 | | | | 98,269 | |
City Service Agreement Revenue, Rebuild Project | | | 5.000 | % | | | 5/1/35 | | | | 250,000 | | | | 267,289 | |
See Notes to Financial Statements.
| | | | | | |
| Western Asset SMASh Series TF Fund 2024 Annual Report | | | | | 23 | |
Schedule of investments (cont’d)
February 29, 2024
Western Asset SMASh Series TF Fund
(Percentages shown based on Fund net assets)
| | | | | | | | | | | | | | | | |
| Security | | Rate | | | Maturity
Date | | | Face
Amount | | | Value | |
Pennsylvania — continued | | | | | | | | | | | | | | | | |
Philadelphia, PA, GO, Series B | | | 5.000 | % | | | 2/1/35 | | | $ | 150,000 | | | $ | 164,194 | |
State Public School Building Authority, PA, Lease Revenue, Philadelphia SD Project, Series A, Refunding, AGM, State Aid Withholding | | | 5.000 | % | | | 6/1/31 | | | | 20,000 | | | | 20,863 | |
Total Pennsylvania | | | | | | | | | | | | | | | 3,943,724 | |
Puerto Rico — 3.5% | | | | | | | | | | | | | | | | |
Puerto Rico Commonwealth Aqueduct & Sewer Authority Revenue, Senior Lien, Series A, Refunding | | | 5.000 | % | | | 7/1/47 | | | | 500,000 | | | | 504,823 | (g) |
Puerto Rico Commonwealth, GO: | | | | | | | | | | | | | | | | |
Restructured, Series A-1 | | | 4.000 | % | | | 7/1/35 | | | | 175,000 | | | | 169,865 | |
Restructured, Series A-1 | | | 4.000 | % | | | 7/1/37 | | | | 760,000 | | | | 725,861 | |
Restructured, Series A-1 | | | 4.000 | % | | | 7/1/41 | | | | 100,000 | | | | 92,883 | |
Puerto Rico Electric Power Authority Revenue: | | | | | | | | | | | | | | | | |
Series A | | | 5.000 | % | | | 7/1/29 | | | | 195,000 | | | | 51,675 | *(h) |
Series A | | | 5.000 | % | | | 7/1/42 | | | | 320,000 | | | | 84,800 | *(h) |
Series A | | | 5.050 | % | | | 7/1/42 | | | | 100,000 | | | | 26,500 | *(h) |
Series XX | | | 5.250 | % | | | 7/1/40 | | | | 360,000 | | | | 95,400 | *(h) |
Puerto Rico Sales Tax Financing Corp., Sales Tax Revenue: | | | | | | | | | | | | | | | | |
CAB, Restructured, Series A-1 | | | 0.000 | % | | | 7/1/27 | | | | 60,000 | | | | 53,201 | |
CAB, Restructured, Series A-1 | | | 0.000 | % | | | 7/1/46 | | | | 630,000 | | | | 205,107 | |
Restructured, Series A-1 | | | 4.550 | % | | | 7/1/40 | | | | 10,000 | | | | 10,078 | |
Restructured, Series A-1 | | | 4.750 | % | | | 7/1/53 | | | | 1,000,000 | | | | 1,000,572 | |
Restructured, Series A-1 | | | 5.000 | % | | | 7/1/58 | | | | 366,000 | | | | 368,744 | |
Restructured, Series A-2 | | | 4.329 | % | | | 7/1/40 | | | | 248,000 | | | | 246,866 | |
Total Puerto Rico | | | | | | | | | | | | | | | 3,636,375 | |
South Carolina — 0.5% | | | | | | | | | | | | | | | | |
Patriots Energy Group Financing Agency, SC, Gas Supply Revenue, Subseries B-2, Refunding (SOFR x 0.670 + 1.900%) | | | 5.458 | % | | | 3/1/31 | | | | 250,000 | | | | 257,567 | (a)(b) |
South Carolina State Jobs-EDA Hospital Facilities Revenue, Bon Secours Mercy Health Inc., Series A, Refunding | | | 4.000 | % | | | 12/1/44 | | | | 250,000 | | | | 244,690 | |
Total South Carolina | | | | | | | | | | | | | | | 502,257 | |
South Dakota — 0.0%†† | | | | | | | | | | | | | | | | |
South Dakota State HEFA Revenue, Regional Health | | | 5.000 | % | | | 9/1/40 | | | | 25,000 | | | | 25,797 | |
See Notes to Financial Statements.
| | | | |
24 | | | | Western Asset SMASh Series TF Fund 2024 Annual Report |
Western Asset SMASh Series TF Fund
(Percentages shown based on Fund net assets)
| | | | | | | | | | | | | | | | |
| Security | | Rate | | | Maturity
Date | | | Face
Amount | | | Value | |
Tennessee — 2.0% | | | | | | | | | | | | | | | | |
Clarksville, TN, Water, Sewer & Gas Revenue, Series A | | | 4.000 | % | | | 2/1/51 | | | $ | 500,000 | | | $ | 489,524 | |
Metropolitan Government of Nashville & Davidson County, TN, Sports Authority Revenue, Series A, AGM | | | 5.250 | % | | | 7/1/48 | | | | 500,000 | | | | 553,566 | |
Metropolitan Government of Nashville & Davidson County, TN, Water & Sewer Revenue, Subordinated, Series B, Refunding | | | 5.000 | % | | | 7/1/46 | | | | 50,000 | | | | 51,745 | |
Tennessee State Energy Acquisition Corp., Natural Gas Revenue: | | | | | | | | | | | | | | | | |
Series A | | | 5.250 | % | | | 9/1/26 | | | | 425,000 | | | | 435,457 | |
Series A-1, Refunding | | | 5.000 | % | | | 5/1/28 | | | | 500,000 | | | | 517,300 | (a)(b) |
Total Tennessee | | | | | | | | | | | | | | | 2,047,592 | |
Texas — 4.7% | | | | | | | | | | | | | | | | |
Arlington, TX, Higher Education Finance Corp., Education Revenue, Uplift Education, Series A, Refunding, PSF - GTD | | | 5.000 | % | | | 12/1/37 | | | | 20,000 | | | | 20,883 | |
Arlington, TX, Special Tax Revenue, Subordinated Lien, Series C, BAM | | | 5.000 | % | | | 2/15/41 | | | | 100,000 | | | | 100,776 | |
Austin, TX, Airport System Revenue, Series B | | | 5.000 | % | | | 11/15/44 | | | | 250,000 | | | | 260,324 | (c) |
Bexar County, TX, Hospital District, GO, Certificates of Obligation | | | 5.000 | % | | | 2/15/48 | | | | 500,000 | | | | 540,633 | |
Central Texas Regional Mobility Authority Revenue, Senior Lien, Series B | | | 4.000 | % | | | 1/1/51 | | | | 1,245,000 | | | | 1,185,917 | |
Forney, TX, ISD, GO, Unlimited Tax School Building Bonds, Series 2019, PSF - GTD | | | 5.000 | % | | | 2/15/49 | | | | 100,000 | | | | 102,955 | |
Grand Parkway Transportation Corp., TX, System Toll Revenue, First Tier Toll Revenue, Series C, Refunding | | | 4.000 | % | | | 10/1/40 | | | | 500,000 | | | | 504,983 | |
Harris County, TX, Cultural Education Facilities Finance Corp., Hospital Revenue, Texas Children’s Hospital, Series B, Refunding | | | 5.000 | % | | | 10/1/31 | | | | 350,000 | | | | 398,828 | (a)(b) |
Hays, TX, ISD, GO, Unlimited Tax School Building Bonds, PSF - GTD | | | 4.000 | % | | | 2/15/47 | | | | 200,000 | | | | 200,990 | |
Houston, TX, Airport System Revenue: | | | | | | | | | | | | | | | | |
Special Facilities, United Airlines Inc., Technical Operations Center Project | | | 5.000 | % | | | 7/15/28 | | | | 100,000 | | | | 101,995 | (c) |
Special Facilities, United Airlines Inc., Terminal Improvement Project, Series B-1 | | | 4.000 | % | | | 7/15/41 | | | | 400,000 | | | | 365,096 | (c) |
Newark, TX, Higher Education Finance Corp., Education Revenue, TLC Academy, Series A | | | 4.000 | % | | | 8/15/31 | | | | 90,000 | | | | 86,521 | |
See Notes to Financial Statements.
| | | | | | |
| Western Asset SMASh Series TF Fund 2024 Annual Report | | | | | 25 | |
Schedule of investments (cont’d)
February 29, 2024
Western Asset SMASh Series TF Fund
(Percentages shown based on Fund net assets)
| | | | | | | | | | | | | | | | |
| Security | | Rate | | | Maturity
Date | | | Face
Amount | | | Value | |
Texas — continued | | | | | | | | | | | | | | | | |
Southwest Texas, Higher Education Authority Inc. Revenue, Southern Methodist University Project, Refunding | | | 5.000 | % | | | 10/1/41 | | | $ | 50,000 | | | $ | 52,081 | |
Tarrant County, TX, Cultural Education Facilities Finance Corp., Hospital Revenue, Methodist Hospitals of Dallas | | | 4.000 | % | | | 10/1/47 | | | | 250,000 | | | | 244,013 | |
Tarrant County, TX, Cultural Education Facilities Finance Corp., Retirement Facility Revenue: | | | | | | | | | | | | | | | | |
Buckner Retirement Services Inc. Project, Refunding | | | 5.000 | % | | | 11/15/37 | | | | 50,000 | | | | 50,556 | |
Buckner Retirement Services Inc. Project, Refunding | | | 5.000 | % | | | 11/15/46 | | | | 50,000 | | | | 49,596 | |
Texas State, Municipal Gas Acquisition & Supply Corp. I, Gas Supply Revenue, Senior Lien, Series D | | | 6.250 | % | | | 12/15/26 | | | | 90,000 | | | | 93,465 | |
Texas State Private Activity Bond Surface Transportation Corp. Revenue: | | | | | | | | | | | | | | | | |
NTE Mobility Partners Segments 3 LLC, Senior Lien, Series 2023, Refunding | | | 5.500 | % | | | 6/30/43 | | | | 300,000 | | | | 323,143 | (c) |
Senior Lien, Blueridge Transportation Group LLC | | | 5.000 | % | | | 12/31/40 | | | | 5,000 | | | | 5,032 | (c) |
Senior Lien, LBJ Infrastructure Group LLC, I-635 Managed Lanes Project, Series A, Refunding | | | 4.000 | % | | | 12/31/35 | | | | 75,000 | | | | 76,465 | |
West Harris County, TX, Regional Water Authority Revenue, Series 2019, Refunding | | | 4.000 | % | | | 12/15/49 | | | | 100,000 | | | | 95,364 | |
Total Texas | | | | | | | | | | | | | | | 4,859,616 | |
Utah — 3.1% | | | | | | | | | | | | | | | | |
Salt Lake City, UT, Airport Revenue: | | | | | | | | | | | | | | | | |
Salt Lake City International Airport, Series A | | | 5.000 | % | | | 7/1/43 | | | | 250,000 | | | | 257,959 | (c) |
Salt Lake City International Airport, Series A | | | 5.250 | % | | | 7/1/48 | | | | 1,000,000 | | | | 1,080,696 | (c) |
Utah State Charter School Finance Authority, Charter School Revenue: | | | | | | | | | | | | | | | | |
Syracuse Arts Academy Project, UT CSCE | | | 5.000 | % | | | 4/15/37 | | | | 5,000 | | | | 5,124 | |
Utah Charter Academies Project, Series 2018, UT CSCE | | | 5.000 | % | | | 10/15/38 | | | | 220,000 | | | | 227,538 | |
Utah State Infrastructure Agency, Telecommunications Revenue, Series A | | | 5.250 | % | | | 10/15/33 | | | | 200,000 | | | | 208,589 | |
Vineyard Redevelopment Agency, UT, Tax Increment Revenue: | | | | | | | | | | | | | | | | |
Series 2021, Refunding, AGM | | | 5.000 | % | | | 5/1/31 | | | | 235,000 | | | | 266,876 | |
See Notes to Financial Statements.
| | | | |
26 | | | | Western Asset SMASh Series TF Fund 2024 Annual Report |
Western Asset SMASh Series TF Fund
(Percentages shown based on Fund net assets)
| | | | | | | | | | | | | | | | |
| Security | | Rate | | | Maturity
Date | | | Face
Amount | | | Value | |
Utah — continued | | | | | | | | | | | | | | | | |
Series 2021, Refunding, AGM | | | 4.000 | % | | | 5/1/37 | | | $ | 275,000 | | | $ | 285,775 | |
Series 2021, Refunding, AGM | | | 4.000 | % | | | 5/1/39 | | | | 300,000 | | | | 307,074 | |
Series 2021, Refunding, AGM | | | 4.000 | % | | | 5/1/41 | | | | 290,000 | | | | 292,708 | |
Series 2021, Refunding, AGM | | | 4.000 | % | | | 5/1/46 | | | | 275,000 | | | | 264,872 | |
Total Utah | | | | | | | | | | | | | | | 3,197,211 | |
Vermont — 0.3% | | | | | | | | | | | | | | | | |
Vermont Educational & Health Buildings Financing Agency Revenue, Middlebury College Project | | | 5.000 | % | | | 11/1/52 | | | | 250,000 | | | | 271,310 | |
Virginia — 1.2% | | | | | | | | | | | | | | | | |
Arlington County, VA, IDA Revenue: | | | | | | | | | | | | | | | | |
Refunding | | | 5.000 | % | | | 2/15/43 | | | | 50,000 | | | | 52,244 | |
Virginia Hospital Center, Refunding | | | 5.000 | % | | | 7/1/36 | | | | 200,000 | | | | 218,612 | |
Isle of Wight County, VA, EDA Revenue, Riverside Health System, Series 2023, AGM | | | 4.750 | % | | | 7/1/53 | | | | 250,000 | | | | 258,715 | |
Virginia State Small Business Financing Authority Revenue: | | | | | | | | | | | | | | | | |
National Senior Campuses, Inc., Series A, Refunding | | | 5.000 | % | | | 1/1/34 | | | | 85,000 | | | | 90,090 | |
Senior Lien, 95 Express Lanes LLC Project, Refunding | | | 5.000 | % | | | 1/1/38 | | | | 350,000 | | | | 374,482 | (c) |
Senior Lien, I-495 HOT Lanes Project, Refunding | | | 5.000 | % | | | 12/31/47 | | | | 200,000 | | | | 208,093 | (c) |
Total Virginia | | | | | | | | | | | | | | | 1,202,236 | |
Washington — 0.6% | | | | | | | | | | | | | | | | |
Port of Seattle, WA, Intermediate Lien Revenue, Series 2022, Refunding | | | 5.000 | % | | | 8/1/41 | | | | 250,000 | | | | 268,369 | (c) |
Washington State Health Care Facilities Authority Revenue: | | | | | | | | | | | | | | | | |
Commonspirit Health, Series A, Refunding | | | 5.000 | % | | | 8/1/44 | | | | 200,000 | | | | 208,714 | |
Seattle Cancer Care Alliance, Refunding | | | 5.000 | % | | | 9/1/50 | | | | 100,000 | | | | 104,804 | |
Total Washington | | | | | | | | | | | | | | | 581,887 | |
Wisconsin — 1.1% | | | | | | | | | | | | | | | | |
Public Finance Authority, WI, Revenue: | | | | | | | | | | | | | | | | |
Cone Health, Series A | | | 5.000 | % | | | 10/1/52 | | | | 250,000 | | | | 263,261 | |
The Carmelite System Inc. Obligated Group, Refunding | | | 5.000 | % | | | 1/1/45 | | | | 50,000 | | | | 48,920 | |
Public Finance Authority, WI, Student Housing Revenue, CHF Wilmington LLC, University of North Carolina at Wilmington Project, AGM | | | 5.000 | % | | | 7/1/53 | | | | 100,000 | | | | 102,525 | |
See Notes to Financial Statements.
| | | | | | |
| Western Asset SMASh Series TF Fund 2024 Annual Report | | | | | 27 | |
Schedule of investments (cont’d)
February 29, 2024
Western Asset SMASh Series TF Fund
(Percentages shown based on Fund net assets)
| | | | | | | | | | | | | | | | |
| Security | | Rate | | | Maturity
Date | | | Face
Amount | | | Value | |
Wisconsin — continued | | | | | | | | | | | | | | | | |
Wisconsin State HEFA Revenue: | | | | | | | | | | | | | | | | |
Bellin Memorial Hospital Inc., Series A | | | 5.500 | % | | | 12/1/52 | | | $ | 250,000 | | | $ | 275,115 | |
Medical College, Series 2016, Refunding | | | 4.000 | % | | | 12/1/46 | | | | 500,000 | | | | 485,602 | |
Total Wisconsin | | | | | | | | | | | | | | | 1,175,423 | |
Total Municipal Bonds (Cost — $93,375,283) | | | | | | | | | | | | | | | 93,931,368 | |
| Municipal Bonds Deposited in Tender Option Bond Trusts (i) — 2.2% | | | | | | | | | |
New York — 2.2% | | | | | | | | | | | | | | | | |
New York City, NY, Municipal Water Finance Authority, Water & Sewer System Revenue, Second General Resolution Fiscal 2023, Subseries AA-1 | | | 5.250 | % | | | 6/15/52 | | | | 1,000,000 | | | | 1,108,624 | |
New York State, NY, Urban Development State Sales Revenue, Series A | | | 5.000 | % | | | 3/15/47 | | | | 1,000,000 | | | | 1,106,727 | |
Total Municipal Bonds Deposited in Tender Option Bond Trusts (Cost — $2,071,448) | | | | | | | | 2,215,351 | |
Total Investments before Short-Term Investments (Cost — $95,446,731) | | | | | | | | 96,146,719 | |
| Short-Term Investments — 8.3% | | | | | | | | | | | | | | | | |
| Municipal Bonds — 8.3% | | | | | | | | | | | | | | | | |
Colorado — 1.2% | | | | | | | | | | | | | | | | |
University of Colorado Hospital Authority Revenue, Series C, Refunding, SPA - TD Bank N.A. | | | 3.300 | % | | | 11/15/39 | | | | 1,300,000 | | | | 1,300,000 | (j)(k) |
Delaware — 0.2% | | | | | | | | | | | | | | | | |
University of Delaware Revenue, Series 2005, Refunding, SPA - TD Bank N.A. | | | 3.650 | % | | | 11/1/35 | | | | 200,000 | | | | 200,000 | (j)(k) |
Florida — 1.3% | | | | | | | | | | | | | | | | |
Hillsborough County, FL, IDA Revenue, Baycare Health System, Series C, Refunding, LOC - TD Bank N.A. | | | 3.300 | % | | | 11/1/38 | | | | 200,000 | | | | 200,000 | (j)(k) |
Orange County, FL, Health Facilities Authority Revenue, Orlando Regional Healthcare System, Series E, Refunding, LOC - TD Bank N.A. | | | 3.300 | % | | | 10/1/26 | | | | 1,200,000 | | | | 1,200,000 | (j)(k) |
Total Florida | | | | | | | | | | | | | | | 1,400,000 | |
Illinois — 0.3% | | | | | | | | | | | | | | | | |
Illinois State Finance Authority Revenue, NorthShore-Edward-Elmhurst Health Credit Group, Series C, Refunding, SPA - JPMorgan Chase & Co. | | | 3.650 | % | | | 8/15/57 | | | | 300,000 | | | | 300,000 | (j)(k) |
See Notes to Financial Statements.
| | | | |
28 | | | | Western Asset SMASh Series TF Fund 2024 Annual Report |
Western Asset SMASh Series TF Fund
(Percentages shown based on Fund net assets)
| | | | | | | | | | | | | | | | |
| Security | | Rate | | | Maturity
Date | | | Face
Amount | | | Value | |
Mississippi — 0.4% | | | | | | | | | | | | | | | | |
Mississippi State Business Finance Corp., Gulf Opportunity Zone, IDR: | | | | | | | | | | | | | | | | |
Chevron USA Inc. Project, Series E | | | 3.700 | % | | | 12/1/30 | | | $ | 100,000 | | | $ | 100,000 | (j)(k) |
Chevron USA Inc. Project, Series E | | | 3.700 | % | | | 12/1/30 | | | | 300,000 | | | | 300,000 | (j)(k) |
Total Mississippi | | | | | | | | | | | | | | | 400,000 | |
Missouri — 0.2% | | | | | | | | | | | | | | | | |
Missouri State HEFA Revenue, BJC Health System, Series C, Refunding, LIQ - BJC Health System | | | 3.300 | % | | | 5/15/38 | | | | 180,000 | | | | 180,000 | (j)(k) |
New Jersey — 0.8% | | | | | | | | | | | | | | | | |
New Jersey State Health Care Facilities Financing Authority Revenue: | | | | | | | | | | | | | | | | |
Hospital Capital Asset Financing Program, Series B, Refunding, LOC - TD Bank N.A. | | | 3.310 | % | | | 7/1/35 | | | | 500,000 | | | | 500,000 | (j)(k) |
Virtua-Memorial Hospital Burlington County, Inc., Series D, LOC - TD Bank N.A. | | | 2.800 | % | | | 7/1/43 | | | | 300,000 | | | | 300,000 | (j)(k) |
Total New Jersey | | | | | | | | | | | | | | | 800,000 | |
New York — 3.1% | | | | | | | | | | | | | | | | |
New York City, NY, GO: | | | | | | | | | | | | | | | | |
Subseries A-3, SPA - Bank of Montreal | | | 3.650 | % | | | 9/1/49 | | | | 2,000,000 | | | | 2,000,000 | (j)(k) |
Subseries E-5, LOC - TD Bank N.A. | | | 3.650 | % | | | 3/1/48 | | | | 700,000 | | | | 700,000 | (j)(k) |
New York City, NY, HDC, MFH Revenue, Series I-3, SPA - TD Bank N.A. | | | 3.300 | % | | | 11/1/60 | | | | 400,000 | | | | 400,000 | (j)(k) |
New York City, NY, Municipal Water Finance Authority, Water & Sewer System Revenue, Second General Resolution Fiscal 2014, Series AA-1, Refunding, SPA - JPMorgan Chase & Co. | | | 3.750 | % | | | 6/15/50 | | | | 100,000 | | | | 100,000 | (j)(k) |
Total New York | | | | | | | | | | | | | | | 3,200,000 | |
Ohio — 0.1% | | | | | | | | | | | | | | | | |
Ohio State, GO, Common Schools, Series C | | | 3.200 | % | | | 6/15/26 | | | | 100,000 | | | | 100,000 | (j)(k) |
Pennsylvania — 0.5% | | | | | | | | | | | | | | | | |
Pennsylvania State Turnpike Commission Revenue, Second Series 2019, Refunding, LOC - TD Bank N.A. | | | 3.300 | % | | | 12/1/38 | | | | 400,000 | | | | 400,000 | (j)(k) |
Philadelphia, PA, Authority for IDR, Series B, Refunding, LOC - TD Bank N.A. | | | 3.300 | % | | | 10/1/30 | | | | 100,000 | | | | 100,000 | (j)(k) |
Total Pennsylvania | | | | | | | | | | | | | | | 500,000 | |
See Notes to Financial Statements.
| | | | | | |
| Western Asset SMASh Series TF Fund 2024 Annual Report | | | | | 29 | |
Schedule of investments (cont’d)
February 29, 2024
Western Asset SMASh Series TF Fund
(Percentages shown based on Fund net assets)
| | | | | | | | | | | | | | | | |
| Security | | Rate | | | Maturity
Date | | | Face
Amount | | | Value | |
Utah — 0.2% | | | | | | | | | | | | | | | | |
Utah County, UT, Hospital Revenue, IHC Health Services Inc., Series C, SPA - TD Bank N.A. | | | 3.650 | % | | | 5/15/58 | | | $ | 200,000 | | | $ | 200,000 | (j)(k) |
Total Municipal Bonds (Cost — $8,580,000) | | | | | | | | | | | | | | | 8,580,000 | |
| | | | |
| | | | | | | | | Shares | | | | |
| Overnight Deposits — 0.0%†† | | | | | | | | | | | | | | | | |
BNY Mellon Cash Reserve Fund (Cost — $7,583) | | | 2.250 | % | | | | | | | 7,583 | | | | 7,583 | (l) |
Total Short-Term Investments (Cost — $8,587,583) | | | | | | | | | | | | | | | 8,587,583 | |
Total Investments — 101.4% (Cost — $104,034,314) | | | | | | | | | | | | | | | 104,734,302 | |
TOB Floating Rate Notes — (1.1)% | | | | (1,165,000 | ) |
Other Liabilities in Excess of Other Assets — (0.3)% | | | | (235,901 | ) |
Total Net Assets — 100.0% | | | | | | | | | | | | | | $ | 103,333,401 | |
See Notes to Financial Statements.
| | | | |
30 | | | | Western Asset SMASh Series TF Fund 2024 Annual Report |
Western Asset SMASh Series TF Fund
| †† | Represents less than 0.1%. |
| * | Non-income producing security. |
| (a) | Maturity date shown represents the mandatory tender date. |
| (b) | Variable rate security. Interest rate disclosed is as of the most recent information available. Certain variable rate securities are not based on a published reference rate and spread but are determined by the issuer or agent and are based on current market conditions. These securities do not indicate a reference rate and spread in their description above. |
| (c) | Income from this issue is considered a preference item for purposes of calculating the alternative minimum tax (“AMT”). |
| (d) | All or a portion of this security is held at the broker as collateral for open futures contracts. |
| (e) | Securities traded on a when-issued or delayed delivery basis. |
| (f) | Pre-Refunded bonds are generally escrowed with U.S. government obligations and/or U.S. government agency securities. |
| (g) | Security is exempt from registration under Rule 144A of the Securities Act of 1933. This security may be resold in transactions that are exempt from registration, normally to qualified institutional buyers. This security has been deemed liquid pursuant to guidelines approved by the Board of Trustees. |
| (h) | The coupon payment on this security is currently in default as of February 29, 2024. |
| (i) | Represents securities deposited into a special purpose entity, referred to as a Tender Option Bond (“TOB”) trust (Note 1). |
| (j) | Variable rate demand obligations (“VRDOs”) have a demand feature under which the Fund can tender them back to the issuer or liquidity provider on no more than 7 days notice. The interest rate generally resets on a daily or weekly basis and is determined on the specific interest rate reset date by the remarketing agent, pursuant to a formula specified in official documents for the VRDO, or set at the highest rate allowable as specified in official documents for the VRDO. VRDOs are benchmarked to the Securities Industry and Financial Markets Association (“SIFMA”) Municipal Swap Index. The SIFMA Municipal Swap Index is compiled from weekly interest rate resets of tax-exempt VRDOs reported to the Municipal Securities Rulemaking Board’s Short-term Obligation Rate Transparency System. |
| (k) | Maturity date shown is the final maturity date. The security may be sold back to the issuer before final maturity. |
| (l) | Rate shown is one-day yield as of the end of the reporting period. |
See Notes to Financial Statements.
| | | | | | |
| Western Asset SMASh Series TF Fund 2024 Annual Report | | | | | 31 | |
Schedule of investments (cont’d)
February 29, 2024
Western Asset SMASh Series TF Fund
| | |
Abbreviation(s) used in this schedule: |
| |
| AGM | | — Assured Guaranty Municipal Corporation — Insured Bonds |
| |
| BAM | | — Build America Mutual — Insured Bonds |
| |
| CAB | | — Capital Appreciation Bonds |
| |
| COP | | — Certificates of Participation |
| |
| CSCE | | — Charter School Credit Enhancement |
| |
| CWA | | — Clean Water Act |
| |
| DFA | | — Development Finance Agency |
| |
| EDA | | — Economic Development Authority |
| |
| EFA | | — Educational Facilities Authority |
| |
| GO | | — General Obligation |
| |
| GTD | | — Guaranteed |
| |
| HDA | | — Housing Development Authority |
| |
| HDC | | — Housing Development Corporation |
| |
| HEFA | | — Health & Educational Facilities Authority |
| |
| HUD | | — Housing & Urban Development |
| |
| IDA | | — Industrial Development Authority |
| |
| IDR | | — Industrial Development Revenue |
| |
| ISD | | — Independent School District |
| |
| LIQ | | — Liquidity Facility |
| |
| LOC | | — Letter of Credit |
| |
| MFA | | — Municipal Finance Authority |
| |
| MFH | | — Multi-Family Housing |
| |
| MTA | | — Metropolitan Transportation Authority |
| |
| NATL | | — National Public Finance Guarantee Corporation — Insured Bonds |
| |
| PEA | | — Public Energy Authority |
| |
| PFA | | — Public Facilities Authority |
| |
| PSF | | — Permanent School Fund |
| |
| SD | | — School District |
| |
| SIFMA | | — Securities Industry and Financial Markets Association |
| |
| SOFR | | — Secured Overnight Financing Rate |
| |
| SPA | | — Standby Bond Purchase Agreement — Insured Bonds |
| |
| TFA | | — Transitional Finance Authority |
| |
| USD | | — Unified School District |
At February 29, 2024, the Fund had the following open futures contracts:
| | | | | | | | | | | | | | | | | | | | |
| | | Number of
Contracts | | | Expiration
Date | | | Notional
Amount | | | Market
Value | | | Unrealized
Appreciation | |
| Contracts to Buy: | | | | | | | | | | | | | | | | | | | | |
| U.S. Treasury Ultra Long-Term | | | | | | | | | | | | | | | | | | | | |
| Bonds | | | 24 | | | | 6/24 | | | $ | 3,032,371 | | | $ | 3,069,000 | | | $ | 36,629 | |
See Notes to Financial Statements.
| | | | |
32 | | | | Western Asset SMASh Series TF Fund 2024 Annual Report |
Statement of assets and liabilities
February 29, 2024
| | | | |
| |
| Assets: | | | | |
Investments, at value (Cost — $104,034,314) | | | $ 104,734,302 | |
Interest receivable | | | 1,038,969 | |
Receivable from brokers — net variation margin on open futures contracts | | | 18,750 | |
Receivable from investment manager | | | 12,306 | |
Prepaid expenses | | | 5,829 | |
Total Assets | | | 105,810,156 | |
| |
| Liabilities: | | | | |
Payable for securities purchased | | | 1,237,089 | |
TOB Floating Rate Notes (Note 1) | | | 1,165,000 | |
Interest and commitment fees payable | | | 13,426 | |
Trustees’ fees payable | | | 184 | |
Accrued expenses | | | 61,056 | |
Total Liabilities | | | 2,476,755 | |
| Total Net Assets | | | $103,333,401 | |
| |
| Net Assets: | | | | |
Par value (Note 5) | | | $104 | |
Paid-in capital in excess of par value | | | 106,377,698 | |
Total distributable earnings (loss) | | | (3,044,401) | |
| Total Net Assets | | | $103,333,401 | |
| |
| Shares Outstanding | | | 10,364,246 | |
| |
| Net Asset Value | | | $9.97 | |
See Notes to Financial Statements.
| | | | | | |
| Western Asset SMASh Series TF Fund 2024 Annual Report | | | | | 33 | |
Statement of operations
For the Year Ended February 29, 2024
| | | | |
| |
| Investment Income: | | | | |
Interest | | $ | 3,285,020 | |
| |
| Expenses: | | | | |
Fund accounting fees | | | 66,040 | |
Interest expense (Note 1) | | | 34,930 | |
Audit and tax fees | | | 29,068 | |
Registration fees | | | 26,089 | |
Legal fees | | | 8,468 | |
Shareholder reports | | | 8,199 | |
Trustees’ fees | | | 1,873 | |
Commitment fees (Note 6) | | | 784 | |
Custody fees | | | 442 | |
Transfer agent fees (Note 2) | | | 161 | |
Miscellaneous expenses | | | 3,796 | |
Total Expenses | | | 179,850 | |
Less: Fee waivers and/or expense reimbursements (Note 2) | | | (145,438) | |
Net Expenses | | | 34,412 | |
| Net Investment Income | | | 3,250,608 | |
| |
| Realized and Unrealized Gain (Loss) on Investments and Futures Contracts (Notes 1, 3 and 4): | | | | |
Net Realized Loss From: | | | | |
Investment transactions | | | (1,528,518) | |
Futures contracts | | | (10,037) | |
Net Realized Loss | | | (1,538,555) | |
Change in Net Unrealized Appreciation (Depreciation) From: | | | | |
Investments | | | 4,105,679 | |
Futures contracts | | | 36,629 | |
Change in Net Unrealized Appreciation (Depreciation) | | | 4,142,308 | |
| Net Gain on Investments and Futures Contracts | | | 2,603,753 | |
| Increase in Net Assets From Operations | | $ | 5,854,361 | |
See Notes to Financial Statements.
| | | | |
34 | | | | Western Asset SMASh Series TF Fund 2024 Annual Report |
Statements of changes in net assets
| | | | | | | | |
For the Year Ended February 29, 2024 and the Year Ended February 28, 2023 | | 2024 | | | 2023 | |
| | |
| Operations: | | | | | | | | |
Net investment income | | $ | 3,250,608 | | | $ | 2,074,166 | |
Net realized loss | | | (1,538,555) | | | | (2,179,729) | |
Change in net unrealized appreciation (depreciation) | | | 4,142,308 | | | | (4,818,263) | |
Increase (Decrease) in Net Assets From Operations | | | 5,854,361 | | | | (4,923,826) | |
| | |
| Distributions to Shareholders From (Note 1): | | | | | | | | |
Total distributable earnings | | | (3,026,620) | | | | (1,860,261) | |
Decrease in Net Assets From Distributions to Shareholders | | | (3,026,620) | | | | (1,860,261) | |
| | |
| Fund Share Transactions (Note 5): | | | | | | | | |
Net proceeds from sale of shares | | | 56,535,293 | | | | 39,799,014 | |
Cost of shares repurchased | | | (31,873,534) | | | | (37,170,863) | |
Increase in Net Assets From Fund Share Transactions | | | 24,661,759 | | | | 2,628,151 | |
Increase (Decrease) in Net Assets | | | 27,489,500 | | | | (4,155,936) | |
| | |
| Net Assets: | | | | | | | | |
Beginning of year | | | 75,843,901 | | | | 79,999,837 | |
End of year | | $ | 103,333,401 | | | $ | 75,843,901 | |
See Notes to Financial Statements.
| | | | | | |
| Western Asset SMASh Series TF Fund 2024 Annual Report | | | | | 35 | |
Financial highlights
| | | | | | | | | | | | | | | | | | | | |
For a share of beneficial interest outstanding throughout each year ended February 28, unless otherwise noted: | |
| | | 20241,2 | | | 20231 | | | 20221 | | | 20211 | | | 20201,2 | |
| | | | | |
| Net asset value, beginning of year | | | $9.65 | | | | $10.51 | | | | $10.69 | | | | $10.86 | | | | $10.09 | |
| | | | | |
| Income (loss) from operations: | | | | | | | | | | | | | | | | | | | | |
Net investment income | | | 0.37 | | | | 0.29 | | | | 0.25 | | | | 0.28 | | | | 0.28 | |
Net realized and unrealized gain (loss) | | | 0.29 | | | | (0.89) | | | | (0.18) | | | | (0.17) | | | | 0.77 | |
Total income (loss) from operations | | | 0.66 | | | | (0.60) | | | | 0.07 | | | | 0.11 | | | | 1.05 | |
| | | | | |
| Less distributions from: | | | | | | | | | | | | | | | | | | | | |
Net investment income | | | (0.34) | | | | (0.26) | | | | (0.25) | | | | (0.28) | | | | (0.28) | |
Total distributions | | | (0.34) | | | | (0.26) | | | | (0.25) | | | | (0.28) | | | | (0.28) | |
| | | | | |
| Net asset value, end of year | | | $9.97 | | | | $9.65 | | | | $10.51 | | | | $10.69 | | | | $10.86 | |
Total return3 | | | 6.99 | % | | | (5.69) | % | | | 0.59 | % | | | 1.09 | % | | | 10.53 | % |
| | | | | |
| Net assets, end of year (000s) | | | $103,333 | | | | $75,844 | | | | $80,000 | | | | $68,002 | | | | $58,666 | |
| | | | | |
| Ratios to average net assets: | | | | | | | | | | | | | | | | | | | | |
Gross expenses4 | | | 0.21 | %5 | | | 0.22 | %5 | | | 0.20 | % | | | 0.25 | % | | | 0.34 | % |
Net expenses6,7 | | | 0.04 | 5 | | | 0.01 | 5 | | | 0.00 | | | | 0.00 | | | | 0.00 | |
Net investment income | | | 3.77 | | | | 2.98 | | | | 2.32 | | | | 2.66 | | | | 2.72 | |
| | | | | |
| Portfolio turnover rate | | | 24 | % | | | 38 | % | | | 12 | % | | | 35 | % | | | 9 | % |
| 1 | Per share amounts have been calculated using the average shares method. |
| 2 | For the year ended February 29. |
| 3 | Performance figures do not reflect the effect of fees and expenses associated with a separately managed account, nor a management fee or other operating expenses of the Fund. Such management fees are paid directly or indirectly by the separately managed account sponsor to the Fund’s manager or subadviser. All operating expenses of the Fund were reimbursed by the manager, pursuant to an expense reimbursement arrangement between the Fund and the manager. If such fees were included, the total return would have been lower. Past performance is no guarantee of future results. |
| 4 | Gross expenses do not include management fees paid to the manager and subadviser. Management fees are paid directly or indirectly by the separately managed account sponsor. |
| 5 | Expense ratio reflects the impact of interest expense related to tender option bond transactions accounted for as secured borrowings for financial reporting purposes. Refer to Note 1. |
| 6 | The Fund’s manager has entered into an expense reimbursement arrangement with the Fund, pursuant to which the Fund’s manager has agreed to reimburse 100% of the Fund’s ordinary operating expenses. The expense reimbursement arrangement does not cover interest, brokerage, taxes and extraordinary expenses. This arrangement cannot be terminated prior to December 31, 2025 without the Board of Trustees’ consent. |
| 7 | Reflects fee waivers and/or expense reimbursements. |
See Notes to Financial Statements.
| | | | |
36 | | | | Western Asset SMASh Series TF Fund 2024 Annual Report |
Notes to financial statements
1. Organization and significant accounting policies
Western Asset SMASh Series TF Fund (the “Fund”) is a separate non-diversified investment series of Legg Mason Partners Institutional Trust (the “Trust”). The Trust, a Maryland statutory trust, is registered under the Investment Company Act of 1940, as amended (the “1940 Act”), as an open-end management investment company.
Shares of the Fund may be purchased only by or on behalf of separately managed account clients where an affiliate of Franklin Templeton Fund Adviser, LLC (“FTFA”) (formerly known as Legg Mason Partners Fund Advisor, LLC (“LMPFA”) prior to November 30, 2023) has an agreement to serve as investment adviser or subadviser (each affiliate, a “Managed Account Adviser”) to the account with the managed account program sponsor (the “Program Sponsor”) (typically, a registered investment adviser or broker/dealer) or directly with the client. Shareholders of the Fund pay fees to their separately managed account sponsor, some of which are paid to affiliates of FTFA. FTFA and the subadviser do not charge investment management fees to the Fund.
The Fund follows the accounting and reporting guidance in Financial Accounting Standards Board (“FASB”) Accounting Standards Codification Topic 946, Financial Services – Investment Companies (“ASC 946”). The following are significant accounting policies consistently followed by the Fund and are in conformity with U.S. generally accepted accounting principles (“GAAP”), including, but not limited to, ASC 946. Estimates and assumptions are required to be made regarding assets, liabilities and changes in net assets resulting from operations when financial statements are prepared. Changes in the economic environment, financial markets and any other parameters used in determining these estimates could cause actual results to differ. Subsequent events have been evaluated through the date the financial statements were issued.
(a) Investment valuation. The valuations for fixed income securities (which may include, but are not limited to, corporate, government, municipal, mortgage-backed, collateralized mortgage obligations and asset-backed securities) and certain derivative instruments are typically the prices supplied by independent third party pricing services, which may use market prices or broker/dealer quotations or a variety of valuation techniques and methodologies. The independent third party pricing services typically use inputs that are observable such as issuer details, interest rates, yield curves, prepayment speeds, credit risks/spreads, default rates and quoted prices for similar securities. Investments in open-end funds are valued at the closing net asset value per share of each fund on the day of valuation. Futures contracts are valued daily at the settlement price established by the board of trade or exchange on which they are traded. If independent third party pricing services are unable to supply prices for a portfolio investment, or if the prices supplied are deemed by the manager to be unreliable, the market price may be determined by the manager using quotations from one or more broker/dealers or at the transaction price if the security has recently been purchased and no value has yet been obtained from a pricing service or pricing broker. When reliable prices are not readily available, such as when the
| | | | | | |
| Western Asset SMASh Series TF Fund 2024 Annual Report | | | | | 37 | |
Notes to financial statements (cont’d)
value of a security has been significantly affected by events after the close of the exchange or market on which the security is principally traded, but before the Fund calculates its net asset value, the Fund values these securities as determined in accordance with procedures approved by the Fund’s Board of Trustees.
Pursuant to policies adopted by the Board of Trustees, the Fund’s manager has been designated as the valuation designee and is responsible for the oversight of the daily valuation process. The Fund’s manager is assisted by the Global Fund Valuation Committee (the “Valuation Committee”). The Valuation Committee is responsible for making fair value determinations, evaluating the effectiveness of the Fund’s pricing policies, and reporting to the Fund’s manager and the Board of Trustees. When determining the reliability of third party pricing information for investments owned by the Fund, the Valuation Committee, among other things, conducts due diligence reviews of pricing vendors, monitors the daily change in prices and reviews transactions among market participants.
The Valuation Committee will consider pricing methodologies it deems relevant and appropriate when making fair value determinations. Examples of possible methodologies include, but are not limited to, multiple of earnings; discount from market of a similar freely traded security; discounted cash-flow analysis; book value or a multiple thereof; risk premium/yield analysis; yield to maturity; and/or fundamental investment analysis. The Valuation Committee will also consider factors it deems relevant and appropriate in light of the facts and circumstances. Examples of possible factors include, but are not limited to, the type of security; the issuer’s financial statements; the purchase price of the security; the discount from market value of unrestricted securities of the same class at the time of purchase; analysts’ research and observations from financial institutions; information regarding any transactions or offers with respect to the security; the existence of merger proposals or tender offers affecting the security; the price and extent of public trading in similar securities of the issuer or comparable companies; and the existence of a shelf registration for restricted securities.
For each portfolio security that has been fair valued pursuant to the policies adopted by the Board of Trustees, the fair value price is compared against the last available and next available market quotations. The Valuation Committee reviews the results of such back testing monthly and fair valuation occurrences are reported to the Board of Trustees quarterly.
The Fund uses valuation techniques to measure fair value that are consistent with the market approach and/or income approach, depending on the type of security and the particular circumstance. The market approach uses prices and other relevant information generated by market transactions involving identical or comparable securities. The income approach uses valuation techniques to discount estimated future cash flows to present value.
| | | | |
38 | | | | Western Asset SMASh Series TF Fund 2024 Annual Report |
GAAP establishes a disclosure hierarchy that categorizes the inputs to valuation techniques used to value assets and liabilities at measurement date. These inputs are summarized in the three broad levels listed below:
| • | | Level 1 — unadjusted quoted prices in active markets for identical investments |
| • | | Level 2 — other significant observable inputs (including quoted prices for similar investments, interest rates, prepayment speeds, credit risk, etc.) |
| • | | Level 3 — significant unobservable inputs (including the Fund’s own assumptions in determining the fair value of investments) |
The inputs or methodologies used to value securities are not necessarily an indication of the risk associated with investing in those securities.
The following is a summary of the inputs used in valuing the Fund’s assets carried at fair value:
| | | | | | | | | | | | | | | | |
ASSETS | |
| Description | | Quoted Prices
(Level 1) | | | Other Significant
Observable Inputs
(Level 2) | | | Significant Unobservable
Inputs (Level 3) | | | Total | |
| Long-Term Investments†: | | | | | | | | | | | | | | | | |
Municipal Bonds | | | — | | | $ | 93,931,368 | | | | — | | | $ | 93,931,368 | |
Municipal Bonds Deposited in | | | | | | | | | | | | | | | | |
Tender Option Bond Trusts | | | — | | | | 2,215,351 | | | | — | | | | 2,215,351 | |
| Total Long-Term Investments | | | — | | | | 96,146,719 | | | | — | | | | 96,146,719 | |
| Short-Term Investments†: | | | | | | | | | | | | | | | | |
Municipal Bonds | | | — | | | | 8,580,000 | | | | — | | | | 8,580,000 | |
Overnight Deposits | | | — | | | | 7,583 | | | | — | | | | 7,583 | |
| Total Short-Term Investments | | | — | | | | 8,587,583 | | | | — | | | | 8,587,583 | |
| Total Investments | | | — | | | $ | 104,734,302 | | | | — | | | $ | 104,734,302 | |
| Other Financial Instruments: | | | | | | | | | | | | | | | | |
Futures Contracts†† | | $ | 36,629 | | | | — | | | | — | | | $ | 36,629 | |
| Total | | $ | 36,629 | | | $ | 104,734,302 | | | | — | | | $ | 104,770,931 | |
| † | See Schedule of Investments for additional detailed categorizations. |
| †† | Reflects the unrealized appreciation (depreciation) of the instruments. |
(b) Tender option bonds. The Fund may enter into tender option bond (“TOB”) transactions and may invest in inverse floating rate instruments (“Inverse Floaters”) issued in TOB transactions. The Fund may participate either in structuring an Inverse Floater or purchasing an Inverse Floater in the secondary market. When structuring an Inverse Floater, the Fund deposits securities (typically municipal bonds or other municipal securities) (the “Underlying Bonds”) into a special purpose entity, referred to as a TOB trust. The TOB trust generally issues floating rate notes (“Floaters”) to third parties and residual interest, Inverse Floaters, to the Fund. The Floaters issued by the TOB trust have interest rates which reset weekly
Western Asset SMASh Series TF Fund 2024 Annual Report
| | | | | | |
| Western Asset SMASh Series TF Fund 2024 Annual Report | | | | | 39 | |
Notes to financial statements (cont’d)
and provide the holders of the Floaters the option to tender their notes back to the TOB trust for redemption at par at each reset date. The net proceeds of the sale of the Floaters, after expenses, are received by the Fund and may be invested in additional securities. The Inverse Floaters are inverse floating rate debt instruments, as the return on those bonds is inversely related to changes in a specified interest rate. Distributions on any Inverse Floaters paid to the Fund will be reduced or, in the extreme, eliminated as short-term interest rates rise and will increase when such interest rates fall. Floaters issued by a TOB trust may be senior to the Inverse Floaters held by the Fund. The value and market for Inverse Floaters can be volatile, and Inverse Floaters can have limited liquidity.
An investment in an Inverse Floater structured by the Fund is accounted for as a secured borrowing. The Underlying Bonds deposited into the TOB trust are included in the Fund’s Schedule of Investments and a liability for Floaters (TOB floating rate notes) issued by the TOB trust is recognized in the Fund’s Statement of Assets and Liabilities. The carrying amount of the TOB trust’s floating rate note obligations as reported on the Statement of Assets and Liabilities approximates its fair value. Interest income, including amortization, on the Underlying Bonds is recognized in the Fund’s Statements of Operations. Interest paid to holders of the Floaters, as well as other expenses related to administration, liquidity, remarketing and trustee services of the TOB trust, are recognized in Interest expense in the Fund’s Statement of Operations. For the year ended February 29, 2024, the average daily amount of floating rate notes outstanding was $846,694 and weighted average interest rate was 4.00%.
(c) Futures contracts. The Fund uses futures contracts generally to gain exposure to, or hedge against, changes in interest rates or gain exposure to, or hedge against, changes in certain asset classes. A futures contract represents a commitment for the future purchase or sale of an asset at a specified price on a specified date.
Upon entering into a futures contract, the Fund is required to deposit cash or securities with a broker in an amount equal to a certain percentage of the contract amount. This is known as the ‘‘initial margin’’ and subsequent payments (‘‘variation margin’’) are made or received by the Fund each day, depending on the daily fluctuation in the value of the contract. For certain futures, including foreign denominated futures, variation margin is not settled daily, but is recorded as a net variation margin payable or receivable. The daily changes in contract value are recorded as unrealized appreciation or depreciation in the Statement of Operations and the Fund recognizes a realized gain or loss when the contract is closed.
Futures contracts involve, to varying degrees, risk of loss in excess of the amounts reflected in the financial statements. In addition, there is the risk that the Fund may not be able to enter into a closing transaction because of an illiquid secondary market.
(d) Securities traded on a when-issued and delayed delivery basis. The Fund may trade securities on a when-issued or delayed delivery basis. In when-issued and delayed delivery transactions, the securities are purchased or sold by the Fund with payment and
| | | | |
40 | | | | Western Asset SMASh Series TF Fund 2024 Annual Report |
delivery taking place in the future in order to secure what is considered to be an advantageous price and yield to the Fund at the time of entering into the transaction.
Purchasing such securities involves risk of loss if the value of the securities declines prior to settlement. These securities are subject to market fluctuations and their current value is determined in the same manner as for other securities.
(e) Counterparty risk and credit-risk-related contingent features of derivative instruments. The Fund may invest in certain securities or engage in other transactions where the Fund is exposed to counterparty credit risk in addition to broader market risks. The Fund may invest in securities of issuers, which may also be considered counterparties as trading partners in other transactions. This may increase the risk of loss in the event of default or bankruptcy by the counterparty or if the counterparty otherwise fails to meet its contractual obligations. The Fund’s subadviser attempts to mitigate counterparty risk by (i) periodically assessing the creditworthiness of its trading partners, (ii) monitoring and/or limiting the amount of its net exposure to each individual counterparty based on its assessment and (iii) requiring collateral from the counterparty for certain transactions. Market events and changes in overall economic conditions may impact the assessment of such counterparty risk by the subadviser. In addition, declines in the values of underlying collateral received may expose the Fund to increased risk of loss.
With exchange traded and centrally cleared derivatives, there is less counterparty risk to the Fund since the exchange or clearinghouse, as counterparty to such instruments, guarantees against a possible default. The clearinghouse stands between the buyer and the seller of the contract; therefore, the credit risk is limited to failure of the clearinghouse. While offset rights may exist under applicable law, the Fund does not have a contractual right of offset against a clearing broker or clearinghouse in the event of a default of the clearing broker or clearinghouse.
The Fund has entered into master agreements, such as an International Swaps and Derivatives Association, Inc. Master Agreement (“ISDA Master Agreement”) or similar agreement, with certain of its derivative counterparties that govern over-the-counter (“OTC”) derivatives and provide for general obligations, representations, agreements, collateral posting terms, netting provisions in the event of default or termination and credit related contingent features. The credit related contingent features include, but are not limited to, a percentage decrease in the Fund’s net assets or net asset value per share over a specified period of time. If these credit related contingent features were triggered, the derivatives counterparty could terminate the positions and demand payment or require additional collateral.
Under an ISDA Master Agreement, the Fund may, under certain circumstances, offset with the counterparty certain derivative financial instruments’ payables and/or receivables with collateral held and/or posted and create one single net payment. However, absent an event of default by the counterparty or a termination of the agreement, the terms of the ISDA
| | | | | | |
| Western Asset SMASh Series TF Fund 2024 Annual Report | | | | | 41 | |
Notes to financial statements (cont’d)
Master Agreements do not result in an offset of reported amounts of financial assets and financial liabilities in the Statement of Assets and Liabilities across transactions between the Fund and the applicable counterparty. The enforceability of the right to offset may vary by jurisdiction.
Collateral requirements differ by type of derivative. Collateral or margin requirements are set by the broker or exchange clearinghouse for exchange traded derivatives while collateral terms are contract specific for OTC traded derivatives. Cash collateral that has been pledged to cover obligations of the Fund under derivative contracts, if any, will be reported separately in the Statement of Assets and Liabilities. Securities pledged as collateral, if any, for the same purpose are noted in the Schedule of Investments.
As of February 29, 2024, the Fund did not have any open OTC derivative transactions with credit related contingent features in a net liability position.
(f) Security transactions and investment income. Security transactions are accounted for on a trade date basis. Interest income (including interest income from payment-in-kind securities) is recorded on the accrual basis. Amortization of premiums and accretion of discounts on debt securities are recorded to interest income over the lives of the respective securities, except for premiums on certain callable debt securities, which are amortized to the earliest call date. The cost of investments sold is determined by use of the specific identification method. To the extent any issuer defaults or a credit event occurs that impacts the issuer, the Fund may halt any additional interest income accruals and consider the realizability of interest accrued up to the date of default or credit event.
(g) Distributions to shareholders. Distributions from net investment income of the Fund, if any, are declared and paid on a monthly basis. The Fund intends to satisfy conditions that will enable interest from municipal securities, which is exempt from federal and certain state income taxes, to retain such tax-exempt status when distributed to the shareholders of the Fund. Distributions of net realized gains, if any, are taxable and are declared at least annually. Distributions to shareholders of the Fund are recorded on the ex-dividend date and are determined in accordance with income tax regulations, which may differ from GAAP.
(h) Compensating balance arrangements. The Fund has an arrangement with its custodian bank whereby a portion of the custodian’s fees is paid indirectly by credits earned on the Fund’s cash on deposit with the bank.
(i) Federal and other taxes. It is the Fund’s policy to comply with the federal income and excise tax requirements of the Internal Revenue Code of 1986 (the “Code”), as amended, applicable to regulated investment companies. Accordingly, the Fund intends to distribute its taxable income and net realized gains, if any, to shareholders in accordance with timing requirements imposed by the Code. Therefore, no federal or state income tax provision is required in the Fund’s financial statements.
| | | | |
42 | | | | Western Asset SMASh Series TF Fund 2024 Annual Report |
Management has analyzed the Fund’s tax positions taken on income tax returns for all open tax years and has concluded that as of February 29, 2024, no provision for income tax is required in the Fund’s financial statements. The Fund’s federal and state income and federal excise tax returns for tax years for which the applicable statutes of limitations have not expired are subject to examination by the Internal Revenue Service and state departments of revenue.
(j) Reclassification. GAAP requires that certain components of net assets be reclassified to reflect permanent differences between financial and tax reporting. These reclassifications have no effect on net assets or net asset value per share. During the current year, the Fund had no reclassifications.
2. Investment management agreement and other transactions with affiliates
FTFA is the Fund’s investment manager. Western Asset Management Company, LLC (“Western Asset”) is the Fund’s subadviser. FTFA and Western Asset are indirect, wholly-owned subsidiaries of Franklin Resources, Inc. (“Franklin Resources”).
FTFA and the subadviser do not charge investment management fees to the Fund. However, the Fund is an integral part of the separately managed account program, and FTFA and the subadviser will be compensated directly or indirectly by separately managed account program sponsors. FTFA provides administrative and certain oversight services to the Fund. FTFA delegates to the subadviser the day-to-day portfolio management of the Fund.
FTFA has entered into an expense reimbursement arrangement with the Fund, pursuant to which FTFA has agreed to reimburse 100% of the Fund’s ordinary operating expenses. The expense reimbursement arrangement does not cover interest, brokerage, taxes and extraordinary expenses. This expense reimbursement arrangement cannot be terminated prior to December 31, 2025 without the Board of Trustees’ consent.
During the year ended February 29, 2024, fees waived and/or expenses reimbursed amounted to $145,438.
Franklin Distributors, LLC (“Franklin Distributors”) serves as the Fund’s sole and exclusive distributor. Franklin Distributors is an indirect, wholly-owned broker-dealer subsidiary of Franklin Resources. Franklin Templeton Investor Services, LLC (“Investor Services”) serves as the Fund’s shareholder servicing agent and acts as the Fund’s transfer agent and dividend-paying agent. Investor Services is an indirect, wholly-owned subsidiary of Franklin Resources. The Fund pays transfer agent fees to Investor Services for its performance of shareholder servicing obligations. Investor Services charges account-based fees based on the number of individual shareholder accounts, as well as a fixed percentage fee based on the total account-based fees charged. In addition, the Fund reimburses Investor Services for out of pocket expenses incurred. For the year ended February 29, 2024, the Fund incurred transfer agent fees as reported on the Statement of Operations, of which $43 was earned by Investor Services.
| | | | | | |
| Western Asset SMASh Series TF Fund 2024 Annual Report | | | | | 43 | |
Notes to financial statements (cont’d)
All officers and one Trustee of the Trust are employees of Franklin Resources or its affiliates and do not receive compensation from the Trust.
The Fund is permitted to purchase or sell short-term variable rate demand obligations from or to certain other affiliated funds or portfolios under specified conditions outlined in procedures adopted by the Board of Trustees. The procedures have been designed to provide assurance that any purchase or sale of securities by the Fund from or to another fund or portfolio that is, or could be considered, an affiliate by virtue of having a common investment manager or subadviser (or affiliated investment manager or subadviser), common Trustees and/or common officers complies with Rule 17a-7 under the 1940 Act. Further, as defined under the procedures, each transaction is effected at the current market price. For the year ended February 29, 2024, such purchase and sale transactions (excluding accrued interest) were $35,780,000 and $39,270,000, respectively.
3. Investments
During the year ended February 29, 2024, the aggregate cost of purchases and proceeds from sales of investments (excluding short-term investments) were as follows:
| | | | |
| Purchases | | $ | 42,510,107 | |
| Sales | | | 20,097,391 | |
At February 29, 2024, the aggregate cost of investments and the aggregate gross unrealized appreciation and depreciation of investments for federal income tax purposes were as follows:
| | | | | | | | | | | | | | | | |
| | | Cost* | | | Gross
Unrealized
Appreciation | | | Gross
Unrealized
Depreciation | | | Net
Unrealized
Appreciation | |
| Securities | | $ | 102,821,274 | | | $ | 2,735,908 | | | $ | (1,987,880) | | | $ | 748,028 | |
| Futures contracts | | | — | | | | 36,629 | | | | — | | | | 36,629 | |
| * | Cost of investments for federal income tax purposes includes the value of Inverse Floaters issued in TOB transactions (Note 1). |
4. Derivative instruments and hedging activities
Below is a table, grouped by derivative type, that provides information about the fair value and the location of derivatives within the Statement of Assets and Liabilities at February 29, 2024.
| | | | | | | | |
| ASSET DERIVATIVES1 | |
| | | | | | Interest Rate Risk | |
| Futures contracts2 | | | | | | $ | 36,629 | |
| | | | |
44 | | | | Western Asset SMASh Series TF Fund 2024 Annual Report |
| 1 | Generally, the balance sheet location for asset derivatives is receivables/net unrealized appreciation and for liability derivatives is payables/net unrealized depreciation. |
| 2 | Includes cumulative unrealized appreciation (depreciation) of futures contracts as reported in the Schedule of Investments. Only net variation margin is reported within the receivables and/or payables on the Statement of Assets and Liabilities. |
The following tables provide information about the effect of derivatives and hedging activities on the Fund’s Statement of Operations for the year ended February 29, 2024. The first table provides additional detail about the amounts and sources of gains (losses) realized on derivatives during the period. The second table provides additional information about the change in net unrealized appreciation (depreciation) resulting from the Fund’s derivatives and hedging activities during the period.
| | | | |
| AMOUNT OF NET REALIZED GAIN (LOSS) ON DERIVATIVES RECOGNIZED | |
| | | Interest
Rate Risk | |
| Futures contracts | | $ | (10,037) | |
| | | | |
| CHANGE IN NET UNREALIZED APPRECIATION (DEPRECIATION) ON DERIVATIVES RECOGNIZED | |
| | | Interest
Rate Risk | |
| Futures contracts | | $ | 36,629 | |
During the year ended February 29, 2024, the volume of derivative activity for the Fund was as follows:
| | | | |
| | | Average Market
Value | |
| Futures contracts (to buy) | | $ | 355,356 | |
5. Shares of beneficial interest
At February 29, 2024, the Trust had an unlimited number of shares of beneficial interest authorized with a par value of $0.00001 per share. Each share represents an identical interest and has the same rights.
Transactions in shares of the Fund were as follows:
| | | | | | | | |
| | | Year Ended
February 29, 2024 | | | Year Ended
February 28, 2023 | |
| Shares sold | | | 5,827,935 | | | | 4,086,633 | |
| Shares repurchased | | | (3,324,544) | | | | (3,836,494) | |
| Net increase | | | 2,503,391 | | | | 250,139 | |
6. Redemption facility
The Fund, together with other U.S. registered and foreign investment funds (collectively, the “Borrowers”) managed by Franklin Resources or its affiliates, is a borrower in a joint syndicated senior unsecured credit facility totaling $2.675 billion (the “Global Credit Facility”). The Global Credit Facility provides a source of funds to the Borrowers for
| | | | | | |
| Western Asset SMASh Series TF Fund 2024 Annual Report | | | | | 45 | |
Notes to financial statements (cont’d)
temporary and emergency purposes, including the ability to meet future unanticipated or unusually large redemption requests. Unless renewed, the Global Credit Facility will terminate on January 31, 2025.
Under the terms of the Global Credit Facility, the Fund shall, in addition to interest charged on any borrowings made by the Fund and other costs incurred by the Fund, pay its share of fees and expenses incurred in connection with the implementation and maintenance of the Global Credit Facility, based upon its relative share of the aggregate net assets of all the Borrowers, including an annual commitment fee of 0.15% based upon the unused portion of the Global Credit Facility. These fees are reflected in the Statement of Operations. The Fund did not utilize the Global Credit Facility during the year ended February 29, 2024.
7. Income tax information and distributions to shareholders
The tax character of distributions paid during the fiscal years ended February 29 and February 28, respectively, was as follows:
| | | | | | | | |
| | | 2024 | | | 2023 | |
| Distributions paid from: | | | | | | | | |
| Tax-exempt income | | $ | 3,023,876 | | | $ | 1,855,690 | |
| Ordinary income | | | 2,744 | | | | 4,571 | |
| Total distributions paid | | $ | 3,026,620 | | | $ | 1,860,261 | |
As of February 29, 2024, the components of distributable earnings (loss) on a tax basis were as follows:
| | | | |
| Undistributed tax-exempt income — net | | $ | 495,625 | |
| Deferred capital losses* | | | (4,288,053) | |
| Other book/tax temporary differences(a) | | | (36,630) | |
| Unrealized appreciation (depreciation)(b) | | | 784,657 | |
| Total distributable earnings (loss) — net | | $ | (3,044,401) | |
| * | These capital losses have been deferred in the current year as either short-term or long-term losses. The losses will be deemed to occur on the first day of the next taxable year in the same character as they were originally deferred and will be available to offset future taxable capital gains. |
| (a) | Other book/tax temporary differences are attributable to the realization for tax purposes of unrealized gains (losses) on futures. |
| (b) | The difference between book-basis and tax-basis unrealized appreciation (depreciation) is attributable to the difference between book and tax amortization methods for premium on fixed income securities. |
| | | | |
46 | | | | Western Asset SMASh Series TF Fund 2024 Annual Report |
Report of independent registered public accounting firm
To the Board of Trustees of Legg Mason Partners Institutional Trust and Shareholders of Western Asset SMASh Series TF Fund
Opinion on the Financial Statements
We have audited the accompanying statement of assets and liabilities, including the schedule of investments, of Western Asset SMASh Series TF Fund (one of the funds constituting Legg Mason Partners Institutional Trust, referred to hereafter as the “Fund”) as of February 29, 2024, the related statement of operations for the year ended February 29, 2024, the statement of changes in net assets for each of the two years in the period ended February 29, 2024, including the related notes, and the financial highlights for each of the five years in the period ended February 29, 2024 (collectively referred to as the “financial statements”). In our opinion, the financial statements present fairly, in all material respects, the financial position of the Fund as of February 29, 2024, the results of its operations for the year then ended, the changes in its net assets for each of the two years in the period ended February 29, 2024 and the financial highlights for each of the five years in the period ended February 29, 2024 in conformity with accounting principles generally accepted in the United States of America.
Basis for Opinion
These financial statements are the responsibility of the Fund’s management. Our responsibility is to express an opinion on the Fund’s financial statements based on our audits. We are a public accounting firm registered with the Public Company Accounting Oversight Board (United States) (PCAOB) and are required to be independent with respect to the Fund in accordance with the U.S. federal securities laws and the applicable rules and regulations of the Securities and Exchange Commission and the PCAOB.
We conducted our audits of these financial statements in accordance with the standards of the PCAOB. Those standards require that we plan and perform the audit to obtain reasonable assurance about whether the financial statements are free of material misstatement, whether due to error or fraud.
Our audits included performing procedures to assess the risks of material misstatement of the financial statements, whether due to error or fraud, and performing procedures that respond to those risks. Such procedures included examining, on a test basis, evidence regarding the amounts and disclosures in the financial statements. Our audits also included evaluating the accounting principles used and significant estimates made by management, as well as evaluating the overall presentation of the financial statements. Our procedures included confirmation of securities owned as of February 29, 2024 by correspondence with the custodian, brokers and the administrative agent for the tender option bond trust; when replies were not received from brokers, we performed other auditing procedures. We believe that our audits provide a reasonable basis for our opinion.
|
| /s/PricewaterhouseCoopers LLP |
Baltimore, Maryland
April 18, 2024
We have served as the auditor of one or more investment companies in the Franklin Templeton Group of Funds since 1948.
| | | | | | |
| Western Asset SMASh Series TF Fund 2024 Annual Report | | | | | 47 | |
Additional information (unaudited)
Information about Trustees and Officers
The business and affairs of Western Asset SMASh Series TF Fund (the “Fund”) are conducted by management under the supervision and subject to the direction of its Board of Trustees. The business address of each Trustee is c/o Jane Trust, Franklin Templeton, 280 Park Avenue, 8th Floor, New York, New York 10017.
Information pertaining to the Trustees and officers of the Fund is set forth below. The Statement of Additional Information includes additional information about Trustees and is available, without charge, upon request by calling the Fund at 877-6LM-FUND/656-3863.
| | |
| Independent Trustees† | | |
| |
| Robert Abeles, Jr. | | |
| |
| Year of birth | | 1945 |
| Position(s) with Fund | | Trustee |
| Term of office1 and length of time served2 | | Since 2013 |
| Principal occupation(s) during the past five years | | Board Member of Excellent Education Development (since 2012); Senior Vice President Emeritus (since 2016) and formerly, Senior Vice President, Finance and Chief Financial Officer (2009 to 2016) at University of Southern California; and formerly, Board Member of Great Public Schools Now (2018 to 2022) |
| Number of funds in fund complex overseen by Trustee | | 50 |
| Other Trusteeships held by Trustee during the past five years | | None |
| |
| Jane F. Dasher | | |
| |
| Year of birth | | 1949 |
| Position(s) with Fund | | Trustee |
| Term of office1 and length of time served2 | | Since 1999 |
| Principal occupation(s) during the past five years | | Director (since 2022) and formerly, Chief Financial Officer, Long Light Capital, LLC, formerly known as Korsant Partners, LLC (a family investment company) (since 1997) |
| Number of funds in fund complex overseen by Trustee | | 50 |
| Other Trusteeships held by Trustee during the past five years | | Formerly, Director, Visual Kinematics, Inc. (2018 to 2022) |
| |
| Anita L. DeFrantz | | |
| |
| Year of birth | | 1952 |
| Position(s) with Fund | | Trustee |
| Term of office1 and length of time served2 | | Since 1998 |
| Principal occupation(s) during the past five years | | President of Tubman Truth Corp. (since 2015); Vice President (since 2017), Member of the Executive Board (since 2013) and Member of the International Olympic Committee (since 1986); and President Emeritus (since 2015) and formerly, President (1987 to 2015) and Director (1990 to 2015) of LA84 (formerly Amateur Athletic Foundation of Los Angeles) |
| Number of funds in fund complex overseen by Trustee | | 50 |
| Other Trusteeships held by Trustee during the past five years | | None |
| | | | |
48 | | | | Western Asset SMASh Series TF Fund |
| | |
| Independent Trustees† (cont’d) | | |
| |
| Susan B. Kerley | | |
| Year of birth | | 1951 |
| Position(s) with Fund | | Trustee |
| Term of office1 and length of time served2 | | Since 1992 |
| Principal occupation(s) during the past five years | | Investment Consulting Partner, Strategic Management Advisors, LLC (investment consulting) (since 1990) |
| Number of funds in fund complex overseen by Trustee | | 50 |
| Other Trusteeships held by Trustee during the past five years | | Director and Trustee (since 1990) and Chairman (since 2017 and 2005 to 2012) of various series of MainStay Family of Funds (66 funds); formerly, Chairman of the Independent Directors Council (2012 to 2014); ICI Executive Committee (2011 to 2014); and Investment Company Institute (ICI) Board of Governors (2006 to 2014) |
| |
| Michael Larson | | |
| |
| Year of birth | | 1959 |
| Position(s) with Fund | | Trustee |
| Term of office1 and length of time served2 | | Since 2004 |
| Principal occupation(s) during the past five years | | Chief Investment Officer for William H. Gates III (since 1994)3 |
| Number of funds in fund complex overseen by Trustee | | 50 |
| Other Trusteeships held by Trustee during the past five years | | Ecolab Inc. (since 2012); Fomento Economico Mexicano, SAB (since 2011); and Republic Services, Inc. (since 2009) |
| |
| Avedick B. Poladian | | |
| |
| Year of birth | | 1951 |
| Position(s) with Fund | | Trustee |
| Term of office1 and length of time served2 | | Since 2007 |
| Principal occupation(s) during the past five years | | Director and Advisor (since 2017) and formerly, Executive Vice President and Chief Operating Officer (2002 to 2016) of Lowe Enterprises, Inc. (privately held real estate and hospitality firm); and formerly, Partner, Arthur Andersen, LLP (1974 to 2002) |
| Number of funds in fund complex overseen by Trustee | | 50 |
| Other Trusteeships held by Trustee during the past five years | | Public Storage (since 2010); Occidental Petroleum Corporation (since 2008); and formerly, California Resources Corporation (2014 to 2021) |
| |
| William E.B. Siart | | |
| |
| Year of birth | | 1946 |
| Position(s) with Fund | | Trustee and Chairman of the Board |
| Term of office1 and length of time served2 | | Since 1997 (Chairman of the Board since 2020) |
| Principal occupation(s) during the past five years | | Chairman of Excellent Education Development (since 2000); formerly, Chairman of Great Public Schools Now (2015 to 2020); Trustee of The Getty Trust (2005 to 2017); and Chairman of Walt Disney Concert Hall, Inc. (1998 to 2006) |
| Number of funds in fund complex overseen by Trustee | | 50 |
| Other Trusteeships held by Trustee during the past five years | | Trustee, University of Southern California (since 1994); and formerly, Member of Board of United States Golf Association, Executive Committee Member (2017 to 2021) |
| | | | | | |
| Western Asset SMASh Series TF Fund | | | | | 49 | |
Additional information (unaudited) (cont’d)
Information about Trustees and Officers
| | |
| Independent Trustees† (cont’d) | | |
| |
| Jaynie Miller Studenmund | | |
| |
| Year of birth | | 1954 |
| Position(s) with Fund | | Trustee |
| Term of office1 and length of time served2 | | Since 2004 |
| Principal occupation(s) during the past five years | | Corporate Board Member and Advisor (since 2004); formerly, Chief Operating Officer of Overture Services, Inc. (publicly traded internet company that created search engine marketing) (2001 to 2004); President and Chief Operating Officer, PayMyBills (internet innovator in bill presentment/payment space) (1999 to 2001); and Executive vice president for consumer and business banking for three national financial institutions (1984 to 1997) |
| Number of funds in fund complex overseen by Trustee | | 50 |
| Other Trusteeships held by Trustee during the past five years | | Director of Pacific Premier Bancorp Inc. and Pacific Premier Bank (since 2019); Director of EXL (operations management and analytics company) (since 2018); formerly, Director of LifeLock, Inc. (identity theft protection company) (2015 to 2017); Director of CoreLogic, Inc. (information, analytics and business services company) (2012 to 2021); and Director of Pinnacle Entertainment, Inc. (gaming and hospitality company) (2012 to 2018) |
| | | |
| |
| Peter J. Taylor | | |
| |
| Year of birth | | 1958 |
| Position(s) with Fund | | Trustee |
| Term of office1 and length of time served2 | | Since 2019 |
| Principal occupation(s) during the past five years | | Retired; formerly, President, ECMC Foundation (nonprofit organization) (2014 to 2023); and Executive Vice President and Chief Financial Officer for University of California system (2009 to 2014) |
| Number of funds in fund complex overseen by Trustee | | 50 |
| Other Trusteeships held by Trustee during the past five years | | Director of 23andMe, Inc. (genetics and health care services company) (since 2021); Director of Pacific Mutual Holding Company4 (since 2016); Ralph M. Parson Foundation (since 2015); Edison International (since 2011); formerly, Member of the Board of Trustees of California State University system (2015 to 2022); and Kaiser Family Foundation (2012 to 2022) |
| Interested Trustee | | |
| |
| Ronald L. Olson5 | | |
| |
| Year of birth | | 1941 |
| Position(s) with Fund | | Trustee |
| Term of office1 and length of time served2 | | Since 2005 |
| Principal occupation(s) during the past five years | | Partner of Munger, Tolles & Olson LLP (a law partnership) (since 1968) |
| Number of funds in fund complex overseen by Trustee | | 50 |
| Other Trusteeships held by Trustee during the past five years | | Director of Provivi, Inc. (since 2017); and Director of Berkshire Hathaway, Inc. (since 1997) |
| | |
| | | | |
50 | | | | Western Asset SMASh Series TF Fund |
| | |
| Interested Trustee and Officer | | |
| |
| Jane Trust, CFA6 | | |
| |
| Year of birth | | 1962 |
| Position(s) with Fund | | Trustee, President and Chief Executive Officer |
| Term of office1 and length of time served2 | | Since 2015 |
| Principal occupation(s) during the past five years | | Senior Vice President, Fund Board Management, Franklin Templeton (since 2020); Officer and/or Trustee/Director of 123 funds associated with FTFA or its affiliates (since 2015); President and Chief Executive Officer of FTFA (since 2015); formerly, Senior Managing Director (2018 to 2020) and Managing Director (2016 to 2018) of Legg Mason & Co., LLC (“Legg Mason & Co.”); and Senior Vice President of FTFA (2015) |
| Number of funds in fund complex overseen by Trustee | | Trustee of Franklin Templeton funds consisting of 123 portfolios; Trustee of Putnam Family of Funds consisting of 105 portfolios |
| Other Trusteeships held by Trustee during the past five years | | None |
| | |
| Additional Officers | | |
| |
Ted P. Becker Franklin Templeton 280 Park Avenue, 8th Floor, New York, NY 10017 | | |
| |
| Year of birth | | 1951 |
| Position(s) with Fund | | Chief Compliance Officer |
| Term of office1 and length of time served2 | | Since 2007 |
| Principal occupation(s) during the past five years | | Vice President, Global Compliance of Franklin Templeton (since 2020); Chief Compliance Officer of FTFA (since 2006); Chief Compliance Officer of certain funds associated with Legg Mason & Co. or its affiliates (since 2006); formerly, Director of Global Compliance at Legg Mason (2006 to 2020); Managing Director of Compliance of Legg Mason & Co. (2005 to 2020) |
|
Susan Kerr
Franklin Templeton 280 Park Avenue, 8th Floor, New York, NY 10017 |
| |
| Year of birth | | 1949 |
| Position(s) with Fund | | Chief Anti-Money Laundering Compliance Officer |
| Term of office1 and length of time served2 | | Since 2013 |
| Principal occupation(s) during the past five years | | Senior Compliance Analyst, Franklin Templeton (since 2020); Chief Anti-Money Laundering Compliance Officer of certain funds associated with Legg Mason & Co. or its affiliates (since 2013) and Anti-Money Laundering Compliance Officer (since 2012), Senior Compliance Officer (since 2011) and Assistant Vice President (since 2010) of Franklin Distributors, LLC; formerly, Assistant Vice President of Legg Mason & Co. (2010 to 2020) |
| | | | | | |
| Western Asset SMASh Series TF Fund | | | | | 51 | |
Additional information (unaudited) (cont’d)
Information about Trustees and Officers
| | |
| Additional Officers (cont’d) | | |
|
Marc A. De Oliveira
Franklin Templeton 100 First Stamford Place, 6th Floor, Stamford, CT 06902 |
| |
| Year of birth | | 1971 |
| Position(s) with Fund | | Secretary and Chief Legal Officer |
| Term of office1 and length of time served2 | | Since 2020 |
| Principal occupation(s) during the past five years | | Associate General Counsel of Franklin Templeton (since 2020); Assistant Secretary of certain funds associated with Legg Mason & Co. or its affiliates (since 2006); formerly, Managing Director (2016 to 2020) and Associate General Counsel of Legg Mason & Co. (2005 to 2020) |
|
Thomas C. Mandia
Franklin Templeton 100 First Stamford Place, 6th Floor, Stamford, CT 06902 |
| |
| Year of birth | | 1962 |
| Position(s) with Fund | | Senior Vice President |
| Term of office1 and length of time served2 | | Since 2020 |
| Principal occupation(s) during the past five years | | Senior Associate General Counsel of Franklin Templeton (since 2020); Secretary of FTFA (since 2006); Assistant Secretary of certain funds associated with Legg Mason & Co. or its affiliates (since 2006); Secretary of LM Asset Services, LLC (“LMAS”) (since 2002) and Legg Mason Fund Asset Management, Inc. (“LMFAM”) (since 2013) (formerly registered investment advisers); formerly, Managing Director and Deputy General Counsel of Legg Mason & Co. (2005 to 2020) |
|
Christopher Berarducci
Franklin Templeton 280 Park Avenue, 8th Floor, New York, NY 10017 |
| |
| Year of birth | | 1974 |
| Position(s) with Fund | | Treasurer and Principal Financial Officer |
| Term of office1 and length of time served2 | | Since 2019 |
| Principal occupation(s) during the past five years | | Vice President, Fund Administration and Reporting, Franklin Templeton (since 2020); Treasurer (since 2010) and Principal Financial Officer (since 2019) of certain funds associated with Legg Mason & Co. or its affiliates; formerly, Managing Director (2020), Director (2015 to 2020), and Vice President (2011 to 2015) of Legg Mason & Co. |
| | | | |
52 | | | | Western Asset SMASh Series TF Fund |
| | |
| Additional Officers (cont’d) | | |
|
Jeanne M. Kelly
Franklin Templeton 280 Park Avenue, 8th Floor, New York, NY 10017 |
| |
| Year of birth | | 1951 |
| Position(s) with Fund | | Senior Vice President |
| Term of office1 and length of time served2 | | Since 2007 |
| Principal occupation(s) during the past five years | | U.S. Fund Board Team Manager, Franklin Templeton (since 2020); Senior Vice President of certain funds associated with Legg Mason & Co. or its affiliates (since 2007); Senior Vice President of FTFA (since 2006); President and Chief Executive Officer of LMAS and LMFAM (since 2015); formerly, Managing Director of Legg Mason & Co. (2005 to 2020); and Senior Vice President of LMFAM (2013 to 2015) |
| | FTFA, referenced above, was formerly known as LMPFA prior to November 30, 2023. |
| † | Trustees who are not “interested persons” of the Fund within the meaning of Section 2(a)(19) of the Investment Company Act of 1940, as amended (the “1940 Act”). |
| 1 | Each Trustee and officer serves until his or her respective successor has been duly elected and qualified or until his or her earlier death, resignation, retirement or removal. |
| 2 | Indicates the earliest year in which the Trustee became a board member for a fund in the Franklin Templeton fund complex or the officer took such office. |
| 3 | Mr. Larson is the chief investment officer for William H. Gates III and in that capacity oversees the non-Microsoft investments of Mr. Gates and all of the investments of the Bill and Melinda Gates Foundation Trust (such combined investments are referred to as the “Accounts”). Since 1997, Western Asset has provided discretionary investment advice with respect to one or more Accounts. |
| 4 | Western Asset and its affiliates provide investment advisory services with respect to registered investment companies sponsored by an affiliate of Pacific Mutual Holding Company (“Pacific Holdings”). Affiliates of Pacific Holdings receive compensation from FTFA or its affiliates for shareholder or distribution services provided with respect to registered investment companies for which Western Asset or its affiliates serve as investment adviser. |
| 5 | Mr. Olson is an “interested person” of the Fund, as defined in the 1940 Act, because his law firm has provided legal services to Western Asset. |
| 6 | Ms. Trust is an “interested person” of the Fund, as defined in the 1940 Act, because of her position with FTFA and/or certain of its affiliates. |
| | | | | | |
| Western Asset SMASh Series TF Fund | | | | | 53 | |
Important tax information (unaudited)
By mid-February, tax information related to a shareholder’s proportionate share of distributions paid during the preceding calendar year will be received, if applicable. Please also refer to www.franklintempleton.com for per share tax information related to any distributions paid during the preceding calendar year. Shareholders are advised to consult with their tax advisors for further information on the treatment of these amounts on their tax returns.
The following tax information for the Fund is required to be furnished to shareholders with respect to income earned and distributions paid during its fiscal year.
The Fund hereby reports the following amounts, or if subsequently determined to be different, the maximum allowable amounts, for the fiscal year ended February 29, 2024:
| | | | | | |
| | | Pursuant to: | | Amount Reported | |
| Exempt-Interest Dividends Distributed | | §852(b)(5)(A) | | | $3,023,876 | |
| Qualified Net Interest Income (QII) | | §871(k)(1)(C) | | | $955 | |
| Section 163(j) Interest Earned | | §163(j) | | | $2,744 | |
| | | | |
54 | | | | Western Asset SMASh Series TF Fund |
Western Asset
SMASh Series TF Fund
Trustees
Robert Abeles, Jr.
Jane F. Dasher
Anita L. DeFrantz
Susan B. Kerley
Michael Larson
Ronald L. Olson
Avedick B. Poladian
William E.B. Siart
Chairman
Jaynie M. Studenmund
Peter J. Taylor
Jane Trust
Investment manager
Franklin Templeton Fund Adviser, LLC*
Subadviser
Western Asset Management Company, LLC
Distributor
Franklin Distributors, LLC
Custodian
The Bank of New York Mellon
Transfer agent
Franklin Templeton Investor
Services, LLC
3344 Quality Drive
Rancho Cordova, CA 95670-7313
Independent registered public accounting firm
PricewaterhouseCoopers LLP Baltimore, MD
| * | Formerly known as Legg Mason Partners Fund Advisor, LLC. |
Western Asset SMASh Series TF Fund
The Fund is a separate investment series of Legg Mason Partners Institutional Trust, a Maryland statutory trust.
Western Asset SMASh Series TF Fund
Legg Mason Funds
620 Eighth Avenue, 47th Floor
New York, NY 10018
The Fund files its complete schedule of portfolio holdings with the Securities and Exchange Commission (“SEC”) for the first and third quarters of each fiscal year as an exhibit to its reports on Form N-PORT. The Fund’s Forms N-PORT are available on the SEC’s website at www.sec.gov. To obtain information on Form N-PORT, shareholders can call the Fund at 877-6LM-FUND/656-3863.
Information on how the Fund voted proxies relating to portfolio securities during the prior 12-month period ended June 30th of each year and a description of the policies and procedures that the Fund uses to determine how to vote proxies related to portfolio transactions are available (1) without charge, upon request, by calling the Fund at 877-6LM-FUND/656-3863, (2) at www.franklintempleton.com and (3) on the SEC’s website at www.sec.gov.
This report is submitted for the general information of the shareholders of Western Asset SMASh Series TF Fund and is not intended for distribution to prospective investors.
This report must be preceded or accompanied by a free prospectus. Investors should consider the Fund’s investment objectives, risks, charges and expenses carefully before investing. The prospectus contains this and other important information about the Fund. Please read the prospectus carefully before investing.
www.franklintempleton.com
© 2024 Franklin Distributors, LLC,
Member FINRA/SIPC. All rights reserved.
Franklin Templeton Funds Privacy and Security Notice
Your Privacy Is Our Priority
Franklin Templeton* is committed to safeguarding your personal information. This notice is designed to provide you with a summary of the non-public personal information Franklin Templeton may collect and maintain about current or former individual investors; our policy regarding the use of that information; and the measures we take to safeguard the information. We do not sell individual investors’ non-public personal information to anyone and only share it as described in this notice.
Information We Collect
When you invest with us, you provide us with your non-public personal information. We collect and use this information to service your accounts and respond to your requests. The non-public personal information we may collect falls into the following categories:
| • | | Information we receive from you or your financial intermediary on applications or other forms, whether we receive the form in writing or electronically. For example, this information may include your name, address, tax identification number, birth date, investment selection, beneficiary information, and your personal bank account information and/or email address if you have provided that information. |
| • | | Information about your transactions and account history with us, or with other companies that are part of Franklin Templeton, including transactions you request on our website or in our app. This category also includes your communications to us concerning your investments. |
| • | | Information we receive from third parties (for example, to update your address if you move, obtain or verify your email address or obtain additional information to verify your identity). |
| • | | Information collected from you online, such as your IP address or device ID and data gathered from your browsing activity and location. (For example, we may use cookies to collect device and browser information so our website recognizes your online preferences and device information.) Our website contains more information about cookies and similar technologies and ways you may limit them. |
| • | | Other general information that we may obtain about you such as demographic information. |
Disclosure Policy
To better service your accounts and process transactions or services you requested, we may share non-public personal information with other Franklin Templeton companies. From time to time we may also send you information about products/services offered by other Franklin Templeton companies although we will not share your non-public personal information with these companies without first offering you the opportunity to prevent that sharing.
We will only share non-public personal information with outside parties in the limited circumstances permitted by law. For example, this includes situations where we need to share information with companies who work on our behalf to service or maintain your account or
|
| NOT PART OF THE ANNUAL REPORT |
Franklin Templeton Funds Privacy and Security Notice (cont’d)
process transactions you requested, when the disclosure is to companies assisting us with our own marketing efforts, when the disclosure is to a party representing you, or when required by law (for example, in response to legal process). Additionally, we will ensure that any outside companies working on our behalf, or with whom we have joint marketing agreements, are under contractual obligations to protect the confidentiality of your information, and to use it only to provide the services we asked them to perform.
Confidentiality and Security
Our employees are required to follow procedures with respect to maintaining the confidentiality of our investors’ non-public personal information. Additionally, we maintain physical, electronic and procedural safeguards to protect the information. This includes performing ongoing evaluations of our systems containing investor information and making changes when appropriate.
At all times, you may view our current privacy notice on our website at https://www.franklintempleton.com/help/privacy-policy or contact us for a copy at (800) 632-2301.
| * | For purposes of this privacy notice Franklin Templeton shall refer to the following entities: |
Fiduciary Trust International of the South (FTIOS), as custodian for individual retirement plans Franklin Advisers, Inc.
Franklin Distributors, LLC, including as program manager of the Franklin Templeton 529 College Savings Plan and the NJBEST 529 College Savings Plan
Franklin Mutual Advisers, LLC
Franklin, Templeton and Mutual Series Funds
Franklin Templeton Institutional, LLC
Franklin Templeton Investments Corp., Canada
Franklin Templeton Investments Management, Limited UK
Legg Mason Funds
Templeton Asset Management, Limited
Templeton Global Advisors, Limited
Templeton Investment Counsel, LLC
If you are a customer of other Franklin Templeton affiliates and you receive notices from them, you will need to read those notices separately.
|
| NOT PART OF THE ANNUAL REPORT |
www.franklintempleton.com
© 2024 Franklin Distributors, LLC,
Member FINRA/SIPC. All rights reserved.
WASX257523 4/24 SR24-4856
The registrant has adopted a code of ethics that applies to the registrant’s principal executive officer, principal financial officer, principal accounting officer or controller.
| ITEM 3. | AUDIT COMMITTEE FINANCIAL EXPERT. |
The Board of Trustees of the registrant has determined that Robert Abeles, Jr., possess the technical attributes identified in Instruction 2(b) of Item 3 to Form N-CSR to qualify an “audit committee financial expert,” and has designated Mr. Abeles, Jr. as the Audit Committee’s financial expert. Mr. Abeles, Jr. is an “independent” Trustees pursuant to paragraph (a) (2) of Item 3 to Form N-CSR.
| ITEM 4. | PRINCIPAL ACCOUNTANT FEES AND SERVICES. |
a) Audit Fees. The aggregate fees billed in the last two fiscal years ending February 28, 2023 and February 29, 2024 (the “Reporting Periods”) for professional services rendered by the Registrant’s principal accountant (the “Auditor”) for the audit of the Registrant’s annual financial statements, or services that are normally provided by the Auditor in connection with the statutory and regulatory filings or engagements for the Reporting Periods, were $149,262 in February 28, 2023 and $149,262 in February 29, 2024.
b) Audit-Related Fees. The aggregate fees billed in the Reporting Period for assurance and related services by the Auditor that are reasonably related to the performance of the Registrant’s financial statements were $0 in February 28, 2023 and $0 in February 29, 2024.
(c) Tax Fees. The aggregate fees billed in the Reporting Periods for professional services rendered by the Auditor for tax compliance, tax advice and tax planning (“Tax Services”) were $40,000 in February 28, 2023 and $40,000 in February 29, 2024. These services consisted of (i) review or preparation of U.S. federal, state, local and excise tax returns; (ii) U.S. federal, state and local tax planning, advice and assistance regarding statutory, regulatory or administrative developments, and (iii) tax advice regarding tax qualification matters and/or treatment of various financial instruments held or proposed to be acquired or held. There were no fees billed for tax services by the Auditors to service affiliates during the Reporting Periods that required pre-approval by the Audit Committee.
d) All Other Fees. The aggregate fees billed in the Reporting Periods for products and services provided by the Auditor, other than the services reported in paragraphs (a) through (c) for the Item 4 for the Legg Mason Partners Institutional Trust were $0 in February 28, 2023 and $0 in February 29, 2024.
All Other Fees. There were no other non-audit services rendered by the Auditor to Franklin Templeton Fund Adviser, LLC (“FTFA”), and any entity controlling, controlled by or under common control with FTFA that provided ongoing services to Legg Mason Partners Institutional Trust requiring pre-approval by the Audit Committee in the Reporting Period.
(e) Audit Committee’s pre–approval policies and procedures described in paragraph (c) (7) of Rule 2-01 of Regulation S-X.
(1) The Charter for the Audit Committee (the “Committee”) of the Board of each registered investment company (the “Fund”) advised by FTFA or one of their affiliates (each, an “Adviser”) requires that the Committee shall approve (a) all audit and permissible non-audit services to be provided to the Fund and (b) all permissible non-audit services to be provided by the Fund’s independent auditors to the Adviser and any Covered Service Providers if the engagement
relates directly to the operations and financial reporting of the Fund. The Committee may implement policies and procedures by which such services are approved other than by the full Committee.
The Committee shall not approve non-audit services that the Committee believes may impair the independence of the auditors. As of the date of the approval of this Audit Committee Charter, permissible non-audit services include any professional services (including tax services), that are not prohibited services as described below, provided to the Fund by the independent auditors, other than those provided to the Fund in connection with an audit or a review of the financial statements of the Fund. Permissible non-audit services may not include: (i) bookkeeping or other services related to the accounting records or financial statements of the Fund; (ii) financial information systems design and implementation; (iii) appraisal or valuation services, fairness opinions or contribution-in-kind reports; (iv) actuarial services; (v) internal audit outsourcing services; (vi) management functions or human resources; (vii) broker or dealer, investment adviser or investment banking services; (viii) legal services and expert services unrelated to the audit; and (ix) any other service the Public Company Accounting Oversight Board determines, by regulation, is impermissible.
Pre-approval by the Committee of any permissible non-audit services is not required so long as: (i) the aggregate amount of all such permissible non-audit services provided to the Fund, the Adviser and any service providers controlling, controlled by or under common control with the Adviser that provide ongoing services to the Fund (“Covered Service Providers”) constitutes not more than 5% of the total amount of revenues paid to the independent auditors during the fiscal year in which the permissible non-audit services are provided to (a) the Fund, (b) the Adviser and (c) any entity controlling, controlled by or under common control with the Adviser that provides ongoing services to the Fund during the fiscal year in which the services are provided that would have to be approved by the Committee; (ii) the permissible non-audit services were not recognized by the Fund at the time of the engagement to be non-audit services; and (iii) such services are promptly brought to the attention of the Committee and approved by the Committee (or its delegate(s)) prior to the completion of the audit.
(2) None of the services described in paragraphs (b) through (d) of this Item were performed in reliance on paragraph (c)(7)(i)(C) of Rule 2-01 of Regulation S-X.
(f) Not applicable.
(g) Non-audit fees billed by the Auditor for services rendered to Legg Mason Partners Institutional Trust, FTFA and any entity controlling, controlled by, or under common control with FTFA that provides ongoing services to Legg Mason Partners Institutional Trust during the reporting period were $350,359 in February 28, 2023 and $342,635 in February 29, 2024.
(h) Yes. Legg Mason Partners Institutional Trust’s Audit Committee has considered whether the provision of non-audit services that were rendered to Service Affiliates, which were not pre-approved (not requiring pre-approval), is compatible with maintaining the Accountant’s independence. All services provided by the Auditor to the Legg Mason Partners Institutional Trust or to Service Affiliates, which were required to be pre-approved, were pre-approved as required.
(i) Not applicable.
(j) Not applicable.
| ITEM 5. | AUDIT COMMITTEE OF LISTED REGISTRANTS. |
| | a) | The independent board members are acting as the registrant’s audit committee as specified in Section 3(a)(58)(B) of the Exchange Act. The Audit Committee consists of the following Board members: |
Robert Abeles, Jr.
Jane F. Dasher
Anita L. DeFrantz
Susan B. Kerley
Michael Larson
Avedick B. Poladian
William E.B. Siart
Jaynie M. Studenmund
Peter J. Taylor
| ITEM 6. | SCHEDULE OF INVESTMENTS. |
Included herein under Item 1.
| ITEM 7. | DISCLOSURE OF PROXY VOTING POLICIES AND PROCEDURES FOR CLOSED-END MANAGEMENT INVESTMENT COMPANIES. |
Not applicable.
| ITEM 8. | PORTFOLIO MANAGERS OF CLOSED-END MANAGEMENT INVESTMENT COMPANIES. |
Not applicable.
| ITEM 9. | PURCHASES OF EQUITY SECURITIES BY CLOSED-END MANAGEMENT INVESTMENT COMPANY AND AFFILIATED PURCHASERS. |
Not applicable.
| ITEM 10. | SUBMISSION OF MATTERS TO A VOTE OF SECURITY HOLDERS. |
Not applicable.
| ITEM 11. | CONTROLS AND PROCEDURES. |
| | (a) | The registrant’s principal executive officer and principal financial officer have concluded that the registrant’s disclosure controls and procedures (as defined in Rule 30a- 3(c) under the Investment Company Act of 1940, as amended (the “1940 Act”)) are effective as of a date within 90 days of the filing date of this report that includes the disclosure required by this paragraph, based on their evaluation of the disclosure controls and procedures required by Rule 30a-3(b) under the 1940 Act and 15d-15(b) under the Securities Exchange Act of 1934. |
| | (b) | There were no changes in the registrant’s internal control over financial reporting (as defined in Rule 30a-3(d) under the 1940 Act) that occurred during the period covered by this report that have materially affected, or are likely to materially affect the registrant’s internal control over financial reporting. |
| ITEM 12. | DISCLOSURE OF SECURITIES LENDING ACTIVITIES FOR CLOSED-END MANAGEMENT INVESTMENT COMPANIES. |
Not applicable.
| ITEM 13. | RECOVERY OF ERRONEOUSLY AWARDED COMPENSATION. |
(a) Not applicable.
(b) Not applicable.
(a)(1) Code of Ethics attached hereto.
Exhibit 99.CODE ETH
(a) (2) Certifications pursuant to section 302 of the Sarbanes-Oxley Act of 2002 attached hereto.
Exhibit 99.CERT
(b) Certifications pursuant to Section 906 of the Sarbanes-Oxley Act of 2002 attached hereto.
Exhibit 99.906CERT
SIGNATURES
Pursuant to the requirements of the Securities Exchange Act of 1934 and the Investment Company Act of 1940, the registrant has duly caused this Report to be signed on its behalf by the undersigned, there unto duly authorized.
| | |
| Legg Mason Partners Institutional Trust |
| |
| By: | | /s/ Jane Trust |
| | Jane Trust |
| | Chief Executive Officer |
Date: April 23, 2024
Pursuant to the requirements of the Securities Exchange Act of 1934 and the Investment Company Act of 1940, this report has been signed below by the following persons on behalf of the registrant and in the capacities and on the dates indicated.
| | |
| By: | | /s/ Jane Trust |
| | Jane Trust |
| | Chief Executive Officer |
Date: April 23, 2024
| | |
| By: | | /s/ Christopher Berarducci |
| | Christopher Berarducci |
| | Principal Financial Officer |
Date: April 23, 2024