UNITED STATES
SECURITIES AND EXCHANGE COMMISSION
Washington, D.C. 20549
FORM N-CSR
CERTIFIED SHAREHOLDER REPORT OF REGISTERED
MANAGEMENT INVESTMENT COMPANIES
Investment Company Act file number 811-06740
Legg Mason Partners Institutional Trust
(Exact name of registrant as specified in charter)
620 Eighth Avenue, 47th Floor, New York, NY 10018
(Address of principal executive offices) (Zip code)
Marc A. De Oliveira
Franklin Templeton
100 First Stamford Place
Stamford, CT 06902
(Name and address of agent for service)
Registrant’s telephone number, including area code: 877-6LM-FUND/656-3863
Date of fiscal year end: August 31
Date of reporting period: February 29, 2024
| ITEM 1. | REPORT TO STOCKHOLDERS. |
The Semi-Annual Report to Stockholders is filed herewith.

| | |
Semi-Annual Report | | February 29, 2024 |
WESTERN ASSET
PREMIER INSTITUTIONAL
GOVERNMENT RESERVES
The Securities and Exchange Commission has adopted new regulations that will result in changes to the design and delivery of annual and semi-annual shareholder reports beginning in July 2024.
If you have previously elected to receive shareholder reports electronically, you will continue to do so and need not take any action.
Otherwise, paper copies of the Fund’s shareholder reports will be mailed to you beginning in July 2024. If you would like to receive shareholder reports and other communications from the Fund electronically instead of by mail, you may make that request at any time by contacting your financial intermediary (such as a broker-dealer or bank) or, if you are a direct investor, enrolling at my.accessportals.com.

|
| INVESTMENT PRODUCTS: NOT FDIC INSURED • NO BANK GUARANTEE • MAY LOSE VALUE |
Fund objective
The Fund’s investment objective is to seek maximum current income to the extent consistent with preservation of capital and the maintenance of liquidity.
| | |
II | | Western Asset Premier Institutional Government Reserves |
Letter from the president

Dear Shareholder,
We are pleased to provide the semi-annual report of Western Asset Premier Institutional Government Reserves for the six-month reporting period ended February 29, 2024. Please read on for Fund performance information during the Fund’s reporting period.
As always, we remain committed to providing you with excellent service and a full spectrum of investment choices. We also remain committed to supplementing the support you receive from your financial advisor. One way we accomplish this is through our website, www.franklintempleton.com. Here you can gain immediate access to market and investment information, including:
| • | | Fund prices and performance, |
| • | | Market insights and commentaries from our portfolio managers, and |
| • | | A host of educational resources. |
We look forward to helping you meet your financial goals.
Sincerely,

Jane Trust, CFA
President and Chief Executive Officer
March 28, 2024
| | |
| Western Asset Premier Institutional Government Reserves | | III |
Performance review
As of February 29, 2024, the seven-day current yield for Capital Shares of Western Asset Premier Institutional Government Reserves was 5.27% and the seven-day effective yield, which reflects compounding, was 5.41%.1
The Fund does not invest directly in securities but instead invests all of its investable assets in an underlying mutual fund, Government Portfolio (the “Portfolio”), which has the same investment objective and strategies, and substantially the same policies as the Fund. Unless otherwise indicated, references to the Fund include the underlying mutual fund, the Portfolio.
| | | | | | | | |
Western Asset Premier Institutional Government Reserves Yields as of February 29, 2024 (unaudited) | |
| | | Seven-Day
Current Yield1 | | | Seven-Day
Effective Yield1 | |
| Capital Shares | | | 5.27 | % | | | 5.41 | % |
| Premium Shares | | | 5.25 | % | | | 5.39 | % |
The performance shown represents past performance. Past performance is no guarantee of future results and current performance may be higher or lower than the performance shown above. Yields will fluctuate. To obtain performance data current to the most recent month-end, please visit our website at www.franklintempleton.com.
As of February 29, 2024, absent fee waivers and/or expense reimbursements, the seven-day current yield and the seven-day effective yield for Capital shares would have been 5.02% and 5.15%, respectively; and the seven-day current yield and the seven-day effective yield for Premium Shares would have been 4.96% and 5.08%, respectively.
The manager has voluntarily undertaken to limit Fund expenses. Such expense limitations may fluctuate daily and are voluntary and temporary and may be terminated by the manager at any time without notice.
You could lose money by investing in the Fund. Although the Fund seeks to preserve the value of your investment at $1.00 per share, it cannot guarantee it will do so. An investment in the Fund is not a bank account and is not insured or guaranteed by the Federal Deposit Insurance Corporation or any other government agency. The Fund’s sponsor is not required to reimburse the Fund for losses, and you should not expect that the sponsor will provide financial support to the Fund at any time, including during periods of market stress.
| 1 | The seven-day current yield reflects the amount of income generated by the investment during that seven-day period and assumes that the income is generated each week over a 365-day period. The yield is shown as a percentage of the investment. The seven-day effective yield is calculated similarly to the seven-day current yield but, when annualized, the income earned by an investment in the Fund is assumed to be reinvested. The effective yield typically will be slightly higher than the current yield because of the compounding effect of the assumed reinvestment. |
| | | | |
iv | | | | Western Asset Premier Institutional Government Reserves |
Performance review (cont’d)
As always, thank you for your confidence in our stewardship of your assets.
Sincerely,
Jane Trust, CFA
President and Chief Executive Officer
March 28, 2024
RISKS: You could lose money by investing in the Fund. Although the Fund seeks to preserve the value of your investment at $1.00 per share, it cannot guarantee it will do so. An investment in the Fund is not a bank account and is not insured or guaranteed by the Federal Deposit Insurance Corporation or any other government agency. The Fund’s sponsors is not required to reimburse the Fund for losses, and you should not expect that the sponsor will provide financial support to the Fund at any time, including during periods of market stress. During periods of market stress, there could be significant redemptions from money market funds in general, potentially driving the market prices of money market instruments down and adversely affecting market liquidity. Although the Fund invests in U.S. government obligations, an investment in the Fund is neither insured nor guaranteed by the U.S. government. Please see the Fund’s prospectus for a more complete discussion of these and other risks and the Fund’s investment strategies.
All investments are subject to risk including the possible loss of principal. Past performance is no guarantee of future results.
| | | | |
| Western Asset Premier Institutional Government Reserves | | | | v |
Portfolio at a glance† (unaudited)
Government Portfolio
The Fund invests all of its investable assets in Government Portfolio, the investment breakdown of which is shown below.
Investment breakdown (%) as a percent of total investments
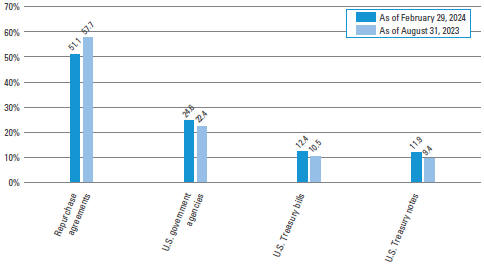
| † | The bar graph above represents the composition of the Portfolio’s investments as of February 29, 2024 and August 31, 2023. The Portfolio is actively managed. As a result, the composition of the Portfolio’s investments is subject to change at any time. |
| | | | |
| Western Asset Premier Institutional Government Reserves 2024 Semi-Annual Report | | | | 1 |
Fund expenses (unaudited)
Example
As a shareholder of the Fund, you may incur two types of costs: (1) transaction costs and (2) ongoing costs, including management fees; and other Fund expenses. This example is intended to help you understand your ongoing costs (in dollars) of investing in the Fund and to compare these costs with the ongoing costs of investing in other mutual funds.
This example is based on an investment of $1,000 invested on September 1, 2023 and held for the six months ended February 29, 2024.
Actual expenses
The table below titled “Based on actual total return” provides information about actual account values and actual expenses. You may use the information provided in this table, together with the amount you invested, to estimate the expenses that you paid over the period. To estimate the expenses you paid on your account, divide your ending account value by $1,000 (for example, an $8,600 ending account value divided by $1,000 = 8.6), then multiply the result by the number under the heading entitled “Expenses Paid During the Period”.
Hypothetical example for comparison purposes
The table below titled “Based on hypothetical total return” provides information about hypothetical account values and hypothetical expenses based on the actual expense ratio and an assumed rate of return of 5.00% per year before expenses, which is not the Fund’s actual return. The hypothetical account values and expenses may not be used to estimate the actual ending account balance or expenses you paid for the period. You may use the information provided in this table to compare the ongoing costs of investing in the Fund and other funds. To do so, compare the 5.00% hypothetical example relating to the Fund with the 5.00% hypothetical examples that appear in the shareholder reports of the other funds.
Please note that the expenses shown in the table below are meant to highlight your ongoing costs only and do not reflect any transactional costs. Therefore, the table is useful in comparing ongoing costs only, and will not help you determine the relative total costs of owning different funds. In addition, if these transaction costs were included, your costs would have been higher.
| | | | | | | | | | | | | | | | | | | | | | | | | | | | | | | | | | | | | | | | | | | | | | |
| | |
| Based on actual total return1 | | | | | | Based on hypothetical total return1 | |
| | | | | | | | | | | | |
| | | Actual
Total Return2 | | | Beginning
Account
Value | | | Ending
Account
Value | | | Annualized
Expense
Ratio3 | | | Expenses
Paid
During
the
Period4 | | | | | | | | Hypothetical
Annualized
Total Return | | | Beginning
Account
Value | | | Ending
Account
Value | | | Annualized
Expense
Ratio3 | | | Expenses
Paid
During
the
Period4 | |
| Capital Shares | | | 2.66 | % | | $ | 1,000.00 | | | $ | 1,026.60 | | | | 0.12 | % | | $ | 0.60 | | | | | | | Capital Shares | | | 5.00 | % | | $ | 1,000.00 | | | $ | 1,024.27 | | | | 0.12 | % | | $ | 0.60 | |
| Premium Shares | | | 2.65 | | | | 1,000.00 | | | | 1,026.50 | | | | 0.14 | | | | 0.71 | | | | | | | Premium Shares | | | 5.00 | | | | 1,000.00 | | | | 1,024.17 | | | | 0.14 | | | | 0.70 | |
| | | | |
2 | | | | Western Asset Premier Institutional Government Reserves 2024 Semi-Annual Report |
| 1 | For the six months ended February 29, 2024. |
| 2 | Assumes the reinvestment of all distributions, including returns of capital, if any, at net asset value. Total return is not annualized, as it may not be representative of the total return for the year. Performance figures may reflect fee waivers and/or expense reimbursements. In the absence of fee waivers and/or expense reimbursements, the total return would have been lower. Past performance is no guarantee of future results. |
| 3 | Includes the Fund’s share of Government Portfolio’s allocated expenses. |
| 4 | Expenses (net of fee waivers and/or expense reimbursements) are equal to each class’ respective annualized expense ratio multiplied by the average account value over the period, multiplied by the number of days in the most recent fiscal half-year (182), then divided by 366. |
| | | | |
| Western Asset Premier Institutional Government Reserves 2024 Semi-Annual Report | | | | 3 |
Statement of assets and liabilities (unaudited)
February 29, 2024
| | | | |
| |
| Assets: | | | | |
Investment in Government Portfolio, at value | | $ | 1,209,528,175 | |
Prepaid expenses | | | 17,159 | |
Total Assets | | | 1,209,545,334 | |
| |
| Liabilities: | | | | |
Distributions payable | | | 3,598,575 | |
Investment management fee payable | | | 94,647 | |
Trustees’ fees payable | | | 6,854 | |
Accrued expenses | | | 67,861 | |
Total Liabilities | | | 3,767,937 | |
| Total Net Assets | | $ | 1,205,777,397 | |
| |
| Net Assets: | | | | |
Par value (Note 5) | | $ | 12,063 | |
Paid-in capital in excess of par value | | | 1,206,305,362 | |
Total distributable earnings (loss) | | | (540,028) | |
| Total Net Assets | | $ | 1,205,777,397 | |
| |
| Net Assets: | | | | |
Capital Shares | | | $948,718,736 | |
Premium Shares | | | $257,058,661 | |
| |
| Shares Outstanding: | | | | |
Capital Shares | | | 949,107,115 | |
Premium Shares | | | 257,236,764 | |
| |
| Net Asset Value: | | | | |
Capital Shares | | | $1.00 | |
Premium Shares | | | $1.00 | |
See Notes to Financial Statements.
| | | | |
| 4 | | | | Western Asset Premier Institutional Government Reserves 2024 Semi-Annual Report |
Statement of operations (unaudited)
For the Six Months Ended February 29, 2024
| | | | |
| |
| Investment Income: | | | | |
Income from Government Portfolio | | $ | 35,088,857 | |
Allocated expenses from Government Portfolio | | | (691,447) | |
Allocated waiver and/or expense reimbursements from Government Portfolio | | | 648,695 | |
Total Investment Income | | | 35,046,105 | |
| |
| Expenses: | | | | |
Investment management fee (Note 2) | | | 1,577,647 | |
Transfer agent fees (Notes 2 & 3) | | | 112,404 | |
Legal fees | | | 33,333 | |
Registration fees | | | 20,153 | |
Trustees’ fees | | | 15,709 | |
Audit and tax fees | | | 10,717 | |
Fund accounting fees | | | 4,476 | |
Shareholder reports | | | 3,955 | |
Insurance | | | 2,057 | |
Miscellaneous expenses | | | 4,390 | |
Total Expenses | | | 1,784,841 | |
Less: Fee waivers and/or expense reimbursements (Notes 2 and 3) | | | (996,119) | |
Net Expenses | | | 788,722 | |
| Net Investment Income | | | 34,257,383 | |
| Net Realized Gain on Investments From Government Portfolio | | | 14,391 | |
| Increase in Net Assets From Operations | | $ | 34,271,774 | |
See Notes to Financial Statements.
| | | | |
| Western Asset Premier Institutional Government Reserves 2024 Semi-Annual Report | | | | 5 |
Statements of changes in net assets
| | | | | | | | |
For the Six Months Ended February 29, 2024 (unaudited) and the Year Ended August 31, 2023 | | 2024 | | | 2023 | |
| | |
| Operations: | | | | | | | | |
Net investment income | | $ | 34,257,383 | | | $ | 85,541,943 | |
Net realized gain (loss) | | | 14,391 | | | | (157,972) | |
Increase in Net Assets From Operations | | | 34,271,774 | | | | 85,383,971 | |
| | |
| Distributions to Shareholders From (Notes 1 and 4): | | | | | | | | |
Total distributable earnings | | | (34,255,042) | | | | (85,539,950) | |
Decrease in Net Assets From Distributions to Shareholders | | | (34,255,042) | | | | (85,539,950) | |
| | |
| Fund Share Transactions (Note 5): | | | | | | | | |
Net proceeds from sale of shares | | | 7,835,879,686 | | | | 25,345,845,621 | |
Reinvestment of distributions | | | 8,676,934 | | | | 3,387,788 | |
Cost of shares repurchased | | | (8,317,250,779) | | | | (24,331,568,272) | |
Increase (Decrease) in Net Assets From Fund Share Transactions | | | (472,694,159) | | | | 1,017,665,137 | |
Increase (Decrease) in Net Assets | | | (472,677,427) | | | | 1,017,509,158 | |
| | |
| Net Assets: | | | | | | | | |
Beginning of period | | | 1,678,454,824 | | | | 660,945,666 | |
End of period | | $ | 1,205,777,397 | | | $ | 1,678,454,824 | |
See Notes to Financial Statements.
| | | | |
| 6 | | | | Western Asset Premier Institutional Government Reserves 2024 Semi-Annual Report |
Financial highlights
| | | | | | | | | | | | | | | | | | | | |
For a share of each class of beneficial interest outstanding throughout each year ended August 31, unless otherwise noted: | |
| | | | | |
| Capital Shares | | 20241 | | | 2023 | | | 2022 | | | 20212 | | | 20202,3 | |
| | | | | |
| Net asset value, beginning of period | | | $1.000 | | | | $1.000 | | | | $1.000 | | | | $1.000 | | | | $1.000 | |
| | | | | |
| Income (loss) from operations: | | | | | | | | | | | | | | | | | | | | |
Net investment income | | | 0.026 | | | | 0.043 | | | | 0.005 | | | | 0.000 | 4 | | | 0.006 | |
Net realized gain (loss)4 | | | 0.000 | | | | (0.000) | | | | (0.000) | | | | (0.000) | | | | (0.000) | |
Total income from operations | | | 0.026 | | | | 0.043 | | | | 0.005 | | | | 0.000 | 4 | | | 0.006 | |
| | | | | |
| Less distributions from: | | | | | | | | | | | | | | | | | | | | |
Net investment income | | | (0.026) | | | | (0.043) | | | | (0.005) | | | | (0.000) | 4 | | | (0.006) | |
Total distributions | | | (0.026) | | | | (0.043) | | | | (0.005) | | | | (0.000) | 4 | | | (0.006) | |
| | | | | |
| Net asset value, end of period | | | $1.000 | | | | $1.000 | | | | $1.000 | | | | $1.000 | | | | $1.000 | |
Total return5 | | | 2.66 | % | | | 4.38 | % | | | 0.50 | % | | | 0.02 | % | | | 0.65 | % |
| | | | | |
| Net assets, end of period (millions) | | | $949 | | | | $1,601 | | | | $498 | | | | $101 | | | | $101 | |
| | | | | |
| Ratios to average net assets: | | | | | | | | | | | | | | | | | | | | |
Gross expenses6,7 | | | 0.37 | %8 | | | 0.36 | % | | | 0.37 | % | | | 0.42 | % | | | 38.35 | %8 |
Net expenses7,9,10 | | | 0.12 | 8 | | | 0.12 | | | | 0.08 | | | | 0.12 | | | | 0.12 | 8 |
Net investment income | | | 5.30 | 8 | | | 4.36 | | | | 0.74 | | | | 0.05 | | | | 0.77 | 8 |
| 1 | For the six months ended February 29, 2024 (unaudited). |
| 2 | Per share amounts have been calculated using the average shares method. |
| 3 | For the period October 30, 2019 (inception date) to August 31, 2020. |
| 4 | Amount represents less than $0.0005 or greater than $(0.0005) per share. |
| 5 | Performance figures may reflect fee waivers and/or expense reimbursements. In the absence of fee waivers and/or expense reimbursements, the total return would have been lower. Past performance is no guarantee of future results. Total returns for periods of less than one year are not annualized. |
| 6 | The gross expenses do not reflect the reduction in the Fund’s management fee, pursuant to the Fund’s investment management agreement, by the amount paid by the Fund for its allocable share of the management fee paid by Government Portfolio. |
| 7 | Includes the Fund’s share of Government Portfolio’s allocated expenses. |
| 9 | Reflects fee waivers and/or expense reimbursements. |
| 10 | As a result of an expense limitation arrangement, the ratio of total annual fund operating expenses, other than interest, brokerage, taxes, extraordinary expenses and acquired fund fees and expenses, to average net assets of Capital Shares did not exceed 0.12%. This expense limitation arrangement cannot be terminated prior to December 31, 2024 without the Board of Trustees’ consent. Additional amounts may be voluntarily waived and/or reimbursed from time to time. |
See Notes to Financial Statements.
| | | | |
| Western Asset Premier Institutional Government Reserves 2024 Semi-Annual Report | | | | 7 |
Financial highlights (cont’d)
| | | | | | | | | | | | | | | | | | | | |
For a share of each class of beneficial interest outstanding throughout each year ended August 31, unless otherwise noted: | |
| | | | | |
| Premium Shares | | 20241 | | | 2023 | | | 2022 | | | 20212 | | | 20202,3 | |
| | | | | |
| Net asset value, beginning of period | | | $1.000 | | | | $1.000 | | | | $1.000 | | | | $1.000 | | | | $1.000 | |
| | | | | |
| Income (loss) from operations: | | | | | | | | | | | | | | | | | | | | |
Net investment income | | | 0.026 | | | | 0.043 | | | | 0.005 | | | | 0.000 | 4 | | | 0.006 | |
Net realized gain (loss)4 | | | 0.000 | | | | (0.000) | | | | (0.000) | | | | (0.000) | | | | (0.000) | |
Total income from operations | | | 0.026 | | | | 0.043 | | | | 0.005 | | | | 0.000 | 4 | | | 0.006 | |
| | | | | |
| Less distributions from: | | | | | | | | | | | | | | | | | | | | |
Net investment income | | | (0.026) | | | | (0.043) | | | | (0.005) | | | | (0.000) | 4 | | | (0.006) | |
Total distributions | | | (0.026) | | | | (0.043) | | | | (0.005) | | | | (0.000) | 4 | | | (0.006) | |
| | | | | |
| Net asset value, end of period | | | $1.000 | | | | $1.000 | | | | $1.000 | | | | $1.000 | | | | $1.000 | |
Total return5 | | | 2.65 | % | | | 4.36 | % | | | 0.46 | % | | | 0.02 | % | | | 0.63 | % |
| | | | | |
| Net assets, end of period (000s) | | | $257,059 | | | | $77,916 | | | | $162,843 | | | | $1,035,980 | | | | $2,108,655 | |
| | | | | |
| Ratios to average net assets: | | | | | | | | | | | | | | | | | | | | |
Gross expenses6,7 | | | 0.40 | %8 | | | 0.38 | % | | | 0.40 | % | | | 0.37 | % | | | 0.38 | %8 |
Net expenses7,9,10 | | | 0.14 | 8 | | | 0.14 | | | | 0.10 | | | | 0.09 | | | | 0.14 | 8 |
Net investment income | | | 5.28 | 8 | | | 4.25 | | | | 0.23 | | | | 0.01 | | | | 0.68 | 8 |
| 1 | For the six months ended February 29, 2024 (unaudited). |
| 2 | Per share amounts have been calculated using the average shares method. |
| 3 | For the period October 30, 2019 (inception date) to August 31, 2020. |
| 4 | Amount represents less than $0.0005 or greater than $(0.0005) per share. |
| 5 | Performance figures may reflect fee waivers and/or expense reimbursements. In the absence of fee waivers and/or expense reimbursements, the total return would have been lower. Past performance is no guarantee of future results. Total returns for periods of less than one year are not annualized. |
| 6 | The gross expenses do not reflect the reduction in the Fund’s management fee, pursuant to the Fund’s investment management agreement, by the amount paid by the Fund for its allocable share of the management fee paid by Government Portfolio. |
| 7 | Includes the Fund’s share of Government Portfolio’s allocated expenses. |
| 9 | Reflects fee waivers and/or expense reimbursements. |
| 10 | As a result of an expense limitation arrangement, the ratio of total annual fund operating expenses, other than interest, brokerage, taxes, extraordinary expenses and acquired fund fees and expenses, to average net assets of Premium Shares did not exceed 0.14%. This expense limitation arrangement cannot be terminated prior to December 31, 2024 without the Board of Trustees’ consent. Additional amounts may be voluntarily waived and/or reimbursed from time to time. |
See Notes to Financial Statements.
| | | | |
| 8 | | | | Western Asset Premier Institutional Government Reserves 2024 Semi-Annual Report |
Notes to financial statements (unaudited)
1. Organization and significant accounting policies
Western Asset Premier Institutional Government Reserves (the “Fund”) is a separate diversified investment series of Legg Mason Partners Institutional Trust (the “Trust”). The Trust, a Maryland statutory trust, is registered under the Investment Company Act of 1940, as amended (the “1940 Act”), as an open-end management investment company. The Fund invests all of its investable assets in Government Portfolio (the “Portfolio”), a separate investment series of Master Portfolio Trust, that has the same investment objective as the Fund.
The financial statements of the Portfolio, including the schedule of investments, are contained elsewhere in this report and should be read in conjunction with the Fund’s financial statements.
The Fund follows the accounting and reporting guidance in Financial Accounting Standards Board (“FASB”) Accounting Standards Codification Topic 946, Financial Services – Investment Companies (“ASC 946”). The following are significant accounting policies consistently followed by the Fund and are in conformity with U.S. generally accepted accounting principles (“GAAP”), including, but not limited to, ASC 946. Estimates and assumptions are required to be made regarding assets, liabilities and changes in net assets resulting from operations when financial statements are prepared. Changes in the economic environment, financial markets and any other parameters used in determining these estimates could cause actual results to differ. Subsequent events have been evaluated through the date the financial statements were issued.
(a) Investment valuation. The Fund records its investment in the Portfolio at value. The value of such investment in the Portfolio reflects the Fund’s proportionate interest (5.9% at February 29, 2024) in the net assets of the Portfolio.
GAAP establishes a disclosure hierarchy that categorizes the inputs to valuation techniques used to value assets and liabilities at measurement date. The disclosure and valuation of securities held by the Portfolio are discussed in Note 1(a) of the Portfolio’s Notes to Financial Statements, which are included elsewhere in this report.
(b) Investment transactions and investment income. Net investment income of the Portfolio is allocated pro rata, based on respective ownership interests, among the Fund and other investors in the Portfolio (the “Holders”) at the time of such determination. Gross realized gains and/or losses of the Portfolio are allocated to the Holders in a manner such that the net asset values per share of each Holder, after each such allocation, is closer to the total of all Holders’ net asset values divided by the aggregate number of shares outstanding for all Holders. The Fund also pays certain other expenses which can be directly attributed to the Fund.
(c) Distributions to shareholders. Distributions from net investment income on the shares of the Fund are declared each business day and are paid monthly. Distributions of net realized gains, if any, are declared at least annually. Distributions to shareholders of the Fund are recorded on the ex-dividend date and are determined in accordance with income tax regulations, which may differ from GAAP.
| | | | |
| Western Asset Premier Institutional Government Reserves 2024 Semi-Annual Report | | | | 9 |
Notes to financial statements (unaudited) (cont’d)
(d) Share class accounting. Investment income, common expenses and realized gains (losses) on investments are allocated to the various classes of the Fund on the basis of daily net assets of each class. Fees relating to a specific class are charged directly to that share class.
(e) Federal and other taxes. It is the Fund’s policy to comply with the federal income and excise tax requirements of the Internal Revenue Code of 1986 (the “Code”), as amended, applicable to regulated investment companies. Accordingly, the Fund intends to distribute its taxable income and net realized gains, if any, to shareholders in accordance with timing requirements imposed by the Code. Therefore, no federal or state income tax provision is required in the Fund’s financial statements.
Management has analyzed the Fund’s tax positions taken on income tax returns for all open tax years and has concluded that as of August 31, 2023, no provision for income tax is required in the Fund’s financial statements. The Fund’s federal and state income and federal excise tax returns for tax years for which the applicable statutes of limitations have not expired are subject to examination by the Internal Revenue Service and state departments of revenue.
(f) Reclassification. GAAP requires that certain components of net assets be reclassified to reflect permanent differences between financial and tax reporting. These reclassifications have no effect on net assets or net asset value per share. During the current year, the Fund had no reclassifications.
2. Investment management agreement and other transactions with affiliates
Franklin Templeton Fund Adviser, LLC (“FTFA”) (formerly known as Legg Mason Partners Fund Advisor, LLC prior to November 30, 2023) is the Fund’s and the Portfolio’s investment manager and Western Asset Management Company, LLC (“Western Asset”) is the Fund’s and the Portfolio’s subadviser. FTFA and Western Asset are indirect, wholly-owned subsidiaries of Franklin Resources, Inc. (“Franklin Resources”).
Under the investment management agreement, the Fund pays an investment management fee, calculated daily and paid monthly, in accordance with the following breakpoint schedule:
| | | | |
| Average Daily Net Assets | | Annual Rate | |
| First $1 billion | | | 0.250% | |
| Next $1 billion | | | 0.225 | |
| Next $3 billion | | | 0.200 | |
| Next $5 billion | | | 0.175 | |
| Over $10 billion | | | 0.150 | |
Since the Fund invests all of its investable assets in the Portfolio, the investment management fee of the Fund will be reduced by the investment management fee allocated to the Fund by the Portfolio.
FTFA provides administrative and certain oversight services to the Fund. FTFA delegates to the subadviser the day-to-day portfolio management of the Fund. For its services, FTFA pays Western Asset monthly 70% of the net management fee it receives from the Fund.
| | | | |
10 | | | | Western Asset Premier Institutional Government Reserves 2024 Semi-Annual Report |
As a result of expense limitation arrangements between the Fund and FTFA, the ratio of total annual fund operating expenses, other than interest, brokerage, taxes, extraordinary expenses and acquired fund fees and expenses, to average net assets of Capital Shares and Premium Shares did not exceed 0.12% and 0.14%, respectively. These expense limitation arrangements cannot be terminated prior to December 31, 2024 without the Board of Trustees’ consent. Additional amounts may be voluntarily waived and/or reimbursed from time to time.
During the six months ended February 29, 2024, fees waived and/or expenses reimbursed amounted to $996,119.
FTFA is permitted to recapture amounts waived and/or reimbursed to a class during the same fiscal year if the class’ total annual fund operating expenses have fallen to a level below the expense limitation (“expense cap”) in effect at the time the fees were earned or the expenses incurred. In no case will FTFA recapture any amount that would result, on any particular business day of the Fund, in the class’ total annual fund operating expenses exceeding the expense cap or any other lower limit then in effect.
Franklin Distributors, LLC (“Franklin Distributors”) serves as the Fund’s sole and exclusive distributor. Franklin Distributors is an indirect, wholly-owned broker-dealer subsidiary of Franklin Resources.
All officers and one Trustee of the Trust are employees of Franklin Resources or its affiliates and do not receive compensation from the Trust.
3. Class specific expenses, waivers and/or expense reimbursements
For the six months ended February 29, 2024, class specific expenses were as follows:
| | | | |
| | | Transfer Agent
Fees | |
| Capital Shares | | $ | 16,490 | |
| Premium Shares | | | 95,914 | |
| Total | | $ | 112,404 | |
For the six months ended February 29, 2024, waivers and/or expense reimbursements by class were as follows:
| | | | |
| | | Waivers/Expense
Reimbursements | |
| Capital Shares | | $ | 592,657 | |
| Premium Shares | | | 403,462 | |
| Total | | $ | 996,119 | |
| | | | |
| Western Asset Premier Institutional Government Reserves 2024 Semi-Annual Report | | | | 11 |
Notes to financial statements (unaudited) (cont’d)
4. Distributions to shareholders by class
| | | | | | | | |
| | | Six Months Ended
February 29, 2024 | | | Year Ended
August 31, 2023 | |
| Net Investment Income: | | | | | | | | |
| Capital Shares | | $ | 21,049,762 | | | $ | 25,195,276 | |
| Premium Shares | | | 13,205,280 | | | | 60,344,674 | |
| Total | | $ | 34,255,042 | | | $ | 85,539,950 | |
5. Shares of beneficial interest
At February 29, 2024, the Trust had an unlimited number of shares of beneficial interest authorized with a par value of $0.00001 per share. The Fund has the ability to issue multiple classes of shares. Each class of shares represents an identical interest and has the same rights, except that each class bears certain direct expenses, including those specifically related to the distribution of its shares.
Transactions in shares of each class were as follows:
| | | | | | | | |
| | | Six Months Ended
February 29, 2024 | | | Year Ended
August 31, 2023 | |
| Capital Shares | | | | | | | | |
| Shares sold | | | 2,331,500,000 | | | | 11,585,200,000 | |
| Shares issued on reinvestment | | | 8,648,765 | | | | 3,387,788 | |
| Shares repurchased | | | (2,992,125,550) | | | | (10,485,918,508) | |
| Net increase (decrease) | | | (651,976,785) | | | | 1,102,669,280 | |
| Premium Shares | | | | | | | | |
| Shares sold | | | 5,504,379,686 | | | | 13,760,645,621 | |
| Shares issued on reinvestment | | | 28,169 | | | | — | |
| Shares repurchased | | | (5,325,125,229) | | | | (13,845,649,764) | |
| Net increase (decrease) | | | 179,282,626 | | | | (85,004,143) | |
Because the Fund has maintained a $1.00 net asset value per share from inception, the number of shares sold, shares issued on reinvestment of dividends declared, and shares repurchased is equal to the dollar amount shown in the Statements of Changes in Net Assets for the corresponding fund share transactions.
6. Deferred capital losses
As of August 31, 2023, the Fund had deferred capital losses of $552,651, which have no expiration date, that will be available to offset future taxable capital gains.
| | | | |
12 | | | | Western Asset Premier Institutional Government Reserves 2024 Semi-Annual Report |
Schedule of investments (unaudited)
February 29, 2024
Government Portfolio
(Percentages shown based on Portfolio net assets)
| | | | | | | | | | | | | | | | |
| Security | | Rate | | | Maturity
Date | | | Face
Amount | | | Value | |
| Short-Term Investments — 96.8% | | | | | | | | | | | | | | | | |
| U.S. Government Agencies — 23.8% | | | | | | | | | | | | | | | | |
Federal Farm Credit Bank (FFCB) | | | 3.625 | % | | | 3/6/24 | | | $ | 17,500,000 | | | $ | 17,495,653 | |
Federal Farm Credit Bank (FFCB) (U.S. Federal Funds Intraday Effective Rate + 0.015%) | | | 5.345 | % | | | 4/8/24 | | | | 25,000,000 | | | | 24,999,731 | (a) |
Federal Farm Credit Bank (FFCB) (SOFR + 0.050%) | | | 5.360 | % | | | 4/12/24 | | | | 75,000,000 | | | | 75,000,000 | (a) |
Federal Farm Credit Bank (FFCB) (SOFR + 0.045%) | | | 5.355 | % | | | 4/25/24 | | | | 5,000,000 | | | | 4,999,164 | (a) |
Federal Farm Credit Bank (FFCB) (SOFR + 0.045%) | | | 5.355 | % | | | 5/24/24 | | | | 2,000,000 | | | | 1,999,436 | (a) |
Federal Farm Credit Bank (FFCB) (SOFR + 0.080%) | | | 5.390 | % | | | 5/24/24 | | | | 50,000,000 | | | | 49,995,569 | (a) |
Federal Farm Credit Bank (FFCB) (SOFR + 0.130%) | | | 5.440 | % | | | 7/9/24 | | | | 75,000,000 | | | | 74,998,743 | (a) |
Federal Farm Credit Bank (FFCB) (SOFR + 0.100%) | | | 5.410 | % | | | 8/1/24 | | | | 20,000,000 | | | | 20,000,000 | (a) |
Federal Farm Credit Bank (FFCB) (Federal Reserve Bank Prime Loan Rate - 3.100%) | | | 5.400 | % | | | 8/26/24 | | | | 100,000,000 | | | | 99,965,658 | (a) |
Federal Farm Credit Bank (FFCB) (SOFR + 0.135%) | | | 5.445 | % | | | 9/5/24 | | | | 101,100,000 | | | | 101,099,902 | (a) |
Federal Farm Credit Bank (FFCB) (SOFR + 0.100%) | | | 5.410 | % | | | 10/7/24 | | | | 9,895,000 | | | | 9,893,713 | (a) |
Federal Farm Credit Bank (FFCB) (U.S. Federal Funds Intraday Effective Rate + 0.180%) | | | 5.510 | % | | | 12/16/24 | | | | 100,000,000 | | | | 100,039,892 | (a) |
Federal Farm Credit Bank (FFCB) (SOFR + 0.150%) | | | 5.460 | % | | | 1/3/25 | | | | 30,000,000 | | | | 30,000,000 | (a) |
Federal Farm Credit Bank (FFCB) (U.S. Federal Funds Intraday Effective Rate + 0.170%) | | | 5.500 | % | | | 1/6/25 | | | | 75,000,000 | | | | 75,000,000 | (a) |
Federal Farm Credit Bank (FFCB) (SOFR + 0.170%) | | | 5.480 | % | | | 1/23/25 | | | | 41,000,000 | | | | 41,000,000 | (a) |
Federal Farm Credit Bank (FFCB) (SOFR + 0.100%) | | | 5.410 | % | | | 2/3/25 | | | | 149,900,000 | | | | 149,858,422 | (a) |
Federal Farm Credit Bank (FFCB) (Federal Reserve Bank Prime Loan Rate - 3.020%) | | | 5.480 | % | | | 2/10/25 | | | | 100,000,000 | | | | 100,000,000 | (a) |
Federal Farm Credit Bank (FFCB) (Federal Reserve Bank Prime Loan Rate - 2.995%) | | | 5.505 | % | | | 3/20/25 | | | | 50,000,000 | | | | 50,000,000 | (a) |
Federal Farm Credit Bank (FFCB) (SOFR + 0.140%) | | | 5.450 | % | | | 4/25/25 | | | | 115,000,000 | | | | 114,947,525 | (a) |
See Notes to Financial Statements.
| | | | |
| Government Portfolio 2024 Semi-Annual Report | | | | 13 |
Schedule of investments (unaudited) (cont’d)
February 29, 2024
Government Portfolio
(Percentages shown based on Portfolio net assets)
| | | | | | | | | | | | | | | | |
| Security | | Rate | | | Maturity
Date | | | Face
Amount | | | Value | |
| U.S. Government Agencies — continued | | | | | | | | | | | | | | | | |
Federal Farm Credit Bank (FFCB) (SOFR + 0.160%) | | | 5.470 | % | | | 5/15/25 | | | $ | 75,000,000 | | | $ | 75,000,000 | (a) |
Federal Farm Credit Bank (FFCB) (Federal Reserve Bank Prime Loan Rate - 3.040%) | | | 5.460 | % | | | 6/18/25 | | | | 110,000,000 | | | | 109,979,786 | (a) |
Federal Farm Credit Bank (FFCB) (U.S. Federal Funds Intraday Effective Rate + 0.190%) | | | 5.520 | % | | | 6/20/25 | | | | 25,000,000 | | | | 25,000,000 | (a) |
Federal Farm Credit Bank (FFCB) (SOFR + 0.130%) | | | 5.440 | % | | | 8/13/25 | | | | 75,000,000 | | | | 75,000,000 | (a) |
Federal Farm Credit Bank (FFCB) (Federal Reserve Bank Prime Loan Rate - 3.010%) | | | 5.490 | % | | | 9/15/25 | | | | 50,000,000 | | | | 50,000,000 | (a) |
Federal Farm Credit Bank (FFCB) (U.S. Federal Funds Intraday Effective Rate + 0.135%) | | | 5.465 | % | | | 11/10/25 | | | | 75,000,000 | | | | 75,000,000 | (a) |
Federal Farm Credit Bank (FFCB) (SOFR + 0.155%) | | | 5.465 | % | | | 11/28/25 | | | | 30,000,000 | | | | 30,000,000 | (a) |
Federal Farm Credit Bank (FFCB) (SOFR + 0.190%) | | | 5.500 | % | | | 12/1/25 | | | | 25,000,000 | | | | 25,012,604 | (a) |
Federal Farm Credit Bank (FFCB) (SOFR + 0.150%) | | | 5.460 | % | | | 12/15/25 | | | | 115,000,000 | | | | 115,000,000 | (a) |
Federal Farm Credit Bank (FFCB), Discount Notes | | | 5.413 | % | | | 4/1/24 | | | | 35,000,000 | | | | 34,839,058 | (b) |
Federal Farm Credit Bank (FFCB), Discount Notes | | | 5.468 | % | | | 8/22/24 | | | | 80,000,000 | | | | 77,989,334 | (b) |
Federal Home Loan Bank (FHLB) | | | 3.375 | % | | | 3/8/24 | | | | 22,500,000 | | | | 22,491,130 | |
Federal Home Loan Bank (FHLB) | | | 5.320 | % | | | 3/8/24 | | | | 22,720,000 | | | | 22,720,000 | |
Federal Home Loan Bank (FHLB) (SOFR + 0.050%) | | | 5.360 | % | | | 3/28/24 | | | | 90,000,000 | | | | 90,000,000 | (a) |
Federal Home Loan Bank (FHLB) | | | 5.340 | % | | | 4/23/24 | | | | 100,000,000 | | | | 100,000,000 | |
Federal Home Loan Bank (FHLB) (SOFR + 0.000%) | | | 5.310 | % | | | 5/10/24 | | | | 40,000,000 | | | | 40,000,000 | (a) |
Federal Home Loan Bank (FHLB) (SOFR + 0.065%) | | | 5.375 | % | | | 5/10/24 | | | | 110,000,000 | | | | 110,000,000 | (a) |
Federal Home Loan Bank (FHLB) (SOFR + 0.065%) | | | 5.375 | % | | | 5/24/24 | | | | 75,000,000 | | | | 75,000,000 | (a) |
Federal Home Loan Bank (FHLB) (SOFR + 0.120%) | | | 5.430 | % | | | 5/28/24 | | | | 90,000,000 | | | | 90,000,000 | (a) |
Federal Home Loan Bank (FHLB) (SOFR + 0.080%) | | | 5.390 | % | | | 6/6/24 | | | | 175,000,000 | | | | 175,000,000 | (a) |
Federal Home Loan Bank (FHLB) | | | 5.450 | % | | | 6/11/24 | | | | 132,000,000 | | | | 132,000,000 | |
See Notes to Financial Statements.
| | | | |
14 | | | | Government Portfolio 2024 Semi-Annual Report |
Government Portfolio
(Percentages shown based on Portfolio net assets)
| | | | | | | | | | | | | | | | |
| Security | | Rate | | | Maturity
Date | | | Face
Amount | | | Value | |
| U.S. Government Agencies — continued | | | | | | | | | | | | | | | | |
Federal Home Loan Bank (FHLB) (SOFR + 0.060%) | | | 5.370 | % | | | 6/18/24 | | | $ | 140,000,000 | | | $ | 140,000,000 | (a) |
Federal Home Loan Bank (FHLB) | | | 2.750 | % | | | 6/28/24 | | | | 29,560,000 | | | | 29,308,317 | |
Federal Home Loan Bank (FHLB) | | | 5.500 | % | | | 8/26/24 | | | | 78,370,000 | | | | 78,399,099 | |
Federal Home Loan Bank (FHLB) | | | 1.610 | % | | | 9/4/24 | | | | 66,425,000 | | | | 65,147,953 | |
Federal Home Loan Bank (FHLB) | | | 3.250 | % | | | 9/13/24 | | | | 50,000,000 | | | | 49,421,236 | |
Federal Home Loan Bank (FHLB) | | | 3.500 | % | | | 9/13/24 | | | | 36,000,000 | | | | 35,653,185 | |
Federal Home Loan Bank (FHLB) | | | 5.500 | % | | | 10/11/24 | | | | 50,000,000 | | | | 50,019,341 | |
Federal Home Loan Bank (FHLB) | | | 5.620 | % | | | 11/12/24 | | | | 100,000,000 | | | | 100,000,000 | |
Federal Home Loan Bank (FHLB) (SOFR + 0.110%) | | | 5.420 | % | | | 11/21/24 | | | | 147,200,000 | | | | 147,200,000 | (a) |
Federal Home Loan Bank (FHLB) | | | 5.125 | % | | | 12/2/24 | | | | 19,000,000 | | | | 19,023,251 | |
Federal Home Loan Bank (FHLB) | | | 2.750 | % | | | 12/13/24 | | | | 18,755,000 | | | | 18,457,459 | |
Federal Home Loan Bank (FHLB) | | | 1.000 | % | | | 12/20/24 | | | | 47,025,000 | | | | 45,623,038 | |
Federal Home Loan Bank (FHLB) | | | 4.750 | % | | | 12/26/24 | | | | 30,000,000 | | | | 29,982,723 | |
Federal Home Loan Bank (FHLB) (SOFR + 0.130%) | | | 5.440 | % | | | 1/28/25 | | | | 100,000,000 | | | | 100,000,000 | (a) |
Federal Home Loan Bank (FHLB) (SOFR + 0.140%) | | | 5.450 | % | | | 4/21/25 | | | | 75,000,000 | | | | 75,000,000 | (a) |
Federal Home Loan Bank (FHLB) (SOFR + 0.135%) | | | 5.445 | % | | | 5/2/25 | | | | 9,970,000 | | | | 9,973,043 | (a) |
Federal Home Loan Bank (FHLB) (SOFR + 0.150%) | | | 5.460 | % | | | 5/28/25 | | | | 17,780,000 | | | | 17,788,963 | (a) |
Federal Home Loan Bank (FHLB) (SOFR + 0.115%) | | | 5.425 | % | | | 6/16/25 | | | | 50,000,000 | | | | 50,000,000 | (a) |
Federal Home Loan Bank (FHLB) (SOFR + 0.115%) | | | 5.425 | % | | | 7/8/25 | | | | 100,000,000 | | | | 100,000,000 | (a) |
Federal Home Loan Bank (FHLB) (SOFR + 0.155%) | | | 5.465 | % | | | 7/8/25 | | | | 12,050,000 | | | | 12,055,129 | (a) |
Federal Home Loan Bank (FHLB) (SOFR + 0.155%) | | | 5.465 | % | | | 8/21/25 | | | | 18,195,000 | | | | 18,198,608 | (a) |
Federal Home Loan Bank (FHLB) (SOFR + 0.155%) | | | 5.465 | % | | | 8/22/25 | | | | 11,055,000 | | | | 11,057,212 | (a) |
Federal Home Loan Bank (FHLB) (SOFR + 0.130%) | | | 5.440 | % | | | 10/3/25 | | | | 200,000,000 | | | | 200,017,338 | (a) |
Federal Home Loan Bank (FHLB) (SOFR + 0.150%) | | | 5.460 | % | | | 12/11/25 | | | | 75,000,000 | | | | 75,000,000 | (a) |
Federal Home Loan Bank (FHLB) (SOFR + 0.145%) | | | 5.455 | % | | | 1/5/26 | | | | 100,000,000 | | | | 100,000,000 | (a) |
See Notes to Financial Statements.
| | | | |
| Government Portfolio 2024 Semi-Annual Report | | | | 15 |
Schedule of investments (unaudited) (cont’d)
February 29, 2024
Government Portfolio
(Percentages shown based on Portfolio net assets)
| | | | | | | | | | | | | | | | |
| Security | | Rate | | | Maturity
Date | | | Face
Amount | | | Value | |
| U.S. Government Agencies — continued | | | | | | | | | | | | | | | | |
Federal Home Loan Bank (FHLB), Discount Notes | | | 5.426 | % | | | 5/10/24 | | | $ | 67,000,000 | | | $ | 66,316,693 | (b) |
Federal Home Loan Bank (FHLB), Discount Notes | | | 5.415 | % | | | 5/13/24 | | | | 100,000,000 | | | | 98,939,472 | (b) |
Federal Home Loan Bank (FHLB), Discount Notes | | | 5.427 | % | | | 5/15/24 | | | | 75,000,000 | | | | 74,181,406 | (b) |
Federal Home Loan Bank (FHLB), Discount Notes | | | 5.266 | % | | | 7/10/24 | | | | 26,000,000 | | | | 25,523,160 | (b) |
Federal Home Loan Bank (FHLB), Discount Notes | | | 5.210 | % | | | 7/31/24 | | | | 50,000,000 | | | | 48,949,722 | (b) |
Federal Home Loan Bank (FHLB), Discount Notes | | | 4.867 | % | | | 10/31/24 | | | | 95,000,000 | | | | 92,025,233 | (b) |
Federal Home Loan Bank (FHLB), Discount Notes | | | 4.994 | % | | | 11/26/24 | | | | 50,000,000 | | | | 48,228,125 | (b) |
Federal Home Loan Bank (FHLB), Discount Notes | | | 4.929 | % | | | 1/10/25 | | | | 50,000,000 | | | | 47,965,625 | (b) |
Federal Home Loan Bank (FHLB), Discount Notes | | | 5.066 | % | | | 2/3/25 | | | | 50,000,000 | | | | 47,756,479 | (b) |
Federal National Mortgage Association (FNMA) | | | 1.625 | % | | | 1/7/25 | | | | 70,000,000 | | | | 68,094,521 | |
Total U.S. Government Agencies | | | | | | | | | | | | | | | 4,886,631,651 | |
| U.S. Treasury Bills — 12.0% | | | | | | | | | | | | | | | | |
U.S. Cash Management Bill | | | 5.430 | % | | | 4/4/24 | | | | 100,000,000 | | | | 99,495,667 | (b) |
U.S. Treasury Bills | | | 4.414 | % | | | 3/5/24 | | | | 110,000,000 | | | | 109,935,117 | (b) |
U.S. Treasury Bills | | | 5.053 | % | | | 3/12/24 | | | | 100,000,000 | | | | 99,838,514 | (b) |
U.S. Treasury Bills | | | 5.224 | % | | | 3/19/24 | | | | 120,000,000 | | | | 119,683,200 | (b) |
U.S. Treasury Bills | | | 5.274 | % | | | 3/21/24 | | | | 125,000,000 | | | | 124,631,945 | (b) |
U.S. Treasury Bills | | | 5.303 | % | | | 3/26/24 | | | | 190,000,000 | | | | 189,303,889 | (b) |
U.S. Treasury Bills | | | 5.303 | % | | | 3/28/24 | | | | 75,000,000 | | | | 74,704,125 | (b) |
U.S. Treasury Bills | | | 5.340 | % | | | 4/2/24 | | | | 265,000,000 | | | | 263,759,800 | (b)(c) |
U.S. Treasury Bills | | | 5.439 | % | | | 4/11/24 | | | | 200,700,000 | | | | 199,483,981 | (b) |
U.S. Treasury Bills | | | 5.402 | % | | | 4/16/24 | | | | 150,000,000 | | | | 148,989,916 | (b) |
U.S. Treasury Bills | | | 5.360 | % | | | 4/23/24 | | | | 50,000,000 | | | | 49,616,302 | (b) |
U.S. Treasury Bills | | | 5.481 | % | | | 4/25/24 | | | | 90,000,000 | | | | 89,268,194 | (b) |
U.S. Treasury Bills | | | 5.372 | % | | | 4/30/24 | | | | 50,000,000 | | | | 49,565,833 | (b)(c) |
U.S. Treasury Bills | | | 5.376 | % | | | 5/2/24 | | | | 90,000,000 | | | | 89,192,450 | (b) |
U.S. Treasury Bills | | | 5.462 | % | | | 5/16/24 | | | | 75,000,000 | | | | 74,165,583 | (b) |
U.S. Treasury Bills | | | 5.447 | % | | | 5/30/24 | | | | 67,000,000 | | | | 66,122,300 | (b) |
U.S. Treasury Bills | | | 5.355 | % | | | 6/4/24 | | | | 200,000,000 | | | | 197,281,945 | (b) |
U.S. Treasury Bills | | | 5.273 | % | | | 6/27/24 | | | | 250,000,000 | | | | 245,857,971 | (b) |
See Notes to Financial Statements.
| | | | |
16 | | | | Government Portfolio 2024 Semi-Annual Report |
Government Portfolio
(Percentages shown based on Portfolio net assets)
| | | | | | | | | | | | | | | | |
| Security | | Rate | | | Maturity
Date | | | Face
Amount | | | Value | |
| U.S. Treasury Bills — continued | | | | | | | | | | | | | | | | |
U.S. Treasury Bills | | | 5.268 | % | | | 7/5/24 | | | $ | 55,000,000 | | | $ | 54,028,837 | (b) |
U.S. Treasury Bills | | | 5.231 | % | | | 8/1/24 | | | | 84,000,000 | | | | 82,217,040 | (b) |
U.S. Treasury Bills | | | 4.863 | % | | | 1/23/25 | | | | 40,000,000 | | | | 38,328,548 | (b) |
Total U.S. Treasury Bills | | | | | | | | | | | | | | | 2,465,471,157 | |
| U.S. Treasury Notes — 11.6% | | | | | | | | | | | | | | | | |
U.S. Treasury Notes (3 mo. U.S. Treasury Money Market Yield - 0.075%) | | | 5.251 | % | | | 4/30/24 | | | | 100,000,000 | | | | 99,981,189 | (a) |
U.S. Treasury Notes | | | 2.125 | % | | | 7/31/24 | | | | 60,000,000 | | | | 59,238,591 | |
U.S. Treasury Notes | | | 3.000 | % | | | 7/31/24 | | | | 257,500,000 | | | | 254,944,497 | |
U.S. Treasury Notes | | | 0.375 | % | | | 8/15/24 | | | | 200,000,000 | | | | 195,498,634 | |
U.S. Treasury Notes | | | 2.375 | % | | | 8/15/24 | | | | 178,100,000 | | | | 175,719,852 | |
U.S. Treasury Notes | | | 0.625 | % | | | 10/15/24 | | | | 60,000,000 | | | | 58,439,869 | |
U.S. Treasury Notes | | | 4.375 | % | | | 10/31/24 | | | | 40,000,000 | | | | 39,839,839 | |
U.S. Treasury Notes (3 mo. U.S. Treasury Money Market Yield + 0.140%) | | | 5.466 | % | | | 10/31/24 | | | | 444,500,000 | | | | 444,403,377 | (a) |
U.S. Treasury Notes | | | 0.750 | % | | | 11/15/24 | | | | 98,000,000 | | | | 94,990,955 | |
U.S. Treasury Notes | | | 2.250 | % | | | 11/15/24 | | | | 100,000,000 | | | | 98,021,390 | |
U.S. Treasury Notes | | | 1.500 | % | | | 11/30/24 | | | | 50,000,000 | | | | 48,769,440 | |
U.S. Treasury Notes | | | 2.125 | % | | | 11/30/24 | | | | 125,000,000 | | | | 122,337,055 | |
U.S. Treasury Notes | | | 1.000 | % | | | 12/15/24 | | | | 60,000,000 | | | | 58,228,568 | |
U.S. Treasury Notes | | | 4.250 | % | | | 12/31/24 | | | | 75,000,000 | | | | 74,484,833 | |
U.S. Treasury Notes (3 mo. U.S. Treasury Money Market Yield + 0.169%) | | | 5.418 | % | | | 4/30/25 | | | | 350,000,000 | | | | 349,950,708 | (a) |
U.S. Treasury Notes (3 mo. U.S. Treasury Money Market Yield + 0.170%) | | | 5.501 | % | | | 10/31/25 | | | | 75,000,000 | | | | 74,961,450 | (a) |
U.S. Treasury Notes (3 mo. U.S. Treasury Money Market Yield + 0.245%) | | | 5.545 | % | | | 1/31/26 | | | | 120,000,000 | | | | 120,108,268 | (a) |
Total U.S. Treasury Notes | | | | | | | | | | | | | | | 2,369,918,515 | |
| Repurchase Agreements — 49.4% | | | | | | | | | | | | | | | | |
Bank of Montreal tri-party repurchase agreement dated 2/29/24; Proceeds at maturity — $325,047,847; (Fully collateralized by U.S. government obligations, 4.000% to 6.324% due 4/20/40 to 12/20/52; Market value — $341,250,000) | | | 5.300 | % | | | 3/1/24 | | | | 325,000,000 | | | | 325,000,000 | |
See Notes to Financial Statements.
| | | | |
| Government Portfolio 2024 Semi-Annual Report | | | | 17 |
Schedule of investments (unaudited) (cont’d)
February 29, 2024
Government Portfolio
(Percentages shown based on Portfolio net assets)
| | | | | | | | | | | | | | | | |
| Security | | Rate | | | Maturity
Date | | | Face
Amount | | | Value | |
| Repurchase Agreements — continued | | | | | | | | | | | | | | | | |
BMO Capital Markets Corp. tri-party repurchase agreement dated 2/1/24; Proceeds at maturity — $201,780,000; (Fully collateralized by U.S. government obligations, 1.450% to 10.943% due 10/25/24 to 4/20/72; Market value — $209,284,297) | | | 5.340 | % | | | 4/1/24 | | | $ | 200,000,000 | | | $ | 200,000,000 | |
BNP Paribas SA tri-party repurchase agreement dated 2/29/24; Proceeds at maturity — $100,014,750; (Fully collateralized by U.S. government obligations, 0.000% to 7.500% due 1/31/25 to 2/20/54; Market value — $102,020,465) | | | 5.310 | % | | | 3/1/24 | | | | 100,000,000 | | | | 100,000,000 | |
BofA Securities Inc. tri-party repurchase agreement dated 1/2/24; Proceeds at maturity — $101,347,306; (Fully collateralized by U.S. government obligations, 2.000% to 8.000% due 6/1/26 to 2/1/54; Market value — $102,000,000) | | | 5.330 | % | | | 4/2/24 | | | | 100,000,000 | | | | 100,000,000 | |
BofA Securities Inc. tri-party repurchase agreement dated 1/2/24; Proceeds at maturity — $101,354,889; (Fully collateralized by U.S. government obligations, 1.000% to 8.500% due 3/20/25 to 9/20/64; Market value — $102,000,000) | | | 5.360 | % | | | 4/2/24 | | | | 100,000,000 | | | | 100,000,000 | |
BofA Securities Inc. tri-party repurchase agreement dated 2/29/24; Proceeds at maturity — $150,022,125; (Fully collateralized by U.S. government obligations, 1.500% to 7.000% due 5/1/30 to 2/20/69; Market value — $153,000,000) | | | 5.310 | % | | | 3/1/24 | | | | 150,000,000 | | | | 150,000,000 | |
Canadian Imperial Bank of Commerce tri-party repurchase agreement dated 2/29/24; Proceeds at maturity — $25,003,674; (Fully collateralized by U.S. government obligations, 0.250% to 3.750% due 12/31/25 to 2/15/50; Market value — $25,503,786) | | | 5.290 | % | | | 3/1/24 | | | | 25,000,000 | | | | 25,000,000 | |
See Notes to Financial Statements.
| | | | |
18 | | | | Government Portfolio 2024 Semi-Annual Report |
Government Portfolio
(Percentages shown based on Portfolio net assets)
| | | | | | | | | | | | | | | | |
| Security | | Rate | | | Maturity
Date | | | Face Amount | | | Value | |
| Repurchase Agreements — continued | | | | | | | | | | | | | | | | |
Canadian Imperial Bank of Commerce tri-party repurchase agreement dated 2/29/24; Proceeds at maturity — $150,022,125; (Fully collateralized by U.S. government obligations, 2.000% to 6.500% due 5/1/28 to 2/1/54; Market value — $153,022,609) | | | 5.310 | % | | | 3/1/24 | | | $ | 150,000,000 | | | $ | 150,000,000 | |
Credit Agricole SA tri-party repurchase agreement dated 2/29/24; Proceeds at maturity — $200,029,444; (Fully collateralized by U.S. government obligations, 2.000% to 4.000% due 11/1/48 to 5/1/52; Market value — $204,000,000) | | | 5.300 | % | | | 3/1/24 | | | | 200,000,000 | | | | 200,000,000 | |
Federal Reserve Bank of New York tri-party repurchase agreement dated 2/29/24; Proceeds at maturity — $1,735,255,431; (Fully collateralized by U.S. government obligations, 0.875% to 2.375% due 8/15/27 to 2/15/32; Market value — $1,735,255,464) | | | 5.300 | % | | | 3/1/24 | | | | 1,735,000,000 | | | | 1,735,000,000 | |
Fixed Income Clearing Corp. tri-party repurchase agreement dated 2/29/24; Proceeds at maturity — $350,051,528; (Fully collateralized by U.S. government obligations, 0.125% to 4.250% due 10/15/25 to 5/15/48; Market value — $357,000,011) | | | 5.300 | % | | | 3/1/24 | | | | 350,000,000 | | | | 350,000,000 | |
Fixed Income Clearing Corp. tri-party repurchase agreement dated 2/29/24; Proceeds at maturity — $498,671,543; (Fully collateralized by U.S. government obligations, 2.000% to 3.500% due 8/15/25 to 9/15/25; Market value — $508,569,998) | | | 5.310 | % | | | 3/1/24 | | | | 498,598,000 | | | | 498,598,000 | |
Fixed Income Clearing Corp. tri-party repurchase agreement dated 2/29/24; Proceeds at maturity — $950,140,125; (Fully collateralized by U.S. government obligations, 0.000% to 2.250% due 5/9/24 to 11/15/25; Market value — $969,000,000) | | | 5.310 | % | | | 3/1/24 | | | | 950,000,000 | | | | 950,000,000 | |
See Notes to Financial Statements.
| | | | |
| Government Portfolio 2024 Semi-Annual Report | | | | 19 |
Schedule of investments (unaudited) (cont’d)
February 29, 2024
Government Portfolio
(Percentages shown based on Portfolio net assets)
| | | | | | | | | | | | | | | | |
| Security | | Rate | | | Maturity
Date | | | Face
Amount | | | Value | |
| Repurchase Agreements — continued | | | | | | | | | | | | | | | | |
ING Financial Markets LLC tri-party repurchase agreement dated 1/12/24; Proceeds at maturity — $101,191,111; (Fully collateralized by U.S. government obligations, 1.500% to 6.500% due 7/1/33 to 1/1/54; Market value — $102,000,000) | | | 5.360 | % | | | 4/1/24 | | | $ | 100,000,000 | | | $ | 100,000,000 | |
ING Financial Markets LLC tri-party repurchase agreement dated 2/1/24; Proceeds at maturity — $100,728,194; (Fully collateralized by U.S. government obligations, 2.000% to 8.000% due 2/1/32 to 2/1/54; Market value — $102,000,000) | | | 5.350 | % | | | 3/21/24 | | | | 100,000,000 | | | | 100,000,000 | |
ING Financial Markets LLC tri-party repurchase agreement dated 2/1/24; Proceeds at maturity — $201,456,389; (Fully collateralized by U.S. government obligations, 1.500% to 6.500% due 7/1/33 to 1/1/57; Market value — $204,000,001) | | | 5.350 | % | | | 3/21/24 | | | | 200,000,000 | | | | 200,000,000 | |
ING Financial Markets LLC tri-party repurchase agreement dated 2/29/24; Proceeds at maturity — $245,036,069; (Fully collateralized by U.S. government obligations, 0.000% to 4.875% due 3/15/24 to 2/15/49; Market value — $249,900,004) | | | 5.300 | % | | | 3/1/24 | | | | 245,000,000 | | | | 245,000,000 | |
ING Financial Markets LLC tri-party repurchase agreement dated 2/29/24; Proceeds at maturity — $38,005,594; (Fully collateralized by U.S. government obligations, 2.750% to 4.750% due 5/15/25 to 8/15/53; Market value — $38,760,019) | | | 5.300 | % | | | 3/1/24 | | | | 38,000,000 | | | | 38,000,000 | |
ING Financial Markets LLC tri-party repurchase agreement dated 2/29/24; Proceeds at maturity — $307,045,283; (Fully collateralized by U.S. government obligations, 1.500% to 7.000% due 6/1/33 to 1/1/57; Market value — $313,140,000) | | | 5.310 | % | | | 3/1/24 | | | | 307,000,000 | | | | 307,000,000 | |
ING Financial Markets LLC tri-party repurchase agreement dated 2/29/24; Proceeds at maturity — $300,044,250; (Fully collateralized by U.S. government obligations, 1.500% to 6.500% due 12/1/26 to 1/1/54; Market value — $306,000,001) | | | 5.310 | % | | | 3/1/24 | | | | 300,000,000 | | | | 300,000,000 | |
See Notes to Financial Statements.
| | | | |
20 | | | | Government Portfolio 2024 Semi-Annual Report |
Government Portfolio
(Percentages shown based on Portfolio net assets)
| | | | | | | | | | | | | | | | |
| Security | | Rate | | | Maturity
Date | | | Face
Amount | | | Value | |
| Repurchase Agreements — continued | | | | | | | | | | | | | | | | |
ING Financial Markets LLC tri-party repurchase agreement dated 2/29/24; Proceeds at maturity — $200,206,889; (Fully collateralized by U.S. government obligations, 1.500% to 6.500% due 7/1/33 to 1/1/54; Market value — $204,000,001) | | | 5.320 | % | | | 3/7/24 | | | $ | 200,000,000 | | | $ | 200,000,000 | |
JPMorgan Securities LLC tri-party repurchase agreement dated 2/29/24; Proceeds at maturity — $225,033,125; (Fully collateralized by U.S. government obligations, 4.125% to 4.625% due 10/15/26 to 7/31/28; Market value — $229,533,843) | | | 5.300 | % | | | 3/1/24 | | | | 225,000,000 | | | | 225,000,000 | |
JPMorgan Securities LLC tri-party repurchase agreement dated 2/29/24; Proceeds at maturity — $700,103,250; (Fully collateralized by U.S. government obligations, 1.500% to 7.500% due 5/1/30 to 2/1/54; Market value — $714,105,315) | | | 5.310 | % | | | 3/1/24 | | | | 700,000,000 | | | | 700,000,000 | |
JPMorgan Securities LLC tri-party repurchase agreement dated 2/29/24; Proceeds at maturity — $300,044,333; (Fully collateralized by U.S. government obligations, 1.754% to 7.425% due 11/1/24 to 9/1/52; Market value — $306,045,220) | | | 5.320 | % | | | 3/1/24 | | | | 300,000,000 | | | | 300,000,000 | |
MUFG Securities Americas Inc. tri-party repurchase agreement dated 2/29/24; Proceeds at maturity — $350,051,625; (Fully collateralized by U.S. government obligations, 2.750% to 4.625% due 2/28/26 to 5/31/29; Market value — $357,000,055) | | | 5.310 | % | | | 3/1/24 | | | | 350,000,000 | | | | 350,000,000 | |
Nomura Securities International Inc. tri-party repurchase agreement dated 2/29/24; Proceeds at maturity — $400,059,000; (Fully collateralized by U.S. government obligations, 1.500% to 7.000% due 1/15/28 to 5/15/65; Market value — $408,060,307) | | | 5.310 | % | | | 3/1/24 | | | | 400,000,000 | | | | 400,000,000 | |
See Notes to Financial Statements.
| | | | |
| Government Portfolio 2024 Semi-Annual Report | | | | 21 |
Schedule of investments (unaudited) (cont’d)
February 29, 2024
Government Portfolio
(Percentages shown based on Portfolio net assets)
| | | | | | | | | | | | | | | | |
| Security | | Rate | | | Maturity
Date | | | Face
Amount | | | Value | |
| Repurchase Agreements — continued | | | | | | | | | | | | | | | | |
Societe Generale NY tri-party repurchase agreement dated 2/29/24; Proceeds at maturity — $700,103,250; (Fully collateralized by U.S. government obligations, 2.000% to 5.500% due 12/20/44 to 8/20/52; Market value — $714,000,000) | | | 5.310 | % | | | 3/1/24 | | | $ | 700,000,000 | | | $ | 700,000,000 | |
TD Securities LLC tri-party repurchase agreement dated 2/29/24; Proceeds at maturity — $135,422,934; (Fully collateralized by U.S. government obligations, 2.500% to 4.500% due 7/1/50 to 10/1/52; Market value — $138,111,060) | | | 5.300 | % | | | 3/1/24 | | | | 135,403,000 | | | | 135,403,000 | |
TD Securities LLC tri-party repurchase agreement dated 2/29/24; Proceeds at maturity — $100,014,750; (Fully collateralized by U.S. government obligations, 3.500% to 8.000% due 1/20/43 to 1/20/54; Market value — $102,000,000) | | | 5.310 | % | | | 3/1/24 | | | | 100,000,000 | | | | 100,000,000 | |
Wells Fargo Securities LLC tri-party repurchase agreement dated 2/29/24; Proceeds at maturity — $850,125,375; (Fully collateralized by U.S. government obligations, 1.500% to 7.500% due 7/1/24 to 3/1/54; Market value — $867,000,000) | | | 5.310 | % | | | 3/1/24 | | | | 850,000,000 | | | | 850,000,000 | |
Total Repurchase Agreements | | | | | | | | | | | | | | | 10,134,001,000 | |
Total Investments — 96.8% (Cost — $19,856,022,323#) | | | | | | | | 19,856,022,323 | |
Other Assets in Excess of Liabilities — 3.2% | | | | | | | | | | | | | | | 654,468,014 | |
Total Net Assets — 100.0% | | | | | | | | | | | | | | $ | 20,510,490,337 | |
| # | Aggregate cost for federal income tax purposes is substantially the same. |
| (a) | Variable rate security. Interest rate disclosed is as of the most recent information available. Certain variable rate securities are not based on a published reference rate and spread but are determined by the issuer or agent and are based on current market conditions. These securities do not indicate a reference rate and spread in their description above. |
| (b) | Rate shown represents yield-to-maturity. |
| (c) | Securities traded on a when-issued or delayed delivery basis. |
| | |
Abbreviation(s) used in this schedule: |
| |
| SOFR | | — Secured Overnight Financing Rate |
See Notes to Financial Statements.
| | | | |
22 | | | | Government Portfolio 2024 Semi-Annual Report |
Statement of assets and liabilities (unaudited)
February 29, 2024
| | | | |
| |
| Assets: | | | | |
Investments, at value | | $ | 9,722,021,323 | |
Repurchase agreements, at value | | | 10,134,001,000 | |
Cash | | | 605,159,645 | |
Interest receivable | | | 49,651,518 | |
Total Assets | | | 20,510,833,486 | |
| |
| Liabilities: | | | | |
Fund accounting fees payable | | | 132,830 | |
Trustees’ fees payable | | | 84,174 | |
Legal fees payable | | | 50,767 | |
Custody fees payable | | | 40,462 | |
Accrued expenses | | | 34,916 | |
Total Liabilities | | | 343,149 | |
| Total Net Assets | | $ | 20,510,490,337 | |
| |
| Represented by: | | | | |
| Paid-in capital | | $ | 20,510,490,337 | |
See Notes to Financial Statements.
| | | | |
| Government Portfolio 2024 Semi-Annual Report | | | | 23 |
Statement of operations (unaudited)
For the Six Months Ended February 29, 2024
| | | | |
| |
| Investment Income: | | | | |
Interest | | $ | 548,455,048 | |
| |
| Expenses: | | | | |
Investment management fee (Note 2) | | | 10,142,790 | |
Trustees’ fees | | | 248,792 | |
Fund accounting fees | | | 146,482 | |
Legal fees | | | 110,033 | |
Interest expense | | | 69,430 | |
Custody fees | | | 33,667 | |
Audit and tax fees | | | 16,163 | |
Miscellaneous expenses | | | 48,671 | |
Total Expenses | | | 10,816,028 | |
Less: Fee waivers and/or expense reimbursements (Note 2) | | | (10,142,790) | |
Net Expenses | | | 673,238 | |
| Net Investment Income | | | 547,781,810 | |
| Net Realized Gain on Investments | | | 244,498 | |
| Increase in Net Assets From Operations | | $ | 548,026,308 | |
See Notes to Financial Statements.
| | | | |
| 24 | | | | Government Portfolio 2024 Semi-Annual Report |
Statements of changes in net assets
| | | | | | | | |
For the Six Months Ended February 29, 2024 (unaudited) and the Year Ended August 31, 2023 | | 2024 | | | 2023 | |
| | |
| Operations: | | | | | | | | |
Net investment income | | $ | 547,781,810 | | | $ | 1,013,484,631 | |
Net realized gain | | | 244,498 | | | | 829,465 | |
Increase in Net Assets From Operations | | | 548,026,308 | | | | 1,014,314,096 | |
| | |
| Capital Transactions: | | | | | | | | |
Proceeds from contributions | | | 90,860,082,349 | | | | 279,878,198,410 | |
Value of withdrawals | | | (91,282,047,657) | | | | (274,304,821,771) | |
Increase (Decrease) in Net Assets From Capital Transactions | | | (421,965,308) | | | | 5,573,376,639 | |
Increase in Net Assets | | | 126,061,000 | | | | 6,587,690,735 | |
| | |
| Net Assets: | | | | | | | | |
Beginning of period | | | 20,384,429,337 | | | | 13,796,738,602 | |
End of period | | $ | 20,510,490,337 | | | $ | 20,384,429,337 | |
See Notes to Financial Statements.
| | | | |
| Government Portfolio 2024 Semi-Annual Report | | | | 25 |
Financial highlights
| | | | | | | | | | | | | | | | | | | | | | | | |
| For the years ended August 31, unless otherwise noted: | |
| | | 20241 | | | 2023 | | | 2022 | | | 2021 | | | 2020 | | | 2019 | |
| | | | | | | |
| Net assets, end of period (millions) | | | $20,510 | | | | $20,384 | | | | $13,797 | | | | $18,484 | | | | $19,125 | | | | $12,505 | |
Total return2 | | | 2.73 | % | | | 4.52 | % | | | 0.55 | % | | | 0.10 | % | | | 1.08 | % | | | 2.35 | % |
| | | | | | |
| Ratios to average net assets: | | | | | | | | | | | | | | | | | | | | | | | | |
Gross expenses | | | 0.11 | %3 | | | 0.11 | % | | | 0.11 | % | | | 0.11 | % | | | 0.11 | % | | | 0.11 | % |
Net expenses4,5 | | | 0.01 | 3 | | | 0.01 | | | | 0.01 | | | | 0.01 | | | | 0.01 | | | | 0.01 | |
Net investment income | | | 5.40 | 3 | | | 4.51 | | | | 0.49 | | | | 0.10 | | | | 0.95 | | | | 2.32 | |
| 1 | For the six months ended February 29, 2024 (unaudited). |
| 2 | Performance figures may reflect compensating balance arrangements, fee waivers and/or expense reimbursements. In the absence of compensating balance arrangements, fee waivers and/or expense reimbursements, the total return would have been lower. Past performance is no guarantee of future results. Total returns for periods of less than one year are not annualized. |
| 4 | The investment manager, pursuant to the terms of the feeder fund’s investment management agreement, has agreed to waive 0.10% of Portfolio expenses, attributable to the Portfolio’s investment management fee. Additional amounts may be voluntarily waived and/or reimbursed from time to time. |
| 5 | Reflects fee waivers and/or expense reimbursements. |
See Notes to Financial Statements.
| | | | |
| 26 | | | | Government Portfolio 2024 Semi-Annual Report |
Notes to financial statements (unaudited)
1. Organization and significant accounting policies
Government Portfolio (the “Portfolio”) is a separate diversified investment series of Master Portfolio Trust (the “Trust”). The Trust, a Maryland statutory trust, is registered under the Investment Company Act of 1940, as amended (the “1940 Act”), as an open-end management investment company. The Declaration of Trust permits the Trustees to issue beneficial interests in the Portfolio. At February 29, 2024, all investors in the Portfolio were funds advised or administered by the investment manager of the Portfolio and/or its affiliates.
The Portfolio follows the accounting and reporting guidance in Financial Accounting Standards Board (“FASB”) Accounting Standards Codification Topic 946, Financial Services – Investment Companies (“ASC 946”). The following are significant accounting policies consistently followed by the Portfolio and are in conformity with U.S. generally accepted accounting principles (“GAAP”), including, but not limited to, ASC 946. Estimates and assumptions are required to be made regarding assets, liabilities and changes in net assets resulting from operations when financial statements are prepared. Changes in the economic environment, financial markets and any other parameters used in determining these estimates could cause actual results to differ. Subsequent events have been evaluated through the date the financial statements were issued.
(a) Investment valuation. In accordance with Rule 2a-7 under the 1940 Act, money market instruments are valued at amortized cost, which approximates market value. This method involves valuing portfolio securities at their cost and thereafter assuming a constant amortization to maturity of any discount or premium. The Portfolio’s use of amortized cost is subject to its compliance with certain conditions as specified by Rule 2a-7 under the 1940 Act.
Pursuant to policies adopted by the Board of Trustees, the Portfolio’s manager has been designated as the valuation designee and is responsible for the oversight of the daily valuation process. The Portfolio’s manager is assisted by the Global Fund Valuation Committee (the “Valuation Committee”). The Valuation Committee is responsible for making fair value determinations, evaluating the effectiveness of the Portfolio’s pricing policies, and reporting to the Board of Trustees.
The Portfolio uses valuation techniques to measure fair value that are consistent with the market approach and/or income approach, depending on the type of security and the particular circumstance. The market approach uses prices and other relevant information generated by market transactions involving identical or comparable securities. The income approach uses valuation techniques to discount estimated future cash flows to present value.
| | | | |
| Government Portfolio 2024 Semi-Annual Report | | | | 27 |
Notes to financial statements (unaudited) (cont’d)
GAAP establishes a disclosure hierarchy that categorizes the inputs to valuation techniques used to value assets and liabilities at measurement date. These inputs are summarized in the three broad levels listed below:
| • | | Level 1 — unadjusted quoted prices in active markets for identical investments |
| • | | Level 2 — other significant observable inputs (including quoted prices for similar investments, interest rates, prepayment speeds, credit risk, etc.) |
| • | | Level 3 — significant unobservable inputs (including the Portfolio’s own assumptions in determining the fair value of investments) |
The inputs or methodologies used to value securities are not necessarily an indication of the risk associated with investing in those securities.
The following is a summary of the inputs used in valuing the Portfolio’s assets carried at fair value:
| | | | | | | | |
| ASSETS |
| Description | | Quoted Prices
(Level 1) | | Other Significant
Observable Inputs
(Level 2) | | Significant
Unobservable
Inputs
(Level 3) | | Total |
| Short-Term Investments† | | — | | $19,856,022,323 | | — | | $19,856,022,323 |
| † | See Schedule of Investments for additional detailed categorizations. |
(b) Repurchase agreements. The Portfolio may enter into repurchase agreements with institutions that its subadviser has determined are creditworthy. Each repurchase agreement is recorded at cost. Under the terms of a typical repurchase agreement, the Portfolio acquires a debt security subject to an obligation of the seller to repurchase, and of the Portfolio to resell, the security at an agreed-upon price and time, thereby determining the yield during the Portfolio’s holding period. When entering into repurchase agreements, it is the Portfolio’s policy that its custodian or a third party custodian, acting on the Portfolio’s behalf, take possession of the underlying collateral securities, the market value of which, at all times, at least equals the principal amount of the repurchase transaction, including accrued interest. To the extent that any repurchase transaction maturity exceeds one business day, the value of the collateral is marked-to-market and measured against the value of the agreement in an effort to ensure the adequacy of the collateral. If the counterparty defaults, the Portfolio generally has the right to use the collateral to satisfy the terms of the repurchase transaction. However, if the market value of the collateral declines during the period in which the Portfolio seeks to assert its rights or if bankruptcy proceedings are commenced with respect to the seller of the security, realization of the collateral by the Portfolio may be delayed or limited.
(c) Securities traded on a when-issued and delayed delivery basis. The Portfolio may trade securities on a when-issued or delayed delivery basis. In when-issued and
| | | | |
| 28 | | | | Government Portfolio 2024 Semi-Annual Report |
delayed delivery transactions, the securities are purchased or sold by the Portfolio with payment and delivery taking place in the future in order to secure what is considered to be an advantageous price and yield to the Portfolio at the time of entering into the transaction.
Purchasing such securities involves risk of loss if the value of the securities declines prior to settlement. These securities are subject to market fluctuations and their current value is determined in the same manner as for other securities.
(d) Interest income and expenses. Interest income (including interest income from payment-in-kind securities) consists of interest accrued and discount earned (including both original issue and market discount adjusted for amortization of premium) on the investments of the Portfolio. Expenses of the Portfolio are accrued daily. The Portfolio bears all costs of its operations other than expenses specifically assumed by the investment manager.
(e) Method of allocation. Net investment income of the Portfolio is allocated pro rata, based on respective ownership interests, among the Fund and other investors in the Portfolio (the “Holders”) at the time of such determination. Gross realized gains and/or losses of the Portfolio are allocated to the Holders in a manner such that the net asset values per share of each Holder, after each such allocation, is closer to the total of all Holders’ net asset values divided by the aggregate number of shares outstanding for all Holders.
(f) Compensating balance arrangements. The Portfolio has an arrangement with its custodian bank whereby a portion of the custodian’s fees is paid indirectly by credits earned on the Portfolio’s cash on deposit with the bank.
(g) Income taxes. The Portfolio is classified as a partnership for federal income tax purposes. As such, each investor in the Portfolio is treated as owner of its proportionate share of the net assets, income, expenses and realized and unrealized gains and losses of the Portfolio. Therefore, no federal income tax provision is required. It is intended that the Portfolio’s assets will be managed so an investor in the Portfolio can satisfy the requirements of Subchapter M of the Internal Revenue Code.
Management has analyzed the Portfolio’s tax positions taken on income tax returns for all open tax years and has concluded that as of August 31, 2023, no provision for income tax is required in the Portfolio’s financial statements. The Portfolio’s federal and state income tax returns for tax years for which the applicable statutes of limitations have not expired are subject to examination by the Internal Revenue Service and state departments of revenue.
(h) Other. Purchases, maturities and sales of money market instruments are accounted for on the date of the transaction. Realized gains and losses are calculated on the identified cost basis.
| | | | |
| Government Portfolio 2024 Semi-Annual Report | | | | 29 |
Notes to financial statements (unaudited) (cont’d)
2. Investment management agreement and other transactions with affiliates
Franklin Templeton Fund Adviser, LLC (“FTFA”) (formerly known as Legg Mason Partners Fund Advisor, LLC prior to November 30, 2023) is the Portfolio’s investment manager and Western Asset Management Company, LLC (“Western Asset”) is the Portfolio’s subadviser. FTFA and Western Asset are indirect, wholly-owned subsidiaries of Franklin Resources, Inc. (“Franklin Resources”).
Under the investment management agreement, the Portfolio pays an investment management fee, calculated daily and paid monthly, at an annual rate of 0.10% of the Portfolio’s average daily net assets.
FTFA provides administrative and certain oversight services to the Portfolio. FTFA delegates to the subadviser the day-to-day portfolio management of the Portfolio. For its services, FTFA pays Western Asset monthly 70% of the net management fee it receives from the Portfolio.
As a result of the investment management agreement between FTFA and the feeder fund, FTFA has agreed to waive 0.10% of Portfolio expenses, attributable to the Portfolio’s investment management fee. Additional amounts may be voluntarily waived and/or reimbursed from time to time.
During the six months ended February 29, 2024, fees waived and/or expenses reimbursed amounted to $10,142,790.
FTFA is permitted to recapture amounts waived and/or reimbursed to the Portfolio during the same fiscal year under certain circumstances.
All officers and one Trustee of the Trust are employees of Franklin Resources or its affiliates and do not receive compensation from the Trust.
3. Derivative instruments and hedging activities
During the six months ended February 29, 2024, the Portfolio did not invest in derivative instruments.
| | | | |
30 | | | | Government Portfolio 2024 Semi-Annual Report |
Western Asset
Premier Institutional Government Reserves
Trustees
Robert Abeles, Jr.
Jane F. Dasher
Anita L. DeFrantz
Susan B. Kerley
Michael Larson
Ronald L. Olson
Avedick B. Poladian
William E.B. Siart
Chairman
Jaynie M. Studenmund
Peter J. Taylor
Jane Trust
Investment manager
Franklin Templeton Fund Adviser, LLC*
Subadviser
Western Asset Management Company, LLC
Distributor
Franklin Distributors, LLC
Custodian
The Bank of New York Mellon
Transfer agent
BNY Mellon Investment
Servicing (US) Inc.
500 Ross Street, 154-0520
Pittsburgh, PA 15262
Independent registered public accounting firm
PricewaterhouseCoopers LLP
Baltimore, MD
| * | Formerly known as Legg Mason Partners Fund Advisor, LLC. |
Western Asset Premier Institutional Government Reserves
The Fund is a separate investment series of Legg Mason Partners Institutional Trust, a Maryland statutory trust.
Western Asset Premier Institutional Government Reserves
Legg Mason Funds
620 Eighth Avenue, 47th Floor
New York, NY 10018
The Fund files its complete schedule of portfolio holdings with the Securities and Exchange Commission (“SEC”) each month on Form N-MFP. The Fund’s reports on Form N-MFP are available on the SEC’s website at www.sec.gov. The Fund makes portfolio holdings available to shareholders on its website at www.franklintempleton.com.
Information on how the Fund voted proxies relating to portfolio securities during the prior 12-month period ended June 30th of each year and a description of the policies and procedures that the Fund uses to determine how to vote proxies related to portfolio transactions are available (1) without charge, upon request, by calling the Fund at 1-877-721-1926 or 1-203-703-6002, (2) at www.franklintempleton.com and (3) on the SEC’s website at www.sec.gov.
This report is submitted for the general information of the shareholders of Western Asset Premier Institutional Government Reserves. This report is not authorized for distribution to prospective investors in the Fund unless preceded or accompanied by a current prospectus.
Investors should consider the Fund’s investment objectives, risks, charges and expenses carefully before investing. The prospectus contains this and other important information about the Fund. Please read the prospectus carefully before investing.
www.franklintempleton.com
© 2024 Franklin Distributors, LLC, Member FINRA/SIPC. All rights reserved.
Franklin Templeton Funds Privacy and Security Notice
Your Privacy and the Security of Your Personal Information is Very Important to US
This Privacy and Security Notice (the “Privacy Notice”) addresses the Funds’ privacy and data protection practices with respect to nonpublic personal information the Fund receives. The Legg Mason Funds include the Western Asset Money Market Funds (Funds) sold by the Funds’ distributor, Franklin Distributors, LLC, as well as Legg Mason-sponsored closed-end funds. The provisions of this Privacy Notice apply to your information both while you are a shareholder and after you are no longer invested with the Funds.
The Type of Nonpublic Personal Information the Funds Collect About You
The Funds collect and maintain nonpublic personal information about you in connection with your shareholder account. Such information may include, but is not limited to:
| • | | Personal information included on applications or other forms; |
| • | | Account balances, transactions, and mutual fund holdings and positions; |
| • | | Bank account information, legal documents, and identity verification documentation; and |
| • | | Online account access user IDs, passwords, security challenge question responses. |
How the Funds Use Nonpublic Personal Information About You
The Funds do not sell or share your nonpublic personal information with third parties or with affiliates for their marketing purposes, unless you have authorized the Funds to do so. The Funds do not disclose any nonpublic personal information about you except as may be required to perform transactions or services you have authorized or as permitted or required by law. The Funds may disclose information about you to:
| • | | Employees, agents, and affiliates on a “need to know” basis to enable the Funds to conduct ordinary business or to comply with obligations to government regulators; |
| • | | Service providers, including the Funds’ affiliates, who assist the Funds as part of the ordinary course of business (such as printing, mailing services, or processing or servicing your account with us) or otherwise perform services on the Funds’ behalf, including companies that may perform statistical analysis, market research and marketing services solely for the Funds; |
| • | | Permit access to transfer, whether in the United States or countries outside of the United States to such Funds’ employees, agents and affiliates and service providers as required to enable the Funds to conduct ordinary business, or to comply with obligations to government regulators; |
| • | | The Funds’ representatives such as legal counsel, accountants and auditors to enable the Funds to conduct ordinary business, or to comply with obligations to government regulators; |
| • | | Fiduciaries or representatives acting on your behalf, such as an IRA custodian or trustee of a grantor trust. |
|
| NOT PART OF THE SEMI-ANNUAL REPORT |
Franklin Templeton Funds Privacy and Security Notice (cont’d)
Except as otherwise permitted by applicable law, companies acting on the Funds’ behalf, including those outside the United States, are contractually obligated to keep nonpublic personal information the Funds provide to them confidential and to use the information the Funds share only to provide the services the Funds ask them to perform.
The Funds may disclose nonpublic personal information about you when necessary to enforce their rights or protect against fraud, or as permitted or required by applicable law, such as in connection with a law enforcement or regulatory request, subpoena, or similar legal process. In the event of a corporate action or in the event a Fund service provider changes, the Funds may be required to disclose your nonpublic personal information to third parties. While it is the Funds’ practice to obtain protections for disclosed information in these types of transactions, the Funds cannot guarantee their privacy policy will remain unchanged.
Keeping You Informed of the Funds’ Privacy and Security Practices
The Funds will notify you annually of their privacy policy as required by federal law. While the Funds reserve the right to modify this policy at any time, they will notify you promptly if this privacy policy changes.
The Funds’ Security Practices
The Funds maintain appropriate physical, electronic and procedural safeguards designed to guard your nonpublic personal information. The Funds’ internal data security policies restrict access to your nonpublic personal information to authorized employees, who may use your nonpublic personal information for Fund business purposes only.
Although the Funds strive to protect your nonpublic personal information, they cannot ensure or warrant the security of any information you provide or transmit to them, and you do so at your own risk. In the event of a breach of the confidentiality or security of your nonpublic personal information, the Funds will attempt to notify you as necessary so you can take appropriate protective steps. If you have consented to the Funds using electronic communications or electronic delivery of statements, they may notify you under such circumstances using the most current email address you have on record with them.
In order for the Funds to provide effective service to you, keeping your account information accurate is very important. If you believe that your account information is incomplete, not accurate or not current, if you have questions about the Funds’ privacy practices, or our use of your nonpublic personal information, write the Funds using the contact information on your account statements, email the Funds by clicking on the Contact Us section of the Funds’ website at www.franklintempleton.com, or contact the Funds at 1-877-721-1926 for the Western Asset Money Market Funds or 1-888-777-0102 for the Legg Mason-sponsored closed-end funds. For additional information related to certain state privacy rights, please visit https:// www.franklintempleton.com/help/privacy-policy.
Revised December 2023.
|
| NOT PART OF THE SEMI-ANNUAL REPORT |
www.franklintempleton.com
© 2024 Franklin Distributors, LLC, Member FINRA/SIPC. All rights reserved.
WASX581631 4/24 SR24-4854
Not applicable.
| ITEM 3. | AUDIT COMMITTEE FINANCIAL EXPERT. |
Not applicable.
| ITEM 4. | PRINCIPAL ACCOUNTANT FEES AND SERVICES. |
Not applicable.
| ITEM 5. | AUDIT COMMITTEE OF LISTED REGISTRANTS. |
Not applicable.
| ITEM 6. | SCHEDULE OF INVESTMENTS. |
Included herein under Item 1.
| ITEM 7. | DISCLOSURE OF PROXY VOTING POLICIES AND PROCEDURES FOR CLOSED-END MANAGEMENT INVESTMENT COMPANIES. |
Not applicable.
| ITEM 8. | PORTFOLIO MANAGERS OF CLOSED-END MANAGEMENT INVESTMENT COMPANIES. |
Not applicable.
| ITEM 9. | PURCHASES OF EQUITY SECURITIES BY CLOSED-END MANAGEMENT INVESTMENT COMPANY AND AFFILIATED PURCHASERS. |
Not applicable.
| ITEM 10. | SUBMISSION OF MATTERS TO A VOTE OF SECURITY HOLDERS. |
Not applicable.
| ITEM 11. | CONTROLS AND PROCEDURES. |
| | (a) | The registrant’s principal executive officer and principal financial officer have concluded that the registrant’s disclosure controls and procedures (as defined in Rule 30a- 3(c) under the Investment Company Act of 1940, as amended (the “1940 Act”)) are effective as of a date within 90 days of the filing date of this report that includes the disclosure required by this paragraph, based on their evaluation of the disclosure controls and procedures required by Rule 30a-3(b) under the 1940 Act and 15d-15(b) under the Securities Exchange Act of 1934. |
| | (b) | There were no changes in the registrant’s internal control over financial reporting (as defined in Rule 30a-3(d) under the 1940 Act) that occurred during the period covered by this report that have materially affected, or are likely to materially affect the registrant’s internal control over financial reporting. |
| ITEM 12. | DISCLOSURE OF SECURITIES LENDING ACTIVITIES FOR CLOSED-END MANAGEMENT INVESTMENT COMPANIES. |
Not applicable.
| ITEM 13. | RECOVERY OF ERRONEOUSLY AWARDED COMPENSATION. |
(a) Not applicable.
(b) Not applicable.
(a) (1) Not applicable.
Exhibit 99.CODE ETH
(a) (2) Certifications pursuant to section 302 of the Sarbanes-Oxley Act of 2002 attached hereto.
Exhibit 99.CERT
(b) Certifications pursuant to Section 906 of the Sarbanes-Oxley Act of 2002 attached hereto.
Exhibit 99.906CERT
SIGNATURES
Pursuant to the requirements of the Securities Exchange Act of 1934 and the Investment Company Act of 1940, the registrant has duly caused this Report to be signed on its behalf by the undersigned, there unto duly authorized.
| | |
| Legg Mason Partners Institutional Trust |
| |
| By: | | /s/ Jane Trust |
| | Jane Trust |
| | Chief Executive Officer |
| |
| Date: | | April 23, 2024 |
Pursuant to the requirements of the Securities Exchange Act of 1934 and the Investment Company Act of 1940, this report has been signed below by the following persons on behalf of the registrant and in the capacities and on the dates indicated.
| | |
| By: | | /s/ Jane Trust |
| | Jane Trust |
| | Chief Executive Officer |
| |
| Date: | | April 23, 2024 |
| |
| By: | | /s/ Christopher Berarducci |
| | Christopher Berarducci |
| | Principal Financial Officer |
| |
| Date: | | April 23, 2024 |