UNITED STATES SECURITIES AND EXCHANGE COMMISSION
Washington, D.C. 20549
Form 10-K
| | | |
| (Mark One) | | |
| |
þ | | ANNUAL REPORT PURSUANT TO SECTION 13 OR 15(d) OF THE SECURITIES EXCHANGE ACT OF 1934
|
| | | For the fiscal year ended December 31, 2007
|
| or |
o | | TRANSITION REPORT PURSUANT TO SECTION 13 OR 15(d) OF THE SECURITIES EXCHANGE ACT OF 1934
|
| | | For the transition period from to |
Commission File Number 0-22664
Patterson-UTI Energy, Inc.
(Exact name of registrant as specified in its charter)
| | | |
Delaware
(State or other jurisdiction of
incorporation or organization) | | 75-2504748
(I.R.S. Employer
Identification No.) |
4510 Lamesa Highway, Snyder, Texas
(Address of principal executive offices) | | 79549
(Zip Code) |
Registrant’s telephone number, including area code:
(325) 574-6300
Securities Registered Pursuant to 12(b) of the Act:
None
Securities Registered Pursuant to 12(g) of the Act:
(Title of class)
Common Stock, $.01 Par Value
Indicate by check mark if the registrant is a well-known seasoned issuer, as defined in Rule 405 of the Securities Act. Yes þ or No o
Indicate by check mark if the registrant is not required to file reports pursuant to Section 13 or Section 15(d) of the Act. Yes o or No þ
Indicate by check mark whether the registrant (1) has filed all reports required to be filed by Section 13 or 15(d) of the Securities Exchange Act of 1934 during the preceding 12 months (or for such shorter period that the registrant was required to file such reports), and (2) has been subject to such filing requirements for the past 90 days. Yes þ No o
Indicate by check mark if disclosure of delinquent filers pursuant to Item 405 ofRegulation S-K is not contained herein, and will not be contained, to the best of the registrant’s knowledge, in definitive proxy or information statements incorporated by reference in Part III of thisForm 10-K or any amendment to thisForm 10-K. þ
Indicate by check mark whether the registrant is a large accelerated filer, an accelerated filer, a non-accelerated filer, or a smaller reporting company. See the definitions of “large accelerated filer,” “accelerated filer” and “smaller reporting company” in Rule 12b-2 of the Exchange Act. (Check one):
| | | | | | | |
Large accelerated filer þ | | Accelerated filer o | | Non-accelerated filer o | | Smaller reporting company o |
Indicate by check mark whether the registrant is a shell company (as defined inRule 12b-2 of the Act). Yes o No þ
The aggregate market value of the voting and non-voting common equity held by non-affiliates of the registrant as of June 29, 2007, the last business day of the registrant’s most recently completed second fiscal quarter, was $4,052,686,260, calculated by reference to the closing price of $26.21 for the common stock on the Nasdaq National Market on that date.
As of February 15, 2008, the registrant had outstanding 154,027,206 shares of common stock, $.01 par value, its only class of common stock.
Documents incorporated by reference:
Definitive Proxy Statement for the 2008 Annual Meeting of Stockholders (Part III).
FORWARD-LOOKING STATEMENTS
Certain statements made in this Annual Report onForm 10-K and in other public filings and press releases by the Company contain “forward-looking” information (as defined in the Private Securities Litigation Reform Act of 1995) that involves risk and uncertainty. These forward-looking statements may include, but are not limited to, references to liquidity, financing of operations, impact of inflation, future capital expenditures, oil and natural gas prices and demand for drilling rigs. Our forward-looking statements can be identified by the fact that they do not relate strictly to historic or current facts and often use words such as “believes,” “budgeted,” “expects,” “project,” “will,” “could,” “may,” “plans,” “intends,” “strategy,” or “anticipates,” and other words and expressions of similar meaning. Although we believe that the expectations reflected in such forward-looking statements are reasonable, we can give no assurance that such expectation will prove to have been correct. Forward-looking statements may be made by management orally or in writing, including, but not limited to, Management’s Discussion and Analysis of Financial Condition and Results of Operations included in this Annual Report onForm 10-K and other sections of our filings with the Securities and Exchange Commission under the Securities Exchange Act of 1934 and the Securities Act of 1933.
Forward-looking statements are not guarantees of future performance and a variety of factors could cause actual results to differ materially from the anticipated or expected results expressed in or suggested by these forward-looking statements. Factors that might cause or contribute to such differences include, but are not limited to, declines in oil and natural gas prices that could adversely affect demand for the Company’s services and their associated effect on day rates, rig utilization and planned capital expenditures, excess availability of land drilling rigs, including as a result of the reactivation or construction of new land drilling rigs, adverse industry conditions, difficulty in integrating acquisitions, demand for oil and natural gas, shortages of rig equipment and ability to retain management and field personnel. Refer to “Risk Factors” contained in Part 1 of this Annual Report onForm 10-K for a more complete discussion of these and other factors that might affect our performance and financial results. These forward-looking statements are intended to relay the Company’s expectations about the future, and speak only as of the date they are made. We undertake no obligation to publicly update or revise any forward-looking statement, whether as a result of new information, future events or otherwise.
PART I
Available Information
This Annual Report onForm 10-K, along with our Quarterly Reports onForm 10-Q, Current Reports onForm 8-K and amendments to those reports filed or furnished pursuant to Section 13(a) or 15(d) of the Securities Exchange Act of 1934, are available free of charge through our Internet website (www.patenergy.com) as soon as reasonably practicable after we electronically file such material with, or furnish it to, the United States Securities and Exchange Commission (“SEC”). You may read and copy any materials we file with the SEC at the SEC’s Public Reference Room at 100 F Street, NE, Washington, DC 20549. You may obtain information on the operation of the Public Reference Room by calling the SEC at1-800-SEC-0330.
Overview
Based on publicly available information, we believe we are the second largest operator of land-based drilling rigs in North America. The Company was formed in 1978 and reincorporated in 1993 as a Delaware corporation. Our contract drilling business operates primarily in Texas, New Mexico, Oklahoma, Arkansas, Louisiana, Mississippi, Colorado, Utah, Wyoming, Montana, North Dakota, South Dakota, Pennsylvania and western Canada (Alberta, British Columbia and Saskatchewan).
As of December 31, 2007, we had a drilling fleet that consisted of 350 currently marketable land-based drilling rigs. A drilling rig includes the structure, power source and machinery necessary to cause a drill bit to penetrate earth to a depth desired by the customer. A drilling rig is considered currently marketable at a point in time if it is
1
operating or can be made ready to operate without significant capital expenditures. We also have a substantial inventory of drilling rig components and equipment.
We provide pressure pumping services to oil and natural gas operators primarily in the Appalachian Basin. These services consist primarily of well stimulation and cementing for completion of new wells and remedial work on existing wells. We provide drilling fluids, completion fluids and related services to oil and natural gas operators offshore in the Gulf of Mexico and on land in Texas, Southeastern New Mexico, Oklahoma and the Gulf Coast region of Louisiana. Drilling and completion fluids are used by oil and natural gas operators during the drilling process to control pressure when drilling oil and natural gas wells. We own and invest in oil and natural gas assets as a working interest owner. Our oil and natural gas interests are located primarily in producing regions of West and South Texas, Southeastern New Mexico, Utah and Mississippi.
Industry Segments
Our revenues, operating profits and identifiable assets are primarily attributable to four industry segments:
| | |
| | • | contract drilling, |
| |
| | • | pressure pumping services, |
| |
| | • | drilling and completion fluids services, and |
| |
| | • | oil and natural gas exploration and production. |
All of our industry segments had operating profits in 2007, 2006 and 2005.
See “Management’s Discussion and Analysis of Financial Condition and Results of Operations” and Note 15 of Notes to Consolidated Financial Statements included as a part of Items 7 and 8, respectively, of this Report for financial information pertaining to these industry segments.
Contract Drilling Operations
General —We market our contract drilling services to major and independent oil and natural gas operators. As of December 31, 2007, we had 350 currently marketable land-based drilling rigs which were based in the following regions:
| | |
| | • | 107 in the Permian Basin region (West Texas and Southeastern New Mexico), |
| |
| | • | 51 in South Texas, |
| |
| | • | 42 in the Ark-La-Tex region and Mississippi, |
| |
| | • | 75 in the Mid-Continent region (Oklahoma and North Central Texas), |
| |
| | • | 52 in the Rocky Mountain region (Colorado, Utah, Wyoming, Montana, North Dakota and South Dakota), |
| |
| | • | 3 in the Appalachian Basin, and |
| |
| | • | 20 in Western Canada (Alberta, British Columbia and Saskatchewan). |
Our marketable drilling rigs have rated maximum depth capabilities ranging from 5,000 feet to 30,000 feet. Sixty-nine of these drilling rigs are electric rigs and 281 are mechanical rigs. An electric rig differs from a mechanical rig in that the electric rig converts the diesel power (the sole energy source for a mechanical rig) into electricity to power the rig. We also have a substantial inventory of drilling rig components and equipment which may be used in the activation of additional drilling rigs or as replacement parts for marketable rigs.
Drilling rigs are typically equipped with engines, drawworks, masts, pumps to circulate the drilling fluid, blowout preventers, drill pipe and other related equipment. Over time, components on a drilling rig are replaced or rebuilt. We spend significant funds each year on an ongoing program to modify and upgrade our drilling rigs to ensure that our drilling equipment is competitive. We have spent $1.4 billion during the last three years on capital expenditures to modify, upgrade and maintain our drilling fleet. During fiscal years 2007, 2006 and 2005, we spent approximately $540 million, $531 million and $329 million, respectively, on these capital expenditures.
2
Depth and complexity of the well and drill site conditions are the principal factors in determining the size of drilling rig used for a particular job. Our rigs are capable of vertical or horizontal drilling.
Our contract drilling operations depend on the availability of drill pipe, drill bits, replacement parts and other related rig equipment, fuel and qualified personnel. Some of these have been in short supply from time to time.
Drilling Contracts —Most of our drilling contracts are with established customers on a competitive bid or negotiated basis. Typically, the contracts are short-term to drill a single well or a series of wells. Customer demand for drilling contracts with a term of one or more years increased during 2005 due to the scarcity of available drilling rigs in the market place. In response to this demand, we entered into long-term contracts in 2005 and 2006 and, to a lesser extent, in 2007. These long-term contracts provide for the use of drilling rigs for fixed periods of time during which multiple wells are drilled. During 2007, our average number of days to drill a well (which includes moving to the drill site, rigging up and rigging down) was approximately 21 days. We may continue to enter into long-term contracts when considered beneficial to the Company.
The drilling contracts obligate us to provide and operate a drilling rig and to pay certain operating expenses, including wages of drilling personnel and necessary maintenance expenses. Most drilling contracts are subject to termination by the customer on short notice. We generally indemnify our customers against claims by our employees and claims that might arise from surface pollution caused by spills of fuel, lubricants and other solvents within our control. The customers generally indemnify us against claims that might arise from other surface and subsurface pollution, except claims that might arise from our gross negligence. Each drilling contract will contain the actual terms setting forth our rights and obligations and those of the particular customer.
The contracts provide for payment on a daywork, footage, or turnkey basis, or a combination thereof. In each case, we provide the rig and crews. Our bid for each contract depends upon location, depth and anticipated complexity of the well,on-site drilling conditions, equipment to be used, estimated risks involved, estimated duration of the job, availability of drilling rigs and other factors particular to each proposed well.
Daywork Contracts
Under daywork contracts, we provide the drilling rig and crew to the customer. The customer supervises the drilling of the well. Our compensation is based on a contracted rate per day during the period the drilling rig is utilized. We often receive a lower rate when the drilling rig is moving, or when drilling operations are interrupted or restricted by adverse weather conditions or other conditions beyond our control. Daywork contracts typically provide separately for mobilization of the drilling rig.
Footage Contracts
Under footage contracts, we contract to drill a well to a certain depth under specified conditions for a fixed price per foot. The customer provides drilling fluids, casing, cementing and well design expertise. These contracts require us to bear the cost of services and supplies that we provide until the well has been drilled to the agreed depth. If we drill the well in less time than estimated, we have the opportunity to improve our profits over those that would be attainable under a daywork contract. Profits are reduced and losses may be incurred if the well requires more days to drill to the contracted depth than estimated. Footage contracts generally contain greater risks for a drilling contractor than daywork contracts. Under footage contracts, the drilling contractor assumes certain risks associated with loss of the well from fire, blowouts and other risks. Due to market conditions, we have entered into very few footage contracts in recent years.
Turnkey Contracts
Under turnkey contracts, we contract to drill a well to a certain depth under specified conditions for a fixed fee. In a turnkey arrangement, we are required to bear the costs of services, supplies and equipment beyond those typically provided under a footage contract. In addition to the drilling rig and crew, we are required to provide the drilling and completion fluids, casing, cementing, and the technical well design and engineering services during the drilling process. We also assume certain risks associated with drilling the well such as fires, blowouts, cratering of the well bore and other such risks. Compensation occurs only when the agreed scope of the work has been
3
completed, which requires us to make larger up-front working capital commitments prior to receiving payments under a turnkey drilling contract. Under a turnkey contract, we have the opportunity to improve our profits if the drilling process goes as expected and there are no complications or time delays. However, given the increased exposure we have under a turnkey contract, profits can be significantly reduced and losses can be incurred if complications or delays occur during the drilling process. Turnkey contracts generally involve the highest degree of risk among the three different types of drilling contracts: daywork, footage and turnkey. Due to market conditions, we have entered into very few turnkey contracts in recent years.
Revenues by Contract Type — Information regarding our revenues by contract type for the last three years follows:
| | | | | | | | | | | | | |
| | | Year Ended December 31, | |
Type of Revenues | | 2007 | | | 2006 | | | 2005 | |
| |
| Daywork | | | 100 | % | | | 100 | % | | | 98 | % |
| Footage | | | 0 | | | | 0 | | | | 1 | |
| Turnkey | | | 0 | | | | 0 | | | | 1 | |
Contract Drilling Activity — Information regarding our contract drilling activity for the last three years follows:
| | | | | | | | | | | | | |
| | | Year Ended December 31, | |
| | | 2007 | | | 2006 | | | 2005 | |
| |
| Average rigs operating(1) | | | 244 | | | | 296 | | | | 276 | |
| Number of rigs operated | | | 338 | | | | 331 | | | | 307 | |
| Number of wells drilled | | | 4,237 | | | | 5,050 | | | | 4,594 | |
| Number of operating days | | | 89,095 | | | | 108,221 | | | | 100,591 | |
| | |
| (1) | | A rig is operating when it is drilling, being moved, assembled, dismantled or otherwise earning revenue under contract. |
Drilling Rigs and Related Equipment — We estimate the depth capacity with respect to rigs that were currently marketable as of December 31, 2007 to be as follows:
| | | | | | | | | | | | | |
Depth Rating (Ft.) | | Mechanical | | | Electric | | | Total | |
| |
| 5,000 to 7,999 | | | 4 | | | | — | | | | 4 | |
| 8,000 to 11,999 | | | 74 | | | | 2 | | | | 76 | |
| 12,000 to 15,999 | | | 186 | | | | 33 | | | | 219 | |
| 16,000 to 30,000 | | | 17 | | | | 34 | | | | 51 | |
| | | | | | | | | | | | | |
| Totals | | | 281 | | | | 69 | | | | 350 | |
| | | | | | | | | | | | | |
At December 31, 2007, we owned and operated 324 trucks and 441 trailers used to rig down, transport and rig up our drilling rigs. Our ownership of trucks and trailers reduces our dependency upon third parties for these services and enhances the efficiency of our contract drilling operations particularly in periods of high drilling rig utilization.
Most repair and overhaul work to our drilling rig equipment is performed at our yard facilities located in Texas, New Mexico, Oklahoma, Wyoming, Utah and Western Canada.
Pressure Pumping Operations
General — We provide pressure pumping services to oil and natural gas operators primarily in the Appalachian Basin. Pressure pumping services are primarily well stimulation and cementing for the completion of new wells and remedial work on existing wells. Most wells drilled in the Appalachian Basin require some form of fracturing or other stimulation to enhance the flow of oil and natural gas by pumping fluids under pressure into the
4
well bore. Generally, Appalachian Basin wells require cementing services before production commences. The cementing process inserts material between the wall of the well bore and the casing to center and stabilize the casing.
Equipment — Our pressure pumping equipment at December 31, 2007 follows:
| | |
| | • | 34 cement pumper trucks, |
| |
| | • | 57 fracturing pumper trucks, |
| |
| | • | 47 nitrogen pumper trucks, |
| |
| | • | 26 blender trucks, |
| |
| | • | 24 acid trucks, |
| |
| | • | 46 bulk cement trucks, |
| |
| | • | 19 bulk nitrogen trucks, |
| |
| | • | 3 bulk nitrogen tractor trailer combinations, |
| |
| | • | 51 bulk sand trucks, |
| |
| | • | 14 sand pneumatic trucks, and |
| |
| | • | 26 connection trucks. |
Drilling and Completion Fluids Operations
General — We provide drilling fluids, completion fluids and related services to oil and natural gas operators offshore in the Gulf of Mexico and on land in Texas, Southeastern New Mexico, Oklahoma and the Gulf Coast region of Louisiana. We serve our offshore customers through six stockpoint facilities located along the Gulf of Mexico in Texas and Louisiana and our land-based customers through fourteen stockpoint facilities in Texas, Louisiana, Oklahoma and New Mexico.
Drilling Fluids — Drilling fluid products and systems are used to cool and lubricate the bit during drilling operations, contain formation pressures (thereby minimizing blowout risk), suspend and remove rock cuttings from the hole and maintain the stability of the wellbore. Technical services are provided to ensure that the products and systems are applied effectively to optimize drilling operations.
Completion Fluids — After a well is drilled, the well casing is set and cemented into place. At that point, the drilling fluid services are complete and the drilling fluids are circulated out of the well and replaced with completion fluids. Completion fluids, also known as clear brine fluids, are solids-free, clear salt solutions that have high specific gravities. Combined with a range of specialty chemicals, these fluids are used to control bottom-hole pressures and to meet specific corrosion, inhibition, viscosity and fluid loss requirements.
Raw Materials — Our drilling and completion fluids operations depend on the availability of the following raw materials:
Drilling
barite and bentonite
Completion
calcium chloride, calcium bromide and zinc bromide
We obtain these raw materials through purchases made on the spot market and supply contracts with producers of these raw materials.
Barite Grinding Facility — We operate a barite grinding facility with two barite grinding mills in Houma, Louisiana. This facility allows us to grind raw barite into the powder additive used in drilling fluids.
Other Equipment — We own and operate 20 trucks and 92 trailers and lease another 34 trucks which are used to transport drilling and completion fluids and related equipment.
5
Oil and Natural Gas Operations
General — We have been engaged in the development, exploration, acquisition and production of oil and natural gas. Through October 31, 2007, we served as operator with respect to several properties and were actively involved in the development, exploration, acquisition and production of oil and natural gas. Effective November 1, 2007, we sold the related operations portion of our exploration and production business. We continue to own and invest in oil and natural gas assets as a working interest owner. Our oil and natural gas interests are located primarily in producing regions of West and South Texas, Southeastern New Mexico, Utah and Mississippi.
Customers
The customers of each of our three oil service business segments are oil and natural gas operators. Our customer base includes both major and independent oil and natural gas operators. During 2007, no single customer accounted for 10% or more of our consolidated operating revenues.
Competition
Contract Drilling and Pressure Pumping Businesses — Our land drilling and pressure pumping businesses are highly competitive. At times, available land drilling rigs and pressure pumping equipment exceed the demand for such equipment. The equipment can also be moved from one market to another in response to market conditions.
Drilling and Completion Fluids Business — The drilling and completion fluids industry is highly competitive and price is generally the most important factor. Other competitive factors include the availability of chemicals and experienced personnel, the reputation of the fluids services provider in the drilling industry and relationships with customers. Some of our competitors have substantially more resources and longer operating histories than we have.
Government and Environmental Regulation
All of our operations and facilities are subject to numerous Federal, state, foreign, and local laws, rules and regulations related to various aspects of our business, including:
| | |
| | • | drilling of oil and natural gas wells, |
| |
| | • | containment and disposal of hazardous materials, oilfield waste, other waste materials and acids, |
| |
| | • | use of underground storage tanks, and |
| |
| | • | use of underground injection wells. |
To date, applicable environmental laws and regulations have not required the expenditure of significant resources. We do not anticipate any material capital expenditures for environmental control facilities or extraordinary expenditures to comply with environmental rules and regulations in the foreseeable future. However, compliance costs under existing laws or under any new requirements could become material, and we could incur liability in any instance of noncompliance.
Our business is generally affected by political developments and by Federal, state, foreign, and local laws and regulations that relate to the oil and natural gas industry. The adoption of laws and regulations affecting the oil and natural gas industry for economic, environmental and other policy reasons could increase costs relating to drilling and production. They could have an adverse effect on our operations. State and Federal environmental laws and regulations currently apply to our operations and may become more stringent in the future.
We believe we use operating and disposal practices that are standard in the industry. However, hydrocarbons and other materials may have been disposed of or released in or under properties currently or formerly owned or operated by us or our predecessors. In addition, some of these properties have been operated by third parties over whom we have no control of their treatment of hydrocarbon and other materials or the manner in which they may have disposed of or released such materials.
6
The Federal Comprehensive Environmental Response Compensation and Liability Act of 1980, as amended, commonly known as CERCLA, and comparable state statutes impose strict liability on:
| | |
| | • | owners and operators of sites, and |
| |
| | • | persons who disposed of or arranged for the disposal of “hazardous substances” found at sites. |
The Federal Resource Conservation and Recovery Act (“RCRA”), as amended, and comparable state statutes govern the disposal of “hazardous wastes.” Although CERCLA currently excludes petroleum from the definition of “hazardous substances,” and RCRA also excludes certain classes of exploration and production wastes from regulation, such exemptions by Congress under both CERCLA and RCRA may be deleted, limited, or modified in the future. If such changes are made to CERCLAand/or RCRA, we could be required to remove and remediate previously disposed of materials (including materials disposed of or released by prior owners or operators) from properties (including ground water contaminated with hydrocarbons) and to perform removal or remedial actions to prevent future contamination.
The Federal Water Pollution Control Act and the Oil Pollution Act of 1990, as amended, and implementing regulations govern:
| | |
| | • | the prevention of discharges, including oil and produced water spills, and |
| |
| | • | liability for drainage into waters. |
The Oil Pollution Act is more comprehensive and stringent than previous oil pollution liability and prevention laws. It imposes strict liability for a comprehensive and expansive list of damages from an oil spill into waters from facilities. Liability may be imposed for oil removal costs and a variety of public and private damages. Penalties may also be imposed for violation of Federal safety, construction and operating regulations, and for failure to report a spill or to cooperate fully in aclean-up.
The Oil Pollution Act also expands the authority and capability of the Federal government to direct and manage oil spillclean-up and operations, and requires operators to prepare oil spill response plans in cases where it can reasonably be expected that substantial harm will be done to the environment by discharges on or into navigable waters. We have spill prevention control and countermeasure plans in place for our oil and natural gas properties in each of the areas in which we operate and for each of the stockpoints operated by our drilling and completion fluids business. Failure to comply with ongoing requirements or inadequate cooperation during a spill event may subject a responsible party, such as us, to civil or criminal actions. Although the liability for owners and operators is the same under the Federal Water Pollution Act, the damages recoverable under the Oil Pollution Act are potentially much greater and can include natural resource damages.
Our operations are also subject to Federal, state and local regulations for the control of air emissions. The Federal Clean Air Act, as amended, and various state and local laws impose certain air quality requirements on us. Amendments to the Clean Air Act revised the definition of “major source” such that emissions from both wellhead and associated equipment involved in oil and natural gas production may be added to determine if a source is a “major source.” As a consequence, more facilities may become major sources and thus would be required to obtain operating permits. This permitting process may require capital expenditures in order to comply with permit limits.
Risks and Insurance
Our operations are subject to the many hazards inherent in the drilling business, including:
| | |
| | • | accidents at the work location, |
| |
| | • | blow-outs, |
| |
| | • | cratering, |
| |
| | • | fires, and |
| |
| | • | explosions. |
7
These hazards could cause:
| | |
| | • | personal injury or death, |
| |
| | • | suspension of drilling operations, or |
| |
| | • | serious damage or destruction of the equipment involved and, in addition to environmental damage, could cause substantial damage to producing formations and surrounding areas. |
Damage to the environment, including property contamination in the form of either soil or ground water contamination, could also result from our operations, particularly through:
| | |
| | • | oil or produced water spillage, |
| |
| | • | natural gas leaks, and |
| |
| | • | fires. |
In addition, we could become subject to liability for reservoir damages. The occurrence of a significant event, including pollution or environmental damages, could materially affect our operations, cash flows and financial condition.
As a protection against operating hazards, we maintain insurance coverage we believe to be adequate, including:
| | |
| | • | all-risk physical damages, |
| |
| | • | employer’s liability, |
| |
| | • | commercial general liability, and |
| |
| | • | workers compensation insurance. |
We believe that we are adequately insured for public liability and property damage to others with respect to our operations. However, such insurance may not be sufficient to protect us against liability for all consequences of:
| | |
| | • | personal injury, |
| |
| | • | well disasters, |
| |
| | • | extensive fire damage, |
| |
| | • | damage to the environment, or |
| |
| | • | other hazards. |
We also carry insurance to cover physical damage to, or loss of, our drilling rigs. However, it does not cover the full replacement cost of the rigs and we do not carry insurance against loss of earnings resulting from such damage. In view of the difficulties that may be encountered in renewing such insurance at reasonable rates, no assurance can be given that:
| | |
| | • | we will be able to maintain the type and amount of coverage that we believe to be adequate at reasonable rates, or |
| |
| | • | any particular types of coverage will be available. |
In addition to insurance coverage, we also attempt to obtain indemnification from our customers for certain risks. These indemnity agreements typically require our customers to hold us harmless in the event of loss of production or reservoir damage. These contractual indemnifications, if obtained, may not be supported by adequate insurance maintained by the customer.
8
Employees
We had approximately 8,100 full-time employees at December 31, 2007. The number of employees fluctuates depending on the current and expected demand for our services. We consider our employee relations to be satisfactory. None of our employees are represented by a union.
Seasonality
Seasonality does not significantly affect our overall operations. However, our drilling operations in Canada, and our pressure pumping division in the Appalachian Basin to a lesser extent, are subject to slow periods of activity during the Spring thaw.
Raw Materials and Subcontractors
We use many suppliers of raw materials and services. These materials and services have historically been available, although there is no assurance that such materials and services will continue to be available on favorable terms or at all. We also utilize numerous independent subcontractors from various trades.
We wish to caution you that there are risks and uncertainties that could affect our business. These risks and uncertainties include, but are not limited to, the risks described below and elsewhere in this Report, particularly found in “Forward Looking Statements.” The following is not intended to be a complete discussion of all potential risks or uncertainties, as it is not possible to predict or identify all risk factors.
We are Dependent on the Oil and Natural Gas Industry and Market Prices for Oil and Natural Gas. Declines in Oil and Natural Gas Prices Have Adversely Affected Our Operations.
Our revenue, profitability and rate of growth are substantially dependent upon prevailing prices for natural gas and, to a lesser extent, oil. For many years, oil and natural gas prices and markets have been extremely volatile. Prices are affected by:
| | |
| | • | market supply and demand, |
| |
| | • | international military, political and economic conditions, and |
| |
| | • | the ability of the Organization of Petroleum Exporting Countries, commonly known as OPEC, to set and maintain production and price targets. |
All of these factors are beyond our control. During 2006, the average market price of natural gas retreated from record highs that were set in 2005. The price dropped from an average of $8.98 per Mcf in 2005 to an average of $6.94 per Mcf in 2006 and an average of $7.18 per Mcf in 2007. This resulted in our customers moderating their increase in drilling activities in 2007. This moderation combined with the reactivation and construction of new land drilling rigs in the United States has resulted in excess capacity compared to recent demand. Additionally, drilling activity in Canada has slowed significantly. As a result of these factors, our average number of rigs operating declined to 244 in 2007 compared to 296 in 2006. We expect oil and natural gas prices to continue to be volatile and to affect our financial condition, operations and ability to access sources of capital. A significant decrease in market prices for natural gas could result in a material decrease in demand for drilling rigs and adversely affect our operating results.
A General Excess of Operable Land Drilling Rigs Adversely Affects Our Profit Margins Particularly in Times of Weaker Demand.
The North American land drilling industry has experienced periods of downturn in demand over the last decade. During these periods, there have been substantially more drilling rigs available than necessary to meet demand. As a result, drilling contractors have had difficulty sustaining profit margins during the downturn periods.
In addition to adverse effects that future declines in demand could have on us, ongoing factors which could continue to adversely affect utilization rates and pricing, even in an environment of high oil and natural gas prices and increased drilling activity, include:
| | |
| | • | movement of drilling rigs from region to region, |
9
| | |
| | • | reactivation of land-based drilling rigs, or |
| |
| | • | construction of new drilling rigs. |
As a result of an increase in drilling activity and increased prices for drilling services in 2005 and 2006, construction of new drilling rigs increased significantly in that time period. The addition of new drilling rigs to the market has resulted in excess capacity compared to demand, and construction of new drilling rigs has moderated in 2007. We cannot predict either the future level of demand for our contract drilling services or future conditions in the oil and natural gas contract drilling business.
Shortages of Drill Pipe, Replacement Parts and Other Related Rig Equipment Adversely Affects Our Operating Results.
During periods of increased demand for drilling services, the industry has experienced shortages of drill pipe, replacement parts and other related rig equipment. These shortages can cause the price of these items to increase significantly and require that orders for the items be placed well in advance of expected use. These price increases and delays in delivery may require us to increase capital and repair expenditures in our contract drilling segment. Severe shortages could impair our ability to operate our drilling rigs.
The Oil Service Business Segments in Which We Operate Are Highly Competitive with Excess Capacity, which Adversely Affect Our Operating Results.
Our land drilling and pressure pumping businesses are highly competitive. At times, available land drilling rigs and pressure pumping equipment exceed the demand for such equipment. This excess capacity has resulted in substantial competition for drilling and pressure pumping contracts. The fact that drilling rigs and pressure pumping equipment are mobile and can be moved from one market to another in response to market conditions heightens the competition in the industry.
We believe that price competition for drilling and pressure pumping contracts will continue for the foreseeable future due to the existence of available rigs and pressure pumping equipment.
In recent years, many drilling and pressure pumping companies have consolidated or merged with other companies. Although this consolidation has decreased the total number of competitors, we believe the competition for drilling and pressure pumping services will continue to be intense.
The drilling and completion fluids services industry is highly competitive. Price is generally the most important factor. Other competitive factors include the availability of chemicals and experienced personnel, the reputation of the fluids services provider in the drilling industry and relationships with customers. Some of our competitors have substantially more resources and longer operating histories than we have.
Labor Shortages Adversely Affect Our Operating Results.
During periods of increasing demand for contract drilling and pressure pumping services, the industry experiences shortages of qualified personnel. During these periods, our ability to attract and retain sufficient qualified personnel to market and operate our drilling rigs and pressure pumping equipment is adversely affected, which negatively impacts both our operations and profitability. Operationally, it is more difficult to hire qualified personnel, which adversely affects our ability to mobilize inactive rigs and pressure pumping equipment in response to the increased demand for such services. Additionally, wage rates for drilling and pressure pumping personnel are likely to increase, resulting in higher operating costs.
Continued Growth Through Rig Acquisition is Not Assured.
We have increased our drilling rig fleet in the past through mergers and acquisitions. The land drilling industry has experienced significant consolidation, and there can be no assurance that acquisition opportunities will be available in the future. Additionally, we are likely to continue to face intense competition from other companies for available acquisition opportunities.
10
There can be no assurance that we will:
| | |
| | • | have sufficient capital resources to complete additional acquisitions, |
| |
| | • | successfully integrate acquired operations and assets, |
| |
| | • | effectively manage the growth and increased size, |
| |
| | • | successfully deploy idle or stacked rigs, |
| |
| | • | maintain the crews and market share to operate drilling rigs acquired, or |
| |
| | • | successfully improve our financial condition, results of operations, business or prospects as a result of any completed acquisition. |
We may incur substantial indebtedness to finance future acquisitions and also may issue equity securities or convertible securities in connection with any such acquisitions. Debt service requirements could represent a significant burden on our results of operations and financial condition and the issuance of additional equity would be dilutive to existing stockholders. Also, continued growth could strain our management, operations, employees and other resources.
The Nature of our Business Operations Presents Inherent Risks of Loss that, if not Insured or Indemnified Against, Could Adversely Affect Our Operating Results.
Our operations are subject to many hazards inherent in the contract drilling, pressure pumping, and drilling and completion fluids businesses, which in turn could cause personal injury or death, work stoppage, or serious damage to our equipment. Our operations could also cause environmental and reservoir damages. We maintain insurance coverage and have indemnification agreements with many of our customers. However, there is no assurance that such insurance or indemnification agreements would adequately protect us against liability or losses from all consequences of these hazards. Additionally, there can be no assurance that insurance would be available to cover any or all of these risks, or, even if available, that insurance premiums or other costs would not rise significantly in the future, so as to make the cost of such insurance prohibitive.
We have elected in some cases to accept a greater amount of risk through increased deductibles on certain insurance policies. For example, we maintain a $1.0 million per occurrence deductible on our workers’ compensation, general liability and equipment insurance coverages.
Violations of Environmental Laws and Regulations Could Materially Adversely Affect Our Operating Results.
The drilling of oil and natural gas wells is subject to various Federal, state, foreign, and local laws, rules and regulations. The cost of compliance with these laws and regulations could be substantial. A failure to comply with these requirements could expose us to substantial civil and criminal penalties. In addition, Federal law imposes a variety of regulations on “responsible parties” related to the prevention of oil spills and liability for damages from such spills. As an owner and operator of land-based drilling rigs, we may be deemed to be a responsible party under Federal law. Our operations and facilities are subject to numerous state and Federal environmental laws, rules and regulations, including, without limitation, laws concerning the containment and disposal of hazardous substances, oil field waste and other waste materials, the use of underground storage tanks and the use of underground injection wells.
Some of Our Contract Drilling Services are Provided Under Turnkey and Footage Contracts, Which are Financially Risky.
At times, a portion of our contract drilling is performed under turnkey and footage contracts, which involve significant risks. Under turnkey drilling contracts, we contract to drill a well to a certain depth under specified conditions at a fixed price. Under footage contracts, we contract to drill a well to a certain depth under specified conditions at a fixed price per foot. The risk to us under these types of drilling contracts are greater than on a well drilled on a daywork basis. Unlike daywork contracts, we must bear the cost of services until the target depth is
11
reached. In addition, we must assume most of the risk associated with the drilling operations, generally assumed by the operator of the well on a daywork contract, including blowouts, loss of hole from fire, machinery breakdowns and abnormal drilling conditions. Accordingly, if severe drilling problems are encountered in drilling wells under such contracts, we could suffer substantial losses.
Anti-takeover Measures in Our Charter Documents and Under State Law Could Discourage an Acquisition and Thereby Affect the Related Purchase Price.
We are a Delaware corporation subject to the Delaware General Corporation Law, including Section 203, an anti-takeover law enacted in 1988. We have also enacted certain anti-takeover measures, including a stockholders’ rights plan. In addition, our Board of Directors has the authority to issue up to one million shares of preferred stock and to determine the price, rights (including voting rights), conversion ratios, preferences and privileges of that stock without further vote or action by the holders of the common stock. As a result of these measures and others, potential acquirers might find it more difficult or be discouraged from attempting to effect an acquisition transaction with us. This may deprive holders of our securities of certain opportunities to sell or otherwise dispose of the securities at above-market prices pursuant to any such transactions.
| |
| Item 1B. | Unresolved Staff Comments. |
None.
Our corporate headquarters are located in Snyder, Texas and include approximately 37,000 square feet of office and storage space. These headquarters are located at 4510 Lamesa Highway, Snyder, Texas, and our telephone number at that address is(325) 574-6300. We also have administrative offices, yards and stockpoint facilities in many of the areas in which we operate. The facilities are primarily used to support day-to-day operations, including the repair and maintenance of equipment as well as the storage of equipment, inventory and supplies and to facilitate administrative responsibilities and sales.
Contract Drilling Operations — Our drilling services are supported by several administrative offices and yard facilities located throughout our areas of operations including Texas, New Mexico, Oklahoma, Colorado, Utah, Wyoming and western Canada.
Pressure Pumping — Our pressure pumping services are supported by several offices and yard facilities located throughout our areas of operations including Pennsylvania, Ohio, New York, West Virginia, Kentucky, Tennessee, Wyoming and Colorado.
Drilling and Completion Fluids — Our drilling and completion fluids services are supported by several administrative offices and stockpoint facilities located throughout our areas of operations including Texas, Louisiana, New Mexico and Oklahoma.
We own our headquarters in Snyder, Texas, as well as several of our other facilities. We also lease a number of facilities and we do not believe that any one of the leased facilities is individually material to our operations. We believe that our existing facilities are suitable and adequate to meet our needs.
| |
| Item 3. | Legal Proceedings. |
We are party to various legal proceedings arising in the normal course of our business. We do not believe that the outcome of these proceedings, either individually or in the aggregate, will have a material adverse effect on our results of operations, cash flows or financial condition.
| |
| Item 4. | Submission of Matters to a Vote of Security Holders. |
None.
12
PART II
| |
| Item 5. | Market for Registrant’s Common Equity, Related Stockholder Matters and Issuer Purchases of Equity Securities. |
Our common stock, par value $0.01 per share, is publicly traded on the Nasdaq National Market and is quoted under the symbol “PTEN.” Our common stock is included in the S&P MidCap 400 Index and several other market indexes. The following table provides high and low sales prices of our common stock for the periods indicated:
| | | | | | | | | |
| | | High | | | Low | |
| |
2007: | | | | | | | | |
| First quarter | | $ | 24.89 | | | $ | 21.13 | |
| Second quarter | | | 27.66 | | | | 22.17 | |
| Third quarter | | | 26.48 | | | | 20.79 | |
| Fourth quarter | | | 23.22 | | | | 18.44 | |
2006: | | | | | | | | |
| First quarter | | $ | 38.49 | | | $ | 25.61 | |
| Second quarter | | | 35.65 | | | | 25.24 | |
| Third quarter | | | 29.11 | | | | 21.84 | |
| Fourth quarter | | | 28.21 | | | | 20.81 | |
As of February 15, 2008, there were approximately 2,100 holders of record of our common stock.
| |
| (c) | Dividends and Buyback Program |
We paid cash dividends during the years ended December 31, 2007 and 2006 as follows:
| | | | | | | | | |
| | | Per Share | | | Total | |
| | | | | | (In thousands) | |
| |
2007: | | | | | | | | |
| Paid on March 30, 2007 | | $ | 0.08 | | | $ | 12,527 | |
| Paid on June 29, 2007 | | | 0.12 | | | | 18,860 | |
| Paid on September 28, 2007 | | | 0.12 | | | | 18,690 | |
| Paid on December 28, 2007 | | | 0.12 | | | | 18,484 | |
| | | | | | | | | |
| Total cash dividends declared and paid | | $ | 0.44 | | | $ | 68,561 | |
| | | | | | | | | |
2006: | | | | | | | | |
| Paid on March 30, 2006 | | $ | 0.04 | | | $ | 6,906 | |
| Paid on June 30, 2006 | | | 0.08 | | | | 13,413 | |
| Paid on September 29, 2006 | | | 0.08 | | | | 13,024 | |
| Paid on December 29, 2006 | | | 0.08 | | | | 12,482 | |
| | | | | | | | | |
| Total cash dividends declared and paid | | $ | 0.28 | | | $ | 45,825 | |
| | | | | | | | | |
13
On February 13, 2008, our Board of Directors approved a cash dividend on our common stock in the amount of $0.12 per share to be paid on March 28, 2008 to holders of record as of March 12, 2008. The amount and timing of all future dividend payments, if any, is subject to the discretion of the Board of Directors and will depend upon business conditions, results of operations, financial condition, terms of our credit facilities and other factors.
The table below sets forth the information with respect to purchases of our common stock made by us during the quarter ended December 31, 2007.
| | | | | | | | | | | | | | | | | |
| | | | | | | | | | | | Approximate
| |
| | | | | | | | | Total number
| | | dollar value
| |
| | | | | | | | | of shares
| | | of shares
| |
| | | | | | | | | (or units)
| | | that may yet
| |
| | | | | | | | | purchased as
| | | be purchased
| |
| | | | | | | | | part of
| | | under the
| |
| | | Total number
| | | Average price
| | | publicly announced
| | | plans or
| |
| | | of shares
| | | paid per
| | | plans or
| | | programs
| |
Period covered | | purchased | | | share | | | programs(1) | | | (In thousands)(1) | |
| |
October1–31, 2007 | | | — | | | $ | — | | | | — | | | $ | 199,726 | |
November1–30, 2007(2) | | | 254,126 | | | $ | 18.87 | | | | 250,000 | | | $ | 195,009 | |
December1–31, 2007 | | | 783,850 | | | $ | 19.60 | | | | 783,850 | | | $ | 179,646 | |
| | | | | | | | | | | | | | | | | |
| Total | | | 1,037,976 | | | $ | 19.42 | | | | 1,033,850 | | | $ | 179,646 | |
| | | | | | | | | | | | | | | | | |
| | |
| (1) | | On August 1, 2007, our Board of Directors approved a stock buyback program authorizing purchases of up to $250 million of our common stock in open market or privately negotiated transactions. |
| |
| (2) | | On November 30, 2007, we purchased 4,126 shares from employees to provide the respective employees with the funds necessary to satisfy their tax withholding obligations with respect to the vesting of restricted shares on that date. The price paid was $18.85 per share, which was the closing price of our common stock on November 30, 2007. |
| |
| (d) | Securities Authorized for Issuance Under Equity Compensation Plans |
Equity compensation to our employees, officers and directors as of December 31, 2007 follows:
| | | | | | | | | | | | | |
| | | Equity Compensation Plan Information | |
| | | | | | | | | Number of
| |
| | | | | | | | | Securities Remaining
| |
| | | Number of
| | | | | | Available for
| |
| | | Securities to
| | | | | | Future Issuance
| |
| | | be Issued
| | | Weighted-Average
| | | under Equity
| |
| | | upon Exercise
| | | Exercise Price
| | | Compensation Plans
| |
| | | of Outstanding
| | | of Outstanding
| | | (Excluding Securities
| |
| | | Options, Warrants
| | | Options, Warrants
| | | Reflected in
| |
Plan Category | | and Rights | | | and Rights | | | Column(a)) | |
| | | (a) | | | (b) | | | (c) | |
| |
| Equity compensation plans approved by security holders(1) | | | 6,733,337 | | | $ | 18.27 | | | | 2,283,045 | |
| Equity compensation plans not approved by security holders(2) | | | 669,747 | | | $ | 9.91 | | | | — | |
| | | | | | | | | | | | | |
| Total | | | 7,403,084 | | | $ | 17.52 | | | | 2,283,045 | |
| | | | | | | | | | | | | |
| | |
| (1) | | The Patterson-UTI Energy, Inc. 2005 Long-Term Incentive Plan (the “2005 Plan”) provides for awards of incentive stock options, non-incentive stock options, tandem and freestanding stock appreciation rights, restricted stock awards, other stock unit awards, performance share awards, performance unit awards and dividend equivalents to key employees, officers and directors, which are subject to certain vesting and forfeiture provisions. All options are granted with an exercise price equal to or greater than the fair market value of the common stock at the time of grant. The vesting schedule and term are set by the Compensation Committee of |
14
| | |
| | the Board of Directors. All securities remaining available for future issuance under equity compensation plans approved by security holders in column (c) are available under this plan. |
| |
| (2) | | The Amended and Restated Patterson-UTI Energy, Inc. 2001 Long-Term Incentive Plan (the “2001 Plan”) was approved by the Board of Directors in July 2001. In connection with the approval of the 2005 Plan, the Board of Directors approved a resolution that no further options, restricted stock or other awards would be granted under any equity compensation plan, other than the 2005 Plan. The terms of the 2001 Plan provided for grants of stock options, stock appreciation rights, shares of restricted stock and performance awards to eligible employees other than officers and directors. No Incentive Stock Options could be awarded under the Plan. All options were granted with an exercise price equal to or greater than the fair market value of the common stock at the time of grant. The vesting schedule and term were set by the Compensation Committee of the Board of Directors. |
15
The following graph compares the cumulative stockholder return of our common stock for the period from December 31, 2002 through December 31, 2007, with the cumulative total return of the Standard & Poors 500 Stock Index, the Standard & Poors MidCap Index, the Oilfield Service Index and a peer group determined by us. Our peer group consists of Grey Wolf, Inc., Helmerich & Payne, Inc., Nabors Industries, Ltd., Pioneer Drilling Co. and Unit Corp. All of the companies in our peer group are providers of land-based drilling services. The graph assumes investment of $100 on December 31, 2002 and reinvestment of all dividends.
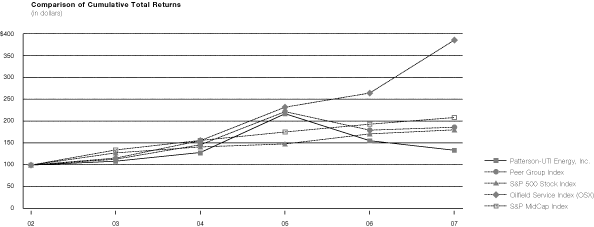
| | | | | | | | | | | | | | | | | | | | | | | | | |
| | | Fiscal Year Ended December 31, | |
| | | 2002
| | | 2003
| | | 2004
| | | 2005
| | | 2006
| | | 2007
| |
Company/Index | | ($) | | | ($) | | | ($) | | | ($) | | | ($) | | | ($) | |
| |
| Patterson-UTI Energy, Inc. | | | 100.00 | | | | 109.15 | | | | 129.56 | | | | 220.73 | | | | 157.34 | | | | 134.84 | |
| Peer Group Index | | | 100.00 | | | | 113.82 | | | | 147.78 | | | | 225.64 | | | | 182.13 | | | | 189.00 | |
| S&P 500 Stock Index | | | 100.00 | | | | 128.68 | | | | 142.69 | | | | 149.70 | | | | 173.34 | | | | 182.87 | |
| Oilfield Service Index (OSX) | | | 100.00 | | | | 116.47 | | | | 157.50 | | | | 236.16 | | | | 269.34 | | | | 393.90 | |
| S&P MidCap Index | | | 100.00 | | | | 135.62 | | | | 157.97 | | | | 177.81 | | | | 196.15 | | | | 211.80 | |
The foregoing graph is based on historical data and is not necessarily indicative of future performance. This graph shall not be deemed to be “soliciting material” or to be “filed” with the SEC or subject to the Regulations of 14A or 14C under the Exchange Act or to the liabilities of Section 18 under such act.
16
| |
| Item 6. | Selected Financial Data. |
Our selected consolidated financial data as of December 31, 2007, 2006, 2005, 2004 and 2003, and for each of the five years in the period ended December 31, 2007 should be read in conjunction with “Management’s Discussion and Analysis of Financial Condition and Results of Operations” and the Consolidated Financial Statements and related Notes thereto, included as Items 7 and 8, respectively, of this Report. Certain reclassifications have been made to the historical financial data to conform with the 2007 presentation.
| | | | | | | | | | | | | | | | | | | | | |
| | | Years Ended December 31, | |
| | | 2007 | | | 2006 | | | 2005 | | | 2004 | | | 2003 | |
| | | (In thousands, except per share amounts) | |
| |
Income Statement Data: | | | | | | | | | | | | | | | | | | | | |
| Operating revenues: | | | | | | | | | | | | | | | | | | | | |
| Contract drilling | | $ | 1,741,647 | | | $ | 2,169,370 | | | $ | 1,485,684 | | | $ | 809,691 | | | $ | 639,694 | |
| Pressure pumping | | | 202,812 | | | | 145,671 | | | | 93,144 | | | | 66,654 | | | | 46,083 | |
| Drilling and completion fluids | | | 128,098 | | | | 192,358 | | | | 122,011 | | | | 90,557 | | | | 69,230 | |
| Oil and natural gas | | | 41,637 | | | | 39,187 | | | | 39,616 | | | | 33,867 | | | | 21,163 | |
| | | | | | | | | | | | | | | | | | | | | |
| Total | | | 2,114,194 | | | | 2,546,586 | | | | 1,740,455 | | | | 1,000,769 | | | | 776,170 | |
| | | | | | | | | | | | | | | | | | | | | |
| Operating costs and expenses: | | | | | | | | | | | | | | | | | | | | |
| Contract drilling | | | 963,150 | | | | 1,002,001 | | | | 776,313 | | | | 556,869 | | | | 475,224 | |
| Pressure pumping | | | 105,273 | | | | 77,755 | | | | 54,956 | | | | 37,561 | | | | 26,184 | |
| Drilling and completion fluids | | | 108,752 | | | | 150,372 | | | | 98,530 | | | | 76,503 | | | | 61,424 | |
| Oil and natural gas | | | 10,864 | | | | 13,374 | | | | 9,566 | | | | 7,978 | | | | 4,808 | |
| Depreciation, depletion, amortization and impairment | | | 249,206 | | | | 196,370 | | | | 156,393 | | | | 122,800 | | | | 100,834 | |
| Selling, general and administrative | | | 64,623 | | | | 55,065 | | | | 39,110 | | | | 31,983 | | | | 27,685 | |
| Embezzlement costs (recoveries) | | | (43,955 | ) | | | 3,081 | | | | 20,043 | | | | 19,122 | | | | 17,849 | |
| (Gain) loss on disposal of assets | | | (16,545 | ) | | | 3,819 | | | | (1,231 | ) | | | (1,411 | ) | | | (1,927 | ) |
| Other operating expenses (income) | | | 2,550 | | | | 5,585 | | | | 5,479 | | | | 897 | | | | (2,193 | ) |
| | | | | | | | | | | | | | | | | | | | | |
| Total | | | 1,443,918 | | | | 1,507,422 | | | | 1,159,159 | | | | 852,302 | | | | 709,888 | |
| | | | | | | | | | | | | | | | | | | | | |
| Operating income | | | 670,276 | | | | 1,039,164 | | | | 581,296 | | | | 148,467 | | | | 66,282 | |
| Other income | | | 531 | | | | 4,670 | | | | 3,463 | | | | 680 | | | | 2,694 | |
| | | | | | | | | | | | | | | | | | | | | |
| Income before income taxes and cumulative effect of change in accounting principle | | | 670,807 | | | | 1,043,834 | | | | 584,759 | | | | 149,147 | | | | 68,976 | |
| Income tax expense | | | 232,168 | | | | 371,267 | | | | 212,019 | | | | 54,801 | | | | 25,320 | |
| | | | | | | | | | | | | | | | | | | | | |
| Income before cumulative effect of change in accounting principle | | | 438,639 | | | | 672,567 | | | | 372,740 | | | | 94,346 | | | | 43,656 | |
| Cumulative effect of change in accounting principle, net of related income tax expense of $398 in 2006 and benefit of $287 in 2003 | | | — | | | | 687 | | | | — | | | | — | | | | (469 | ) |
| | | | | | | | | | | | | | | | | | | | | |
| Net income | | $ | 438,639 | | | $ | 673,254 | | | $ | 372,740 | | | $ | 94,346 | | | $ | 43,187 | |
| | | | | | | | | | | | | | | | | | | | | |
| Income before cumulative effect of change in accounting principle per common share: | | | | | | | | | | | | | | | | | | | | |
| Basic | | $ | 2.83 | | | $ | 4.07 | | | $ | 2.19 | | | $ | 0.57 | | | $ | 0.27 | |
| | | | | | | | | | | | | | | | | | | | | |
| Diluted | | $ | 2.79 | | | $ | 4.02 | | | $ | 2.15 | | | $ | 0.56 | | | $ | 0.27 | |
| | | | | | | | | | | | | | | | | | | | | |
17
| | | | | | | | | | | | | | | | | | | | | |
| | | Years Ended December 31, | |
| | | 2007 | | | 2006 | | | 2005 | | | 2004 | | | 2003 | |
| | | (In thousands, except per share amounts) | |
| |
| Net income per common share: | | | | | | | | | | | | | | | | | | | | |
| Basic | | $ | 2.83 | | | $ | 4.08 | | | $ | 2.19 | | | $ | 0.57 | | | $ | 0.27 | |
| | | | | | | | | | | | | | | | | | | | | |
| Diluted | | $ | 2.79 | | | $ | 4.02 | | | $ | 2.15 | | | $ | 0.56 | | | $ | 0.26 | |
| | | | | | | | | | | | | | | | | | | | | |
| Cash dividends per common share | | $ | 0.44 | | | $ | 0.28 | | | $ | 0.16 | | | $ | 0.06 | | | $ | — | |
| | | | | | | | | | | | | | | | | | | | | |
| Weighted average number of common shares outstanding: | | | | | | | | | | | | | | | | | | | | |
| Basic | | | 154,755 | | | | 165,159 | | | | 170,426 | | | | 166,258 | | | | 161,272 | |
| | | | | | | | | | | | | | | | | | | | | |
| Diluted | | | 156,997 | | | | 167,413 | | | | 173,767 | | | | 169,211 | | | | 164,572 | |
| | | | | | | | | | | | | | | | | | | | | |
Balance Sheet Data: | | | | | | | | | | | | | | | | | | | | |
| Total assets | | $ | 2,465,199 | | | $ | 2,192,503 | | | $ | 1,795,781 | | | $ | 1,256,785 | | | $ | 1,039,521 | |
| Borrowings under line of credit | | | 50,000 | | | | 120,000 | | | | — | | | | — | | | | — | |
| Stockholders’ equity | | | 1,896,030 | | | | 1,562,466 | | | | 1,367,011 | | | | 961,501 | | | | 789,814 | |
| Working capital | | | 227,577 | | | | 335,052 | | | | 382,448 | | | | 235,480 | | | | 198,399 | |
18
| |
| Item 7. | Management’s Discussion and Analysis of Financial Condition and Results of Operations |
This Item 7 contains forward-looking statements, which are made pursuant to the “Safe Harbor” provisions of the Private Securities Litigation Reform Act of 1995.
Management Overview — We are a leading provider of contract services to the North American oil and natural gas industry. Our services primarily involve the drilling, on a contract basis, of land-based oil and natural gas wells and, to a lesser extent, we provide pressure pumping services and drilling and completion fluid services. In addition to the aforementioned contract services, we have also engaged in the development, exploration, acquisition and production of oil and natural gas. For the three years ended December 31, 2007, our operating revenues consisted of the following (dollars in thousands):
| | | | | | | | | | | | | | | | | | | | | | | | | |
| | | 2007 | | | 2006 | | | 2005 | |
| |
| Contract drilling | | $ | 1,741,647 | | | | 82 | % | | $ | 2,169,370 | | | | 84 | % | | $ | 1,485,684 | | | | 86 | % |
| Pressure pumping | | | 202,812 | | | | 10 | | | | 145,671 | | | | 6 | | | | 93,144 | | | | 5 | |
| Drilling and completion fluids | | | 128,098 | | | | 6 | | | | 192,358 | | | | 8 | | | | 122,011 | | | | 7 | |
| Oil and natural gas | | | 41,637 | | | | 2 | | | | 39,187 | | | | 2 | | | | 39,616 | | | | 2 | |
| | | | | | | | | | | | | | | | | | | | | | | | | |
| | | $ | 2,114,194 | | | | 100 | % | | $ | 2,546,586 | | | | 100 | % | | $ | 1,740,455 | | | | 100 | % |
| | | | | | | | | | | | | | | | | | | | | | | | | |
We provide our contract services to oil and natural gas operators in many of the oil and natural gas producing regions of North America. Our contract drilling operations are focused in various regions of Texas, New Mexico, Oklahoma, Arkansas, Louisiana, Mississippi, Colorado, Utah, Wyoming, Montana, North Dakota, South Dakota, Pennsylvania and Western Canada, while our pressure pumping services are focused primarily in the Appalachian Basin. Our drilling and completion fluids services are provided to operators offshore in the Gulf of Mexico and on land in Texas, Southeastern New Mexico, Oklahoma and the Gulf Coast region of Louisiana. The oil and natural gas properties in which we hold working interests are primarily located in West and South Texas, Southeastern New Mexico, Utah and Mississippi.
Typically, the profitability of our business is most readily assessed by two primary indicators in our contract drilling segment: our average number of rigs operating and our average revenue per operating day. During 2007, our average number of rigs operating was 244 compared to 296 in 2006 and 276 in 2005. Our average revenue per operating day was $19,550 in 2007 compared to $20,050 in 2006 and $14,770 in 2005. Our consolidated net income for 2007 decreased by $235 million, or 35%, as compared to 2006. This decrease was primarily due to our contract drilling segment experiencing a decrease in the average number of rigs operating, a decrease in the average revenue per operating day and an increase in the average costs per operating day in 2007 as compared to 2006.
Our revenues, profitability and cash flows are highly dependent upon the market prices of oil and natural gas. During periods of improved commodity prices, the capital spending budgets of oil and natural gas operators tend to expand, which results in increased demand for our contract services. Conversely, in periods when these commodity prices deteriorate, the demand for our contract services generally weakens and we experience downward pressure on pricing for our services. In addition, our operations are highly impacted by competition, the availability of excess equipment, labor issues and various other factors which are more fully described as “Risk Factors” in Item 1A of this Annual Report.
We believe that the liquidity shown on our balance sheet as of December 31, 2007, which includes approximately $228 million in working capital (including $17.4 million in cash) and $266 million available under a $375 million line of credit, provides us with the ability to pursue acquisition opportunities, expand into new regions, make improvements to our assets, pay cash dividends and survive downturns in our industry.
Commitments and Contingencies — We maintain letters of credit in the aggregate amount of $59.4 million for the benefit of various insurance companies as collateral for retrospective premiums and retained losses which could become payable under the terms of the underlying insurance contracts. These letters of credit expire at various times during each calendar year. No amounts have been drawn under the letters of credit.
As of December 31, 2007, we had non-cancelable commitments to purchase approximately $83.0 million of equipment.
19
A receiver was appointed to take control of and liquidate the assets of our former CFO in connection with his embezzlement of Company funds. In May 2007, the court approved a plan of distribution for the assets recovered by the receiver. We expect to recover a total of approximately $44.5 million pursuant to the approved plan, and we have recognized this recovery in our consolidated statement of income in 2007, net of professional fees incurred as a result of the embezzlement. As of December 31, 2007, we had received cash payments from the receiver of approximately $41.2 million, with the remaining $3.3 million of the recovery consisting of notes receivable, investments and other assets that are being transferred to us.
Trading and investing — We have not engaged in trading activities that include high-risk securities, such as derivatives and non-exchange traded contracts. We invest cash primarily in highly liquid, short-term investments such as overnight deposits, money markets and highly rated municipal and commercial bonds.
Description of business — We conduct our contract drilling operations in Texas, New Mexico, Oklahoma, Arkansas, Louisiana, Mississippi, Colorado, Utah, Wyoming, Montana, North Dakota, South Dakota, Pennsylvania and western Canada. For the years ended December 31, 2007, 2006 and 2005, revenue earned outside of the United States was $72.9 million, $98.5 million and $84.4 million, respectively. Additionally, we had long-lived assets located outside of the United States of $91.6 million, $78.9 million and $60.7 million as of December 31, 2007, 2006 and 2005, respectively. As of December 31, 2007, we had 350 currently marketable land-based drilling rigs. We provide pressure pumping services to oil and natural gas operators primarily in the Appalachian Basin. These services consist primarily of well stimulation and cementing for completion of new wells and remedial work on existing wells. We provide drilling fluids, completion fluids and related services to oil and natural gas operators offshore in the Gulf of Mexico and on land in Texas, Southeastern New Mexico, Oklahoma and the Gulf Coast region of Louisiana. Drilling and completion fluids are used by oil and natural gas operators during the drilling process to control pressure when drilling oil and natural gas wells. We also invest on a working interest basis in production of oil and natural gas.
Critical Accounting Policies
In addition to established accounting policies, our consolidated financial statements are impacted by certain estimates and assumptions made by management. The following is a discussion of our critical accounting policies pertaining to property and equipment, oil and natural gas properties, goodwill, revenue recognition and the use of estimates.
Property and equipment — Property and equipment, including betterments which extend the useful life of the asset, are stated at cost. Maintenance and repairs are charged to expense when incurred. We provide for the depreciation of our property and equipment using the straight-line method over the estimated useful lives. Our method of depreciation does not change when equipment becomes idle; we continue to depreciate idled equipment on a straight-line basis. No provision for salvage value is considered in determining depreciation of our property and equipment. We review our assets for impairment when events or changes in circumstances indicate that the carrying values of certain assets either exceed their respective fair values or may not be recovered over their estimated remaining useful lives. The cyclical nature of our industry has resulted in fluctuations in rig utilization over periods of time. Management believes that the contract drilling industry will continue to be cyclical and rig utilization will fluctuate. Based on management’s expectations of future trends, we estimate future cash flows over the life of the respective assets in our assessment of impairment. These estimates of cash flows are based on historical cyclical trends in the industry as well as management’s expectations regarding the continuation of these trends in the future. Provisions for asset impairment are charged to income when estimated future cash flows, on an undiscounted basis, are less than the asset’s net book value. Impairment charges are recorded based on discounted cash flows. There were no material impairment charges related to property and equipment during the years 2007, 2006 or 2005.
Oil and natural gas properties — Working interests in oil and natural gas properties are accounted for using the successful efforts method of accounting. Under the successful efforts method of accounting, exploration costs which result in the discovery of oil and natural gas reserves and all development costs are capitalized to the appropriate well. Exploration costs which do not result in discovering oil and natural gas reserves are charged to expense when such determination is made. In accordance with Statement of Financial Accounting Standards No. 19, “Financial Accounting and Reporting by Oil and Gas Producing Companies,” (“SFAS No. 19”) costs of exploratory
20
wells are initially capitalized to wells in progress until the outcome of the drilling is known. We review wells in progress quarterly to determine whether sufficient progress is being made in assessing the reserves and the economic operating viability of the respective projects. If no progress has been made in assessing the reserves and the economic operating viability of a project after one year following the completion of drilling, we consider the costs of the well to be impaired and recognize the costs as expense. Geological and geophysical costs, including seismic costs and costs to carry and retain undeveloped properties, are charged to expense when incurred. The capitalized costs of both developmental and successful exploratory type wells, consisting of lease and well equipment, lease acquisition costs and intangible development costs, are depreciated, depleted and amortized on the units-of-production method, based on engineering estimates of proved oil and natural gas reserves of each respective field. We review our proved oil and natural gas properties for impairment when an event occurs such as downward revisions in reserve estimates or decreases in oil and natural gas prices. Proved properties are grouped by field and undiscounted cash flow estimates are prepared internally and reviewed by an independent petroleum engineer. If the net book value of a field exceeds its undiscounted cash flow estimate, impairment expense is measured and recognized as the difference between its net book value and discounted cash flow. Unproved oil and natural gas properties are reviewed quarterly to determine impairment. The intent to drill, lease expiration and abandonment of area are considered. Assessment of impairment is made on alease-by-lease basis. If an unproved property is determined to be impaired, then costs related to that property are expensed. Impairment expense of approximately $3.9 million, $5.0 million and $4.4 million for the years ended December 31, 2007, 2006 and 2005, respectively, is included in depreciation, depletion and impairment in the accompanying financial statements.
Goodwill — Goodwill is considered to have an indefinite useful economic life and is not amortized. As such, we assess impairment of our goodwill annually as of December 31 or on an interim basis if events or circumstances indicate that the fair value of the asset has decreased below its carrying value.
Revenue recognition — Revenues are recognized when services are performed, except for revenues earned under turnkey contract drilling arrangements which are recognized using the completed contract method of accounting, as described below. We follow the percentage-of-completion method of accounting for footage contract drilling arrangements. Under the percentage-of-completion method, management estimates are relied upon in the determination of the total estimated expenses to be incurred drilling the well. Due to the nature of turnkey contract drilling arrangements and risks therein, we follow the completed contract method of accounting for such arrangements. Under this method, revenues and expenses related to a well in progress are deferred and recognized in the period the well is completed. Provisions for losses on incomplete or in-process wells are made when estimated total expenses are expected to exceed estimated total revenues. We recognize reimbursements received from third parties for out-of-pocket expenses incurred as revenues and account for out-of-pocket expenses as direct costs.
Use of estimates — The preparation of financial statements in conformity with accounting principles generally accepted in the United States of America requires management to make certain estimates and assumptions that affect the reported amounts of assets and liabilities and disclosures of contingent assets and liabilities at the date of the financial statements and the reported amounts of revenues and expenses during the reporting period. Actual results could differ from such estimates.
Key estimates used by management include:
| | |
| | • | allowance for doubtful accounts, |
| |
| | • | depreciation and depletion, |
| |
| | • | asset impairment, |
| |
| | • | reserves for self-insured levels of insurance coverages, and |
| |
| | • | fair values of assets and liabilities assumed in acquisitions. |
For additional information on our accounting policies, see Note 1 of Notes to Consolidated Financial Statements included as a part of Item 8 of this Report.
21
Liquidity and Capital Resources
As of December 31, 2007, we had working capital of $228 million including cash and cash equivalents of $17.4 million. For 2007, our sources of cash flow included:
| | |
| | • | $812 million from operating activities, |
| |
| | • | $34.2 million in proceeds from the disposal of property and equipment, and |
| |
| | • | $3.2 million from the exercise of stock options and related tax benefits associated with stock-based compensation. |
During 2007, we used $70.9 million to repurchase shares of our common stock, $68.6 million to pay dividends on our common stock, $70.0 million to repay borrowings under our line of credit, $29.0 million to acquire three electric land-based drilling rigs and $608 million:
| | |
| | • | to make capital expenditures for the betterment and refurbishment of our drilling rigs, |
| |
| | • | to acquire and procure drilling equipment and facilities to support our drilling operations, |
| |
| | • | to fund capital expenditures for our pressure pumping and drilling and completion fluids divisions, and |
| |
| | • | to fund leasehold acquisition and exploration and development of oil and natural gas properties. |
As of December 31, 2007, we had $50.0 million in borrowings outstanding under our $375 million revolving line of credit and $59.4 million in outstanding letters of credit such that we had available borrowing capacity of approximately $266 million at December 31, 2007.
We paid cash dividends during the year ended December 31, 2007 as follows:
| | | | | | | | | |
| | | Per Share | | | Total | |
| | | | | | (In thousands) | |
| |
| Paid on March 30, 2007 | | $ | 0.08 | | | $ | 12,527 | |
| Paid on June 29, 2007 | | | 0.12 | | | | 18,860 | |
| Paid on September 28, 2007 | | | 0.12 | | | | 18,690 | |
| Paid on December 28, 2007 | | | 0.12 | | | | 18,484 | |
| | | | | | | | | |
| Total cash dividends declared and paid | | $ | 0.44 | | | $ | 68,561 | |
| | | | | | | | | |
On February 13, 2008, our Board of Directors approved a cash dividend on our common stock in the amount of $0.12 per share to be paid on March 28, 2008 to holders of record as of March 12, 2008. The amount and timing of all future dividend payments, if any, is subject to the discretion of the Board of Directors and will depend upon business conditions, results of operations, financial condition, terms of our credit facilities and other factors.
On August 1, 2007, our Board of Directors approved a stock buyback program (“2007 Program”), authorizing purchases of up to $250 million of our common stock in open market or privately negotiated transactions. During the year ended December 31, 2007, we purchased 3,308,850 shares of our common stock under the 2007 Program at a cost of approximately $70.4 million. As of December 31, 2007, we are authorized to purchase approximately $180 million of our outstanding common stock under the 2007 Program.
We believe that the current level of cash and short-term investments, together with cash generated from operations, should be sufficient to meet our capital needs. From time to time, acquisition opportunities are evaluated. The timing, size or success of any acquisition and the associated capital commitments are unpredictable. Should opportunities for growth requiring capital arise, we believe we would be able to satisfy these needs through a combination of working capital, cash generated from operations, our existing credit facility and additional debt or equity financing. However, there can be no assurance that such capital would be available.
22
Contractual Obligations
The following table presents information with respect to our contractual obligations as of December 31, 2007 (dollars in thousands):
| | | | | | | | | | | | | | | | | | | | | |
| | | Payments Due by Period | |
| | | | | | Less Than 1
| | | | | | | | | More Than 5
| |
| | | Total | | | Year | | | 1-3 Years | | | 3-5 Years | | | Years | |
| |
| Borrowings under line of credit(1) | | $ | 50,000 | | | $ | — | | | $ | 50,000 | | | $ | — | | | $ | — | |
| Commitments to purchase equipment(2) | | | 82,998 | | | | 82,998 | | | | — | | | | — | | | | — | |
| | | | | | | | | | | | | | | | | | | | | |
| | | $ | 132,998 | | | $ | 82,998 | | | $ | 50,000 | | | $ | — | | | $ | — | |
| | | | | | | | | | | | | | | | | | | | | |
| | |
| (1) | | Our line of credit is a revolving line of credit that matures on December 16, 2009. So long as we are in compliance with our obligations under the credit agreement, no principal repayments are required until maturity. |
| |
| (2) | | Represents non-cancelable commitments to purchase equipment to be delivered throughout 2008. |
Off-Balance Sheet Arrangements
We had no off-balance sheet arrangements at December 31, 2007.
Results of Operations
Comparison of the years ended December 31, 2007 and 2006
The following tables summarize operations by business segment for the years ended December 31, 2007 and 2006:
| | | | | | | | | | | | | |
| | | Year Ended December 31, | |
Contract Drilling | | 2007 | | | 2006 | | | % Change | |
| | | (Dollars in thousands) | |
| |
| Revenues | | $ | 1,741,647 | | | $ | 2,169,370 | | | | (19.7 | )% |
| Direct operating costs | | $ | 963,150 | | | $ | 1,002,001 | | | | (3.9 | )% |
| Selling, general and administrative | | $ | 5,893 | | | $ | 7,313 | | | | (19.4 | )% |
| Depreciation | | $ | 213,812 | | | $ | 168,607 | | | | 26.8 | % |
| Operating income | | $ | 558,792 | | | $ | 991,449 | | | | (43.6 | )% |
| Operating days | | | 89,095 | | | | 108,192 | | | | (17.7 | )% |
| Average revenue per operating day | | $ | 19.55 | | | $ | 20.05 | | | | (2.5 | )% |
| Average direct operating costs per operating day | | $ | 10.81 | | | $ | 9.26 | | | | 16.7 | % |
| Average rigs operating | | | 244 | | | | 296 | | | | (17.6 | )% |
| Capital expenditures | | $ | 539,506 | | | $ | 531,087 | | | | 1.6 | % |
The demand for our contract drilling services is impacted by the market price of oil and, to a larger extent, natural gas. However, the reactivation and construction of new land drilling rigs in the United States has resulted in excess capacity compared to recent demand. Additionally, drilling activity in Canada has decreased significantly. As a result, our average rigs operating declined to 244 in 2007 from 296 in 2006. The average market price of natural gas for each of the fiscal quarters and full years in 2007 and 2006 follow:
| | | | | | | | | | | | | | | | | | | | | |
| | | 1st Quarter | | | 2nd Quarter | | | 3rd Quarter | | | 4th Quarter | | | Year | |
| |
2007: | | | | | | | | | | | | | | | | | | | | |
| Average natural gas price(1) | | $ | 7.44 | | | $ | 7.76 | | | $ | 6.35 | | | $ | 7.19 | | | $ | 7.18 | |
2006: | | | | | | | | | | | | | | | | | | | | |
| Average natural gas price(1) | | $ | 7.93 | | | $ | 6.74 | | | $ | 6.26 | | | $ | 6.87 | | | $ | 6.94 | |
23
| | |
| (1) | | The average natural gas price above represents the Henry Hub Spot price as reported by the United States Energy Information Administration. |
Revenues in 2007 decreased as compared to 2006 as a result of decreases in the number of operating days and in the average revenues per operating day. Direct operating costs in 2007 decreased as compared to 2006 as a result of the decreased number of operating days, largely offset by an increase in the average direct operating costs per operating day. The increase in average direct operating costs per day resulted primarily from increased compensation costs and an increase in the cost of maintenance for our drilling rigs. Operating days, average rigs operating and average revenue per operating day decreased in 2007 as a result of decreased demand for our contract drilling services resulting from the excess capacity discussed above. Selling, general and administrative expense decreased primarily as a result of the transfer of certain administrative staff to our corporate segment. Significant capital expenditures have been incurred in both 2007 and 2006 to activate additional drilling rigs, to modify and upgrade our drilling rigs and to acquire additional related equipment such as drill pipe, drill collars, engines, fluid circulating systems, rig hoisting systems and safety enhancement equipment. The increase in depreciation expense is a result of the capital expenditures discussed above.
| | | | | | | | | | | | | |
| | | Year Ended December 31, | |
Pressure Pumping | | 2007 | | | 2006 | | | % Change | |
| | | (Dollars in thousands) | |
| |
| Revenues | | $ | 202,812 | | | $ | 145,671 | | | | 39.2 | % |
| Direct operating costs | | $ | 105,273 | | | $ | 77,755 | | | | 35.4 | % |
| Selling, general and administrative | | $ | 18,971 | | | $ | 13,185 | | | | 43.9 | % |
| Depreciation | | $ | 14,311 | | | $ | 9,896 | | | | 44.6 | % |
| Operating income | | $ | 64,257 | | | $ | 44,835 | | | | 43.3 | % |
| Total jobs | | | 14,094 | | | | 11,650 | | | | 21.0 | % |
| Average revenue per job | | $ | 14.39 | | | $ | 12.50 | | | | 15.1 | % |
| Average direct operating costs per job | | $ | 7.47 | | | $ | 6.67 | | | | 12.0 | % |
| Capital expenditures | | $ | 47,582 | | | $ | 41,262 | | | | 15.3 | % |
Revenues and direct operating costs increased as a result of the increased number of jobs, as well as an increase in the average revenue and average direct operating costs per job. The increase in jobs was attributable to increased demand for our services and increased operating capacity. Increased average revenue per job was due to increased pricing for our services and an increase in the number of larger jobs being driven by demand for services associated with unconventional reservoirs in the Appalachian basin. Average direct operating costs per job increased as a result of increases in compensation, maintenance and the cost of materials used in our operations, as well as an increase in the number of larger jobs. Selling, general and administrative expense increased primarily as a result of expenses to support the expanding operations of the pressure pumping segment. Significant capital expenditures have been incurred in both 2007 and 2006 to add capacity, expand our areas of operation and modify and upgrade existing equipment. The increase in depreciation expense is a result of the capital expenditures discussed above.
| | | | | | | | | | | | | |
| | | Year Ended December 31, | |
Drilling and Completion Fluids | | 2007 | | | 2006 | | | % Change | |
| | | (Dollars in thousands) | |
| |
| Revenues | | $ | 128,098 | | | $ | 192,358 | | | | (33.4 | )% |
| Direct operating costs | | $ | 108,752 | | | $ | 150,372 | | | | (27.7 | )% |
| Selling, general and administrative | | $ | 9,958 | | | $ | 10,521 | | | | (5.4 | )% |
| Depreciation | | $ | 2,860 | | | $ | 2,706 | | | | 5.7 | % |
| Operating income | | $ | 6,528 | | | $ | 28,759 | | | | (77.3 | )% |
| Capital expenditures | | $ | 3,082 | | | $ | 4,222 | | | | (27.0 | )% |
Revenues and direct operating costs decreased as a result of a decrease in the number of large jobs offshore in the Gulf of Mexico caused primarily by a slowdown in drilling activity during 2007 as compared to 2006.
24
| | | | | | | | | | | | | |
| | | Year Ended December 31, | |
Oil and Natural Gas Production and Exploration | | 2007 | | | 2006 | | | % Change | |
| | | (Dollars in thousands, except commodity prices) | |
| |
| Revenues | | $ | 41,637 | | | $ | 39,187 | | | | 6.3 | % |
| Direct operating costs | | $ | 10,864 | | | $ | 13,374 | | | | (18.8 | )% |
| Selling, general and administrative | | $ | 2,365 | | | $ | 2,785 | | | | (15.1 | )% |
| Depreciation, depletion and impairment | | $ | 17,410 | | | $ | 14,368 | | | | 21.2 | % |
| Operating income | | $ | 10,998 | | | $ | 8,660 | | | | 27.0 | % |
| Capital expenditures | | $ | 17,516 | | | $ | 21,198 | | | | (17.4 | )% |
| Average net daily oil production (Bbls) | | | 971 | | | | 983 | | | | (1.2 | )% |
| Average net daily gas production (Mcf) | | | 4,996 | | | | 5,143 | | | | (2.9 | )% |
| Average oil sales price (per Bbl) | | $ | 68.82 | | | $ | 63.83 | | | | 7.8 | % |
| Average gas sales price (per Mcf) | | $ | 7.37 | | | $ | 6.82 | | | | 8.1 | % |
Revenues increased due to an increase in the average sales price of both oil and natural gas in 2007 compared to 2006. Average net daily oil and natural gas production decreased in 2007 primarily due to the sale of certain properties in the first half of 2007. The decrease in direct operating costs is primarily due to a decrease of approximately $3.0 million in costs associated with the abandonment of exploratory wells in 2007 compared to 2006. Selling, general and administrative expenses decreased in 2007 primarily due to the transfer in the fourth quarter of the operating responsibilities associated with oil and natural gas wells resulting in reduced headcount in our oil and natural gas production and exploration segment. Depreciation, depletion and impairment expense in 2007 includes approximately $3.9 million incurred to impair certain oil and natural gas properties compared to approximately $5.0 million incurred to impair certain oil and natural gas properties in 2006. Depletion expense increased approximately $4.7 million primarily due to the completion of new wells in 2007.
| | | | | | | | | | | | | |
| | | Year Ended December 31, | |
Corporate and Other | | 2007 | | | 2006 | | | % Change | |
| | | (Dollars in thousands) | |
| |
| Selling, general and administrative | | $ | 27,436 | | | $ | 21,261 | | | | 29.0 | % |
| Depreciation | | $ | 813 | | | $ | 793 | | | | 2.5 | % |
| Other operating expenses | | $ | 2,550 | | | $ | 5,585 | | | | (54.3 | )% |
| Embezzlement costs (recoveries) | | $ | (43,955 | ) | | $ | 3,081 | | | | N/A | % |
| (Gain) loss on disposal of assets | | $ | (16,545 | ) | | $ | 3,819 | | | | N/A | % |
| Interest income | | $ | 2,355 | | | $ | 5,925 | | | | (60.3 | )% |
| Interest expense | | $ | 2,187 | | | $ | 1,602 | | | | 36.5 | % |
| Other income | | $ | 363 | | | $ | 347 | | | | 4.6 | % |
| Capital expenditures | | $ | — | | | $ | 150 | | | | (100.0 | )% |
Selling, general and administrative expense increased primarily as a result of compensation expense related to transfers of certain administrative staff from our drilling segment to our corporate segment as well as increases in stock-based compensation expense. Other operating expenses decreased due to a decrease in bad debt expense of $2.9 million. In 2007, we sold certain oil and natural gas properties resulting in a gain of $21.6 million This gain was reduced by approximately $5.1 million in losses associated with the disposal of other assets. Gains and losses on the disposal of assets are considered as part of our corporate activities due to the fact that such transactions relate to decisions of the executive management group regarding corporate strategy. Embezzlement costs (recoveries) in 2007 includes an expected recovery of $44.5 million reduced by professional fees incurred as a result of the embezzlement. Embezzlement costs (recoveries) in 2006 include professional fees incurred as a result of the embezzlement reduced by insurance proceeds of $2.3 million.
25
Comparison of the years ended December 31, 2006 and 2005
The following tables summarize operations by business segment for the years ended December 31, 2006 and 2005:
| | | | | | | | | | | | | |
| | | Year Ended December 31, | |
Contract Drilling | | 2006 | | | 2005 | | | % Change | |
| | | (Dollars in thousands) | |
| |
| Revenues | | $ | 2,169,370 | | | $ | 1,485,684 | | | | 46.0 | % |
| Direct operating costs | | $ | 1,002,001 | | | $ | 776,313 | | | | 29.1 | % |
| Selling, general and administrative | | $ | 7,313 | | | $ | 5,069 | | | | 44.3 | % |
| Depreciation | | $ | 168,607 | | | $ | 131,740 | | | | 28.0 | % |
| Operating income | | $ | 991,449 | | | $ | 572,562 | | | | 73.2 | % |
| Operating days | | | 108,192 | | | | 100,591 | | | | 7.6 | % |
| Average revenue per operating day | | $ | 20.05 | | | $ | 14.77 | | | | 35.7 | % |
| Average direct operating costs per operating day | | $ | 9.26 | | | $ | 7.72 | | | | 19.9 | % |
| Average rigs operating | | | 296 | | | | 276 | | | | 7.2 | % |
| Capital expenditures | | $ | 531,087 | | | $ | 329,073 | | | | 61.4 | % |
Our average number of rigs operating increased to 296 in 2006 from 276 in 2005. The average market price of natural gas for each of the fiscal quarters and full years in 2006 and 2005 follow:
| | | | | | | | | | | | | | | | | | | | | |
| | | 1st Quarter | | | 2nd Quarter | | | 3rd Quarter | | | 4th Quarter | | | Year | |
| |
2006: | | | | | | | | | | | | | | | | | | | | |
| Average natural gas price(1) | | $ | 7.93 | | | $ | 6.74 | | | $ | 6.26 | | | $ | 6.87 | | | $ | 6.94 | |
2005: | | | | | | | | | | | | | | | | | | | | |
| Average natural gas price(1) | | $ | 6.62 | | | $ | 7.14 | | | $ | 9.82 | | | $ | 12.64 | | | $ | 8.98 | |
| | |
| (1) | | The average natural gas price above represents the Henry Hub Spot price as reported by the United States Energy Information Administration. |
26
Revenues and direct operating costs increased as a result of the increased number of operating days, as well as an increase in the average revenue and average direct operating cost per operating day. Operating days and average rigs operating increased as a result of increased demand for our contract drilling services and the increase in the number of marketable rigs in our fleet due to our rig activation program. Average revenue per operating day increased as a result of increased demand and pricing for our drilling services. Average direct operating costs per operating day increased primarily as a result of increased compensation costs and an increase in the cost of maintenance for our rigs. Significant capital expenditures were incurred to activate additional drilling rigs, to modify and upgrade our drilling rigs and to acquire additional related equipment such as drill pipe, drill collars, engines, fluid circulating systems, rig hoisting systems and safety enhancement equipment. The increase in depreciation expense was a result of the capital expenditures and acquisitions.
| | | | | | | | | | | | | |
| | | Year Ended December 31, | |
Pressure Pumping | | 2006 | | | 2005 | | | % Change | |
| | | (Dollars in thousands) | |
| |
| Revenues | | $ | 145,671 | | | $ | 93,144 | | | | 56.4 | % |
| Direct operating costs | | $ | 77,755 | | | $ | 54,956 | | | | 41.5 | % |
| Selling, general and administrative | | $ | 13,185 | | | $ | 9,430 | | | | 39.8 | % |
| Depreciation | | $ | 9,896 | | | $ | 7,094 | | | | 39.5 | % |
| Operating income | | $ | 44,835 | | | $ | 21,664 | | | | 107.0 | % |
| Total jobs | | | 11,650 | | | | 9,615 | | | | 21.2 | % |
| Average revenue per job | | $ | 12.50 | | | $ | 9.69 | | | | 29.0 | % |
| Average direct operating costs per job | | $ | 6.67 | | | $ | 5.72 | | | | 16.6 | % |
| Capital expenditures | | $ | 41,262 | | | $ | 25,508 | | | | 61.8 | % |
Revenues and direct operating costs increased as a result of the increased number of jobs, as well as an increase in the average revenue and average direct operating cost per job. The increase in jobs was attributable to increased demand for our services and increased operating capacity which has been added. Increased average revenue per job was due to increased pricing for our services and an increase in the number of larger jobs. Average direct operating costs per job increased as a result of increases in compensation and the cost of materials used in our operations, as well as an increase in the number of larger jobs. Selling, general and administrative expense increased as a result of additional expenses to support the expanded operations of the pressure pumping segment. Significant capital expenditures were incurred to add capacity and modify and upgrade existing equipment. The increase in depreciation expense was a result of the capital expenditures discussed above.
| | | | | | | | | | | | | |
| | | Year Ended December 31, | |
Drilling and Completion Fluids | | 2006 | | | 2005 | | | % Change | |
| | | (Dollars in thousands) | |
| |
| Revenues | | $ | 192,358 | | | $ | 122,011 | | | | 57.7 | % |
| Direct operating costs | | $ | 150,372 | | | $ | 98,530 | | | | 52.6 | % |
| Selling, general and administrative | | $ | 10,521 | | | $ | 8,912 | | | | 18.1 | % |
| Depreciation | | $ | 2,706 | | | $ | 2,368 | | | | 14.3 | % |
| Operating income | | $ | 28,759 | | | $ | 12,201 | | | | 135.7 | % |
| Capital expenditures | | $ | 4,222 | | | $ | 3,042 | | | | 38.8 | % |
27
Revenues and direct operating costs increased primarily as a result of an increase in large jobs offshore in the Gulf of Mexico during 2006.
| | | | | | | | | | | | | |
| | | Year Ended December 31, | |
Oil and Natural Gas Production and Exploration | | 2006 | | | 2005 | | | % Change | |
| | | (Dollars in thousands, except commodity prices) | |
| |
| Revenues | | $ | 39,187 | | | $ | 39,616 | | | | (1.1 | )% |
| Direct operating costs | | $ | 13,374 | | | $ | 9,566 | | | | 39.8 | % |
| Selling, general and administrative | | $ | 2,785 | | | $ | 2,189 | | | | 27.2 | % |
| Depreciation, depletion and impairment | | $ | 14,368 | | | $ | 14,456 | | | | (0.6 | )% |
| Operating income | | $ | 8,660 | | | $ | 13,405 | | | | (35.4 | )% |
| Capital expenditures | | $ | 21,198 | | | $ | 17,163 | | | | 23.5 | % |
| Average net daily oil production (Bbls) | | | 983 | | | | 860 | | | | 14.3 | % |
| Average net daily gas production (Mcf) | | | 5,143 | | | | 7,016 | | | | (26.7 | )% |
| Average oil sales price (per Bbl) | | $ | 63.83 | | | $ | 54.30 | | | | 17.6 | % |
| Average gas sales price (per Mcf) | | $ | 6.82 | | | $ | 7.64 | | | | (10.7 | )% |
Direct operating costs increased primarily due to $4.2 million in costs associated with the abandonment of exploratory wells. Depreciation, depletion and impairment expense includes $5.0 million and $4.4 million incurred during 2006 and 2005, respectively, to reflect the impairment of certain oil and natural gas properties. Average net daily oil production increased due to the completion of new wells in 2006. Average net daily natural gas production decreased as a result of production declines and the sale of certain natural gas properties.
| | | | | | | | | | | | | |
| | | Year Ended December 31, | |
Corporate and Other | | 2006 | | | 2005 | | | % Change | |
| | | (Dollars in thousands) | |
| |
| Selling, general and administrative | | $ | 21,261 | | | $ | 13,510 | | | | 57.4 | % |
| Depreciation | | $ | 793 | | | $ | 735 | | | | 7.9 | % |
| Other operating expenses | | $ | 5,585 | | | $ | 5,479 | | | | 1.9 | % |
| Embezzlement costs | | $ | 3,081 | | | $ | 20,043 | | | | (84.6 | )% |
| (Gain) loss on disposal of assets | | $ | 3,819 | | | $ | (1,231 | ) | | | N/A | % |
| Interest income | | $ | 5,925 | | | $ | 3,551 | | | | 66.9 | % |
| Interest expense | | $ | 1,602 | | | $ | 516 | | | | 210.5 | % |
| Other income | | $ | 347 | | | $ | 428 | | | | (18.9 | )% |
| Capital expenditures | | $ | 150 | | | $ | 5,308 | | | | (97.2 | )% |
Selling, general and administrative expense increased primarily as a result of an increase of $7.8 million in stock-based compensation expense which was impacted by the adoption of a new accounting standard in 2006 requiring the expensing of stock options. Other operating expenses include bad debt expense of $5.4 million and $1.2 million in 2006 and 2005, respectively. Embezzlement costs in 2005 includes payments made to or for the benefit of Jonathan D. Nelson, our former CFO, for assets and services that were not received by the Company and in 2006 includes continuing professional fees incurred as a result of the embezzlement, net of insurance proceeds of $2.3 million received in connection with the loss. Interest expense in 2006 increased due to borrowings under our line of credit during 2006.
Income Taxes
| | | | | | | | | | | | | |
| | | Year Ended December 31, | |
| | | 2007 | | | 2006 | | | 2005 | |
| | | (Dollars in thousands) | |
| |
| Income before income tax | | $ | 670,807 | | | $ | 1,043,834 | | | $ | 584,759 | |
| Income tax expense | | | 232,168 | | | | 371,267 | | | | 212,019 | |
| Effective tax rate | | | 34.6 | % | | | 35.6 | % | | | 36.3 | % |
28
The effective tax rate is a result of a Federal rate of 35.0% adjusted as follows:
| | | | | | | | | | | | | |
| | | 2007 | | | 2006 | | | 2005 | |
| |
| Statutory tax rate | | | 35.0 | % | | | 35.0 | % | | | 35.0 | % |
| State income taxes | | | 1.4 | | | | 1.4 | | | | 1.8 | |
| Permanent differences | | | (1.6 | ) | | | (0.8 | ) | | | (0.6 | ) |
| Other, net | | | (0.2 | ) | | | 0.0 | | | | 0.1 | |
| | | | | | | | | | | | | |
| Effective tax rate | | | 34.6 | % | | | 35.6 | % | | | 36.3 | % |
| | | | | | | | | | | | | |
The permanent differences indicated above are largely attributable to the Domestic Production Activities Deduction. The deduction was enacted as part of the American Jobs Creation Act of 2004 effective for taxable years after December 31, 2004. The act allows a deduction of 3% in 2005 and 2006, 6% in 2007, 2008 and 2009, and 9% in 2010 and after on the lesser of qualified production activities income or taxable income.
For tax purposes, we have Federal net operating loss carryforwards of approximately $374,000 available at December 31, 2007. We have alternative minimum tax credit carryforwards of approximately $118,000 available at December 31, 2007. The net operating loss carryforwards, if unused, are scheduled to expire in 2019. The alternative minimum tax credit may be carried forward indefinitely.
We record deferred Federal income taxes based primarily on the relationship between the amount of our unused Federal net operating loss carryforwards and the temporary differences between the book basis and tax basis in our assets. Deferred tax assets and liabilities are measured using enacted tax rates expected to apply to taxable income in the year in which those temporary differences are expected to be settled. As a result of fully recognizing the benefit of our deferred income taxes, we incur deferred income tax expense as these benefits are utilized. We incurred a deferred tax expense of approximately $38.3 million in 2007, a deferred tax benefit of approximately $4.1 million in 2006 and a deferred tax expense of approximately $17.1 million in 2005.
Volatility of Oil and Natural Gas Prices
Our revenue, profitability, and rate of growth are substantially dependent upon prevailing prices for natural gas and, to a lesser extent, oil. For many years, oil and natural gas prices and markets have been volatile. Prices are affected by market supply and demand factors as well as international military, political and economic conditions, and the ability of OPEC to set and maintain production and price targets. All of these factors are beyond our control. During 2006, the average market price of natural gas retreated from record highs that were set in 2005. The price dropped from an average of $8.98 per Mcf in 2005 to an average of $6.94 per Mcf in 2006 and an average of $7.18 per Mcf in 2007. This resulted in our customers moderating their increase in drilling activities in 2007. This moderation combined with the reactivation and construction of new land drilling rigs in the United States has resulted in excess capacity compared to recent demand. Additionally, drilling activity in Canada has slowed significantly. As a result of these factors, our average rigs operating declined to 244 in 2007 compared to 296 in 2006. We expect oil and natural gas prices to continue to be volatile and to affect our financial condition, operations and ability to access sources of capital. A significant decrease in market prices for natural gas could result in a material decrease in demand for drilling rigs and adversely affect our operating results.
The North American land drilling industry has experienced many downturns in demand over the last decade. During these periods, there have been substantially more drilling rigs available than necessary to meet demand. As a result, drilling contractors have had difficulty sustaining profit margins during the downturn periods.
Impact of Inflation
Inflation has not had a significant impact on our operations during the three years in the period ended December 31, 2007. We believe that inflation will not have a significant near-term impact on our financial position.
Recently Issued Accounting Standards
In September 2006, the FASB issued Statement No. 157,Fair Value Measurements(“FAS 157”). FAS 157 defines fair value, establishes a framework for measuring fair value in generally accepted accounting principles, and
29
expands disclosures about fair value measurement. FAS 157 is effective for financial statements issued for fiscal years beginning after November 15, 2007 and interim periods within those fiscal years. FAS 157 will be effective for us beginning in the quarter ending March 31, 2008. The application of FAS 157 is not expected to have a material impact to us.
In February 2007, the FASB issued Statement No. 159,The Fair Value Option for Financial Assets and Financial Liabilities Including an Amendment of FASB Statement No. 115(“FAS 159”). FAS 159 permits entities to choose to measure many financial instruments and certain other items at fair value. FAS 159 is effective as of the beginning of an entity’s first fiscal year that begins after November 15, 2007 and will be effective for us beginning in the quarter ending March 31, 2008. The application of FAS 159 is not expected to have a material impact to us.
In December 2007, the FASB issued Statement No. 141(R),Business Combinations(“FAS 141(R)”) and Statement No. 160,Noncontrolling Interests in Consolidated Financial Statements, an amendment of ARB No. 51(“FAS 160”). FAS 141(R) is a revision of Statement No. 141,Business Combinations, and calls for significant changes from current practice in accounting for business combinations. FAS 141(R) is effective for business combinations for which the acquisition date is on or after the beginning of the first annual reporting period beginning on or after December 15, 2008. FAS 160 amends ARB 51 to establish accounting and reporting standards for the noncontrolling interest in a subsidiary and for the deconsolidation of a subsidiary. FAS 160 is effective for fiscal years beginning on or after December 15, 2008. Both FAS 141(R) and FAS 160 will be effective for us beginning the quarter ending March 31, 2009. The application of FAS 141(R) and FAS 160 are not expected to have a material impact to us.
| |
| Item 7A. | Quantitative and Qualitative Disclosures About Market Risk |
We currently have exposure to interest rate market risk associated with borrowings under our credit facility. The revolving credit facility calls for periodic interest payments at a floating rate ranging from LIBOR plus 0.625% to 1.0% or at the prime rate. The applicable rate above LIBOR is based upon our debt to capitalization ratio. A 1% increase (100 basis points) in LIBOR and the prime rate would result in additional annual interest expense of approximately $500,000 based upon the level of borrowings we had outstanding at December 31, 2007.
We conduct some business in Canadian dollars through our Canadian land-based drilling operations. The exchange rate between Canadian dollars and U.S. dollars has fluctuated during the last several years. If the value of the Canadian dollar against the U.S. dollar weakens, revenues and earnings of our Canadian operations will be reduced and the value of our Canadian net assets will decline when they are translated to U.S. dollars.
| |
| Item 8. | Financial Statements and Supplementary Data. |
Financial Statements are filed as a part of this Report at the end of Part IV hereof beginning atpage F-1, Index to Consolidated Financial Statements, and are incorporated herein by this reference.
| |
| Item 9. | Changes in and Disagreements with Accountants on Accounting and Financial Disclosure. |
None.
| |
| Item 9A. | Controls and Procedures. |
Disclosure Controls and Procedures:
Under the supervision and with the participation of our management, including our Chief Executive Officer (CEO) and Chief Financial Officer (CFO), we conducted an evaluation of the effectiveness of our disclosure controls and procedures, as such term is defined inRules 13a-15(e) and15d-15(e) promulgated under the Securities and Exchange Act of 1934, as amended (the Exchange Act), as of the end of the period covered by this Annual Report onForm 10-K. Based on this evaluation, our CEO and CFO concluded that, as of December 31, 2007, our disclosure controls and procedures were effective to ensure that information required to be disclosed by us in reports that we file or submit under the Exchange Act is recorded, processed, summarized and reported within the time periods specified in SEC rules and forms and is accumulated and reported to our management, including our CEO and CFO, as appropriate to allow timely decisions regarding required disclosure.
30
Management’s Report on Internal Control over Financial Reporting:
Our management is responsible for establishing and maintaining adequate internal control over financial reporting, as defined in Exchange ActRule 13a-15(f). Under the supervision and with the participation of our management, including our CEO and CFO, we carried out an evaluation of the effectiveness of our internal control over financial reporting as of December 31, 2007, based on theInternal Control-Integrated Frameworkissued by the Committee of Sponsoring Organizations of the Treadway Commission. Based on this evaluation, our management has concluded that our internal control over financial reporting was effective as of December 31, 2007.
The effectiveness of our internal control over financial reporting as of December 31, 2007 has been audited by PricewaterhouseCoopers LLP, an independent registered public accounting firm, as stated in their report which appears onpage F-2 of this Report and is incorporated by reference into Item 8 of this Annual Report onForm 10-K.
Changes in Internal Control over Financial Reporting:
There have been no changes in our internal control over financial reporting during the most recently completed fiscal quarter that have materially affected, or are reasonably likely to materially affect, our internal control over financial reporting.
| |
| Item 9B. | Other Information |
None.
31
PART III
The information required by Part III is omitted from this Report because we will file a definitive proxy statement pursuant to Regulation 14A of the Securities Exchange Act of 1934 no later than 120 days after the end of the fiscal year covered by this Report and certain information included therein is incorporated herein by reference.
| |
| Item 10. | Directors, Executive Officers and Corporate Governance. |
The information required by this Item is incorporated herein by reference to the Proxy Statement.
| |
| Item 11. | Executive Compensation. |
The information required by this Item is incorporated herein by reference to the Proxy Statement.
| |
| Item 12. | Security Ownership of Certain Beneficial Owners and Management and Related Stockholder Matters. |
The information required by this Item is incorporated herein by reference to the Proxy Statement.
| |
| Item 13. | Certain Relationships and Related Transactions, and Director Independence. |
The information required by this Item is incorporated herein by reference to the Proxy Statement.
| |
| Item 14. | Principal Accountant Fees and Services. |
The information required by this Item is incorporated herein by reference to the Proxy Statement.
32
PART IV
| |
| Item 15. | Exhibits and Financial Statement Schedule. |
(a)(1)Financial Statements
See Index to Consolidated Financial Statements onpage F-1 of this Report.
(a)(2)Financial Statement Schedule
Schedule II — Valuation and qualifying accounts is filed herewith onpage S-1.
All other financial statement schedules have been omitted because they are not applicable or the information required therein is included elsewhere in the financial statements or notes thereto.
(a)(3)Exhibits
The following exhibits are filed herewith or incorporated by reference herein.
| | | | | |
| | 3 | .1 | | Restated Certificate of Incorporation, as amended (filed August 9, 2004 as Exhibit 3.1 to the Company’s Quarterly Report onForm 10-Q for the quarterly period ended June 30, 2004 and incorporated herein by reference). |
| | 3 | .2 | | Amendment to Restated Certificate of Incorporation, as amended (filed August 9, 2004 as Exhibit 3.2 to the Company’s Quarterly Report onForm 10-Q for the quarterly period ended June 30, 2004 and incorporated herein by reference). |
| | 3 | .3 | | Second Amended and Restated Bylaws (filed August 6, 2007 as Exhibit 3.3 to the Company’s Quarterly Report onForm 10-Q for the quarterly period ended June 30, 2007 and incorporated herein by reference). |
| | 4 | .1 | | Rights Agreement dated January 2, 1997, between Patterson Energy, Inc. and Continental Stock Transfer & Trust Company (filed January 14, 1997 as Exhibit 2 to the Company’s Registration Statement onForm 8-A and incorporated herein by reference). |
| | 4 | .2 | | Amendment to Rights Agreement dated as of October 23, 2001 (filed October 31, 2001 as Exhibit 3.4 to the Company’s Quarterly Report onForm 10-Q for the quarterly period ended September 30, 2001 and incorporated herein by reference). |
| | 4 | .3 | | Restated Certificate of Incorporation, as amended (See Exhibits 3.1 and 3.2). |
| | 4 | .4 | | Registration Rights Agreement with Bear, Stearns and Co. Inc., dated March 25, 1994, as assigned by REMY Capital Partners III, L.P. (filed March 19, 2002 as Exhibit 4.3 to the Company’s Annual Report onForm 10-K for the fiscal year ended December 31, 2001 and incorporated herein by reference). |
| | 10 | .1 | | For additional material contracts, see Exhibits 4.1, 4.2 and 4.4. |
| | 10 | .2 | | Patterson-UTI Energy, Inc., 1993 Stock Incentive Plan, as amended (filed March 13, 1998 as Exhibit 10.1 to the Company’s Registration Statement onForm S-8 (FileNo. 333-47917) and incorporated herein by reference).* |
| | 10 | .3 | | Patterson-UTI Energy, Inc. Non-Employee Directors’ Stock Option Plan, as amended (filed November 4, 1997 as Exhibit 10.1 to the Company’s Registration Statement onForm S-8 (FileNo. 333-39471) and incorporated herein by reference).* |
| | 10 | .4 | | Amended and Restated Patterson-UTI Energy, Inc. 2001 Long-Term Incentive Plan (filed November 27, 2002 as Exhibit 4.4 to Post Effective Amendment No. 1 to the Company’s Registration Statement onForm S-8 (FileNo. 333-60470) and incorporated herein by reference).* |
| | 10 | .5 | | Patterson-UTI Energy, Inc. Amended and Restated 1997 Long-Term Incentive Plan (filed July 28, 2003 as Exhibit 4.7 to the Company’s Quarterly Report onForm 10-Q for the quarterly period ended June 30, 2003 and incorporated herein by reference).* |
| | 10 | .6 | | Amendment to the Patterson-UTI Energy, Inc. Amended and Restated 1997 Long-Term Incentive Plan (filed August 9, 2004 as Exhibit 10.7 to the Company’s Quarterly Report onForm 10-Q for the quarterly period ended June 30, 2004 and incorporated herein by reference).* |
| | 10 | .7 | | Amended and Restated Patterson-UTI Energy, Inc. Non-Employee Director Stock Option Plan(filed July 28, 2003 as Exhibit 4.8 to the Company’s Quarterly Report onForm 10-Q for the quarterly period ended June 30, 2003 and incorporated herein by reference).* |
33
| | | | | |
| | 10 | .8 | | Amended and Restated Patterson-UTI Energy, Inc. 1996 Employee Stock Option Plan (filed July 25, 2001 as Exhibit 4.4 to Post-Effective Amendment No. 1 to the Company’s Registration Statement onForm S-8 (FileNo. 333-60466) and incorporated herein by reference).* |
| | 10 | .9 | | Patterson-UTI Energy, Inc. 2005 Long-Term Incentive Plan, including Form of Executive Officer Restricted Stock Award Agreement, Form of Executive Officer Stock Option Agreement, Form of Non-Employee Director Restricted Stock Award Agreement and Form of Non-Employee Director Stock Option Agreement (filed June 21, 2005 as Exhibit 10.1 to the Company’s Current Report onForm 8-K, and incorporated herein by reference).* |
| | 10 | .10 | | Restricted Stock Award Agreement dated April 28, 2004 between Patterson-UTI Energy, Inc. and Mark S. Siegel (filed August 9, 2004 as Exhibit 10.1 to the Company’s Quarterly Report onForm 10-Q for the quarterly period ended June 30, 2004 and incorporated herein by reference).* |
| | 10 | .11 | | Restricted Stock Award Agreement dated April 28, 2004 between Patterson-UTI Energy, Inc. and Cloyce A. Talbott (filed August 9, 2004 as Exhibit 10.2 to the Company’s Quarterly Report onForm 10-Q for the quarterly period ended June 30, 2004 and incorporated herein by reference).* |
| | 10 | .12 | | Restricted Stock Award Agreement dated April 28, 2004 between Patterson-UTI Energy, Inc. and Kenneth N. Berns (filed August 9, 2004 as Exhibit 10.4 to the Company’s Quarterly Report onForm 10-Q for the quarterly period ended June 30, 2004 and incorporated herein by reference).* |
| | 10 | .13 | | Restricted Stock Award Agreement dated April 28, 2004 between Patterson-UTI Energy, Inc. and John E. Vollmer III (filed August 9, 2004 as Exhibit 10.6 to the Company’s Quarterly Report onForm 10-Q for the quarterly period ended June 30, 2004 and incorporated herein by reference).* |
| | 10 | .14 | | Patterson-UTI Energy, Inc. Change in Control Agreement, effective as of January 29, 2004, by and between Patterson-UTI Energy, Inc. and Mark S. Siegel (filed on February 4, 2004 as Exhibit 10.2 to the Company’s Annual Report onForm 10-K for the year ended December 31, 2003 and incorporated herein by reference).* |
| | 10 | .15 | | Employment Agreement, dated as of September 1, 2007 between Patterson-UTI Energy, Inc. and Cloyce A. Talbott (filed on September 24, 2007 as Exhibit 10.1 to the Company’s Current Report onForm 8-K, and incorporated herein by reference).* |
| | 10 | .16 | | Patterson-UTI Energy, Inc. Change in Control Agreement, effective as of January 29, 2004, by and between Patterson-UTI Energy, Inc. and Kenneth N. Berns (filed on February 4, 2004 as Exhibit 10.5 to the Company’s Annual Report onForm 10-K for the year ended December 31, 2003 and incorporated herein by reference).* |
| | 10 | .17 | | Patterson-UTI Energy, Inc. Change in Control Agreement, effective as of January 29, 2004, by and between Patterson-UTI Energy, Inc. and John E. Vollmer III (filed on February 4, 2004 as Exhibit 10.7 to the Company’s Annual Report onForm 10-K for the year ended December 31, 2003 and incorporated herein by reference).* |
| | 10 | .18 | | Form of Letter Agreement regarding termination, effective as of January 29, 2004, entered into by Patterson-UTI Energy, Inc. with each of Mark S. Siegel, Kenneth N. Berns and John E. Vollmer III (filed on February 25, 2005 as Exhibit 10.23 to the Company’s Annual Report onForm 10-K for the year ended December 31, 2004 and incorporated herein by reference).* |
| | 10 | .19 | | Form of Indemnification Agreement entered into by Patterson-UTI Energy, Inc. with each of Mark S. Siegel, Cloyce A. Talbott, Douglas J. Wall, Kenneth N. Berns, Curtis W. Huff, Terry H. Hunt, Kenneth R. Peak, Charles O. Buckner, John E. Vollmer III, William L. Moll, Jr. and Gregory W. Pipkin (filed April 28, 2004 as Exhibit 10.11 to the Company’s Annual Report onForm 10-K, as amended, for the year ended December 31, 2003 and incorporated herein by reference).* |
| | 10 | .20 | | Severance Agreement between Patterson-UTI Energy, Inc. and Douglas J. Wall, effective as of August 31, 2007 (filed September 4, 2007 as Exhibit 10.3 to the Company’s Current Report onForm 8-K and incorporated herein by reference).* |
| | 10 | .21 | | Patterson-UTI Energy, Inc. Change in Control Agreement, effective as of August 31, 2007, by and between Patterson-UTI Energy, Inc. and Douglas J. Wall (filed September 4, 2007 as Exhibit 10.2 to the Company’s Current Report onForm 8-K and incorporated herein by reference).* |
34
| | | | | |
| | 10 | .22 | | Patterson-UTI Energy, Inc. Change in Control Agreement, effective as of August 31, 2007, by and between Patterson-UTI Energy, Inc. and William L. Moll, Jr. (filed November 5, 2007 as Exhibit 10.7 to the Company’s Quarterly Report onForm 10-Q for the quarterly period ended September 30, 2007 and incorporated herein by reference).* |
| | 10 | .23 | | First Amendment to Change in Control Agreement Between Patterson-UTI Energy, Inc. and Mark S. Siegel, entered into November 1, 2007 (filed November 5, 2007 as Exhibit 10.8 to the Company’s Quarterly Report onForm 10-Q for the quarterly period ended September 30, 2007 and incorporated herein by reference).* |
| | 10 | .24 | | First Amendment to Change in Control Agreement Between Patterson-UTI Energy, Inc. and Douglas J. Wall, entered into November 1, 2007 (filed November 5, 2007 as Exhibit 10.9 to the Company’s Quarterly Report onForm 10-Q for the quarterly period ended September 30, 2007 and incorporated herein by reference).* |
| | 10 | .25 | | First Amendment to Change in Control Agreement Between Patterson-UTI Energy, Inc. and John E. Vollmer, III, entered into November 1, 2007 (filed November 5, 2007 as Exhibit 10.10 to the Company’s Quarterly Report onForm 10-Q for the quarterly period ended September 30, 2007 and incorporated herein by reference).* |
| | 10 | .26 | | First Amendment to Change in Control Agreement Between Patterson-UTI Energy, Inc. and Kenneth N. Berns, entered into November 1, 2007 (filed November 5, 2007 as Exhibit 10.11 to the Company’s Quarterly Report onForm 10-Q for the quarterly period ended September 30, 2007 and incorporated herein by reference).* |
| | 10 | .27 | | First Amendment to Change in Control Agreement Between Patterson-UTI Energy, Inc. and William L. Moll, Jr., entered into November 1, 2007 (filed November 5, 2007 as Exhibit 10.12 to the Company’s Quarterly Report onForm 10-Q for the quarterly period ended September 30, 2007 and incorporated herein by reference).* |
| | 10 | .28 | | Credit Agreement dated as of December 17, 2004 among Patterson-UTI Energy, Inc., as the Borrower, Bank of America, N.A., as administrative agent, L/C Issuer and a Lender and the other lenders and agents party thereto (filed on December 23, 2004 as Exhibit 10.1 to the Company’s Current Report onForm 8-K and incorporated herein by reference). |
| | 10 | .29 | | Commitment Increase and Joinder Agreement, dated as of August 2, 2006, by and among Patterson-UTI Energy, Inc., the guarantors party thereto, the lenders party thereto, and Bank of America, N.A. as Administrative Agent, L/C Issuer and Lender (filed August 21, 2006 as Exhibit 10.1 to the Company’s Current Report onForm 8-K and incorporated herein by reference). |
| | 10 | .30 | | Letter Agreement dated February 6, 2006 between Patterson-UTI Energy, Inc. and John E. Vollmer III (filed May 1, 2006 as Exhibit 10.25 to the Company’s Annual Report onForm 10-K, as amended, and incorporated herein by reference).* |
| | 14 | .1 | | Patterson-UTI Energy, Inc. Code of Business Conduct and Ethics for Senior Financial Executives (filed on February 4, 2004 as Exhibit 14.1 to the Company’s Annual Report onForm 10-K for the year ended December 31, 2003 and incorporated herein by reference). |
| | 21 | .1 | | Subsidiaries of the Registrant. |
| | 23 | .1 | | Consent of Independent Registered Public Accounting Firm. |
| | 31 | .1 | | Certification of Chief Executive Officer pursuant toRule 13a-14(a)/15d-14(a) of the Securities Exchange Act of 1934, as amended. |
| | 31 | .2 | | Certification of Chief Financial Officer pursuant toRule 13a-14(a)/15d-14(a) of the Securities Exchange Act of 1934, as amended. |
| | 32 | .1 | | Certification of Chief Executive Officer and Chief Financial Officer pursuant to 18 USC Section 1350, as adopted pursuant to Section 906 of the Sarbanes-Oxley Act of 2002. |
| | |
| * | | Management Contract or Compensatory Plan identified as required by Item 15(a)(3) ofForm 10-K. |
35
INDEX TO CONSOLIDATED FINANCIAL STATEMENTS
F-1
Report of Independent Registered Public Accounting Firm
To the Board of Directors and Shareholders of
Patterson-UTI Energy, Inc.:
In our opinion, the consolidated financial statements listed in the accompanying index present fairly, in all material respects, the financial position of Patterson-UTI Energy, Inc. and its subsidiaries at December 31, 2007 and 2006, and the results of their operations and their cash flows for each of the three years in the period ended December 31, 2007 in conformity with accounting principles generally accepted in the United States of America. In addition, in our opinion, the financial statement schedule listed in the index appearing under Item 15(a)(2) presents fairly, in all material respects, the information set forth therein when read in conjunction with the related consolidated financial statements. Also in our opinion, the Company maintained, in all material respects, effective internal control over financial reporting as of December 31, 2007, based on criteria established inInternal Control — Integrated Frameworkissued by the Committee of Sponsoring Organizations of the Treadway Commission (COSO). The Company’s management is responsible for these financial statements and financial statement schedule, for maintaining effective internal control over financial reporting and for its assessment of the effectiveness of internal control over financial reporting, included in Management’s Report on Internal Control over Financial Reporting appearing under Item 9A. Our responsibility is to express opinions on these financial statements, on the financial statement schedule, and on the Company’s internal control over financial reporting based on our integrated audits. We conducted our audits in accordance with the standards of the Public Company Accounting Oversight Board (United States). Those standards require that we plan and perform the audits to obtain reasonable assurance about whether the financial statements are free of material misstatement and whether effective internal control over financial reporting was maintained in all material respects. Our audits of the financial statements included examining, on a test basis, evidence supporting the amounts and disclosures in the financial statements, assessing the accounting principles used and significant estimates made by management, and evaluating the overall financial statement presentation. Our audit of internal control over financial reporting included obtaining an understanding of internal control over financial reporting, assessing the risk that a material weakness exists, and testing and evaluating the design and operating effectiveness of internal control based on the assessed risk. Our audits also included performing such other procedures as we considered necessary in the circumstances. We believe that our audits provide a reasonable basis for our opinions.
A company’s internal control over financial reporting is a process designed to provide reasonable assurance regarding the reliability of financial reporting and the preparation of financial statements for external purposes in accordance with generally accepted accounting principles. A company’s internal control over financial reporting includes those policies and procedures that (i) pertain to the maintenance of records that, in reasonable detail, accurately and fairly reflect the transactions and dispositions of the assets of the company; (ii) provide reasonable assurance that transactions are recorded as necessary to permit preparation of financial statements in accordance with generally accepted accounting principles, and that receipts and expenditures of the company are being made only in accordance with authorizations of management and directors of the company; and (iii) provide reasonable assurance regarding prevention or timely detection of unauthorized acquisition, use, or disposition of the company’s assets that could have a material effect on the financial statements.
Because of its inherent limitations, internal control over financial reporting may not prevent or detect misstatements. Also, projections of any evaluation of effectiveness to future periods are subject to the risk that controls may become inadequate because of changes in conditions, or that the degree of compliance with the policies or procedures may deteriorate.
/s/ PricewaterhouseCoopers LLP
Houston, Texas
February 18, 2008
F-2
PATTERSON-UTI ENERGY, INC. AND SUBSIDIARIES
| | | | | | | | | |
| | | December 31, | |
| | | 2007 | | | 2006 | |
| | | (In thousands,
| |
| | | except share data) | |
| |
ASSETS |
| Current assets: | | | | | | | | |
| Cash and cash equivalents | | $ | 17,434 | | | $ | 13,385 | |
| Accounts receivable, net of allowance for doubtful accounts of $10,014 and $7,484 at December 31, 2007 and 2006, respectively | | | 373,279 | | | | 484,106 | |
| Accrued Federal and state income taxes receivable | | | — | | | | 5,448 | |
| Inventory | | | 44,416 | | | | 43,947 | |
| Deferred tax assets, net | | | 35,370 | | | | 48,868 | |
| Deposits on equipment purchases | | | 1,650 | | | | 24,746 | |
| Other | | | 50,636 | | | | 32,170 | |
| | | | | | | | | |
| Total current assets | | | 522,785 | | | | 652,670 | |
| Property and equipment, net | | | 1,841,404 | | | | 1,435,804 | |
| Goodwill | | | 96,198 | | | | 99,056 | |
| Other | | | 4,812 | | | | 4,973 | |
| | | | | | | | | |
| Total assets | | $ | 2,465,199 | | | $ | 2,192,503 | |
| | | | | | | | | |
| |
LIABILITIES AND STOCKHOLDERS’ EQUITY |
| Current liabilities: | | | | | | | | |
| Accounts payable: | | | | | | | | |
| Trade | | $ | 133,330 | | | $ | 138,372 | |
| Accrued revenue distributions | | | 4,221 | | | | 15,359 | |
| Other | | | 19,365 | | | | 18,424 | |
| Accrued Federal and state income taxes payable | | | 1,458 | | | | — | |
| Accrued expenses | | | 136,834 | | | | 145,463 | |
| | | | | | | | | |
| Total current liabilities | | | 295,208 | | | | 317,618 | |
| Borrowings under line of credit | | | 50,000 | | | | 120,000 | |
| Deferred tax liabilities, net | | | 219,490 | | | | 187,960 | |
| Other | | | 4,471 | | | | 4,459 | |
| | | | | | | | | |
| Total liabilities | | | 569,169 | | | | 630,037 | |
| | | | | | | | | |
| Commitments and contingencies (see Note 9) | | | — | | | | — | |
| Stockholders’ equity: | | | | | | | | |
| Preferred stock, par value $.01; authorized 1,000,000 shares, no shares issued | | | — | | | | — | |
| Common stock, par value $.01; authorized 300,000,000 shares with 177,385,808 and 176,656,401 issued and 153,942,800 and 156,542,512 outstanding at December 31, 2007 and 2006, respectively | | | 1,773 | | | | 1,766 | |
| Additional paid-in capital | | | 703,581 | | | | 681,069 | |
| Retained earnings | | | 1,716,620 | | | | 1,346,542 | |
| Accumulated other comprehensive income | | | 20,207 | | | | 8,390 | |
| Treasury stock, at cost, 23,443,008 shares and 20,113,889 shares at December 31, 2007 and 2006, respectively | | | (546,151 | ) | | | (475,301 | ) |
| | | | | | | | | |
| Total stockholders’ equity | | | 1,896,030 | | | | 1,562,466 | |
| | | | | | | | | |
| Total liabilities and stockholders’ equity | | $ | 2,465,199 | | | $ | 2,192,503 | |
| | | | | | | | | |
The accompanying notes are an integral part of these consolidated financial statements.
F-3
PATTERSON-UTI ENERGY, INC. AND SUBSIDIARIES
| | | | | | | | | | | | | |
| | | Year Ended December 31, | |
| | | 2007 | | | 2006 | | | 2005 | |
| | | (In thousands, except per share data) | |
| |
| Operating revenues: | | | | | | | | | | | | |
| Contract drilling | | $ | 1,741,647 | | | $ | 2,169,370 | | | $ | 1,485,684 | |
| Pressure pumping | | | 202,812 | | | | 145,671 | | | | 93,144 | |
| Drilling and completion fluids | | | 128,098 | | | | 192,358 | | | | 122,011 | |
| Oil and natural gas | | | 41,637 | | | | 39,187 | | | | 39,616 | |
| | | | | | | | | | | | | |
| | | | 2,114,194 | | | | 2,546,586 | | | | 1,740,455 | |
| | | | | | | | | | | | | |
| Operating costs and expenses: | | | | | | | | | | | | |
| Contract drilling | | | 963,150 | | | | 1,002,001 | | | | 776,313 | |
| Pressure pumping | | | 105,273 | | | | 77,755 | | | | 54,956 | |
| Drilling and completion fluids | | | 108,752 | | | | 150,372 | | | | 98,530 | |
| Oil and natural gas | | | 10,864 | | | | 13,374 | | | | 9,566 | |
| Depreciation, depletion and impairment | | | 249,206 | | | | 196,370 | | | | 156,393 | |
| Selling, general and administrative | | | 64,623 | | | | 55,065 | | | | 39,110 | |
| Embezzlement costs (recoveries) | | | (43,955 | ) | | | 3,081 | | | | 20,043 | |
| (Gain) loss on disposal of assets | | | (16,545 | ) | | | 3,819 | | | | (1,231 | ) |
| Other operating expenses | | | 2,550 | | | | 5,585 | | | | 5,479 | |
| | | | | | | | | | | | | |
| | | | 1,443,918 | | | | 1,507,422 | | | | 1,159,159 | |
| | | | | | | | | | | | | |
| Operating income | | | 670,276 | | | | 1,039,164 | | | | 581,296 | |
| | | | | | | | | | | | | |
| Other income (expense): | | | | | | | | | | | | |
| Interest income | | | 2,355 | | | | 5,925 | | | | 3,551 | |
| Interest expense | | | (2,187 | ) | | | (1,602 | ) | | | (516 | ) |
| Other | | | 363 | | | | 347 | | | | 428 | |
| | | | | | | | | | | | | |
| | | | 531 | | | | 4,670 | | | | 3,463 | |
| | | | | | | | | | | | | |
| Income before income taxes and cumulative effect of change in accounting principle | | | 670,807 | | | | 1,043,834 | | | | 584,759 | |
| | | | | | | | | | | | | |
| Income tax expense (benefit): | | | | | | | | | | | | |
| Current | | | 193,897 | | | | 375,373 | | | | 194,918 | |
| Deferred | | | 38,271 | | | | (4,106 | ) | | | 17,101 | |
| | | | | | | | | | | | | |
| | | | 232,168 | | | | 371,267 | | | | 212,019 | |
| | | | | | | | | | | | | |
| Income before cumulative effect of change in accounting principle | | | 438,639 | | | | 672,567 | | | | 372,740 | |
| Cumulative effect of change in accounting principle, net of related income tax expense of $398 | | | — | | | | 687 | | | | — | |
| | | | | | | | | | | | | |
| Net income | | $ | 438,639 | | | $ | 673,254 | | | $ | 372,740 | |
| | | | | | | | | | | | | |
| Income before cumulative effect of change in accounting principle per common share: | | | | | | | | | | | | |
| Basic | | $ | 2.83 | | �� | | 4.07 | | | $ | 2.19 | |
| | | | | | | | | | | | | |
| Diluted | | $ | 2.79 | | | | 4.02 | | | $ | 2.15 | |
| | | | | | | | | | | | | |
| Net income per common share: | | | | | | | | | | | | |
| Basic | | $ | 2.83 | | | $ | 4.08 | | | $ | 2.19 | |
| | | | | | | | | | | | | |
| Diluted | | $ | 2.79 | | | $ | 4.02 | | | $ | 2.15 | |
| | | | | | | | | | | | | |
| Weighted average number of common shares outstanding: | | | | | | | | | | | | |
| Basic | | | 154,755 | | | | 165,159 | | | | 170,426 | |
| | | | | | | | | | | | | |
| Diluted | | | 156,997 | | | | 167,413 | | | | 173,767 | |
| | | | | | | | | | | | | |
| Cash dividends per common share | | $ | 0.44 | | | $ | 0.28 | | | $ | 0.16 | |
| | | | | | | | | | | | | |
The accompanying notes are an integral part of these consolidated financial statements.
F-4
PATTERSON-UTI ENERGY, INC. AND SUBSIDIARIES
| | | | | | | | | | | | | | | | | | | | | | | | | | | | | | | | | |
| | | | | | | | | | | | | | | | | | Accumulated
| | | | | | | |
| | | Common Stock | | | Additional
| | | | | | | | | Other
| | | | | | | |
| | | Number of
| | | | | | Paid-in
| | | Deferred
| | | Retained
| | | Comprehensive
| | | Treasury
| | | | |
| | | Shares | | | Amount | | | Capital | | | Compensation | | | Earnings | | | Income | | | Stock | | | Total | |
| | | (In thousands) | |
| |
| Balance, December 31, 2004 | | | 171,626 | | | $ | 1,716 | | | $ | 597,280 | | | $ | (5,420 | ) | | $ | 373,712 | | | $ | 7,350 | | | $ | (13,137 | ) | | $ | 961,501 | |
| Issuance of restricted stock | | | 305 | | | | 3 | | | | 8,040 | | | | (8,043 | ) | | | — | | | | — | | | | — | | | | — | |
| Amortization of deferred compensation expense | | | — | | | | — | | | | — | | | | 2,825 | | | | — | | | | — | | | | — | | | | 2,825 | |
| Forfeitures of restricted shares | | | (65 | ) | | | — | | | | (1,351 | ) | | | 1,351 | | | | — | | | | — | | | | — | | | | — | |
| Exercise of stock options | | | 4,043 | | | | 40 | | | | 43,434 | | | | — | | | | — | | | | — | | | | — | | | | 43,474 | |
| Tax benefit related to stock-based compensation | | | — | | | | — | | | | 24,748 | | | | — | | | | — | | | | — | | | | — | | | | 24,748 | |
| Foreign currency translation adjustment (net of tax of $705) | | | — | | | | — | | | | — | | | | — | | | | — | | | | 1,215 | | | | — | | | | 1,215 | |
| Purchase of treasury stock | | | — | | | | — | | | | — | | | | — | | | | — | | | | — | | | | (12,153 | ) | | | (12,153 | ) |
| Payment of cash dividend (see Note 10) | | | — | | | | — | | | | — | | | | — | | | | (27,339 | ) | | | — | | | | — | | | | (27,339 | ) |
| Net income | | | — | | | | — | | | | — | | | | — | | | | 372,740 | | | | — | | | | — | | | | 372,740 | |
| | | | | | | | | | | | | | | | | | | | | | | | | | | | | | | | | |
| Balance, December 31, 2005 | | | 175,909 | | | | 1,759 | | | | 672,151 | | | | (9,287 | ) | | | 719,113 | | | | 8,565 | | | | (25,290 | ) | | | 1,367,011 | |
| Elimination of deferred compensation due to change in accounting principle | | | — | | | | — | | | | (9,287 | ) | | | 9,287 | | | | — | | | | — | | | | — | | | | — | |
| Issuance of restricted stock | | | 613 | | | | 6 | | | | (6 | ) | | | — | | | | — | | | | — | | | | — | | | | — | |
| Forfeitures of restricted shares | | | (47 | ) | | | (1 | ) | | | 1 | | | | — | | | | — | | | | — | | | | — | | | | — | |
| Exercise of stock options | | | 181 | | | | 2 | | | | 1,944 | | | | — | | | | — | | | | — | | | | — | | | | 1,946 | |
| Tax benefit related to stock-based compensation | | | — | | | | — | | | | 1,087 | | | | — | | | | — | | | | — | | | | — | | | | 1,087 | |
| Stock based compensation, net of cumulative effect of change in accounting principle | | | — | | | | — | | | | 15,179 | | | | — | | | | — | | | | — | | | | — | | | | 15,179 | |
| Foreign currency translation adjustment, (net of tax of $6) | | | — | | | | — | | | | — | | | | — | | | | — | | | | (175 | ) | | | — | | | | (175 | ) |
| Payment of cash dividend (see Note 10) | | | — | | | | — | | | | — | | | | — | | | | (45,825 | ) | | | — | | | | — | | | | (45,825 | ) |
| Purchase of treasury stock | | | — | | | | — | | | | — | | | | — | | | | — | | | | — | | | | (450,011 | ) | | | (450,011 | ) |
| Net income | | | — | | | | — | | | | — | | | | — | | | | 673,254 | | | | — | | | | — | | | | 673,254 | |
| | | | | | | | | | | | | | | | | | | | | | | | | | | | | | | | | |
| Balance, December 31, 2006 | | | 176,656 | | | | 1,766 | | | | 681,069 | | | | — | | | | 1,346,542 | | | | 8,390 | | | | (475,301 | ) | | | 1,562,466 | |
| Issuance of restricted stock | | | 601 | | | | 6 | | | | (6 | ) | | | — | | | | — | | | | — | | | | — | | | | — | |
| Forfeitures of restricted shares | | | (101 | ) | | | (1 | ) | | | 1 | | | | — | | | | — | | | | — | | | | — | | | | — | |
| Exercise of stock options | | | 230 | | | | 2 | | | | 2,048 | | | | — | | | | — | | | | — | | | | — | | | | 2,050 | |
| Tax benefit related to stock-based compensation | | | — | | | | — | | | | 1,105 | | | | — | | | | — | | | | — | | | | — | | | | 1,105 | |
| Stock based compensation | | | — | | | | — | | | | 19,364 | | | | — | | | | — | | | | — | | | | — | | | | 19,364 | |
| Foreign currency translation adjustment, (net of tax of $6,755) | | | — | | | | — | | | | — | | | | — | | | | — | | | | 11,817 | | | | — | | | | 11,817 | |
| Payment of cash dividend (see Note 10) | | | — | | | | — | | | | — | | | | — | | | | (68,561 | ) | | | — | | | | — | | | | (68,561 | ) |
| Purchase of treasury stock | | | — | | | | — | | | | — | | | | — | | | | — | | | | — | | | | (70,850 | ) | | | (70,850 | ) |
| Net income | | | — | | | | — | | | | — | | | | — | | | | 438,639 | | | | — | | | | — | | | | 438,639 | |
| | | | | | | | | | | | | | | | | | | | | | | | | | | | | | | | | |
| Balance, December 31, 2007 | | | 177,386 | | | $ | 1,773 | | | $ | 703,581 | | | $ | — | | | $ | 1,716,620 | | | $ | 20,207 | | | $ | (546,151 | ) | | $ | 1,896,030 | |
| | | | | | | | | | | | | | | | | | | | | | | | | | | | | | | | | |
The accompanying notes are an integral part of these consolidated financial statements.
F-5
PATTERSON-UTI ENERGY, INC. AND SUBSIDIARIES
| | | | | | | | | | | | | |
| | | Year Ended December 31, | |
| | | 2007 | | | 2006 | | | 2005 | |
| | | (In thousands) | |
| |
| Cash flows from operating activities: | | | | | | | | | | | | |
| Net income | | $ | 438,639 | | | $ | 673,254 | | | $ | 372,740 | |
| Adjustments to reconcile net income to net cash provided by operating activities: | | | | | | | | | | | | |
| Depreciation, depletion and impairment | | | 249,206 | | | | 196,370 | | | | 156,393 | |
| Provision for bad debts | | | 2,550 | | | | 5,400 | | | | 1,231 | |
| Dry holes and abandonments | | | 1,309 | | | | 4,338 | | | | — | |
| Deferred income tax expense (benefit) | | | 38,271 | | | | (3,708 | ) | | | 17,101 | |
| Tax benefit related to stock-based compensation | | | — | | | | — | | | | 24,748 | |
| Stock based compensation expense | | | 19,364 | | | | 15,179 | | | | 2,825 | |
| (Gain) loss on disposal of assets | | | (16,545 | ) | | | 3,819 | | | | (1,253 | ) |
| Changes in operating assets and liabilities: | | | | | | | | | | | | |
| Accounts receivable | | | 112,353 | | | | (67,417 | ) | | | (208,248 | ) |
| Income taxes receivable/payable | | | 7,174 | | | | (16,231 | ) | | | 7,068 | |
| Inventory and other current assets | | | 4,853 | | | | (47,406 | ) | | | (9,402 | ) |
| Accounts payable | | | (40,317 | ) | | | 27,184 | | | | 60,860 | |
| Accrued expenses | | | (6,104 | ) | | | 32,972 | | | | 32,514 | |
| Other liabilities | | | 1,471 | | | | 13,416 | | | | 3,902 | |
| | | | | | | | | | | | | |
| Net cash provided by operating activities | | | 812,224 | | | | 837,170 | | | | 460,479 | |
| | | | | | | | | | | | | |
| Cash flows from investing activities: | | | | | | | | | | | | |
| Acquisitions | | | (29,000 | ) | | | — | | | | (73,577 | ) |
| Purchases of property and equipment | | | (607,686 | ) | | | (597,919 | ) | | | (380,094 | ) |
| Proceeds from disposal of assets | | | 34,224 | | | | 10,934 | | | | 12,674 | |
| Change in other assets | | | — | | | | — | | | | 1,766 | |
| | | | | | | | | | | | | |
| Net cash used in investing activities | | | (602,462 | ) | | | (586,985 | ) | | | (439,231 | ) |
| | | | | | | | | | | | | |
| Cash flows from financing activities: | | | | | | | | | | | | |
| Purchases of treasury stock | | | (70,850 | ) | | | (450,011 | ) | | | (12,153 | ) |
| Dividends paid | | | (68,561 | ) | | | (45,825 | ) | | | (27,339 | ) |
| Tax benefit related to stock-based compensation | | | 1,105 | | | | 1,087 | | | | — | |
| Proceeds from borrowings under line of credit | | | 142,500 | | | | 274,000 | | | | — | |
| Repayment of borrowings under line of credit | | | (212,500 | ) | | | (154,000 | ) | | | — | |
| Line of credit issuance costs | | | — | | | | (342 | ) | | | — | |
| Proceeds from exercise of stock options | | | 2,050 | | | | 1,946 | | | | 43,474 | |
| | | | | | | | | | | | | |
| Net cash provided by (used in) financing activities | | | (206,256 | ) | | | (373,145 | ) | | | 3,982 | |
| | | | | | | | | | | | | |
| Effect of foreign exchange rate changes on cash | | | 543 | | | | (53 | ) | | | (1,203 | ) |
| | | | | | | | | | | | | |
| Net increase (decrease) in cash and cash equivalents | | | 4,049 | | | | (123,013 | ) | | | 24,027 | |
| Cash and cash equivalents at beginning of year | | | 13,385 | | | | 136,398 | | | | 112,371 | |
| | | | | | | | | | | | | |
| Cash and cash equivalents at end of year | | $ | 17,434 | | | $ | 13,385 | | | $ | 136,398 | |
| | | | | | | | | | | | | |
| Supplemental disclosure of cash flow information: | | | | | | | | | | | | |
| Net cash paid during the year for: | | | | | | | | | | | | |
| Interest expense | | $ | (1,808 | ) | | $ | (1,278 | ) | | $ | (418 | ) |
| Income taxes | | | (176,281 | ) | | | (377,847 | ) | | | (156,709 | ) |
The accompanying notes are an integral part of these consolidated financial statements.
F-6
PATTERSON-UTI ENERGY, INC. AND SUBSIDIARIES
| |
| 1. | Description of Business and Summary of Significant Accounting Policies |
A description of the business and basis of presentation follows:
Description of business — Patterson-UTI Energy, Inc., together with its wholly-owned subsidiaries, (collectively referred to herein as “Patterson-UTI” or the “Company”) is a leading provider of onshore contract drilling services to major and independent oil and natural gas operators in Texas, New Mexico, Oklahoma, Arkansas, Louisiana, Mississippi, Colorado, Utah, Wyoming, Montana, North Dakota, South Dakota, Pennsylvania and Western Canada. The Company provides pressure pumping services to oil and natural gas operators primarily in the Appalachian Basin. The Company provides drilling fluids, completion fluids and related services to oil and natural gas operators offshore in the Gulf of Mexico and on land in Texas, Southeastern New Mexico, Oklahoma and the Gulf Coast region of Louisiana. The Company owns and invests in oil and natural gas assets as a working interest owner. The Company’s oil and natural gas interests are located primarily in producing regions of West and South Texas, Southeastern New Mexico, Utah and Mississippi.
Basis of presentation — The consolidated financial statements include the accounts of Patterson-UTI and its wholly-owned subsidiaries. All significant intercompany accounts and transactions have been eliminated. The Company has no controlling financial interests in any entity that is not a wholly-owned subsidiary and which would require consolidation.
The U.S. dollar is the functional currency for all of the Company’s operations except for its Canadian operations, which use the Canadian dollar as their functional currency. The effects of exchange rate changes are reflected in accumulated other comprehensive income, which is a separate component of stockholders’ equity.
A summary of the significant accounting policies follows:
Management estimates — The preparation of financial statements in conformity with accounting principles generally accepted in the United States of America requires management to make estimates and assumptions that affect the reported amounts of assets and liabilities and disclosure of contingent assets and liabilities at the date of the financial statements and the reported amounts of revenues and expenses during the reporting period. Actual results could differ from such estimates.
Revenue recognition — Revenues are recognized when services are performed, except for revenues earned under turnkey contract drilling arrangements which are recognized using the completed contract method of accounting, as described below. The Company follows the percentage-of-completion method of accounting for footage and daywork contract drilling arrangements. Under the percentage-of-completion method, management estimates are relied upon in the determination of the total estimated expenses to be incurred drilling the well. Due to the nature of turnkey contract drilling arrangements and risks therein, the Company follows the completed contract method of accounting for such arrangements. Under this method, all drilling revenues and expenses related to a well in progress are deferred and recognized in the period the well is completed. Provisions for losses on incomplete or in-process wells are made when estimated total expenses are expected to exceed estimated total revenues. The Company recognizes reimbursements received from third parties for out-of-pocket expenses incurred as revenues and accounts for these out-of-pocket expenses as direct costs.
Accounts receivable — Trade accounts receivable are recorded at the invoiced amount and do not bear interest. The allowance for doubtful accounts represents the Company’s estimate of the amount of probable credit losses existing in the Company’s accounts receivable. The Company reviews the adequacy of its allowance for doubtful accounts at least quarterly. Significant individual accounts receivable balances and balances which have been outstanding greater than 90 days are reviewed individually for collectibility. Account balances, when determined to be uncollectible, are charged against the allowance.
F-7
Inventories — Inventories consist primarily of chemical products to be used in conjunction with the Company’s drilling and completion fluids and pressure pumping activities. The inventories are stated at the lower of cost or market, determined by thefirst-in, first-out method.
Property and equipment — Property and equipment is carried at cost less accumulated depreciation. Depreciation is provided on the straight-line method over the estimated useful lives. The method of depreciation does not change when equipment becomes idle. The estimated useful lives, in years, are defined below.
| | | | | |
| | | Useful Lives | |
| |
| Drilling rigs and other equipment | | | 2-15 | |
| Buildings | | | 15-20 | |
| Other | | | 3-12 | |
Oil and natural gas properties — Working interests in oil and natural gas properties are accounted for using the successful efforts method of accounting. Under the successful efforts method of accounting, exploration costs which result in the discovery of oil and natural gas reserves and all development costs are capitalized to the appropriate well. Exploration costs which do not result in discovering oil and natural gas reserves are charged to expense when such determination is made. Costs of exploratory wells are initially capitalized to wells in progress until the outcome of the drilling is known. The Company reviews wells in progress quarterly to determine whether sufficient progress is being made in assessing the reserves and the economic operating viability of the respective projects. If no progress has been made in assessing the reserves and the economic operating viability of a project after one year following the completion of drilling, the Company considers the costs of the well to be impaired and recognizes the costs as expense. Geological and geophysical costs, including seismic costs, and costs to carry and retain undeveloped properties are charged to expense when incurred. The capitalized costs of both developmental and successful exploratory type wells, consisting of lease and well equipment, lease acquisition costs and intangible development costs, are depreciated, depleted and amortized on the units-of-production method, based on engineering estimates of proved oil and natural gas reserves of each respective field. The Company reviews its proved oil and natural gas properties for impairment when an event occurs such as downward revisions in reserve estimates or decreases in oil and natural gas prices. Proved properties are grouped by field and undiscounted cash flow estimates are provided by an independent petroleum engineer. If the net book value of a field exceeds its undiscounted cash flow estimate, impairment expense is measured and recognized as the difference between its net book value and discounted cash flow. Unproved oil and natural gas properties are reviewed quarterly to determine impairment. The Company’s intent to drill, lease expiration and abandonment of area are considered. Assessment of impairment is made on alease-by-lease basis. If an unproved property is determined to be impaired, costs related to that property are expensed.
Goodwill — Goodwill is considered to have an indefinite useful economic life and is not amortized. As such, the Company assesses impairment of its goodwill annually or on an interim basis if events or circumstances indicate that the fair value of the asset has decreased below its carrying value.
Depreciation, depletion and impairment — The following table summarizes depreciation, depletion and impairment expense for 2007, 2006 and 2005 (in millions):
| | | | | | | | | | | | | |
| | | 2007 | | | 2006 | | | 2005 | |
| |
| Depreciation and impairment expense | | $ | 234.7 | | | $ | 186.6 | | | $ | 146.1 | |
| Depletion expense | | | 14.5 | | | | 9.8 | | | | 10.3 | |
| | | | | | | | | | | | | |
| Total | | $ | 249.2 | | | $ | 196.4 | | | $ | 156.4 | |
| | | | | | | | | | | | | |
Maintenance and repairs — Maintenance and repairs are charged to expense when incurred. Renewals and betterments which extend the life or improve existing property and equipment are capitalized.
Retirements — Upon disposition or retirement of property and equipment, the cost and related accumulated depreciation are removed and any resulting gain or loss is reflected in the consolidated statement of income.
Net income per common share — The Company provides a dual presentation of its net income per common share in its Consolidated Statements of Income: Basic net income per common share (“Basic EPS”) and diluted net
F-8
income per common share (“Diluted EPS”). Basic EPS excludes dilution and is computed by dividing net income by the weighted average number of common shares outstanding during the period excluding nonvested restricted stock. Diluted EPS is based on the weighted-average number of common shares outstanding plus the impact of dilutive instruments, including stock options, warrants and restricted stock using the treasury stock method. The following table presents information necessary to calculate net income per share for the years ended December 31, 2007, 2006 and 2005 as well as potentially dilutive securities excluded from the weighted average number of diluted common shares outstanding, as their inclusion would have been anti-dilutive (in thousands, except per share amounts):
| | | | | | | | | | | | | |
| | | 2007 | | | 2006 | | | 2005 | |
| |
| Net income | | $ | 438,639 | | | $ | 673,254 | | | $ | 372,740 | |
| Weighted average number of common shares outstanding excluding nonvested restricted stock | | | 154,755 | | | | 165,159 | | | | 170,426 | |
| | | | | | | | | | | | | |
| Basic net income per common share | | $ | 2.83 | | | $ | 4.08 | | | $ | 2.19 | |
| | | | | | | | | | | | | |
| Weighted average number of common shares outstanding excluding nonvested restricted stock | | | 154,755 | | | | 165,159 | | | | 170,426 | |
| Dilutive effect of stock options and restricted shares | | | 2,242 | | | | 2,254 | | | | 3,341 | |
| | | | | | | | | | | | | |
| Weighted average number of diluted common shares outstanding | | | 156,997 | | | | 167,413 | | | | 173,767 | |
| | | | | | | | | | | | | |
| Diluted net income per common share | | $ | 2.79 | | | $ | 4.02 | | | $ | 2.15 | |
| | | | | | | | | | | | | |
| Potentially dilutive securities excluded as anti-dilutive | | | 2,460 | | | | 800 | | | | — | |
| | | | | | | | | | | | | |
Income taxes — The asset and liability method is used in accounting for income taxes. Under this method, deferred tax assets and liabilities are recognized for operating loss and tax credit carryforwards and for the future tax consequences attributable to differences between the financial statement carrying amounts of existing assets and liabilities and their respective tax bases. Deferred tax assets and liabilities are measured using enacted tax rates expected to apply to taxable income in the year in which those temporary differences are expected to be recovered or settled. The effect on deferred tax assets and liabilities of a change in tax rates is recognized in the results of operations in the period that includes the enactment date. If applicable, a valuation allowance is recorded to reduce the carrying amounts of deferred tax assets unless it is more likely than not that such assets will be realized.
The Company adopted FASB Interpretation No. 48,Accounting for Uncertainty in Income Taxes — an interpretation of FASB Statement No. 109(“FIN 48”) on January 1, 2007. FIN 48 clarifies the accounting for uncertainty in income taxes recognized in an enterprise’s financial statements and prescribes a recognition threshold and measurement attribute for the financial statement recognition and measurement of a tax position taken or expected to be taken in a tax return. As a result of the adoption of FIN 48 the Company reduced a reserve for an uncertain tax position with respect to a business combination that had originally been recorded as goodwill (see Note 5). The impact of adjustments to reserves with respect to other uncertain tax positions was not material. In connection with the adoption of FIN 48, the Company established a policy to account for interest and penalties with respect to income taxes as operating expenses.
Stock based compensation — Prior to January 1, 2006, the Company accounted for stock based compensation related to employee stock options and shares of restricted stock using the recognition and measurement principles of APB Opinion No. 25,Accounting for Stock Issued to Employees(“APB 25”), and related interpretations. Under the provisions of APB 25, expense associated with stock option grants was measured based on the intrinsic value of the option at the date of grant and expense associated with restricted stock grants was measured based on the fair value of the shares at the date of grant. Reductions in compensation expense associated with awards that were forfeited prior to vesting were recognized as those grants were forfeited. Effective January 1, 2006, the Company adopted the provisions of Financial Accounting Standards Board Statement No. 123(R),Share-Based Payment(“SFAS 123(R)”). SFAS 123(R) requires the recognition of expense associated with the grant of both stock options and restricted stock based on the estimated fair value of the options or restricted stock at the date of grant, net of estimated forfeitures.
F-9
Statement of cash flows — For purposes of reporting cash flows, cash and cash equivalents include cash on deposit and money market funds.
Recently Issued Accounting Standards — In September 2006, the FASB issued Statement No. 157,Fair Value Measurements(“FAS 157”). FAS 157 defines fair value, establishes a framework for measuring fair value in generally accepted accounting principles, and expands disclosures about fair value measurement. FAS 157 is effective for financial statements issued for fiscal years beginning after November 15, 2007 and interim periods within those fiscal years. FAS 157 will be effective for the Company beginning in the quarter ending March 31, 2008. The application of FAS 157 is not expected to have a material impact to the Company.
In February 2007, the FASB issued Statement No. 159,The Fair Value Option for Financial Assets and Financial Liabilities Including an Amendment of FASB Statement No. 115(“FAS 159”). FAS 159 permits entities to choose to measure many financial instruments and certain other items at fair value. FAS 159 is effective as of the beginning of an entity’s first fiscal year that begins after November 15, 2007 and will be effective for the Company beginning in the quarter ending March 31, 2008. The application of FAS 159 is not expected to have a material impact to the Company.
In December 2007, the FASB issued Statement No. 141(R),Business Combinations(“FAS 141(R)”) and Statement No. 160,Noncontrolling Interests in Consolidated Financial Statements, an amendment of ARB No. 51(“FAS 160”). FAS 141(R) is a revision of Statement No. 141,Business Combinations, and calls for significant changes from current practice in accounting for business combinations. FAS 141(R) is effective for business combinations for which the acquisition date is on or after the beginning of the first annual reporting period beginning on or after December 15, 2008. FAS 160 amends ARB 51 to establish accounting and reporting standards for the noncontrolling interest in a subsidiary and for the deconsolidation of a subsidiary. FAS 160 is effective for fiscal years beginning on or after December 15, 2008. Both FAS 141(R) and FAS 160 will be effective for the Company beginning the quarter ending March 31, 2009. The application of FAS 141(R) and FAS 160 are not expected to have a material impact to the Company.
Reclassifications — Certain reclassifications have been made to the 2006 and 2005 consolidated financial statements in order for them to conform with the 2007 presentation.
2007 Acquisitions
On October 9, 2007, the Company acquired three recently refurbished SCR electric land-based drilling rigs and spare drilling equipment for $29.0 million. The transaction was accounted for as an acquisition of assets and the purchase price was allocated among the assets acquired based on their estimated fair market values.
2005 Acquisitions
Key Energy Services, Inc. — On January 15, 2005, the Company purchased land drilling assets from Key Energy Services, Inc. for $61.8 million. The assets included 25 active and 10 stacked land-based drilling rigs, related drilling equipment, yard facilities and a rig moving fleet consisting of approximately 45 trucks and 100 trailers. The transaction was accounted for as an acquisition of assets and the purchase price was allocated among the assets acquired based on their estimated fair market values.
Other — On June 17, 2005, the Company acquired one land-based drilling rig for $3.6 million and on September 29, 2005, the Company acquired five land-based drilling rigs and related drilling equipment for $8.2 million. The transactions were accounted for as acquisitions of assets and the purchase price was allocated among the assets acquired based on their estimated fair market values.
F-10
The following table illustrates the Company’s comprehensive income including the effects of foreign currency translation adjustments for the years ended December 31, 2007, 2006 and 2005 (in thousands):
| | | | | | | | | | | | | |
| | | 2007 | | | 2006 | | | 2005 | |
| |
| Net income | | $ | 438,639 | | | $ | 673,254 | | | $ | 372,740 | |
| Other comprehensive income: | | | | | | | | | | | | |
| Foreign currency translation adjustment related to Canadian operations, net of tax | | | 11,817 | | | | (175 | ) | | | 1,215 | |
| | | | | | | | | | | | | |
| Comprehensive income | | $ | 450,456 | | | $ | 673,079 | | | $ | 373,955 | |
| | | | | | | | | | | | | |
| |
| 4. | Property and Equipment |
Property and equipment consisted of the following at December 31, 2007 and 2006 (in thousands):
| | | | | | | | | |
| | | 2007 | | | 2006 | |
| |
| Equipment | | $ | 2,748,007 | | | $ | 2,135,567 | |
| Oil and natural gas properties | | | 75,732 | | | | 85,143 | |
| Buildings | | | 50,955 | | | | 30,987 | |
| Land | | | 9,991 | | | | 7,507 | |
| | | | | | | | | |
| | | | 2,884,685 | | | | 2,259,204 | |
| Less accumulated depreciation and depletion | | | (1,043,281 | ) | | | (823,400 | ) |
| | | | | | | | | |
| | | $ | 1,841,404 | | | $ | 1,435,804 | |
| | | | | | | | | |
Goodwill is evaluated at least annually to determine if the fair value of recorded goodwill has decreased below its carrying value. At December 31, 2007 the Company performed its annual goodwill evaluation and determined no adjustment to impair goodwill was necessary. For purposes of impairment testing, goodwill is evaluated at the reporting unit level. The Company’s reporting units for impairment testing have been determined to be its operating segments. Goodwill by operating segment as of December 31, 2007 and 2006 and changes for the years then ended are as follows (in thousands):
| | | | | | | | | |
| | | 2007 | | | 2006 | |
| |
Contract Drilling: | | | | | | | | |
| Goodwill at beginning of year | | $ | 89,092 | | | $ | 89,092 | |
| Changes to goodwill | | | (2,858 | ) | | | — | |
| | | | | | | | | |
| Goodwill at end of period | | | 86,234 | | | | 89,092 | |
| | | | | | | | | |
Drilling and completion fluids: | | | | | | | | |
| Goodwill at beginning of year | | | 9,964 | | | | 9,964 | |
| Changes to goodwill | | | — | | | | — | |
| | | | | | | | | |
| Goodwill at end of period | | | 9,964 | | | | 9,964 | |
| | | | | | | | | |
| Total goodwill | | $ | 96,198 | | | $ | 99,056 | |
| | | | | | | | | |
In connection with the implementation of FIN 48 as of January 1, 2007 as discussed in Note 1 of these Consolidated Financial Statements, the Company determined that a tax reserve of $2.9 million which had been established in connection with a business acquisition should be reduced to zero. This reserve had originally been established in connection with the allocation of the purchase price in the transaction and was reflected as an increase in goodwill.
F-11
Accrued expenses consisted of the following at December 31, 2007 and 2006 (in thousands):
| | | | | | | | | |
| | | 2007 | | | 2006 | |
| |
| Salaries, wages, payroll taxes and benefits | | $ | 33,816 | | | $ | 42,751 | |
| Workers’ compensation liability | | | 70,989 | | | | 69,330 | |
| Sales, use and other taxes | | | 12,119 | | | | 11,043 | |
| Insurance, other than workers’ compensation | | | 16,308 | | | | 13,328 | |
| Other | | | 3,602 | | | | 9,011 | |
| | | | | | | | | |
| | | $ | 136,834 | | | $ | 145,463 | |
| | | | | | | | | |
| |
| 7. | Asset Retirement Obligation |
Statement of Financial Accounting Standards No. 143,Accounting for Asset Retirement Obligations, (“SFAS 143”), requires that the Company record a liability for the estimated costs to be incurred in connection with the abandonment of oil and natural gas properties in the future. The following table describes the changes to the Company’s asset retirement obligations during 2007 and 2006 (in thousands):
| | | | | | | | | |
| | | 2007 | | | 2006 | |
| |
| Balance at beginning of year | | $ | 1,829 | | | $ | 1,725 | |
| Liabilities incurred | | | 276 | | | | 154 | |
| Liabilities settled | | | (862 | ) | | | (104 | ) |
| Accretion expense | | | 61 | | | | 54 | |
| Revision in estimated costs of plugging oil and natural gas wells | | | 289 | | | | — | |
| | | | | | | | | |
| Asset retirement obligation at end of year | | $ | 1,593 | | | $ | 1,829 | |
| | | | | | | | | |
| |
| 8. | Borrowings Under Line of Credit |
The Company has an unsecured revolving line of credit (“LOC”) with a maximum borrowing capacity of $375 million. Interest is paid on outstanding LOC balances at a floating rate ranging from LIBOR plus 0.625% to 1.0% or the prime rate. Any outstanding borrowings must be repaid at maturity on December 16, 2009. This arrangement includes various fees, including a commitment fee on the average daily unused amount (0.15% at December 31, 2007). There are customary restrictions and covenants associated with the LOC. Financial covenants provide for a maximum debt to capitalization ratio and a minimum interest coverage ratio. The Company does not expect that the restrictions and covenants will restrict its ability to operate or react to opportunities that might arise. As of December 31, 2007, the Company had outstanding borrowings of $50.0 million under the LOC and $59.4 million in letters of credit were outstanding. As a result, the Company had available borrowing capacity of $266 million at December 31, 2007. The weighted average interest rate on borrowings outstanding at December 31, 2007 was 5.47%. The carrying value of borrowings outstanding under the LOC approximates fair value due to the floating interest rate.
| |
| 9. | Commitments, Contingencies and Other Matters |
Commitments —The Company maintains letters of credit in the aggregate amount of $59.4 million for the benefit of various insurance companies as collateral for retrospective premiums and retained losses which may become payable under the terms of the underlying insurance contracts. These letters of credit are typically renewed annually. No amounts have been drawn under the letters of credit.
As of December 31, 2007, the Company has non-cancelable commitments to purchase approximately $83.0 million of equipment.
Contingencies — The Company’s contract services and oil and natural gas exploration and production operations are subject to inherent risks, including blowouts, cratering, fire and explosions which could result in
F-12
personal injury or death, suspended drilling operations, damage to, or destruction of equipment, damage to producing formations and pollution or other environmental hazards.
As a protection against these hazards, the Company maintains general liability insurance coverage of $2.0 million per occurrence with $4.0 million of aggregate coverage and excess liability and umbrella coverages up to $100 million per occurrence and in the aggregate. The Company maintains a $1.0 million per occurrence deductible on its workers’ compensation insurance and its general liability insurance coverages.
The Company believes it is adequately insured for public liability and property damage to others with respect to its operations. However, such insurance may not be sufficient to protect the Company against liability for all consequences of well disasters, extensive fire damage, or damage to the environment. The Company also carries insurance to cover physical damage to, or loss of, its rigs. However, it does not cover the full replacement cost of the rigs and the Company does not carry insurance against loss of earnings resulting from such damage. There can be no assurance that such insurance coverage will always be available on terms that are satisfactory to the Company.
In November 2005, the Company discovered that its former Chief Financial Officer, Jonathan D. Nelson (“Nelson”), had fraudulently diverted approximately $77.5 million in Company funds for his own benefit. As a result, the Audit Committee of the Board of Directors commenced an investigation into Nelson’s activities and retained independent counsel and independent forensic accountants to assist with the investigation. Nelson has been sentenced and is serving a term of imprisonment arising out of his embezzlement. A receiver was appointed to take control of and liquidate the assets of Nelson. In May 2007, the court approved a plan of distribution for the assets recovered by the receiver. The Company expects to recover a total of approximately $44.5 million pursuant to the approved plan, and has recognized this recovery in the Company’s consolidated statement of income in 2007, net of professional fees incurred as a result of the embezzlement. As of December 31, 2007, the Company had received cash payments from the receiver of approximately $41.2 million, with the remaining $3.3 million of the expected recovery consisting of notes receivable, investments and other assets that have been or are expected to be transferred to the Company.
The Company is party to various legal proceedings arising in the normal course of its business. The Company does not believe that the outcome of these proceedings, either individually or in the aggregate, will have a material adverse effect on its financial condition, results of operations or cash flows.
Other Matters — The Company has Change in Control Agreements with its Chairman of the Board, Chief Executive Officer, two Senior Vice Presidents and its General Counsel (the “Key Employees”). Each Change in Control Agreement generally has an initial term with automatic twelve month renewals unless the Company notifies the Key Employee at least ninety days before the end of such renewal period that the term will not be extended. If a change in control of the Company occurs during the term of the agreement and the Key Employee’s employment is terminated (i) by the Company other than for cause or other than automatically as a result of death, disability or retirement or (ii) by the Key Employee for good reason (as those terms are defined in the Change in Control Agreements), then the Key Employee shall generally be entitled to, among other things,
| | |
| | • | a bonus payment equal to the greater of the highest bonus paid after the Change in Control Agreement was entered into and the average of the two annual bonuses earned in the two fiscal years immediately preceding a change in control (such bonus payment prorated for the portion of the fiscal year preceding the termination date); |
| |
| | • | a payment equal to 2.5 times (in the case of the Chairman of the Board and Chief Executive Officer), 2 times (in the case of the Senior Vice Presidents) or 1.5 times (in the case of the General Counsel) of the sum of (i) the highest annual salary in effect for such Key Employee and (ii) the average of the three annual bonuses earned by the Key Employee for the three fiscal years preceding the termination date; and |
| |
| | • | continued coverage under the Company’s welfare plans for up to three years (in the case of the Chairman of the Board and Chief Executive Officer) or two years (in the case of the Senior Vice Presidents and General Counsel). |
F-13
Each Change in Control Agreement provides the Key Employee with a fullgross-up payment for any excise taxes imposed on payments and benefits received under the Change in Control Agreements or otherwise, including other taxes that may be imposed as a result of thegross-up payment.
Cash Dividends —The Company paid cash dividends during the years ended December 31, 2007, 2006 and 2005 as follows:
| | | | | | | | | |
| | | Per Share | | | Total | |
| | | | | | (In thousands) | |
| |
2007: | | | | | | | | |
| Paid on March 30, 2007 | | $ | 0.08 | | | $ | 12,527 | |
| Paid on June 29, 2007 | | | 0.12 | | | | 18,860 | |
| Paid on September 28, 2007 | | | 0.12 | | | | 18,690 | |
| Paid on December 28, 2007 | | | 0.12 | | | | 18,484 | |
| | | | | | | | | |
| Total cash dividends declared and paid | | $ | 0.44 | | | $ | 68,561 | |
| | | | | | | | | |
2006: | | | | | | | | |
| Paid on March 30, 2006 | | $ | 0.04 | | | $ | 6,906 | |
| Paid on June 30, 2006 | | | 0.08 | | | | 13,413 | |
| Paid on September 29, 2006 | | | 0.08 | | | | 13,024 | |
| Paid on December 29, 2006 | | | 0.08 | | | | 12,482 | |
| | | | | | | | | |
| Total cash dividends declared and paid | | $ | 0.28 | | | $ | 45,825 | |
| | | | | | | | | |
2005: | | | | | | | | |
| Paid on March 4, 2005 | | $ | 0.04 | | | $ | 6,746 | |
| Paid on June 1, 2005 | | | 0.04 | | | | 6,790 | |
| Paid on September 1, 2005 | | | 0.04 | | | | 6,904 | |
| Paid on December 1, 2005 | | | 0.04 | | | | 6,899 | |
| | | | | | | | | |
| Total cash dividends declared and paid | | $ | 0.16 | | | $ | 27,339 | |
| | | | | | | | | |
On February 13, 2008, the Company’s Board of Directors approved a cash dividend on its common stock in the amount of $0.12 per share to be paid on March 28, 2008 to holders of record as of March 12, 2008. The amount and timing of all future dividend payments, if any, is subject to the discretion of the Board of Directors and will depend upon business conditions, results of operations, financial condition, terms of the Company’s credit facilities and other factors.
The Company has granted restricted shares of the Company’s common stock (“Restricted Shares”) to certain employees under the Patterson-UTI Energy, Inc. 1997 Long-Term Incentive Plan, as amended, and the Patterson-UTI Energy, Inc. 2005 Long-Term Incentive Plan. As required by SFAS 123(R), the Restricted Shares were valued based upon the market price of the Company’s common stock on the date of the grant. The restrictions on these shares lapse at various dates through 2010.
On June 7, 2004, the Company’s Board of Directors authorized a stock buyback program (“2004 Program”) for the purchase of up to $30 million of the Company’s outstanding common stock in open market or privately negotiated transactions. During 2004, the Company purchased 100,000 shares of its common stock under the 2004 Program in the open market for approximately $1.5 million. During 2005, the Company purchased 355,000 shares of its common stock under the 2004 Program in the open market for approximately $12.2 million. On March 27, 2006, the Company’s Board of Directors increased the 2004 Program to allow for future purchases of up to $200 million of the Company’s outstanding common stock. During the second quarter of 2006, the Company completed the purchase of 6,704,800 shares of its common stock under the 2004 Program in the open market at a cost of approximately $200 million. On August 2, 2006, the Company’s Board of Directors again increased the 2004
F-14
Program to allow for future purchases of up to $250 million of the Company’s outstanding common stock. During the remainder of 2006, the Company purchased an additional 9,940,542 shares of its common stock under the 2004 Program in the open market at a cost of approximately $250 million.
On August 1, 2007, the Company’s Board of Directors approved a new stock buyback program (“2007 Program”), authorizing purchases of up to $250 million of the Company’s common stock in open market or privately negotiated transactions. During the year ended December 31, 2007, the Company purchased 3,308,850 shares of its common stock under the 2007 Program at a cost of approximately $70.4 million. As of December 31, 2007, the Company is authorized to purchase approximately $180 million of the Company’s outstanding common stock under the 2007 Program. Shares purchased under the 2004 and 2007 stock buyback programs have been accounted for as treasury stock.
Additionally, the Company purchased 20,269 shares of treasury stock from employees during 2007. These shares were purchased at fair market value upon the vesting of restricted stock to provide the employees with the funds necessary to satisfy their respective tax withholding obligations. The total purchase price for these shares was approximately $496,000.
| |
| 11. | Stock-based Compensation |
The Company adopted FASB 123(R) on January 1, 2006 and recognizes the cost of share-based payments under the fair-value-based method. The Company uses share-based payments to compensate employees and non-employee directors. All awards have been equity instruments in the form of stock options or restricted stock awards and have included both service and performance conditions. The Company issues shares of common stock when vested stock option awards are exercised and when restricted stock awards are granted. For the year ended December 31, 2007, the Company recognized $19.4 million in stock-based compensation expense and a related income tax benefit of approximately $6.7 million. For the year ended December 31, 2006, the Company recognized $16.3 million in stock-based compensation expense and a related income tax benefit of approximately $5.8 million and recognized a benefit in the form of a cumulative effect of change in accounting principle associated with the adoption of FAS 123(R) of $1.1 million, with a related tax expense of $398,000.
During 2005, the Company’s shareholders approved the Patterson-UTI Energy, Inc. 2005 Long-Term Incentive Plan (the “2005 Plan”) and the Board of Directors adopted a resolution that no future grants would be made under any of the Company’s other previously existing plans. The Company’s share-based compensation plans at December 31, 2007 follow:
| | | | | | | | | | | | | |
| | | | | | Options &
| | | | |
| | | Shares
| | | Restricted
| | | Shares
| |
| | | Authorized
| | | Shares
| | | Available
| |
Plan Name | | for Grant | | | Outstanding | | | for Grant | |
| |
| Patterson-UTI Energy, Inc. 2005 Long-Term Incentive Plan | | | 6,250,000 | | | | 3,079,250 | | | | 2,283,045 | |
| Patterson-UTI Energy, Inc. Amended and Restated 1997 Long-Term Incentive Plan, as amended (“1997 Plan”) | | | — | | | | 4,903,337 | | | | — | |
| Amended and Restated Patterson-UTI Energy, Inc. 2001 Long-Term Incentive Plan (“2001 Plan”) | | | — | | | | 669,747 | | | | — | |
| Amended and Restated Non-Employee Director Stock Option Plan of Patterson-UTI Energy, Inc. (“Non-Employee Director Plan”) | | | — | | | | 120,000 | | | | — | |
| Amended and Restated Patterson-UTI Energy, Inc. 1996 Employee Stock Option Plan (“1996 Plan”) | | | — | | | | 81,600 | | | | — | |
| Patterson-UTI Energy, Inc., 1993 Incentive Stock Plan, as amended (“1993 Plan”) | | | — | | | | 39,300 | | | | — | |
A summary of the 2005 Plan follows:
| | |
| | • | The Compensation Committee of the Board of Directors administers the plan. |
| |
| | • | All employees including officers and directors are eligible for awards. |
F-15
| | |
| | • | The Compensation Committee determines the vesting schedule for awards. Awards typically vest over 1 year for non-employee directors and 3 to 4 years for employees. |
| |
| | • | The Compensation Committee sets the term of awards and no option term can exceed 10 years. |
| |
| | • | All options granted under the plan are granted with an exercise price equal to or greater than the fair market value of the Company’s common stock at the time the option is granted. |
| |
| | • | The plan provides for awards of incentive stock options, non-incentive stock options, tandem and freestanding stock appreciation rights, restricted stock awards, other stock unit awards, performance share awards, performance unit awards and dividend equivalents. As of December 31, 2007, only non-incentive stock options and restricted stock awards had been granted under the plan. |
Options granted under the 1997 Plan typically vest over three or five years as dictated by the Compensation Committee. These options have terms of no more than ten years. All options were granted with an exercise price equal to the fair market value of the related common stock at the time of grant. Restricted Stock Awards granted under the 1997 Plan typically vest over four years.
Options granted under the 2001 Plan typically vest over five years as dictated by the Compensation Committee. These options have terms of no more than ten years. All options were granted with an exercise price equal to the fair market value of the Company’s common stock at the time of grant.
Options granted under the Non-Employee Director Plan vest on the first anniversary of the option grant and have a term of five years. All options were granted with an exercise price equal to the fair market value of the related common stock at the time of grant.
Options granted under the 1996 plan typically vest over one, four or five years as dictated by the Compensation Committee. These options have terms of no more than ten years. All options were granted with an exercise price equal to the fair market value of the Company’s common stock at the time of grant.
Options granted under the 1993 Plan typically vest over five years as dictated by the Compensation Committee. These options have terms of no more than ten years. All options were granted with an exercise price equal to the fair market value of the Company’s common stock at the time of grant.
Stock Options —The Company accounted for all stock options under the intrinsic value method prior to January 1, 2006. Accordingly, no compensation expense was recognized in periods prior to 2006 for stock options because they had no intrinsic value when granted as exercise prices were equal to the grant date market value of the related common stock. The Modified Prospective Application (“MPA”) method was applied to transition from the intrinsic value method to the fair-value-based method for stock options. The effects of the application of the MPA method follow:
| | |
| | • | Previously reported amounts and disclosures are not affected. |
| |
| | • | Compensation cost, net of estimated forfeitures for the unvested portion of awards outstanding at January 1, 2006, is recognized under the fair-value-based method as the awards vest. Compensation cost is based on the grant-date estimated fair value of stock options as calculated for the Company’s previously reported pro forma disclosures under FASB Statement No. 123,Accounting for Stock-Based Compensation (“FAS 123”). |
| |
| | • | The fair-value based method is applied to new awards and to any awards outstanding at January 1, 2006 that are modified, repurchased or cancelled after that date. |
F-16
The Company estimates grant date fair values of stock options using the Black-Scholes-Merton valuation model (“Black-Scholes”), except for stock options granted prior to 1996 that are not subject to FAS 123(R) and were not subject to FAS 123 pro forma disclosures. Volatility assumptions are based on the historic volatility of the Company’s common stock over the most recent period equal to the expected term of the options as of the date the options were granted. The expected term assumptions are based on the Company’s experience with respect to employee stock option activity. Dividend yield assumptions are based on the expected dividends at the time the options were granted. The risk-free interest rate assumptions are determined by reference to United States Treasury yields. Weighted-average assumptions used to estimate grant date fair values for stock options granted in the years ended December 31, 2007, 2006 and 2005 follow:
| | | | | | | | | | | | | |
| | | 2007 | | | 2006 | | | 2005 | |
| |
| Volatility | | | 36.37 | % | | | 33.18 | % | | | 26.95 | % |
| Expected term (in years) | | | 4.00 | | | | 4.00 | | | | 4.00 | |
| Dividend yield | | | 1.97 | % | | | 1.09 | % | | | 0.65 | % |
| Risk-free interest rate | | | 4.55 | % | | | 4.87 | % | | | 3.84 | % |
Stock option activity for the year ended December 31, 2007 follows:
| | | | | | | | | |
| | | | | | Weighted-
| |
| | | | | | Average
| |
| | | | | | Exercise
| |
| | | Shares | | | Price | |
| |
| Outstanding at beginning of year | | | 6,575,096 | | | $ | 16.18 | |
| Granted | | | 1,060,000 | | | $ | 23.92 | |
| Exercised | | | (229,812 | ) | | $ | 8.92 | |
| Forfeited | | | (2,183 | ) | | $ | 14.64 | |
| Expired | | | (17 | ) | | $ | 14.64 | |
| | | | | | | | | |
| Outstanding at end of year | | | 7,403,084 | | | $ | 17.52 | |
| | | | | | | | | |
| Exercisable at end of year | | | 5,879,750 | | | $ | 15.54 | |
| | | | | | | | | |
Options outstanding at December 31, 2007 have an aggregate intrinsic value of approximately $29.8 million and a weighted-average remaining contractual term of 5.9 years. Options exercisable at December 31, 2007 have an aggregate intrinsic value of approximately $29.8 million and a weighted-average remaining contractual term of 5.1 years. Additional information with respect to options granted, vested and exercised during the years ended December 31, 2007, 2006 and 2005 follows:
| | | | | | | | | | | | | |
| | | 2007 | | | 2006 | | | 2005 | |
| |
| Weighted-average grant-date fair value of stock options granted (per share) | | $ | 7.09 | | | $ | 8.62 | | | $ | 6.33 | |
| Grant-date fair value of stock options vested during the year (in thousands) | | $ | 5,613 | | | $ | 6,900 | | | $ | 15,738 | |
| Aggregate intrinsic value of stock options exercised (in thousands) | | $ | 3,186 | | | $ | 3,377 | | | $ | 73,467 | |
As of December 31, 2007, options to purchase 1,523,334 shares were outstanding and not vested. All of these non-vested options are expected to ultimately vest. Additional information as of December 31, 2007 with respect to these options that are expected to vest follows:
| | | | | |
| Aggregate intrinsic value | | $ | 0 | |
| Weighted-average remaining contractual term | | | 9.03 years | |
| Weighted-average remaining expected term | | | 3.03 years | |
| Weighted-average remaining vesting period | | | 1.97 years | |
| Unrecognized compensation cost | | $ | 9.3 million | |
F-17
Restricted Stock —Under all restricted stock awards to date, shares were issued when granted, nonvested shares are subject to forfeiture for failure to fulfill service conditions and, in certain cases, performance conditions. Nonforfeitable dividends are paid on nonvested restricted shares. Restricted stock awards prior to January 1, 2006 were valued at the grant date market value of the underlying common stock, recognized as contra equity deferred compensation and amortized to expense under the “graded-vesting” method. Implementation of FAS 123(R) did not change the accounting for the Company’s nonvested stock awards, except as follows:
| | |
| | • | Prior to January 1, 2006, forfeitures were recognized as they occurred; |
| |
| | • | From January 1, 2006 forward, forfeitures are estimated in the determination of periodic compensation cost; |
| |
| | • | Contra equity deferred compensation was reversed againstpaid-in-capital at January 1, 2006; and |
| |
| | • | Compensation expense is recognized as attributed to each period. |
The Company uses the “graded-vesting” attribution method to determine periodic compensation cost from restricted stock awards.
Restricted stock activity for the year ended December 31, 2007 follows:
| | | | | | | | | |
| | | | | | Weighted-
| |
| | | | | | Average Grant
| |
| | | Shares | | | Date Fair Value | |
| |
| Nonvested restricted stock outstanding at beginning of year | | | 1,188,200 | | | $ | 25.92 | |
| Granted | | | 601,150 | | | $ | 24.60 | |
| Vested | | | (197,645 | ) | | $ | 19.37 | |
| Forfeited | | | (101,555 | ) | | $ | 26.51 | |
| | | | | | | | | |
| Nonvested restricted stock outstanding at end of year | | | 1,490,150 | | | $ | 26.22 | |
| | | | | | | | | |
As of December 31, 2007, approximately 1,440,000 shares of nonvested restricted stock outstanding are expected to vest. Additional information as of December 31, 2007 with respect to these shares that are expected to vest follows:
| | | |
| Aggregate intrinsic value | | $28.1 million |
| Weighted-average remaining vesting period | | 1.97 years |
| Unrecognized compensation cost | | $16.5 million |
Dividends on Equity Awards —Nonforfeitable dividends paid on equity awards are recognized as follows:
| | |
| | • | Dividends are recognized as reductions of retained earnings for the portion of equity awards expected to vest. |
| |
| | • | Dividends are recognized as additional compensation cost for the portion of equity awards that are not expected to vest or that ultimately do not vest. |
Vesting expectations, in regard to these dividend payments, correspond with forfeiture assumptions used to recognize compensation cost.
F-18
Prior Period Pro Forma Disclosures —Prior to January 1, 2006, the Company accounted for share-based compensation under the intrinsic value method. Other than the restricted stock discussed above, no additional share-based compensation expense was reflected in earnings prior to January 1, 2006 since the exercise price was equal to the grant-date market value of the underlying common stock for all stock options granted prior to that date. The effect of share-based compensation, as if the Company had applied the fair-value-based method proscribed by FAS 123, on net income and earnings per share for the year ended December 31, 2005 is as follows (in thousands, except per share amounts):
| | | | | |
| | | 2005 | |
| |
| Net income, as reported | | $ | 372,740 | |
| Add back: Share-based employee compensation cost, net of related tax effects, included in net income as reported | | | 1,795 | |
| Deduct: Share-based employee compensation cost, net of related tax effects, that would have been included in net income if the fair-value-based method had been applied to all awards | | | (11,119 | ) |
| | | | | |
| Pro-forma net income | | $ | 363,416 | |
| | | | | |
| Net income per common share: | | | | |
| Basic, as reported | | $ | 2.19 | |
| | | | | |
| Basic, pro-forma | | $ | 2.13 | |
| | | | | |
| Diluted, as reported | | $ | 2.15 | |
| | | | | |
| Diluted, pro-forma | | $ | 2.11 | |
| | | | | |
The Company incurred rent expense of $33.9 million, $31.8 million and $22.5 million, for the years 2007, 2006 and 2005, respectively. Rent expense is primarily related to short-term equipment rentals that are passed through to customers. The Company’s obligations under non-cancelable operating lease agreements are not material to the Company’s operations or cash flows.
The Company adopted FASB Interpretation No. 48,Accounting for Uncertainty in Income Taxes — an interpretation of FASB Statement No. 109(“FIN 48”), on January 1, 2007. FIN 48 clarifies the accounting for uncertainty in income taxes recognized in an enterprise’s financial statements and prescribes a recognition threshold and measurement attribute for the financial statement recognition and measurement of a tax position taken or expected to be taken in a tax return. As a result of the adoption of FIN 48 the Company reduced a reserve that had been established for an uncertain tax position that was taken with respect to a business combination. The reserve had originally been recorded as goodwill (see Note 5). The impact of adjustments to reserves with respect to other uncertain tax positions was not material. As of December 31, 2007, the Company had no unrecognized tax benefits. In connection with the adoption of FIN 48, the Company established a policy to account for interest and penalties related to uncertain income tax positions as operating expenses. As of December 31, 2007, the tax years ended December 31, 2004 through December 31, 2006 are open for examination by U.S. taxing authorities. As of December 31, 2007, the tax years ended December 31, 2003 through December 31, 2006 are open for examination by Canadian taxing authorities.
F-19
Components of the income tax provision applicable to Federal, state and foreign income taxes for the years ended December 31, 2007, 2006 and 2005 are as follows (in thousands):
| | | | | | | | | | | | | |
| | | 2007 | | | 2006 | | | 2005 | |
| |
| Federal income tax expense (benefit): | | | | | | | | | | | | |
| Current | | $ | 172,221 | | | $ | 344,395 | | | $ | 174,635 | |
| Deferred | | | 36,864 | | | | (5,851 | ) | | | 14,182 | |
| | | | | | | | | | | | | |
| | | | 209,085 | | | | 338,544 | | | | 188,817 | |
| | | | | | | | | | | | | |
| State income tax expense: | | | | | | | | | | | | |
| Current | | | 16,456 | | | | 21,371 | | | | 13,045 | |
| Deferred | | | 983 | | | | 1,392 | | | | 1,431 | |
| | | | | | | | | | | | | |
| | | | 17,439 | | | | 22,763 | | | | 14,476 | |
| | | | | | | | | | | | | |
| Foreign income tax expense: | | | | | | | | | | | | |
| Current | | | 5,220 | | | | 9,607 | | | | 7,238 | |
| Deferred | | | 424 | | | | 353 | | | | 1,488 | |
| | | | | | | | | | | | | |
| | | | 5,644 | | | | 9,960 | | | | 8,726 | |
| | | | | | | | | | | | | |
| Total: | | | | | | | | | | | | |
| Current | | | 193,897 | | | | 375,373 | | | | 194,918 | |
| Deferred | | | 38,271 | | | | (4,106 | ) | | | 17,101 | |
| | | | | | | | | | | | | |
| Total income tax expense | | $ | 232,168 | | | $ | 371,267 | | | $ | 212,019 | |
| | | | | | | | | | | | | |
The difference between the statutory Federal income tax rate and the effective income tax rate for the years ended December 31, 2007, 2006 and 2005 is summarized as follows:
| | | | | | | | | | | | | |
| | | 2007 | | | 2006 | | | 2005 | |
| |
| Statutory tax rate | | | 35.0 | % | | | 35.0 | % | | | 35.0 | % |
| State income taxes | | | 1.4 | | | | 1.4 | | | | 1.8 | |
| Permanent differences | | | (1.6 | ) | | | (0.8 | ) | | | (0.6 | ) |
| Other, net | | | (0.2 | ) | | | 0.0 | | | | 0.1 | |
| | | | | | | | | | | | | |
| Effective tax rate | | | 34.6 | % | | | 35.6 | % | | | 36.3 | % |
| | | | | | | | | | | | | |
F-20
The tax effect of significant temporary differences representing deferred tax assets and liabilities and changes therein were as follows (in thousands):
| | | | | | | | | | | | | | | | | | | | | | | | | | | | | |
| | | December
| | | | | | December
| | | | | | December
| | | | | | December
| |
| | | 31,
| | | Net
| | | 31,
| | | Net
| | | 31,
| | | Net
| | | 31,
| |
| | | 2007 | | | Change | | | 2006 | | | Change | | | 2005 | | | Change | | | 2004 | |
| |
| Deferred tax assets: | | | | | | | | | | | | | | | | | | | | | | | | | | | | |
| Current: | | | | | | | | | | | | | | | | | | | | | | | | | | | | |
| Federal net operating loss carryforwards | | $ | 374 | | | $ | (1,496 | ) | | $ | 1,870 | | | $ | — | | | $ | 1,870 | | | $ | — | | | $ | 1,870 | |
| Workers’ compensation allowance | | | 26,586 | | | | 223 | | | | 26,363 | | | | 6,902 | | | | 19,461 | | | | 4,584 | | | | 14,877 | |
| Embezzlement costs | | | 660 | | | | (13,634 | ) | | | 14,294 | | | | 14,294 | | | | — | | | | — | | | | — | |
| Other | | | 18,404 | | | | 3,903 | | | | 14,501 | | | | 3,137 | | | | 11,364 | | | | 4,386 | | | | 6,978 | |
| | | | | | | | | | | | | | | | | | | | | | | | | | | | | |
| | | | 46,024 | | | | (11,004 | ) | | | 57,028 | | | | 24,333 | | | | 32,695 | | | | 8,970 | | | | 23,725 | |
| | | | | | | | | | | | | | | | | | | | | | | | | | | | | |
| Non-current: | | | | | | | | | | | | | | | | | | | | | | | | | | | | |
| Federal net operating loss carryforwards | | | — | | | | (374 | ) | | | 374 | | | | (1,871 | ) | | | 2,245 | | | | (1,870 | ) | | | 4,115 | |
| AMT credit | | | 118 | | | | — | | | | 118 | | | | — | | | | 118 | | | | — | | | | 118 | |
| Federal benefit of foreign deferred tax liabilities | | | 8,973 | | | | 424 | | | | 8,549 | | | | 353 | | | | 8,196 | | | | 1,488 | | | | 6,708 | |
| Federal benefit of state deferred tax liabilities | | | 5,427 | | | | 735 | | | | 4,692 | | | | 460 | | | | 4,232 | | | | 717 | | | | 3,515 | |
| Embezzlement costs | | | — | | | | — | | | | — | | | | — | | | | — | | | | (22,178 | ) | | | 22,178 | |
| Other | | | 9,999 | | | | 2,890 | | | | 7,109 | | | | 6,172 | | | | 937 | | | | 174 | | | | 763 | |
| | | | | | | | | | | | | | | | | | | | | | | | | | | | | |
| | | | 24,517 | | | | 3,675 | | | | 20,842 | | | | 5,114 | | | | 15,728 | | | | (21,669 | ) | | | 37,397 | |
| | | | | | | | | | | | | | | | | | | | | | | | | | | | | |
| Total deferred tax assets | | | 70,541 | | | | (7,329 | ) | | | 77,870 | | | | 29,447 | | | | 48,423 | | | | (12,699 | ) | | | 61,122 | |
| | | | | | | | | | | | | | | | | | | | | | | | | | | | | |
| Deferred tax liabilities: | | | | | | | | | | | | | | | | | | | | | | | | | | | | |
| Current: | | | | | | | | | | | | | | | | | | | | | | | | | | | | |
| Other | | | (10,654 | ) | | | (2,492 | ) | | | (8,161 | ) | | | (1,848 | ) | | | (6,313 | ) | | | 1,421 | | | | (7,734 | ) |
| | | | | | | | | | | | | | | | | | | | | | | | | | | | | |
| Non-current: | | | | | | | | | | | | | | | | | | | | | | | | | | | | |
| Property and equipment basis difference | | | (231,965 | ) | | | (28,466 | ) | | | (203,500 | ) | | | (23,775 | ) | | | (179,725 | ) | | | (6,381 | ) | | | (173,344 | ) |
| Other | | | (12,042 | ) | | | (6,741 | ) | | | (5,301 | ) | | | (110 | ) | | | (5,191 | ) | | | (663 | ) | | | (4,528 | ) |
| | | | | | | | | | | | | | | | | | | | | | | | | | | | | |
| | | | (244,007 | ) | | | (35,207 | ) | | | (208,801 | ) | | | (23,885 | ) | | | (184,916 | ) | | | (7,044 | ) | | | (177,872 | ) |
| | | | | | | | | | | | | | | | | | | | | | | | | | | | | |
| Total deferred tax liabilities | | | (254,661 | ) | | | (37,699 | ) | | | (216,962 | ) | | | (25,733 | ) | | | (191,229 | ) | | | (5,623 | ) | | | (185,606 | ) |
| | | | | | | | | | | | | | | | | | | | | | | | | | | | | |
| Net deferred tax liability | | $ | (184,120 | ) | | $ | (45,028 | ) | | $ | (139,092 | ) | | $ | 3,714 | | | $ | (142,806 | ) | | $ | (18,322 | ) | | $ | (124,484 | ) |
| | | | | | | | | | | | | | | | | | | | | | | | | | | | | |
In assessing the realizability of deferred tax assets, management considers whether it is more likely than not that some portion or all of the deferred tax assets will not be realized. The ultimate realization of deferred tax assets is dependent upon the generation of future taxable income during the periods in which those temporary differences become deductible. Management considers the scheduled reversal of deferred tax liabilities, projected future taxable income and tax planning strategies in making this assessment. The Company expects the deferred tax assets at December 31, 2007 to be realized as a result of the reversal during the carryforward period of existing taxable temporary differences giving rise to deferred tax liabilities and the generation of taxable income in the carryforward period; therefore, no valuation allowance is necessary.
Management deducted accumulated net embezzlement losses in the Company’s 2005 tax returns, which corresponds with the period in which the embezzlement was detected.
F-21
Other deferred tax assets consist primarily of various allowance accounts and tax deferred expenses expected to generate future tax benefit of approximately $28 million. Other deferred tax liabilities consist primarily of receivables from insurance companies and tax deferred income not yet recognized for tax purposes.
For tax purposes, the Company has Federal net operating loss carryforwards of approximately $374,000 available at December 31, 2007. The Company has alternative minimum tax credit carryforwards of approximately $118,000 available at December 31, 2007. The net operating loss carryforwards, if unused, are scheduled to expire in 2019. The alternative minimum tax credit may be carried forward indefinitely.
The Company maintains a 401(k) plan for all eligible employees. The Company’s operating results include expenses of approximately $4.2 million in 2007, $3.1 million in 2006 and $2.7 million in 2005 for the Company’s contributions to the plan.
The Company’s revenues, operating profits and identifiable assets are primarily attributable to four business segments: (i) contract drilling of oil and natural gas wells, (ii) pressure pumping services, (iii) drilling and completion fluids services to operators in the oil and natural gas industry, and (iv) the exploration, development, acquisition and production of oil and natural gas. Each of these segments represents a distinct type of business based upon the type and nature of services and products offered. These segments have separate management teams which report to the Company’s chief operating decision maker and have distinct and identifiable revenues and expenses.
Contract Drilling — The Company markets its contract drilling services to major and independent oil and natural gas operators. As of December 31, 2007, the Company had 350 currently marketable land-based drilling rigs, of which 107 of the drilling rigs were based in the Permian Basin region, 51 in South Texas, 42 in the Ark-La-Tex region and Mississippi, 75 in the Mid-Continent region, 52 in the Rocky Mountain region, 3 in the Appalachian Basin and 20 in Western Canada.
Pressure Pumping — The Company provides pressure pumping services primarily in the Appalachian Basin. Pressure pumping services consist primarily of well stimulation and cementing for the completion of new wells and remedial work on existing wells. Well stimulation involves processes inside a well designed to enhance the flow of oil, natural gas, or other desired substances from the well. Cementing is the process of inserting material between the hole and the pipe to center and stabilize the pipe in the hole.
Drilling and Completion Fluids — The Company provides drilling fluids, completion fluids and related services to oil and natural gas operators offshore in the Gulf of Mexico and on land in Texas, Southeastern New Mexico, Oklahoma and the Gulf Coast region of Louisiana. Drilling and completion fluids are used by oil and natural gas operators during the drilling process to control pressure when drilling oil and natural gas wells.
Oil and Natural Gas — The Company has been engaged in the development, exploration, acquisition and production of oil and natural gas. Through October 31, 2007, the Company served as operator with respect to several properties and was actively involved in the development, exploration, acquisition and production of oil and natural gas. Effective November 1, 2007 the Company sold the related operations portion of its exploration and production business. The Company continues to own and invest in oil and natural gas assets as a working interest owner. The Company’s oil and natural gas interest are located primarily in producing regions of West and south Texas, Southeastern New Mexico, Utah and Mississippi.
F-22
The following tables summarize selected financial information relating to the Company’s business segments (in thousands):
| | | | | | | | | | | | | |
| | | Years Ended December 31, | |
| | | 2007 | | | 2006 | | | 2005 | |
| |
| Revenues: | | | | | | | | | | | | |
| Contract drilling(a) | | $ | 1,744,884 | | | $ | 2,174,805 | | | $ | 1,488,485 | |
| Pressure pumping | | | 202,812 | | | | 145,671 | | | | 93,144 | |
| Drilling and completion fluids(b) | | | 128,447 | | | | 192,974 | | | | 122,309 | |
| Oil and natural gas | | | 41,637 | | | | 39,187 | | | | 39,616 | |
| | | | | | | | | | | | | |
| Total segment revenues | | | 2,117,780 | | | | 2,552,637 | | | | 1,743,554 | |
| Elimination of intercompany revenues(a)(b) | | | (3,586 | ) | | | (6,051 | ) | | | (3,099 | ) |
| | | | | | | | | | | | | |
| Total revenues | | $ | 2,114,194 | | | $ | 2,546,586 | | | $ | 1,740,455 | |
| | | | | | | | | | | | | |
| Income before income taxes: | | | | | | | | | | | | |
| Contract drilling | | $ | 558,792 | | | $ | 991,449 | | | $ | 572,562 | |
| Pressure pumping | | | 64,257 | | | | 44,835 | | | | 21,664 | |
| Drilling and completion fluids | | | 6,528 | | | | 28,759 | | | | 12,201 | |
| Oil and natural gas | | | 10,998 | | | | 8,660 | | | | 13,405 | |
| | | | | | | | | | | | | |
| | | | 640,575 | | | | 1,073,703 | | | | 619,832 | |
| Corporate and other | | | (30,799 | ) | | | (27,639 | ) | | | (19,724 | ) |
| Embezzlement (costs) recoveries(c) | | | 43,955 | | | | (3,081 | ) | | | (20,043 | ) |
| Gain (loss) on disposal of assets(d) | | | 16,545 | | | | (3,819 | ) | | | 1,231 | |
| Interest income | | | 2,355 | | | | 5,925 | | | | 3,551 | |
| Interest expense | | | (2,187 | ) | | | (1,602 | ) | | | (516 | ) |
| Other | | | 363 | | | | 347 | | | | 428 | |
| | | | | | | | | | | | | |
| Income before income taxes | | $ | 670,807 | | | $ | 1,043,834 | | | $ | 584,759 | |
| | | | | | | | | | | | | |
| Identifiable assets: | | | | | | | | | | | | |
| Contract drilling | | $ | 2,132,910 | | | $ | 1,849,923 | | | $ | 1,421,779 | |
| Pressure pumping | | | 154,120 | | | | 111,787 | | | | 72,536 | |
| Drilling and completion fluids | | | 91,989 | | | | 106,032 | | | | 90,904 | |
| Oil and natural gas | | | 37,885 | | | | 65,443 | | | | 60,785 | |
| Corporate and other(e) | | | 48,295 | | | | 59,318 | | | | 149,777 | |
| | | | | | | | | | | | | |
| Total assets | | $ | 2,465,199 | | | $ | 2,192,503 | | | $ | 1,795,781 | |
| | | | | | | | | | | | | |
| Depreciation, depletion and impairment: | | | | | | | | | | | | |
| Contract drilling | | $ | 213,812 | | | $ | 168,607 | | | $ | 131,740 | |
| Pressure pumping | | | 14,311 | | | | 9,896 | | | | 7,094 | |
| Drilling and completion fluids | | | 2,860 | | | | 2,706 | | | | 2,368 | |
| Oil and natural gas | | | 17,410 | | | | 14,368 | | | | 14,456 | |
| Corporate and other | | | 813 | | | | 793 | | | | 735 | |
| | | | | | | | | | | | | |
| Total depreciation, depletion and impairment | | $ | 249,206 | | | $ | 196,370 | | | $ | 156,393 | |
| | | | | | | | | | | | | |
| Capital expenditures: | | | | | | | | | | | | |
| Contract drilling | | $ | 539,506 | | | $ | 531,087 | | | $ | 329,073 | |
| Pressure pumping | | | 47,582 | | | | 41,262 | | | | 25,508 | |
| Drilling and completion fluids | | | 3,082 | | | | 4,222 | | | | 3,042 | |
| Oil and natural gas | | | 17,516 | | | | 21,198 | | | | 17,163 | |
| Corporate and other | | | — | | | | 150 | | | | 5,308 | |
| | | | | | | | | | | | | |
| Total capital expenditures | | $ | 607,686 | | | $ | 597,919 | | | $ | 380,094 | |
| | | | | | | | | | | | | |
| | |
| (a) | | Includes contract drilling intercompany revenues of approximately $3.2 million, $5.4 million and $2.8 million for the years ended December 31, 2007, 2006 and 2005, respectively. |
| |
| (b) | | Includes drilling and completion fluids intercompany revenues of approximately $348,000, $616,000 and $298,000 for the years ended December 31, 2007, 2006 and 2005, respectively. |
F-23
| | |
| (c) | | The Company’s former CFO has pleaded guilty to criminal charges and has been sentenced and is serving a term of imprisonment arising out of his embezzlement of funds from the Company. Embezzlement costs in 2005 and 2006 include embezzled funds and other costs incurred as a result of the embezzlement. The Company expects to recover a total of approximately $44.5 million in assets seized by a court-appointed receiver from the former CFO and companies that he controlled. Cash payments from the receiver of approximately $41.2 million have been received as of December 31, 2007, with the remaining $3.3 million of the expected recovery consisting of notes receivable, investments and other assets that have been or are expected to be transferred to the Company. The embezzlement recovery in 2007 includes the recognition of this recovery, net of professional and other costs incurred as a result of the embezzlement. |
| |
| (d) | | Gains or losses associated with the disposal of assets relate to decisions of the executive management group regarding corporate strategy. Accordingly, the related gains or losses have been separately presented and excluded from the results of specific segments. |
| |
| (e) | | Corporate and other assets primarily include cash on hand managed by the parent corporation and certain deferred Federal income tax assets. |
| |
| 16. | Quarterly Financial Information (in thousands, except per share amounts) (unaudited) |
| | | | | | | | | | | | | | | | | |
| | | 1st Quarter | | | 2nd Quarter | | | 3rd Quarter | | | 4th Quarter | |
| |
2007 | | | | | | | | | | | | | | | | |
| Operating revenues | | $ | 547,101 | | | $ | 522,558 | | | $ | 524,002 | | | $ | 520,533 | |
| Operating income | | | 179,725 | | | | 215,136 | | | | 144,100 | | | | 131,315 | |
| Net income | | | 115,801 | | | | 139,551 | | | | 98,181 | | | | 85,106 | |
| Net income per common share: | | | | | | | | | | | | | | | | |
| Basic | | $ | 0.75 | | | $ | 0.90 | | | $ | 0.63 | | | $ | 0.56 | |
| Diluted | | $ | 0.73 | | | $ | 0.88 | | | $ | 0.62 | | | $ | 0.55 | |
2006 | | | | | | | | | | | | | | | | |
| Operating revenues | | $ | 597,733 | | | $ | 636,813 | | | $ | 673,658 | | | $ | 638,382 | |
| Operating income | | | 245,599 | | | | 268,913 | | | | 281,905 | | | | 242,747 | |
| Net income | | | 159,256 | | | | 171,690 | | | | 185,990 | | | | 156,318 | |
| Net income per common share: | | | | | | | | | | | | | | | | |
| Basic | | $ | 0.93 | | | $ | 1.02 | | | $ | 1.14 | | | $ | 0.99 | |
| Diluted | | $ | 0.91 | | | $ | 1.00 | | | $ | 1.12 | | | $ | 0.97 | |
| |
| 17. | Concentrations of Credit Risk |
Financial instruments, which potentially subject the Company to concentrations of credit risk, consist primarily of demand deposits, temporary cash investments and trade receivables.
The Company believes it has placed its demand deposits and temporary cash investments with high credit quality financial institutions. At December 31, 2007 and 2006, the Company’s demand deposits and temporary cash investments consisted of the following (in thousands):
| | | | | | | | | |
| | | 2007 | | | 2006 | |
| |
| Deposits in FDIC and SIPC-insured institutions under $100,000 | | $ | 462 | | | $ | 684 | |
| Deposits in FDIC and SIPC-insured institutions over $100,000 | | | 53,112 | | | | 21,859 | |
| Deposits in Foreign Banks | | | 6,282 | | | | 3,754 | |
| | | | | | | | | |
| | | | 59,856 | | | | 26,297 | |
| Less outstanding checks and other reconciling items | | | (42,422 | ) | | | (12,912 | ) |
| | | | | | | | | |
| Cash and cash equivalents | | $ | 17,434 | | | $ | 13,385 | |
| | | | | | | | | |
F-24
Concentrations of credit risk with respect to trade receivables are primarily focused on companies involved in the exploration and development of oil and natural gas properties. The concentration is somewhat mitigated by the diversification of customers for which the Company provides services. As is general industry practice, the Company typically does not require customers to provide collateral. No significant losses from individual customers were experienced during the years ended December 31, 2007, 2006, or 2005. The Company recognized bad debt expense for 2007, 2006 and 2005 of $2.6 million, $5.4 million and $1.2 million, respectively.
The carrying values of cash and cash equivalents and trade receivables approximate fair value due to the short-term maturity of these items.
| |
| 18. | Related Party Transactions |
Joint Operation of Oil and Natural Gas Properties — Through October 31, 2007, the Company served as operator with respect to several properties and was actively involved in the development, exploration, acquisition and production of oil and natural gas. Effective November 1, 2007, the Company sold the operations portion of its exploration and production business. The Company continues to own and invest in oil and natural gas assets as a working interest owner. During the time that the Company served as operator, it served as operator with respect to certain oil and natural gas properties in which certain of its affiliated persons have participated, either individually or through entities they control. These participations have typically been through working interests in prospects or properties originated or acquired by Patterson Petroleum, LLC, a wholly owned subsidiary of Patterson-UTI.
During the time that the Company served as operator, sales of working interests to affiliated parties were made by Patterson-UTI at its cost, comprised of Patterson-UTI’s costs of acquiring and preparing the working interests for sale plus a promote fee in some cases. These costs were paid by the working interest owners on a pro rata basis based upon their working interest ownership percentage. The price at which working interests were sold to affiliated persons was the same price at which working interests were sold to unaffiliated persons except that in some cases the affiliated persons also paid a promote fee. The affiliated persons received oil and natural gas production revenue (net of royalty) of $19.0 million, $15.8 million and $15.5 million from these properties in 2007, 2006 and 2005, respectively. These persons or entities in turn paid for joint operating costs (including drilling and other development expenses) of $9.2 million, $14.1 million and $9.5 million incurred in 2007, 2006 and 2005, respectively. These activities resulted in a payable to the affiliated persons of $0 and approximately $1.5 million and a receivable from the affiliated persons of $0 and approximately $1.6 million at December 31, 2007 and 2006, respectively.
F-25
| | | | | | | | | | | | | | | | | |
| | | | | | Charged to
| | | | | | | |
| | | | | | Costs and
| | | | | | | |
Description | | Beginning Balance | | | Expenses(1) | | | Deductions(2) | | | Ending Balance | |
| | | (In thousands) | |
| |
Year Ended December 31, 2007 | | | | | | | | | | | | | | | | |
| Deducted from asset accounts: | | | | | | | | | | | | | | | | |
| Allowance for doubtful accounts | | $ | 7,484 | | | $ | 2,550 | | | $ | 20 | | | $ | 10,014 | |
Year Ended December 31, 2006 | | | | | | | | | | | | | | | | |
| Deducted from asset accounts: | | | | | | | | | | | | | | | | |
| Allowance for doubtful accounts | | $ | 2,199 | | | $ | 5,400 | | | $ | 115 | | | $ | 7,484 | |
Year Ended December 31, 2005 | | | | | | | | | | | | | | | | |
| Deducted from asset accounts: | | | | | | | | | | | | | | | | |
| Allowance for doubtful accounts | | $ | 1,909 | | | $ | 1,231 | | | $ | 941 | | | $ | 2,199 | |
| | |
| (1) | | Net of recoveries. |
| |
| (2) | | Uncollectible accounts written off. |
S-1
SIGNATURES
Pursuant to the requirements of Section 13 or 15(d) of the Securities Exchange Act of 1934, Patterson-UTI Energy, Inc. has duly caused this Report onForm 10-K to be signed on its behalf by the undersigned, thereunto duly authorized.
PATTERSON-UTI ENERGY, INC.
Douglas J. Wall
President and Chief Executive Officer
Date: February 19, 2008
Pursuant to the requirements of the Securities Exchange Act of 1934, this Report onForm 10-K has been signed by the following persons on behalf of Patterson-UTI Energy, Inc. and in the capacities indicated as of February 19, 2008.
| | | | | |
Signature | | Title |
| |
| | | |
/s/ Mark S. Siegel Mark S. Siegel | | Chairman of the Board |
| | | |
/s/ Douglas J. Wall Douglas J. Wall (Principal Executive Officer) | | President and Chief Executive Officer |
| | | |
/s/ John E. Vollmer III John E. Vollmer III (Principal Financial Officer) | | Senior Vice President — Corporate Development, Chief Financial Officer and Treasurer |
| | | |
/s/ Gregory W. Pipkin Gregory W. Pipkin (Principal Accounting Officer) | | Chief Accounting Officer and Assistant Secretary |
| | | |
/s/ Kenneth N. Berns Kenneth N. Berns | | Senior Vice President and Director |
| | | |
/s/ Charles O. Buckner Charles O. Buckner | | Director |
| | | |
/s/ Cloyce A. Talbott Cloyce A. Talbott | | Director |
| | | |
/s/ Curtis W. Huff Curtis W. Huff | | Director |
| | | |
/s/ Terry H. Hunt Terry H. Hunt | | Director |
| | | |
/s/ Kenneth R. Peak Kenneth R. Peak | | Director |
EXHIBIT INDEX
| | | | | |
| | 3 | .1 | | Restated Certificate of Incorporation, as amended (filed August 9, 2004 as Exhibit 3.1 to the Company’s Quarterly Report onForm 10-Q for the quarterly period ended June 30, 2004 and incorporated herein by reference). |
| | 3 | .2 | | Amendment to Restated Certificate of Incorporation, as amended (filed August 9, 2004 as Exhibit 3.2 to the Company’s Quarterly Report onForm 10-Q for the quarterly period ended June 30, 2004 and incorporated herein by reference). |
| | 3 | .3 | | Second Amended and Restated Bylaws (filed August 6, 2007 as Exhibit 3.3 to the Company’s Quarterly Report onForm 10-Q for the quarterly period ended June 30, 2007 and incorporated herein by reference). |
| | 4 | .1 | | Rights Agreement dated January 2, 1997, between Patterson Energy, Inc. and Continental Stock Transfer & Trust Company (filed January 14, 1997 as Exhibit 2 to the Company’s Registration Statement onForm 8-A and incorporated herein by reference). |
| | 4 | .2 | | Amendment to Rights Agreement dated as of October 23, 2001 (filed October 31, 2001 as Exhibit 3.4 to the Company’s Quarterly Report onForm 10-Q for the quarterly period ended September 30, 2001 and incorporated herein by reference). |
| | 4 | .3 | | Restated Certificate of Incorporation, as amended (See Exhibits 3.1 and 3.2). |
| | 4 | .4 | | Registration Rights Agreement with Bear, Stearns and Co. Inc., dated March 25, 1994, as assigned by REMY Capital Partners III, L.P. (filed March 19, 2002 as Exhibit 4.3 to the Company’s Annual Report onForm 10-K for the fiscal year ended December 31, 2001 and incorporated herein by reference). |
| | 10 | .1 | | For additional material contracts, see Exhibits 4.1, 4.2 and 4.4. |
| | 10 | .2 | | Patterson-UTI Energy, Inc., 1993 Stock Incentive Plan, as amended (filed March 13, 1998 as Exhibit 10.1 to the Company’s Registration Statement onForm S-8 (FileNo. 333-47917) and incorporated herein by reference).* |
| | 10 | .3 | | Patterson-UTI Energy, Inc. Non-Employee Directors’ Stock Option Plan, as amended (filed November 4, 1997 as Exhibit 10.1 to the Company’s Registration Statement onForm S-8 (FileNo. 333-39471) and incorporated herein by reference).* |
| | 10 | .4 | | Amended and Restated Patterson-UTI Energy, Inc. 2001 Long-Term Incentive Plan (filed November 27, 2002 as Exhibit 4.4 to Post Effective Amendment No. 1 to the Company’s Registration Statement onForm S-8 (FileNo. 333-60470) and incorporated herein by reference).* |
| | 10 | .5 | | Patterson-UTI Energy, Inc. Amended and Restated 1997 Long-Term Incentive Plan (filed July 28, 2003 as Exhibit 4.7 to the Company’s Quarterly Report onForm 10-Q for the quarterly period ended June 30, 2003 and incorporated herein by reference).* |
| | 10 | .6 | | Amendment to the Patterson-UTI Energy, Inc. Amended and Restated 1997 Long-Term Incentive Plan (filed August 9, 2004 as Exhibit 10.7 to the Company’s Quarterly Report onForm 10-Q for the quarterly period ended June 30, 2004 and incorporated herein by reference).* |
| | 10 | .7 | | Amended and Restated Patterson-UTI Energy, Inc. Non-Employee Director Stock Option Plan(filed July 28, 2003 as Exhibit 4.8 to the Company’s Quarterly Report onForm 10-Q for the quarterly period ended June 30, 2003 and incorporated herein by reference).* |
| | 10 | .8 | | Amended and Restated Patterson-UTI Energy, Inc. 1996 Employee Stock Option Plan (filed July 25, 2001 as Exhibit 4.4 to Post-Effective Amendment No. 1 to the Company’s Registration Statement onForm S-8 (FileNo. 333-60466) and incorporated herein by reference).* |
| | 10 | .9 | | Patterson-UTI Energy, Inc. 2005 Long-Term Incentive Plan, including Form of Executive Officer Restricted Stock Award Agreement, Form of Executive Officer Stock Option Agreement, Form of Non-Employee Director Restricted Stock Award Agreement and Form of Non-Employee Director Stock Option Agreement (filed June 21, 2005 as Exhibit 10.1 to the Company’s Current Report onForm 8-K, and incorporated herein by reference).* |
| | 10 | .10 | | Restricted Stock Award Agreement dated April 28, 2004 between Patterson-UTI Energy, Inc. and Mark S. Siegel (filed August 9, 2004 as Exhibit 10.1 to the Company’s Quarterly Report onForm 10-Q for the quarterly period ended June 30, 2004 and incorporated herein by reference).* |
| | 10 | .11 | | Restricted Stock Award Agreement dated April 28, 2004 between Patterson-UTI Energy, Inc. and Cloyce A. Talbott (filed August 9, 2004 as Exhibit 10.2 to the Company’s Quarterly Report onForm 10-Q for the quarterly period ended June 30, 2004 and incorporated herein by reference).* |
| | | | | |
| | 10 | .12 | | Restricted Stock Award Agreement dated April 28, 2004 between Patterson-UTI Energy, Inc. and Kenneth N. Berns (filed August 9, 2004 as Exhibit 10.4 to the Company’s Quarterly Report onForm 10-Q for the quarterly period ended June 30, 2004 and incorporated herein by reference).* |
| | 10 | .13 | | Restricted Stock Award Agreement dated April 28, 2004 between Patterson-UTI Energy, Inc. and John E. Vollmer III (filed August 9, 2004 as Exhibit 10.6 to the Company’s Quarterly Report onForm 10-Q for the quarterly period ended June 30, 2004 and incorporated herein by reference).* |
| | 10 | .14 | | Patterson-UTI Energy, Inc. Change in Control Agreement, effective as of January 29, 2004, by and between Patterson-UTI Energy, Inc. and Mark S. Siegel (filed on February 4, 2004 as Exhibit 10.2 to the Company’s Annual Report onForm 10-K for the year ended December 31, 2003 and incorporated herein by reference).* |
| | 10 | .15 | | Employment Agreement, dated as of September 1, 2007 between Patterson-UTI Energy, Inc. and Cloyce A. Talbott (filed on September 24, 2007 as Exhibit 10.1 to the Company’s Current Report onForm 8-K, and incorporated herein by reference).* |
| | 10 | .16 | | Patterson-UTI Energy, Inc. Change in Control Agreement, effective as of January 29, 2004, by and between Patterson-UTI Energy, Inc. and Kenneth N. Berns (filed on February 4, 2004 as Exhibit 10.5 to the Company’s Annual Report onForm 10-K for the year ended December 31, 2003 and incorporated herein by reference).* |
| | 10 | .17 | | Patterson-UTI Energy, Inc. Change in Control Agreement, effective as of January 29, 2004, by and between Patterson-UTI Energy, Inc. and John E. Vollmer III (filed on February 4, 2004 as Exhibit 10.7 to the Company’s Annual Report onForm 10-K for the year ended December 31, 2003 and incorporated herein by reference).* |
| | 10 | .18 | | Form of Letter Agreement regarding termination, effective as of January 29, 2004, entered into by Patterson-UTI Energy, Inc. with each of Mark S. Siegel, Kenneth N. Berns and John E. Vollmer III (filed on February 25, 2005 as Exhibit 10.23 to the Company’s Annual Report onForm 10-K for the year ended December 31, 2004 and incorporated herein by reference).* |
| | 10 | .19 | | Form of Indemnification Agreement entered into by Patterson-UTI Energy, Inc. with each of Mark S. Siegel, Cloyce A. Talbott, Douglas J. Wall, Kenneth N. Berns, Curtis W. Huff, Terry H. Hunt, Kenneth R. Peak, Charles O. Buckner, John E. Vollmer III, William L. Moll, Jr. and Gregory W. Pipkin (filed April 28, 2004 as Exhibit 10.11 to the Company’s Annual Report onForm 10-K, as amended, for the year ended December 31, 2003 and incorporated herein by reference).* |
| | 10 | .20 | | Severance Agreement between Patterson-UTI Energy, Inc. and Douglas J. Wall, effective as of August 31, 2007 (filed September 4, 2007 as Exhibit 10.3 to the Company’s Current Report onForm 8-K and incorporated herein by reference).* |
| | 10 | .21 | | Patterson-UTI Energy, Inc. Change in Control Agreement, effective as of August 31, 2007, by and between Patterson-UTI Energy, Inc. and Douglas J. Wall (filed September 4, 2007 as Exhibit 10.2 to the Company’s Current Report onForm 8-K and incorporated herein by reference).* |
| | 10 | .22 | | Patterson-UTI Energy, Inc. Change in Control Agreement, effective as of August 31, 2007, by and between Patterson-UTI Energy, Inc. and William L. Moll, Jr. (filed November 5, 2007 as Exhibit 10.7 to the Company’s Quarterly Report onForm 10-Q for the quarterly period ended September 30, 2007 and incorporated herein by reference).* |
| | 10 | .23 | | First Amendment to Change in Control Agreement Between Patterson-UTI Energy, Inc. and Mark S. Siegel, entered into November 1, 2007 (filed November 5, 2007 as Exhibit 10.8 to the Company’s Quarterly Report onForm 10-Q for the quarterly period ended September 30, 2007 and incorporated herein by reference).* |
| | 10 | .24 | | First Amendment to Change in Control Agreement Between Patterson-UTI Energy, Inc. and Douglas J. Wall, entered into November 1, 2007 (filed November 5, 2007 as Exhibit 10.9 to the Company’s Quarterly Report onForm 10-Q for the quarterly period ended September 30, 2007 and incorporated herein by reference).* |
| | 10 | .25 | | First Amendment to Change in Control Agreement Between Patterson-UTI Energy, Inc. and John E. Vollmer, III, entered into November 1, 2007 (filed November 5, 2007 as Exhibit 10.10 to the Company’s Quarterly Report onForm 10-Q for the quarterly period ended September 30, 2007 and incorporated herein by reference).* |
| | 10 | .26 | | First Amendment to Change in Control Agreement Between Patterson-UTI Energy, Inc. and Kenneth N. Berns, entered into November 1, 2007 (filed November 5, 2007 as Exhibit 10.11 to the Company’s Quarterly Report onForm 10-Q for the quarterly period ended September 30, 2007 and incorporated herein by reference).* |
| | | | | |
| | 10 | .27 | | First Amendment to Change in Control Agreement Between Patterson-UTI Energy, Inc. and William L. Moll, Jr., entered into November 1, 2007 (filed November 5, 2007 as Exhibit 10.12 to the Company’s Quarterly Report onForm 10-Q for the quarterly period ended September 30, 2007 and incorporated herein by reference).* |
| | 10 | .28 | | Credit Agreement dated as of December 17, 2004 among Patterson-UTI Energy, Inc., as the Borrower, Bank of America, N.A., as administrative agent, L/C Issuer and a Lender and the other lenders and agents party thereto (filed on December 23, 2004 as Exhibit 10.1 to the Company’s Current Report onForm 8-K and incorporated herein by reference). |
| | 10 | .29 | | Commitment Increase and Joinder Agreement, dated as of August 2, 2006, by and among Patterson-UTI Energy, Inc., the guarantors party thereto, the lenders party thereto, and Bank of America, N.A. as Administrative Agent, L/C Issuer and Lender (filed August 21, 2006 as Exhibit 10.1 to the Company’s Current Report onForm 8-K and incorporated herein by reference). |
| | 10 | .30 | | Letter Agreement dated February 6, 2006 between Patterson-UTI Energy, Inc. and John E. Vollmer III (filed May 1, 2006 as Exhibit 10.25 to the Company’s Annual Report onForm 10-K, as amended, and incorporated herein by reference).* |
| | 14 | .1 | | Patterson-UTI Energy, Inc. Code of Business Conduct and Ethics for Senior Financial Executives (filed on February 4, 2004 as Exhibit 14.1 to the Company’s Annual Report onForm 10-K for the year ended December 31, 2003 and incorporated herein by reference). |
| | 21 | .1 | | Subsidiaries of the Registrant. |
| | 23 | .1 | | Consent of Independent Registered Public Accounting Firm. |
| | 31 | .1 | | Certification of Chief Executive Officer pursuant toRule 13a-14(a)/15d-14(a) of the Securities Exchange Act of 1934, as amended. |
| | 31 | .2 | | Certification of Chief Financial Officer pursuant toRule 13a-14(a)/15d-14(a) of the Securities Exchange Act of 1934, as amended. |
| | 32 | .1 | | Certification of Chief Executive Officer and Chief Financial Officer pursuant to 18 USC Section 1350, as adopted pursuant to Section 906 of the Sarbanes-Oxley Act of 2002. |
| | |
| * | | Management Contract or Compensatory Plan identified as required by Item 15(a)(3) ofForm 10-K. |