Exhibit 99.1

| INSTITUTIONAL INVESTOR DAY February 19, 2009 |
| FORWARD LOOKING STATEMENTS In this presentation we may make certain forward-looking statements. The Company's ability to predict results or the actual effect of future plans or strategies is inherently uncertain. For more information about these risks and uncertainties, we refer you to our public reports on file with the SEC. |

| KEYNOTE ADDRESS Larry D. Richman, Chief Executive Officer & President |
| FINANCIAL UPDATE Mark P. Holmes, Interim Chief Financial Officer |
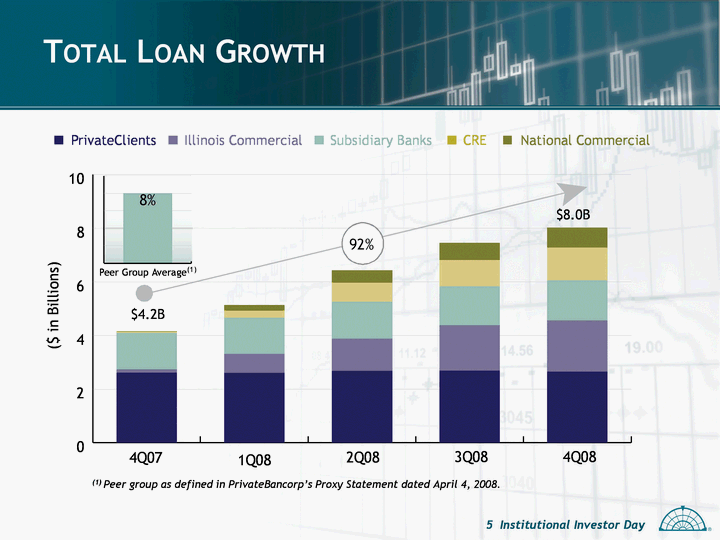
| TOTAL LOAN GROWTH (1) Peer group as defined in PrivateBancorp's Proxy Statement dated April 4, 2008. |
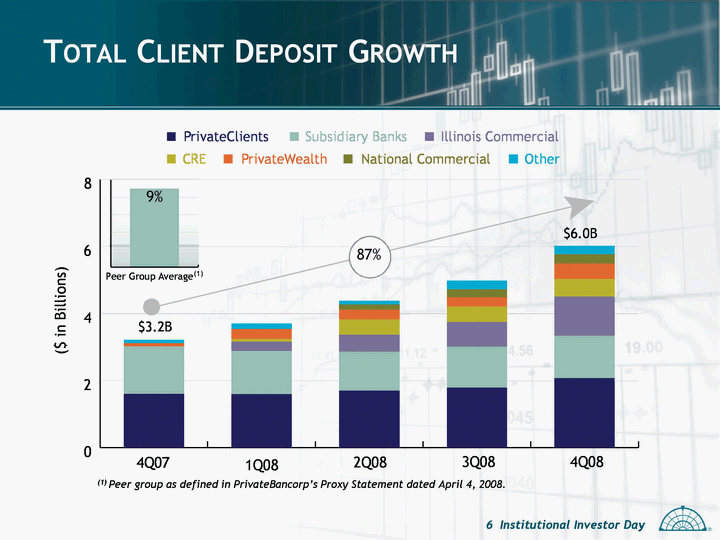
| TOTAL CLIENT DEPOSIT GROWTH (1) Peer group as defined in PrivateBancorp's Proxy Statement dated April 4, 2008. |
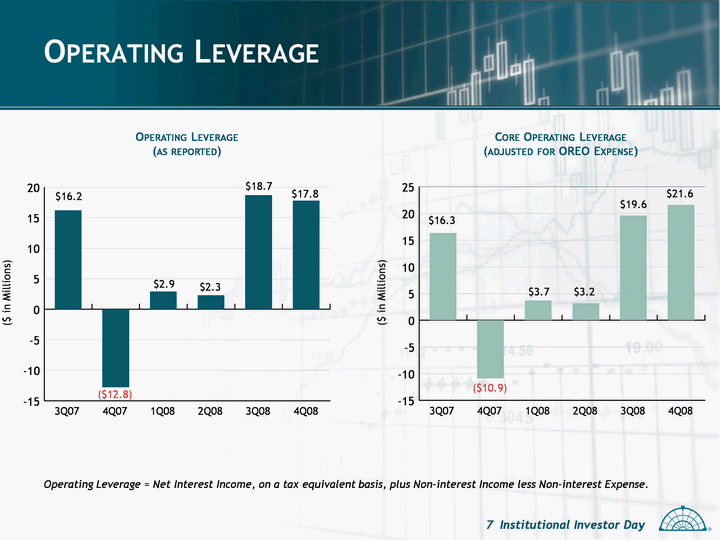
| OPERATING LEVERAGE OPERATING LEVERAGE (AS REPORTED) CORE OPERATING LEVERAGE (ADJUSTED FOR OREO EXPENSE) Operating Leverage = Net Interest Income, on a tax equivalent basis, plus Non-interest Income less Non-interest Expense. |
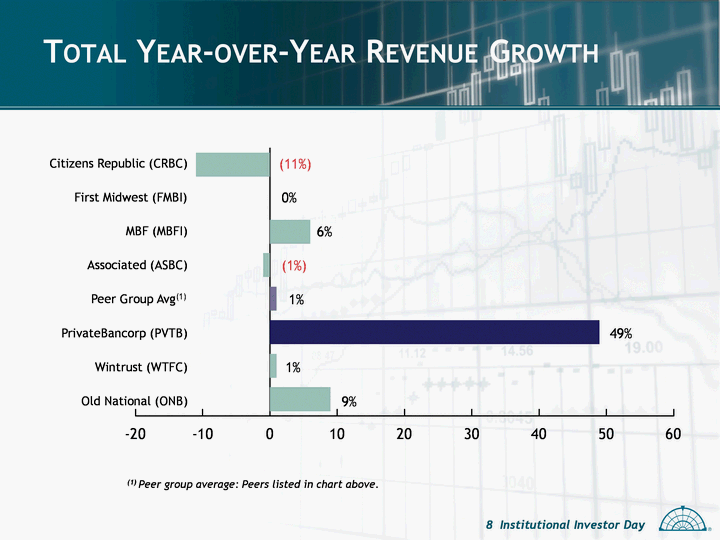
| Old National Bancorp 1.34 Wintrust Financial Corporation 1.44 PrivateBancorp, Inc. 1.64 Associated Banc-Corp 2 MB Financial, Inc. 2.34 First Midwest Bancorp, Inc. 2.44 Citizens Republic Bancorp, Inc. 4.13 TOTAL YEAR-OVER-YEAR REVENUE GROWTH (1) Peer group average: Peers listed in chart above. |
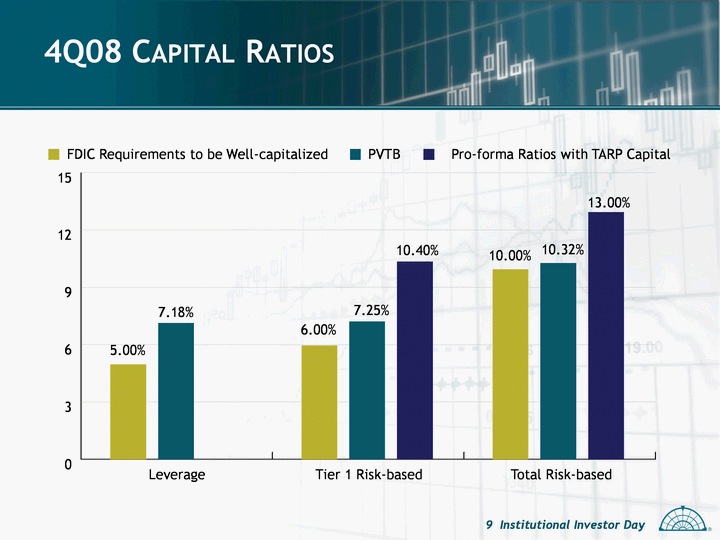
| 4Q08 CAPITAL RATIOS |

| RISK MANAGEMENT UPDATE Kevin J. Van Solkema, Chief Risk Officer |
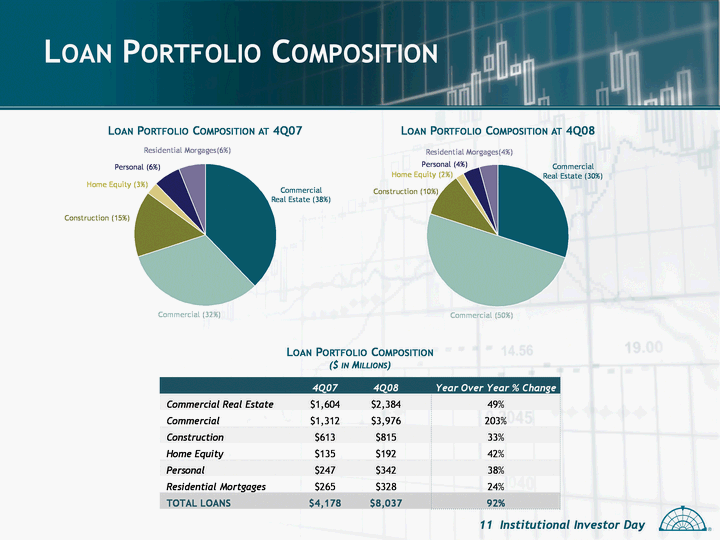
| LOAN PORTFOLIO COMPOSITION LOAN PORTFOLIO COMPOSITION AT 4Q07 LOAN PORTFOLIO COMPOSITION AT 4Q08 4Q07 4Q08 Year Over Year % Change Commercial Real Estate $1,604 $2,384 49% Commercial $1,312 $3,976 203% Construction $613 $815 33% Home Equity $135 $192 42% Personal $247 $342 38% Residential Mortgages $265 $328 24% TOTAL LOANS $4,178 $8,037 92% LOAN PORTFOLIO COMPOSITION ($ IN MILLIONS) |

| LOAN PORTFOLIO COMPOSITION LOAN PORTFOLIO COMPOSITION ($ in 000) YTD Loan Growth Chicago 128% St. Louis / Kansas City 11% Michigan 28% Wisconsin 3% Atlanta -2% TOTAL 92% |
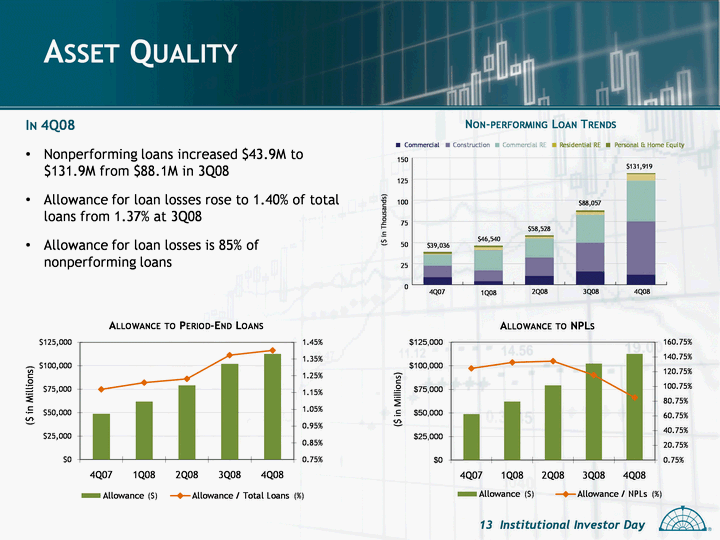
| ASSET QUALITY IN 4Q08 Nonperforming loans increased $43.9M to $131.9M from $88.1M in 3Q08 Allowance for loan losses rose to 1.40% of total loans from 1.37% at 3Q08 Allowance for loan losses is 85% of nonperforming loans NON-PERFORMING LOAN TRENDS ($) (%) ($) (%) |
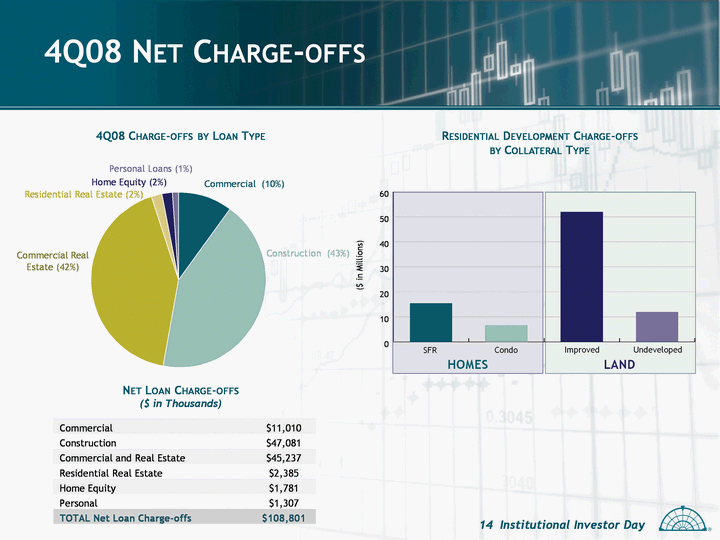
| 4Q08 NET CHARGE-OFFS 4Q08 CHARGE-OFFS BY LOAN TYPE RESIDENTIAL DEVELOPMENT CHARGE-OFFS BY COLLATERAL TYPE Commercial $11,010 Construction $47,081 Commercial and Real Estate $45,237 Residential Real Estate $2,385 Home Equity $1,781 Personal $1,307 TOTAL Net Loan Charge-offs $108,801 NET LOAN CHARGE-OFFS ($ in Thousands) |
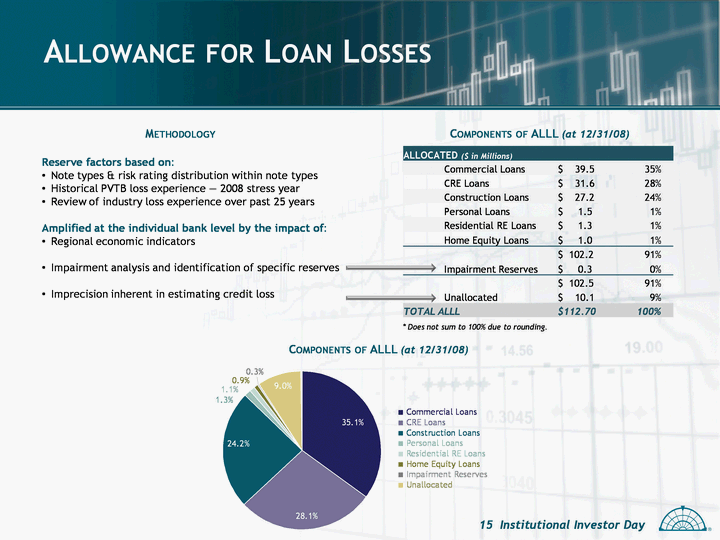
| ALLOWANCE FOR LOAN LOSSES COMPONENTS OF ALLL (at 12/31/08) ALLOCATED ($ in Millions) ALLOCATED ($ in Millions) Commercial Loans $ 39.5 35% CRE Loans $ 31.6 28% Construction Loans $ 27.2 24% Personal Loans $ 1.5 1% Residential RE Loans $ 1.3 1% Home Equity Loans $ 1.0 1% $ 102.2 91% Impairment Reserves $ 0.3 0% $ 102.5 91% Unallocated $ 10.1 9% TOTAL ALLL TOTAL ALLL $112.70 100% * Does not sum to 100% due to rounding. Reserve factors based on: Note types & risk rating distribution within note types Historical PVTB loss experience - 2008 stress year Review of industry loss experience over past 25 years Amplified at the individual bank level by the impact of: Regional economic indicators Impairment analysis and identification of specific reserves Imprecision inherent in estimating credit loss METHODOLOGY COMPONENTS OF ALLL (at 12/31/08) |
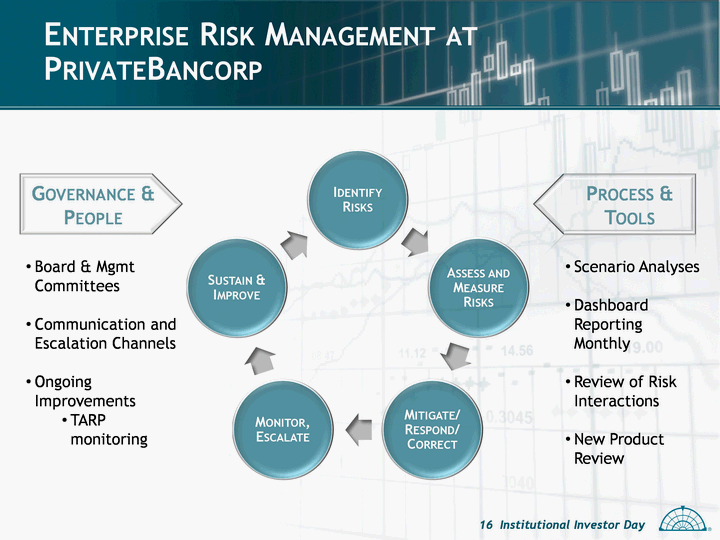
| ENTERPRISE RISK MANAGEMENT AT PRIVATEBANCORP PRIVATEBANCORP PRIVATEBANCORP GOVERNANCE & PEOPLE Board & Mgmt Committees Communication and Escalation Channels Ongoing Improvements TARP monitoring PROCESS & TOOLS Scenario Analyses Dashboard Reporting Monthly Review of Risk Interactions New Product Review |
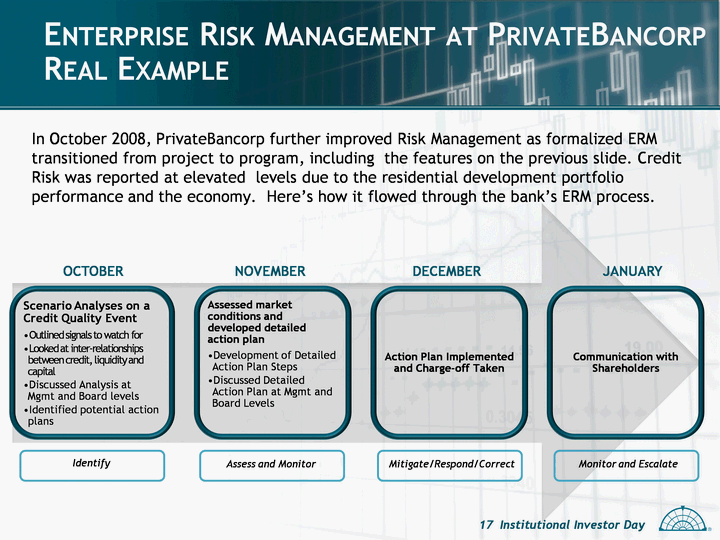
| ENTERPRISE RISK MANAGEMENT AT PRIVATEBANCORP REAL EXAMPLE In October 2008, PrivateBancorp further improved Risk Management as formalized ERM transitioned from project to program, including the features on the previous slide. Credit Risk was reported at elevated levels due to the residential development portfolio performance and the economy. Here's how it flowed through the bank's ERM process. OCTOBER NOVEMBER DECEMBER JANUARY Identify Assess and Monitor Mitigate/Respond/Correct Monitor and Escalate |
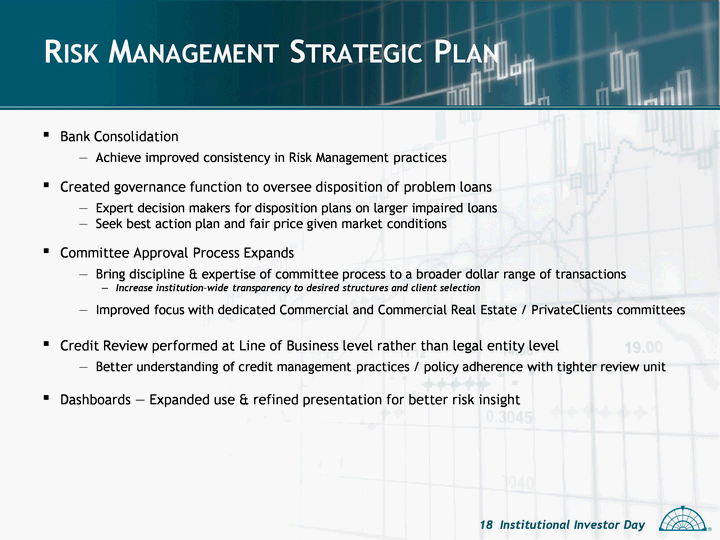
| RISK MANAGEMENT STRATEGIC PLAN Bank Consolidation Achieve improved consistency in Risk Management practices Created governance function to oversee disposition of problem loans Expert decision makers for disposition plans on larger impaired loans Seek best action plan and fair price given market conditions Committee Approval Process Expands Bring discipline & expertise of committee process to a broader dollar range of transactions Increase institution-wide transparency to desired structures and client selection Improved focus with dedicated Commercial and Commercial Real Estate / PrivateClients committees Credit Review performed at Line of Business level rather than legal entity level Better understanding of credit management practices / policy adherence with tighter review unit Dashboards - Expanded use & refined presentation for better risk insight |
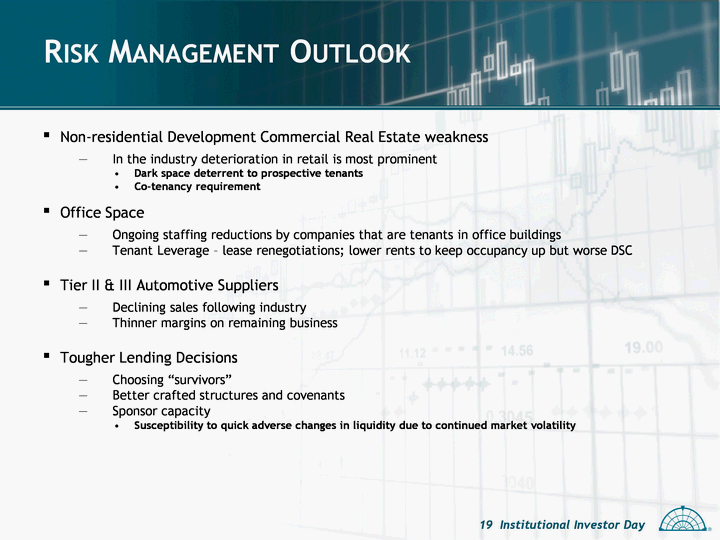
| RISK MANAGEMENT OUTLOOK Non-residential Development Commercial Real Estate weakness In the industry deterioration in retail is most prominent Dark space deterrent to prospective tenants Co-tenancy requirement Office Space Ongoing staffing reductions by companies that are tenants in office buildings Tenant Leverage - lease renegotiations; lower rents to keep occupancy up but worse DSC Tier II & III Automotive Suppliers Declining sales following industry Thinner margins on remaining business Tougher Lending Decisions Choosing "survivors" Better crafted structures and covenants Sponsor capacity Susceptibility to quick adverse changes in liquidity due to continued market volatility |

| LINE OF BUSINESS LEADERS PANEL DISCUSSION |

| COMMERCIAL REAL ESTATE Karen B. Case, Executive Managing Director & President |

| WHO WE ARE, WHERE WE ARE (15) Chicago (2) St. Louis (1)Minneapolis (3) Denver REPORTING TO CRE 19 banking officers 1 credit analyst 3 administrative support (2) Detroit RISK AND OPERATIONAL SUPPORT Construction loan administration Documentation/closing officer Chief appraiser Real estate syndication specialist |
| CRE STRATEGY We bank dynamic and growing professional real estate companies and entrepreneurs We understand the business philosophy and goals of our clients, rather than just chase "deals" No two deals look alike, but for the consistency in Reliance on the integrity of the sponsorship; and The discipline in our underwriting Equity, recourse, leasing-our loans are structured to include at least two of these three attributes |
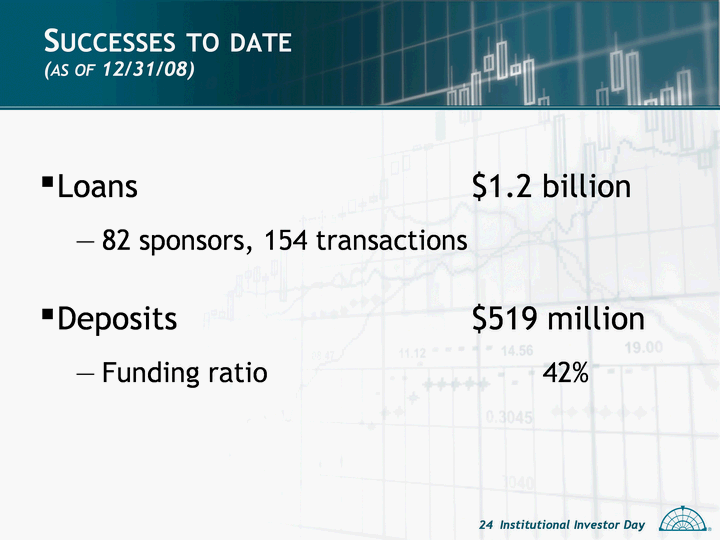
| SUCCESSES TO DATE (AS OF 12/31/08) Loans $1.2 billion 82 sponsors, 154 transactions Deposits $519 million Funding ratio 42% |
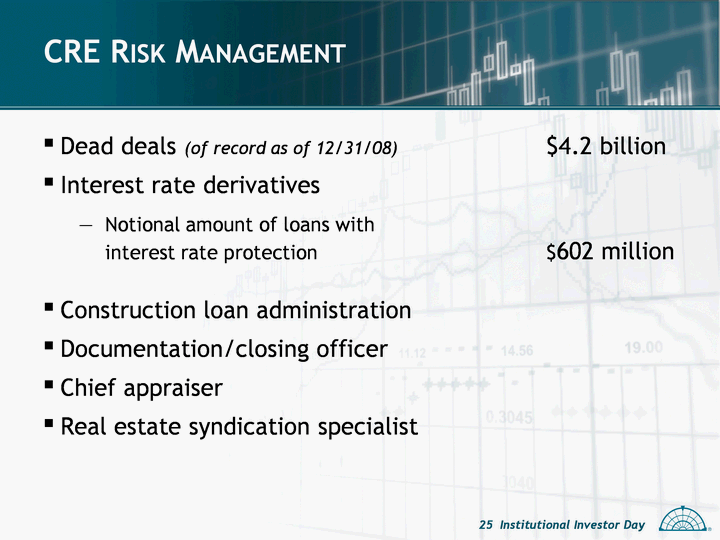
| CRE RISK MANAGEMENT Dead deals (of record as of 12/31/08) $4.2 billion Interest rate derivatives Notional amount of loans with interest rate protection $602 million Construction loan administration Documentation/closing officer Chief appraiser Real estate syndication specialist |

| THE PRIVATECLIENTS GROUP Gary S. Collins, Executive Managing Director & President |

| TEAM & AREAS OF PRACTICE Original core of The PrivateBank Executive Management Team averages 25 years in the industry 8 metropolitan Chicago area offices (As of 12/31/08) Approximately 8,800 clients $2.7 billion in loans outstanding $2.1 billion in total deposits The PrivateBank Mortgage Company Private banking with an emphasis on superior client service |
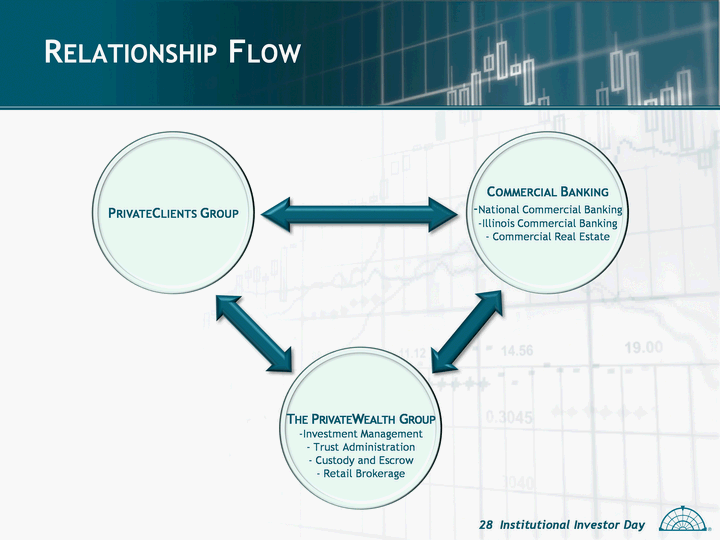
| RELATIONSHIP FLOW COMMERCIAL BANKING - -National Commercial Banking - -Illinois Commercial Banking - - Commercial Real Estate PRIVATECLIENTS GROUP THE PRIVATEWEALTH GROUP Investment Management Trust Administration - - Custody and Escrow - - Retail Brokerage |
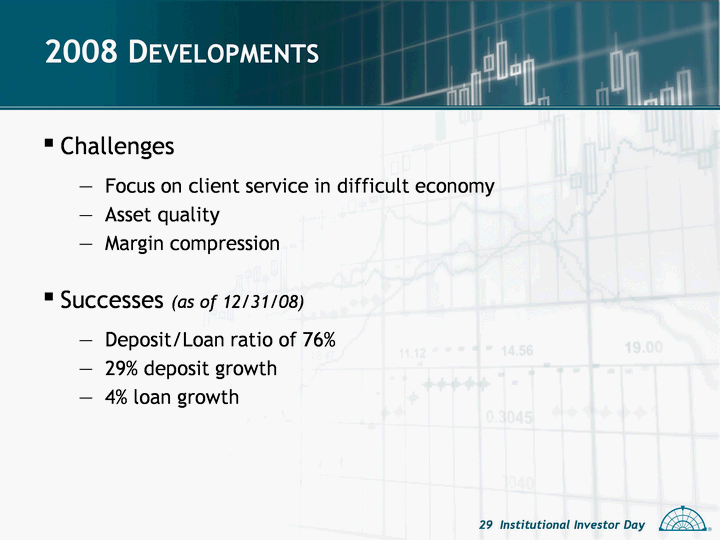
| 2008 DEVELOPMENTS Challenges Focus on client service in difficult economy Asset quality Margin compression Successes (as of 12/31/08) Deposit/Loan ratio of 76% 29% deposit growth 4% loan growth |

| ILLINOIS COMMERCIAL & SPECIALTY BANKING Bruce S. Lubin, Executive Managing Director & President |
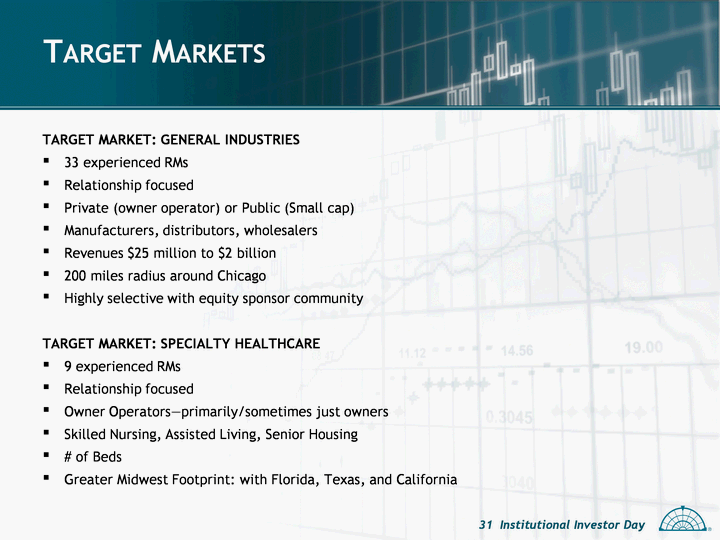
| TARGET MARKETS TARGET MARKET: GENERAL INDUSTRIES 33 experienced RMs Relationship focused Private (owner operator) or Public (Small cap) Manufacturers, distributors, wholesalers Revenues $25 million to $2 billion 200 miles radius around Chicago Highly selective with equity sponsor community TARGET MARKET: SPECIALTY HEALTHCARE 9 experienced RMs Relationship focused Owner Operators-primarily/sometimes just owners Skilled Nursing, Assisted Living, Senior Housing # of Beds Greater Midwest Footprint: with Florida, Texas, and California |
| TARGET MARKETS (CONTINUED) TARGET MARKET: SPECIALTY - OTHER 9 experienced RMs Construction & Engineering, Security Alarm, Title Insurance Companies Privately Held - owner operators Revenues $25 million to $2 billion / $500K RMR Local and regional focus Underwriting analysis |

| ILLINOIS COMMERCIAL BANKING LOANS |
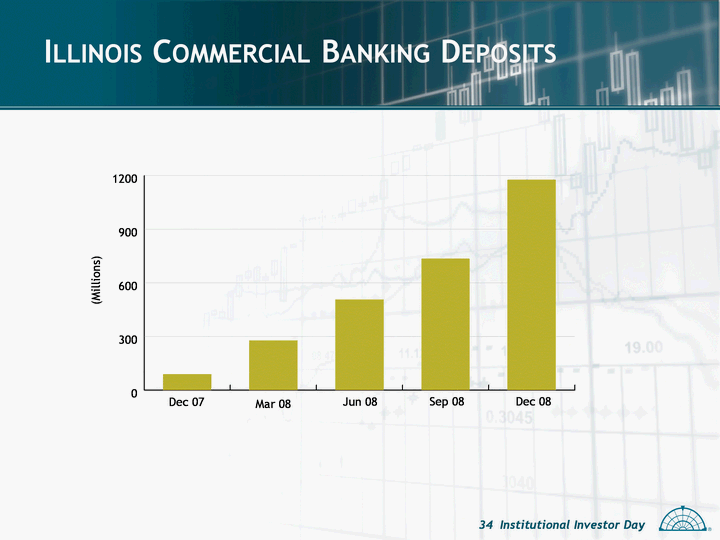
| ILLINOIS COMMERCIAL BANKING DEPOSITS |

| NATIONAL COMMERCIAL BANKING Bruce R. Hague, Executive Managing Director & President |
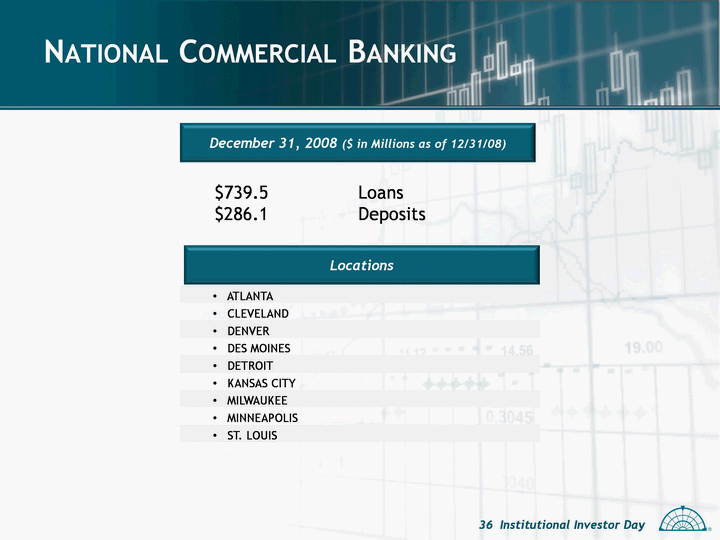
| NATIONAL COMMERCIAL BANKING ATLANTA CLEVELAND DENVER DES MOINES DETROIT KANSAS CITY MILWAUKEE MINNEAPOLIS ST. LOUIS December 31, 2008 ($ in Millions as of 12/31/08) $739.5 Loans $286.1 Deposits Locations |
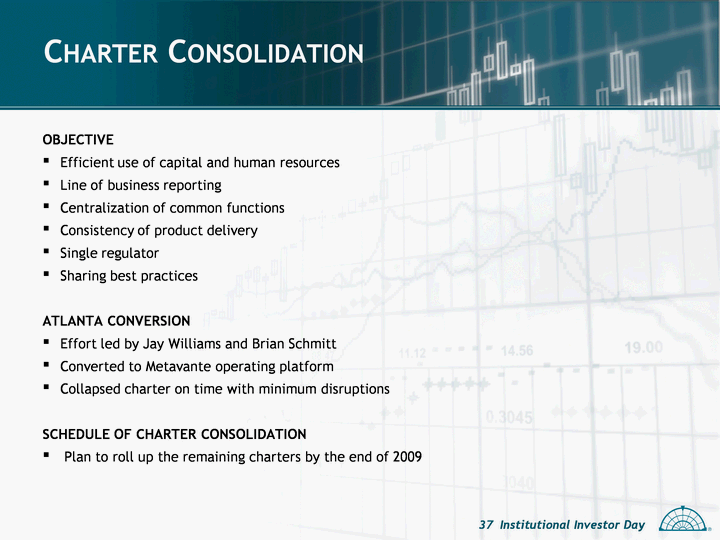
| CHARTER CONSOLIDATION OBJECTIVE Efficient use of capital and human resources Line of business reporting Centralization of common functions Consistency of product delivery Single regulator Sharing best practices ATLANTA CONVERSION Effort led by Jay Williams and Brian Schmitt Converted to Metavante operating platform Collapsed charter on time with minimum disruptions SCHEDULE OF CHARTER CONSOLIDATION Plan to roll up the remaining charters by the end of 2009 |
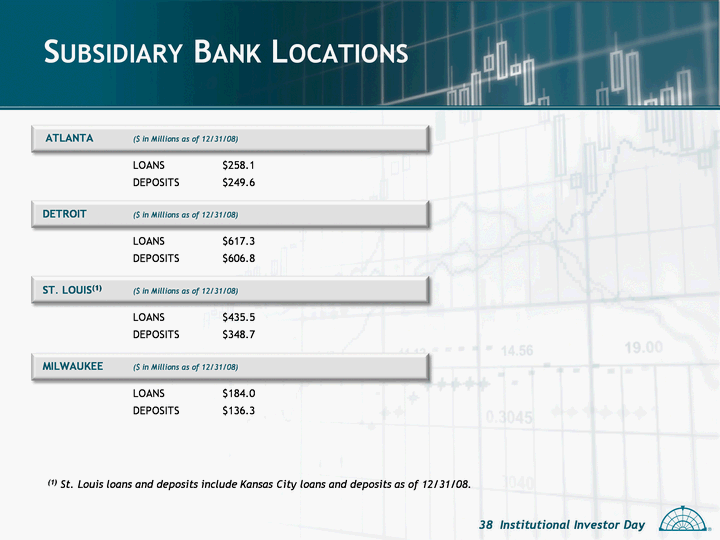
| SUBSIDIARY BANK LOCATIONS ATLANTA ($ in Millions as of 12/31/08) LOANS $258.1 DEPOSITS $249.6 DETROIT ($ in Millions as of 12/31/08) LOANS $617.3 DEPOSITS $606.8 ST. LOUIS(1) ($ in Millions as of 12/31/08) LOANS $435.5 DEPOSITS $348.7 MILWAUKEE ($ in Millions as of 12/31/08) LOANS $184.0 DEPOSITS $136.3 (1) St. Louis loans and deposits include Kansas City loans and deposits as of 12/31/08. |

| THE PRIVATEBANK CAPITAL MARKETS Launched in-house capital markets business in March 2008 Provides a complete suite of customized interest rate and currency risk management solutions to PVTB's clients Strong growth in revenue and trading volume across all client segments Generated $11.0 million in net client revenue in 2008 on $1.8 billion in notional volume Accounted for 41% of PVTB's non-interest income in Q4 All market risk is fully hedged-no trading risk Further infrastructure enhancements planned in 2009 including deal capture system and E-FX platform |

| THE PRIVATEWEALTH GROUP Wallace L. Head, Executive Managing Director & President |
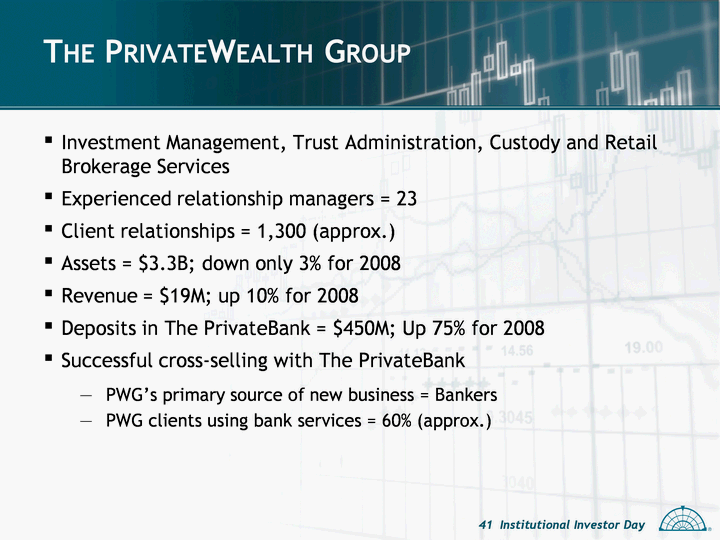
| THE PRIVATEWEALTH GROUP Investment Management, Trust Administration, Custody and Retail Brokerage Services Experienced relationship managers = 23 Client relationships = 1,300 (approx.) Assets = $3.3B; down only 3% for 2008 Revenue = $19M; up 10% for 2008 Deposits in The PrivateBank = $450M; Up 75% for 2008 Successful cross-selling with The PrivateBank PWG's primary source of new business = Bankers PWG clients using bank services = 60% (approx.) |

| THE PRIVATEWEALTH GROUP Target Markets Individuals, families, foundations & endowments with at least $5M of manageable assets who want high quality investment and trust services Local Investment Managers, Law Firms, etc. who want high quality custody and escrow services Examples of Recent New Clients "Post-Madoff" Family "Post-Sale-of-Business" Families |
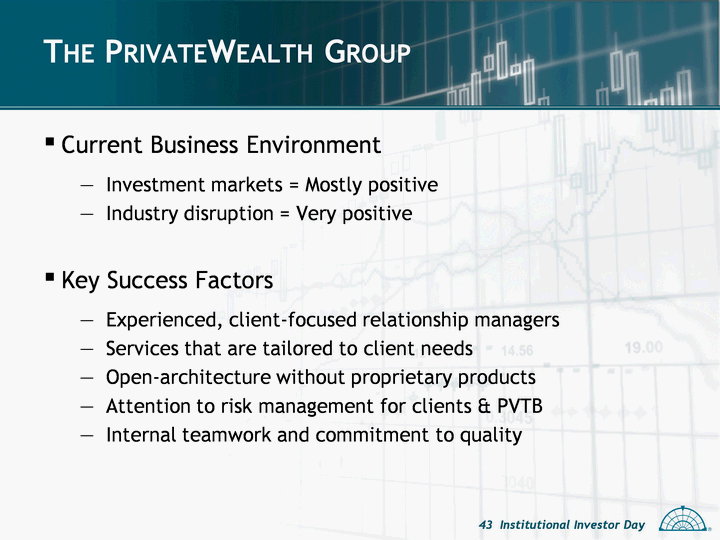
| THE PRIVATEWEALTH GROUP Current Business Environment Investment markets = Mostly positive Industry disruption = Very positive Key Success Factors Experienced, client-focused relationship managers Services that are tailored to client needs Open-architecture without proprietary products Attention to risk management for clients & PVTB Internal teamwork and commitment to quality |

| FOCUS • EXECUTION • CONTINUITY • CONFIDENTIALITY • LIFETIME RELATIONSHIPSSM |