Exhibit 99.1

For further information:
Media Contact:
Amy Yuhn
Director of Communications
312-564-1378
ayuhn@theprivatebank.com
Investor Relations Contact:
Katie Manzel
Investor Relations Officer
312-564-6818
kmanzel@theprivatebank.com
For Immediate Release
PrivateBancorp Reports Fourth Quarter and Full Year 2009 Results
Operating profit increased and capital position strengthened; credit quality continues to impact performance
CHICAGO, January 25, 2010 – PrivateBancorp, Inc. (NASDAQ: PVTB) today reported a net loss of $18.6 million, or $0.30 per diluted share, for the fourth quarter ended December 31, 2009, compared with a net loss of $62.8 million, or $1.98 per diluted share, for the fourth quarter 2008. For the 12 months ended December 31, 2009, the net loss was $42.5 million, or $0.95 per diluted share, compared to a net loss of $93.5 million, or $3.16 per diluted share, for the prior year period.
“While the economic environment in 2009 remained difficult, our business fundamentals are strong and the significant investments we’ve made in people and infrastructure are driving ongoing momentum in our operating profit,” said Larry D. Richman, President and Chief Executive Officer, PrivateBancorp, Inc. “Throughout the year we have strengthened our risk management process. The credit environment in the second half of the year caused us to put even greater focus on asset quality management, and in the fourth quarter we redeployed a number of our bankers to leverage their specific industry expertise as we tackle the challenges in our credit portfolio.
“While we are not out of the woods as it relates to stress on our credit portfolio, our combination of strong core performance, attention to rigorous risk management and balance sheet strength position us well as we move into 2010,” Richman continued. “Over the long-term, the continued growth in client relationships will lead to higher net revenue and deposits and improvement in our net interest margin. This, along with the increased efficiency of our operations, will facilitate earnings growth.”
1
4th Quarter Results:
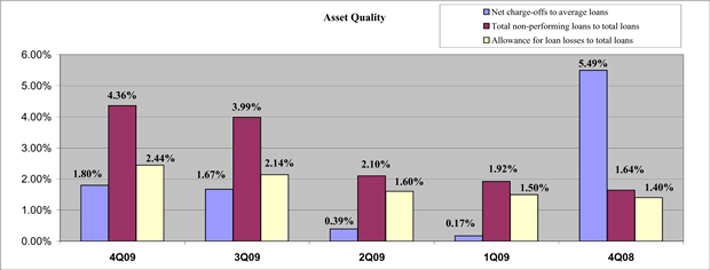
| | • | | Growth in non-performing assets slowed to 10 percent quarter-over-quarter and non-performing assets were $436.9 million, compared to $396.6 million in the third quarter. Provision for loan losses was $69.5 million and net charge-offs were $40.6 million, resulting in an increased allowance for loan losses of $221.7 million or 2.44 percent of total loans. |
| | • | | Net revenue grew 13.5 percent over third quarter to $114.8 million and net interest margin increased to 3.48 percent, up 39 basis points over third quarter. Operating profit increased 4.4 percent to $46.3 million, up from $44.3 million in third quarter. |
| | • | | Client deposits grew 4 percent from the third quarter, including an 18 percent increase in demand deposits, while loans remained flat due to decreased borrowings by existing clients and ongoing selectivity in new business development. |
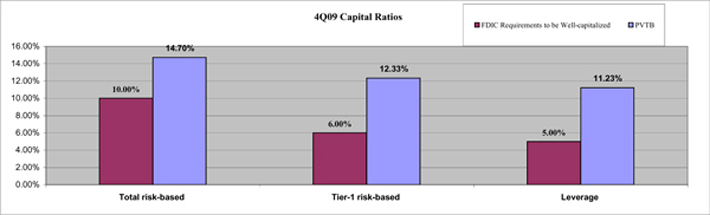
| | • | | Capital position was strengthened and total risk-based capital ratio was 14.70 percent, Tier 1 capital ratio was 12.33 percent and tangible common equity ratio was 7.41 percent. |
Credit Quality
Credit quality continued to be impacted in the fourth quarter by ongoing weakness in the overall economy and was largely influenced by poor commercial real estate sector performance. However, growth in fourth quarter non-performing assets was consistent with management’s expectations. Although credit trends in the commercial real estate sector will continue to be uneven, the Company currently anticipates a first-quarter growth rate in non-performing assets to be generally in line with the fourth quarter.
The fourth quarter 2009 provision for loan losses was $69.5 million, compared to $119.3 million in the fourth quarter 2008 and $90.0 million in the third quarter 2009.
The allowance for loan losses as a percentage of total loans was 2.44 percent at December 31, 2009, compared with 1.40 percent at December 31, 2008, and 2.14 percent at September 30, 2009. Allowance for loan losses as a percentage of non-performing loans was 56 percent in the fourth quarter 2009, compared to 85 percent in the fourth quarter 2008 and 54 percent in the third quarter 2009. Charge-offs were $41.5 million for the quarter ended December 31, 2009, offset by recoveries of $874,000, and $40.1 million for the quarter ended September 30, 2009, offset by recoveries of $2.8 million. Charge-offs for the quarter ended December 31, 2008, were $109.5 million, offset by recoveries of $658,000. Approximately $13.0 million of fourth-quarter 2009 net charge-offs were commercial real estate loans and $14.2 million were construction loans.
2
The Company had $436.9 million in total non-performing assets at December 31, 2009, compared to $155.7 million at December 31, 2008, and $396.6 million at September 30, 2009, largely due to the ongoing deterioration in the Company’s commercial real estate portfolio. Approximately 72 percent of non-accrual loans at December 31, 2009, were commercial real estate or construction loans. Non-performing assets to total assets were 3.62 percent at December 31, 2009, compared to 1.55 percent at December 31, 2008, and 3.28 percent at September 30, 2009.
Credit quality results exclude $502.0 million in covered assets as of December 31, 2009, referring to certain assets acquired as a result of the Founders Bank transaction that are subject to a loss-sharing agreement with the FDIC.
Balance Sheet
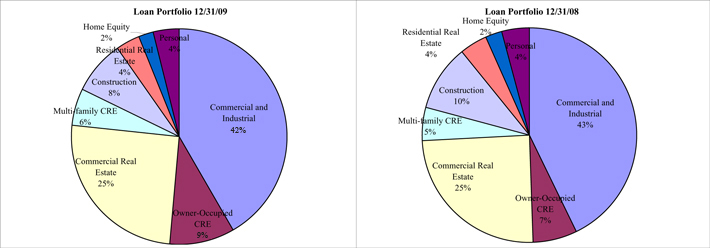
Total assets increased to $12.1 billion at December 31, 2009, from $10.0 billion at December 31, 2008, and remained flat as compared to September 30, 2009. Total loans increased to $9.1 billion at December 31, 2009, from $8.0 billion at December 31, 2008, and $9.0 billion at September 30, 2009. Consistent with overall economic conditions, the Company experienced a decrease in borrowings from existing clients and continued to engage in selective loan growth. Commercial loans were 51 percent of the Company’s total loans at the end of the fourth quarter 2009, compared with 50 percent of total loans at December 31, 2008, and 51 percent of total loans at September 30, 2009. Commercial real estate loans were 31 percent of total loans at the end of the fourth quarter 2009, compared to 30 percent of total loans at the end of the fourth quarter 2008 and up from 29 percent at the end of the third quarter 2009. The small increase in commercial real estate loans as a percentage of total loans in the fourth quarter 2009 is the result of construction loans converting to commercial real estate mortgages.
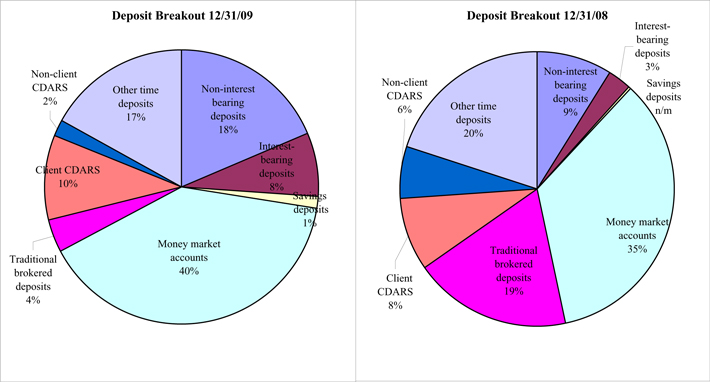
Total deposits were $9.9 billion at December 31, 2009, compared to $8.0 billion at December 31, 2008, and $9.6 billion at September 30, 2009. Client deposits increased to $9.3 billion at December 31, 2009, from $6.0 billion at December 31, 2008, and $8.9 billion at September 30, 2009. Client deposits at December 31, 2009, include $1.8 billion in non-interest bearing deposits. Brokered deposits (excluding $979.7 million in client CDARS® deposits) were 6 percent of total deposits in the fourth quarter 2009, a decrease from 25 percent of total deposits as of December 31, 2008, and 7 percent in the third quarter 2009. The significant decrease in brokered deposits year-over-year reflects the Company’s strategy to focus on growing client deposits.
Funds borrowed, which include federal funds purchased, FHLB advances, trust preferred securities, borrowings under the Company’s credit facilities, and convertible senior notes, was $748.0 million at December 31, 2009, down from $1.3 billion at December 31, 2008, and September 30, 2009, reflecting an improvement in funding mix.
3
The Company’s investment securities portfolio was $1.6 billion at December 31, 2009, compared to $1.5 billion at December 31, 2008, and $1.7 billion at September 30, 2009. Net unrealized gains were $44.8 million, compared to $44.2 million at the end of the fourth quarter 2008, and $61.5 million at the end of the third quarter 2009. The decrease in net unrealized gains during the fourth quarter was largely driven by the interest rate environment. The Company’s securities portfolio is primarily composed of U.S. government agency backed mortgage pools, agency collateralized mortgage obligations, and investment grade municipal bonds.
Operating Performance
Operating profit (the sum of net interest income on a tax equivalent basis and non-interest income less non-interest expense) was $46.3 million in the fourth quarter 2009, up from $16.8 million in the fourth quarter 2008, and $44.3 million in the third quarter 2009. Net revenue grew to $114.8 million in the fourth quarter 2009, from $71.7 million in the fourth quarter 2008, and $101.2 million in the third quarter 2009. Net interest income improved to $99.6 million in the fourth quarter 2009, up from $59.1 million for the fourth quarter 2008, and from $87.4 million in the third quarter 2009. Net interest margin (on a tax equivalent basis) was 3.48 percent for the fourth quarter 2009, compared to 2.62 percent for the fourth quarter 2008, and 3.09 percent in the third quarter 2009. Net interest margin continued to improve on the repricing of deposits, an increase in demand deposits, improved loan pricing, and the contribution from the former Founders Bank business.
Non-interest income was $14.3 million in the fourth quarter 2009, compared to $11.6 million in the fourth quarter 2008, and $12.9 million in the third quarter 2009. The increase in non-interest income during the fourth quarter was primarily due to capital markets products and mortgage banking contributions. Capital markets activities for the fourth quarter 2009 resulted in revenue of $2.4 million, including a $796,000 credit valuation adjustment, as compared to $4.8 million in the fourth quarter 2008, and a negative revenue position of $322,000 in the third quarter 2009, including a $2.4 million negative credit valuation adjustment. Mortgage banking income was $2.2 million in the fourth quarter 2009, compared to $622,000 for the fourth quarter 2008, and $1.8 million in the third quarter 2009. Treasury management income was $3.4 million in the fourth quarter 2009, compared to $1.1 million in the fourth quarter 2008, and $3.1 million in the third quarter 2009. Banking and other services income was $1.9 million in the fourth quarter 2009, including a $4.2 million loss on loan dispositions, compared to $1.3 million in the fourth quarter 2008, and $4.1 million in the third quarter 2009.
The PrivateWealth Group’s fee revenue was $4.1 million in the fourth quarter 2009, compared to $4.1 million both in the fourth quarter 2008 and in the third quarter 2009. The PrivateWealth Group’s assets under management at December 31, 2009, were $4.0 billion, compared with $3.3 billion at December 31, 2008, and $4.0 billion at September 30, 2009.
4
Expenses
Non-interest expense was $68.5 million in the fourth quarter. This compares to $54.9 million in the fourth quarter 2008 and $56.8 million in the third quarter 2009. Expenses increased by $11.7 million from the third quarter 2009 primarily due to an increase of $7.8 million in salaries and benefits. Third quarter salary and benefits expenses included the reversal of incentive compensation accruals. During the fourth quarter 2009, headcount increased slightly as the Company continued to invest in its infrastructure, particularly in the risk management area.
Additionally, loan and collection expenses were $4.5 million, compared to $1.4 million in the third quarter, due to increased credit costs associated with non-performing assets in the fourth quarter 2009. Offsetting the increase was a $644,000 decrease in net foreclosed property expenses.
The efficiency ratio was 59.7 percent in the fourth quarter 2009 compared to 76.6 percent in the fourth quarter 2008 and 56.2 percent in the third quarter 2009. The efficiency ratio improved year-over-year as the Company realized the benefits of investments made in people and infrastructure.
Capital
As of December 31, 2009, the Company had a total risk-based capital ratio at 14.70 percent and Tier 1 risk-based capital ratio at 12.33 percent, exceeding the well-capitalized thresholds of 10 percent and 6 percent, respectively. The Company raised $194 million in new capital through a common stock offering during the fourth quarter and does not foresee the need to raise additional capital in the near term.
The Company’s tangible common equity ratio at December 31, 2009, was 7.41 percent.
Quarterly Conference Call and Webcast Presentation
Interested parties are invited to listen to our quarterly conference call on Monday, January 25, 2010, at 10 a.m. CST. The call may be accessed by telephone at (888) 782-9127 (U.S. and Canada) or (706) 634-5643 (International). A live webcast of the call can be accessed on our website atwww.theprivatebank.com by visiting the Investor Relations tab under the About Us section. A rebroadcast of the call will be available beginning approximately two hours after the call until midnight on February 1, 2010, by calling (800) 642-1687 (U.S. and Canada) or (706) 645-9291 (International) and entering passcode #49424957.
About PrivateBancorp, Inc.
PrivateBancorp, Inc. is a growing diversified financial services company with 34 offices in 10 states and $12.1 billion in assets as of December 31, 2009. Through its subsidiaries, PrivateBancorp delivers customized business and personal financial services to middle-market commercial and commercial real estate companies, as well as business owners, executives, entrepreneurs and families in all of the markets and communities we serve. Our website is www.theprivatebank.com.
5
Forward-Looking Statements: Statements contained in this news release that are not historical facts may constitute forward-looking statements within the meaning of Section 21E of the Securities Exchange Act of 1934, as amended. The Company’s ability to predict results or the actual effect of future plans or strategies is inherently uncertain. Factors which could have a material adverse effect on the operations and future prospects of the Company include, but are not limited to, credit quality and the need to increase our allowance for loan losses; unforeseen difficulties and higher than expected costs associated with our growth; unforeseen difficulties in integrating new hires; inability to retain top management personnel; insufficient liquidity or funding sources; the failure to obtain on terms acceptable to us, or at all, the capital necessary to maintain our regulatory capital ratios above the “well-capitalized” threshold; slower than anticipated growth of the Company’s business or unanticipated business declines, including as a result of continuing negative economic conditions; fluctuations in market rates of interest and loan and deposit pricing in the Company’s market areas; the effect of margin pressure on the Company’s earnings; legislative or regulatory changes, particularly changes in the regulation of financial services companies and/or the products and services offered by financial services companies and regulation of banks participating in the TARP Capital Purchase Program; the regulatory examination environment and trends in regulatory enforcement actions; unforeseen difficulties relating to the acquisition and integration of businesses acquired in purchase and assumption transactions; further deterioration in asset quality; any additional charges related to asset impairments including impairment of deferred tax and goodwill assets; adverse developments in the Company’s loan or investment portfolios; failure to improve operating efficiencies through expense controls; competition; and the possible dilutive effect of potential acquisitions, expansion or future capital raises. These risks and uncertainties should be considered in evaluating forward-looking statements and undue reliance should not be placed on such statements. The Company assumes no obligation to update publicly any of these statements in light of future events unless required under the federal securities laws.
Editor’s Note: Financial highlights attached.
6
| | |
| Consolidated Income Statements | |  |
Unaudited | |
(Amounts in thousands except per share data) | |
| | | | | | | | | | | | | | | | |
| | | Three Months Ended
December 31, | | | Year Ended December 31, | |
| | | 2009 | | | 2008 | | | 2009 | | | 2008 | |
Interest Income | | | | | | | | | | | | | | | | |
Loans, including fees | | $ | 115,140 | | | $ | 107,370 | | | $ | 411,830 | | | $ | 367,104 | |
Federal funds sold and other short-term investments | | | 340 | | | | 488 | | | | 1,112 | | | | 1,145 | |
Securities: | | | | | | | | | | | | | | | | |
Taxable | | | 15,672 | | | | 10,754 | | | | 58,663 | | | | 28,657 | |
Exempt from Federal income taxes | | | 1,672 | | | | 2,025 | | | | 7,107 | | | | 8,477 | |
| | | | | | | | | | | | | | | | |
Total interest income | | | 132,824 | | | | 120,637 | | | | 478,712 | | | | 405,383 | |
| | | | |
Interest Expense | | | | | | | | | | | | | | | | |
Interest-bearing deposits | | | 848 | | | | 285 | | | | 2,646 | | | | 1,515 | |
Savings deposits and money market accounts | | | 9,022 | | | | 11,579 | | | | 29,635 | | | | 48,880 | |
Brokered and other time deposits | | | 13,959 | | | | 36,405 | | | | 79,335 | | | | 126,316 | |
Short-term borrowings | | | 1,613 | | | | 3,416 | | | | 8,094 | | | | 12,787 | |
Long-term debt | | | 7,820 | | | | 9,805 | | | | 34,018 | | | | 25,490 | |
| | | | | | | | | | | | | | | | |
Total interest expense | | | 33,262 | | | | 61,490 | | | | 153,728 | | | | 214,988 | |
| | | | | | | | | | | | | | | | |
Net interest income | | | 99,562 | | | | 59,147 | | | | 324,984 | | | | 190,395 | |
Provision for loan and covered asset losses | | | 70,077 | | | | 119,250 | | | | 199,419 | | | | 189,579 | |
| | | | | | | | | | | | | | | | |
Net Interest Income (Expense) after provision for loan and covered asset losses | | | 29,485 | | | | (60,103 | ) | | | 125,565 | | | | 816 | |
| | | | | | | | | | | | | | | | |
| | | | |
Non-interest Income | | | | | | | | | | | | | | | | |
The PrivateWealth Group | | | 4,081 | | | | 4,140 | | | | 15,459 | | | | 16,968 | |
Mortgage banking | | | 2,243 | | | | 622 | | | | 8,930 | | | | 4,158 | |
Capital markets products | | | 2,409 | | | | 4,767 | | | | 17,150 | | | | 11,049 | |
Treasury management | | | 3,366 | | | | 1,086 | | | | 10,148 | | | | 2,369 | |
Bank owned life insurance | | | 442 | | | | 501 | | | | 1,728 | | | | 1,809 | |
Banking and other services | | | 1,918 | | | | 1,297 | | | | 11,659 | | | | 4,453 | |
Net securities (losses) gains | | | (149 | ) | | | (770 | ) | | | 7,381 | | | | 510 | |
Early extinguishment of debt | | | - | | | | - | | | | (985 | ) | | | - | |
| | | | | | | | | | | | | | | | |
Total non-interest income | | | 14,310 | | | | 11,643 | | | | 71,470 | | | | 41,316 | |
| | | | | | | | | | | | | | | | |
| | | | |
Non-interest Expense | | | | | | | | | | | | | | | | |
Salaries and employee benefits | | | 31,020 | | | | 28,219 | | | | 123,653 | | | | 116,678 | |
Net occupancy expense | | | 7,039 | | | | 4,543 | | | | 26,170 | | | | 17,098 | |
Technology and related costs | | | 3,503 | | | | 2,019 | | | | 10,599 | | | | 6,310 | |
Marketing | | | 3,568 | | | | 2,781 | | | | 9,843 | | | | 10,425 | |
Professional fees | | | 5,562 | | | | 4,714 | | | | 16,327 | | | | 13,954 | |
Investment manager expenses | | | 576 | | | | 690 | | | | 2,322 | | | | 3,299 | |
Net foreclosed property expenses | | | 1,810 | | | | 4,605 | | | | 5,675 | | | | 6,217 | |
Supplies and printing | | | 436 | | | | 461 | | | | 1,465 | | | | 1,627 | |
Postage, telephone, and delivery | | | 855 | | | | 563 | | | | 3,060 | | | | 2,226 | |
Insurance | | | 5,015 | | | | 2,341 | | | | 22,607 | | | | 7,408 | |
Amortization of intangibles | | | 536 | | | | 267 | | | | 1,737 | | | | 1,164 | |
Loan and collection | | | 4,526 | | | | 1,456 | | | | 9,617 | | | | 3,023 | |
Other expenses | | | 4,082 | | | | 2,244 | | | | 14,340 | | | | 6,696 | |
| | | | | | | | | | | | | | | | |
Total non-interest expense | | | 68,528 | | | | 54,903 | | | | 247,415 | | | | 196,125 | |
| | | | | | | | | | | | | | | | |
Loss before income taxes | | | (24,733 | ) | | | (103,363 | ) | | | (50,380 | ) | | | (153,993 | ) |
Income tax benefit | | | (9,556 | ) | | | (40,783 | ) | | | (20,564 | ) | | | (61,357 | ) |
| | | | | | | | | | | | | | | | |
Net loss | | | (15,177 | ) | | | (62,580 | ) | | | (29,816 | ) | | | (92,636 | ) |
Net income attributable to noncontrolling interests | | | 64 | | | | 53 | | | | 247 | | | | 309 | |
| | | | | | | | | | | | | | | | |
Net loss attributable to controlling interests | | | (15,241 | ) | | | (62,633 | ) | | | (30,063 | ) | | | (92,945 | ) |
Preferred stock dividends and discount accretion | | | 3,389 | | | | 146 | | | | 12,443 | | | | 546 | |
| | | | | | | | | | | | | | | | |
Net loss available to common stockholders | | $ | (18,630 | ) | | $ | (62,779 | ) | | $ | (42,506 | ) | | $ | (93,491 | ) |
| | | | | | | | | | | | | | | | |
| | | | |
Per Common Share Data | | | | | | | | | | | | | | | | |
Basic | | $ | (0.30 | ) | | $ | (1.98 | ) | | $ | (0.95 | ) | | $ | (3.16 | ) |
Diluted | | $ | (0.30 | ) | | $ | (1.98 | ) | | $ | (0.95 | ) | | $ | (3.16 | ) |
Dividends | | $ | 0.01 | | | $ | 0.075 | | | $ | 0.04 | | | $ | 0.30 | |
Weighted average common shares outstanding | | | 61,608 | | | | 31,733 | | | | 44,516 | | | | 29,553 | |
Diluted average common shares outstanding | | | 61,608 | | | | 31,733 | | | | 44,516 | | | | 29,553 | |
Note 1: Certain reclassifications have been made to prior period financial statements to place them on a basis comparable with the current period financial statements.
Note 2:For the three months and year ended December 31, 2008 and 2009 diluted shares are equal to basic shares due to the net loss. The calculation of diluted earnings per share results in anti-dilution.
| | |
| Quarterly Consolidated Income Statements | |  |
Unaudited | |
(Amounts in thousands except per share data) | |
| | | | | | | | | | | | | | | | | | | |
| | | 4Q09 | | | 3Q09 | | | 2Q09 | | | 1Q09 | | 4Q08 | |
Interest Income | | | | | | | | | | | | | | | | | | | |
Loans, including fees | | $ | 115,140 | | | $ | 107,749 | | | $ | 95,997 | | | $ | 92,944 | | $ | 107,370 | |
Federal funds sold and other short-term investments | | | 340 | | | | 323 | | | | 161 | | | | 288 | | | 488 | |
Securities: | | | | | | | | | | | | | | | | | | | |
Taxable | | | 15,672 | | | | 14,799 | | | | 13,646 | | | | 14,546 | | | 10,754 | |
Exempt from Federal income taxes | | | 1,672 | | | | 1,797 | | | | 1,786 | | | | 1,852 | | | 2,025 | |
| | | | | | | | | | | | | | | | | | | |
Total interest income | | | 132,824 | | | | 124,668 | | | | 111,590 | | | | 109,630 | | | 120,637 | |
| | | | | |
Interest Expense | | | | | | | | | | | | | | | | | | | |
Interest-bearing deposits | | | 848 | | | | 932 | | | | 467 | | | | 399 | | | 285 | |
Savings deposits and money market accounts | | | 9,022 | | | | 8,013 | | | | 6,036 | | | | 6,564 | | | 11,579 | |
Brokered and other time deposits | | | 13,959 | | | | 18,170 | | | | 20,322 | | | | 26,884 | | | 36,405 | |
Short-term borrowings | | | 1,613 | | | | 1,649 | | | | 1,844 | | | | 2,988 | | | 3,416 | |
Long-term debt | | | 7,820 | | | | 8,469 | | | | 8,814 | | | | 8,915 | | | 9,805 | |
| | | | | | | | | | | | | | | | | | | |
Total interest expense | | | 33,262 | | | | 37,233 | | | | 37,483 | | | | 45,750 | | | 61,490 | |
| | | | | | | | | | | | | | | | | | | |
Net interest income | | | 99,562 | | | | 87,435 | | | | 74,107 | | | | 63,880 | | | 59,147 | |
Provision for loan and covered asset losses | | | 70,077 | | | | 90,016 | | | | 21,521 | | | | 17,805 | | | 119,250 | |
| | | | | | | | | | | | | | | | | | | |
Net Interest Income (Expense) after provision for loan and covered asset losses | | | 29,485 | | | | (2,581 | ) | | | 52,586 | | | | 46,075 | | | (60,103 | ) |
| | | | | | | | | | | | | | | | | | | |
| | | | | |
Non-interest Income | | | | | | | | | | | | | | | | | | | |
The PrivateWealth Group | | | 4,081 | | | | 4,084 | | | | 3,500 | | | | 3,794 | | | 4,140 | |
Mortgage banking | | | 2,243 | | | | 1,826 | | | | 2,686 | | | | 2,175 | | | 622 | |
Capital markets products | | | 2,409 | | | | (322 | ) | | | 3,830 | | | | 11,233 | | | 4,767 | |
Treasury management | | | 3,366 | | | | 3,067 | | | | 2,110 | | | | 1,605 | | | 1,086 | |
Bank owned life insurance | | | 442 | | | | 444 | | | | 453 | | | | 389 | | | 501 | |
Banking and other services | | | 1,918 | | | | 4,093 | | | | 2,054 | | | | 3,594 | | | 1,297 | |
Net securities (losses) gains | | | (149 | ) | | | (309 | ) | | | 7,067 | | | | 772 | | | (770 | ) |
Early extinguishment of debt | | | - | | | | - | | | | (985 | ) | | | - | | | - | |
| | | | | | | | | | | | | | | | | | | |
Total non-interest income | | | 14,310 | | | | 12,883 | | | | 20,715 | | | | 23,562 | | | 11,643 | |
| | | | | | | | | | | | | | | | | | | |
| | | | | |
Non-interest Expense | | | | | | | | | | | | | | | | | | | |
Salaries and employee benefits | | | 31,020 | | | | 23,212 | | | | 34,300 | | | | 35,121 | | | 28,219 | |
Net occupancy expense | | | 7,039 | | | | 7,004 | | | | 6,067 | | | | 6,060 | | | 4,543 | |
Technology and related costs | | | 3,503 | | | | 2,565 | | | | 1,967 | | | | 2,564 | | | 2,019 | |
Marketing | | | 3,568 | | | | 2,500 | | | | 1,933 | | | | 1,842 | | | 2,781 | |
Professional fees | | | 5,562 | | | | 5,759 | | | | 2,492 | | | | 2,514 | | | 4,714 | |
Investment manager expenses | | | 576 | | | | 581 | | | | 556 | | | | 609 | | | 690 | |
Net foreclosed property expenses | | | 1,810 | | | | 2,454 | | | | 967 | | | | 444 | | | 4,605 | |
Supplies and printing | | | 436 | | | | 295 | | | | 392 | | | | 342 | | | 461 | |
Postage, telephone, and delivery | | | 855 | | | | 803 | | | | 821 | | | | 581 | | | 563 | |
Insurance | | | 5,015 | | | | 4,603 | | | | 9,157 | | | | 3,832 | | | 2,341 | |
Amortization of intangibles | | | 536 | | | | 547 | | | | 325 | | | | 329 | | | 267 | |
Loan and collection | | | 4,526 | | | | 1,388 | | | | 1,838 | | | | 1,865 | | | 1,456 | |
Other expenses | | | 4,082 | | | | 5,124 | | | | 3,180 | | | | 1,954 | | | 2,244 | |
| | | | | | | | | | | | | | | | | | | |
Total non-interest expense | | | 68,528 | | | | 56,835 | | | | 63,995 | | | | 58,057 | | | 54,903 | |
| | | | | | | | | | | | | | | | | | | |
(Loss) income before income taxes | | | (24,733 | ) | | | (46,533 | ) | | | 9,306 | | | | 11,580 | | | (103,363 | ) |
Income tax (benefit) provision | | | (9,556 | ) | | | (18,789 | ) | | | 3,372 | | | | 4,409 | | | (40,783 | ) |
| | | | | | | | | | | | | | | | | | | |
Net (loss) income | | | (15,177 | ) | | | (27,744 | ) | | | 5,934 | | | | 7,171 | | | (62,580 | ) |
Net income attributable to noncontrolling interests | | | 64 | | | | 66 | | | | 57 | | | | 60 | | | 53 | |
| | | | | | | | | | | | | | | | | | | |
Net (loss) income attributable to controlling interests | | | (15,241 | ) | | | (27,810 | ) | | | 5,877 | | | | 7,111 | | | (62,633 | ) |
Preferred stock dividends and discount accretion | | | 3,389 | | | | 3,385 | | | | 3,399 | | | | 2,270 | | | 146 | |
| | | | | | | | | | | | | | | | | | | |
Net (loss) income available to common stockholders | | $ | (18,630 | ) | | $ | (31,195 | ) | | $ | 2,478 | | | $ | 4,841 | | $ | (62,779 | ) |
| | | | | | | | | | | | | | | | | | | |
| | | | | |
Per Common Share Data | | | | | | | | | | | | | | | | | | | |
Basic | | $ | (0.30 | ) | | $ | (0.68 | ) | | $ | 0.06 | | | $ | 0.15 | | $ | (1.98 | ) |
Diluted | | $ | (0.30 | ) | | $ | (0.68 | ) | | $ | 0.06 | | | $ | 0.14 | | $ | (1.98 | ) |
Dividends | | $ | 0.01 | | | $ | 0.01 | | | $ | 0.01 | | | $ | 0.01 | | $ | 0.075 | |
Weighted average common shares outstanding | | | 61,608 | | | | 46,047 | | | | 38,015 | | | | 32,030 | | | 31,733 | |
Diluted average common shares outstanding | | | 61,608 | | | | 46,047 | | | | 39,795 | | | | 34,304 | | | 31,733 | |
Note 1: Certain reclassifications have been made to prior period financial statements to place them on a basis comparable with the current period financial statements.
Note 2:For the fourth quarter 2008 and the third and fourth quarter 2009 diluted shares are equal to basic shares due to the net loss. The calculation of diluted earnings per share during those periods results in anti-dilution.
| | |
| Consolidated Balance Sheets | |  |
Unaudited | |
(Dollars in thousands) | |
| | | | | | | | | | | | | | | | | | | | |
| | | 12/31/09 | | | 09/30/09 | | | 06/30/09 | | | 03/31/09 | | | 12/31/08 | |
| | | unaudited | | | unaudited | | | unaudited | | | unaudited | | | unaudited | |
Assets | | | | | | | | | | | | | | | | | | | | |
Cash and due from banks | | $ | 320,160 | | | $ | 199,703 | | | $ | 99,088 | | | $ | 96,712 | | | $ | 131,848 | |
Fed funds sold and other short-term investments | | | 218,935 | | | | 332,188 | | | | 393,953 | | | | 83,626 | | | | 98,387 | |
Loans held for sale | | | 28,363 | | | | 19,000 | | | | 23,825 | | | | 11,298 | | | | 17,082 | |
Securities available-for-sale, at fair value | | | 1,569,541 | | | | 1,648,313 | | | | 1,443,648 | | | | 1,385,244 | | | | 1,425,564 | |
Non-marketable equity investments | | | 29,413 | | | | 30,681 | | | | 28,586 | | | | 28,035 | | | | 27,213 | |
| | | | | |
Loans, excluding covered assets and net of unearned fees | | | 9,073,474 | | | | 9,028,456 | | | | 8,728,926 | | | | 8,483,641 | | | | 8,036,807 | |
Allowance for loan losses | | | (221,688 | ) | | | (192,791 | ) | | | (140,088 | ) | | | (127,011 | ) | | | (112,672 | ) |
| | | | | | | | | | | | | | | | | | | | |
Loans, net of allowance for loan losses and unearned fees | | | 8,851,786 | | | | 8,835,665 | | | | 8,588,838 | | | | 8,356,630 | | | | 7,924,135 | |
| | | | | | | | | | | | | | | | | | | | |
| | | | | |
Covered assets | | | 502,034 | | | | 530,059 | | | | - | | | | - | | | | - | |
Allowance for covered assets losses | | | (2,764 | ) | | | - | | | | - | | | | - | | | | - | |
| | | | | | | | | | | | | | | | | | | | |
Covered assets, net of allowance for covered assets | | | 499,270 | | | | 530,059 | | | | - | | | | - | | | | - | |
| | | | | | | | | | | | | | | | | | | | |
| | | | | |
Other real estate owned | | | 41,497 | | | | 36,705 | | | | 29,236 | | | | 28,703 | | | | 23,823 | |
Premises, furniture, and equipment, net | | | 41,344 | | | | 32,870 | | | | 33,162 | | | | 33,179 | | | | 34,201 | |
Accrued interest receivable | | | 35,562 | | | | 35,862 | | | | 30,867 | | | | 30,627 | | | | 34,282 | |
Investment in bank owned life insurance | | | 47,666 | | | | 47,225 | | | | 46,780 | | | | 46,327 | | | | 45,938 | |
Goodwill | | | 94,671 | | | | 94,683 | | | | 95,045 | | | | 95,045 | | | | 95,045 | |
Other intangible assets | | | 18,485 | | | | 19,021 | | | | 5,890 | | | | 6,215 | | | | 6,544 | |
Derivative assets | | | 71,540 | | | | 83,784 | | | | 66,921 | | | | 94,214 | | | | 74,999 | |
Other assets | | | 191,200 | | | | 136,825 | | | | 103,511 | | | | 79,859 | | | | 101,476 | |
| | | | | | | | | | | | | | | | | | | | |
Total assets | | $ | 12,059,433 | | | $ | 12,082,584 | | | $ | 10,989,350 | | | $ | 10,375,714 | | | $ | 10,040,537 | |
| | | | | | | | | | | | | | | | | | | | |
| | | | | |
Liabilities | | | | | | | | | | | | | | | | | | | | |
Demand deposits: | | | | | | | | | | | | | | | | | | | | |
Non-interest bearing | | $ | 1,840,900 | | | $ | 1,565,492 | | | $ | 1,243,453 | | | $ | 954,311 | | | $ | 711,693 | |
Interest bearing | | | 752,728 | | | | 589,298 | | | | 535,374 | | | | 428,529 | | | | 232,099 | |
Savings deposits and money market accounts | | | 4,080,824 | | | | 4,057,382 | | | | 3,129,384 | | | | 3,021,268 | | | | 2,798,882 | |
Brokered deposits(1) | | | 1,566,139 | | | | 1,606,823 | | | | 1,943,065 | | | | 1,740,960 | | | | 2,654,768 | |
Other time deposits | | | 1,678,172 | | | | 1,741,783 | | | | 1,426,874 | | | | 1,671,520 | | | | 1,599,014 | |
| | | | | | | | | | | | | | | | | | | | |
Total deposits | | | 9,918,763 | | | | 9,560,778 | | | | 8,278,150 | | | | 7,816,588 | | | | 7,996,456 | |
Short-term borrowings | | | 214,975 | | | | 690,352 | | | | 892,706 | | | | 834,466 | | | | 654,765 | |
Long-term debt | | | 533,023 | | | | 618,173 | | | | 606,793 | | | | 710,793 | | | | 618,793 | |
Accrued interest payable | | | 9,673 | | | | 12,051 | | | | 18,809 | | | | 23,775 | | | | 37,623 | |
Derivative liabilities | | | 71,958 | | | | 85,097 | | | | 65,844 | | | | 91,911 | | | | 76,497 | |
Other liabilities | | | 75,425 | | | | 47,614 | | | | 47,670 | | | | 31,953 | | | | 50,837 | |
| | | | | | | | | | | | | | | | | | | | |
Total liabilities | | | 10,823,817 | | | | 11,014,065 | | | | 9,909,972 | | | | 9,509,486 | | | | 9,434,971 | |
| | | | | | | | | | | | | | | | | | | | |
| | | | | |
Stockholders’ Equity | | | | | | | | | | | | | | | | | | | | |
Preferred stock | | | 237,487 | | | | 237,145 | | | | 236,808 | | | | 294,546 | | | | 58,070 | |
Common stock | | | 70,444 | | | | 46,593 | | | | 46,548 | | | | 32,543 | | | | 32,468 | |
Treasury stock | | | (18,489 | ) | | | (18,427 | ) | | | (18,223 | ) | | | (17,338 | ) | | | (17,285 | ) |
Additional paid-in-capital | | | 940,338 | | | | 767,579 | | | | 761,068 | | | | 495,811 | | | | 482,347 | |
Retained earnings | | | (22,093 | ) | | | (2,748 | ) | | | 28,896 | | | | 26,875 | | | | 22,365 | |
Accumulated other comprehensive income, net | | | 27,896 | | | | 38,161 | | | | 24,131 | | | | 33,698 | | | | 27,568 | |
| | | | | | | | | | | | | | | | | | | | |
Controlling interest stockholders’ equity | | | 1,235,583 | | | | 1,068,303 | | | | 1,079,228 | | | | 866,135 | | | | 605,533 | |
| | | | | | | | | | | | | | | | | | | | |
Noncontrolling interests | | | 33 | | | | 216 | | | | 150 | | | | 93 | | | | 33 | |
| | | | | | | | | | | | | | | | | | | | |
Total stockholders’ equity | | | 1,235,616 | | | | 1,068,519 | | | | 1,079,378 | | | | 866,228 | | | | 605,566 | |
| | | | | | | | | | | | | | | | | | | | |
Total liabilities and stockholders’ equity | | $ | 12,059,433 | | | $ | 12,082,584 | | | $ | 10,989,350 | | | $ | 10,375,714 | | | $ | 10,040,537 | |
| | | | | | | | | | | | | | | | | | | | |
Note 1: Certain reclassifications have been made to prior period financial statements to place them on a basis comparable with the current period financial statements.
| (1) | Computed as the sum of traditional brokered deposits, client CDARs and non-client CDARs. Client CDARs for the fourth quarter 2008 through the fourth quarter 2009 were $679.0 million, $865.7 million, $1.0 billion, $981.7 million, and $979.7 million and are included in client deposits. |
| | |
Selected Financial Data Unaudited (Amounts in thousands except per share data) | |  |
| |
| |
| | | | | | | | | | | | | | | | | | | | |
| | | 4Q09 | | | 3Q09 | | | 2Q09 | | | 1Q09 | | | 4Q08 | |
| | | | | |
Selected Statement of Income Data: | | | | | | | | | | | | | | | | | | | | |
Net interest income | | $ | 99,562 | | | $ | 87,435 | | | $ | 74,107 | | | $ | 63,880 | | | $ | 59,147 | |
Net revenue(1) | | $ | 114,802 | | | $ | 101,155 | | | $ | 95,821 | | | $ | 88,288 | | | $ | 71,707 | |
Operating profit(2) | | $ | 46,274 | | | $ | 44,320 | | | $ | 31,826 | | | $ | 30,231 | | | $ | 16,804 | |
(Loss) income before taxes | | $ | (24,733 | ) | | $ | (46,533 | ) | | $ | 9,306 | | | $ | 11,580 | | | $ | (103,363 | ) |
Net (loss) income available to common stockholders | | $ | (18,630 | ) | | $ | (31,195 | ) | | $ | 2,478 | | | $ | 4,841 | | | $ | (62,779 | ) |
| | | | | |
Per Common Share Data: | | | | | | | | | | | | | | | | | | | | |
Basic earnings per share | | $ | (0.30 | ) | | $ | (0.68 | ) | | $ | 0.06 | | | $ | 0.15 | | | $ | (1.98 | ) |
Diluted earnings per share (3) | | $ | (0.30 | ) | | $ | (0.68 | ) | | $ | 0.06 | | | $ | 0.14 | | | $ | (1.98 | ) |
Dividends | | $ | 0.01 | | | $ | 0.01 | | | $ | 0.01 | | | $ | 0.01 | | | $ | 0.075 | |
Book value (period end)(4) | | $ | 13.99 | | | $ | 17.48 | | | $ | 17.74 | | | $ | 16.96 | | | $ | 16.31 | |
Tangible book value (period end)(5) | | $ | 12.41 | | | $ | 15.09 | | | $ | 15.62 | | | $ | 13.96 | | | $ | 13.28 | |
Market value (close) | | $ | 8.97 | | | $ | 24.46 | | | $ | 22.24 | | | $ | 14.46 | | | $ | 32.46 | |
Book value multiple | | | 0.64 | x | | | 1.40 | x | | | 1.25 | x | | | 0.85 | x | | | 1.99 | x |
| | | | | |
Share Data: | | | | | | | | | | | | | | | | | | | | |
Weighted Average Common Shares Outstanding | | | 61,608 | | | | 46,047 | | | | 38,015 | | | | 32,030 | | | | 31,733 | |
Diluted Average Common Shares Outstanding(3) | | | 61,608 | | | | 46,047 | | | | 39,795 | | | | 34,304 | | | | 31,733 | |
Common shares issued (at period end) | | | 71,869 | | | | 48,104 | | | | 48,015 | | | | 34,180 | | | | 34,043 | |
Common shares outstanding (at period end) | | | 71,332 | | | | 47,574 | | | | 47,493 | | | | 33,702 | | | | 33,568 | |
| | | | | |
Performance Ratios: | | | | | | | | | | | | | | | | | | | | |
Return on average assets | | | -0.50 | % | | | -0.94 | % | | | 0.23 | % | | | 0.29 | % | | | -2.63 | % |
Return on average common equity | | | -7.96 | % | | | -14.51 | % | | | 1.45 | % | | | 3.48 | % | | | -45.11 | % |
Net interest margin(6) | | | 3.48 | % | | | 3.09 | % | | | 2.99 | % | | | 2.68 | % | | | 2.62 | % |
Fee revenue as a percent of total revenue(7) | | | 12.68 | % | | | 13.11 | % | | | 16.49 | % | | | 26.29 | % | | | 17.35 | % |
Non-interest income to average assets | | | 0.47 | % | | | 0.43 | % | | | 0.80 | % | | | 0.95 | % | | | 0.49 | % |
Non-interest expense to average assets | | | 2.26 | % | | | 1.91 | % | | | 2.47 | % | | | 2.34 | % | | | 2.31 | % |
Net overhead ratio(8) | | | 1.79 | % | | | 1.48 | % | | | 1.67 | % | | | 1.39 | % | | | 1.82 | % |
Efficiency ratio (9) | | | 59.69 | % | | | 56.19 | % | | | 66.79 | % | | | 65.76 | % | | | 76.57 | % |
| | | | | |
Selected Financial Condition Data: | | | | | | | | | | | | | | | | | | | | |
The Private Wealth Group assets under management | | $ | 3,983,623 | | | $ | 4,008,268 | | | $ | 3,171,697 | | | $ | 3,164,158 | | | $ | 3,261,061 | |
| | | | | |
Balance Sheet Ratios: | | | | | | | | | | | | | | | | | | | | |
Loans to Deposits (period end) | | | 91.48 | % | | | 94.43 | % | | | 105.45 | % | | | 108.53 | % | | | 100.50 | % |
| | | | | |
Average interest-earning assets to average interest-bearing liabilities | | | 127.44 | % | | | 122.93 | % | | | 120.58 | % | | | 115.10 | % | | | 112.30 | % |
| | | | | |
Capital Ratios (period end): | | | | | | | | | | | | | | | | | | | | |
Total equity to total assets | | | 10.25 | % | | | 8.84 | % | | | 9.82 | % | | | 8.35 | % | | | 6.03 | % |
Total risk-based | | | 14.70 | % | | | 13.40 | % | | | 14.40 | % | | | 12.63 | % | | | 10.32 | % |
Tier-1 risk-based | | | 12.33 | % | | | 11.01 | % | | | 11.95 | % | | | 10.13 | % | | | 7.24 | % |
Leverage | | | 11.23 | % | | | 9.94 | % | | | 11.67 | % | | | 9.79 | % | | | 7.17 | % |
Tangible common equity to tangible assets (10) | | | 7.41 | % | | | 6.00 | % | | | 6.81 | % | | | 4.58 | % | | | 4.49 | % |
| (1) | Computed as the sum of net interest income on a tax equivalent basis and non-interest income. The quarterly tax equivalent adjustments for the fourth quarter 2008 through the fourth quarter 2009 were $917,000, $846,000, $999,000, $837,000, and $930,000, respectively. |
| (2) | Computed as the sum of net interest income on a tax equivalent basis and non-interest income, less non-interest expense. The quarterly tax equivalent adjustments for the fourth quarter 2008 through the fourth quarter 2009 were $917,000, $846,000, $999,000, $837,000, and $930,000, respectively. |
| (3) | For the fourth quarter 2008 and the third and fourth quarters 2009, diluted shares are equal to basic shares due to the net loss. The calculation of diluted earnings per share results in anti-dilution for the fourth quarter 2008 and the third and fourth quarters 2009. |
| (4) | Computed as total common equity divided by outstanding shares at end of period. |
| (5) | Computed as total common equity less goodwill and other intangibles divided by outstanding shares at end of period. This is a non-GAAP financial measure. |
| (6) | The quarterly tax equivalent adjustments for the fourth quarter 2008 through the fourth quarter 2009 were $917,000, $846,000, $999,000, $837,000, and $930,000, respectively. |
| (7) | Computed as non-interest income less acquisition related gains, securities gains (losses), net and early extinguishment of debt divided by the sum of net interest income and non-interest income less acquisition related gains, securities gains (losses), net and early extinguishment of debt. |
| (8) | Computed as non-interest expense less non-interest income divided by average total assets. |
| (9) | Computed as non-interest expense divided by the sum of net interest income on a tax equivalent basis and non-interest income. The quarterly tax equivalent adjustments for the fourth quarter 2008 through the fourth quarter 2009 were $917,000, $846,000 $999,000, $837,000, and $930,000, respectively. |
| (10) | Computed as tangible common equity divided by tangible assets, where tangible common equity equals total equity less preferred stock, goodwill and other intangible assets and tangible assets equals total assets less goodwill and other intangible assets. This is a non-GAAP financial measure. |
| | |
Loan Composition (excluding covered assets(1)) Unaudited (Dollars in thousands) | |  |
| |
| |
| | | | | | | | | | | | | | | |
| | | 12/31/09 | | 09/30/09 | | 06/30/09 | | 03/31/09 | | 12/31/08 |
Commercial and Industrial | | $ | 3,820,698 | | $ | 3,888,744 | | $ | 3,682,155 | | $ | 3,531,439 | | $ | 3,437,130 |
Owner-Occupied CRE | | | 835,913 | | | 765,489 | | | 899,315 | | | 872,656 | | | 538,688 |
| | | | | | | | | | | | | | | |
Total Commercial Loans | | | 4,656,611 | | | 4,654,233 | | | 4,581,470 | | | 4,404,095 | | | 3,975,818 |
| | | | | | | | | | | | | | | |
Commercial Real Estate | | | 2,293,996 | | | 2,169,209 | | | 1,954,692 | | | 1,825,805 | | | 1,980,271 |
Multi-family CRE | | | 521,001 | | | 466,098 | | | 492,896 | | | 520,455 | | | 403,690 |
| | | | | | | | | | | | | | | |
Total CRE Loans | | | 2,814,997 | | | 2,635,307 | | | 2,447,588 | | | 2,346,260 | | | 2,383,961 |
| | | | | | | | | | | | | | | |
Construction | | | 719,224 | | | 874,970 | | | 867,660 | | | 837,952 | | | 815,150 |
Residential Real Estate | | | 319,463 | | | 316,795 | | | 319,762 | | | 332,736 | | | 328,138 |
Home Equity | | | 220,025 | | | 214,630 | | | 215,087 | | | 205,872 | | | 191,934 |
Personal | | | 343,154 | | | 332,521 | | | 297,359 | | | 356,726 | | | 341,806 |
| | | | | | | | | | | | | | | |
Total Loans | | $ | 9,073,474 | | $ | 9,028,456 | | $ | 8,728,926 | | $ | 8,483,641 | | $ | 8,036,807 |
| | | | | | | | | | | | | | | |
Commercial Real Estate and Construction Loans Portfolio by Collateral Type
| | | | | | | | | | | | | | | | | | |
| | | 12/31/09 | | | 09/30/09 | | | 12/31/08 | |
| | | Amount | | % of
Total | | | Amount | | % of
Total | | | Amount | | % of
Total | |
Commercial Real Estate Portfolio | | | | | | | | | | | | | | | | | | |
Land | | $ | 400,261 | | 14 | % | | $ | 408,177 | | 15 | % | | $ | 475,802 | | 20 | % |
Residential 1-4 Family | | | 192,695 | | 7 | % | | | 252,113 | | 10 | % | | | 163,438 | | 7 | % |
Multi-Family 5+ | | | 521,001 | | 19 | % | | | 466,098 | | 18 | % | | | 403,690 | | 17 | % |
Industrial/Warehouse | | | 316,899 | | 11 | % | | | 289,307 | | 11 | % | | | 268,962 | | 11 | % |
Office | | | 410,131 | | 14 | % | | | 386,514 | | 15 | % | | | 441,929 | | 19 | % |
Retail | | | 419,115 | | 15 | % | | | 341,233 | | 13 | % | | | 357,844 | | 15 | % |
Health Care | | | 49,337 | | 2 | % | | | 50,184 | | 2 | % | | | 28,706 | | 1 | % |
Mixed Use/Other | | | 505,558 | | 18 | % | | | 441,681 | | 16 | % | | | 243,590 | | 10 | % |
| | | | | | | | | | | | | | | | | | |
Total Commercial Real Estate | | $ | 2,814,997 | | 100 | % | | $ | 2,635,307 | | 100 | % | | $ | 2,383,961 | | 100 | % |
| | | | | | | | | | | | | | | | | | |
| | | | | | |
Construction Portfolio | | | | | | | | | | | | | | | | | | |
Land | | $ | 91,207 | | 13 | % | | $ | 195,644 | | 22 | % | | $ | 29,790 | | 4 | % |
Residential 1-4 Family | | | 61,854 | | 9 | % | | | 88,765 | | 10 | % | | | 216,384 | | 27 | % |
Multi-Family 5+ | | | 131,001 | | 18 | % | | | 156,451 | | 18 | % | | | 44,893 | | 5 | % |
Industrial/Warehouse | | | 31,461 | | 4 | % | | | 13,778 | | 2 | % | | | - | | 0 | % |
Office | | | 112,946 | | 16 | % | | | 48,711 | | 6 | % | | | - | | 0 | % |
Retail | | | 127,356 | | 18 | % | | | 123,959 | | 14 | % | | | 38,508 | | 5 | % |
Mixed Use/Other | | | 163,399 | | 22 | % | | | 247,662 | | 28 | % | | | 485,575 | | 59 | % |
| | | | | | | | | | | | | | | | | | |
Total Construction | | $ | 719,224 | | 100 | % | | $ | 874,970 | | 100 | % | | $ | 815,150 | | 100 | % |
| | | | | | | | | | | | | | | | | | |
| (1) | Covered assets represent assets acquired from the FDIC subject to a loss sharing agreement and are presented separately on the Consolidated Balance Sheets. |
| | |
Asset Quality (excluding covered assets(1)) Unaudited (Dollars in thousands) | |  |
| |
| |
| | | | | | | | | | | | | | | | | | | | |
| | | 4Q09 | | | 3Q09 | | | 2Q09 | | | 1Q09 | | | 4Q08 | |
| | | | | |
Credit Quality Key Ratios: | | | | | | | | | | | | | | | | | | | | |
Net charge-offs to average loans | | | 1.80 | % | | | 1.67 | % | | | 0.39 | % | | | 0.17 | % | | | 5.49 | % |
Total non-performing loans to total loans | | | 4.36 | % | | | 3.99 | % | | | 2.10 | % | | | 1.92 | % | | | 1.64 | % |
Total non-performing assets to total assets | | | 3.62 | % | | | 3.28 | % | | | 1.94 | % | | | 1.85 | % | | | 1.55 | % |
Nonaccrual loans to: | | | | | | | | | | | | | | | | | | | | |
total loans | | | 4.36 | % | | | 3.99 | % | | | 2.10 | % | | | 1.92 | % | | | 1.64 | % |
total assets | | | 3.28 | % | | | 2.98 | % | | | 1.67 | % | | | 1.57 | % | | | 1.31 | % |
Allowance for loan losses to: | | | | | | | | | | | | | | | | | | | | |
total loans | | | 2.44 | % | | | 2.14 | % | | | 1.60 | % | | | 1.50 | % | | | 1.40 | % |
non-performing loans | | | 56 | % | | | 54 | % | | | 76 | % | | | 78 | % | | | 85 | % |
nonaccrual loans | | | 56 | % | | | 54 | % | | | 76 | % | | | 78 | % | | | 85 | % |
| | | | | |
Non-performing assets: | | | | | | | | | | | | | | | | | | | | |
Loans past due 90 days and accruing | | $ | 0 | | | $ | 0 | | | $ | 0 | | | $ | 0 | | | $ | 0 | |
Nonaccrual loans | | | 395,447 | | | | 359,918 | | | | 183,526 | | | | 162,896 | | | | 131,919 | |
OREO | | | 41,497 | | | | 36,705 | | | | 29,236 | | | | 28,703 | | | | 23,823 | |
| | | | | | | | | | | | | | | | | | | | |
Total non-performing assets | | $ | 436,944 | | | $ | 396,623 | | | $ | 212,762 | | | $ | 191,599 | | | $ | 155,742 | |
Nonaccrual Loans Stratification
| | | | | | | | | | | | | | | |
| | | $5.0 Million or
More | | $3.0 Million to
$4.9 Million | | $1.5 Million to
$2.9 Million | | Under $1.5
Million | | Total |
As of December 31, 2009 | | | | | | | | | | | | | | | |
Amount: | | | | | | | | | | | | | | | |
Commercial | | $ | 46,176 | | $ | - | | $ | 4,092 | | $ | 19,078 | | $ | 69,346 |
Commercial real estate | | | 51,425 | | | 15,186 | | | 60,028 | | | 44,410 | | | 171,049 |
Construction | | | 41,772 | | | 27,690 | | | 24,590 | | | 19,770 | | | 113,822 |
Residential real estate | | | - | | | 3,265 | | | 2,959 | | | 8,257 | | | 14,481 |
Personal and home equity | | | 5,031 | | | 7,419 | | | 4,998 | | | 9,301 | | | 26,749 |
| | | | | | | | | | | | | | | |
Total | | $ | 144,404 | | $ | 53,560 | | $ | 96,667 | | $ | 100,816 | | $ | 395,447 |
| | | | | | | | | | | | | | | |
| | | | | |
Number of borrowers: | | | | | | | | | | | | | | | |
Commercial | | | 3 | | | - | | | 2 | | | 51 | | | 56 |
Commercial real estate | | | 6 | | | 4 | | | 28 | | | 88 | | | 126 |
Construction | | | 4 | | | 7 | | | 11 | | | 38 | | | 60 |
Residential real estate | | | - | | | 1 | | | 1 | | | 23 | | | 25 |
Personal and home equity | | | 1 | | | 2 | | | 3 | | | 39 | | | 45 |
| | | | | | | | | | | | | | | |
Total | | | 14 | | | 14 | | | 45 | | | 239 | | | 312 |
| | | | | | | | | | | | | | | |
| | | | | |
As of September 30, 2009 | | | | | | | | | | | | | | | |
Amount: | | | | | | | | | | | | | | | |
Commercial | | $ | 44,977 | | $ | - | | $ | 13,679 | | $ | 14,152 | | $ | 72,808 |
Commercial real estate | | | 50,610 | | | 14,099 | | | 39,917 | | | 40,812 | | | 145,438 |
Construction | | | 54,979 | | | 23,049 | | | 22,605 | | | 18,243 | | | 118,876 |
Residential real estate | | | - | | | 3,300 | | | 5,089 | | | 3,510 | | | 11,899 |
Personal and home equity | | | - | | | 3,000 | | | 1,544 | | | 6,353 | | | 10,897 |
| | | | | | | | | | | | | | | |
Total | | $ | 150,566 | | $ | 43,448 | | $ | 82,834 | | $ | 83,070 | | $ | 359,918 |
| | | | | | | | | | | | | | | |
| | | | | |
Number of borrowers: | | | | | | | | | | | | | | | |
Commercial | | | 4 | | | - | | | 6 | | | 50 | | | 60 |
Commercial real estate | | | 6 | | | 4 | | | 19 | | | 78 | | | 107 |
Construction | | | 5 | | | 6 | | | 11 | | | 36 | | | 58 |
Residential real estate | | | - | | | 1 | | | 2 | | | 13 | | | 16 |
Personal and home equity | | | - | | | 1 | | | 1 | | | 30 | | | 32 |
| | | | | | | | | | | | | | | |
Total | | | 15 | | | 12 | | | 39 | | | 207 | | | 273 |
| | | | | | | | | | | | | | | |
| (1) | Covered assets represent assets acquired from the FDIC subject to a loss sharing agreement and are presented separately on the Consolidated Balance Sheets. Covered assets are included as a component of total assets in calculations above. |
| | |
Loan Portfolio Aging (excluding covered assets(1)) Unaudited (Dollars in thousands) | |  |
| |
| |
| | | | | | | | | | | | | | | | | | | | | | | | |
| As of December 31, 2009 | | Current | | | 30-59 Days
Past Due | | | 60-89 Days
Past Due | | | 90 Days
Past Due | | | Nonaccrual | | | Total Loans | |
Loan balances: | |
Commercial | | $ | 4,563,883 | | | $ | 13,427 | | | $ | 9,955 | | | $ | 0 | | | $ | 69,346 | | | $ | 4,656,611 | |
Commercial real estate | | | 2,589,327 | | | | 23,983 | | | | 30,638 | | | | - | | | | 171,049 | | | | 2,814,997 | |
Construction | | | 601,260 | | | | 3,391 | | | | 751 | | | | - | | | | 113,822 | | | | 719,224 | |
Residential real estate | | | 299,158 | | | | 4,170 | | | | 1,654 | | | | - | | | | 14,481 | | | | 319,463 | |
Personal and home equity | | | 521,738 | | | | 6,097 | | | | 8,595 | | | | - | | | | 26,749 | | | | 563,179 | |
| | | | | | | | | | | | | | | | | | | | | | | | |
Total loans | | $ | 8,575,366 | | | $ | 51,068 | | | $ | 51,593 | | | $ | 0 | | | $ | 395,447 | | | $ | 9,073,474 | |
| | | | | | | | | | | | | | | | | | | | | | | | |
|
Aging as a percent of loan balance: | |
Commercial | | | 98.01 | % | | | 0.29 | % | | | 0.21 | % | | | 0.00 | % | | | 1.49 | % | | | 100.00 | % |
Commercial real estate | | | 91.98 | % | | | 0.85 | % | | | 1.09 | % | | | 0.00 | % | | | 6.08 | % | | | 100.00 | % |
Construction | | | 83.60 | % | | | 0.47 | % | | | 0.10 | % | | | 0.00 | % | | | 15.83 | % | | | 100.00 | % |
Residential real estate | | | 93.64 | % | | | 1.31 | % | | | 0.52 | % | | | 0.00 | % | | | 4.53 | % | | | 100.00 | % |
Personal and home equity | | | 92.64 | % | | | 1.08 | % | | | 1.53 | % | | | 0.00 | % | | | 4.75 | % | | | 100.00 | % |
| | | | | | | | | | | | | | | | | | | | | | | | |
Total loans | | | 94.51 | % | | | 0.56 | % | | | 0.57 | % | | | 0.00 | % | | | 4.36 | % | | | 100.00 | % |
| | | | | | |
| | | 4Q09 | | | 3Q09 | | | 2Q09 | | | 1Q09 | | | 4Q08 | | | | |
|
Nonaccrual loans: | |
Commercial | | $ | 69,346 | | | $ | 72,808 | | | $ | 25,442 | | | $ | 19,017 | | | $ | 11,735 | | | | | |
Commercial Real Estate | | | 171,049 | | | | 145,438 | | | | 72,621 | | | | 55,238 | | | | 48,143 | | | | | |
Construction | | | 113,822 | | | | 118,876 | | | | 64,849 | | | | 66,067 | | | | 63,305 | | | | | |
Residential Real Estate | | | 14,481 | | | | 11,899 | | | | 8,913 | | | | 8,138 | | | | 6,829 | | | | | |
Personal and Home Equity | | | 26,749 | | | | 10,897 | | | | 11,701 | | | | 14,436 | | | | 1,907 | | | | | |
| | | | | | | | | | | | | | | | | | | | | | | | |
Total | | $ | 395,447 | | | $ | 359,918 | | | $ | 183,526 | | | $ | 162,896 | | | $ | 131,919 | | | | | |
| | | | | | | | | | | | | | | | | | | | | | | | |
|
Nonaccrual loans as a percent of total loan type: | |
Commercial | | | 1.49 | % | | | 1.56 | % | | | 0.56 | % | | | 0.43 | % | | | 0.30 | % | | | | |
Commercial Real Estate | | | 6.08 | % | | | 5.52 | % | | | 2.97 | % | | | 2.35 | % | | | 2.02 | % | | | | |
Construction | | | 15.83 | % | | | 13.59 | % | | | 7.47 | % | | | 7.88 | % | | | 7.77 | % | | | | |
Residential Real Estate | | | 4.53 | % | | | 3.76 | % | | | 2.79 | % | | | 2.45 | % | | | 2.08 | % | | | | |
Personal and Home Equity | | | 4.75 | % | | | 1.99 | % | | | 2.28 | % | | | 2.57 | % | | | 0.36 | % | | | | |
| | | | | | | | | | | | | | | | | | | | | | | | |
Total | | | 4.36 | % | | | 3.99 | % | | | 2.10 | % | | | 1.92 | % | | | 1.64 | % | | | | |
|
Loans past due 60-89 days and still accruing: | |
Commercial | | $ | 9,955 | | | $ | 1,588 | | | $ | 228 | | | $ | 1,355 | | | $ | 2,874 | | | | | |
Commercial Real Estate | | | 30,638 | | | | 23,245 | | | | 24,491 | | | | 2,138 | | | | 1,773 | | | | | |
Construction | | | 751 | | | | 10,962 | | | | 7,076 | | | | 3,554 | | | | 1,060 | | | | | |
Residential Real Estate | | | 1,654 | | | | - | | | | 2,888 | | | | - | | | | - | | | | | |
Personal and Home Equity | | | 8,595 | | | | 3,087 | | | | 4,698 | | | | 471 | | | | 246 | | | | | |
| | | | | | | | | | | | | | | | | | | | | | | | |
Total | | $ | 51,593 | | | $ | 38,882 | | | $ | 39,381 | | | $ | 7,518 | | | $ | 5,953 | | | | | |
| | | | | | | | | | | | | | | | | | | | | | | | |
|
Loans past due 60-89 days and still accruing as a percent of total loan type: | |
Commercial | | | 0.21 | % | | | 0.03 | % | | | 0.00 | % | | | 0.03 | % | | | 0.07 | % | | | | |
Commercial Real Estate | | | 1.09 | % | | | 0.88 | % | | | 1.00 | % | | | 0.09 | % | | | 0.07 | % | | | | |
Construction | | | 0.10 | % | | | 1.25 | % | | | 0.82 | % | | | 0.42 | % | | | 0.13 | % | | | | |
Residential Real Estate | | | 0.52 | % | | | - | | | | 0.90 | % | | | - | | | | - | | | | | |
Personal and Home Equity | | | 1.53 | % | | | 0.56 | % | | | 0.92 | % | | | 0.08 | % | | | 0.05 | % | | | | |
| | | | | | | | | | | | | | | | | | | | | | | | |
Total | | | 0.57 | % | | | 0.43 | % | | | 0.45 | % | | | 0.09 | % | | | 0.07 | % | | | | |
|
Loans past due 30-59 days and still accruing: | |
Commercial | | $ | 13,427 | | | $ | 4,424 | | | $ | 4,022 | | | $ | 22,598 | | | $ | 9,186 | | | | | |
Commercial Real Estate | | | 23,983 | | | | 18,005 | | | | 11,050 | | | | 53,743 | | | | 7,340 | | | | | |
Construction | | | 3,391 | | | | 2,541 | | | | 3,936 | | | | 3,642 | | | | 8,106 | | | | | |
Residential Real Estate | | | 4,170 | | | | 1,431 | | | | - | | | | 5,606 | | | | 3,485 | | | | | |
Personal and Home Equity | | | 6,097 | | | | 3,877 | | | | 1,007 | | | | 7,333 | | | | 1,334 | | | | | |
| | | | | | | | | | | | | | | | | | | | | | | | |
Total | | $ | 51,068 | | | $ | 30,278 | | | $ | 20,015 | | | $ | 92,922 | | | $ | 29,451 | | | | | |
| | | | | | | | | | | | | | | | | | | | | | | | |
|
Loans past due 30-59 days and still accruing as a percent of total loan type: | |
Commercial | | | 0.29 | % | | | 0.10 | % | | | 0.09 | % | | | 0.51 | % | | | 0.23 | % | | | | |
Commercial Real Estate | | | 0.85 | % | | | 0.68 | % | | | 0.45 | % | | | 2.29 | % | | | 0.31 | % | | | | |
Construction | | | 0.47 | % | | | 0.29 | % | | | 0.45 | % | | | 0.43 | % | | | 0.99 | % | | | | |
Residential Real Estate | | | 1.31 | % | | | 0.45 | % | | | - | | | | 1.68 | % | | | 1.06 | % | | | | |
Personal and Home Equity | | | 1.08 | % | | | 0.71 | % | | | 0.20 | % | | | 1.30 | % | | | 0.25 | % | | | | |
| | | | | | | | | | | | | | | | | | | | | | | | |
Total | | | 0.56 | % | | | 0.34 | % | | | 0.23 | % | | | 1.10 | % | | | 0.37 | % | | | | |
| (1) | Covered assets represent assets acquired from the FDIC subject to a loss sharing agreement and are presented separately on the Consolidated Balance Sheets. Covered assets are included as a component of total assets in calculations above. |
| | |
Allowance for Loan Losses (excluding covered assets(1)) Unaudited (Dollars in thousands) | |  |
| |
| |
| | | | | | | | | | | | | | | | | | | | |
| | | 4Q09 | | | 3Q09 | | | 2Q09 | | | 1Q09 | | | 4Q08 | |
Change in allowance for loan losses: | |
Balance at beginning of period | | $ | 192,791 | | | $ | 140,088 | | | $ | 127,011 | | | $ | 112,672 | | | $ | 102,223 | |
Loans charged off: | | | | | | | | | | | | | | | | | | | | |
Commercial | | $ | (11,082 | ) | | $ | (13,065 | ) | | $ | (2,220 | ) | | $ | (5,377 | ) | | $ | (11,184 | ) |
Commercial Real Estate | | | (13,120 | ) | | | (13,772 | ) | | | (428 | ) | | | (246 | ) | | | (45,240 | ) |
Construction | | | (14,438 | ) | | | (6,928 | ) | | | (1,507 | ) | | | (598 | ) | | | (47,555 | ) |
Residential Real Estate | | | (970 | ) | | | (475 | ) | | | (50 | ) | | | - | | | | (2,385 | ) |
Home Equity | | | (805 | ) | | | (100 | ) | | | (262 | ) | | | (19 | ) | | | (1,782 | ) |
Personal | | | (1,086 | ) | | | (5,802 | ) | | | (8,113 | ) | | | (797 | ) | | | (1,313 | ) |
| | | | | | | | | | | | | | | | | | | | |
Total loans charged off | | | (41,501 | ) | | | (40,142 | ) | | | (12,580 | ) | | | (7,037 | ) | | | (109,459 | ) |
| | | | | | | | | | | | | | | | | | | | |
Recoveries: | | | | | | | | | | | | | | | | | | | | |
Commercial | | $ | 410 | | | $ | 1,060 | | | $ | 1,329 | | | $ | 1,190 | | | $ | 174 | |
Commercial Real Estate | | | 126 | | | | 676 | | | | 462 | | | | 496 | | | | 3 | |
Construction | | | 240 | | | | 1,026 | | | | 1,950 | | | | 1,840 | | | | 474 | |
Residential Real Estate | | | 12 | | | | - | | | | 138 | | | | 2 | | | | - | |
Home Equity | | | 52 | | | | 1 | | | | 11 | | | | 10 | | | | 1 | |
Personal | | | 34 | | | | 66 | | | | 246 | | | | 33 | | | | 6 | |
| | | | | | | | | | | | | | | | | | | | |
Total recoveries: | | | 874 | | | | 2,829 | | | | 4,136 | | | | 3,571 | | | | 658 | |
| | | | | | | | | | | | | | | | | | | | |
Total net loan charge-offs | | | (40,627 | ) | | | (37,313 | ) | | | (8,444 | ) | | | (3,466 | ) | | | (108,801 | ) |
Provision | | | 69,524 | | | | 90,016 | | | | 21,521 | | | | 17,805 | | | | 119,250 | |
| | | | | | | | | | | | | | | | | | | | |
Balance at end of period | | $ | 221,688 | | | $ | 192,791 | | | $ | 140,088 | | | $ | 127,011 | | | $ | 112,672 | |
| | | | | | | | | | | | | | | | | | | | |
|
Allocation of allowance for loan losses: | |
General allocated reserve: | | | | | | | | | | | | | | | | | | | | |
Commercial | | $ | 43,350 | | | $ | 59,118 | | | $ | 46,449 | | | $ | 47,258 | | | $ | 39,524 | |
Commercial Real Estate | | | 77,223 | | | | 44,745 | | | | 36,880 | | | | 37,026 | | | | 31,625 | |
Construction | | | 23,581 | | | | 41,222 | | | | 34,710 | | | | 30,429 | | | | 27,231 | |
Residential Real Estate | | | 3,635 | | | | 2,009 | | | | 1,468 | | | | 1,443 | | | | 1,294 | |
Home Equity | | | 2,862 | | | | 1,582 | | | | 1,224 | | | | 1,220 | | | | 1,000 | |
Personal | | | 5,277 | | | | 2,084 | | | | 1,810 | | | | 1,540 | | | | 1,527 | |
| | | | | | | | | | | | | | | | | | | | |
Total general allocated | | $ | 155,928 | | | $ | 150,760 | | | $ | 122,541 | | | $ | 118,916 | | | $ | 102,201 | |
Specific reserve | | | 65,760 | | | | 42,031 | | | | 16,847 | | | | 7,460 | | | | 330 | |
Unallocated reserve | | | - | | | | - | | | | 700 | | | | 635 | | | | 10,141 | |
| | | | | | | | | | | | | | | | | | | | |
Total | | $ | 221,688 | | | $ | 192,791 | | | $ | 140,088 | | | $ | 127,011 | | | $ | 112,672 | |
| | | | | | | | | | | | | | | | | | | | |
|
Allocation of reserve by a percent of total allowance for loan losses: | |
General allocated reserve: | | | | | | | | | | | | | | | | | | | | |
Commercial | | | 20 | % | | | 31 | % | | | 33 | % | | | 37 | % | | | 35 | % |
Commercial Real Estate | | | 35 | % | | | 23 | % | | | 26 | % | | | 29 | % | | | 28 | % |
Construction | | | 10 | % | | | 21 | % | | | 25 | % | | | 24 | % | | | 24 | % |
Residential Real Estate | | | 2 | % | | | 1 | % | | | 1 | % | | | 1 | % | | | 1 | % |
Home Equity | | | 1 | % | | | 1 | % | | | 1 | % | | | 1 | % | | | 1 | % |
Personal | | | 2 | % | | | 1 | % | | | 1 | % | | | 1 | % | | | 2 | % |
| | | | | | | | | | | | | | | | | | | | |
Total general allocated | | | 70 | % | | | 78 | % | | | 87 | % | | | 93 | % | | | 91 | % |
Specific reserve | | | 30 | % | | | 22 | % | | | 13 | % | | | 6 | % | | | - | |
Unallocated reserve | | | - | | | | - | | | | - | | | | 1 | % | | | 9 | % |
| | | | | | | | | | | | | | | | | | | | |
Total | | | 100 | % | | | 100 | % | | | 100 | % | | | 100 | % | | | 100 | % |
| | | | | | | | | | | | | | | | | | | | |
| | | | | |
Allowance for loan losses to: | | | | | | | | | | | | | | | | | | | | |
total loans | | | 2.44 | % | | | 2.14 | % | | | 1.60 | % | | | 1.50 | % | | | 1.40 | % |
non-performing loans | | | 56 | % | | | 54 | % | | | 76 | % | | | 78 | % | | | 85 | % |
nonaccrual loans | | | 56 | % | | | 54 | % | | | 76 | % | | | 78 | % | | | 85 | % |
| (1) | Covered assets represent assets acquired from the FDIC subject to a loss sharing agreement and are presented separately on the Consolidated Balance Sheets. Covered assets are included as a component of total assets in calculations above. |
| | |
Deposits Unaudited (Dollars in thousands) | |  |
| |
| |
| | | | | | | | | | | | | | | |
| | | 12/31/09 | | 09/30/09 | | 06/30/09 | | 03/31/09 | | 12/31/08 |
Non-interest bearing deposits | | $ | 1,840,900 | | $ | 1,565,492 | | $ | 1,243,453 | | $ | 954,311 | | $ | 711,693 |
Interest-bearing deposits | | | 752,728 | | | 589,298 | | | 535,374 | | | 428,529 | | | 232,099 |
Savings deposits | | | 141,614 | | | 135,937 | | | 19,852 | | | 16,745 | | | 15,644 |
Money market accounts | | | 3,939,210 | | | 3,921,445 | | | 3,109,532 | | | 3,004,523 | | | 2,783,238 |
Brokered deposits: | | | | | | | | | | | | | | | |
Traditional brokered deposits | | | 389,590 | | | 453,759 | | | 708,802 | | | 768,488 | | | 1,481,762 |
Client CDARS | | | 979,728 | | | 981,677 | | | 1,047,082 | | | 865,656 | | | 678,958 |
Non-client CDARS | | | 196,821 | | | 171,387 | | | 187,181 | | | 106,816 | | | 494,048 |
| | | | | | | | | | | | | | | |
Total brokered deposits | | | 1,566,139 | | | 1,606,823 | | | 1,943,065 | | | 1,740,960 | | | 2,654,768 |
Other time deposits | | | 1,678,172 | | | 1,741,783 | | | 1,426,874 | | | 1,671,520 | | | 1,599,014 |
| | | | | | | | | | | | | | | |
Total deposits | | $ | 9,918,763 | | $ | 9,560,778 | | $ | 8,278,150 | | $ | 7,816,588 | | $ | 7,996,456 |
| | | | | | | | | | | | | | | |
| | | | | |
Client deposits (1) | | $ | 9,332,352 | | $ | 8,935,632 | | $ | 7,382,167 | | $ | 6,941,284 | | $ | 6,020,646 |
| (1) | Client deposits are equal to total deposits less brokered deposits plus client CDARSTM. |
n/mNot meaningful
| | |
Net Interest Margin Unaudited (Dollars in thousands) | |  |
| |
| |
| | | | | | | | | | | | | | | | | | | | |
| | | Three Months Ended December 31, | |
| | | 2009 | | | 2008 | |
| | | Average
Balance | | | Interest | | Rate | | | Average
Balance | | | Interest | | Rate | |
Assets: | | | | | | | | | | | | | | | | | | | | |
Fed funds sold and other short-term investments | | $ | 335,990 | | | $ | 340 | | 0.40 | % | | $ | 119,711 | | | $ | 488 | | 1.61 | % |
Securities: | | | | | | | | | | | | | | | | | | | | |
Taxable | | | 1,424,474 | | | | 15,672 | | 4.40 | % | | | 912,965 | | | | 10,754 | | 4.71 | % |
Tax exempt | | | 159,021 | | | | 2,602 | | 6.55 | % | | | 179,685 | | | | 2,941 | | 6.55 | % |
| | | | | | | | | | | | | | | | | | | | |
Total securities | | | 1,583,495 | | | | 18,274 | | 4.62 | % | | | 1,092,650 | | | | 13,695 | | 5.01 | % |
| | | | | | | | | | | | | | | | | | | | |
Loans: | | | | | | | | | | | | | | | | | | | | |
Commercial, Construction & CRE | | | 8,111,383 | | | | 89,518 | | 4.36 | % | | | 7,023,689 | | | | 96,904 | | 5.44 | % |
Residential | | | 335,005 | | | | 4,282 | | 5.11 | % | | | 335,117 | | | | 4,770 | | 5.69 | % |
Private Client | | | 531,955 | | | | 5,191 | | 3.87 | % | | | 489,086 | | | | 5,696 | | 4.62 | % |
| | | | | | | | | | | | | | | | | | | | |
Total loans(1) | | | 8,978,343 | | | | 98,991 | | 4.36 | % | | | 7,847,892 | | | | 107,370 | | 5.40 | % |
| | | | | | | | | | | | | | | | | | | | |
Covered assets | | | 513,038 | | | | 16,149 | | 12.34 | % | | | - | | | | - | | - | |
| | | | | | | | | | | | | | | | | | | | |
Total earning assets | | $ | 11,410,866 | | | $ | 133,754 | | 4.63 | % | | $ | 9,060,253 | | | $ | 121,553 | | 5.30 | % |
| | | | | | | | | | | | | | | | | | | | |
Cash and due from banks | | | 269,436 | | | | | | | | | | 141,128 | | | | | | | |
Allowance for loan losses | | | (190,482 | ) | | | | | | | | | (104,510 | ) | | | | | | |
Other assets | | | 550,547 | | | | | | | | | | 338,520 | | | | | | | |
| | | | | | | | | | | | | | | | | | | | |
Total assets | | $ | 12,040,367 | | | | | | | | | $ | 9,435,391 | | | | | | | |
| | | | | | | | | | | | | | | | | | | | |
| | | | | | |
Liabilities and Stockholders’ Equity: | | | | | | | | | | | | | | | | | | | | |
Interest-bearing demand deposits | | $ | 628,760 | | | $ | 848 | | 0.54 | % | | $ | 166,636 | | | $ | 285 | | 0.68 | % |
Savings deposits | | | 138,211 | | | | 283 | | 0.81 | % | | | 15,912 | | | | 46 | | 1.14 | % |
Money market accounts | | | 4,024,286 | | | | 8,739 | | 0.86 | % | | | 2,595,014 | | | | 11,533 | | 1.76 | % |
Time deposits | | | 1,727,566 | | | | 7,384 | | 1.70 | % | | | 1,606,006 | | | | 13,191 | | 3.26 | % |
Brokered deposits | | | 1,572,292 | | | | 6,575 | | 1.66 | % | | | 2,600,547 | | | | 23,214 | | 3.54 | % |
| | | | | | | | | | | | | | | | | | | | |
Total interest-bearing deposits | | | 8,091,115 | | | | 23,829 | | 1.17 | % | | | 6,984,115 | | | | 48,269 | | 2.74 | % |
Short term borrowings | | | 306,347 | | | | 1,613 | | 2.06 | % | | | 478,892 | | | | 3,416 | | 2.79 | % |
Long term debt | | | 556,126 | | | | 7,820 | | 5.58 | % | | | 604,554 | | | | 9,805 | | 6.35 | % |
| | | | | | | | | | | | | | | | | | | | |
Total interest-bearing liabilities | | | 8,953,588 | | | | 33,262 | | 1.47 | % | | | 8,067,561 | | | | 61,490 | | 3.01 | % |
| | | | | | | | | | | | | | | | | | | | |
Non-interest bearing demand deposits | | | 1,770,036 | | | | | | | | | | 637,013 | | | | | | | |
Other liabilities | | | 150,476 | | | | | | | | | | 120,658 | | | | | | | |
Stockholders’ equity | | | 1,166,267 | | | | | | | | | | 610,159 | | | | | | | |
| | | | | | | | | | | | | | | | | | | | |
Total liabilities and stockholders’ equity | | $ | 12,040,367 | | | | | | | | | $ | 9,435,391 | | | | | | | |
| | | | | | | | | | | | | | | | | | | | |
Net interest spread(2) | | | | | | | | | 3.16 | % | | | | | | | | | 2.29 | % |
Effect of non interest-bearing funds | | | | | | | | | 0.32 | % | | | | | | | | | 0.33 | % |
| | | | | | | | | | | | | | | | | | | | |
Net interest income/margin(3) (4) | | | | | | $ | 100,492 | | 3.48 | % | | | | | | $ | 60,063 | | 2.62 | % |
| | | | | | | | | | | | | | | | | | | | |
| (1) | Non-accrual loans are included in the average balances and the average annualized interest foregone on these loans was approximately $17.8 million for the quarter ended December 31, 2009 compared to approximately $5.9 million in the prior year quarter. |
| (2) | Yield on average interest-earning assets less rate on average interest-bearing liabilities. |
| (3) | Reconciliation of the effect after tax equivalent adjustment to reported net interest income: |
| | | | | | |
| | | Three months ended
December 31, |
| | | 2009 | | 2008 |
Net interest income | | $ | 99,562 | | $ | 59,147 |
Tax equivalent adjustment | | | 930 | | | 916 |
| | | | | | |
Net interest income, tax equivalent basis | | $ | 100,492 | | $ | 60,063 |
| | | | | | |
| (5) | Computed as net interest income, on a tax equivalent basis, divided by average interest-earning assets. |