Exhibit 99.1

For further information:
Media Contact:
Amy Yuhn
312-564-1378
ayuhn@theprivatebank.com
Investor Relations Contact:
Beth Coronelli
312-564-6052
bcoronelli@theprivatebank.com
For Immediate Release
PrivateBancorp Reports First Quarter Results
Operating Performance Solid; Non-performing Asset Growth Slows
CHICAGO, April 26, 2010 – PrivateBancorp, Inc. (NASDAQ: PVTB) today reported a net loss of $24.3 million, or $0.35 per diluted share, for the first quarter 2010, compared to net income of $4.8 million, or $0.14 per diluted share, for the first quarter 2009.
“While there is still credit uncertainty, we are encouraged by the slowing pace of our non-performing asset growth and continue to actively manage through the challenges of the cycle,” said Larry D. Richman, President and Chief Executive Officer, PrivateBancorp, Inc. “Non-performing asset growth moderated due largely to our focused efforts to address weaker credits as we bolstered our workout teams and repositioned resources.”
“Our capital position and business fundamentals remain solid,” Richman continued. “Supported by our strong balance sheet, we are working with new and existing clients as they begin to reinvest in their businesses. As the economy recovers and credit trends improve over time, we are positioned to return to profitability, leveraging our core earnings capacity and strong commercial banking franchise.”
First Quarter Results
| • | Non-performing assets at quarter end were $442.0 million, compared to $436.9 million at year-end. Provision for loan losses for the first quarter 2010 was $72.1 million and net charge-offs were $56.9 million, resulting in an allowance for loan losses of $236.9 million or 2.66 percent of total loans. |
| • | Net revenue totaled $114.3 million and operating profit was $40.9 million for the quarter. Net interest income and net interest margin remained strong at $98.3 million and 3.36 percent. |
| • | Deposits grew to $10.6 billion with a 6 percent increase in client deposits from year end. Total loans were $8.9 billion, reflecting lower overall credit demand, with paydowns and payoffs offsetting new loan growth. New loan growth was approximately $200 million in the quarter. |
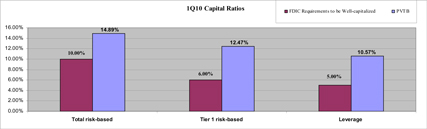
| • | Solid capital position reflected by total risk-based capital ratio of 14.89 percent, Tier 1 capital ratio of 12.47 percent, Tier 1 common capital ratio of 7.85 percent, and tangible common equity ratio of 6.86 at quarter end. |
Credit Quality
The Company continued to manage the portfolio through the difficult credit climate with ongoing disciplined workout and asset review, and heightened focus on addressing the challenges of the commercial real estate sector. Non-performing assets increased at a slower rate than in the previous quarter, indicating early signs of stabilization. While risk is still evident given the broader credit environment, management anticipates continued moderation of non-performing asset growth in the second quarter. Overall, commercial and industrial sector performance appears to be strengthening slightly, in line with early signs of economic recovery. However, the commercial real estate sector continues to show stress.
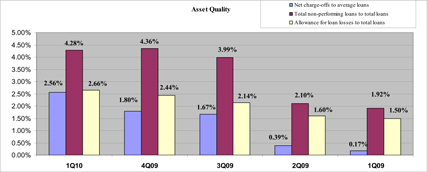
The first quarter 2010 provision for loan losses was $72.1 million, compared to $17.8 million in the first quarter 2009 and $69.5 million in the fourth quarter 2009. The allowance for loan losses as a percentage of total loans was 2.66 percent at March 31, 2010, compared to 1.50 percent at March 31, 2009, and 2.44 percent at December 31, 2009. Allowance for loan losses, as a percentage of non-performing loans, was 62 percent in the first quarter 2010, compared to 78 percent in the first quarter 2009 and 56 percent in the fourth quarter 2009.
Net charge-offs increased to $56.9 million for the quarter ended March 31, 2010, up from $3.5 million for the first quarter 2009 and $40.6 million for the fourth quarter 2009. Approximately $31.9 million of first quarter net charge-offs were related to commercial real estate and construction loans.
The Company had $442.0 million in total non-performing assets at March 31, 2010, compared to $191.6 million at March 31, 2009, and $436.9 million at December 31, 2009. Approximately 71 percent of non-performing loans at March 31, 2010, were commercial real estate and construction loans. Non-performing assets to total assets were 3.45 percent at March 31, 2010, compared to 1.85 percent at March 31, 2009, and 3.62 percent at December 31, 2009.
Credit quality results exclude $468.9 million in covered assets as of the end of first quarter, referring to certain assets acquired through an FDIC-assisted transaction that are subject to a loss-sharing agreement.
Operating Performance
The Company continues to generate strong core performance as it leverages its investment in people and infrastructure. New business development remains steady with client acquisition, disciplined pricing, and increased cross sell driving stable revenue.
Net revenue was $114.3 million in the first quarter 2010, up from $88.3 million in the first quarter 2009 and relatively flat compared to $114.8 million in the fourth quarter 2009. Operating profit (the sum of net interest income and non-interest income less non-interest expense) was $40.9 million in the first quarter 2010, compared to $30.2 million in the first quarter 2009 and $46.3 million in the fourth quarter 2009. Operating profit was impacted by modestly reduced loan levels and a normalized incentive compensation accrual in the first quarter 2010.
Net interest income was $98.3 million in the first quarter 2010, compared to $63.9 million for the first quarter 2009 and $99.6 million in the fourth quarter 2009. Net interest margin (on a tax equivalent basis) was 3.36 percent for the first quarter 2010, compared to 2.68 percent in the first quarter 2009 and 3.48 percent in the fourth quarter 2009. Excluding accretion from the Founders Bank transaction in the first and fourth quarters, net interest margin was relatively flat on a comparison basis. The strength of the net interest margin reflects increased client deposits and the contribution of the Founders Bank transaction.
Non-interest income was $15.1 million in the first quarter 2010, compared to $23.6 million in the first quarter 2009 and $14.3 million in the fourth quarter 2009. Treasury management income increased to $3.6 million in the first quarter 2010, up from $1.6 million in the first quarter 2009 and $3.4 million in the fourth quarter 2009, reflecting increased cross sell into our existing commercial base. Capital markets income in the first quarter 2010 decreased to $278,000, down from $11.2 million in the first quarter 2009 and $2.4 million in the fourth quarter 2009. Capital markets income was impacted by a $1.3 million negative credit valuation adjustment, reduced originations, and the interest rate environment.
Mortgage banking income was $2.1 million in the first quarter 2010, compared to $2.2 million in the first and fourth quarters 2009. Other income, service charges and fees were $4.2 million in the first quarter 2010, compared to $3.6 million in the first quarter 2009 and $1.9 million in the fourth quarter 2009, which included a $4.2 million loss on loan dispositions.
Wealth management fee income was $4.4 million in the first quarter 2010, up from $3.8 million in the first quarter 2009 and $4.1 million in the fourth quarter 2009. Assets under management and administration at March 31, 2010, were $4.0 billion, compared to $3.2 billion at March 31, 2009, and $4.0 billion at December 31, 2009.
Expenses
The Company continued to closely manage costs, resulting in lower expenses quarter-over-quarter, excluding the impact of the normalized incentive compensation accrual in the first quarter 2010. Non-interest expense was $73.4 million in the first quarter 2010, compared to $58.1 million in the first quarter 2009 and $68.5 million in the fourth quarter 2009. The efficiency ratio was 64.2 percent in the first quarter 2010, compared to 65.8 percent in the first quarter 2009 and 59.7 percent in the fourth quarter 2009.
Balance Sheet
Total assets increased to $12.8 billion at March 31, 2010, up from $10.4 billion at March 31, 2009, and $12.1 billion at December 31, 2009.
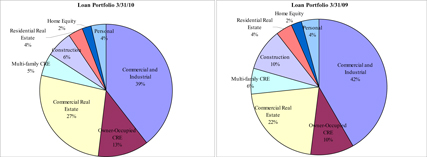
Consistent with the industry, loan growth has slowed due to reduced borrowing demand. Total loans decreased 1.7 percent, with paydowns and payoffs offsetting new originations and utilization of existing lines. Total loans were $8.9 billion at the end of the first quarter 2010, compared to $8.5 billion at the end of the first quarter 2009 and $9.1 billion at year-end 2009. Commercial and industrial loans accounted for 52 percent of total loans, while commercial real estate loans were 32 percent at the end of the first quarter 2010.
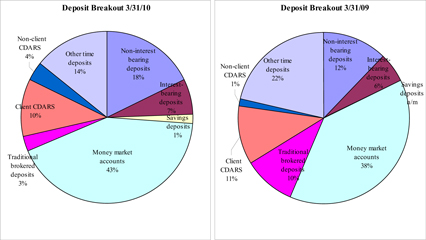
The Company is actively expanding client relationships, as reflected by the 6 percent increase in client deposits in the quarter. Client deposit growth continued to outpace loan growth, leading to stronger liquidity. Total deposits were $10.6 billion at March 31, 2010, compared to $7.8 billion at March 31, 2009, and $9.9 billion at December 31, 2009. Client deposits increased to $9.9 billion at the end of the first quarter 2010, up from $6.9 billion at the end of first quarter 2009 and $9.3 billion at year-end 2009. Client deposits at March 31, 2010, included $1.9 billion in non-interest bearing deposits. Brokered deposits (excluding $1.1 billion in client CDARS® deposits) were 7 percent of total deposits at the end of the first quarter 2010, compared to 11 percent a year ago and 6 percent at the end of the fourth quarter 2009.
Funds borrowed, which include federal funds purchased, FHLB advances, trust preferred securities, borrowings under the Company’s credit facilities, and convertible senior notes, was $740.2 million at March 31, 2010, down from $1.5 billion at March 31, 2009, and $748.0 million at December 31, 2009.
The Company’s investment securities portfolio was $1.8 billion at March 31, 2010, compared to $1.4 billion at March 31, 2009, and $1.6 billion at December 31, 2009. Net unrealized gains were $53.7 million, compared to $54.2 million at the end of the first quarter 2009 and $44.8 million at the end of the fourth quarter 2009. The Company’s securities portfolio is primarily composed of U.S. government agency backed mortgage pools, agency collateralized mortgage obligations, and investment grade municipal bonds.
Federal funds sold and other short-term investments increased to $1.1 billion in the first quarter 2010, up from $83.6 million in the first quarter 2009 and $218.9 million in the fourth quarter 2009, as a result of increased deposit inflows. Strong liquidity results in near-term pressure on interest income until it is deployed into higher earning assets.
Capital
The Company continued to manage within its capital base. As of March 31, 2010, the Company had a total risk-based capital ratio at 14.89 percent and Tier 1 risk-based capital ratio at 12.47 percent, exceeding the minimum well-capitalized thresholds of 10 percent and 6 percent, respectively. The Company’s Tier 1 common capital ratio was 7.85 percent and the tangible common equity ratio was 6.86 percent at the end of the first quarter 2010.
Quarterly Conference Call and Webcast Presentation
Interested parties are invited to listen to our quarterly conference call on Monday, April 26, 2010, at 10 a.m. CDT. The call may be accessed by telephone at (888) 782-9127 (U.S. and Canada) or (706) 634-5643 (International). A live webcast of the call can be accessed on our website atwww.theprivatebank.com by visiting the Investor Relations tab under the About Us section. A rebroadcast of the call will be available beginning approximately two hours after the call until midnight on May 2, 2010, by calling (800) 642-1687 (U.S. and Canada) or (706) 645-9291 (International) and entering passcode #67997323.
About PrivateBancorp, Inc.
PrivateBancorp, Inc., through its subsidiaries, delivers customized business and personal financial services to middle-market companies, as well as business owners, executives, entrepreneurs and families in all of the markets and communities we serve. As of March 31, 2010, the Company had 34 offices in 10 states and $12.8 billion in assets. Our website is www.theprivatebank.com.
Forward-Looking Statements
Statements contained in this news release that are not historical facts may constitute forward-looking statements within the meaning of Section 21E of the Securities Exchange Act of 1934, as amended. The Company’s ability to predict results or the actual effect of future plans or strategies is inherently uncertain. Factors which could cause actual results to differ from those reflected in forward looking statements include, but are not limited to: unforeseen credit quality problems or further deterioration in asset quality that could result in charge-offs greater than the Company has provided for in its allowance for loan and lease losses; continued declines in commercial real estate values in our market areas; unanticipated withdrawals of significant client deposits; the lack of sufficient or cost-effective sources of liquidity or funding; difficulty in raising capital on acceptable terms when necessary or required; an inability to retain key personnel; potential for significant charges if our deferred tax or goodwill assets suffer impairment; unanticipated changes in interest rates or significant
tightening of credit spreads; prolonged negative economic conditions or slower than anticipated economic recovery; legislative or regulatory changes, particularly changes in the regulation of financial services companies and/or the products and services offered by financial services companies and regulation of banks participating in the TARP Capital Purchase Program; adverse developments in the regulatory examination or regulatory enforcement environment; or failures or disruptions to the Company’s data processing or other information systems. These risks and uncertainties should be considered in evaluating forward-looking statements and undue reliance should not be placed on our forward-looking statements. The Company assumes no obligation to update publicly any of these statements in light of future events unless required under the federal securities laws.
Non-GAAP Measures
This press release contains both financial measures based on accounting principles generally accepted in the United States (GAAP) and non-GAAP based financial measures. The Company believes that these non-GAAP financial measures provide information useful to investors in understanding the underlying operational performance of the Company, its business, and performance trends and facilitates comparisons with the performance of others in the banking industry. Where non-GAAP financial measures are used, the comparable GAAP financial measure, as well as the reconcilement to the comparable GAAP financial measure, can be found in this press release. These disclosures should not be viewed as a substitute for operating results determined in accordance with GAAP, nor are they necessarily comparable to non-GAAP performance measures that may be presented by other companies.
Editor’s Note: Financial highlights attached.
Quarterly Consolidated Income Statements Unaudited (Amounts in thousands except per share data) |  |
| 1Q10 | 4Q09 | 3Q09 | 2Q09 | 1Q09 | |||||||||||||||
Interest Income | |||||||||||||||||||
Loans, including fees | $ | 111,062 | $ | 115,140 | $ | 107,749 | $ | 95,997 | $ | 92,944 | |||||||||
Federal funds sold and other short-term investments | 544 | 340 | 323 | 161 | 288 | ||||||||||||||
Securities: | |||||||||||||||||||
Taxable | 15,450 | 15,672 | 14,799 | 13,646 | 14,546 | ||||||||||||||
Exempt from Federal income taxes | 1,718 | 1,672 | 1,797 | 1,786 | 1,852 | ||||||||||||||
Total interest income | 128,774 | 132,824 | 124,668 | 111,590 | 109,630 | ||||||||||||||
Interest Expense | |||||||||||||||||||
Interest-bearing deposits | 966 | 848 | 932 | 467 | 399 | ||||||||||||||
Savings deposits and money market accounts | 9,114 | 9,022 | 8,013 | 6,036 | 6,564 | ||||||||||||||
Brokered and other time deposits | 11,424 | 13,959 | 18,170 | 20,322 | 26,884 | ||||||||||||||
Short-term borrowings | 1,446 | 1,613 | 1,649 | 1,844 | 2,988 | ||||||||||||||
Long-term debt | 7,505 | 7,820 | 8,469 | 8,814 | 8,915 | ||||||||||||||
Total interest expense | 30,455 | 33,262 | 37,233 | 37,483 | 45,750 | ||||||||||||||
Net interest income | 98,319 | 99,562 | 87,435 | 74,107 | 63,880 | ||||||||||||||
Provision for loan and covered asset losses | 72,548 | 70,077 | 90,016 | 21,521 | 17,805 | ||||||||||||||
Net interest income (expense) after provision for loan and covered asset losses | 25,771 | 29,485 | (2,581 | ) | 52,586 | 46,075 | |||||||||||||
Non-interest Income | |||||||||||||||||||
Wealth management | 4,424 | 4,081 | 4,084 | 3,500 | 3,794 | ||||||||||||||
Mortgage banking | 2,121 | 2,243 | 1,826 | 2,686 | 2,175 | ||||||||||||||
Capital markets products | 278 | 2,409 | (322 | ) | 3,830 | 11,233 | |||||||||||||
Treasury management | 3,608 | 3,366 | 3,067 | 2,110 | 1,605 | ||||||||||||||
Bank owned life insurance | 435 | 442 | 444 | 453 | 389 | ||||||||||||||
Other income, service charges, and fees | 4,173 | 1,918 | 4,093 | 2,054 | 3,594 | ||||||||||||||
Net securities gains (losses) | 29 | (149 | ) | (309 | ) | 7,067 | 772 | ||||||||||||
Early extinguishment of debt | — | — | — | (985 | ) | — | |||||||||||||
Total non-interest income | 15,068 | 14,310 | 12,883 | 20,715 | 23,562 | ||||||||||||||
Non-interest Expense | |||||||||||||||||||
Salaries and employee benefits | 39,389 | 31,020 | 23,212 | 34,300 | 35,121 | ||||||||||||||
Net occupancy expense | 7,295 | 7,039 | 7,004 | 6,067 | 6,060 | ||||||||||||||
Technology and related costs | 3,043 | 3,503 | 2,565 | 1,967 | 2,564 | ||||||||||||||
Marketing | 2,102 | 3,568 | 2,500 | 1,933 | 1,842 | ||||||||||||||
Professional fees | 4,203 | 5,562 | 5,759 | 2,492 | 2,514 | ||||||||||||||
Investment manager expenses | 635 | 576 | 581 | 556 | 609 | ||||||||||||||
Net foreclosed property expenses | 1,403 | 1,810 | 2,454 | 967 | 444 | ||||||||||||||
Supplies and printing | 290 | 436 | 295 | 392 | 342 | ||||||||||||||
Postage, telephone, and delivery | 965 | 855 | 803 | 821 | 581 | ||||||||||||||
Insurance | 5,419 | 5,015 | 4,603 | 9,157 | 3,832 | ||||||||||||||
Amortization of intangibles | 415 | 536 | 547 | 325 | 329 | ||||||||||||||
Loan and collection | 2,579 | 4,526 | 1,388 | 1,838 | 1,865 | ||||||||||||||
Other expenses | 5,633 | 4,082 | 5,124 | 3,180 | 1,954 | ||||||||||||||
Total non-interest expense | 73,371 | 68,528 | 56,835 | 63,995 | 58,057 | ||||||||||||||
(Loss) income before income taxes | (32,532 | ) | (24,733 | ) | (46,533 | ) | 9,306 | 11,580 | |||||||||||
Income tax (benefit) provision | (11,676 | ) | (9,556 | ) | (18,789 | ) | 3,372 | 4,409 | |||||||||||
Net (loss) income | (20,856 | ) | (15,177 | ) | (27,744 | ) | 5,934 | 7,171 | |||||||||||
Net income attributable to noncontrolling interests | 70 | 64 | 66 | 57 | 60 | ||||||||||||||
Net (loss) income attributable to controlling interests | (20,926 | ) | (15,241 | ) | (27,810 | ) | 5,877 | 7,111 | |||||||||||
Preferred stock dividends and discount accretion | 3,394 | 3,389 | 3,385 | 3,399 | 2,270 | ||||||||||||||
Net (loss) income available to common stockholders | ($ | 24,320 | ) | ($ | 18,630 | ) | ($ | 31,195 | ) | $ | 2,478 | $ | 4,841 | ||||||
Per Common Share Data | |||||||||||||||||||
Basic | $ | (0.35 | ) | $ | (0.30 | ) | $ | (0.68 | ) | $ | 0.06 | $ | 0.15 | ||||||
Diluted | $ | (0.35 | ) | $ | (0.30 | ) | $ | (0.68 | ) | $ | 0.06 | $ | 0.14 | ||||||
Dividends | $ | 0.01 | $ | 0.01 | $ | 0.01 | $ | 0.01 | $ | 0.01 | |||||||||
Weighted average common shares outstanding | 69,933 | 61,608 | 46,047 | 38,015 | 32,030 | ||||||||||||||
Diluted average common shares outstanding | 69,933 | 61,608 | 46,047 | 39,795 | 34,304 | ||||||||||||||
Note 1:For the first quarter 2010 and the third and fourth quarters 2009 diluted shares are equal to basic shares due to the net loss. The calculation of diluted earnings per share during those periods results in anti-dilution.
Consolidated Balance Sheets (Dollars in thousands) | |
| 03/31/10 | 12/31/09 | 09/30/09 | 06/30/09 | 03/31/09 | ||||||||||||||||
| unaudited | audited | unaudited | unaudited | unaudited | ||||||||||||||||
Assets | ||||||||||||||||||||
Cash and due from banks | $ | 107,618 | $ | 320,160 | $ | 199,703 | $ | 99,088 | $ | 96,712 | ||||||||||
Fed funds sold and other short-term investments | 1,146,814 | 218,935 | 332,188 | 393,953 | 83,626 | |||||||||||||||
Loans held for sale | 16,224 | 28,363 | 19,000 | 23,825 | 11,298 | |||||||||||||||
Securities available-for-sale, at fair value | 1,769,138 | 1,569,541 | 1,648,313 | 1,443,648 | 1,385,244 | |||||||||||||||
Non-marketable equity investments | 29,475 | 29,413 | 30,681 | 28,586 | 28,035 | |||||||||||||||
Loans, excluding covered assets and net of unearned fees | 8,916,854 | 9,073,474 | 9,028,456 | 8,728,926 | 8,483,641 | |||||||||||||||
Allowance for loan losses | (236,851 | ) | (221,688 | ) | (192,791 | ) | (140,088 | ) | (127,011 | ) | ||||||||||
Loans, net of allowance for loan losses and unearned fees | 8,680,003 | 8,851,786 | 8,835,665 | 8,588,838 | 8,356,630 | |||||||||||||||
Covered assets | 468,939 | 502,034 | 530,059 | — | — | |||||||||||||||
Allowance for covered assets losses | (5,176 | ) | (2,764 | ) | — | — | — | |||||||||||||
Covered assets, net of allowance for covered assets | 463,763 | 499,270 | 530,059 | — | — | |||||||||||||||
Other real estate owned | 60,755 | 41,497 | 36,705 | 29,236 | 28,703 | |||||||||||||||
Premises, furniture, and equipment, net | 41,350 | 41,344 | 32,870 | 33,162 | 33,179 | |||||||||||||||
Accrued interest receivable | 34,766 | 35,562 | 35,862 | 30,867 | 30,627 | |||||||||||||||
Investment in bank owned life insurance | 48,101 | 47,666 | 47,225 | 46,780 | 46,327 | |||||||||||||||
Goodwill | 94,658 | 94,671 | 94,683 | 95,045 | 95,045 | |||||||||||||||
Other intangible assets | 18,070 | 18,485 | 19,021 | 5,890 | 6,215 | |||||||||||||||
Derivative assets | 85,152 | 71,540 | 83,784 | 66,921 | 94,214 | |||||||||||||||
Other assets | 202,975 | 191,200 | 136,825 | 103,511 | 79,859 | |||||||||||||||
Total assets | $ | 12,798,862 | $ | 12,059,433 | $ | 12,082,584 | $ | 10,989,350 | $ | 10,375,714 | ||||||||||
Liabilities | ||||||||||||||||||||
Demand deposits: | ||||||||||||||||||||
Non-interest bearing | $ | 1,886,427 | $ | 1,840,900 | $ | 1,565,492 | $ | 1,243,453 | $ | 954,311 | ||||||||||
Interest bearing | 714,700 | 752,728 | 589,298 | 535,374 | 428,529 | |||||||||||||||
Savings deposits and money market accounts | 4,709,796 | 4,080,824 | 4,057,382 | 3,129,384 | 3,021,268 | |||||||||||||||
Brokered deposits | 1,831,306 | 1,566,139 | 1,606,823 | 1,943,065 | 1,740,960 | |||||||||||||||
Other time deposits | 1,498,322 | 1,678,172 | 1,741,783 | 1,426,874 | 1,671,520 | |||||||||||||||
Total deposits | 10,640,551 | 9,918,763 | 9,560,778 | 8,278,150 | 7,816,588 | |||||||||||||||
Short-term borrowings | 241,293 | 214,975 | 690,352 | 892,706 | 834,466 | |||||||||||||||
Long-term debt | 498,874 | 533,023 | 618,173 | 606,793 | 710,793 | |||||||||||||||
Accrued interest payable | 10,357 | 9,673 | 12,051 | 18,809 | 23,775 | |||||||||||||||
Derivative liabilities | 86,873 | 71,958 | 85,097 | 65,844 | 91,911 | |||||||||||||||
Other liabilities | 100,687 | 75,425 | 47,614 | 47,670 | 31,953 | |||||||||||||||
Total liabilities | 11,578,635 | 10,823,817 | 11,014,065 | 9,909,972 | 9,509,486 | |||||||||||||||
Equity | ||||||||||||||||||||
Preferred stock | 237,833 | 237,487 | 237,145 | 236,808 | 294,546 | |||||||||||||||
Common stock | 70,500 | 70,444 | 46,593 | 46,548 | 32,543 | |||||||||||||||
Treasury stock | (18,595 | ) | (18,489 | ) | (18,427 | ) | (18,223 | ) | (17,338 | ) | ||||||||||
Additional paid-in-capital | 944,095 | 940,338 | 767,579 | 761,068 | 495,811 | |||||||||||||||
Retained earnings | (47,112 | ) | (22,093 | ) | (2,748 | ) | 28,896 | 26,875 | ||||||||||||
Accumulated other comprehensive income, net | 33,403 | 27,896 | 38,161 | 24,131 | 33,698 | |||||||||||||||
Total stockholders’ equity | 1,220,124 | 1,235,583 | 1,068,303 | 1,079,228 | 866,135 | |||||||||||||||
Noncontrolling interests | 103 | 33 | 216 | 150 | 93 | |||||||||||||||
Total equity | 1,220,227 | 1,235,616 | 1,068,519 | 1,079,378 | 866,228 | |||||||||||||||
Total liabilities and equity | $ | 12,798,862 | $ | 12,059,433 | $ | 12,082,584 | $ | 10,989,350 | $ | 10,375,714 | ||||||||||
Selected Financial Data Unaudited (Amounts in thousands except per share data) | |
| 1Q10 | 4Q09 | 3Q09 | 2Q09 | 1Q09 | ||||||||||||||||
Selected Statement of Income Data: | ||||||||||||||||||||
Net interest income | $ | 98,319 | $ | 99,562 | $ | 87,435 | $ | 74,107 | $ | 63,880 | ||||||||||
Net revenue(1) (2) | $ | 114,273 | $ | 114,802 | $ | 101,155 | $ | 95,821 | $ | 88,288 | ||||||||||
Operating profit(1) (2) | $ | 40,902 | $ | 46,274 | $ | 44,320 | $ | 31,826 | $ | 30,231 | ||||||||||
(Loss) income before taxes | ($ | 32,532 | ) | ($ | 24,733 | ) | ($ | 46,533 | ) | $ | 9,306 | $ | 11,580 | |||||||
Net (loss) income available to common stockholders | ($ | 24,320 | ) | ($ | 18,630 | ) | ($ | 31,195 | ) | $ | 2,478 | $ | 4,841 | |||||||
Per Common Share Data: | ||||||||||||||||||||
Basic earnings per share | ($ | 0.35 | ) | ($ | 0.30 | ) | ($ | 0.68 | ) | $ | 0.06 | $ | 0.15 | |||||||
Diluted earnings per share (3) | ($ | 0.35 | ) | ($ | 0.30 | ) | ($ | 0.68 | ) | $ | 0.06 | $ | 0.14 | |||||||
Dividends | $ | 0.01 | $ | 0.01 | $ | 0.01 | $ | 0.01 | $ | 0.01 | ||||||||||
Book value (period end)(1) | $ | 13.77 | $ | 13.99 | $ | 17.48 | $ | 17.74 | $ | 16.96 | ||||||||||
Tangible book value (period end)(1) (2) | $ | 12.19 | $ | 12.41 | $ | 15.09 | $ | 15.62 | $ | 13.96 | ||||||||||
Market value (close) | $ | 13.70 | $ | 8.97 | $ | 24.46 | $ | 22.24 | $ | 14.46 | ||||||||||
Book value multiple | 0.99 | x | 0.64 | x | 1.40 | x | 1.25 | x | 0.85 | x | ||||||||||
Share Data: | ||||||||||||||||||||
Weighted average common shares outstanding | 69,933 | 61,608 | 46,047 | 38,015 | 32,030 | |||||||||||||||
Diluted average common shares outstanding(3) | 69,933 | 61,608 | 46,047 | 39,795 | 34,304 | |||||||||||||||
Common shares issued (at period end) | 71,877 | 71,869 | 48,104 | 48,015 | 34,180 | |||||||||||||||
Common shares outstanding (at period end) | 71,333 | 71,332 | 47,574 | 47,493 | 33,702 | |||||||||||||||
Performance Ratios: | ||||||||||||||||||||
Return on average assets | -0.68 | % | -0.50 | % | -0.94 | % | 0.23 | % | 0.29 | % | ||||||||||
Return on average common equity | -9.86 | % | -7.96 | % | -14.51 | % | 1.45 | % | 3.48 | % | ||||||||||
Net interest margin(1) (2) | 3.36 | % | 3.48 | % | 3.09 | % | 2.99 | % | 2.68 | % | ||||||||||
Fee revenue as a percent of total revenue(1) | 13.27 | % | 12.68 | % | 13.11 | % | 16.49 | % | 26.29 | % | ||||||||||
Non-interest income to average assets | 0.49 | % | 0.47 | % | 0.43 | % | 0.80 | % | 0.95 | % | ||||||||||
Non-interest expense to average assets | 2.39 | % | 2.26 | % | 1.91 | % | 2.47 | % | 2.34 | % | ||||||||||
Net overhead ratio(1) | 1.90 | % | 1.79 | % | 1.48 | % | 1.67 | % | 1.39 | % | ||||||||||
Efficiency ratio (1) (2) | 64.21 | % | 59.69 | % | 56.19 | % | 66.79 | % | 65.76 | % | ||||||||||
Selected Financial Condition Data: | ||||||||||||||||||||
Assets under management and administration(1) | $ | 3,983,066 | $ | 3,983,623 | $ | 4,008,268 | $ | 3,171,697 | $ | 3,164,158 | ||||||||||
Balance Sheet Ratios: | ||||||||||||||||||||
Loans to Deposits (period end) | 83.80 | % | 91.48 | % | 94.43 | % | 105.45 | % | 108.53 | % | ||||||||||
Average interest-earning assets to average interest-bearing liabilities | 129.96 | % | 127.44 | % | 122.93 | % | 120.58 | % | 115.10 | % | ||||||||||
Capital Ratios (period end): | ||||||||||||||||||||
Total risk-based | 14.89 | % | 14.65 | % | 13.40 | % | 14.40 | % | 12.63 | % | ||||||||||
Tier 1 risk-based | 12.47 | % | 12.29 | % | 11.01 | % | 11.95 | % | 10.13 | % | ||||||||||
Leverage | 10.57 | % | 11.17 | % | 9.94 | % | 11.67 | % | 9.79 | % | ||||||||||
Tier 1 common capital(1) (2) | 7.85 | % | 7.84 | % | 6.44 | % | 7.15 | % | 4.53 | % | ||||||||||
Tangible common equity to tangible assets(1) (2) | 6.86 | % | 7.41 | % | 6.00 | % | 6.81 | % | 4.58 | % | ||||||||||
Total equity to total assets | 9.53 | % | 10.25 | % | 8.84 | % | 9.82 | % | 8.35 | % | ||||||||||
(1)Refer to Glossary of Terms for definition.
(2)This is a non-GAAP measure, refer to Non-GAAP Measures for a reconciliation to GAAP.
(3)For the first quarter 2010 and the third and fourth quarters 2009, diluted shares are equal to basic shares due to the net loss. The calculation of diluted earnings per share for those periods results in anti-dilution.
Loan Composition (excluding covered assets(1)) Unaudited (Dollars in thousands) | |
| 03/31/10 | 12/31/09 | 09/30/09 | 06/30/09 | 03/31/09 | |||||||||||
Commercial and Industrial | $ | 3,516,884 | $ | 3,820,698 | $ | 3,888,744 | $ | 3,682,155 | $ | 3,531,439 | |||||
Owner-Occupied CRE | 1,126,109 | 835,913 | 765,489 | 899,315 | 872,656 | ||||||||||
Total Commercial Loans | 4,642,993 | 4,656,611 | 4,654,233 | 4,581,470 | 4,404,095 | ||||||||||
Commercial Real Estate | 2,378,294 | 2,293,996 | 2,169,209 | 1,954,692 | 1,825,805 | ||||||||||
Multi-family CRE | 487,901 | 521,001 | 466,098 | 492,896 | 520,455 | ||||||||||
Total CRE Loans | 2,866,195 | 2,814,997 | 2,635,307 | 2,447,588 | 2,346,260 | ||||||||||
Construction | 562,078 | 719,224 | 874,970 | 867,660 | 837,952 | ||||||||||
Residential Real Estate | 316,012 | 319,463 | 316,795 | 319,762 | 332,736 | ||||||||||
Home Equity | 212,421 | 220,025 | 214,630 | 215,087 | 205,872 | ||||||||||
Personal | 317,155 | 343,154 | 332,521 | 297,359 | 356,726 | ||||||||||
Total Loans | $ | 8,916,854 | $ | 9,073,474 | $ | 9,028,456 | $ | 8,728,926 | $ | 8,483,641 | |||||
Commercial Real Estate and Construction Loans Portfolio by Collateral Type
| 03/31/10 | 12/31/09 | |||||||||||
| % of | % of | |||||||||||
| Amount | Total | Amount | Total | |||||||||
Commercial Real Estate Portfolio | ||||||||||||
Land | $ | 352,849 | 12 | % | $ | 400,261 | 14 | % | ||||
Residential 1-4 Family | 199,542 | 7 | % | 192,695 | 7 | % | ||||||
Multi-Family 5+ | 487,901 | 17 | % | 521,001 | 19 | % | ||||||
Industrial/Warehouse | 319,201 | 11 | % | 316,899 | 11 | % | ||||||
Office | 422,341 | 15 | % | 410,131 | 14 | % | ||||||
Retail | 433,687 | 15 | % | 419,115 | 15 | % | ||||||
Health Care | 51,868 | 2 | % | 49,337 | 2 | % | ||||||
Mixed Use/Other | 598,806 | 21 | % | 505,558 | 18 | % | ||||||
Total Commercial Real Estate | $ | 2,866,195 | 100 | % | $ | 2,814,997 | 100 | % | ||||
Construction Portfolio | ||||||||||||
Land | $ | 67,938 | 12 | % | $ | 91,207 | 13 | % | ||||
Residential 1-4 Family | 41,868 | 7 | % | 61,854 | 9 | % | ||||||
Multi-Family 5+ | 54,514 | 10 | % | 131,001 | 18 | % | ||||||
Industrial/Warehouse | 21,871 | 4 | % | 31,461 | 4 | % | ||||||
Office | 89,331 | 16 | % | 112,946 | 16 | % | ||||||
Retail | 105,900 | 19 | % | 127,356 | 18 | % | ||||||
Mixed Use/Other | 180,656 | 32 | % | 163,399 | 22 | % | ||||||
Total Construction | $ | 562,078 | 100 | % | $ | 719,224 | 100 | % | ||||
| (1) | Refer to Glossary of Terms for definition. |
Asset Quality (excluding covered assets(1)) Unaudited (Dollars in thousands) | |
| 1Q10 | 4Q09 | 3Q09 | 2Q09 | 1Q09 | ||||||||||||||||
Credit Quality Key Ratios: | ||||||||||||||||||||
Net charge-offs to average loans | 2.56 | % | 1.80 | % | 1.67 | % | 0.39 | % | 0.17 | % | ||||||||||
Total non-performing loans to total loans | 4.28 | % | 4.36 | % | 3.99 | % | 2.10 | % | 1.92 | % | ||||||||||
Total non-performing assets to total assets | 3.45 | % | 3.62 | % | 3.28 | % | 1.94 | % | 1.85 | % | ||||||||||
Nonaccrual loans to: | ||||||||||||||||||||
total loans | 4.28 | % | 4.36 | % | 3.99 | % | 2.10 | % | 1.92 | % | ||||||||||
total assets | 2.98 | % | 3.28 | % | 2.98 | % | 1.67 | % | 1.57 | % | ||||||||||
Allowance for loan losses to: | ||||||||||||||||||||
total loans | 2.66 | % | 2.44 | % | 2.14 | % | 1.60 | % | 1.50 | % | ||||||||||
non-performing loans | 62 | % | 56 | % | 54 | % | 76 | % | 78 | % | ||||||||||
nonaccrual loans | 62 | % | 56 | % | 54 | % | 76 | % | 78 | % | ||||||||||
Non-performing assets: | ||||||||||||||||||||
Loans past due 90 days and accruing | $ | 0 | $ | 0 | $ | 0 | $ | 0 | $ | 0 | ||||||||||
Nonaccrual loans | 381,207 | 395,447 | 359,918 | 183,526 | 162,896 | |||||||||||||||
OREO | 60,755 | 41,497 | 36,705 | 29,236 | 28,703 | |||||||||||||||
Total non-performing assets | $ | 441,962 | $ | 436,944 | $ | 396,623 | $ | 212,762 | $ | 191,599 | ||||||||||
Restructured loans accruing interest | $ | 3,840 | $ | 0 | $ | 0 | $ | 0 | $ | 0 | ||||||||||
Nonaccrual Loans Stratification
| $5.0 Million or More | $3.0 to $4.9 Million | $1.5 to $2.9 Million | Under $1.5 Million | Total | |||||||||||
As of March 31, 2010 | |||||||||||||||
Amount: | |||||||||||||||
Commercial | $ | 42,076 | $ | 6,778 | $ | 6,861 | $ | 12,794 | $ | 68,509 | |||||
Commercial real estate | 75,998 | 33,812 | 55,979 | 46,969 | 212,758 | ||||||||||
Construction | 11,081 | 14,013 | 18,409 | 15,832 | 59,335 | ||||||||||
Residential real estate | — | 3,265 | 3,941 | 9,570 | 16,776 | ||||||||||
Personal and home equity | — | 9,409 | 4,958 | 9,462 | 23,829 | ||||||||||
Total | $ | 129,155 | $ | 67,277 | $ | 90,148 | $ | 94,627 | $ | 381,207 | |||||
Number of borrowers: | |||||||||||||||
Commercial | 2 | 2 | 3 | 43 | 50 | ||||||||||
Commercial real estate | 9 | 9 | 27 | 82 | 127 | ||||||||||
Construction | 2 | 3 | 8 | 27 | 40 | ||||||||||
Residential real estate | — | 1 | 2 | 19 | 22 | ||||||||||
Personal and home equity | — | 2 | 3 | 35 | 40 | ||||||||||
Total | 13 | 17 | 43 | 206 | 279 | ||||||||||
As of December 31, 2009 | |||||||||||||||
Amount: | |||||||||||||||
Commercial | $ | 46,176 | $ | — | $ | 4,092 | $ | 19,078 | $ | 69,346 | |||||
Commercial real estate | 51,425 | 15,186 | 60,028 | 44,410 | 171,049 | ||||||||||
Construction | 41,772 | 27,690 | 24,590 | 19,770 | 113,822 | ||||||||||
Residential real estate | — | 3,265 | 2,959 | 8,257 | 14,481 | ||||||||||
Personal and home equity | 5,031 | 7,419 | 4,998 | 9,301 | 26,749 | ||||||||||
Total | $ | 144,404 | $ | 53,560 | $ | 96,667 | $ | 100,816 | $ | 395,447 | |||||
Number of borrowers: | |||||||||||||||
Commercial | 3 | — | 2 | 51 | 56 | ||||||||||
Commercial real estate | 6 | 4 | 28 | 88 | 126 | ||||||||||
Construction | 4 | 7 | 11 | 38 | 60 | ||||||||||
Residential real estate | — | 1 | 1 | 23 | 25 | ||||||||||
Personal and home equity | 1 | 2 | 3 | 39 | 45 | ||||||||||
Total | 14 | 14 | 45 | 239 | 312 | ||||||||||
| (1) | Refer to Glossary of Terms for definition. Covered assets are included as a component of total assets in calculations above. |
Loan Portfolio Aging (excluding covered assets(1)) Unaudited (Dollars in thousands) | |
| As of March 31, 2010 | Current | 30-59 Days Past Due | 60-89 Days Past Due | 90 Days Past Due and Accruing | Restructured Loans Accruing Interest | Nonaccrual | Total Loans | |||||||||||||||||||||
Loan balances: |
| |||||||||||||||||||||||||||
Commercial | $ | 4,558,109 | $ | 11,641 | $ | 4,245 | $ | 0 | $ | 489 | $ | 68,509 | $ | 4,642,993 | ||||||||||||||
Commercial real estate | 2,577,892 | 36,740 | 35,454 | — | 3,351 | 212,758 | 2,866,195 | |||||||||||||||||||||
Construction | 493,091 | 3,252 | 6,400 | — | — | 59,335 | 562,078 | |||||||||||||||||||||
Residential real estate | 292,410 | 6,656 | 170 | — | — | 16,776 | 316,012 | |||||||||||||||||||||
Personal and home equity | 501,446 | 2,189 | 2,112 | — | — | 23,829 | 529,576 | |||||||||||||||||||||
Total loans | $ | 8,422,948 | $ | 60,478 | $ | 48,381 | $ | 0 | $ | 3,840 | $ | 381,207 | $ | 8,916,854 | ||||||||||||||
Aging as a percent of loan balance: |
| |||||||||||||||||||||||||||
Commercial | 98.17 | % | 0.25 | % | 0.09 | % | 0.00 | % | 0.01 | % | 1.48 | % | 100.00 | % | ||||||||||||||
Commercial real estate | 89.94 | % | 1.28 | % | 1.24 | % | 0.00 | % | 0.12 | % | 7.42 | % | 100.00 | % | ||||||||||||||
Construction | 87.73 | % | 0.58 | % | 1.14 | % | 0.00 | % | 0.00 | % | 10.56 | % | 100.00 | % | ||||||||||||||
Residential real estate | 92.53 | % | 2.11 | % | 0.05 | % | 0.00 | % | 0.00 | % | 5.31 | % | 100.00 | % | ||||||||||||||
Personal and home equity | 94.69 | % | 0.41 | % | 0.40 | % | 0.00 | % | 0.00 | % | 4.50 | % | 100.00 | % | ||||||||||||||
Total loans | 94.46 | % | 0.68 | % | 0.54 | % | 0.00 | % | 0.04 | % | 4.28 | % | 100.00 | % | ||||||||||||||
| 1Q10 | 4Q09 | 3Q09 | 2Q09 | 1Q09 | ||||||||||||||||||||||||
Nonaccrual loans: |
| |||||||||||||||||||||||||||
Commercial | $ | 68,509 | $ | 69,346 | $ | 72,808 | $ | 25,442 | $ | 19,017 | ||||||||||||||||||
Commercial real estate | 212,758 | 171,049 | 145,438 | 72,621 | 55,238 | |||||||||||||||||||||||
Construction | 59,335 | 113,822 | 118,876 | 64,849 | 66,067 | |||||||||||||||||||||||
Residential real estate | 16,776 | 14,481 | 11,899 | 8,913 | 8,138 | |||||||||||||||||||||||
Personal and home equity | 23,829 | 26,749 | 10,897 | 11,701 | 14,436 | |||||||||||||||||||||||
Total | $ | 381,207 | $ | 395,447 | $ | 359,918 | $ | 183,526 | $ | 162,896 | ||||||||||||||||||
Nonaccrual loans as a percent of total loan type: |
| |||||||||||||||||||||||||||
Commercial | 1.48 | % | 1.49 | % | 1.56 | % | 0.56 | % | 0.43 | % | ||||||||||||||||||
Commercial real estate | 7.42 | % | 6.08 | % | 5.52 | % | 2.97 | % | 2.35 | % | ||||||||||||||||||
Construction | 10.56 | % | 15.83 | % | 13.59 | % | 7.47 | % | 7.88 | % | ||||||||||||||||||
Residential real estate | 5.31 | % | 4.53 | % | 3.76 | % | 2.79 | % | 2.45 | % | ||||||||||||||||||
Personal and home equity | 4.50 | % | 4.75 | % | 1.99 | % | 2.28 | % | 2.57 | % | ||||||||||||||||||
Total | 4.28 | % | 4.36 | % | 3.99 | % | 2.10 | % | 1.92 | % | ||||||||||||||||||
Loans past due 60-89 days and still accruing: |
| |||||||||||||||||||||||||||
Commercial | $ | 4,245 | $ | 9,955 | $ | 1,588 | $ | 228 | $ | 1,355 | ||||||||||||||||||
Commercial real estate | 35,454 | 30,638 | 23,245 | 24,491 | 2,138 | |||||||||||||||||||||||
Construction | 6,400 | 751 | 10,962 | 7,076 | 3,554 | |||||||||||||||||||||||
Residential real estate | 170 | 1,654 | — | 2,888 | — | |||||||||||||||||||||||
Personal and home equity | 2,112 | 8,595 | 3,087 | 4,698 | 471 | |||||||||||||||||||||||
Total | $ | 48,381 | $ | 51,593 | $ | 38,882 | $ | 39,381 | $ | 7,518 | ||||||||||||||||||
Loans past due 60-89 days and still accruing as a percent of total loan type: |
| |||||||||||||||||||||||||||
Commercial | 0.09 | % | 0.21 | % | 0.03 | % | — | 0.03 | % | |||||||||||||||||||
Commercial real estate | 1.24 | % | 1.09 | % | 0.88 | % | 1.00 | % | 0.09 | % | ||||||||||||||||||
Construction | 1.14 | % | 0.10 | % | 1.25 | % | 0.82 | % | 0.42 | % | ||||||||||||||||||
Residential real estate | 0.05 | % | 0.52 | % | — | 0.90 | % | — | ||||||||||||||||||||
Personal and home equity | 0.40 | % | 1.53 | % | 0.56 | % | 0.92 | % | 0.08 | % | ||||||||||||||||||
Total | 0.54 | % | 0.57 | % | 0.43 | % | 0.45 | % | 0.09 | % | ||||||||||||||||||
Loans past due 30-59 days and still accruing: |
| |||||||||||||||||||||||||||
Commercial | $ | 11,641 | $ | 13,427 | $ | 4,424 | $ | 4,022 | $ | 22,598 | ||||||||||||||||||
Commercial real estate | 36,740 | 23,983 | 18,005 | 11,050 | 53,743 | |||||||||||||||||||||||
Construction | 3,252 | 3,391 | 2,541 | 3,936 | 3,642 | |||||||||||||||||||||||
Residential real estate | 6,656 | 4,170 | 1,431 | — | 5,606 | |||||||||||||||||||||||
Personal and home equity | 2,189 | 6,097 | 3,877 | 1,007 | 7,333 | |||||||||||||||||||||||
Total | $ | 60,478 | $ | 51,068 | $ | 30,278 | $ | 20,015 | $ | 92,922 | ||||||||||||||||||
Loans past due 30-59 days and still accruing as a percent of total loan type: |
| |||||||||||||||||||||||||||
Commercial | 0.25 | % | 0.29 | % | 0.10 | % | 0.09 | % | 0.51 | % | ||||||||||||||||||
Commercial real estate | 1.28 | % | 0.85 | % | 0.68 | % | 0.45 | % | 2.29 | % | ||||||||||||||||||
Construction | 0.58 | % | 0.47 | % | 0.29 | % | 0.45 | % | 0.43 | % | ||||||||||||||||||
Residential real estate | 2.11 | % | 1.31 | % | 0.45 | % | — | 1.68 | % | |||||||||||||||||||
Personal and home equity | 0.41 | % | 1.08 | % | 0.71 | % | 0.20 | % | 1.30 | % | ||||||||||||||||||
Total | 0.68 | % | 0.56 | % | 0.34 | % | 0.23 | % | 1.10 | % | ||||||||||||||||||
| (1) | Refer to Glossary of Terms for definition. |
Allowance for Loan Losses (excluding covered assets(1)) Unaudited (Dollars in thousands) | |
| 1Q10 | 4Q09 | 3Q09 | 2Q09 | 1Q09 | ||||||||||||||||
Change in allowance for loan losses: | ||||||||||||||||||||
Balance at beginning of period | $ | 221,688 | $ | 192,791 | $ | 140,088 | $ | 127,011 | $ | 112,672 | ||||||||||
Loans charged off: | ||||||||||||||||||||
Commercial | ($ | 18,129 | ) | ($ | 11,082 | ) | ($ | 13,065 | ) | ($ | 2,220 | ) | ($ | 5,377 | ) | |||||
Commercial real estate | (21,793 | ) | (13,120 | ) | (13,772 | ) | (428 | ) | (246 | ) | ||||||||||
Construction | (10,264 | ) | (14,438 | ) | (6,928 | ) | (1,507 | ) | (598 | ) | ||||||||||
Residential real estate | (1,590 | ) | (970 | ) | (475 | ) | (50 | ) | — | |||||||||||
Home equity | (1,087 | ) | (805 | ) | (100 | ) | (262 | ) | (19 | ) | ||||||||||
Personal | (4,584 | ) | (1,086 | ) | (5,802 | ) | (8,113 | ) | (797 | ) | ||||||||||
Total loans charged off | (57,447 | ) | (41,501 | ) | (40,142 | ) | (12,580 | ) | (7,037 | ) | ||||||||||
Recoveries: | ||||||||||||||||||||
Commercial | $ | 330 | $ | 410 | $ | 1,060 | $ | 1,329 | $ | 1,190 | ||||||||||
Commercial real estate | 53 | 126 | 676 | 462 | 496 | |||||||||||||||
Construction | 134 | 240 | 1,026 | 1,950 | 1,840 | |||||||||||||||
Residential real estate | 6 | 12 | — | 138 | 2 | |||||||||||||||
Home equity | 4 | 52 | 1 | 11 | 10 | |||||||||||||||
Personal | 17 | 34 | 66 | 246 | 33 | |||||||||||||||
Total recoveries: | 544 | 874 | 2,829 | 4,136 | 3,571 | |||||||||||||||
Total net loan charge-offs | (56,903 | ) | (40,627 | ) | (37,313 | ) | (8,444 | ) | (3,466 | ) | ||||||||||
Provision | 72,066 | 69,524 | 90,016 | 21,521 | 17,805 | |||||||||||||||
Balance at end of period | $ | 236,851 | $ | 221,688 | $ | 192,791 | $ | 140,088 | $ | 127,011 | ||||||||||
Allocation of allowance for loan losses: | ||||||||||||||||||||
General allocated reserve: | ||||||||||||||||||||
Commercial | $ | 55,324 | $ | 43,350 | $ | 59,118 | $ | 46,449 | $ | 47,258 | ||||||||||
Commercial real estate | 77,698 | 77,223 | 44,745 | 36,880 | 37,026 | |||||||||||||||
Construction | 18,479 | 23,581 | 41,222 | 34,710 | 30,429 | |||||||||||||||
Residential real estate | 3,658 | 3,635 | 2,009 | 1,468 | 1,443 | |||||||||||||||
Home equity | 2,664 | 2,862 | 1,582 | 1,224 | 1,220 | |||||||||||||||
Personal | 5,909 | 5,277 | 2,084 | 1,810 | 1,540 | |||||||||||||||
Total general allocated | $ | 163,732 | $ | 155,928 | $ | 150,760 | $ | 122,541 | $ | 118,916 | ||||||||||
Specific reserve | 73,119 | 65,760 | 42,031 | 16,847 | 7,460 | |||||||||||||||
Unallocated reserve | — | — | — | 700 | 635 | |||||||||||||||
Total | $ | 236,851 | $ | 221,688 | $ | 192,791 | $ | 140,088 | $ | 127,011 | ||||||||||
Allocation of reserve by a percent of total allowance for loan losses: | ||||||||||||||||||||
General allocated reserve: | ||||||||||||||||||||
Commercial | 23 | % | 20 | % | 31 | % | 33 | % | 37 | % | ||||||||||
Commercial real estate | 33 | % | 35 | % | 23 | % | 26 | % | 29 | % | ||||||||||
Construction | 8 | % | 10 | % | 21 | % | 25 | % | 24 | % | ||||||||||
Residential real estate | 2 | % | 2 | % | 1 | % | 1 | % | 1 | % | ||||||||||
Home equity | 1 | % | 1 | % | 1 | % | 1 | % | 1 | % | ||||||||||
Personal | 2 | % | 2 | % | 1 | % | 1 | % | 1 | % | ||||||||||
Total general allocated | 69 | % | 70 | % | 78 | % | 87 | % | 93 | % | ||||||||||
Specific reserve | 31 | % | 30 | % | 22 | % | 13 | % | 6 | % | ||||||||||
Unallocated reserve | — | — | — | — | 1 | % | ||||||||||||||
Total | 100 | % | 100 | % | 100 | % | 100 | % | 100 | % | ||||||||||
Allowance for loan losses to: | ||||||||||||||||||||
total loans | 2.66 | % | 2.44 | % | 2.14 | % | 1.60 | % | 1.50 | % | ||||||||||
non-performing loans | 62 | % | 56 | % | 54 | % | 76 | % | 78 | % | ||||||||||
nonaccrual loans | 62 | % | 56 | % | 54 | % | 76 | % | 78 | % | ||||||||||
(1) Refer to Glossary of Terms for definition.
Deposits Unaudited (Dollars in thousands) | |
| 03/31/10 | 12/31/09 | 09/30/09 | 06/30/09 | 03/31/09 | |||||||||||
Non-interest bearing deposits | $ | 1,886,427 | $ | 1,840,900 | $ | 1,565,492 | $ | 1,243,453 | $ | 954,311 | |||||
Interest-bearing deposits | 714,700 | 752,728 | 589,298 | 535,374 | 428,529 | ||||||||||
Savings deposits | 163,613 | 141,614 | 135,937 | 19,852 | 16,745 | ||||||||||
Money market accounts | 4,546,183 | 3,939,210 | 3,921,445 | 3,109,532 | 3,004,523 | ||||||||||
Brokered deposits: | |||||||||||||||
Traditional brokered deposits | 294,346 | 389,590 | 453,759 | 708,802 | 768,488 | ||||||||||
Client CDARS | 1,129,471 | 979,728 | 981,677 | 1,047,082 | 865,656 | ||||||||||
Non-client CDARS | 407,489 | 196,821 | 171,387 | 187,181 | 106,816 | ||||||||||
Total brokered deposits | 1,831,306 | 1,566,139 | 1,606,823 | 1,943,065 | 1,740,960 | ||||||||||
Other time deposits | 1,498,322 | 1,678,172 | 1,741,783 | 1,426,874 | 1,671,520 | ||||||||||
Total deposits | $ | 10,640,551 | $ | 9,918,763 | $ | 9,560,778 | $ | 8,278,150 | $ | 7,816,588 | |||||
Client deposits (1) | $ | 9,938,716 | $ | 9,332,352 | $ | 8,935,632 | $ | 7,382,167 | $ | 6,941,284 | |||||
| (1) | Refer to Glossary of Terms for definition. |
n/m Not meaningful
Net Interest Margin Unaudited (Dollars in thousands) | |
| Three Months Ended March 31, | ||||||||||||||||||||
| 2010 | 2009 | |||||||||||||||||||
| Average Balance | Interest | Rate | Average Balance | Interest | Rate | |||||||||||||||
Assets: | ||||||||||||||||||||
Fed funds sold and other short-term investments | $ | 757,463 | $ | 544 | 0.29 | % | $ | 94,525 | $ | 288 | 1.24 | % | ||||||||
Securities: | ||||||||||||||||||||
Taxable | 1,456,165 | 15,450 | 4.24 | % | 1,230,728 | 14,546 | 4.73 | % | ||||||||||||
Tax exempt | 161,507 | 2,604 | 6.45 | % | 166,966 | 2,698 | 6.46 | % | ||||||||||||
Total securities | 1,617,672 | 18,054 | 4.46 | % | 1,397,694 | 17,244 | 4.94 | % | ||||||||||||
Loans: | ||||||||||||||||||||
Commercial, construction & CRE | 8,183,112 | 89,258 | 4.40 | % | 7,366,742 | 83,242 | 4.56 | % | ||||||||||||
Residential | 334,000 | 4,250 | 5.09 | % | 348,008 | 4,958 | 5.70 | % | ||||||||||||
Personal | 515,725 | 4,822 | 3.79 | % | 499,042 | 4,744 | 3.86 | % | ||||||||||||
Total loans(1) | 9,032,837 | 98,330 | 4.39 | % | 8,213,792 | 92,944 | 4.56 | % | ||||||||||||
Covered assets | 481,566 | 12,732 | 10.60 | % | — | — | — | |||||||||||||
Total earning assets | $ | 11,889,538 | $ | 129,660 | 4.39 | % | $ | 9,706,011 | $ | 110,476 | 4.58 | % | ||||||||
Cash and due from banks | 181,539 | 89,462 | ||||||||||||||||||
Allowance for loan losses and covered assets | (241,814 | ) | (114,414 | ) | ||||||||||||||||
Other assets | 614,154 | 390,347 | ||||||||||||||||||
Total assets | $ | 12,443,417 | $ | 10,071,406 | ||||||||||||||||
Liabilities and Equity: | ||||||||||||||||||||
Interest-bearing demand deposits | $ | 720,381 | $ | 966 | 0.54 | % | $ | 328,713 | $ | 399 | 0.49 | % | ||||||||
Savings deposits | 150,357 | 286 | 0.77 | % | 15,959 | 25 | 0.63 | % | ||||||||||||
Money market accounts | 4,228,146 | 8,828 | 0.85 | % | 2,954,309 | 6,539 | 0.90 | % | ||||||||||||
Time deposits | 1,645,788 | 6,221 | 1.53 | % | 1,604,369 | 10,549 | 2.67 | % | ||||||||||||
Brokered deposits | 1,637,891 | 5,203 | 1.29 | % | 2,120,080 | 16,335 | 3.12 | % | ||||||||||||
Total interest-bearing deposits | 8,382,563 | 21,504 | 1.04 | % | 7,023,430 | 33,847 | 1.95 | % | ||||||||||||
Short term borrowings | 240,926 | 1,446 | 2.40 | % | 792,174 | 2,988 | 1.51 | % | ||||||||||||
Long term debt | 525,342 | 7,505 | 5.71 | % | 617,408 | 8,915 | 5.78 | % | ||||||||||||
Total interest-bearing liabilities | 9,148,831 | 30,455 | 1.34 | % | 8,433,012 | 45,750 | 2.19 | % | ||||||||||||
Non-interest bearing demand deposits | 1,902,720 | 771,578 | ||||||||||||||||||
Other liabilities | 153,550 | 79,892 | ||||||||||||||||||
Equity | 1,238,316 | 786,924 | ||||||||||||||||||
Total liabilities and equity | $ | 12,443,417 | $ | 10,071,406 | ||||||||||||||||
Net interest spread(2) | 3.05 | % | 2.39 | % | ||||||||||||||||
Effect of non interest-bearing funds | 0.31 | % | 0.29 | % | ||||||||||||||||
Net interest income/margin(2) (3) | $ | 99,205 | 3.36 | % | $ | 64,726 | 2.68 | % | ||||||||||||
(1) Non-accrual loans are included in the average balances and the average annualized interest foregone on these loans was approximately $18.4 million for the quarter ended March 31, 2010 compared to approximately $6.6 million in the prior year quarter.
(2) Refer to Glossary of Terms for definition.
(3) This is a non-GAAP measure, refer to Non-GAAP Measures for a reconciliation to GAAP.
Non-GAAP Measures Unaudited | |
This press release contains both financial measures based on accounting principles generally accepted in the United States (GAAP) and non-GAAP based financial measures. These non-GAAP measures include net interest income, net interest margin, net revenue, operating profit and efficiency ratio all on a fully taxable-equivalent basis; tier 1 common capital, tangible book value and tangible common equity to tangible assets ratio. We believe that presenting these non-GAAP financial measures will provide information useful to investors in understanding the underlying operational performance of the company, its business, and performance trends and facilitates comparisons with the performance of others in the banking industry.
We use net interest income on a taxable-equivalent basis in calculating various performance measures by increasing the interest income earned on tax-exempt assets to make it fully equivalent to interest income earned on taxable investments assuming a 35% tax rate. Management believes this measure to be the preferred industry measurement of net interest income as it enhances comparability to net interest income arising from taxable and tax-exempt sources, and accordingly believes that providing this measure may be useful for peer comparison purposes.
We also consider various measures when evaluating capital utilization and adequacy, including tier 1 common capital, tangible book value and tangible common equity ratio, in addition to capital ratios defined by banking regulators. These calculations are intended to complement the capital ratios defined by banking regulators for both absolute and comparative purposes. Certain of these measures exclude the ending balances of goodwill and other intangibles and/or preferred capital components. Because GAAP does not include capital ratio measures, we believe there are no comparable GAAP financial measures to these ratios. We believe these non-GAAP measures are relevant because they reflect the level of capital available to withstand unexpected market conditions. Additionally, presentation of these measures allows readers to compare certain aspects of our capitalization to other companies. However, because there are no standardized definitions for these ratios, our calculations may not be comparable with other companies, and the usefulness of these measures to investors may be limited.
Non-GAAP financial measures have inherent limitations, are not required to be uniformly applied, and are not audited. Although these non-GAAP financial measures are frequently used by stakeholders in the evaluation of a company, they have limitations as analytical tools, and should not be considered in isolation or as a substitute for analyses of results as reported under GAAP. As a result, we encourage readers to consider our Consolidated Financial Statements in their entirety and not to rely on any single financial measure. The following table reconciles Non-GAAP financial measures to GAAP:
| Quarters Ending | ||||||||||||||||||||
| (Amounts in thousands except per share data) | 1Q10 | 4Q09 | 3Q09 | 2Q09 | 1Q09 | |||||||||||||||
Taxable-equivalent interest income | ||||||||||||||||||||
GAAP net interest income | $ | 98,319 | $ | 99,562 | $ | 87,435 | $ | 74,107 | $ | 63,880 | ||||||||||
Taxable-equivalent adjustment | 886 | 930 | 837 | 999 | 846 | |||||||||||||||
Taxable-equivalent net interest income(a) | $ | 99,205 | $ | 100,492 | $ | 88,272 | $ | 75,106 | $ | 64,726 | ||||||||||
Average Earning Assets(b) | $ | 11,889,538 | $ | 11,410,866 | $ | 11,298,102 | $ | 10,016,476 | $ | 9,706,011 | ||||||||||
Net Interest Margin(a) / (b) | 3.36 | % | 3.48 | % | 3.09 | % | 2.99 | % | 2.68 | % | ||||||||||
Net Revenue | ||||||||||||||||||||
Taxable-equivalent net interest income(a) | $ | 99,205 | $ | 100,492 | $ | 88,272 | $ | 75,106 | $ | 64,726 | ||||||||||
GAAP non-interest income | 15,068 | 14,310 | 12,883 | 20,715 | 23,562 | |||||||||||||||
Net revenue | $ | 114,273 | $ | 114,802 | $ | 101,155 | $ | 95,821 | $ | 88,288 | ||||||||||
Operating Profit | ||||||||||||||||||||
Taxable-equivalent net interest income(a) | $ | 99,205 | $ | 100,492 | $ | 88,272 | $ | 75,106 | $ | 64,726 | ||||||||||
GAAP non-interest income | 15,068 | 14,310 | 12,883 | 20,715 | 23,562 | |||||||||||||||
Less: GAAP non-interest expense | 73,371 | 68,528 | 56,835 | 63,995 | 58,057 | |||||||||||||||
Operating profit | $ | 40,902 | $ | 46,274 | $ | 44,320 | $ | 31,826 | $ | 30,231 | ||||||||||
Efficiency Ratio | ||||||||||||||||||||
GAAP non-interest expense(c ) | $ | 73,371 | $ | 68,528 | $ | 56,835 | $ | 63,995 | $ | 58,057 | ||||||||||
Taxable-equivalent net interest income(a) | $ | 99,205 | $ | 100,492 | $ | 88,272 | $ | 75,106 | $ | 64,726 | ||||||||||
GAAP non-interest income | 15,068 | 14,310 | 12,883 | 20,715 | 23,562 | |||||||||||||||
Net revenue(d) | $ | 114,273 | $ | 114,802 | $ | 101,155 | $ | 95,821 | $ | 88,288 | ||||||||||
Efficiency ratio(c ) /(d) | 64.21 | % | 59.69 | % | 56.19 | % | 66.79 | % | 65.76 | % | ||||||||||
Tier 1 Common Capital | ||||||||||||||||||||
Tier 1 risk-based capital | $ | 1,301,622 | $ | 1,331,738 | $ | 1,161,447 | $ | 1,199,105 | $ | 976,063 | ||||||||||
Less: preferred stock | 237,833 | 237,487 | 237,145 | 236,808 | 294,546 | |||||||||||||||
Less: trust preferred capital securities | 244,793 | 244,793 | 244,793 | 244,793 | 244,793 | |||||||||||||||
Less: noncontrolling interests | 103 | 33 | 216 | 150 | 93 | |||||||||||||||
Tier 1 common capital(e) | $ | 818,893 | 849,425 | 679,293 | 717,354 | 436,631 | ||||||||||||||
Tangible Common Equity | ||||||||||||||||||||
GAAP total equity | $ | 1,220,227 | $ | 1,235,616 | $ | 1,068,519 | $ | 1,079,378 | $ | 866,228 | ||||||||||
Less: goodwill | 94,658 | 94,671 | 94,683 | 95,045 | 95,045 | |||||||||||||||
Less: other intangibles | 18,070 | 18,485 | 19,021 | 5,890 | 6,215 | |||||||||||||||
Less: preferred stock | 237,833 | 237,487 | 237,145 | 236,808 | 294,546 | |||||||||||||||
Tangible common equity(f) | $ | 869,666 | $ | 884,973 | $ | 717,670 | $ | 741,635 | $ | 470,422 | ||||||||||
Tangible Assets | ||||||||||||||||||||
GAAP total assets | $ | 12,798,862 | $ | 12,059,433 | $ | 12,082,584 | $ | 10,989,350 | $ | 10,375,714 | ||||||||||
Less: goodwill | 94,658 | 94,671 | 94,683 | 95,045 | 95,045 | |||||||||||||||
Less: other intangibles | 18,070 | 18,485 | 19,021 | 5,890 | 6,215 | |||||||||||||||
Tangible assets(g) | $ | 12,686,134 | $ | 11,946,277 | $ | 11,968,880 | $ | 10,888,415 | $ | 10,274,454 | ||||||||||
Period-end Shares Outstanding(h) | 71,333 | 71,332 | 47,574 | 47,493 | 33,702 | |||||||||||||||
Risk-weighted Assets(i) | $ | 10,436,330 | $ | 10,839,705 | $ | 10,553,773 | $ | 10,033,055 | $ | 9,631,361 | ||||||||||
Ratios: | ||||||||||||||||||||
Tier 1 common capital(e) / (i) | 7.85 | % | 7.84 | % | 6.44 | % | 7.15 | % | 4.53 | % | ||||||||||
Tangible book value(f) / (h) | $ | 12.19 | $ | 12.41 | $ | 15.09 | $ | 15.62 | $ | 13.96 | ||||||||||
Tangible common equity to tangible assets(f) / (g) | 6.86 | % | 7.41 | % | 6.00 | % | 6.81 | % | 4.58 | % | ||||||||||
Glossary of Terms
Assets under management and administration (“AUMA”) - Assets held in trust where we serve as trustee or in accounts where we make investment decisions on behalf of clients. AUMA also includes non-managed assets we hold in custody for clients or for which we receive fees for advisory or brokerage services. We do not include these assets on our Consolidated Balance Sheets.
Book value - Total common equity divided by outstanding shares of common stock at end of period.
CDARS® deposit program - is a deposit services arrangement that effectively achieves FDIC deposit insurance for jumbo deposit relationships. These deposits are classified as brokered deposits for regulatory deposit purposes; however, we classify these deposits as client CDARS® due to the source being our existing and new client relationships and are, therefore, not traditional ‘brokered’ deposits. We also participate in a non-client CDARS® program that is more like a traditional brokered deposit program in that our relationship is with the underlying depositor.
Client deposits - Total deposits less brokered deposits plus client CDARSTM
Common equity - Total equity less preferred stock.
Covered assets - Assets acquired through an FDIC-assisted transaction that are subject to a loss share agreement and are presented separately on the Consolidated Balance Sheets.
Efficiency ratio - Total non-interest expense divided by the sum of net interest income on a tax equivalent basis and non-interest income. This is a non-GAAP financial measure.
Fee revenue as percent of total revenue ratio - Total non-interest income less acquisition related gains, net securities gains (losses), and early extinguishment of debt divided by the sum of net interest income and non-interest income less acquisition related gains, net securities gains (losses) and early extinguishment of debt.
GAAP - Accounting principles generally accepted in the United States of America.
Net interest margin - Expressed as a percentage, net interest margin is a ratio computed as annualized taxable-equivalent net interest income divided by average earning assets. This is a non-GAAP financial measure.
Net interest spread - The difference between the average yield earned on interest-earning assets on a taxable-equivalent basis and the average rate paid for interest-bearing liabilities.
Net overhead ratio - Total non-interest expense less non-interest income divided by average total assets.
Net revenue - The sum of taxable equivalent net interest income and non-interest income. This is a non-GAAP financial measure.
Non-GAAP - Certain financial measures within this document that are not formally defined by GAAP or codified in the federal banking regulations. A reconciliation of these non-GAAP measures may be found at the end of this document.
Operating profit - The sum of taxable equivalent net interest income and non-interest income, less non-interest expense. This is a non-GAAP financial measure.
Risk-weighted assets - Computed by the assignment of specific risk-weights (as defined by the Board of Governors of the Federal Reserve System) to assets and off-balance sheet instruments.
Tangible book value - Total common equity less goodwill and other intangibles divided by outstanding shares of common stock at end of period. This is a non-GAAP financial measure.
Tangible common equity to tangible assets ratio - Tangible common equity divided by tangible assets, where tangible common equity equals total equity less preferred stock, goodwill and other intangible assets and tangible assets equals total assets less goodwill and other intangible assets. This is a non-GAAP financial measure.
Taxable-equivalent interest income - The interest income earned on certain assets is completely or partially exempt from Federal income tax. As such, these tax-exempt instruments typically yield lower returns than taxable investments. To provide more meaningful comparisons of yields and margins for all interest-earning assets, we use interest income on a taxable-equivalent basis in calculating average yields and net interest margins by increasing the interest income earned on tax-exempt assets to make it fully equivalent to interest income earned on other taxable investments. This adjustment is not permitted under GAAP on the Consolidated Income Statement.
Tier 1 common capital - - Tier 1 risk-based capital, less preferred equity, less trust preferred capital securities, and less noncontrolling interests.
Tier 1 common capital ratio - Tier 1 common capital divided by period-end risk-weighted assets.
Tier 1 risk-based capital - Total equity, plus trust preferred capital securities, plus certain noncontrolling interests that are held by others; less goodwill and certain other intangible assets, less equity investments in nonfinancial companies, less ineligible servicing assets, less disallowed deferred tax assets and less net unrealized holding losses on available for sale equity securities. Net unrealized holding gains on available-for-sale equity securities, net unrealized holding gains (losses) on available for sale debt securities and net unrealized holding gains (losses) on cash flow hedge derivatives are excluded from total equity for Tier 1 capital purposes.
Tier 1 risk-based capital ratio - Tier 1 risk-based capital divided by period-end risk-weighted assets.
Leverage ratio - Tier 1 risk-based capital divided by adjusted average total assets.
Total risk-based capital - Tier 1 risk-based capital plus qualifying subordinated debt and trust preferred capital securities, other noncontrolling interest not qualified as Tier 1, eligible gains on available-for-sale equity securities and the allowance for loan and lease losses, subject to certain limitations.
Total risk-based capital ratio - Total risk-based capital divided by period-end risk-weighted assets.