Washington, D.C. 20549
Kevin J. McCarthy
Form N-CSR is to be used by management investment companies to file reports with the Commission not later than 10 days after the transmission to stockholders of any report that is required to be transmitted to stockholders under Rule 30e-1 under the Investment Company Act of 1940 (17 CFR 270.30e-1). The Commission may use the information provided on Form N-CSR in its regulatory, disclosure review, inspection, and policymaking roles.
A registrant is required to disclose the information specified by Form N-CSR, and the Commission will make this information public. A registrant is not required to respond to the collection of information contained in Form N-CSR unless the Form displays a currently valid Office of Management and Budget (“OMB”) control number. Please direct comments concerning the accuracy of the information collection burden estimate and any suggestions for reducing the burden to Secretary, Securities and Exchange Commission, 450 Fifth Street, NW, Washington, DC 20549-0609. The OMB has reviewed this collection of information under the clearance requirements of 44 U.S.C. ss. 3507.
ITEM 1. REPORTS TO STOCKHOLDERS.
LIFE IS COMPLEX.
Nuveen makes things e-simple.
It only takes a minute to sign up for e-Reports. Once enrolled, you’ll receive an e-mail as soon as your Nuveen Fund information is ready. No more waiting for delivery by regular mail. Just click on the link within the e-mail to see the report and save it on your computer if you wish.
Free e-Reports right to your e-mail!
www.investordelivery.com
If you receive your Nuveen Fund distributions and statements from your financial advisor or brokerage account.
OR
www.nuveen.com/accountaccess
If you receive your Nuveen Fund distributions and statements directly from Nuveen.
Table of Contents
| Chairman’s Letter to Shareholders | 4 |
| | |
| Portfolio Manager’s Comments | 5 |
| | |
| Dividend and Share Price Information | 11 |
| | |
| Performance Overview | 12 |
| | |
| Report of Independent Registered Public Accounting Firm | 13 |
| | |
| Portfolio of Investments | 14 |
| | |
| Statement of Assets and Liabilities | 23 |
| | |
| Statement of Operations | 24 |
| | |
| Statement of Changes in Net Assets | 25 |
| | |
| Financial Highlights | 26 |
| | |
| Notes to Financial Statements | 28 |
| | |
| Board Member & Officers | 34 |
| | |
| Reinvest Automatically, Easily and Conveniently | 39 |
| | |
| Glossary of Terms Used in this Report | 41 |
| | |
| Additional Fund Information | 43 |
Chairman’s
Letter to Shareholders
Dear Shareholders,
In recent months the positive atmosphere in financial markets has reflected efforts by central banks in the U.S. and Europe to provide liquidity to the financial system and keep interest rates low. At the same time, future economic growth in these countries still faces serious headwinds in the form of high energy prices, uncertainties about potential political leadership changes and increasing pressure to reduce government spending regardless of its impact on the economy. Together with the continuing political tensions in the Middle East, investors have many reasons to remain cautious.
Though progress has been painfully slow, officials in Europe have taken important steps to address critical issues. The European Central Bank has provided vital liquidity to the banking system. Similarly, officials in the Euro area finally agreed to an enhanced “firewall” of funding to deal with financial crises in member countries. These steps, in addition to the completion of another round of financing for Greece, have eased credit conditions across the continent. Several very significant challenges remain with the potential to derail the recent progress but European leaders have demonstrated political will and persistence in dealing with their problems.
In the U.S., strong corporate earnings and continued progress on job creation have contributed to a rebound in the equity market and many of the major stock market indexes are approaching their levels before the financial crisis. The Fed’s commitment to an extended period of low interest rates is promoting economic growth, which remains moderate but steady and raises concerns about the future course of long term rates once the program ends. Pre-election maneuvering has added to the highly partisan atmosphere in the Congress. The end of the Bush-era tax cuts and implementation of the spending restrictions of the Budget Control Act of 2011, both scheduled to take place at year-end, loom closer with little progress being made to deal with them.
During the last year, investors have experienced a sharp decline and a strong recovery in the equity markets. Experienced investment teams keep their eye on a longer time horizon and use their practiced investment disciplines to negotiate through market peaks and valleys to achieve long term goals for investors. Monitoring this process is an important consideration for the Fund Board as it oversees your Nuveen funds on your behalf.
As always, I encourage you to contact your financial consultant if you have any questions about your investment in a Nuveen Fund. On behalf of the other members of your Fund Board, we look forward to continuing to earn your trust in the months and years ahead.
Sincerely,
Robert P. Bremner
Chairman of the Board
May 18, 2012
Portfolio Manager’s Comments
Nuveen Select Maturities Municipal Fund (NIM)
Portfolio manager Paul Brennan reviews U.S. economic and municipal market conditions, key investment strategies and the twelve-month performance of the Nuveen Select Maturities Municipal Fund. With 21 years of investment experience, including 15 years with Nuveen, Paul has managed NIM since 2006.
What factors affected the U.S. economy and municipal market during the twelve-month reporting period ended March 31, 2012?
During this period, the U.S. economy’s progress toward recovery from recession remained moderate. The Federal Reserve (Fed) maintained its efforts to improve the overall economic environment by continuing to hold the benchmark fed funds rate at the record low level of zero to 0.25% that it had established in December 2008. At its April 2012 meeting (after the end of this reporting period), the central bank affirmed its opinion that economic conditions would likely warrant keeping this rate at “exceptionally low levels” at least through late 2014. The Fed also stated that it would continue its program to extend the average maturity of its holdings of U.S. Treasury securities by purchasing $400 billion of these securities with maturities of six to thirty years and selling an equal amount of U.S. Treasury securities with maturities of three years or less. The goals of this program, which the Fed expects to complete by the end of June 2012, are to lower longer-term interest rates, support a stronger economic recovery and help ensure that inflation remains at levels consistent with the Fed’s mandates of maximum employment and price stability.
In the first quarter of 2012, the U.S. economy, as measured by the U.S. gross domestic product (GDP), grew at an annualized rate of 2.2%, marking eleven consecutive quarters of positive growth. The Consumer Price Index (CPI) rose 2.7% year-over-year as of March 2012, while the core CPI (which excludes food and energy) increased 2.3% during the same period, edging above the Fed’s unofficial objective of 2.0% or lower for this inflation measure. Labor market conditions have shown some signs of improvement, as national unemployment stood at 8.2% in March 2012, the lowest level since January 2009, down from 8.9% in March 2011. The housing market continued to be the major weak spot in the economy, beleaguered by a high level of distressed properties and difficult credit conditions. For the twelve months ended February 2012 (most recent data available at the time this report was prepared), the average home price in the Standard & Poor’s (S&P)/Case-Shiller Index of 20 major metropolitan areas lost 3.5%, as housing prices hit their lowest levels since October 2002, down approximately 35% from their 2006 peak. In addition, the U.S. economic picture continued to be clouded by concerns about the European debt crisis and efforts to reduce the federal deficit.
Certain statements in this report are forward-looking statements. Discussions of specific investments are for illustration only and are not intended as recommendations of individual investments. The forward-looking statements and other views expressed herein are those of the portfolio manager as of the date of this report. Actual future results or occurrences may differ significantly from those anticipated in any forward-looking statements, and the views expressed herein are subject to change at any time, due to numerous market and other factors. The Fund disclaims any obligation to update publicly or revise any forward-looking statements or views expressed herein.
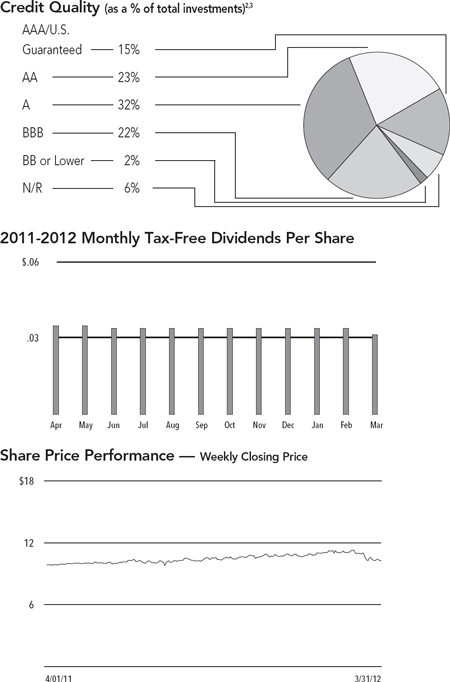
Ratings shown are the highest rating given by one of the following national rating agencies: Standard & Poor’s Group, Moody’s Investors Service, Inc. or Fitch, Inc. Credit ratings are subject to change. AAA, AA, A and BBB are investment grade ratings; BB, B, CCC, CC, C and D are below-investment grade ratings. Certain bonds backed by U.S. Government or agency securities are regarded as having an implied rating equal to the rating of such securities. Holdings designated N/R are not rated by a national rating agency.
Municipal bond prices generally rallied over this period, amid strong demand and competitive yields that continued to be relatively low. Although the availability of tax-exempt supply improved in recent months, the pattern of new issuance remained light compared with long-term historical trends. This served as a key driver of performance, as tight supply and strong demand combined to create favorable market conditions for municipal bonds. Concurrent with rising prices, yields declined across most maturities, especially at the longer end of the municipal yield curve. The depressed level of municipal bond issuance was due in part to the continuing impact of the taxable Build America Bonds (BAB) program. Even though the BAB program expired at the end of 2010, issuers had made extensive use of its favorable terms to issue almost $190 billion in taxable BAB bonds during 2009 and 2010, representing approximately 25% of all municipal issuance during that period. Some borrowers accelerated issuance into 2010 in order to take advantage of the program before its termination, fulfilling their capital program borrowing needs well into 2011 and 2012. This reduced the need for many borrowers to come to market with new issues during this period. The low level of municipal issuance during this period also reflected the current political distaste for additional borrowing by state and local governments and the prevalent atmosphere of municipal budget austerity.
Over the twelve months ended March 31, 2012, municipal bond issuance nationwide totaled $326.3 billion, a decrease of 14% compared with issuance during the twelvemonth period ended March 31, 2011. During this period, demand for municipal bonds remained very strong, especially from individual investors.
What key strategies were used to manage NIM during this reporting period?
As previously discussed, municipal bond prices generally rallied during this period and yields remained relatively low. In this environment, we continued to take a bottom-up approach to discovering sectors that appeared undervalued as well as individual credits that had the potential to perform well over the long term and helped us keep NIM fully invested.
During this period, NIM found value in several areas of the primary and secondary markets, including tax-supported bonds such as general obligation (GO) and appropriations credits, transportation bonds (specifically Lambert-St. Louis International Airport), as well as new tobacco issues from Illinois and Minnesota. These latest
tobacco bonds are part of a new generation of tobacco borrowing with conservative structures that limit final maturities, ensure bondholders are paid even if cigarette consumption dips far more annually than expected and higher credit ratings that have been well received by the marketplace. In general, we continued to focus on purchasing fundamentally solid credits consistent with maintaining NIM’s duration and maturity.
Cash for new purchases during this period was generated primarily by the proceeds from called and maturing bonds. A sizeable number of bond calls and refundings provided a good source of liquidity, which drove much of our activity as we worked to redeploy the proceeds to keep NIM fully invested. Among the bonds called from NIM’s portfolio were a number of pre-refunded holdings, bonds with very short maturities or short call dates, as well as a large position in an AAA-rated nursing home credit. This resulted in a substantial drop in our allocation to the AAA quality sector, as it was difficult to source appropriate AAA replacement paper in the current market. These proceeds were redeployed largely to the AA sector. On the whole, selling was minimal during this period, as the bonds in our portfolio generally offered higher yields than those available in the current marketplace.
How did the Fund perform during the twelve-month period ended March 31, 2012?
Results for NIM, as well as relevant index information, are presented in the accompanying table.
Average Annual Total Returns on Net Asset Value
For periods ended 3/31/12
| | | 1-Year | | 5-Year | | 10-Year |
| NIM | | | 8.49% | | | 4.81% | | | 4.54% |
| | | | | | | | | | | |
| Standard & Poor’s (S&P) Intermediate Municipal Bond Index* | | | 9.71% | | | 5.85% | | | 5.52% |
| Standard & Poor’s (S&P) National Municipal Bond Index* | | | 12.56% | | | 5.11% | | | 5.49% |
For the twelve months ended March 31, 2012, the total return on net asset value (NAV) for NIM trailed the returns for both the Standard & Poor’s (S&P) Intermediate Municipal Bond Index and the Standard & Poor’s (S&P) National Municipal Bond Index. Key management factors that influenced the Fund’s performance during this period included duration and yield curve positioning, credit exposure and sector allocation.
| | Past performance is not predictive of future results. Current performance may be higher or lower than the data shown. Returns do not reflect the deduction of taxes that shareholders may have to pay on Fund distributions or upon the sale of Fund shares. |
| | |
| | For additional information, see the Performance Overview page in this report. |
| | |
| * | Refer to Glossary of Terms Used in this Report for definitions. |
Overall, credits at the longest end of the municipal yield curve posted the strongest returns, while bonds at the shortest end produced the weakest results. For this period, duration and yield curve positioning detracted slightly from NIM’s performance. In keeping with its investment parameters, NIM maintains an average effective maturity of 12 years or less for portfolio holdings. With this intermediate-term orientation, the Fund had strong allocations to the intermediate parts of the yield curve as well as an overweighting in the outperforming longer end (16 years and longer) of the curve. However, NIM was also overweighted at the very short end of the curve, which underperformed. In comparison, the S&P Intermediate Municipal Bond Index contains only bonds with maturity dates between 3 and 15 years, thus omitting the poorest performing maturity category for this period. These weightings help to explain some of the difference between the twelve-month performances of NIM and the S&P Intermediate Index.
Credit exposure was a positive contributor to NIM’s performance during these twelve months, as lower-rated bonds, especially those rated BBB and lower, generally outperformed higher-quality bonds, with issues rated AAA posting the weakest returns. The outperformance of the lower-quality sector was due in part to the greater demand for lower-rated bonds as investors looked for investment vehicles offering higher yields. NIM benefited from its strong exposure to bonds rated A, BBB, BB and lower, and N/R, which made up 62% of the Fund as of March 31, 2012.
Holdings and sectors that generally made positive contributions to NIM’s return during this period included zero coupon bonds, health care, industrial development revenue (IDR), transportation and special tax credits. Leasing and education bonds also outpaced the general municipal market for the period. Tobacco bonds backed by the 1998 master settlement agreement also were one of the top performing sectors, as these bonds benefited from several developments in the market, including increased demand for higher-yielding investments by investors who had become less risk-averse. In addition, based on recent data showing that cigarette sales have fallen less steeply than anticipated, the 46 states participating in the agreement stand to receive increased payments from the tobacco companies.
In contrast, pre-refunded bonds, which are often backed by U.S. Treasury securities, were the poorest performing market segment during this period. The underperformance of these bonds can be attributed primarily to their shorter effective maturities and higher credit quality. NIM continued to be overweighted in pre-refunded bonds, although the Fund’s allocation dropped from 17.6% to 10.1% during this reporting
period, largely as the result of bond calls. GO and other tax-supported bonds as well as credits issued by the water and sewer, electric utilities, housing and resource recovery sectors also generally lagged the performance of the general municipal market for this period. Even though GOs nationally tended to underperform, NIM’s holdings of bonds issued by Illinois, the largest state allocation in its portfolio, performed well despite Illinois’s well-publicized problems.
RISK CONSIDERATIONS
Fund shares are not guaranteed or endorsed by any bank or other insured depository institution, and are not federally insured by the Federal Deposit Insurance Corporation. Past performance is no guarantee of future results. Fund common shares are subject to a variety of risks, including:
Investment and Market Risk. An investment in common shares is subject to investment risk, including the possible loss of the entire principal amount that you invest. Your investment in common shares represents an indirect investment in the municipal securities owned by the Fund, which generally trade in the over-the-counter markets. Your common shares at any point in time may be worth less than your original investment, even after taking into account the reinvestment of Fund dividends and distributions.
Price Risk. Shares of closed-end investment companies like this Fund frequently trade at a discount to their NAV. Your common shares at any point in time may be worth less than your original investment, even after taking into account the reinvestment of Fund dividends and distributions.
Tax Risk. The tax treatment of Fund distributions may be affected by new IRS interpretations of the Internal Revenue Code and future changes in tax laws and regulations.
Issuer Credit Risk. This is the risk that a security in a Fund’s portfolio will fail to make dividend or interest payments when due.
Interest Rate Risk. Fixed-income securities such as bonds, preferred, convertible and other debt securities will decline in value if market interest rates rise.
Reinvestment Risk. If market interest rates decline, income earned from a Fund’s portfolio may be reinvested at rates below that of the original bond that generated the income.
Call Risk or Prepayment Risk. Issuers may exercise their option to prepay principal earlier than scheduled, forcing a Fund to reinvest in lower-yielding securities.
Inverse Floater Risk. The Fund may invest in inverse floaters. Due to their leveraged nature, these investments can greatly increase the Fund’s exposure to interest rate risk and credit risk. In addition, investments in inverse floaters involve the risk that the Fund could lose more than its original principal investment.
Dividend and Share Price Information
DIVIDEND INFORMATION
During the twelve-month reporting period ended March 31, 2012, NIM had two monthly dividend decreases, effective in June 2011 and March 2012.
NIM seeks to pay stable dividends at rates that reflect the Fund’s past results and projected future performance. During certain periods, NIM may pay dividends at a rate that may be more or less than the amount of net investment income actually earned by the Fund during the period. If a Fund has cumulatively earned more than it has paid in dividends, it holds the excess in reserve as undistributed net investment income (UNII) as part of the Fund’s NAV. Conversely, if a Fund has cumulatively paid dividends in excess of its earnings, the excess constitutes negative UNII that is likewise reflected in the Fund’s NAV. NIM will, over time, pay all of its net investment income as dividends to shareholders. As of March 31, 2012, NIM had a positive UNII balance for both tax and financial reporting purposes.
SHARE REPURCHASES AND PRICE INFORMATION
Since the inception of the Fund’s repurchase program, the Fund has not repurchased any of its outstanding shares.
As of March 31, 2012, the share price of NIM was trading at a discount of -2.11% to its NAV. The Fund’s average premium over the entire twelve-month reporting period was +0.89%.
| NIM | | Nuveen Select |
| Performance | | Maturities |
| | Municipal Fund |
| | | as of March 31, 2012 |
| | | | | |
| Fund Snapshot | | | | |
| Share Price | | $ | 10.23 | |
| Net Asset Value (NAV) | | $ | 10.45 | |
| Premium/(Discount) to NAV | | | -2.11 | % |
| Market Yield | | | 3.70 | % |
Taxable-Equivalent Yield1 | | | 5.14 | % |
| Net Assets ($000) | | $ | 129,868 | |
Average Annual Total Returns (Inception 9/18/92) | | | | | | | |
| | | | On Share Price | | On NAV |
| 1-Year | | | 8.49 | % | | 8.49 | % |
| 5-Year | | | 4.95 | % | | 4.81 | % |
| 10-Year | | | 4.62 | % | | 4.54 | % |
States3 | | | | |
| (as a % of total investments) | | | | |
| Illinois | | | 13.3 | % |
| Texas | | | 9.0 | % |
| New York | | | 8.1 | % |
| Pennsylvania | | | 7.7 | % |
| Colorado | | | 7.0 | % |
| Florida | | | 6.8 | % |
| South Carolina | | | 5.1 | % |
| California | | | 4.0 | % |
| Arkansas | | | 3.0 | % |
| Wisconsin | | | 2.9 | % |
| Missouri | | | 2.8 | % |
| New Jersey | | | 2.7 | % |
| Minnesota | | | 2.2 | % |
| Michigan | | | 2.2 | % |
| Tennessee | | | 2.0 | % |
| Ohio | | | 1.8 | % |
| Nevada | | | 1.8 | % |
| Washington | | | 1.6 | % |
| North Carolina | | | 1.6 | % |
| Other | | | 14.4 | % |
Portfolio Composition3 (as a % of total investments) | | | | |
| Tax Obligation/Limited | | | 25.0 | % |
| Utilities | | | 16.1 | % |
| Tax Obligation/General | | | 10.8 | % |
| Transportation | | | 10.6 | % |
| U.S. Guaranteed | | | 10.4 | % |
| Health Care | | | 8.6 | % |
| Consumer Staples | | | 5.6 | % |
| Education and Civic Organizations | | | 5.3 | % |
| Water and Sewer | | | 4.1 | % |
| Other | | | 3.5 | % |
| | Refer to the Glossary of Terms Used in this Report for further definition of the terms used within this Fund’s Performance Overview page. |
| 1 | Taxable-Equivalent Yield represents the yield that must be earned on a fully taxable investment in order to equal the yield of the Fund on an after-tax basis. It is based on an income tax rate of 28%. When comparing this Fund to investments that generate qualified dividend income, the Taxable-Equivalent Yield is lower. |
| 2 | Ratings shown are the highest rating given by one of the following national rating agencies: Standard & Poor’s Group, Moody’s Investors Service, Inc. or Fitch, Inc. Credit ratings are subject to change. AAA, AA, A and BBB are investment grade ratings; BB, B, CCC, CC, C and D are below-investment grade ratings. Certain bonds backed by U.S. Government or agency securities are regarded as having an implied rating equal to the rating of such securities. Holdings designated N/R are not rated by a national rating agency. |
| 3 | Holdings are subject to change. |
Report of Independent
Registered Public Accounting Firm
The Board of Trustees and Shareholders
Nuveen Select Maturities Municipal Fund
We have audited the accompanying statement of assets and liabilities, including the portfolio of investments, of Nuveen Select Maturities Municipal Fund (the “Fund”) as of March 31, 2012, and the related statement of operations for the year then ended, the statements of changes in net assets for each of the two years in the period then ended, and the financial highlights for each of the five years in the period then ended. These financial statements and financial highlights are the responsibility of the Fund’s management. Our responsibility is to express an opinion on these financial statements and financial highlights based on our audits.
We conducted our audits in accordance with the standards of the Public Company Accounting Oversight Board (United States). Those standards require that we plan and perform the audits to obtain reasonable assurance about whether the financial statements and financial highlights are free of material misstatement. We were not engaged to perform an audit of the Fund’s internal control over financial reporting. Our audits included consideration of internal control over financial reporting as a basis for designing audit procedures that are appropriate in the circumstances, but not for the purpose of expressing an opinion on the effectiveness of the Fund’s internal control over financial reporting. Accordingly, we express no such opinion. An audit also includes examining, on a test basis, evidence supporting the amounts and disclosures in the financial statements and financial highlights, assessing the accounting principles used and significant estimates made by management, and evaluating the overall financial statement presentation. Our procedures included confirmation of securities owned as of March 31, 2012, by correspondence with the custodian and brokers. We believe that our audits provide a reasonable basis for our opinion.
In our opinion, the financial statements and financial highlights referred to above present fairly, in all material respects, the financial position of Nuveen Select Maturities Municipal Fund at March 31, 2012, and the results of its operations for the year then ended, the changes in its net assets for each of the two years in the period then ended, and the financial highlights for each of the five years in the period then ended in conformity with U.S. generally accepted accounting principles.
Chicago, Illinois
May 25, 2012
| | | Nuveen Select Maturities Municipal Fund |
| NIM | | Portfolio of Investments |
| | | March 31, 2012 |
| | Principal | | | | Optional Call | | | | |
| | Amount (000) | | Description (1) | | Provisions (2) | Ratings (3) | | Value | |
| | | | Alabama – 0.1% | | | | | | |
| $ | 180 | | Birmingham Special Care Facilities Financing Authority, Alabama, Revenue Bonds, Baptist Health System Inc., Series 2005A, 5.000%, 11/15/30 | | 11/15 at 100.00 | Baa2 | $ | 174,060 | |
| | | | Alaska – 0.1% | | | | | | |
| | 155 | | Alaska State, Sport Fishing Revenue Bonds, Series 2011, 5.000%, 4/01/21 | | 4/20 at 100.00 | A1 | | 179,033 | |
| | | | Arizona – 1.1% | | | | | | |
| | | | Salt Verde Financial Corporation, Arizona, Senior Gas Revenue Bonds, Citigroup Energy Inc Prepay Contract Obligations, Series 2007: | | | | | | |
| | 100 | | 5.000%, 12/01/17 | | No Opt. Call | A– | | 106,989 | |
| | 85 | | 5.250%, 12/01/19 | | No Opt. Call | A– | | 92,949 | |
| | 35 | | 5.000%, 12/01/32 | | No Opt. Call | A– | | 35,050 | |
| | 380 | | 5.000%, 12/01/37 | | No Opt. Call | A– | | 377,826 | |
| | 750 | | Surprise Municipal Property Corporation, Arizona, Wastewater System Revenue Bonds, Series 2007, 4.500%, 4/01/17 | | 10/12 at 100.00 | A– | | 756,105 | |
| | 1,350 | | Total Arizona | | | | | 1,368,919 | |
| | | | Arkansas – 2.9% | | | | | | |
| | 1,500 | | Jefferson County, Arkansas, Pollution Control Revenue Bonds, Entergy Arkansas Inc. Project, Series 2006, 4.600%, 10/01/17 | | 5/12 at 100.00 | A– | | 1,502,895 | |
| | 1,000 | | Jonesboro, Arkansas, Industrial Development Revenue Bonds, Anheuser Busch Inc. Project, Series 2002, 4.600%, 11/15/12 | | No Opt. Call | A– | | 1,027,050 | |
| | 1,140 | | North Little Rock, Arkansas, Electric Revenue Refunding Bonds, Series 1992A, 6.500%, 7/01/15 – NPFG Insured | | No Opt. Call | BBB | | 1,214,499 | |
| | 3,640 | | Total Arkansas | | | | | 3,744,444 | |
| | | | California – 3.9% | | | | | | |
| | 600 | | California Health Facilities Financing Authority, Revenue Bonds, Catholic Healthcare West, Series 2008H, 5.125%, 7/01/22 | | 7/15 at 100.00 | A+ | | 641,784 | |
| | 125 | | California Health Facilities Financing Authority, Revenue Bonds, Lucile Salter Packard Children’s Hospital, Series 2008A, 1.450%, 8/15/33 (Mandatory put 3/15/17) | | No Opt. Call | AA | | 124,684 | |
| | 160 | | California Health Facilities Financing Authority, Revenue Bonds, Lucile Salter Packard Children’s Hospital, Series 2018C, 1.450%, 8/15/23 (Mandatory put 3/15/17) | | No Opt. Call | AA | | 159,595 | |
| | 500 | | California State, General Obligation Bonds, Various Purpose Series 2010, 5.500%, 3/01/40 | | 3/20 at 100.00 | A1 | | 549,215 | |
| | 1,000 | | Ceres Unified School District, Stanislaus County, California, General Obligation Bonds, Series 2002B, 0.000%, 8/01/31 – FGIC Insured | | 8/12 at 32.87 | A+ | | 322,540 | |
| | 260 | | Golden State Tobacco Securitization Corporation, California, Tobacco Settlement Asset-Backed Bonds, Series 2007A-1, 4.500%, 6/01/27 | | 6/17 at 100.00 | BB– | | 218,054 | |
| | 365 | | Lake Elsinore Redevelopment Agency, California, Special Tax Bonds, Community Facilities District 90-2, Series 2007A, 4.500%, 10/01/24 | | 10/17 at 100.00 | AA– | | 372,669 | |
| | | | Moulton Niguel Water District, California, Certificates of Participation, Refunding Series 2003: | | | | | | |
| | 250 | | 5.000%, 9/01/21 – AMBAC Insured | | No Opt. Call | AAA | | 274,695 | |
| | 250 | | 5.000%, 9/01/22 – AMBAC Insured | | No Opt. Call | AAA | | 271,895 | |
| | 500 | | 5.000%, 9/01/23 – AMBAC Insured | | No Opt. Call | AAA | | 541,780 | |
| | 2,000 | | Palomar Pomerado Health, California, General Obligation Bonds, Series 2009A, 0.000%, 8/01/25 – AGC Insured | | No Opt. Call | AA– | | 1,064,940 | |
| | 2,000 | | San Diego Community College District, California, General Obligation Bonds, Refunding Series 2011, 0.000%, 8/01/37 | | No Opt. Call | AA+ | | 533,920 | |
| | 8,010 | | Total California | | | | | 5,075,771 | |
| | | | Colorado – 6.8% | | | | | | |
| | 2,895 | | Centennial Downs Metropolitan District, Colorado, General Obligation Bonds, Series 1999, 5.000%, 12/01/20 – AMBAC Insured | | 12/14 at 100.00 | N/R | | 2,995,196 | |
| | 1,035 | | Colorado Educational and Cultural Facilities Authority, Charter School Revenue Bonds, Douglas County School District RE-1 – DCS Montessori School, Series 2002A, 6.000%, 7/15/22 | | 7/12 at 100.00 | BBB | | 1,037,308 | |
| | Principal | | | | Optional Call | | | | | |
| | Amount (000) | | Description (1) | | Provisions (2) | Ratings (3) | | | Value | |
| | | | Colorado (continued) | | | | | | | |
| $ | 1,175 | | Colorado Educational and Cultural Facilities Authority, Revenue Bonds, Classical Academy Charter School, Series 2003, 4.500%, 12/01/18 – SYNCORA GTY Insured | | 12/13 at 100.00 | A | | $ | 1,200,157 | |
| | 125 | | Colorado Housing Finance Authority, Single Family Program Senior Bonds, Series 2000D-2, 6.900%, 4/01/29 (Alternative Minimum Tax) | | 10/12 at 104.50 | AA | | | 131,439 | |
| | 1,465 | | Denver West Metropolitan District, Colorado, General Obligation Refunding and Improvement Bonds, Series 2003, 4.500%, 12/01/18 – RAAI Insured | | 12/13 at 100.00 | A– | | | 1,480,895 | |
| | 1,500 | | E-470 Public Highway Authority, Colorado, Senior Revenue Bonds, Series 2007C-2, 5.000%, 9/01/39 (Mandatory put 9/02/13) – NPFG Insured | | No Opt. Call | BBB | | | 1,570,845 | |
| | 1,000 | | E-470 Public Highway Authority, Colorado, Toll Revenue Bonds, Series 2004B, 0.000%, 3/01/36 – NPFG Insured | | 9/20 at 41.72 | BBB | | | 219,810 | |
| | 200 | | Regional Transportation District, Colorado, Denver Transit Partners Eagle P3 Project Private Activity Bonds, Series 2010, 6.000%, 1/15/41 | | 7/20 at 100.00 | Baa3 | | | 212,864 | |
| | 9,395 | | Total Colorado | | | | | | 8,848,514 | |
| | | | Connecticut – 1.4% | | | | | | | |
| | | | Eastern Connecticut Resource Recovery Authority, Solid Waste Revenue Bonds, Wheelabrator Lisbon Project, Series 1993A: | | | | | | | |
| | 185 | | 5.500%, 1/01/14 (Alternative Minimum Tax) | | 7/12 at 100.00 | BBB | | | 185,599 | |
| | 1,570 | | 5.500%, 1/01/15 (Alternative Minimum Tax) | | 1/15 at 100.00 | BBB | | | 1,574,553 | |
| | 1,755 | | Total Connecticut | | | | | | 1,760,152 | |
| | | | Florida – 6.6% | | | | | | | |
| | 160 | | Citizens Property Insurance Corporation, Florida, High-Risk Account Revenue Bonds, Coastal Account Senior Secured Series 2011A-1, 5.000%, 6/01/18 | | No Opt. Call | A+ | | | 178,696 | |
| | 2,400 | | Deltona, Florida, Utility Systems Water and Sewer Revenue Bonds, Series 2003, 5.250%, 10/01/17 – NPFG Insured | | 10/13 at 100.00 | A1 | | | 2,496,024 | |
| | | | Florida Citizens Property Insurance Corporation, High Risk Account Revenue Bonds, Series 2007A: | | | | | | | |
| | 1,110 | | 5.000%, 3/01/15 – NPFG Insured | | No Opt. Call | A+ | | | 1,221,622 | |
| | 210 | | 5.000%, 3/01/16 – NPFG Insured | | No Opt. Call | A+ | | | 233,146 | |
| | 600 | | Florida Department of Environmental Protection, Florida Forever Revenue Bonds, Series 2007B, 5.000%, 7/01/19 – NPFG Insured | | 7/17 at 101.00 | AA– | | | 695,040 | |
| | 15 | | JEA, Florida, Electric Revenue Certificates, Series 1973-2, 6.800%, 7/01/12 (ETM) | | No Opt. Call | AAA | | | 15,252 | |
| | | | Miami-Dade County, Florida, Public Facilities Revenue Bonds, Jackson Health System, Series 2009: | | | | | | | |
| | 10 | | 5.500%, 6/01/29 – AGM Insured | | 6/19 at 100.00 | AA– | | | 10,930 | |
| | 10 | | 5.625%, 6/01/34 – AGC Insured | | 6/19 at 100.00 | AA– | | | 10,774 | |
| | 750 | | North Sumter County Utility Dependent District, Florida, Utility Revenue Bonds, Series 2010, 5.000%, 10/01/20 | | No Opt. Call | A | | | 817,148 | |
| | 2,000 | | Orange County, Florida, Tourist Development Tax Revenue Bonds, Series 2005, 5.000%, 10/01/22 – AMBAC Insured | | 10/15 at 100.00 | AA– | | | 2,121,600 | |
| | 200 | | Port Everglades Authority, Florida, Port Facilities Revenue Bonds, Series 1986, 7.125%, 11/01/16 (ETM) | | No Opt. Call | Aaa | | | 229,652 | |
| | 500 | | South Miami Health Facilities Authority, Florida, Hospital Revenue, Baptist Health System Obligation Group, Series 2007, 5.000%, 8/15/27 | | 8/17 at 100.00 | AA | | | 530,775 | |
| | 7,965 | | Total Florida | | | | | | 8,560,659 | |
| | | | Georgia – 0.3% | | | | | | | |
| | 355 | | Cherokee County Water and Sewerage Authority, Georgia, Revenue Bonds, Series 1995, 5.200%,8/01/25 (Pre-refunded 8/01/22) – NPFG Insured | | 8/22 at 100.00 | BBB (4) | | | 416,571 | |
| | | | Idaho – 0.1% | | | | | | | |
| | 100 | | Madison County, Idaho, Hospital Revenue Certificates of Participation, Madison Memorial Hospital, Series 2006, 5.250%, 9/01/37 | | 9/16 at 100.00 | BB+ | | | 94,312 | |
| | | | Illinois – 12.9% | | | | | | | |
| | 325 | | Chicago, Illinois, Tax Increment Allocation Bonds, Irving/Cicero Redevelopment Project, Series 1998, 7.000%, 1/01/14 | | 7/12 at 100.00 | N/R | | | 325,683 | |
| | 1,500 | | Cook County Township High School District 208, Illinois, General Obligation Bonds, Series 2006, 5.000%, 12/01/21 – NPFG Insured | | 12/15 at 100.00 | Aa3 | | | 1,695,450 | |
| | | Nuveen Select Maturities Municipal Fund (continued) |
| NIM | | Portfolio of Investments |
March 31, 2012
| | Principal | | | | Optional Call | | | | | |
| | Amount (000) | | Description (1) | | Provisions (2) | Ratings (3) | | | Value | |
| | | | Illinois (continued) | | | | | | | |
| $ | 2,000 | | Huntley, Illinois, Special Service Area 9, Special Tax Bonds, Series 2007, 5.100%, 3/01/28 - AGC Insured | | 3/17 at 100.00 | AA– | | $ | 2,128,980 | |
| | 2,000 | | Illinois Educational Facilities Authority, Revenue Bonds, Art Institute of Chicago, Series 2000, 4.450%, 3/01/34 (Mandatory put 3/01/15) | | 3/14 at 100.00 | A+ | | | 2,140,220 | |
| | 1,000 | | Illinois Educational Facilities Authority, Student Housing Revenue Bonds, Educational Advancement Foundation Fund, University Center Project, Series 2002, 6.625%, 5/01/17(Pre-refunded 5/01/12) | | 5/12 at 101.00 | Aaa | | | 1,015,530 | |
| | 85 | | Illinois Finance Authority, Revenue Bonds, OSF Healthcare System, Series 2007A, 5.750%, 11/15/37 | | 11/17 at 100.00 | A | | | 91,030 | |
| | 250 | | Illinois Finance Authority, Revenue Bonds, Roosevelt University, Series 2007, 5.250%, 4/01/22 | | 4/17 at 100.00 | BBB+ | | | 257,188 | |
| | 20 | | Illinois Health Facilities Authority, Revenue Bonds, Condell Medical Center, Series 2002, 5.250%, 5/15/12 (ETM) | | No Opt. Call | Aaa | | | 20,126 | |
| | 25 | | Illinois Health Facilities Authority, Revenue Bonds, Lutheran General Health System, Series 1993A, 6.125%, 4/01/12 – AGM Insured (ETM) | | No Opt. Call | AA– (4) | | | 25,004 | |
| | | | Illinois Health Facilities Authority, Revenue Bonds, Sherman Health Systems, Series 1997: | | | | | | | |
| | 135 | | 5.250%, 8/01/17 – AMBAC Insured | | 5/12 at 100.00 | BBB | | | 135,279 | |
| | 85 | | 5.250%, 8/01/22 – AMBAC Insured | | 8/12 at 100.00 | BBB | | | 85,101 | |
| | 700 | | Illinois Health Facilities Authority, Revenue Bonds, Silver Cross Hospital and Medical Centers, Series 1999, 5.500%, 8/15/19 | | 8/19 at 100.00 | BBB– | | | 700,840 | |
| | 105 | | Illinois Health Facilities Authority, Revenue Refunding Bonds, Elmhurst Memorial Healthcare, Series 2002, 5.625%, 1/01/28 | | 1/13 at 100.00 | A– | | | 106,086 | |
| | 100 | | Illinois State, General Obligation Bonds, Refunding Series 2006, 5.000%, 1/01/15 | | No Opt. Call | A+ | | | 109,558 | |
| | 235 | | Illinois State, General Obligation Bonds, Refunding Series 2007B, 5.000%, 1/01/16 | | No Opt. Call | A+ | | | 260,404 | |
| | 315 | | Illinois State, General Obligation Bonds, Refunding Series 2008, 4.250%, 4/01/16 | | No Opt. Call | A+ | | | 341,602 | |
| | 1,165 | | Illinois State, General Obligation Bonds, Refunding Series 2010, 5.000%, 1/01/19 | | No Opt. Call | A+ | | | 1,322,799 | |
| | 230 | | Illinois State, General Obligation Bonds, Series 2006, 5.000%, 1/01/17 | | 1/16 at 100.00 | A+ | | | 252,501 | |
| | 25 | | Illinois State, General Obligation Bonds, Series 2007A, 5.500%, 6/01/15 | | No Opt. Call | A+ | | | 28,070 | |
| | 300 | | Illinois State, General Obligation Bonds, Series 2012A, 4.000%, 1/01/20 | | No Opt. Call | A+ | | | 320,496 | |
| | 275 | | Illinois, General Obligation Bonds, Illinois FIRST Program, Series 2002, 5.250%, 12/01/19 – AGM Insured | | 12/12 at 100.00 | AA– | | | 281,738 | |
| | 1,355 | | Kane & DeKalb Counties Community Unit School District 301, Illinois, General Obligation Bonds, Series 2006, 0.000%, 12/01/18 – NPFG Insured | | No Opt. Call | Aa3 | | | 1,105,694 | |
| | 55 | | Metropolitan Pier and Exposition Authority, Illinois, Dedicated State Tax Revenue Bonds, Series 2002, 5.375%, 6/01/15 – FGIC Insured | | 6/13 at 100.00 | AAA | | | 57,459 | |
| | 1,000 | | Peoria Public Building Commission, Illinois, School District Facility Revenue Bonds, Peoria County School District 150 Project, Series 2009A, 0.000%, 12/01/22 – AGC Insured | | 12/18 at 79.62 | AA– | | | 621,520 | |
| | | | Railsplitter Tobacco Settlement Authority, Illinois, Tobacco Settlement Revenue Bonds, Series 2010: | | | | | | | |
| | 500 | | 5.000%, 6/01/19 | | No Opt. Call | A | | | 561,145 | |
| | 1,000 | | 5.250%, 6/01/21 | | No Opt. Call | A | | | 1,142,530 | |
| | 700 | | Regional Transportation Authority, Cook, DuPage, Kane, Lake, McHenry and Will Counties, Illinois, General Obligation Bonds, Series 1994D, 7.750%, 6/01/19 – FGIC Insured | | No Opt. Call | AA | | | 870,709 | |
| | 715 | | Williamson & Johnson Counties Community Unit School District 2, Marion, Illinois, Limited Tax General Obligation Lease Certificates, Series 2011, 7.000%, 10/15/22 | | 10/19 at 103.00 | BBB+ | | | 780,458 | |
| | 16,200 | | Total Illinois | | | | | | 16,783,200 | |
| | | | Indiana – 0.6% | | | | | | | |
| | 250 | | Indiana Finance Authority, Educational Facilities Revenue Bonds, Drexel Foundation For Educational Excellence, Inc., Series 2009A, 6.000%, 10/01/21 | | 10/19 at 100.00 | BBB– | | | 265,320 | |
| | 250 | | Jasper County, Indiana, Pollution Control Revenue Refunding Bonds, Northern Indiana Public Service Company Project, Series 1994A Remarketed, 5.850%, 4/01/19 – NPFG Insured | | No Opt. Call | BBB | | | 290,180 | |
| | 250 | | Lake County Building Corporation, Indiana, First Mortgage Bonds, Series 2000, 4.750%, 2/01/21 | | No Opt. Call | N/R | | | 254,245 | |
| | 750 | | Total Indiana | | | | | | 809,745 | |
| | Principal | | | | Optional Call | | | | | |
| | Amount (000) | | Description (1) | | Provisions (2) | Ratings (3) | | | Value | |
| | | | Iowa – 0.4% | | | | | | | |
| $ | 500 | | Ames, Iowa, Hospital Revenue Bonds, Mary Greeley Medical Center, Series 2011, 5.250%, 6/15/27 | | No Opt. Call | A2 | | $ | 540,245 | |
| | | | Kansas – 0.3% | | | | | | | |
| | 145 | | Wyandotte County-Kansas City Unified Government, Kansas, Sales Tax Special Obligation Bonds, Redevelopment Project Area B, Series 2005, 5.000%, 12/01/20 | | 12/15 at 100.00 | AA– | | | 152,779 | |
| | 370 | | Wyandotte County-Kansas City Unified Government, Kansas, Sales Tax Special Obligation Capital Appreciation Revenue Bonds Redevelopment Project Area B – Major Multi-Sport Athletic Complex Project, Subordinate Lien Series 2010B, 0.000%, 6/01/21 | | No Opt. Call | BBB | | | 244,533 | |
| | 515 | | Total Kansas | | | | | | 397,312 | |
| | | | Kentucky – 1.2% | | | | | | | |
| | 325 | | Kentucky Economic Development Finance Authority, Louisville Arena Project Revenue Bonds, Louisville Arena Authority, Inc., Series 2008-A1, 5.750%, 12/01/28 – AGC Insured | | 6/18 at 100.00 | AA– | | | 355,709 | |
| | 460 | | Kentucky Housing Corporation, Housing Revenue Bonds, Series 2005G, 5.000%, 7/01/30 (Alternative Minimum Tax) | | 1/15 at 100.60 | AAA | | | 466,353 | |
| | 340 | | Lexington-Fayette Urban County Government Public Facilities Corporation, Kentucky State Lease Revenue Bonds, Eastern State Hospital Project, Series 2011A, 5.250%, 6/01/29 | | 6/21 at 100.00 | Aa3 | | | 379,943 | |
| | 320 | | Louisville-Jefferson County Metropolitan Government, Kentucky, Pollution Control Revenue Bonds, Louisville Gas and Electric Company Project, Series 2003A, 1.650%, 10/01/33 (Mandatory put 4/03/17) (WI/DD, Settling 4/02/12) | | No Opt. Call | N/R | | | 318,854 | |
| | 1,445 | | Total Kentucky | | | | | | 1,520,859 | |
| | | | Louisiana – 1.4% | | | | | | | |
| | 1,010 | | Louisiana Public Facilities Authority, Revenue Bonds, Baton Rouge General Hospital, Series 2004, 5.250%, 7/01/24 – NPFG Insured | | 7/14 at 100.00 | BBB | | | 1,067,136 | |
| | 55 | | Louisiana Public Facilities Authority, Revenue Bonds, Ochsner Clinic Foundation Project, Series 2007A, 5.250%, 5/15/38 | | 5/17 at 100.00 | Baa1 | | | 55,599 | |
| | | | Tobacco Settlement Financing Corporation, Louisiana, Tobacco Settlement Asset-Backed Bonds, Series 2001B: | | | | | | | |
| | 425 | | 5.500%, 5/15/30 | | 5/12 at 100.00 | A1 | | | 427,937 | |
| | 245 | | 5.875%, 5/15/39 | | 5/12 at 100.00 | A– | | | 246,450 | |
| | 1,735 | | Total Louisiana | | | | | | 1,797,122 | |
| | | | Maryland – 0.8% | | | | | | | |
| | 1,100 | | Maryland Energy Financing Administration, Revenue Bonds, AES Warrior Run Project, Series 1995, 7.400%, 9/01/19 (Alternative Minimum Tax) | | 5/12 at 100.00 | N/R | | | 1,106,930 | |
| | | | Massachusetts – 0.8% | | | | | | | |
| | 500 | | Massachusetts Development Finance Agency, Revenue Bonds, Orchard Cove, Series 2007, 5.000%, 10/01/19 | | 10/17 at 100.00 | N/R | | | 481,235 | |
| | | | Massachusetts Port Authority, Special Facilities Revenue Bonds, Delta Air Lines Inc., Series 2001A: | | | | | | | |
| | 100 | | 5.200%, 1/01/20 – AMBAC Insured (Alternative Minimum Tax) | | 5/12 at 100.00 | N/R | | | 95,446 | |
| | 470 | | 5.000%, 1/01/27 – AMBAC Insured (Alternative Minimum Tax) | | 7/12 at 100.00 | N/R | | | 405,953 | |
| | 1,070 | | Total Massachusetts | | | | | | 982,634 | |
| | | | Michigan – 2.1% | | | | | | | |
| | 1,000 | | Cornell Township Economic Development Corporation, Michigan, Environmental Improvement Revenue Refunding Bonds, MeadWestvaco Corporation-Escanaba Project, Series 2002, 5.875%, 5/01/18 (Pre-refunded 5/01/12) | | 5/12 at 100.00 | AA+ (4) | | | 1,004,920 | |
| | 400 | | Detroit, Michigan, Downtown Development Authority, Tax Increment Refunding Bonds, Development Area 1 Projects, Series 1996C-1, 0.000%, 7/01/23 | | No Opt. Call | A– | | | 210,668 | |
| | 1,000 | | Michigan Hospital Finance Authority, Refunding and Project Revenue Bonds, Ascension Health Senior Credit Group, Series 2010, 1.500%, 11/15/47 (Mandatory put 3/15/17) | | No Opt. Call | N/R | | | 991,140 | |
| | 500 | | Wayne County Airport Authority, Michigan, Revenue Bonds, Detroit Metropolitan Airport, Refunding Series 2010C, 5.000%, 12/01/16 | | No Opt. Call | A | | | 555,145 | |
| | 2,900 | | Total Michigan | | | | | | 2,761,873 | |
| | | Nuveen Select Maturities Municipal Fund (continued) |
| NIM | | Portfolio of Investments |
March 31, 2012
| | Principal | | | | Optional Call | | | | | |
| | Amount (000) | | Description (1) | | Provisions (2) | Ratings (3) | | | Value | |
| | | | Minnesota – 2.2% | | | | | | | |
| $ | 1,100 | | Becker, Minnesota, Pollution Control Revenue Bonds, Northern States Power Company, Series 1993A, 8.500%, 9/01/19 | | 8/12 at 101.00 | A1 | | $ | 1,143,923 | |
| | 250 | | Northern Municipal Power Agency, Minnesota, Electric System Revenue Bonds, Refunding Series 2009A, 5.000%, 1/01/15 – AGC Insured | | No Opt. Call | AA– | | | 277,913 | |
| | | | Tobacco Securitization Authority, Minnesota, Tobacco Settlement Revenue Bonds, Tax-Exempt Series 2011B: | | | | | | | |
| | 135 | | 5.000%, 3/01/20 | | No Opt. Call | A | | | 153,517 | |
| | 180 | | 5.000%, 3/01/21 | | No Opt. Call | A | | | 203,576 | |
| | 145 | | 5.000%, 3/01/22 | | No Opt. Call | A | | | 162,963 | |
| | 385 | | 5.250%, 3/01/23 | | 3/22 at 100.00 | A– | | | 434,738 | |
| | 400 | | 5.250%, 3/01/24 | | 3/22 at 100.00 | A– | | | 446,112 | |
| | 2,595 | | Total Minnesota | | | | | | 2,822,742 | |
| | | | Mississippi – 0.5% | | | | | | | |
| | | | Mississippi Hospital Equipment and Facilities Authority, Revenue Bonds, | | | | | | | |
| | | | Baptist Memorial Healthcare, Series 2004B-1: | | | | | | | |
| | 115 | | 5.000%, 9/01/16 | | No Opt. Call | AA | | | 124,322 | |
| | 300 | | 5.000%, 9/01/24 | | 9/14 at 100.00 | AA | | | 312,717 | |
| | 250 | | Warren County, Mississippi, Gulf Opportunity Zone Revenue Bonds, International Paper Company, Series 2006A, 4.800%, 8/01/30 | | 5/12 at 100.00 | BBB | | | 249,410 | |
| | 665 | | Total Mississippi | | | | | | 686,449 | |
| | | | Missouri – 1.2% | | | | | | | |
| | 300 | | St. Louis County, Missouri, GNMA Collateralized Mortgage Revenue Bonds, Series 1989A, 8.125%,8/01/20 (Pre-refunded 7/01/20) (Alternative Minimum Tax) | | 7/20 at 100.00 | AA+ (4) | | | 369,630 | |
| | 1,000 | | St. Louis, Missouri, Airport Revenue Bonds, Lambert-St. Louis International Airport, Series 2005, 5.500%, 7/01/19 – NPFG Insured | | No Opt. Call | A– | | | 1,145,330 | |
| | 1,300 | | Total Missouri | | | | | | 1,514,960 | |
| | | | Montana – 0.1% | | | | | | | |
| | 90 | | University of Montana, Revenue Bonds, Series 1996D, 5.375%, 5/15/19 – NPFG Insured (ETM) | | 5/12 at 100.00 | BBB (4) | | | 107,105 | |
| | | | Nebraska – 0.9% | | | | | | | |
| | 1,000 | | Dodge County School District 1, Nebraska, Fremont Public Schools, General Obligation Bonds, Series 2004, 5.000%, 12/15/19 – AGM Insured | | 12/14 at 100.00 | Aa3 | | | 1,103,430 | |
| | 100 | | Douglas County School District 10 Elkhorn, Nebraska, General Obligation Bonds, Public Schools Series 2012, 4.000%, 6/15/23 (WI/DD, Settling 4/13/12) | | 6/22 at 100.00 | AA– | | | 109,740 | |
| | 1,100 | | Total Nebraska | | | | | | 1,213,170 | |
| | | | Nevada – 1.8% | | | | | | | |
| | 1,000 | | Clark County, Nevada, Airport Revenue Bonds, Subordinate Lien Series 2010B, 5.750%, 7/01/42 | | 1/20 at 100.00 | Aa3 | | | 1,108,220 | |
| | 250 | | Las Vegas Redevelopment Agency, Nevada, Tax Increment Revenue Bonds, Series 2009A, 8.000%, 6/15/30 | | 6/19 at 100.00 | BBB– | | | 272,473 | |
| | 775 | | Washoe County, Nevada, General Obligation Bonds, Reno-Sparks Convention & Visitors Authority, Refunding Series 2011, 5.000%, 7/01/23 | | 7/21 at 100.00 | AA | | | 895,327 | |
| | 2,025 | | Total Nevada | | | | | | 2,276,020 | |
| | | | New Jersey – 2.6% | | | | | | | |
| | 305 | | Bayonne Redevelopment Agency, New Jersey, Revenue Bonds, Royal Caribbean Cruises Project, Series 2006A, 4.750%, 11/01/16 (Alternative Minimum Tax) | | No Opt. Call | BB | | | 300,376 | |
| | | | New Jersey Economic Development Authority, Cigarette Tax Revenue Bonds, Series 2004: | | | | | | | |
| | 150 | | 5.375%, 6/15/14 | | No Opt. Call | BBB+ | | | 164,175 | |
| | 15 | | 5.375%, 6/15/15 – RAAI Insured | | No Opt. Call | BBB+ | | | 16,872 | |
| | 110 | | 5.500%, 6/15/16 – RAAI Insured | | No Opt. Call | BBB+ | | | 126,976 | |
| | 25 | | New Jersey Health Care Facilities Financing Authority, State Contract Bonds, Hospital Asset Transformation Program, Series 2008A, 5.250%, 10/01/38 | | 10/18 at 100.00 | A+ | | | 26,590 | |
| | 1,730 | | New Jersey Transportation Trust Fund Authority, Transportation System Bonds, Capital Appreciation Series 2010A, 0.000%, 12/15/33 | | No Opt. Call | A+ | | | 568,236 | |
| | Principal | | | | Optional Call | | | | | |
| | Amount (000) | | Description (1) | | Provisions (2) | Ratings (3) | | | Value | |
| | | | New Jersey (continued) | | | | | | | |
| $ | 1,515 | | New Jersey Transportation Trust Fund Authority, Transportation System Bonds, Series 2010D, 5.000%, 12/15/23 | | No Opt. Call | A+ | | $ | 1,788,897 | |
| | 415 | | Tobacco Settlement Financing Corporation, New Jersey, Tobacco Settlement Asset-Backed Bonds, Series 2007-1A, 4.500%, 6/01/23 | | 6/17 at 100.00 | B1 | | | 389,922 | |
| | 4,265 | | Total New Jersey | | | | | | 3,382,044 | |
| | | | New York – 7.9% | | | | | | | |
| | 220 | | Brooklyn Arena Local Development Corporation, New York, Payment in Lieu of Taxes Revenue Bonds, Barclays Center Project, Series 2009, 6.000%, 7/15/30 | | 1/20 at 100.00 | BBB– | | | 240,412 | |
| | 1,000 | | Dormitory Authority of the State of New York, Revenue Bonds, Brooklyn Law School, Series 2003A, 5.500%, 7/01/15 – RAAI Insured | | 7/13 at 100.00 | BBB+ | | | 1,055,870 | |
| | 770 | | Dormitory Authority of the State of New York, Third General Resolution Revenue Bonds, State University Educational Facilities Issue, Series 2012A, 5.000%, 5/15/25 | | 5/22 at 100.00 | AA– | | | 902,117 | |
| | 400 | | Hudson Yards Infrastructure Corporation, New York, Revenue Bonds, Senior Fiscal 2012 Series 2011A, 5.750%, 2/15/47 | | No Opt. Call | A | | | 448,192 | |
| | 105 | | New York City Industrial Development Agency, New York, Civic Facility Revenue Bonds, Special Needs Facilities Pooled Program, Series 2008A-1, 5.700%, 7/01/13 | | No Opt. Call | N/R | | | 104,901 | |
| | | | New York State Tobacco Settlement Financing Corporation, Tobacco Settlement Asset-Backed and State Contingency Contract-Backed Bonds, Series 2003A-1: | | | | | | | |
| | 250 | | 5.250%, 6/01/20 – AMBAC Insured | | 6/13 at 100.00 | AA– | | | 263,328 | |
| | 200 | | 5.250%, 6/01/21 – AMBAC Insured | | 6/13 at 100.00 | AA– | | | 210,710 | |
| | 640 | | 5.250%, 6/01/22 – AMBAC Insured | | 6/13 at 100.00 | AA– | | | 673,888 | |
| | | | New York State Tobacco Settlement Financing Corporation, Tobacco Settlement Asset-Backed and State Contingency Contract-Backed Bonds, Series 2003B-1C: | | | | | | | |
| | 500 | | 5.500%, 6/01/21 | | 6/13 at 100.00 | AA– | | | 528,230 | |
| | 300 | | 5.500%, 6/01/22 | | 6/13 at 100.00 | AA– | | | 316,758 | |
| | | | New York State Tobacco Settlement Financing Corporation, Tobacco Settlement Asset-Backed and State Contingency Contract-Backed Bonds, Series 2011B: | | | | | | | |
| | 360 | | 5.000%, 6/01/17 | | No Opt. Call | AA– | | | 421,582 | |
| | 565 | | 5.000%, 6/01/18 | | No Opt. Call | AA– | | | 669,644 | |
| | 4,300 | | Port Authority of New York and New Jersey, Special Project Bonds, JFK International Air Terminal LLC, Sixth Series 1997, 7.000%, 12/01/12 – NPFG Insured (Alternative Minimum Tax) | | No Opt. Call | Baa1 | | | 4,398,169 | |
| | 9,610 | | Total New York | | | | | | 10,233,801 | |
| | | | North Carolina – 1.5% | | | | | | | |
| | 1,880 | | Union County, North Carolina, Certificates of Participation, Series 2003, 5.000%, 6/01/18 – AMBAC Insured | | 6/13 at 101.00 | Aa2 | | | 1,988,777 | |
| | | | Ohio – 1.8% | | | | | | | |
| | 45 | | Buckeye Tobacco Settlement Financing Authority, Ohio, Tobacco Settlement Asset-Backed Revenue Bonds, Senior Lien, Series 2007A-1, 5.000%, 6/01/17 | | No Opt. Call | Baa1 | | | 47,836 | |
| | 1,200 | | Buckeye Tobacco Settlement Financing Authority, Ohio, Tobacco Settlement Asset-Backed Revenue Bonds, Senior Lien, Series 2007A-2, 5.125%, 6/01/24 | | 6/17 at 100.00 | B | | | 958,584 | |
| | | | New Albany Community Authority, Ohio, Community Facilities Revenue Refunding Bonds, Series 2012C: | | | | | | | |
| | 25 | | 4.000%, 10/01/18 | | No Opt. Call | A1 | | | 27,379 | |
| | 30 | | 4.000%, 10/01/19 | | No Opt. Call | A1 | | | 32,874 | |
| | 40 | | 4.000%, 10/01/20 | | No Opt. Call | A1 | | | 43,673 | |
| | 45 | | 5.000%, 10/01/21 | | No Opt. Call | A1 | | | 52,483 | |
| | 35 | | 5.000%, 10/01/22 | | No Opt. Call | A1 | | | 40,575 | |
| | 1,000 | | Toledo-Lucas County Port Authority, Ohio, Port Revenue Bonds, Cargill Inc., Series 2004B, 4.500%, 12/01/15 | | No Opt. Call | A | | | 1,078,240 | |
| | 2,420 | | Total Ohio | | | | | | 2,281,644 | |
| | | | Oklahoma – 0.8% | | | | | | | |
| | 1,000 | | Oklahoma Capitol Improvement Authority, State Facilities Revenue Bonds, Series 2005F, 5.000%, 7/01/27 – AMBAC Insured | | No Opt. Call | AA | | | 1,104,810 | |
| | | Nuveen Select Maturities Municipal Fund (continued) |
| NIM | | Portfolio of Investments |
March 31, 2012
| | Principal | | | | Optional Call | | | | | |
| | Amount (000) | | Description (1) | | Provisions (2) | Ratings (3) | | | Value | |
| | | | Pennsylvania – 7.4% | | | | | | | |
| $ | 100 | | Cumberland County Municipal Authority, Pennsylvania, Revenue Bonds, Presbyterian Homes Inc., Refunding Series 2005A, 5.000%, 12/01/15 – RAAI Insured | | No Opt. Call | BBB+ | | $ | 107,437 | |
| | 200 | | Luzerne County Industrial Development Authority, Pennsylvania, Guaranteed Lease Revenue Bonds, Series 2009, 7.750%, 12/15/27 | | 12/19 at 100.00 | N/R | | | 204,882 | |
| | 640 | | Pennsylvania Higher Educational Facilities Authority, College Revenue Bonds, Ninth Series 1976, 7.625%, 7/01/15 (ETM) | | No Opt. Call | Aaa | | | 711,923 | |
| | 225 | | Pennsylvania Higher Educational Facilities Authority, Revenue Bonds, University of the Arts, Series 1999, 5.150%, 3/15/20 – RAAI Insured (ETM) | | 5/12 at 100.00 | N/R (4) | | | 260,746 | |
| | 580 | | Pennsylvania Turnpike Commission, Motor License Fund-Enhanced Subordinate Special Revenue Bonds, Series 2010A, 0.000%, 12/01/34 | | 12/20 at 100.00 | AA | | | 516,264 | |
| | 4,120 | | Philadelphia Gas Works, Pennsylvania, Revenue Bonds, Eighteenth Series 2004, 5.000%, 8/01/15 – AMBAC Insured | | 8/14 at 100.00 | BBB+ | | | 4,413,344 | |
| | 1,350 | | Philadelphia Gas Works, Pennsylvania, Revenue Bonds, Twelfth Series 1990B, 7.000%, 5/15/20 – NPFG Insured (ETM) | | No Opt. Call | BBB (4) | | | 1,674,122 | |
| | 235 | | Philadelphia Hospitals and Higher Education Facilities Authority, Pennsylvania, Hospital Revenue Bonds, Temple University Hospital, Series 1993A, 6.625%, 11/15/23 | | 5/12 at 100.00 | BBB– | | | 235,106 | |
| | 1,085 | | Pittsburgh School District, Allegheny County, Pennsylvania, General Obligation Bonds, Series 2006B, 5.000%, 9/01/12 – AMBAC Insured | | No Opt. Call | Aa3 | | | 1,105,365 | |
| | 65 | | St. Mary Hospital Authority, Pennsylvania, Health System Revenue Bonds, Catholic Health East, Series 2009D, 6.250%, 11/15/34 | | 5/19 at 100.00 | A+ | | | 74,484 | |
| | 330 | | Union County Hospital Authority, Pennsylvania, Hospital Revenue Bonds, Evangelical Community Hospital Project, Refunding and Improvement Series 2011, 5.750%, 8/01/21 | | No Opt. Call | BBB+ | | | 364,746 | |
| | 8,930 | | Total Pennsylvania | | | | | | 9,668,419 | |
| | | | Puerto Rico – 0.7% | | | | | | | |
| | 1,000 | | Puerto Rico Sales Tax Financing Corporation, Sales Tax Revenue Bonds, First Subordinate Series 2009A, 0.000%, 8/01/32 | | 8/26 at 100.00 | A+ | | | 967,900 | |
| | | | Rhode Island – 0.9% | | | | | | | |
| | | | Rhode Island Tobacco Settlement Financing Corporation, Tobacco Settlement Asset-Backed Bonds, Series 2002A: | | | | | | | |
| | 380 | | 6.125%, 6/01/32 | | 6/12 at 100.00 | BBB+ | | | 382,641 | |
| | 755 | | 6.250%, 6/01/42 | | 6/12 at 100.00 | BBB+ | | | 761,448 | |
| | 1,135 | | Total Rhode Island | | | | | | 1,144,089 | |
| | | | South Carolina – 5.0% | | | | | | | |
| | 750 | | Berkeley County School District, South Carolina, Installment Purchase Revenue Bonds, Securing Assets for Education, Series 2003, 5.250%, 12/01/19 | | 12/13 at 100.00 | A1 | | | 791,865 | |
| | 1,540 | | Piedmont Municipal Power Agency, South Carolina, Electric Revenue Bonds, Series 1991, 6.750%, 1/01/19 – FGIC Insured (ETM) | | No Opt. Call | Baa1 (4) | | | 2,027,780 | |
| | 2,835 | | Piedmont Municipal Power Agency, South Carolina, Electric Revenue Bonds, Series 1991, 6.750%, 1/01/19 – FGIC Insured | | No Opt. Call | Baa1 | | | 3,622,818 | |
| | 5 | | South Carolina JOBS Economic Development Authority, Economic Development Revenue Bonds, Bon Secours Health System Inc., Series 2002A, 5.625%, 11/15/30 (Pre-refunded 11/15/12) | | 11/12 at 100.00 | A3 (4) | | | 5,170 | |
| | 20 | | South Carolina JOBS Economic Development Authority, Economic Development Revenue Bonds, Bon Secours Health System Inc., Series 2002B, 5.625%, 11/15/30 | | 11/12 at 100.00 | A– | | | 20,090 | |
| | 5,150 | | Total South Carolina | | | | | | 6,467,723 | |
| | | | South Dakota – 0.8% | | | | | | | |
| | 1,000 | | South Dakota Health and Educational Facilities Authority, Revenue Bonds, Sanford Health, Series 2007, 5.000%, 11/01/27 | | 5/17 at 100.00 | AA– | | | 1,056,180 | |
| | Principal | | | | Optional Call | | | | | |
| | Amount (000) | | Description (1) | | Provisions (2) | Ratings (3) | | | Value | |
| | | | Tennessee – 1.9% | | | | | | | |
| | | | Shelby County Health, Educational and Housing Facilities Board, Tennessee, Hospital Revenue Bonds, Methodist Healthcare, Series 2002: | | | | | | | |
| $ | 750 | | 6.000%, 9/01/17 (Pre-refunded 9/01/12) | | 9/12 at 100.00 | AA+ (4) | | $ | 768,353 | |
| | 1,250 | | 6.000%, 9/01/17 (Pre-refunded 9/01/12) | | 9/12 at 100.00 | AA+ (4) | | | 1,280,588 | |
| | 400 | | The Tennessee Energy Acquisition Corporation, Gas Revenue Bonds, Series 2006A, 5.000%, 9/01/13 | | No Opt. Call | A2 | | | 419,400 | |
| | 2,400 | | Total Tennessee | | | | | | 2,468,341 | |
| | | | Texas – 8.7% | | | | | | | |
| | 1,055 | | Austin, Texas, General Obligation Bonds, Series 2004, 5.000%, 9/01/20 (Pre-refunded 9/01/14) – NPFG Insured | | 9/14 at 100.00 | AAA | | | 1,170,860 | |
| | 565 | | Bexar County Housing Finance Corporation, Texas, FNMA Guaranteed Multifamily Housing Revenue Bonds, Villas Sonterra Apartments Project, Series 2007A, 4.700%, 10/01/15(Alternative Minimum Tax) | | No Opt. Call | N/R | | | 600,194 | |
| | 25 | | Brazos River Authority, Texas, Collateralized Pollution Control Revenue Bonds, Texas Utilities Electric Company, Series 2003D, 5.400%, 10/01/29 (Mandatory put 10/01/14) | | No Opt. Call | CC | | | 9,460 | |
| | 2,000 | | Brazos River Authority, Texas, Collateralized Revenue Refunding Bonds, CenterPoint Energy Inc., Series 2004B, 4.250%, 12/01/17 – FGIC Insured | | 6/14 at 100.00 | A– | | | 2,070,660 | |
| | 15 | | Brazos River Authority, Texas, Pollution Control Revenue Refunding Bonds, TXU Energy Company LLC, Series 2003A, 6.750%, 4/01/38 (Mandatory put 4/01/13) (Alternative Minimum Tax) | | No Opt. Call | CC | | | 11,619 | |
| | 500 | | Central Texas Regional Mobility Authority, Senior Lien Revenue Bonds, Series 2011, 6.250%, 1/01/46 | | 1/21 at 100.00 | BBB– | | | 545,300 | |
| | 1,875 | | Denton Independent School District, Denton County, Texas, General Obligation Bonds, Series 2006, 5.000%, 8/15/20 | | 8/16 at 100.00 | AAA | | | 2,171,775 | |
| | 1,000 | | Houston, Texas, Hotel Occupancy Tax and Special Revenue Bonds, Convention and Entertainment Facilities Department, Refunding Series 2011B, 5.250%, 9/01/25 | | 9/16 at 100.00 | A2 | | | 1,078,610 | |
| | 500 | | Houston, Texas, Hotel Occupancy Tax and Special Revenue Bonds, Convention and Entertainment Project, Series 2001B, 0.000%, 9/01/23 – AMBAC Insured | | No Opt. Call | A2 | | | 294,745 | |
| | 300 | | Kerrville Health Facilities Development Corporation, Texas, Revenue Bonds, Sid Peterson Memorial Hospital Project, Series 2005, 5.125%, 8/15/26 | | No Opt. Call | BBB– | | | 303,531 | |
| | 200 | | Love Field Airport Modernization Corporation, Texas, Special Facilities Revenue Bonds, Southwest Airlines Company, Series 2010, 5.250%, 11/01/40 | | 11/20 at 100.00 | BBB– | | | 207,832 | |
| | 325 | | North Texas Tollway Authority, Second Tier System Revenue Refunding Bonds, Series 2008F, 5.750%, 1/01/38 | | 1/18 at 100.00 | A3 | | | 348,852 | |
| | 750 | | North Texas Tollway Authority, Special Projects System Revenue Bonds, Current Interest Series 2011D, 5.000%, 9/01/24 | | 9/21 at 100.00 | AA | | | 886,110 | |
| | | | North Texas Tollway Authority, Special Projects System Revenue Bonds, Series 2011C: | | | | | | | |
| | 100 | | 0.000%, 9/01/43 | | 9/31 at 100.00 | AA | | | 63,317 | |
| | 490 | | 0.000%, 9/01/45 | | 9/31 at 100.00 | AA | | | 343,299 | |
| | 1,195 | | Texas Municipal Gas Acquisition and Supply Corporation I, Gas Supply Revenue Bonds, Series 2006B, 0.867%, 12/15/17 | | 5/12 at 100.00 | A– | | | 1,102,638 | |
| | 125 | | Weslaco Health Facilities Development Corporation, Texas, Hospital Revenue Bonds, Knapp Medical Center, Series 2002, 6.000%, 6/01/17 (Pre-refunded 6/01/12) | | 6/12 at 100.00 | N/R (4) | | | 125,984 | |
| | 11,020 | | Total Texas | | | | | | 11,334,786 | |
| | | | Virgin Islands – 0.4% | | | | | | | |
| | 525 | | Virgin Islands Public Finance Authority, Matching Fund Loan Notes Revenue Bonds, Senior Lien Series 2010A, 5.000%, 10/01/29 | | 10/20 at 100.00 | BBB+ | | | 540,572 | |
| | | | Virginia – 0.2% | | | | | | | |
| | 250 | | Virginia College Building Authority, Educational Facilities Revenue Refunding Bonds, Marymount University, Series 1998, 5.100%, 7/01/18 – RAAI Insured | | 7/12 at 100.00 | N/R | | | 250,393 | |
| | | Nuveen Select Maturities Municipal Fund (continued) |
| NIM | | Portfolio of Investments |
March 31, 2012
| | Principal | | | | Optional Call | | | | | |
| | Amount (000) | | Description (1) | | Provisions (2) | Ratings (3) | | | Value | |
| | | | Washington – 1.6% | | | | | | | |
| $ | 305 | | Washington Public Power Supply System, Revenue Refunding Bonds, Nuclear Project 3, Series 1989B, 7.125%, 7/01/16 – NPFG Insured | | No Opt. Call | Aa1 | | $ | 381,268 | |
| | 1,000 | | Washington State Health Care Facilities Authority, Revenue Bonds, Fred Hutchinson Cancer Research Center, Series 2011A, 5.375%, 1/01/31 | | 1/21 at 100.00 | A | | | 1,063,028 | |
| | 575 | | Washington State Tobacco Settlement Authority, Tobacco Settlement Asset-Backed Revenue Bonds, Series 2002, 6.500%, 6/01/26 | | 6/13 at 100.00 | A3 | | | 599,073 | |
| | 1,880 | | Total Washington | | | | | | 2,043,369 | |
| | | | Wisconsin – 2.8% | | | | | | | |
| | | | Badger Tobacco Asset Securitization Corporation, Wisconsin, Tobacco Settlement Asset-Backed Bonds, Series 2002: | | | | | | | |
| | 340 | | 6.125%, 6/01/27 (Pre-refunded 6/01/12) | | 6/12 at 100.00 | Aaa | | | 343,427 | |
| | 1,480 | | 6.375%, 6/01/32 (Pre-refunded 6/01/12) | | 6/12 at 100.00 | Aaa | | | 1,495,540 | |
| | 270 | | Wisconsin Health and Educational Facilities Authority, Revenue Bonds, Aurora Health Care, Inc., Series 2010B, 5.000%, 7/15/20 | | No Opt. Call | A | | | 306,464 | |
| | 675 | | Wisconsin Health and Educational Facilities Authority, Revenue Bonds, Aurora Health Care, Inc., Series 2012A, 5.000%, 7/15/25 | | 7/21 at 100.00 | A | | | 735,008 | |
| | | | Wisconsin Health and Educational Facilities Authority, Revenue Bonds, Wheaton Franciscan Healthcare System, Series 2006: | | | | | | | |
| | 500 | | 5.250%, 8/15/18 | | 8/16 at 100.00 | A– | | | 539,503 | |
| | 180 | | 5.250%, 8/15/34 | | 8/16 at 100.00 | A– | | | 181,420 | |
| | 3,445 | | Total Wisconsin | | | | | | 3,601,362 | |
| $ | 122,805 | | Total Long-Term Investments (cost $117,416,011) – 95.5% | | | | | | 124,077,011 | |
| | | | Short-Term Investments – 1.6% | | | | | | | |
| | | | Missouri – 1.6% | | | | | | | |
| $ | 2,030 | | St. Louis, Missouri, Airport Revenue Bonds, Lambert-St. Louis International Airport, Variable Rate Demand Obligations, Tender Option Bond Trust DCL-017, 0.940%, 7/01/22 (5) | | No Opt. Call | A-2 | | | 2,030,000 | |
| | | | Total Short-Term Investments (cost $2,030,000) | | | | | | 2,030,000 | |
| | | | Total Investments (cost $119,446,011) – 97.1% | | | | | | 126,107,011 | |
| | | | Other Assets Less Liabilities – 2.9% | | | | | | 3,761,320 | |
| | | | Net Assets – 100% | | | | | $ | 129,868,331 | |
| (1) | | All percentages shown in the Portfolio of Investments are based on net assets. |
| (2) | | Optional Call Provisions (not covered by the report of independent registered public accounting firm): Dates (month and year) and prices of the earliest optional call or redemption. There may be other call provisions at varying prices at later dates. Certain mortgage-backed securities may be subject to periodic principal paydowns. |
| (3) | | Ratings (not covered by the report of independent registered public accounting firm): Using the highest of Standard & Poor’s Group (“Standard & Poor’s”), Moody’s Investors Service, Inc. (“Moody’s”) or Fitch, Inc. (“Fitch”) rating. Ratings below BBB by Standard & Poor’s, Baa by Moody’s or BBB by Fitch are considered to be below investment grade. Holdings designated N/R are not rated by any of these national rating agencies. |
| (4) | | Backed by an escrow or trust containing sufficient U.S. Government or U.S. Government agency securities, which ensure the timely payment of principal and interest. Certain bonds backed by U.S. Government or agency securities are regarded as having an implied rating equal to the rating of such securities. |
| (5) | | Investment has a maturity of more than one year, but has variable rate and demand features which qualify it as a short-term investment. The rate disclosed is that in effect at the end of the reporting period. The rate changes periodically based on market conditions or a specified market index. |
| N/R | | Not rated. |
| WI/DD | | Purchased on a when-issued or delayed delivery basis. |
| (ETM) | | Escrowed to maturity. |
| See accompanying notes to financial statements. |
| | | |
| 22 | | Nuveen Investments |
| | | Statement of |
| | | Assets & Liabilities |
| | | March 31, 2012 |
| | | | | |
| Assets | | | | |
| Investments, at value (cost $119,446,011) | | $ | 126,107,011 | |
| Cash | | | 173,019 | |
| Receivables: | | | | |
| Interest | | | 1,574,095 | |
| Investments sold | | | 3,058,552 | |
| Other assets | | | 6,723 | |
| Total assets | | | 130,919,400 | |
| Liabilities | | | | |
| Payables: | | | | |
| Dividends | | | 376,598 | |
| Investments purchased | | | 538,101 | |
| Accrued expenses: | | | | |
| Management fees | | | 52,035 | |
| Other | | | 84,335 | |
| Total liabilities | | | 1,051,069 | |
| Net assets | | $ | 129,868,331 | |
| Shares outstanding | | | 12,432,574 | |
| Net asset value per share outstanding | | $ | 10.45 | |
| Net assets consist of: | | | | |
| Shares, $.01 par value per share | | $ | 124,326 | |
| Paid-in surplus | | | 123,723,690 | |
| Undistributed (Over-distribution of) net investment income | | | 196,357 | |
| Accumulated net realized gain (loss) | | | (837,042 | ) |
| Net unrealized appreciation (depreciation) | | | 6,661,000 | |
| Net assets | | $ | 129,868,331 | |
| Authorized shares | | | Unlimited | |
| See accompanying notes to financial statements. |
| | | |
| Nuveen Investments | | 23 |
Year Ended March 31, 2012
| | | | | |
| Investment Income | | $ | 5,809,352 | |
| Expenses | | | | |
| Management fees | | | 609,703 | |
| Shareholders’ servicing agent fees and expenses | | | 6,536 | |
| Custodian’s fees and expenses | | | 34,174 | |
| Trustees’ fees and expenses | | | 3,764 | |
| Professional fees | | | 24,611 | |
| Shareholders’ reports – printing and mailing expenses | | | 86,639 | |
| Stock exchange listing fees | | | 8,816 | |
| Investor relations expense | | | 12,237 | |
| Other expenses | | | 7,898 | |
| Total expenses before custodian fee credit | | | 794,378 | |
| Custodian fee credit | | | (2,230 | ) |
| Net expenses | | | 792,148 | |
| Net investment income (loss) | | | 5,017,204 | |
| Realized and Unrealized Gain (Loss) | | | | |
| Net realized gain (loss) from investments | | | (395,603 | ) |
| Change in net unrealized appreciation (depreciation) of investments | | | 5,682,964 | |
| Net realized and unrealized gain (loss) | | | 5,287,361 | |
| Net increase (decrease) in net assets from operations | | $ | 10,304,565 | |
| See accompanying notes to financial statements. |
| | | |
| 24 | | Nuveen Investments |
| | | Statement of |
| | | Changes in Net Assets |
| | | Year | | Year | |
| | | Ended | | Ended | |
| | | 3/31/12 | | 3/31/11 | |
| Operations | | | | | | | |
| Net investment income (loss) | | $ | 5,017,204 | | $ | 5,360,027 | |
| Net realized gain (loss) from investments | | | (395,603 | ) | | 39,355 | |
| Change in net unrealized appreciation (depreciation) of investments | | | 5,682,964 | | | (2,560,337 | ) |
| Net increase (decrease) in net assets from operations | | | 10,304,565 | | | 2,839,045 | |
| Distributions to Shareholders | | | | | | | |
| From net investment income | | | (5,064,360 | ) | | (5,217,227 | ) |
| Decrease in net assets from distributions to shareholders | | | (5,064,360 | ) | | (5,217,227 | ) |
| Capital Share Transactions | | | | | | | |
| Net proceeds from shares issued to shareholders due to reinvestment of distributions | | | 78,825 | | | 95,473 | |
| Net increase (decrease) in net assets applicable to shares from capital share transactions | | | 78,825 | | | 95,473 | |
| Net increase (decrease) in net assets | | | 5,319,030 | | | (2,282,709 | ) |
| Net assets at the beginning of period | | | 124,549,301 | | | 126,832,010 | |
| Net assets at the end of period | | $ | 129,868,331 | | $ | 124,549,301 | |
| Undistributed (Over-distribution of) net investment income at the end of period | | $ | 196,357 | | $ | 258,709 | |
| See accompanying notes to financial statements. |
| | | |
| Nuveen Investments | | 25 |
| | | Financial |
| | | Highlights |
| | | |
| | | Selected data for a Common share outstanding throughout each period: |
| | | | | Investment Operations | | Less Distributions | | | | | |
| | | Beginning Net Asset Value | | Net Investment Income (Loss | ) | Net Realized/ Unrealized Gain (Loss | ) | Total | | Net Investment Income | | Capital Gains | | Total | | Ending Net Asset Value | | Ending Market Value | |
| Year Ended 3/31: | | | | | | | | | | | | | | | | | | | | | | | | | |
| 2012 | | $ | 10.02 | | $ | .40 | | $ | .44 | | $ | .84 | | $ | (.41 | ) | $ | — | | $ | (.41 | ) | $ | 10.45 | | $ | 10.23 | |
| 2011 | | | 10.22 | | | .43 | | | (.21 | ) | | .22 | | | (.42 | ) | | — | | | (.42 | ) | | 10.02 | | | 9.81 | |
| 2010 | | | 9.68 | | | .44 | | | .52 | | | .96 | | | (.42 | ) | | — | | | (.42 | ) | | 10.22 | | | 10.42 | |
| 2009 | | | 10.07 | | | .43 | | | (.38 | ) | | .05 | | | (.44 | ) | | — | | | (.44 | ) | | 9.68 | | | 9.98 | |
| 2008 | | | 10.19 | | | .44 | | | (.12 | ) | | .32 | | | (.44 | ) | | — | | | (.44 | ) | | 10.07 | | | 9.80 | |
| | | | | Ratios/Supplemental Data | |
| Total Returns | | | | Ratios to Average Net Assets(b) | | | |
Based on Market Value | (a) | Based on Net Asset Value | (a) | Ending Net Assets (000) | | Expenses | | Net Investment Income (Loss) | | Portfolio Turnover Rate | |
| 8.49 | % | | 8.49 | % | $ | 129,868 | | | .62 | % | | 3.92 | % | | 17 | % |
| (1.89 | ) | | 2.15 | | | 124,549 | | | .59 | | | 4.22 | | | 8 | |
| 8.83 | | | 10.06 | | | 126,832 | | | .59 | | | 4.38 | | | 5 | |
| 6.53 | | | .52 | | | 120,012 | | | .61 | | | 4.43 | | | 8 | |
| 3.18 | | | 3.18 | | | 124,831 | | | .59 | | | 4.37 | | | 11 | |
| (a) | Total Return Based on Market Value is the combination of changes in the market price per share and the effect of reinvested dividend income and reinvested capital gains distributions, if any, at the average price paid per share at the time of reinvestment. The last dividend declared in the period, which is typically paid on the first business day of the following month, is assumed to be reinvested at the ending market price. The actual reinvestment for the last dividend declared in the period may take place over several days, and in some instances may not be based on the market price, so the actual reinvestment price may be different from the price used in the calculation. Total returns are not annualized. |
| | Total Return Based on Net Asset Value is the combination of changes in net asset value, reinvested dividend income at net asset value and reinvested capital gains distributions at net asset value, if any. The last dividend declared in the period, which is typically paid on the first business day of the following month, is assumed to be reinvested at the ending net asset value. The actual reinvest price for the last dividend declared in the period may often be based on the Fund’s market price (and not its net asset value), and therefore may be different from the price used in the calculation. Total returns are not annualized. |
| (b) | Ratios do not reflect the effect of custodian fee credits earned on the Fund’s net cash on deposit with the custodian bank, where applicable. |
| See accompanying notes to financial statements. |
| | | |
| Nuveen Investments | | 27 |
| | | Notes to |
| | | Financial Statements |
1. General Information and Significant Accounting Policies
General Information
The fund covered in this report and its corresponding New York Stock Exchange (“NYSE”) symbol is Nuveen Select Maturities Municipal Fund (NIM) (the “Fund”). The Fund is registered under the Investment Company Act of 1940, as amended, as a closed-end, registered investment company.
The Fund seeks to provide current income exempt from regular federal income tax, consistent with the preservation of capital by investing in an investment-grade quality portfolio of municipal obligations with intermediate characteristics. In managing its portfolio, the Fund has purchased municipal obligations having remaining effective maturities of no more than fifteen years with respect to 80% of its total assets that, in the opinion of Nuveen Asset Management, LLC (the “Sub-Adviser”), a wholly-owned subsidiary of Nuveen Fund Advisors, Inc. (the “Adviser”), a wholly-owned subsidiary of Nuveen Investments, Inc. (“Nuveen”), represent the best value in terms of the balance between yield and capital preservation currently available from the intermediate sector of the municipal market. The Sub-Adviser will actively monitor the effective maturities of the Fund’s investments in response to prevailing market conditions, and will adjust its portfolio consistent with its investment policy of maintaining an average effective remaining maturity of twelve years or less.
Significant Accounting Policies
The following is a summary of significant accounting policies followed by the Fund in the preparation of its financial statements in accordance with U.S. generally accepted accounting principles (“U.S. GAAP”).
Investment Valuation
Prices of municipal bonds are provided by a pricing service approved by the Fund’s Board of Trustees. These securities are generally classified as Level 2 for fair value measurement purposes. The pricing service establishes a security’s fair value using methods that may include consideration of the following: yields or prices of investments of comparable quality, type of issue, coupon, maturity and rating, market quotes or indications of value from security dealers, evaluations of anticipated cash flows or collateral, general market conditions and other information and analysis, including the obligor’s credit characteristics considered relevant. In pricing certain securities, particularly less liquid and lower quality securities, the pricing service may consider information about a security, its issuer, or market activity, provided by the Adviser. These securities are generally classified as Level 2 or Level 3 depending on the priority of the significant inputs.
Certain securities may not be able to be priced by the pre-established pricing methods as described above. Such securities may be valued by the Fund’s Board of Trustees or its designee at fair value. These securities generally include, but are not limited to, restricted securities (securities which may not be publicly sold without registration under the Securities Act of 1933, as amended) for which a pricing service is unable to provide a market price; securities whose trading has been formally suspended; debt securities that have gone into default and for which there is no current market quotation; a security whose market price is not available from a pre-established pricing source; a security with respect to which an event has occurred that is likely to materially affect the value of the security after the market has closed but before the calculation of a Fund’s net asset value (as may be the case in non-U.S. markets on which the security is primarily traded) or make it difficult or impossible to obtain a reliable market quotation; and a security whose price, as provided by the pricing service, is not deemed to reflect the security’s fair value. As a general principle, the fair value of a security would appear to be the amount that the owner might reasonably expect to receive for it in a current sale. A variety of factors may be considered in determining the fair value of such securities, which may include consideration of the following: yields or prices of investments of comparable quality, type of issue, coupon, maturity and rating, market quotes or indications of value from security dealers, evaluations of anticipated cash flows or collateral, general market conditions and other information and analysis, including the obligor’s credit characteristics considered relevant. These securities are generally classified as Level 2 or Level 3 depending on the priority of the significant inputs. Regardless of the method employed to value a particular security, all valuations are subject to review by the Fund’s Board of Trustees or its designee.
Refer to Footnote 2 – Fair Value Measurements for further details on the leveling of securities held by the Fund as of the end of the reporting period.
Investment Transactions
Investment transactions are recorded on a trade date basis. Realized gains and losses from transactions are determined on the specific identification method, which is the same basis used for federal income tax purposes. Investments purchased on a when-issued/delayed delivery basis may have extended settlement periods. Any investments so purchased are subject to market fluctuation during this period. The Fund has instructed the custodian to segregate assets with a current value at least equal to the amount of the when-issued/delayed delivery purchase commitments. At March 31, 2012, the Fund had outstanding when-issued/delayed delivery purchase commitments of $429,534.
Investment Income
Investment income, which reflects the amortization of premiums and includes accretion of discounts for financial reporting purposes, is recorded on an accrual basis. Investment income also reflects paydown gains and losses, if any.
Income Taxes
The Fund intends to distribute substantially all of its net investment income and net capital gains to shareholders and to otherwise comply with the requirements of Subchapter M of the Internal Revenue Code applicable to regulated investment companies (“RICs”). Therefore, no federal income tax provision is required. Furthermore, the Fund intends to satisfy conditions that will enable interest from municipal securities, which is exempt from regular federal and designated state income taxes, to retain such tax-exempt status when distributed to shareholders of the Fund. Net realized capital gains and ordinary income distributions paid by the Fund are subject to federal taxation.
For all open tax years and all major taxing jurisdictions, management of the Fund has concluded that there are no significant uncertain tax positions that would require recognition in the financial statements. Open tax years are those that are open for examination by taxing authorities (i.e., generally the last four tax year ends and the interim tax period since then). Furthermore, management of the Fund is also not aware of any tax positions for which it is reasonably possible that the total amounts of unrecognized tax benefits will significantly change in the next twelve months.
Dividends and Distributions to Shareholders
Dividends from net investment income are declared monthly. Net realized capital gains and/or market discount from investment transactions, if any, are distributed to shareholders at least annually. Furthermore, capital gains are distributed only to the extent they exceed available capital loss carryforwards.
Distributions to shareholders of net investment income, net realized capital gains and/or market discount, if any, are recorded on the ex-dividend date. The amount and timing of distributions are determined in accordance with federal income tax regulations, which may differ from U.S. GAAP.
Derivative Financial Instruments
The Fund is authorized to invest in certain derivative instruments, including foreign currency forwards, futures, options and swap contracts. Although the Fund is authorized to invest in such derivative instruments, and may do so in the future, it did not make any such investments during the fiscal year ended March 31, 2012.
Zero Coupon Securities
The Fund is authorized to invest in zero coupon securities. A zero coupon security does not pay a regular interest coupon to its holders during the life of the security. Tax-exempt income to the holder of the security comes from accretion of the difference between the original purchase price of the security at issuance and the par value of the security at maturity and is effectively paid at maturity. The market prices of zero coupon securities generally are more volatile than the market prices of securities that pay interest periodically.
Custodian Fee Credit
The Fund has an arrangement with the custodian bank whereby certain custodian fees and expenses are reduced by net credits earned on the Fund’s cash on deposit with the bank. Such deposit arrangements are an alternative to overnight investments. Credits for cash balances may be offset by charges for any days on which the Fund overdraws its account at the custodian bank.
Indemnifications
Under the Fund’s organizational documents, its officers and trustees are indemnified against certain liabilities arising out of the performance of their duties to the Fund. In addition, in the normal course of business, the Fund enters into contracts that provide general indemnifications to other parties. The Fund’s maximum exposure under these arrangements is unknown as this would involve future claims that may be made against the Fund that have not yet occurred. However, the Fund has not had prior claims or losses pursuant to these contracts and expects the risk of loss to be remote.
| | | Notes to |
| | | Financial Statements (continued) |
Use of Estimates
The preparation of financial statements in conformity with U.S. GAAP requires management to make estimates and assumptions that affect the reported amounts of assets and liabilities at the date of the financial statements and the reported amounts of increases and decreases in net assets from operations during the reporting period. Actual results may differ from those estimates.
2. Fair Value Measurements
Fair value is defined as the price that the Fund would receive upon selling an investment or transferring a liability in an orderly transaction to an independent buyer in the principal or most advantageous market for the investment. A three-tier hierarchy is used to maximize the use of observable market data and minimize the use of unobservable inputs and to establish classification of fair value measurements for disclosure purposes.
Observable inputs reflect the assumptions market participants would use in pricing the asset or liability. Observable inputs are based on market data obtained from sources independent of the reporting entity. Unobservable inputs reflect the reporting entity’s own assumptions about the assumptions market participants would use in pricing the asset or liability. Unobservable inputs are based on the best information available in the circumstances. The three-tier hierarchy of inputs is summarized in the three broad levels listed below:
| | Level 1 – | Quoted prices in active markets for identical securities. |
| | Level 2 – | Other significant observable inputs (including quoted prices for similar securities, interest rates, prepayment speeds, credit risk, etc.). |
| | Level 3 – | Significant unobservable inputs (including management’s assumptions in determining the fair value of investments). |
The inputs or methodologies used for valuing securities are not an indication of the risk associated with investing in those securities. The following is a summary of the Fund’s fair value measurements as of March 31, 2012:
| | | | | | | | | | | | | | |
| | | Level 1 | | Level 2 | | Level 3 | | Total | |
| Long-Term Investments: | | | | | | | | | | | | | |
| Municipal Bonds | | $ | — | | $ | 124,077,011 | | $ | — | | $ | 124,077,011 | |
| Short-Term Investments: | | | | | | | | | | | | | |
| Municipal Bonds | | | — | | | 2,030,000 | | | — | | | 2,030,000 | |
| Total | | $ | — | | $ | 126,107,011 | | $ | — | | $ | 126,107,011 | |
During the fiscal year ended March 31, 2012, the Fund recognized no significant transfers to or from Level 1, Level 2 or Level 3.
3. Derivative Instruments and Hedging Activities
The Fund records derivative instruments at fair value, with changes in fair value recognized on the Statement of Operations, when applicable. Even though the Fund’s investments in derivatives may represent economic hedges, they are not considered to be hedge transactions for financial reporting purposes. The Fund did not invest in derivative instruments during the fiscal year ended March 31, 2012.
4. Fund Shares
Since the inception of the Fund’s repurchase program, the Fund has not repurchased any of its outstanding shares. Transactions in Fund shares were as follows:
| | | Year | | Year | |
| | | Ended | | Ended | |
| | | 3/31/12 | | 3/31/11 | |
Shares issued to shareholders due to reinvestment of distributions | | | 7,598 | | | 9,224 | |
5. Investment Transactions
Purchases and sales (including maturities but excluding short-term investments) during the fiscal year ended March 31, 2012, aggregated $21,463,201 and $25,354,778, respectively.
6. Income Tax Information
The following information is presented on an income tax basis. Differences between amounts for financial statement and federal income tax purposes are primarily due to timing differences in recognizing taxable market discount and timing differences in recognizing certain gains and losses on investment transactions. To the extent that differences arise that are permanent in nature, such amounts are reclassified within the capital accounts as detailed below. Temporary differences do not require reclassification. Temporary and permanent differences do not impact the net asset value of the Fund.
At March 31, 2012, the cost and unrealized appreciation (depreciation) of investments, as determined on a federal income tax basis, were as follows:
| | | | | |
| Cost of investments | | $ | 119,304,385 | |
| Gross unrealized: | | | | |
| Appreciation | | $ | 7,188,172 | |
| Depreciation | | | (385,546 | ) |
| Net unrealized appreciation (depreciation) of investments | | $ | 6,802,626 | |
Permanent differences, primarily due to federal taxes paid, taxable market discount and expiration of capital loss carryforwards, resulted in reclassifications among the Fund’s components of net assets at March 31, 2012, the Fund’s tax year end, as follows:
| | | | | |
| Paid-in-surplus | | $ | (8,518,117 | ) |
| Undistributed (Over-distribution of) net investment income | | | (15,196 | ) |
| Accumulated net realized gain (loss) | | | 8,533,313 | |
The tax components of undistributed net tax-exempt income, net ordinary income and net long-term capital gains at March 31, 2012, the Fund’s tax year end, were as follows:
| | | | | |
| Undistributed net tax-exempt income * | | $ | 399,525 | |
| Undistributed net ordinary income ** | | | 35,040 | |
| Undistributed net long-term capital gains | | | — | |
| * | Undistributed net tax-exempt income (on a tax basis) has not been reduced for the dividend declared on March 1, 2012, paid on April 1, 2012. |
| ** | Net ordinary income consists of taxable market discount income and net short-term capital gains, if any. |
The tax character of distributions paid during the Fund’s tax years ended March 31, 2012 and March 31, 2011, was designated for purposes of the dividends paid deduction as follows:
| | | | | |
| 2012 | | | | |
| Distributions from net tax-exempt income *** | | $ | 5,107,608 | |
| Distributions from net ordinary income ** | | | — | |
| Distributions from net long-term capital gains | | | — | |
| | | | | |
| 2011 | | | | |
| Distributions from net tax-exempt income | | $ | 5,216,904 | |
| Distributions from net ordinary income ** | | | — | |
| Distributions from net long-term capital gains | | | — | |
| ** | Net ordinary income consists of taxable market discount income and net short-term capital gains, if any. |
| *** | The Fund hereby designates this amount paid during the fiscal year ended March 31, 2012, as Exempt Interest Dividends. |
At March 31, 2012, the Fund’s tax year end, the Fund had unused capital loss carryforwards available for federal income tax purposes to be applied against future capital gains, if any. If not applied, the carryforwards will expire as follows:
| | | | | |
| Expiration: | | | | |
| March 31, 2013 | | $ | 4,977 | |
| March 31, 2014 | | | 14,448 | |
| March 31, 2015 | | | 11,084 | |
| March 31, 2016 | | | 44,763 | |
| March 31, 2017 | | | 148,403 | |
| Total | | $ | 223,675 | |
| | | Notes to |
| | | Financial Statements (continued) |
During the Fund’s tax year ended March 31, 2012, the Fund utilized $216,319 of its capital loss carryforwards. At March 31, 2012, the Fund’s tax year end, $8,521,480 of the Fund’s capital loss carryforwards expired.
On December 22, 2010, the Regulated Investment Company Modernization Act of 2010 (the “Act”) was enacted, which changed various technical rules governing the tax treatment of RICs. The changes are generally effective for taxable years beginning after the date of enactment. One of the more prominent changes addresses capital loss carryforwards. Under the Act, the Fund will be permitted to carry forward capital losses incurred in taxable years beginning after the date of enactment for an unlimited period. However, any losses incurred during those future taxable years will be required to be utilized prior to the losses incurred in pre-enactment taxable years, which carry an expiration date. As a result of this ordering rule, pre-enactment capital loss carryforwards may be more likely to expire unused. Additionally, post-enactment capital loss carryforwards will retain their character as either short-term or long-term capital losses rather than being considered all short-term as permitted under previous regulation.
The Act also contains several provisions aimed at preserving the character of distributions made by a fiscal year RIC during the portion of its taxable year ending after October 31 or December 31, reducing the circumstances under which a RIC might be required to file amended Forms 1099 to restate previously reported distributions.
During the Fund’s tax year ended March 31, 2012, there were no post-enactment capital losses generated.
The Fund has elected to defer losses incurred from November 1, 2011 through March 31, 2012, the Fund’s tax year end, in accordance with federal income tax rules. These losses are treated as having arisen on the first day of the following fiscal year. The Fund has elected to defer losses as follows:
| | | | | |
| Post-October capital losses | | $ | 601,582 | |
| Late-year ordinary losses | | | — | |
7. Management Fees and Other Transactions with Affiliates
The Fund’s management fee consists of two components – a fund-level fee, based only on the amount of assets within the Fund, and a complex-level fee, based on the aggregate amount of all eligible fund assets managed by the Adviser. This pricing structure enables Fund shareholders to benefit from growth in the assets within the Fund as well as from growth in the amount of complex-wide assets managed by the Adviser.
The annual fund-level fee, payable monthly, is calculated according to the following schedule:
| | | | | |
| Average Daily Net Assets* | | | Fund-Level Fee Rate |
| For the first $125 million | | | .3000 | % |
| For the next $125 million | | | .2875 | |
| For the next $250 million | | | .2750 | |
| For the next $500 million | | | .2625 | |
| For the next $1 billion | | | .2500 | |
| For net assets over $2 billion | | | .2375 | |
The annual complex-level fee, payable monthly, is calculated according to the following schedule:
| | | | | |
| Complex-Level Managed Asset Breakpoint Level* | | | Effective Rate at Breakpoint Level |
| $55 billion | | | .2000 | % |
| $56 billion | | | .1996 | |
| $57 billion | | | .1989 | |
| $60 billion | | | .1961 | |
| $63 billion | | | .1931 | |
| $66 billion | | | .1900 | |
| $71 billion | | | .1851 | |
| $76 billion | | | .1806 | |
| $80 billion | | | .1773 | |
| $91 billion | | | .1691 | |
| $125 billion | | | .1599 | |
| $200 billion | | | .1505 | |
| $250 billion | | | .1469 | |
| $300 billion | | | .1445 | |
| * | For the fund-level and complex-level fees, managed assets include closed-end fund assets managed by the Adviser that are attributable to financial leverage. For these purposes, financial leverage includes the funds’ use of preferred stock and borrowings and certain investments in the residual interest certificates (also called inverse floating rate securities) in tender option bond (TOB) trusts, including the portion of assets held by a TOB trust that has been effectively financed by the trust’s issuance of floating rate securities, subject to an agreement by the Adviser as to certain funds to limit the amount of such assets for determining managed assets in certain circumstances. The complex-level fee is calculated based upon the aggregate daily managed assets of all Nuveen Funds that constitute “eligible assets.” Eligible assets do not include assets attributable to investments in other Nuveen Funds or assets in excess of $2 billion added to the Nuveen Fund complex in connection with the Adviser’s assumption of the management of the former First American Funds effective January 1, 2011. As of March 31, 2012, the complex-level fee rate for the Fund was .1735%. |
The management fee compensates the Adviser for the overall investment advisory and administrative services and general office facilities. The Adviser is responsible for the Fund’s overall strategy and asset allocation decisions. The Adviser has entered into a sub-advisory agreement with the Sub-Adviser under which the Sub-Adviser manages the investment portfolio of the Fund. The Sub-Adviser is compensated for its services to the Fund from the management fees paid to the Adviser.
The Fund pays no compensation directly to those of its trustees who are affiliated with the Adviser or to its officers, all of whom receive remuneration for their services to the Fund from the Adviser or its affiliates. The Board of Trustees has adopted a deferred compensation plan for independent trustees that enables trustees to elect to defer receipt of all or a portion of the annual compensation they are entitled to receive from certain Nuveen-advised funds. Under the plan, deferred amounts are treated as though equal dollar amounts had been invested in shares of select Nuveen-advised funds.
8. New Accounting Pronouncements
Fair Value Measurements and Disclosures
On May 12, 2011, the Financial Accounting Standards Board (“FASB”) issued Accounting Standards Update (“ASU”) No. 2011-04 (“ASU No. 2011-04”) modifying Topic 820, Fair Value Measurements and Disclosures. At the same time, the International Accounting Standards Board (“IASB”) issued International Financial Reporting Standard (“IFRS”) 13, Fair Value Measurement. The objective of the FASB and IASB is convergence of their guidance on fair value measurements and disclosures. Specifically, ASU No. 2011-04 requires reporting entities to disclose i) the amounts of any transfers between Level 1 and Level 2 and the reasons for the transfers and ii) for Level 3 fair value measurements, a) quantitative information about significant unobservable inputs used, b) a description of the valuation processes used by the reporting entity and c) a narrative description of the sensitivity of the fair value measurement to changes in unobservable inputs if a change in those inputs might result in a significantly higher or lower fair value measurement. The effective date of ASU No. 2011-04 is for interim and annual periods beginning after December 15, 2011. At this time, management is evaluating the implications of this guidance and the impact it will have to the financial statement amounts and footnote disclosures, if any.
| Board Members & Officers (Unaudited) |
| | | |
| | | The management of the Funds, including general supervision of the duties performed for the Funds by the Adviser, is the responsibility of the board members of the Funds. The number of board members of the Funds is currently set at ten. None of the board members who are not “interested” persons of the Funds (referred to herein as “independent board members”) has ever been a director or employee of, or consultant to, Nuveen or its affiliates. The names and business addresses of the board members and officers of the Funds, their principal occupations and other affiliations during the past five years, the number of portfolios each oversees and other directorships they hold are set forth below. |
| | Name, | | Position(s) Held | | Year First | | Principal | | Number |
| | Birthdate | | with the Funds | | Elected or | | Occupation(s) | | of Portfolios |
| | & Address | | | | Appointed | | including other | | in Fund Complex |
| | | | | | and Term(1) | | Directorships | | Overseen by |
| | | | | | | | During Past 5 Years | | Board Member |
| | | | | | | | | | |
| Independent Board Members: | | | | | | |
| | | | | | | |
| ■ | ROBERT P. BREMNER 8/22/40 333 W. Wacker Drive Chicago, IL 60606 | | Chairman of the Board and Board Member | | 1996 Class III | | Private Investor and Management Consultant; Treasurer and Director, Humanities Council of Washington, D.C.; Board Member, Independent Directors Council affiliated with the Investment Company Institute. | | 231 |
| | | | | | | | | | |
| ■ | JACK B. EVANS 10/22/48 333 W. Wacker Drive Chicago, IL 60606 | | Board Member | | 1999 Class III | | President, The Hall-Perrine Foundation, a private philanthropic corporation (since 1996); Director and Chairman, United Fire Group, a publicly held company; member of the Board of Regents for the State of Iowa University System; Director, Source Media Group; Life Trustee of Coe College and the Iowa College Foundation; formerly, Director, Alliant Energy; formerly, Director, Federal Reserve Bank of Chicago; formerly, President and Chief Operating Officer, SCI Financial Group, Inc., a regional financial services firm. | | 231 |
| | | | | | | | | | |
| ■ | WILLIAM C. HUNTER 3/6/48 333 W. Wacker Drive Chicago, IL 60606 | | Board Member | | 2004 Class I | | Dean, Tippie College of Business, University of Iowa (since 2006); Director (since 2004) of Xerox Corporation; Director (since 2005), Beta Gamma Sigma International Honor Society; Director of Wellmark, Inc. (since 2009); formerly, Dean and Distinguished Professor of Finance, School of Business at the University of Connecticut (2003-2006); previously, Senior Vice President and Director of Research at the Federal Reserve Bank of Chicago (1995-2003); formerly, Director (1997-2007), Credit Research Center at Georgetown University. | | 231 |
| | | | | | | | | | |
| ■ | DAVID J. KUNDERT 10/28/42 333 W. Wacker Drive Chicago, IL 60606 | | Board Member | | 2005 Class II | | Director, Northwestern Mutual Wealth Management Company; retired (since 2004) as Chairman, JPMorgan Fleming Asset Management, President and CEO, Banc One Investment Advisors Corporation, and President, One Group Mutual Funds; prior thereto, Executive Vice President, Banc One Corporation and Chairman and CEO, Banc One Investment Management Group; Member, Board of Regents, Luther College; member of the Wisconsin Bar Association; member of Board of Directors, Friends of Boerner Botanical Gardens; member of Board of Directors and Chair of Investment Committee, Greater Milwaukee Foundation. | | 231 |
| | | | | | | | | | |
■ | WILLIAM J. SCHNEIDER 9/24/44 333 W. Wacker Drive Chicago, IL 60606 | | Board Member | | 1996 Class III | | Chairman of Miller-Valentine Partners Ltd., a real estate investment company; formerly, Senior Partner and Chief Operating Officer(retired 2004) of Miller-Valentine Group; member, University of Dayton Business School Advisory Council;member, Mid-America Health System Board; formerly, member and chair, Dayton Philharmonic Orchestra Association; formerly, member, Business Advisory Council, Cleveland Federal Reserve Bank. | | 231 |
| | Name, | | Position(s) Held | | Year First | | Principal | | Number |
| | Birthdate | | with the Funds | | Elected or | | Occupation(s) | | of Portfolios |
| | & Address | | | | Appointed | | Including other | | in Fund Complex |
| | | | | | and Term(1) | | Directorships | | Overseen by |
| | | | | | | | During Past 5 Years | | Board Member |
| | | | | | | | | | |
| Independent Board Members: | | | | | | |
| | | | | | | |
| ■ | JUDITH M. STOCKDALE 12/29/47 333 W. Wacker Drive Chicago, IL 60606 | | Board Member | | 1997 Class I | | Executive Director, Gaylord and Dorothy Donnelley Foundation (since 1994); prior thereto, Executive Director, Great Lakes Protection Fund (1990-1994). | | 231 |
| | | | | | | | | | |
| ■ | CAROLE E. STONE 6/28/47 333 W. Wacker Drive Chicago, IL 60606 | | Board Member | | 2007 Class I | | Director, Chicago Board Options Exchange (since 2006); Director, C2 Options Exchange, Incorporated (since 2009); formerly, Commissioner, New York State Commission on Public Authority Reform (2005-2010); formerly, Chair, New York Racing Association Oversight Board (2005-2007). | | 231 |
| | | | | | | | | | |
| ■ | VIRGINIA L. STRINGER 8/16/44 333 W. Wacker Drive Chicago, IL 60606 | | Board Member | | 2011 | | Board Member, Mutual Fund Directors Forum; former governance consultant and non-profit board member; former Owner and President, Strategic Management Resources, Inc. a management consulting firm; former Member, Governing Board, Investment Company Institute’s Independent Directors Council; previously, held several executive positions in general management, marketing and human resources at IBM and The Pillsbury Company; Independent Director, First American Fund Complex (1987-2010) and Chair (1997-2010). | | 231 |
| | | | | | | | | | |
| ■ | TERENCE J. TOTH 9/29/59 333 W. Wacker Drive Chicago, IL 60606 | | Board Member | | 2008 Class II | | Director, Legal & General Investment Management America, Inc. (since 2008); Managing Partner, Promus Capital (since 2008); formerly, CEO and President, Northern Trust Global Investments (2004-2007); Executive Vice President, Quantitative Management & Securities Lending (2000-2004); prior thereto, various positions with Northern Trust Company (since 1994); member: Goodman Theatre Board (since 2004), Chicago Fellowship Board (since 2005), Catalyst Schools of Chicago Board (since 2008) and Mather Foundation Board (since 2012), and a member of its investment committee; formerly,Member, Northern Trust Mutual Funds Board(2005-2007), Northern Trust Global Investments Board (2004-2007), Northern Trust Japan Board (2004-2007), Northern Trust Securities Inc. Board (2003-2007) and Northern Trust Hong Kong Board (1997-2004). | | 231 |
| | | | | | | | | | |
| Interested Board Member: | | | | | | |
| | | | | | | |
| ■ | JOHN P. AMBOIAN(2) 6/14/61 333 W. Wacker Drive Chicago, IL 60606 | | Board Member | | 2008 Class II | | Chief Executive Officer and Chairman (since 2007) and Director (since 1999) of Nuveen Investments, Inc., formerly, President (1999-2007); Chief Executive Officer (since 2007) of Nuveen Investments Advisers, Inc.; Director (since 1998) formerly, Chief Executive Officer (2007-2010) of Nuveen Fund Advisors, Inc. | | 231 |
Board Members & Officers (Unaudited) (continued)
| | Name, | | Position(s) Held | | Year First | | Principal | | Number |
| | Birthdate | | with the Funds | | Elected or | | Occupation(s) | | of Portfolios |
| | and Address | | | | Appointed(3) | | During Past 5 Years | | in Fund Complex |
| | | | | | | | | | Overseen |
| | | | | | | | | | by Officer |
| | | | | | | | | | |
| Officers of the Funds: | | | | | | | | |
| | | | | | | | | |
| ■ | GIFFORD R. ZIMMERMAN 9/9/56 333 W. Wacker Drive Chicago, IL 60606 | | Chief Administrative Officer | | 1988 | | Managing Director (since 2002), and Assistant Secretary of Nuveen Securities, LLC; Managing Director (since 2004) and Assistant Secretary (since 1994) of Nuveen Investments, Inc.; Managing Director (since 2002), Assistant Secretary (since 1997) and Co-General Counsel (since 2011) of Nuveen Fund Advisors, Inc.; Managing Director, Assistant Secretary and Associate General Counsel of Nuveen Asset Management, LLC (since 2011); Managing Director, Associate General Counsel and Assistant Secretary, of Symphony Asset Management LLC (since 2003); Vice President and Assistant Secretary of NWQ Investment Management Company, LLC (since 2002), Nuveen Investments Advisers Inc. (since 2002), Santa Barbara Asset Management, LLC (since 2006), and of Winslow Capital Management Inc. (since 2010); Chief Administrative Officer and Chief Compliance Officer (since 2006) of Nuveen Commodities Asset Management, LLC; Chartered Financial Analyst. | | 231 |
| | | | | | | | | | |
| ■ | WILLIAM ADAMS IV 6/9/55 333 W. Wacker Drive Chicago, IL 60606 | | Vice President | | 2007 | | Senior Executive Vice President, Global Structured Products (since 2010), formerly, Executive Vice President (1999-2010) of Nuveen Securities, LLC; Co-President of Nuveen Fund Advisors, Inc. (since 2011); President (since 2011), formerly, Managing Director (2010-2011) of Nuveen Commodities Asset Management, LLC. | | 131 |
| | | | | | | | | | |
| ■ | CEDRIC H. ANTOSIEWICZ 1/11/62 333 W. Wacker Drive Chicago, IL 60606 | | Vice President | | 2007 | | Managing Director of Nuveen Securities, LLC. | | 131 |
| | | | | | | | | | |
| ■ | MARGO L. COOK 4/11/64 333 W. Wacker Drive Chicago, IL 60606 | | Vice President | | 2009 | | Executive Vice President (since 2008) of Nuveen Investments, Inc. and of Nuveen Fund Advisors, Inc. (since 2011); Managing Director-Investment Services of Nuveen Commodities Asset Management, LLC (since August 2011), previously, Head of Institutional Asset Management (2007-2008) of Bear Stearns Asset Management; Head of Institutional Asset Management (1986-2007) of Bank of NY Mellon; Chartered Financial Analyst. | | 231 |
| | | | | | | | | | |
| ■ | LORNA C. FERGUSON 10/24/45 333 W. Wacker Drive Chicago, IL 60606 | | Vice President | | 1998 | | Managing Director (since 2005) of Nuveen Fund Advisors, Inc. and Nuveen Securities, LLC (since 2004). | | 231 |
| | | | | | | | | | |
| ■ | STEPHEN D. FOY 5/31/54 333 W. Wacker Drive Chicago, IL 60606 | | Vice President and Controller | | 1998 | | Senior Vice President (since 2010), formerly, Vice President (2005-2010) and Funds Controller of Nuveen Securities, LLC; Vice President of Nuveen Fund Advisors, Inc.; Chief Financial Officer of Nuveen Commodities Asset Management, LLC (since 2010); Certified Public Accountant. | | 231 |
| | Name, | | Position(s) Held | | Year First | | Principal | | Number |
| | Birthdate | | with the Funds | | Elected or | | Occupation(s) | | of Portfolios |
| | and Address | | | | Appointed(3) | | During Past 5 Years | | in Fund Complex |
| | | | | | | | | | Overseen |
| | | | | | | | | | by Officer |
| | | | | | | | | | |
| Officers of the Funds: | | | | | | | | |
| | | | | | | | | | |
| ■ | SCOTT S. GRACE 8/20/70 333 W. Wacker Drive Chicago, IL 60606 | | Vice President and Treasurer | | 2009 | | Managing Director, Corporate Finance & Development, Treasurer (since 2009) of Nuveen Securities, LLC; Managing Director and Treasurer (since 2009) of Nuveen Fund Advisors, Inc., Nuveen Investments Advisers, Inc., Nuveen Investments Holdings Inc. and (since 2011) Nuveen Asset Management, LLC; Vice President and Treasurer of NWQ Investment Management Company, LLC, Tradewinds Global Investors, LLC, Symphony Asset Management LLC and Winslow Capital Management, Inc.; Vice President of Santa Barbara Asset Management, LLC; formerly, Treasurer (2006-2009), Senior Vice President (2008-2009), previously, Vice President (2006-2008) of Janus Capital Group, Inc.; formerly, Senior Associate in Morgan Stanley’s Global Financial Services Group (2000-2003); Chartered Accountant Designation. | | 231 |
| | | | | | | | | | |
| ■ | WALTER M. KELLY 2/24/70 333 W. Wacker Drive Chicago, IL 60606 | | Chief Compliance Officer and Vice President | | 2003 | | Senior Vice President (since 2008) and Assistant Secretary (since 2003) of Nuveen Fund Advisors, Inc. | | 231 |
| | | | | | | | | | |
| ■ | TINA M. LAZAR 8/27/61 333 W. Wacker Drive Chicago, IL 60606 | | Vice President | | 2002 | | Senior Vice President (since 2010), formerly, Vice President (2005-2010) of Nuveen Fund Advisors, Inc. | | 231 |
| | | | | | | | | | |
| ■ | KEVIN J. MCCARTHY 3/26/66 333 W. Wacker Drive Chicago, IL 60606 | | Vice President and Secretary | | 2007 | | Managing Director and Assistant Secretary (since 2008), formerly, Vice President (2007-2008), Nuveen Securities, LLC; Managing Director (since 2008), Assistant Secretary (since 2007) and Co-General Counsel (since 2011) of Nuveen Fund Advisors, Inc.; Managing Director, Assistant Secretary and Associate General Counsel (since 2011) of Nuveen Asset Management, LLC; Managing Director (since 2008), and Assistant Secretary, Nuveen Investment Holdings, Inc.; Vice President (since 2007) and Assistant Secretary of Nuveen Investments Advisers Inc., NWQ Investment Management Company, LLC, NWQ Holdings, LLC, Symphony Asset Management LLC, Santa Barbara Asset Management, LLC, and of Winslow Capital Management, Inc. (since 2010); Vice President and Secretary (since 2010) of Nuveen Commodities Asset Management, LLC; prior thereto, Partner, Bell, Boyd & Lloyd LLP (1997-2007). | | 231 |
Board Members & Officers (Unaudited) (continued)
| | Name, | | Position(s) Held | | Year First | | Principal | | Number |
| | Birthdate | | with the Funds | | Elected or | | Occupation(s) | | of Portfolios |
| | and Address | | | | Appointed(3) | | During Past 5 Years | | in Fund Complex |
| | | | | | | | | | Overseen |
| | | | | | | | | | by Officer |
| | | | | | | | | | |
| Officers of the Funds: | | | | | | | | |
| | | | | | | | | |
| ■ | KATHLEEN L. PRUDHOMME 3/30/53 901 Marquette Avenue Minneapolis, MN 55402 | | Vice President and Assistant Secretary | | 2011 | | Managing Director, Assistant Secretary and Co-General Counsel (since 2011) of Nuveen Fund Advisors, Inc.; Managing Director, Assistant Secretary and Associate General Counsel (since 2011) of Nuveen Asset Management, LLC; Managing Director and Assistant Secretary (since 2011) of Nuveen Securities, LLC; formerly, Deputy General Counsel, FAF Advisors, Inc. (2004-2010). | | 231 |
| (1) | Board Members serve three year terms. The Board of Trustees is divided into three classes, Class I, Class II, Class III, with each being elected to serve until the third succeeding annual shareholders’ meeting subsequent to its election or thereafter in each case when its respective successors are duly elected or appointed. The first year elected or appointed represents the year in which the board member was first elected or appointed to any fund in the Nuveen Complex. |
| (2) | Mr. Amboian is an interested trustee because of his position with Nuveen Investments, Inc. and certain of its subsidiaries, which are affiliates of the Nuveen Funds. |
| (3) | Officers serve one year terms through August of each year. The year first elected or appointed represents the year in which the Officer was first elected or appointed to any fund in the Nuveen Complex. |
Reinvest Automatically,
Easily and Conveniently
Nuveen makes reinvesting easy. A phone call is all it takes to set up your reinvestment account.
Nuveen Closed-End Funds Automatic Reinvestment Plan
Your Nuveen Closed-End Fund allows you to conveniently reinvest distributions in additional Fund shares.
By choosing to reinvest, you’ll be able to invest money regularly and automatically, and watch your investment grow through the power of compounding. Just like distributions in cash, there may be times when income or capital gains taxes may be payable on distributions that are reinvested.
It is important to note that an automatic reinvestment plan does not ensure a profit, nor does it protect you against loss in a declining market.
Easy and convenient
To make recordkeeping easy and convenient, each month you’ll receive a statement showing your total distributions, the date of investment, the shares acquired and the price per share, and the total number of shares you own.
How shares are purchased
The shares you acquire by reinvesting will either be purchased on the open market or newly issued by the Fund. If the shares are trading at or above net asset value at the time of valuation, the Fund will issue new shares at the greater of the net asset value or 95% of the then-current market price. If the shares are trading at less than net asset value, shares for your account will be purchased on the open market. If the Plan Agent begins purchasing Fund shares on the open market while shares are trading below net asset value, but the Fund’s shares subsequently trade at or above their net asset value before the Plan Agent is able to complete its purchases, the Plan Agent may cease open-market purchases and may invest the uninvested portion of the distribution in newly-issued Fund shares at a price equal to the greater of the shares’ net asset value or 95% of the shares’ market value on the last business day immediately prior to the purchase date. Distributions received to purchase shares in the open market will normally be invested shortly after the distribution payment date. No interest will be paid on distributions awaiting reinvestment. Because the market price of the shares may increase before purchases are completed, the average purchase price per share may
Reinvest Automatically,
Easily and Conveniently (continued)
exceed the market price at the time of valuation, resulting in the acquisition of fewer shares than if the distribution had been paid in shares issued by the Fund. A pro rata portion of any applicable brokerage commissions on open market purchases will be paid by Plan participants. These commissions usually will be lower than those charged on individual transactions.
Flexible
You may change your distribution option or withdraw from the Plan at any time, should your needs or situation change.
You can reinvest whether your shares are registered in your name, or in the name of a brokerage firm, bank, or other nominee. Ask your investment advisor if his or her firm will participate on your behalf. Participants whose shares are registered in the name of one firm may not be able to transfer the shares to another firm and continue to participate in the Plan.
The Fund reserves the right to amend or terminate the Plan at any time. Although the Fund reserves the right to amend the Plan to include a service charge payable by the participants, there is no direct service charge to participants in the Plan at this time.
Call today to start reinvesting distributions
For more information on the Nuveen Automatic Reinvestment Plan or to enroll in or withdraw from the Plan, speak with your financial advisor or call us at (800) 257-8787.
Glossary of Terms
Used in this Report
| | |
| ■ | Auction Rate Bond: An auction rate bond is a security whose interest payments are adjusted periodically through an auction process, which process typically also serves as a means for buying and selling the bond. Auctions that fail to attract enough buyers for all the shares offered for sale are deemed to have “failed,” with current holders receiving a formula-based interest rate until the next scheduled auction. |
| | |
| ■ | Average Annual Total Return: This is a commonly used method to express an investment’s performance over a particular, usually multi-year time period. It expresses the return that would have been necessary each year to equal the investment’s actual cumulative performance (including change in NAV or market price and reinvested dividends and capital gains distributions, if any) over the time period being considered. |
| | |
| ■ | Average Effective Maturity: The market-value-weighted average of the effective maturity dates of the individual securities including cash. In the case of a bond that has been advance-refunded to a call date, the effective maturity is the date on which the bond is scheduled to be redeemed using the proceeds of an escrow account. In most other cases the effective maturity is the stated maturity date of the security. |
| | |
| ■ | Market Yield (also known as Dividend Yield or Current Yield): An investment’s current annualized dividend divided by its current market price. |
| | |
| ■ | Net Asset Value (NAV): The net market value of all securities held in a portfolio. |
| | |
| ■ | Net Asset Value (NAV) Per Share: The market value of one share of a mutual fund or closed-end fund. For a Fund, the NAV is calculated daily by taking the Fund’s total assets (securities, cash, and accrued earnings), subtracting the Fund’s liabilities, and dividing by the number of shares outstanding. |
| | |
| ■ | Pre-Refunding: Pre-Refunding, also known as advanced refundings or refinancings, is a procedure used by state and local governments to refinance municipal bonds to lower interest expenses. The issuer sells new bonds with a lower yield and uses the proceeds to buy U.S. Treasury securities, the interest from which is used to make payments on the higher-yielding bonds. Because of this collateral, pre-refunding generally raises a bond’s credit rating and thus its value. |
| | |
| ■ | Standard & Poor’s (S&P) Intermediate Municipal Bond Index: An unleveraged, market value-weighted index containing all of the bonds in the S&P National Municipal Bond Index with maturity dates between 3 and 14.999 years. Index returns assume reinvestment of distributions, but do not reflect any applicable sales charges or management fees. It is not possible to invest directly in an index. |
| | |
| ■ | Standard & Poor’s (S&P) National Municipal Bond Index: is an unleveraged, market value-weighted index designed to measure the performance of the tax-exempt, investment-grade U.S. municipal bond market. Index returns assume reinvestment of |
Glossary of Terms
Used in this Report (continued)
| | distributions, but do not reflect any applicable sales charges or management fees. It is not possible to invest directly in an index. |
| | |
■ | Taxable-Equivalent Yield: The yield necessary from a fully taxable investment to equal, on an after-tax basis, the yield of a municipal bond investment. |
| | |
| ■ | Zero Coupon Bond: A zero coupon bond does not pay a regular interest coupon to its holders during the life of the bond. Tax-exempt income to the holder of the bond comes from accretion of the difference between the original purchase price of the bond at issuance and the par value of the bond at maturity and is effectively paid at maturity. The market prices of zero coupon bonds generally are more volatile than the market prices of bonds that pay interest periodically. |
Additional Fund Information
Board of Trustees
John P. Amboian
Robert P. Bremner
Jack B. Evans
William C. Hunter
David J. Kundert
William J. Schneider
Judith M. Stockdale
Carole E. Stone
Virginia L. Stringer
Terence J. Toth
Fund Manager
Nuveen Fund Advisors, Inc.
333 West Wacker Drive
Chicago, IL 60606
Custodian
State Street Bank
& Trust Company
Boston, MA
Transfer Agent and
Shareholder Services
State Street Bank
& Trust Company
Nuveen Funds
P.O. Box 43071
Providence, RI 02940-3071
(800) 257-8787
Legal Counsel
Chapman and Cutler LLP
Chicago, IL
Independent Registered
Public Accounting Firm
Ernst & Young LLP
Chicago, IL
Quarterly Portfolio of Investments and Proxy Voting Information
You may obtain (i) the Fund’s quarterly portfolio of investments, (ii) information regarding how the Fund voted proxies relating to portfolio securities held during the most recent twelve-month period ended June 30, and (iii) a description of the policies and procedures that the Fund used to determine how to vote proxies relating to portfolio securities without charge, upon request, by calling Nuveen Investments toll-free at (800) 257-8787 or on Nuveen’s website at www.nuveen.com.
You may also obtain this and other Fund information directly from the Securities and Exchange Commission (SEC). The SEC may charge a copying fee for this information. Visit the SEC on-line at http://www.sec.gov or in person at the SEC’s Public Reference Room in Washington, D.C. Call the SEC at (202) 942-8090 for room hours and operation. You may also request Fund information by sending an e-mail request to publicinfo@sec.gov or by writing to the SEC’s Public References Section at 100 F Street NE, Washington, D.C. 20549.
CEO Certification Disclosure
The Fund’s Chief Executive Officer has submitted to the New York Stock Exchange (NYSE) the annual CEO certification as required by Section 303A.12(a) of the NYSE Listed Company Manual. The Fund has filed with the SEC the certification of its Chief Executive Officer and Chief Financial Officer required by Section 302 of the Sarbanes-Oxley Act.
Share Information
The Fund intends to repurchase shares of its own common stock in the future at such times and in such amounts as is deemed advisable. During the period covered by this report, the Fund did not repurchase any of its common shares.
Any future repurchases will be reported to shareholders in the next annual or semi-annual report.
Nuveen Investments:
Serving Investors for Generations
Since 1898, financial advisors and their clients have relied on Nuveen Investments to provide dependable investment solutions through continued adherence to proven, long-term investing principles. Today, we offer a range of high quality equity and fixed-income solutions designed to be integral components of a well-diversified core portfolio.
Focused on meeting investor needs.
Nuveen Investments provides high-quality investment services designed to help secure the long-term goals of institutional and individual investors as well as the consultants and financial advisors who serve them. Nuveen Investments markets a wide range of specialized investment solutions which provide investors access to capabilities of its high-quality boutique investment affiliates - Nuveen Asset Management, Symphony Asset Management, NWQ Investment Management Company, Santa Barbara Asset Management, Tradewinds Global Investors, Winslow Capital Management and Gresham Investment Management. In total, Nuveen Investments managed approximately $227 billion as of March 31, 2012.
Find out how we can help you.
To learn more about how the products and services of Nuveen Investments may be able to help you meet your financial goals, talk to your financial advisor, or call us at (800) 257-8787. Please read the information provided carefully before you invest. Investors should consider the investment objective and policies, risk considerations, charges and expenses of any investment carefully. Where applicable, be sure to obtain a prospectus, which contains this and other relevant information. To obtain a prospectus, please contact your securities representative or Nuveen Investments, 333 W. Wacker Dr., Chicago, IL 60606. Please read the prospectus carefully before you invest or send money.
Learn more about Nuveen Funds at: www.nuveen.com/cef
Distributed by
Nuveen Securities, LLC
333 West Wacker Drive
Chicago, IL 60606
www.nuveen.com
EAN-A-0312D
ITEM 2. CODE OF ETHICS.
As of the end of the period covered by this report, the registrant has adopted a code of ethics that applies to the registrant's principal executive officer, principal financial officer, principal accounting officer or controller, or persons performing similar functions. There were no amendments to or waivers from the Code during the period covered by this report. The registrant has posted the code of ethics on its website at www.nuveen.com/CEF/Shareholder. (To view the code, click on Fund Governance and then click on Code of Conduct.)
ITEM 3. AUDIT COMMITTEE FINANCIAL EXPERT.
The registrant's Board of Directors or Trustees (“Board”) determined that the registrant has at least one “audit committee financial expert” (as defined in Item 3 of Form N-CSR) serving on its Audit Committee. The registrant's audit committee financial expert is Carole E. Stone, who is “independent” for purposes of Item 3 of Form N-CSR.
Ms. Stone served for five years as Director of the New York State Division of the Budget. As part of her role as Director, Ms. Stone was actively involved in overseeing the development of the State's operating, local assistance and capital budgets, its financial plan and related documents; overseeing the development of the State's bond-related disclosure documents and certifying that they fairly presented the State's financial position; reviewing audits of various State and local agencies and programs; and coordinating the State's system of internal audit and control. Prior to serving as Director, Ms. Stone worked as a budget analyst/examiner with increasing levels of responsibility over a 30 year period, including approximately five years as Deputy Budget Director. Ms. Stone has also served as Chair of the New York State Racing Association Oversight Board, as Chair of the Public Authorities Control Board, as a Commissioner on the New York State Commission on Public Authority Reform and as a member of the Boards of Directors of several New York State public authorities. These positions have involved overseeing operations and finances of certain entities and assessing the adequacy of project/entity financing and financial reporting. Currently, Ms. Stone is on the Board of Directors of CBOE Holdings, Inc., of the Chicago Board Options Exchange, and of C2 Options Exchange. Ms. Stone's position on the boards of these entities and as a member of both CBOE Holdings' Audit Committee and its Finance Committee has involved, among other things, the oversight of audits, audit plans and preparation of financial statements.
ITEM 4. PRINCIPAL ACCOUNTANT FEES AND SERVICES.
The following tables show the amount of fees that Ernst & Young LLP, the Fund's auditor, billed to the Fund during the Fund's last two full fiscal years. For engagements with Ernst & Young LLP the Audit Committee approved in advance all audit services and non-audit services that Ernst & Young LLP provided to the Fund, except for those non-audit services that were subject to the pre-approval exception under Rule 2-01 of Regulation S-X (the “pre-approval exception”). The pre-approval exception for services provided directly to the Fund waives the pre-approval requirement for services other than audit, review or attest services if: (A) the aggregate amount of all such services provided constitutes no more than 5% of the total amount of revenues paid by the Fund to its accountant during the fiscal year in which the services are provided; (B) the Fund did not recognize the services as non-audit services at the time of the engagement; and (C) the services are promptly brought to the Audit Committee's attention, and the Committee (or its delegate) approves the services before the audit is completed.
The Audit Committee has delegated certain pre-approval responsibilities to its Chairman (or, in his absence, any other member of the Audit Committee).
SERVICES THAT THE FUND'S AUDITOR BILLED TO THE ADVISER AND AFFILIATED FUND SERVICE PROVIDERS
The tables also show the percentage of fees subject to the pre-approval exception. The pre-approval exception for services provided to the Adviser and any Affiliated Fund Service Provider (other than audit, review or attest services) waives the pre-approval requirement if: (A) the aggregate amount of all such services provided constitutes no more than 5% of the total amount of revenues paid to Ernst & Young LLP by the Fund, the Adviser and Affiliated Fund Service Providers during the fiscal year in which the services are provided that would have to be pre-approved by the Audit Committee; (B) the Fund did not recognize the services as non-audit services at the time of the engagement; and (C) the services are promptly brought to the Audit Committee's attention, and the Committee (or its delegate) approves the services before the Fund's audit is completed.
The following table shows the amount of fees that Ernst & Young LLP billed during the Fund's last two full fiscal years for non-audit services. The Audit Committee is required to pre-approve non-audit services that Ernst & Young LLP provides to the Adviser and any Affiliated Fund Services Provider, if the engagement related directly to the Fund's operations and financial reporting (except for those subject to the pre-approval exception described above). The Audit Committee requested and received information from Ernst & Young LLP about any non-audit services that Ernst & Young LLP rendered during the Fund's last fiscal year to the Adviser and any Affiliated Fund Service Provider. The Committee considered this information in evaluating Ernst & Young LLP's independence.
Audit Committee Pre-Approval Policies and Procedures. Generally, the Audit Committee must approve (i) all non-audit services to be performed for the Fund by the Fund's independent accountants and (ii) all audit and non-audit services to be performed by the Fund's independent accountants for the Affiliated Fund Service Providers with respect to operations and financial reporting of the Fund. Regarding tax and research projects conducted by the independent accountants for the Fund and Affiliated Fund Service Providers (with respect to operations and financial reports of the Fund) such engagements will be (i) pre-approved by the Audit Committee if they are expected to be for amounts greater than $10,000; (ii) reported to the Audit Committee chairman for his verbal approval prior to engagement if they are expected to be for amounts under $10,000 but greater than $5,000; and (iii) reported to the Audit Committee at the next Audit Committee meeting if they are expected to be for an amount under $5,000.
ITEM 5. AUDIT COMMITTEE OF LISTED REGISTRANTS.
ITEM 6. SCHEDULE OF INVESTMENTS.
a) See Portfolio of Investments in Item 1.
b) Not applicable.
ITEM 7. DISCLOSURE OF PROXY VOTING POLICIES AND PROCEDURES FOR CLOSED-END MANAGEMENT INVESTMENT COMPANIES.
ITEM 9. PURCHASES OF EQUITY SECURITIES BY CLOSED-END MANAGEMENT INVESTMENT COMPANY AND AFFILIATED PURCHASERS.
Not applicable.
ITEM 10. SUBMISSION OF MATTERS TO A VOTE OF SECURITY HOLDERS.
There have been no material changes to the procedures by which shareholders may recommend nominees to the registrant's Board implemented after the registrant last provided disclosure in response to this item.
ITEM 11. CONTROLS AND PROCEDURES.
ITEM 12. EXHIBITS.
File the exhibits listed below as part of this Form. Letter or number the exhibits in the sequence indicated.
Pursuant to the requirements of the Securities Exchange Act of 1934 and the Investment Company Act of 1940, the registrant has duly caused this report to be signed on its behalf by the undersigned, thereunto duly authorized.
Kevin J. McCarthy
Pursuant to the requirements of the Securities Exchange Act of 1934 and the Investment Company Act of 1940, this report has been signed below by the following persons on behalf of the registrant and in the capacities and on the dates indicated.
Gifford R. Zimmerman
Stephen D. Foy