Life is Complex
Nuveen makes things e-simple.
It only takes a minute to sign up for e-Reports. Once enrolled, you'll receive an e-mail as soon as your Nuveen Fund information is ready—no more waiting for delivery by regular mail. Just click on the link within the e-mail to see the report and save it on your computer if you wish.
Free e-Reports right to your e-mail!
www.investordelivery.com
If you receive your Nuveen Fund dividends and statements from your financial advisor or brokerage account.
or www.nuveen.com/accountaccess
If you receive your Nuveen Fund dividends and statements directly from Nuveen.
| | |
Table of Contents | |
| |
| Chairman's Letter to Shareholders | 4 |
| Portfolio Manager's Comments | 5 |
| Share Information | 7 |
| Risk Considerations | 9 |
| Performance Overview and Holding Summaries | 10 |
| Shareholder Meeting Report | 12 |
| Portfolio of Investments | 13 |
| Statement of Assets and Liabilities | 28 |
| Statement of Operations | 29 |
| Statement of Changes in Net Assets | 30 |
| Financial Highlights | 32 |
| Notes to Financial Statements | 34 |
| Additional Fund Information | 42 |
| Glossary of Terms Used in this Report | 43 |
| Reinvest Automatically, Easily and Conveniently | 44 |
| Annual Investment Management Agreement Approval Process | 45 |
NUVEEN 3
Chairman's Letter to Shareholders
Dear Shareholders,
Asset prices have steadily climbed this year, propelled by a "Goldilocks" economic scenario that enabled markets to sidestep geopolitical tensions, natural disasters, terrorism events and political noise. The U.S. economy continued to run not too hot, not too cold, with steady growth and low levels of unemployment, inflation and interest rates. Corporate earnings have been healthy and recession risk appeared low. At the same time, growth across the rest of the world has improved as well, leading to upward revisions in global growth projections.
Yet, a global synchronized recovery also brings the prospect of higher inflation. Central banks have to manage the delicate balance between too-loose financial conditions, which risks economies overheating, and too-tight conditions, which could trigger recession. The nominee for Chairman of the U.S. Federal Reserve (Fed), Jerome Powell, is largely expected to maintain the course set by Chair Janet Yellen after her term expires in February 2018. However, uncertainties about fiscal policy remain, particularly as Congress is currently working on a tax overhaul plan. Depending on the details of a tax bill and whether it passes, the Fed's job of managing interest rates could become more complicated in the years ahead.
Meanwhile, politics will remain in the forefront. The U.S. debt ceiling debate resumes in December 2017 when the current extension of the debt limit expires, and rebuilding continues in the wake of Hurricanes Harvey, Irma and Maria. The ongoing "Brexit" negotiations and the North American Free Trade Agreement (NAFTA) talks may impact key trade and political partnerships. Tensions with North Korea may continue to flare.
The magnitude of the market's bullishness this year has been somewhat surprising. But gains may not be so easy in the coming years. Nobody can predict market shifts, which is why Nuveen encourages you to talk to your financial advisor to ensure your investment portfolio is appropriately diversified for your objectives, time horizon and risk tolerance. On behalf of the other members of the Nuveen Fund Board, we look forward to continuing to earn your trust in the months and years ahead.
Sincerely,
William J. Schneider
Chairman of the Board
November 22, 2017
4 NUVEEN
Portfolio Manager's Comments
Nuveen Select Maturities Municipal Fund (NIM)
This Fund features portfolio management by Nuveen Asset Management, LLC, an affiliate of Nuveen, LLC. Portfolio manager Paul L. Brennan, CFA, reviews key investment strategies and the six-month performance of the Nuveen Select Maturities Municipal Fund (NIM). Paul has managed NIM since 2006.
What key strategies were used to manage NIM during the six-month reporting period ended September 30, 2017?
During the six-month reporting period, moderate economic growth, well-signaled policy actions from the Federal Reserve (Fed), a reassessment of political risk and stable municipal credit fundamentals continued to drive demand for municipal bonds, while supply remained relatively tight. Against this backdrop, yields fell (except at the very short end of the yield curve, which rose in concert with the Fed's rate hikes) and credit spreads narrowed, helping the broad municipal market to post a gain for the reporting period. During this time, we continued to take a bottom-up approach to discovering sectors that appeared undervalued as well as individual credits that we believed had the potential to perform well over the long term.
The Fund's overall positioning remained relatively unchanged during the reporting period, although we marginally increased exposure to lower quality bonds by the end of the reporting period. Our emphasis remained on intermediate and longer maturities, lower rated credits and sectors offering higher yields.
Cash for new purchases was generated primarily by proceeds from called and matured bonds, which we worked to redeploy to keep NIM fully invested and support the Fund's income stream. Because NIM is an intermediate maturity Fund, it typically has a greater number of bonds maturing or being called than funds with longer average maturity targets. In addition, we continued to see heightened call activity during the reporting period, as bond issuers sought to lower costs through refinancings and the increase in this activity provided ample cash for purchases.
How did NIM perform during the six-month reporting period ended September 30, 2017?
The table in NIM's Performance Overview and Holding Summaries section of this report provide total returns for the Fund for the six-month, one-year, five-year and ten-year periods ended September 30, 2017. The Fund's returns are compared with the performance of corresponding market indexes.
This material is not intended to be a recommendation or investment advice, does not constitute a solicitation to buy or sell securities, and is not provided in a fiduciary capacity. The information provided does not take into account the specific objectives or circumstances of any particular investor, or suggest any specific course of action. Investment decisions should be made based on an investor's objectives and circumstances and in consultation with his or her advisors.
Certain statements in this report are forward-looking statements. Discussions of specific investments are for illustration only and are not intended as recommendations of individual investments. The forward-looking statements and other views expressed herein are those of the portfolio manager as of the date of this report. Actual future results or occurrences may differ significantly from those anticipated in any forward-looking statements, and the views expressed herein are subject to change at any time, due to numerous market and other factors. The Fund disclaims any obligation to update publicly or revise any forward-looking statements or views expressed herein.
For financial reporting purposes, the ratings disclosed are the highest rating given by one of the following national rating agencies: Standard & Poor's (S&P), Moody's Investors Service, Inc. (Moody's) or Fitch, Inc. (Fitch). This treatment of split-rated securities may differ from that used for other purposes, such as for Fund investment policies. Credit ratings are subject to change. AAA, AA, A and BBB are investment grade ratings, while BB, B, CCC, CC, C and D are below investment grade ratings. Certain bonds backed by U.S. Government or agency securities are regarded as having an implied rating equal to the rating of such securities. Holdings designated N/R are not rated by these national rating agencies.
Bond insurance guarantees only the payment of principal and interest on the bond when due, and not the value of the bonds themselves, which will fluctuate with the bond market and the financial success of the issuer and the insurer. Insurance relates specifically to the bonds in the portfolio and not to the share prices of a Fund. No representation is made as to the insurers' ability to meet their commitments.
Refer to the Glossary of Terms Used in this Report for further definition of the terms used within this section.
NUVEEN 5
Portfolio Manager's Comments (continued)
For the six months ended September 30, 2017, the total return on net asset value (NAV) for NIM outperformed the S&P Municipal Bond Intermediate Index.
The main drivers of the Fund's performance during this reporting period were credit exposures and sector allocations. Lower rated bonds continued to outperform higher rated bonds during this reporting period. The Fund remained overweight to bonds rated A and below, which was beneficial to performance because these segments, especially single A and BBB bonds, performed well. Given the strong performance of lower quality credits, the sectors with greater concentrations of lower rated bonds were the top performers, including the health care, industrial development revenue/pollution control revenue (IDR/PCR) and tobacco sectors. NIM held overweight allocations in these sectors, which drove relative gains.
The Fund's duration and yield curve positioning was modestly favorable to performance. NIM's duration was shorter than the benchmark's, which was disadvantageous in this environment where longer bonds outperformed shorter bonds. However, the Fund's overweight to longer duration bonds outperformed its exposure to shorter duration bonds, and this positioning contributed positively to performance.
Additionally, NIM's performance was further aided by some bonds that appreciated on improving credit situations. The Fund's holdings in Chicago credits, including the Chicago Board of Education, IDR/PCR FirstEnergy Solution bonds and New Jersey state debt were notable performers in this reporting period.
Given the continued news about economic problems in Puerto Rico, we should note that NIM has no exposure to Puerto Rico bonds.
Note About Investment Valuations
The municipal securities held by the Fund are valued by the Fund's pricing service using a range of market-based inputs and assumptions. A different municipal pricing service might incorporate different assumptions and inputs into its valuation methodology, potentially resulting in different values for the same securities. Thus, the current net asset value of the Fund's shares might be impacted, higher or lower, if the Fund were to use a different pricing service, or if its pricing service were to materially change its valuation methodology. On October 4, 2016, the Fund's then-current municipal bond pricing service was acquired by the parent company of another pricing service, and the combination of the valuation methodologies used by the two organizations took place on October 16, 2017, subsequent to the close of the reporting period of this report. The change of valuation methodologies due to that combination had little or no impact on the net asset value of the Fund's shares.
6 NUVEEN
Share Information
DISTRIBUTION INFORMATION
The following information regarding the Fund's distributions is current as of September 30, 2017. The Fund's distribution levels may vary over time based on its investment activity and portfolio investment value changes.
During the current reporting period, the Fund's distributions to shareholders were as shown in the accompanying table.
| Monthly Distributions (Ex-Dividend Date) | | Per Share Amounts | |
| April 2017 | | $ | 0.0260 | |
| May | | | 0.0260 | |
| June | | | 0.0260 | |
| July | | | 0.0260 | |
| August | | | 0.0260 | |
| September 2017 | | | 0.0260 | |
| Total Distributions from Net Investment Income | | $ | 0.1560 | |
| Yields | | | | |
| Market Yield* | | | 3.03 | % |
| Taxable-Equivalent Yield* | | | 4.21 | % |
| * | Market Yield is based on the Fund's current annualized monthly distribution divided by the Fund's current market price as of the end of the reporting period. Taxable-Equivalent Yield represents the yield that must be earned on a fully taxable investment in order to equal the yield of the Fund on an after-tax basis. It is based on an income tax rate of 28.0%. When comparing the Fund to investments that generate qualified dividend income, the Taxable-Equivalent Yield would be lower. |
The Fund seeks to pay regular monthly dividends out of its net investment income at a rate that reflects its past and projected net income performance. To permit the Fund to maintain a more stable monthly dividend, the Fund may pay dividends at a rate that may be more or less than the amount of net income actually earned by the Fund during the period. If the Fund has cumulatively earned more than it has paid in dividends, it will hold the excess in reserve as undistributed net investment income (UNII) as part of the Fund's net asset value. Conversely, if the Fund has cumulatively paid in dividends more than it has earned, the excess will constitute a negative UNII that will likewise be reflected in the Fund's net asset value. The Fund will, over time, pay all its net investment income as dividends to shareholders.
As of September 30, 2017, the Fund had a positive UNII balance, based upon our best estimate, for tax purposes and a positive UNII balance for financial reporting purposes.
All monthly dividends paid by the Fund during the current reporting period were paid from net investment income. If a portion of the Fund's monthly distributions was sourced from or comprised of elements other than net investment income, including capital gains and/or a return of capital, the Fund's shareholders would have received a notice to that effect. For financial reporting purposes, the composition and per share amounts of the Fund's dividends for the reporting period are presented in the Statement of Changes in Net Assets and Financial Highlights, respectively. For income tax purposes, distribution information for each Fund as of its most recent tax year end is presented in Note 6 — Income Tax Information within the Notes to Financial Statements of this report.
NUVEEN 7
Share Information (continued)
SHARE REPURCHASES
During August 2017, the Fund's Board of Trustees reauthorized an open-market share repurchase program, allowing the Fund to repurchase an aggregate of up to approximately 10% of its outstanding shares.
As of September 30, 2017, and since the inception of the Fund's repurchase program, the Fund has cumulatively repurchased and retired its outstanding shares as shown in the accompanying table.
| | |
| Shares cumulatively repurchased and retired | 0 |
| Shares authorized for repurchase | 1,245,000 |
OTHER SHARE INFORMATION
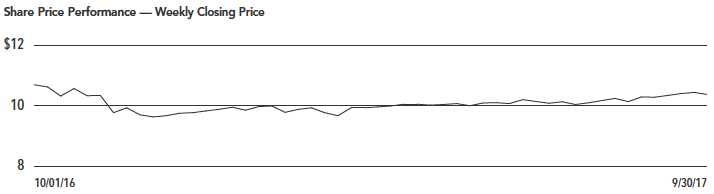
As of September 30, 2017, and during the current reporting period, the Fund's share price was trading at a premium/(discount) to its NAV as shown in the accompanying table.
| | |
| NAV | $10.52 |
| Share price | $10.31 |
| Premium/(Discount) to NAV | (2.00)% |
| 6-month average premium/(discount) to NAV | (2.99)% |
8 NUVEEN
Risk Considerations
Fund shares are not guaranteed or endorsed by any bank or other insured depository institution, and are not federally insured by the Federal Deposit Insurance Corporation.
Nuveen Select Maturities Municipal Fund (NIM)
Investing in closed-end funds involves risk; principal loss is possible. There is no guarantee the Fund's investment objectives will be achieved. Closed-end fund shares may frequently trade at a discount or premium to their net asset value. Debt or fixed income securities such as those held by the Fund, are subject to market risk, credit risk, interest rate risk, derivatives risk, liquidity risk, and income risk. As interest rates rise, bond prices fall. These and other risk considerations such as tax risk are described in more detail on the Fund's web page at www.nuveen.com/NIM.
NUVEEN 9
NIM
Nuveen Select Maturities Municipal Fund
Performance Overview and Holding Summaries as of September 30, 2017
Refer to the Glossary of Terms Used in this Report for further definition of the terms used within this section.
Average Annual Total Returns as of September 30, 2017
| | | | | | |
| | Cumulative | | | Average Annual | |
| | 6-Month | | 1-Year | 5-Year | 10-Year |
| NIM at NAV | 3.87% | | 1.08% | 2.97% | 4.09% |
| NIM at Share Price | 5.46% | | (0.54)% | 1.59% | 4.70% |
| S&P Municipal Bond Intermediate Index | 2.97% | | 0.96% | 2.85% | 4.61% |
Past performance is not predictive of future results. Current performance may be higher or lower than the data shown. Returns do not reflect the deduction of taxes that shareholders may have to pay on Fund distributions or upon the sale of Fund shares. Returns at NAV are net of Fund expenses, and assume reinvestment of distributions. Comparative index return information is provided for the Fund's shares at NAV only. Indexes are not available for direct investment.
10 NUVEEN
This data relates to the securities held in the Fund's portfolio of investments as of the end of the reporting period. It should not be construed as a measure of performance for the Fund itself. Holdings are subject to change.
For financial reporting purposes, the ratings disclosed are the highest rating given by one of the following national rating agencies: Standard & Poor's Group, Moody's Investors Service, Inc. or Fitch, Inc. This treatment of split-rated securities may differ from that used for other purposes, such as for Fund investment policies. Credit ratings are subject to change. AAA, AA, A and BBB are investment grade ratings; BB, B, CCC, CC, C and D are below-investment grade ratings. Certain bonds backed by U.S. Government or agency securities are regarded as having an implied rating equal to the rating of such securities. Holdings designated N/R are not rated by these national rating agencies.
| | |
Fund Allocation | |
(% of net assets) | |
| Long-Term Municipal Bonds | 98.7% |
| Corporate Bonds | 0.0% |
| Short-Term Municipal Bonds | 0.7% |
| Other Assets Less Liabilities | 0.6% |
Net Assets | 100% |
Portfolio Credit Quality | |
(% of total investments) | |
| AAA/U.S. Guaranteed | 13.3% |
| AA | 20.9% |
| A | 33.0% |
| BBB | 22.3% |
| BB or Lower | 6.8% |
| N/R (not rated) | 3.7% |
Total | 100% |
| | |
Portfolio Composition | |
(% of total investments) | |
| Tax Obligation/Limited | 20.1% |
| Transportation | 14.8% |
| Health Care | 14.6% |
| Utilities | 13.5% |
| Tax Obligation/General | 13.2% |
| U.S. Guaranteed | 9.2% |
| Consumer Staples | 5.0% |
| Other | 9.6% |
Total | 100% |
| | |
States and Territories | |
(% of total municipal bonds) | |
| Illinois | 18.7% |
| Texas | 8.8% |
| New Jersey | 7.9% |
| Pennsylvania | 5.8% |
| California | 5.8% |
| Ohio | 5.2% |
| New York | 4.4% |
| Wisconsin | 4.3% |
| Florida | 3.9% |
| South Carolina | 3.8% |
| Arizona | 3.2% |
| Louisiana | 2.4% |
| Nevada | 2.3% |
| Washington | 2.3% |
| Indiana | 2.0% |
| Other | 19.2% |
Total | 100% |
NUVEEN 11
Shareholder Meeting Report
The annual meeting of shareholders was held in the offices of Nuveen on August 2, 2017 for NIM; at this meeting the shareholders were asked to elect Board Members.
| | |
| | NIM |
| | Common |
| | Shares |
| |
Approval of the Board Members was reached as follows: | |
| David J. Kundert | |
| For | 11,348,350 |
| Withhold | 203,480 |
| Total | 11,551,830 |
| John K. Nelson | |
| For | 11,343,133 |
| Withhold | 208,697 |
| Total | 11,551,830 |
| Terence J. Toth | |
| For | 11,349,294 |
| Withhold | 202,536 |
| Total | 11,551,830 |
| Robert L. Young | |
| For | 11,338,856 |
| Withhold | 212,974 |
| Total | 11,551,830 |
12 NUVEEN
| | | | | |
NIM | | | |
| |
Nuveen Select Maturities Municipal Fund | | | |
Portfolio of Investments | September 30, 2017 (Unaudited) |
| |
| |
Principal Amount (000) | | | Optional Call Provisions (2) | | |
| | Description (1) | Ratings (3) | Value |
| | | LONG-TERM INVESTMENTS – 98.7% | | | |
| | | | | | |
| | | MUNICIPAL BONDS – 98.7% | | | |
| | | | | | |
| | | Alabama – 0.7% | | | |
| $ 375 | | Black Belt Energy Gas District, Alabama, Gas Supply Revenue Bonds, Series 2016, 4.000%, | 3/21 at 100.59 | A1 | $ 405,649 |
| | | 7/01/46 (Mandatory put 6/01/21) | | | |
| 350 | | Black Belt Energy Gas District, Alabama, Gas Supply Revenue Bonds, Series 2017A, 4.000%, | 4/22 at 100.52 | A1 | 385,920 |
| | | 8/01/47 (Mandatory put 7/01/22) | | | |
| 125 | | Mobile Spring Hill College Educational Building Authority, Alabama, Revenue Bonds, Spring Hill | 4/25 at 100.00 | N/R | 130,420 |
| | | College Project, Series 2015, 5.000%, 4/15/27 | | | |
| 850 | | Total Alabama | | | 921,989 |
| | | Alaska – 0.1% | | | |
| 155 | | Alaska State, Sport Fishing Revenue Bonds, Refunding Series 2011, 5.000%, 4/01/21 | 4/20 at 100.00 | A1 | 169,657 |
| | | Arizona – 3.2% | | | |
| | | Arizona Health Facilities Authority, Hospital System Revenue Bonds, Phoenix Children's | | | |
| | | Hospital, Refunding Series 2012A: | | | |
| 275 | | 5.000%, 2/01/20 | No Opt. Call | BBB+ | 295,988 |
| 290 | | 5.000%, 2/01/27 | 2/22 at 100.00 | BBB+ | 318,017 |
| | | Arizona Sports and Tourism Authority, Tax Revenue Bonds, Multipurpose Stadium Facility | | | |
| | | Project, Refunding Senior Series 2012A: | | | |
| 425 | | 5.000%, 7/01/25 | 7/22 at 100.00 | A1 | 472,961 |
| 685 | | 5.000%, 7/01/26 | 7/22 at 100.00 | A1 | 758,884 |
| 685 | | 5.000%, 7/01/27 | 7/22 at 100.00 | A1 | 755,336 |
| 115 | | Pima County Industrial Development Authority, Arizona, Revenue Bonds, Tucson Electric Power | 3/23 at 100.00 | A– | 121,243 |
| | | Company Project, Series 2013A, 4.000%, 9/01/29 | | | |
| | | Salt Verde Financial Corporation, Arizona, Senior Gas Revenue Bonds, Citigroup Energy Inc | | | |
| | | Prepay Contract Obligations, Series 2007: | | | |
| 150 | | 5.000%, 12/01/17 | No Opt. Call | BBB+ | 150,993 |
| 135 | | 5.250%, 12/01/19 | No Opt. Call | BBB+ | 145,626 |
| 165 | | 5.000%, 12/01/32 | No Opt. Call | BBB+ | 197,606 |
| 715 | | 5.000%, 12/01/37 | No Opt. Call | BBB+ | 857,642 |
| 120 | | The Industrial Development Authority of the City of Phoenix, Arizona Education Facility | 7/19 at 101.00 | N/R | 118,561 |
| | | Revenue Bonds, Legacy Traditional Schools East Mesa and Cadence (Nevada) | | | |
| | | Campuses, Series 2017A, 144A, 4.000%, 7/01/22 | | | |
| 3,760 | | Total Arizona | | | 4,192,857 |
| | | Arkansas – 0.4% | | | |
| 540 | | Independence County, Arkansas, Pollution Control Revenue Bonds, Arkansas Power and Light | No Opt. Call | A | 556,519 |
| | | Company Project, Series 2013, 2.375%, 1/01/21 | | | |
| | | California – 5.8% | | | |
| 300 | | Alameda Corridor Transportation Authority, California, Revenue Bonds, Refunding Senior Lien | No Opt. Call | A | 357,378 |
| | | Series 2013A, 5.000%, 10/01/23 | | | |
| 390 | | California Health Facilities Financing Authority, Revenue Bonds, El Camino Hospital, Series | 2/27 at 100.00 | A+ | 403,677 |
| | | 2017, 3.750%, 2/01/32 | | | |
| 275 | | California Municipal Finance Authority, Charter School Revenue Bonds, Palmdale Aerospace | 7/26 at 100.00 | BB | 294,500 |
| | | Academy Project, Series 2016A, 144A, 5.000%, 7/01/31 | | | |
| 105 | | California Pollution Control Financing Authority, Solid Waste Disposal Revenue Bonds, Waste | No Opt. Call | A– | 108,319 |
| | | Management Inc., Refunding Series 2015B-2, 3.125%, 11/01/40 (Mandatory put 11/03/25) | | | |
| | | (Alternative Minimum Tax) | | | |
NUVEEN 13
| | | |
NIM | Nuveen Select Maturities Municipal Fund | |
| | Portfolio of Investments (continued) | September 30, 2017 (Unaudited) |
| | | | | | |
Principal | | | Optional Call | | |
Amount (000) | | Description (1) | Provisions (2) | Ratings (3) | Value |
| | | California (continued) | | | |
| $ 290 | | California Pollution Control Financing Authority, Solid Waste Disposal Revenue Bonds, Waste | No Opt. Call | A– | $ 311,808 |
| | | Management Inc., Series 2015A-1, 3.375%, 7/01/25 (Alternative Minimum Tax) | | | |
| 205 | | California Pollution Control Financing Authority, Solid Waste Disposal Revenue Bonds, Waste | No Opt. Call | A– | 215,379 |
| | | Management, Inc. Project, Refunding Series 2015B-1, 3.000%, 11/01/25 (Alternative Minimum Tax) | | | |
| 525 | | California State, General Obligation Bonds, Various Purpose Series 2010, 5.500%, 3/01/40 | 3/20 at 100.00 | AA– | 578,245 |
| 125 | | California Statewide Communities Development Authority, California, Revenue Bonds, Loma Linda | 12/24 at 100.00 | BB+ | 141,557 |
| | | University Medical Center, Series 2014A, 5.250%, 12/01/29 | | | |
| 250 | | Delano, California, Certificates of Participation, Delano Regional Medical Center, Series | 1/23 at 100.00 | BBB | 274,132 |
| | | 2012, 5.000%, 1/01/24 | | | |
| 125 | | Golden State Tobacco Securitization Corporation, California, Tobacco Settlement Asset-Backed | 11/17 at 100.00 | B+ | 124,862 |
| | | Bonds, Series 2007A-1, 5.000%, 6/01/33 | | | |
| 100 | | Lake Elsinore Public Financing Authority, California, Local Agency Revenue Bonds, Canyon Hills | 9/24 at 100.00 | N/R | 111,620 |
| | | Improvement Area A & C, Series 2014C, 5.000%, 9/01/32 | | | |
| 325 | | Lake Elsinore Redevelopment Agency, California, Special Tax Bonds, Community Facilities | 10/17 at 100.00 | AA | 325,887 |
| | | District 90-2, Series 2007A, 4.500%, 10/01/24 – AGM Insured | | | |
| 1,000 | | Mount San Antonio Community College District, Los Angeles County, California, General | 2/28 at 100.00 | Aa1 | 962,270 |
| | | Obligation Bonds, Election of 2008, Series 2013A, 0.000%, 8/01/28 (4) | | | |
| 2,000 | | Palomar Pomerado Health, California, General Obligation Bonds, Series 2009A, 0.000%, 8/01/25 – | No Opt. Call | AA | 1,620,600 |
| | | AGC Insured | | | |
| 35 | | Riverside County Transportation Commission, California, Toll Revenue Senior Lien Bonds, Series | 6/23 at 100.00 | BBB– | 39,478 |
| | | 2013A, 5.750%, 6/01/44 | | | |
| 2,000 | | San Diego Community College District, California, General Obligation Bonds, Refunding Series | No Opt. Call | Aaa | 1,008,720 |
| | | 2011, 0.000%, 8/01/37 | | | |
| 415 | | San Joaquin Hills Transportation Corridor Agency, Orange County, California, Toll Road Revenue | 1/25 at 100.00 | BBB | 467,116 |
| | | Bonds, Refunding Senior Lien Series 2014A, 5.000%, 1/15/29 | | | |
| 215 | | Washington Township Health Care District, California, Revenue Bonds, Refunding Series 2015A, | No Opt. Call | Baa1 | 249,391 |
| | | 5.000%, 7/01/25 | | | |
| 8,680 | | Total California | | | 7,594,939 |
| | | Colorado – 1.4% | | | |
| 250 | | Colorado Health Facilities Authority, Colorado, Revenue Bonds, Catholic Health Initiatives, | No Opt. Call | BBB+ | 276,780 |
| | | Series 2008D-3, 5.000%, 10/01/38 (Mandatory put 11/12/21) | | | |
| | | E-470 Public Highway Authority, Colorado, Senior Revenue Bonds, Series 2000B: | | | |
| 300 | | 0.000%, 9/01/29 – NPFG Insured | No Opt. Call | A | 205,227 |
| 250 | | 0.000%, 9/01/33 – NPFG Insured | No Opt. Call | A | 141,427 |
| 5 | | E-470 Public Highway Authority, Colorado, Senior Revenue Bonds, Series 2007A-1, 5.250%, | No Opt. Call | A | 5,168 |
| | | 9/01/18 – NPFG Insured | | | |
| 1,000 | | E-470 Public Highway Authority, Colorado, Toll Revenue Bonds, Series 2004B, 0.000%, 3/01/36 – | 9/20 at 41.72 | A | 377,740 |
| | | NPFG Insured | | | |
| 500 | | Plaza Metropolitan District 1, Lakewood, Colorado, Tax Increment Revenue Bonds, Refunding | No Opt. Call | N/R | 533,305 |
| | | Series 2013, 144A, 5.000%, 12/01/20 | | | |
| 210 | | Regional Transportation District, Colorado, Denver Transit Partners Eagle P3 Project Private | 7/20 at 100.00 | BBB+ | 230,395 |
| | | Activity Bonds, Series 2010, 6.000%, 1/15/41 | | | |
| 2,515 | | Total Colorado | | | 1,770,042 |
| | | Connecticut – 0.8% | | | |
| 100 | | Connecticut Health and Educational Facilities Authority, Revenue Bonds, Healthcare Facility | 12/17 at 100.00 | N/R | 99,568 |
| | | Expansion Church Home of Hartford Inc. Project, TEMPS-50 Series 2016B-2, 144A, | | | |
| | | 2.875%, 9/01/20 | | | |
| 905 | | Connecticut Health and Educational Facilities Authority, Revenue Bonds, Yale University, | No Opt. Call | AAA | 904,647 |
| | | Series 2010A-3, 0.875%, 7/01/49 (Mandatory put 2/08/18) | | | |
| 1,005 | | Total Connecticut | | | 1,004,215 |
14 NUVEEN
| | | | | | |
Principal | | | Optional Call | | |
Amount (000) | | Description (1) | Provisions (2) | Ratings (3) | Value |
| | | Delaware – 0.1% | | | |
| $ 170 | | Delaware Health Facilities Authority, Revenue Bonds, Nanticoke Memorial Hospital, Series 2013, | 7/23 at 100.00 | BBB | $ 183,687 |
| | | 5.000%, 7/01/28 | | | |
| | | District of Columbia – 0.9% | | | |
| 120 | | District of Columbia Student Dormitory Revenue Bonds, Provident Group – Howard Properties LLC | 10/22 at 100.00 | BB+ | 124,074 |
| | | Issue, Series 2013, 5.000%, 10/01/30 | | | |
| 935 | | District of Columbia Tobacco Settlement Corporation, Tobacco Settlement Asset-Backed Bonds, | No Opt. Call | Baa1 | 1,050,379 |
| | | Series 2001, 6.500%, 5/15/33 | | | |
| 1,055 | | Total District of Columbia | | | 1,174,453 |
| | | Florida – 3.6% | | | |
| 295 | | Cape Coral, Florida, Utility Improvement Assessment Bonds, Refunding Various Areas Series | No Opt. Call | AA | 295,749 |
| | | 2017, 3.000%, 9/01/28 – AGM Insured | | | |
| | | Citizens Property Insurance Corporation, Florida, Coastal Account Senior Secured Bonds, | | | |
| | | Series 2015A-1: | | | |
| 555 | | 5.000%, 6/01/22 | 12/21 at 100.00 | AA | 633,455 |
| 365 | | 5.000%, 6/01/25 | 12/24 at 100.00 | AA | 436,566 |
| 200 | | Citizens Property Insurance Corporation, Florida, High-Risk Account Revenue Bonds, Coastal | No Opt. Call | AA | 205,278 |
| | | Account Senior Secured Series 2011A-1, 5.000%, 6/01/18 | | | |
| | | Citizens Property Insurance Corporation, Florida, Personal and Commercial Lines Account Bonds, | | | |
| | | Senior Secured Series 2012A-1: | | | |
| 50 | | 5.000%, 6/01/18 | No Opt. Call | AA | 51,319 |
| 455 | | 5.000%, 6/01/20 | No Opt. Call | AA | 499,549 |
| | | Collier County Educational Facilities Authority, Florida, Revenue Bonds, Hodges University, | | | |
| | | Refunding Series 2013: | | | |
| 90 | | 4.750%, 11/01/23 | No Opt. Call | BBB– | 94,756 |
| 370 | | 6.000%, 11/01/33 | 11/23 at 100.00 | BBB– | 417,290 |
| | | Miami-Dade County, Florida, Public Facilities Revenue Bonds, Jackson Health System, | | | |
| | | Series 2009: | | | |
| 10 | | 5.500%, 6/01/29 (Pre-refunded 6/01/19) – AGM Insured | 6/19 at 100.00 | AA (5) | 10,751 |
| 10 | | 5.625%, 6/01/34 (Pre-refunded 6/01/19) – AGC Insured | 6/19 at 100.00 | AA (5) | 10,772 |
| 480 | | North Sumter County Utility Dependent District, Florida, Utility Revenue Bonds, Series 2010, | No Opt. Call | A | 509,002 |
| | | 5.000%, 10/01/20 | | | |
| 90 | | Palm Beach County Health Facilities Authority, Florida, Hospital Revenue Bonds, BRCH | 12/24 at 100.00 | BBB+ | 99,636 |
| | | Corporation Obligated Group, Refunding Series 2014, 5.000%, 12/01/31 | | | |
| 720 | | South Miami Health Facilities Authority, Florida, Hospital Revenue, Baptist Health System | 12/17 at 100.00 | AA– | 722,383 |
| | | Obligation Group, Refunding Series 2007, 5.000%, 8/15/27 | | | |
| | | Tampa, Florida, Cigarette Tax Allocation Bonds, H. Lee Moffitt Cancer Center Project, | | | |
| | | Refunding & Capital Improvement Series 2012A: | | | |
| 120 | | 5.000%, 9/01/22 | No Opt. Call | A+ | 138,478 |
| 350 | | 5.000%, 9/01/23 | 9/22 at 100.00 | A+ | 401,457 |
| 185 | | 5.000%, 9/01/25 | 9/22 at 100.00 | A+ | 211,605 |
| 4,345 | | Total Florida | | | 4,738,046 |
| | | Georgia – 0.9% | | | |
| 180 | | Cherokee County Water and Sewerage Authority, Georgia, Revenue Bonds, Series 1995, 5.200%, | 8/22 at 100.00 | A (5) | 197,811 |
| | | 8/01/25 (Pre-refunded 8/01/22) – NPFG Insured | | | |
| 900 | | Private Colleges and Universities Authority, Georgia, Revenue Bonds, Mercer University, | 10/22 at 100.00 | Baa2 | 1,021,212 |
| | | Refunding Series 2012C, 5.250%, 10/01/23 | | | |
| 1,080 | | Total Georgia | | | 1,219,023 |
NUVEEN 15
| | | |
NIM | Nuveen Select Maturities Municipal Fund | |
| | Portfolio of Investments (continued) | September 30, 2017 (Unaudited) |
| | | | | | |
Principal | | | Optional Call | | |
Amount (000) | | Description (1) | Provisions (2) | Ratings (3) | Value |
| | | Guam – 0.3% | | | |
| $ 140 | | Guam Government Waterworks Authority, Water and Wastewater System Revenue Bonds, Series 2013, | 7/23 at 100.00 | A– | $ 154,858 |
| | | 5.500%, 7/01/43 | | | |
| 150 | | Guam International Airport Authority, Revenue Bonds, Series 2013C, 6.375%, 10/01/43 | 10/23 at 100.00 | BBB | 171,604 |
| | | (Alternative Minimum Tax) | | | |
| 290 | | Total Guam | | | 326,462 |
| | | Hawaii – 1.4% | | | |
| 200 | | Hawaii Department of Budget and Finance, Special Purpose Revenue Bonds, Hawaii Pacific | 7/23 at 100.00 | BB | 214,000 |
| | | University, Series 2013A, 6.250%, 7/01/27 | | | |
| 1,000 | | Hawaii Department of Budget and Finance, Special Purpose Revenue Bonds, Hawaiian Electric | No Opt. Call | A– | 1,018,450 |
| | | Company, Inc. and Subsidiary Projects, Series 2017A, 3.100%, 5/01/26 (Alternative Minimum Tax) | | | |
| 20 | | Hawaii Department of Budget and Finance, Special Purpose Revenue Bonds, Queens Health Systems, | 7/25 at 100.00 | AA– | 23,474 |
| | | Series 2015A, 5.000%, 7/01/29 | | | |
| 510 | | Hawaiian Electric Company Inc. and Its Subsidiaries, Special Purpose Revenue Bonds, Department of | No Opt. Call | A– | 533,154 |
| | | Budget and Finance of the State of Hawaii, Series 2015, 3.250%, 1/01/25 (Alternative Minimum Tax) | | | |
| 1,730 | | Total Hawaii | | | 1,789,078 |
| | | Idaho – 0.4% | | | |
| 565 | | Nez Perce County, Idaho, Pollution Control Revenue Bonds, Potlatch Corporation Project, | No Opt. Call | BB+ | 547,977 |
| | | Refunding Series 2016, 2.750%, 10/01/24 | | | |
| | | Illinois – 18.2% | | | |
| | | Cary, Illinois, Special Tax Bonds, Special Service Area 1, Refunding Series 2016: | | | |
| 10 | | 2.150%, 3/01/23 – BAM Insured | No Opt. Call | AA | 9,962 |
| 10 | | 2.350%, 3/01/24 – BAM Insured | No Opt. Call | AA | 9,946 |
| 25 | | 2.700%, 3/01/26 – BAM Insured | 3/25 at 100.00 | AA | 24,647 |
| 25 | | 2.900%, 3/01/28 – BAM Insured | 3/25 at 100.00 | AA | 24,187 |
| 25 | | 3.050%, 3/01/30 – BAM Insured | 3/25 at 100.00 | AA | 24,392 |
| | | Cary, Illinois, Special Tax Bonds, Special Service Area 2, Refunding Series 2016: | | | |
| 15 | | 2.150%, 3/01/23 – BAM Insured | No Opt. Call | AA | 14,943 |
| 15 | | 2.350%, 3/01/24 – BAM Insured | No Opt. Call | AA | 14,919 |
| 25 | | 2.700%, 3/01/26 – BAM Insured | 3/25 at 100.00 | AA | 24,647 |
| 35 | | 2.900%, 3/01/28 – BAM Insured | 3/25 at 100.00 | AA | 34,074 |
| 40 | | 3.050%, 3/01/30 – BAM Insured | 3/25 at 100.00 | AA | 38,875 |
| 1,215 | | Chicago Board of Education, Illinois, General Obligation Bonds, Dedicated Capital Improvement | 4/27 at 100.00 | A | 1,434,028 |
| | | Revenues, Series 2016, 6.000%, 4/01/46 | | | |
| 190 | | Chicago Board of Education, Illinois, General Obligation Bonds, Dedicated Revenues, Refunding | No Opt. Call | B+ | 190,502 |
| | | Series 2010F, 5.000%, 12/01/17 | | | |
| 45 | | Chicago Board of Education, Illinois, General Obligation Bonds, Dedicated Revenues, Refunding | No Opt. Call | N/R (5) | 45,321 |
| | | Series 2010F, 5.000%, 12/01/17 (ETM) | | | |
| 750 | | Chicago Board of Education, Illinois, General Obligation Bonds, Dedicated Revenues, Refunding | 12/27 at 100.00 | N/R | 902,115 |
| | | Series 2017B, 144A, 6.750%, 12/01/30 | | | |
| 300 | | Chicago, Illinois, General Airport Revenue Bonds, O'Hare International Airport, Senior Lien | 1/25 at 100.00 | A | 338,223 |
| | | Refunding Series 2015A, 5.000%, 1/01/33 (Alternative Minimum Tax) | | | |
| 75 | | Chicago, Illinois, General Obligation Bonds, Project and Refunding Series 2009C, | 1/19 at 100.00 | BBB+ | 77,338 |
| | | 5.000%, 1/01/27 | | | |
| | | Chicago, Illinois, General Obligation Bonds, Refunding Series 2016C:�� | | | |
| 200 | | 5.000%, 1/01/23 | No Opt. Call | BBB+ | 221,356 |
| 225 | | 5.000%, 1/01/24 | No Opt. Call | BBB+ | 251,707 |
| 190 | | 5.000%, 1/01/25 | No Opt. Call | BBB+ | 213,813 |
| 55 | | 5.000%, 1/01/26 | No Opt. Call | BBB+ | 62,087 |
| 325 | | Cook County, Illinois, General Obligation Bonds, Refunding Series 2012C, 5.000%, 11/15/21 | No Opt. Call | AA– | 363,542 |
| 185 | | Cook County, Illinois, General Obligation Bonds, Refunding Series 2016A, 5.000%, 11/15/20 | No Opt. Call | AA– | 202,582 |
16 NUVEEN
| | | | | | |
Principal | | | Optional Call | | |
Amount (000) | | Description (1) | Provisions (2) | Ratings (3) | Value |
| | | Illinois (continued) | | | |
| $ 1,997 | | Huntley, Illinois, Special Service Area 9, Special Tax Bonds, Series 2007, 5.100%, 3/01/28 | 10/17 at 100.00 | AA (5) | $ 2,003,670 |
| | | (Pre-refunded 10/30/17) – AGC Insured | | | |
| 590 | | Huntley, Illinois, Special Tax Bonds, Special Service Area 10, Refunding Series 2017, 3.300%, | 3/26 at 100.00 | AA | 593,186 |
| | | 3/01/28 (WI/DD, Settling 10/18/17) – BAM Insured | | | |
| 625 | | Illinois Finance Authority, Gas Supply Refunding Revenue Bonds, The Peoples Gas Light and Coke | No Opt. Call | A | 631,631 |
| | | Company Project, Series 2010B, 1.875%, 2/01/33 (Mandatory put 8/01/20) | | | |
| 455 | | Illinois Finance Authority, Revenue Bonds, Centegra Health System, Series 2012, 5.000%, 9/01/27 | 9/22 at 100.00 | BBB– | 492,301 |
| 560 | | Illinois Finance Authority, Revenue Bonds, Centegra Health System, Series 2014A, | 9/24 at 100.00 | BBB– | 573,306 |
| | | 4.625%, 9/01/39 | | | |
| 275 | | Illinois Finance Authority, Revenue Bonds, Northwest Community Hospital, Series 2008A, 5.500%, | 7/18 at 100.00 | A (5) | 284,287 |
| | | 7/01/38 (Pre-refunded 7/01/18) | | | |
| 890 | | Illinois Finance Authority, Revenue Bonds, OSF Healthcare System, Series 2007A, 5.750%, | 11/17 at 100.00 | A (5) | 895,660 |
| | | 11/15/37 (Pre-refunded 11/15/17) | | | |
| 1,850 | | Illinois Finance Authority, Revenue Bonds, Presence Health Network, Series 2016C, | No Opt. Call | BBB | 2,022,068 |
| | | 4.000%, 2/15/24 | | | |
| 250 | | Illinois Finance Authority, Revenue Bonds, Roosevelt University, Series 2007, 5.250%, 4/01/22 | 12/17 at 100.00 | Ba2 | 250,102 |
| | | Illinois State, General Obligation Bonds, February Series 2014: | | | |
| 370 | | 5.000%, 2/01/25 | 2/24 at 100.00 | BBB | 404,810 |
| 325 | | 5.000%, 2/01/26 | 2/24 at 100.00 | BBB | 355,404 |
| | | Illinois State, General Obligation Bonds, Refunding Series 2012: | | | |
| 390 | | 5.000%, 8/01/20 | No Opt. Call | BBB | 416,029 |
| 335 | | 5.000%, 8/01/21 | No Opt. Call | BBB | 362,162 |
| 1,000 | | 5.000%, 8/01/22 | No Opt. Call | BBB | 1,088,880 |
| 320 | | 5.000%, 8/01/23 | No Opt. Call | BBB | 350,979 |
| 300 | | Illinois State, General Obligation Bonds, Series 2012A, 4.000%, 1/01/20 | No Opt. Call | BBB | 310,068 |
| | | Illinois State, General Obligation Bonds, Series 2013: | | | |
| 280 | | 5.500%, 7/01/25 | 7/23 at 100.00 | BBB | 313,748 |
| 240 | | 5.500%, 7/01/26 | 7/23 at 100.00 | BBB | 268,795 |
| 470 | | Illinois Toll Highway Authority, Toll Highway Revenue Bonds, Refunding Senior Lien Series | 1/26 at 100.00 | AA– | 548,363 |
| | | 2016A, 5.000%, 12/01/31 | | | |
| 450 | | Illinois Toll Highway Authority, Toll Highway Revenue Bonds, Senior Lien Series 2015B, | 1/26 at 100.00 | AA– | 513,243 |
| | | 5.000%, 1/01/37 | | | |
| 1,380 | | Kane & DeKalb Counties Community Unit School District 301, Illinois, General Obligation Bonds, | No Opt. Call | Aa2 | 1,356,319 |
| | | Series 2006, 0.000%, 12/01/18 – NPFG Insured | | | |
| 1,000 | | Peoria Public Building Commission, Illinois, School District Facility Revenue Bonds, Peoria | 12/18 at 79.62 | AA | 782,190 |
| | | County School District 150 Project, Series 2009A, 0.000%, 12/01/22 – AGC Insured | | | |
| | | Railsplitter Tobacco Settlement Authority, Illinois, Tobacco Settlement Revenue Bonds, | | | |
| | | Series 2010: | | | |
| 725 | | 5.000%, 6/01/19 | No Opt. Call | A | 769,297 |
| 1,025 | | 5.250%, 6/01/21 | No Opt. Call | A | 1,161,417 |
| 60 | | 6.250%, 6/01/24 | 11/17 at 100.00 | A | 61,223 |
| 310 | | Regional Transportation Authority, Cook, DuPage, Kane, Lake, McHenry and Will Counties, | No Opt. Call | AA | 332,831 |
| | | Illinois, General Obligation Bonds, Series 1994D, 7.750%, 6/01/19 – FGIC Insured | | | |
| | | Southwestern Illinois Development Authority, Health Facility Revenue Bonds, Memorial Group, | | | |
| | | Inc., Series 2013: | | | |
| 50 | | 7.250%, 11/01/33 (Pre-refunded 11/01/23) | 11/23 at 100.00 | N/R (5) | 66,417 |
| 95 | | 7.250%, 11/01/36 (Pre-refunded 11/01/23) | 11/23 at 100.00 | N/R (5) | 126,192 |
| 200 | | 7.625%, 11/01/48 (Pre-refunded 11/01/23) | 11/23 at 100.00 | N/R (5) | 270,006 |
| | | Springfield, Illinois, Electric Revenue Bonds, Senior Lien Series 2015: | | | |
| 230 | | 5.000%, 3/01/33 | 3/25 at 100.00 | A | 260,399 |
| 145 | | 5.000%, 3/01/34 – AGM Insured | 3/25 at 100.00 | AA | 163,959 |
| 500 | | Sterling, Whiteside County, Illinois, General Obligation Bonds, Alternate Revenue Source, | No Opt. Call | A+ | 553,335 |
| | | Series 2012, 4.000%, 11/01/22 | | | |
NUVEEN 17
| | | |
NIM | Nuveen Select Maturities Municipal Fund | |
| | Portfolio of Investments (continued) | September 30, 2017 (Unaudited) |
| | | | | | |
Principal | | | Optional Call | | |
Amount (000) | | Description (1) | Provisions (2) | Ratings (3) | Value |
| | | Illinois (continued) | | | |
| $ 355 | | Will, Grundy, Kendall, LaSalle, Kankakee, Livingston and Cook Counties Community College | 6/18 at 100.00 | AA | $ 365,522 |
| | | District 525 Joliet Junior College, Illinois, General Obligation Bond, Series 2008, | | | |
| | | 5.750%, 6/01/28 | | | |
| 390 | | Williamson & Johnson Counties Community Unit School District 2, Marion, Illinois, Limited Tax | 10/19 at 103.00 | BBB+ | 423,442 |
| | | General Obligation Lease Certificates, Series 2011, 7.000%, 10/15/22 | | | |
| 22,417 | | Total Illinois | | | 23,894,447 |
| | | Indiana – 2.0% | | | |
| 115 | | Indiana Finance Authority, Educational Facilities Revenue Bonds, Drexel Foundation For | 10/19 at 100.00 | B– | 114,878 |
| | | Educational Excellence, Inc., Series 2009A, 6.000%, 10/01/21 | | | |
| 140 | | Indianapolis, Indiana, Thermal Energy System Revenue Bonds, Refunding First Lien Series 2014A, | 10/24 at 100.00 | A | 160,236 |
| | | 5.000%, 10/01/31 | | | |
| 255 | | Jasper County, Indiana, Pollution Control Revenue Refunding Bonds, Northern Indiana Public | No Opt. Call | A | 270,456 |
| | | Service Company Project, Series 1994A Remarketed, 5.850%, 4/01/19 – NPFG Insured | | | |
| 250 | | Lake County Building Corporation, Indiana, First Mortgage Bonds, Series 2012, 4.750%, 2/01/21 | No Opt. Call | N/R | 263,477 |
| 250 | | Vanderburgh County, Indiana, Redevelopment District Tax Increment Revenue bonds, Refunding | 8/24 at 100.00 | A | 292,050 |
| | | Series 2014, 5.000%, 2/01/29 | | | |
| 865 | | Whiting, Indiana, Environmental Facilities Revenue Bonds, BP Products North America Inc. | No Opt. Call | A– | 869,680 |
| | | Project, Series 2008, 1.850%, 6/01/44 (Mandatory put 10/01/19) | | | |
| 600 | | Whiting, Indiana, Environmental Facilities Revenue Bonds, BP Products North America Inc. | No Opt. Call | A– | 684,456 |
| | | Project, Series 2015, 5.000%, 11/01/45 (Mandatory put 11/01/22) (Alternative Minimum Tax) | | | |
| 2,475 | | Total Indiana | | | 2,655,233 |
| | | Iowa – 1.1% | | | |
| 500 | | Ames, Iowa, Hospital Revenue Bonds, Mary Greeley Medical Center, Series 2011, 5.250%, 6/15/27 | 6/20 at 100.00 | A2 (5) | 554,580 |
| | | (Pre-refunded 6/15/20) | | | |
| | | Iowa Finance Authority, Iowa, Midwestern Disaster Area Revenue Bonds, Iowa Fertilizer Company | | | |
| | | Project, Series 2013: | | | |
| 220 | | 5.000%, 12/01/19 | No Opt. Call | B | 227,647 |
| 215 | | 5.500%, 12/01/22 | 12/18 at 100.00 | B | 219,777 |
| 200 | | 5.250%, 12/01/25 | 12/23 at 100.00 | B | 212,172 |
| 185 | | Iowa Finance Authority, Iowa, Midwestern Disaster Area Revenue Bonds, Iowa Fertilizer Company | 6/19 at 105.00 | B | 197,269 |
| | | Project, Series 2016, 144A, 5.875%, 12/01/27 | | | |
| 1,320 | | Total Iowa | | | 1,411,445 |
| | | Kansas – 0.1% | | | |
| 105 | | Wyandotte County/Kansas City Unified Government, Kansas, Utility System Revenue Bonds, | No Opt. Call | A+ | 121,670 |
| | | Refunding & Improvement Series 2014A, 5.000%, 9/01/22 | | | |
| | | Kentucky – 1.0% | | | |
| 550 | | Kentucky Economic Development Finance Authority, Hospital Revenue Bonds, Owensboro Health, | 6/27 at 100.00 | BBB | 615,257 |
| | | Refunding Series 2017A, 5.000%, 6/01/31 | | | |
| 350 | | Kentucky Economic Development Finance Authority, Louisville Arena Project Revenue Bonds, | 6/18 at 100.00 | AA | 356,307 |
| | | Louisville Arena Authority, Inc., Series 2008-A1, 5.750%, 12/01/28 – AGC Insured | | | |
| 340 | | Lexington-Fayette Urban County Government Public Facilities Corporation, Kentucky State Lease | 6/21 at 100.00 | A1 | 376,825 |
| | | Revenue Bonds, Eastern State Hospital Project, Series 2011A, 5.250%, 6/01/29 | | | |
| 1,240 | | Total Kentucky | | | 1,348,389 |
| | | Louisiana – 2.4% | | | |
| 240 | | De Soto Parrish, Louisiana, Pollution Control Revenue Bonds, Southwestern Electric Power | No Opt. Call | A– | 240,166 |
| | | Company Project, Refunding Series 2010, 1.600%, 1/01/19 | | | |
| 455 | | Jefferson Parish Hospital Service District 2, Louisiana, Hospital Revenue Bonds, East | 7/21 at 100.00 | BB | 482,123 |
| | | Jefferson General Hospital, Refunding Series 2011, 6.375%, 7/01/41 | | | |
18 NUVEEN
| | | | | | |
Principal | | | Optional Call | | |
Amount (000) | | Description (1) | Provisions (2) | Ratings (3) | Value |
| | | Louisiana (continued) | | | |
| | | Louisiana Citizens Property Insurance Corporation, Assessment Revenue Bonds, Series 2006-C1: | | | |
| $ 175 | | 5.875%, 6/01/23 (Pre-refunded 6/01/18) | 6/18 at 100.00 | AA (5) | $ 180,824 |
| 10 | | 6.000%, 6/01/24 (Pre-refunded 6/01/18) | 6/18 at 100.00 | AA (5) | 10,341 |
| 150 | | Louisiana Public Facilities Authority, Revenue Bonds, Ochsner Clinic Foundation Project, | 5/26 at 100.00 | A3 | 174,856 |
| | | Refunding Series 2016, 5.000%, 5/15/29 | | | |
| 100 | | Louisiana Public Facilities Authority, Revenue Bonds, Ochsner Clinic Foundation Project, | 5/27 at 100.00 | A3 | 117,176 |
| | | Refunding Series 2017, 5.000%, 5/15/30 | | | |
| | | Louisiana Public Facilities Authority, Revenue Bonds, Ochsner Clinic Foundation Project, | | | |
| | | Series 2015: | | | |
| 525 | | 5.000%, 5/15/22 | No Opt. Call | A3 | 600,232 |
| 335 | | 5.000%, 5/15/24 | No Opt. Call | A3 | 396,359 |
| 110 | | New Orleans, Louisiana, General Obligation Bonds, Refunding Series 2015, 5.000%, 12/01/25 | No Opt. Call | AA– | 131,780 |
| 100 | | New Orleans, Louisiana, Sewerage Service Revenue Bonds, Series 2015, 5.000%, 6/01/32 | 6/25 at 100.00 | A | 114,867 |
| 590 | | Saint Charles Parish, Louisiana, Gulf Opportunity Zone Revenue Bonds, Valero Project, Series | No Opt. Call | BBB | 624,019 |
| | | 2010, 4.000%, 12/01/40 (Mandatory put 6/01/22) | | | |
| 2,790 | | Total Louisiana | | | 3,072,743 |
| | | Maine – 0.0% | | | |
| 35 | | Portland, Maine, General Airport Revenue Bonds, Refunding Series 2013, 5.000%, 7/01/22 | No Opt. Call | BBB+ | 40,125 |
| | | Maryland – 0.3% | | | |
| 335 | | Baltimore, Maryland, Convention Center Hotel Revenue Bonds, Refunding Series 2017, | 9/27 at 100.00 | BBB– | 394,640 |
| | | 5.000%, 9/01/30 | | | |
| | | Massachusetts – 1.0% | | | |
| 200 | | Massachusetts Development Finance Agency Revenue Bonds, Lawrence General Hospital Issue, | 7/24 at 100.00 | BBB– | 218,720 |
| | | Series 2014A, 5.000%, 7/01/27 | | | |
| 500 | | Massachusetts Development Finance Agency, Revenue Bonds, Orchard Cove, Series 2007, | 10/17 at 100.00 | N/R | 500,910 |
| | | 5.000%, 10/01/19 | | | |
| | | Massachusetts Port Authority, Special Facilities Revenue Bonds, Delta Air Lines Inc., | | | |
| | | Series 2001A: | | | |
| 100 | | 5.200%, 1/01/20 – AMBAC Insured (Alternative Minimum Tax) | 12/17 at 100.00 | N/R | 100,381 |
| 470 | | 5.000%, 1/01/27 – AMBAC Insured (Alternative Minimum Tax) | 1/18 at 100.00 | N/R | 474,333 |
| 1,270 | | Total Massachusetts | | | 1,294,344 |
| | | Michigan – 1.1% | | | |
| 400 | | Detroit Downtown Development Authority, Michigan, Tax Increment Refunding Bonds, Development | No Opt. Call | BB | 300,528 |
| | | Area 1 Projects, Series 1996B, 0.000%, 7/01/23 | | | |
| 150 | | Detroit, Michigan, Senior Lien Sewerage Disposal System Revenue Bonds, Series 2001B, 5.500%, | No Opt. Call | A | 181,444 |
| | | 7/01/29 – FGIC Insured | | | |
| 150 | | Michigan Finance Authority, Local Government Loan Program Revenue Bonds, Detroit Water & | 7/25 at 100.00 | A– | 167,098 |
| | | Sewerage Department Sewage Disposal System Local Project, Second Lien Series 2015C, | | | |
| | | 5.000%, 7/01/34 | | | |
| 705 | | Wayne County Airport Authority, Michigan, Revenue Bonds, Detroit Metropolitan Wayne County | 12/25 at 100.00 | A | 803,199 |
| | | Airport, Refunding Series 2015F, 5.000%, 12/01/33 (Alternative Minimum Tax) | | | |
| 1,405 | | Total Michigan | | | 1,452,269 |
| | | Missouri – 1.2% | | | |
| 100 | | Branson Industrial Development Authority, Missouri, Tax Increment Revenue Bonds, Branson | 11/25 at 100.00 | N/R | 100,478 |
| | | Shoppes Redevelopment Project, Refunding Series 2017A, 4.000%, 11/01/26 | | | |
| 100 | | Missouri Health and Educational Facilities Authority, Educational Facilities Revenue Bonds, | 5/23 at 100.00 | BBB+ | 110,143 |
| | | Saint Louis College of Pharmacy, Series 2013, 5.250%, 5/01/33 | | | |
| 30 | | Missouri Health and Educational Facilities Authority, Educational Facilities Revenue Bonds, | 11/23 at 100.00 | BBB | 30,782 |
| | | Saint Louis College of Pharmacy, Series 2015B, 4.000%, 5/01/32 | | | |
NUVEEN 19
| | | |
NIM | Nuveen Select Maturities Municipal Fund | |
| | Portfolio of Investments (continued) | September 30, 2017 (Unaudited) |
| | | | | | |
Principal | | | Optional Call | | |
Amount (000) | | Description (1) | Provisions (2) | Ratings (3) | Value |
| | | Missouri (continued) | | | |
| $ 1,070 | | Saint Louis, Missouri, Airport Revenue Bonds, Lambert-St. Louis International Airport, Series | No Opt. Call | A | $ 1,147,917 |
| | | 2005, 5.500%, 7/01/19 – NPFG Insured | | | |
| 170 | | St. Louis County, Missouri, GNMA Collateralized Mortgage Revenue Bonds, Series 1989A, 8.125%, | 7/20 at 100.00 | AA+ (5) | 185,575 |
| | | 8/01/20 (Pre-refunded 7/01/20) (Alternative Minimum Tax) | | | |
| 1,470 | | Total Missouri | | | 1,574,895 |
| | | Montana – 0.3% | | | |
| 260 | | Billings, Montana, Tax Increment Urban Renewal Revenue Bonds, Expanded North 27th Street, | 1/23 at 100.00 | N/R | 271,697 |
| | | Series 2013A, 5.000%, 7/01/33 | | | |
| 120 | | University of Montana, Revenue Bonds, Series 1996D, 5.375%, 5/15/19 – NPFG Insured (ETM) | No Opt. Call | A (5) | 125,198 |
| 380 | | Total Montana | | | 396,895 |
| | | Nebraska – 0.1% | | | |
| 100 | | Douglas County School District 10 Elkhorn, Nebraska, General Obligation Bonds, Public Schools | 6/22 at 100.00 | AA– | 110,513 |
| | | Series 2012, 4.000%, 6/15/23 | | | |
| | | Nevada – 2.3% | | | |
| 1,470 | | Clark County, Nevada, Airport Revenue Bonds, Subordinate Lien Series 2010B, 5.750%, 7/01/42 | 1/20 at 100.00 | Aa3 | 1,621,836 |
| 250 | | Las Vegas Redevelopment Agency, Nevada, Tax Increment Revenue Bonds, Series 2009A, 8.000%, | 6/19 at 100.00 | BBB+ (5) | 279,170 |
| | | 6/15/30 (Pre-refunded 6/15/19) | | | |
| 50 | | Las Vegas, Nevada, Local Improvement Bonds, Special Improvement District 607 Providence, | No Opt. Call | N/R | 53,563 |
| | | Refunding Series 2013, 5.000%, 6/01/22 | | | |
| 175 | | Washoe County, Nevada, Gas and Water Facilities Revenue Bonds, Sierra Pacific Power Company, | No Opt. Call | A+ | 183,739 |
| | | Refunding Series 2016B, 3.000%, 3/01/36 (Mandatory put 6/01/22) | | | |
| 775 | | Washoe County, Nevada, General Obligation Bonds, Reno-Sparks Convention & Visitors Authority, | 7/21 at 100.00 | AA | 877,315 |
| | | Refunding Series 2011, 5.000%, 7/01/23 | | | |
| 2,720 | | Total Nevada | | | 3,015,623 |
| | | New Hampshire – 0.1% | | | |
| 105 | | Business Finance Authority of the State of New Hampshire, Water Facility Revenue Bonds, | 1/26 at 100.00 | A+ | 108,166 |
| | | Pennichuck Water Works, Inc. Project ,Series 2015A, 4.250%, 1/01/36 (Alternative Minimum Tax) | | | |
| | | New Jersey – 7.8% | | | |
| 500 | | Camden County Improvement Authority, New Jersey, Health Care Redevelopment Revenue Bonds, | 2/24 at 100.00 | BBB+ | 559,915 |
| | | Cooper Health System Obligated Group Issue, Refunding Series 2014A, 5.000%, 2/15/30 | | | |
| 300 | | Gloucester County Pollution Control Financing Authority, New Jersey, Pollution Control Revenue | No Opt. Call | BBB– | 328,350 |
| | | Bonds, Logan Project, Refunding Series 2014A, 5.000%, 12/01/24 (Alternative Minimum Tax) | | | |
| | | New Jersey Economic Development Authority, Cigarette Tax Revenue Refunding Bonds, Series 2012: | | | |
| 150 | | 4.000%, 6/15/19 | No Opt. Call | BBB+ | 155,308 |
| 280 | | 5.000%, 6/15/20 | No Opt. Call | BBB+ | 301,669 |
| 150 | | 5.000%, 6/15/21 | No Opt. Call | BBB+ | 164,965 |
| 345 | | 5.000%, 6/15/22 | No Opt. Call | BBB+ | 385,196 |
| 375 | | 5.000%, 6/15/23 | 6/22 at 100.00 | BBB+ | 415,354 |
| 210 | | 5.000%, 6/15/24 | 6/22 at 100.00 | BBB+ | 231,384 |
| 510 | | 5.000%, 6/15/25 | 6/22 at 100.00 | BBB+ | 558,389 |
| 150 | | 5.000%, 6/15/26 | 6/22 at 100.00 | BBB+ | 163,245 |
| 100 | | 4.250%, 6/15/27 | 6/22 at 100.00 | BBB+ | 103,619 |
| 300 | | 5.000%, 6/15/28 | 6/22 at 100.00 | BBB+ | 323,550 |
| 220 | | New Jersey Economic Development Authority, Private Activity Bonds, The Goethals Bridge | 1/24 at 100.00 | BBB | 243,725 |
| | | Replacement Project, Series 2013, 5.000%, 1/01/28 (Alternative Minimum Tax) | | | |
| 1,000 | | New Jersey Economic Development Authority, School Facilities Construction Financing Program | 6/25 at 100.00 | A– | 1,112,320 |
| | | Bonds, Refunding Series 2015XX, 5.000%, 6/15/27 | | | |
| 75 | | New Jersey Health Care Facilities Financing Authority, State Contract Bonds, Hospital Asset | 10/18 at 100.00 | BBB+ | 76,870 |
| | | Transformation Program, Series 2008A, 5.250%, 10/01/38 | | | |
20 NUVEEN
| | | | | | |
Principal | | | Optional Call | | |
Amount (000) | | Description (1) | Provisions (2) | Ratings (3) | Value |
| | | New Jersey (continued) | | | |
| $ 40 | | New Jersey Health Care Facilities Financing Authority, State Contract Bonds, Hospital Asset | 10/18 at 100.00 | N/R (5) | $ 41,748 |
| | | Transformation Program, Series 2008A, 5.250%, 10/01/38 (Pre-refunded 10/01/18) | | | |
| 1,095 | | New Jersey Higher Education Assistance Authority, Student Loan Revenue Bonds, Senior Lien | 12/26 at 100.00 | Aaa | 1,102,545 |
| | | Series 2017-1A, 3.750%, 12/01/31 (Alternative Minimum Tax) | | | |
| 1,280 | | New Jersey Transportation Trust Fund Authority, Transportation System Bonds, Capital | No Opt. Call | A– | 629,107 |
| | | Appreciation Series 2010A, 0.000%, 12/15/33 | | | |
| 1,590 | | New Jersey Transportation Trust Fund Authority, Transportation System Bonds, Series 2010D, | No Opt. Call | A– | 1,788,686 |
| | | 5.000%, 12/15/23 | | | |
| 330 | | New Jersey Turnpike Authority, Revenue Bonds, Series 2012B, 5.000%, 1/01/19 | No Opt. Call | A+ | 346,210 |
| 270 | | Salem County Pollution Control Financing Authority, New Jersey, Pollution Control Revenue | No Opt. Call | BBB– | 292,815 |
| | | Bonds, Chambers Project, Refunding Series 2014A, 5.000%, 12/01/23 (Alternative Minimum Tax) | | | |
| 250 | | South Jersey Port Corporation, New Jersey, Marine Terminal Revenue Bonds, Refunding Series | No Opt. Call | Baa1 | 254,605 |
| | | 2012Q, 3.000%, 1/01/22 | | | |
| | | Tobacco Settlement Financing Corporation, New Jersey, Tobacco Settlement Asset-Backed Bonds, | | | |
| | | Series 2007-1A: | | | |
| 190 | | 4.500%, 6/01/23 | 11/17 at 100.00 | BBB+ | 190,181 |
| 230 | | 4.625%, 6/01/26 | 11/17 at 100.00 | BBB | 230,219 |
| 160 | | 4.750%, 6/01/34 | 11/17 at 100.00 | BB– | 156,403 |
| 70 | | 5.000%, 6/01/41 | 11/17 at 100.00 | B | 68,446 |
| 10,170 | | Total New Jersey | | | 10,224,824 |
| | | New Mexico – 1.0% | | | |
| 715 | | Farmington, New Mexico, Pollution Control Revenue Bonds, Southern California Edison Company – | No Opt. Call | A | 723,330 |
| | | Four Corners Project, Refunding Series 2005A, 1.875%, 4/01/29 (Mandatory put 4/01/20) | | | |
| 490 | | New Mexico Municipal Energy Acquisition Authority, Gas Supply Revenue Bonds, Refunding | 8/19 at 100.00 | A1 | 521,164 |
| | | Sub-Series 2014A, 5.000%, 11/01/39 (Mandatory put 8/01/19) | | | |
| 1,205 | | Total New Mexico | | | 1,244,494 |
| | | New York – 4.3% | | | |
| 220 | | Brooklyn Arena Local Development Corporation, New York, Payment in Lieu of Taxes Revenue | 1/20 at 100.00 | AA+ (5) | 245,091 |
| | | Bonds, Barclays Center Project, Series 2009, 6.000%, 7/15/30 (Pre-refunded 1/15/20) | | | |
| | | Buffalo and Erie County Industrial Land Development Corporation, New York, Revenue Bonds, | | | |
| | | Catholic Health System, Inc. Project, Series 2015: | | | |
| 210 | | 5.000%, 7/01/23 | No Opt. Call | BBB+ | 241,744 |
| 195 | | 5.000%, 7/01/24 | No Opt. Call | BBB+ | 226,968 |
| 200 | | Dormitory Authority of the State of New York, Revenue Bonds, Orange Regional Medical Center | 6/27 at 100.00 | Baa3 | 227,342 |
| | | Obligated Group, Series 2017, 144A, 5.000%, 12/01/28 | | | |
| 775 | | Dormitory Authority of the State of New York, State University Educational Facilities Revenue | 5/22 at 100.00 | AA | 895,389 |
| | | Bonds, Third General Resolution, Series 2012A, 5.000%, 5/15/25 | | | |
| 175 | | Hudson Yards Infrastructure Corporation, New York, Revenue Bonds, Senior Fiscal 2012 Series | 2/21 at 100.00 | AA– | 200,449 |
| | | 2011A, 5.750%, 2/15/47 | | | |
| 260 | | Hudson Yards Infrastructure Corporation, New York, Revenue Bonds, Senior Fiscal 2012 Series | 2/21 at 100.00 | Aa3 (5) | 299,463 |
| | | 2011A, 5.750%, 2/15/47 (Pre-refunded 2/15/21) | | | |
| | | Long Island Power Authority, New York, Electric System General Revenue Bonds, Series 2000A: | | | |
| 240 | | 0.000%, 6/01/22 – AGM Insured | No Opt. Call | AA | 220,558 |
| 170 | | 0.000%, 6/01/24 – AGM Insured | No Opt. Call | AA | 147,273 |
| 835 | | New York State Energy Research and Development Authority, Pollution Control Revenue Bonds, New | No Opt. Call | A | 850,381 |
| | | York State Electric and Gas Corporation, Series 2005A, 2.375%, 7/01/26 (Mandatory put 5/01/20) | | | |
| | | (Alternative Minimum Tax) | | | |
| 435 | | New York State Thruway Authority, General Revenue Junior Indebtedness Obligations, Series | No Opt. Call | A– | 461,361 |
| | | 2013A, 5.000%, 5/01/19 | | | |
NUVEEN 21
| | | |
NIM | Nuveen Select Maturities Municipal Fund | |
| | Portfolio of Investments (continued) | September 30, 2017 (Unaudited) |
| | | | | | |
Principal | | | Optional Call | | |
Amount (000) | | Description (1) | Provisions (2) | Ratings (3) | Value |
| | | New York (continued) | | | |
| | | New York Transportation Development Corporation, New York, Special Facility Revenue Refunding | | | |
| | | Bonds, Terminal One Group Association, L.P. Project, Series 2015: | | | |
| $ 60 | | 5.000%, 1/01/22 (Alternative Minimum Tax) | No Opt. Call | A– | $ 67,777 |
| 60 | | 5.000%, 1/01/23 (Alternative Minimum Tax) | No Opt. Call | A– | 68,517 |
| | | New York Transportation Development Corporation, Special Facilities Bonds, LaGuardia Airport | | | |
| | | Terminal B Redevelopment Project, Series 2016A: | | | |
| 135 | | 4.000%, 7/01/32 (Alternative Minimum Tax) | 7/24 at 100.00 | BBB | 141,426 |
| 175 | | 4.000%, 7/01/33 (Alternative Minimum Tax) | 7/24 at 100.00 | BBB | 182,723 |
| 185 | | 5.000%, 7/01/34 (Alternative Minimum Tax) | 7/24 at 100.00 | BBB | 203,896 |
| 215 | | 4.000%, 7/01/35 – AGM Insured (Alternative Minimum Tax) | 7/24 at 100.00 | AA | 224,303 |
| 275 | | 5.000%, 7/01/46 (Alternative Minimum Tax) | 7/24 at 100.00 | BBB | 302,704 |
| 400 | | Triborough Bridge and Tunnel Authority, New York, General Purpose Revenue Bonds, Refunding | No Opt. Call | AA– | 459,768 |
| | | Series 2013B, 5.000%, 11/15/21 | | | |
| 5,220 | | Total New York | | | 5,667,133 |
| | | North Carolina – 1.3% | | | |
| 1,315 | | North Carolina Municipal Power Agency 1, Catawba Electric Revenue Bonds, Series 2015C, | 1/26 at 100.00 | A | 1,565,284 |
| | | 5.000%, 1/01/29 | | | |
| 250 | | North Carolina Turnpike Authority, Monroe Expressway Toll Revenue Bonds, Capital Appreciation | 7/26 at 96.08 | BBB– | 179,578 |
| | | Series 2017C, 0.000%, 7/01/27 | | | |
| 1,565 | | Total North Carolina | | | 1,744,862 |
| | | North Dakota – 0.7% | | | |
| | | Burleigh County, North Dakota, Health Care Revenue Bonds, Saint Alexius Medical Center | | | |
| | | Project, Series 2014A: | | | |
| 200 | | 5.000%, 7/01/29 (Pre-refunded 7/01/21) | 7/21 at 100.00 | N/R (5) | 227,112 |
| 650 | | 5.000%, 7/01/31 (Pre-refunded 7/01/21) | 7/21 at 100.00 | N/R (5) | 738,114 |
| 850 | | Total North Dakota | | | 965,226 |
| | | Ohio – 5.2% | | | |
| | | Buckeye Tobacco Settlement Financing Authority, Ohio, Tobacco Settlement Asset-Backed Revenue | | | |
| | | Bonds, Senior Lien, Series 2007A-2: | | | |
| 100 | | 5.375%, 6/01/24 | 11/17 at 100.00 | B– | 97,495 |
| 1,865 | | 5.125%, 6/01/24 | 11/17 at 100.00 | B– | 1,772,757 |
| 725 | | 5.875%, 6/01/30 | 11/17 at 100.00 | B– | 705,135 |
| 100 | | 5.750%, 6/01/34 | 11/17 at 100.00 | B– | 96,806 |
| 480 | | Fairfield County, Ohio, Hospital Facilities Revenue Bonds, Fairfield Medical Center Project, | 6/23 at 100.00 | Baa2 | 506,770 |
| | | Series 2013, 5.000%, 6/15/43 | | | |
| 50 | | Lake County, Ohio, Hospital Facilities Revenue Bonds, Lake Hospital System, Inc., Refunding | 8/18 at 100.00 | A3 | 51,811 |
| | | Series 2008C, 5.500%, 8/15/24 | | | |
| 225 | | Lake County, Ohio, Hospital Facilities Revenue Bonds, Lake Hospital System, Inc., Refunding | 8/18 at 100.00 | N/R (5) | 233,971 |
| | | Series 2008C, 5.500%, 8/15/24 (Pre-refunded 8/15/18) | | | |
| | | New Albany Community Authority, Ohio, Community Facilities Revenue Refunding Bonds, | | | |
| | | Series 2012C: | | | |
| 25 | | 4.000%, 10/01/18 | No Opt. Call | Aa3 | 25,651 |
| 30 | | 4.000%, 10/01/19 | No Opt. Call | Aa3 | 31,498 |
| 40 | | 4.000%, 10/01/20 | No Opt. Call | Aa3 | 42,763 |
| 45 | | 5.000%, 10/01/21 | No Opt. Call | Aa3 | 50,531 |
| 35 | | 5.000%, 10/01/22 | No Opt. Call | Aa3 | 40,013 |
| 20 | | Ohio Air Quality Development Authority, Ohio, Air Quality Development Revenue Bonds, | No Opt. Call | Caa1 | 9,150 |
| | | FirstEnergy Generation Corporation Project, Series 2009A, 5.700%, 8/01/20 | | | |
| 175 | | Ohio Air Quality Development Authority, Ohio, Pollution Control Revenue Bonds, FirstEnergy | No Opt. Call | CCC– | 80,063 |
| | | Generation Corporation Project, Refunding Series 2009B, 3.100%, 3/01/23 | | | |
| | | (Mandatory put 3/01/19) | | | |
22 NUVEEN
| | | | | |
Principal | | Optional Call | | |
Amount (000) | Description (1) | Provisions (2) | Ratings (3) | Value |
| | Ohio (continued) | | | |
| $ 260 | Ohio Air Quality Development Authority, Ohio, Pollution Control Revenue Bonds, FirstEnergy | No Opt. Call | B1 | $ 258,362 |
| | Generation Corporation Project, Refunding Series 2009C, 5.625%, 6/01/18 | | | |
| 485 | Ohio Air Quality Development Authority, Ohio, Pollution Control Revenue Bonds, FirstEnergy | No Opt. Call | CCC– | 221,888 |
| | Generation Project, Refunding Series 2006A, 3.750%, 12/01/23 (Mandatory put 12/03/18) | | | |
| 90 | Ohio Air Quality Development Authority, Ohio, Pollution Control Revenue Bonds, FirstEnergy | No Opt. Call | CCC– | 41,175 |
| | Nuclear Generation Corporation Project, Refunding Series 2010A, 3.125%, 7/01/33 | | | |
| | (Mandatory put 7/02/18) | | | |
| 130 | Ohio Air Quality Development Authority, Ohio, Pollution Control Revenue Bonds, FirstEnergy | No Opt. Call | CCC– | 59,475 |
| | Nuclear Generation Project, Refunding Series 2006B, 3.625%, 12/01/33 (Mandatory put 6/01/20) | | | |
| 2,000 | Ohio Turnpike Commission, Turnpike Revenue Bonds, Infrastructure Projects, Junior Lien | 2/31 at 100.00 | A+ | 1,938,320 |
| | Convertible Series 2013A-3, 0.000%, 2/15/34 (4) | | | |
| 230 | Ohio Water Development Authority, Pollution Control Revenue Refunding Bonds, FirstEnergy | No Opt. Call | CCC– | 105,225 |
| | Nuclear Generating Corporation Project, Series 2005B, 4.000%, 1/01/34 (Mandatory put 7/01/21) | | | |
| 90 | Ohio Water Development Authority, Pollution Control Revenue Refunding Bonds, FirstEnergy | No Opt. Call | Caa1 | 41,175 |
| | Nuclear Generating Corporation Project, Series 2006A, 3.000%, 5/15/19 | | | |
| 110 | Ohio Water Development Authority, Pollution Control Revenue Refunding Bonds, FirstEnergy | No Opt. Call | CCC– | 50,325 |
| | Nuclear Generating Corporation Project, Series 2006B, 4.000%, 12/01/33 (Mandatory put 6/03/19) | | | |
| 110 | Ohio Water Development Authority, Pollution Control Revenue Refunding Bonds, FirstEnergy | No Opt. Call | CCC+ | 50,325 |
| | Nuclear Generating Corporation Project, Series 2008B, 3.625%, 10/01/33 (Mandatory put 4/01/20) | | | |
| 220 | Ohio Water Development Authority, Pollution Control Revenue Refunding Bonds, FirstEnergy | No Opt. Call | CCC– | 100,650 |
| | Nuclear Generating Corporation Project, Series 2010A, 3.750%, 7/01/33 (Mandatory put 7/01/20) | | | |
| 125 | Ohio Water Development Authority, Pollution Control Revenue Refunding Bonds, FirstEnergy | No Opt. Call | CCC– | 57,188 |
| | Nuclear Generating Corporation Project, Series 2010C, 4.000%, 6/01/33 (Mandatory put 6/03/19) | | | |
| 100 | Tuscarawas County Economic Development and Finance Alliance, Ohio, Higher Education Facilities | 3/25 at 100.00 | N/R | 104,855 |
| | Revenue Bonds, Ashland University, Refunding & Improvement Series 2015, 5.375%, 3/01/27 | | | |
| 7,865 | Total Ohio | | | 6,773,377 |
| | Oklahoma – 0.2% | | | |
| 250 | Comanche County Educational Facilities Authority, Oklahoma, Educational Facilities Lease | 12/27 at 100.00 | A | 296,435 |
| | Revenue Bonds, Elgin Public Schools Project, Series 2017A, 5.000%, 12/01/31 | | | |
| | Oregon – 0.6% | | | |
| 1,250 | Beaverton School District 48J, Washington and Multnomah Counties, Oregon, General Obligation | 6/27 at 85.82 | AA+ | 791,913 |
| | Bonds, Deferred Interest Series 2017B, 0.000%, 6/15/31 | | | |
| | Pennsylvania – 5.8% | | | |
| 220 | Beaver County Industrial Development Authority, Pennsylvania, Pollution Control Revenue | No Opt. Call | CCC– | 100,650 |
| | Refunding Bonds, FirstEnergy Nuclear Generation Project, Series 2008A, 2.700%, 4/01/35 | | | |
| | (Mandatory put 4/02/18) | | | |
| 455 | Lehigh County Industrial Development Authority, Pennsylvania, Pollution Control Revenue Bonds, | No Opt. Call | A | 451,565 |
| | Pennsylvania Power and Light Company, Series 2016B, 1.800%, 2/15/27 (Mandatory put 8/15/22) | | | |
| 200 | Luzerne County Industrial Development Authority, Pennsylvania, Guaranteed Lease Revenue Bonds, | 12/19 at 100.00 | N/R | 208,130 |
| | Series 2009, 7.750%, 12/15/27 | | | |
| 500 | Montgomery County Industrial Development Authority, Pennsylvania, Pollution Control Revenue | No Opt. Call | BBB | 504,300 |
| | Bonds, PECO Energy Company Project, Refunding Series 1996A, 2.600%, 3/01/34 | | | |
| | (Mandatory put 9/01/20) | | | |
| 500 | Montgomery County Industrial Development Authority, Pennsylvania, Pollution Control Revenue | No Opt. Call | BBB | 499,395 |
| | Bonds, PECO Energy Company Project, Refunding Series 1999A, 2.500%, 10/01/30 | | | |
| | (Mandatory put 4/01/20) | | | |
| 5 | Pennsylvania Economic Development Financing Authority, Exempt Facilities Revenue Bonds, | No Opt. Call | CCC+ | 2,288 |
| | Shippingport Project, First Energy Guarantor., Series 2006A, 2.550%, 11/01/41 | | | |
| | (Mandatory put 12/03/18) | | | |
NUVEEN 23
| | | |
NIM | Nuveen Select Maturities Municipal Fund | |
| | Portfolio of Investments (continued) | September 30, 2017 (Unaudited) |
| | | | | | |
Principal | | | Optional Call | | |
Amount (000) | | Description (1) | Provisions (2) | Ratings (3) | Value |
| | | Pennsylvania (continued) | | | |
| $ 405 | | Pennsylvania Economic Development Financing Authority, Health System Revenue Bonds , Albert | 10/19 at 100.00 | N/R (5) | $ 439,385 |
| | | Einstein Healthcare, Series 2009A, 6.250%, 10/15/23 (Pre-refunded 10/15/19) | | | |
| 500 | | Pennsylvania Economic Development Financing Authority, Parking System Revenue Bonds, Capitol | 1/24 at 100.00 | AA | 587,930 |
| | | Region Parking System, Junior Guaranteed Series 2013B, 5.500%, 1/01/27 | | | |
| 250 | | Pennsylvania Economic Development Financing Authority, Parking System Revenue Bonds, Capitol | 1/24 at 100.00 | AA | 295,555 |
| | | Region Parking System, Junior Insured Series 2013C, 5.500%, 1/01/26 – AGM Insured | | | |
| 230 | | Pennsylvania Economic Development Financing Authority, Private Activity Revenue Bonds, | No Opt. Call | BBB | 269,820 |
| | | Pennsylvania Rapid Bridge Replacement Project, Series 2015, 5.000%, 12/31/25 (Alternative | | | |
| | | Minimum Tax) | | | |
| 115 | | Pennsylvania Economic Development Financing Authority, Unemployment Compensation Revenue | 12/17 at 100.00 | Aaa | 116,018 |
| | | Bonds, Series 2012B, 5.000%, 1/01/22 | | | |
| 140 | | Pennsylvania Higher Educational Facilities Authority, Revenue Bonds, University of the Arts, | 11/17 at 100.00 | AA (5) | 147,070 |
| | | Series 1999, 5.150%, 3/15/20 – AGM Insured (ETM) | | | |
| 475 | | Pennsylvania Turnpike Commission, Motor License Fund-Enhanced Subordinate Special Revenue | 12/20 at 100.00 | AA– | 528,290 |
| | | Bonds, Series 2010A, 5.500%, 12/01/34 | | | |
| 105 | | Pennsylvania Turnpike Commission, Motor License Fund-Enhanced Subordinate Special Revenue | 12/20 at 100.00 | N/R (5) | 119,439 |
| | | Bonds, Series 2010A, 5.500%, 12/01/34 (Pre-refunded 12/01/20) | | | |
| | | Pennsylvania Turnpike Commission, Turnpike Revenue Bonds, Refunding Subordinate Second | | | |
| | | Series 2016B-2: | | | |
| 560 | | 5.000%, 6/01/29 | 6/26 at 100.00 | A3 | 653,559 |
| 580 | | 5.000%, 6/01/35 | 6/26 at 100.00 | A3 | 656,148 |
| 540 | | Philadelphia Gas Works, Pennsylvania, Revenue Bonds, Twelfth Series 1990B, 7.000%, 5/15/20 – | No Opt. Call | A (5) | 589,307 |
| | | NPFG Insured (ETM) | | | |
| 65 | | Quakertown, Pennsylvania, General Authority Health Facilities Revenue USDA Loan Anticipation | 7/19 at 100.00 | N/R | 65,031 |
| | | Notes and Revenue Bonds for LifeQuest Obligated Group, Series 2017A, 3.125%, 7/01/21 | | | |
| 60 | | Scranton-Lackawanna Health and Welfare Authority, Pennsylvania, University Revenue Bonds, | No Opt. Call | BB+ | 57,061 |
| | | Marywood University, Series 2016, 3.375%, 6/01/26 | | | |
| 880 | | St. Mary Hospital Authority, Pennsylvania, Health System Revenue Bonds, Catholic Health East, | 5/19 at 100.00 | AA– | 941,345 |
| | | Series 2009D, 6.250%, 11/15/34 | | | |
| 330 | | Union County Hospital Authority, Pennsylvania, Hospital Revenue Bonds, Evangelical Community | No Opt. Call | A– | 377,447 |
| | | Hospital Project, Refunding & Improvement Series 2011, 5.750%, 8/01/21 | | | |
| 7,115 | | Total Pennsylvania | | | 7,609,733 |
| | | Rhode Island – 0.2% | | | |
| 200 | | Rhode Island Health and Educational Building Corporation, Revenue Bonds, Care New England | 9/23 at 100.00 | BB (5) | 242,056 |
| | | Health System, Series 2013A, 5.500%, 9/01/28 (Pre-refunded 9/01/23) | | | |
| | | South Carolina – 3.7% | | | |
| 1,540 | | Piedmont Municipal Power Agency, South Carolina, Electric Revenue Bonds, Refunding Series | No Opt. Call | A3 (5) | 1,651,188 |
| | | 1991, 6.750%, 1/01/19 – FGIC Insured (ETM) | | | |
| 3,040 | | Piedmont Municipal Power Agency, South Carolina, Electric Revenue Bonds, Refunding Series | No Opt. Call | A3 | 3,245,686 |
| | | 1991, 6.750%, 1/01/19 – FGIC Insured | | | |
| 4,580 | | Total South Carolina | | | 4,896,874 |
| | | Tennessee – 0.3% | | | |
| | | Knox County Health, Educational and Housing Facility Board, Tennessee, Hospital Revenue Bonds, | | | |
| | | Covenant Health, Refunding Series 2012A: | | | |
| 105 | | 4.000%, 1/01/22 | No Opt. Call | A | 114,645 |
| 180 | | 5.000%, 1/01/23 | No Opt. Call | A | 207,779 |
| 285 | | Total Tennessee | | | 322,424 |
| | | Texas – 8.7% | | | |
| 10 | | Bexar Metropolitan Water District, Texas, Waterworks System Revenue Bonds, Refunding Series | 5/20 at 100.00 | AA (5) | 11,217 |
| | | 2010, 5.875%, 5/01/40 (Pre-refunded 5/01/20) | | | |
24 NUVEEN
| | | | | | |
Principal | | | Optional Call | | |
Amount (000) | | Description (1) | Provisions (2) | Ratings (3) | Value |
| | | Texas (continued) | | | |
| | | Bexar Metropolitan Water District, Texas, Waterworks System Revenue Refunding Bonds, | | | |
| | | Series 2009: | | | |
| $ 65 | | 5.000%, 5/01/29 (Pre-refunded 5/01/19) | 5/19 at 100.00 | AA (5) | $ 69,081 |
| 165 | | 5.000%, 5/01/39 (Pre-refunded 5/01/19) | 5/19 at 100.00 | AA (5) | 175,359 |
| 25 | | Brazos River Authority, Texas, Collateralized Pollution Control Revenue Bonds, Texas Utilities | 12/17 at 100.00 | N/R | 0 |
| | | Electric Company, Series 2003D, 5.400%, 10/01/29 (Mandatory put 10/02/17) (6) | | | |
| 525 | | Central Texas Regional Mobility Authority, Revenue Bonds, Senior Lien Series 2011, 6.250%, | 1/21 at 100.00 | BBB+ (5) | 608,843 |
| | | 1/01/46 (Pre-refunded 1/01/21) | | | |
| 1,000 | | Central Texas Regional Mobility Authority, Revenue Bonds, Senior Lien, Series 2015A, | 7/25 at 100.00 | BBB+ | 1,150,870 |
| | | 5.000%, 1/01/31 | | | |
| 155 | | Harris County-Houston Sports Authority, Texas, Revenue Bonds, Refunding Second Lien Series | No Opt. Call | A3 | 182,951 |
| | | 2014C, 5.000%, 11/15/24 | | | |
| 395 | | Harris County-Houston Sports Authority, Texas, Revenue Bonds, Refunding Senior Lien Series | 11/24 at 100.00 | AA | 469,059 |
| | | 2014A, 5.000%, 11/15/26 – AGM Insured | | | |
| 35 | | Houston, Texas, Airport System Special Facilities Revenue Bonds, United Airlines, Inc. | 7/24 at 100.00 | BB– | 38,508 |
| | | Terminal E Project, Refunding Series 2014, 5.000%, 7/01/29 (Alternative Minimum Tax) | | | |
| 140 | | Houston, Texas, Hotel Occupancy Tax and Special Revenue Bonds, Convention and Entertainment | 12/17 at 100.00 | A2 | 140,475 |
| | | Facilities Department, Refunding Series 2011B, 5.250%, 9/01/25 | | | |
| 500 | | Houston, Texas, Hotel Occupancy Tax and Special Revenue Bonds, Convention and Entertainment | No Opt. Call | A2 | 432,595 |
| | | Project, Series 2001B, 0.000%, 9/01/23 – AMBAC Insured | | | |
| 430 | | Love Field Airport Modernization Corporation, Texas, General Airport Revenue Bonds Series | 11/25 at 100.00 | A1 | 504,889 |
| | | 2015, 5.000%, 11/01/28 (Alternative Minimum Tax) | | | |
| 300 | | Love Field Airport Modernization Corporation, Texas, Special Facilities Revenue Bonds, | 11/20 at 100.00 | A3 | 326,583 |
| | | Southwest Airlines Company, Series 2010, 5.250%, 11/01/40 | | | |
| | | McCamey County Hospital District, Texas, General Obligation Bonds, Series 2013: | | | |
| 100 | | 5.000%, 12/01/25 | No Opt. Call | B1 | 108,404 |
| 100 | | 5.250%, 12/01/28 | 12/25 at 100.00 | B1 | 109,260 |
| 250 | | Mission Economic Development Corporation, Texas, Revenue Bonds, Natgasoline Project, Series | 10/18 at 103.00 | BB– | 262,083 |
| | | 2016B, 144A, 5.750%, 10/01/31 (Alternative Minimum Tax) | | | |
| | | North Central Texas Health Facilities Development Corporation, Texas, Revenue Bonds, | | | |
| | | Children's Medical Center Dallas Project, Series 2012: | | | |
| 425 | | 5.000%, 8/15/24 | 8/22 at 100.00 | Aa2 | 490,573 |
| 380 | | 5.000%, 8/15/25 | 8/22 at 100.00 | Aa2 | 435,708 |
| | | North Texas Tollway Authority, Special Projects System Revenue Bonds, Convertible Capital | | | |
| | | Appreciation Series 2011C: | | | |
| 100 | | 0.000%, 9/01/43 (4) | 9/31 at 100.00 | AA+ | 107,716 |
| 490 | | 0.000%, 9/01/45 (4) | 9/31 at 100.00 | AA+ | 574,417 |
| 760 | | North Texas Tollway Authority, Special Projects System Revenue Bonds, Current Interest Series | 9/21 at 100.00 | AA+ | 864,561 |
| | | 2011D, 5.000%, 9/01/24 | | | |
| 455 | | North Texas Tollway Authority, System Revenue Bonds, Refunding First Tier, Series 2014A, | No Opt. Call | A1 | 531,918 |
| | | 5.000%, 1/01/23 | | | |
| 2,870 | | North Texas Tollway Authority, System Revenue Bonds, Refunding Second Tier, Series 2008F, | 1/18 at 100.00 | A2 (5) | 2,904,957 |
| | | 5.750%, 1/01/38 (Pre-refunded 1/01/18) | | | |
| 230 | | Texas Municipal Gas Acquisition and Supply Corporation I, Gas Supply Revenue Bonds, Series | No Opt. Call | BBB+ | 230,060 |
| | | 2006B, 1.434%, 12/15/17 (3-Month LIBOR reference rate + 0.550% spread) (10) | | | |
| 110 | | Texas Municipal Gas Acquisition and Supply Corporation III, Gas Supply Revenue Bonds, Series | 12/22 at 100.00 | A3 | 122,218 |
| | | 2012, 5.000%, 12/15/32 | | | |
| 475 | | Texas Transportation Commission, Central Texas Turnpike System Revenue Bonds, Second Tier | 8/24 at 100.00 | BBB+ | 538,360 |
| | | Refunding Series 2015C, 5.000%, 8/15/31 | | | |
| 10,490 | | Total Texas | | | 11,390,665 |
NUVEEN 25
| | | |
NIM | Nuveen Select Maturities Municipal Fund | |
| | Portfolio of Investments (continued) | September 30, 2017 (Unaudited) |
| | | | | | |
Principal | | | Optional Call | | |
Amount (000) | | Description (1) | Provisions (2) | Ratings (3) | Value |
| | | Virginia – 0.6% | | | |
| $ 100 | | Peninsula Ports Authority of Virginia, Coal Terminal Revenue Bonds, Dominion Terminal Associates | No Opt. Call | BBB | $ 99,833 |
| | | Project-DETC Issue, Refunding Series 2003, 1.550%, 10/01/33 (Mandatory put 10/01/19) | | | |
| 575 | | Virginia Small Business Financing Authority, Senior Lien Revenue Bonds, Elizabeth River | 7/22 at 100.00 | BBB | 640,125 |
| | | Crossing, Opco LLC Project, Series 2012, 5.500%, 1/01/42 (Alternative Minimum Tax) | | | |
| 675 | | Total Virginia | | | 739,958 |
| | | Washington – 2.2% | | | |
| 1,000 | | Port of Seattle, Washington, Revenue Bonds, Intermediate Lien Series 2015C, 5.000%, 4/01/23 | No Opt. Call | AA– | 1,166,320 |
| | | (Alternative Minimum Tax) | | | |
| 1,050 | | Washington Health Care Facilities Authority, Revenue Bonds, Fred Hutchinson Cancer Research | 1/21 at 100.00 | A | 1,137,959 |
| | | Center, Series 2011A, 5.375%, 1/01/31 | | | |
| 585 | | Whidbey Island Public Hospital District, Island County, Washington, General Obligation Bonds, | 12/22 at 100.00 | Baa2 | 624,470 |
| | | Whidbey General Hospital, Series 2013, 5.500%, 12/01/33 | | | |
| 2,635 | | Total Washington | | | 2,928,749 |
| | | West Virginia – 0.6% | | | |
| 100 | | Monongalia County Commission, West Virginia, Special District Excise Tax Revenue, University | No Opt. Call | N/R | 99,147 |
| | | Town Centre Economic Opportunity Development District, Refunding & Improvement | | | |
| | | Series 2017A, 144A, 4.500%, 6/01/27 (WI/DD, Settling 10/12/17) | | | |
| 125 | | West Virginia Economic Development Authority, Energy Revenue Bonds, Morgantown Energy | No Opt. Call | Baa3 | 122,473 |
| | | Associates Project, Refunding Series 2016, 2.875%, 12/15/26 (Alternative Minimum Tax) | | | |
| 250 | | West Virginia Economic Development Authority, Solid Waste Disposal Facilities Revenue Bonds, | No Opt. Call | A– | 248,488 |
| | | Appalachian Power Company – Amos Project, Series 2011A, 1.700%, 1/01/41 (Mandatory put | | | |
| | | 9/01/20) (Alternative Minimum Tax) | | | |
| 240 | | West Virginia Hospital Finance Authority, Revenue Bonds, West Virginia University Health | 6/27 at 100.00 | A | 248,422 |
| | | System Obligated Group, Improvement Series 2017A, 3.375%, 6/01/29 | | | |
| 715 | | Total West Virginia | | | 718,530 |
| | | Wisconsin – 4.3% | | | |
| 600 | | Public Finance Authority of Wisconsin, Limited Obligation PILOT Revenue Bonds, American | 12/27 at 100.00 | N/R | 687,534 |
| | | Dream @ Meadowlands Project, Series 2017, 144A, 6.500%, 12/01/37 | | | |
| 350 | | Public Finance Authority of Wisconsin, Solid Waste Disposal Revenue Bonds, Waste Management | 5/26 at 100.00 | A– | 353,056 |
| | | Inc., Refunding Series 2016A-2, 2.875%, 5/01/27 (Alternative Minimum Tax) | | | |
| | | University of Wisconsin Hospitals and Clinics Authority, Revenue Bonds, Refunding Series 2013A: | | | |
| 755 | | 4.000%, 4/01/20 | No Opt. Call | AA– | 807,608 |
| 25 | | 5.000%, 4/01/22 | No Opt. Call | AA– | 28,805 |
| 325 | | Wisconsin Health and Educational Facilities Authority, Revenue Bonds, Aurora Health Care, | No Opt. Call | A+ | 354,578 |
| | | Inc., Series 2010B, 5.000%, 7/15/20 | | | |
| 675 | | Wisconsin Health and Educational Facilities Authority, Revenue Bonds, Aurora Health Care, | 7/21 at 100.00 | A+ | 750,060 |
| | | Inc., Series 2012A, 5.000%, 7/15/25 | | | |
| 590 | | Wisconsin Health and Educational Facilities Authority, Revenue Bonds, Marshfield Clinic, | 2/27 at 100.00 | A– | 571,191 |
| | | Series 2017C, 3.250%, 2/15/33 | | | |
| 1,500 | | Wisconsin Health and Educational Facilities Authority, Wisconsin, Revenue Bonds, ThedaCare | 12/24 at 100.00 | AA– | 1,765,905 |
| | | Inc, Series 2015, 5.000%, 12/15/26 | | | |
| | | Wisconsin State, General Fund Annual Appropriation Revenue Bonds, Refunding Series 2009A: | | | |
| 45 | | 5.000%, 5/01/21 | 5/19 at 100.00 | Aa2 | 47,805 |
| 30 | | 5.375%, 5/01/25 | 5/19 at 100.00 | Aa2 | 32,067 |
| 35 | | 5.625%, 5/01/28 | 5/19 at 100.00 | Aa2 | 37,497 |
| | | Wisconsin State, General Fund Annual Appropriation Revenue Bonds, Refunding Series 2009A: | | | |
| 30 | | 5.375%, 5/01/25 (Pre-refunded 5/01/19) | 5/19 at 100.00 | N/R (5) | 32,090 |
| 5 | | 5.625%, 5/01/28 (Pre-refunded 5/01/19) | 5/19 at 100.00 | N/R (5) | 5,368 |
| 35 | | 6.000%, 5/01/33 (Pre-refunded 5/01/19) | 5/19 at 100.00 | N/R (5) | 37,783 |
| 135 | | 6.000%, 5/01/33 (Pre-refunded 5/01/19) | 5/19 at 100.00 | Aa2 (5) | 145,733 |
| 5,135 | | Total Wisconsin | | | 5,657,080 |
| $ 125,112 | | Total Municipal Bonds (cost $122,509,884) | | | 129,294,674 |
26 NUVEEN
| | | | | | | |
Principal | | | | | | |
Amount (000) | | Description (1) | Coupon | Maturity | Ratings (3) | Value |
| | | CORPORATE BONDS – 0.0% | | | | |
| | | Transportation – 0.0% | | | | |
| $ 16 | | Las Vegas Monorail Company, Senior Interest Bonds (7), (8) | 5.500% | 7/15/19 | N/R | $ 10,305 |
| 5 | | Las Vegas Monorail Company, Senior Interest Bonds (7), (8) | 5.500% | 7/15/55 | N/R | 2,243 |
| $ 21 | | Total Corporate Bonds (cost $1,623) | | | | 12,548 |
| | | Total Long-Term Investments (cost $122,511,507) | | | | 129,307,222 |
Principal | | | | Optional Call | | |
Amount (000) | | Description (1) | | Provisions (2) | Ratings (3) | Value |
| | | SHORT-TERM INVESTMENTS – 0.7% | | | | |
| | | MUNICIPAL BONDS – 0.7% | | | | |
| | | Florida – 0.3% | | | | |
| $ 385 | | Miami-Dade County School Board, Florida, Variable Rate Demand Obligation, Certificates | | No Opt. Call | A-2 | $ 385,000 |
| | | of Participation, Tender Option Bond Floater 2013-005, 144A, 1.170%, 5/01/37 (9) | | | | |
| | | Illinois – 0.4% | | | | |
| 285 | | Chicago Board of Education, Illinois, Variable Rate Demand Obligation, General Obligation | | 11/17 at 100.00 | B | 287,972 |
| | | Bonds, Dedicated Alternative Revenue, Project Series 2015G, 9.000%, 3/01/32 (9) | | | | |
| 200 | | Chicago Board of Education, Illinois, Variable Rate Demand Obligation, General Obligation | | 11/17 at 100.00 | B | 202,074 |
| | | Bonds, Dedicated Revenues, Refunding SIFMA Index Series 2013A-2, 9.000%, 3/01/35 (9) | | | | |
| 485 | | Total Illinois | | | | 490,046 |
$ 870 | | Total Short-Term Investments (cost $868,252) | | | | 875,046 |
| | | Total Investments (cost $123,379,759) – 99.4% | | | | 130,182,268 |
| | | Other Assets Less Liabilities – 0.6% | | | | 798,237 |
| | | Net Assets – 100% | | | | $ 130,980,505 |
| | |
| (1) | All percentages shown in the Portfolio of Investments are based on net assets. |
| (2) | Optional Call Provisions: Dates (month and year) and prices of the earliest optional call or redemption. There may be other call provisions at varying prices at later dates. |
| | Certain mortgage-backed securities may be subject to periodic principal paydowns. |
| (3) | For financial reporting purposes, the ratings disclosed are the highest of Standard & Poor's Group ("Standard & Poor's"), Moody's Investors Service, Inc. ("Moody's") or Fitch, |
| | Inc. ("Fitch") rating. This treatment of split-rated securities may differ from that used for other purposes, such as for Fund investment policies. Ratings below BBB by Standard & |
| | Poor's, Baa by Moody's or BBB by Fitch are considered to be below investment grade. Holdings designated N/R are not rated by any of these national rating agencies. |
| (4) | Step-up coupon bond, a bond with a coupon that increases ("steps up"), usually at regular intervals, while the bond is outstanding. The rate shown is the coupon as of the end |
| | of the reporting period. |
| (5) | Backed by an escrow or trust containing sufficient U.S. Government or U.S. Government agency securities, which ensure the timely payment of principal and interest. Certain |
| | bonds backed by U.S. Government or agency securities are regarded as having an implied rating equal to the rating of such securities. |
| (6) | As of, or subsequent to, the end of the reporting period, this security is non-income producing. Non-income producing, in the case of a fixed income security, generally denotes |
| | that the issuer has (1) defaulted on the payment of principal or interest, (2) is under the protection of the Federal Bankruptcy Court or (3) the Fund's Adviser has concluded that |
| | the issue is not likely to meet its future interest payment obligations and has ceased accruing additional income on the Fund's records. |
| (7) | Investment valued at fair value using methods determined in good faith by, or at the discretion of, the Board. For fair value measurement disclosure purposes, investment |
| | classified as Level 3. See Notes to Financial Statements, Note 2 – Investment Valuation and Fair Value Measurements for more information. |
| (8) | During January 2010, Las Vegas Monorail Company ("Las Vegas Monorail") filed for federal bankruptcy protection. During March 2012, Las Vegas Monorail emerged from |
| | federal bankruptcy with the acceptance of a reorganization plan assigned by the Federal Bankruptcy Court. Under the reorganization plan, the Fund surrendered its Las Vegas |
| | Monorail Project Revenue Bonds, First Tier, Series 2000 and in turn received two senior interest corporate bonds: the first with an annual coupon rate of 5.500% maturing on |
| | July 15, 2019 and the second with an annual coupon rate of 3.000% (5.500% after December 31, 2015) maturing on July 15, 2055. The Fund was not accruing income for either |
| | senior interest corporate bond. On January 18, 2017, the Fund's Adviser determined it was likely that this senior interest corporate bond would fulfill its obligation on the |
| | security maturing on July 15, 2019, and therefore began accruing income on the Fund's records. |
| (9) | Investment has a maturity of greater than one year, but has variable rate and demand features which qualify it as a short-term investment. The rate disclosed is that in effect as |
| | of the end of the reporting period. This rate changes periodically based on market conditions or a specified market index. |
| (10) | Variable rate security. The rate shown is the coupon as of the end of the reporting period. |
| 144A | Investment is exempt from registration under Rule 144A of the Securities Act of 1933, as amended. These investments may only be resold in transactions exempt from registration, |
| | which are normally those transactions with qualified institutional buyers. |
| ETM | Escrowed to maturity. |
| LIBOR | London Inter-Bank Offered Rate. |
| WI/DD | Investment, or portion of investment, purchased on a when-issued or delayed delivery basis. |
See accompanying notes to financial statements.
NUVEEN 27
| | |
| Statement of Assets and Liabilities | September 30, 2017 (Unaudited) |
| | |
Assets | |
| Long-term investments, at value (cost $122,511,507) | $129,307,222 |
| Short-term investments, at value (cost $868,252) | 875,046 |
| Cash | 42,489 |
| Receivable for: | |
| Interest | 1,534,204 |
| Investments sold | 330,000 |
| Other assets | 3,301 |
| Total assets | 132,092,262 |
Liabilities | |
| Payable for: | |
| Dividends | 315,923 |
| Investments purchased | 686,951 |
| Accrued expenses: | |
| Management fees | 49,625 |
| Trustees fees | 892 |
| Other | 58,366 |
| Total liabilities | 1,111,757 |
| Net assets | $130,980,505 |
| Shares outstanding | 12,445,363 |
| Net asset value ("NAV") per share outstanding | $ 10.52 |
| |
Net assets consist of: | |
| Shares, $.01 par value per share | $ 124,454 |
| Paid-in surplus | 123,843,472 |
| Undistributed (Over-distribution of) net investment income | 263,929 |
| Accumulated net realized gain (loss) | (53,859) |
| Net unrealized appreciation (depreciation) | 6,802,509 |
| Net assets | $130,980,505 |
| Authorized shares | Unlimited |
See accompanying notes to financial statements.
28 NUVEEN
| | |
| Statement of Operations | Six Months Ended September 30, 2017 (Unaudited) |
| | |
Investment Income | $ 2,452,918 |
Expenses | |
| Management fees | 300,312 |
| Custodian fees | 22,674 |
| Trustees fees | 1,978 |
| Professional fees | 11,973 |
| Shareholder reporting expenses | 18,447 |
| Shareholder servicing agent fees | 1,946 |
| Stock exchange listing fees | 3,493 |
| Investor relations expense | 6,118 |
| Other | 9,180 |
| Total expenses | 376,121 |
| Net investment income (loss) | 2,076,797 |
Realized and Unrealized Gain (Loss) | |
| Net realized gain (loss) from investments | (125) |
| Change in net unrealized appreciation (depreciation) of investments | 2,882,210 |
| Net realized and unrealized gain (loss) | 2,882,085 |
| Net increase (decrease) in net assets from operations | $ 4,958,882 |
See accompanying notes to financial statements.
NUVEEN 29
| | | | | | | |
| Statement of Changes in Net Assets | | | | | (Unaudited) | |
| | |
| | | Six Months | | | Year | |
| | | Ended | | | Ended | |
| | | 9/30/17 | | | 3/31/17 | |
Operations | | | | | | |
| Net investment income (loss) | | $ | 2,076,797 | | | $ | 3,954,543 | |
| Net realized gain (loss) from investments | | | (125 | ) | | | 69,578 | |
| Change in net unrealized appreciation (depreciation) of investments | | | 2,882,210 | | | | (4,483,778 | ) |
| Net increase (decrease) in net assets from operations | | | 4,958,882 | | | | (459,657 | ) |
Distributions to Shareholders | | | | | | | | |
| From net investment income | | | (1,941,476 | ) | | | (3,916,297 | ) |
| From accumulated net realized gains | | | — | | | | (24,891 | ) |
| Decrease in net assets from distributions to shareholders | | | (1,941,476 | ) | | | (3,941,188 | ) |
Capital Share Transactions | | | | | | | | |
| Net proceeds from shares issued to shareholders due to reinvestment of distributions | | | — | | | | 26,761 | |
| Net increase (decrease) in net assets from capital share transactions | | | — | | | | 26,761 | |
| Net increase (decrease) in net assets | | | 3,017,406 | | | | (4,374,084 | ) |
| Net assets at the beginning of period | | | 127,963,099 | | | | 132,337,183 | |
| Net assets at the end of period | | $ | 130,980,505 | | | $ | 127,963,099 | |
| Undistributed (Over-distribution of) net investment income at the end of period | | $ | 263,929 | | | $ | 128,608 | |
See accompanying notes to financial statements.
30 NUVEEN
THIS PAGE INTENTIONALLY LEFT BLANK
NUVEEN 31
| | | | | | | | | | | |
Financial Highlights (Unaudited) | | | | |
| |
| Selected data for a share outstanding throughout each period: | | | | | |
| |
| |
| |
| | | Investment Operations | | | | Less Distributions | | | |
| | | Net | Net | | | | From | | | |
| | | Investment | Realized/ | | | From Net | Accumulated | | | Ending |
| | Beginning | Income | Unrealized | | | Investment | Net Realized | | Ending | Share |
| | NAV | (Loss) | Gain (Loss) | | Total | Income | Gains | Total | NAV | Price |
| Year Ended 3/31: | | | | | | | | | |
| 2018 (c) | $ 10.28 | $ 0.17 | $ 0.23 | | $ 0.40 | $ (0.16) | $ — | $ (0.16) | $ 10.52 | $ 10.31 |
| 2017 | 10.64 | 0.32 | (0.36) | | (0.04) | (0.32) | —* | (0.32) | 10.28 | 9.93 |
| 2016 | 10.59 | 0.32 | 0.06 | | 0.38 | (0.33) | — | (0.33) | 10.64 | 10.57 |
| 2015 | 10.38 | 0.34 | 0.21 | | 0.55 | (0.34) | — | (0.34) | 10.59 | 10.78 |
| 2014 | 10.63 | 0.36 | (0.27) | | 0.09 | (0.34) | — | (0.34) | 10.38 | 10.18 |
| 2013 | 10.45 | 0.37 | 0.18 | | 0.55 | (0.37) | — | (0.37) | 10.63 | 10.35 |
32 NUVEEN
| | | | | | | | | | | | | | | | | | |
| | | | | | | | | | | Ratios/Supplemental Data | | | | |
| | |
| | | Total Returns | | | | | | | | Ratios to Average Net Assets | | | | |
| | | | | Based | | | | | | | | | Net | | | | |
Based | | | | on | | | Ending | | | | | | Investment | | | Portfolio | |
on | | | | Share | | | Net Assets | | | | | | Income | | | Turnover | |
NAV(a) | | | | Price(a) | | | | (000 | ) | | Expenses | | | (Loss) | | | Rate(b) | |
| | |
| | 3.87 | % | | | | 5.46 | % | | $ | 130,981 | | | | 0.58 | %** | | | 3.18 | %** | | | 11 | % |
| | (0.43 | ) | | | | (3.13 | ) | | | 127,963 | | | | 0.58 | | | | 3.01 | | | | 15 | |
| | 3.66 | | | | | 1.24 | | | | 132,337 | | | | 0.57 | | | | 3.01 | | | | 20 | |
| | 5.37 | | | | | 9.39 | | | | 131,818 | | | | 0.58 | | | | 3.23 | | | | 16 | |
| | 0.95 | | | | | 1.83 | | | | 129,153 | | | | 0.58 | | | | 3.44 | | | | 15 | |
| | 5.32 | | | | | 4.77 | | | | 132,277 | | | | 0.56 | | | | 3.51 | | | | 17 | |
| (a) | Total Return Based on NAV is the combination of changes in NAV, reinvested dividend income at NAV and reinvested capital gains distributions at NAV, if any. The last dividend declared in the period, which is typically paid on the first business day of the following month, is assumed to be reinvested at the ending NAV. The actual reinvest price for the last dividend declared in the period may often be based on the Fund's market price (and not its NAV), and therefore may be different from the price used in the calculation. Total returns are not annualized. |
| | Total Return Based on Share Price is the combination of changes in the market price per share and the effect of reinvested dividend income and reinvested capital gains distributions, if any, at the average price paid per share at the time of reinvestment. The last dividend declared in the period, which is typically paid on the first business day of the following month, is assumed to be reinvested at the ending market price. The actual reinvestment for the last dividend declared in the period may take place over several days, and in some instances may not be based on the market price, so the actual reinvestment price may be different from the price used in the calculation. Total returns are not annualized. |
| (b) | Portfolio Turnover Rate is calculated based on the lesser of long-term purchases or sales (as disclosed in Note 5 – Investment Transactions) divided by the average long-term market value during the period. |
| (c) | For the six months ended September 30, 2017. |
| * | Rounds to less than $0.01 per share. |
| ** | Annualized. |
See accompanying notes to financial statements.
NUVEEN 33
| |
Notes to Financial Statements (Unaudited) |
1. General Information and Significant Accounting Policies
General Information
Fund Information
The fund covered in this report and its corresponding New York Stock Exchange ("NYSE") symbol is Nuveen Select Maturities Municipal Fund (NIM) (the "Fund"). The Fund is registered under the Investment Company Act of 1940, as amended, as a diversified, closed-end management investment company. The Fund was organized as a Massachusetts business trust on July 23, 1992.
The end of the reporting period for the Fund is September 30, 2017, and the period covered by these Notes to Financial Statements is the six months ended September 30, 2017 (the "current fiscal period").
Investment Adviser
The Fund's investment adviser is Nuveen Fund Advisors, LLC (the "Adviser"), a subsidiary of Nuveen, LLC ("Nuveen"). Nuveen is the investment management arm of Teachers Insurance and Annuity Association of America (TIAA). The Adviser has overall responsibility for management of the Fund, oversees the management of the Fund's portfolio, manages the Fund's business affairs and provides certain clerical, bookkeeping and other administrative services, and, if necessary, asset allocation decisions. The Adviser has entered into a sub-advisory agreement with Nuveen Asset Management, LLC (the "Sub-Adviser"), a subsidiary of the Adviser, under which the Sub-Adviser manages the investment portfolio of the Fund.
Investment Objective and Principal Investment Strategies
The Fund seeks to provide current income exempt from regular federal income tax, consistent with the preservation of capital by investing in an investment-grade quality portfolio of municipal obligations with intermediate characteristics. In managing its portfolio, the Fund has purchased municipal obligations having remaining effective maturities of no more than fifteen years with respect to 80% of its total assets that, in the opinion of the Sub-Adviser, represent the best value in terms of the balance between yield and capital preservation currently available from the intermediate sector of the municipal market. The Sub-Adviser will actively monitor the effective maturities of the Fund's investments in response to prevailing market conditions, and will adjust its portfolio consistent with its investment policy of maintaining an average effective remaining maturity of twelve years or less.
Significant Accounting Policies
The Fund is an investment company and follows accounting and reporting guidance under Financial Accounting Standards Board (FASB) Accounting Standards Codification (ASC) Topic 946 "Financial Services – Investment Companies." The following is a summary of significant accounting policies followed by the Fund in the preparation of its financial statements in accordance with U.S. generally accepted accounting principles ("U.S. GAAP").
Investment Transactions
Investment transactions are recorded on a trade date basis. Realized gains and losses from investment transactions are determined on the specific identification method, which is the same basis used for federal income tax purposes. Investments purchased on a when-issued/delayed delivery basis may have extended settlement periods. Any investments so purchased are subject to market fluctuation during this period. The Fund has earmarked securities in its portfolio with a current value at least equal to the amount of the when-issued/delayed delivery purchase commitments.
As of the end of the reporting period, the Fund's outstanding when-issued/delayed delivery purchase commitments were as follows:
| | |
| Outstanding when-issued/delayed delivery purchase commitments | $686,951 |
Investment Income
Investment income is comprised of interest income, which reflects the amortization of premiums and accretion of discounts for financial reporting purposes, and is recorded on an accrual basis. Investment income also reflects payment-in-kind ("PIK") interest and paydown gains and losses, if any. PIK interest represents income received in the form of securities in lieu of cash.
Professional Fees
Professional fees presented on the Statement of Operations consist of legal fees incurred in the normal course of operations, audit fees, tax consulting fees and, in some cases, workout expenditures. Workout expenditures are incurred in an attempt to protect or enhance an investment or to pursue other claims or legal actions on behalf of Fund shareholders. If a refund is received for workout expenditures paid in a prior reporting period, such amounts will be recognized as "Legal fee refund" on the Statement of Operations.
34 NUVEEN
Dividends and Distributions to Shareholders
Dividends from net investment income, if any, are declared monthly. Net realized capital gains and/or market discount from investment transactions, if any, are distributed to shareholders at least annually. Furthermore, capital gains are distributed only to the extent they exceed available capital loss carryforwards.
Distributions to shareholders of net investment income, net realized capital gains and/or market discount, if any, are recorded on the ex-dividend date. The amount and timing of distributions are determined in accordance with federal income tax regulations, which may differ from U.S. GAAP.
Compensation
The Fund pays no compensation directly to those of its trustees who are affiliated with the Adviser or to its officers, all of whom receive remuneration for their services to the Fund from the Adviser or its affiliates. The Fund's Board of Trustees (the "Board") has adopted a deferred compensation plan for independent trustees that enables trustees to elect to defer receipt of all or a portion of the annual compensation they are entitled to receive from certain Nuveen-advised funds. Under the plan, deferred amounts are treated as though equal dollar amounts had been invested in shares of select Nuveen-advised funds.
Indemnifications
Under the Fund's organizational documents, its officers and trustees are indemnified against certain liabilities arising out of the performance of their duties to the Fund. In addition, in the normal course of business, the Fund enters into contracts that provide general indemnifications to other parties. The Fund's maximum exposure under these arrangements is unknown as this would involve future claims that may be made against the Fund that have not yet occurred. However, the Fund has not had prior claims or losses pursuant to these contracts and expects the risk of loss to be remote.
Netting Agreements
In the ordinary course of business, the Fund may enter into transactions subject to enforceable International Swaps and Derivative Association, Inc. ("ISDA") master agreements or other similar arrangements ("netting agreements"). Generally, the right to offset in netting agreements allows the Fund to offset certain securities and derivatives with a specific counterparty, when applicable, as well as any collateral received or delivered to that counterparty based on the terms of the agreements. Generally, the Fund manages its cash collateral and securities collateral on a counterparty basis.
The Fund's investments subject to netting agreements as of the end of the reporting period, if any, are further described in Note 3 – Portfolio Securities and Investments in Derivatives.
Use of Estimates
The preparation of financial statements in conformity with U.S. GAAP requires management to make estimates and assumptions that affect the reported amounts of assets and liabilities at the date of the financial statements and the reported amounts of increases and decreases in net assets from operations during the current fiscal period. Actual results may differ from those estimates.
2. Investment Valuation and Fair Value Measurements
The fair valuation input levels as described below are for fair value measurement purposes.
Fair value is defined as the price that would be received upon selling an investment or transferring a liability in an orderly transaction to an independent buyer in the principal or most advantageous market for the investment. A three-tier hierarchy is used to maximize the use of observable market data and minimize the use of unobservable inputs and to establish classification of fair value measurements for disclosure purposes. Observable inputs reflect the assumptions market participants would use in pricing the asset or liability. Observable inputs are based on market data obtained from sources independent of the reporting entity. Unobservable inputs reflect the reporting entity's own assumptions about the assumptions market participants would use in pricing the asset or liability. Unobservable inputs are based on the best information available in the circumstances. The following is a summary of the three-tiered hierarchy of valuation input levels.
Level 1 – Inputs are unadjusted and prices are determined using quoted prices in active markets for identical securities.
Level 2 – Prices are determined using other significant observable inputs (including quoted prices for similar securities, interest rates, prepayment speeds, credit risk, etc.).
Level 3 – Prices are determined using significant unobservable inputs (including management's assumptions in determining the fair value of investments).
Prices of fixed income securities are provided by an independent pricing service ("pricing service") approved by the Board. The pricing service establishes a security's fair value using methods that may include consideration of the following: yields or prices of investments of comparable quality, type of issue, coupon, maturity and rating, market quotes or indications of value from security dealers, evaluations of anticipated cash flows or collateral, general market conditions and other information and analysis, including the obligor's credit characteristics considered relevant. These securities are generally classified as Level 2. In pricing certain securities, particularly less liquid and lower quality securities, the pricing service may consider information about a security, its issuer or market activity, provided by the Adviser. These securities are generally classified as Level 2 or Level 3 depending on the observability of the significant inputs.
NUVEEN 35
Notes to Financial Statements (Unaudited) (continued)
Certain securities may not be able to be priced by the pre-established pricing methods as described above. Such securities may be valued by the Board and/or its appointee at fair value. These securities generally include, but are not limited to, restricted securities (securities which may not be publicly sold without registration under the Securities Act of 1933, as amended) for which a pricing service is unable to provide a market price; securities whose trading has been formally suspended; debt securities that have gone into default and for which there is no current market quotation; a security whose market price is not available from a pre-established pricing source; a security with respect to which an event has occurred that is likely to materially affect the value of the security after the market has closed but before the calculation of the Fund's net asset value ("NAV") (as may be the case in non-U.S. markets on which the security is primarily traded) or make it difficult or impossible to obtain a reliable market quotation; and a security whose price, as provided by the pricing service, is not deemed to reflect the security's fair value. As a general principle, the fair value of a security would appear to be the amount that the owner might reasonably expect to receive for it in a current sale. A variety of factors may be considered in determining the fair value of such securities, which may include consideration of the following: yields or prices of investments of comparable quality, type of issue, coupon, maturity and rating, market quotes or indications of value from security dealers, evaluations of anticipated cash flows or collateral, general market conditions and other information and analysis, including the obligor's credit characteristics considered relevant. These securities are generally classified as Level 2 or Level 3 depending on the observability of the significant inputs. Regardless of the method employed to value a particular security, all valuations are subject to review by the Board and/or its appointee.
The inputs or methodologies used for valuing securities are not an indication of the risks associated with investing in those securities. The following is a summary of the Fund's fair value measurements as of the end of the reporting period:
| | | | | | | | | | | | | |
| | | Level 1 | | | Level 2 | | | Level 3 | | | Total | |
| Long-Term Investments: | | | | | | | | | | | | |
| Municipal Bonds* | | $ | — | | | $ | 129,294,674 | | | $ | — | | | $ | 129,294,674 | |
| Corporate Bonds** | | | — | | | | — | | | | 12,548 | *** | | | 12,548 | |
| Short-Term Investments: | | | | | | | | | | | | | | | | |
| Municipal Bonds* | | | — | | | | 875,046 | | | | — | | | | 875,046 | |
| Total | | $ | — | | | $ | 130,169,720 | | | $ | 12,548 | | | $ | 130,182,268 | |
| * | Refer to the Fund's Portfolio of Investments for state classifications. |
| ** | Refer to the Fund's Portfolio of Investments for industry classifications. |
| *** | Refer to the Fund's Portfolio of Investments for securities classified as Level 3. |
The Board is responsible for the valuation process and has appointed the oversight of the daily valuation process to the Adviser's Valuation Committee. The Valuation Committee, pursuant to the valuation policies and procedures adopted by the Board, is responsible for making fair value determinations, evaluating the effectiveness of the Fund's pricing policies and reporting to the Board. The Valuation Committee is aided in its efforts by the Adviser's dedicated Securities Valuation Team, which is responsible for administering the daily valuation process and applying fair value methodologies as approved by the Valuation Committee. When determining the reliability of independent pricing services for investments owned by the Fund, the Valuation Committee, among other things, conducts due diligence reviews of the pricing services and monitors the quality of security prices received through various testing reports conducted by the Securities Valuation Team.
The Valuation Committee will consider pricing methodologies it deems relevant and appropriate when making a fair value determination, based on the facts and circumstances specific to the portfolio instrument. Fair value determinations generally will be derived as follows, using public or private market information:
| (i) | If available, fair value determinations shall be derived by extrapolating from recent transactions or quoted prices for identical or comparable securities. |
| (ii) | If such information is not available, an analytical valuation methodology may be used based on other available information including, but not limited to: analyst appraisals, research reports, corporate action information, issuer financial statements and shelf registration statements. Such analytical valuation methodologies may include, but are not limited to: multiple of earnings, discount from market value of a similar freely-traded security, discounted cash flow analysis, book value or a multiple thereof, risk premium/yield analysis, yield to maturity and/or fundamental investment analysis. |
The purchase price of a portfolio instrument will be used to fair value the instrument only if no other valuation methodology is available or deemed appropriate, and it is determined that the purchase price fairly reflects the instrument's current value.
For each portfolio security that has been fair valued pursuant to the policies adopted by the Board, the fair value price is compared against the last available and next available market quotations. The Valuation Committee reviews the results of such testing and fair valuation occurrences are reported to the Board.
36 NUVEEN
3. Portfolio Securities and Investments in Derivatives
Portfolio Securities
Zero Coupon Securities
A zero coupon security does not pay a regular interest coupon to its holders during the life of the security. Income to the holder of the security comes from accretion of the difference between the original purchase price of the security at issuance and the par value of the security at maturity and is effectively paid at maturity. The market prices of zero coupon securities generally are more volatile than the market prices of securities that pay interest periodically.
Investments in Derivatives
The Fund is authorized to invest in certain derivative instruments such as futures, options and swap contracts. The Fund limits its investments in futures, options on futures and swap contracts to the extent necessary for the Adviser to claim the exclusion from registration by the Commodity Futures Trading Commission as a commodity pool operator with respect to the Fund. The Fund records derivative instruments at fair value, with changes in fair value recognized on the Statement of Operations, when applicable. Even though the Fund's investments in derivatives may represent economic hedges, they are not considered to be hedge transactions for financial reporting purposes.
Although the Fund is authorized to invest in derivative instruments and may do so in the future, it did not make any such investments during the current fiscal period.
Market and Counterparty Credit Risk
In the normal course of business the Fund may invest in financial instruments and enter into financial transactions where risk of potential loss exists due to changes in the market (market risk) or failure of the other party to the transaction to perform (counterparty credit risk). The potential loss could exceed the value of the financial assets recorded on the financial statements. Financial assets, which potentially expose the Fund to counterparty credit risk, consist principally of cash due from counterparties on forward, option and swap transactions, when applicable. The extent of the Fund's exposure to counterparty credit risk in respect to these financial assets approximates their carrying value as recorded on the Statement of Assets and Liabilities.
The Fund helps manage counterparty credit risk by entering into agreements only with counterparties the Adviser believes have the financial resources to honor their obligations and by having the Adviser monitor the financial stability of the counterparties. Additionally, counterparties may be required to pledge collateral daily (based on the daily valuation of the financial asset) on behalf of the Fund with a value approximately equal to the amount of any unrealized gain above a pre-determined threshold. Reciprocally, when the Fund has an unrealized loss, the Fund has instructed the custodian to pledge assets of the Fund as collateral with a value approximately equal to the amount of the unrealized loss above a pre-determined threshold. Collateral pledges are monitored and subsequently adjusted if and when the valuations fluctuate, either up or down, by at least the pre-determined threshold amount.
4. Fund Shares
Transactions in Fund shares during the Fund's current and prior fiscal period, were as follows:
| | | |
| | Six Months | Year |
| | Ended | Ended |
| | 9/30/17 | 3/31/17 |
| Shares issued to shareholders due to reinvestment of distributions | — | 2,482 |
5. Investment Transactions
Long-term purchases and sales (including maturities) during the current fiscal period aggregated $14,404,310 and $14,046,047, respectively.
6. Income Tax Information
The Fund intends to distribute substantially all of its net investment income and net capital gains to shareholders and to otherwise comply with the requirements of Subchapter M of the Internal Revenue Code applicable to regulated investment companies. Therefore, no federal income tax provision is required. Furthermore, the Fund intends to satisfy conditions that will enable interest from municipal securities, which is exempt from regular federal and designated state income taxes, to retain such tax-exempt status when distributed to shareholders of the Fund. Net realized capital gains and ordinary income distributions paid by the Fund are subject to federal taxation.
For all open tax years and all major taxing jurisdictions, management of the Fund has concluded that there are no significant uncertain tax positions that would require recognition in the financial statements. Open tax years are those that are open for examination by taxing authorities (i.e., generally the last four tax year ends and the interim tax period since then). Furthermore, management of the Fund is also not aware of any tax positions for which it is reasonably possible that the total amounts of unrecognized tax benefits will significantly change in the next twelve months.
The following information is presented on an income tax basis. Differences between amounts for financial statement and federal income tax purposes are primarily due to timing differences in recognizing taxable market discount and timing differences in recognizing certain gains and losses on investment transactions. To the extent that differences arise that are permanent in nature, such amounts are reclassified within the capital accounts as detailed below. Temporary differences do not require reclassification. Temporary and permanent differences do not impact the NAV of the Fund.
NUVEEN 37
Notes to Financial Statements (Unaudited) (continued)
The table below presents the cost and unrealized appreciation (depreciation) of the Fund's investment portfolio, as determined on a federal income tax basis as of September 30, 2017.
| | | | |
| Tax cost of investments | | $ | 123,212,007 | |
| Gross unrealized: | | | | |
| Appreciation | | $ | 7,516,232 | |
| Depreciation | | | (545,971 | ) |
| Net unrealized appreciation (depreciation) of investments | | $ | 6,970,261 | |
Permanent differences, primarily due to taxable market discount and distribution reallocations, resulted in reclassifications among the Fund's components of net assets as of March 31, 2017, the Fund's last tax year end, as follows:
| | | | |
| Paid-in-surplus | | $ | — | |
| Undistributed (Over-distribution of) net investment income | | | (23,901 | ) |
| Accumulated net realized gain (loss) | | | 23,901 | |
The tax components of undistributed net tax-exempt income, net ordinary income and net long-term capital gains as of March 31, 2017, the Fund's last tax year end, were as follows:
| Undistributed net tax-exempt income1 | | $ | 281,923 | |
| Undistributed net ordinary income2 | | | — | |
| Undistributed net long-term capital gains | | | — | |
1 Undistributed net tax-exempt income (on a tax basis) has not been reduced for the dividend declared on March 1, 2017, paid on April 3, 2017. 2 Net ordinary income consists of taxable market discount income and net short-term capital gains, if any. | |
The tax character of distributions paid during the Fund's last tax year ended March 31, 2017 was designated for purposes of the dividends paid deduction as follows:
| | | | |
| Distributions from net tax-exempt income | | $ | 3,900,840 | |
Distributions from net ordinary income2 | | | 33,870 | |
| Distributions from net long-term capital gains | | | 6,414 | |
2 Net ordinary income consists of taxable market discount income and net short-term capital gains, if any. | | | | |
| | | | |
During the Fund's last tax year ended March 31, 2017, the Fund utilized $110,784 of its capital loss carryforward.
The Fund has elected to defer late-year losses in accordance with federal income tax rules. These losses are treated as having arisen on the first day of the current fiscal year. The Fund has elected to defer losses as follows:
| | | | |
Post-October capital losses3 | | $ | 38,202 | |
Late-year ordinary losses4 | | | — | |
3 Capital losses incurred from November 1, 2016 through March 31, 2017, the Fund's last tax year end. |
4 Ordinary losses incurred from January 1, 2017 through March 31, 2017 and/or specified losses incurred from November 1, 2016 through March 31, 2017. |
38 NUVEEN
7. Management Fees and Other Transactions with Affiliates
Management Fees
The Fund's management fee compensates the Adviser for overall investment advisory and administrative services and general office facilities. The Sub-Adviser is compensated for its services to the Fund from the management fees paid to the Adviser.
The Fund's management fee consists of two components – a fund-level fee, based only on the amount of assets within the Fund, and a complex-level fee, based on the aggregate amount of all eligible fund assets managed by the Adviser. This pricing structure enables Fund shareholders to benefit from growth in the assets within the Fund as well as from growth in the amount of complex-wide assets managed by the Adviser.
| | | | |
The annual Fund-level fee, payable monthly, is calculated according to the following schedule: | | | |
Average Daily Net Assets* | | Fund-Level Fee | |
| For the first $125 million | | | 0.3000 | % |
| For the next $125 million | | | 0.2875 | |
| For the next $250 million | | | 0.2750 | |
| For the next $500 million | | | 0.2625 | |
| For the next $1 billion | | | 0.2500 | |
| For the next $3 billion | | | 0.2250 | |
| For managed assets over $5 billion | | | 0.2125 | |
The annual complex-level fee, payable monthly, is calculated by multiplying the current complex-wide fee rate, determined according to the following schedule by the Fund's daily net assets:
| | | | |
Complex-Level Managed Asset Breakpoint Level* | | Effective Rate at Breakpoint Level | |
| $55 billion | | | 0.2000 | % |
| $56 billion | | | 0.1996 | |
| $57 billion | | | 0.1989 | |
| $60 billion | | | 0.1961 | |
| $63 billion | | | 0.1931 | |
| $66 billion | | | 0.1900 | |
| $71 billion | | | 0.1851 | |
| $76 billion | | | 0.1806 | |
| $80 billion | | | 0.1773 | |
| $91 billion | | | 0.1691 | |
| $125 billion | | | 0.1599 | |
| $200 billion | | | 0.1505 | |
| $250 billion | | | 0.1469 | |
| $300 billion | | | 0.1445 | |
| * | For the complex-level fees, managed assets include closed-end fund assets managed by the Adviser that are attributable to certain types of leverage. For these purposes, leverage includes the funds' use of preferred stock and borrowings and certain investments in the residual interest certificates (also called inverse floating rate securities) in tender option bond (TOB) trusts, including the portion of assets held by a TOB trust that has been effectively financed by the trust's issuance of floating rate securities, subject to an agreement by the Adviser as to certain funds to limit the amount of such assets for determining managed assets in certain circumstances. The complex-level fee is calculated based upon the aggregate daily managed assets of all Nuveen funds that constitute "eligible assets." Eligible assets do not include assets attributable to investments in other Nuveen funds or assets in excess of a determined amount (originally $2 billion) added to the Nuveen fund complex in connection with the Adviser's assumption of the management of the former First American Funds effective January 1, 2011. As of September 30, 2017, the complex- level fee rate for the Fund was 0.1599%. |
Other Transactions with Affiliates
The Fund is permitted to purchase or sell securities from or to certain other funds managed by the Adviser ("inter-fund trade") under specified conditions outlined in procedures adopted by the Board. These procedures have been designed to ensure that any inter-fund trade of securities by the Fund from or to another fund that is, or could be, considered an affiliate of the Fund under certain limited circumstances by virtue of having a common investment adviser (or affiliated investment adviser), common officer and/or common trustee complies with Rule 17a-7 of the 1940 Act. Further, as defined under these procedures, each inter-fund trade is effected at the current market price as provided by an independent pricing service. Unsettled inter-fund trades as of the end of the reporting period are recognized as a component of "Receivable for investments sold" and/or "Payable for investments purchased" on the Statement of Assets and Liabilities, when applicable.
During the current fiscal period, the Fund did not engage in inter-fund trades pursuant to these procedures.
NUVEEN 39
Notes to Financial Statements (Unaudited) (continued)
8. Borrowing Arrangements
Uncommitted Line of Credit
During the current fiscal period, the Fund participated in an unsecured bank line of credit ("Unsecured Credit Line") under which outstanding balances would bear interest at a variable rate. Although the Fund participated in the Unsecured Credit Line, it did not have any outstanding balances during the current fiscal period.
The Unsecured Credit Line was not renewed after its schedule termination date on July 27, 2017.
Committed Line of Credit
The Fund, along with certain other funds managed by the Adviser ("Participating Funds"), have established a 364-day, approximately $3 billion standby credit facility with a group of lenders, under which the Participating Funds may borrow for various purposes other than leveraging for investment purposes. A large portion of this facility's capacity (and its associated costs as described below) is currently dedicated for use by a small number of Participating Funds, which does not include the Fund covered by this shareholder report. The remaining capacity under the facility (and the corresponding portion of the facility's annual costs) is separately dedicated to most of the other open-end funds in the Nuveen fund family, along with a number of Nuveen closed-end funds, including the Fund covered by this shareholder report. The credit facility expires in July 2018 unless extended or renewed.
The credit facility has the following terms: a fee of 0.15% per annum on unused commitment amounts, and interest at a rate equal to the higher of (a) one-month LIBOR (London Inter-Bank Offered Rate) plus 1.25% per annum or (b) the Fed Funds rate plus 1.25% per annum on amounts borrowed. Participating Funds paid administration, legal and arrangement fees, which are recognized as a component of "Other expenses" on the Statement of Operations, and along with commitment fees, have been allocated among such Participating Funds based upon the relative proportions of the facility's aggregate capacity reserved for them and other factors deemed relevant by the Adviser and the Board of each Participating Fund.
During the current fiscal period, the Fund did not utilize this facility.
Inter-Fund Borrowing and Lending
The Securities and Exchange Commission ("SEC") has granted an exemptive order permitting registered open-end and closed-end Nuveen funds to participate in an inter-fund lending facility whereby the Nuveen funds may directly lend to and borrow money from each other for temporary purposes (e.g., to satisfy redemption requests or when a sale of securities "fails," resulting in an unanticipated cash shortfall) (the "Inter-Fund Program"). The closed-end Nuveen funds, including the Fund covered by this shareholder report, will participate only as lenders, and not as borrowers, in the Inter-Fund Program because such closed-end funds rarely, if ever, need to borrow cash to meet redemptions. The Inter-Fund Program is subject to a number of conditions, including, among other things, the requirements that (1) no fund may borrow or lend money through the Inter-Fund Program unless it receives a more favorable interest rate than is typically available from a bank or other financial institution for a comparable transaction; (2) no fund may borrow on an unsecured basis through the Inter-Fund Program unless the fund's outstanding borrowings from all sources immediately after the inter-fund borrowing total 10% or less of its total assets; provided that if the borrowing fund has a secured borrowing outstanding from any other lender, including but not limited to another fund, the inter-fund loan must be secured on at least an equal priority basis with at least an equivalent percentage of collateral to loan value; (3) if a fund's total outstanding borrowings immediately after an inter-fund borrowing would be greater than 10% of its total assets, the fund may borrow through the inter-fund loan on a secured basis only; (4) no fund may lend money if the loan would cause its aggregate outstanding loans through the Inter-Fund Program to exceed 15% of its net assets at the time of the loan; (5) a fund's inter-fund loans to any one fund shall not exceed 5% of the lending fund's net assets; (6) the duration of inter-fund loans will be limited to the time required to receive payment for securities sold, but in no event more than seven days; and (7) each inter-fund loan may be called on one business day's notice by a lending fund and may be repaid on any day by a borrowing fund. In addition, a Nuveen fund may participate in the Inter-Fund Program only if and to the extent that such participation is consistent with the fund's investment objective and investment policies. The Board is responsible for overseeing the Inter-Fund Program.
The limitations detailed above and the other conditions of the SEC exemptive order permitting the Inter-Fund Program are designed to minimize the risks associated with Inter-Fund Program for both the lending fund and the borrowing fund. However, no borrowing or lending activity is without risk. When a fund borrows money from another fund, there is a risk that the loan could be called on one day's notice or not renewed, in which case the fund may have to borrow from a bank at a higher rate or take other actions to payoff such loan if an inter-fund loan is not available from another fund. Any delay in repayment to a lending fund could result in a lost investment opportunity or additional borrowing costs.
During May 2017, the Board approved the Nuveen funds participation in the Inter-Fund Program. During the current reporting period, none of the Funds have entered into any inter-fund loan activity.
40 NUVEEN
9. New Accounting Pronouncements
Accounting Standards Update ("ASU") 2017-08 ("ASU 2017-08") Premium Amortization on Purchased Callable Debt Securities
During March 2017, the Financial Accounting Standards Board ("FASB") issued ASU 2017-08, which shortens the premium amortization period for purchased non-contingently callable debt securities. ASU 2017-08 specifies that the premium amortization period ends at the earliest call date, for purchased non-contingently callable debt securities. ASU 2017-08 is effective for fiscal years, and interim periods within those fiscal years, beginning after December 15, 2018. Management is currently evaluating the implications of ASU 2017-08, if any.
NUVEEN 41
| | | | | | |
Additional Fund Information |
| |
| |
Board of Trustees | | | | | |
| Margo Cook* | Jack B. Evans | William C. Hunter | David J. Kundert | Albin F. Moschner | John K. Nelson |
| William J. Schneider | Judith M. Stockdale | Carole E. Stone | Terence J. Toth | Margaret L. Wolff | Robert L. Young |
| |
| * Interested Board Member. | | | | | |
| |
| |
Fund Manager | Custodian | Legal Counsel | Independent Registered | Transfer Agent and |
| Nuveen Fund Advisors, LLC | State Street Bank | Chapman and Cutler LLP | Public Accounting Firm | Shareholder Services |
| 333 West Wacker Drive | & Trust Company | Chicago, IL 60603 | KPMG LLP | | Computershare Trust |
| Chicago, IL 60606 | One Lincoln Street | | 200 East Randolph Drive | Company, N.A. |
| | Boston, MA 02111 | | Chicago, IL 60601 | | 250 Royall Street |
| | | | | | Canton, MA 02021 |
| | | | | | (800) 257-8787 |
Quarterly Form N-Q Portfolio of Investments Information
The Fund is required to file its complete schedule of portfolio holdings with the Securities and Exchange Commission (SEC) for the first and third quarters of each fiscal year on Form N-Q. You may obtain this information directly from the SEC. Visit the SEC on-line at http://www.sec.gov or in person at the SEC's Public Reference Room in Washington, D.C. Call the SEC toll-free at (800) SEC-0330 for room hours and operation.
Nuveen Funds' Proxy Voting Information
You may obtain (i) information regarding how each fund voted proxies relating to portfolio securities held during the most recent twelve-month period ended June 30, without charge, upon request, by calling Nuveen toll-free at (800) 257-8787 or on Nuveen's website at www.nuveen.com and (ii) a description of the policies and procedures that each fund used to determine how to vote proxies relating to portfolio securities without charge, upon request, by calling Nuveen toll free at (800) 257-8787. You may also obtain this information directly from the SEC. Visit the SEC online at http://www.sec.gov.
CEO Certification Disclosure
The Fund's Chief Executive Officer (CEO) has submitted to the New York Stock Exchange (NYSE) the annual CEO certification as required by Section 303A.12(a) of the NYSE Listed Company Manual. The Fund has filed with the SEC the certification of its CEO and Chief Financial Officer required by Section 302 of the Sarbanes-Oxley Act.
Share Repurchases
The Fund intends to repurchase, through its open-market share repurchase program, shares of its own common stock at such times and in such amounts as is deemed advisable. During the period covered by this report, the Fund repurchased shares of its common stock as shown in the accompanying table. Any future repurchases will be reported to shareholders in the next annual or semi-annual report.
FINRA BrokerCheck
The Financial Industry Regulatory Authority (FINRA) provides information regarding the disciplinary history of FINRA member firms and associated investment professionals. This information as well as an investor brochure describing FINRA BrokerCheck is available to the public by calling the FINRA BrokerCheck Hotline number at (800) 289-9999 or by visiting www.FINRA.org.
42 NUVEEN
Glossary of Terms Used in this Report
| · | Auction Rate Bond: An auction rate bond is a security whose interest payments are adjusted periodically through an auction process, which process typically also serves as a means for buying and selling the bond. Auctions that fail to attract enough buyers for all the shares offered for sale are deemed to have "failed," with current holders receiving a formula-based interest rate until the next scheduled auction. |
| · | Average Annual Total Return: This is a commonly used method to express an investment's performance over a particular, usually multi-year time period. It expresses the return that would have been necessary each year to equal the invest- ment's actual cumulative performance (including change in NAV or market price and reinvested dividends and capital gains distributions, if any) over the time period being considered. |
| · | Duration: Duration is a measure of the expected period over which a bond's principal and interest will be paid, and consequently is a measure of the sensitivity of a bond's or bond fund's value to changes when market interest rates change. Generally, the longer a bond's or fund's duration, the more the price of the bond or fund will change as interest rates change. |
| · | Net Asset Value (NAV) Per Share: A fund's Net Assets is equal to its total assets (securities, cash, accrued earnings and receiv- ables) less its total liabilities. NAV per share is equal to the fund's Net Assets divided by its number of shares outstanding. |
| · | Pre-Refunding: Pre-Refunding, also known as advanced refundings or refinancings, is a procedure used by state and local governments to refinance municipal bonds to lower interest expenses. The issuer sells new bonds with a lower yield and uses the proceeds to buy U.S. Treasury securities, the interest from which is used to make payments on the higher-yielding bonds. Because of this collateral, pre-refunding generally raises a bond's credit rating and thus its value. |
| · | S&P Municipal Bond Intermediate Index: An unleveraged, market value-weighted index containing all of the bonds in the S&P Municipal Bond Index with maturity dates between 3 and 14.999 years. Index returns assume reinvestment of distributions, but do not reflect any applicable sales charges or management fees. |
| · | Zero Coupon Bond: A zero coupon bond does not pay a regular interest coupon to its holders during the life of the bond. Income to the holder of the bond comes from accretion of the difference between the original purchase price of the bond at issuance and the par value of the bond at maturity and is effectively paid at maturity. The market prices of zero coupon bonds generally are more volatile than the market prices of bonds that pay interest periodically. |
NUVEEN 43
Reinvest Automatically, Easily and Conveniently
Nuveen makes reinvesting easy. A phone call is all it takes to set up your reinvestment account.
Nuveen Closed-End Funds Automatic Reinvestment Plan
Nuveen Closed-End Fund allows you to conveniently reinvest distributions in additional Fund shares. By choosing to reinvest, you'll be able to invest money regularly and automatically, and watch your investment grow through the power of compounding. Just like distributions in cash, there may be times when income or capital gains taxes may be payable on distributions that are reinvested. It is important to note that an automatic reinvestment plan does not ensure a profit, nor does it protect you against loss in a declining market.
Easy and convenient
To make recordkeeping easy and convenient, each month you'll receive a statement showing your total distributions, the date of investment, the shares acquired and the price per share, and the total number of shares you own.
How shares are purchased
The shares you acquire by reinvesting will either be purchased on the open market or newly issued by the Fund. If the shares are trading at or above net asset value at the time of valuation, the Fund will issue new shares at the greater of the net asset value or 95% of the then-current market price. If the shares are trading at less than net asset value, shares for your account will be purchased on the open market. If the Plan Agent begins purchasing Fund shares on the open market while shares are trading below net asset value, but the Fund's shares subsequently trade at or above their net asset value before the Plan Agent is able to complete its purchases, the Plan Agent may cease open-market purchases and may invest the uninvested portion of the distribution in newly-issued Fund shares at a price equal to the greater of the shares' net asset value or 95% of the shares' market value on the last business day immediately prior to the purchase date. Distributions received to purchase shares in the open market will normally be invested shortly after the distribution payment date. No interest will be paid on distributions awaiting reinvestment. Because the market price of the shares may increase before purchases are completed, the average purchase price per share may exceed the market price at the time of valuation, resulting in the acquisition of fewer shares than if the distribution had been paid in shares issued by the Fund. A pro rata portion of any applicable brokerage commissions on open market purchases will be paid by Plan participants. These commissions usually will be lower than those charged on individual transactions.
Flexible
You may change your distribution option or withdraw from the Plan at any time, should your needs or situation change. You can reinvest whether your shares are registered in your name, or in the name of a brokerage firm, bank, or other nominee. Ask your investment advisor if his or her firm will participate on your behalf. Participants whose shares are registered in the name of one firm may not be able to transfer the shares to another firm and continue to participate in the Plan. The Fund reserves the right to amend or terminate the Plan at any time. Although the Fund reserves the right to amend the Plan to include a service charge payable by the participants, there is no direct service charge to participants in the Plan at this time.
Call today to start reinvesting distributions
For more information on the Nuveen Automatic Reinvestment Plan or to enroll in or withdraw from the Plan, speak with your financial advisor or call us at (800) 257-8787.
44 NUVEEN
Annual Investment Management Agreement Approval Process (Unaudited)
The Board of Trustees (the "Board," and each Trustee, a "Board Member") of the Fund, including the Board Members who are not parties to the Fund's advisory or sub-advisory agreement or "interested persons" of any such parties (the "Independent Board Members"), oversees the management of the Fund, including the performance of Nuveen Fund Advisors, LLC, the Fund's investment adviser (the "Adviser"), and Nuveen Asset Management, LLC, the Fund's sub-adviser (the "Sub-Adviser"). As required by applicable law, after the initial term of the Fund following commencement of its operations, the Board is required to consider annually whether to renew the Fund's management agreement with the Adviser (the "Investment Management Agreement") and its sub-advisory agreement with the Sub-Adviser (the "Sub-Advisory Agreement" and, together with the Investment Management Agreement, the "Advisory Agreements"). Accordingly, the Board met in person on April 11-12, 2017 (the "April Meeting") and May 23-25, 2017 (the "May Meeting") to consider the approval of each Advisory Agreement for the Fund that was up for renewal for an additional one-year period.
The Board considered its review of the Advisory Agreements as an ongoing process encompassing the information received and the deliberations the Board and its committees have had throughout the year. The Board met regularly during the year and received materials and discussed topics that were relevant to the annual consideration of the renewal of the Advisory Agreements, including, among other things, overall market performance and developments; fund investment performance; investment team review; valuation of securities; compliance, regulatory and risk management matters; and other developments. The Board had also established several standing committees, including the Open-end Fund Committee and Closed-end Fund Committee, which met regularly throughout the year to permit the Board Members to delve deeper into the topics particularly relevant to the respective product line. The Board further continued its practice of seeking to meet periodically with the Sub-Adviser and its investment team. The accumulated information, knowledge, and experience the Board Members had gained during their tenure on the Board governing the Fund and working with the Fund Advisers (as defined below) were taken into account in their review of the Advisory Agreements.
In addition to the materials received by the Board or its committees throughout the year, the Board reviewed extensive additional materials prepared specifically for its annual review of the Advisory Agreements in response to a request by independent legal counsel on behalf of the Independent Board Members. The materials addressed a variety of topics, including, but not limited to, a description of the services provided by the Adviser and Sub-Adviser (the Adviser and the Sub-Adviser are each a "Fund Adviser"); an analysis of fund performance including comparative industry data and a detailed focus on any performance outliers; an analysis of the Sub-Adviser; an analysis of the fees and expense ratios of the Nuveen funds in absolute terms and in comparison to the fees and expenses of peers with a focus on any expense outliers; an assessment of shareholder services for the Nuveen funds and of the performance of certain service providers; a review of initiatives instituted or continued during the past year; a review of premium/discount trends and leverage management for the closed-end funds; and information regarding the profitability of the Fund Advisers, the compensation of portfolio managers, and compliance and risk matters. The materials provided in connection with the annual review included information compiled and prepared by Broadridge Financial Solutions, Inc. ("Broadridge" or "Lipper"), an independent provider of investment company data, comparing, in relevant part, the Fund's fees and expenses with those of a comparable universe of funds (the "Peer Universe"), as selected by Broadridge (the "Broadridge Report"). The Independent Board Members also received a memorandum from independent legal counsel outlining their fiduciary duties and legal standards in reviewing the Advisory Agreements.
As part of its annual review, the Board met at the April Meeting to review the investment performance of the Fund and to consider the Adviser's analysis of the Sub-Adviser evaluating, among other things, the Sub-Adviser's assets under management, investment
NUVEEN 45
Annual Investment Management Agreement Approval Process (Unaudited) (continued)
team, performance, organizational stability, and investment approach. During the review, the Independent Board Members requested and received additional information from management. At the May Meeting, the Board, including the Independent Board Members, continued its review and ultimately approved the continuation of the Advisory Agreements for an additional year. Throughout the year and throughout their review of the Advisory Agreements, the Independent Board Members were assisted by independent legal counsel and met with counsel separately without management present. In deciding to renew the Advisory Agreements, the Independent Board Members did not identify a particular factor as determinative, but rather the decision reflected the comprehensive consideration of all the information presented, and each Board Member may have attributed different weights to the various factors and information considered in connection with the approval process. The following summarizes the principal factors, but not all the factors, the Board considered in its review of the Advisory Agreements and its conclusions.
A. Nature, Extent and Quality of Services
In evaluating the renewal of the Advisory Agreements, the Independent Board Members received and considered information regarding the nature, extent and quality of the applicable Fund Adviser's services provided to the Fund and the resulting performance of the Fund. The Board recognized the myriad of services the Adviser and its affiliates provided to manage and operate the Nuveen funds, including (a) product management (such as managing distributions, positioning the product in the marketplace, maintaining and enhancing shareholder communications and reporting to the Board); (b) investment oversight, risk management and securities valuation (such as overseeing the sub-advisers and other service providers, analyzing investment performance and risks, overseeing risk management and disclosure, executing the daily valuation of securities, and analyzing trade execution); (c) fund administration (such as helping to prepare fund tax returns and complete other tax compliance matters and helping to prepare regulatory filings and shareholder reports); (d) fund board administration (such as preparing board materials and organizing and providing assistance for board meetings); (e) compliance (such as helping to devise and maintain the Nuveen funds' compliance program and test for adherence); (f) legal support (such as helping to prepare registration statements and proxy statements, interpreting regulations and policies and overseeing fund activities); (g) with respect to certain closed-end funds, providing leverage, capital and distribution management services; and (h) with respect to certain open-end funds with portfolios that have a leverage component, providing such leverage management services.
The Board further noted the Adviser's continued dedication to investing in its business to enhance the quality and breadth of the services provided to the Fund. The Board recognized the Adviser's investment in staffing over recent years to support the services provided to the Nuveen funds in key areas, including in investment services, product management, retail distribution and information technology, closed-end funds and structured products, as well as in fund administration, operations and risk management. The Board further noted the Adviser's continued commitment to enhancing its compliance program by, among other things, restructuring the compliance organization, developing a unified compliance program, adding compliance staff, and developing and/or revising policies and procedures as well as building further infrastructure to address new regulatory requirements or guidance and the growth of the complex. The Board also considered the enhancements to Nuveen's cyberse-curity capabilities, systems and processes to value securities, stress test reporting and risk and control self-assessments.
In addition, the Independent Board Members considered information highlighting the various initiatives that the Adviser had implemented or continued over recent years to benefit the open-end fund and closed-end fund product lines and/or particular Nuveen funds. The Board noted the Adviser's continued efforts to rationalize the open-end fund and closed-end fund product lines through, among other things, mergers, liquidations and repositionings in seeking to provide enhanced shareholder value over the years through increased efficiency, reduced costs, improved performance and revised investment approaches that are more relevant to current shareholder needs. With respect to closed-end Nuveen funds, such initiatives included (a) an increased level of leverage management activities in 2016 and 2017 resulting from the rollover of existing facilities, the negotiation of improved terms and pricing to reduce leverage costs, the innovation of new leverage structures, the rebalancing of leverage of various funds as a result of mergers or new investment mandates, and the restructuring of tender option bonds to be compliant
46 NUVEEN
with new regulatory requirements; (b) an increased level of capital management activities (i.e., the management of the issuance and repurchase of shares of certain closed-end funds) during 2016 as a result of market demand as well as an implementation of a cross department review system for shares trading at certain discount levels; (c) continued refinements to a database to permit further analysis of the closed-end fund marketplace and shareholder base; (d) the development of enhanced secondary market board reporting and commentary; (e) the reconfiguration of the framework for determining and maintaining closed-end fund benchmarks to permit more consistency across the complex; and (f) the development of product innovations for new closed-end offerings, including target term funds. The Board also recognized the Adviser's continued commitment to supporting the closed-end product line through its award winning investor relations support program through which Nuveen seeks to educate investors and financial advisers regarding closed-end funds.
With respect to municipal funds, the Independent Board Members also appreciated, in particular, the astute portfolio management of the municipal funds with respect to the Puerto Rico debt crisis.
In its review, the Board recognized that initiatives that attracted assets to the Nuveen family of funds generally benefited the Nuveen funds in the complex as fixed costs would be spread over a larger asset base and, as described below, through the complex-wide fee arrangement which generally provides that the management fees of the Nuveen funds (subject to limited exceptions) are reduced as asset levels in the complex reach certain breakpoints in the fee schedule.
Similarly, the Board considered the sub-advisory services provided by the Sub-Adviser to the Fund. The Sub-Adviser generally provided portfolio advisory services for the Fund. The Board reviewed the Adviser's analysis of the Sub-Adviser which evaluated, among other things, the investment team and any changes thereto, the stability and history of the organization, the assets under management, the investment approach and the performance of the Nuveen funds it sub-advises. The Board noted that the Adviser recommended the renewal of the Sub-Advisory Agreement.
Based on its review, the Board determined, in the exercise of its reasonable business judgment, that it was satisfied with the nature, extent and quality of services provided to the Fund under each Advisory Agreement.
B. The Investment Performance of the Fund and Fund Advisers
As part of its evaluation of the services provided by the Fund Advisers, the Board reviewed Fund performance over the quarter, one-, three- and five-year periods ending December 31, 2016 as well as performance data for the first quarter of 2017 ending March 31, 2017. The Board reviewed performance on an absolute basis and in comparison to the performance of peer funds (the "Performance Peer Group") and a recognized or customized benchmark (i.e., generally a benchmark derived from multiple recognized benchmarks). For closed-end funds, the Board (or the Closed-end Fund Committee) also reviewed, among other things, the premium or discount to net asset value of the Nuveen closed-end funds as of a specified date and over various periods as well as in comparison to the premium/discount average in their respective Lipper peer category. The Independent Board Members continued to recognize the importance of secondary market trading for the shares of the closed-end funds and the evaluation of the premium and discount levels was a continuing priority for them. The review and analysis of performance information during the annual review of Advisory Agreements incorporated the discussions and performance information the Board Members have had at each of their quarterly meetings throughout the year.
In evaluating performance data, the Independent Board Members recognized some of the limitations of such data and the difficulty in establishing appropriate peer groups and benchmarks for certain of the Nuveen funds. They recognized that each fund operates pursuant to its own investment objective(s), parameters and restrictions which may differ from that of the Performance Peer Group or benchmark. Certain funds may also utilize leverage which may provide benefits or risks to their portfolio compared to an unlevered benchmark. The Independent Board Members had noted that management had classified the Performance Peer Groups as low, medium and high in relevancy to the applicable fund as a result of these differences or other factors. The Independent Board Members recognized that the variations between the Performance Peer Group or benchmark
NUVEEN 47
Annual Investment Management Agreement Approval Process (Unaudited) (continued)
and the Fund will lead to differing performance results and may limit the value of the comparative performance data in assessing the Fund's performance.
In addition, the Independent Board Members recognized that the performance data is a snapshot in time, in this case as of the end of the 2016 calendar year or end of the first quarter of 2017. A different period may generate significantly different results and longer term performance can be adversely affected by even one period of significant underperformance. Further, a shareholder's experience in the Fund depends on his or her own holding period which may differ from that reviewed by the Independent Board Members.
In their review of performance, the Independent Board Members focused, in particular, on the Adviser's analysis of Nuveen funds determined to be underperforming performance outliers and the factors contributing to the respective fund's performance and any efforts to address performance concerns. With respect to any Nuveen funds for which the Board has identified performance issues, the Board monitors such funds closely until performance improves, discusses with the Adviser the reasons for such results, considers any steps necessary or appropriate to address such issues, and reviews the results of any efforts undertaken. The Board, however, acknowledged that shareholders chose to invest or remain invested in a fund knowing that the Adviser and applicable sub-adviser manage the fund, knowing the fund's investment strategy and seeking exposure to that strategy (even if the strategy was "out of favor" in the marketplace) and knowing the fund's fee structure.
In reviewing the performance of the Nuveen municipal funds, the Board recognized the challenged and volatile conditions of the municipal market in the fourth quarter of 2016 which impacted the performance of many of the municipal funds. The Board further considered that the municipal market had generally rebounded in the first quarter of 2017. In reviewing the performance of the municipal funds, the Board considered the impact of the market conditions.
The Board noted that the Fund ranked in the fourth quartile in its Performance Peer Group in the one-, three- and five-year periods. Although the Fund underperformed its benchmark in the one- and three-year periods, the Fund outperformed its benchmark in the five-year period. In reviewing the comparative peer data, the Board recognized that the peer group was classified as low for relevancy. The Board further noted that the holdings in the securities of a particular issuer were a key detractor from the Fund's performance. The Board was satisfied with the Adviser's explanation of Fund performance.
C. Fees, Expenses and Profitability
1. Fees and Expenses
The Board evaluated the management fees and other fees and expenses of the Fund. The Board reviewed and considered, among other things, the gross and net management fees paid by the Fund. The Board further considered the net total expense ratio of the Fund (expressed as a percentage of average net assets) as the expense ratio is most reflective of the investors' net experience in the Fund as it directly reflected the costs of investing in the Fund.
In addition, the Board reviewed the Broadridge Report comparing, in relevant part, the Fund's gross and net advisory fees and net total expense ratio with those of a Peer Universe. The Independent Board Members also reviewed the methodology regarding the construction of the applicable Peer Universe by Broadridge. In reviewing the comparative data, the Board was aware that various factors may limit some of the usefulness of the data, such as differences in size of the peers; the composition of the Peer Universe; changes each year of funds comprising the Peer Universe; levels of expense reimbursements and fee waivers; and differences in the type and use of leverage. Nevertheless, in reviewing a fund's fees and expenses compared to the fees and expenses of its peers (excluding leverage costs and leveraged assets), the Board generally considered a fund's expenses and fees to be higher if they were over 10 basis points higher, slightly higher if they were 6 to 10 basis points higher, in line if they were within approximately 5 basis points higher than the peer average and below if they were below the peer average of the Peer Universe. The Board noted that the substantial majority of the Nuveen funds had a net expense ratio that was near or below their respective peer average.
48 NUVEEN
The Independent Board Members noted that the Fund had a net management fee and a net expense ratio that were higher than its peer averages. The Independent Board Members noted that the Fund's net expense ratio was higher than the average of the Peer Universe primarily due to the odd composition of the Peer Universe, which contained only one non-Nuveen fund. The Independent Board Members noted that the Fund's net expense ratio was below that of the non-Nuveen peer. The Independent Board Members were satisfied with the explanation of the differential.
In their evaluation of the management fee schedule, the Independent Board Members also reviewed the fund-level and complex-wide breakpoint schedules, as described in further detail below. With respect to closed-end funds, the Board considered the effects of leverage on fees and expenses, including the calculation of management fees for funds with tender option bonds.
Based on their review of the information provided, the Board determined that the Fund's management fees (as applicable) to a Fund Adviser were reasonable in light of the nature, extent and quality of services provided to the Fund.
2. Comparisons with the Fees of Other Clients
The Board also reviewed information regarding the respective Fund Adviser's fee rates for providing advisory services to other types of clients. For the Adviser and/or the Sub-Adviser, such other clients may include municipal separately managed accounts and passively managed exchange-traded funds ("ETFs") sub-advised by the Sub-Adviser but that are offered by another fund complex.
The Board recognized that the Fund had an affiliated sub-adviser. In reviewing the fee rates assessed to other clients, with respect to affiliated sub-advisers, the Board reviewed, among other things, the range of fees and average fee rates assessed for managed accounts.
The Board recognized the inherent differences between the Nuveen funds and the other types of clients. The Board considered information regarding these various differences which included, among other things, the services required, average account sizes, types of investors targeted, legal structure and operations, and applicable laws and regulations. The Independent Board Members recognized that the foregoing variations resulted in different economics among the product structures and culminated in varying management fees among the types of clients and the Nuveen funds. In general, the Board noted that higher fee levels reflected higher levels of service provided by the Fund Adviser, increased investment management complexity, greater product management requirements and higher levels of business risk or some combination of the foregoing. The Board recognized the breadth of services the Adviser provided to support the Nuveen funds as summarized above and noted that many of such administrative services may not be required to the same extent or at all for the institutional clients or other clients. The Board further recognized the passive management of ETFs compared to the active management required of other Nuveen funds would contribute to differing fee levels.
The Independent Board Members noted that the sub-advisory fees paid by the Adviser to the Sub-Adviser, however, were generally for portfolio management services. The Board noted such sub-advisory fees were more comparable to the fees of retail wrap accounts and other external sub-advisory mandates.
Given the inherent differences in the various products, particularly the extensive services provided to the Fund, the Board concluded that such facts justify the different levels of fees.
3. Profitability of Fund Advisers
In conjunction with their review of fees, the Independent Board Members also considered Nuveen's level of profitability for its advisory services to the Nuveen funds for the calendar years 2016 and 2015. In considering profitability, the Independent Board Members considered the level of profitability realized by Nuveen before the imposition of any distribution and marketing expenses incurred by the firm from its own resources. In evaluating the profitability, the Independent Board Members evaluated the analysis employed in developing the profitability figures, including the assumptions and methodology employed in allocating expenses. The Independent Board Members recognized the inherent limitations to any cost allocation methodology as different and reasonable approaches may be used and yet yield differing results. The Independent Board Members further
NUVEEN 49
Annual Investment Management Agreement Approval Process (Unaudited) (continued)
reviewed an analysis of the history of the profitability methodology used explaining any changes to the methodology over the years. The Board has appointed two Independent Board Members, who along with independent legal counsel, helped to review and discuss the methodology employed to develop the profitability analysis each year and any proposed changes thereto and to keep the Board apprised of such changes during the year.
In their review, the Independent Board Members evaluated, among other things, Nuveen's adjusted operating margins, the gross and net revenue margins (pre-tax and after-tax) for advisory activities for the Nuveen funds, and the revenues, expenses, and net income (pre-tax and after-tax) of Nuveen for each of the last two calendar years. The Independent Board Members also reviewed an analysis of the key drivers behind the changes in revenues and expenses that impacted profitability in 2016 versus 2015. The Board, however, observed that Nuveen's operating margins for its advisory activities in 2016 were similar to that of 2015.
In addition to reviewing Nuveen's profitability in absolute terms, the Independent Board Members also reviewed the adjusted total company margins of other advisory firms that had publicly available information and comparable assets under management (based on asset size and asset composition). The Independent Board Members, however, noted that the usefulness of the comparative data may be limited as the other firms may have a different business mix and their profitability data may be affected by numerous other factors such as the types of funds managed, the cost allocation methodology used, and their capital structure. Nevertheless, the Board noted that Nuveen's adjusted operating margins appeared comparable to the adjusted margins of the peers.
Further, the Adviser is a subsidiary of Nuveen, LLC, the investment management arm of Teachers Insurance and Annuity Association of America ("TIAA"). To have a fuller picture of the financial condition and strength of the TIAA complex, together with Nuveen, the Board reviewed a balance sheet for TIAA reflecting its assets, liabilities and capital and contingency reserves for the 2016 and 2015 calendar years.
In addition to the Adviser's profitability, the Independent Board Members also considered the profitability of the Sub-Adviser from its relationship with the Nuveen funds. The Independent Board Members reviewed the Sub-Adviser's revenues, expenses and revenue margins (pre- and post-tax) for its advisory activities for the calendar year ended December 31, 2016. The Independent Board Members also reviewed a profitability analysis reflecting the revenues, expenses and revenue margin (pre-and post-tax) by asset type for the Sub-Adviser for the calendar year ending December 31, 2016.
In evaluating the reasonableness of the compensation, the Independent Board Members also considered other amounts paid to a Fund Adviser for its services to the Fund as well as indirect benefits (such as soft dollar arrangements), if any, the Fund Adviser and its affiliates received or were expected to receive that were directly attributable to the management of the Fund. See Section E below for additional information on indirect benefits a Fund Adviser may receive as a result of its relationship with the Fund.
Based on a consideration of all the information provided, the Board noted that Nuveen's and the Sub-Adviser's level of profitability was acceptable and not unreasonable in light of the services provided.
D. Economies of Scale and Whether Fee Levels Reflect These Economies of Scale
When evaluating the level of the advisory fees, the Independent Board Members considered whether there will be any economies of scale that may be realized by the Fund Adviser as the Fund grows and the extent to which these economies were shared with the Fund and shareholders. The Board recognized that economies of scale are difficult to measure with precision; however, the Board considered that there were several ways the Fund Adviser may share the benefits of economies of scale with the Nuveen funds, including through breakpoints in the management fee schedule reducing the fee rates as asset levels grow, fee waivers and/or expense limitation agreements and the Adviser's investment in its business which can enhance the services provided to the Nuveen funds. With respect to the fee structure, the Independent Board Members have recognized that economies of scale may be realized when a particular fund grows, but also when the total size of the fund complex grows (even if the assets of a particular fund in the complex have not changed or have decreased). Accordingly, subject to certain
50 NUVEEN
exceptions, the funds in the Nuveen complex pay a management fee to the Adviser which is generally comprised of a fund-level component and complex-level component, each of which has a breakpoint schedule. Subject to certain exceptions, the fund-level fee component declines as the assets of the particular fund grow and the complex-level fee component declines when eligible assets of all the Nuveen funds (except for Nuveen ETFs which are subject to a unitary fee) in the Nuveen complex combined grow. In addition, with respect to closed-end funds, the Independent Board Members noted that, although such funds may from time-to-time make additional share offerings, the growth of their assets would occur primarily through the appreciation of such funds' investment portfolios.
The Independent Board Members reviewed the breakpoint and complex-wide schedules and any savings achieved from fee reductions as a result of the fund-level and complex-level breakpoints for the 2016 calendar year. In addition, the Independent Board Members recognized the Adviser's ongoing investment in its business to expand or enhance the services provided to the benefit of all of the Nuveen funds.
Based on their review, the Board concluded that the current fee structure was acceptable and reflected economies of scale to be shared with shareholders when assets under management increase.
E. Indirect Benefits
The Independent Board Members received and considered information regarding other benefits the respective Fund Adviser or its affiliates may receive as a result of their relationship with the Nuveen funds, including compensation paid to affiliates of a Fund Adviser for services rendered to the funds and research services received by a Fund Adviser from broker-dealers that execute fund trades. The Independent Board Members noted that affiliates of the Adviser may receive compensation for serving as a co-manager for initial public offerings of new Nuveen closed-end funds and as underwriter on shelf offerings for certain existing funds. The Independent Board Members considered the compensation paid for such services in 2016.
In addition to the above, the Independent Board Members considered that the Fund's portfolio transactions are allocated by the Sub-Adviser and the Sub-Adviser may benefit from research received from broker-dealers that execute Fund portfolio transactions. The Board noted, however, that with respect to transactions in fixed income securities, such securities generally trade on a principal basis and do not generate soft dollar credits. Although the Board recognized the Sub-Adviser may benefit from a soft dollar arrangement if it does not have to pay for this research out of its own assets, the Board also recognized that the research may benefit the Fund to the extent it enhances the ability of the Sub-Adviser to manage the Fund.
Based on their review, the Board concluded that any indirect benefits received by a Fund Adviser as a result of its relationship with the Fund were reasonable and within acceptable parameters.
F. Other Considerations
The Board Members did not identify any single factor discussed previously as all-important or controlling. The Board Members, including the Independent Board Members, concluded that the terms of each Advisory Agreement were fair and reasonable, that the respective Fund Adviser's fees were reasonable in light of the services provided to the Fund and that the Advisory Agreements be renewed.
NUVEEN 51
Nuveen:
Serving Investors for Generations
Since 1898, financial advisors and their clients have relied on Nuveen to provide dependable investment solutions through continued adherence to proven, long-term investing principles. Today, we offer a range of high quality solutions designed to be integral components of a well-diversified core portfolio.
Focused on meeting investor needs.
Nuveen is the investment management arm of TIAA. We have grown into one of the world's premier global asset managers, with specialist knowledge across all major asset classes and particular strength in solutions that provide income for investors and that draw on our expertise in alternatives and responsible investing. Nuveen is driven not only by the independent investment processes across the firm, but also the insights, risk management, analytics and other tools and resources that a truly world-class platform provides. As a global asset manager, our mission is to work in partnership with our clients to create solutions which help them secure their financial future.
Find out how we can help you.
To learn more about how the products and services of Nuveen may be able to help you meet your financial goals, talk to your financial advisor, or call us at (800) 257-8787. Please read the information provided carefully before you invest. Investors should consider the investment objective and policies, risk considerations, charges and expenses of any investment carefully.
Where applicable, be sure to obtain a prospectus, which contains this and other relevant information. To obtain a prospectus, please contact your securities representative or Nuveen, 333 W. Wacker Dr., Chicago, IL 60606. Please read the prospectus carefully before you invest or send money.
Learn more about Nuveen Funds at: www.nuveen.com/cef
Nuveen Securities, LLC, member FINRA and SIPC | 333 West Wacker Drive Chicago, IL 60606 | www.nuveen.com
ESA-A-0917D 304526-INV-B-11/18