Exhibit 99.1
|
Exa Analyst and Investor Day
2015
© Exa Corporation. All rights reserved.
|
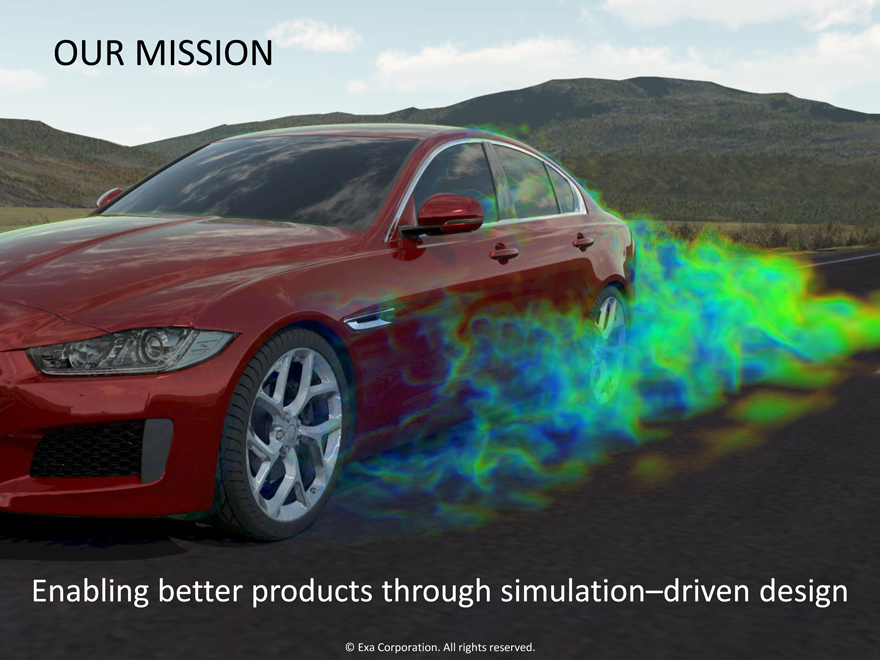
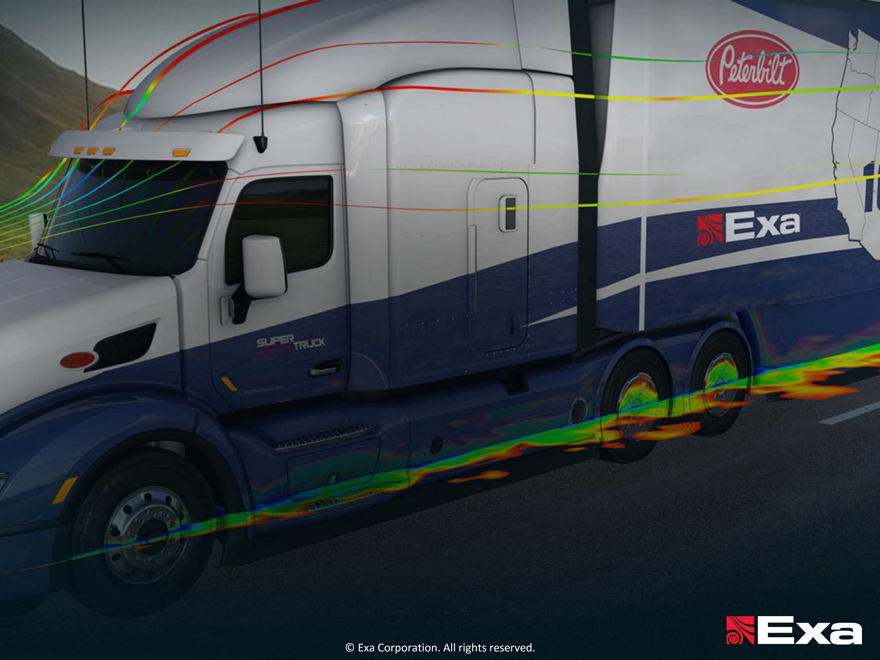
OUR MISSION
Enabling better products through simulation driven design
© Exa Corporation. All rights reserved.
|
© Exa Corporation. All rights reserved.
|
© Exa Corporation. All rights reserved.
|

© Exa Corporation. All rights reserved.
|
© Exa Corporation. All rights reserved.
|
© Exa Corporation. All rights reserved.
|
© Exa Corporation. All rights reserved.
|

© Exa Corporation. All rights reserved.
|

© Exa Corporation. All rights reserved.
|

© Exa Corporation. All rights reserved.
|
Simulate, optimize and move to production with confidence
© Exa Corporation. All rights reserved.
|
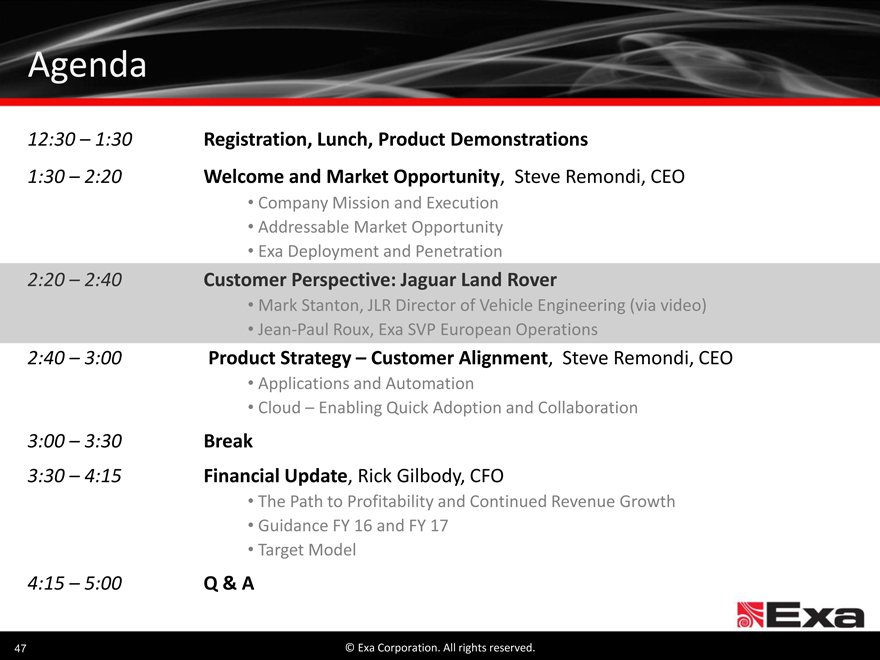
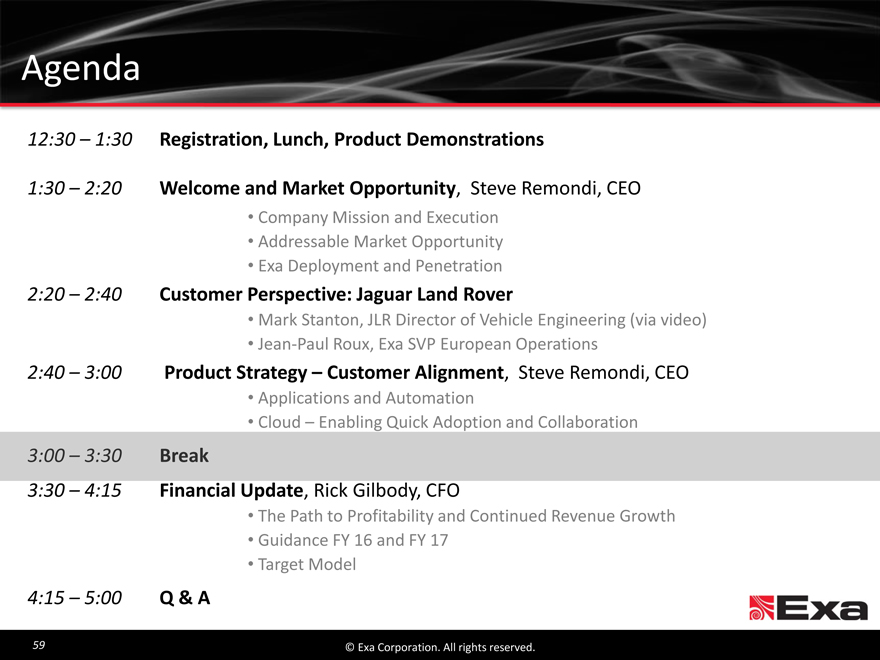
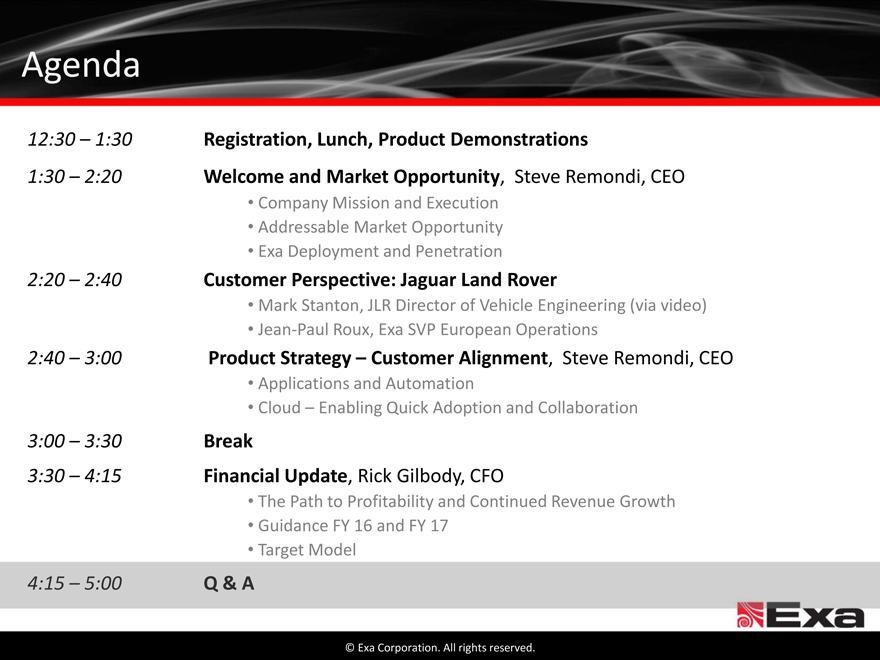
Agenda
12:30 1:30 Registration, Lunch, Product Demonstrations
1:30 2:20 Welcome and Market Opportunity, Steve Remondi, CEO
Company Mission and Execution
Addressable Market Opportunity
Exa Deployment and Penetration
2:20 2:40 Customer Perspective: Jaguar Land Rover
Mark Stanton, JLR Director of Vehicle Engineering (via video)
Jean-Paul Roux, Exa SVP European Operations
2:40 3:00 Product Strategy Customer Alignment, Steve Remondi, CEO
Applications and Automation
Cloud Enabling Quick Adoption and Collaboration
3:00 3:30 Break
3:30 4:15 Financial Update, Rick Gilbody, CFO
The Path to Profitability and Continued Revenue Growth
Guidance FY 16 and FY 17
Target Model
4:15 5:00 Q & A
13 © Exa Corporation. All rights reserved.
|
Safe Harbor Statement
Today’s presentation includes forward-looking statements intended to qualify for the Safe Harbor from liability established by the Private Securities Litigation Reform Act of 1995. These forward-looking statements, including statements regarding our financial expectations, demand for our solutions and growth in our markets, are subject to risks, uncertainties and other factors that could cause actual results to differ materially from those suggested by our forward-looking statements. These factors include, but are not limited to, the risk factors described in our Annual Report on Form 10-K for the year ended January 31, 2015, as filed with the SEC on March 24, 2015. Forward-looking information in this presentation represents our outlook as of today, and we do not undertake any obligation to update these forward-looking statements.
During today’s presentation we may refer to our Adjusted EBITDA and non-GAAP operating income. These are non-GAAP financial measures that have been adjusted for certain non-cash and other items, and that is not computed in accordance with generally accepted accounting principles. The GAAP measure most comparable to Adjusted EBITDA is our net income (loss). The GAAP measure most comparable to non-GAAP operating income is operating income (loss). A reconciliation of these non-GAAP measures to their most comparable GAAP measures is included in the Appendix of this presentation.
We will also refer to revenue and total operating expenses on a constant currency basis (as well as measures derived from revenue and total operating expenses on a constant currency basis), which we define as GAAP revenue or operating expenses, adjusted to reverse the impact of changes in the exchange rates of the principal currencies in which our international operations generated revenue and incurred expenses. We calculate revenue and total expenses on a constant currency basis by converting revenue or operating expenses that were generated in foreign currencies to United States dollars at assumed exchange rates equal to the exchange rates in effect for such currencies during the corresponding period of the previous year, rather than the exchange rates actually in effect during the fiscal year of the period in question.
14 © Exa Corporation. All rights reserved.
|
Agenda
12:30 1:30 Registration, Lunch, Product Demonstrations
2:20 2:40 Customer Perspective: Jaguar Land Rover
Mark Stanton, JLR Director of Vehicle Engineering (via video)
Jean-Paul Roux, Exa SVP European Operations
2:40 3:00 Product Strategy Customer Alignment, Steve Remondi, CEO
Applications and Automation
Cloud Enabling Quick Adoption and Collaboration
3:00 3:30 Break
3:30 4:15 Financial Update, Rick Gilbody, CFO
The Path to Profitability and Continued Revenue Growth
Guidance FY 16 and FY 17
Target Model
4:15 5:00 Q & A
15 © Exa Corporation. All rights reserved.
|

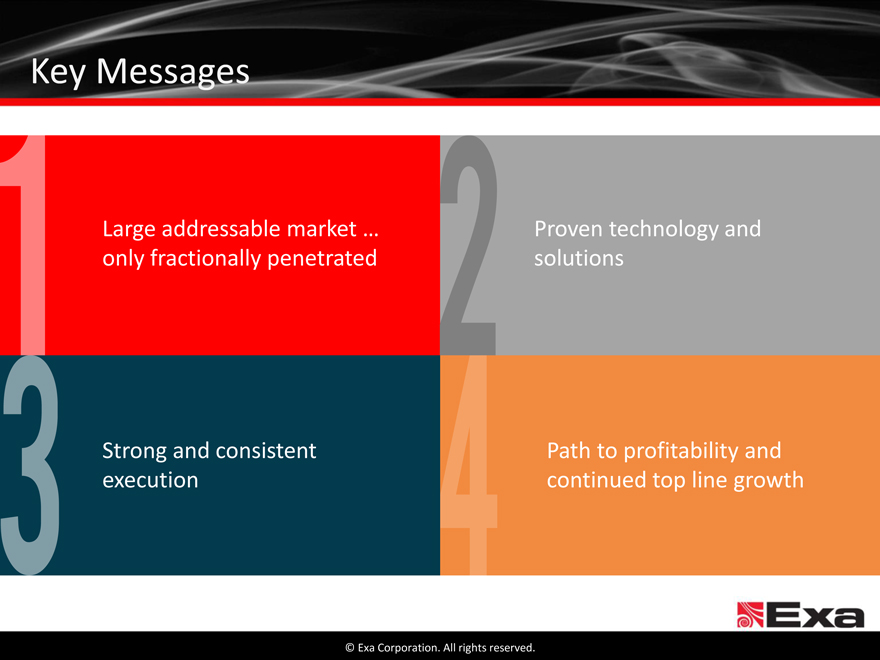
Key Messages
Large addressable market … Proven technology and
only fractionally penetrated solutions
Strong and consistent Path to profitability and
execution continued top line growth
© Exa Corporation. All rights reserved.
|
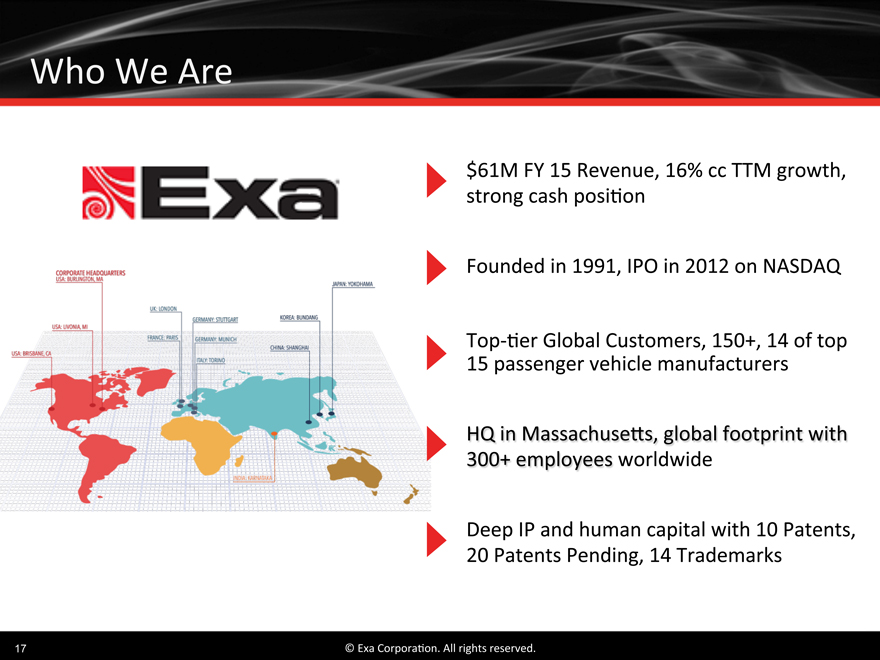
Who We Are
$61M in Revenue, 16% cc TTM growth, strong cash position
Founded in 1991, IPO in 2012 on NASDAQ
Top-tier Global Customers, 150+, 14 of top 15 passenger vehicle manufacturers
HQ in Massachusetts, global footprint with
300+ employees worldwide
Deep IP and human capital with 10 Patents,
20 Patents Pending, 14 Trademarks
17 © Exa Corporation. All rights reserved.
|
What We Deliver
Proprietary, Market Leading Simulation Technology
Tangible, Immediate Value Proposition
Vertical Applications in Ground Transportation and Aerospace
Highly-Visible, Consumption-Based Licensing Model
Consistent Revenue Growth, Accelerating Margins
18 © Exa Corporation. All rights reserved.
|
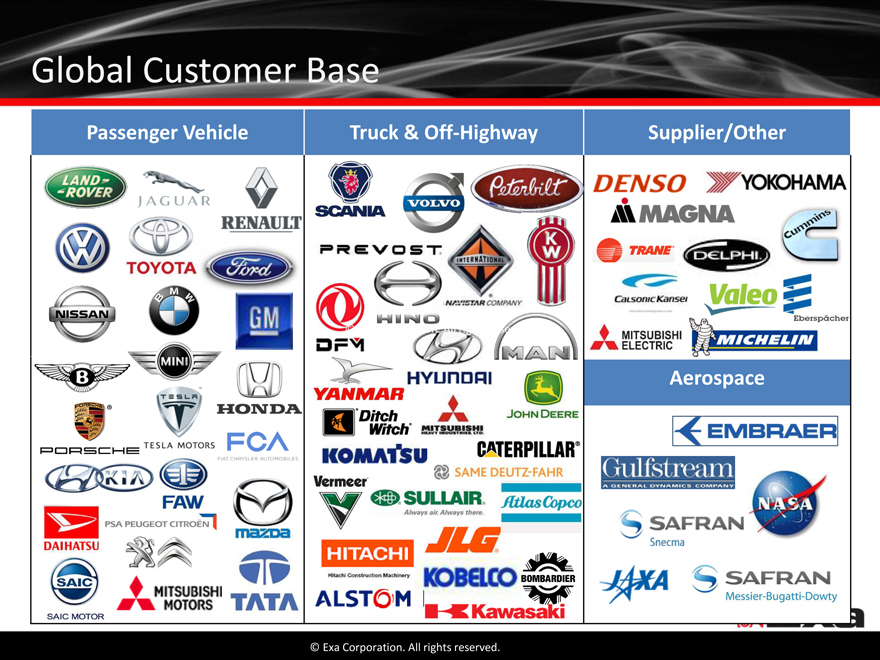
Global Customer Base
Passenger Vehicle Truck & Off-Highway Supplier/Other
Aerospace
© Exa Corporation. All rights reserved.
|
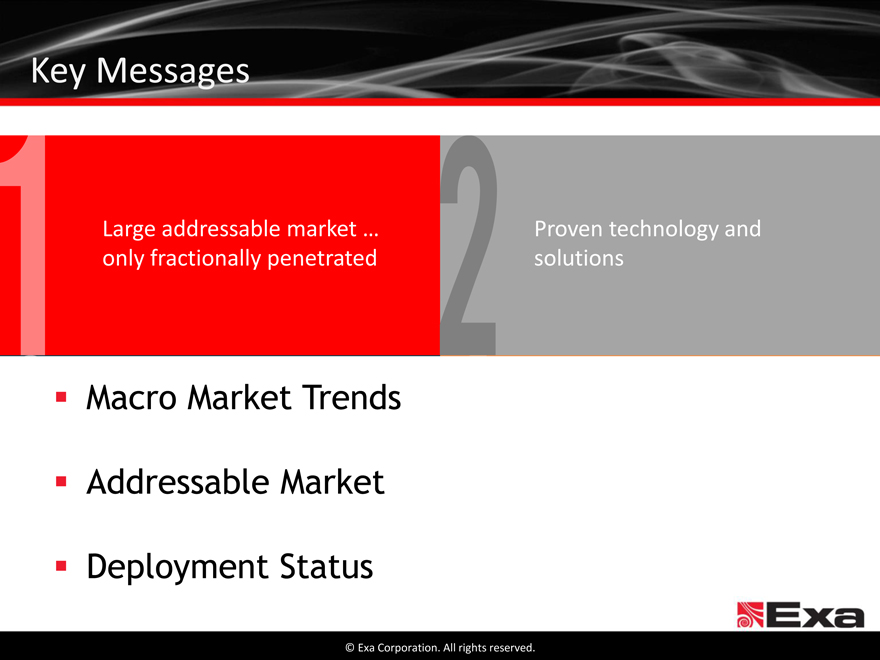
Key Messages
Large addressable market … Proven technology and
only fractionally penetrated solutions
Macro Market Trends Addressable Market Deployment Status
© Exa Corporation. All rights reserved.
|
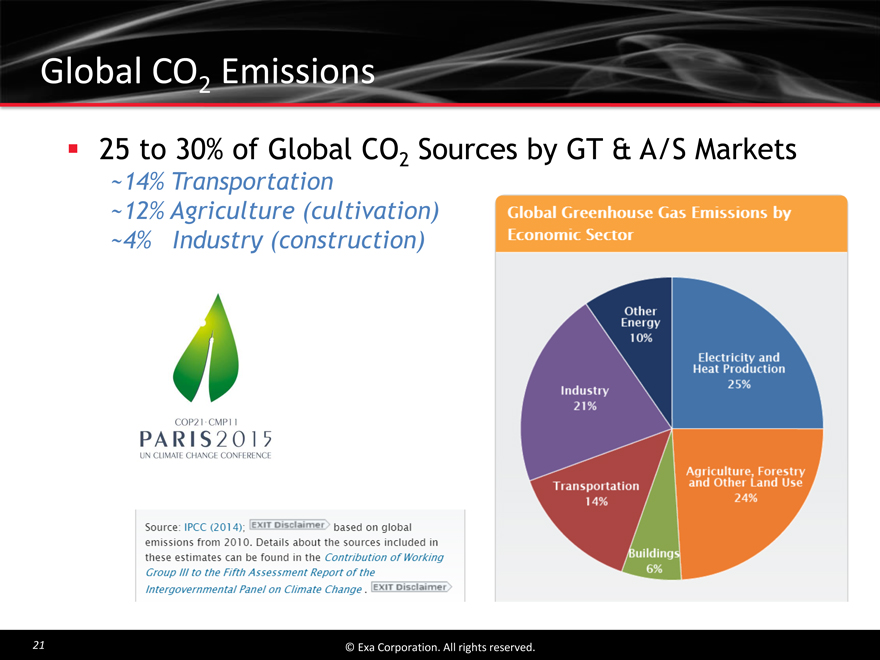
Global CO2 Emissions
25 to 30% of Global CO2 Sources by GT & A/S Markets
~14% Transportation
~12% Agriculture (cultivation) ~4% Industry (construction)
21 © Exa Corporation. All rights reserved.
|
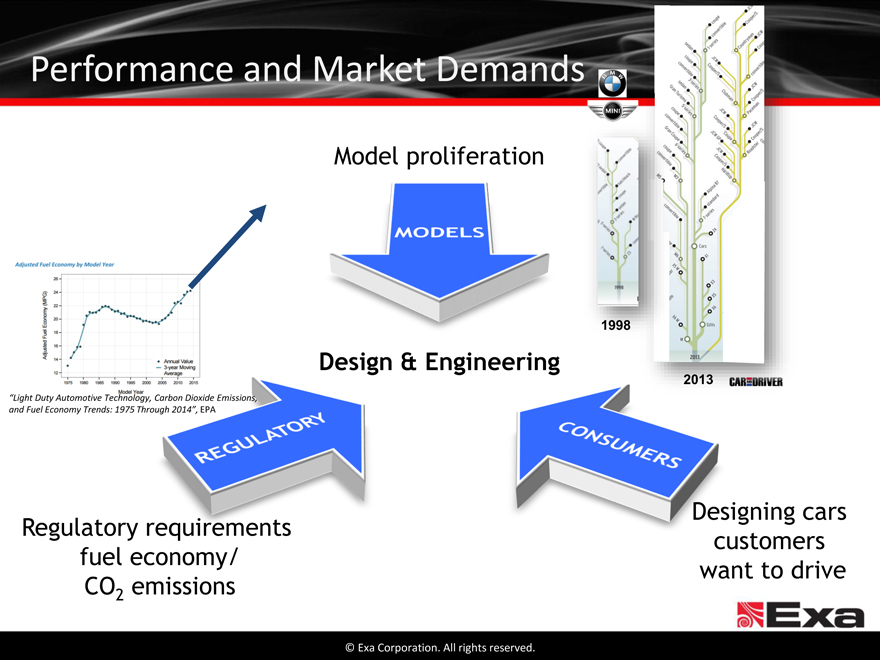
Performance and Market Demands
Model proliferation
1998
Design & Engineering
2013
“Light Duty Automotive Technology, Carbon Dioxide Emissions, and Fuel Economy Trends: 1975 Through 2014”, EPA
Designing cars
Regulatory requirements customers
fuel economy/ want to drive
CO2 emissions
© Exa Corporation. All rights reserved.
|
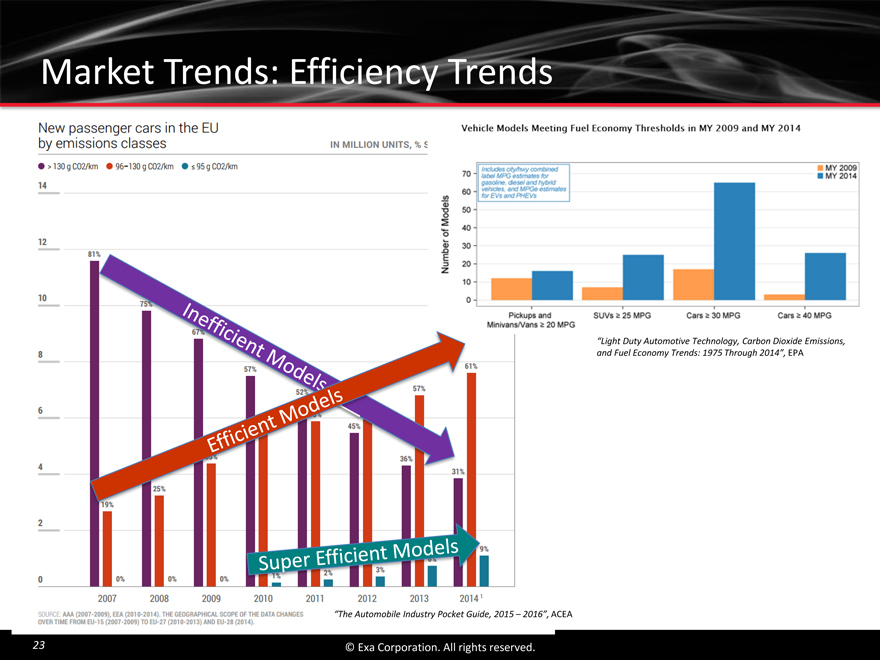
Market Trends: Efficiency Trends
“Light Duty Automotive Technology, Carbon Dioxide Emissions, and Fuel Economy Trends: 1975 Through 2014”, EPA
“The Automobile Industry Pocket Guide, 2015 2016”, ACEA
23 © Exa Corporation. All rights reserved.
|
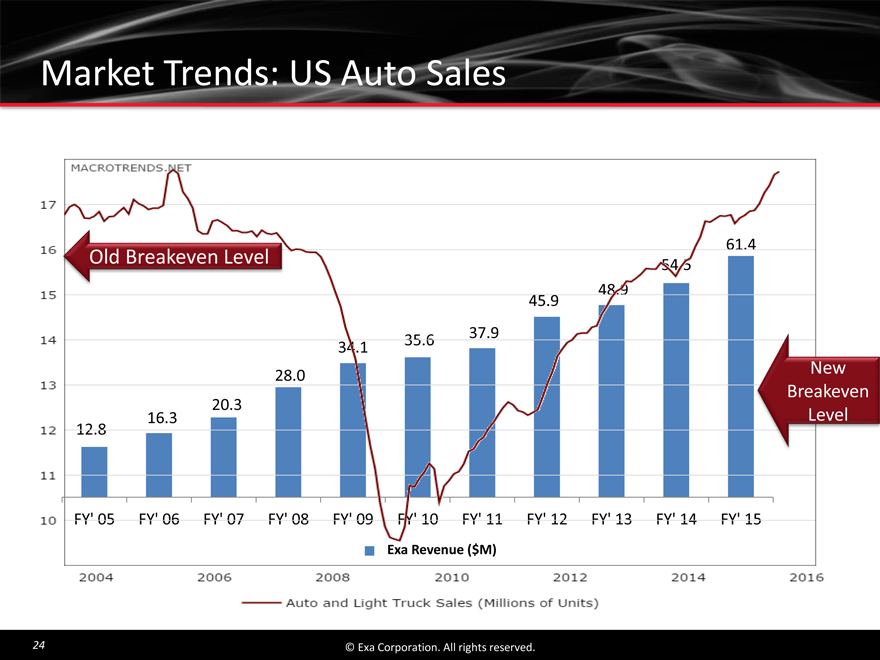
Market Trends: US Auto Sales
Old Breakeven Level
New Breakeven Level
24 © Exa Corporation. All rights reserved.
|
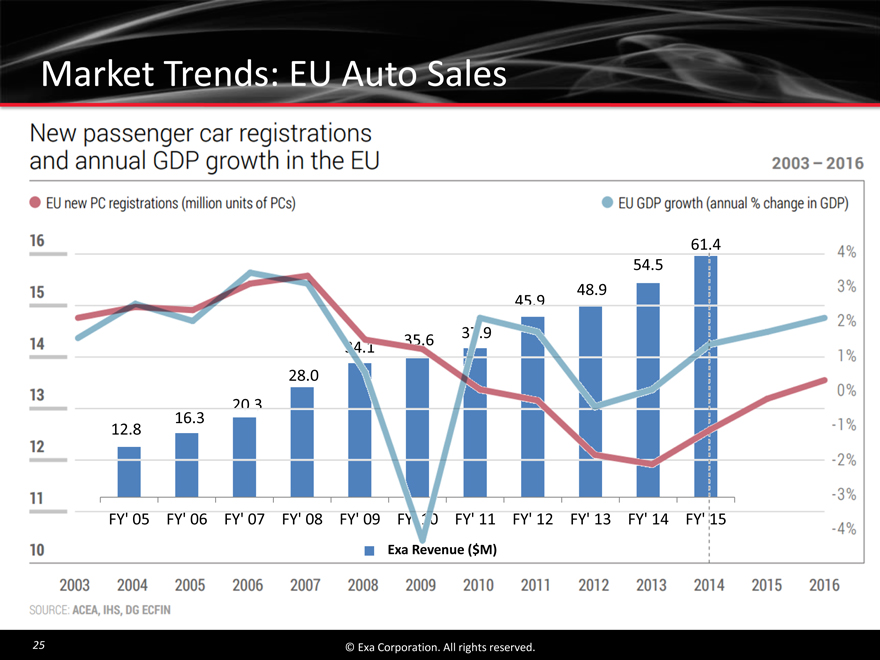
Market Trends: EU Auto Sales
© Exa Corporation. All rights reserved.
25
|
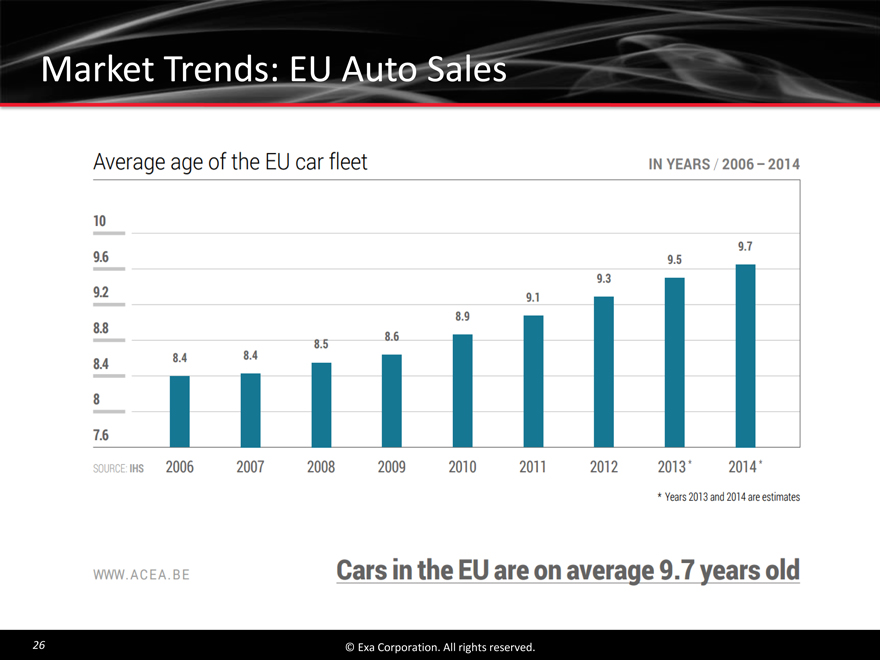
Market Trends: EU Auto Sales
26 © Exa Corporation. All rights reserved.
|
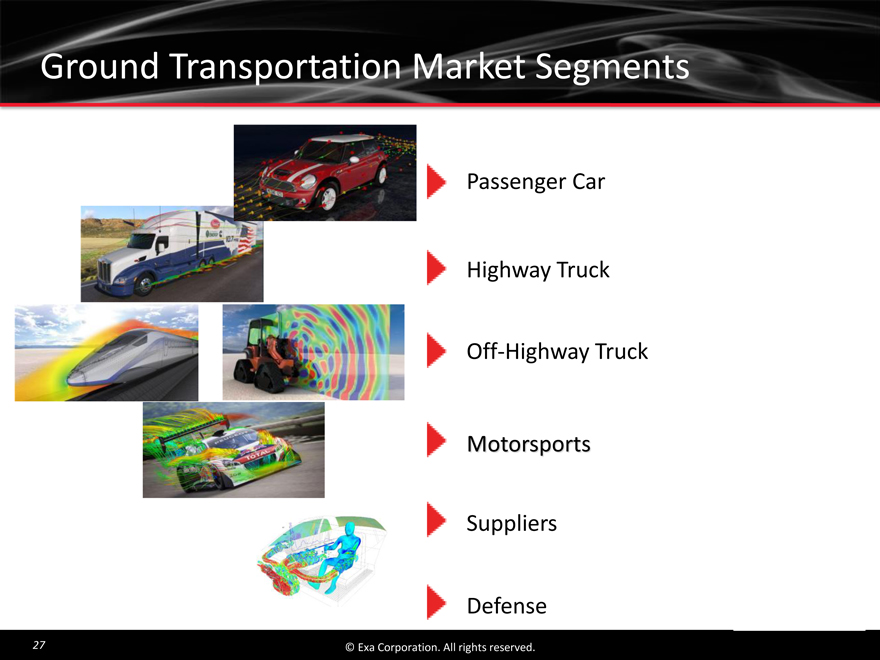
Ground Transportation Market Segments
Passenger Car
Highway Truck
Off-Highway Truck
Motorsports
Suppliers
Defense
27 © Exa Corporation. All rights reserved.
|
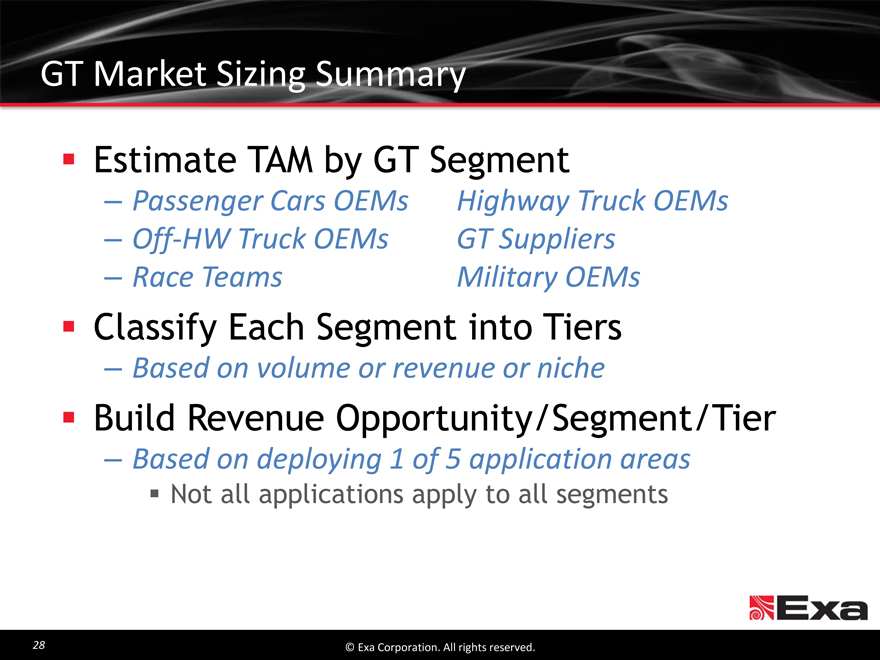
GT Market Sizing Summary
Estimate TAM by GT Segment
Passenger Cars OEMs Highway Truck OEMs
Off-HW Truck OEMs GT Suppliers
Race Teams Military OEMs
Classify Each Segment into Tiers
Based on volume or revenue or niche
Build Revenue Opportunity/Segment/Tier
Based on deploying 1 of 5 application areas
Not all applications apply to all segments
28 © Exa Corporation. All rights reserved.
|
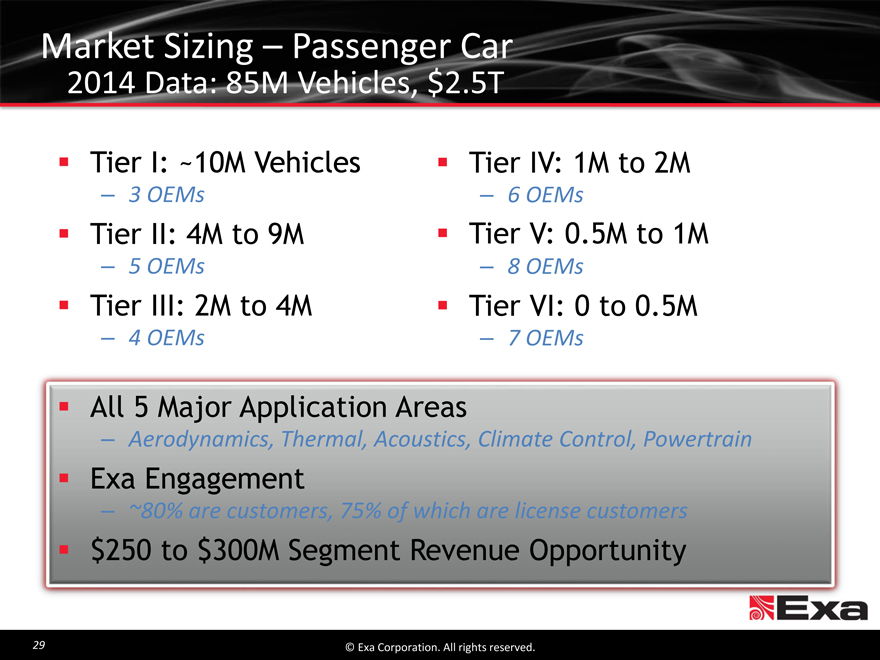
Market Sizing Passenger Car
2014 Data: 85M Vehicles, $2.5T
Tier I: ~10M Vehicles
3 OEMs
Tier II: 4M to 9M
5 OEMs
Tier III: 2M to 4M
4 OEMs
Tier IV: 1M to 2M
6 OEMs
Tier V: 0.5M to 1M
8 OEMs
Tier VI: 0 to 0.5M
7 OEMs
All 5 Major Application Areas
Aerodynamics, Thermal, Acoustics, Climate Control, Powertrain
Exa Engagement
~80% are customers, 75% of which are license customers
$250 to $300M Segment Revenue Opportunity
29 © Exa Corporation. All rights reserved.
|
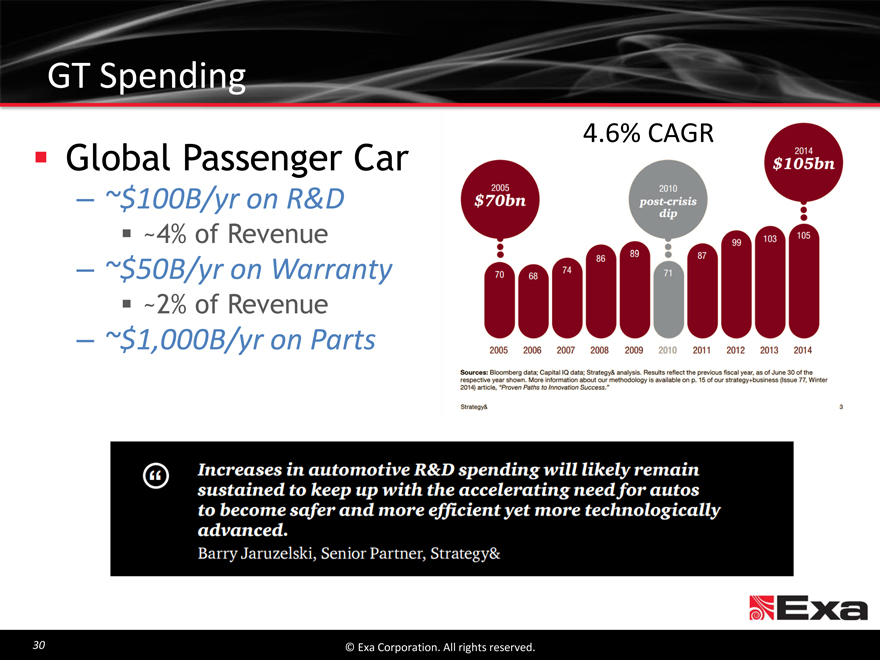
GT Spending
4.6% CAGR
Global Passenger Car
~$100B/yr on R&D
~4% of Revenue
~$50B/yr on Warranty
~2% of Revenue
~$1,000B/yr on Parts
30 © Exa Corporation. All rights reserved.
|
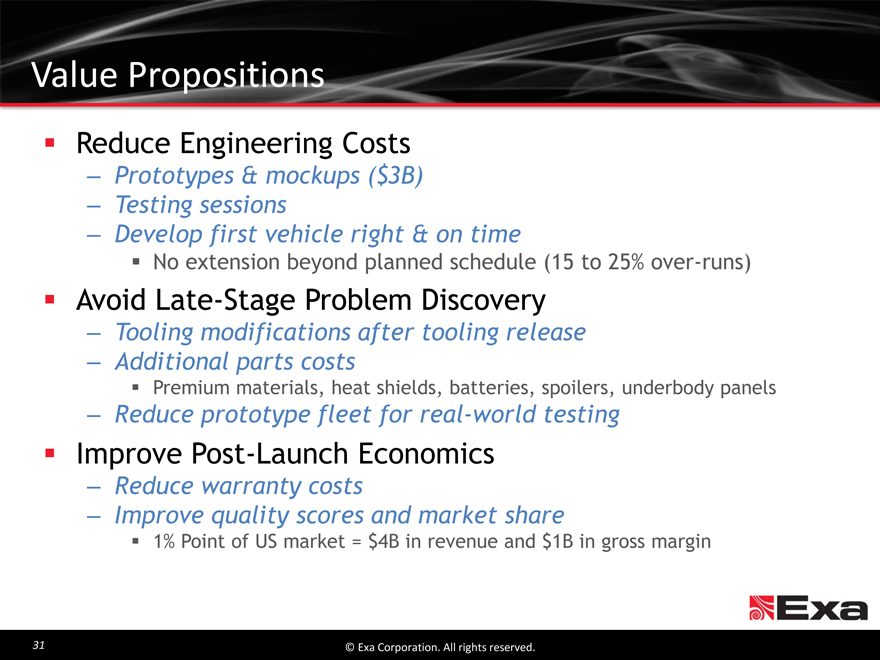
Value Propositions
Reduce Engineering Costs
Prototypes & mockups ($3B)
Testing sessions
Develop first vehicle right & on time
No extension beyond planned schedule (15 to 25% over-runs)
Avoid Late-Stage Problem Discovery
Tooling modifications after tooling release
Additional parts costs
Premium materials, heat shields, batteries, spoilers, underbody panels
Reduce prototype fleet for real-world testing
Improve Post-Launch Economics
Reduce warranty costs
Improve quality scores and market share
1% Point of US market = $4B in revenue and $1B in gross margin
31 © Exa Corporation. All rights reserved.
|
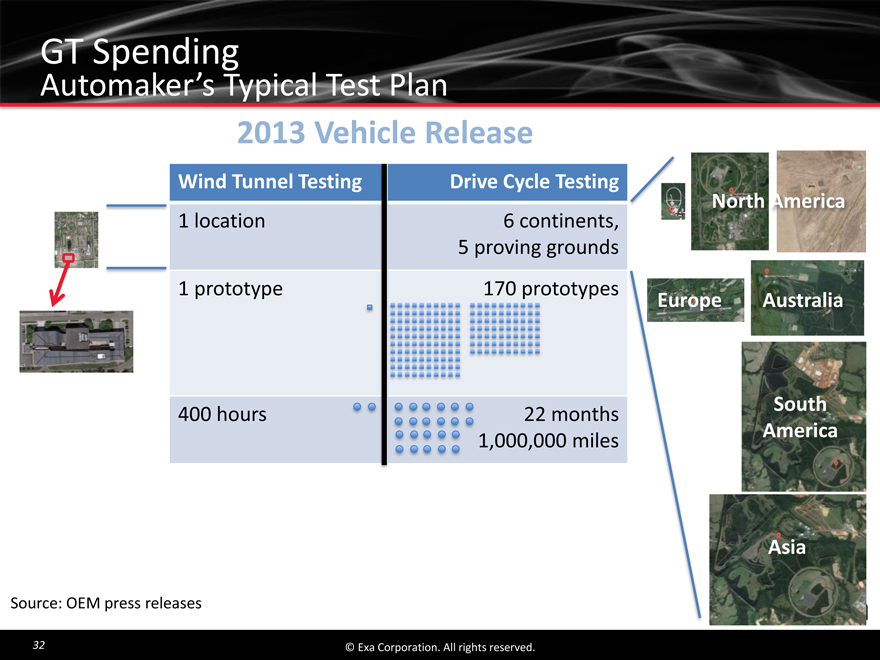
GT Spending
Automaker’s Typical Test Plan
2013 Vehicle Release
Wind Tunnel Testing Drive Cycle Testing
North America
1 location 6 continents,
5 proving grounds
1 prototype 170 prototypes Europe Australia
400 hours 22 months South
1,000,000 miles America
Asia
Source: OEM press releases
32 © Exa Corporation. All rights reserved.
|
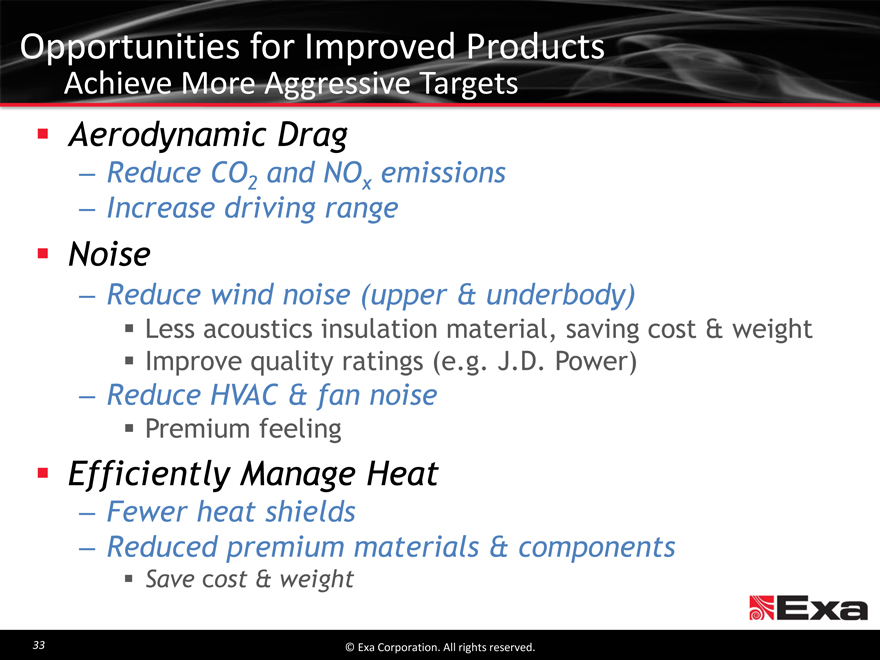
Opportunities for Improved Products
Achieve More Aggressive Targets
Aerodynamic Drag
Reduce CO2 and NOx emissions
Increase driving range
Noise
Reduce wind noise (upper & underbody)
Less acoustics insulation material, saving cost & weight Improve quality ratings (e.g. J.D. Power)
Reduce HVAC & fan noise
Premium feeling
Efficiently Manage Heat
Fewer heat shields
Reduced premium materials & components
Save cost & weight
33 © Exa Corporation. All rights reserved.
|
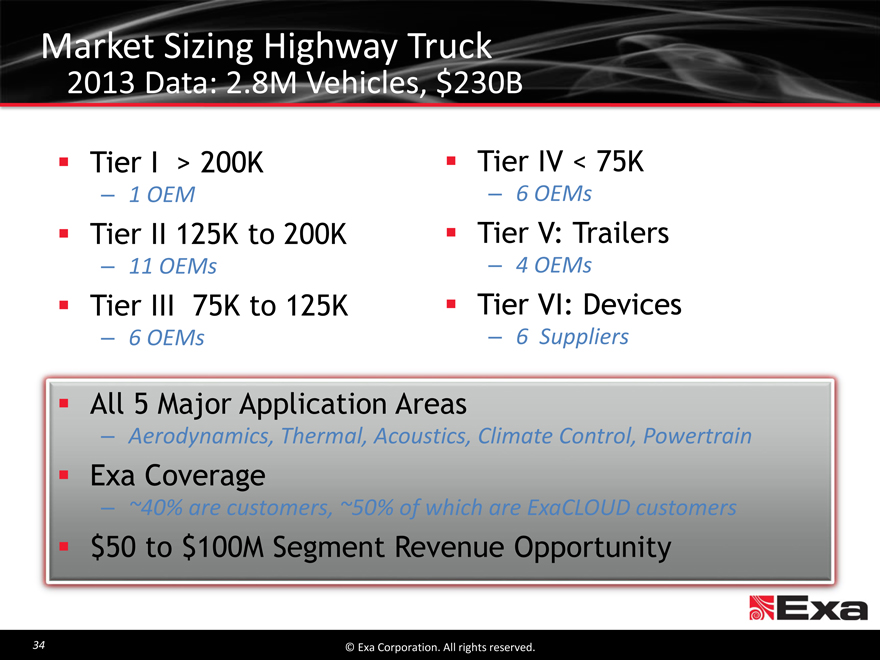
Market Sizing Highway Truck
2013 Data: 2.8M Vehicles, $230B
Tier I > 200K
1 OEM
Tier II 125K to 200K
11 OEMs
Tier IV < 75K
6 OEMs
Tier V: Trailers
4 OEMs
Tier VI: Devices
6 Suppliers
Tier III 75K to 125K
6 OEMs
All 5 Major Application Areas
Aerodynamics, Thermal, Acoustics, Climate Control, Powertrain
Exa Coverage
~40% are customers, ~50% of which are ExaCLOUD customers
$50 to $100M Segment Revenue Opportunity
34 © Exa Corporation. All rights reserved.
|
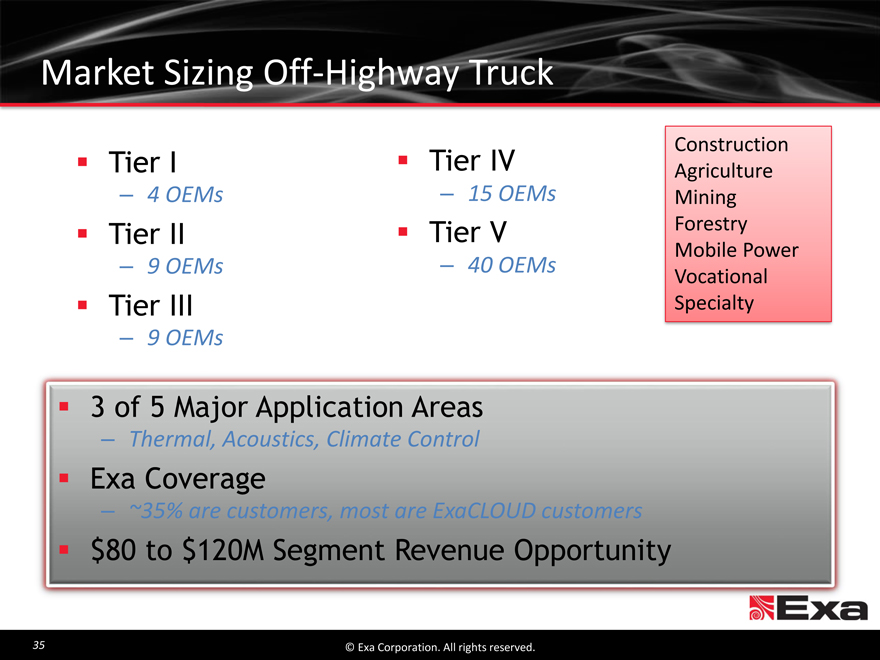
Market Sizing Off-Highway Truck
Construction
Tier I Tier IV Agriculture
4 OEMs 15 OEMs Mining
Tier II Tier V Forestry
Mobile Power
9 OEMs 40 OEMs Vocational
Tier III Specialty
9 OEMs
3 of 5 Major Application Areas
Thermal, Acoustics, Climate Control
Exa Coverage
~35% are customers, most are ExaCLOUD customers
$80 to $120M Segment Revenue Opportunity
35 © Exa Corporation. All rights reserved.
|
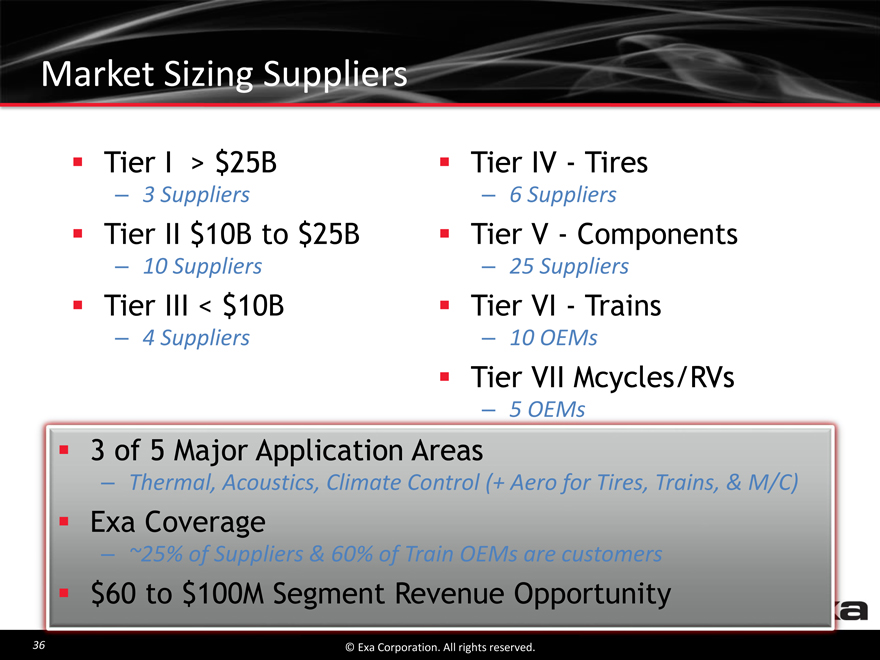
Market Sizing Suppliers
Tier I > $25B
3 Suppliers
Tier II $10B to $25B
10 Suppliers
Tier III < $10B
4 Suppliers
Tier IV—Tires
6 Suppliers
Tier V—Components
25 Suppliers
Tier VI—Trains
10 OEMs
Tier VII Mcycles/RVs
5 OEMs
3 of 5 Major Application Areas
Thermal, Acoustics, Climate Control (+ Aero for Tires, Trains, & M/C)
Exa Coverage
~25% of Suppliers & 60% of Train OEMs are customers
$60 to $100M Segment Revenue Opportunity
© Exa Corporation. All rights reserved.
36
|
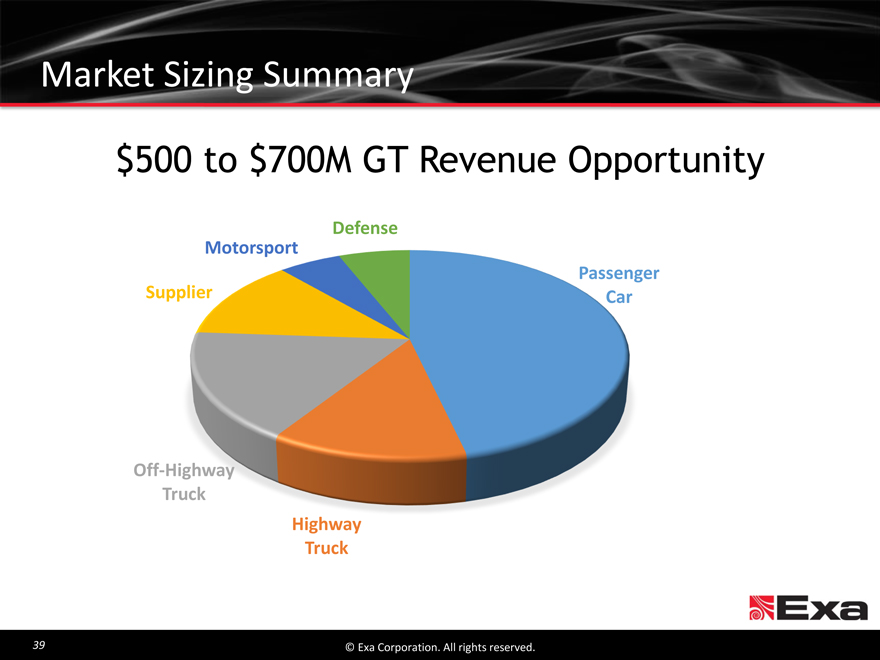
Market Sizing Summary
$500 to $700M GT Revenue Opportunity
Defense
Motorsport
Passenger
Supplier Car
Off-Highway
Truck
Highway
Truck
39 © Exa Corporation. All rights reserved.
|
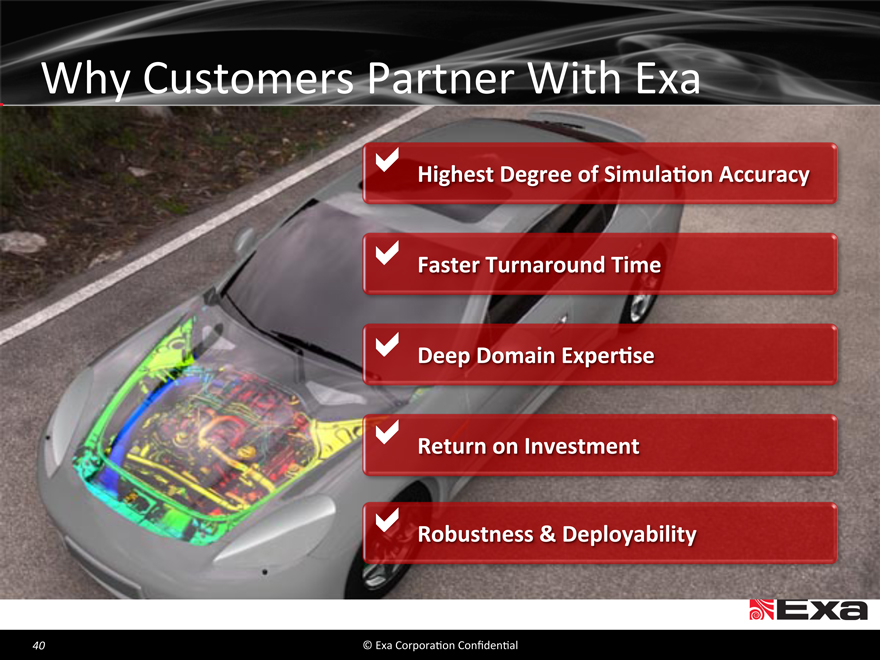
Why Customers Partner With Exa
Highest Degree of Simulation Accuracy
Faster Turnaround Time
Deep Domain Expertise
Return on Investment
Robustness Deployability
40 © Exa Corporation. All rights reserved.
|
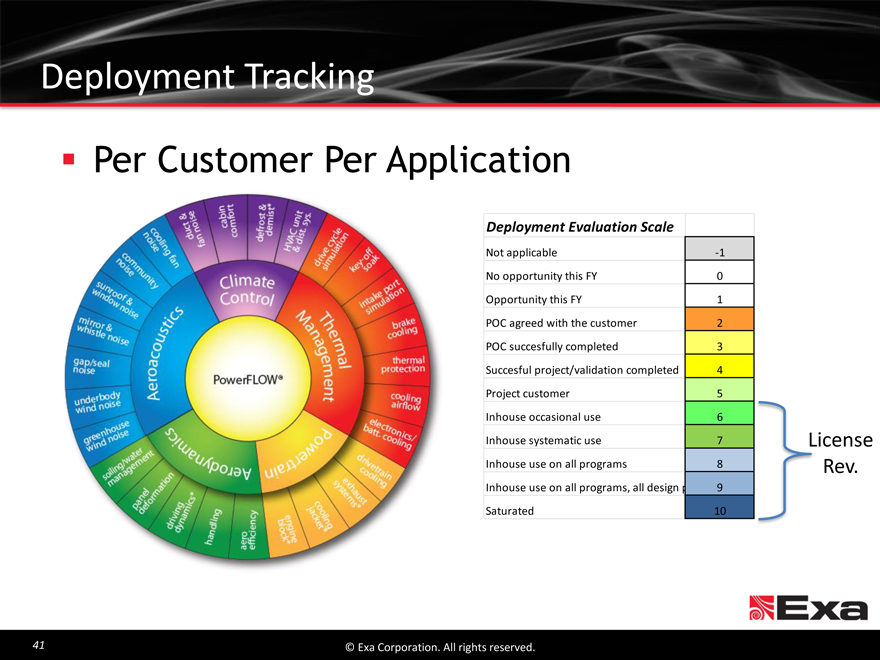
Deployment Tracking
Per Customer Per Application
Deployment Evaluation Scale
Not applicable -1
No opportunity this FY 0
Opportunity this FY 1
POC agreed with the customer 2
POC succesfully completed 3
Succesful project/validation completed 4
Project customer 5
Inhouse occasional use 6
Inhouse systematic use 7 License
Inhouse use on all programs 8 Rev.
Inhouse use on all programs, all design p 9
Saturated 10
41 © Exa Corporation. All rights reserved.
|
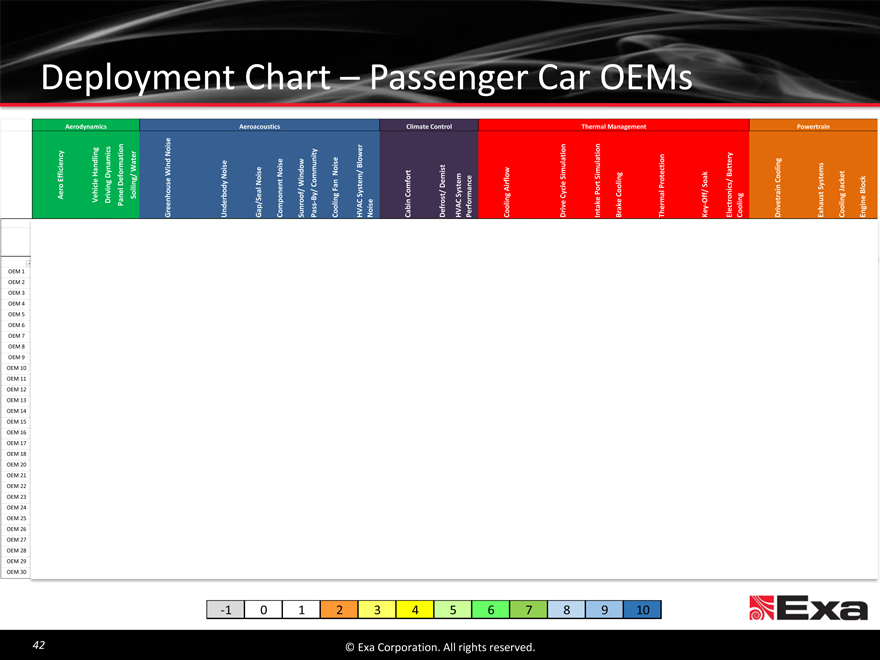
Deployment Chart - Passenger Car OEMs
Aero Efficiency
Vehicle Handling Aerodynamics
Driving Dynamics Panel Deformation Soiling/ Water
Greenhouse Wind Noise
Underbody Noise Deployment
Gap/Seal Noise Aeroacoustics
Component Noise
Sunroof/ Window
Pass-By/ Community Chart Cooling Fan Noise HVAC System/ Blower Noise
Cabin Comfort Climate
Defrost/ Demist Control HVAC System Performance
Cooling Airflow Passenger
Drive Cycle Simulation Car Intake Port Simulation Thermal
Brake Cooling Management
Thermal Protection OEMs Key-Off/ Soak
Electronics/ Battery Cooling
Drivetrain Cooling
Exhaust Systems Powertrain Cooling Jacket
Engine Block
OEM 1 OEM 2 OEM 3 OEM 4 OEM 5 OEM 6 OEM 7 OEM 8 OEM 9 OEM 10 OEM 11 OEM 12 OEM 13 OEM 14 OEM 15 OEM 16 OEM 17 OEM 18 OEM 20 OEM 21 OEM 22 OEM 23 OEM 24 OEM 25 OEM 26 OEM 27 OEM 28 OEM 29 OEM 30
-1 0 1 2 3 4 5 6 7 8 9 10
© Exa Corporation. All rights reserved.
42
|
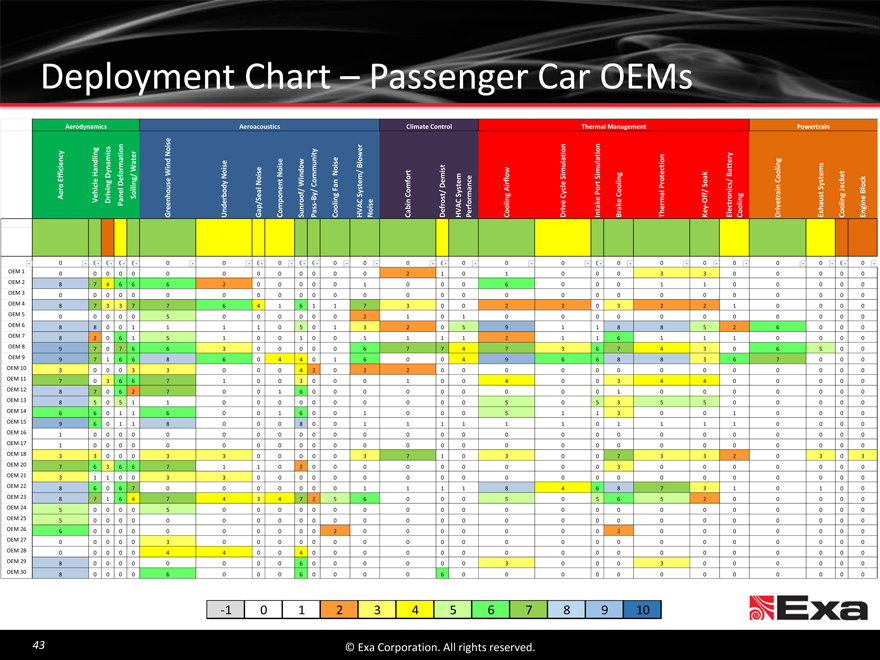
Deployment Chart Passenger Car OEMs
Aerodynamics Aeroacoustics Climate Control Thermal Management Powertrain
n ise n
c s o y io
i No ion
er t
d nit a g
t e e lat ion t ery
n ow Bl t t
s
iency dling ynami mat nd ower t ec Bat
E ff ic Han D ef or g / Wa e Wi Nois ise No ise mmu Nois r emi e S imu Simul ot / Coolin t ems ket k
icle g D dy No Wi Co stem/ D nc irf low le rt Pr s n S ys ac oc
/ A l / J Bl
t
ero ivin Soilin ous bo Seal onent of/ By/ g Fan Sy Co mfo t Sy stem ma g Cyc Po Co oling Soak o nic g rai s g e
A r — e Off in
s r —
s g
Veh D Panel r eenh Under ap / Co mp Sun ro Pa Co olin VAC Nois e Ca bin ef os VAC Pe rf or Co olin r ive nt ake Brak Th erma ey lectr Co olin r ivet Exhau Co olin En
G G H D H D I K E D
0 0 0 0 0 0 0 0 0 0 0 0 0 0 0 0 0 0 0 0 0 0 0 0 0 0 0
OEM 1 0 0 0 0 0 0 0 0 0 0 0 0 0 2 1 0 1 0 0 0 3 3 0 0 0 0 0
OEM 2 8 7 4 6 6 6 2 0 0 0 0 0 1 0 0 0 6 0 0 0 1 1 0 0 0 0 0
OEM 3 0 0 0 0 0 0 0 0 0 0 0 0 0 0 0 0 0 0 0 0 0 0 0 0 0 0 0
OEM 4 8 7 3 3 7 7 6 4 1 6 1 1 7 3 0 0 2 2 0 3 2 2 1 0 0 0 0
OEM 5 0 0 0 0 0 5 0 0 0 0 0 0 2 1 0 1 0 0 0 0 0 0 0 0 0 0 0
OEM 6 8 8 0 0 1 1 1 1 0 5 0 1 3 2 0 5 9 1 1 8 8 5 2 6 0 0 0
OEM 7 8 2 0 6 1 5 1 0 0 1 0 0 1 1 1 1 2 1 1 6 1 1 1 0 0 0 0
OEM 8 9 7 0 7 6 6 3 0 0 0 0 0 6 7 7 4 7 3 6 7 4 3 0 6 5 0 0
OEM 9 9 7 1 6 6 8 6 0 4 4 0 1 6 0 0 4 9 6 6 8 8 3 6 7 0 0 0
OEM 10 3 0 0 0 3 3 0 0 0 4 2 0 2 2 0 0 0 0 0 0 0 0 0 0 0 0 0
OEM 11 7 0 3 6 6 7 1 0 0 3 0 0 0 1 0 0 4 0 0 3 4 4 0 0 0 0 0
OEM 12 8 7 0 6 2 7 0 0 1 6 0 0 0 0 0 0 0 0 0 1 0 0 0 0 0 0 0
OEM 13 8 5 0 5 1 1 0 0 0 0 0 0 0 0 0 0 5 0 5 3 5 5 0 0 0 0 0
OEM 14 6 6 0 1 1 6 0 0 1 6 0 0 1 0 0 0 5 1 1 3 0 0 1 0 0 0 0
OEM 15 9 6 0 1 1 8 0 0 0 8 0 0 1 1 1 1 1 1 0 1 1 1 1 0 0 0 0
OEM 16 1 0 0 0 0 0 0 0 0 0 0 0 0 0 0 0 0 0 0 0 0 0 0 0 0 0 0
OEM 17 1 0 0 0 0 0 0 0 0 0 0 0 0 0 0 0 0 0 0 0 0 0 0 0 0 0 0
OEM 18 3 3 0 0 0 3 3 0 0 0 0 0 3 7 1 0 3 0 0 7 3 3 2 0 3 0 3
OEM 20 7 6 3 6 6 7 1 1 0 2 0 0 0 0 0 0 0 0 0 3 0 0 0 0 0 0 0
OEM 21 3 1 1 0 0 3 3 0 0 0 0 0 0 0 0 0 0 0 0 0 0 0 0 0 0 0 0
OEM 22 8 6 0 6 7 0 0 0 0 0 0 0 1 1 1 1 8 4 6 8 7 3 1 0 1 0 0
OEM 23 8 7 1 6 4 7 4 3 4 7 2 5 6 0 0 0 5 0 5 6 5 2 0 0 0 0 0
OEM 24 5 0 0 0 0 5 0 0 0 0 0 0 0 0 0 0 0 0 0 0 0 0 0 0 0 0 0
OEM 25 5 0 0 0 0 0 0 0 0 0 0 0 0 0 0 0 0 0 0 0 0 0 0 0 0 0 0
OEM 26 6 0 0 0 0 0 0 0 0 0 0 2 0 0 0 0 0 0 0 2 0 0 0 0 0 0 0
OEM 27 0 0 0 0 0 3 0 0 0 0 0 0 0 0 0 0 0 0 0 0 0 0 0 0 0 0 0
OEM 28 0 0 0 0 0 4 4 0 0 4 0 0 0 0 0 0 0 0 0 0 0 0 0 0 0 0 0
OEM 29 8 0 0 0 0 0 0 0 0 6 0 0 0 0 0 0 3 0 0 0 3 0 0 0 0 0 0
OEM 30 8 0 0 0 0 6 0 0 0 6 0 0 0 0 6 0 0 0 0 0 0 0 0 0 0 0 0
-1 0 1 2 3 4 5 6 7 8 9 10
43 © Exa Corporation. All rights reserved.
|
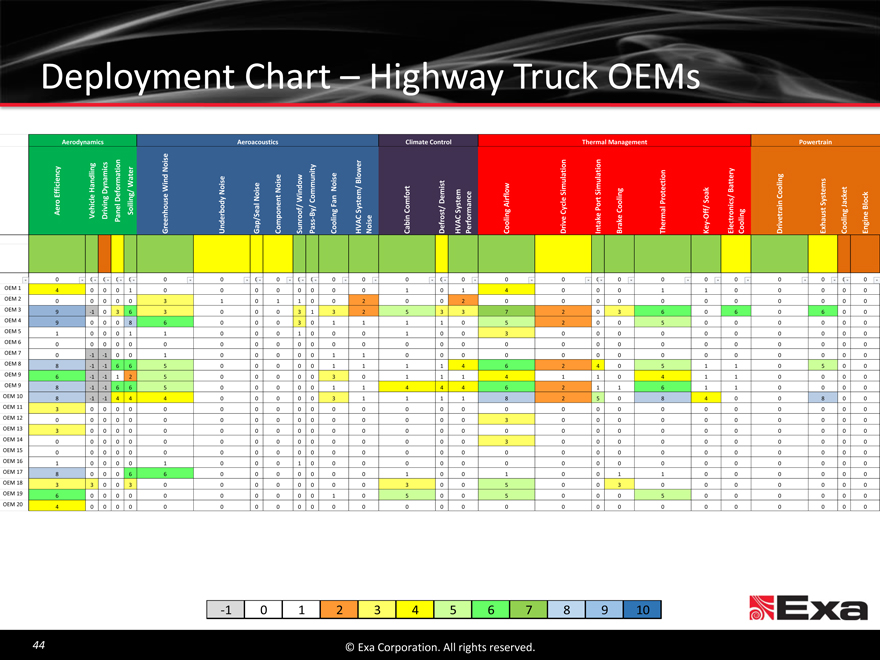
Deployment Chart Highway Truck OEMs
Aerodynamics Aeroacoustics Climate Control Thermal Management Powertrain
se
n n
s y o
y ng c i o Noi w er ion ti y
c l i t nit t n
e o l a o g
is i
n d ma d s e se ow Bl t la t tt er n
o r Win i s e d t w ec
f icien Ha Dynami / Water No i Noi mmu No r o i mu imu g ak Ba oli et
E f l e g Def n g se y No t Win Co n em/ Demis em c e r fl S t S li n Pro t o s/ Co y stems c k ck
i l a n i le r S c n S a
A i i J
o i n il u d n en f / / g F S yst Comfo S yst g Cyc l f / n g ra t g
v S o ho S ea o By n st/ r ma n e Po ma r o n s e Blo
/ — l i C n o C o i e k e t i et a u i n n
Aer Vehic Dri Pa nel een derbo nroo ise i r l Coo er—Of l l i
p i v t a ec i v h g
Gr Un Ga Comp u Pass Coo HVA No Cab Def HVA Perf Coo Dr In Brak h ey l Coo Dr x Coo n
S T K E E E
0 0 0 0 0 0 0 0 0 0 0 0 0 0 0 0 0 0 0 0 0 0 0 0 0 0 0
OEM 1 4 0 0 0 1 0 0 0 0 0 0 0 0 1 0 1 4 0 0 0 1 1 0 0 0 0 0
OEM 2 0 0 0 0 0 3 1 0 1 1 0 0 2 0 0 2 0 0 0 0 0 0 0 0 0 0 0
OEM 3 9 -1 0 3 6 3 0 0 0 3 1 3 2 5 3 3 7 2 0 3 6 0 6 0 6 0 0
OEM 4 9 0 0 0 8 6 0 0 0 3 0 1 1 1 1 0 5 2 0 0 5 0 0 0 0 0 0
OEM 5 1 0 0 0 1 1 0 0 0 1 0 0 0 1 0 0 3 0 0 0 0 0 0 0 0 0 0
OEM 6 0 0 0 0 0 0 0 0 0 0 0 0 0 0 0 0 0 0 0 0 0 0 0 0 0 0 0
OEM 7 0 -1 -1 0 0 1 0 0 0 0 0 1 1 0 0 0 0 0 0 0 0 0 0 0 0 0 0
OEM 8 8 -1 -1 6 6 5 0 0 0 0 0 1 1 1 1 4 6 2 4 0 5 1 1 0 5 0 0
OEM 9 6 -1 -1 1 2 5 0 0 0 0 0 3 0 1 1 1 4 1 1 0 4 1 1 0 0 0 0
OEM 9 8 -1 -1 6 6 5 0 0 0 0 0 1 1 4 4 4 6 2 1 1 6 1 1 0 0 0 0
OEM 10 8 -1 -1 4 4 4 0 0 0 0 0 3 1 1 1 1 8 2 5 0 8 4 0 0 8 0 0
OEM 11 3 0 0 0 0 0 0 0 0 0 0 0 0 0 0 0 0 0 0 0 0 0 0 0 0 0 0
OEM 12 0 0 0 0 0 0 0 0 0 0 0 0 0 0 0 0 3 0 0 0 0 0 0 0 0 0 0
OEM 13 3 0 0 0 0 0 0 0 0 0 0 0 0 0 0 0 0 0 0 0 0 0 0 0 0 0 0
OEM 14 0 0 0 0 0 0 0 0 0 0 0 0 0 0 0 0 3 0 0 0 0 0 0 0 0 0 0
OEM 15 0 0 0 0 0 0 0 0 0 0 0 0 0 0 0 0 0 0 0 0 0 0 0 0 0 0 0
OEM 16 1 0 0 0 0 1 0 0 0 1 0 0 0 0 0 0 0 0 0 0 0 0 0 0 0 0 0
OEM 17 8 0 0 0 6 6 0 0 0 0 0 0 0 1 0 0 1 0 0 1 1 0 0 0 0 0 0
OEM 18 3 3 0 0 3 0 0 0 0 0 0 0 0 3 0 0 5 0 0 3 0 0 0 0 0 0 0
OEM 19 6 0 0 0 0 0 0 0 0 0 0 1 0 5 0 0 5 0 0 0 5 0 0 0 0 0 0
OEM 20 4 0 0 0 0 0 0 0 0 0 0 0 0 0 0 0 0 0 0 0 0 0 0 0 0 0 0
-1 0 1 2 3 4 5 6 7 8 9 10
44 © Exa Corporation. All rights reserved.
|
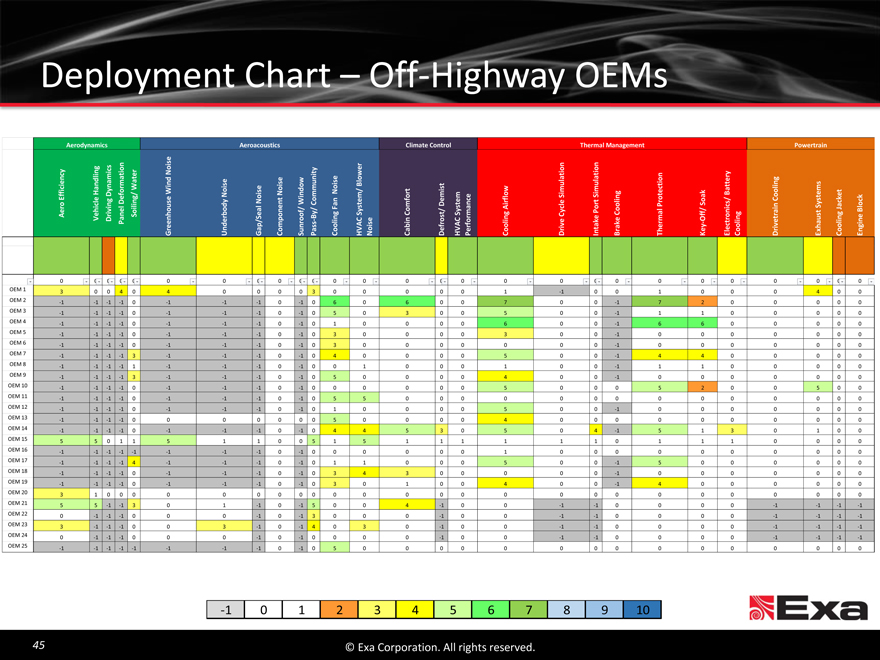
Deployment Chart Off-Highway OEMs
Aerodynamics Aeroacoustics Climate Control Thermal Management Powertrain
e
s
n i n on
i
i ng t o er No ity tio ti
t a
ency dl mics ma e ise Blower la i on ng
s t t i
r e s
o Wa Wi nd Noi i s No imul i mu g ec ems et
S S in t t
ng/ n em/ l o s / c k
Effici e Han g Dyna Def i e No Noise Window mmun t t em nce i l r o S ak c Battery Cool
l l Fa e t Pro Sys Ja ck
f / ys A f/ t
o i Soi us nent Co S Comfort t/ Demi S rflow Po Co
s
A er eal o —By/ i ng C ys e o C orma i ng Cyc e mal Of i ng rain us i ng ine Blo
Dr /S s s i s b in r ve a ke k — vet g
Vehic vin Panel Greenho U n derbody Gap Comp Sunroo Pa Cool HVA No Ca Def HVA Perf Cool Dri n t Bra Th er K ey lectroni Cool Dri Exha Cool En
I E
0 0 0 0 0 0 0 0 0 0 0 0 0 0 0 0 0 0 0 0 0 0 0 0 0 0 0
OEM 1 3 0 0 4 0 4 0 0 0 0 3 0 0 0 0 0 1 -1 0 0 1 0 0 0 4 0 0
OEM 2 -1 -1 -1 -1 0 -1 -1 -1 0 -1 0 6 0 6 0 0 7 0 0 -1 7 2 0 0 0 0 0
OEM 3 -1 -1 -1 -1 0 -1 -1 -1 0 -1 0 5 0 3 0 0 5 0 0 -1 1 1 0 0 0 0 0
OEM 4 -1 -1 -1 -1 0 -1 -1 -1 0 -1 0 1 0 0 0 0 6 0 0 -1 6 6 0 0 0 0 0
OEM 5 -1 -1 -1 -1 0 -1 -1 -1 0 -1 0 3 0 0 0 0 3 0 0 -1 0 0 0 0 0 0 0
OEM 6 -1 -1 -1 -1 0 -1 -1 -1 0 -1 0 3 0 0 0 0 0 0 0 -1 0 0 0 0 0 0 0
OEM 7 -1 -1 -1 -1 3 -1 -1 -1 0 -1 0 4 0 0 0 0 5 0 0 -1 4 4 0 0 0 0 0
OEM 8 -1 -1 -1 -1 1 -1 -1 -1 0 -1 0 0 1 0 0 0 1 0 0 -1 1 1 0 0 0 0 0
OEM 9 -1 -1 -1 -1 3 -1 -1 -1 0 -1 0 5 0 0 0 0 4 0 0 -1 0 0 0 0 0 0 0
OEM 10 -1 -1 -1 -1 0 -1 -1 -1 0 -1 0 0 0 0 0 0 5 0 0 0 5 2 0 0 5 0 0
OEM 11 -1 -1 -1 -1 0 -1 -1 -1 0 -1 0 5 5 0 0 0 0 0 0 0 0 0 0 0 0 0 0
OEM 12 -1 -1 -1 -1 0 -1 -1 -1 0 -1 0 1 0 0 0 0 5 0 0 -1 0 0 0 0 0 0 0
OEM 13 -1 -1 -1 -1 0 0 0 0 0 0 0 5 0 0 0 0 4 0 0 0 0 0 0 0 0 0 0
OEM 14 -1 -1 -1 -1 0 -1 -1 -1 0 -1 0 4 4 5 3 0 5 0 4 -1 5 1 3 0 1 0 0
OEM 15 5 5 0 1 1 5 1 1 0 0 5 1 5 1 1 1 1 1 1 0 1 1 1 0 0 0 0
OEM 16 -1 -1 -1 -1 -1 -1 -1 -1 0 -1 0 0 0 0 0 0 1 0 0 0 0 0 0 0 0 0 0
OEM 17 -1 -1 -1 -1 4 -1 -1 -1 0 -1 0 1 1 0 0 0 5 0 0 -1 5 0 0 0 0 0 0
OEM 18 -1 -1 -1 -1 0 -1 -1 -1 0 -1 0 3 4 3 0 0 0 0 0 -1 0 0 0 0 0 0 0
OEM 19 -1 -1 -1 -1 0 -1 -1 -1 0 -1 0 3 0 1 0 0 4 0 0 -1 4 0 0 0 0 0 0
OEM 20 3 1 0 0 0 0 0 0 0 0 0 0 0 0 0 0 0 0 0 0 0 0 0 0 0 0 0
OEM 21 5 5 -1 -1 3 0 1 -1 0 -1 5 0 0 4 -1 0 0 -1 -1 0 0 0 0 -1 -1 -1 -1
OEM 22 0 -1 -1 -1 0 0 0 -1 0 -1 3 0 0 0 -1 0 0 -1 -1 0 0 0 0 -1 -1 -1 -1
OEM 23 3 -1 -1 -1 0 0 3 -1 0 -1 4 0 3 0 -1 0 0 -1 -1 0 0 0 0 -1 -1 -1 -1
OEM 24 0 -1 -1 -1 0 0 0 -1 0 -1 0 0 0 0 -1 0 0 -1 -1 0 0 0 0 -1 -1 -1 -1
OEM 25 -1 -1 -1 -1 -1 -1 -1 -1 0 -1 0 5 0 0 0 0 0 0 0 0 0 0 0 0 0 0 0
-1 0 1 2 3 4 5 6 7 8 9 10
45 © Exa Corporation. All rights reserved.
|
Key Messages
Large addressable market … Proven technology and
only fractionally penetrated solutions
Strong and consistent Path to profitability and
execution continued top line growth
© Exa Corporation. All rights reserved.
|
Agenda
12:30 1:30 Registration, Lunch, Product Demonstrations
1:30 2:20 Welcome and Market Opportunity, Steve Remondi, CEO
Company Mission and Execution
Addressable Market Opportunity
Exa Deployment and Penetration
2:40 3:00 Product Strategy Customer Alignment, Steve Remondi, CEO
Applications and Automation
Cloud Enabling Quick Adoption and Collaboration
3:00 3:30 Break
3:30 4:15 Financial Update, Rick Gilbody, CFO
The Path to Profitability and Continued Revenue Growth
Guidance FY 16 and FY 17
Target Model
4:15 5:00
Q & A
47 © Exa Corporation. All rights reserved.
|
AUDIO ONLY: Jaguar Land Rover Video in Progress
|
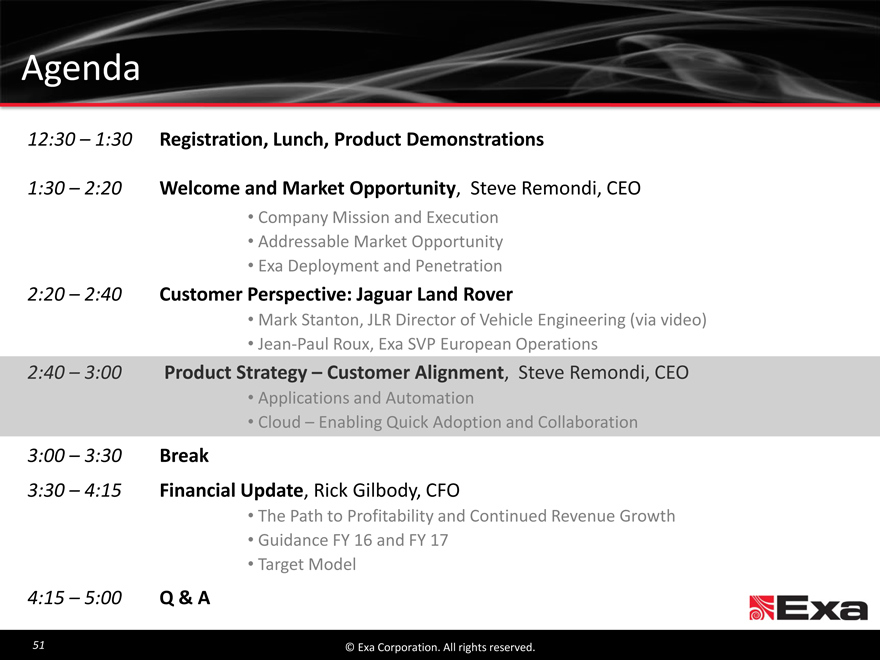
Agenda
12:30 1:30 Registration, Lunch, Product Demonstrations
1:30 2:20 Welcome and Market Opportunity, Steve Remondi, CEO
Company Mission and Execution
Addressable Market Opportunity
Exa Deployment and Penetration
2:20 2:40 Customer Perspective: Jaguar Land Rover
Mark Stanton, JLR Director of Vehicle Engineering (via video)
Jean-Paul Roux, Exa SVP European Operations
3:00 3:30 Break
3:30 4:15 Financial Update, Rick Gilbody, CFO
The Path to Profitability and Continued Revenue Growth
Guidance FY 16 and FY 17
Target Model
4:15 5:00
Q & A
51 © Exa Corporation. All rights reserved.
|
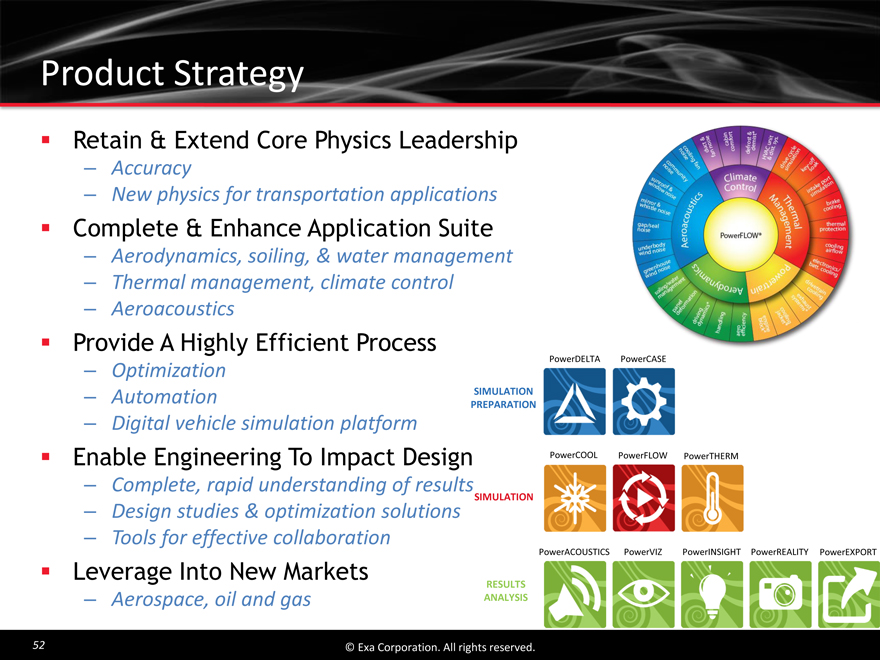
Product Strategy
Retain & Extend Core Physics Leadership
Accuracy
New physics for transportation applications
Complete & Enhance Application Suite
Aerodynamics, soiling, & water management
Thermal management, climate control
Aeroacoustics
Provide A Highly Efficient Process
PowerDELTA PowerCASE
Optimization
Automation SIMULATION
PREPARATION
Digital vehicle simulation platform
Enable Engineering To Impact Design PowerCOOL PowerFLOW PowerTHERM
Complete, rapid understanding of results
SIMULATION
Design studies & optimization solutions
Tools for effective collaboration
PowerACOUSTICS PowerVIZ PowerINSIGHT PowerREALITY PowerEXPORT
Leverage Into New Markets RESULTS
Aerospace, oil and gas ANALYSIS
52 © Exa Corporation. All rights reserved.
|
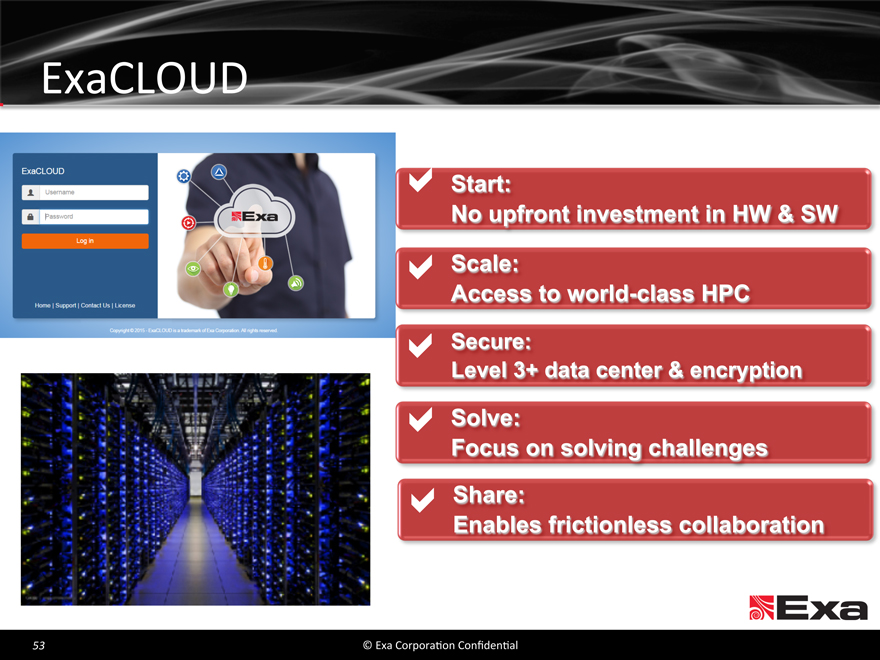
ExaCLOUD
Start:
No upfront investment in HW & SW
Scale:
Access to world class HPC
Secure:
Level 3+ data center & encryption
Solve:
Focus on solving challenges
Share:
Enables frictionless collaboration
53 © Exa Corporation. All rights reserved.
|
AUDIO ONLY: ExaCLOUD Video in Progress
© Exa Corporation. All rights reserved.
|
AUDIO ONLY: PowerINSIGHT Video in Progress
© Exa Corporation. All rights reserved.
|
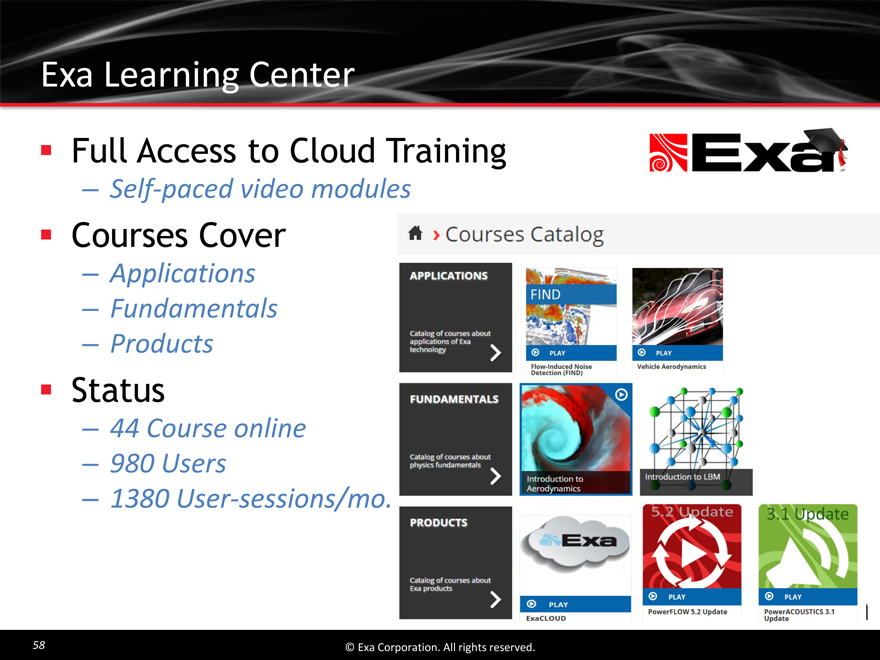
Exa Learning Center
Full Access to Cloud Training
Self-paced video modules
Courses Cover
Applications
Fundamentals
Products
Status
44 Course online
980 Users
1380 User-sessions/mo.
58 © Exa Corporation. All rights reserved.
|
Agenda
12:30 1:30 Registration, Lunch, Product Demonstrations
1:30 2:20 Welcome and Market Opportunity, Steve Remondi, CEO
Company Mission and Execution
Addressable Market Opportunity
Exa Deployment and Penetration
2:20 2:40 Customer Perspective: Jaguar Land Rover
Mark Stanton, JLR Director of Vehicle Engineering (via video)
Jean-Paul Roux, Exa SVP European Operations
2:40 3:00 Product Strategy Customer Alignment, Steve Remondi, CEO
Applications and Automation
Cloud Enabling Quick Adoption and Collaboration
3:30 4:15
Financial Update, Rick Gilbody, CFO
The Path to Profitability and Continued Revenue Growth
Guidance FY 16 and FY 17
Target Model
4:15 5:00
Q & A
|

Agenda
12:30 1:30 Registration, Lunch, Product Demonstrations
1:30 2:20 Welcome and Market Opportunity, Steve Remondi, CEO
Company Mission and Execution
Addressable Market Opportunity
Exa Deployment and Penetration
2:20 2:40 Customer Perspective: Jaguar Land Rover
Mark Stanton, JLR Director of Vehicle Engineering (via video)
Jean-Paul Roux, Exa SVP European Operations
2:40 3:00 Product Strategy Customer Alignment, Steve Remondi, CEO
Applications and Automation
Cloud Enabling Quick Adoption and Collaboration
3:00 3:30
Break
4:15 5:00
Q & A
60 © Exa Corporation. All rights reserved.
|
Key Messages
Strong and consistent Path to profitability and
execution continued top line growth
© Exa Corporation. All rights reserved.
|
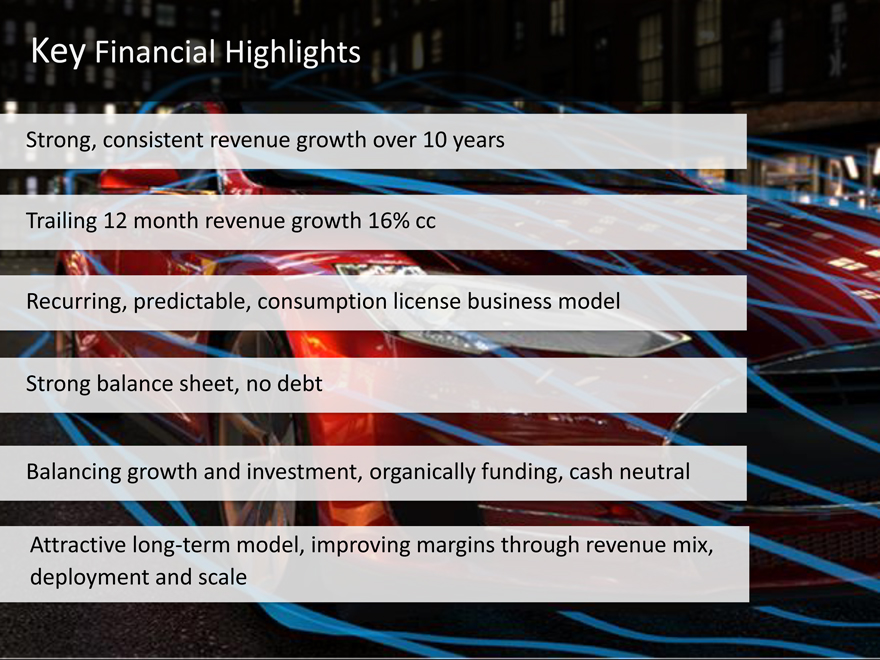
Key Financial Highlights
Strong, consistent revenue growth over 10 years
Trailing 12 month revenue growth 16% cc
Recurring, predictable, consumption license business model
Strong balance sheet, no debt
Balancing growth and investment, organically funding, cash neutral
Attractive long-term model, improving margins through revenue mix, deployment and scale
|
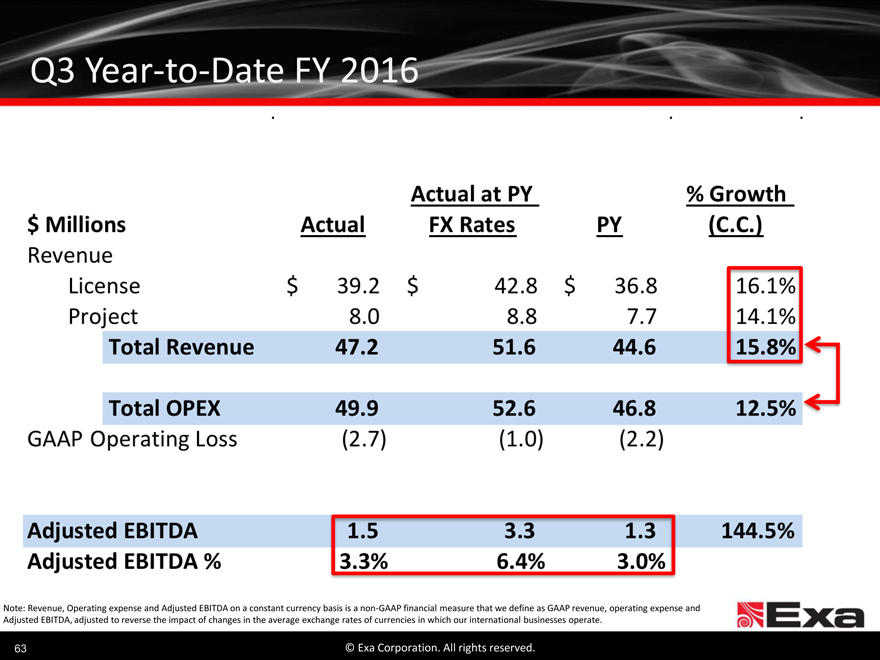
Q3 Year-to-Date FY 2016
Note: Revenue, Operating expense and Adjusted EBITDA on a constant currency basis is a non-GAAP financial measure that we define as GAAP revenue, operating expense and Adjusted EBITDA, adjusted to reverse the impact of changes in the average exchange rates of currencies in which our international businesses operate.
63 © Exa Corporation. All rights reserved.
|
Exa Revenue Profile
License Revenue
Highly recurring and visible
On-premise and cloud consumption based license models
Expansion through installed base deployment and new customer acquisition
Ratable revenue recognition
Project Revenue
Fixed fee, on-site and T&M
Customer enablement and application validation
License expansion
Consulting services
© Exa Corporation. All rights reserved.
|
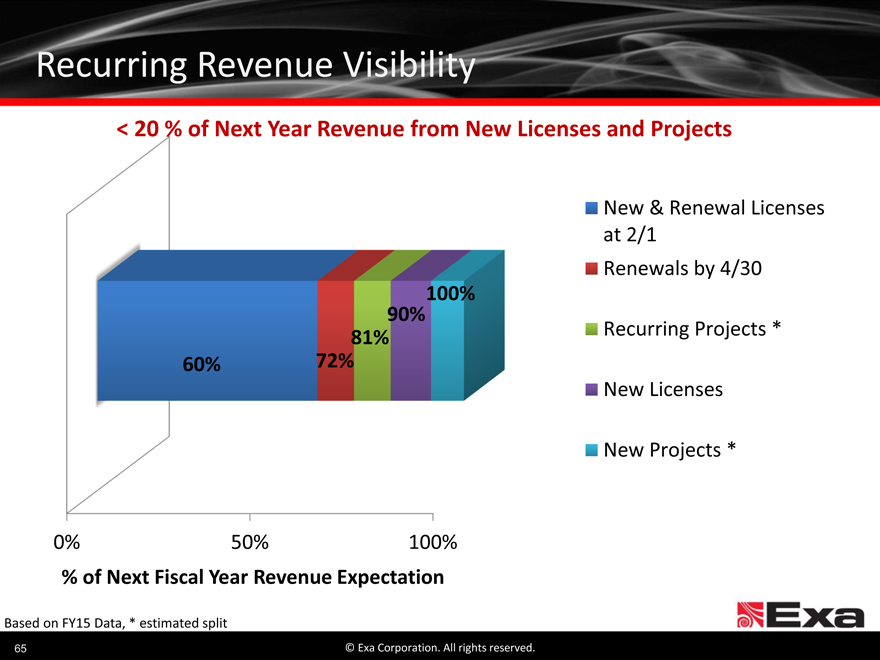
Recurring Revenue Visibility
< 20 % of Next Year Revenue from New Licenses and Projects
New & Renewal Licenses
at 2/1
Renewals by 4/30
100%
90%
81% Recurring Projects *
60% 72%
New Licenses
New Projects *
0% 50% 100%
% of Next Fiscal Year Revenue Expectation
Based on FY15 Data, * estimated split
65 © Exa Corporation. All rights reserved.
|
Investing In Growth
~$12M incremental investment in customer facing resources, product enhancement and market development over the past 30 months
Core product functionality extension
ExaCloud platform
Expansion of core markets
Passenger vehicle applications
Heavy vehicle highway and off-highway
Non- transportation machinery
Extension into new vertical markets
Aerospace
Oil & Gas
66 © Exa Corporation. All rights reserved.
|
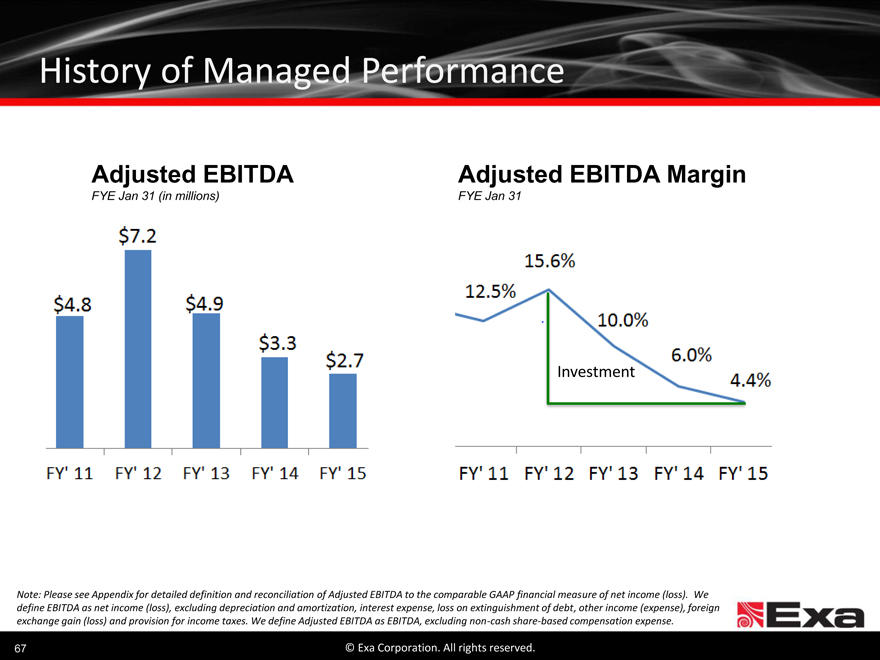
History of Managed Performance
Adjusted EBITDA Adjusted EBITDA Margin
FYE Jan 31 (in millions) FYE Jan 31
Investment
Note: Please see Appendix for detailed definition and reconciliation of Adjusted EBITDA to the comparable GAAP financial measure of net income (loss). We define EBITDA as net income (loss), excluding depreciation and amortization, interest expense, loss on extinguishment of debt, other income (expense), foreign exchange gain (loss) and provision for income taxes. We define Adjusted EBITDA as EBITDA, excluding non-cash share-based compensation expense.
67 © Exa Corporation. All rights reserved.
|
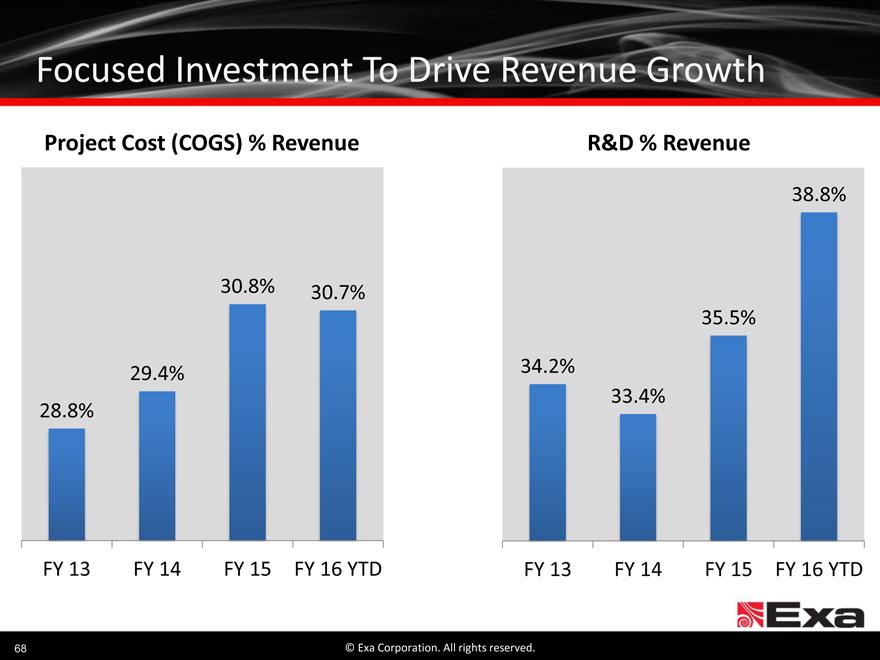
Focused Investment To Drive Revenue Growth
Project Cost (COGS) % Revenue R&D % Revenue
38.8%
30.8% 30.7%
35.5%
29.4% 34.2%
33.4%
28.8%
FY 13 FY 14 FY 15 FY 16 YTD FY 13 FY 14 FY 15 FY 16 YTD
68 © Exa Corporation. All rights reserved.
|
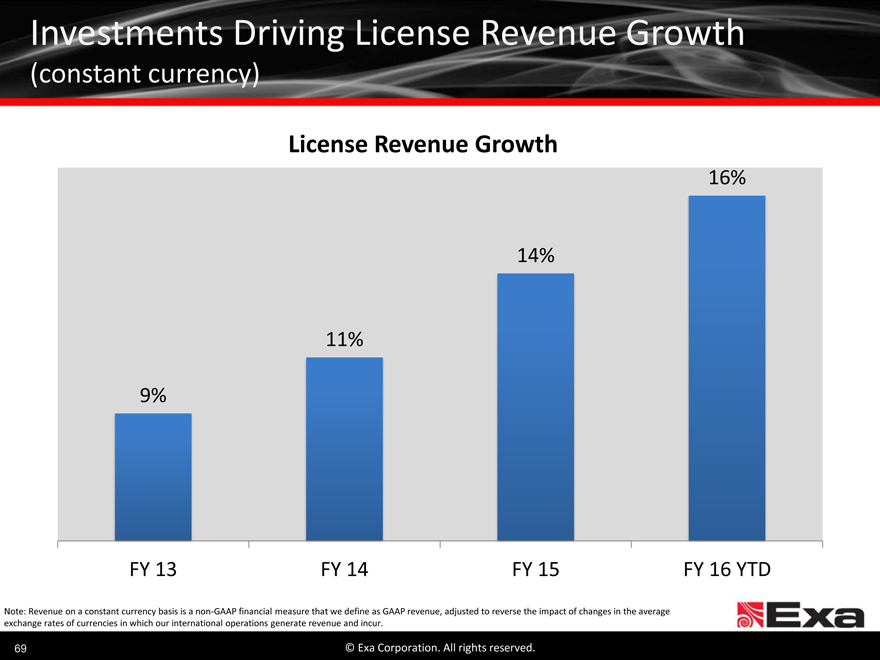
Investments Driving License Revenue Growth
(constant currency)
License Revenue Growth
16%
14%
11%
9%
FY 13 FY 14 FY 15 FY 16 YTD
Note: Revenue on a constant currency basis is a non-GAAP financial measure that we define as GAAP revenue, adjusted to reverse the impact of changes in the average
exchange rates of currencies in which our international operations generate revenue and incur.
69 © Exa Corporation. All rights reserved.
|
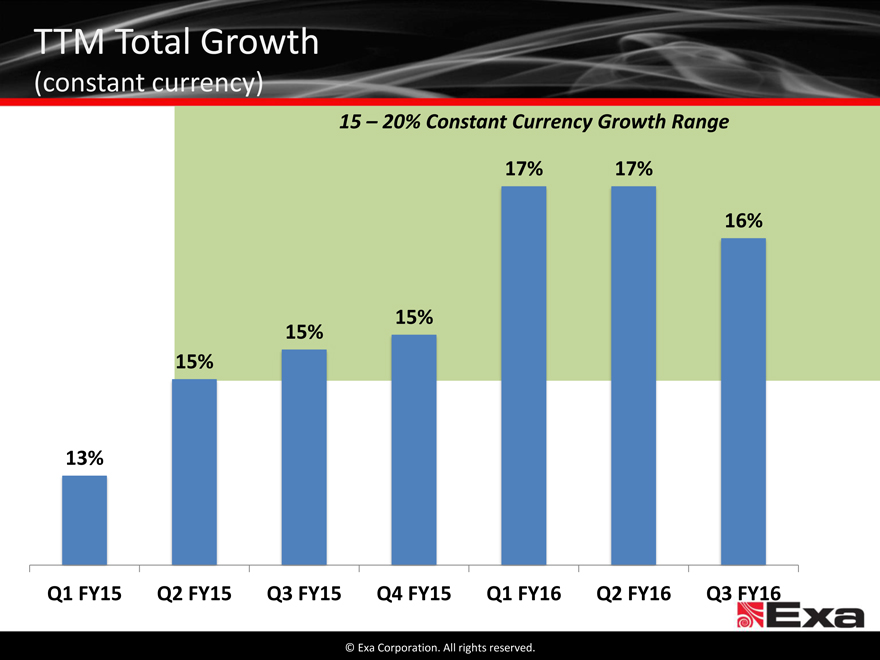
TTM Total Growth
(constant currency)
15 20% Constant Currency Growth Range
17% 17%
16%
15%
15%
15%
13%
Q1 FY15 Q2 FY15 Q3 FY15 Q4 FY15 Q1 FY16 Q2 FY16 Q3 FY16
© Exa Corporation. All rights reserved.
|
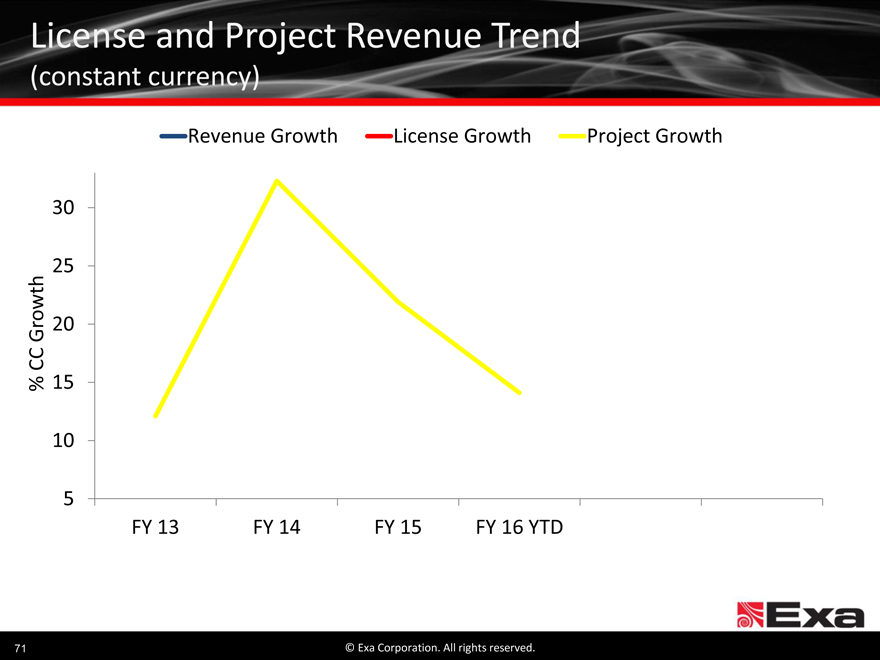
License and Project Revenue Trend
(constant currency)
Revenue Growth License Growth Project Growth
30
25
Growth 20
CC
% 15
10
5
FY 13 FY 14 FY 15 FY 16 YTD
71 © Exa Corporation. All rights reserved.
|

License and Project Revenue Trend
(constant currency)
Revenue Growth License Growth Project Growth
30
25
Growth 20
CC
% 15
10
5
FY 13 FY 14 FY 15 FY 16 YTD
72 © Exa Corporation. All rights reserved.
|
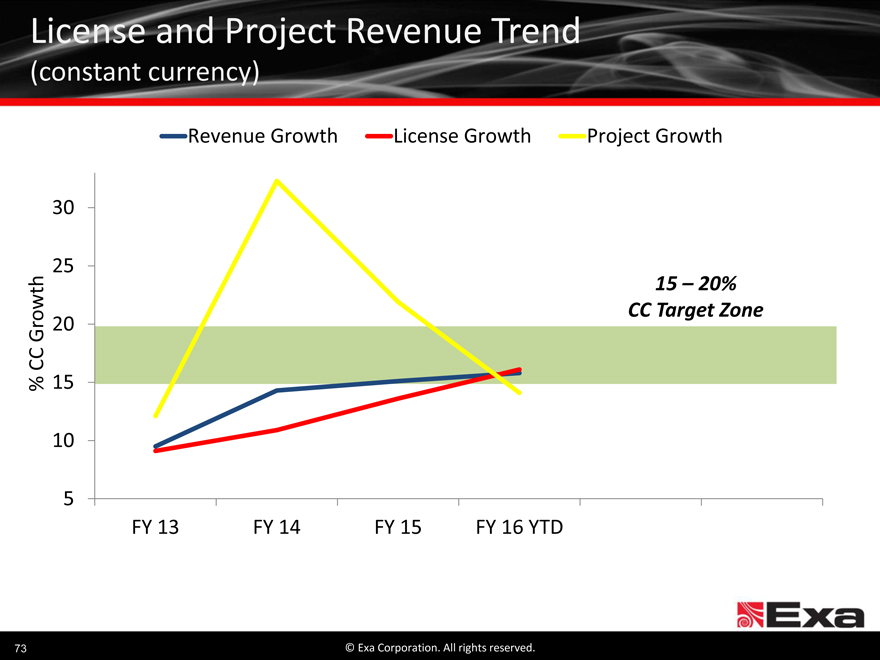
License and Project Revenue Trend
(constant currency)
Revenue Growth License Growth Project Growth
30
25
15 20%
CC Target Zone
Growth 20
CC
% 15
10
5
FY 13 FY 14 FY 15 FY 16 YTD
73 © Exa Corporation. All rights reserved.
|
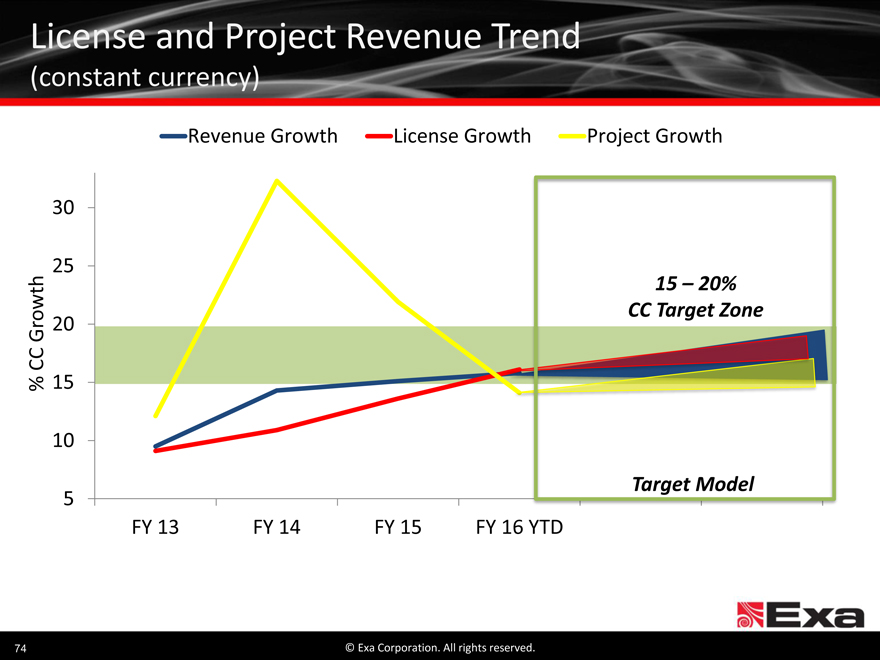
License and Project Revenue Trend
(constant currency)
Revenue Growth License Growth Project Growth
30
25
Growth 20
CC
% 15
10
Target Model
5
FY 13 FY 14 FY 15 FY 16 YTD
74 © Exa Corporation. All rights reserved.
|
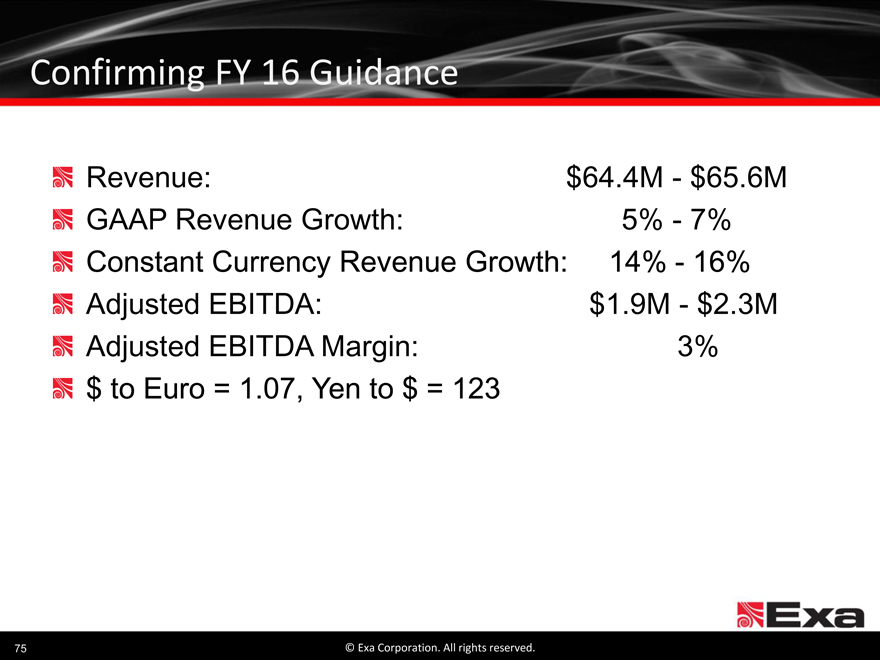
Confirming FY 16 Guidance
Revenue: $64.4M —$65.6M
GAAP Revenue Growth: 5% —7%
Constant Currency Revenue Growth: 14% —16%
Adjusted EBITDA: $1.9M —$2.3M
Adjusted EBITDA Margin: 3%
$ to Euro = 1.07, Yen to $ = 123
75 © Exa Corporation. All rights reserved.
|
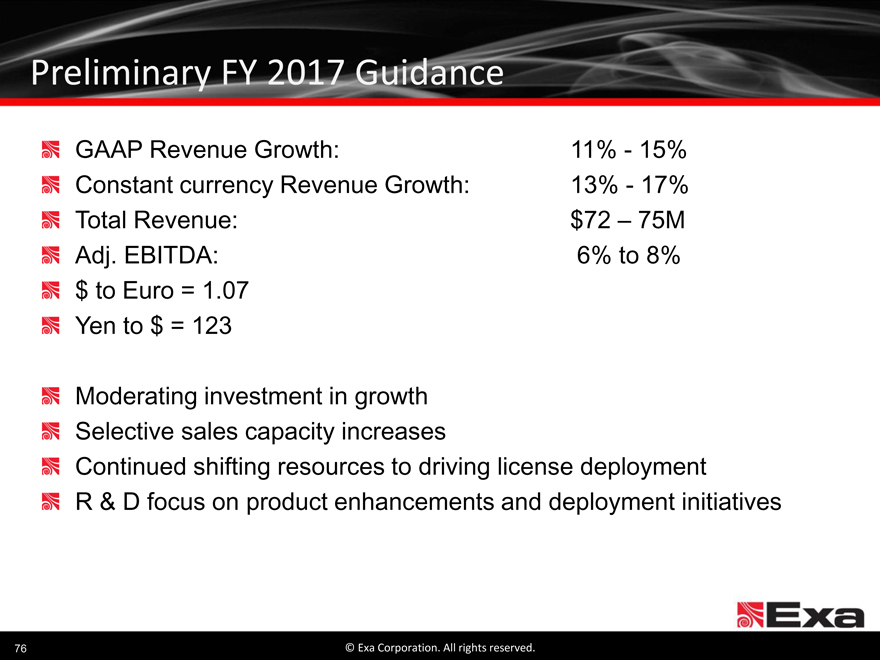
Preliminary FY 2017 Guidance
GAAP Revenue Growth: 11%—15%
Constant currency Revenue Growth: 13%—17%
Total Revenue: $72 75M
Adj. EBITDA: 6% to 8%
$ to Euro = 1.07
Yen to $ = 123
Moderating investment in growth Selective sales capacity increases
Continued shifting resources to driving license deployment R & D focus on product enhancements and deployment initiatives
76 © Exa Corporation. All rights reserved.
|
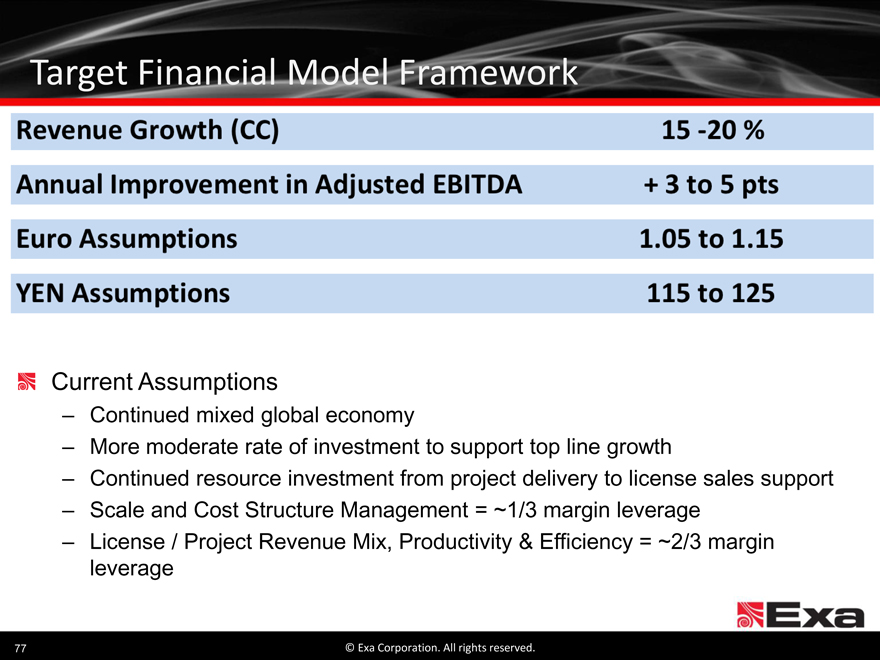
Target Financial Model Framework
Current Assumptions
Continued mixed global economy
More moderate rate of investment to support top line growth
Continued resource investment from project delivery to license sales support
Scale and Cost Structure Management = ~1/3 margin leverage
License / Project Revenue Mix, Productivity & Efficiency = ~2/3 margin leverage
77 © Exa Corporation. All rights reserved.
|
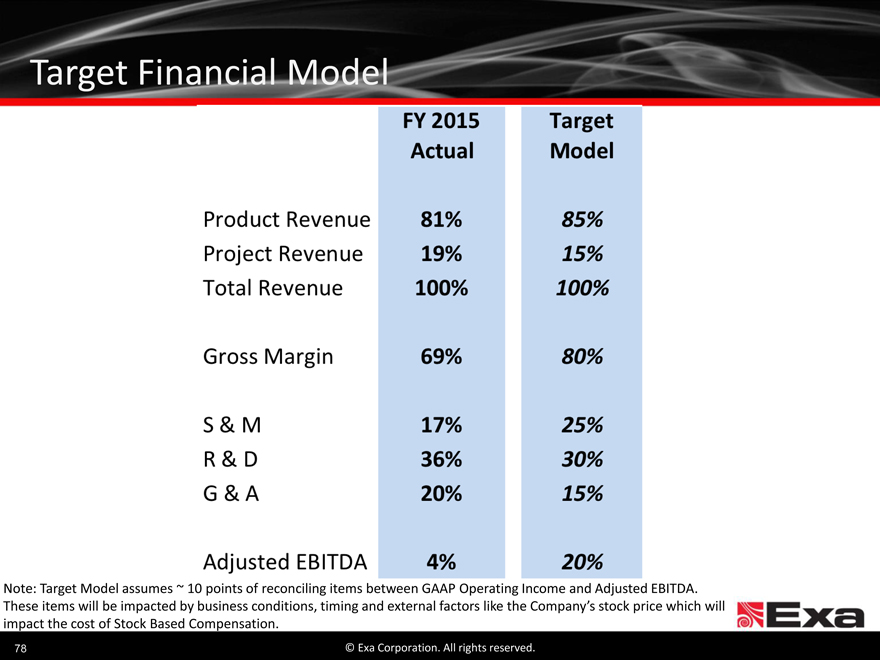
Target Financial Model
Note: Target Model assumes ~ 10 points of reconciling items between GAAP Operating Income and Adjusted EBITDA.
These items will be impacted by business conditions, timing and external factors like the Company’s stock price which will impact the cost of Stock Based Compensation.
78 © Exa Corporation. All rights reserved.
|
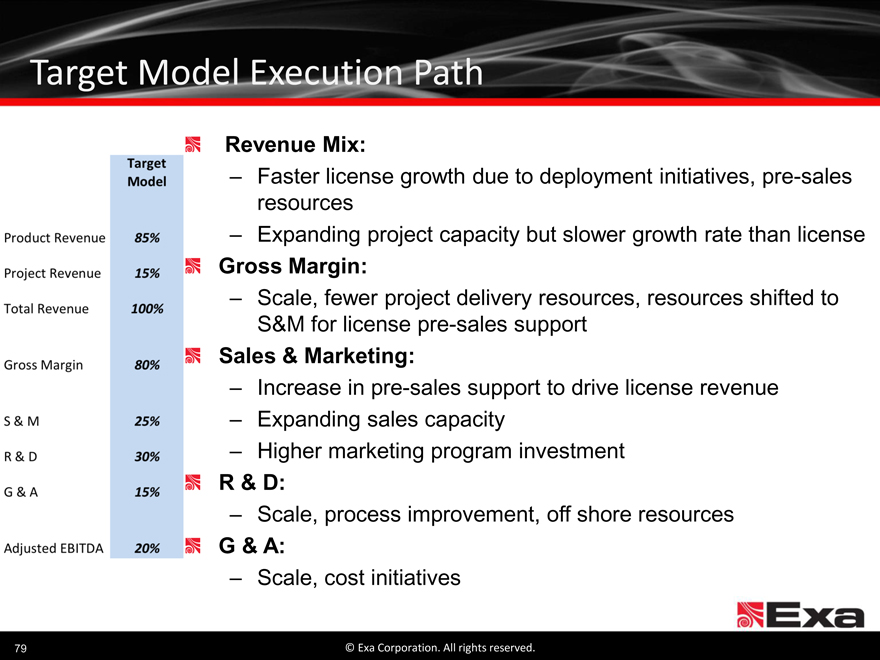
Target Model Execution Path
Revenue Mix:
Faster license growth due to deployment initiatives, pre-sales resources
Expanding project capacity but slower growth rate than license
Gross Margin:
Scale, fewer project delivery resources, resources shifted to
S&M for license pre-sales support
Sales & Marketing:
Increase in pre-sales support to drive license revenue
Expanding sales capacity
Higher marketing program investment
R & D:
Scale, process improvement, off shore resources
G & A:
Scale, cost initiatives
79 © Exa Corporation. All rights reserved.
|
Summary
Strong and expanding market opportunity Significant deployment expansion runway Competitive technical advantage Strong customer base Extended market reach via ExaCLOUD License growth momentum Considerable margin expansion opportunity
80 © Exa Corporation. All rights reserved.
|

Key Messages
Large addressable market … Proven technology and
only fractionally penetrated solutions
Strong and consistent Clear visibility to profitability
execution and continued top line growth
© Exa Corporation. All rights reserved.
|
Agenda
12:30 1:30 Registration, Lunch, Product Demonstrations
1:30 2:20 Welcome and Market Opportunity, Steve Remondi, CEO
Company Mission and Execution
Addressable Market Opportunity
Exa Deployment and Penetration
2:20 2:40
Customer Perspective: Jaguar Land Rover
Mark Stanton, JLR Director of Vehicle Engineering (via video)
Jean-Paul Roux, Exa SVP European Operations
2:40 3:00 Product Strategy Customer Alignment, Steve Remondi, CEO
Applications and Automation
Cloud Enabling Quick Adoption and Collaboration
3:00 3:30 Break
3:30 4:15 Financial Update, Rick Gilbody, CFO
The Path to Profitability and Continued Revenue Growth
Guidance FY 16 and FY 17
Target Model
© Exa Corporation. All rights reserved.
|
Appendix
© Exa Corporation. All rights reserved.
|
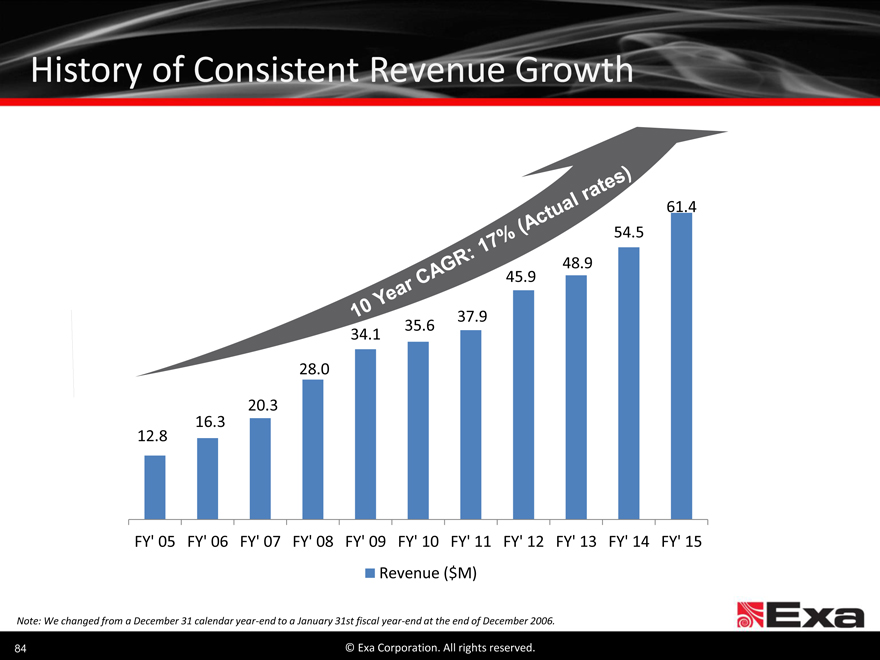
History of Consistent Revenue Growth
61.4
54.5
48.9
45.9
37.9
35.6
34.1
28.0
20.3
16.3
12.8
FY’ 05 FY’ 06 FY’ 07 FY’ 08 FY’ 09 FY’ 10 FY’ 11 FY’ 12 FY’ 13 FY’ 14 FY’ 15
Revenue ($M)
Note: We changed from a December 31 calendar year-end to a January 31st fiscal year-end at the end of December 2006.
84 © Exa Corporation. All rights reserved.
|
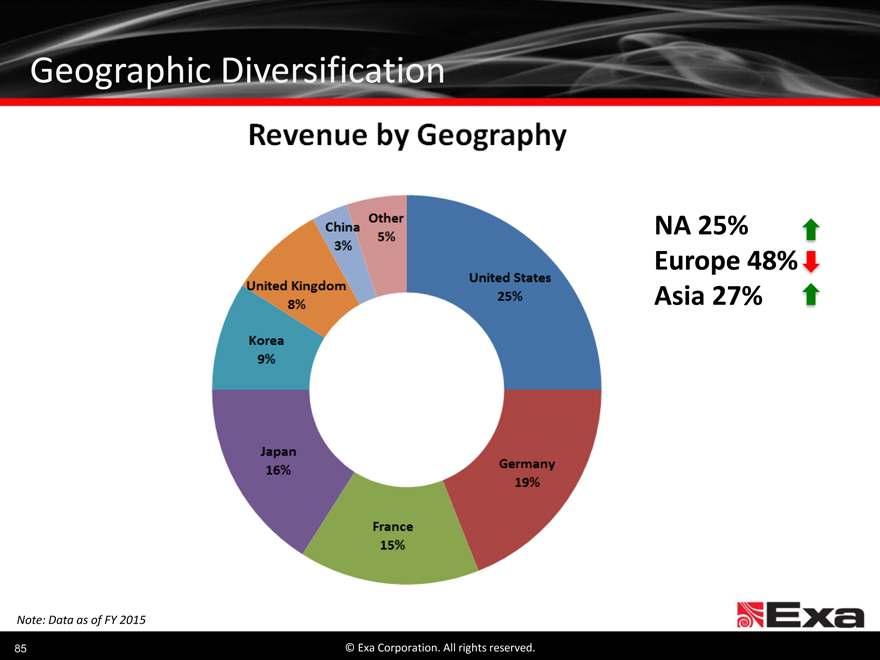
Geographic Diversification
NA 25%
Europe 48%
Asia 27%
Note: Data as of FY 2015
85 © Exa Corporation. All rights reserved.
|
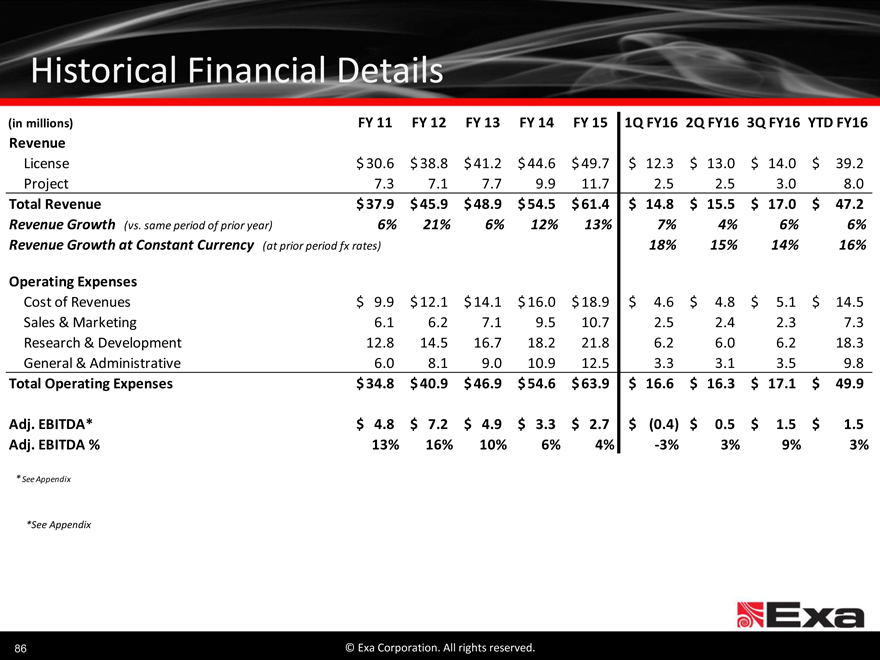
Historical Financial Details
(in millions) FY 11 FY 12 FY 13 FY 14 FY 15 1Q FY16 2Q FY16 3Q FY16 YTD FY16
Revenue
License $ 30.6 $ 38.8 $ 41.2 $ 44.6 $ 49.7 $ 12.3 $ 13.0 $ 14.0 $ 39.2
Project 7.3 7.1 7.7 9.9 11.7 2.5 2.5 3.0 8.0
Total Revenue $ 37.9 $ 45.9 $ 48.9 $ 54.5 $ 61.4 $ 14.8 $ 15.5 $ 17.0 $ 47.2
Revenue Growth (vs. same period of prior year) 6% 21% 6% 12% 13% 7% 4% 6% 6%
Revenue Growth at Constant Currency (at prior period fx rates) 18% 15% 14% 16%
Operating Expenses
Cost of Revenues $ 9.9 $ 12.1 $ 14.1 $ 16.0 $ 18.9 $ 4.6 $ 4.8 $ 5.1 $ 14.5
Sales & Marketing 6.1 6.2 7.1 9.5 10.7 2.5 2.4 2.3 7.3
Research & Development 12.8 14.5 16.7 18.2 21.8 6.2 6.0 6.2 18.3
General & Administrative 6.0 8.1 9.0 10.9 12.5 3.3 3.1 3.5 9.8
Total Operating Expenses $ 34.8 $ 40.9 $ 46.9 $ 54.6 $ 63.9 $ 16.6 $ 16.3 $ 17.1 $ 49.9
Adj. EBITDA* $ 4.8 $ 7.2 $ 4.9 $ 3.3 $ 2.7 $ (0.4) $ 0.5 $ 1.5 $ 1.5
Adj. EBITDA % 13% 16% 10% 6% 4% -3% 3% 9% 3%
* See Appendix
*See Appendix
86 © Exa Corporation. All rights reserved.
|
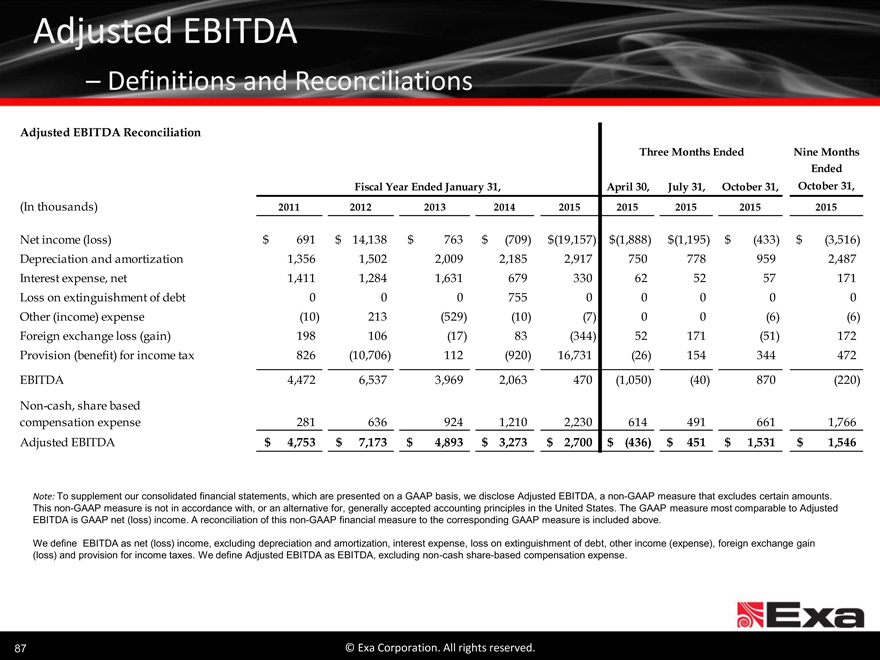
Adjusted EBITDA
Definitions and Reconciliations
Adjusted EBITDA Reconciliation
Three Months Ended Nine Months
Ended
Fiscal Year Ended January 31, April 30, July 31, October 31, October 31,
(In thousands) 2011 2012 2013 2014 2015 2015 2015 2015 2015
Net income (loss) $ 691 $ 14,138 $ 763 $ (709) $(19,157) $ (1,888) $(1,195) $ (433) $ (3,516)
Depreciation and amortization 1,356 1,502 2,009 2,185 2,917 750 778 959 2,487
Interest expense, net 1,411 1,284 1,631 679 330 62 52 57 171
Loss on extinguishment of debt 0 0 0 755 0 0 0 0 0
Other (income) expense (10) 213 (529) (10) (7) 0 0 (6) (6)
Foreign exchange loss (gain) 198 106 (17) 83 (344) 52 171 (51) 172
Provision (benefit) for income tax 826 (10,706) 112 (920) 16,731 (26) 154 344 472
EBITDA 4,472 6,537 3,969 2,063 470 (1,050) (40) 870 (220)
Non-cash, share based
compensation expense 281 636 924 1,210 2,230 614 491 661 1,766
Adjusted EBITDA $ 4,753 $ 7,173 $ 4,893 $ 3,273 $ 2,700 $ (436) $ 451 $ 1,531 $ 1,546
Note: To supplement our consolidated financial statements, which are presented on a GAAP basis, we disclose Adjusted EBITDA, a non-GAAP measure that excludes certain amounts. This non-GAAP measure is not in accordance with, or an alternative for, generally accepted accounting principles in the United States. The GAAP measure most comparable to Adjusted EBITDA is GAAP net (loss) income. A reconciliation of this non-GAAP financial measure to the corresponding GAAP measure is included above.
We define EBITDA as net (loss) income, excluding depreciation and amortization, interest expense, loss on extinguishment of debt, other income (expense), foreign exchange gain (loss) and provision for income taxes. We define Adjusted EBITDA as EBITDA, excluding non-cash share-based compensation expense.
87 © Exa Corporation. All rights reserved.