TAUBMAN CENTERS, INC.
CONTENTS
PART I |
| Item 1. | Business | 2 |
| Item 1A. | Risk Factors | 13 |
| Item 1B. | Unresolved Staff Comments | 13 |
| Item 2. | Properties | 13 |
| Item 3. | Legal Proceedings | 17 |
| Item 4. | Submission of Matters to a Vote of Security Holders | 17 |
PART II |
| Item 5. | Market for Registrant’s Common Equity, Related Stockholder Matters, and Issuer Purchases of Equity Securities | 17 |
| Item 6. | Selected Financial Data | 19 |
| Item 7. | Management’s Discussion and Analysis of Financial Condition and Results of Operations | 20 |
| Item 7A. | Quantitative and Qualitative Disclosure About Market Risk | 47 |
| Item 8. | Financial Statements and Supplementary Data | 47 |
| Item 9. | Changes in and Disagreements with Accountants on Accounting and Financial Disclosure | 47 |
| Item 9A. | Controls and Procedures | 47 |
| Item 9B. | Other Information | 47 |
PART III |
| Item 10. | Directors, Executive Officers, and Corporate Governance | 47 |
| Item 11. | Executive Compensation | 48 |
| Item 12. | Security Ownership of Certain Beneficial Owners and Management and Related Stockholder Matters | 48 |
| Item 13. | Certain Relationships and Related Transactions, and Director Independence | 48 |
| Item 14. | Principal Accountant Fees and Services | 48 |
| Item 15. | Exhibits and Financial Statement Schedules | 49 |
PART I
Item 1. BUSINESS.
The following discussion of our business contains various “forward-looking statements” within the meaning of Section 27A of the Securities Act of 1933, as amended, and Section 21E of the Securities Exchange Act of 1934, as amended. These forward-looking statements represent our expectations or beliefs concerning future events. We caution that although forward-looking statements reflect our good faith beliefs and best judgment based upon current information, these statements are qualified by important factors that could cause actual results to differ materially from those in the forward-looking statements, including those risks, uncertainties, and factors detailed from time to time in reports filed with the SEC, and in particular those set forth under the headings “General Risks of the Company” and “Environmental Matters” in this Annual Report on Form 10-K.
The Company
Taubman Centers, Inc. (“we”, “us”, “our”, or "TCO") was incorporated in Michigan in 1973 and we had our initial public offering ("IPO") in 1992. We own a 65% managing general partner’s interest in The Taubman Realty Group Limited Partnership (the "Operating Partnership" or "TRG"), through which we conduct all of our operations.
We are engaged in the ownership, development, acquisition, and operation of regional shopping centers. Our portfolio as of December 31, 2006 included 22 urban and suburban regional and super-regional shopping centers in 10 states. In addition, The Mall at Partridge Creek (Clinton Township, Michigan) is under construction and will open on October 18, 2007. The Operating Partnership also owns certain regional retail shopping center development projects and more than 99% of The Taubman Company LLC (the "Manager"), which manages the shopping centers and provides other services to the Operating Partnership and to us. See the table on page 14 of this report for information regarding the centers.
In April 2005, we formed Taubman Asia, which is the platform for our expansion into the Asia-Pacific region. Taubman Asia is headquartered in Hong Kong and is engaged in projects that leverage our strong retail planning, design, and operational capabilities. In 2007, Taubman Asia completed the development services agreement for our involvement in a 1.2 million square foot retail and entertainment complex in New Songdo City in South Korea. Additionally, we announced our involvement in the retail component of Macao Studio City on the Cotai strip in Macao (see Item 7, “Management’s Discussion and Analysis of Financial Condition and Results of Operations (MD&A) - Subsequent Events”).
We are a real estate investment trust, or REIT, under the Internal Revenue Code of 1986, as amended (the "Code"). In order to satisfy the provisions of the Code applicable to REITs, we must distribute to our shareholders at least 90% of our REIT taxable income prior to net capital gains and meet certain other requirements. The Operating Partnership's partnership agreement provides that the Operating Partnership will distribute, at a minimum, sufficient amounts to its partners such that our pro rata share will enable us to pay shareholder dividends (including capital gains dividends that may be required upon the Operating Partnership's sale of an asset) that will satisfy the REIT provisions of the Code.
Recent Developments
For a discussion of business developments that occurred in 2006, see Item 7, "Management's Discussion and Analysis of Financial Condition and Results of Operations."
The Shopping Center Business
There are several types of retail shopping centers, varying primarily by size and marketing strategy. Retail shopping centers range from neighborhood centers of less than 100,000 square feet of GLA to regional and super-regional shopping centers. Retail shopping centers in excess of 400,000 square feet of GLA are generally referred to as "regional" shopping centers, while those centers having in excess of 800,000 square feet of GLA are generally referred to as "super-regional" shopping centers. Nineteen of our centers are "super-regional" centers. In this annual report on Form 10-K, the term "regional shopping centers" refers to both regional and super-regional shopping centers. The term "GLA" refers to gross retail space, including anchors and mall tenant areas, and the term "Mall GLA" refers to gross retail space, excluding anchors. The term "anchor" refers to a department store or other large retail store. The term "mall tenants" refers to stores (other than anchors) that lease space in shopping centers.
Business of the Company
We, as managing general partner of the Operating Partnership, are engaged in the ownership, management, leasing, acquisition, development, and expansion of regional shopping centers.
The centers:
| · | are strategically located in major metropolitan areas, many in communities that are among the most affluent in the country, including Atlantic City, Charlotte, Dallas, Denver, Detroit, Los Angeles, Miami, New York City, Orlando, Phoenix, San Francisco, Tampa, and Washington, D.C.; |
| · | range in size between 242,000 and 1.6 million square feet of GLA and between 197,000 and 624,000 square feet of Mall GLA. The smallest center has approximately 60 stores, and the largest has over 200 stores. Of the 22 centers, 19 are super-regional shopping centers; |
| · | have approximately 3,000 stores operated by their mall tenants under approximately 1,000 trade names; |
| · | have 64 anchors, operating under 15 trade names; |
| · | lease most of Mall GLA to national chains, including subsidiaries or divisions of The Limited (The Limited, Express, Victoria's Secret, and others), Gap (Gap, Gap Kids, Banana Republic, Old Navy, and others), and Foot Locker, Inc. (Foot Locker, Lady Foot Locker, Champs Sports, and others); and |
| · | are among the most productive (measured by mall tenants' average sales per square foot) in the United States. In 2006, mall tenants had average sales per square foot of $539, which is significantly greater than the average for all regional shopping centers owned by public companies. |
The most important factor affecting the revenues generated by the centers is leasing to mall tenants (including temporary tenants and specialty retailers), which represents approximately 90% of revenues. Anchors account for less than 10% of revenues because many own their stores and, in general, those that lease their stores do so at rates substantially lower than those in effect for mall tenants.
Our portfolio is concentrated in highly productive super-regional shopping centers. Of our 22 centers, 20 had annual rent rolls at December 31, 2006 of over $10 million. We believe that this level of productivity is indicative of the centers' strong competitive position and is, in significant part, attributable to our business strategy and philosophy. We believe that large shopping centers (including regional and especially super-regional shopping centers) are the least susceptible to direct competition because (among other reasons) anchors and large specialty retail stores do not find it economically attractive to open additional stores in the immediate vicinity of an existing location for fear of competing with themselves. In addition to the advantage of size, we believe that the centers' success can be attributed in part to their other physical characteristics, such as design, layout, and amenities.
Business Strategy And Philosophy
We believe that the regional shopping center business is not simply a real estate development business, but rather an operating business in which a retailing approach to the on-going management and leasing of the centers is essential. Thus we:
| · | offer a large, diverse selection of retail stores in each center to give customers a broad selection of consumer goods and variety of price ranges; |
| · | endeavor to increase overall mall tenants' sales by leasing space to a constantly changing mix of tenants, thereby increasing achievable rents; |
| · | seek to anticipate trends in the retailing industry and emphasize ongoing introductions of new retail concepts into our centers. Due in part to this strategy, a number of successful retail trade names have opened their first mall stores in the centers. In addition, we have brought to the centers "new to the market" retailers. We believe that the execution of this leasing strategy has been unique in the industry and is an important element in building and maintaining customer loyalty and increasing mall productivity; and |
| · | provide innovative initiatives that utilize technology and the Internet to heighten the shopping experience, build customer loyalty and increase tenant sales. Our Taubman Center website program connects shoppers and retailers through an interactive content-driven website. We also offer our shoppers a robust direct email program, which allows them to receive, each week, information featuring what’s on sale and what’s new at the stores they select. |
The centers compete for retail consumer spending through diverse, in-depth presentations of predominantly fashion merchandise in an environment intended to facilitate customer shopping. While some centers include stores that target high-end, upscale customers, each center is individually merchandised in light of the demographics of its potential customers within convenient driving distance.
Our leasing strategy involves assembling a diverse mix of mall tenants in each of the centers in order to attract customers, thereby generating higher sales by mall tenants. High sales by mall tenants make the centers attractive to prospective tenants, thereby increasing the rental rates that prospective tenants are willing to pay. We implement an active leasing strategy to increase the centers' productivity and to set minimum rents at higher levels. Elements of this strategy include terminating leases of under-performing tenants, renegotiating existing leases, and not leasing space to prospective tenants that (though viable or attractive in certain ways) would not enhance a center's retail mix.
In 2005, we began a new leasing strategy which offers our tenants the option to pay a fixed charge or pay their share of common area maintenance (CAM) costs. This strategy has been positive for tenant relations, as it has allowed the retailer to decide whether fixed CAM or traditional net CAM works best for them. Our research suggests this approach is unique in the industry; the retailer can choose greater predictability for a modest premium in the fixed CAM option. From a financial perspective, our analysis shows the premium will balance our additional risk. As tenants sign up for the fixed CAM option, over time there will be significantly less matching of CAM income with CAM expenditures, which can vary considerably from period to period.
Potential For Growth
Our principal objective is to enhance shareholder value. We seek to maximize the financial results of our core assets, while also pursuing a growth strategy that primarily includes an active new center development program.
Internal Growth
We expect that the majority of our future growth will come from our existing core portfolio and business. We’ve always had a culture of intensively managing our assets and maximizing the rents from tenants, and we’re committed to continue such efforts to drive even better performance.
Our core business strategy is to maintain a portfolio of properties that deliver above-market profitable growth by providing targeted retailers with the best opportunity to do business in each market and targeted shoppers with the best local shopping experience for their needs.
Development of New Centers
We are pursuing an active program of regional shopping center development. We believe that we have the expertise to develop economically attractive regional shopping centers through intensive analysis of local retail opportunities. We believe that the development of new centers is an important use of our capital and an area in which we excel. At any time, we have numerous potential development projects in various stages.
The Mall at Partridge Creek (Partridge Creek), a 640,000 square foot center, is under construction in Clinton Township, Michigan. The center will be anchored by Nordstrom, Parisian, and MJR Theatres, and is scheduled to open on October 18, 2007, with Nordstrom opening in spring 2008.
The Pier Shops at Caesars (The Pier), located in Atlantic City, New Jersey, began opening in phases in June 2006. Gordon Group Holdings LLC (Gordon), developed the center, and in January 2007, we assumed full management and leasing of the center. In addition, we are in final negotiations to increase our ownership of The Pier from 30% to 50%. We expect to complete this transaction and close on a refinancing of the property in the first quarter of 2007.
We are negotiating agreements regarding City Creek Center, a mixed-use project in Salt Lake City, Utah. Demolition of the existing structures began in November 2006. The retail component of the project is expected to open in fall 2011 and will include approximately 300,000 square feet of tenant GLA and Macy’s, Nordstrom, and Dillard’s as anchors. Refer to “Management’s Discussion and Analysis of Financial Condition and Results of Operations - Liquidity and Capital Resources - Planned Capital Spending” regarding the status of this project.
In October 2006, we announced that we are seeking a final decision in the Supreme Court of the State of New York (Suffolk County) on our land use plan for our Oyster Bay project in Syosset, Long Island, New York. Refer to “Management’s Discussion and Analysis of Financial Condition and Results of Operations - Liquidity and Capital Resources - Planned Capital Spending” regarding the status of this project.
In April 2005, we formed Taubman Asia, which is the platform for our expansion into the Asia-Pacific region. Taubman Asia is headquartered in Hong Kong and is engaged in projects that leverage our strong retail planning, design and operational capabilities. In January 2007, we completed the development services agreement for a 1.2 million square foot retail and entertainment complex in New Songdo City, Incheon, South Korea. The shopping complex is scheduled to open in early 2010, with construction beginning in 2007. We have negotiated the opportunity to invest in a portion of the broader project, which will include not only retail, but also office, hotel, and residential uses. We anticipate finalizing our decision on this investment in 2007. Also in January 2007, Taubman Asia announced our involvement in the retail component of Macao Studio City on the Cotai Strip in Macao.
Our policies with respect to development activities are designed to reduce the risks associated with development. We generally do not intend to acquire land early in the development process. Instead, we generally acquire options on land or form partnerships with landholders holding potentially attractive development sites. We typically exercise the options only once we are prepared to begin construction. The pre-construction phase for a regional center typically extends over several years and the time to obtain anchor commitments, zoning and regulatory approvals, and public financing arrangements can vary significantly from project to project. In addition, we do not intend to begin construction until a sufficient number of anchor stores have agreed to operate in the shopping center, such that we are confident that the projected sales and rents from Mall GLA are sufficient to earn a return on invested capital in excess of our cost of capital. Having historically followed these principles, our experience indicates that, on average, less than 10% of the costs of the development of a regional shopping center will be incurred prior to the construction period. However, no assurance can be given that we will continue to be able to so limit pre-construction costs. Unexpected costs due to extended zoning and regulatory processes may cause our investment in a project to exceed this historic experience.
While we will continue to evaluate development projects using criteria, including financial criteria for rates of return, similar to those employed in the past, no assurances can be given that the adherence to these policies will produce comparable results in the future. In addition, the costs of shopping center development opportunities that are explored but ultimately abandoned will, to some extent, diminish the overall return on development projects. (See "Management's Discussion and Analysis of Financial Condition and Results of Operations - Liquidity and Capital Resources - Capital Spending" for further discussion of our development activities).
Strategic Acquisitions
Our objective is to acquire existing centers only when they are compatible with the quality of our portfolio (or can be redeveloped to that level) and if they satisfy our strategic plans and pricing requirements. We also may acquire additional interests in centers currently in our portfolio.
Expansions of the Centers
Another potential element of growth is the strategic expansion of existing properties to update and enhance their market positions, by replacing or adding new anchor stores or increasing mall tenant space. Most of the centers have been designed to accommodate expansions. Expansion projects can be as significant as new shopping center construction in terms of scope and cost, requiring governmental and existing anchor store approvals, design and engineering activities, including rerouting utilities, providing additional parking areas or decking, acquiring additional land, and relocating anchors and mall tenants (all of which must take place with a minimum of disruption to existing tenants and customers).
Construction has been completed on an expansion and renovation of tenant space at Waterside Shops at Pelican Bay (Waterside). In addition, Nordstrom will join the center as an anchor in fall 2008 and an expansion of the current anchor, Saks Fifth Avenue, will be completed in late 2007 with a full renovation of the store expected to be completed by summer 2008.
At Twelve Oaks Mall (Twelve Oaks), construction is underway on an addition of a 165,000 square foot Nordstrom. In addition, the project includes a 60,000 square foot expansion and renovation of Macy’s (previously Marshall Fields), and approximately 97,000 square feet of additional new store space. A grand opening is planned for September 28, 2007.
Construction is underway on a lifestyle component addition at Stamford Town Center, which is expected to open in November 2007. The project is 100% leased and will consist of a mix of signature retail and restaurant offerings.
The following table includes information regarding recent development, acquisition, and expansion and renovation activities that have been completed:
Developments:
Completion Date | Center | Location |
June 2006 (1) | The Pier Shops at Caesars | Atlantic City, New Jersey |
| September 2005 | Northlake Mall | Charlotte, North Carolina |
Acquisitions:
Completion Date | Center | Location |
| October 2006 | Land under Sunvalley | Concord, California |
| July 2004 | International Plaza | Tampa, Florida |
| | additional interest (2) | |
| January 2004 | Beverly Center | Los Angeles, California |
| | additional interest (3) | |
Expansions and Renovations:
Completion Date | Center | Location |
| September 2006 | Waterside Shops at Pelican Bay | Naples, Florida |
| (1) | Began opening in phases. |
| (2) | In July 2004, an additional 23.6% interest in the center was acquired. |
| (3) | In January 2004, the joint venture partner’s 30% interest in the center was acquired. |
Rental Rates
As leases have expired in the centers, we have generally been able to rent the available space, either to the existing tenant or a new tenant, at rental rates that are higher than those of the expired leases. In periods of increasing sales, such as those we are currently experiencing, rents on new leases will tend to rise as tenants' expectations of future growth become more optimistic. In periods of slower growth or declining sales, rents on new leases will grow more slowly or will decline for the opposite reason. However, center revenues nevertheless increase as older leases roll over or are terminated early and replaced with new leases negotiated at current rental rates that are usually higher than the average rates for existing leases.
The following tables contain certain information regarding per square foot minimum rent in our consolidated businesses and unconsolidated joint ventures at the comparable centers (centers that had been owned and open for the current and preceding year):
| | | | 2006 | | | 2005 | | | 2004 | | | 2003 | | | 2002 | |
| Average rent per square foot: | | | | | | | | | | | | | | | | |
| Consolidated Businesses | | $ | 43.20 | | $ | 41.41 | | $ | 40.98 | | $ | 40.06 | | $ | 42.31 | |
| Unconsolidated Joint Ventures | | | 41.03 | | | 42.28 | | | 42.09 | | | 42.75 | | | 42.03 | |
| Opening base rent per square foot: | | | | | | | | | | | | | | | | |
| Consolidated Businesses | | $ | 42.24 | | $ | 42.38 | | $ | 44.35 | | $ | 43.41 | | $ | 45.91 | |
| Unconsolidated Joint Ventures | | | 42.98 | | | 44.90 | | | 44.67 | | | 40.06 | | | 43.03 | |
| Square feet of GLA opened: | | | | | | | | | | | | | | | | |
| Consolidated Businesses | | | 941,163 | | | 682,305 | | | 688,020 | | | 512,105 | | | 429,705 | |
| Unconsolidated Joint Ventures | | | 306,461 | | | 400,477 | | | 337,679 | | | 498,950 | | | 344,311 | |
| Closing base rent per square foot: | | | | | | | | | | | | | | | | |
| Consolidated Businesses | | $ | 39.73 | | $ | 40.59 | | $ | 44.54 | | $ | 40.80 | | $ | 43.47 | |
| Unconsolidated Joint Ventures | | | 42.49 | | | 44.26 | | | 51.40 | | | 41.28 | | | 41.63 | |
| Square feet of GLA closed: | | | | | | | | | | | | | | | | |
| Consolidated Businesses | | | 894,770 | | | 650,701 | | | 499,098 | | | 628,626 | | | 299,234 | |
| Unconsolidated Joint Ventures | | | 246,704 | | | 366,932 | | | 280,393 | | | 470,143 | | | 362,747 | |
| Releasing spread per square foot: | | | | | | | | | | | | | | | | |
| Consolidated Businesses | | $ | 2.51 | | $ | 1.79 | | $ | (0.19 | ) | $ | 2.61 | | $ | 2.44 | |
| Unconsolidated Joint Ventures | | | 0.49 | | | 0.64 | | | (6.73 | ) | | (1.22 | ) | | 1.40 | |
The spread between opening and closing rents may not be indicative of future periods, as this statistic is not computed on comparable tenant spaces, and can vary significantly from period to period depending on the total amount, location, and average size of tenant space opening and closing in the period.
Lease Expirations
The following table shows scheduled lease expirations based on information available as of December 31, 2006 for the next ten years for all owned centers in operation at that date, excluding Arizona Mills and The Pier:
Lease Expiration Year | Number of Leases Expiring | Leased Area in Square Footage | Annualized Base Rent Under Expiring Leases (in thousands of dollars) | Annualized Base Rent Under Expiring Leases Per Square Foot | Percent of Total Leased Square Footage Represented by Expiring Leases |
2007 (1) | 140 | 414,098 | 16,487 | $39.81 | 4.1% |
| 2008 | 258 | 729,423 | 30,372 | 41.64 | 7.3 |
| 2009 | 296 | 759,318 | 32,170 | 42.37 | 7.6 |
| 2010 | 224 | 590,268 | 27,847 | 47.18 | 5.9 |
| 2011 | 434 | 1,333,204 | 54,253 | 40.69 | 13.3 |
| 2012 | 299 | 1,064,200 | 48,056 | 45.16 | 10.6 |
| 2013 | 256 | 983,699 | 41,179 | 41.86 | 9.8 |
| 2014 | 197 | 721,516 | 27,776 | 38.50 | 7.2 |
| 2015 | 237 | 934,797 | 34,725 | 37.15 | 9.3 |
| 2016 | 243 | 919,426 | 36,662 | 39.87 | 9.2 |
| (1) | Excludes leases that expire in 2007 for which renewal leases or leases with replacement tenants have been executed as of December 31, 2006. |
We believe that the information in the table is not necessarily indicative of what will occur in the future because of several factors, but principally because of early lease terminations at the centers. For example, the average remaining term of the leases that were terminated during the period 2001 to 2006 was approximately two years. The average term of leases signed during 2006 and 2005 was approximately seven years.
In addition, mall tenants at the centers may seek the protection of the bankruptcy laws, which could result in the termination of such tenants' leases and thus cause a reduction in cash flow. In 2006, 1.0% of leases were affected compared to 0.4% in 2005. This statistic has ranged from 0.4% to 4.5% since we went public in 1992. Since 1991, the annual provision for losses on accounts receivable has been less than 2% of annual revenues.
Occupancy
Occupancy statistics include centers owned and open in the full periods presented, and value center anchors. The statistics for comparable centers exclude Northlake Mall (Northlake), which opened in 2005. The statistics for comparable centers also exclude Waterside due to the recent renovation and expansion, and Woodland, which was sold in the fourth quarter of 2005. All statistics exclude The Pier, which opened in 2006.
| | 2006 | 2005 | 2004 |
All Centers: | | | |
| Leased space | 92.5% | 91.7% | 90.7% |
| Ending occupancy | 91.3 | 90.0 | 89.6 |
| Average occupancy | 89.2 | 88.9 | 87.4 |
| | | | |
Comparable Centers: | | | |
| Leased space | 92.3% | 91.5% | 90.7% |
| Ending occupancy | 91.2 | 90.2 | 89.6 |
| Average occupancy | 89.1 | 89.1 | 87.4 |
Major Tenants
No single retail company represents 10% or more of our revenues. The combined operations of The Limited, Inc. accounted for approximately 4.7% of Mall GLA as of December 31, 2006 and 4.3% of 2006 minimum rent. No other single retail company accounted for more than 4% of Mall GLA or 3% of 2006 minimum rent.
The following table shows the ten largest tenants and their square footage as of December 31, 2006:
Tenant | # of Stores | Square Footage | % of Mall GLA |
| Limited (The Limited, Express, Victoria's Secret, and others) | 64 | 476,358 | 4.7% |
| Gap (Gap, Gap Kids, Banana Republic, Old Navy, and others) | 41 | 338,560 | 3.3 |
| Forever 21 (Forever 21, XXI Forever, and others) | 19 | 255,803 | 2.5 |
| Abercrombie & Fitch (Abercrombie & Fitch, Hollister, and others) | 34 | 250,475 | 2.5 |
| Foot Locker (Foot Locker, Lady Foot Locker, Champs Sports, and others) | 43 | 221,250 | 2.2 |
| Williams-Sonoma (Williams-Sonoma, Pottery Barn, Pottery Barn Kids) | 28 | 215,629 | 2.1 |
| Talbots (Talbots, J. Jill) | 32 | 185,587 | 1.8 |
| Ann Taylor | 31 | 180,307 | 1.8 |
| The TJX Companies (Marshalls, T.J. Maxx) | 4 | 151,313 | 1.5 |
| Luxottica (Lenscrafters, Sunglass Hut International, Things Remembered, and others) | 62 | 118,074 | 1.2 |
General Risks of the Company
The Economic Performance and Value of our Shopping Centers are Dependent on Many Factors
The economic performance and value of our shopping centers are dependent on various factors. Additionally, these same factors will influence our decision whether to go forward on the development of new centers and may affect the ultimate economic performance and value of projects under construction. Adverse changes in the economic performance and value of our shopping centers would adversely affect our income and cash available to pay dividends.
Such factors include:
| · | changes in the national, regional, and/or local economic and geopolitical climates; |
| · | increases in operating costs; |
| · | the public perception of the safety of customers at our shopping centers; |
| · | availability and cost of financing; |
| · | changes in government regulations; and |
| · | changes in real estate zoning and tax laws. |
In addition, the value and performance of our shopping centers may be adversely affected by certain other factors discussed below including competition, uninsured losses, and environmental liabilities.
We are in a competitive business.
There are numerous shopping facilities that compete with our properties in attracting retailers to lease space. In addition, retailers at our properties face continued competition from discount shopping centers, lifestyle centers, outlet malls, wholesale and discount shopping clubs, direct mail, telemarketing, television shopping networks and shopping via the Internet. Competition of this type could adversely affect our revenues and cash available for distribution to stockholders.
We compete with other major real estate investors with significant capital for attractive investment opportunities. These competitors include other REITs, investment banking firms and private institutional investors. This competition has increased prices for commercial properties and may impair our ability to make suitable property acquisitions on favorable terms in the future.
Some of our potential losses may not be covered by insurance.
We carry standard liability, fire, flood, earthquake, extended coverage and rental loss insurance on each of our properties. We believe the policy specifications and insured limits of these policies are adequate and appropriate. There are, however, some types of losses, including lease and other contract claims, that generally are not insured. If an uninsured loss or a loss in excess of insured limits occurs, we could lose all or a portion of the capital we have invested in a property, as well as the anticipated future revenue from the property. If this happens, we might nevertheless remain obligated for any mortgage debt or other financial obligations related to the property.
In November 2002, Congress passed the “Terrorism Risk Insurance Act of 2002” (TRIA), which required insurance companies to offer terrorism coverage to all existing insured companies for an additional cost. As a result, our standard property insurance policies are currently provided without a sub-limit for terrorism, eliminating the need for separate terrorism insurance policies.
In 2005, Congress extended the expiration date of TRIA to December 31, 2007. While Congress may further extend or replace TRIA , the possibility exists that TRIA may be allowed to expire at the end of 2007. There are specific provisions in our loans that address terrorism insurance. Simply stated, in most loans, we are obligated to obtain terrorism insurance, but there are limits on the amounts we could be required to spend to obtain such coverage. If Congress fails to further extend or replace TRIA or if another terrorist event occurs, we would likely pay higher amounts for terrorism insurance coverage and/or obtain less coverage than we have currently. Our inability to obtain such coverage or to do so only at greatly increased costs may also negatively impact the availability and cost of future financings.
We may be subject to liabilities for environmental matters.
All of the centers presently owned by us (not including option interests in certain pre-development projects ) have been subject to environmental assessments. No assurances can be given, however, that all environmental liabilities have been identified or that no prior owner, operator, or current occupant has created an environmental condition not known to us. Moreover, no assurances can be given that future laws, ordinances or regulations will not impose any material environmental liability or that the current environmental condition of the centers will not be affected by tenants and occupants of the centers, by the condition of properties in the vicinity of the centers (such as the presence of underground storage tanks) or by third parties unrelated to us.
We hold investments in joint ventures in which we do not control all decisions, and we may have conflicts of interest with our joint venture partners.
Some of our shopping centers are partially owned by non-affiliated partners through joint venture arrangements. As a result, we do not control all decisions regarding those shopping centers and may be required to take actions that are in the interest of the joint venture partners but not our best interests. Accordingly, we may not be able to favorably resolve any issues which arise with respect to such decisions, or we may have to provide financial or other inducements to our joint venture partners to obtain such resolution.
For joint ventures that we do not manage, we do not control decisions as to the design or operation of internal controls over accounting and financial reporting, including those relating to maintenance of accounting records, authorization of receipts and disbursements, selection and application of accounting policies, reviews of period-end financial reporting, and safeguarding of assets. Therefore, we are exposed to risk that such controls may not be designed or operating effectively, which could ultimately affect the accuracy of financial information related to these joint ventures as prepared by our joint venture partners.
Various restrictive provisions and rights govern sales or transfers of interests in our joint ventures. These may work to our disadvantage because, among other things, we may be required to make decisions as to the purchase or sale of interests in our joint ventures at a time that is disadvantageous to us.
The bankruptcy of our tenants, anchors or joint venture partners could adversely affect us.
We could be adversely affected by the bankruptcy of third parties. The bankruptcy of a mall tenant could result in the termination of its lease, which would lower the amount of cash generated by that mall. In addition, if a department store operating as an anchor at one of our shopping centers were to go into bankruptcy and cease operating, we may experience difficulty and delay in replacing the anchor. In addition, the anchor’s closing may lead to reduced customer traffic and lower mall tenant sales. As a result, we may also experience difficulty or delay in leasing spaces in areas adjacent to the vacant anchor space. The profitability of shopping centers held in a joint venture could also be adversely affected by the bankruptcy of one of the joint venture partners if, because of certain provisions of the bankruptcy laws, we were unable to make important decisions in a timely fashion or became subject to additional liabilities.
Our investments are subject to credit and market risk.
We occasionally extend credit to third parties in connection with the sale of land or other transactions. We have occasionally made investments in marketable and other equity securities. We are exposed to risk in the event the values of our investments and/ or our loans decrease due to overall market conditions, business failure, and/ or other nonperformance by the investees or counterparties.
Our real estate investments are relatively illiquid.
We may be limited in our ability to vary our portfolio in response to changes in economic or other conditions by restrictions on transfer imposed by our partners or lenders. In addition, under TRG’s partnership agreement, upon the sale of a center or TRG’s interest in a center, TRG may be required to distribute to its partners all of the cash proceeds received by TRG from such sale. If TRG made such a distribution, the sale proceeds would not be available to finance TRG’s activities, and the sale of a center may result in a decrease in funds generated by continuing operations and in distributions to TRG’s partners, including us.
We may acquire or develop new properties, and these activities are subject to various risks.
We actively pursue development and acquisition activities as opportunities arise, and these activities are subject to the following risks:
| · | the pre-construction phase for a regional center typically extends over several years, and the time to obtain anchor commitments, zoning and regulatory approvals, and public financing can vary significantly from project to project; |
| · | we may not be able to obtain the necessary zoning or other governmental approvals for a project, or we may determine that the expected return on a project is not sufficient; if we abandon our development activities with respect to a particular project, we may incur a loss on our investment; |
| · | construction and other project costs may exceed our original estimates because of increases in material and labor costs, delays and costs to obtain anchor and tenant commitments; |
| · | we may not be able to obtain financing or to refinance construction loans, which are generally recourse to TRG; and |
| · | occupancy rates and rents at a completed project may not meet our projections, and the costs of development activities that we explore but ultimately abandon will, to some extent, diminish the overall return on our completed development projects. |
We are engaged in development and service activities and are evaluating investments in international markets, and these activities are subject to risks that may reduce our financial return. In addition to the general risks related to development and acquisition activities described in the preceding section, our international activities are subject to unique risks, including:
| · | adverse effects of changes in exchange rates for foreign currencies; |
| · | changes in foreign political environments; |
| · | difficulties of complying with a wide variety of foreign laws including corporate governance, operations, taxes, and litigation; |
| · | changes in and/or difficulties in complying with applicable laws and regulations in the United States that affect foreign operations, including the Foreign Corrupt Practices Act; |
| · | difficulties in managing international operations, including difficulties that arise from ambiguities in contracts written in foreign languages; and |
| · | obstacles to the repatriation of earnings and cash. |
Although our international activities are currently limited in their scope, to the extent that we expand them, these risks could increase in significance and adversely affect our financial returns on international projects and services and overall financial condition. We have put in place policies, practices, and systems for mitigating these international risks, although we cannot provide assurance that we will be entirely successful in doing so.
We may not be able to maintain our status as a REIT.
We may not be able to maintain our status as a REIT for federal income tax purposes with the result that the income distributed to shareholders will not be deductible in computing taxable income and instead would be subject to tax at regular corporate rates. We may also be subject to the alternative minimum tax if we fail to maintain our status as a REIT. Any such corporate tax liability would be substantial and would reduce the amount of cash available for distribution to our shareholders which, in turn, could have a material adverse impact on the value of, or trading price for, our shares. Although we believe we are organized and operate in a manner to maintain our REIT qualification, many of the REIT requirements of the Internal Revenue Code of 1986, as amended, or the Code, are very complex and have limited judicial or administrative interpretations. Changes in tax laws or regulations or new administrative interpretations and court decisions may also affect our ability to maintain REIT status in the future. If we do not maintain our REIT status in any year, we may be unable to elect to be treated as a REIT for the next four taxable years.
Although we currently intend to maintain our status as a REIT, future economic, market, legal, tax, or other considerations may cause us to determine that it would be in our and our shareholders’ best interests to revoke our REIT election. If we revoke our REIT election, we will not be able to elect REIT status for the next four taxable years.
We may be subject to taxes even if we qualify as a REIT.
Even if we qualify as a REIT for federal income tax purposes, we will be required to pay certain federal, state and local taxes on our income and property. For example, we will be subject to income tax to the extent we distribute less than 100% of our REIT taxable income, including capital gains. Moreover, if we have net income from “prohibited transactions,” that income will be subject to a 100% penalty tax. In general, prohibited transactions are sales or other dispositions of property held primarily for sale to customers in the ordinary course of business. The determination as to whether a particular sale is a prohibited transaction depends on the facts and circumstances related to that sale. We cannot guarantee that sales of our properties would not be prohibited transactions unless we comply with certain statutory safe-harbor provisions. The need to avoid prohibited transactions could cause us to forego or defer sales of facilities that non-REITs otherwise would have sold or that might otherwise be in our best interest to sell.
In addition, any net taxable income earned directly by our taxable REIT subsidiaries will be subject to federal and state corporate income tax. In this regard, several provisions of the laws applicable to REITs and their subsidiaries ensure that a taxable REIT subsidiary will be subject to an appropriate level of federal income taxation. For example, a taxable REIT subsidiary is limited in its ability to deduct certain interest payments made to an affiliated REIT. In addition, the REIT has to pay a 100% penalty tax on some payments that it receives or on some deductions taken by the taxable REIT subsidiaries if the economic arrangements between the REIT, the REIT’s tenants, and the taxable REIT subsidiary are not comparable to similar arrangements between unrelated parties. Finally, some state and local jurisdictions may tax some of our income even though as a REIT we are not subject to federal income tax on that income, because not all states and localities follow the federal income tax treatment of REITs. To the extent that we and our affiliates are required to pay federal, state and local taxes, we will have less cash available for distributions to our shareholders.
The lower tax rate on certain dividends from non-REIT “C” corporations may cause investors to prefer to hold stock in non-REIT “C” corporations.
Whereas corporate dividends have traditionally been taxed at ordinary income rates, the maximum tax rate on certain corporate dividends received by individuals through December 31, 2008, has been reduced from 35% to 15%. This change has reduced substantially the so-called “double taxation” (that is, taxation at both the corporate and shareholder levels) that had generally applied to non-REIT “C” corporations but did not apply to REITs. Generally, dividends from REITs do not qualify for the dividend tax reduction because REITs generally do not pay corporate-level tax on income that they distribute currently to shareholders. REIT dividends are only eligible for the lower capital gains rates in limited circumstances in which the dividends are attributable to income, such as dividends from a taxable REIT subsidiary, that has been subject to corporate-level tax. The application of capital gains rates to non-REIT “C” corporation dividends could cause individual investors to view stock in non-REIT “C” corporations as more attractive than shares in REITs, which may negatively affect the value of our shares.
Our ownership limitations and other provisions of our articles of incorporation and bylaws may hinder any attempt to acquire us.
The general limitations on ownership of our capital stock and other provisions of our articles of incorporation and bylaws could have the effect of discouraging offers to acquire us and of inhibiting a change in control, which could adversely affect our shareholders’ ability to receive a premium for their shares in connection with such a transaction.
Members of the Taubman family have the power to vote a significant number of the shares of our capital stock entitled to vote.
Based on information contained in filings made with the SEC, as of December 31, 2006, A. Alfred Taubman and the members of his family have the power to vote approximately 31% of the outstanding shares of our common stock and our Series B preferred stock, considered together as a single class, and approximately 86% of our outstanding Series B preferred stock. Our shares of common stock and our Series B preferred stock vote together as a single class on all matters generally submitted to a vote of our shareholders, and the holders of the Series B preferred stock have certain rights to nominate up to four individuals for election to our board of directors and other class voting rights. Mr. Taubman’s sons, Robert S. Taubman and William S. Taubman, serve as our Chairman of the Board, President and Chief Executive Officer, and our Chief Operating Officer, respectively. These individuals occupy the same positions with The Taubman Company, LLC, which manages all of our properties. As a result, Mr. A. Alfred Taubman and the members of his family may exercise significant influence with respect to the election of our board of directors, the outcome of any corporate transaction or other matter submitted to our shareholders for approval, including any merger, consolidation or sale of all or substantially all of our assets. In addition, because our articles of incorporation impose a limitation on the ownership of our outstanding capital stock by any person and such ownership limitation may not be changed without the affirmative vote of holders owning not less than two-thirds of the outstanding shares of capital stock entitled to vote on such matter, Mr. A. Alfred Taubman and the members of his family have the power to prevent a change in control of our company.
Our ability to pay dividends on our stock may be limited.
Because we conduct all of our operations through TRG, our ability to pay dividends on our stock will depend almost entirely on payments and dividends received on our interests in TRG. Additionally, the terms of some of the debt to which TRG is a party limits its ability to make some types of payments and other dividends to us. This in turn limits our ability to make some types of payments, including payment of dividends on our stock, unless we meet certain financial tests or such payments or dividends are required to maintain our qualification as a REIT. As a result, if we are unable to meet the applicable financial tests, we may not be able to pay dividends on our stock in one or more periods.
Our ability to pay dividends is further limited by the requirements of Michigan law.
Our ability to pay dividends on our stock is further limited by the laws of Michigan. Under the Michigan Business Corporation Act, a Michigan corporation may not make a distribution if, after giving effect to the distribution, the corporation would not be able to pay its debts as the debts become due in the usual course of business, or the corporation’s total assets would be less than the sum of its total liabilities plus the amount that would be needed, if the corporation were dissolved at the time of the distribution, to satisfy the preferential rights upon dissolution of shareholders whose preferential rights are superior to those receiving the distribution. Accordingly, we may not make a distribution on our stock if, after giving effect to the distribution, we would not be able to pay our debts as they become due in the usual course of business or our total assets would be less than the sum of our total liabilities plus the amount that would be needed to satisfy the preferential rights upon dissolution of the holders of any shares of our preferred stock then outstanding.
We may incur additional indebtedness, which may harm our financial position and cash flow and potentially impact our ability to pay dividends on our stock.
Our governing documents do not limit us from incurring additional indebtedness and other liabilities. As of December 31, 2006, we had approximately $2.3 billion of consolidated indebtedness outstanding, and our beneficial interest in both our consolidated debt and the debt of our unconsolidated joint ventures was $2.6 billion. We may incur additional indebtedness and become more highly leveraged, which could harm our financial position and potentially limit our cash available to pay dividends.
We cannot assure you that we will be able to pay dividends regularly although we have done so in the past.
Our ability to pay dividends in the future is dependent on our ability to operate profitably and to generate cash from our operations. Although we have done so in the past, we cannot guarantee that we will be able to pay dividends on a regular quarterly basis in the future. Furthermore, any new shares of common stock issued will increase the cash required to continue to pay cash dividends at current levels. Any common stock or preferred stock that may in the future be issued to finance acquisitions, upon exercise of stock options or otherwise, would have a similar effect.
Environmental Matters
All of the centers presently owned by us (not including option interests in certain pre-development projects) have been subject to environmental assessments. We are not aware of any environmental liability relating to the centers or any other property, in which we have or had an interest (whether as an owner or operator) that we believe, would have a material adverse effect on our business, assets, or results of operations. No assurances can be given, however, that all environmental liabilities have been identified or that no prior owner, operator, or current occupant has created an environmental condition not known to us. Moreover, no assurances can be given that (1) future laws, ordinances, or regulations will not impose any material environmental liability or that (2) the current environmental condition of the centers will not be affected by tenants and occupants of the centers, by the condition of properties in the vicinity of the centers (such as the presence of underground storage tanks), or by third parties unrelated to us.
Personnel
We have engaged the Manager to provide real estate management, acquisition, development, and administrative services required by us and our properties.
As of December 31, 2006, the Manager had 547 full-time employees. The following table provides a breakdown of employees by operational areas as of December 31, 2006:
| | Number of Employees |
| Center Operations | 206 |
| Property Management | 133 |
| Leasing and Tenant Coordination | 60 |
| Development | 25 |
| Financial Services | 62 |
| Other | 61 |
| Total | 547 |
Available Information
The Company makes available free of charge through its website at www.taubman.com all reports it electronically files with, or furnishes to, the Securities Exchange Commission (the “SEC”), including its Annual Report on Form 10-K, Quarterly Reports on Form 10-Q, and Current Reports on Form 8-K, as well as any amendments to those reports, as soon as reasonably practicable after those documents are filed with, or furnished to, the SEC. These filings are also accessible on the SEC’s website at www.sec.gov.
Item 1A. RISK FACTORS.
The information required by this item is included in this report at Item 1 under the caption "Business - General Risks of the Company."
Item 1B. UNRESOLVED STAFF COMMENTS.
None.
Item 2. PROPERTIES.
Ownership
The following table sets forth certain information about each of the centers. The table includes only centers in operation at December 31, 2006. Centers are owned in fee other than Beverly Center (Beverly), Cherry Creek Shopping Center (Cherry Creek), International Plaza, and MacArthur Center, which are held under ground leases expiring between 2049 and 2083.
Certain of the centers are partially owned through joint ventures. Generally, the Operating Partnership's joint venture partners have ongoing rights with regard to the disposition of the Operating Partnership's interest in the joint ventures, as well as the approval of certain major matters.
Center | Anchors | Sq. Ft of GLA/Mall GLA as of 12/31/06 | Year Opened/ Expanded | Year Acquired | Ownership % as of 12/31/06 |
Consolidated Businesses: | | | | | |
| Beverly Center | Bloomingdales, Macy’s | 884,000 | 1982 | | 100% |
| Los Angeles, CA | | 576,000 | | | |
| | | | | | |
| Cherry Creek Shopping Center | Macy’s, Neiman Marcus, Nordstrom (2007), | 1,023,000 (1) | 1990/1998 | | 50% |
| Denver, CO | Saks Fifth Avenue | 550,000 | | | |
| | | | | | |
| Dolphin Mall | Bass Pro Shops Outdoor World (2007), Burlington Coat | 1,315,000 | 2001 | | 100% |
| Miami, FL | Factory, Cobb Theatres, Dave & Busters, Marshalls, Neiman | 624,000 | | | |
| | Marcus-Last Call, Off 5th Saks, The Sports Authority | | | | |
| | | | | | |
| Fairlane Town Center | JCPenney, Macy’s, Off 5th Saks, Sears | 1,513,000 (2) | 1976/1978/ | | 100% |
| Dearborn, MI | | 623,000 | 1980/2000 | | |
| (Detroit Metropolitan Area) | | | | | |
| | | | | | |
| Great Lakes Crossing | AMC Theaters, Bass Pro Shops Outdoor World, Circuit City, | 1,360,000 | 1998 | | 100% |
| Auburn Hills, MI | GameWorks, Neiman Marcus-Last Call, Off 5th Saks | 545,000 | | | |
| (Detroit Metropolitan Area) | | | | | |
| | | | | | |
| International Plaza | Dillard’s, Neiman Marcus, Nordstrom, Robb & Stucky | 1,221,000 | 2001 | | 50% |
| Tampa, FL | | 579,000 | | | |
| | | | | | |
| MacArthur Center | Dillard’s, Nordstrom | 933,000 | 1999 | | 95% |
| Norfolk, VA | | 519,000 | | | |
| | | | | | |
| Northlake Mall | Belk, Dick’s Sporting Goods, Dillard’s, Macy’s | 1,072,000 | 2005 | | 100% |
| Charlotte, NC | | 466,000 | | | |
| | | | | | |
| Regency Square | JCPenney, Macy’s (two locations), Sears | 823,000 | 1975/1987 | 1997 | 100% |
| Richmond, VA | | 236,000 | | | |
| | | | | | |
| The Mall at Short Hills | Bloomingdale’s, Macy’s, Neiman Marcus, Nordstrom, Saks | 1,340,000 | 1980/1994/ | | 100% |
| Short Hills, NJ | Fifth Avenue | 518,000 | 1995 | | |
| | | | | | |
| Stony Point Fashion Park | Dick’s Sporting Goods, Dillard’s, Saks Fifth Avenue | 662,000 | 2003 | | 100% |
| Richmond, VA | | 296,000 | | | |
| | | | | | |
| Twelve Oaks Mall | JCPenney, Lord & Taylor, Macy’s, Nordstrom (2007), Sears | 1,190,000 (3) | 1977/1978 | | 100% |
| Novi, MI | | 452,000 | | | |
| (Detroit Metropolitan Area) | | | | | |
| | | | | | |
| The Mall at Wellington Green | City Furniture and Ashley Furniture Home Store, Dillard’s, | 1,274,000 | 2001/2003 | | 90% |
| Wellington, FL | JCPenney, Macy’s, Nordstrom | 461,000 | | | |
| (Palm Beach County) | | | | | |
| | | | | | |
| The Shops at Willow Bend | Dillard’s, Macy’s, Neiman Marcus, Saks Fifth Avenue | 1,388,000 (4) | 2001/2004 | | 100% |
| Plano, TX | | 530,000 | | | |
| (Dallas Metropolitan Area) | | | | | |
| | Total GLA | 15,998,000 | | | |
| | Total Mall GLA | 6,975,000 | | | |
| | TRG% of Total GLA | 14,702,000 | | | |
| | TRG% of Total Mall GLA | 6,338,000 | | | |
Unconsolidated Joint Ventures: | | | | | |
| Arizona Mills | GameWorks, Harkins Cinemas, JCPenney Outlet, Neiman | 1,231,000 | 1997 | | 50% |
| Tempe, AZ | Marcus-Last Call, Off 5th Saks | 527,000 | | | |
| (Phoenix Metropolitan Area) | | | | | |
| | | | | | |
| Fair Oaks | JCPenney, Lord & Taylor, Macy’s (two locations), Sears | 1,571,000 | 1980/1987/ | | 50% |
| Fairfax, VA | | 566,000 | 1988/2000 | | |
| (Washington, DC Metropolitan Area) | | | | | |
| | | | | | |
| The Mall at Millenia | Bloomingdale’s, Macy’s, Neiman Marcus | 1,115,000 | 2002 | | 50% |
| Orlando, FL | | 515,000 | | | |
| | | | | | |
| The Pier Shops at Caesars | | 303,000 | 2006 | | (5) |
| Atlantic City, NJ | | 303,000 | | | |
| | | | | | |
| Stamford Town Center | Macy’s, Saks Fifth Avenue | 852,000 (6) | 1982 | | 50% |
| Stamford, CT | | 359,000 | | | |
| | | | | | |
| Sunvalley | JCPenney, Macy’s (two locations), Sears | 1,326,000 | 1967/1981 | 2002 | 50% |
| Concord, CA | | 486,000 | | | |
| (San Francisco Metropolitan Area) | | | | | |
| | | | | | |
| Waterside Shops at Pelican Bay | Nordstrom (2008), Saks Fifth Avenue | 242,000 | 1992/2006 | 2003 | 25% |
| Naples, FL | | 197,000 | | | |
| | | | | | |
| Westfarms | JCPenney, Lord & Taylor, Macy’s, Macy’s Men’s Store/ | 1,290,000 | 1974/1983/ | | 79% |
| West Hartford, CT | Furniture Gallery, Nordstrom | 520,000 | 1997 | | |
| | | | | | |
| | Total GLA | 7,930,000 | | | |
| | Total Mall GLA | 3,473,000 | | | |
| | TRG% of Total GLA | 4,127,000 | | | |
| | TRG% of Total Mall GLA | 1,687,000 | | | |
| | | | | | |
| | Grand Total GLA | 23,928,000 | | | |
| | Grand Total Mall GLA | 10,448,000 | | | |
| | TRG% of Total GLA | 18,829,000 | | | |
| | TRG% of Total Mall GLA | 8,025,000 | | | |
| (1) | Nordstrom will occupy the former Lord & Taylor space, which closed on April 2005. |
| (2) | GLA includes the former Lord & Taylor store, which closed in June 2006. |
| (3) | In addition to the 2007 Nordstrom addition, an expansion and renovation of Macy’s and additional store space will open in September 2007. |
| (4) | GLA includes the former Lord & Taylor store, which closed in April 2005. |
| (5) | The Company is in final negotiations to increase its ownership from 30% to 50%. |
| (6) | GLA includes the space formerly occupied by Filene’s, which is 100% leased and will include a mix of stores and restaurants. The expected opening date is November 2007. |
Anchors
The following table summarizes certain information regarding the anchors at the operating centers (excluding the value centers) as of December 31, 2006:
Name | Number of Anchor Stores | | 12/31/06 GLA (in thousands) | | % of GLA |
| Belk | 1 | | 180 | | 0.9% |
| | | | | | |
| City Furniture and Ashley Furniture Home Store | 1 | | 140 | | 0.7% |
| | | | | | |
| Dick’s Sporting Goods | 2 | | 159 | | 0.8% |
| | | | | | |
| Dillard’s | 6 | | 1,335 | | 6.8% |
| | | | | | |
| Federated | | | | | |
| Macy’s | 17 | | 3,394 | | |
| Bloomingdale’s | 3 | | 614 | | |
| Lord & Taylor | 3 | | 397 | | |
| Macy’s Men’s Store/Furniture Gallery | 1 | | 80 | | |
| Total | 24 | | 4,485 | | 22.7% |
| | | | | | |
| JCPenney | 7 | | 1,266 | | 6.4% |
| | | | | | |
Neiman Marcus (1) | 5 | | 556 | | 2.8% |
| | | | | | |
Nordstrom (2) | 5 | | 796 | | 4.0% |
| | | | | | |
| Robb & Stucky | 1 | | 119 | | 0.6% |
| | | | | | |
| Saks | | | | | |
| Saks Fifth Avenue | 6 | | 467 | | |
Off 5th Saks (3) | 1 | | 93 | | |
| Total | 7 | | 560 | | 2.8% |
| | | | | | |
| Sears | 5 | | 1,104 | | 5.6% |
| | | | | | |
| Total | 64 | | 10,700 | | 54.3% (4) |
| (1) | Excludes three Neiman Marcus-Last Call stores at value centers. |
| (2) | Nordstrom will open at Cherry Creek and Twelve Oaks in Fall 2007, and Waterside in 2008. |
| (3) | Excludes three Off 5th Saks stores at value centers. |
| (4) | Percentages in table may not add due to rounding. |
Mortgage Debt
The following table sets forth certain information regarding the mortgages encumbering the centers as of December 31, 2006. All mortgage debt in the table below is nonrecourse to the Operating Partnership except for debt encumbering Dolphin Mall (Dolphin), Fairlane Town Center (Fairlane), and Twelve Oaks. The Operating Partnership has guaranteed the payment of all or a portion of the principal and interest on the mortgage debt of these centers. (See "Management's Discussion and Analysis of Financial Condition and Results of Operations - Liquidity and Capital Resources - Loan Commitments and Guarantees"). An $86 million mortgage for The Pier is excluded along with a $0.3 million note secured by certain equipment of The Mall at Millenia.
Centers Consolidated in TCO’s Financial Statements | | Stated Interest Rate | | | Principal Balance as of 12/31/06 (thousands of dollars) | | | Annual Debt Service (thousands of dollars) | | | Maturity Date | | | Balance Due on Maturity (thousands of dollars) | | Earliest Prepayment Date | |
| Beverly Center | | 5.28% | | | 343,608 | | | 23,101 | (1) | | 02/11/14 | | | 303,277 | | 01/16/07 | (2) |
| Cherry Creek Shopping Center (50%) | | 5.24% | | | 280,000 | | | Interest Only | | | 06/18/16 | | | 280,000 | | 05/11/09 | (2)(3) |
| Dolphin Mall | | LIBOR+0.70% | | | 5,000 | (4) | | Interest Only | | | 02/14/09 | (5) | | 5,000 | | 2 Days Notice | (6) |
| Fairlane Town Center | | LIBOR+0.70% | | | 55,000 | (4) | | Interest Only | | | 02/14/09 | (5) | | 55,000 | | 2 Days Notice | (6) |
| Great Lakes Crossing | | 5.25% | | | 142,908 | | | 10,006 | (1) | | 03/11/13 | | | 125,507 | | 30 Days Notice | (2) |
| International Plaza (50.1%) | | 4.21% | (7) | | 178,719 | (7) | | 11,274 | (1) | | 01/08/08 | (8) | | 175,150 | | 30 Days Notice | (9) |
| MacArthur Center (95%) | | 7.59% | (10) | | 138,243 | (10) | | 12,400 | (1) | | 10/01/10 | | | 126,884 | | 30 Days Notice | (2) |
| Northlake Mall | | 5.41% | | | 215,500 | | | Interest Only | | | 02/06/16 | | | 215,500 | | 3/23/08 | (11) |
| The Mall at Partridge Creek | | LIBOR+1.15% | | | 22,010 | | | Interest Only | | | 09/07/10 | | | 22,010 | | 3 Days Notice | (6) |
| Regency Square | | 6.75% | | | 77,812 | | | 6,421 | (1) | | 11/01/11 | | | 71,569 | | 60 Days Notice | (12) |
| The Mall at Short Hills | | 5.47% | | | 540,000 | | | Interest Only | | | 12/14/15 | | | 540,000 | | 01/01/11 | (13) |
| Stony Point Fashion Park | | 6.24% | | | 111,864 | | | 8,488 | (1) | | 06/01/14 | | | 98,585 | | 08/13/06 | (11) |
| The Mall at Wellington Green (90%) | | 5.44% | | | 200,000 | | | Interest Only | | | 05/06/15 | | | 200,000 | | 06/24/07 | (11) |
| Twelve Oaks Mall | | LIBOR+0.70% | | | 0 | (4) | | Interest Only | | | 02/09/07 | (5) | | 0 | | 2 Days Notice | (6) |
| | | | | | | | | | | | | | | | | | |
Other Consolidated Secured Debt | | | | | | | | | | | | | | | | | |
| TRG Credit Facility | | Variable Bank Rate | (14) | | 8,075 | | | Interest Only | | | 02/14/08 | | | 8,075 | | At Any Time | (6) |
| | | | | | | | | | | | | | | | | | |
Centers Owned by Unconsolidated Joint Ventures/TRG’s % Ownership | | | | | | | | | | | | | | | | | |
| Arizona Mills (50%) | | 7.90% | | | 137,780 | | | 12,728 | (1) | | 10/05/10 | | | 130,419 | | 30 Days Notice | (2) |
| Fair Oaks (50%) | | 6.60% | | | 140,000 | | | Interest Only | | | 04/01/08 | | | 140,000 | | 30 Days Notice | (15) |
| The Mall at Millenia (50%) | | 5.46% | | | 210,000 | | | Interest Only | (16) | | 04/09/13 | | | 195,255 | | 30 Days Notice | (2) |
| Sunvalley (50%) | | 5.67% | | | 127,950 | | | 9,372 | (1) | | 11/01/12 | | | 114,056 | | 30 Days Notice | (2) |
| Taubman Land Associates (50%) | | LIBOR+0.90% | (17) | | 30,000 | | | Interest Only | | | 11/01/12 | | | 30,000 | | At Any Time | (6) |
| Waterside Shops at Pelican Bay (25%) | | 5.54% | | | 165,000 | | | Interest Only | | | 10/07/16 | | | 165,000 | | 09/28/09 | (12)(18) |
| Westfarms (79%) | | 6.10% | | | 198,521 | | | 15,272 | (1) | | 07/11/12 | | | 179,028 | | 30 Days Notice | (2) |
| (1) | Amortizing principal based on 30 years. |
| (2) | No defeasance deposit required if paid within three months of maturity date. |
| (3) | Loan may be defeased earlier of 2 years from the date the final note is securitized or 5/11/09. |
| (4) | Subfacility in $350 million revolving line of credit. Facility may be increased to $650 million subject to available lender commitments and additional secured collateral. |
| (5) | The maturity date may be extended one year. |
| (6) | Prepayment can be made without penalty. |
| (7) | Debt is reduced by $0.2 million of purchase accounting discount from acquisition which increases the stated rate on the debt of 4.21% to an effective rate of 4.38%. |
| (8) | The operating partnership has entered into three forward starting swaps totaling $150 million to partially hedge the refinancing of this debt at maturity. The weighted average forward swap rate for these three swaps is 5.33% excluding the credit spread. |
| (9) | No defeasance deposit required if paid within one month of maturity date. |
| (10) | Debt includes $2.8 million of purchase accounting premium from acquisition which reduces the stated rate on the debt of 7.59% to an effective rate of 6.87%. |
| (11) | No defeasance deposit required if paid within four months of maturity date. |
| (12) | No defeasance deposit required if paid within six months of maturity date. |
| (13) | Debt may be prepaid with a prepayment penalty equal to greater of yield maintenance or 1% of principal prepaid. No prepayment penalty is due if prepaid within three months of maturity date. 30 days notice required. |
| (14) | The facility is a $40 million line of credit and is secured by an indirect interest in 40% of Short Hills. |
| (15) | Debt may be prepaid with a yield maintenance prepayment penalty. No prepayment penalty is due if prepaid within six months of maturity date. |
| (16) | Interest only through 4/9/08. Thereafter, principal will be amortized based on 30 years. Annual debt service will be $14,245. |
| (17) | Beginning 1/2/07, debt is swapped at 5.05% +0.90% credit spread. Effective rate of 5.95% from 1/2/07 to 11/1/12. |
| (18) | Loan may be defeased earlier of 2 years from the date the final note is securitized or 9/28/09. |
For additional information regarding the centers and their operations, see the responses to Item 1 of this report.
Item 3. LEGAL PROCEEDINGS.
Neither we, our subsidiaries, nor any of the joint ventures is presently involved in any material litigation, nor, to our knowledge, is any material litigation threatened against us, our subsidiaries, or any of the properties. Except for routine litigation involving present or former tenants (generally eviction or collection proceedings), substantially all litigation is covered by liability insurance.
Item 4. SUBMISSION OF MATTERS TO A VOTE OF SECURITY HOLDERS.
Not applicable.
PART II
Item 5. MARKET FOR REGISTRANT'S COMMON EQUITY, RELATED STOCKHOLDER MATTERS, AND ISSUER PURCHASES OF EQUITY SECURITIES.
The common stock of Taubman Centers, Inc. is listed and traded on the New York Stock Exchange (Symbol: TCO). As of February 26, 2007, the 53,594,244 outstanding shares of Common Stock were held by 607 holders of record. A substantially greater number of holders are beneficial owners whose shares are held of record by banks, brokers, and other financial institutions. The closing price per share of the Common Stock on the New York Stock Exchange on February 26, 2007 was $60.97.
The following table presents the dividends declared on our Common Stock and the range of share prices of our Common Stock for each quarter of 2006 and 2005:
| | Market Quotations |
2006 Quarter Ended | High | Low | Dividends |
| March 31 | $43.77 | $35.61 | $0.305 |
| | | | |
| June 30 | 42.01 | 36.85 | 0.305 |
| | | | |
| September 30 | 44.42 | 39.43 | 0.305 |
| | | | |
| December 31 | 50.86 | 44.77 | 0.375 |
| | Market Quotations |
2005 Quarter Ended | High | Low | Dividends |
| March 31 | $29.85 | $26.60 | $0.285 |
| | | | |
| June 30 | 35.03 | 27.83 | 0.285 |
| | | | |
| September 30 | 36.04 | 31.00 | 0.285 |
| | | | |
| December 31 | 35.83 | 28.75 | 0.305 |
The restrictions on our ability to pay dividends on our Common Stock are set forth in “Managements Discussion and Analysis of Financial Condition and Results of Operations - Liquidity and Capital Resources - Dividends.”
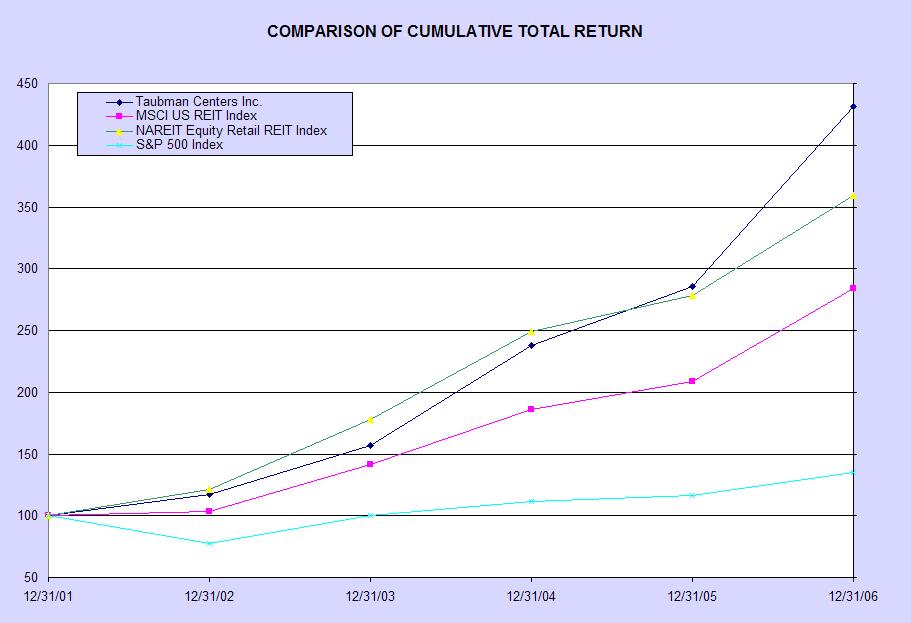
Shareholder Return Performance Graph
The following line graph sets forth the cumulative total returns on a $100 investment in each of the Company’s Common Stock, the MSCI US REIT Index, the NAREIT Equity Retail REITI Index, and the S&P Composite - 500 Stock Index for the period December 31, 2001 through December 31, 2006 (assuming in all cases, the reinvestment of dividends).
| | 12/31/01 | 12/31/02 | 12/31/03 | 12/31/04 | 12/31/05 | 12/31/06 |
| Taubman Centers Inc. | $100.00 | $116.86 | $156.59 | $237.57 | $285.96 | $431.11 |
| MSCI US REIT Index | 100.00 | 103.64 | 141.73 | 186.35 | 208.96 | 284.02 |
| NAREIT Equity Retail REIT Index | 100.00 | 121.07 | 177.69 | 249.18 | 278.58 | 359.40 |
| S&P 500 Index | 100.00 | 77.90 | 100.25 | 111.15 | 116.61 | 135.02 |
Note: the stock performance shown on the graph above is not necessarily indicative of future price performance.
Equity Purchases
We did not purchase any equity securities in the fourth quarter of 2006.
Item 6. SELECTED FINANCIAL DATA.
The following table sets forth selected financial data and should be read in conjunction with the financial statements and notes thereto and Management's Discussion and Analysis of Financial Condition and Results of Operations included in this report:
| | | Year Ended December 31 |
| | | | 2006 | | | 2005 | | | 2004 | | | 2003 | | | 2002 | |
| | | (in thousands of dollars, except as noted) |
| STATEMENT OF OPERATIONS DATA: | | | | | | | | | | | | | | | | |
Rents, recoveries, and other shopping center revenues(1) | | | 579,284 | | | 479,405 | | | 436,815 | | | 398,959 | | | 358,902 | |
Income before gain on disposition of interest in center, discontinued operations, and minority and preferred interests | | | 95,140 | | | 57,432 | | | 59,970 | | | 31,292 | | | 42,015 | |
Gain on disposition of interest in center (2) | | | | | | 52,799 | | | | | | | | | | |
Discontinued operations (3) | | | | | | | | | 328 | | | 50,881 | | | 13,816 | |
| Minority interest in TRG | | | (36,870 | ) | | (35,869 | ) | | (35,694 | ) | | (35,501 | ) | | (32,826 | ) |
| TRG preferred distributions | | | (2,460 | ) | | (2,460 | ) | | (12,244 | ) | | (9,000 | ) | | (9,000 | ) |
Net income (4) | | | 45,117 | | | 71,735 | | | 12,378 | | | 37,836 | | | 14,426 | |
| Preferred dividends | | | (23,723 | ) | | (27,622 | ) | | (17,444 | ) | | (16,600 | ) | | (16,600 | ) |
| Net income (loss) allocable to common shareowners | | | 21,394 | | | 44,113 | | | (5,066 | ) | | 21,236 | | | (2,174 | ) |
| Income (loss) from continuing operations per common share - diluted | | | 0.41 | | | 0.87 | | | (0.11 | ) | | (0.13 | ) | | (0.16 | ) |
| Net income (loss) per common share - diluted | | | 0.40 | | | 0.87 | | | (0.10 | ) | | 0.41 | | | (0.05 | ) |
| Dividends declared per common share | | | 1.290 | | | 1.160 | | | 1.095 | | | 1.050 | | | 1.025 | |
| Weighted average number of common shares outstanding -basic | | | 52,661,024 | | | 50,459,314 | | | 49,021,843 | | | 50,387,616 | | | 51,239,237 | |
| Weighted average number of common shares outstanding - diluted | | | 52,979,453 | | | 50,530,139 | | | 49,021,843 | | | 50,387,616 | | | 51,239,237 | |
| Number of common shares outstanding at end of period | | | 52,931,594 | | | 51,866,184 | | | 48,745,625 | | | 49,936,786 | | | 52,207,756 | |
| Ownership percentage of TRG at end of period | | | 65 | % | | 64 | % | | 61 | % | | 61 | % | | 62 | % |
| | | | | | | | | | | | | | | | | |
| BALANCE SHEET DATA: | | | | | | | | | | | | | | | | |
| Real estate before accumulated depreciation | | | 3,398,122 | | | 3,081,324 | | | 2,936,964 | | | 2,519,922 | | | 2,393,428 | |
| Total assets | | | 2,826,622 | | | 2,797,580 | | | 2,632,434 | | | 2,186,970 | | | 2,269,707 | |
| Total debt | | | 2,319,538 | | | 2,089,948 | | | 1,930,439 | | | 1,495,777 | | | 1,463,725 | |
| | | | | | | | | | | | | | | | | |
| SUPPLEMENTAL INFORMATION: | | | | | | | | | | | | | | | | |
Funds from Operations allocable to TCO (4)(5) | | | 136,736 | | | 110,578 | | | 103,070 | | | 87,325 | | | 88,240 | |
Mall tenant sales (6) | | | 4,348,826 | | | 4,124,534 | | | 3,728,010 | | | 3,417,572 | | | 3,113,620 | |
Sales per square foot (6)(7) | | | 539 | | | 508 | | | 466 | | | 441 | | | 457 | |
| Number of shopping centers at end of period | | | 22 | | | 21 | | | 21 | | | 21 | | | 20 | |
| Ending Mall GLA in thousands of square feet | | | 10,448 | | | 10,029 | | | 9,982 | | | 9,988 | | | 9,850 | |
Leased space (8)(9) | | | 92.5 | % | | 91.7 | % | | 90.7 | % | | 89.8 | % | | 90.3 | % |
Ending occupancy (9) | | | 91.3 | % | | 90.0 | % | | 89.6 | % | | 87.4 | % | | 87.0 | % |
Average occupancy (9) | | | 89.2 | % | | 88.9 | % | | 87.4 | % | | 86.6 | % | | 84.8 | % |
Average base rent per square foot (7): | | | | | | | | | | | | | | | | |
| Consolidated businesses: | | | | | | | | | | | | | | | | |
| All mall tenants | | $ | 43.20 | | $ | 41.41 | | $ | 40.98 | | $ | 40.06 | | $ | 42.31 | |
| Stores opening during year | | | 42.24 | | | 42.38 | | | 44.35 | | | 43.41 | | | 45.91 | |
| Stores closing during year | | | 39.73 | | | 40.59 | | | 44.54 | | | 40.80 | | | 43.47 | |
| Unconsolidated Joint Ventures: | | | | | | | | | | | | | | | | |
| All mall tenants | | $ | 41.03 | | $ | 42.28 | | $ | 42.09 | | $ | 42.75 | | $ | 42.03 | |
| Stores opening during year | | | 42.98 | | | 44.90 | | | 44.67 | | | 40.06 | | | 43.03 | |
| Stores closing during year | | | 42.49 | | | 44.26 | | | 51.40 | | | 41.28 | | | 41.63 | |
(1) Certain reclassifications have been made to prior year information to conform to current year classifications.
(2) In December 2005, a 50% owned unconsolidated joint venture sold its interest in Woodland for $177.4 million.
(3) Biltmore Fashion Park was sold in 2003, and La Cumbre Plaza and Paseo Nuevo were sold in 2002. Discontinued operations in 2004, 2003, and 2002 include gains on dispositions of interests in centers of $0.3 million,
$49.6 million, and $12.3 million, respectively.
(4) Funds from Operations (FFO) is defined and discussed in MD&A - Presentation of Operating Results. Net income in 2006 includes $3.1 million in connection with the write-off of financing costs related to the respective
pay-off and refinancing of the loans on The Shops at Willow Bend and Dolphin. In addition to these charges, FFO in 2006 includes a $4.7 million charge incurred in connection with the redemption of $113 million of the
Series A Preferred Stock and $113 million of the Series I Preferred Stock. Net income in 2005 includes a $12.7 million charge incurred in connection with a prepayment premium and the write-off of financing costs related
to the refinancing of The Mall at Short Hills, the pay-off of the Northlake loan, and debt modifications in connection with the pay-off of the loan on The Mall at Oyster Bay. In addition to these charges, FFO in 2005 includes a
$3.1 million charge incurred in connection with the redemption of $87 million of the Series A Preferred Stock. Net income and FFO in 2004 include insurance recoveries related to the unsolicited tender offer of $1.0 million,
a $2.7 million charge incurred in connection with the redemption of the Series C and D Preferred Equity, and a $5.7 million restructuring loss. Net income (loss) and FFO include costs incurred in connection with the
unsolicited tender offer, net of recoveries, of $24.8 million and $5.1 million in 2003 and 2002, respectively.
(5) Reconciliations of net income (loss) to FFO for 2006, 2005, and 2004 are provided in MD&A - Presentation of Operating Results. For 2003, net income of $21.2 million, less the gain on dispositions of interests in centers
of $49.6 million, adding back depreciation and amortization of $137.4 million and minority interests in TRG of $35.5 million, arrives at TRG’s FFO of $144.5 million, of which TCO’s share was $87.3 million. For 2002, net
loss of $2.2 million, less the gain on dispositions of interests in centers of $12.3 million, adding back depreciation and amortization of $124.3 million and minority interests in TRG of $32.8 million, arrives at TRG’s FFO
of $142.6 million, of which TCO’s share was $88.2 million.
(6) Based on reports of sales furnished by mall tenants.
(7) See MD&A for information regarding this statistic.
(8) Leased space comprises both occupied space and space that is leased but not yet occupied.
(9) 2002 statistics exclude anchor spaces at value centers.
Item 7. MANAGEMENT'S DISCUSSION AND ANALYSIS OF FINANCIAL CONDITION AND RESULTS OF OPERATIONS.
MANAGEMENT'S DISCUSSION AND ANALYSIS OF
FINANCIAL CONDITION AND RESULTS OF OPERATIONS
The following Management’s Discussion and Analysis of Financial Condition and Results of Operations contains various “forward-looking statements” within the meaning of Section 27A of the Securities Act of 1933, as amended, and Section 21E of the Securities Exchange Act of 1934, as amended. These forward-looking statements represent our expectations or beliefs concerning future events, including the following: statements regarding future developments and joint ventures, rents and returns, statements regarding the continuation of trends, and any statements regarding the sufficiency of our cash balances and cash generated from operating and financing activities for our future liquidity and capital resource needs. We caution that although forward-looking statements reflect our good faith beliefs and best judgment based upon current information, these statements are qualified by important factors that could cause actual results to differ materially from those in the forward-looking statements, including those risks, uncertainties, and factors detailed from time to time in reports filed with the SEC, and in particular those set forth under the headings “General Risks of the Company” and “Environmental Matters” in Item 1. of this Annual Report on Form 10-K. The following discussion should be read in conjunction with the accompanying Consolidated Financial Statements of Taubman Centers, Inc. and the Notes thereto.
General Background and Performance Measurement
Taubman Centers, Inc. (“we”, “us”, “our” or “TCO”) owns a managing general partner's interest in The Taubman Realty Group Limited Partnership (the “Operating Partnership” or “TRG”), through which we conduct all of our operations. The Operating Partnership owns, develops, acquires, and operates shopping centers. The Consolidated Businesses consist of shopping centers that are controlled by ownership or contractual agreement, development projects for future regional shopping centers, variable interest entities for which we are the primary beneficiary, and The Taubman Company LLC (“Manager”). Shopping centers owned through joint ventures that are not controlled by us but over which we have significant influence (“Unconsolidated Joint Ventures”) are accounted for under the equity method.
References in this discussion to “beneficial interest” refer to our ownership or pro-rata share of the item being discussed. Also, the operations of the shopping centers are often best understood by measuring their performance as a whole, without regard to our ownership interest. Consequently, in addition to the discussion of the operations of the Consolidated Businesses, the operations of the Unconsolidated Joint Ventures are presented and discussed as a whole.
The comparability of information used in measuring performance is affected by the opening of Northlake in September 2005 and the sale of our interest in Woodland in December 2005, as well as the expansion and renovation at Waterside. The Pier began opening stores in late June 2006, and is accounted for under the equity method. The Pier has been excluded from all operating statistics. Additional “comparable center” statistics that exclude Northlake, Waterside, and Woodland are provided for 2006 and 2005 to present the performance of comparable centers in our continuing operations. Comparable centers are generally defined as centers that were owned and open for two years. As of January 1, 2006, we began consolidating the entity that owns Cherry Creek. The center is included within our consolidated results and statistics as of that date, while it continues to be presented as an Unconsolidated Joint Venture for dates and periods prior to January 1, 2006.
Overall Summary of Management’s Discussion and Analysis of Financial Condition and Results of Operations
Our business is to lease space in our shopping centers. Generally these leases are long term, with our average lease term at approximately 7 years. Therefore general economic trends most directly impact our tenants’ sales and consequently their ability to perform under their existing lease agreements and expand into new locations as well as our ability to find new tenants for our shopping centers. Occupancy continued to increase during 2006, and we anticipate continued occupancy growth throughout 2007, although we expect more modest increases in the first half of 2007 than in the second half. Average rent per square foot increased by 1.7% in 2006 and we anticipate rent per square foot to increase in the range of 2.5% in 2007. Tenant sales trends demonstrated strong growth in 2006, increasing 6.1% and reaching a new record level of $539 per square foot for our comparable centers. This increase in sales resulted in a significant increase in percentage rent in 2006. We believe these improving tenant sales provide us an opportunity to continue to increase rents in the future (see "Mall Tenant Sales and Center Revenues" and "Rental Rates and Occupancy").
The rents we are able to achieve are similarly affected by economic trends and tenants’ expectations thereof, as described under “Rental Rates and Occupancy”. The spread between rents on openings and closings may not be indicative of future periods, as this statistic is not computed on comparable tenant spaces, and can vary significantly from quarter to quarter depending on the total amount, location, and average size of tenant space opening and closing in the period. Mall tenant sales, occupancy levels and our resulting revenues are seasonal in nature (see “Seasonality").
Our analysis of our financial results begins under “Results of Operations”. We have been active in developing and expanding our shopping center portfolio, and we describe the most recent center openings, including The Pier and Northlake, under “Openings, Dispositions, and Acquisitions”. In 2005, we disposed of our interest in a 50% owned unconsolidated joint venture and we acquired additional interests in two centers in 2004. Additional efforts to broaden our growth included the formation in 2005 of Taubman Asia, which is the platform for our expansion into the Asia-Pacific region. In January 2007, we completed an agreement to provide development services for a project in New Songdo City, Incheon, South Korea and were selected as the preferred retail partner for a project in Macao (see “Subsequent Events”).
We similarly have been very active in managing our balance sheet, completing a series of new financings and refinancings of existing debt, as well as a series of stock buybacks, as outlined under “Debt Transactions” and “Equity Transactions”. As a result of our financings, our floating rate debt represents less than 5% of our total debt and we believe we are well positioned if there is a rise in interest rates.
We have certain additional sources of income beyond our rental revenues, recoveries from tenants, and revenue from management, leasing, and development services. We disclose the Operating Partnership’s share of these sources of income under “Other Income”. Included in other revenue are lease cancellation income, as well as other sources of revenue derived from our shopping centers, such as parking garage and sponsorship income. Other sources of income include interest income and gains on peripheral land sales.
We then provide a discussion of our critical accounting policies, the impact of adoption of new accounting principles, and the expected impact of recently issued accounting pronouncements.
With all the preceding information as background, we have then provided insight and explanations for variances in our financial results from 2004 through 2006 under “Comparison of 2006 to 2005” and “Comparison of 2005 to 2004”. As information useful to understanding our results, we have described the presentation of our minority interest, the presentation of certain interests in centers, and the reasons for our use of non-GAAP measures such as EBITDA and Funds from Operations (FFO) under “Presentation of Operating Results”. Reconciliations from net income and net income allocable to common shareowners to these measures follow the annual comparisons.
Our discussion of sources and uses of capital resources under “Liquidity and Capital Resources” begins with a brief overview of capital activities and transactions occurring in 2006. Analysis of specific operating, investing, and financing activities is then provided in more detail. Cash flows from rents and recoveries, lease cancellation revenue, and recent center openings provide the resources for payments of interest and other operating expenses, leasing costs, and required distributions and dividends. Proceeds from the sale of a property and the completion of a major financing occurring in late 2005, in addition to financings in 2006, created significant liquidity used for the pay-off or refinancing of several existing loans and further investment in development properties in 2006.
Specific analysis of our fixed and floating rates and periods of interest rate risk exposure is provided under “Beneficial Interest in Debt”. Completing our analysis of our exposure to rates are the effects of changes in interest rates on our cash flows and fair values of debt contained under “Sensitivity Analysis”.
In conducting our business, we enter into various contractual obligations, including those for debt, capital leases for property improvements, operating leases for land and office space, purchase obligations, and other long-term commitments. Detail of these obligations, including expected settlement periods, is contained under “Contractual Obligations”. Property-level debt represents the largest single class of obligations. Described under “Loan Commitments and Guarantees” and “Cash Tender Agreement” are our significant guarantees and commitments.
Development of new malls and renovation and expansion of existing malls continues to be a significant use of our capital, as described in “Capital Spending” and “Planned Capital Spending”. Recent spending includes that related to the construction of Partridge Creek, in Clinton Township, Michigan, the expansion and renovation of Twelve Oaks and Waterside, the renovation of the former Filene’s space at Stamford Town Center, our Oyster Bay project in the Town of Oyster Bay, New York, and other development activities and capital items. Additional capital spending in 2007 is expected to continue for these and other projects.
Dividends and distributions are also significant uses of our capital resources. The factors considered when determining the amount of our dividends, including requirements arising because of our status as a REIT, are described under “Dividends”. We increased our quarterly dividend by 23% in the fourth quarter of 2006. Our total return to our shareholders, assuming reinvestment of dividends, was 50.8% for 2006.
Mall Tenant Sales and Center Revenues
Over the long term, the level of mall tenant sales is the single most important determinant of revenues of the shopping centers because mall tenants provide approximately 90% of these revenues and because mall tenant sales determine the amount of rent, percentage rent, and recoverable expenses (together, total occupancy costs) that mall tenants can afford to pay. However, levels of mall tenant sales can be considerably more volatile in the short run than total occupancy costs.
We believe that the ability of tenants to pay occupancy costs and earn profits over long periods of time increases as sales per square foot increase, whether through inflation or real growth in customer spending. Because most mall tenants have certain fixed expenses, the occupancy costs that they can afford to pay and still be profitable are a higher percentage of sales at higher sales per square foot.
Sales directly impact the amount of percentage rents certain tenants and anchors pay. The effects of increases or declines in sales on our operations are moderated by the relatively minor share that percentage rents represent of total rents (approximately five percent in 2006). However, a sustained trend in sales does impact, either negatively or positively, our ability to lease vacancies and negotiate rents at advantageous rates.
Tenant sales trends demonstrated strong growth in 2006, increasing 6.1% and reaching a new record level of $539 per square foot. This increase in sales resulted in a significant increase in percentage rent in 2006. We believe these improving tenant sales provide us an opportunity to increase rents in the future.
The following table summarizes occupancy costs, excluding utilities, for mall tenants as a percentage of mall tenant sales:
| | | | 2006 | | | 2005 | | | 2004 | |
| Mall tenant sales (in thousands of dollars) | | | 4,348,826 | | | 4,124,534 | | | 3,728,010 | |
Sales per square foot (1) | | | 539 | | | 508 | | | 466 | |
| | | | | | | | | | | |
| Consolidated Businesses: | | | | | | | | | | |
| Minimum rents | | | 9.1 | % | | 9.3 | % | | 10.0 | % |
| Percentage rents | | | 0.4 | | | 0.4 | | | 0.2 | |
| Expense recoveries | | | 4.9 | | | 4.6 | | | 5.0 | |
| Mall tenant occupancy costs as a percentage of mall tenant sales | | | 14.4 | % | | 14.3 | % | | 15.2 | % |
| Unconsolidated Joint Ventures: | | | | | | | | | | |
| Minimum rents | | | 8.3 | % | | 8.9 | % | | 9.7 | % |
| Percentage rents | | | 0.4 | | | 0.3 | | | 0.3 | |
| Expense recoveries | | | 3.8 | | | 4.0 | | | 4.4 | |
| Mall tenant occupancy costs as a percentage of mall tenant sales | | | 12.5 | % | | 13.2 | % | | 14.4 | % |
| (1) | Sales per square foot is presented for the comparable centers, including value centers. |
Rental Rates and Occupancy
As leases have expired in the shopping centers, we have generally been able to rent the available space, either to the existing tenant or a new tenant, at rental rates that are higher than those of the expired leases. In a period of increasing sales, rents on new leases will tend to rise as tenants' expectations of future growth become more optimistic. In periods of slower growth or declining sales, rents on new leases will grow more slowly or will decline for the opposite reason. However, center revenues nevertheless increase as older leases roll over or are terminated early and replaced with new leases negotiated at current rental rates that are usually higher than the average rates for existing leases.
The following table contains certain information regarding rentals at the comparable shopping centers:
| | | | 2006 | | | 2005 | | | 2004 | |
| Average rent per square foot: | | | | | | | | | | |
| Consolidated Businesses | | $ | 43.20 | | $ | 41.41 | | $ | 40.98 | |
| Unconsolidated Joint Ventures | | | 41.03 | | | 42.28 | | | 42.09 | |
| Opening base rent per square foot: | | | | | | | | | | |
| Consolidated Businesses | | $ | 42.24 | | $ | 42.38 | | $ | 44.35 | |
| Unconsolidated Joint Ventures | | | 42.98 | | | 44.90 | | | 44.67 | |
| Square feet of GLA opened: | | | | | | | | | | |
| Consolidated Businesses | | | 941,163 | | | 682,305 | | | 688,020 | |
| Unconsolidated Joint Ventures | | | 306,461 | | | 400,477 | | | 337,679 | |
| Closing base rent per square foot: | | | | | | | | | | |
| Consolidated Businesses | | $ | 39.73 | | $ | 40.59 | | $ | 44.54 | |
| Unconsolidated Joint Ventures | | | 42.49 | | | 44.26 | | | 51.40 | |
| Square feet of GLA closed: | | | | | | | | | | |
| Consolidated Businesses | | | 894,770 | | | 650,701 | | | 499,098 | |
| Unconsolidated Joint Ventures | | | 246,704 | | | 366,932 | | | 280,393 | |
| Releasing spread per square foot: | | | | | | | | | | |
| Consolidated Businesses | | $ | 2.51 | | $ | 1.79 | | $ | (0.19 | ) |
| Unconsolidated Joint Ventures | | | 0.49 | | | 0.64 | | | (6.73 | ) |
The spread between opening and closing rents may not be indicative of future periods, as this statistic is not computed on comparable tenant spaces, and can vary significantly from period to period depending on the total amount, location, and average size of tenant space opening and closing in the period. Rents on stores opening in 2004 were generally negotiated in a decreasing sales environment. In 2006, the releasing spread per square foot of the Unconsolidated Joint Ventures was impacted by the opening of large tenant spaces at certain centers. Additionally, average rents and releasing spreads in 2006 were impacted by the consolidation of Cherry Creek, which is included within the Consolidated Businesses as of January 1, 2006. Prior to that time, Cherry Creek was included within the Unconsolidated Joint Ventures.
Mall tenant leased space, ending occupancy, and average occupancy rates are as follows:
| | | | 2006 | | | 2005 | | | 2004 | |
All Centers: | | | | | | | | | | |
| Leased space | | | 92.5 | % | | 91.7 | % | | 90.7 | % |
| Ending occupancy | | | 91.3 | | | 90.0 | | | 89.6 | |
| Average occupancy | | | 89.2 | | | 88.9 | | | 87.4 | |
| | | | | | | | | | | |
Comparable Centers: | | | | | | | | | | |
| Leased space | | | 92.3 | % | | 91.5 | % | | 90.7 | % |
| Ending occupancy | | | 91.2 | | | 90.2 | | | 89.6 | |
| Average occupancy | | | 89.1 | | | 89.1 | | | 87.4 | |
Occupancy continued to increase during 2006, with ending occupancy increasing to 91.3%, a 1.3% increase from 90.0% in 2005. For our comparable centers, ending occupancy was 91.2%, a 1.0% increase from 90.2% in 2005. We anticipate continued occupancy growth throughout 2007, with more modest increases in the first half than in the second half of the year. Income from temporary in-line tenants, which has become an integral part of our business, continues to augment our income. Temporary tenants, defined as those with lease terms less than 12 months, are not included in occupancy or leased space statistics. As of December 31, 2006, approximately 2.2% of space was occupied by temporary tenants. Tenant bankruptcy filings as a percentage of the total number of tenant leases was 1.0% in 2006, compared to 0.4% in 2005, and 1.7% in 2004.
Seasonality
The regional shopping center industry is seasonal in nature, with mall tenant sales highest in the fourth quarter due to the Christmas season, and with lesser, though still significant, sales fluctuations associated with the Easter holiday and back-to-school events. While minimum rents and recoveries are generally not subject to seasonal factors, most leases are scheduled to expire in the first quarter, and the majority of new stores open in the second half of the year in anticipation of the Christmas selling season. Additionally, most percentage rents are recorded in the fourth quarter. Accordingly, revenues and occupancy levels are generally highest in the fourth quarter. Included in revenues are gains on sales of peripheral land and lease cancellation income that may vary significantly from quarter to quarter.
| | | Total 2006 | | | 4th Quarter 2006 | | | 3rd Quarter 2006 | | | 2nd Quarter 2006 | | | 1st Quarter 2006 | |
| | | (in thousands of dollars, except as indicated) |
| Mall tenant sales | | | 4,348,826 | | | 1,447,188 | | | 985,224 | | | 989,275 | | | 927,139 | |
| Revenues and gains on land sales and interest income: | | | | | | | | | | | | | | | | |
| Consolidated Businesses | | | 588,744 | | | 163,455 | | | 140,065 | | | 144,780 | | | 140,444 | |
| Unconsolidated Joint Ventures | | | 253,486 | | | 72,584 | | | 63,772 | | | 58,554 | | | 58,576 | |
| Occupancy: | | | | | | | | | | | | | | | | |
| Ending-comparable | | | 91.2 | % | | 91.2 | % | | 89.2 | % | | 88.7 | % | | 88.3 | % |
| Average-comparable | | | 89.1 | | | 90.4 | | | 88.9 | | | 88.6 | | | 88.4 | |
| Ending | | | 91.3 | | | 91.3 | | | 89.5 | | | 89.0 | | | 88.3 | |
| Average | | | 89.2 | | | 90.6 | | | 89.2 | | | 88.7 | | | 88.4 | |
| Leased space: | | | | | | | | | | | | | | | | |
| Comparable | | | 92.3 | % | | 92.3 | % | | 92.1 | % | | 91.6 | % | | 90.7 | % |
| All centers | | | 92.5 | | | 92.5 | | | 92.4 | | | 91.8 | | | 90.9 | |
Because the seasonality of sales contrasts with the generally fixed nature of minimum rents and recoveries, mall tenant occupancy costs (the sum of minimum rents, percentage rents, and expense recoveries) as a percentage of sales are considerably higher in the first three quarters than they are in the fourth quarter.
| | | | Total 2006 | | | 4th Quarter 2006 | | | 3rd Quarter 2006 | | | 2nd Quarter 2006 | | | 1st Quarter 2006 | |
| Consolidated Businesses: | | | | | | | | | | | | | | | | |
| Minimum rents | | | 9.1 | % | | 7.1 | % | | 9.9 | % | | 9.9 | % | | 10.5 | % |
| Percentage rents | | | 0.4 | | | 0.8 | | | 0.3 | | | 0.1 | | | 0.4 | |
| Expense recoveries | | | 4.9 | | | 4.2 | | | 4.9 | | | 5.6 | | | 4.8 | |
| Mall tenant occupancy costs | | | 14.4 | % | | 12.1 | % | | 15.1 | % | | 15.6 | % | | 15.7 | % |
| Unconsolidated Joint Ventures: | | | | | | | | | | | | | | | | |
| Minimum rents | | | 8.3 | % | | 6.4 | % | | 9.2 | % | | 9.1 | % | | 9.7 | % |
| Percentage rents | | | 0.4 | | | 0.8 | | | 0.3 | | | 0.2 | | | 0.2 | |
| Expense recoveries | | | 3.8 | | | 3.2 | | | 4.1 | | | 4.1 | | | 3.9 | |
| Mall tenant occupancy costs | | | 12.5 | % | | 10.4 | % | | 13.6 | % | | 13.4 | % | | 13.8 | % |
Results of Operations
Openings, Dispositions, and Acquisitions
During the three year period ended December 31, 2006, we completed the following shopping center openings, dispositions, and acquisitions:
Openings
Shopping Center | Date | Location | Ownership |
| The Pier Shops at Caesars | June 2006 | Atlantic City, New Jersey | (1) |
| Northlake Mall | September 2005 | Charlotte, North Carolina | Wholly-owned |
Dispositions
Shopping Center | Date | | |
| Woodland | December 2005 | 50% owned unconsolidated joint venture | |
Acquisitions
Shopping Center | Date | Acquisition | Resulting Ownership |
| International Plaza | July 2004 | Additional 23.6% interest | 50.1% owned consolidated joint venture |
| Beverly Center | January 2004 | Additional 30% interest | Wholly-owned |
| (1) | See “Planned Capital Spending-New Centers”. |
In October 2006, we purchased a 50% interest in the land under Sunvalley, which was subject to two ground leases. We placed a 6-year, $30 million interest-only, non-recourse loan on the land and swapped the rate in early January 2007 to a fixed rate of 5.95%.
In December 2005, a 50% owned unconsolidated joint venture sold its interest in Woodland for $177.4 million. Our share of proceeds was $85.4 million. We recognized a gain of $52.8 million on the transaction, representing the excess of the fair value over the net book basis of our interest in the center. Our gain on the transaction differed from the $73.4 million gain recognized by the Operating Partnership due to our $20.6 million additional basis in Woodland. The cash proceeds from the sale were used in early 2006 to acquire the land for Partridge Creek, as part of a like-kind exchange pursuant to Section 1031 of the Internal Revenue Code and the regulations thereunder ("Section 1031 like-kind exchange"). Additional proceeds were also used to purchase the land and real property improvements of the Oyster Bay development, also as part of a Section 1031 like-kind exchange, and to pay off the outstanding balance on the loan on the property.
Taubman Asia
In April 2005, we formed Taubman Asia, which is the platform for our expansion into the Asia-Pacific region. Taubman Asia is headquartered in Hong Kong and is engaged in projects that leverage our strong retail planning, design, and operational capabilities. In 2007, Taubman Asia completed the development services agreement for our involvement in New Songdo City in South Korea. Additionally, we announced our involvement in the retail component of Macao Studio City on the Cotai strip in Macao (see “Subsequent Events”).
Debt Transactions
We completed a series of debt financings in the three year period ended December 31, 2006, as follows:
| | Date | Initial Loan Balance/Facility | Stated Interest Rate | Maturity Date(1) |
| | (in millions of dollars) | |
| Taubman Land Associates (Sunvalley) | December 2006 | 30 | LIBOR+0.90% (2) | November 2012 |
| Waterside Shops at Pelican Bay | September 2006 | 165 | 5.54% | October 2016 |
The Mall at Partridge Creek construction facility (3) | September 2006 | 81 | LIBOR+1.15% | September 2010 |
TRG revolving credit facility (4) | August 2006 | 350 | LIBOR+0.70% | February 2009 |
| Cherry Creek Shopping Center | May 2006 | 280 | 5.24% | June 2016 |
| Northlake Mall | February 2006 | 216 | 5.41% | February 2016 |
| The Mall at Short Hills | December 2005 | 540 | 5.47% | December 2015 |
| The Mall at Wellington Green | May 2005 | 200 | 5.44% | May 2015 |
| TRG revolving credit facility | October 2004 | 350 | LIBOR+0.80% | February 2008 (4) |
| Northlake Mall construction facility | July 2004 | 142 | LIBOR+1.75% | August 2007 (5) |
| Stony Point Fashion Park | June 2004 | 115 | 6.24% | June 2014 |
| The Mall at Oyster Bay facility | May 2004 | 62 | LIBOR+2.00% | March 2006 (6) |
| The Mall at Wellington Green | April 2004 | 140 | LIBOR+1.50% | May 2007 (7) |
| Dolphin Mall | February 2004 | 145 | LIBOR+2.15% | February 2007 (8) |
| Beverly Center | January 2004 | 348 | 5.28% | February 2014 |
| (1) | Excludes any options to extend the maturities (see the footnotes to our financial statements regarding extension options). |
| (2) | The loan is swapped at 5.95% (5.05% swap rate plus 0.90% credit spread) from January 2, 2007 through the term of the loan. |
| (3) | See "Liquidity and Capital Resources - Contractual Obligations". |
| (4) | TRG revolving credit facility was amended in August 2006. |
| (5) | The loan was repaid in December 2005. |
| (6) | The loan was repaid in February 2006. |
| (7) | The loan was repaid in May 2005. |
| (8) | The remaining balance on the loan was refinanced with the TRG revolving credit facility in August 2006. |
We paid off the remaining $144 million balance on the loans on The Shops at Willow Bend (Willow Bend) when they became prepayable without penalty in February 2006. We wrote off the remaining $2.1 million of financing costs associated with the Willow Bend loans at that time. Proceeds from the August 2006 amendment to our revolving credit facility were used to refinance the remaining $140 million balance on the loan on Dolphin when it became prepayable without penalty in August 2006. We wrote off $1.0 million of financing costs related to the Dolphin loan at that time. Under the revised terms, borrowings under the line of credit are primary obligations of the entities owning Dolphin, Fairlane, and Twelve Oaks, which are collateral for the line of credit. The Operating Partnership and the entities owning Fairlane and Twelve Oaks are guarantors under the credit agreement.
Proceeds from the December 2005 financing on The Mall at Short Hills (Short Hills) were used to pay down the existing 6.7%, $260 million loan on the center, the Northlake construction loan and our revolver. We incurred charges of $10.9 million during the fourth quarter of 2005 in connection with a prepayment premium for the existing Short Hills loan and the write-off of the remaining financing costs for the Short Hills and Northlake loans. We also wrote off $1.8 million of financing costs related to the modification of the loan on The Mall at Oyster Bay (Oyster Bay), which we repaid in February 2006.
Equity Transactions
We also completed a series of equity transactions in the three year period ended December 31, 2006, as follows:
| | # of shares/units | Amount | Price per share/unit | Date |
| | (in millions of dollars) | |
Redemptions and Repurchases: | | | | |
Redemption of Series I Cumulative Redeemable Preferred Stock (1) | 4,520,000 | 113.0 | $25.00 | June 2006 |
Redemption of Series A Cumulative Redeemable Preferred Stock (2) | 4,520,000 | 113.0 | 25.00 | May 2006 |
Redemption of Series A Cumulative Redeemable Preferred Stock (3) | 3,480,000 | 87.0 | 25.00 | July 2005 |
Redemption of Series C and D Preferred Partnership Equity (4) | | 100.0 | | November 2004 |
Stock buybacks (5) | 2,447,781 | 50.2 | 20.50 | April-May 2004 |
| | | | | |
Issuances: | | | | |
Issuance of Series I Cumulative Redeemable Preferred Stock (6) | 4,520,000 | 113.0 | 25.00 | May 2006 |
Issuance of Series H Cumulative Redeemable Preferred Stock (7) | 3,480,000 | 87.0 | 25.00 | July 2005 |
Issuance of Series G Cumulative Redeemable Preferred Stock (8) | 4,000,000 | 100.0 | 25.00 | November 2004 |
Private placement of 8.2% Series F Cumulative Redeemable Preferred Partnership Equity | | 30.0 | | May 2004 |
TRG units issued in connection with acquisition of additional interest in Beverly Center (9) | 276,724 | 7.6 | 27.50 | January 2004 |
| (1) | A $0.6 million charge was recognized upon redemption of this preferred stock, comprised of the difference between the redemption price ($113.0 million) and its book value ($112.4 million). |
| (2) | A $4.0 million charge was recognized upon redemption of this preferred stock, comprised of the difference between the redemption price ($113.0 million) and its book value ($109.0 million). |
| (3) | A $3.1 million charge was recognized upon redemption of this preferred stock, comprised of the difference between the redemption price ($87.0 million) and its book value ($83.9 million). |
| (4) | A $2.7 million charge was recognized upon redemption of this preferred equity, comprised of the difference between the redemption price ($100.0 million) and its book value ($97.3 million). |
| (5) | For each common share repurchased, a unit of TRG partnership interest is similarly redeemed. |
| (6) | Proceeds were used to redeem $113 million of our remaining 8.30% Series A Cumulative Redeemable Preferred Stock. |
| (7) | Proceeds were used to redeem $87 million of our outstanding $200 million 8.30% Series A Cumulative Redeemable Preferred Stock. |
| (8) | Proceeds were used to redeem all of the outstanding TRG 9% Series C and D Cumulative Redeemable Preferred Equity for $100 million. |
| (9) | Reflects units of partnership interest issued without any corresponding change in our common shares outstanding. With these changes in partnership units outstanding, corresponding changes may also occur in the Series B Preferred Stock (see Note 16 to our financial statements regarding this relationship). |
In December 2005, our Board of Directors authorized the purchase of up to $50 million of our common stock on the open market. As of December 31, 2006, we had not purchased any shares or redeemed any units under this program. Repurchases of common stock will be financed through general corporate funds, including equity issuances, and through borrowings under existing lines of credit.
Repurchases of common stock in 2004 were under a previous buyback program. As of December 31, 2004, the maximum amount authorized under this program had been repurchased.
GMPT Portfolio and Restructuring
In October 2004, The Mills Corporation finalized its acquisition of 50% interests in nine of General Motors Pension Trusts’ (GMPT) shopping centers, completing a recapitalization of GMPT’s mall portfolio. We reached an agreement with GMPT to cease management of these centers, effective November 1, 2004. We recognized a restructuring charge of $5.7 million during the fourth quarter of 2004 relating to the termination of these contracts. Substantially all of this charge represented employee severance payments.
Other Income
We have certain additional sources of income beyond our rental revenues, recoveries from tenants, and revenues from management, leasing, and development services, as summarized in the following table. Lease cancellation revenue is dependent on the overall economy and performance of particular retailers in specific locations and can vary significantly. Gains on peripheral land sales can also vary significantly from year-to-year, depending on the results of negotiations with tenants, counterparties, and potential purchasers of land, as well as the timing of the transactions. In 2007, we estimate our share of lease cancellation income to be approximately $6 million to $7 million and gains on land sales to be approximately $3 million to $4 million.
| | | 2006 | 2005 | 2004 |
| | | | Consolidated Businesses | | | Unconsolidated Joint Ventures | | | Consolidated Businesses | | | Unconsolidated Joint Ventures | | | Consolidated Businesses | | | Unconsolidated Joint Ventures | |
| | | (Operating Partnership’s share in millions of dollars) |
| Other Income: | | | | | | | | | | | | | | | | | | | |
| Shopping center related revenues | | | 21.9 | | | 2.6 | | | 20.7 | | | 3.2 | | | 15.5 | | | 3.0 | |
| Lease cancellation revenue | | | 10.5 | | | 2.8 | | | 6.5 | | | 1.4 | | | 7.5 | | | 1.7 | |
| | | | 32.4 | | | 5.4 | | | 27.2 | | | 4.6 | | | 22.9 | | | 4.7 | |
| Gains on Land Sales and Interest Income: | | | | | | | | | | | | | | | | | | | |
| Gains on sales of peripheral land | | | 4.1 | | | | | | 4.4 | | | | | | 6.4 | | | | |
| Interest income | | | 5.2 | | | 0.6 | | | 1.6 | | | 0.4 | | | 1.1 | | | 0.1 | |
| | | | 9.3 | | | 0.6 | | | 6.0 | | | 0.4 | | | 7.5 | | | 0.1 | |
(1) Amounts in this table may not add due to rounding.
Subsequent Events
In January 2007, we assumed full management and leasing responsibility of The Pier. We are in final negotiations to increase our ownership percentage in the center from 30% to 50% (see “Planned Capital Spending- New Centers”).
Also in January 2007, Taubman Asia completed the development services agreement for a 1.2 million square foot retail and entertainment complex in New Songdo City, Incheon, South Korea. The shopping complex is scheduled to open in early 2010, with construction beginning in 2007. We have negotiated the opportunity to invest in a portion of the broader project, which will include not only retail, but also office, hotel, and residential uses. We anticipate finalizing our decision on this investment in 2007. In January 2007, we announced our involvement in the retail component of Macao Studio City on the Cotai Strip in Macao. Taubman Asia has signed a term sheet to acquire a minority position in the retail component of the project and will provide development, leasing, and management services, subject to definitive agreements to be completed in the first half of 2007.
In addition, in January 2007, we announced our involvement as a third party leasing agent for a lifestyle center in the city of North Las Vegas, Nevada. This is a mixed use project that will include retail, dining, and entertainment of up to 1.3 million square feet and a residential component consisting of approximately 800 units. The shopping center will open in late 2008. The developer of the residential component is an affiliate of the Taubman family.
Also in January 2007, we acquired land for future development for $15.5 million.
Application of Critical Accounting Policies
The preparation of financial statements in conformity with accounting principles generally accepted in the United States of America requires management to make estimates and assumptions that affect the financial statements and disclosures. Some of these estimates and assumptions require application of difficult, subjective, and/or complex judgment, often about the effect of matters that are inherently uncertain and that may change in subsequent periods. We are required to make such estimates and assumptions when applying the following accounting policies.
Valuation of Shopping Centers
All properties, including those under construction and/or owned by joint ventures, are reviewed for impairment when events or changes in circumstances indicate that their carrying value may not be recoverable. Impairment of a shopping center owned by consolidated entities would be recognized when the sum of expected cash flows (undiscounted and without interest charges) is less than the carrying value of the property. Other than temporary impairment of an investment in an Unconsolidated Joint Venture is recognized when the carrying value is not considered recoverable based on evaluation of the severity and duration of the decline in value, including the results of discontinued cash flow and other valuation techniques. The expected cash flows of a shopping center are dependent on estimates and other factors subject to change, including (1) changes in the national, regional, and/or local economic climates, (2) competition from other shopping centers, stores, clubs, mailings, and the internet, (3) increases in operating costs, (4) bankruptcy and/or other changes in the condition of third parties, including anchors and tenants, and (5) expected holding period. These factors could cause our expected future cash flows from a shopping center to change, and, as a result, an impairment could be considered to have occurred. To the extent an impairment has occurred, the excess carrying value of the asset over its estimated fair value is charged against operations. There were no impairment charges recognized in the periods covered within this Annual Report. As of December 31, 2006, the consolidated net book value of our properties was $2.6 billion, representing over 90% of our consolidated assets. We also have varying ownership percentages in the properties of Unconsolidated Joint Ventures with a total combined net book value of $0.8 billion. These amounts include certain development costs that are described in the policy that follows.
Capitalization of Development Costs
In developing shopping centers, we typically obtain land or land options, zoning and regulatory approvals, anchor commitments, and financing arrangements during a process that may take several years and during which we may incur significant costs. We capitalize all development costs once it is considered probable that a project will reach a successful conclusion. Prior to this time, we expense all costs relating to a potential development, including payroll, and include these costs in Funds from Operations (see "Presentation of Operating Results").
Many factors in the development of a shopping center are beyond our control, including (1) changes in the national, regional, and/or local economic climates, (2) competition from other shopping centers, stores, clubs, mailings, and the internet, (3) availability and cost of financing, (4) changes in regulations, laws, and zoning, and (5) decisions made by third parties, including anchors. These factors could cause our assessment of the probability of a development project reaching a successful conclusion to change. If a project subsequently was considered less than probable of reaching a successful conclusion, a charge against operations for previously capitalized development costs would occur.
Our approximately $129.3 million balance of development pre-construction costs as of December 31, 2006 consists primarily of costs relating to our Oyster Bay project in the Town of Oyster Bay, New York. See “Liquidity and Capital Resources - Planned Capital Spending” regarding the status of this project.
Valuation of Accounts Receivable
Rents and expense recoveries from tenants are our principal source of income; they represent over 90% of our revenues. In generating this income, we will routinely have accounts receivable due from tenants. The collectibility of tenant receivables is affected by bankruptcies, changes in the economy, and the ability of the tenants to perform under the terms of their lease agreements. While we estimate potentially uncollectible receivables and provide for them through charges against income, actual experience may differ from those estimates. Also, if a tenant were not able to perform under the terms of its lease agreement, receivable balances not previously provided for may be required to be charged against operations. Bad debt expense was less than 1% of total revenues in 2006, while bankruptcy filings affected 1% of tenant leases during the year. Since 1991, the annual provision for losses on accounts receivable has been less than 2% of annual revenues.
Valuation of Deferred Tax Assets
Our taxable REIT subsidiaries (TRSs) currently have deferred tax assets, reflecting net operating loss carryforwards and the impact of temporary differences between the amounts of assets and liabilities for financial reporting purposes and the bases of such assets and liabilities as measured by tax laws. Our temporary differences primarily relate to deferred compensation and depreciation. We reduce our deferred tax assets through valuation allowances to the amount where realization is more likely than not assured, considering all available evidence, including expected future taxable earnings and potential tax planning strategies. Expected future taxable earnings and the implementation of tax planning strategies require certain significant judgments and estimates, including those relating to our management company's profitability, the timing and amounts of gains on land sales, the profitability of our Asian operations, and other factors affecting the results of operations of our TRSs. Changes in any of these factors could cause our estimates of the realization of deferred tax assets to change materially. As of December 31, 2006, we had a consolidated gross deferred tax asset of $8.9 million, reduced to a net deferred tax asset of $3.3 million by a valuation allowance of $5.6 million.
Valuations for Acquired Property and Intangibles
Upon acquisition of an investment property, including that of an additional interest in an asset already partially owned, we make an assessment of the valuation and composition of assets and liabilities acquired. These assessments consider fair values of the respective assets and liabilities and are determined based on estimated future cash flows using appropriate discount and capitalization rates and other commonly accepted valuation techniques. The estimated future cash flows that are used for this analysis reflect the historical operations of the property, known trends and changes expected in current market and economic conditions which would impact the property’s operations, and our plans for such property. These estimates of cash flows and valuations are particularly important given the application of FASB Statement Nos. 141 and 142 for the allocation of purchase price between land, building and improvements, and other identifiable intangibles.
Adoption of New Accounting Pronouncements in 2006
Adoption of Staff Accounting Bulletin No. 108
In September 2006, the Securities and Exchange Commission published Staff Accounting Bulletin No. 108 (SAB 108) “Considering the Effects of Prior Year Misstatements When Quantifying Misstatements in Current Year Financial Statements.” The interpretations in SAB 108 express the SEC’s staff’s views regarding the process of quantifying financial statement misstatements. The staff’s interpretations resulted from their awareness of a diversity in practice as to how the effect of prior year errors were considered in relation to current year financial statements. Through SAB 108, the staff communicated its belief that allowing prior year errors to remain unadjusted on the balance sheet is not in the best interest of the users of financial statements. SAB 108 became effective for us in the fourth quarter of 2006.
In adopting SAB 108, we changed our method of evaluating financial statement misstatements from a “rollover” (income statement-oriented) approach to SAB 108’s “dual-method” (both an income statement and balance sheet-oriented) approach. In doing so, we identified three misstatements previously considered immaterial to all previous periods under the rollover method but material when evaluated together under the dual-method, as described below. These misstatements were corrected upon adoption of SAB 108.
Accounting for Cherry Creek Shopping Center Ground Rent Prior to 1999
Prior to 1999, Cherry Creek, a venture previously accounted for under the equity method, recognized ground rentals under its 99 year ground lease on a cash basis instead of the straightline method required by Statement of Financial Accounting Standards No. 13, “Accounting for Leases”. This error resulted in us overstating our cumulative equity in the net income of Cherry Creek by a total of $3.5 million from our 1992 acquisition of an interest in the Operating Partnership through December 31, 2005. The maximum misstatement of our equity in the net income of Cherry Creek in any individual year in this period under the rollover method was $0.3 million.
We began consolidating Cherry Creek on January 1, 2006 as a result of adopting EITF 04-5. As a result of the correction of the above error, the cumulative effect of a change in accounting principle upon adoption of EITF 04-5, assets, and liabilities recognized upon the consolidation of Cherry Creek were increased by $7.9 million, $8.3 million and $19.7 million, respectively. Prior to 2006, we accounted for our investment in Cherry Creek under the equity method.
Recognition of Payroll Costs
We previously recognized our payroll costs in a manner that corresponded to our biweekly pay periods, which do not necessarily end on the last day of the calendar year. Differences caused by not strictly recognizing payroll on a calendar year basis, while previously adjusted on a periodic basis, have resulted in overstatements of net income by a total of $1.0 million over the last decade, with the maximum misstatement in any individual year computed under the rollover method being $0.1 million.
Arizona Mills
In 2006, The Mills Corporation (Mills), which manages our 50% unconsolidated joint venture, Arizona Mills, advised us that Mills had identified errors in prior year financial statements, primarily relating to the timing of writeoffs of tenant allowances, that relate to years prior to 2006. We have not yet received audited financial statements for any period after 2004 from Mills and amounts identified as errors may change as a result of the eventual completion of the Arizona Mills 2005 audit. However, based on the information we have received from Mills, we have determined that the cumulative impact of our share of prior years’ errors identified by Mills to date is an overstatement of our equity by $1.3 million.
Cumulative Effect of Adoption of SAB 108
As a result of applying the guidance in SAB 108, during the year ended December 31, 2006, we recorded a $5.9 million reduction to our shareholders’ equity account (dividends in excess of net income) in our opening balance sheet to correct for the effect of the errors associated with the accounting for Cherry Creek’s ground rent prior to 1999, the recognition of payroll costs, and our share of Arizona Mills’s errors identified by Mills, described above.
Adoption of EITF 04-5
Under guidance in EITF 04-5 "Determining Whether a General Partner, or the General Partners as a Group, Controls a Limited Partnership or Similar Entity When the Limited Partners Have Certain Rights" and Statement of Position 78-9, "Accounting for Investments in Real Estate Ventures" (SOP 78-9) as amended by FASB Staff Position 78-9-1 and the corresponding changes and considerations surrounding control, we began consolidating the entity that owns Cherry Creek as of January 1, 2006. This entity was previously accounted for under the equity method in accordance with the provisions of SOP 78-9. As of January 1, 2006, the impact to the balance sheet was an increase in assets of approximately $136 million and liabilities of approximately $196 million, and a $60 million reduction of beginning equity representing the cumulative effect of change in accounting principle.
New Accounting Pronouncements
In December 2006, the FASB issued Staff Position No. EITF 00-19-2, “Accounting for Registration Payment Arrangements.” This Staff Position requires companies that agree to register securities recognize a liability if a payment to investors for failing to fulfill the agreement is probable and its amount can be reasonably estimated. This Staff Position is effective for fiscal years beginning after December 15, 2006. We do not anticipate that the adoption of this Staff Position will have a material effect on our results of operations or financial position.
In September 2006, the FASB issued Statement No. 157 “Fair Value Measurements.” This Statement defines fair value, establishes a framework for measuring fair value in generally accepted accounting principles, and expands disclosures about fair value measurements. This Statement applies to accounting pronouncements that require or permit fair value measurements, except for share-based payments transactions under FASB Statement No. 123. This Statement is effective for financial statements issued for fiscal years beginning after November 15, 2007. As Statement No. 157 does not require any new fair value measurements or remeasurements of previously computed fair values, we not believe adoption of this Statement will have a material effect on our financial statements.
In June 2006, the FASB issued Interpretation No. 48, “Uncertainty in Income Taxes - an interpretation of FASB Statement No. 109.” This Interpretation defines a recognition threshold and measurement attribute for the financial statement recognition and measurement of a tax position taken or expected to be taken in a tax return. The Interpretation also provides guidance on derecognition, classification, interest and penalties, accounting in interim periods, disclosure, and transition. This Interpretation is effective for fiscal years beginning after December 15, 2006. We do not anticipate that the adoption of this Statement will have a material effect on our results of operations or financial position.
Presentation of Operating Results
The following tables contain the operating results of our Consolidated Businesses and the Unconsolidated Joint Ventures. Income allocated to the minority partners in the Operating Partnership and preferred interests is deducted to arrive at the results allocable to our common shareowners. Because the net equity of the Operating Partnership is less than zero, the income allocated to the minority partners is equal to their share of distributions. The net equity of these minority partners is less than zero due to accumulated distributions in excess of net income and not as a result of operating losses. Distributions to partners are usually greater than net income because net income includes non-cash charges for depreciation and amortization. Amounts allocable to minority partners in certain consolidated joint ventures are added back or deducted to arrive at our net results. Our average ownership percentage of the Operating Partnership was 65% in 2006, 62% in 2005, and 61% in 2004.
The results of Cherry Creek are presented within the Consolidated Businesses for periods beginning January 1, 2006, as a result of our adoption of EITF 04-5. The results of International Plaza are presented within the Consolidated Businesses for periods beginning July 1, 2004, as a result of our acquisition of a controlling interest in the center. Prior to the respective adoption date and acquisition date, these centers are included within the Unconsolidated Joint Ventures.
The accounts of The Pier, which opened in June 2006, are included within the Unconsolidated Joint Ventures beginning in 2006. As of December 31, 2006, we have a $4 million investment in The Pier. The joint venture partner has guaranteed 100% of the outstanding construction loan and is responsible for funding the completion of development and initial leasing costs of the center and all operating requirements of the center prior to stabilization of the center.
Prior year information for which errors were identified and corrected through an adjustment of beginning (January 1, 2006) shareholders’ equity pursuant to SAB 108 has not been adjusted.
Use of Non-GAAP Measures
The operating results in the following tables include the supplemental earnings measures of Beneficial Interest in EBITDA and Funds from Operations (FFO). Beneficial Interest in EBITDA represents the Operating Partnership’s share of the earnings before interest and depreciation and amortization, excluding gains on sales of depreciated operating properties of its consolidated and unconsolidated businesses. We believe Beneficial Interest in EBITDA provides a useful indicator of operating performance, as it is customary in the real estate and shopping center business to evaluate the performance of properties on a basis unaffected by capital structure.
The National Association of Real Estate Investment Trusts (NAREIT) defines FFO as net income (loss) (computed in accordance with Generally Accepted Accounting Principles (GAAP)), excluding gains (or losses) from extraordinary items and sales of properties, plus real estate related depreciation and after adjustments for unconsolidated partnerships and joint ventures. We believe that FFO is a useful supplemental measure of operating performance for REITs. Historical cost accounting for real estate assets implicitly assumes that the value of real estate assets diminishes predictably over time. Since real estate values instead have historically risen or fallen with market conditions, we and most industry investors and analysts have considered presentations of operating results that exclude historical cost depreciation to be useful in evaluating the operating performance of REITs. We primarily use FFO in measuring performance and in formulating corporate goals and compensation.
Our presentations of EBITDA and FFO are not necessarily comparable to the similarly titled measures of other REITs due to the fact that not all REITs use the same definitions. These measures should not be considered alternatives to net income (loss) or as an indicator of our operating performance. Additionally, neither represents cash flows from operating, investing or financing activities as defined by GAAP. Reconciliations of Net Income (Loss) Allocable to Common Shareowners to Funds from Operations and Net Income to Beneficial Interest in EBITDA are presented following the Comparison of 2005 to 2004. See the following section regarding certain presentation changes affecting EBITDA and FFO.
Presentation Changes
As previously reported for 2005, because of a change in our business practice to offer our tenants the option to pay a fixed charge or pay their share of common area maintenance (CAM) costs and the related change to contractual terms of leases, we began adding back in the fourth quarter of 2005 all depreciation on CAM assets to calculate EBITDA and FFO. Additionally, we have reclassified depreciation on CAM assets from recoverable expenses to depreciation and amortization expense for all periods presented.
Also, as a result of this change in our business practice, we modified our estimated useful lives of CAM assets that are recoverable from tenants as of January 1, 2006. The change in useful lives better aligns the depreciation of common area assets with our lease portfolio. The change in estimate did not have a material effect on the current results of operations but could be material in future periods. The Operating Partnership's share of depreciation on CAM capital expenditures was $15.7 million, $15.7 million, and $14.2 million in 2006, 2005, and 2004, respectively.
During 2006, we began recognizing revenue for marketing and promotion services at the gross amount billed to tenants, rather than a net amount retained (that is, the amount billed to the tenants less the related costs incurred). Revenues are now included in recoveries from tenants and the related expenses in other operating expense. This presentation change was made as a result of our recent offering to tenants of an option to pay fixed amounts for marketing and promotion of the shopping centers. In evaluating the accounting for marketing and promotion services, we considered that there may no longer be a direct relationship between tenant billings and the marketing and promotion costs incurred, as well as the fact that we are the primary obligor on the costs incurred. Historically, revenues from marketing and promotion services have been equal to costs incurred.
In addition, we now separately present gains on peripheral land sales and interest income in the income statement following revenues and expenses.
Prior year revenues and expenses in the following tables have been reclassified as described above to be consistent with the 2006 presentation.
Comparison of 2006 to 2005
The following table sets forth operating results for 2006 and 2005, showing the results of the Consolidated Businesses and Unconsolidated Joint Ventures:
| | | 2006 | 2005 |
| | | CONSOLIDATED BUSINESSES | | | UNCONSOLIDATED JOINT VENTURES AT 100%(1) | | | CONSOLIDATED BUSINESSES | | | UNCONSOLIDATED JOINT VENTURES AT 100%(1) | |
(in millions of dollars)| REVENUES: | | | | | | | | | | | | | |
Minimum rents | | | 311.2 | | | 148.8 | | | 262.1 | | | 184.5 | |
Percentage rents | | | 14.7 | | | 8.0 | | | 9.8 | | | 8.1 | |
Expense recoveries | | | 206.2 | | | 85.6 | | | 164.6 | | | 104.1 | |
Management, leasing and development services | | | 11.8 | | | | | | 13.8 | | | | |
Other | | | 35.4 | | | 9.7 | | | 29.0 | | | 8.7 | |
| Total revenues | | | 579.3 | | | 252.2 | | | 479.4 | | | 305.4 | |
| | | | | | | | | | | | | | |
| EXPENSES: | | | | | | | | | | | | | |
| Maintenance, taxes, and utilities | | | 152.9 | | | 64.3 | | | 126.4 | | | 71.3 | |
| Other operating | | | 71.6 | | | 26.3 | | | 57.7 | | | 29.6 | |
| Management, leasing and development services | | | 5.7 | | | | | | 9.1 | | | | |
| General and administrative | | | 30.3 | | | | | | 27.7 | | | | |
Interest expense (2) | | | 128.6 | | | 57.6 | | | 121.6 | | | 67.6 | |
Depreciation and amortization (3) (4) | | | 138.0 | | | 45.8 | | | 128.4 | | | 54.8 | |
| Total operating expenses | | | 527.1 | | | 193.9 | | | 470.9 | | | 223.3 | |
| | | | | | | | | | | | | | |
| Gains on land sales and interest income | | | 9.5 | | | 1.3 | | | 6.5 | | | 0.8 | |
| | | | 61.6 | | | 59.6 | | | 15.0 | | | 82.9 | |
Equity in income of Unconsolidated Joint Ventures (4) (5) | | | 33.5 | | | | | | 42.5 | | | | |
Income before gain on disposition of interest in center and minority and preferred interests | | | 95.1 | | | | | | 57.4 | | | | |
Gain on disposition of interest in center (5) | | | | | | | | | 52.8 | | | | |
| Minority and preferred interests: | | | | | | | | | | | | | |
| TRG preferred distributions | | | (2.5 | ) | | | | | (2.5 | ) | | | |
| Minority share of consolidated joint ventures | | | (10.7 | ) | | | | | (0.2 | ) | | | |
| Minority share of income of TRG | | | (22.8 | ) | | | | | (40.4 | ) | | | |
| Distributions less than (in excess of) minority share of income | | | (14.1 | ) | | | | | 4.5 | | | | |
| Net income | | | 45.1 | | | | | | 71.7 | | | | |
Preferred dividends (6) | | | (23.7 | ) | | | | | (27.6 | ) | | | |
| Net income (loss) allocable to common shareowners | | | 21.4 | | | | | | 44.1 | | | | |
| | | | | | | | | | | | | | |
| SUPPLEMENTAL INFORMATION: | | | | | | | | | | | | | |
| EBITDA - 100% | | | 328.2 | | | 162.9 | | | 265.0 | | | 205.3 | |
| EBITDA - outside partners' share | | | (33.2 | ) | | (71.4 | ) | | (14.9 | ) | | (91.9 | ) |
| Beneficial interest in EBITDA | | | 295.0 | | | 91.6 | | | 250.1 | | | 113.5 | |
| Beneficial interest expense | | | (115.8 | ) | | (31.2 | ) | | (116.1 | ) | | (37.6 | ) |
| Non-real estate depreciation | | | (2.9 | ) | | | | | (2.1 | ) | | | |
| Preferred dividends and distributions | | | (26.2 | ) | | | | | (30.1 | ) | | | |
| Funds from Operations contribution | | | 150.0 | | | 60.4 | | | 101.8 | | | 75.9 | |
| (1) | With the exception of the Supplemental Information, amounts include 100% of the Unconsolidated Joint Ventures. Amounts are net of intercompany transactions. The Unconsolidated Joint Ventures are presented at 100% in order to allow for measurement of their performance as a whole, without regard to our ownership interest. In our consolidated financial statements, we account for investments in the Unconsolidated Joint Ventures under the equity method. |
| (2) | Interest expense for 2006 includes charges of $3.1 million in connection with the write-off of financing costs related to the respective pay off and refinancing of the loans on Willow Bend and Dolphin when the loans became prepayable without penalty, in the first and third quarters of 2006, respectively. Interest expense for 2005 includes a $12.7 million charge incurred in connection with a prepayment premium and the write-off of financing costs related to the refinancing of Short Hills, the pay-off of the Northlake loan, and the debt modifications in connection with the pay-off of the Oyster Bay loan. |
| (3) | Included in depreciation and amortization of the Consolidated Businesses and Unconsolidated Joint Ventures (at 100%) are $13.4 million and $6.7 million, respectively, of depreciation of center replacement assets for 2006, and $11.5 million and $8.8 million, respectively, for 2005. |
| (4) | Amortization of the additional basis included in depreciation and amortization was $4.9 million and $4.3 million in 2006 and 2005, respectively. Also, amortization of our additional basis in the Operating Partnership included in equity in income of Unconsolidated Joint Ventures was $1.9 million and $3.0 million in 2006 and 2005, respectively. |
| (5) | During 2005, a 50% owned unconsolidated joint venture sold its interest in Woodland. Our equity in the gain on the sale is separately presented on the income statement, and is therefore excluded from the equity in income of Unconsolidated Joint Ventures line item. |
| (6) | Preferred dividends for 2006 include $4.7 million of charges recognized in connection with the redemption of the remaining Series A and Series I Preferred Stock. Preferred dividends for 2005 include a $3.1 million charge recognized in connection with the partial redemption of the Series A Preferred Stock. |
| (7) | Certain reclassifications have been made to prior year information to conform to current year classifications. Amounts in this table may not add due to rounding. |
Consolidated Businesses
Total revenues for the year ended December 31, 2006 were $579.3 million, a $99.9 million or 20.8% increase over 2005. Minimum rents increased $49.1 million, primarily due to Cherry Creek, which we began consolidating in 2006 upon our adoption of EITF 04-5, and the September 2005 opening of Northlake. Minimum rents also increased due to tenant rollovers. Percentage rents increased due to higher tenant sales and Cherry Creek. Expense recoveries increased primarily due to Cherry Creek and Northlake, and increases in recoverable costs. Management, leasing, and development revenue decreased primarily due to a reduction in reimbursable third party costs, offset by increased revenues related to services from certain contracts. We expect that management, leasing, and development revenue, less related expenses, will be in the range of $6 million to $7 million in 2007. Other income increased primarily due to Cherry Creek, Northlake, and increases in lease cancellation revenue.
Total expenses were $527.1 million, a $56.2 million or 11.9% increase from 2005. Maintenance, taxes, and utilities expense increased primarily due to Cherry Creek, Northlake, and increases in maintenance costs, property taxes, and electricity expense at certain centers. Other operating expense increased primarily due to Cherry Creek and Northlake, as well as increases in bad debt expense, pre-development costs, and professional fees. We expect that pre-development costs for both our domestic and non-U.S. projects, which were $10.1 million in 2006, will be between $10 million and $11 million in 2007. Management, leasing, and development expense decreased primarily due to a reduction in reimbursable third party costs. General and administrative expense increased primarily due to increases in compensation expenses, including bonus expense and the mark-to-market of long term grants that fluctuate with our stock price, which were partially offset by decreased severance costs. We expect that general and administrative expenses will be approximately $7.5 million for each quarter of 2007. Interest expense increased due to Cherry Creek, Northlake, the higher balance on the refinancing of Short Hills, and increases in floating interest rates. These increases were partially offset by the pay-off of the Willow Bend and Oyster Bay loans and reduced rates on refinancings. Interest expense in 2006 also included the write-off of financing costs related to the respective pay-off and refinancing of the loans on Willow Bend and Dolphin, while interest expense in 2005 included charges incurred in connection with a prepayment premium and the write-off of financing costs related to the refinancing of Short Hills, the pay-off of the Northlake loan and a debt modification in connection with the pay-off of the Oyster Bay loan. Depreciation expense increased primarily due to Cherry Creek and Northlake, which were partially offset by a decrease due to fully depreciated assets at certain centers and changes in depreciable lives of tenant and anchor allowances in connection with early terminations during 2005.
Gains on land sales and interest income increased due to higher interest rates and average cash balances in 2006, which were partially offset by a decrease in gains on peripheral land sales.
Unconsolidated Joint Ventures
Total revenues for the year ended December 31, 2006 were $252.2 million, a $53.2 million or 17.4% decrease from 2005. Minimum rents decreased $35.7 million, primarily due to the consolidation of Cherry Creek in 2006 and the sale of Woodland in December 2005, which were partially offset by the opening of The Pier in June 2006, increases in occupancy, and tenant rollovers. Percentage rents remained relatively flat, with decreases due to Cherry Creek, offset by percentage rent from increased tenant sales. Expense recoveries decreased primarily due to Cherry Creek and Woodland, which were partially offset by increased recoverable costs at certain centers and The Pier. Other income increased due to increases in lease cancellation income, which were partially offset by Cherry Creek and Woodland.
Total expenses decreased by $29.4 million to $193.9 million for the year ended December 31, 2006. Maintenance, taxes, and utilities expenses decreased primarily due to Cherry Creek and Woodland, which were partially offset by The Pier and increases in maintenance costs and electricity expense at certain centers. Other operating expense decreased primarily due to Cherry Creek, Woodland, and decreases in professional fees, which were partially offset by increases related to The Pier and bad debt expense. Interest expense decreased due to Cherry Creek, which was partially offset by The Pier and the new financing of Waterside. Depreciation expense decreased primarily due to Cherry Creek and Woodland, which was partially offset by The Pier.
As a result of the foregoing, income of the Unconsolidated Joint Ventures decreased by $23.3 million to $59.6 million. Our equity in income of the Unconsolidated Joint Ventures was $33.5 million, a $9.0 million decrease from 2005.
Net Income
Our income before the gain on disposition of our interest in Woodland and minority and preferred interests increased by $37.7 million to $95.1 million for 2006. In 2005, we recognized our $52.8 million share of the gain on the disposition of Woodland. Minority share of income of consolidated joint ventures increased due to Cherry Creek (see "Presentation of Operating Results"). Preferred dividends in 2006 include $4.7 million of charges related to the redemption of the remaining Series A and Series I Preferred Stock. Preferred dividends in 2005 include a $3.1 million charge related to the partial redemption of the Series A Preferred Stock (see “Equity Transactions”). After allocation of income to minority and preferred interests, the net income allocable to common shareowners for 2006 was $21.4 million compared to $44.1 million in 2005.
Comparison of 2005 to 2004
The following table sets forth operating results for 2005 and 2004, showing the results of the Consolidated Businesses and Unconsolidated Joint Ventures:
| | | 2005 | 2004 |
| | | CONSOLIDATED BUSINESSES | | | UNCONSOLIDATED JOINT VENTURES AT 100%(1) | | | CONSOLIDATED BUSINESSES | | | UNCONSOLIDATED JOINT VENTURES AT 100%(1) | |
(in millions of dollars)
| REVENUES: | | | | | | | | | | | | | |
Minimum rents | | | 262.1 | | | 184.5 | | | 235.1 | | | 195.0 | |
Percentage rents | | | 9.8 | | | 8.1 | | | 6.3 | | | 6.5 | |
Expense recoveries | | | 164.6 | | | 104.1 | | | 150.7 | | | 110.1 | |
Management, leasing and development services | | | 13.8 | | | | | | 21.3 | | | | |
Other | | | 29.0 | | | 8.7 | | | 23.4 | | | 9.5 | |
| Total revenues | | | 479.4 | | | 305.4 | | | 436.8 | | | 321.2 | |
| | | | | | | | | | | | | | |
| EXPENSES: | | | | | | | | | | | | | |
| Maintenance, taxes, and utilities | | | 126.4 | | | 71.3 | | | 118.4 | | | 76.0 | |
| Other operating | | | 57.7 | | | 29.6 | | | 51.5 | | | 30.9 | |
| Restructuring loss | | | | | | | | | 5.7 | | | | |
| Costs related to unsolicited tender offer, net of recoveries | | | | | | | | | (1.0 | ) | | | |
| Management, leasing and development services | | | 9.1 | | | | | | 17.5 | | | | |
| General and administrative | | | 27.7 | | | | | | 26.6 | | | | |
Interest expense (2) | | | 121.6 | | | 67.6 | | | 95.9 | | | 74.0 | |
Depreciation and amortization (3) (4) | | | 128.4 | | | 54.8 | | | 110.2 | | | 60.0 | |
| Total expenses | | | 470.9 | | | 223.3 | | | 424.8 | | | 240.9 | |
| | | | | | | | | | | | | | |
| Gains on land sales and interest income | | | 6.5 | | | 0.8 | | | 7.9 | | | 0.2 | |
| | | | 15.0 | | | 82.9 | | | 19.9 | | | 80.6 | |
Equity in income of Unconsolidated Joint Ventures (4) (5) | | | 42.5 | | | | | | 40.1 | | | | |
Income before gain on disposition of interest in center, discontinued operations, and minority and preferred interests | | | 57.4 | | | | | | 60.0 | | | | |
Gain on disposition of interest in center (5) | | | 52.8 | | | | | | | | | | |
| Discontinued operations- | | | | | | | | | | | | | |
| Net gain on disposition of interest in center | | | | | | | | | 0.3 | | | | |
| Minority and preferred interests: | | | | | | | | | | | | | |
TRG preferred distributions (6) | | | (2.5 | ) | | | | | (12.2 | ) | | | |
| Minority share of consolidated joint ventures | | | (0.2 | ) | | | | | 0.0 | | | | |
| Minority share of income of TRG | | | (40.4 | ) | | | | | (14.9 | ) | | | |
| Distributions less than (in excess of) minority share of income | | | 4.5 | | | | | | (20.8 | ) | | | |
| Net income | | | 71.7 | | | | | | 12.4 | | | | |
Preferred dividends (7) | | | (27.6 | ) | | | | | (17.4 | ) | | | |
| Net income (loss) allocable to common shareowners | | | 44.1 | | | | | | (5.1 | ) | | | |
| | | | | | | | | | | | | | |
| SUPPLEMENTAL INFORMATION: | | | | | | | | | | | | | |
| EBITDA - 100% | | | 265.0 | | | 205.3 | | | 226.0 | | | 214.6 | |
| EBITDA - outside partners' share | | | (14.9 | ) | | (91.9 | ) | | (6.2 | ) | | (99.4 | ) |
| Beneficial interest in EBITDA | | | 250.1 | | | 113.5 | | | 219.8 | | | 115.2 | |
| Beneficial interest expense | | | (116.1 | ) | | (37.6 | ) | | (92.9 | ) | | (39.9 | ) |
| Non-real estate depreciation | | | (2.1 | ) | | | | | (2.4 | ) | | | |
| Preferred dividends and distributions | | | (30.1 | ) | | | | | (29.7 | ) | | | |
| Funds from Operations contribution | | | 101.8 | | | 75.9 | | | 94.8 | | | 75.3 | |
| (1) | With the exception of the Supplemental Information, amounts include 100% of the Unconsolidated Joint Ventures. Amounts are net of intercompany transactions and exclude the gain on the sale of Woodland (Note 5). The Unconsolidated Joint Ventures are presented at 100% in order to allow for measurement of their performance as a whole, without regard to our ownership interest. In our consolidated financial statements, we account for investments in the Unconsolidated Joint Ventures under the equity method. |
| (2) | Interest expense for 2005 includes a $12.7 million charge incurred in connection with a prepayment premium and the write-off of financing costs related to the refinancing of Short Hills, the pay-off of the Northlake loan, and the debt modifications in connection with the pay-off of the Oyster Bay loan. |
| (3) | Included in depreciation and amortization of the Consolidated Businesses and Unconsolidated Joint Ventures (at 100%) are $11.5 million and $8.5 million, respectively, of depreciation of center replacement assets for 2005, and $9.1 million and $9.6 million, respectively, for 2004. |
| (4) | Amortization of the additional basis included in depreciation and amortization was $4.3 million and $4.2 million in 2005 and 2004, respectively. Also, amortization of our additional basis in the Operating Partnership included in equity in income of Unconsolidated Joint Ventures was $3.0 million in both 2005 and 2004. |
| (5) | During 2005, a 50% owned unconsolidated joint venture sold its interest in Woodland. Our equity in the gain on the sale is separately presented on the income statement, and is therefore excluded from the equity in income of Unconsolidated Joint Ventures line item. |
| (6) | TRG preferred distributions for 2004 include a $2.7 million charge incurred in connection with the redemption of the Series C and D preferred equity. |
| (7) | Preferred dividends in 2005 include a $3.1 million charge incurred in connection with the partial redemption of the Series A Preferred Stock. |
| (8) | Amounts in this table may not add due to rounding. Certain reclassifications have been made to prior year information to conform to current year classifications. |
Consolidated Businesses
Total revenues for the year ended December 31, 2005 were $479.4 million, a $42.6 million or 9.8% increase over 2004. Minimum rents increased $27.0 million, due to International Plaza, which we began consolidating upon the acquisition of a controlling interest in the center, the September 2005 opening of Northlake and increases in occupancy, tenant rollovers, and income from temporary tenants and specialty retailers. Percentage rents increased due to International Plaza and higher tenant sales. Expense recoveries increased due to International Plaza, Northlake, and increases in recoverable costs at certain centers, which were partially offset by a decrease in revenue from marketing and promotion services. Management, leasing, and development revenue decreased primarily due to the loss of revenue from the nine GMPT management contracts, which were cancelled in November 2004, and were partially offset by revenue from the MGM Project CityCenter and Salt Lake City contracts and cost reimbursements related to Taubman Asia. Other income increased primarily due to increases in parking-related revenue and sponsorship income.
Total expenses were $470.9 million, a $46.1 million or 10.9% increase from 2004. Recoverable expenses increased primarily due to International Plaza and Northlake, as well as increases in maintenance costs, electricity expense, and property taxes at certain centers. Other operating expense increased primarily due to office and deal pursuit costs in Asia, International Plaza, and overhead no longer allocable to the GMPT management contracts, offset by a decrease in bad debt expense. During 2004, $1.0 million of insurance proceeds were received relating to costs expended in connection with an unsolicited tender offer in 2003. Also during 2004, a $5.7 million restructuring loss was recognized. Substantially all of this charge represented employee severance payments and benefits. Management, leasing, and development expense decreased primarily due to the cancellation of the GMPT management contracts, with certain overhead costs previously allocated to the contracts now being recognized as other operating expenses or general and administrative expense. This was partially offset by expenses related to the MGM Project CityCenter and Salt Lake City contracts and activities related to Taubman Asia. In addition to the increase related to expenses that were previously allocated to GMPT, general and administrative expense increased due to professional fees, travel, and severance costs, which were offset by a decrease in bonus grants outstanding that fluctuate with our stock price. Interest expense increased due to charges incurred in 2005 in connection with a prepayment premium and the write-off of financing costs related to the refinancing of Short Hills, the pay-off of the Northlake loan and a debt modification in connection with the pay-off of the Oyster Bay loan. Other interest expense increases were due to International Plaza, the refinancings of Wellington Green and Stony Point Fashion Park (Stony Point), as well as the opening of Northlake and increases in floating interest rates. Depreciation expense increased primarily due to International Plaza, Northlake, and changes in depreciable lives of tenant and anchor allowances in connection with early terminations.
Gains on land sales and interest income decreased due to decreases in gains on sales of peripheral land, which were partially offset by increased interest income.
Unconsolidated Joint Ventures
Total revenues for the year ended December 31, 2005 were $305.4 million, a $15.8 million or 4.9% decrease from 2004. Minimum rents decreased $10.5 million, primarily due to the consolidation of International Plaza, which was partially offset by increases in occupancy and tenant rollovers. Percentage rents increased due to higher tenant sales. Expense recoveries decreased due to International Plaza, offset by increases at other centers.
Total expenses decreased by $17.6 million to $223.3 million for the year ended December 31, 2005. Recoverable expenses decreased primarily due to International Plaza. Other operating expense decreased primarily due to International Plaza, partially offset by increases in professional fees and other expenses. Interest expense decreased primarily due to International Plaza and the payoff of debt on Woodland and Stamford Town Center. Depreciation expense decreased primarily due to International Plaza.
As a result of the foregoing, income of the Unconsolidated Joint Ventures increased by $2.3 million to $82.9 million. Our equity in income of the Unconsolidated Joint Ventures was $42.5 million, a $2.4 million increase from 2004.
Net Income
As a result of the foregoing, our income before the gain on disposition of our interest in Woodland, discontinued operations and minority and preferred interests decreased by $2.6 million to $57.4 million for 2005. In 2005, we recognized our $52.8 million share of the gain on disposition of Woodland. Discontinued operations in 2004 included a $0.3 million adjustment to the gain on the disposition of Biltmore Fashion Park. Preferred dividends in 2005 include a $3.1 million charge related to the partial redemption of the Series A preferred stock, while TRG preferred distributions in 2004 include a $2.7 million charge incurred in connection with the redemption of the Series C and Series D Preferred Equity. After allocation of income to minority and preferred interests, the net income (loss) allocable to common shareowners for 2005 was $44.1 million compared to $(5.1) million in 2004.
Reconciliation of Net Income (Loss) Allocable to Common Shareowners to Funds from Operations
| | | | 2006 | | | 2005 | | | 2004 | |
| | | (in millions of dollars, except as indicated) |
| Net income (loss) allocable to common shareowners | | | 21.4 | | | 44.1 | | | (5.1 | ) |
| | | | | | | | | | | |
| Add (less) depreciation and gains on dispositions of properties: | | | | | | | | | | |
Gains on dispositions of interests in centers | | | | | | (52.8 | ) | | (0.3 | ) |
Depreciation and amortization (1): | | | | | | | | | | |
Consolidated businesses at 100% | | | 138.0 | | | 128.4 | | | 110.2 | |
Minority partners in consolidated joint ventures | | | (14.6 | ) | | (9.3 | ) | | (3.2 | ) |
Share of unconsolidated joint ventures | | | 26.9 | | | 33.4 | | | 35.2 | |
Non-real estate depreciation | | | (2.9 | ) | | (2.1 | ) | | (2.4 | ) |
| | | | | | | | | | | |
| Add minority interests in TRG: | | | | | | | | | | |
Minority share of income in TRG | | | 22.8 | | | 40.4 | | | 14.9 | |
Distributions (less than) in excess of minority share of income of TRG | | | 14.1 | | | (4.5 | ) | | 20.8 | |
Distributions in excess of minority share of income of consolidated joint ventures | | | 4.9 | | | 0.2 | | | | |
| | | | | | | | | | | |
Funds from Operations | | | 210.4 | | | 177.7 | | | 170.1 | |
| | | | | | | | | | | |
| TCO’s average ownership percentage of TRG | | | 65.0 | % | | 62.2 | % | | 60.6 | % |
| | | | | | | | | | | |
Funds from Operations allocable to TCO | | | 136.7 | | | 110.6 | | | 103.1 | |
| (1) | Depreciation includes $10.2 million, $10.1 million, and $8.1 million of mall tenant allowance amortization for the years ended December 31, 2006, 2005, and 2004, respectively. Depreciation also includes TRG’s beneficial interest in depreciation of center replacement assets recoverable from tenants of $15.7 million, $15.7 million, and $14.2 million for the years ended December 31, 2006, 2005, and 2004, respectively. |
| (2) | Amounts in this table may not add due to rounding. |
Reconciliation of Net Income to Beneficial Interest in EBITDA
| | | | 2006 | | | 2005 | | | 2004 | |
| | | (in millions of dollars, except as indicated) |
| Net income | | | 45.1 | | | 71.7 | | | 12.4 | |
| | | | | | | | | | | |
| Add (less) depreciation and gains on dispositions of properties: | | | | | | | | | | |
Gains on dispositions of interests in centers | | | | | | (52.8 | ) | | (0.3 | ) |
Depreciation and amortization: | | | | | | | | | | |
Consolidated businesses at 100% | | | 138.0 | | | 128.4 | | | 110.2 | |
Minority partners in consolidated joint ventures | | | (14.6 | ) | | (9.3 | ) | | (3.2 | ) |
Share of unconsolidated joint ventures | | | 26.9 | | | 33.4 | | | 35.2 | |
| | | | | | | | | | | |
| Add (less) preferred interests and interest expense: | | | | | | | | | | |
Preferred distributions | | | 2.5 | | | 2.5 | | | 12.2 | |
Interest expense: | | | | | | | | | | |
Consolidated businesses at 100% | | | 128.6 | | | 121.6 | | | 95.9 | |
Minority partners in consolidated joint ventures | | | (12.9 | ) | | (5.5 | ) | | (3.1 | ) |
Share of unconsolidated joint ventures | | | 31.2 | | | 37.6 | | | 39.9 | |
| | | | | | | | | | | |
| Add minority interests in TRG: | | | | | | | | | | |
Minority share of income in TRG | | | 22.8 | | | 40.4 | | | 14.9 | |
Distributions (less than) in excess of minority share of income of TRG | | | 14.1 | | | (4.5 | ) | | 20.8 | |
Distributions in excess of minority share of income of consolidated joint ventures | | | 4.9 | | | 0.2 | | | | |
| | | | | | | | | | | |
| Beneficial interest in EBITDA | | | 386.5 | | | 363.5 | | | 335.0 | |
| | | | | | | | | | | |
| TCO’s average ownership percentage of TRG | | | 65.0 | % | | 62.2 | % | | 60.6 | % |
| | | | | | | | | | | |
| Beneficial interest in EBITDA allocable to TCO | | | 251.1 | | | 226.4 | | | 202.9 | |
| (1) | Amounts in this table may not add due to rounding. |
Liquidity and Capital Resources
In the following discussion, references to beneficial interest represent the Operating Partnership’s ownership share of the results of its consolidated and unconsolidated businesses. We do not have, and have not had, any parent company indebtedness; all debt discussed represents obligations of the Operating Partnership or its subsidiaries and joint ventures.
Capital resources are required to maintain our current operations, pay dividends, and fund planned capital spending for projects under construction, future developments, and other commitments and contingencies. We believe that our net cash provided by operating activities, distributions from our joint ventures, the unutilized portions of our credit facilities, and our ability to access the capital markets assure adequate liquidity to meet current and future cash requirements and will allow us to conduct our operations in accordance with our dividend and financing policies. The following sections contain information regarding our recent capital transactions and sources and uses of cash; beneficial interest in debt and sensitivity to interest rate risk; contractual obligations; covenants, commitments, and contingencies; and historical capital spending. We then provide information regarding our anticipated future capital spending and our dividend policies.
Summaries of 2006 Capital Activities and Transactions
As of December 31, 2006, we had a consolidated cash balance of $26.3 million. Our cash balance includes $2.0 million that is restricted to specific uses stipulated by our lenders, including ground lease payments, taxes, insurance, debt service, capital improvements, leasing costs, and tenant allowances. Additionally, we have a secured $350 million line of credit. This line had $60.0 million of borrowings as of December 31, 2006. We also have available a second secured bank line of credit of up to $40 million, which had $8.1 of borrowings as of December 31, 2006. Our $350 million line of credit matures in February 2009 and has a one year extension option. The $40 million line of credit matures in February 2008.
During 2006, we:
| · | Completed financings of approximately $1.1 billion relating to our $350 million revolving line of credit, Cherry Creek, Northlake, Partridge Creek, the land under Sunvalley, and Waterside and paid off floating rate loans on Willow Bend and Oyster Bay. |
| · | Acquired a 50% interest in the land under Sunvalley. |
| · | Redeemed $113 million of preferred stock. |
| · | Continued to be active in construction and development activities for both existing centers and centers currently under development. |
These transactions are more fully described in “Results of Operations” and “Capital Spending”.
Operating Activities
Our net cash provided by operating activities was $223.5 million in 2006, compared to $184.6 million in 2005 and $135.5 million in 2004. In 2006, increases in cash related primarily to increases in rents, recoveries, lease cancellation revenue, the consolidation of Cherry Creek, and the full year of operations of Northlake. In 2005, increases in cash related primarily to increases in rents, the opening of Northlake, and additional operating cash flows due to International Plaza, which we began consolidating upon acquisition of a controlling interest in the center. Included in interest expense in 2005 was a prepayment premium paid in connection with the Short Hills refinancing in December 2005 (see "Debt Transactions"). In 2004, increases in cash related primarily to increases in rents and recoveries and additional operating cash flows due to the full year of operations of Stony Point, offset by payments of costs previously accrued in connection with the unsolicited tender offer, restructuring and other costs.
Investing Activities
Net cash used in investing activities was $131.5 million in 2006 compared to $91.1 million in 2005 and $243.6 million in 2004. Cash used in investing activities was impacted by the timing of capital expenditures, with additions to properties in 2006, 2005, and 2004 for the construction of Northlake, Partridge Creek, Stony Point, the expansion and renovation at Twelve Oaks, and our Oyster Bay Project, as well as other development activities and other capital items. A tabular presentation of 2006 capital spending is shown in “Capital Spending”. During 2004, $58.5 million, net of cash transferred in, was used to purchase an additional interest in International Plaza, and $3.3 million was used to acquire an additional interest in Beverly. Contributions to Unconsolidated Joint Ventures of $25.3 million in 2006 were made primarily to purchase land that Sunvalley is located on and to fund the expansion at Waterside (see “Capital Spending - Existing Centers”), while $30.4 million of contributions in 2005 were made primarily for the purchase of anchor spaces at Stamford Town Center and Cherry Creek, the initial contribution to The Pier (see "Capital Spending - New Centers"), and to fund construction at Waterside, while $72.3 million of contributions in 2004 were made primarily to fund the repayment of debt at Stamford and Woodland.
Sources of cash used in funding these investing activities, other than cash flows from operating activities, included distributions from Unconsolidated Joint Ventures, as well as the transactions described under Financing Activities. Distributions in excess of earnings from Unconsolidated Joint Ventures provided $57.6 million in 2006, which included $39.5 million of proceeds from the Waterside financing. Distributions in excess of earnings from Unconsolidated Joint Ventures provided $17.1 million and $20.2 million in 2005 and 2004, respectively, and included amounts for Cherry Creek which was consolidated in 2006 and Woodland which was sold in 2005. Net proceeds from sales of peripheral land were $5.4 million, $6.1 million and $11.5 million in 2006, 2005, and 2004, respectively. The timing of land sales is variable and proceeds from land sales can vary significantly from period to period. During 2005, $76.4 million of escrowed cash was received in connection with the sale of Woodland and used in 2006 for the purchase of replacement property. In addition a $9.0 million note received in connection with the sale of Woodland was collected during the first quarter of 2006.
Financing Activities
Net cash used in financing activities was $231.6 million in 2006, compared to $41.0 million of cash provided in 2005, and $106.8 million of cash used in 2004.
Net cash used in or provided by financing activities was primarily impacted by cash requirements of the investing activities described in the preceding section. Proceeds from the issuance of debt, net of payments and issuance costs, were $51.6 million in 2006, compared to $157.4 million in 2005 and $236.5 million in 2004. In 2006 we used the proceeds from the issuance of the $113 million Series I Preferred Stock to redeem the remaining outstanding Series A Preferred Stock. The Series I Preferred Stock was then redeemed using available cash. In 2005 we used $87 million in proceeds from the issuance of Series H Preferred Stock to redeem a portion of Series A Preferred Stock. In 2004, issuance of Series F Preferred Equity contributed $30 million and we used proceeds from the issuance of the $100 million Series G Preferred Stock to redeem all of the outstanding Series C and D Cumulative Redeemable Preferred Equity. Equity issuance costs were $0.6 million, $3.2 million, and $4.1 million in 2006, 2005, and 2004, respectively. Issuance of stock and partnership units related to the exercise of employee options contributed $6.7 million in 2005 and $10.4 million in 2004. The third party owner of Partridge Creek contributed $9.0 million in 2006 to fund the project (see “Contractual Obligations - The Mall at Partridge Creek Contractual Obligations” regarding the ownership structure of this project). Repurchases of common stock totaled $50.2 million in 2004. Total dividends and distributions paid were $178.6 million, $119.9 million, and $115.8 million in 2006, 2005, and 2004, respectively. Distributions to minority interests in 2006 include $45.3 million of excess proceeds from the refinancing of Cherry Creek.
Beneficial Interest in Debt
At December 31, 2006, the Operating Partnership's debt and its beneficial interest in the debt of its Consolidated and Unconsolidated Joint Ventures totaled $2,585.3 million, with an average interest rate of 5.69% excluding amortization of debt issuance costs and the effects of interest rate hedging instruments. These costs are reported as interest expense in the results of operations. Interest expense for the year ended December 31, 2006 includes $0.6 million of non-cash amortization relating to acquisitions, or 0.02% of the average all-in rate. Included in beneficial interest in debt is debt used to fund development and expansion costs. Beneficial interest in construction work in progress totaled $241.0 million as of December 31, 2006, which includes $227.1 million of assets on which interest is being capitalized. Beneficial interest in capitalized interest was $9.8 million for 2006. The following table presents information about our beneficial interest in debt as of December 31, 2006:
| | | Amount | | Interest Rate Including Spread | |
| | | (in millions of dollars) | | | |
| Fixed rate debt | | | 2,478.5 | | | 5.66% | (1) |
| | | | | | | | |
| Floating rate debt - | | | | | | | |
| Floating month to month | | | 106.8 | (2) | | 6.22 | (1) |
| | | | | | | | |
| Total beneficial interest in debt | | | 2,585.3 | | | 5.69 | (1) |
| | | | | | | | |
Amortization of financing costs (3) | | | | | | 0.17 | % |
| Average all-in rate | | | | | | 5.86 | % |
| (1) | Represents weighted average interest rate before amortization of financing costs. |
| (2) | $15 million of floating rate debt is swapped at 5.95% from January 2, 2007 to November 1, 2012. |
| (3) | Financing costs include financing fees, interest rate cap premiums, and losses on settlement of derivatives used to hedge the refinancing of certain fixed rate debt. |
| (4) | Amounts in table may not add due to rounding. |
In 2006, we entered into three forward starting swaps for $150 million to partially hedge interest rate risk associated with the planned refinancing of International Plaza in January 2008. The weighted average forward swap rate for these three swaps is 5.33%, excluding the credit spread.
Sensitivity Analysis
We have exposure to interest rate risk on our debt obligations and interest rate instruments. We use derivative instruments primarily to manage exposure to interest rate risks inherent in variable rate debt and refinancings. We routinely use cap, swap, and treasury lock agreements to meet these objectives. Based on the Operating Partnership's beneficial interest in floating rate debt in effect at December 31, 2006, a one percent increase or decrease in interest rates on this floating rate debt would decrease or increase cash flows by approximately $0.9 million and, due to the effect of capitalized interest, annual earnings by approximately $0.8 million. Based on our consolidated debt and interest rates in effect at December 31, 2006, a one percent increase in interest rates would decrease the fair value of debt by approximately $126.2 million, while a one percent decrease in interest rates would increase the fair value of debt by approximately $134.9 million.
Contractual Obligations
In conducting our business, we enter into various contractual obligations, including those for debt, capital leases for property improvements, operating leases for land and office space, purchase obligations (primarily for construction), and other long-term commitments. Detail of these obligations as of December 31, 2006 for our consolidated businesses, including expected settlement periods, is contained below:
| | | Payments due by period | |
| | | | Total | | Less than 1year (2007) | | 1-3 years (2008-2009) | | 3-5 years (2010-2011) | | More than 5years (2012+) | |
| | | (in millions of dollars) |
| | | | | | | | | | | | | |
Debt(1) | | | 2,319.5 | | 16.6 | | 271.2 | | 246.7 | | 1,785.1 | |
| Interest payments | | | 923.9 | | 129.7 | | 237.9 | | 215.2 | | 341.0 | |
| Capital lease obligations | | | 8.1 | | 3.9 | | 4.3 | | | | | |
| Operating leases | | | 369.7 | | 8.1 | | 15.9 | | 14.7 | | 331.0 | |
| Purchase obligations: | | | | | | | | | | | | |
Planned capital spending (2) | | | 201.9 | | 201.9 | | | | | | | |
Other purchase obligations (3) | | | 7.8 | | 2.4 | | 2.9 | | 1.3 | | 1.2 | |
Other long-term liabilities (4) | | | 81.9 | | 8.9 | | 4.6 | | 1.9 | | 66.5 | |
| Total | | | 3,912.8 | | 371.5 | | 536.8 | | 479.8 | | 2,524.8 | |
| (1) | The settlement periods for debt do not consider extension options. Amounts relating to interest on floating rate debt are calculated based on the debt balances and interest rates as of December 31, 2006. |
| (2) | As of December 31, 2006, we were contractually committed for $90.9 million of this planned spending. See “Planned Capital Spending” for detail regarding planned spending. |
| (3) | Excludes purchase agreements with cancellation provisions of 90 days or less. |
| (4) | Other long-term liabilities consist of various accrued liabilities, most significantly assessment bond obligations and long-term incentive compensation. |
| (5) | Amounts in this table may not add due to rounding. |
The Mall at Partridge Creek Contractual Obligations
In May 2006, we engaged the services of a third-party investor to acquire certain property associated with Partridge Creek, in order to facilitate a Section 1031 like-kind exchange to provide flexibility for disposing of assets in the future. The third-party investor became the owner of the project and leases the land from one of our subsidiaries. In turn, the owner leases the project back to us.
Funding for the project is provided by the following sources. We provide approximately 45% of the project funding under a junior subordinated financing. The owner has provided $9 million in equity. Funding for the remaining project costs is being provided by the owner’s third-party construction loan, which has a balance of $22.0 million as of December 31, 2006 (see “Debt Transactions”).
We are the construction manager for the project and have an option to purchase the property and assume the ground lease from the owner during the 30-month exchange period ending December 2008. The option, if exercised, will provide the owner a 12% cumulative return on its equity. In the event that we do not exercise our right to purchase the property from the owner, the owner will have the right to sell all of its interest in the property, provided that the purchaser shall assume all of the obligations and be assigned all of the owner's rights under the ground lease, the operating lease, and any remaining obligations under the loans.
We have guaranteed the lease payments on the operating lease (excluding annual supplemental rent equal to 1.67% of the owner's outstanding equity balance, commencing after the exchange period) as well as completion of the project. The lease payments are structured to cover debt service, ground rent payments, and other expenses of the lessor. We consolidate the accounts of the owner and the junior loan and other intercompany transactions are eliminated in consolidation.
Loan Commitments and Guarantees
Certain loan agreements contain various restrictive covenants, including minimum net worth requirements, minimum debt service coverage ratios, a maximum payout ratio on distributions, a maximum leverage ratio, a minimum debt yield ratio, and a minimum fixed charges coverage ratio, the latter being the most restrictive. The Operating Partnership is in compliance with all of its covenants.
Payments of principal and interest on the loans in the following table are guaranteed by the Operating Partnership as of December 31, 2006.
Center | | | Loan balance as of 12/31/06 | | | TRG's beneficial interest in loan balance as of 12/31/06 | | | Amount of loan balance guaranteed by TRG as of 12/31/06 | | | % of loan balance guaranteed by TRG | | | % of interest guaranteed by TRG | |
| | | (in millions of dollars) | | | | | | |
| Dolphin Mall | | | 5.0 | | | 5.0 | | | 5.0 | | | 100 | % | | 100 | % |
| Fairlane Town Center | | | 55.0 | | | 55.0 | | | 55.0 | | | 100 | % | | 100 | % |
| The Mall at Millenia | | | 0.3 | | | 0.2 | | | 0.2 | | | 50 | % | | 50 | % |
| Twelve Oaks Mall | | | - | | | - | | | - | | | 100 | % | | 100 | % |
In 2006, the $350 million revolver was amended by the Operating Partnership. Under the revised terms, borrowings under the line of credit are primary obligations of the entities owning Dolphin, Fairlane, and Twelve Oaks, which are the collateral for the line of credit. The Operating Partnership and the entities owning Fairlane and Twelve Oaks are guarantors under the credit agreement.
In addition, we have guaranteed certain obligations of Partridge Creek (see “Contractual Obligations”) and the payment of $3.7 million related to the remaining development costs and certain tenant allowances for Northlake.
Cash Tender Agreement
A. Alfred Taubman has the annual right to tender to us units of partnership interest in the Operating Partnership (provided that the aggregate value is at least $50 million) and cause us to purchase the tendered interests at a purchase price based on a market valuation of TCO on the trading date immediately preceding the date of the tender (the Cash Tender Agreement). At A. Alfred Taubman's election, his family, and certain others may participate in tenders. We will have the option to pay for these interests from available cash, borrowed funds, or from the proceeds of an offering of our common stock. Generally, we expect to finance these purchases through the sale of new shares of our stock. The tendering partner will bear all market risk if the market price at closing is less than the purchase price and will bear the costs of sale. Any proceeds of the offering in excess of the purchase price will be for the sole benefit of TCO.
We account for the cash tender agreement between us and Mr. Taubman as a freestanding written put option. As the option put price is defined by the current price of our stock at the time of tender, the fair value of the written option defined by the cash tender agreement is considered to be zero.
Based on a market value at December 31, 2006 of $50.86 per common share, the aggregate value of interests in the Operating Partnership that may be tendered under the Cash Tender Agreement was approximately $1.3 billion. The purchase of these interests at December 31, 2006 would have resulted in our owning an additional 31% interest in the Operating Partnership.
Capital Spending
Capital spending for routine maintenance of the shopping centers is generally recovered from tenants. Capital spending during 2006, excluding acquisitions, is summarized in the following table:
| | | 2006 (1) |
| | | Consolidated Businesses | | | Beneficial Interest in Consolidated Businesses | | | Unconsolidated Joint Ventures | | | Beneficial Interest in Unconsolidated Joint Ventures | |
| | | (in millions of dollars) |
| New Development Projects: | | | | | | | | | | | | | |
Pre-construction development activities (2) | | | 25.6 | | | 25.6 | | | | | | | |
New centers (3) | | | 41.4 | | | 41.4 | | | | | | | |
| | | | | | | | | | | | | | |
| Existing Centers: | | | | | | | | | | | | | |
Renovation projects with incremental GLA and/or anchor replacement (4) | | | 38.8 | | | 38.8 | | | 33.2 | | | 9.9 | |
| Renovations with no incremental GLA effect and other | | | 9.0 | | | 8.7 | | | 4.9 | | | 2.4 | |
Mall tenant allowances (5) | | | 14.6 | | | 14.1 | | | 5.1 | | | 2.5 | |
| Asset replacement costs reimbursable by tenants | | | 14.0 | | | 12.9 | | | 5.3 | | | 3.0 | |
| | | | | | | | | | | | | | |
| Corporate office improvements and equipment | | | 8.6 | | | 8.6 | | | | | | | |
| | | | | | | | | | | | | | |
| Additions to properties | | | 151.9 | | | 150.0 | | | 48.5 | | | 17.9 | |
| (1) | Costs are net of intercompany profits and are computed on an accrual basis. |
| (2) | Primarily includes project costs of Oyster Bay. |
| (3) | Includes costs related to Partridge Creek. |
| (4) | Includes costs related to the renovation of the former Filene's space at Stamford Town Center, the expansion at Twelve Oaks, and the expansion and renovation of Waterside. |
| (5) | Excludes initial lease-up costs. |
| (6) | Amounts in this table may not add due to rounding. |
The following table presents a reconciliation of the Consolidated Businesses’ capital spending shown above (on an accrual basis) to cash additions (on a cash basis) to properties as presented in our Consolidated Statement of Cash Flows for the year ended December 31, 2006:
| | | | (in millions of dollars) | |
| Consolidated Businesses’ capital spending | | | 151.9 | |
| Differences between cash and accrual basis | | | 26.4 | |
| Additions to properties | | | 178.3 | |
Capital spending during 2005, excluding acquisitions, is summarized in the following table:
| | 2005 (1) |
| | | Consolidated Businesses | | | Beneficial Interest in Consolidated Businesses | | | Unconsolidated Joint Ventures | | | Beneficial Interest in Unconsolidated Joint Ventures | |
| | | (in millions of dollars) |
| New Development Projects: | | | | | | | | | | | | | |
Pre-construction development activities (2) | | | 31.8 | | | 31.8 | | | | | | | |
New centers (3) | | | 106.3 | | | 106.3 | | | | | | | |
| | | | | | | | | | | | | | |
| Existing Centers: | | | | | | | | | | | | | |
Renovation projects with incremental GLA and/or anchor replacement (4) | | | 2.6 | | | 2.6 | | | 49.4 | | | 19.7 | |
| Renovations with no incremental GLA effect and other | | | 4.2 | | | 4.1 | | | 3.1 | | | 1.6 | |
Mall tenant allowances (5) | | | 13.2 | | | 12.2 | | | 5.6 | | | 2.9 | |
| Asset replacement costs reimbursable by tenants | | | 9.8 | | | 9.2 | | | 8.0 | | | 4.6 | |
| | | | | | | | | | | | | | |
| Corporate office improvements and equipment | | | 5.2 | | | 5.2 | | | | | | | |
| | | | | | | | | | | | | | |
| Additions to properties | | | 173.1 | | | 171.5 | | | 66.1 | | | 28.8 | |
| (1) | Costs are net of intercompany profits and are computed on an accrual basis. |
| (2) | Primarily includes project costs of Oyster Bay. |
| (3) | Primarily includes costs related to Northlake and Partridge Creek. |
| (4) | Includes costs related to the acquisition of the former Filene's space at Stamford Town Center, the former Lord & Taylor space at Cherry Creek, and the expansion and renovation of Waterside. |
| (5) | Excludes initial lease-up costs. |
| (6) | Amounts in this table may not add due to rounding. |
The Operating Partnership's share of mall tenant allowances per square foot leased, committed under contracts during the year, excluding expansion space and new developments, was $19.05 in 2006 and $19.84 in 2005. In addition, the Operating Partnership's share of capitalized leasing and tenant coordination costs excluding new developments, was $6.6 million in both 2006 and 2005, or $5.64 and $6.09, in 2006 and 2005, respectively, per square foot leased.
Planned Capital Spending
New Centers
Partridge Creek, a 640,000 square foot center, is under construction in Clinton Township, Michigan. The center will be anchored by Nordstrom, Parisian, and MJR Theatres, and is scheduled to open on October 18, 2007, with Nordstrom opening in spring 2008. Our investment in this center will be approximately $155 million and we are expecting a stabilized return of 9.5%.
The Pier, located in Atlantic City, New Jersey and developed by Gordon Group Holdings LLC (Gordon), began opening in phases in June 2006. In January 2005, we contributed $4 million as a first payment to acquire a 30% interest in the center. We are in final negotiations to increase our ownership of The Pier from 30% to 50%. Our original agreement with Gordon specified we would purchase the 30% interest at a 7% capitalization rate based on The Pier’s 2007 net operating income (NOI). We have now negotiated that the entire 50% interest will be purchased at a 7% capitalization rate based on The Pier’s 2008 NOI. Given the phased openings at the center, we do not expect a full run rate before 2008. Therefore, the asset is not likely to contribute significantly to our earnings and FFO in 2007. We expect to close on our agreement with Gordon in the first quarter of 2007 when we also expect to close on a refinancing for The Pier, which will pay off the $86 million balance on the existing floating rate loan. We assumed full management and leasing of The Pier in January 2007. The Pier is accounted for under the equity method.
We are negotiating agreements regarding City Creek Center, a mixed-use project in Salt Lake City, Utah. Demolition of the existing structures began in November 2006 and the project is expected to open in 2011. The retail component of the project will include approximately 300,000 square feet of tenant GLA and three department stores, including Dillard’s, Macy’s, and Nordstrom. We have been a consultant throughout the planning process for this project and will develop, manage, lease, and own the retail space. We are currently in the final stages of refining the agreements that will govern our investment in the retail portion. When complete, we will provide the anticipated costs and returns.
A new 1.2 million square foot retail and entertainment complex in New Songdo City, Incheon, South Korea is scheduled to open in early 2010, with construction beginning in 2007. We have negotiated the opportunity to invest in a portion of the broader project, which will include not only retail, but also office, hotel, and residential uses. We anticipate finalizing our decision on this investment in 2007.
In January 2007, we announced our involvement in the retail component of Macao Studio City on the Cotai Strip in Macao. Taubman Asia has signed a term sheet to acquire a minority position in the retail component of the project and will provide development, leasing, and management services, subject to definitive agreements to be completed in the first half of 2007.
In October 2006, we announced that we are seeking a final decision in the Supreme Court of the State of New York (Suffolk County) on our land use plan for our Oyster Bay project in Syosset, Long Island, New York. Although the timing is uncertain, we believe it is likely the court ruling will occur in the next two to three months. We believe we will be successful in this litigation and we will ultimately build the mall. Depending on the timing of the construction and opening of the mall, which will be anchored by Neiman Marcus, Nordstrom, and Barneys New York, we anticipate spending as much as $500 million on this project. Assuming $500 million of cost we expect a minimum return of 7%. We expect success with the litigation, but if we are ultimately unsuccessful it is anticipated that the recovery on this asset would be significantly less than our current investment. Our cost in this project as of December 31, 2006 was $128.2 million. With capitalized interest, storage costs and ongoing expenses we expect our investment to increase $4 million to $5 million each quarter.
Existing Centers
Construction has been completed on an expansion and renovation of tenant space at Waterside at a cost of approximately $52 million. We expect a return of approximately 11% on our $13 million share of project costs. In addition, Nordstrom will join the center as an anchor in fall 2008 and an expansion of the current anchor, Saks Fifth Avenue, will be completed in late 2007 with a full renovation of the store expected to be completed by summer 2008.
At Twelve Oaks, construction is underway on an addition of a 165,000 square foot Nordstrom. In addition, the project includes a 60,000 square foot expansion and renovation of Macy’s (previously Marshall Fields), and approximately 97,000 square feet of additional new store space. A grand opening is planned for September 28, 2007. We expect a return of approximately 10% on our estimated cost of $63 million.
Construction is underway on a lifestyle component addition to Stamford Town Center, on the site once occupied by Filene's department store. The project, which is 100% leased, will consist of a mix of signature retail and restaurant offerings, creating significantly greater visibility to the city and much-needed pedestrian access to the center. We expect a 7.5% to 8% return on the $51 million project, which is expected to open in November 2007.
The following table summarizes planned capital spending for 2007, excluding The Pier, as well as costs related to City Creek Center, Asia projects, and other projects or expansions for which budgets have not yet been approved by the Board of Directors:
| | 2007 (1) |
| | | Consolidated Businesses | | | Beneficial Interest in Consolidated Businesses | | | Unconsolidated Joint Ventures | | | Beneficial Interest in Unconsolidated Joint Ventures | |
| | | (in millions of dollars) |
New development projects(2) | | | 120.1 | | | 120.1 | | | | | | | |
Existing centers(3) | | | 80.8 | | | 77.8 | | | 55.1 | | | 28.7 | |
| Corporate office improvements and equipment | | | 1.0 | | | 1.0 | | | | | | | |
| Total | | | 201.9 | | | 198.9 | | | 55.1 | | | 28.7 | |
| (1) | Costs are net of intercompany profits. |
| (2) | Primarily includes costs related to Partridge Creek and Oyster Bay. |
| (3) | Primarily includes costs related to the expansion and renovation of Twelve Oaks and Stamford Town Center. |
| (4) | Amounts in this table may not add due to rounding. |
Estimates of future capital spending include only projects approved by our Board of Directors and, consequently, estimates will change as new projects are approved. Costs of potential development projects, including our exploration of development possibilities in Asia, are expensed until we conclude that it is probable that the project will reach a successful conclusion.
Disclosures regarding planned capital spending, including estimates regarding capital expenditures, occupancy, and returns on new developments presented above are forward-looking statements and certain significant factors could cause the actual results to differ materially, including but not limited to: (1) actual results of negotiations with anchors, tenants, and contractors, (2) timing and outcome of litigation and entitlement processes, (3) changes in the scope, number, and valuation of projects, (4) cost overruns, (5) timing of expenditures, (6) financing considerations, (7) actual time to complete projects, (8) changes in economic climate, (9) competition from others attracting tenants and customers, (10) increases in operating costs, (11) timing of tenant openings, and (12) early lease terminations and bankruptcies.
Dividends
We pay regular quarterly dividends to our common and Series G and Series H preferred shareowners. Dividends to our common shareowners are at the discretion of the Board of Directors and depend on the cash available to us, our financial condition, capital and other requirements, and such other factors as the Board of Directors deems relevant. To qualify as a REIT, we must distribute at least 90% of our REIT taxable income to our shareowners, as well as meet certain other requirements. Preferred dividends accrue regardless of whether earnings, cash availability, or contractual obligations were to prohibit the current payment of dividends.
On December 7, 2006, we declared a quarterly dividend of $0.375 per common share that was paid on January 19, 2007 to shareowners of record on December 29, 2006. We declared a quarterly dividend of $0.50 per share on our 8% Series G Preferred Stock, paid December 29, 2006 to shareowners of record on December 19, 2006. We also declared a quarterly dividend of $0.4765625 per share on our 7.625% Series H Preferred Stock, paid on December 29, 2006 to shareholders of record on December 19, 2006.
The annual determination of our common dividends is based on anticipated Funds from Operations available after preferred dividends, as well as assessments of annual capital spending, financing considerations, and other appropriate factors.
Any inability of the Operating Partnership or its Joint Ventures to secure financing as required to fund maturing debts, capital expenditures and changes in working capital, including development activities and expansions, may require the utilization of cash to satisfy such obligations, thereby possibly reducing distributions to partners of the Operating Partnership and funds available to us for the payment of dividends.
Item 7A. QUANTITATIVE AND QUALITATIVE DISCLOSURES ABOUT MARKET RISK.
The information required by this Item is included in this report at Item 7 under the caption “Liquidity and Capital Resources”.
Item 8. FINANCIAL STATEMENTS AND SUPPLEMENTARY DATA.
The Financial Statements of Taubman Centers, Inc. and the Reports of Independent Registered Public Accounting Firms thereon are filed pursuant to this Item 8 and are included in this report at Item 15.
Item 9. CHANGE IN AND DISAGREEMENTS WITH ACCOUNTANTS ON ACCOUNTING AND FINANCIAL DISCLOSURE.
None.
Item 9A. CONTROLS AND PROCEDURES.
Evaluation of Disclosure Controls and Procedures
As of the end of the period covered by this annual report, the Company carried out an evaluation, under the supervision and with the participation of the Company’s management, including the Company’s Chief Executive Officer and Chief Financial Officer, of the effectiveness of the design and operation of the Company’s disclosure controls and procedures (as defined by SEC Rule 13a-15(e)). Based upon that evaluation, the Company’s Chief Executive Officer and Chief Financial Officer concluded that the Company’s disclosure controls and procedures are effective.
Management’s Annual Report on Internal Control over Financial Reporting
Management’s Annual Report on Internal Control over Financial Reporting accompanies the Company’s financial statements included in Item 15 of this annual report.
Report of the Independent Registered Public Accounting Firm
The report issued by the Company’s independent registered public accounting firm, KPMG LLP, accompanies the Company’s financial statements included in Item 15 of this annual report.
Changes in Internal Control over Financial Reporting
There were no changes in the Company’s internal control over financial reporting identified in connection with the Company’s fourth quarter 2006 evaluation of such internal control that have materially affected, or are reasonably likely to materially affect, the Company’s internal control over financial reporting.
Item 9B. OTHER INFORMATION.
Not applicable.
PART III*
Item 10. DIRECTORS, EXECUTIVE OFFICERS, AND CORPORATE GOVERNANCE.
The information required by this item is hereby incorporated by reference to the material appearing in the Proxy Statement under the captions “Proposal 1-Election of Directors—Directors and Executive Officers,” “Proposal 1-Election of Directors—The Board of Directors and Committees,” "Proposal 1-Election of Directors—Corporate Governance,” and “Additional Information—Section 16(a) Beneficial Ownership Reporting Compliance.”
Item 11. EXECUTIVE COMPENSATION.
The information required by this item is hereby incorporated by reference to the material appearing in the Proxy Statement under the captions "Proposal 1-Election of Directors—Director Compensation,” “Compensation Committee Interlocks and Insider Participation,” “Compensation Discussion and Analysis,” “Compensation Committee Report,” and “Executive Compensation Tables.”
Item 12. SECURITY OWNERSHIP OF CERTAIN BENEFICIAL OWNERS AND MANAGEMENT AND RELATED STOCKHOLDER MATTERS.
The following table sets forth certain information regarding the Company’s equity compensation plans as of December 31, 2006:
| | | Number of Securities to be Issued Upon Exercise of Outstanding Options, Warrants, and Rights | | | Weighted- Average Exercise Price of Outstanding Options, Warrants, and Rights | | | Number of Securities Remaining Available for Future Issuances Under Equity Compensation Plans (Excluding Securities Reflected in Column (a)) | |
| | | | (a) | | | (b) | | | (c) | |
Equity compensation plans approved by security holders: (1) (2) | | | | | | | | | | |
| Incentive Option Plan | | | 1,115,376 | | $ | 32.55 | | | 1,114,611 | |
| The Taubman Company 2005 Long-Term Incentive Plan | | | 261,685 | | | | (3) | | 1,235,061 | |
| | | | 1,377,061 | | $ | 32.55 | | | 2,349,672 | |
Equity compensation plan not approved by security holders: (4) | | | | | | | | | | |
| Non-Employee Directors’ Deferred Compensation Plan | | | 7,981 | | | | (5) | | | (6) |
| | | | 1,385,042 | | $ | 32.55 | | | 2,349,672 | |
| (1) | Consists of TRG's 1992 Incentive Option Plan, as amended, and The Taubman Company 2005 Long-Term Incentive Plan. Under the 1992 Incentive Option Plan, employees receive Units of Partnership Interest in TRG upon the exercise of their vested options, and each Unit can be converted into one share of Common Stock under the Continuing Offer. Under The Taubman Company 2005 Long-Term Incentive Plan, employees receive restricted stock units, which represent the right to one share of Common Stock upon vesting. The Taubman Centers, Inc. Non-Employee Directors' Stock Grant Plan was also approved by security holders, but is not included in the table above because issuances under such plan consist of stock grants with no exercise price and such plan does not have a limit on the aggregate number of shares that can be issued thereunder. Under the Taubman Centers, Inc. Non-Employee Directors' Stock Grant Plan, non-employee directors received grants of Common Stock on a quarterly basis having a value of $3,750 in 2006 and will receive in 2007 grants of Common Stock on a quarterly basis having a value of $12,500. |
| (2) | No options were exercised or granted between January 1, 2007 and February 26, 2007. In addition, no restricted stock units were granted between January 1, 2007 and February 26, 2007. |
| (3) | Excludes restricted stock units issued under The Taubman Company 2005 Long-Term Incentive Plan because they are converted into Common Stock on a one-for-one basis at no additional cost. |
| (4) | Consists of the Company's Non-Employee Directors' Deferred Compensation Plan, which was approved by the Board in May 2005. The Deferred Compensation Plan gives each non-employee director of the Company the right to defer the receipt of all or a portion of his or her annual director retainer until the termination of such director's service on the Board and for such deferred compensation to be denominated in restricted stock units. The number of restricted stock units received equals the deferred retainer fee divided by the fair market value of the common stock on the business day immediately before the date the director would otherwise have been entitled to receive the retainer fee. The restricted stock units represent the right to receive equivalent shares of Common Stock at the end of the deferral period. During the deferral period, when the Company pays cash dividends on the Common Stock, the directors' deferral accounts are credited with dividend equivalents on their deferred restricted stock units, payable in additional restricted stock units based on the then-fair market value of the Common Stock. Each Director's account is 100% vested at all times. |
| (5) | The restricted stock units are excluded because they are converted into Common Stock on a one-for-one basis at no additional cost. |
| (6) | The number of securities available for future issuance is unlimited and will reflect whether non-employee directors elect to defer all or a portion of their annual retainers. |
Additional information required by this item is hereby incorporated by reference to the table and related footnotes appearing in the Proxy Statement under the caption “Security Ownership of Certain Beneficial Owners and Management.”
Item 13. CERTAIN RELATIONSHIPS AND RELATED TRANSACTIONS, AND DIRECTOR INDEPENDENCE.
The information required by this item is hereby incorporated by reference to the material appearing in the Proxy Statement under the caption “Related Person Transactions,” and "Proposal 1-Election of Directors—The Board of Directors and Committees.”
Item 14. PRINCIPAL ACCOUNTANT FEES AND SERVICES
The information required by this item is hereby incorporated by reference to the material appearing in the Proxy Statement under the caption “Audit Committee Disclosure,” and “Report of the Audit Committee.”
* The Compensation Committee Report on Executive Compensation and the Audit Committee Report appearing in the Proxy Statement are not incorporated by reference in this Annual Report on Form 10-K or in any other report, registration statement, or prospectus of the Registrant.
PART IV
Item 15. EXHIBITS AND FINANCIAL STATEMENT SCHEDULES.
15(a)(1) | The following financial statements of Taubman Centers, Inc. and the Reports of Independent Registered Public Accounting Firm thereon are filed with this report: |
TAUBMAN CENTERS, INC. | Page |
| Management's Annual Report on Internal Control Over Financial Reporting | F-2 |
| Reports of Independent Registered Public Accounting Firm | F-3 |
| Consolidated Balance Sheet as of December 31, 2006 and 2005 | F-5 |
| Consolidated Statement of Operations for the years ended December 31, 2006, 2005, and 2004 | F-6 |
| Consolidated Statement of Shareowners' Equity for the years ended December 31, 2006, 2005, and 2004 | F-7 |
| Consolidated Statement of Cash Flows for the years ended December 31, 2006, 2005, and 2004 | F-8 |
| Notes to Consolidated Financial Statements | F-9 |
15(a)(2) | The following is a list of the financial statement schedules required by Item 15(d): |
TAUBMAN CENTERS, INC. | |
| Schedule II - Valuation and Qualifying Accounts for the years ended December 31, 2006, 2005, and 2004 | F-34 |
| Schedule III - Real Estate and Accumulated Depreciation as of December 31, 2006 | F-35 |
| 3(a) | -- | Restated By-Laws of Taubman Centers, Inc. (incorporated herein by reference to Exhibit 3 filed with the Registrant's Quarterly Report on Form 10-Q for the quarter ended June 30, 2005 (“2005 Second Quarter Form 10-Q”)). |
| | | |
| 3(b) | -- | Restated Articles of Incorporation of Taubman Centers, Inc. (incorporated herein by reference to Exhibit 3 filed with the Registrant's Quarterly Report on Form 10-Q for the quarter ended June 30, 2006). |
| | | |
| 4(a) | -- | Loan Agreement dated as of January 15, 2004 among La Cienega Associates, as Borrower, Column Financial, Inc., as Lender (incorporated herein by reference to Exhibit 4 filed with the Registrant’s Quarterly Report on Form 10-Q for the quarter ended March 31, 2004 ("2004 First Quarter Form 10-Q")) |
| | | |
| 4(b) | -- | Assignment of Leases and Rents, La Cienega Associates, Assignor, and Column Financial, Inc., Assignee, dated as of January 15, 2004 (incorporated herein by reference to Exhibit 4 filed with the 2004 First Quarter Form 10-Q). |
| 4(c) | -- | Leasehold Deed of Trust, with Assignment of Leases and Rents, Fixture Filing, and Security Agreement, dated as of January 15, 2004, from La Cienega Associates, Borrower, to Commonwealth Land Title Company, Trustee, for the benefit of Column Financial, Inc., Lender (incorporated herein by reference to Exhibit 4 filed with the 2004 First Quarter Form 10-Q). |
| 4(d) | -- | Amended and Restated Promissory Note A-1, dated December 14, 2005, by Short Hills Associates L.L.C. to Metropolitan Life Insurance Company (incorporated by reference to Exhibit 4.1 of the Registrant’s Current Report on Form 8-K dated December 16, 2005). |
| | | |
| 4(e) | -- | Amended and Restated Promissory Note A-2, dated December 14, 2005, by Short Hills Associates L.L.C. to Metropolitan Life Insurance Company (incorporated by reference to Exhibit 4.2 of the Registrant’s Current Report on Form 8-K dated December 16, 2005). |
| | | |
| 4(f) | -- | Amended and Restated Promissory Note A-3, dated December 14, 2005, by Short Hills Associates L.L.C. to Metropolitan Life Insurance Company (incorporated by reference to Exhibit 4.3 of the Registrant’s Current Report on Form 8-K dated December 16, 2005). |
| | | |
| 4(g) | -- | Amended and Restated Mortgage, Security Agreement and Fixture Filings, dated December 14, 2005 by Short Hills Associates L.L.C. to Metropolitan Life Insurance Company (incorporated by reference to Exhibit 4.4 of the Registrant’s Current Report on Form 8-K dated December 16, 2005). |
| | | |
| 4(h) | -- | Amended and Restated Assignment of Leases, dated December 14, 2005, by Short Hills Associates L.L.C. to Metropolitan Life Insurance Company (incorporated by reference to Exhibit 4.5 of the Registrant’s Current Report on Form 8-K dated December 16, 2005). |
| | | |
| 4(i) | -- | Amended and Restated Secured Revolving Credit Agreement, dated as of August 9, 2006, by and among Dolphin Mall Associates Limited Partnership, Fairlane Town Center LLC and Twelve Oaks Mall, LLC, as Borrowers, Eurohypo AG, New York Branch, as Administrative Agent and Lead Arranger, and the various lenders and agents on the signature pages thereto (incorporated herein by reference to Exhibit 4.1 filed with the Registrant’s Current Report on Form 8-K dated August 9, 2006). |
| | | |
| 4(j) | -- | Second Amended and Restated Mortgage, Assignment of Leases and Rents and Security Agreement, dated as of August 9, 2006, by and between Dolphin Mall Associates Limited Partnership and Eurohypo AG, New York Branch, as Administrative Agent (incorporated herein by reference to Exhibit 4.5 filed with the Registrant’s Current Report on Form 8-K dated August 9, 2006). |
| 4(k) | -- | Amended and Restated Mortgage, dated as of August 9, 2006, by and between Fairlane Town Center LLC and Eurohypo AG, New York Branch, as Administrative Agent (incorporated herein by reference to Exhibit 4.3 filed with the Registrant’s Current Report on Form 8-K dated August 9, 2006). |
| | | |
| 4(l) | -- | Amended and Restated Mortgage, dated as of August 9, 2006, by and between Twelve Oaks Mall, LLC and Eurohypo AG, New York Branch, as Administrative Agent (incorporated herein by reference to Exhibit 4.4 filed with the Registrant’s Current Report on Form 8-K dated August 9, 2006). |
| | | |
| 4(m) | -- | Guaranty of Payment, dated as of August 9, 2006, by and among The Taubman Realty Group Limited Partnership, Fairlane Town Center LLC and Twelve Oaks Mall, LLC (incorporated herein by reference to Exhibit 4.2 filed with the Registrant’s Current Report on Form 8-K dated August 9, 2006). |
| | | |
| *10(a) | -- | The Taubman Realty Group Limited Partnership 1992 Incentive Option Plan, as Amended and Restated Effective as of September 30, 1997 (incorporated herein by reference to Exhibit 10(b) filed with the Registrant’s Annual Report on Form 10-K for the year ended December 31, 1997). |
| | | |
| *10(b) | -- | First Amendment to The Taubman Realty Group Limited Partnership 1992 Incentive Option Plan as Amended and Restated Effective as of September 30, 1997, effective January 1, 2002 (incorporated herein by reference to Exhibit 10(b) filed with the Registrant’s Annual Report on Form 10-K for the year ended December 31, 2001 (“2001 Form 10-K”)). |
| *10(c) | -- | Second Amendment to The Taubman Realty Group Limited Partnership 1992 Incentive Plan as Amended and Restated Effective as of September 30, 1997 (incorporated herein by reference to Exhibit 10(c) filed with the 2004 Form 10-K). |
| | | |
| *10(d) | -- | Third Amendment to The Taubman Realty Group Limited Partnership 1992 Incentive Plan as Amended and Restated Effective as of September 30, 1997 (incorporated herein by reference to Exhibit 10(d) filed with the 2004 Form 10-K). |
| | | |
| *10(e) | -- | The Form of The Taubman Realty Group Limited Partnership 1992 Incentive Option Plan Option Agreement (incorporated herein by reference to Exhibit 10(e) filed with the 2004 Form 10-K). |
| 10(f) | -- | Master Services Agreement between The Taubman Realty Group Limited Partnership and the Manager (incorporated herein by reference to Exhibit 10(f) filed with the 1992 Form 10-K). |
| | | |
| 10(g) | -- | Amended and Restated Cash Tender Agreement among Taubman Centers, Inc., The Taubman Realty Group Limited Partnership, and A. Alfred Taubman, A. Alfred Taubman, acting not individually but as Trustee of the A. Alfred Taubman Restated Revocable Trust, and TRA Partners, (incorporated herein by reference to Exhibit 10 (a) filed with the 2000 Second Quarter Form 10-Q). |
| | | |
| *10(h) | -- | Supplemental Retirement Savings Plan (incorporated herein by reference to Exhibit 10(i) filed with the Registrant's Annual Report on Form 10-K for the year ended December 31, 1994). |
| | | |
| *10(i) | -- | The Taubman Company Long-Term Compensation Plan (as amended and restated effective January 1, 2000) (incorporated herein by reference to Exhibit 10 (c) filed with the 2000 Second Quarter Form 10-Q). |
| | | |
| *10(j) | -- | First Amendment to the Taubman Company Long-Term Compensation Plan (as amended and restated effective January 1, 2000) (incorporated herein by reference to Exhibit 10(m) filed with the 2004 Form 10-K). |
| | | |
| *10(k) | -- | Second Amendment to the Taubman Company Long-Term Performance Compensation Plan (as amended and restated effective January 1, 2000). |
| | | |
| *10(l) | -- | The Taubman Company 2005 Long-Term Incentive Plan (incorporated herein by reference to the Form DEF14A filed with the Securities and Exchange Commission on April 5, 2005). |
| | | |
| *10(m) | -- | Employment Agreement between The Taubman Company Limited Partnership and Lisa A. Payne (incorporated herein by reference to Exhibit 10 filed with the Registrant’s Quarterly Report on Form 10-Q for the quarter ended March 31, 1997). |
| | | |
| *10(n) | -- | Change of Control Agreement, dated July 17, 2006, by and among the Company, Taubman Realty Group Limited Partnership, and Lisa A. Payne (incorporated herein by reference to Exhibit 10.2 filed with the Registrant’s Current Report on Form 8-K dated July 17, 2006). |
| | | |
| *10(o) | -- | Form of Change of Control Agreement (incorporated herein by reference to Exhibit 10.1 filed with the Registrant’s Current Report on Form 8-K dated July 17, 2006). |
| 10(p) | -- | Second Amended and Restated Continuing Offer, dated as of May 16, 2000. (incorporated herein by reference to Exhibit 10 (b) filed with the 2000 Second Quarter Form 10-Q). |
| | | |
| 10(q) | -- | The Second Amendment and Restatement of Agreement of Limited Partnership of the Taubman Realty Group Limited Partnership dated September 30, 1998 (incorporated herein by reference to Exhibit 10 filed with the Registrant’s Quarterly Report on Form 10-Q dated September 30, 1998). |
| 10(r) | -- | Annex II to Second Amendment to the Second Amendment and Restatement of Agreement of Limited Partnership of The Taubman Realty Group Limited Partnership. (incorporated herein by reference to Exhibit 10(p) filed with Registrant’s Annual Report on Form 10-K for the year ended December 31, 1999 (“1999 Form 10-K”)). |
| | | |
| 10(s) | -- | Annex III to The Second Amendment and Restatement of Agreement of Limited Partnership of The Taubman Realty Group Limited Partnership, dated as of May 27, 2004 (incorporated by reference to Exhibit 10(c) filed with the 2004 Second Quarter Form 10-Q). |
| 10(t) | -- | First Amendment to the Second Amendment and Restatement of Agreement of Limited Partnership of the Taubman Realty Group Limited Partnership dated September 30, 1998 (incorporated herein by reference to Exhibit 10(b) filed with the Registrant’s Quarterly Report on Form 10-Q/A for the quarter ended June 30, 2002 (“2002 Second Quarter Form 10-Q/A”)). |
| | | |
| 10(u) | -- | Second Amendment to the Second Amendment and Restatement of Agreement of Limited Partnership of The Taubman Realty Group Limited Partnership effective as of September 3, 1999 (incorporated herein by reference to Exhibit 10(a) filed with the Registrant’s Quarterly Report on Form 10-Q for the quarter ended September 30, 1999 (“1999 Third Quarter Form 10-Q”)). |
| | | |
| 10(v) | -- | Third Amendment to the Second Amendment and Restatement of Agreement of Limited Partnership of the Taubman Realty Group Limited Partnership, dated May 2, 2003 (incorporated herein by reference to Exhibit 10(a) filed with the Registrant’s Quarterly Report on Form 10-Q for the quarter ended June 30, 2003 (“2003 Second Quarter Form 10-Q”)). |
| | | |
| 10(w) | -- | Fourth Amendment to the Second Amendment and Restatement of Agreement of Limited Partnership of the Taubman Realty Group Limited Partnership, dated December 31, 2003 (incorporated herein by reference to Exhibit 10(x) filed with the Registrant’s Annual Report on Form 10-K for the year ended December 31, 2003). |
| | | |
| 10(x) | -- | Fifth Amendment to the Second Amendment and Restatement of Agreement of Limited Partnership of the Taubman Realty Group Limited Partnership, dated February 1, 2005 (incorporated herein by reference to Exhibit 10.1 filed with the Registrant’s Current Report on Form 8-K filed on February 7, 2005). |
| | | |
| 10(y) | -- | Sixth Amendment to the Second Amendment and Restatement of Agreement of Limited Partnership of the Taubman Realty Group Limited Partnership, dated March 29, 2006 (incorporated herein by reference to Exhibit 10 filed with the Registrant’s Quarterly Report on Form 10-Q for the quarter ended March 31, 2006). |
| | | |
| 10(z) | -- | Amended and Restated Shareholders' Agreement dated as of October 30, 2001 among Taub-Co Management, Inc., The Taubman Realty Group Limited Partnership, The A. Alfred Taubman Restated Revocable Trust, and Taub-Co Holdings LLC (incorporated herein by reference to Exhibit 10(q) filed with the 2001 Form 10-K). |
| | | |
| *10(aa) | -- | The Taubman Realty Group Limited Partnership and The Taubman Company LLC Election and Option Deferral Agreement (incorporated herein by reference to Exhibit 10(r) filed with the 2001 Form 10-K). |
| | | |
| 10(ab) | -- | Operating Agreement of Taubman Land Associates, a Delaware Limited Liability Company, dated October 20, 2006. |
| 10(ac) | -- | Amended and Restated Agreement of Partnership of Sunvalley Associates, a California general partnership (incorporated herein by reference to Exhibit 10(a) filed with the 2002 Second Quarter Form 10-Q/A). |
| *10(ad) | -- | Summary of Compensation for the Board of Directors of Taubman Centers, Inc. (incorporated herein by reference to Exhibit 10.1 filed with the Registrant’s Current Report on Form 8-K dated December 7, 2004). |
| | | |
| *10(ae) | -- | Summary of Compensation for the Board of Directors of Taubman Centers, Inc. |
| | | |
| *10(af) | -- | The Form of The Taubman Company Restricted Stock Unit Award Agreement (incorporated by reference to Exhibit 10 of the Registrant’s Current Report on Form 8-K dated May 18, 2005). |
| | | |
| *10(ag) | -- | The Taubman Centers, Inc. Non-Employee Directors' Deferred Compensation Plan (incorporated by reference to Exhibit 10 of the Registrant’s Current Report on Form 8-K dated May 18, 2005). |
| *10(ah) | -- | The Form of The Taubman Centers, Inc. Non-Employee Directors' Deferred Compensation Plan (incorporated by reference to Exhibit 10 of the Registrant’s Current Report on Form 8-K dated May 18, 2005). |
| | | |
| 12 | -- | Statement Re: Computation of Taubman Centers, Inc. Ratio of Earnings to Combined Fixed Charges and Preferred Dividends. |
| | | |
| 21 | -- | Subsidiaries of Taubman Centers, Inc. |
| | | |
| 24 | -- | Powers of Attorney. |
| | | |
| 31(a) | -- | Certification of Chief Executive Officer pursuant to 15 U.S.C. Section 10A, as adopted pursuant to Section 302 of the Sarbanes-Oxley Act of 2002. |
| | | |
| 31(b) | -- | Certification of Chief Financial Officer pursuant to 15 U.S.C. Section 10A, as adopted pursuant to Section 302 of the Sarbanes-Oxley Act of 2002. |
| | | |
| 32(a) | -- | Certification of Chief Executive Officer pursuant to 18 U.S.C. Section 1350, as adopted pursuant to Section 906 of the Sarbanes-Oxley Act of 2002. |
| | | |
| 32(b) | -- | Certification of Chief Financial Officer pursuant to 18 U.S.C. Section 1350, as adopted pursuant to Section 906 of the Sarbanes-Oxley Act of 2002. |
| | | |
| 99(a) | -- | Debt Maturity Schedule. |
| | | |
| 99(b) | -- | Real Estate and Accumulated Depreciation Schedule of the Unconsolidated Joint Ventures of The Taubman Realty Group Limited Partnership. |
* | A management contract or compensatory plan or arrangement required to be filed. |
15(b) | The list of exhibits filed with this report is set forth in response to Item 15(a)(3). The required exhibit index has been filed with the exhibits. |
15(c) | The financial statement schedules of the Company listed at Item 15(a)(2) are filed pursuant to this Item 15(c). |
TAUBMAN CENTERS, INC.
INDEX TO CONSOLIDATED FINANCIAL STATEMENTS AND
CONSOLIDATED FINANCIAL STATEMENT SCHEDULES
The following consolidated financial statements and consolidated financial statement schedules are included in Item 8 of this Annual Report on Form 10-K:
CONSOLIDATED FINANCIAL STATEMENTS |
| | Management’s Annual Report on Internal Control Over Financial Reporting | F-2 |
| | Reports of Independent Registered Public Accounting Firm | F-3 |
| | Consolidated Balance Sheet as of December 31, 2006 and 2005 | F-5 |
| | Consolidated Statement of Operations for the years ended December 31, 2006, 2005, and 2004 | F-6 |
| | Consolidated Statement of Shareowners’ Equity for the years ended December 31, 2006, 2005 and 2004 | F-7 |
| | Consolidated Statement of Cash Flows for the years ended December 31, 2006, 2005 and 2004 | F-8 |
| | Notes to Consolidated Financial Statements | F-9 |
CONSOLIDATED FINANCIAL STATEMENT SCHEDULES |
| | Schedule II - Valuation and Qualifying Accounts for the years ended December 31, 2006, 2005, and 2004 | F-35 |
| | Schedule III - Real Estate and Accumulated Depreciation | F-36 |
MANAGEMENT'S ANNUAL REPORT ON INTERNAL CONTROL OVER FINANCIAL REPORTING
The management of Taubman Centers, Inc. is responsible for the preparation and integrity of the financial statements and financial information reported herein. This responsibility includes the establishment and maintenance of adequate internal control over financial reporting. The Company’s internal control over financial reporting is designed to provide reasonable assurance that assets are safeguarded, transactions are properly authorized and recorded, and that the financial records and accounting policies applied provide a reliable basis for the preparation of financial statements and financial information that are free of material misstatement.
The management of Taubman Centers, Inc. is required to assess the effectiveness of the Company’s internal control over financial reporting as of December 31, 2006. Management bases this assessment of the effectiveness of its internal control on recognized control criteria, the Internal Control-Integrated Framework issued by the Committee of Sponsoring Organizations of the Treadway Commission (COSO). Management has completed its assessment as of December 31, 2006.
Based on its assessment, management believes that Taubman Centers, Inc. maintained effective internal control over financial reporting as of December 31, 2006. The independent registered public accounting firm, KPMG LLP, that audited the 2006 financial statements included in this annual report have issued an attestation report on management’s assessment of the Company’s system of internal controls over financial reporting, also included herein.
REPORT OF INDEPENDENT REGISTERED PUBLIC ACCOUNTING FIRM
The Board of Directors and Shareowners
Taubman Centers, Inc.:
We have audited the accompanying consolidated balance sheets of Taubman Centers, Inc. (the Company) as of December 31, 2006 and 2005, and the related consolidated statements of operations, shareowners’ equity, and cash flows for each of the years in the three-year period ended December 31, 2006. In connection with our audits of the consolidated financial statements, we also have audited financial statement schedules listed in the Index at Item 15 (a) (2). These consolidated financial statements and financial statement schedules are the responsibility of the Company’s management. Our responsibility is to express an opinion on these consolidated financial statements and financial statement schedules based on our audits.
We conducted our audits in accordance with the standards of the Public Company Accounting Oversight Board (United States). Those standards require that we plan and perform the audit to obtain reasonable assurance about whether the financial statements are free of material misstatement. An audit includes examining, on a test basis, evidence supporting the amounts and disclosures in the financial statements. An audit also includes assessing the accounting principles used and significant estimates made by management, as well as evaluating the overall financial statement presentation. We believe that our audits provide a reasonable basis for our opinion.
In our opinion, the consolidated financial statements referred to above present fairly, in all material respects, the financial position of the Company as of December 31, 2006 and 2005, and the results of its operations and its cash flows for each of the years in the three-year period ended December 31, 2006, in conformity with U.S. generally accepted accounting principles. Also in our opinion, the related financial statement schedules, when considered in relation to the basic consolidated financial statements taken as a whole, present fairly, in all material respects, the information set forth therein.
As discussed in Note 1 to the consolidated financial statements, the Company changed its method of quantifying errors in 2006 pursuant to Staff Accounting Bulletin No. 108, “Considering the Effects of Prior Year Misstatements when Quantifying Misstatements in Current Year Financial Statements.” Also, as discussed in Note 1 to the consolidated financial statements, the Company began consolidating as of January 1, 2006, the entity that owns Cherry Creek Shopping Center, pursuant to the transition methodology provided in Emerging Issues Task Force Issue No. 04-5 “Determining Whether a General Partner, or the General Partners as a Group, Controls a Limited Partnership of Similar Entity When the Limited Partners Have Certain Rights.”
We also have audited, in accordance with the standards of the Public Company Accounting Oversight Board (United States), the effectiveness of the Company’s internal control over financial reporting as of December 31, 2006, based on criteria established in Internal Control—Integrated Framework issued by the Committee of Sponsoring Organizations of the Treadway Commission (COSO), and our report dated February 26, 2007 expressed an unqualified opinion on management’s assessment of, and the effective operation of, internal control over financial reporting.
KPMG LLP
Chicago, Illinois
February 26, 2007
REPORT OF INDEPENDENT REGISTERED PUBLIC ACCOUNTING FIRM
The Board of Directors and Shareowners
Taubman Centers, Inc.:
We have audited management's assessment, included in the accompanying Management’s Annual Report on Internal Control Over Financial Reporting, that Taubman Centers, Inc. (the Company) maintained effective internal control over financial reporting as of December 31, 2006, based on the criteria established in Internal Control—Integrated Framework issued by the Committee of Sponsoring Organizations of the Treadway Commission (COSO). The Company's management is responsible for maintaining effective internal control over financial reporting and for its assessment of the effectiveness of internal control over financial reporting. Our responsibility is to express an opinion on management's assessment and an opinion on the effectiveness of the Company’s internal control over financial reporting based on our audit.
We conducted our audit in accordance with the standards of the Public Company Accounting Oversight Board (United States). Those standards require that we plan and perform the audit to obtain reasonable assurance about whether effective internal control over financial reporting was maintained in all material respects. Our audit included obtaining an understanding of internal control over financial reporting, evaluating management's assessment, testing and evaluating the design and operating effectiveness of internal control, and performing such other procedures as we considered necessary in the circumstances. We believe that our audit provides a reasonable basis for our opinion.
A company's internal control over financial reporting is a process designed to provide reasonable assurance regarding the reliability of financial reporting and the preparation of financial statements for external purposes in accordance with generally accepted accounting principles. A company's internal control over financial reporting includes those policies and procedures that (1) pertain to the maintenance of records that, in reasonable detail, accurately and fairly reflect the transactions and dispositions of the assets of the company; (2) provide reasonable assurance that transactions are recorded as necessary to permit preparation of financial statements in accordance with generally accepted accounting principles, and that receipts and expenditures of the company are being made only in accordance with authorizations of management and directors of the company; and (3) provide reasonable assurance regarding prevention or timely detection of unauthorized acquisition, use, or disposition of the company’s assets that could have a material effect on the financial statements.
Because of its inherent limitations, internal control over financial reporting may not prevent or detect misstatements. Also, projections of any evaluation of effectiveness to future periods are subject to the risk that controls may become inadequate because of changes in conditions, or that the degree of compliance with the policies or procedures may deteriorate.
In our opinion, management's assessment that the Company maintained effective internal control over financial reporting as of December 31, 2006, is fairly stated, in all material respects, based on the criteria established in Internal Control—Integrated Framework issued by the Committee of Sponsoring Organizations of the Treadway Commission (COSO). Also, in our opinion, the Company maintained, in all material respects, effective internal control over financial reporting as of December 31, 2006, based on the criteria established in Internal Control—Integrated Framework issued by the Committee of Sponsoring Organizations of the Treadway Commission (COSO).
We also have audited, in accordance with the standards of the Public Company Accounting Oversight Board (United States), the consolidated balance sheets of the Company as of December 31, 2006 and 2005, and the related consolidated statements of operations, shareowners’ equity, and cash flows, and related financial statement schedules for each of the years in the three-year period ended December 31, 2006, and our report dated February 26, 2007 expressed an unqualified opinion on those consolidated financial statements and related financial statement schedules.
KPMG LLP
Chicago, Illinois
February 26, 2007
TAUBMAN CENTERS, INC.
CONSOLIDATED BALANCE SHEET
(in thousands, except share data)
| | | December 31 |
| | | | 2006 | | | 2005 | |
| Assets: | | | | | | | |
| Properties (Notes 7 and 11) | | $ | 3,398,122 | | $ | 3,081,324 | |
| Accumulated depreciation and amortization (Note 7) | | | (821,384 | ) | | (651,665 | ) |
| | | $ | 2,576,738 | | $ | 2,429,659 | |
| Investment in Unconsolidated Joint Ventures (Note 8) | | | 86,493 | | | 106,117 | |
| Cash and cash equivalents | | | 26,282 | | | 163,577 | |
| Accounts and notes receivable, less allowance for doubtful accounts of $7,581 and $5,497 in 2006 and 2005 (Note 9) | | | 36,650 | | | 41,717 | |
| Accounts and notes receivable from related parties (Note 14) | | | 2,444 | | | 2,400 | |
| Deferred charges and other assets (Note 10) | | | 98,015 | | | 54,110 | |
| | | $ | 2,826,622 | | $ | 2,797,580 | |
| Liabilities: | | | | | | | |
| Notes payable (Note 11) | | $ | 2,319,538 | | $ | 2,089,948 | |
| Accounts payable and accrued liabilities | | | 247,432 | | | 235,410 | |
| Dividends and distributions payable | | | 19,849 | | | 15,819 | |
| Distributions in excess of investments in and net income of Unconsolidated | | | | | | | |
| Joint Ventures (Note 8) | | | 101,944 | | | 101,028 | |
| | | $ | 2,688,763 | | $ | 2,442,205 | |
| Commitments and contingencies (Notes 2, 7,11, 13, 15, and 17) | | | | | | | |
| | | | | | | | |
| Preferred Equity of TRG (Note 16) | | $ | 29,217 | | $ | 29,217 | |
| | | | | | | | |
| Partners' Equity of TRG allocable to minority partners (Note 1) | | | | | | | |
| | | | | | | | |
| Shareowners' Equity (Note 16): | | | | | | | |
Series A Cumulative Redeemable Preferred Stock, $0.01 par value, 8,000,000 shares authorized, $113 million liquidation preference, 4,520,000 shares issued and outstanding at December 31, 2005. No shares outstanding or authorized at December 31, 2006 | | | | | $ | 45 | |
Series B Non-Participating Convertible Preferred Stock, $0.001 par and liquidation value, 40,000,000 shares authorized, 28,113,897 and 29,175,240 shares issued and outstanding at December 31, 2006 and 2005 | | $ | 28 | | | 29 | |
Series G Cumulative Redeemable Preferred Stock, 4,000,000 shares authorized, no par, $100 million liquidation preference, 4,000,000 shares issued and outstanding at December 31, 2006 and 2005 | | | | | | | |
Series H Cumulative Redeemable Preferred Stock, 3,480,000 shares authorized, no par, $87 million liquidation preference, 3,480,000 shares issued and outstanding at December 31, 2006 and 2005 | | | | | | | |
Common Stock, $0.01 par value, 250,000,000 shares authorized, 52,931,594 and 51,866,184 shares issued and outstanding at December 31, 2006 and 2005 | | | 529 | | | 519 | |
| Additional paid-in capital | | | 635,304 | | | 739,090 | |
| Accumulated other comprehensive income (loss) (Note 12) | | | (9,560 | ) | | (9,051 | ) |
| Dividends in excess of net income | | | (517,659 | ) | | (404,474 | ) |
| | | $ | 108,642 | | $ | 326,158 | |
| | | $ | 2,826,622 | | $ | 2,797,580 | |
| | | | | | | | |
See notes to consolidated financial statements.
TAUBMAN CENTERS, INC.
CONSOLIDATED STATEMENT OF OPERATIONS
(in thousands, except share data)
| | | Year Ended December 31 |
| | | | 2006 | | | 2005 | | | 2004 | |
| | | | | | | | | | | |
| Revenues: | | | | | | | | | | |
| Minimum rents | | $ | 311,187 | | $ | 262,106 | | $ | 235,114 | |
| Percentage rents | | | 14,700 | | | 9,835 | | | 6,288 | |
| Expense recoveries | | | 206,190 | | | 164,614 | | | 150,699 | |
| Management, leasing, and development services | | | 11,777 | | | 13,818 | | | 21,333 | |
| Other | | | 35,430 | | | 29,032 | | | 23,381 | |
| | | $ | 579,284 | | $ | 479,405 | | $ | 436,815 | |
| Expenses: | | | | | | | | | | |
| Maintenance, taxes, and utilities | | $ | 152,885 | | $ | 126,395 | | $ | 118,442 | |
| Other operating | | | 71,643 | | | 57,678 | | | 51,462 | |
| Restructuring loss (Note 4) | | | | | | | | | 5,662 | |
| Costs related to unsolicited tender offer, net of recoveries (Note 3) | | | | | | | | | (1,044 | ) |
| Management, leasing, and development services (Note 4) | | | 5,730 | | | 9,072 | | | 17,533 | |
| General and administrative | | | 30,290 | | | 27,746 | | | 26,617 | |
| Interest expense (Note 11) | | | 128,643 | | | 121,612 | | | 95,934 | |
| Depreciation and amortization | | | 137,957 | | | 128,377 | | | 110,180 | |
| | | $ | 527,148 | | $ | 470,880 | | $ | 424,786 | |
| Gains on land sales and interest income | | $ | 9,460 | | $ | 6,457 | | $ | 7,871 | |
| | | | | | | | | | | |
Income before equity in income of Unconsolidated Joint Ventures, gain on disposition of interest in center, discontinued operations, and minority and preferred interests | | $ | 61,596 | | | 14,982 | | | 19,900 | |
| Equity in income of Unconsolidated Joint Ventures (Note 8) | | | 33,544 | | | 42,450 | | | 40,070 | |
Income before gain on disposition of interest in center, discontinued operations, and minority and preferred interests | | $ | 95,140 | | | 57,432 | | | 59,970 | |
| Gain on disposition of interest in center (Note 2) | | | | | | 52,799 | | | | |
| Discontinued operations (Note 2) | | | | | | | | | 328 | |
| Income before minority and preferred interests | | $ | 95,140 | | $ | 110,231 | | $ | 60,298 | |
| Minority share of consolidated joint ventures | | | (10,693 | ) | | (167 | ) | | 18 | |
| Minority interest in TRG: | | | | | | | | | | |
| Minority share of income of TRG | | | (22,816 | ) | | (40,403 | ) | | (14,913 | ) |
| Distributions less than (in excess of) minority share of income | | | (14,054 | ) | | 4,534 | | | (20,781 | ) |
| TRG Series C, D, and F preferred distributions (Note 16) | | | (2,460 | ) | | (2,460 | ) | | (12,244 | ) |
| Net income | | $ | 45,117 | | $ | 71,735 | | $ | 12,378 | |
| Series A, G, H, and I preferred stock dividends (Note 16) | | | (23,723 | ) | | (27,622 | ) | | (17,444 | ) |
| Net income (loss) allocable to common shareowners | | $ | 21,394 | | $ | 44,113 | | $ | (5,066 | ) |
| | | | | | | | | | | |
| Basic earnings per common share (Note 18): | | | | | | | | | | |
| Income (loss) from continuing operations | | $ | .41 | | $ | .87 | | $ | (.11 | ) |
| Net income (loss) | | $ | .41 | | $ | .87 | | $ | (.10 | ) |
| Diluted earnings per common share (Note 18): | | | | | | | | | | |
| Income (loss) from continuing operations | | $ | .40 | | $ | .87 | | $ | (.11 | ) |
| Net income (loss) | | $ | .40 | | $ | .87 | | $ | (.10 | ) |
| | | | | | | | | | | |
| Cash dividends declared per common share | | $ | 1.290 | | $ | 1.160 | | $ | 1.095 | |
| | | | | | | | | | | |
| Weighted average number of common shares outstanding-basic | | | 52,661,024 | | | 50,459,314 | | | 49,021,843 | |
See notes to consolidated financial statements.
TAUBMAN CENTERS, INC.
CONSOLIDATED STATEMENT OF SHAREOWNERS' EQUITY
YEARS ENDED DECEMBER 31, 2006, 2005, AND 2004
(in thousands, except share data)
| | | Preferred Stock | Common Stock | | Additional Paid -In | | | Accumulated Other Comprehensive | | | Dividends in Excess of | | | | |
| | | Shares | | | Amount | | | Shares | | | Amount | | | Capital | | | Income (Loss) | | | Net Income | | | Total | |
| | | | | | | | | | | | | | | | | | | | | | | | | | |
| Balance, January 1, 2004 | | | 37,819,738 | | $ | 110 | | | 49,936,786 | | $ | 499 | | $ | 664,362 | | $ | (12,593 | ) | $ | (330,879 | ) | $ | 321,499 | |
| | | | | | | | | | | | | | | | | | | | | | | | | | |
Issuance of stock pursuant to Continuing Offer (Notes 15 and 17) | | | (565,575 | ) | | | | | 1,256,620 | | | 12 | | | 7,716 | | | | | | | | | 7,728 | |
| Issuance of Series G Preferred Stock, net of issuance costs | | | 4,000,000 | | | | | | | | | | | | 96,729 | | | | | | | | | 96,729 | |
| Release of units (Note 16) | | | | | | | | | | | | | | | 510 | | | | | | | | | 510 | |
| Purchases of stock (Note 16) | | | | | | | | | (2,447,781 | ) | | (24 | ) | | (50,154 | ) | | | | | | | | (50,178 | ) |
| Partnership units issued (Note 16) | | | 460,774 | | | | | | | | | | | | 10,318 | | | | | | | | | 10,318 | |
| Cash dividends declared | | | | | | | | | | | | | | | | | | | | | (71,002 | ) | | (71,002 | ) |
| | | | | | | | | | | | | | | | | | | | | | | | | | |
| Net income | | | | | | | | | | | | | | | | | | | | | 12,378 | | | 12,378 | |
| Other comprehensive income: | | | | | | | | | | | | | | | | | | | | | | | | | |
| Realized loss on interest rate instruments | | | | | | | | | | | | | | | | | | (6,054 | ) | | | | | (6,054 | ) |
| Reduction of loss on interest rate instruments | | | | | | | | | | | | | | | | | | 5,999 | | | | | | 5,999 | |
Reclassification adjustment for amounts recognized in net income | | | | | | | | | | | | | | | | | | 1,261 | | | | | | 1,261 | |
| Total comprehensive income | | | | | | | | | | | | | | | | | | | | | | | $ | 13,584 | |
| Balance, December 31, 2004 | | | 41,714,937 | | $ | 110 | | | 48,745,625 | | $ | 487 | | $ | 729,481 | | $ | (11,387 | ) | $ | (389,503 | ) | $ | 329,188 | |
| | | | | | | | | | | | | | | | | | | | | | | | | | |
Issuance of stock pursuant to Continuing Offer (Notes 15 and 17) | | | (1,932,134 | ) | | (1 | ) | | 3,120,103 | | | 32 | | | 7 | | | | | | | | | 38 | |
| Issuance of Series B Preferred Stock (Note 16) | | | 836,921 | | | | | | | | | | | | | | | | | | | | | | |
| Issuance of Series H Preferred Stock, net of issuance costs | | | 3,480,000 | | | | | | | | | | | | 83,842 | | | | | | | | | 83,842 | |
| Redemption of Series A Preferred Stock | | | (3,480,000 | ) | | (35 | ) | | | | | | | | (83,850 | ) | | | | | | | | (83,885 | ) |
| Release of units (Note 16) | | | | | | | | | | | | | | | 500 | | | | | | | | | 500 | |
| Partnership units issued (Note 16) | | | 555,516 | | | | | | | | | | | | 6,663 | | | | | | | | | 6,663 | |
Share-based compensation under employee and director benefit plans (Note 15) | | | | | | | | | 456 | | | | | | 2,447 | | | | | | 82 | | | 2,529 | |
| Dividend equivalents (Note 15) | | | | | | | | | | | | | | | | | | | | | (165 | ) | | (165 | ) |
| Cash dividends declared | | | | | | | | | | | | | | | | | | | | | (86,623 | ) | | (86,623 | ) |
| | | | | | | | | | | | | | | | | | | | | | | | | | |
| Net income | | | | | | | | | | | | | | | | | | | | | 71,735 | | | 71,735 | |
| Other comprehensive income: | | | | | | | | | | | | | | | | | | | | | | | | | |
| Unrealized gain on interest rate instruments and other | | | | | | | | | | | | | | | | | | 894 | | | | | | 894 | |
Reclassification adjustment for amounts recognized in net income | | | | | | | | | | | | | | | | | | 1,442 | | | | | | 1,442 | |
| Total comprehensive income | | | | | | | | | | | | | | | | | | | | | | | $ | 74,071 | |
| Balance, December 31, 2005 | | | 41,175,240 | | $ | 74 | | | 51,866,184 | | $ | 519 | | $ | 739,090 | | $ | (9,051 | ) | $ | (404,474 | ) | $ | 326,158 | |
| | | | | | | | | | | | | | | | | | | | | | | | | | |
| Cumulative effect of adopting EITF 04-5 (Note 1) | | | | | | | | | | | | | | | | | | | | | (60,226 | ) | | (60,226 | ) |
| Cumulative effect of adopting SAB 108 (Note 1) | | | | | | | | | | | | | | | | | | | | | (5,876 | ) | | (5,876 | ) |
Issuance of stock pursuant to Continuing Offer (Notes 15 and 17) | | | (1,061,343 | ) | | (1 | ) | | 1,061,414 | | | 10 | | | (9 | ) | | | | | | | | | |
| Issuance of Series I Preferred Stock, net of issuance costs | | | 4,520,000 | | | | | | | | | | | | 109,229 | | | | | | | | | 109,229 | |
| Redemption of Series A Preferred Stock | | | (4,520,000 | ) | | (45 | ) | | | | | | | | (108,910 | ) | | | | | | | | (108,955 | ) |
| Redemption of Series I Preferred Stock | | | (4,520,000 | ) | | | | | | | | | | | (109,229 | ) | | | | | | | | (109,229 | ) |
Share-based compensation under employee and director benefit plans (Note 15) | | | | | | | | | 3,996 | | | | | | 5,133 | | | | | | | | | 5,133 | |
| Dividend equivalents (Note 15) | | | | | | | | | | | | | | | | | | | | | (297 | ) | | (297 | ) |
| Cash dividends declared | | | | | | | | | | | | | | | | | | | | | (91,903 | ) | | (91,903 | ) |
| | | | | | | | | | | | | | | | | | | | | | | | | | |
| Net income | | | | | | | | | | | | | | | | | | | | | 45,117 | | | 45,117 | |
| Other comprehensive income: | | | | | | | | | | | | | | | | | | | | | | | | | |
| Unrealized loss on interest rate instruments and other | | | | | | | | | | | | | | | | | | (1,900 | ) | | | | | (1,900 | ) |
Reclassification adjustment for amounts recognized in net income | | | | | | | | | | | | | | | | | | 1,391 | | | | | | 1,391 | |
| Total comprehensive income | | | | | | | | | | | | | | | | | | | | | | | $ | 44,608 | |
| Balance, December 31, 2006 | | | 35,593,897 | | $ | 28 | | | 52,931,594 | | $ | 529 | | $ | 635,304 | | $ | (9,560 | ) | $ | (517,659 | ) | $ | 108,642 | |
See notes to consolidated financial statements.
TAUBMAN CENTERS, INC.
CONSOLIDATED STATEMENT OF CASH FLOWS
(in thousands)
| | | Year Ended December 31 |
| | | | 2006 | | | 2005 | | | 2004 | |
| | | | | | | | | | | |
| Cash Flows From Operating Activities: | | | | | | | | | | |
| Net income | | $ | 45,117 | | $ | 71,735 | | $ | 12,378 | |
| Adjustments to reconcile net income to net cash provided by operating activities: | | | | | | | | | | |
| Minority and preferred interests | | | 50,023 | | | 38,496 | | | 47,920 | |
| Depreciation and amortization | | | 137,957 | | | 128,377 | | | 110,180 | |
| Provision for losses on accounts receivable | | | 5,110 | | | 2,512 | | | 4,103 | |
| Gains on sales of land | | | (4,084 | ) | | (4,833 | ) | | (6,758 | ) |
| Gains on dispositions of interests in centers (Note 2) | | | | | | (52,799 | ) | | (328 | ) |
| Other | | | 7,037 | | | 5,224 | | | (1,754 | ) |
| Increase (decrease) in cash attributable to changes in assets and liabilities: | | | | | | | | | | |
| Receivables, deferred charges, and other assets | | | (7,610 | ) | | (4,349 | ) | | (9,802 | ) |
| Accounts payable and other liabilities | | | (10,070 | ) | | 214 | | | (20,404 | ) |
| Net Cash Provided by Operating Activities | | $ | 223,480 | | $ | 184,577 | | $ | 135,535 | |
| | | | | | | | | | | |
| Cash Flows From Investing Activities: | | | | | | | | | | |
| Additions to properties | | $ | (178,304 | ) | $ | (160,266 | ) | $ | (141,323 | ) |
| Net proceeds from dispositions of interests in centers (Note 2) | | | 9,000 | | | 76,400 | | | | |
| Proceeds from sales of land | | | 5,423 | | | 6,082 | | | 11,539 | |
| Acquisition of interests in centers, net of cash transferred in (Note 2) | | | | | | | | | (61,774 | ) |
| Contributions to Unconsolidated Joint Ventures | | | (25,251 | ) | | (30,350 | ) | | (72,257 | ) |
| Distributions from Unconsolidated Joint Ventures in excess of income | | | 57,583 | | | 17,073 | | | 20,180 | |
| Net Cash Used In Investing Activities | | $ | (131,549 | ) | $ | (91,061 | ) | $ | (243,635 | ) |
| | | | | | | | | | | |
| Cash Flows From Financing Activities: | | | | | | | | | | |
| Debt proceeds | | $ | 585,584 | | $ | 830,818 | | $ | 819,527 | |
| Debt payments | | | (530,522 | ) | | (670,709 | ) | | (571,156 | ) |
| Debt issuance costs | | | (3,475 | ) | | (2,756 | ) | | (11,902 | ) |
| Redemption of preferred stock and repurchase of preferred equity in TRG | | | (226,000 | ) | | (87,000 | ) | | (100,000 | ) |
| Issuance of preferred stock and equity in TRG | | | 113,000 | | | 87,000 | | | 130,000 | |
| Equity issuance costs | | | (607 | ) | | (3,158 | ) | | (4,054 | ) |
Issuance of common stock and/or partnership units in connection with Incentive Option Plan (Notes 15 and 17) | | | | | | 6,701 | | | 10,372 | |
| Contribution from minority interest (Note 2) | | | 9,000 | | | | | | | |
| Repurchase of common stock (Note 16) | | | | | | | | | (50,178 | ) |
| Distributions to minority and preferred interests | | | (95,359 | ) | | (38,329 | ) | | (45,213 | ) |
| Cash dividends to preferred shareowners | | | (19,071 | ) | | (24,507 | ) | | (17,444 | ) |
| Cash dividends to common shareowners | | | (64,130 | ) | | (57,080 | ) | | (53,174 | ) |
| Net Cash Provided By (Used In) Financing Activities | | $ | (231,580 | ) | $ | 40,980 | | $ | 106,778 | |
| | | | | | | | | | | |
| Net Increase (Decrease) In Cash and Cash Equivalents | | $ | (139,649 | ) | $ | 134,496 | | $ | (1,322 | ) |
| | | | | | | | | | | |
| Cash and Cash Equivalents at Beginning of Year | | | 163,577 | | | 29,081 | | | 30,403 | |
| | | | | | | | | | | |
Effect of consolidating Cherry Creek Shopping Center (Note 1) (Cherry Creek Shopping Center's cash balance at beginning of year) | | | 2,354 | | | | | | | |
| | | | | | | | | | | |
| Cash and Cash Equivalents at End of Year | | $ | 26,282 | | $ | 163,577 | | $ | 29,081 | |
See notes to consolidated financial statements.
TAUBMAN CENTERS, INC.
NOTES TO CONSOLIDATED FINANCIAL STATEMENTS
Three Years Ended December 31, 2006
Note 1 - Summary of Significant Accounting Policies
Organization and Basis of Presentation
General
Taubman Centers, Inc. (the Company or TCO), a real estate investment trust, or REIT, is the managing general partner of The Taubman Realty Group Limited Partnership (the Operating Partnership or TRG). The Operating Partnership is an operating subsidiary that engages in the ownership, management, leasing, acquisition, development, and expansion of regional and super-regional retail shopping centers and interests therein. The Operating Partnership's owned portfolio as of December 31, 2006 included 22 urban and suburban shopping centers in ten states. One new center is under construction in Michigan.
In 2005, the Company formed Taubman Asia, which is the platform for its expansion into the Asia-Pacific region. Taubman Asia is headquartered in Hong Kong.
Consolidation
The consolidated financial statements of the Company include all accounts of the Company, the Operating Partnership, and its consolidated subsidiaries, including The Taubman Company LLC (the Manager). The Company consolidates the accounts of the owner of The Mall at Partridge Creek (Partridge Creek) (Note 2), which qualifies as a variable interest entity under FASB Interpretation No. 46 “Consolidation of Variable Interest Entities” (FIN 46R) for which the Operating Partnership is considered to be the primary beneficiary. All intercompany transactions have been eliminated.
Investments in entities not controlled but over which the Company may exercise significant influence (Unconsolidated Joint Ventures) are accounted for under the equity method. The Company has evaluated its investments in the Unconsolidated Joint Ventures and has concluded that the ventures are not variable interest entities as defined in FIN 46R. Accordingly, the Company accounts for its interests in these ventures under the guidance in Statement of Position 78-9 "Accounting for Investments in Real Estate Ventures," (SOP 78-9), as amended by FASB Staff Position 78-9-1, and Emerging Issues Task Force Issue No. 04-5 "Determining Whether a General Partner, or the General Partners as a Group, Controls a Limited Partnership or Similar Entity When the Limited Partners Have Certain Rights" (EITF 04-5). The Company’s partners or other owners in these Unconsolidated Joint Ventures have substantive participating rights, as contemplated by paragraphs 16 through 18 of EITF 04-5, including approval rights over annual operating budgets, capital spending, financing, admission of new partners/members, or sale of the properties and the Company has concluded that the equity method of accounting is appropriate for these interests. Specifically, the Company’s 79% investment in Westfarms is through a general partnership in which the other general partners have approval rights over annual operating budgets, capital spending, refinancing, or sale of the property.
With the issuance of EITF 04-5 and the amendment of SOP 78-9, the Company began consolidating, as of January 1, 2006, the entity that owns Cherry Creek Shopping Center (Cherry Creek), a 50% owned joint venture, pursuant to the transition methodology provided in EITF 04-5. The impact to the balance sheet was an increase in assets of approximately $136 million and liabilities of approximately $199 million, and a $63 million reduction of beginning equity representing the cumulative effects of changes in accounting principles related to Cherry Creek (see also “Adoption of Staff Accounting Bulletin No. 108”). The reduction in beginning equity was the result of the Company's venture partner's $52 million deficit capital account as of December 31, 2005 and the adoption of Staff Accounting Bulletin No. 108 (SAB 108), which increased the venture partner’s deficit capital account to $60 million. The venture partner’s deficit account was recorded at zero in the consolidated balance sheet as of January 1, 2006. The Company’s $3.5 million cumulative impact of adopting SAB 108 that is attributable to Cherry Creek is included in the total cumulative effect of adopting SAB 108 in the Company’s Consolidated Statement of Shareholders’ Equity.
TAUBMAN CENTERS, INC.
NOTES TO CONSOLIDATED FINANCIAL STATEMENTS - (CONTINUED)
The Operating Partnership
At December 31, 2006, the Operating Partnership’s equity included three classes of preferred equity (Series F, G, and H) and the net equity of the partnership unitholders. Net income and distributions of the Operating Partnership are allocable first to the preferred equity interests, and the remaining amounts to the general and limited partners in the Operating Partnership in accordance with their percentage ownership. The Series G and Series H Preferred Equity are owned by the Company and are eliminated in consolidation. The Series F Preferred Equity is owned by an institutional investor. The Company's Series B Preferred Stock is currently held by partners in TRG other than the Company. The Series B Preferred Stock entitles its holders to one vote per share on all matters submitted to the Company’s shareholders and votes together with the common stock on all matters as a single class.
Because the net equity balance (accumulated distributions from operations in excess of net income) of the outside partners in certain of the Company’s consolidated joint ventures is less than zero, $(313) million as of December 31, 2006, the interest of these outside partners is presented as a zero balance in the consolidated balance sheet as of December 31, 2006 and December 31, 2005. The income allocated to these noncontrolling partners is equal to their share of operating distributions as long as the net equity of the partners is less than zero.
The Company accounts for distributions to minority partners that result from financing transactions as a debit balance minority interest upon determination that (1) the distribution was the result of appreciation in the fair value of the property above the book value, (2) the financing was provided at a loan to value ratio commensurate with non-recourse real estate lending, and (3) the excess of the property value over the financing provides support for the eventual recovery of the debit balance minority interest upon sale or disposal of the property. Debit balance minority interests are considered as part of the carrying value of a property, should events or circumstances indicate that the carrying value may not be recoverable.
In May 2006, Cherry Creek refinanced its debt and distributed the excess proceeds to the partners. The joint venture partner's $45 million share of the distributed excess proceeds is classified as minority interest and included in Deferred Charges and Other Assets in the Company's consolidated balance sheet.
Revenue Recognition
Shopping center space is generally leased to tenants under short and intermediate term leases which are accounted for as operating leases. Minimum rents are recognized on the straight-line method. Percentage rent is accrued when lessees' specified sales targets have been met. Most expense recoveries, which include an administrative fee, are recognized as revenue in the period applicable costs are chargeable to tenants. Management, leasing, and development revenue is recognized as services are rendered, when fees due are determinable, and collectibility is reasonably assured. Fees for management, leasing, and development services are established under contracts and are generally based on negotiated rates, percentages of cash receipts, and/or actual costs incurred. Profits on real estate sales are recognized whenever (1) a sale is consummated, (2) the buyer has demonstrated an adequate commitment to pay for the property, (3) the Company’s receivable is not subject to future subordination, and (4) the Company has transferred to the buyer the risks and rewards of ownership. Other revenues, including fees paid by tenants to terminate their leases, are recognized when fees due are determinable, no further actions or services are required to be performed by the Company, and collectibility is reasonably assured. The Company records a provision for losses on accounts receivable to reduce them to the amount estimated to be collectible. Taxes assessed by government authorities on revenue-producing transactions, such as sales, use, and value-added taxes are primarily accounted for on a net basis on the Company’s income statement.
Depreciation and Amortization
Buildings, improvements and equipment are depreciated on straight-line or double-declining balance bases over the estimated useful lives of the assets, which generally range from 3 to 50 years. Capital expenditures that are recoverable from tenants are depreciated over the estimated recovery period. Intangible assets are amortized on a straight-line basis over the estimated useful lives of the assets. Tenant allowances and deferred leasing costs are amortized on a straight-line basis over the lives of the related leases. In the event of early termination of such leases, the unrecoverable net book values of the assets are recognized as depreciation and amortization expense in the period of termination.
TAUBMAN CENTERS, INC.
NOTES TO CONSOLIDATED FINANCIAL STATEMENTS - (CONTINUED)
Capitalization
Direct and indirect costs that are clearly related to the acquisition, development, construction and improvement of properties are capitalized under guidelines of SFAS No. 67, “Accounting for Costs and Initial Rental Operations of Real Estate Projects.” Compensation costs are allocated based on actual time spent on a project. Costs incurred on real estate for ground leases, property taxes and insurance are capitalized during periods in which activities necessary to get the property ready for its intended use are in progress. Interest costs determined under guidelines of SFAS No. 34, “Capitalization of Interest Cost” are capitalized during periods in which activities necessary to get the property ready for its intended use are in progress.
All properties, including those under construction or development and/or owned by Unconsolidated Joint Ventures, are reviewed for impairment on an individual basis whenever events or changes in circumstances indicate that their carrying value may not be recoverable. Impairment of a shopping center owned by consolidated entities is recognized when the sum of expected cash flows (undiscounted and without interest charges) is less than the carrying value of the property. Other than temporary impairment of an investment in an Unconsolidated Joint Venture is recognized when the carrying value of the investment is not considered recoverable based on evaluation of the severity and duration of the decline in value, including the results of discounted cash flow and other valuation techniques. To the extent impairment has occurred, the excess carrying value of the asset over its estimated fair value is charged to income.
In leasing a shopping center space, the Company may provide funding to the lessee through a tenant allowance. In accounting for a tenant allowance, the Company determines whether the allowance represents funding for the construction of leasehold improvements and evaluates the ownership, for accounting purposes, of such improvements. If the Company is considered the owner of the leasehold improvements for accounting purposes, the Company capitalizes the amount of the tenant allowance and depreciates it over the shorter of the useful life of the leasehold improvements or the lease term. If the tenant allowance represents a payment for a purpose other than funding leasehold improvements, or in the event the Company is not considered the owner of the improvements for accounting purposes, the allowance is considered to be a lease incentive and is recognized over the lease term as a reduction of rental revenue. Factors considered during this evaluation usually include (1) who holds legal title to the improvements, (2) evidentiary requirements concerning the spending of the tenant allowance, and (3) other controlling rights provided by the lease agreement (e.g. unilateral control of the tenant space during the build-out process). Determination of the accounting for a tenant allowance is made on a case-by-case basis, considering the facts and circumstances of the individual tenant lease.
Cash and Cash Equivalents
Cash equivalents consist of highly liquid investments with a maturity of 90 days or less at the date of purchase.
Acquisition of Interests in Centers
The cost of acquiring an ownership interest or an additional ownership interest in a center is allocated to the tangible assets acquired (such as land and building) and to any identifiable intangible assets based on their estimated fair values at the date of acquisition. The fair value of the property is determined on an “as-if-vacant” basis. Management considers various factors in estimating the "as-if-vacant" value including an estimated lease up period, lost rents and carrying costs. The identifiable intangible assets would include the estimated value of “in place” leases, above and below market “in place” leases, and tenant relationships. The portion of the purchase price that management determines should be allocated to identifiable intangible assets is amortized over the estimated life of the associated intangible asset (for instance, the remaining life of the associated tenant lease).
Deferred Charges and Other Assets
Direct financing costs are deferred and amortized on a straight-line basis, which approximates the effective interest method, over the terms of the related agreements as a component of interest expense. Direct costs related to successful leasing activities are capitalized and amortized on a straight-line basis over the lives of the related leases. All other deferred charges are amortized on a straight-line basis over the terms of the agreements to which they relate.
TAUBMAN CENTERS, INC.
NOTES TO CONSOLIDATED FINANCIAL STATEMENTS - (CONTINUED)
Share-Based Compensation Plans
On January 1, 2006, the Company adopted Statement No. 123 (Revised) “Share-Based Payment.” As part of its adoption of the Statement with respect to any grant for which vesting accelerates upon retirement, the Company has begun recognizing compensation cost from the date of the grant through the date the employee first becomes eligible to retire, if this period is shorter than the stated vesting period of the grant. In prior periods, the Company recognized compensation cost using the stated vesting period, regardless of retirement eligibility. As the Company had previously applied the fair value recognition provisions of Statement No. 123, the adoption of Statement No. 123 (Revised) did not have a material effect on the Company's results of operations.
Interest Rate Hedging Agreements
All derivatives, whether designated in hedging relationships or not, are recorded on the balance sheet at fair value. If a derivative is designated as a cash flow hedge, the effective portions of changes in the fair value of the derivative are recorded in other comprehensive income (OCI) and are recognized in the income statement when the hedged item affects income. Ineffective portions of changes in the fair value of a cash flow hedge are recognized in the Company’s income as interest expense.
The Company formally documents all relationships between hedging instruments and hedged items, as well as its risk management objectives and strategies for undertaking various hedge transactions. The Company assesses, both at the inception of the hedge and on an ongoing basis, whether the derivatives that are used in hedging transactions are highly effective in offsetting changes in the cash flows of the hedged items.
Income Taxes
The Company operates in such a manner as to qualify as a REIT under the provisions of the Internal Revenue Code; therefore, applicable taxable income is included in the taxable income of its shareowners, to the extent distributed by the Company. To qualify as a REIT, the Company must distribute at least 90% of its REIT taxable income prior to net capital gains to its shareowners and meet certain other requirements. Additionally, no provision for income taxes for consolidated partnerships has been made, as such taxes are the responsibility of the individual partners.
In connection with the Tax Relief Extension Act of 1999, the Company made Taxable REIT Subsidiary elections for all of its corporate subsidiaries pursuant to section 856(I) of the Internal Revenue Code. The Company’s Taxable REIT Subsidiaries are subject to corporate level income taxes which are provided for in the Company’s financial statements.
Deferred tax assets and liabilities reflect the impact of temporary differences between the amounts of assets and liabilities for financial reporting purposes and the bases of such assets and liabilities as measured by tax laws. Deferred tax assets are reduced by a valuation allowance to the amount where realization is more likely than not assured after considering all available evidence, including expected taxable earnings and potential tax planning strategies. The Company’s temporary differences primarily relate to deferred compensation and depreciation.
Finite Life Entity
SFAS No. 150, “Accounting for Certain Financial Instruments with Characteristics of both Liabilities and Equity” establishes standards for classifying and measuring as liabilities certain financial instruments that embody obligations of the issuer and have characteristics of both liabilities and equity. At December 31, 2006, the Company held controlling majority interests in consolidated entities with specified termination dates in 2080 and 2083. The minority owners’ interest in these entities are to be settled upon termination by distribution or transfer of either cash or specific assets of the underlying entity. The estimated fair value of these minority interests were approximately $186.9 million at December 31, 2006, compared to a book value of $(45.5) million, which is classified as Deferred Charges and Other Assets in the Company’s consolidated balance sheet.
Use of Estimates
The preparation of financial statements in conformity with accounting principles generally accepted in the United States of America requires management to make estimates and assumptions that affect the reported amounts of assets, liabilities, and disclosure of contingent assets and liabilities at the date of the financial statements, and the reported amounts of revenues and expenses during the reporting period. Actual results could differ from those estimates.
TAUBMAN CENTERS, INC.
NOTES TO CONSOLIDATED FINANCIAL STATEMENTS - (CONTINUED)
Fair Value of Financial Instruments
The following methods and assumptions were used to estimate the fair value of financial instruments:
The carrying value of cash and cash equivalents, accounts and notes receivable, and accounts payable and accrued liabilities approximates fair value due to the short maturity of these instruments.
The carrying value of variable-rate mortgages and other loans represents their fair values. The fair value of fixed rate mortgage notes and other notes payable is estimated based on quoted market prices, if available. If no quoted market prices are available, the fair value of fixed-rate mortgages and other notes payable are estimated using cash flows discounted at current market rates. The use of different market assumptions and/or estimation methodologies may have a material effect on the estimated fair value amounts.
The fair value of interest rate hedging instruments is the amount that the Company would receive or pay to terminate the agreement at the reporting date.
Segments and Related Disclosures
The Company has one reportable operating segment: it owns, develops, and manages regional shopping centers. The Company has aggregated its shopping centers into this one reportable segment, as the shopping centers share similar economic characteristics and other similarities. The shopping centers are located in major metropolitan areas, have similar tenants (most of which are national chains), are operated using consistent business strategies, and are expected to exhibit similar long-term financial performance. Earnings before interest, taxes, depreciation, and amortization (EBITDA) is often used by the Company's chief operating decision makers in assessing segment performance. EBITDA is believed to be a useful indicator of operating performance as it is customary in the real estate and shopping center business to evaluate the performance of properties on a basis unaffected by capital structure.
No single retail company represents 10% or more of the Company's revenues. Although the Company operates a subsidiary headquartered in Hong Kong, there are not yet any material revenues from customers attributable to a country other than the United States of America.
Adoption of Staff Accounting Bulletin No. 108
In September 2006, the Securities and Exchange Commission published SAB No. 108 “Considering the Effects of Prior Year Misstatements When Quantifying Misstatements in Current Year Financial Statements.” The interpretations in SAB 108 express the SEC’s staff’s views regarding the process of quantifying financial statement misstatements. The staff’s interpretations resulted from their awareness of a diversity in practice as to how the effect of prior year errors were considered in relation to current year financial statements. Through SAB 108, the staff communicated its belief that allowing prior year errors to remain unadjusted on the balance sheet is not in the best interest of the users of financial statements. SAB 108 became effective for the Company for the year ended December 31, 2006.
In adopting SAB 108, the Company changed its methods of evaluating financial statement misstatements from a “rollover” (income statement-oriented) approach to SAB 108’s “dual-method” (both an income statement and balance sheet-oriented) approach. In doing so, the Company identified three misstatements previously considered immaterial to all previous periods under the rollover method but material when evaluated together under the dual-method, as described below. These misstatements were corrected upon adoption of SAB 108.
Accounting for Cherry Creek Ground Rent Prior to 1999
Prior to 1999, Cherry Creek, a venture previously accounted for under the equity method, recognized ground rentals under its 99 year ground lease on a cash basis instead of the straightline method required by Statement of Financial Accounting Standards No. 13, “Accounting for Leases.” This error resulted in the Company overstating its cumulative equity in the net income of Cherry Creek by a total of $3.5 million from the Company’s 1992 acquisition of an interest in the Operating Partnership through December 31, 2005. The maximum misstatement of the Company’s equity in the net income of Cherry Creek in any individual year in this period under the rollover method was $0.3 million.
TAUBMAN CENTERS, INC.
NOTES TO CONSOLIDATED FINANCIAL STATEMENTS - (CONTINUED)
The Company began consolidating Cherry Creek on January 1, 2006 as a result of adopting EITF 04-5 (Note 1). As a result of the correction of the above error, the cumulative effect of a change in accounting principle upon adoption of EITF 04-5, assets, and liabilities recognized by the Company upon the consolidation of Cherry Creek were increased by $7.9 million, $8.3 million and $19.7 million, respectively. Prior to 2006, the Company accounted for its investment in Cherry Creek under the equity method.
Recognition of Payroll Costs
The Company previously recognized its payroll costs in a manner that corresponded to its biweekly pay periods, which do not necessarily end on the last day of the calendar year. Differences caused by not strictly recognizing payroll on a calendar year basis, while previously adjusted on a periodic basis, have resulted in overstatements of net income by a total of $1.0 million over the last decade, with the maximum misstatement in any individual year computed under the rollover method being $0.1 million.
Arizona Mills
In 2006, The Mills Corporation (Mills), which manages the 50% unconsolidated joint venture, Arizona Mills, advised the Company that Mills had identified errors in prior year financial statements, primarily relating to the timing of writeoffs of tenant allowances, that relate to years prior to 2006. The Company has not yet received audited financial statements for any period after 2004 from Mills and amounts identified as errors may change as a result of the eventual completion of the Arizona Mills 2005 audit. However, based on the information received from Mills, the Company has determined that the cumulative impact of its share of prior years’ errors identified by Mills to date is an overstatement of the Company's equity by $1.3 million.
Cumulative Effect of Adopting SAB 108
As a result of applying the guidance in SAB 108, during the year ended December 31, 2006, the Company recorded a $5.9 million reduction to its shareholder’s equity account (dividends in excess of net income) in its opening balance sheet to correct for the effect of the errors associated with the accounting for Cherry Creek’s ground rent prior to 1999, the recognition of payroll costs, and its share of Arizona Mills’s errors identified by Mills, described above.
Modified Useful Lives and Income Statement Reclassifications
During 2006, the Company modified its estimated useful lives of capital assets that are recoverable from its tenants. This change in estimate was a result of the Company's initiative of offering its tenants the option to pay for common area maintenance costs through fixed payments versus the historical practice of a tenant paying an amount equal to its proportionate share of common area costs. The change in useful lives better aligns the depreciation of common area assets with the Company's lease portfolio. This change in estimate did not have a material effect on the current results of operations but could be material in future periods. Beginning in 2006, depreciation on these assets, which was previously included in recoverable expenses, is included in depreciation and amortization.
Also during 2006, the Company began recognizing revenue for marketing and promotion services at the gross amount billed to tenants, rather than a net amount retained (that is, the amount billed to the tenants less the related costs incurred). Revenues are now included in recoveries from tenants and the related expenses in other operating expense. This presentation change was made as a result of the Company’s recent offering to tenants of an option to pay fixed amounts for marketing and promotion of the shopping centers. In evaluating the accounting for marketing and promotion services, the Company considered that there may no longer be a direct relationship between tenant billings and the marketing and promotion costs incurred, as well as the fact that the Company is the primary obligor on the costs incurred. Historically, revenues from marketing and promotion services have been equal to costs incurred.
In addition, the Company now classifies gains on peripheral land sales and interest income separately in its income statement.
Prior year revenues and expenses in the consolidated financial statements and in the combined financial information in Note 8 have been reclassified as described above to be consistent with the 2006 presentation.
TAUBMAN CENTERS, INC.
NOTES TO CONSOLIDATED FINANCIAL STATEMENTS - (CONTINUED)
Other
Dollar amounts presented in tables within the notes to the consolidated financial statements are stated in thousands, except share data or as otherwise noted. Certain reclassifications have been made to 2005 and 2004 amounts to conform to current year classifications.
Note 2 - New Center Development, Disposition, and Acquisitions
New Center Development
Northlake Mall
Northlake Mall (Northlake), a wholly-owned regional center, opened on September 15, 2005 in Charlotte, North Carolina.
The Mall at Partridge Creek
Partridge Creek, a 640,000 square foot center, is under construction in Clinton Township, Michigan. The center will be anchored by Nordstrom, Parisian, and MJR Theatres, and is scheduled to open in October 2007, with Nordstrom opening in spring 2008. In May 2006, the Operating Partnership engaged the services of a third party investor to acquire certain property associated with the project, in order to facilitate a Section 1031 like-kind exchange to provide flexibility for disposing of assets in the future. The third party investor became the owner of the project and leases the land from a subsidiary of the Operating Partnership. In turn, the owner leases the project back to the Operating Partnership.
Funding for the project is provided by the following sources. The Operating Partnership provides approximately 45% of the project funding under a junior subordinated financing. The owner has provided $9 million in equity. Funding for the remaining project costs are being provided by the owner’s third party construction loan (Note 11). The owner's equity contribution, representing minority interest, is included within Accounts Payable and Accrued Liabilities in the Company's consolidated balance sheet.
The Operating Partnership is the construction manager for the project and has an option to purchase the property and assume the ground lease from the owner during the 30-month exchange period ending December 2008. The option, if exercised, will provide the owner a 12% cumulative return on its equity. In the event the Operating Partnership does not exercise its right to purchase the property from the owner, the owner will have the right to sell all of its interest in the property, provided that the purchaser shall assume all of the obligations and be assigned all of the owner's rights under the ground lease, the operating lease, and any remaining obligations under the loans.
The Operating Partnership has guaranteed the lease payments on the operating lease (excluding annual supplemental rent equal to 1.67% of the owner's outstanding equity balance, commencing after the exchange period) as well as completion of the project. The lease payments are structured to cover debt service, ground rent payments, and other expenses of the lessor. The Company consolidates the accounts of the owner. The junior loan and other intercompany transactions are eliminated in consolidation.
The Pier Shops at Caesars
The Pier Shops at Caesars (The Pier) was developed by Gordon Group Holdings LLC (Gordon) and began opening in phases in June 2006. In January 2005, the Company contributed $4 million as a first payment to acquire a 30% interest in the center. The Company is in final negotiations to increase its ownership of The Pier from 30% to 50%. The Company’s original agreement with Gordon specified that the Company would purchase the 30% interest at a 7% capitalization rate based on The Pier’s 2007 net operating income (NOI). The Company has now negotiated that the entire 50% interest will be purchased at a 7% capitalization rate based on 2008 NOI. The Company expects to close on its agreement with Gordon in the first quarter of 2007 when the Company also expects to close on a financing for The Pier, which will pay off the $86 million balance on the existing floating rate loan. The Company assumed full management and leasing of The Pier in January 2007. The Pier is accounted for under the equity method and the Company’s $4 million investment represented an effective 6% interest in 2006 based on relative equity contributions.
TAUBMAN CENTERS, INC.
NOTES TO CONSOLIDATED FINANCIAL STATEMENTS - (CONTINUED)
Disposition
In December 2005, a 50% owned unconsolidated joint venture sold its interest in Woodland for $177.4 million. The Company's $85.4 million share of proceeds was received in cash with the exception of a $9 million 5.40% note receivable, which was repaid in the first quarter of 2006. The cash proceeds from the sale were used in January 2006 to acquire the land for Partridge Creek, as part of a like-kind exchange pursuant to Section 1031 of the Internal Revenue Code and the regulations thereunder ("Section 1031 like-kind exchange"). Additional proceeds were used in February 2006 to purchase the land and real property improvements of The Mall at Oyster Bay (Oyster Bay) development, also as part of a Section 1031 like-kind exchange, and to pay off the outstanding balance on the loan on the property (Note 11). In connection with the sale, the Company entered into a tax indemnification agreement with its joint venture partner (Note 17).
Acquisitions
In July 2004, the Company acquired an additional 23.6% interest in International Plaza for $60.2 million in cash, increasing its ownership in the center to 50.1%. As a result of the acquisition, the Company has a controlling interest in the center and began consolidating its results as of the purchase date. Prior to the acquisition date, the Company accounted for International Plaza under the equity method. As of December 31, 2006, the Operating Partnership has a preferred investment in International Plaza of $22 million, on which an annual preferential return of 8.25% will accrue. In addition to the preferred return on its investment, the Operating Partnership is entitled to receive the balance of its preferred investment before any available cash will be utilized for distribution to the non-preferred partner.
In January 2004, the Company purchased the additional 30% ownership of Beverly Center (Beverly). Consideration of approximately $11 million for this interest consisted of $3.3 million in cash and 276,724 of newly issued partnership units valued at $27.50 per unit. The price of the acquisition was determined pursuant to a 1988 option agreement. The Company had carried the $11 million net exercise price as a liability on its balance sheet. The Company already recognized 100% of the financial results of the center in its financial statements.
Note 3 - Unsolicited Tender Offer
In the fall of 2002, the Company received an unsolicited tender offer seeking to acquire control of the Company. The Company’s Board of Directors rejected the proposal and recommended that the Company’s shareholders not tender their shares pursuant to the tender offer. In October 2003, the tender offer was withdrawn, and the related litigation ended. During 2004, the Company recovered through its insurance $1.0 million relating to the unsolicited tender offer and related litigation.
Note 4 - Management, Leasing, and Development Services
The majority of the Company's third party management, leasing, and development revenue in 2006 and 2005 was derived from two agreements. The first, a management agreement for a shopping center owned by a third party, is renewable year-to-year, and is cancelable by the owner with 90 days written notice. The second is an agreement for retail leasing and development and design advisory services for a mixed-use urban development project scheduled to open in 2009 on the strip in Las Vegas, Nevada. The term of this fixed-fee contract is approximately 25 years, effective June 2005, and is generally cancelable for cause and by the project owner upon payment to the Company of a cancellation fee. In 2007, the Company entered into additional agreements (Note 22) .
In October 2004, the Mills Corporation finalized its acquisition of 50% interests in nine of General Motors Pension Trusts’ (GMPT) shopping centers, completing a recapitalization of GMPT’s mall portfolio. The Company ceased management of these centers on November 1, 2004, subject to an agreement with GMPT. The Company recognized a restructuring charge of $5.7 million during the fourth quarter of 2004 relating to the termination of these management contracts. The restructuring charge is classified in the line item Restructuring loss in the income statements. Substantially all of this charge represented employee severance payments and benefits and were paid as of December 31, 2005.
TAUBMAN CENTERS, INC.
NOTES TO CONSOLIDATED FINANCIAL STATEMENTS - (CONTINUED)
Note 5 - Income Taxes
During the years ended December 31, 2006, 2005, and 2004, the Company's federal income tax expense was zero as a result of net operating losses incurred by the Company’s Taxable REIT Subsidiaries, except as follows related to the sale of Woodland. During 2005, the Company recognized deferred federal income tax expense of $0.5 million in connection with the sale of Woodland. The Company has a net operating loss carryforward from its Taxable REIT Subsidiaries of $0.8 million from 2002 that expires in 2022, and a net operating loss carryforward of $4.6 million ($3.0 million from 2004 that will expire in 2024 and $1.6 million from 2005 that will expire in 2025). The net operating loss carryforward reflects the amount available after utilization of losses to offset the Company’s Taxable REIT Subsidiaries’ federal taxable income of $2.9 million in 2005 and estimated federal taxable income of $3.0 million in 2006. As of December 31, 2006 and 2005 the Company had net deferred tax assets of $3.3 million and $3.2 million, after valuation allowances of $5.6 million and $9.6 million, respectively. The $4.0 million decrease in the valuation allowance for the year ended December 31, 2006 related to tax deductions realized in the current year for the payout of certain deferred compensation that was previously reserved with a valuation allowance and to a reversal of deferred tax assets that have now been determined will not be utilized or recognized by the Company’s Taxable REIT Subsidiaries in the future. The ultimate realization of the net deferred tax asset is dependent upon the Manager’s profitability, the timing and amounts of gains on land sales, the profitability of the Company’s Asian operations, and other factors affecting the results of operations of the Taxable REIT Subsidiaries. During 2006, the Manager was recapitalized with the result that a larger share of its taxable income will be allocated to the Operating Partnership instead of the Company’s Taxable REIT Subsidiaries.
Dividends declared on the Company’s common and preferred stock and their tax status are presented in the following tables. The tax status of the Company’s dividends in 2006, 2005, and 2004 may not be indicative of future periods. The portion of dividends paid in 2005 shown below as capital gains and unrecaptured Section 1250 capital gains are designated as capital gain dividends for tax purposes.
Year | | | Dividends per common share declared | | | Return of capital | | | Ordinary income | | | 15% Rate long term capital gain | | | Unrecaptured Section 1250 capital gains | |
| 2006 | | $ | 1.290 | | $ | 0.0687 | | $ | 1.2006 | | $ | 0.0207 | | | | |
| 2005 | | | 1.160 | | | 0.3179 | | | 0.7282 | | | 0.0404 | | $ | 0.0735 | |
| 2004 | | | 1.095 | | | 0.6932 | | | 0.3835 | | | 0.0183 | | | | |
Year | | | Dividends per Series A Preferred share declared | | | Ordinary income | | | 15% Rate long term capital gain | | | Unrecaptured Section 1250 capital gains | |
| 2006 | | $ | 0.790 | | $ | 0.7770 | | $ | 0.0130 | | | | |
| 2005 | | | 2.075 | | | 1.8712 | | | 0.0723 | | $ | 0.1315 | |
| 2004 | | | 2.075 | | | 2.0403 | | | 0.0347 | | | | |
Year | | | Dividends per Series G Preferred share declared | | | Ordinary income | | | 15% Rate long term capital gain | | | Unrecaptured Section 1250 capital gains | |
| 2006 | | $ | 2.000 | | $ | 1.9679 | | $ | 0.0321 | | | | |
| 2005 | | | 2.000 | | | 1.8036 | | | 0.0697 | | $ | 0.1267 | |
| 2004 | | | 0.211 | | | 0.2076 | | | 0.0035 | | | | |
Year | | | Dividends per Series H Preferred share declared | | | Ordinary income | | | 15% Rate long term capital gain | | | Unrecaptured Section 1250 capital gains | |
| 2006 | | $ | 1.906 | | $ | 1.8757 | | $ | 0.0303 | | | | |
| 2005 | | | 0.953 | | | 0.8595 | | | 0.0332 | | $ | 0.0604 | |
The Company redeemed the remaining 4,520,000 shares of its outstanding Series A Preferred Shares in May 2006 for $25 per share and paid all holders of the Series A Preferred Shares $0.27 per share in accrued dividends, which are reported separately above as a 2006 dividend payment.
TAUBMAN CENTERS, INC.
NOTES TO CONSOLIDATED FINANCIAL STATEMENTS - (CONTINUED)
Note 6 - Investment in the Operating Partnership
The partnership equity of the Operating Partnership and the Company's ownership therein are shown below:
Year | TRG units outstanding at December 31 | TRG units owned by TCO at December 31 (1) | TCO's % interest in TRG at December 31 | TCO's average interest in TRG |
| 2006 | 81,078,700 | 52,931,594 | 65% | 65% |
| 2005 | 81,074,633 | 51,866,184 | 64 | 62 |
| 2004 | 80,514,605 | 48,745,625 | 61 | 61 |
| (1) | There is a one-for-one relationship between TRG units owned by TCO and TCO common shares outstanding; amounts in this column are equal to TCO’s common shares outstanding as of the specified dates. |
Net income and distributions of the Operating Partnership are allocable first to the preferred equity interests (Note 16), and the remaining amounts to the general and limited Operating Partnership partners in accordance with their percentage ownership.
Note 7 - Properties
Properties at December 31, 2006 and December 31, 2005 are summarized as follows:
| | | | 2006 | | | 2005 | |
| Land | | $ | 252,716 | | $ | 248,582 | |
| Buildings, improvements, and equipment | | | 2,915,504 | | | 2,709,215 | |
| Construction in process | | | 100,627 | | | 19,855 | |
| Development pre-construction costs | | | 129,275 | | | 103,672 | |
| | | $ | 3,398,122 | | $ | 3,081,324 | |
| Accumulated depreciation and amortization | | | (821,384 | ) | | (651,665 | ) |
| | | $ | 2,576,738 | | $ | 2,429,659 | |
Buildings and improvements under capital leases were $7.5 million and $13.0 million at December 31, 2006 and 2005, respectively. Amortization of assets under capital leases are included within depreciation expense.
Depreciation expense for 2006, 2005, and 2004 was $128.5 million, $120.7 million, and $102.3 million, respectively.
The charge to operations in 2006, 2005, and 2004 for domestic and non-U.S. pre-development activities was $10.1 million, $8.5 million, and $4.0 million, respectively.
In October 2006, the Company announced that it is seeking a final decision in the Supreme Court of the State of New York (Suffolk County) on the Company’s land use plan to build a mall in Syosset, Long Island, New York. The Company believes it will be successful in this litigation and will ultimately build the mall, which will be anchored by Neiman Marcus, Nordstrom, and Barneys New York. However, if the Company is ultimately unsuccessful it is anticipated that the recovery on this asset would be significantly less than its current investment. The Company’s $128.2 million investment in Oyster Bay as of December 31, 2006 is included in development pre-construction costs.
One shopping center pays annual special assessment levies of a Community Development District (CDD), which provided certain infrastructure assets and improvements. As the amount and period of the special assessments were determinable, the Company capitalized the infrastructure assets and improvements and recognized an obligation for the future special assessments to be levied. At December 31, 2006, the book value of the infrastructure assets and improvements, net of depreciation, was $52.8 million. The related obligation is classified as an accrued liability and had a balance of $64.8 million at December 31, 2006. The fair value of this obligation, derived from quoted market prices, was $70.7 million at December 31, 2006.
TAUBMAN CENTERS, INC.
NOTES TO CONSOLIDATED FINANCIAL STATEMENTS - (CONTINUED)
Note 8 - Investments in Unconsolidated Joint Ventures
General Information
The Company has investments in joint ventures that own shopping centers. The Operating Partnership is the managing general partner or managing member of these Unconsolidated Joint Ventures, except for the ventures that own Arizona Mills, The Mall at Millenia, and Waterside Shops at Pelican Bay (Waterside). The Company began providing certain management services upon the opening of The Pier in June 2006 and assumed full management and leasing responsibility in January 2007 (Note 22).
Shopping Center | Ownership as of December 31, 2006 and 2005 |
| Arizona Mills | 50% |
| Fair Oaks Mall | 50 |
| The Mall at Millenia | 50 |
| The Pier Shops at Caesars | (Note 2) |
| Stamford Town Center | 50 |
| Sunvalley | 50 |
| Waterside Shops at Pelican Bay | 25 |
| Westfarms | 79 |
In October 2006, Taubman Land Associates LLC, a 50% unconsolidated joint venture owned by the Company and an affiliate of the Taubman family, acquired for $42.5 million the land on which Sunvalley is situated. Sunvalley is owned by Sunvalley Associates, a 50% joint venture with a Taubman family affiliate.
The Company's carrying value of its Investment in Unconsolidated Joint Ventures differs from its share of the partnership or members equity reported in the combined balance sheet of the Unconsolidated Joint Ventures due to (i) the Company's cost of its investment in excess of the historical net book values of the Unconsolidated Joint Ventures and (ii) the Operating Partnership’s adjustments to the book basis, including intercompany profits on sales of services that are capitalized by the Unconsolidated Joint Ventures. The Company's additional basis allocated to depreciable assets is recognized on a straight-line basis over 40 years. The Operating Partnership’s differences in bases are amortized over the useful lives of the related assets.
In its consolidated balance sheet, the Company separately reports its investment in joint ventures for which accumulated distributions have exceeded investments in and net income of the joint ventures. The net equity of certain joint ventures is less than zero because distributions are usually greater than net income, as net income includes non-cash charges for depreciation and amortization.
Combined Financial Information
Combined balance sheet and results of operations information is presented in the following table for the Unconsolidated Joint Ventures, followed by the Operating Partnership's beneficial interest in the combined information. In 2006, amounts related to The Pier were included in the combined information of the Unconsolidated Joint Ventures. Beneficial interest is calculated based on the Operating Partnership's ownership interest in each of the Unconsolidated Joint Ventures. The accounts of Woodland, formerly a 50% Unconsolidated Joint Venture sold in 2005, are included in these results through the date of the sale (Note 2). The Company's equity in the gain on the sale of Woodland is separately presented on the Company's income statement, and is therefore excluded from the equity in income of Unconsolidated Joint Ventures line item. The Company began consolidating the entity that owns Cherry Creek in 2006 (Note 1). The accounts of Cherry Creek, previously accounted for under the equity method, are included in these results through December 31, 2005.
TAUBMAN CENTERS, INC.
NOTES TO CONSOLIDATED FINANCIAL STATEMENTS - (CONTINUED)
| | | December 31 |
| | | | 2006 | | | 2005 | |
| Assets: | | | | | | | |
| Properties | | $ | 1,157,872 | | $ | 1,076,743 | |
| Accumulated depreciation and amortization | | | (320,256 | ) | | (363,394 | ) |
| | | $ | 837,616 | | $ | 713,349 | |
| Cash and cash equivalents | | | 35,504 | | | 33,498 | |
| Accounts and notes receivable, less allowance for doubtful accounts of $2,032 and $1,822 in 2006 and 2005 | | | 26,769 | | | 23,189 | |
| Deferred charges and other assets | | | 23,417 | | | 24,458 | |
| | | $ | 923,306 | | $ | 794,494 | |
| | | | | | | | |
| Liabilities and accumulated deficiency in assets: | | | | | | | |
| Notes payable | | $ | 1,097,347 | | $ | 999,545 | |
| Accounts payable and other liabilities | | | 84,177 | | | 59,322 | |
| TRG's accumulated deficiency in assets | | | (163,778 | ) | | (172,554 | ) |
| Unconsolidated Joint Venture Partners' accumulated deficiency in assets | | | (94,440 | ) | | (91,819 | ) |
| | | $ | 923,306 | | $ | 794,494 | |
| | | | | | | | |
| TRG's accumulated deficiency in assets (above) | | $ | (163,778 | ) | $ | (172,554 | ) |
| TRG's investment in The Pier Shops at Caesars | | | | | | 4,663 | |
| TRG basis adjustments, including elimination of intercompany profit | | | 77,797 | | | 80,424 | |
| TCO's additional basis | | | 70,530 | | | 92,556 | |
| Net Investment in Unconsolidated Joint Ventures | | $ | (15,451 | ) | $ | 5,089 | |
| Distributions in excess of investments in and net income of Unconsolidated Joint Ventures | | | 101,944 | | | 101,028 | |
| Investment in Unconsolidated Joint Ventures | | $ | 86,493 | | $ | 106,117 | |
| | | Year Ended December 31 |
| | | | 2006 | | | 2005 | | | 2004 | |
| Revenues | | $ | 253,418 | | $ | 306,239 | | $ | 321,355 | |
| Maintenance, taxes, utilities, and other operating expenses | | $ | 93,452 | | $ | 105,956 | | $ | 113,035 | |
| Interest expense | | | 57,563 | | | 67,590 | | | 74,033 | |
| Depreciation and amortization | | | 43,124 | | | 51,939 | | | 57,385 | |
| Total operating costs | | $ | 194,139 | | $ | 225,485 | | $ | 244,453 | |
| Gain on disposition of interest in center | | | | | $ | 145,881 | | | | |
| Net income | | $ | 59,279 | | $ | 226,635 | | $ | 76,902 | |
| | | | | | | | | | | |
| Net income allocable to TRG | | $ | 34,101 | | $ | 114,680 | | $ | 39,147 | |
| Realized intercompany profit, net of depreciation on TRG’s basis adjustments | | | 1,387 | | | 4,370 | | | 3,963 | |
| TCO's additional basis in Woodland | | | | | | (20,764 | ) | | | |
| Depreciation of TCO's additional basis | | | (1,944 | ) | | (3,037 | ) | | (3,040 | ) |
| Equity in income of Unconsolidated Joint Ventures | | $ | 33,544 | | $ | 95,249 | | $ | 40,070 | |
| TRG's share of gain on disposition of interest in center | | | | | | (52,799 | ) | | | |
| Equity in income of Unconsolidated Joint Venture excluding gain on disposition of interest in center | | | | | $ | 42,450 | | | | |
| | | | | | | | | | | |
| Beneficial interest in Unconsolidated Joint Ventures' operations: | | | | | | | | | | |
| Revenues less maintenance, taxes, utilities, and other operating expenses | | $ | 91,559 | | $ | 113,453 | | $ | 115,230 | |
| Interest expense | | | (31,151 | ) | | (37,594 | ) | | (39,913 | ) |
| Depreciation and amortization | | | (26,864 | ) | | (33,409 | ) | | (35,247 | ) |
| Equity in income of Unconsolidated Joint Ventures | | $ | 33,544 | | $ | 42,450 | | $ | 40,070 | |
TAUBMAN CENTERS, INC.
NOTES TO CONSOLIDATED FINANCIAL STATEMENTS - (CONTINUED)
Other Information
The provision for losses on accounts receivable of the Unconsolidated Joint Ventures was $1.2 million, $0.2 million, and $1.4 million for the years ended December 31, 2006, 2005, and 2004, respectively.
Deferred charges and other assets of $23.4 million at December 31, 2006 were comprised of leasing costs of $24.6 million, before accumulated amortization of $(10.4) million, net deferred financing costs of $5.1 million, and other net charges of $4.1 million. Deferred charges and other assets of $24.5 million at December 31, 2005 were comprised of leasing costs of $34.2 million, before accumulated amortization of $(14.9) million, net deferred financing costs of $3.3 million, and other net charges of $1.8 million.
The estimated fair value of the Unconsolidated Joint Ventures’ notes payable was $1.1 million and $1.0 million at December 31, 2006 and 2005, respectively.
Depreciation expense on properties for 2006, 2005 and 2004 was $40.2 million, $47.4 million and $53.1 million.
Note 9 - Accounts and Notes Receivable
Accounts and notes receivable at December 31, 2006 and December 31, 2005 are summarized as follows:
| | | | 2006 | | | 2005 | |
| Trade | | $ | 25,418 | | $ | 21,052 | |
| Notes | | | 6,044 | | | 15,244 | |
| Straight-line rent | | | 12,120 | | | 10,159 | |
| Other | | | 649 | | | 759 | |
| | | $ | 44,231 | | $ | 47,214 | |
| Less: allowance for doubtful accounts | | | (7,581 | ) | | (5,497 | ) |
| | | $ | 36,650 | | $ | 41,717 | |
Notes receivable as of December 31, 2006 provide interest at a range of interest rates from 6.5% to 8% (with a weighted average interest rate of 7.8% at December 31, 2006) and mature at various dates from July 2007 to June 2009.
Note 10 - Deferred Charges and Other Assets
Deferred charges and other assets at December 31, 2006 and December 31, 2005 are summarized as follows:
| | | | 2006 | | | 2005 | |
| Leasing costs | | $ | 38,196 | | $ | 30,951 | |
| Accumulated amortization | | | (18,825 | ) | | (13,992 | ) |
| | | $ | 19,371 | | $ | 16,959 | |
| Minority interest (Note 1) | | | 45,332 | | | | |
| Deferred financing costs, net | | | 8,126 | | | 10,191 | |
| Intangibles, net | | | 6,085 | | | 8,457 | |
| Investments | | | 3,480 | | | 3,704 | |
| Deferred tax asset, net | | | 3,311 | | | 3,151 | |
| Other, net | | | 12,310 | | | 11,648 | |
| | | $ | 98,015 | | $ | 54,110 | |
Intangible assets are primarily comprised of the fair value of in-place leases recognized in connection with acquisitions (Note 2).
TAUBMAN CENTERS, INC.
NOTES TO CONSOLIDATED FINANCIAL STATEMENTS - (CONTINUED)
Note 11 - Notes Payable
Notes payable at December 31, 2006 and December 31, 2005 consist of the following:
| | | | 2006 | | | 2005 | | | Stated Interest Rate | | Maturity Date | | | Balance Due on Maturity | | | Facility Amount | |
| Beverly Center | | $ | 343,608 | | $ | 347,500 | | | 5.28% | | 02/11/14 | | $ | 303,277 | | | | |
| Cherry Creek Shopping Center | | | 280,000 | | | | (1) | | 5.24% | | 06/08/16 | | | 280,000 | | | | |
| Cherry Creek Shopping Center | | | 800 | | | | (1) | | Prime | | Various | (2) | | 800 | | $ | 2,000 | |
| Dolphin Mall | | | 5,000 | | | | | | LIBOR + 0.70% | | 02/14/09 | | | 5,000 | | | 139,938 | (3) |
| Dolphin Mall | | | | | | 141,311 | | | LIBOR + 2.15% | | | | | | | | | |
| Fairlane Town Center | | | 55,000 | | | | | | LIBOR + 0.70% | | 02/14/09 | | | 55,000 | | | 80,000 | (3) |
| Great Lakes Crossing | | | 142,908 | | | 145,239 | | | 5.25% | | 03/11/13 | | | 125,507 | | | | |
| International Plaza | | | 178,719 | | | 182,135 | | | 4.21% | | 01/08/08 | | | 175,150 | | | | |
| MacArthur Center | | | 138,243 | | | 140,895 | | | 7.59% | | 10/01/10 | | | 126,884 | | | | |
| Northlake Mall | | | 215,500 | | | | | | 5.41% | | 02/06/16 | | | 215,500 | | | | |
| The Mall at Oyster Bay | | | | | | 56,241 | | | LIBOR + 2.00% | | | | | | | | | |
| The Mall at Partridge Creek | | | 22,010 | | | | | | LIBOR + 1.15% | | 09/07/10 | | | 22,010 | | | 81,000 | |
| Regency Square | | | 77,812 | | | 78,792 | | | 6.75% | | 11/01/11 | | | 71,569 | | | | |
| The Mall at Short Hills | | | 540,000 | | | 540,000 | | | 5.47% | | 12/14/15 | | | 540,000 | | | | |
| Stony Point Fashion Park | | | 111,864 | | | 113,228 | | | 6.24% | | 06/01/14 | | | 98,585 | | | | |
| Twelve Oaks Mall | | | | | | | | | LIBOR + 0.70% | | 02/09/07 | | | | | | 130,062 | (3) |
| The Mall at Wellington Green | | | 200,000 | | | 200,000 | | | 5.44% | | 05/06/15 | | | 200,000 | | | | |
| The Shops at Willow Bend | | | | | | 96,405 | | | LIBOR + 1.50% | | | | | | | | | |
| The Shops at Willow Bend | | | | | | 48,202 | | | LIBOR + 3.75% | | | | | | | | | |
| Line of Credit | | | 8,074 | | | | | | Variable Bank Rate | | 02/14/08 | | | 8,074 | | | 40,000 | |
| | | $ | 2,319,538 | | $ | 2,089,948 | | | | | | | | | | | | |
| (1) | Cherry Creek was consolidated as of January 1, 2006 (Note 1). |
| (2) | Loans mature at various dates through 2009. |
| (3) | Subfacility in $350 million revolving credit facility. Sublimits may be reallocated quarterly but not more often than twice a year. |
Notes payable are collateralized by properties with a net book value of $2.1 billion at December 31, 2006 and $2.2 billion at December 31, 2005.
Interest expense for the year ended December 31, 2006 includes a $1.0 million charge for the write-off of financing costs related to the refinancing of the loan on Dolphin Mall (Dolphin) prior to maturity and a $2.1 million charge from the write-off of financing costs related to the pay-off of the loans on The Shops at Willow Bend (Willow Bend) prior to their maturity date. Interest expense for the year ended December 31, 2005 includes a $10.0 million charge in connection with a prepayment premium and the write-off of financing costs related to the refinancing of The Mall at Short Hills (Short Hills), a $0.9 million Northlake loan pay-off, and a $1.8 million debt modification related to the pay-off of an Oyster Bay loan.
The following table presents scheduled principal payments on notes payable as of December 31, 2006:
| 2007 | | $ | 16,556 | |
| 2008 | | | 196,746 | |
| 2009 | | | 74,433 | |
| 2010 | | | 163,057 | |
| 2011 | | | 83,686 | |
| Thereafter | | | 1,785,060 | |
| | | $ | 2,319,538 | |
TAUBMAN CENTERS, INC.
NOTES TO CONSOLIDATED FINANCIAL STATEMENTS - (CONTINUED)
Fair Value of Financial Instruments Related to Debt
The estimated fair values of financial instruments at December 31, 2006 and December 31, 2005 are as follows:
| | | 2006 | 2005 |
| | | | Carrying Value | | | Fair Value | | | Carrying Value | | | Fair Value | |
| Notes payable | | $ | 2,319,538 | | $ | 2,322,828 | | $ | 2,089,948 | | $ | 2,092,034 | |
| Interest rate instruments: | | | | | | | | | | | | | |
| in a receivable position | | | | | | | | | 71 | | | 71 | |
| in a payable position | | | 1,854 | | | 1,854 | | | | | | | |
Debt Covenants and Guarantees
Certain loan agreements contain various restrictive covenants, including minimum net worth requirements, minimum debt service coverage ratios, a maximum payout ratio on distributions, a maximum leverage ratio, a minimum debt yield ratio, and a minimum fixed charges coverage ratio, the latter being the most restrictive. The Operating Partnership is in compliance with all of its covenants. The maximum payout ratio on distributions covenant limits the payment of distributions generally to 95% of funds from operations, as defined in the loan agreement except as required to maintain the Company's tax status, pay preferred distributions, and for distributions related to the sale of certain assets.
Payments of principal and interest on the loans in the following table are guaranteed by the Operating Partnership as of December 31, 2006.
Center | | | Loan balance as of 12/31/06 | | | TRG's beneficial interest in loan balance as of 12/31/06 | | | Amount of loan balance guaranteed by TRG as of 12/31/06 | | | % of loan balance guaranteed by TRG | | | % of interest guaranteed by TRG | |
| | | (in millions of dollars) | | | | | | |
| Dolphin Mall | | | 5.0 | | | 5.0 | | | 5.0 | | | 100 | % | | 100 | % |
| Fairlane Town Center | | | 55.0 | | | 55.0 | | | 55.0 | | | 100 | % | | 100 | % |
| The Mall at Millenia | | | 0.3 | | | 0.2 | | | 0.2 | | | 50 | % | | 50 | % |
| Twelve Oaks Mall | | | - | | | - | | | - | | | 100 | % | | 100 | % |
In 2006, the $350 million revolver was amended by the Company. Under the revised terms, borrowings under the line of credit are primary obligations of the entities owning Dolphin, Fairlane Town Center (Fairlane), and Twelve Oaks Mall (Twelve Oaks), which are the collateral for the line of credit. The Operating Partnership and the entities owning Fairlane and Twelve Oaks are guarantors under the credit agreement.
In addition, the Operating Partnership has guaranteed certain obligations of Partridge Creek (Note 2) and the payment of $3.7 million related to the remaining development costs and certain tenant allowances for Northlake.
The Company is required to escrow cash balances for specific uses stipulated by its lenders, including ground lease payments, taxes, insurance, debt service, capital improvements, leasing costs, and tenant allowances. As of December 31, 2006 and December 31, 2005, the Company’s cash balances restricted for these uses were $2.0 million and $8.5 million, respectively. Such amounts are included within cash and cash equivalents in the Company’s consolidated balance sheet.
Beneficial Interest in Debt and Interest Expense
The Operating Partnership's beneficial interest in the debt, capital lease obligations, capitalized interest, and interest expense of its consolidated subsidiaries and its Unconsolidated Joint Ventures is summarized in the following table. The Operating Partnership's beneficial interest in the Consolidated Subsidiaries excludes debt and interest related to the minority interests in International Plaza (49.9%), MacArthur Center (5%), The Mall at Wellington Green (10%), and Cherry Creek (a 50% consolidated subsidiary as of January 2006). Unconsolidated Joint Venture amounts at the beneficial interest level exclude The Pier.
TAUBMAN CENTERS, INC.
NOTES TO CONSOLIDATED FINANCIAL STATEMENTS - (CONTINUED)
| | | At 100% | At Beneficial Interest |
| | | Consolidated Subsidiaries | | | Unconsolidated Joint Ventures | | | Consolidated Subsidiaries | | | Unconsolidated Joint Ventures | |
| Debt as of: | | | | | | | | | | | | | |
| December 31, 2006 | | $ | 2,319,538 | | $ | 1,097,347 | | $ | 2,063,111 | | $ | 522,180 | |
| December 31, 2005 | | | 2,089,948 | | | 999,545 | | | 1,972,046 | | | 558,443 | |
| | | | | | | | | | | | | | |
| Capital lease obligations as of: | | | | | | | | | | | | | |
| December 31, 2006 | | $ | 7,501 | | $ | 676 | | $ | 7,336 | | $ | 338 | |
| December 31, 2005 | | | 13,014 | | | 1,966 | | | 12,510 | | | 983 | |
| | | | | | | | | | | | | | |
| Capitalized interest: | | | | | | | | | | | | | |
| Year ended December 31, 2006 | | $ | 9,803 | | $ | 4,087 | | $ | 9,797 | | | | |
| Year ended December 31, 2005 | | | 9,940 | | | 3 | | | 9,940 | | $ | 1 | |
| | | | | | | | | | | | | | |
| Interest expense: | | | | | | | | | | | | | |
| Year ended December 31, 2006 | | $ | 128,643 | | $ | 57,563 | | $ | 115,790 | | $ | 31,151 | |
| Year ended December 31, 2005 | | | 121,612 | | | 67,590 | | | 116,082 | | | 37,594 | |
Note 12 - Derivatives
The Company uses derivative instruments primarily to manage exposure to interest rate risks inherent in variable rate debt and refinancings. The Company routinely uses cap, swap, and treasury lock agreements to meet these objectives. None of the Company’s derivatives are designated as fair value hedges. Derivatives not designated as hedges are not speculative and were entered into to manage the Company’s exposure to interest rate movements and other identified risks, but do not meet the strict hedge accounting requirements of FASB Statement No. 133 “Accounting for Derivative Instruments and Hedging Activities.”
The following table presents the effect that derivative instruments had on interest expense and equity in income of Unconsolidated Joint Ventures during the three years ended December 31, 2006:
| | | | 2006 | | | 2005 | | | 2004 | |
| Payments under swap agreements | | | | | $ | 883 | | $ | 5,462 | |
| Receipts under swap agreements | | $ | (121 | ) | | | | | | |
| Adjustment of accumulated other comprehensive income for amounts recognized in net income | | | 1,391 | | | 1,442 | | | 1,262 | |
| Change in fair value of cap agreements not designated as hedges | | | 59 | | | 5 | | | | |
| Net reduction to income | | $ | 1,329 | | $ | 2,330 | | $ | 6,724 | |
As of December 31, 2006, the Company had $7.7 million of net realized losses included in Accumulated OCI, related to terminated derivative instruments, that are being recognized as interest expense over the term of the hedged debt, as follows:
| Hedged Items | | | OCI Amounts | | | Recognition Period | |
| Beverly Center refinancing | | $ | 4,238 | | | January 2004 through December 2013 | |
| Regency Square financing | | | 1,356 | | | November 2001 through October 2011 | |
| Westfarms refinancing | | | 2,066 | | | July 2002 through July 2012 | |
| | | $ | 7,660 | | | | |
Additionally, as of December 31, 2006, the Company had $1.9 million of net unrealized losses included in Accumulated OCI that will be recognized as interest expense over the effective periods of the derivative agreements, as follows:
| Hedged Items | | | OCI Amounts | | | Recognition Period | |
| International Plaza forecasted refinancing | | $ | 1,854 | | | January 2008 through December 2017 | |
| Taubman Land Associates financing | | | 46 | | | January 2007 through October 2012 | |
| | | $ | 1,900 | | | | |
The Company expects that approximately $1.2 million of the $9.6 million in Accumulated OCI at December 31, 2006 will be reclassified from Accumulated OCI and recognized as a reduction of income during 2007.
TAUBMAN CENTERS, INC.
NOTES TO CONSOLIDATED FINANCIAL STATEMENTS - (CONTINUED)
Note 13 - Leases
Shopping center space is leased to tenants and certain anchors pursuant to lease agreements. Tenant leases typically provide for minimum rent, percentage rent, and other charges to cover certain operating costs. Future minimum rent under operating leases in effect at December 31, 2006 for operating centers, assuming no new or renegotiated leases or option extensions on anchor agreements, is summarized as follows:
| 2007 | $298,168 |
| 2008 | 283,198 |
| 2009 | 262,079 |
| 2010 | 242,393 |
| 2011 | 204,436 |
| Thereafter | 719,968 |
Certain shopping centers, as lessees, have ground leases expiring at various dates through the year 2083. In addition, one center has the option to extend the lease term for five 10 year periods. Ground rent expense is recognized on a straight-line basis over the lease terms. The Company also leases its office facilities and certain equipment. Office facility leases expire at various dates through the year 2015. Additionally, two of the leases have 5 year extension options. The Company’s U.S. headquarters is rented from an affiliate of the Taubman family under a 10 year lease, with a 5 year extension option. Rental expense on a straight-line basis under operating leases was $8.3 million in 2006, $6.6 million in 2005, and $7.7 million in 2004. Included in these amounts are related party office rental expense of $2.3 million in both 2006 and 2005, and $2.4 million in 2004. Payables representing straightline rent adjustments under lease agreements were $32.3 million and $30.9 million as of December 31, 2006 and 2005, respectively.
The following is a schedule of future minimum rental payments required under operating leases:
| 2007 | $ 8,125 |
| 2008 | 8,045 |
| 2009 | 7,857 |
| 2010 | 7,831 |
| 2011 | 6,848 |
| Thereafter | 330,803 |
The table above includes $2.4 million in each year from 2007 through 2009, $2.5 million in 2010, and $2.6 million in each year from 2011 through 2014 of related party amounts. Also included in the table above are rentals to a joint venture partner of $0.6 million in 2007, $0.7 million in each year from 2008 through 2011, and $158.4 million thereafter.
Certain shopping centers have entered into lease agreements for property improvements that qualify as capital leases. As of December 31, 2006, future minimum lease payments for these capital leases are as follows:
| 2007 | | $ | 3,865 | |
| 2008 | | | 2,818 | |
| 2009 | | | 1,462 | |
| Total minimum lease payments | | $ | 8,145 | |
| Less amount representing interest | | | (644 | ) |
| Capital lease obligations | | $ | 7,501 | |
Note 14 - Transactions with Affiliates
The Taubman Company LLC (the Manager), which is 99% beneficially owned by the Operating Partnership, provides property management, leasing, development, and other administrative services to the Company, the shopping centers, Taubman affiliates, and other third parties. Accounts receivable from related parties include amounts due from Unconsolidated Joint Ventures or other affiliates of the Company, primarily relating to services performed by the Manager. These receivables include certain amounts due to the Manager related to reimbursement of third party (non-affiliated) costs.
TAUBMAN CENTERS, INC.
NOTES TO CONSOLIDATED FINANCIAL STATEMENTS - (CONTINUED)
During 1997, the Operating Partnership acquired an option from a related party to purchase certain real estate on which the Operating Partnership was exploring the possibility of developing a shopping center. Through December 31, 2000, the Operating Partnership had made payments of $450,000. In 2000, the Operating Partnership decided not to go forward with the project and reached an agreement with the optionor to be reimbursed, at the time of the sale or lease of the real estate, for an amount equal to the lesser of 50% of the project costs to date or $350,000. The Company received $140,000 in 2005 and the remaining $210,000 in 2006.
A. Alfred Taubman and certain of his affiliates receive various property management services from the Manager. For such services, Mr. Taubman and affiliates paid the Manager approximately $1.9 million, $1.6 million, and $1.7 million in 2006, 2005, and 2004, respectively.
Other related party transactions are described in Notes 8, 13, 15, 16, 17, and 22.
Note 15 - Share-Based Compensation and Other Employee Plans
The Company provides certain share-based compensation through an incentive option plan, a long-term incentive plan, and non-employee directors' stock grant and deferred compensation plans. All of the plans were designed to provide additional incentive for the achievement of financial goals and offer additional alignment of the interests of management and/or the directors with those of shareholders. Additionally, the non-employee directors' plans are intended to provide incentives for directors to continue to serve on the board and to attract new directors with outstanding qualifications.
On January 1, 2006, the Company adopted Statement No. 123 (Revised) “Share-Based Payment.” As part of its adoption of the Statement with respect to any grant for which vesting accelerates upon retirement, the Company has begun recognizing compensation cost from the date of the grant through the date the employee first becomes eligible to retire, if this period is shorter than the stated vesting period of the grant. In prior periods, the Company recognized compensation cost using the stated vesting period, regardless of retirement eligibility. As the Company had previously applied the fair value recognition provisions of Statement No. 123, the adoption of Statement No. 123 (Revised) did not have a material effect on the Company's results of operations.
The compensation cost charged to income for the above-mentioned share-based compensation plans was $4.6 million and $2.4 million for the years ended December 31, 2006 and 2005, respectively. Compensation cost capitalized as part of properties and deferred leasing costs for the years ended December 31, 2006 and 2005 was $0.6 million and $0.4 million, respectively. There was no compensation cost charged to income or capitalized in 2004 for the above mentioned plans as all outstanding options were fully vested.
The Company currently recognizes no tax benefits from the recognition of compensation cost or tax deductions incurred upon the exercise or vesting of share-based awards. Any allocations of compensation cost or deduction to the Company’s corporate taxable REIT subsidiaries from the Company's Manager, which is treated as a partnership for federal income tax purposes, have resulted in a valuation allowance being recorded against its net deferred tax asset associated with the temporary differences related to share-based compensation. This is primarily due to prior year cumulative tax net operating losses incurred through the year ended December 31, 2006.
Incentive Options
The Company’s incentive option plan (the Option Plan), which is shareholder approved, permits the grant of options to employees. The Operating Partnership's units issued in connection with the Option Plan are exchangeable for new shares of the Company's common stock under the Continuing Offer (Note 17). Options for 1.1 million partnership units have been granted and are outstanding at December 31, 2006. Of the 1.1 million options outstanding, 0.6 million have vesting schedules with one-third vesting at each of the third, fifth, and seventh years of the grant anniversary, if continuous service has been provided and certain conditions dependent on the Company’s market performance in comparison to its competitors have been met. Substantially all of the other 0.5 million options outstanding have vesting schedules with one-third vesting at each of the first, second, and third years of the grant anniversary, if continuous service has been provided. The options have ten-year contractual terms. As of December 31, 2006, options for 1.1 million Operating Partnership units remain available for grant under the Option Plan.
TAUBMAN CENTERS, INC.
NOTES TO CONSOLIDATED FINANCIAL STATEMENTS - (CONTINUED)
The Company has estimated the value of the options issued during the years ended December 31, 2006 and 2005 using a Black-Scholes valuation model based on the following assumptions:
| | 2006 | 2005 |
| Expected volatility | 20.87%-21.14% | 21.00% |
| Expected dividend yield | 3.50% | 4.00% |
| Expected terms (in years) | 7 | 7 |
| Risk-free interest rate | 4.74%-5.08% | 3.83%-4.15% |
Expected volatility and dividend yields are based on historical volatility and yields of the Company’s stock, respectively, as well as other factors. In developing the assumption of expected term, the Company has considered the vesting and contractual terms as well as the expected terms of options disclosed by members of its peer group. The risk-free rates used are based on the U.S. Treasury yield curves in effect at the times of grants. For the options for which vesting is dependent on the Company's market performance in comparison to its competitors, the Company used a Monte Carlo simulation to estimate the probability of the vesting conditions being met. The Company assumes no forfeitures under the Option Plan due to the small number of participants and low turnover rate. The weighted-average grant-date fair value of all options granted, including those dependent on market performance, during the years ended December 31, 2006 and 2005 was $8.11 and $3.80 per option, respectively.
A summary of option activity under the Option Plan for the years ended December 31, 2006, 2005, and 2004 is presented below:
| | | Number of Options | | | Weighted Average Exercise Price | | | Weighted Average Remaining Contractual Term (in years) | | Range of Exercise Prices | |
| Outstanding at January 1, 2004 | | | 1,405,209 | | $ | 12.15 | | | 4.0 | | $9.69 - $13.14 | |
| Exercised | | | (845,767 | ) | | 12.26 | | | | | | |
| | | | | | | | | | | | | |
| Outstanding at December 31, 2004 | | | 559,442 | | $ | 11.98 | | | 3.7 | | $9.69 - $12.25 | |
| Granted | | | 902,139 | | | 30.09 | | | 9.2 | | | |
| Exercised | | | (559,442 | ) | | 11.98 | | | | | | |
| Forfeited | | | (50,000 | ) | | 29.38 | | | | | | |
| | | | | | | | | | | | | |
| Outstanding at December 31, 2005 | | | 852,139 | | $ | 30.13 | | | 9.2 | | $29.38 - $31.31 | |
| Granted | | | 263,237 | | | 40.37 | | | | | | |
| | | | | | | | | | | | | |
| Outstanding at December 31, 2006 | | | 1,115,376 | | $ | 32.55 | | | 8.5 | | $29.38 - $40.39 | |
| | | | | | | | | | | | | |
| Fully vested options at December 31, 2006 | | | 100,434 | | $ | 31.31 | | | 8.3 | | | |
There were 90,852 options that vested during the year ended December 31, 2006.
The aggregate intrinsic value (the difference between the period end stock price and the option strike price) of options outstanding as of December 31, 2006 was $20.4 million. The aggregate intrinsic value of options fully vested as of December 31, 2006 was $2.0 million.
The total intrinsic value of options exercised during the years ended December 31, 2005 and 2004 was $9.5 million and $10.8 million, respectively. Cash received from option exercises under the Option Plan for the years ended December 31, 2005 and 2004 was $6.7 million and $10.4 million, respectively. No options were exercised in 2006.
As of December 31, 2006 there were 1.0 million nonvested options outstanding, and $2.4 million of total unrecognized compensation cost related to nonvested share-based compensation arrangements granted under the Plan. That cost is expected to be recognized over a weighted-average period of 2.4 years.
TAUBMAN CENTERS, INC.
NOTES TO CONSOLIDATED FINANCIAL STATEMENTS - (CONTINUED)
Under the Option Plan, vested unit options can be exercised by tendering mature units with a market value equal to the exercise price of the unit options. In 2002, Robert S. Taubman, the Company’s chief executive officer, exercised options for 3.0 million units by tendering 2.1 million mature units and deferring receipt of 0.9 million units under the unit option deferral election. As the Company declares distributions, the deferred option units receive their proportionate share of the distributions in the form of cash payments. These deferred option units will remain in a deferred compensation account until Mr. Taubman's retirement or ten years from the date of exercise. Beginning with the ten year anniversary of the date of exercise, the deferred partnership units will be paid in ten annual installments.
Long-Term Incentive Plan
In May 2005, the Company’s shareholders approved the adoption of The Taubman Company 2005 Long-Term Incentive Plan (LTIP). The LTIP allows the Company to make grants of restricted stock units (RSU) to employees. An aggregate of 1.2 million shares of the Company’s common stock remain available for issuance under the LTIP. There were RSU for 0.3 million shares outstanding at December 31, 2006. Each RSU represents the right to receive upon vesting one share of the Company’s common stock plus a cash payment equal to the aggregate cash dividends that would have been paid on such share of common stock from the date of grant of the award to the vesting date. Each RSU is valued at the closing price of the Company's common stock on the grant date.
A summary of activity under the LTIP is presented below:
| | | Restricted Stock Units | | | Weighted-Average Grant Date Fair Value | |
| Outstanding at January 1, 2005 | | | | | | | |
| Granted | | | 140,440 | | | $31.31 | |
| Forfeited | | | (1,536 | ) | | 31.31 | |
| Outstanding at December 31, 2005 | | | 138,904 | | | 31.31 | |
| Granted | | | 131,698 | | | 40.38 | |
| Forfeited | | | (4,999 | ) | | 33.84 | |
| Redeemed | | | (3,918 | ) | | 33.53 | |
| Outstanding at December 31, 2006 | | | 261,685 | | | 35.79 | |
The total intrinsic value of RSU redeemed during the year ended December 31, 2006 was $0.1 million. No options were redeemed during the year ended December 31, 2005.
These RSU vest on the third year anniversary of the grant if continuous service has been provided for that period, or upon retirement if earlier. Based on an analysis of historical employee turnover, the Company has made an annual forfeiture assumption of 2.4% of grants when recognizing compensation costs relating to the RSU.
All of the RSU outstanding at December 31, 2006 were nonvested. As of December 31, 2006, there was $5.0 million of total unrecognized compensation cost related to nonvested RSU outstanding under the LTIP. This cost is expected to be recognized over an average period of 1.9 years.
Non-Employee Directors’ Stock Grant and Deferred Compensation Plans
In May 2005, the Company’s shareholders approved the adoption of the Taubman Centers, Inc. Non-Employee Directors’ Stock Grant Plan (SGP). The SGP provides for the annual grant to each non-employee director of the Company shares of the Company’s common stock having an annual fair market value of $15,000 in 2006 and determined based on the fair value of the Company's common stock on the last business day of the preceding quarter. The Company has authorized 50,000 shares of the Company's common stock for issuance under the SGP. As of December 31, 2006, 1,198 shares have been issued under the SGP. Certain directors have elected to defer receipt of their shares as described below. In December 2006, the annual grant to each non-employee director for 2007 was increased to shares of the Company’s common stock having a fair market value of $50,000.
TAUBMAN CENTERS, INC.
NOTES TO CONSOLIDATED FINANCIAL STATEMENTS - (CONTINUED)
Also in May 2005, the Board of Directors of the Company approved the adoption of the Taubman Centers, Inc. Non-Employee Directors’ Deferred Compensation Plan (DCP). The DCP allows each non-employee director of the Company the right to defer the receipt of all or a portion of his or her annual director retainer until the termination of his or her service on the Company’s Board of Directors and for such deferred compensation to be denominated in restricted stock units, representing the right to receive shares of the Company’s common stock at the end of the deferral period. The Company has authorized 175,000 shares of common stock for issuance under the DCP. During the deferral period, when the Company pays cash dividends on its common stock, the directors’ deferral accounts will be credited with dividend equivalents on their deferred restricted stock units, payable in additional restricted stock units based on the then-fair market value of the Company’s common stock. There were 7,981 restricted stock units outstanding under the DCP at December 31, 2006.
Other Employee Plans
As of December 31, 2006 and 2005 the Company had fully vested awards outstanding for 77,610 and 89,938 notional shares of stock, respectively, under a previous long-term performance compensation plan. These awards will be settled in cash based on a twenty day average of the market value of the Company's common stock. The cash payment on these cumulative units remaining has been deferred by employees until retirement or termination. The liability for the eventual payout of these awards is marked to market quarterly based on the twenty day average of the Company's stock price. The Company recorded compensation costs of $1.1 million, $0.6 million, and $2.6 million relating to these awards for the years ended December 31, 2006, 2005, and 2004, respectively. The Company paid $0.5 million, $6.0 million, and $0.3 million of this deferred liability during the years ended December 31, 2006, 2005, and 2004, respectively.
The Company has a voluntary retirement savings plan established in 1983 and amended and restated effective January 1, 2001 (the Plan). The Plan is qualified in accordance with Section 401(k) of the Internal Revenue Code (the Code). The Company contributes an amount equal to 2% of the qualified wages of all qualified employees and matches employee contributions in excess of 2% up to 7% of qualified wages. In addition, the Company may make discretionary contributions within the limits prescribed by the Plan and imposed in the Code. Costs relating to the Plan were $1.7 million in 2006, $1.6 million in 2005, and $1.9 million in 2004.
Note 16 - Common and Preferred Stock and Equity of TRG
Outstanding Preferred Stock and Equity
The Company is obligated to issue to the minority interest, upon subscription, one share of Series B Non-Participating Convertible Preferred Stock (Series B Preferred Stock) for each of the Operating Partnership units held by the minority interest. Each share of Series B Preferred Stock entitles the holder to one vote on all matters submitted to the Company's shareholders. The holders of Series B Preferred Stock, voting as a class, have the right to designate up to four nominees for election as directors of the Company. On all other matters, including the election of directors, the holders of Series B Preferred Stock will vote with the holders of common stock. The holders of Series B Preferred Stock are not entitled to dividends or earnings of the Company. Under certain circumstances, the Series B Preferred Stock is convertible into common stock at a ratio of 14,000 shares of Series B Preferred Stock for one share of common stock. During the years ended December 31, 2006, 2005, and 2004, 1,061,343 shares, 1,932,134 shares, and 565,575 shares, respectively, of Series B Preferred Stock were converted to 71 shares, 130 shares, and 38 shares, respectively, of the Company’s common stock as a result of tenders of units under the Continuing Offer (Note 17).
The Operating Partnership’s $30 million 8.2% Cumulative Redeemable Preferred Partnership Equity (Series F Preferred Equity) is owned by institutional investors, and has no stated maturity, sinking fund, or mandatory redemption requirements. The Company, beginning in May 2009 can redeem the Series F Preferred Equity. The holders of Series F Preferred Equity have the right, beginning in 2014, to exchange $100 in liquidation value of such equity for one share of Series F Preferred Stock. The terms of the Series F Preferred Stock are substantially similar to those of the Series F Preferred Equity. The Series F Preferred Stock is non-voting.
TAUBMAN CENTERS, INC.
NOTES TO CONSOLIDATED FINANCIAL STATEMENTS - (CONTINUED)
The 8.0% Series G Cumulative Redeemable Preferred Stock (Series G Preferred Stock), which was issued in 2004, has no stated maturity, sinking fund, or mandatory redemption requirements and is not convertible into any other security of the Company. The Series G Preferred Stock has liquidation preferences of $100 million ($25 per share). Dividends are cumulative and are payable in arrears on or before the last day of each calendar quarter. All accrued dividends have been paid. The Series G Preferred Stock will be redeemable by the Company at $25 per share, plus accrued dividends, beginning in November 2009. The Company owns corresponding Series G Preferred Equity interests in the Operating Partnership that entitle the Company to income and distributions (in the form of guaranteed payments) in amounts equal to the dividends payable on the Company's Series G Preferred Stock. The Series G Preferred Stock is non-voting.
The $87 million 7.625% Series H Cumulative Redeemable Preferred Stock (Series H Preferred Stock), which was issued in 2005, has no stated maturity, sinking fund, or mandatory redemption requirements and are not convertible into any other security of the Company. Dividends are cumulative and are payable in arrears on or before the last day of each calendar quarter. All accrued dividends have been paid. The Series H Preferred Stock will be redeemable by the Company at $25 per share (par), plus accrued dividends, beginning in July 2010. The Company owns corresponding Series H Preferred Equity interests in the Operating Partnership that entitle the Company to income and distributions (in the form of guaranteed payments) in amounts equal to the dividends payable on the Company’s Series H Preferred Stock. The Series H Preferred Stock is non-voting.
In connection with the Company’s 1999 acquisition of Lord Associates, a retail leasing firm, partnership units and Series B Preferred stock were being released over a five-year period ending in January 2005, with $0.5 million having been released in both 2005 and 2004. Such amounts were recognized as compensation expense.
Redemption of Preferred Stock and Equity
In May 2006, the Company redeemed all of the remaining 8.3% Series A Preferred Stock (Series A Preferred Stock) at a price of $25.27 per share, which included accrued and unpaid dividends. The Company previously had $113 million or 4,520,000 shares of its Series A Preferred Stock outstanding. Emerging Issues Task Force Topic D-42, “The Effect on the Calculation of Earnings Per Share for the Redemption or Induced Conversion of Preferred Stock,” provides that any excess of the fair value of the consideration transferred to the holders of preferred stock redeemed over the carrying amount of the preferred stock should be subtracted from net earnings to determine net earnings available to common stockholders. As a result of application of Topic D-42, the Company recognized a charge of $4.0 million in the second quarter of 2006, representing the difference between the carrying value and the redemption price of the Series A Preferred Stock.
This Series A Preferred Stock was redeemed with the proceeds of a $113 million private preferred stock issuance, the Series I Cumulative Redeemable Preferred Stock (Series I Preferred Stock). The Series I Preferred Stock paid dividends at a floating rate equal to 3-month LIBOR plus 1.25%, an effective rate of 6.4225% for the period the shares were outstanding. The Company redeemed the Series I Preferred Stock on June 30, 2006, using available cash. The Company recognized a charge of $0.6 million at that time, representing the difference between the carrying value, which includes original issuance costs, and the redemption price of the Series I Preferred Stock.
In July 2005, the Company redeemed 3,480,000 shares of its 8,000,000 outstanding Series A Preferred Stock for $87 million. As a result of application of Topic D-42, the Company recognized a charge of $3.1 million in 2005, representing the difference between the carrying value and the redemption price of the shares of Series A Preferred Stock.
During November 2004, the Operating Partnership's Series C and Series D Preferred Equity were redeemed by the Company. The excess of the $100 million redemption value over the $97.3 million book value was recorded as a preferred distribution in the Company's results of operations for 2004.
Common Stock and Equity
In December 2005, the Company's Board of Directors authorized the purchase of up to $50 million of the Company's common stock on the open market. For each share of stock repurchased, an equal number of Operating Partnership units will be redeemed. There were no purchases under this program in 2006 or 2005. Repurchases of common stock will be financed through general corporate funds and through borrowings under existing lines of credit. During 2004 the Company repurchased shares of its common stock under a previous buyback program.
TAUBMAN CENTERS, INC.
NOTES TO CONSOLIDATED FINANCIAL STATEMENTS - (CONTINUED)
In January 2004, 276,724 additional partnership units were issued in connection with the acquisition of the 30% interest in Beverly (Note 2).
Note 17 - Commitments and Contingencies
At the time of the Company's initial public offering and acquisition of its partnership interest in the Operating Partnership, the Company entered into an agreement (the Cash Tender Agreement) with A. Alfred Taubman, who owns an interest in the Operating Partnership, whereby he has the annual right to tender to the Company units of partnership interest in the Operating Partnership (provided that the aggregate value is at least $50 million) and cause the Company to purchase the tendered interests at a purchase price based on a market valuation of the Company on the trading date immediately preceding the date of the tender. The Company will have the option to pay for these interests from available cash, borrowed funds, or from the proceeds of an offering of the Company's common stock. Generally, the Company expects to finance these purchases through the sale of new shares of its stock. The tendering partner will bear all market risk if the market price at closing is less than the purchase price and will bear the costs of sale. Any proceeds of the offering in excess of the purchase price will be for the sole benefit of the Company. At A. Alfred Taubman's election, his family and certain others may participate in tenders.
The Company accounts for the Cash Tender Agreement between the Company and Mr. Taubman as a freestanding written put option. As the option put price is defined by the current market price of the Company's stock at the time of tender, the fair value of the written option defined by the Cash Tender Agreement is considered to be zero.
Based on a market value at December 31, 2006 of $50.86 per common share, the aggregate value of interests in the Operating Partnership that may be tendered under the Cash Tender Agreement was approximately $1.3 billion. The purchase of these interests at December 31, 2006 would have resulted in the Company owning an additional 31% interest in the Operating Partnership.
The Company has made a continuing, irrevocable offer to all present holders (other than certain excluded holders, including A. Alfred Taubman), assignees of all present holders, those future holders of partnership interests in the Operating Partnership as the Company may, in its sole discretion, agree to include in the continuing offer, and all existing and future optionees under the Operating Partnership's incentive option plan to exchange shares of common stock for partnership interests in the Operating Partnership (the Continuing Offer). Under the Continuing Offer agreement, one unit of the Operating Partnership interest is exchangeable for one share of the Company's common stock.
The disposition of Woodland in 2005 by one of the Company's Unconsolidated Joint Ventures was structured in a tax efficient manner to facilitate the investment of the Company's share of the sales proceeds in a like-kind exchange in accordance with Section 1031 of the Internal Revenue Code and the regulations thereunder. The structuring of the disposition has included the continued existence and operation of the partnership that previously owned the shopping center. In connection with the disposition, the Company entered into a tax indemnification agreement with the Woodland joint venture partner, a life insurance company. Under this tax indemnification agreement, the Company has agreed to indemnify the joint venture partner in the event an unfavorable tax determination is received as a result of the structuring of the sale in the tax efficient manner described. The maximum amount that the Company could be required to pay under the indemnification is equal to the taxes incurred by the joint venture partner as a result of the unfavorable tax determination by the IRS or the state of Michigan within their respective three and four year statutory assessment limitation periods, in excess of those that would have otherwise been due if the Unconsolidated Joint Venture had sold Woodland, distributed the cash sales proceeds, and liquidated the owning entities. The Company cannot reasonably estimate this maximum amount of the indemnity, as the Company is not privy to or does not have knowledge of its joint venture partner's tax basis or tax attributes in the Woodland entities or its life insurance-related assets. However, the Company believes that the probability of having to perform under the tax indemnification agreement is remote. The Company and the Woodland joint venture partner have also indemnified each other for their shares of costs or revenues of operating or selling the shopping center in the event additional costs or revenues are subsequently identified.
TAUBMAN CENTERS, INC.
NOTES TO CONSOLIDATED FINANCIAL STATEMENTS - (CONTINUED)
Neither the Company, its subsidiaries, nor any of its joint ventures is presently involved in any material litigation, nor, to its knowledge, is any material litigation threatened against the Company, its subsidiaries, or any of the properties. Except for routine litigation involving present or former tenants (generally eviction or collection proceedings), substantially all litigation is covered by liability insurance. See also Notes 3 and 7.
See Note 2 regarding obligations and commitments related to Partridge Creek and The Pier and Note 11 for the Operating Partnership's guarantees of certain notes payable and other obligations.
Note 18 - Earnings Per Share
Basic earnings per share amounts are based on the weighted average of common shares outstanding for the respective periods. Diluted earnings per share amounts are based on the weighted average of common shares outstanding plus the dilutive effect of common stock equivalents. Common stock equivalents include outstanding partnership units exchangeable for common shares under the Continuing Offer (Note 17), outstanding options for units of partnership interest under the Operating Partnership’s incentive option plan, RSU under the LTIP and DCP (Note 15), and unissued partnership units under unit option deferral elections. In computing the potentially dilutive effect of these common stock equivalents, partnership units are assumed to be exchanged for common shares under the Continuing Offer, increasing the weighted average number of shares outstanding. The potentially dilutive effects of partnership units outstanding and/or issuable under the unit option deferral elections are calculated using the if-converted method, while the effects of other common stock equivalents are calculated using the treasury stock method.
As of December 31, 2006, there were 10.4 million partnership units outstanding and 0.9 million unissued partnership units under unit option deferral elections, which may be exchanged for common shares of the Company under the Continuing Offer (Note 17). Outstanding partnership units and unissued units were excluded from the computation of diluted earnings per share as they were anti-dilutive in all periods presented. These outstanding units and unissued units could only be dilutive to earnings per share if the minority interests' ownership share of the Operating Partnership's income was greater than their share of distributions.
| | | Year Ended December 31 |
| | | | 2006 | | | 2005 | | | 2004 | |
| Income (loss) from continuing operations allocable to common shareowners (Numerator): | | | | | | | | | | |
| Net income (loss) allocable to common shareowners | | $ | 21,394 | | $ | 44,113 | | $ | (5,066 | ) |
| Common shareowners' share of discontinued operations | | | | | | | | | (199 | ) |
| Basic/diluted income (loss) from continuing operations | | $ | 21,394 | | $ | 44,113 | | $ | (5,265 | ) |
| | | | | | | | | | | |
| Shares (Denominator) - basic | | | 52,661,024 | | | 50,459,314 | | | 49,021,843 | |
| Effect of dilutive securities | | | 318,429 | | | 70,825 | | | | |
| Shares (Denominator) - diluted | | | 52,979,453 | | | 50,530,139 | | | 49,021,843 | |
| | | | | | | | | | | |
| Income (loss) from continuing operations per common share: | | | | | | | | | | |
| Basic | | $ | 0.41 | | $ | 0.87 | | $ | (0.11 | ) |
| Diluted | | $ | 0.40 | | $ | 0.87 | | $ | (0.11 | ) |
| | | | | | | | | | | |
| Discontinued operations per common share: | | | | | | | | | | |
| Basic | | | | | | | | $ | 0.00 | |
| Diluted | | | | | | | | $ | 0.00 | |
Note 19 - Cash Flow Disclosures and Non-Cash Investing and Financing Activities
Interest paid in 2006, 2005, and 2004, net of amounts capitalized of $9.8 million, $9.9 million, and $6.0 million, respectively, approximated $119.8 million, $112.0 million, and $93.7 million, respectively. The following non-cash investing and financing activities occurred during 2006, 2005, and 2004:
| | | | 2006 | | | 2005 | | | 2004 | |
| Non-cash additions to properties | | $ | 24,051 | | $ | 50,844 | | $ | 38,020 | |
| Note receivable on Woodland sale (Note 2) | | | | | | 9,000 | | | | |
| Capital lease obligations | | | | | | 91 | | | 4,559 | |
| Issuance of partnership units in connection with acquisition (Note 2) | | | | | | | | | 7,674 | |
TAUBMAN CENTERS, INC.
NOTES TO CONSOLIDATED FINANCIAL STATEMENTS - (CONTINUED)
Non-cash additions to properties primarily represent accrued construction and tenant allowance costs of new centers and development projects. Additionally, consolidated assets increased upon consolidation of the accounts of Cherry Creek in 2006 (Note 1) and the accounts of International Plaza in 2004 (Note 2).
Note 20 - Quarterly Financial Data (Unaudited)
The following is a summary of quarterly results of operations for 2006 and 2005:
| | | 2006 (1) |
| | | First Quarter | | | Second Quarter | | | Third Quarter | | | Fourth Quarter | |
| Revenues | | $ | 138,021 | | $ | 139,276 | | $ | 138,913 | | $ | 163,074 | |
| Equity in income of Unconsolidated Joint Ventures | | | 8,471 | | | 7,412 | | | 7,082 | | | 10,579 | |
| Income before minority and preferred interests | | | 21,408 | | | 20,972 | | | 17,561 | | | 35,199 | |
| Net income | | | 11,434 | | | 7,791 | | | 5,024 | | | 20,868 | |
| Net income (loss) allocable to common shareowners | | | 5,431 | | | (2,612 | ) | | 1,366 | | | 17,209 | |
| Basic earnings per common share - | | | | | | | | | | | | | |
| Net income (loss) | | $ | 0.10 | | $ | (0.05 | ) | $ | 0.03 | | $ | 0.33 | |
| Diluted earnings per common share - | | | | | | | | | | | | | |
| Net income (loss) | | $ | 0.10 | | $ | (0.05 | ) | $ | 0.03 | | $ | 0.32 | |
| | 2005 (2) |
| | | | First Quarter | | | Second Quarter | | | Third Quarter | | | Fourth Quarter | |
| Revenues | | $ | 112,157 | | $ | 117,206 | | $ | 114,159 | | $ | 135,883 | |
| Equity in income of Unconsolidated Joint Ventures | | | 9,070 | | | 9,372 | | | 9,268 | | | 14,740 | |
| Income before minority and preferred interests | | | 18,216 | | | 11,227 | | | 9,752 | | | 71,036 | |
| Net income | | | 8,420 | | | 1,636 | | | 288 | | | 61,391 | |
| Net income (loss) allocable to common shareowners | | | 2,270 | | | (4,514 | ) | | (9,030 | ) | | 55,387 | |
| Basic earnings per common share - | | | | | | | | | | | | | |
| Net income (loss) | | $ | 0.05 | | $ | (0.09 | ) | $ | (0.18 | ) | $ | 1.09 | |
| Diluted earnings per common share - | | | | | | | | | | | | | |
| Net income (loss) | | $ | 0.05 | | $ | (0.09 | ) | $ | (0.18 | ) | $ | 0.93 | |
| (1) | Amounts include a $2.1 million charge incurred in the first quarter of 2006 in connection with the write-off of financing costs related to the refinancing of the loan on Willow Bend prior to maturity, charges of $4.6 million from the second quarter of 2006 associated with the redemption of the remaining $113 million of the Series A Preferred Stock and the redemption of the Series I Preferred Stock, and a $1.0 million charge from the third quarter of 2006 incurred due to the write-off of financing costs related to the refinancing of the loan on Dolphin prior to maturity. |
| (2) | Amounts include a $3.1 million charge incurred in connection with the redemption of $87 million of Series A stock in the third quarter of 2005, and $12.7 million of charges incurred during the fourth quarter of 2005 in connection with a prepayment premium and the write-off of financing costs related to the refinancing of Short Hills, the pay-off of the Northlake loan, and debt modifications in connection with the pay-off of the Oyster Bay loan. The fourth quarter of 2005 also includes a $52.8 million gain on the sale of Woodland (Note 2). |
Note 21 - New Accounting Pronouncements
In December 2006, the FASB issued Staff Position No. EITF 00-19-2, “Accounting for Registration Payment Arrangements.” This Staff Position requires companies that agree to register securities recognize a liability if a payment to investors for failing to fulfill the agreement is probable and its amount can be reasonably estimated. This Staff Position is effective for fiscal years beginning after December 15, 2006. The Company does not anticipate that the adoption of this Staff Position will have a material effect on its results of operations or financial position.
In September 2006, the FASB issued Statement No. 157 “Fair Value Measurements.” This Statement defines fair value, establishes a framework for measuring fair value in generally accepted accounting principles, and expands disclosures about fair value measurements. This Statement applies to accounting pronouncements that require or permit fair value measurements, except for share-based payments transactions under FASB Statement No. 123. This Statement is effective for financial statements issued for fiscal years beginning after November 15, 2007. As Statement No. 157 does not require any new fair value measurements or remeasurements of previously computed fair values, the Company does not believe adoption of this Statement will have a material effect on its financial statements.
TAUBMAN CENTERS, INC.
NOTES TO CONSOLIDATED FINANCIAL STATEMENTS - (CONTINUED)
In June 2006, the FASB issued Interpretation No. 48, “Uncertainty in Income Taxes - an interpretation of FASB Statement No. 109.” This Interpretation defines a recognition threshold and measurement attribute for the financial statement recognition and measurement of a tax position taken or expected to be taken in a tax return. The Interpretation also provides guidance on derecognition, classification, interest and penalties, accounting in interim periods, disclosure, and transition. This Interpretation is effective for fiscal years beginning after December 15, 2006. The Company does not anticipate that the adoption of this Statement will have a material effect on its results of operations or financial position.
Note 22 - Subsequent Events
In January 2007, the Company assumed full management and leasing responsibility for The Pier. The Company is in final negotiations to increase its ownership interest in the center from 30% to 50%. The Company expects to complete this transaction and close on a refinancing of the property in the first quarter of 2007.
Also in January 2007, Taubman Asia completed the development services agreement for a 1.2 million square foot retail and entertainment complex in New Songdo City, Incheon, South Korea. The shopping complex is scheduled to open in early 2010, with construction beginning in 2007. Also, in January 2007, Taubman Asia was selected as the preferred retail partner of Macao Studio City, a resort property located on the Cotai Strip in Macao. Taubman Asia has signed a term sheet to acquire a minority position in the retail component of the project and will provide development, leasing and management services, subject to definitive agreements to be completed in the first half of 2007.
In addition, in January 2007, the Company announced its involvement as a third party leasing agent for a lifestyle center in the city of North Las Vegas, Nevada. This is a mixed use project that will include retail, dining, and entertainment of up to 1.3 million square feet and a residential component consisting of approximately 800 units. The shopping center will open in late 2008. The developer of the residential component is an affiliate of the Taubman family.
Also in January 2007, the Company acquired land for future development for $15.5 million.
Schedule II
TAUBMAN CENTERS, INC.
VALUATION AND QUALIFYING ACCOUNTS
For the years ended December 31, 2006, 2005, and 2004
(in thousands)
| | | | | Additions | | | | | | | | | |
| | | | Balance at beginning of year | | | Charged to costs and expenses | | | Charged to other accounts | | | Write-offs | | | Transfers, net | | | Balance at end of year | |
| Year ended December 31, 2006 | | | | | | | | | | | | | | | | | | | |
| Allowance for doubtful receivables | | $ | 5,497 | | $ | 5,110 | | | | | $ | (3,055 | ) | $ | 29 | (1) | $ | 7,581 | |
| | | | | | | | | | | | | | | | | | | | |
| Year ended December 31, 2005 | | | | | | | | | | | | | | | | | | | |
| Allowance for doubtful receivables | | $ | 8,661 | | | 2,512 | | | | | | (5,676 | ) | | | | $ | 5,497 | |
| | | | | | | | | | | | | | | | | | | | |
| Year ended December 31, 2004 | | | | | | | | | | | | | | | | | | | |
| Allowance for doubtful receivables | | $ | 7,403 | | | 4,103 | | | | | | (4,039 | ) | | 1,194 | (2) | $ | 8,661 | |
| (1) | Represents the transfer in of Cherry Creek. Prior to January 1, 2006, the Company accounted for its interest in Cherry Creek under the equity method. |
| (2) | Represents the transfer in of International Plaza. Prior to July 2004, the Company accounted for its interest in International Plaza under the equity method. |
Schedule III
TAUBMAN CENTERS, INC.
REAL ESTATE AND ACCUMULATED DEPRECIATION
December 31, 2006
(in thousands)
| | | Initial Cost to Company | | | | Gross Amount at Which Carried at Close of Period | | | | | | | | | | | | | | | |
| | | | Land | | | Buildings, Improvements, and Equipment | | | Cost Capitalized Subsequent to Acquisition | | | Land | | | BI&E | | | Total | | | Accumulated Depreciation(A/D) | | | Total Cost Net of A/D | | | Encumbrances | | | Date of Completion of Construction or Acquisition | | | Depreciable Life | |
Shopping Centers: | | | | | | | | | | | | | | | | | | | | | | | | | | | | | | | | | | |
| Beverly Center, Los Angeles, CA | | | | | $ | 209,149 | | $ | 40,417 | | | | | $ | 249,566 | | $ | 249,566 | | $ | 105,053 | | $ | 144,513 | | $ | 343,608 | | | 1982 | | | 40 Years | |
| Cherry Creek Shopping Center, Denver, CO | | | | | | 99,260 | | | 107,611 | | | | | | 206,871 | | | 206,871 | | | 87,600 | | | 119,271 | | | 280,000 | | | 1990 | | | 40 Years | |
| Dolphin Mall, Miami, FL | | $ | 34,881 | | | 240,261 | | | 14,684 | | $ | 34,881 | | | 254,945 | | | 289,826 | | | 48,791 | | | 241,035 | | | 5,000 | (1) | | 2001 | | | 50 Years | |
| Fairlane Town Center, Dearborn, MI | | | 17,330 | | | 104,668 | | | 31,876 | | | 17,330 | | | 136,544 | | | 153,874 | | | 45,439 | | | 108,435 | | | 55,000 | (1) | | 1996 | | | 40 Years | |
| Great Lakes Crossing, Auburn Hills, MI | | | 15,506 | | | 194,584 | | | 21,524 | | | 15,506 | | | 216,108 | | | 231,614 | | | 73,533 | | | 158,081 | | | 142,908 | | | 1998 | | | 50 Years | |
| International Plaza, Tampa, FL | | | | | | 309,784 | | | 8,971 | | | | | | 318,755 | | | 318,755 | | | 58,684 | | | 260,071 | | | 178,719 | | | 2001 | | | 50 Years | |
| MacArthur Center, Norfolk, VA | | | | | | 146,204 | | | 10,836 | | | | | | 157,040 | | | 157,040 | | | 36,617 | | | 120,423 | | | 138,243 | | | 1999 | | | 50 Years | |
| Northlake Mall, Charlotte, NC | | | 22,540 | | | 148,098 | | | 3,197 | | | 22,540 | | | 151,295 | | | 173,835 | | | 14,139 | | | 159,696 | | | 215,500 | | | 2005 | | | 50 Years | |
| Regency Square, Richmond, VA | | | 18,635 | | | 101,600 | | | 9,595 | | | 18,635 | | | 111,195 | | | 129,830 | | | 33,292 | | | 96,538 | | | 77,812 | | | 1997 | | | 40 Years | |
| The Mall at Short Hills, Short Hills, NJ | | | 25,114 | | | 169,204 | | | 119,485 | | | 25,114 | | | 288,689 | | | 313,803 | | | 106,871 | | | 206,932 | | | 540,000 | | | 1980 | | | 40 Years | |
| Stony Point Fashion Park, Richmond, VA | | | 10,677 | | | 101,797 | | | 1,058 | | | 10,677 | | | 102,855 | | | 113,532 | | | 20,735 | | | 92,797 | | | 111,864 | | | 2003 | | | 50 Years | |
| Twelve Oaks Mall, Novi, MI | | | 25,410 | | | 191,185 | | | 7,109 | | | 25,410 | | | 198,294 | | | 223,704 | | | 71,266 | | | 152,438 | | | - | (1) | | 1977 | | | 50 Years | |
| The Mall at Wellington Green, Wellington, FL | | | 18,967 | | | 192,370 | | | 8,508 | | | 21,439 | | | 198,406 | | | 219,845 | | | 47,654 | | | 172,191 | | | 200,000 | | | 2001 | | | 50 Years | |
| The Shops at Willow Bend, Plano, TX | | | 26,192 | | | 229,523 | | | 7,706 | | | 26,192 | | | 237,229 | | | 263,421 | | | 46,922 | | | 216,499 | | | | | | 2001 | | | 50 Years | |
Other: | | | | | | | | | | | | | | | | | | | | | | | | | | | | | | | | | | |
| Office Facilities | | | | | | | | | 25,143 | | | | | | 25,143 | | | 25,143 | | | 11,552 | | | 13,591 | | | | | | | | | | |
| Peripheral Land | | | 30,828 | | | | | | | | | 30,828 | | | | | | 30,828 | | | | | | 30,828 | | | | | | | | | | |
Construction in Process and Development Pre-Construction Costs | | | | | | 188,840 | | | 41,062 | | | | | | 229,902 | | | 229,902 | | | | | | 229,902 | | | 22,010 | | | | | | | |
| Assets under CDD obligations | | | 4,164 | | | 61,411 | | | | | | 4,164 | | | 61,411 | | | 65,575 | | | 12,732 | | | 52,843 | | | | | | | | | | |
| Other | | | | | | 1,158 | | | | | | | | | 1,158 | | | 1,158 | | | 504 | | | 654 | | | | | | | | | | |
| TOTAL | | $ | 250,244 | | $ | 2,689,096 | | $ | 458,782 | | $ | 252,716 | | $ | 3,145,406 | | $ | 3,398,122 | (2) | $ | 821,384 | | $ | 2,576,738 | | | | | | | | | | |
The changes in total real estate assets and accumulated depreciation for the years ended December 31, 2006, 2005, and 2004 are as follows:
| | | Total Real Estate Assets | | | Total Real Estate Assets | | | Total Real Estate Assets | | | | | | Accumulated Depreciation | | | Accumulated Depreciation (5) | | | Accumulated Depreciation (5) | |
| | | | 2006 | | | 2005 | | | 2004 | | | | | | 2006 | | | 2005 | | | 2004 | |
| Balance, beginning of year | | $ | 3,081,324 | | $ | 2,936,964 | | $ | 2,519,922 | | | Balance, beginning of year | | $ | (651,665 | ) | $ | (558,891 | ) | $ | (450,515 | ) |
| New development and improvements | | | 151,428 | | | 173,297 | | | 112,995 | | | Depreciation for year | | | (128,488 | ) | | (120,673 | ) | | (102,330 | ) |
| Disposals/Write-offs | | | (39,672 | ) | | (27,905 | ) | | (15,997 | ) | | Disposals/Write-offs | | | 39,195 | | | 27,782 | | | 24,314 | |
| Transfers In/(Out) | | | 205,042 | (3) | | (1,032 | ) | | 320,044 | (4) | | Transfers In/(Out) | | | (80,426 | ) | | 117 | | | (30,360 | ) |
| Balance, end of year | | $ | 3,398,122 | | $ | 3,081,324 | | $ | 2,936,964 | | | Balance, end of year | | $ | (821,384 | ) | $ | (651,665 | ) | $ | (558,891 | ) |
| (1) | These centers are collateral for the Company’s $350 million line of credit. Borrowings under the line of credit are primary obligations of the entities owning these centers. |
| (2) | The unaudited aggregate costs for federal income tax purposes as of December 31, 2006 was $3.220 billion. |
| (3) | Includes costs related to Cherry Creek, which became a consolidated center in 2006. |
| (4) | Includes costs relating to International Plaza, which became a Consolidated Joint Venture in 2004. |
| (5) | Does not include depreciation of assets recoverable from tenants. |
SIGNATURES
Pursuant to the requirements of Section 13 or 15(d) of the Securities Act of 1934, the registrant has duly caused this report to be signed on its behalf by the undersigned, thereunto duly authorized.
| | | TAUBMAN CENTERS, INC. |
| | | |
| Date: February 27, 2007 | By: | /s/ Robert S. Taubman |
| | | Robert S. Taubman, Chairman of the Board, President, and Chief Executive Officer |
Pursuant to the requirements of the Securities Exchange Act of 1934, this report has been signed below by the following persons on behalf of the registrant and in the capacities and on the dates indicated.
Signature | Title | Date |
| | | |
/s/ Robert S. Taubman | Chairman of the Board, President, | February 27, 2007 |
| Robert S. Taubman | Chief Executive Officer, and Director | |
| | | |
/s/ Lisa A. Payne | Vice Chairman, Chief Financial | February 27, 2007 |
| Lisa A. Payne | Officer, and Director (Principal Financial Officer) | |
| | | |
/s/ William S. Taubman | Chief Operating Officer, | February 27, 2007 |
| William S. Taubman | and Director | |
| | | |
/s/ Esther R. Blum | Senior Vice President, Controller, and | February 27, 2007 |
| Esther R. Blum | Chief Accounting Officer | |
| | | |
* | Director | February 27, 2007 |
| Graham Allison | | |
| | | |
* | Director | February 27, 2007 |
| Jerome A. Chazen | | |
| | | |
* | Director | February 27, 2007 |
| Craig M. Hatkoff | | |
| | | |
* | Director | February 27, 2007 |
| Peter Karmanos, Jr. | | |
| | | |
* | Director | February 27, 2007 |
| William U. Parfet | | |
| *By: | /s/ Lisa A. Payne |
| | Lisa A. Payne, as Attorney-in-Fact |
EXHIBIT INDEX
Exhibit Number
| 3(a) | -- | Restated By-Laws of Taubman Centers, Inc. (incorporated herein by reference to Exhibit 3 filed with the Registrant's Quarterly Report on Form 10-Q for the quarter ended June 30, 2005 (“2005 Second Quarter Form 10-Q”)). |
| | | |
| 3(b) | -- | Restated Articles of Incorporation of Taubman Centers, Inc. (incorporated herein by reference to Exhibit 3 filed with the Registrant's Quarterly Report on Form 10-Q for the quarter ended June 30, 2006). |
| | | |
| 4(a) | -- | Loan Agreement dated as of January 15, 2004 among La Cienega Associates, as Borrower, Column Financial, Inc., as Lender (incorporated herein by reference to Exhibit 4 filed with the Registrant’s Quarterly Report on Form 10-Q for the quarter ended March 31, 2004 ("2004 First Quarter Form 10-Q")) |
| | | |
| 4(b) | -- | Assignment of Leases and Rents, La Cienega Associates, Assignor, and Column Financial, Inc., Assignee, dated as of January 15, 2004 (incorporated herein by reference to Exhibit 4 filed with the 2004 First Quarter Form 10-Q). |
| 4(c) | -- | Leasehold Deed of Trust, with Assignment of Leases and Rents, Fixture Filing, and Security Agreement, dated as of January 15, 2004, from La Cienega Associates, Borrower, to Commonwealth Land Title Company, Trustee, for the benefit of Column Financial, Inc., Lender (incorporated herein by reference to Exhibit 4 filed with the 2004 First Quarter Form 10-Q). |
| | | |
| 4(d) | -- | Amended and Restated Promissory Note A-1, dated December 14, 2005, by Short Hills Associates L.L.C. to Metropolitan Life Insurance Company (incorporated by reference to Exhibit 4.1 of the Registrant’s Current Report on Form 8-K dated December 16, 2005). |
| | | |
| 4(e) | -- | Amended and Restated Promissory Note A-2, dated December 14, 2005, by Short Hills Associates L.L.C. to Metropolitan Life Insurance Company (incorporated by reference to Exhibit 4.2 of the Registrant’s Current Report on Form 8-K dated December 16, 2005). |
| 4(f) | -- | Amended and Restated Promissory Note A-3, dated December 14, 2005, by Short Hills Associates L.L.C. to Metropolitan Life Insurance Company (incorporated by reference to Exhibit 4.3 of the Registrant’s Current Report on Form 8-K dated December 16, 2005). |
| | | |
| 4(g) | -- | Amended and Restated Mortgage, Security Agreement and Fixture Filings, dated December 14, 2005 by Short Hills Associates L.L.C. to Metropolitan Life Insurance Company (incorporated by reference to Exhibit 4.4 of the Registrant’s Current Report on Form 8-K dated December 16, 2005). |
| | | |
| 4(h) | -- | Amended and Restated Assignment of Leases, dated December 14, 2005, by Short Hills Associates L.L.C. to Metropolitan Life Insurance Company (incorporated by reference to Exhibit 4.5 of the Registrant’s Current Report on Form 8-K dated December 16, 2005). |
| 4(i) | -- | Amended and Restated Secured Revolving Credit Agreement, dated as of August 9, 2006, by and among Dolphin Mall Associates Limited Partnership, Fairlane Town Center LLC and Twelve Oaks Mall, LLC, as Borrowers, Eurohypo AG, New York Branch, as Administrative Agent and Lead Arranger, and the various lenders and agents on the signature pages thereto (incorporated herein by reference to Exhibit 4.1 filed with the Registrant’s Current Report on Form 8-K dated August 9, 2006). |
| | | |
| 4(j) | -- | Second Amended and Restated Mortgage, Assignment of Leases and Rents and Security Agreement, dated as of August 9, 2006, by and between Dolphin Mall Associates Limited Partnership and Eurohypo AG, New York Branch, as Administrative Agent (incorporated herein by reference to Exhibit 4.5 filed with the Registrant’s Current Report on Form 8-K dated August 9, 2006). |
| 4(k) | -- | Amended and Restated Mortgage, dated as of August 9, 2006, by and between Fairlane Town Center LLC and Eurohypo AG, New York Branch, as Administrative Agent (incorporated herein by reference to Exhibit 4.3 filed with the Registrant’s Current Report on Form 8-K dated August 9, 2006). |
| 4(l) | -- | Amended and Restated Mortgage, dated as of August 9, 2006, by and between Twelve Oaks Mall, LLC and Eurohypo AG, New York Branch, as Administrative Agent (incorporated herein by reference to Exhibit 4.4 filed with the Registrant’s Current Report on Form 8-K dated August 9, 2006). |
| 4(m) | -- | Guaranty of Payment, dated as of August 9, 2006, by and among The Taubman Realty Group Limited Partnership, Fairlane Town Center LLC and Twelve Oaks Mall, LLC (incorporated herein by reference to Exhibit 4.2 filed with the Registrant’s Current Report on Form 8-K dated August 9, 2006). |
| | | |
| *10(a) | -- | The Taubman Realty Group Limited Partnership 1992 Incentive Option Plan, as Amended and Restated Effective as of September 30, 1997 (incorporated herein by reference to Exhibit 10(b) filed with the Registrant’s Annual Report on Form 10-K for the year ended December 31, 1997). |
| | | |
| *10(b) | -- | First Amendment to The Taubman Realty Group Limited Partnership 1992 Incentive Option Plan as Amended and Restated Effective as of September 30, 1997, effective January 1, 2002 (incorporated herein by reference to Exhibit 10(b) filed with the Registrant’s Annual Report on Form 10-K for the year ended December 31, 2001 (“2001 Form 10-K”)). |
| | | |
| *10(c) | -- | Second Amendment to The Taubman Realty Group Limited Partnership 1992 Incentive Plan as Amended and Restated Effective as of September 30, 1997 (incorporated herein by reference to Exhibit 10(c) filed with the 2004 Form 10-K). |
| | | |
| *10(d) | -- | Third Amendment to The Taubman Realty Group Limited Partnership 1992 Incentive Plan as Amended and Restated Effective as of September 30, 1997 (incorporated herein by reference to Exhibit 10(d) filed with the 2004 Form 10-K). |
| | | |
| *10(e) | -- | The Form of The Taubman Realty Group Limited Partnership 1992 Incentive Option Plan Option Agreement (incorporated herein by reference to Exhibit 10(e) filed with the 2004 Form 10-K). |
| 10(f) | -- | Master Services Agreement between The Taubman Realty Group Limited Partnership and the Manager (incorporated herein by reference to Exhibit 10(f) filed with the 1992 Form 10-K). |
| | | |
| 10(g) | -- | Amended and Restated Cash Tender Agreement among Taubman Centers, Inc., The Taubman Realty Group Limited Partnership, and A. Alfred Taubman, A. Alfred Taubman, acting not individually but as Trustee of the A. Alfred Taubman Restated Revocable Trust, and TRA Partners, (incorporated herein by reference to Exhibit 10 (a) filed with the 2000 Second Quarter Form 10-Q). |
| *10(h) | -- | Supplemental Retirement Savings Plan (incorporated herein by reference to Exhibit 10(i) filed with the Registrant's Annual Report on Form 10-K for the year ended December 31, 1994). |
| | | |
| *10(i) | -- | The Taubman Company Long-Term Compensation Plan (as amended and restated effective January 1, 2000) (incorporated herein by reference to Exhibit 10 (c) filed with the 2000 Second Quarter Form 10-Q). |
| *10(j) | -- | First Amendment to the Taubman Company Long-Term Compensation Plan (as amended and restated effective January 1, 2000) (incorporated herein by reference to Exhibit 10(m) filed with the 2004 Form 10-K). |
| | | |
| *10(k) | -- | Second Amendment to the Taubman Company Long-Term Performance Compensation Plan (as amended and restated effective January 1, 2000). |
| | | |
| *10(l) | -- | The Taubman Company 2005 Long-Term Incentive Plan (incorporated herein by reference to the Form DEF14A filed with the Securities and Exchange Commission on April 5, 2005). |
| *10(m) | -- | Employment Agreement between The Taubman Company Limited Partnership and Lisa A. Payne (incorporated herein by reference to Exhibit 10 filed with the Registrant’s Quarterly Report on Form 10-Q for the quarter ended March 31, 1997). |
| | | |
| *10(n) | -- | Change of Control Agreement, dated July 17, 2006, by and among the Company, Taubman Realty Group Limited Partnership, and Lisa A. Payne (incorporated herein by reference to Exhibit 10.2 filed with the Registrant’s Current Report on Form 8-K dated July 17, 2006). |
| | | |
| *10(o) | -- | Form of Change of Control Agreement (incorporated herein by reference to Exhibit 10.1 filed with the Registrant’s Current Report on Form 8-K dated July 17, 2006). |
| 10(p) | -- | Second Amended and Restated Continuing Offer, dated as of May 16, 2000. (incorporated herein by reference to Exhibit 10 (b) filed with the 2000 Second Quarter Form 10-Q). |
| | | |
| 10(q) | -- | The Second Amendment and Restatement of Agreement of Limited Partnership of the Taubman Realty Group Limited Partnership dated September 30, 1998 (incorporated herein by reference to Exhibit 10 filed with the Registrant’s Quarterly Report on Form 10-Q dated September 30, 1998). |
| | | |
| 10(r) | -- | Annex II to Second Amendment to the Second Amendment and Restatement of Agreement of Limited Partnership of The Taubman Realty Group Limited Partnership. (incorporated herein by reference to Exhibit 10(p) filed with Registrant’s Annual Report on Form 10-K for the year ended December 31, 1999 (“1999 Form 10-K”)). |
| | | |
| 10(s) | -- | Annex III to The Second Amendment and Restatement of Agreement of Limited Partnership of The Taubman Realty Group Limited Partnership, dated as of May 27, 2004 (incorporated by reference to Exhibit 10(c) filed with the 2004 Second Quarter Form 10-Q). |
| 10(t) | -- | First Amendment to the Second Amendment and Restatement of Agreement of Limited Partnership of the Taubman Realty Group Limited Partnership dated September 30, 1998 (incorporated herein by reference to Exhibit 10(b) filed with the Registrant’s Quarterly Report on Form 10-Q/A for the quarter ended June 30, 2002 (“2002 Second Quarter Form 10-Q/A”)). |
| | | |
| 10(u) | -- | Second Amendment to the Second Amendment and Restatement of Agreement of Limited Partnership of The Taubman Realty Group Limited Partnership effective as of September 3, 1999 (incorporated herein by reference to Exhibit 10(a) filed with the Registrant’s Quarterly Report on Form 10-Q for the quarter ended September 30, 1999 (“1999 Third Quarter Form 10-Q”)). |
| 10(v) | -- | Third Amendment to the Second Amendment and Restatement of Agreement of Limited Partnership of the Taubman Realty Group Limited Partnership, dated May 2, 2003 (incorporated herein by reference to Exhibit 10(a) filed with the Registrant’s Quarterly Report on Form 10-Q for the quarter ended June 30, 2003 (“2003 Second Quarter Form 10-Q”)). |
| | | |
| 10(w) | -- | Fourth Amendment to the Second Amendment and Restatement of Agreement of Limited Partnership of the Taubman Realty Group Limited Partnership, dated December 31, 2003 (incorporated herein by reference to Exhibit 10(x) filed with the Registrant’s Annual Report on Form 10-K for the year ended December 31, 2003). |
| | | |
| 10(x) | -- | Fifth Amendment to the Second Amendment and Restatement of Agreement of Limited Partnership of the Taubman Realty Group Limited Partnership, dated February 1, 2005 (incorporated herein by reference to Exhibit 10.1 filed with the Registrant’s Current Report on Form 8-K filed on February 7, 2005). |
| | | |
| 10(y) | -- | Sixth Amendment to the Second Amendment and Restatement of Agreement of Limited Partnership of the Taubman Realty Group Limited Partnership, dated March 29, 2006 (incorporated herein by reference to Exhibit 10 filed with the Registrant’s Quarterly Report on Form 10-Q for the quarter ended March 31, 2006). |
| 10(z) | -- | Amended and Restated Shareholders’ Agreement dated as of October 30, 2001 among Taub-Co Management, Inc., The Taubman Realty Group Limited Partnership, The A. Alfred Taubman Restated Revocable Trust, and Taub-Co Holdings LLC (incorporated herein by reference to Exhibit 10(q) filed with the 2001 Form 10-K). |
| | | |
| *10(aa) | -- | The Taubman Realty Group Limited Partnership and The Taubman Company LLC Election and Option Deferral Agreement (incorporated herein by reference to Exhibit 10(r) filed with the 2001 Form 10-K). |
| | | |
| 10(ab) | -- | Amended and Restated Agreement of Partnership of Sunvalley Associates, a California general partnership (incorporated herein by reference to Exhibit 10(a) filed with the 2002 Second Quarter Form 10-Q/A). |
| 10(ac) | -- | Operating Agreement of Taubman Land Associates, a Delaware Limited Liability Company, dated October 20, 2006. |
| | | |
| *10(ad) | -- | Summary of Compensation for the Board of Directors of Taubman Centers, Inc. (incorporated herein by reference to Exhibit 10.1 filed with the Registrant’s Current Report on Form 8-K dated December 7, 2004). |
| | | |
| *10(ae) | -- | Summary of Compensation for the Board of Directors of Taubman Centers, Inc. |
| | | |
| *10(af) | -- | The Form of The Taubman Company Restricted Stock Unit Award Agreement (incorporated by reference to Exhibit 10 of the Registrant’s Current Report on Form 8-K dated May 18, 2005). |
| *10(ag) | -- | The Taubman Centers, Inc. Non-Employee Directors’ Deferred Compensation Plan (incorporated by reference to Exhibit 10 of the Registrant’s Current Report on Form 8-K dated May 18, 2005). |
| *10(ah) | -- | The Form of The Taubman Centers, Inc. Non-Employee Directors' Deferred Compensation Plan (incorporated by reference to Exhibit 10 of the Registrant’s Current Report on Form 8-K dated May 18, 2005). |
| | | |
| 12 | -- | Statement Re: Computation of Taubman Centers, Inc. Ratio of Earnings to Combined Fixed Charges and Preferred Dividends. |
| | | |
| 21 | -- | Subsidiaries of Taubman Centers, Inc. |
| 23 | -- | Consent of KPMG LLP. |
| | | |
| 24 | -- | Powers of Attorney. |
| 31(a) | -- | Certification of Chief Executive Officer pursuant to 15 U.S.C. Section 10A, as adopted pursuant to Section 302 of the Sarbanes-Oxley Act of 2002. |
| | | |
| 31(b) | -- | Certification of Chief Financial Officer pursuant to 15 U.S.C. Section 10A, as adopted pursuant to Section 302 of the Sarbanes-Oxley Act of 2002. |
| | | |
| 32(a) | -- | Certification of Chief Executive Officer pursuant to 18 U.S.C. Section 1350, as adopted pursuant to Section 906 of the Sarbanes-Oxley Act of 2002. |
| | | |
| 32(b) | -- | Certification of Chief Financial Officer pursuant to 18 U.S.C. Section 1350, as adopted pursuant to Section 906 of the Sarbanes-Oxley Act of 2002. |
| | | |
| 99(a) | -- | Debt Maturity Schedule. |
| | | |
| 99(b) | -- | Real Estate and Accumulated Depreciation Schedule of the Unconsolidated Joint Ventures of The Taubman Realty Group Limited Partnership. |