SECURITIES AND EXCHANGE COMMISSION
CERTIFIED SHAREHOLDER REPORT OF REGISTERED MANAGEMENT INVESTMENT COMPANIES
| | |
| Investment Company Act file number: | | 811-07064 |
| |
| Exact name of registrant as specified in charter: | | The Target Portfolio Trust |
| |
| Address of principal executive offices: | | 655 Broad Street, 6 th Floor |
| | Newark, New Jersey 07102 |
| |
| Name and address of agent for service: | | Andrew R. French |
| | 655 Broad Street, 6 th Floor |
| | Newark, New Jersey 07102 |
| |
| Registrant’s telephone number, including area code: | | |
| |
| Date of fiscal year end: | | 07/31/2024 |
| |
| Date of reporting period: | | 07/31/2024 |
Item 1 – Reports to Stockholders
| | (a) | Report transmitted to stockholders pursuant to Rule 30e-1 under the Act (17 CFR 270.30e-1). |
PGIM Quant Solutions Small-Cap Value
Fund
ANNUAL SHAREHOLDER REPORT – July 31, 2024
This annual shareholder report contains important information about the Class A shares of PGIM Quant Solutions Small-Cap Value Fund (the
“Fund”) for the period of August 1, 2023 to July 31, 2024.
Y
ou can find additional information about the Fund at
pgim.com/investments/mutual-funds/prospectuses-fact-sheets
. You can also request
this information by contacting us at (800) 225-1852.
This report describes changes to the Fund that occurred during the reporting period.
WHAT WERE THE FUND COSTS FOR THE LAST YEAR?
(Based on a hypothetical $10,000 investment)
| Costs of a $10,000 investment | Costs paid as a percentage of a $10,000 investment |
PGIM Quant Solutions Small-Cap Value Fund— | | |
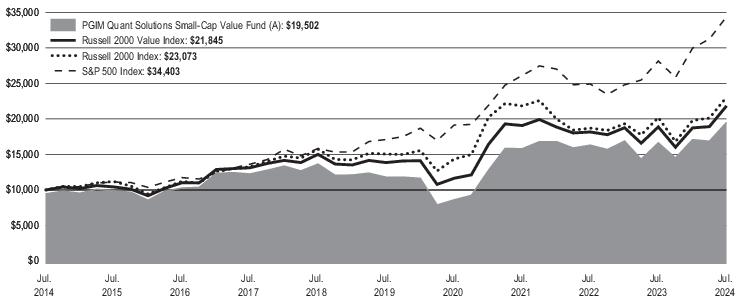
WHAT AFFECTED THE FUND’S PERFORMANCE DURING THE REPORTING PERIOD?
■
Stock market gains continued to be energized by large-cap growth and technology companies, fueled by investor optimism about the future
growth of artificial intelligence. Amid this market backdrop, US small-cap equities underperformed their large-cap counterparts. Although
large-cap growth stocks significantly outperformed large-cap value stocks, the situation was reversed in the small-cap space. The Russell
2000
Value Index (15.68%) outperformed the Russell 2000
Growth Index (12.80%) by nearly 3%.
■
PGIM Quantitative Solutions’ focus on deep-value stocks, which are characterized by high earnings yields, cash flow yields, and book yields,
drove performance as the Fund outperformed relative to the Index in eight of 11 economic sectors during the reporting period. The top
contributors to performance came from positioning in numerous industries across the industrials, energy, and real estate sectors.
■
The top detractors from performance came from the consumer staples sector, with underperformance relative to the Index broadly distributed
across a handful of industries. Positioning among biotechnology and healthcare technology industries in the healthcare sector also weighed on
the Fund’s returns during the reporting period.
HOW HAS THE FUND PERFORMED OVER THE PAST 10
YEARS
?
The Fund’s past performance is not a good predictor of the Fund’s future performance.
The returns do not reflect the deduction of
taxes that a shareholder would pay on Fund distributions or redemption of Fund shares.
Visit
pgim.com/investments/mutual-funds/prospectuses-fact-sheets
or call (800) 225-1852 for more recent performance data.
The line graph reflects a hypothetical $10,000 investment in Class A shares and assumes that all recurring fees (including management fees)
were deducted and dividend and distributions were reinvested. Without waiver of fees and/or expense reimbursements, if any, the returns would
have been lower.
Cumulative Performance: July 31, 2014 to July 31, 2024 Initial Investment of $10,000 |
The line graph reflects the return on the Fund's Class A shares with sales charges.
Average Annual Total Returns as of 7/31/2024 |
| | | |
Class A with sales charges | | | |
Class A without sales charges | | | |
| | | |
| | | |
| | | |
The Fund has added the S&P 500 Index as a broad-based securities market index in response to new regulatory requirements.
WHAT ARE SOME KEY FUND STATISTICS AS OF 7/31/2024?
| |
| |
Total advisory fees paid for the year | |
Portfolio turnover rate for the year | |
WHAT ARE SOME CHARACTERISTICS OF THE FUND’S HOLDINGS AS OF 7/31/2024?
| |
| |
Affiliated Mutual Funds (7.9% represents investments purchased with collateral from securities | |
Oil, Gas & Consumable Fuels | |
| |
Mortgage Real Estate Investment Trusts (REITs) | |
| |
Energy Equipment & Services | |
| |
| |
| |
| |
Consumer Staples Distribution & Retail | |
| |
| |
Textiles, Apparel & Luxury Goods | |
| |
| |
| |
| |
| |
| |
| |
Commercial Services & Supplies | |
| |
| |
| |
Health Care Equipment & Supplies | |
Health Care Providers & Services | |
| |
Electronic Equipment, Instruments & Components | |
| |
| |
| |
| |
| |
Hotels, Restaurants & Leisure | |
Real Estate Management & Development | |
| |
Semiconductors & Semiconductor Equipment | |
Diversified Consumer Services | |
Technology Hardware, Storage & Peripherals | |
| |
Construction & Engineering | |
| |
| |
| |
| |
| |
Diversified Telecommunication Services | |
Trading Companies & Distributors | |
| |
Unaffiliated Exchange-Traded Funds | |
| |
Interactive Media & Services | |
| |
| |
| |
| |
Wireless Telecommunication Services | |
| |
| |
| |
| |
Liabilities in excess of other assets | |
| |
WERE THERE ANY CHANGES TO THE FUND
THIS
YEAR
?
The following is a summary of certain changes to the Fund since
August
1, 2023:
■
The Fund's principal risk disclosure was revised to include Financials Sector Risk as a principal risk of the Fund due to changes in the Fund's portfolio which may result in greater exposure to this sector.
For more complete information, you should review the Fund’s next prospectus, which we expect to be available by September 27, 2024 at
pgim.com/investments/mutual-funds/prospectuses-fact-sheets or by request at (800) 225-1852.
You can find additional information at
pgim.com/investments/mutual-funds/prospectuses-fact-sheets
or by scanning the QR code below,
including the Fund’s prospectus, financial information, fund holdings, and proxy voting information. You can also request this information by
contacting us at (800) 225-1852.
To receive your fund documents online, go to
pgim.com/investments/resource/edelivery
and enroll.
PGIM Quant Solutions Small-Cap Value Fund
PGIM Quant Solutions Small-Cap Value Fund
ANNUAL SHAREHOLDER REPORT – July 31, 2024
This annual shareholder report contains important information about the Class C shares of PGIM Quant Solutions Small-Cap Value Fund (the
“Fund”) for the period of August 1, 2023 to July 31, 2024.
You can find additional information about the Fund at
pgim.com/investments/mutual-funds/prospectuses-fact-sheets
. You can also request
this information by contacting us at (800) 225-1852.
This report describes changes to the Fund that occurred during the reporting period.
WHAT WERE THE FUND COSTS FOR THE LAST YEAR?
(Based on a hypothetical $10,000 investment)
| Costs of a $10,000 investment | Costs paid as a percentage of a $10,000 investment |
PGIM Quant Solutions Small-Cap Value Fund— | | |
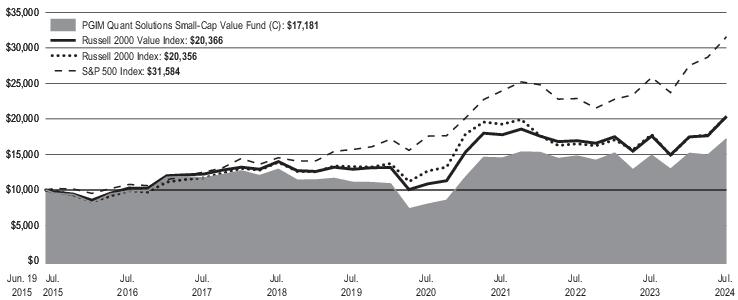
WHAT AFFECTED THE FUND’S PERFORMANCE DURING THE REPORTING PERIOD?
■
Stock market gains continued to be energized by large-cap growth and technology companies, fueled by investor optimism about the future
growth of artificial intelligence. Amid this market backdrop, US small-cap equities underperformed their large-cap counterparts. Although
large-cap growth stocks significantly outperformed large-cap value stocks, the situation was reversed in the small-cap space. The Russell
2000
Value Index (15.68%) outperformed the Russell 2000
Growth Index (12.80%) by nearly 3%.
■
PGIM Quantitative Solutions’ focus on deep-value stocks, which are characterized by high earnings yields, cash flow yields, and book yields,
drove performance as the Fund outperformed relative to the Index in eight of 11 economic sectors during the reporting period. The top
contributors to performance came from positioning in numerous industries across the industrials, energy, and real estate sectors.
■
The top detractors from performance came from the consumer staples sector, with underperformance relative to the Index broadly distributed
across a handful of industries. Positioning among biotechnology and healthcare technology industries in the healthcare sector also weighed on
the Fund’s returns during the reporting period.
HOW HAS THE FUND PERFORMED OVER THE PAST 10 YEARS?
T
he Fund’s past performance is not a good predictor of the Fund’s future performance.
The returns do not reflect the deduction of
taxes that a shareholder would pay on Fund distributions or redemption of Fund shares.
Visit
pgim.com/investments/mutual-funds/prospectuses-fact-sheets
or call (800) 225-1852 for more recent performance data.
The line graph reflects a hypothetical $10,000 investment in Class C shares and assumes that all recurring fees (including management fees)
were deducted and dividend and distributions were reinvested. Without waiver of fees and/or expense reimbursements, if any, the returns would
have been lower.
Cumulative Performance: June 19, 2015 to July 31, 2024 Initial Investment of $10,000 |
Average Annual Total Returns as of 7/31/2024 |
| | | |
Class C with sales charges | | | |
Class C without sales charges | | | |
| | | |
| | | |
| | | |
Since Inception returns are provided for any share class with less than 10 fiscal years of returns. Since Inception returns for the Indexes are measured from the closest month-end to
the class's inception date.
The Fund has added the S&P 500 Index as a broad-based securities market index in response to new regulatory requirements.
WHAT ARE SOME KEY FUND STATISTICS AS OF 7/31/2024?
| |
| |
Total advisory fees paid for the year | |
Portfolio turnover rate for the year | |
WHAT ARE SOME CHARACTERISTICS OF THE FUND’S HOLDINGS AS OF 7/31/2024?
| |
| |
Affiliated Mutual Funds (7.9% represents investments purchased with collateral from securities | |
Oil, Gas & Consumable Fuels | |
| |
Mortgage Real Estate Investment Trusts (REITs) | |
| |
Energy Equipment & Services | |
| |
| |
| |
| |
Consumer Staples Distribution & Retail | |
| |
| |
Textiles, Apparel & Luxury Goods | |
| |
| |
| |
| |
| |
| |
| |
Commercial Services & Supplies | |
| |
| |
| |
Health Care Equipment & Supplies | |
Health Care Providers & Services | |
| |
Electronic Equipment, Instruments & Components | |
| |
| |
| |
| |
| |
Hotels, Restaurants & Leisure | |
Real Estate Management & Development | |
| |
Semiconductors & Semiconductor Equipment | |
Diversified Consumer Services | |
Technology Hardware, Storage & Peripherals | |
| |
Construction & Engineering | |
| |
| |
| |
| |
| |
Diversified Telecommunication Services | |
Trading Companies & Distributors | |
| |
Unaffiliated Exchange-Traded Funds | |
| |
Interactive Media & Services | |
| |
| |
| |
| |
Wireless Telecommunication Services | |
| |
| |
| |
| |
Liabilities in excess of other assets | |
| |
WERE THERE ANY CHANGES TO THE FUND THIS YEAR?
The following is a summary of certain changes to the Fund since August 1, 2023:
■
The Fund's principal risk disclosure was revised to include Financials Sector Risk as a principal risk of the Fund due to changes in the Fund's portfolio which may result in greater exposure to this sector.
For more complete information, you should review the Fund’s next prospectus, which we expect to be available by September 27, 2024 at
pgim.com/investments/mutual-funds/prospectuses-fact-sheets or by request at (800) 225-1852.
You can find additional information at
pgim.com/investments/mutual-funds/prospectuses-fact-sheets
or by scanning the QR code below,
including the Fund’s prospectus, financial information, fund holdings, and proxy voting information. You can also request this information by
contacting us at (800) 225-1852.
To receive your fund documents online, go to
pgim.com/investments/resource/edelivery
and enroll.
PGIM Quant Solutions Small-Cap Value Fund
PGIM Quant Solutions Small-Cap Value Fund
ANNUAL SHAREHOLDER REPORT – July 31, 2024
This annual shareholder report contains important information about the Class R shares of PGIM Quant Solutions Small-Cap Value Fund (the
“Fund”) for the period of August 1, 2023 to July 31, 2024.
You can find additional information about the Fund at
pgim.com/investments/mutual-funds/prospectuses-fact-sheets
.
You can also request
this information by contacting us at (800) 225-1852.
This report describes changes to the Fund that occurred during the reporting period.
WHAT WERE THE FUND COSTS FOR THE LAST YEAR?
(Based on a hypothetical $10,000 investment)
| Costs of a $10,000 investment | Costs paid as a percentage of a $10,000 investment |
PGIM Quant Solutions Small-Cap Value Fund— | | |
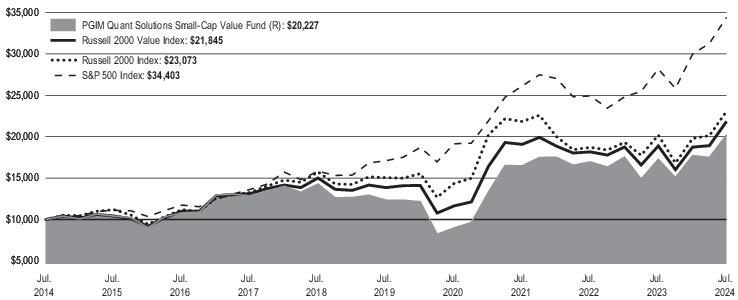
WHAT AFFECTED THE FUND’S PERFORMANCE DURING THE REPORTING PERIOD?
■
Stock market gains continued to be energized by large-cap growth and technology companies, fueled by investor optimism about the future
growth of artificial intelligence. Amid this market backdrop, US small-cap equities underperformed their large-cap counterparts. Although
large-cap growth stocks significantly outperformed large-cap value stocks, the situation was reversed in the small-cap space. The Russell
2000
Value Index (15.68%) outperformed the Russell 2000
Growth Index (12.80%) by nearly 3%.
■
PGIM Quantitative Solutions’ focus on deep-value stocks, which are characterized by high earnings yields, cash flow yields, and book yields,
drove performance as the Fund outperformed relative to the Index in eight of 11 economic sectors during the reporting period. The top
contributors to performance came from positioning in numerous industries across the industrials, energy, and real estate sectors.
■
The top detractors from performance came from the consumer staples sector, with underperformance relative to the Index broadly distributed
across a handful of industries. Positioning among biotechnology and healthcare technology industries in the healthcare sector also weighed on
the Fund’s returns during the reporting period.
HOW HAS THE FUND PERFORMED OVER THE PAST 10 YEARS?
The Fund’s past performance is not a good predictor of the Fund’s future performance.
The returns do not reflect the deduction of
taxes that a shareholder would pay on Fund distributions or redemption of Fund shares.
Visit
pgim.com/investments/mutual-funds/prospectuses-fact-sheets
or call (800) 225-1852 for more recent performance data.
The line graph reflects a hypothetical $10,000 investment in Class R shares and assumes that all recurring fees (including management fees)
were deducted and dividend and distributions were reinvested. Without waiver of fees and/or expense reimbursements, if any, the returns would
have been lower.
Cumulative Performance: July 31, 2014 to July 31, 2024 Initial Investment of $10,000 |
Average Annual Total Returns as of 7/31/2024 |
| | | |
| | | |
| | | |
| | | |
| | | |
The Fund has added the S&P 500 Index as a broad-based securities market index in response to new regulatory requirements.
WHAT ARE SOME KEY FUND STATISTICS AS OF 7/31/2024?
| |
| |
Total advisory fees paid for the year | |
Portfolio turnover rate for the year | |
WHAT ARE SOME CHARACTERISTICS OF THE FUND’S HOLDINGS AS OF 7/31/2024?
| |
| |
Affiliated Mutual Funds (7.9% represents investments purchased with collateral from securities | |
Oil, Gas & Consumable Fuels | |
| |
Mortgage Real Estate Investment Trusts (REITs) | |
| |
Energy Equipment & Services | |
| |
| |
| |
| |
Consumer Staples Distribution & Retail | |
| |
| |
Textiles, Apparel & Luxury Goods | |
| |
| |
| |
| |
| |
| |
| |
Commercial Services & Supplies | |
| |
| |
| |
Health Care Equipment & Supplies | |
Health Care Providers & Services | |
| |
Electronic Equipment, Instruments & Components | |
| |
| |
| |
| |
| |
Hotels, Restaurants & Leisure | |
Real Estate Management & Development | |
| |
Semiconductors & Semiconductor Equipment | |
Diversified Consumer Services | |
Technology Hardware, Storage & Peripherals | |
| |
Construction & Engineering | |
| |
| |
| |
| |
| |
Diversified Telecommunication Services | |
Trading Companies & Distributors | |
| |
Unaffiliated Exchange-Traded Funds | |
| |
Interactive Media & Services | |
| |
| |
| |
| |
Wireless Telecommunication Services | |
| |
| |
| |
| |
Liabilities in excess of other assets | |
| |
WERE THERE ANY CHANGES TO THE FUND THIS YEAR?
The following is a summary of certain changes to the Fund since August 1, 2023:
■
The Fund's principal risk disclosure was revised to include Financials Sector Risk as a principal risk of the Fund due to changes in the Fund's portfolio which may result in greater exposure to this sector.
For more complete information, you should review the Fund’s next prospectus, which we expect to be available by September 27, 2024 at
pgim.com/investments/mutual-funds/prospectuses-fact-sheets or by request at (800) 225-1852.
You can find additional information at
pgim.com/investments/mutual-funds/prospectuses-fact-sheets
or by scanning the QR code below,
including the Fund’s prospectus, financial information, fund holdings, and proxy voting information. You can also request this information by
contacting us at (800) 225-1852.
To receive your fund documents online, go to
pgim.com/investments/resource/edelivery
and enroll.
PGIM Quant Solutions Small-Cap Value Fund
PGIM Quant Solutions Small-Cap Value Fund
ANNUAL SHAREHOLDER REPORT – July 31, 2024
This annual shareholder report contains important information about the Class Z shares of PGIM Quant Solutions Small-Cap Value Fund (the
“Fund”) for the period of August 1, 2023 to July 31, 2024.
You can find additional information about the Fund at
pgim.com/investments/mutual-funds/prospectuses-fact-sheets
. You can also request
this information by contacting us at (800) 225-1852.
This report describes changes to the Fund that occurred during the reporting period.
WHAT WERE THE FUND COSTS FOR THE LAST YEAR?
(Based on a hypothetical $10,000 investment)
| Costs of a $10,000 investment | Costs paid as a percentage of a $10,000 investment |
PGIM Quant Solutions Small-Cap Value Fund— | | |
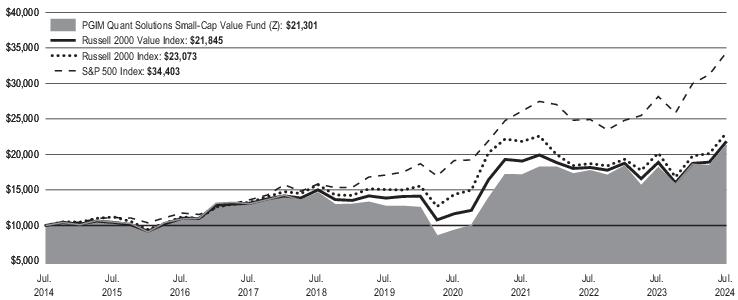
WHAT AFFECTED THE FUND’S PERFORMANCE DURING THE REPORTING PERIOD?
■
Stock market gains continued to be energized by large-cap growth and technology companies, fueled by investor optimism about the future
growth of artificial intelligence. Amid this market backdrop, US small-cap equities underperformed their large-cap counterparts. Although
large-cap growth stocks significantly outperformed large-cap value stocks, the situation was reversed in the small-cap space. The Russell
2000
Value Index (15.68%) outperformed the Russell 2000
Growth Index (12.80%) by nearly 3%.
■
PGIM Quantitative Solutions’ focus on deep-value stocks, which are characterized by high earnings yields, cash flow yields, and book yields,
drove performance as the Fund outperformed relative to the Index in eight of 11 economic sectors during the reporting period. The top
contributors to performance came from positioning in numerous industries across the industrials, energy, and real estate sectors.
■
The top detractors from performance came from the consumer staples sector, with underperformance relative to the Index broadly distributed
across a handful of industries. Positioning among biotechnology and healthcare technology industries in the healthcare sector also weighed on
the Fund’s returns during the reporting period.
HOW HAS THE FUND PERFORMED OVER THE PAST 10 YEARS?
The Fund’s past performance is not a good predictor of the Fund’s future performance.
The returns do not reflect the deduction of
taxes that a shareholder would pay on Fund distributions or redemption of Fund shares.
Visit
pgim.com/investments/mutual-funds/prospectuses-fact-sheets
or call (800) 225-1852 for more recent performance data.
The line graph reflects a hypothetical $10,000 investment in Class Z shares and assumes that all recurring fees (including management fees)
were deducted and dividend and distributions were reinvested. Without waiver of fees and/or expense reimbursements, if any, the returns would
have been lower.
Cumulative Performance: July 31, 2014 to July 31, 2024 Initial Investment of $10,000 |
Average Annual Total Returns as of 7/31/2024 |
| | | |
| | | |
| | | |
| | | |
| | | |
The Fund has added the S&P 500 Index as a broad-based securities market index in response to new regulatory requirements.
WHAT ARE SOME KEY FUND STATISTICS AS OF 7/31/2024?
| |
| |
Total advisory fees paid for the year | |
Portfolio turnover rate for the year | |
WHAT ARE SOME CHARACTERISTICS OF THE FUND’S HOLDINGS AS OF 7/31/2024?
| |
| |
Affiliated Mutual Funds (7.9% represents investments purchased with collateral from securities | |
Oil, Gas & Consumable Fuels | |
| |
Mortgage Real Estate Investment Trusts (REITs) | |
| |
Energy Equipment & Services | |
| |
| |
| |
| |
Consumer Staples Distribution & Retail | |
| |
| |
Textiles, Apparel & Luxury Goods | |
| |
| |
| |
| |
| |
| |
| |
Commercial Services & Supplies | |
| |
| |
| |
Health Care Equipment & Supplies | |
Health Care Providers & Services | |
| |
Electronic Equipment, Instruments & Components | |
| |
| |
| |
| |
| |
Hotels, Restaurants & Leisure | |
Real Estate Management & Development | |
| |
Semiconductors & Semiconductor Equipment | |
Diversified Consumer Services | |
Technology Hardware, Storage & Peripherals | |
| |
Construction & Engineering | |
| |
| |
| |
| |
| |
Diversified Telecommunication Services | |
Trading Companies & Distributors | |
| |
Unaffiliated Exchange-Traded Funds | |
| |
Interactive Media & Services | |
| |
| |
| |
| |
Wireless Telecommunication Services | |
| |
| |
| |
| |
Liabilities in excess of other assets | |
| |
WERE THERE ANY CHANGES TO THE FUND THIS YEAR?
The following is a summary of certain changes to the Fund since
August
1, 2023:
■
The Fund's principal risk disclosure was revised to include Financials Sector Risk as a principal risk of the Fund due to changes in the Fund's portfolio which may result in greater exposure to this sector.
For more complete information, you should review the Fund’s next prospectus, which we expect to be available by September 27, 2024 at
pgim.com/investments/mutual-funds/prospectuses-fact-sheets or by request at (800) 225-1852.
You can find additional information at
pgim.com/investments/mutual-funds/prospectuses-fact-sheets
or by scanning the QR code below,
including the Fund’s prospectus, financial information, fund holdings, and proxy voting information. You can also request this information by
contacting us at (800) 225-1852.
To receive your fund documents online, go to
pgim.com/investments/resource/edelivery
and enroll.
PGIM Quant Solutions Small-Cap Value Fund
PGIM Quant Solutions Small-Cap Value Fund
ANNUAL SHAREHOLDER REPORT – July 31, 2024
This annual shareholder report contains important information about the Class R2 shares of PGIM Quant Solutions Small-Cap Value Fund (the
“Fund”) for the period of August 1, 2023 to July 31, 2024.
You can find additional information about the Fund at
pgim.com/investments/mutual-funds/prospectuses-fact-sheets
. You can also request
this information by contacting us at (800) 225-1852.
This report describes changes to the Fund that occurred during the reporting period.
WHAT WERE THE FUND COSTS FOR THE LAST YEAR?
(Based on a hypothetical $10,000 investment)
| Costs of a $10,000 investment | Costs paid as a percentage of a $10,000 investment |
PGIM Quant Solutions Small-Cap Value Fund— | | |
WHAT AFFECTED THE FUND’S PERFORMANCE DURING THE REPORTING PERIOD?
■
Stock market gains continued to be energized by large-cap growth and technology companies, fueled by investor optimism about the future
growth of artificial intelligence. Amid this market backdrop, US small-cap equities underperformed their large-cap counterparts. Although
large-cap growth stocks significantly outperformed large-cap value stocks, the situation was reversed in the small-cap space. The Russell
2000
Value Index (15.68%) outperformed the Russell 2000
Growth Index (12.80%) by nearly 3%.
■
PGIM Quantitative Solutions’ focus on deep-value stocks, which are characterized by high earnings yields, cash flow yields, and book yields,
drove performance as the Fund outperformed relative to the Index in eight of 11 economic sectors during the reporting period. The top
contributors to performance came from positioning in numerous industries across the industrials, energy, and real estate sectors.
■
The top detractors from performance came from the consumer staples sector, with underperformance relative to the Index broadly distributed
across a handful of industries. Positioning among biotechnology and healthcare technology industries in the healthcare sector also weighed on
the Fund’s returns during the reporting period.
HOW HAS THE FUND PERFORMED OVER THE PAST 10 YEARS?
The Fund’s past performance is not a good predictor of the Fund’s future performance.
The returns do not reflect the deduction of
taxes that a shareholder would pay on Fund distributions or redemption of Fund shares.
Visit
pgim.com/investments/mutual-funds/prospectuses-fact-sheets
or call (800) 225-1852 for more recent performance data.
The line graph reflects a hypothetical $10,000 investment in Class R2 shares and assumes that all recurring fees (including management fees)
were deducted and dividend and distributions were reinvested. Without waiver of fees and/or expense reimbursements, if any, the returns would
have been lower.
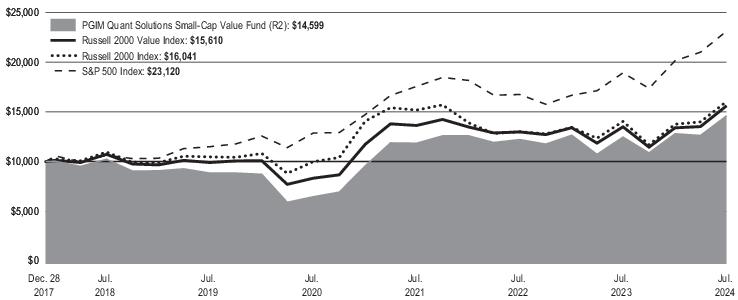
Cumulative Performance: December 28, 2017 to July 31, 2024 Initial Investment of $10,000 |
Average Annual Total Returns as of 7/31/2024 |
| | | |
| | | |
| | | |
| | | |
| | | |
Since Inception returns are provided for any share class with less than 10 fiscal years of returns. Since Inception returns for the Indexes are measured from the closest month-end to
the class's inception date.
The Fund has added the S&P 500 Index as a broad-based securities market index in response to new regulatory requirements.
WHAT ARE SOME KEY FUND STATISTICS AS OF 7/31/2024?
| |
| |
Total advisory fees paid for the year | |
Portfolio turnover rate for the year | |
WHAT ARE SOME CHARACTERISTICS OF THE FUND’S HOLDINGS AS OF 7/31/2024?
| |
| |
Affiliated Mutual Funds (7.9% represents investments purchased with collateral from securities | |
Oil, Gas & Consumable Fuels | |
| |
Mortgage Real Estate Investment Trusts (REITs) | |
| |
Energy Equipment & Services | |
| |
| |
| |
| |
Consumer Staples Distribution & Retail | |
| |
| |
Textiles, Apparel & Luxury Goods | |
| |
| |
| |
| |
| |
| |
| |
Commercial Services & Supplies | |
| |
| |
| |
Health Care Equipment & Supplies | |
Health Care Providers & Services | |
| |
Electronic Equipment, Instruments & Components | |
| |
| |
| |
| |
| |
Hotels, Restaurants & Leisure | |
Real Estate Management & Development | |
| |
Semiconductors & Semiconductor Equipment | |
Diversified Consumer Services | |
Technology Hardware, Storage & Peripherals | |
| |
Construction & Engineering | |
| |
| |
| |
| |
| |
Diversified Telecommunication Services | |
Trading Companies & Distributors | |
| |
Unaffiliated Exchange-Traded Funds | |
| |
Interactive Media & Services | |
| |
| |
| |
| |
Wireless Telecommunication Services | |
| |
| |
| |
| |
Liabilities in excess of other assets | |
| |
WERE THERE ANY CHANGES TO THE FUND THIS YEAR?
The following is a summary of certain changes to the Fund since August 1, 2023:
■
The Fund's principal risk disclosure was revised to include Financials Sector Risk as a principal risk of the Fund due to changes in the Fund's portfolio which may result in greater exposure to this sector.
For more complete information, you should review the Fund’s next prospectus, which we expect to be available by September 27, 2024 at
pgim.com/investments/mutual-funds/prospectuses-fact-sheets or by request at (800) 225-1852.
You can find additional information at
pgim.com/investments/mutual-funds/prospectuses-fact-sheets
or by scanning the QR code below,
including the Fund’s prospectus, financial information, fund holdings, and proxy voting information. You can also request this information by
contacting us at (800) 225-1852.
To receive your fund documents online, go to
pgim.com/investments/resource/edelivery
and enroll.
PGIM Quant Solutions Small-Cap Value Fund
PGIM Quant Solutions Small-Cap Value Fund
ANNUAL SHAREHOLDER REPORT – July 31, 2024
This annual shareholder report contains important information about the Class R4 shares of PGIM Quant Solutions Small-Cap Value Fund (the
“Fund”) for the period of August 1, 2023 to July 31, 2024.
You can find additional information about the Fund at
pgim.com/investments/mutual-funds/prospectuses-fact-sheets
. You can also request
this information by contacting us at (800) 225-1852.
This report describes changes to the Fund that occurred during the reporting period.
WHAT WERE THE FUND COSTS FOR THE LAST YEAR?
(Based on a hypothetical $10,000 investment)
| Costs of a $10,000 investment | Costs paid as a percentage of a $10,000 investment |
PGIM Quant Solutions Small-Cap Value Fund— | | |
WHAT AFFECTED THE FUND’S PERFORMANCE DURING THE REPORTING PERIOD?
■
Stock market gains continued to be energized by large-cap growth and technology companies, fueled by investor optimism about the future
growth of artificial intelligence. Amid this market backdrop, US small-cap equities underperformed their large-cap counterparts. Although
large-cap growth stocks significantly outperformed large-cap value stocks, the situation was reversed in the small-cap space. The Russell
2000
Value Index (15.68%) outperformed the Russell 2000
Growth Index (12.80%) by nearly 3%.
■
PGIM Quantitative Solutions’ focus on deep-value stocks, which are characterized by high earnings yields, cash flow yields, and book yields,
drove performance as the Fund outperformed relative to the Index in eight of 11 economic sectors during the reporting period. The top
contributors to performance came from positioning in numerous industries across the industrials, energy, and real estate sectors.
■
The top detractors from performance came from the consumer staples sector, with underperformance relative to the Index broadly distributed
across a handful of industries. Positioning among biotechnology and healthcare technology industries in the healthcare sector also weighed on
the Fund’s returns during the reporting period.
HOW HAS THE FUND PERFORMED OVER THE PAST 10 YEARS?
The Fund’s past performance is not a good predictor of the Fund’s future performance.
The returns do not reflect the deduction of
taxes that a shareholder would pay on Fund distributions or redemption of Fund shares.
Visit
pgim.com/investments/mutual-funds/prospectuses-fact-sheets
or call (800) 225-1852 for more recent performance data.
The line graph reflects a hypothetical $10,000 investment in Class R4 shares and assumes that all recurring fees (including management fees)
were deducted and dividend and distributions were reinvested. Without waiver of fees and/or expense reimbursements, if any, the returns would
have been lower.
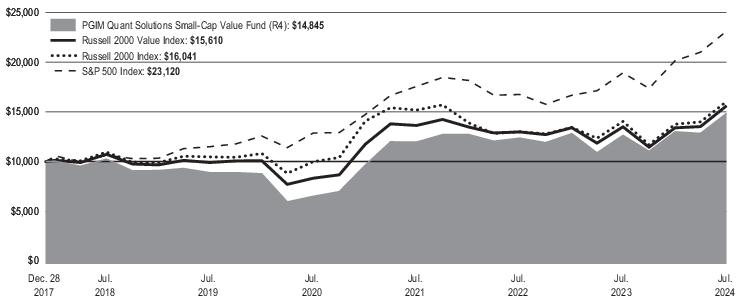
Cumulative Performance: December 28, 2017 to July 31, 2024 Initial Investment of $10,000 |
Average Annual Total Returns as of 7/31/2024 |
| | | |
| | | |
| | | |
| | | |
| | | |
Since Inception returns are provided for any share class with less than 10 fiscal years of returns. Since Inception returns for the Indexes are measured from the closest month-end to
the class's inception date.
The Fund has added the S&P 500 Index as a broad-based securities market index in response to new regulatory requirements.
WHAT ARE SOME KEY FUND STATISTICS AS OF 7/31/2024?
| |
| |
Total advisory fees paid for the year | |
Portfolio turnover rate for the year | |
WHAT ARE SOME CHARACTERISTICS OF THE FUND’S HOLDINGS AS OF
7/31/2024
?
| |
| |
Affiliated Mutual Funds (7.9% represents investments purchased with collateral from securities | |
Oil, Gas & Consumable Fuels | |
| |
Mortgage Real Estate Investment Trusts (REITs) | |
| |
Energy Equipment & Services | |
| |
| |
| |
| |
Consumer Staples Distribution & Retail | |
| |
| |
Textiles, Apparel & Luxury Goods | |
| |
| |
| |
| |
| |
| |
| |
Commercial Services & Supplies | |
| |
| |
| |
Health Care Equipment & Supplies | |
Health Care Providers & Services | |
| |
Electronic Equipment, Instruments & Components | |
| |
| |
| |
| |
| |
Hotels, Restaurants & Leisure | |
Real Estate Management & Development | |
| |
Semiconductors & Semiconductor Equipment | |
Diversified Consumer Services | |
Technology Hardware, Storage & Peripherals | |
| |
Construction & Engineering | |
| |
| |
| |
| |
| |
Diversified Telecommunication Services | |
Trading Companies & Distributors | |
| |
Unaffiliated Exchange-Traded Funds | |
| |
Interactive Media & Services | |
| |
| |
| |
| |
Wireless Telecommunication Services | |
| |
| |
| |
| |
Liabilities in excess of other assets | |
| |
WERE THERE ANY CHANGES TO THE FUND THIS YEAR?
The following is a summary of certain changes to the Fund since August 1, 2023:
■
The Fund's principal risk disclosure was revised to include Financials Sector Risk as a principal risk of the Fund due to changes in the Fund's portfolio which may result in greater exposure to this sector.
For more complete information, you should review the Fund’s next prospectus, which we expect to be available by September 27, 2024 at
pgim.com/investments/mutual-funds/prospectuses-fact-sheets or by request at (800) 225-1852.
You can find additional information at
pgim.com/investments/mutual-funds/prospectuses-fact-sheets
or by scanning the QR code below,
including the Fund’s prospectus, financial information, fund holdings, and proxy voting information. You can also request this information by
contacting us at (800) 225-1852.
To receive your fund documents online, go to
pgim.com/investments/resource/edelivery
and enroll.
PGIM Quant Solutions Small-Cap Value Fund
PGIM Quant Solutions Small-Cap Value Fund
ANNUAL SHAREHOLDER REPORT – July 31, 2024
This annual shareholder report contains important information about the Class R6 shares of PGIM Quant Solutions Small-Cap Value Fund (the
“Fund”) for the period of August 1, 2023 to July 31, 2024.
You can find additional information about the Fund at
pgim.com/investments/mutual-funds/prospectuses-fact-sheets
. You can also request
this information by contacting us at (800) 225-1852.
This report describes changes to the Fund that occurred during the reporting period.
WHAT WERE THE FUND COSTS FOR THE LAST YEAR?
(Based on a hypothetical $10,000 investment)
| Costs of a $10,000 investment | Costs paid as a percentage of a $10,000 investment |
PGIM Quant Solutions Small-Cap Value Fund— | | |
WHAT AFFECTED THE FUND’S PERFORMANCE DURING THE REPORTING PERIOD?
■
Stock market gains continued to be energized by large-cap growth and technology companies, fueled by investor optimism about the future
growth of artificial intelligence. Amid this market backdrop, US small-cap equities underperformed their large-cap counterparts. Although
large-cap growth stocks significantly outperformed large-cap value stocks, the situation was reversed in the small-cap space. The Russell
2000
Value Index (15.68%) outperformed the Russell 2000
Growth Index (12.80%) by nearly 3%.
■
PGIM Quantitative Solutions’ focus on deep-value stocks, which are characterized by high earnings yields, cash flow yields, and book yields,
drove performance as the Fund outperformed relative to the Index in eight of 11 economic sectors during the reporting period. The top
contributors to performance came from positioning in numerous industries across the industrials, energy, and real estate sectors.
■
The top detractors from performance came from the consumer staples sector, with underperformance relative to the Index broadly distributed
across a handful of industries. Positioning among biotechnology and healthcare technology industries in the healthcare sector also weighed on
the Fund’s returns during the reporting period.
HOW HAS THE FUND PERFORMED OVER THE PAST 10 YEARS?
The Fund’s past performance is not a good predictor of the Fund’s future performance.
The returns do not reflect the deduction of
taxes that a shareholder would pay on Fund distributions or redemption of Fund shares.
Visit
pgim.com/investments/mutual-funds/prospectuses-fact-sheets
or call (800) 225-1852 for more recent performance data.
The line graph reflects a hypothetical $10,000 investment in Class R6 shares and assumes that all recurring fees (including management fees)
were deducted and dividend and distributions were reinvested. Without waiver of fees and/or expense reimbursements, if any, the returns would
have been lower.
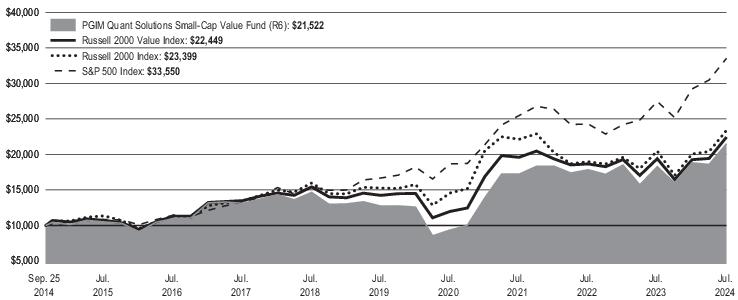
Cumulative Performance: September 25, 2014 to July 31, 2024 Initial Investment of $10,000 |
Average Annual Total Returns as of 7/31/2024 |
| | | |
| | | |
| | | |
| | | |
| | | |
Since Inception returns are provided for any share class with less than 10 fiscal years of returns. Since Inception returns for the Indexes are measured from the closest month-end to
the class's inception date.
The Fund has added the S&P 500 Index as a broad-based securities market index in response to new regulatory requirements.
WHAT ARE SOME KEY FUND STATISTICS AS OF 7/31/2024?
| |
| |
Total advisory fees paid for the year | |
Portfolio turnover rate for the year | |
WHAT ARE SOME CHARACTERISTICS OF THE FUND’S HOLDINGS AS OF 7/31/2024?
| |
| |
Affiliated Mutual Funds (7.9% represents investments purchased with collateral from securities | |
Oil, Gas & Consumable Fuels | |
| |
Mortgage Real Estate Investment Trusts (REITs) | |
| |
Energy Equipment & Services | |
| |
| |
| |
| |
Consumer Staples Distribution & Retail | |
| |
| |
Textiles, Apparel & Luxury Goods | |
| |
| |
| |
| |
| |
| |
| |
Commercial Services & Supplies | |
| |
| |
| |
Health Care Equipment & Supplies | |
Health Care Providers & Services | |
| |
Electronic Equipment, Instruments & Components | |
| |
| |
| |
| |
| |
Hotels, Restaurants & Leisure | |
Real Estate Management & Development | |
| |
Semiconductors & Semiconductor Equipment | |
Diversified Consumer Services | |
Technology Hardware, Storage & Peripherals | |
| |
Construction & Engineering | |
| |
| |
| |
| |
| |
Diversified Telecommunication Services | |
Trading Companies & Distributors | |
| |
Unaffiliated Exchange-Traded Funds | |
| |
Interactive Media & Services | |
| |
| |
| |
| |
Wireless Telecommunication Services | |
| |
| |
| |
| |
Liabilities in excess of other assets | |
| |
WERE THERE ANY CHANGES TO THE FUND THIS YEAR?
The following is a summary of certain changes to the Fund since August 1, 2023:
■
The Fund's principal risk disclosure was revised to include Financials Sector Risk as a principal risk of the Fund due to changes in the Fund's portfolio which may result in greater exposure to this sector.
For more complete information, you should review the Fund’s next prospectus, which we expect to be available by September 27, 2024 at
pgim.com/investments/mutual-funds/prospectuses-fact-sheets or by request at (800) 225-1852.
You can find additional information at
pgim.com/investments/mutual-funds/prospectuses-fact-sheets
or by scanning the QR code below,
including the Fund’s prospectus, financial information, fund holdings, and proxy voting information. You can also request this information by
contacting us at (800) 225-1852.
To receive your fund documents online, go to
pgim.com/investments/resource/edelivery
and enroll.
PGIM Quant Solutions Small-Cap Value Fund
ANNUAL SHAREHOLDER REPORT – July 31, 2024
This annual shareholder report contains important information about the Class A shares of PGIM Core Bond Fund (the “Fund”) for the period of
August 1, 2023 to July 31, 2024.
You can find additional information about the Fund at
pgim.com/investments/mutual-funds/prospectuses-fact-sheets
. You can also request
this information by contacting us at (800) 225-1852.
WHAT WERE THE FUND COSTS FOR THE LAST YEAR?
(Based on a hypothetical $10,000 investment)
| Costs of a $10,000 investment | Costs paid as a percentage of a $10,000 investment |
PGIM Core Bond Fund—Class A | | |
WHAT AFFECTED THE FUND’S PERFORMANCE DURING THE REPORTING PERIOD?
■
Although the US Federal Reserve held policy rates steady for eight consecutive Federal Open Market Committee meetings, moderating
economic data provided markets greater confidence that the first rate cut would come in the second half of 2024. Against the backdrop of a
steepening US Treasury curve, credit spreads across a broad spectrum of fixed income asset classes generally tightened.
■
The following strategies contributed most to the Fund’s performance relative to the Index during the period: positioning in AAA collateralized
loan obligations (CLOs); overweights in the non-agency commercial mortgage-backed securities (CMBS) AAA and US investment grade
sectors; security selection in US Treasuries, asset-backed securities (ABS), and non-agency mortgage-backed securities (MBS); duration
positioning; and selection in banking, MBS, and midstream energy. (Duration measures the sensitivity of the price—the value of principal—of a
bond to a change in interest rates.)
■
The following strategies detracted from relative performance during the period: security selection in MBS, yield curve positioning, and selection
in finance companies. (A yield curve is a line graph that illustrates the relationship between the yields and maturities of fixed income securities.
It is created by plotting the yields of different maturities for the same type of bonds.)
■
The Fund uses derivatives when they facilitate implementation of the overall investment approach. During the reporting period, the Fund used
swaps, options, and futures to help manage duration positioning and yield curve exposure. In aggregate, these positions detracted
from performance.
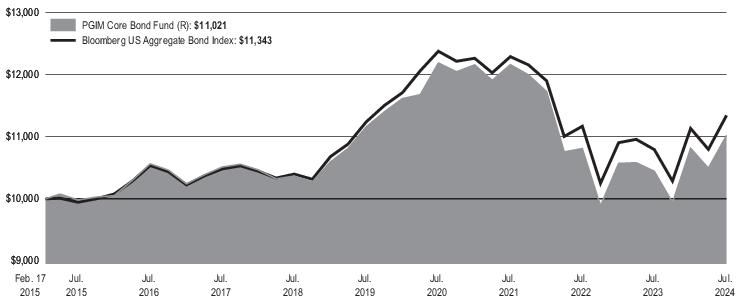
HOW HAS THE FUND PERFORMED OVER THE PAST 10 YEARS?
The Fund’s past performance is not a good predictor of the Fund’s future performance.
The returns do not reflect the deduction of
taxes that a shareholder would pay on Fund distributions or redemption of Fund shares.
Visit
pgim.com/investments/mutual-funds/prospectuses-fact-sheets
or call (800) 225-1852 for more recent performance data.
The line graph reflects a hypothetical $10,000 investment in Class A shares and assumes that all recurring fees (including management fees)
were deducted and dividend and distributions were reinvested. Without waiver of fees and/or expense reimbursements, if any, the returns would
have been lower.
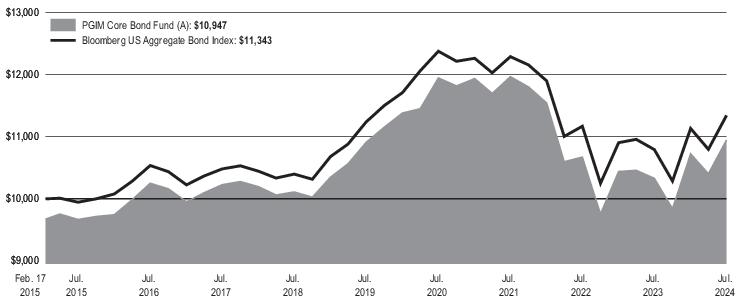
Cumulative Performance: February 17, 2015 to July 31, 2024 Initial Investment of $10,000 |
The line graph reflects the return on the Fund's Class A shares with sales charges.
Average Annual Total Returns as of 7/31/2024 |
| | | |
Class A w ith sales charges | | | |
Class A without sales charges | | | |
Bloomberg US Aggregate Bond Index | | | |
Since Inception returns are provided for any
share
class with less than 10
fiscal year
s of returns. Since Inception returns for the Index are measured from the closest month-end to the
class’s inception date.
WHAT ARE SOME KEY FUND STATISTICS AS OF 7/31/2024?
| |
| |
Total advisory fees paid for the year | |
Portfolio turnover rate for the year | |
WHAT ARE SOME CHARACTERISTICS OF THE FUND’S HOLDINGS AS OF 7/31/2024?
Credit Quality expressed as a percentage of total investments as of 7/31/2024 (%) |
| |
| |
| |
| |
| |
| |
| |
| |
Credit ratings reflect the highest rating assigned by a nationally recognized statistical rating organization (NRSRO) such as Moody’s Investors Service, Inc. (Moody’s), S&P Global
Ratings (S&P), or Fitch Ratings, Inc. (Fitch). Credit ratings reflect the common nomenclature used by both S&P and Fitch. Where applicable, ratings are converted to the comparable
S&P/Fitch rating tier nomenclature. The Not Rated category consists of securities that have not been rated by an NRSRO. Credit ratings are subject to change.
You can find additional information at
pgim.com/investments/mutual-funds/prospectuses-fact-sheets
or by scanning the QR code below,
including the Fund’s prospectus, financial information, fund holdings, and proxy voting information. You can also request this information by
contacting us at (800) 225-1852.
To receive your fund documents online, go to
pgim.com/investments/resource/edelivery
and enroll.
ANNUAL SHAREHOLDER REPORT – July 31, 2024
This annual shareholder report contains important information about the Class C shares of PGIM Core Bond Fund (the “Fund”) for the period of
August 1, 2023 to July 31, 2024.
You can find additional information about the Fund at
pgim.com/investments/mutual-funds/prospectuses-fact-sheets
. You can also request
this information by contacting us at (800) 225-1852.
WHAT WERE THE FUND COSTS FOR THE LAST YEAR?
(Based on a hypothetical $10,000 investment)
| Costs of a $10,000 investment | Costs paid as a percentage of a $10,000 investment |
PGIM Core Bond Fund—Class C | | |
WHAT AFFECTED THE FUND’S PERFORMANCE DURING THE REPORTING PERIOD?
■
Although the US Federal Reserve held policy rates steady for eight consecutive Federal Open Market Committee meetings, moderating
economic data provided markets greater confidence that the first rate cut would come in the second half of 2024. Against the backdrop of a
steepening US Treasury curve, credit spreads across a broad spectrum of fixed income asset classes generally tightened.
■
The following strategies contributed most to the Fund’s performance relative to the Index during the period: positioning in AAA collateralized
loan obligations (CLOs); overweights in the non-agency commercial mortgage-backed securities (CMBS) AAA and US investment grade
sectors; security selection in US Treasuries, asset-backed securities (ABS), and non-agency mortgage-backed securities (MBS); duration
positioning; and selection in banking, MBS, and midstream energy. (Duration measures the sensitivity of the price—the value of principal—of a
bond to a change in interest rates.)
■
The following strategies detracted from relative performance during the period: security selection in MBS, yield curve positioning, and selection
in finance companies. (A yield curve is a line graph that illustrates the relationship between the yields and maturities of fixed income securities.
It is created by plotting the yields of different maturities for the same type of bonds.)
■
The Fund uses derivatives when they facilitate implementation of the overall investment approach. During the reporting period, the Fund used
swaps, options, and futures to help manage duration positioning and yield curve exposure. In aggregate, these positions detracted
from performance.
HOW HAS THE FUND PERFORMED OVER THE PAST 10 YEARS?
The Fund’s past performance is not a good predictor of the Fund’s future performance.
The returns do not reflect the deduction of
taxes that a shareholder would pay on Fund distributions or redemption of Fund shares.
Visit
pgim.com/investments/mutual-funds/prospectuses-fact-sheets
or call (800) 225-1852 for more recent performance data.
The line graph reflects a hypothetical $10,000 investment in Class C shares and assumes that all recurring fees (including management fees)
were deducted and dividend and distributions were reinvested.
Without
waiver of fees and/or expense reimbursements, if any, the returns would
have been lower.
Cumulative Performance: February 17, 2015 to July 31, 2024 Initial Investment of $10,000 |
Average Annual Total Returns as of 7/31/2024 |
| | | |
Class C with sales charges | | | |
Class C without sales charges | | | |
Bloomberg US Aggregate Bond Index | | | |
Since Inception returns are provided for any share class with less than 10 fiscal years of returns. Since Inception returns for the Index are measured from the closest month-end to the
class’s inception date.
WHAT ARE SOME KEY FUND STATISTICS AS OF 7/31/2024?
| |
| |
Total advisory fees paid for the year | |
Portfolio turnover rate for the year | |
WHAT ARE SOME CHARACTERISTICS OF THE FUND’S HOLDINGS AS OF 7/31/2024?
Credit Quality expressed as a percentage of total investments as of 7/31/2024 (%) |
| |
| |
| |
| |
| |
| |
| |
| |
Credit ratings reflect the highest rating assigned by a nationally recognized statistical rating organization (NRSRO) such as Moody’s Investors Service, Inc. (Moody’s), S&P Global
Ratings (S&P), or Fitch Ratings, Inc. (Fitch). Credit ratings reflect the common nomenclature used by both S&P and Fitch. Where applicable, ratings are converted to the comparable
S&P/Fitch rating tier nomenclature. The Not Rated category consists of securities that have not been rated by an NRSRO. Credit ratings are subject to change.
You can find additional information at
pgim.com/investments/mutual-funds/prospectuses-fact-sheets
or by scanning the QR code below,
including the Fund’s prospectus, financial information, fund holdings, and proxy voting information. You can also request this information by
contacting us at (800) 225-1852.
To receive your fund documents online, go to
pgim.com/investments/resource/edelivery
and enroll.
ANNUAL SHAREHOLDER REPORT – July 31, 2024
This annual shareholder report contains important information about the Class R shares of PGIM Core Bond Fund (the “Fund”) for the period of
August 1, 2023 to July 31, 2024.
You can find additional information about the Fund at
pgim.com/investments/mutual-funds/prospectuses-fact-sheets
. You can also request
this information by contacting us at (800) 225-1852.
WHAT WERE THE FUND COSTS FOR THE LAST YEAR?
(Based on a hypothetical $10,000 investment)
| Costs of a $10,000 investment | Costs paid as a percentage of a $10,000 investment |
PGIM Core Bond Fund—Class R | | |
WHAT AFFECTED THE FUND’S PERFORMANCE DURING THE REPORTING PERIOD?
■
Although the US Federal Reserve held policy rates steady for eight consecutive Federal Open Market Committee meetings, moderating
economic data provided markets greater confidence that the first rate cut would come in the second half of 2024. Against the backdrop of a
steepening US Treasury curve, credit spreads across a broad spectrum of fixed income asset classes generally tightened.
■
The following strategies contributed most to the Fund’s performance relative to the Index during the period: positioning in AAA collateralized
loan obligations (CLOs); overweights in the non-agency commercial mortgage-backed securities (CMBS) AAA and US investment grade
sectors; security selection in US Treasuries, asset-backed securities (ABS), and non-agency mortgage-backed securities (MBS); duration
positioning; and selection in banking, MBS, and midstream energy. (Duration measures the sensitivity of the price—the value of principal—of a
bond to a change in interest rates.)
■
The following strategies detracted from relative performance during the period: security selection in MBS, yield curve positioning, and selection
in finance companies. (A yield curve is a line graph that illustrates the relationship between the yields and maturities of fixed income securities.
It is created by plotting the yields of different maturities for the same type of bonds.)
■
The Fund uses derivatives when they facilitate implementation of the overall investment approach. During the reporting period, the Fund used
swaps, options, and futures to help manage duration positioning and yield curve exposure. In aggregate, these positions detracted
from performance.
HOW HAS THE FUND PERFORMED OVER THE PAST 10 YEARS?
The Fund’s past performance is not a good predictor of the Fund’s future performance.
The returns do not reflect the deduction of
taxes that a shareholder would pay on Fund distributions or redemption of Fund shares.
Visit
pgim.com/investments/mutual-funds/prospectuses-fact-sheets
or call (800) 225-1852 for more recent performance data.
The line graph reflects a hypothetical $10,000 investment in Class R shares and assumes that all recurring fees (including management fees)
were deducted and dividend and distributions were reinvested. Without waiver of fees and/or expense reimbursements, if any, the returns would
have been lower.
Cumulative Performance: February 17, 2015 to July 31, 2024 Initial Investment of $10,000 |
Average Annual Total Returns as of 7/31/2024 |
| | | |
| | | |
Bloomberg US Aggregate Bond Index | | | |
Since Inception returns are provided for any share class with less than 10 fiscal years of
returns
. Since Inception returns for the Index are measured from the closest month-end to the
class’s inception date.
WHAT ARE SOME KEY FUND STATISTICS AS OF 7/31/2024?
| |
| |
Total advisory fees paid for the year | |
Portfolio turnover rate for the year | |
WHAT ARE SOME CHARACTERISTICS OF THE FUND’S HOLDINGS AS OF 7/31/2024?
Credit Quality expressed as a percentage of total investments as of 7/31/2024 (%) |
| |
| |
| |
| |
| |
| |
| |
| |
Credit ratings reflect the highest rating assigned by a nationally recognized statistical rating organization (NRSRO) such as Moody’s Investors Service, Inc. (Moody’s), S&P Global
Ratings (S&P), or Fitch Ratings, Inc. (Fitch). Credit ratings reflect the common nomenclature used by both S&P and Fitch. Where applicable, ratings are converted to the comparable
S&P/Fitch rating tier nomenclature. The Not Rated category consists of securities that have not been rated by an NRSRO. Credit ratings are subject to change.
You can find additional information at
pgim.com/investments/mutual-funds/prospectuses-fact-sheets
or by scanning the QR code below,
including the Fund’s prospectus, financial information, fund holdings, and proxy voting information. You can also request this information by
contacting us at (800) 225-1852.
To receive your fund documents online, go to
pgim.com/investments/resource/edelivery
and enroll.
ANNUAL SHAREHOLDER REPORT – July 31, 2024
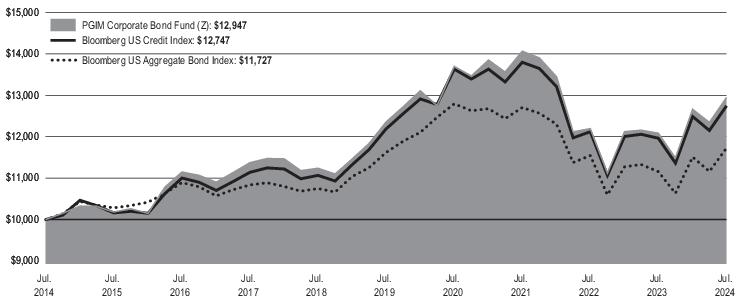
This annual shareholder report contains important information about the Class Z shares of PGIM Core Bond Fund (the “Fund”) for the period of
August 1, 2023 to July 31, 2024.
You can find additional information about the Fund at
pgim.com/investments/mutual-funds/prospectuses-fact-sheets
. You can also request
this information by contacting us at (800) 225-1852.
WHAT WERE THE FUND COSTS FOR THE LAST YEAR?
(Based on a hypothetical $10,000 investment)
| Costs of a $10,000 investment | Costs paid as a percentage of a $10,000 investment |
PGIM Core Bond Fund—Class Z | | |
WHAT AFFECTED THE FUND’S PERFORMANCE DURING THE REPORTING PERIOD?
■
Although the US Federal Reserve held policy rates steady for eight consecutive Federal Open Market Committee meetings, moderating
economic data provided markets greater confidence that the first rate cut would come in the second half of 2024. Against the backdrop of a
steepening US Treasury curve, credit spreads across a broad spectrum of fixed income asset classes generally tightened.
■
The following strategies contributed most to the Fund’s performance relative to the Index during the period: positioning in AAA collateralized
loan obligations (CLOs); overweights in the non-agency commercial mortgage-backed securities (CMBS) AAA and US investment grade
sectors; security selection in US Treasuries, asset-backed securities (ABS), and non-agency mortgage-backed securities (MBS); duration
positioning; and selection in banking, MBS, and midstream energy. (Duration measures the sensitivity of the price—the value of principal—of a
bond to a change in interest rates.)
■
The following strategies detracted from relative performance during the period: security selection in MBS, yield curve positioning, and selection
in finance companies. (A yield curve is a line graph that illustrates the relationship between the yields and maturities of fixed income securities.
It is created by plotting the yields of different maturities for the same type of bonds.)
■
The Fund uses derivatives when they facilitate implementation of the overall investment approach. During the reporting period, the Fund used
swaps, options, and futures to help manage duration positioning and yield curve exposure. In aggregate, these positions detracted
from performance.
HOW HAS THE FUND PERFORMED OVER THE PAST 10 YEARS?
The Fund’s past performance is not a good predictor of the Fund’s future performance.
The returns do not reflect the deduction of
taxes that a shareholder would pay on Fund distributions or redemption of Fund shares.
Visit
pgim.com/investments/mutual-funds/prospectuses-fact-sheets
or call (800) 225-1852 for more recent performance data.
The line graph reflects a hypothetical $10,000 investment in Class Z shares and assumes that all recurring fees (including management fees)
were deducted and dividend and distributions were reinvested. Without
waiver
of fees and/or expense reimbursements, if any, the returns would
have been lower.
Cumulative Performance: July 31, 2014 to July 31, 2024 Initial Investment of $10,000 |
Average Annual Total Returns as of 7/31/2024 |
| | | |
| | | |
Bloomberg US Aggregate Bond Index | | | |
WHAT ARE SOME KEY FUND STATISTICS AS OF 7/31/2024?
| |
| |
Total advisory fees paid for the year | |
Portfolio turnover rate for the year | |
WHAT ARE SOME CHARACTERISTICS OF THE FUND’S HOLDINGS AS OF 7/31/2024?
Credit Quality expressed as a percentage of total investments as of 7/31/2024 (%) |
| |
| |
| |
| |
| |
| |
| |
| |
Credit ratings reflect the highest rating assigned by a nationally recognized statistical rating organization (NRSRO) such as Moody’s Investors Service, Inc. (Moody’s), S&P Global
Ratings (S&P), or Fitch Ratings, Inc. (Fitch). Credit ratings reflect the common nomenclature used by both S&P and Fitch. Where applicable, ratings are converted to the comparable
S&P/Fitch rating tier nomenclature. The Not Rated category consists of securities that have not been rated by an NRSRO. Credit ratings are subject to change.
You can find additional information at
pgim.com/investments/mutual-funds/prospectuses-fact-sheets
or by scanning the QR code below,
including the Fund’s prospectus, financial information, fund holdings, and proxy voting information. You can also request this information by
contacting us at (800) 225-1852.
To receive your fund documents online, go to
pgim.com/investments/resource/edelivery
and enroll.
ANNUAL SHAREHOLDER REPORT – July 31, 2024
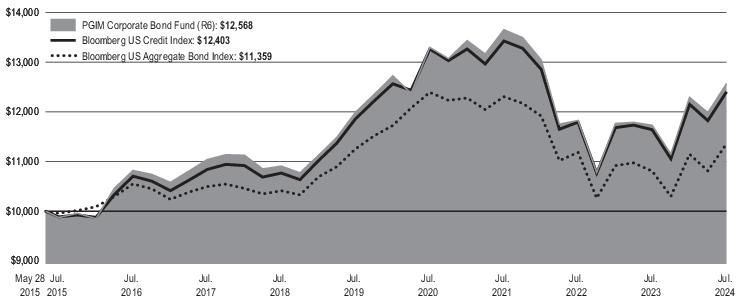
This annual shareholder report contains important information about the Class R6 shares of PGIM Core Bond Fund (the “Fund”) for the period of
August 1, 2023 to July 31, 2024.
You can find additional information about the Fund at
pgim.com/investments/mutual-funds/prospectuses-fact-sheets
. You can also request
this information by contacting us at (800) 225-1852.
WHAT WERE THE FUND COSTS FOR THE LAST YEAR?
(Based on a hypothetical $10,000 investment)
| Costs of a $10,000 investment | Costs paid as a percentage of a $10,000 investment |
PGIM Core Bond Fund—Class R6 | | |
WHAT AFFECTED THE FUND’S PERFORMANCE DURING THE REPORTING PERIOD?
■
Although the US Federal Reserve held policy rates steady for eight consecutive Federal Open Market Committee meetings, moderating
economic data provided markets greater confidence that the first rate cut would come in the second half of 2024. Against the backdrop of a
steepening US Treasury curve, credit spreads across a broad spectrum of fixed income asset classes generally tightened.
■
The following strategies contributed most to the Fund’s performance relative to the Index during the period: positioning in AAA collateralized
loan obligations (CLOs); overweights in the non-agency commercial mortgage-backed securities (CMBS) AAA and US investment grade
sectors; security selection in US Treasuries, asset-backed securities (ABS), and non-agency mortgage-backed securities (MBS); duration
positioning; and selection in banking, MBS, and midstream energy. (Duration measures the sensitivity of the price—the value of principal—of a
bond to a change in interest rates.)
■
The following strategies detracted from relative performance during the period: security selection in MBS, yield curve positioning, and selection
in finance companies. (A yield curve is a line graph that illustrates the relationship between the yields and maturities of fixed income securities.
It is created by plotting the yields of different maturities for the same type of bonds.)
■
The Fund uses derivatives when they facilitate implementation of the overall investment approach. During the reporting period, the Fund used
swaps, options, and futures to help manage duration positioning and yield curve exposure. In aggregate, these positions detracted
from performance.
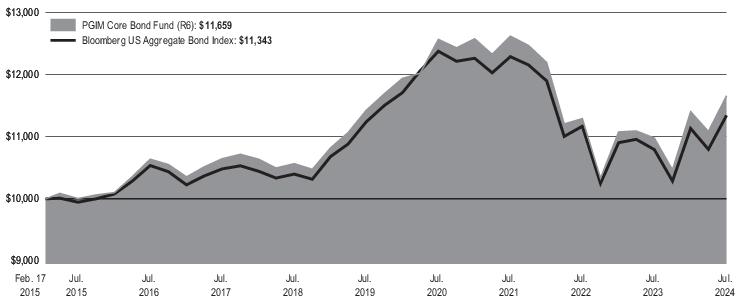
HOW HAS THE FUND PERFORMED OVER THE PAST 10 YEARS?
The Fund’s past performance is not a good predictor of the Fund’s future performance.
The returns do not reflect the deduction of
taxes that a shareholder would pay on Fund distributions or redemption of Fund shares.
Visit
pgim.com/investments/mutual-funds/prospectuses-fact-sheets
or call (800) 225-1852 for more recent performance data.
The line graph reflects a hypothetical $10,000 investment in Class R6 shares and assumes that all recurring fees (including management fees)
were deducted and dividend and distributions were reinvested. Without waiver of fees and/or expense reimbursements, if any, the returns would
have been lower.
Cumulative Performance: February 17, 2015 to July 31, 2024 Initial Investment of $10,000 |
Average Annual Total Returns as of 7/31/2024 |
| | | |
| | | |
Bloomberg US Aggregate Bond Index | | | |
Since Inception returns are provided for any share class with less than 10 fiscal years of returns. Since Inception returns for the Index are measured from the closest month-end to the
class’s inception date.
WHAT ARE SOME KEY FUND STATISTICS AS OF 7/31/2024?
| |
| |
Total advisory fees paid for the year | |
Portfolio turnover rate for the year | |
WHAT ARE SOME CHARACTERISTICS OF THE FUND’S HOLDINGS AS OF 7/31/2024?
Credit Quality expressed as a percentage of total investments as of 7/31/2024 (%) |
| |
| |
| |
| |
| |
| |
| |
| |
Credit ratings reflect the highest rating assigned by a nationally recognized statistical rating organization (NRSRO) such as Moody’s Investors Service, Inc. (Moody’s), S&P Global
Ratings (S&P), or Fitch Ratings, Inc. (Fitch). Credit ratings reflect the common nomenclature used by both S&P and Fitch. Where applicable, ratings are converted to the comparable
S&P/Fitch rating tier nomenclature. The Not Rated category consists of securities that have not been rated by an NRSRO. Credit ratings are subject to change.
You can find additional information at
pgim.com/investments/mutual-funds/prospectuses-fact-sheets
or by scanning the QR code below,
including the Fund’s prospectus, financial information, fund holdings, and proxy voting information. You can also request this information by
contacting us at (800) 225-1852.
To receive your fund documents online, go to
pgim.com/investments/resource/edelivery
and enroll.
ANNUAL SHAREHOLDER REPORT – July 31, 2024
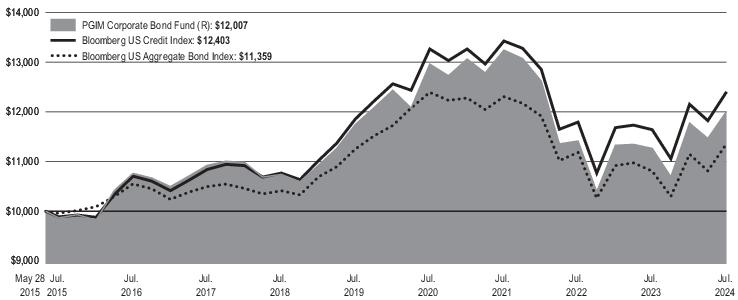
This annual shareholder report contains important information about the Class A shares of PGIM Corporate Bond Fund (the “Fund”) for the period
of August 1, 2023 to July 31, 2024.
You can find additional information about the Fund at
pgim.com/investments/mutual-funds/prospectuses-fact-sheets
. You can also request
this information by contacting us at (800) 225-1852.
This report describes changes to the Fund that occurred during the reporting period.
WHAT WERE THE FUND COSTS FOR THE LAST YEAR?
(Based on a hypothetical $10,000 investment)
| Costs of a $10,000 investment | Costs paid as a percentage of a $10,000 investment |
PGIM Corporate Bond Fund—Class A | | |
WHAT AFFECTED THE FUND’S PERFORMANCE DURING THE REPORTI
NG
PERIOD?
■
Although the Federal Reserve (the Fed) has held policy rates steady for eight consecutive Federal Open Market Committee meetings,
moderating economic data provided markets greater confidence that the first Fed interest rate cut would come in the second half of 2024.
Against the backdrop of a steepening US Treasury curve, credit spreads across a broad spectrum of fixed income asset classes generally
tightened during the reporting period.
■
The following contributed most to the Fund’s performance during the reporting period: positioning in US investment-grade corporate bonds and
emerging-market investment-grade bonds; an overweight relative to the Index in the AAA-rated non-agency commercial mortgage-backed
securities sector; security selection in taxable municipals and US high yield corporates; and positioning in midstream energy, electric utilities,
real estate investment trusts, banking, metal & mining, and consumer non-cyclicals.
■
The following detracted most from the Fund’s performance during the reporting period: security selection in US Treasuries; positioning in media
& entertainment, finance companies, life insurance, railroads, and natural gas; and the Fund’s yield curve and duration positioning. (A yield
curve is a line graph that illustrates the relationship between the yields and maturities of fixed income securities. It is created by plotting the
yields of different maturities for the same type of bonds. Duration measures the sensitivity of the price—the value of principal—of a bond to a
change in interest rates.)
■
The Fund employs US Treasury futures and swaps on a limited basis to manage the Fund’s duration and interest-rate risk. The subadviser
believes that using such futures and swaps is more efficient than managing interest-rate risk through the purchase and sale of cash corporate
bonds. This use of derivatives detracted from performance during the reporting
period.
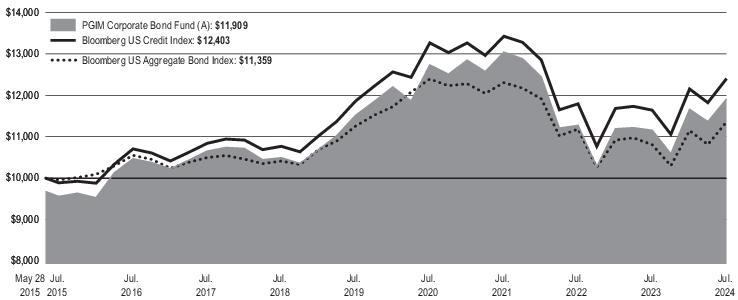
HOW HAS THE FUND PERFORMED OVER THE PAST 10 YEARS?
The Fund’s past performance is not a good predictor of the Fund’s future performance.
The returns do not reflect the deduction of
taxes that a shareholder would pay on Fund distributions or redemption of Fund shares.
Visit
pgim.com/investments/mutual-funds/prospectuses-fact-sheets
or call (800) 225-1852 for more recent performance data.
The line graph reflects a hypothetical $10,000 investment in Class A shares and assumes that all recurring fees (including management fees)
were deducted and dividend and distributions were reinvested. Without waiver of fees and/or expense reimbursements, if any, the returns would
have been lower.
Cumulative Performance: May 28, 2015 to July 31, 2024 Initial Investment of $10,000 |
The line graph reflects the return on the Fund's Class A shares
wi
th
sal
es charges.
Average Annual Total Returns as of 7/31/2024 |
| | | |
Class A with sales charges | | | |
Class A without sales charges | | | |
Bloomberg US Credit Index | | | |
Bloomberg US Aggregate Bond Index | | | |
Since Inception returns are provided for any share class with less than 10 fiscal years of returns. Since Inception returns for the Indexes are measured from the closest month-end
to
the class’s inception date.
The Fund has added the Bloomberg US Aggregate Bond Index as a broad-based securities market index in response to new regulatory r
equirements.
WHAT ARE SOME KEY FUND STATISTICS AS OF 7/31/2024?
| |
| |
Total advisory fees paid for the year | |
Portfolio turnover rate for the year | |
WHAT ARE SOME CHARACTERISTICS OF THE FUND’S HOLDING
S A
S OF 7/31/2024?
Credit Quality expressed as a percentage of total investments as of 7/31/2024 (%) |
| |
| |
| |
| |
| |
| |
| |
Credit ratings reflect the highest rating assigned by a nationally recognized statistical rating organization (NRSRO) such as Moody’s Investors Service, Inc. (Moody’s), S&P Global
Ratings (S&P), or Fitch Ratings, Inc. (Fitch). Credit ratings reflect the common nomenclature used by both S&P and Fitch. Where applicable, ratings are converted to the comparable
S&P/Fitch rating tier nomenclature. The Not Rated category consists of securities that have not been rated by an NRSRO. Credit ratings are subject to change.
WERE THERE ANY CHANGES TO THE FUND THIS YEAR?
The following is a summary of certain changes to the Fund since August 1, 2023:
■
The Fund's principal risk disclosure was revised to include Yankee Obligations Risk as a principal risk of the Fund. The Fund's risk disclosure was revised based on changes in the Fund's portfolio which may result in greater exposure to these types of securities.
For more complete information, you should review the Fund's next prospectus, which we expect to be available by September 27, 2024 at
pgim.com/investments/mutual-funds/prospectuses-fact-sheets or by request at (800) 225-1852.
You can find additional information at
pgim.com/investments/mutual-funds/prospectuses-fact-sheets
or by scanning the QR code below,
including the Fund’s prospectus, financial information, fund holdings, and proxy voting information. You can also request this information by
contacting us at (800) 225-1852.
To receive your fund documents online, go to
pgim.com/investments/resource/edelivery
and enroll.
ANNUAL SHAREHOLDER REPORT – July 31, 2024
This annual shareholder report contains important information about the Class C shares of PGIM Corporate Bond Fund (the “Fund”) for the
period of August 1, 2023 to July 31, 2024.
You can find additional information about the Fund at
pgim.com/investments/mutual-funds/prospectuses-fact-sheets
. You can also request
this information by contacting us at (800) 225-1852.
This report describes changes to the Fund that occurred during the reporting period.
WHAT WERE THE FUND COSTS FOR THE LAST YEAR?
(Based on a hypothetical $10,000 investment)
| Costs of a $10,000 investment | Costs paid as a percentage of a $10,000 investment |
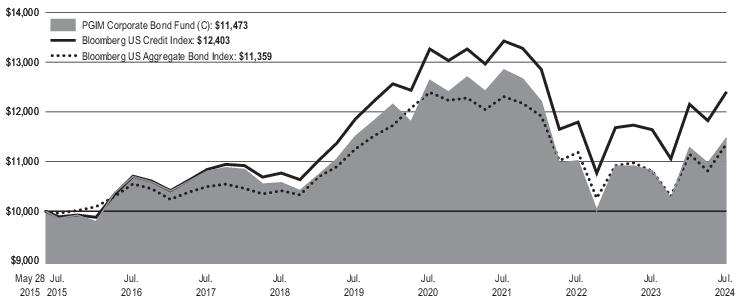
PGIM Corporate Bond Fund—Class C | | |
WHAT AFFECTED THE FUND’S PERFORMANCE DURING THE REPORTING PERIOD?
■
Although the Federal Reserve (the Fed) has held policy rates steady for eight consecutive Federal Open Market Committee meetings,
moderating economic data provided markets greater confidence that the first Fed interest rate cut would come in the second half of 2024.
Against the backdrop of a steepening US Treasury curve, credit spreads across a broad spectrum of fixed income asset classes generally
tightened during the reporting period.
■
The following contributed most to the Fund’s performance during the reporting period: positioning in US investment-grade corporate bonds and
emerging-market investment-grade bonds; an overweight relative to the Index in the AAA-rated non-agency commercial mortgage-backed
securities sector; security selection in taxable municipals and US high yield corporates; and positioning in midstream energy, electric utilities,
real estate investment trusts, banking, metal & mining, and consumer non-cyclicals.
■
The following detracted most from the Fund’s performance during the reporting period: security selection in US Treasuries; positioning in media
& entertainment, finance companies, life insurance, railroads, and natural gas; and the Fund’s yield curve and duration positioning. (A yield
curve is a line graph that illustrates the relationship between the yields and maturities of fixed income securities. It is created by plotting the
yields of different maturities for the same type of bonds. Duration measures the sensitivity of the price—the value of principal—of a bond to a
change in interest rates.)
■
The Fund employs US Treasury futures and swaps on a limited basis to manage the Fund’s duration and interest-rate risk. The subadviser
believes that using such futures and swaps is more efficient than managing interest-rate risk through the purchase and sale of cash corporate
bonds. This use of derivatives detracted from performance during the reporting period.
HOW HAS THE FUND PERFORMED OVER THE PAST 10 YEARS?
The Fund’s past performance is not a good predictor of the Fund’s future performance.
The returns do not reflect the deduction of
taxes that a shareholder would pay on Fund distributions or redemption of Fund shares.
Visit
pgim.com/investments/mutual-funds/prospectuses-fact-sheets
or call (800) 225-1852 for more recent performance data.
The line graph reflects a hypothetical $10,000 investment in Class C shares and assumes that all recurring fees (including management fees)
were deducted and dividend and distributions were reinvested. Without waiver of fees and/or expense reimbursements, if any, the returns would
have been lower.
Cumulative Performance: May 28, 2015 to July 31, 2024 Initial Investment of $10,000 |
Average Annual Total Returns as of 7/31/2024 |
| | | |
Class C with sales charges | | | |
Class C without sales charges | | | |
Bloomberg US Credit Index | | | |
Bloomberg US Aggregate Bond Index | | | |
Since Inception returns are provided for any share class with less than 10 fiscal years of returns. Since Inception returns for the Indexes are measured from the closest month-end to
the class’s inception date.
The Fund has added the Bloomberg US Aggregate Bond Index as a broad-based securities market index in response to new regulatory requirements.
WHAT ARE SOME KEY FUND STATISTICS AS OF 7/31/2024?
| |
| |
Total advisory fees paid for the year | |
Portfolio turnover rate for the year | |
WHAT ARE SOME CHARACTERISTICS OF THE FUND’S HOLDINGS AS OF 7/31/2024?
Credit Quality expressed as a percentage of total investments as of 7/31/2024 (%) |
| |
| |
| |
| |
| |
| |
| |
Credit ratings reflect the highest rating assigned by a nationally recognized statistical rating organization (NRSRO) such as Moody’s Investors Service, Inc. (Moody’s), S&P Global
Ratings (S&P), or Fitch Ratings, Inc. (Fitch). Credit ratings reflect the common nomenclature used by both S&P and Fitch. Where applicable, ratings are converted to the comparable
S&P/Fitch rating tier nomenclature. The Not Rated category consists of securities that have not been rated by an NRSRO. Credit ratings are subject to change.
WERE THERE ANY CHANGES TO THE FUND THIS YEAR?
The following is a summary of certain changes to the Fund since August 1, 2023:
■
The Fund's principal risk disclosure was revised to include Yankee Obligations Risk as a principal risk of the Fund. The Fund's risk disclosure was revised based on changes in the Fund's portfolio which may result in greater exposure to these types of securities.
For more complete information, you should review the Fund's next prospectus, which we expect to be available by September 27, 2024 at
pgim.com/investments/mutual-funds/prospectuses-fact-sheets or by request at (800) 225-1852.
You can find additional information at
pgim.com/investments/mutual-funds/prospectuses-fact-sheets
or by scanning the QR code below,
including the Fund’s prospectus, financial information, fund holdings, and proxy voting information. You can also request this information by
contacting us at (800) 225-1852.
To receive your fund documents online, go to
pgim.com/investments/resource/edelivery
and enroll.
ANNUAL SHAREHOLDER REPORT – July 31, 2024
This annual shareholder report contains important information about the Class R shares of PGIM Corporate Bond Fund (the “Fund”) for the
period of August 1, 2023 to July 31, 2024.
You can find additional information about the Fund at
pgim.com/investments/mutual-funds/prospectuses-fact-sheets
. You can also request
this information by contacting us at (800) 225-1852.
This report describes changes to the Fund that occurred during the reporting period.
WHAT WERE THE FUND COSTS FOR THE LAST YEAR?
(Based on a hypothetical $10,000 investment)
| Costs of a $10,000 investment | Costs paid as a percentage of a $10,000 investment |
PGIM Corporate Bond Fund—Class R | | |
WHAT AFFECTED THE FUND’S PERFORMANCE DURING THE REPORTING PERIOD?
■
Although the Federal Reserve (the Fed) has held policy rates steady for eight consecutive Federal Open Market Committee meetings,
moderating economic data provided markets greater confidence that the first Fed interest rate cut would come in the second half of 2024.
Against the backdrop of a steepening US Treasury curve, credit spreads across a broad spectrum of fixed income asset classes generally
tightened during the reporting period.
■
The following contributed most to the Fund’s performance during the reporting period: positioning in US investment-grade corporate bonds and
emerging-market investment-grade bonds; an overweight relative to the Index in the AAA-rated non-agency commercial mortgage-backed
securities sector; security selection in taxable municipals and US high yield corporates; and positioning in midstream energy, electric utilities,
real estate investment trusts, banking, metal & mining, and consumer non-cyclicals.
■
The following detracted most from the Fund’s performance during the reporting period: security selection in US Treasuries; positioning in media
& entertainment, finance companies, life insurance, railroads, and natural gas; and the Fund’s yield curve and duration positioning. (A yield
curve is a line graph that illustrates the relationship between the yields and maturities of fixed income securities. It is created by plotting the
yields of different maturities for the same type of bonds. Duration measures the sensitivity of the price—the value of principal—of a bond to a
change in interest rates.)
■
The Fund employs US Treasury futures and swaps on a limited basis to manage the Fund’s duration and interest-rate risk. The subadviser
believes that using such futures and swaps is more efficient than managing interest-rate risk through the purchase and sale of cash corporate
bonds. This use of derivatives detracted from performance during the reporting period.
HOW HAS THE FUND PERFORMED OVER THE PAST 10 YEARS?
The Fund’s past performance is not a good predictor of the Fund’s future performance.
The returns do not reflect the deduction of
taxes that a shareholder would pay on Fund distributions or redemption of Fund shares.
Visit
pgim.com/investments/mutual-funds/prospectuses-fact-sheets
or call (800) 225-1852 for more recent performance data.
The line graph reflects a hypothetical $10,000 investment in Class R shares and assumes that all recurring fees (including management fees)
were deducted and dividend and distributions were reinvested. Without waiver of fees and/or expense reimbursements, if any, the returns would
have been lower.
Cumulative Performance: May 28, 2015 to July 31, 2024 Initial Investment of $10,000 |
Average Annual Total Returns as of 7/31/2024 |
| | | |
| | | |
Bloomberg US Credit Index | | | |
Bloomberg US Aggregate Bond Index | | | |
Since Inception returns are provided for any share class with less than 10 fiscal years of returns. Since Inception returns for the Indexes are measured from the closest month-end to
the class’s inception date.
The Fund has added the Bloomberg US Aggregate Bond Index as a broad-based securities market index in response to new regulatory requirements.
WHAT ARE SOME KEY FUND STATISTICS AS OF 7/31/2024?
| |
| |
Total advisory fees paid for the year | |
Portfolio turnover rate for the year | |
WHAT ARE SOME CHARACTERISTICS OF THE FUND’S HOLDINGS AS OF 7/31/2024?
Credit Quality expressed as a percentage of total investments as of 7/31/2024 (%) |
| |
| |
| |
| |
| |
| |
| |
Credit ratings reflect the highest rating assigned by a nationally recognized statistical rating organization (NRSRO) such as Moody’s Investors Service, Inc. (Moody’s), S&P Global
Ratings (S&P), or Fitch Ratings, Inc. (Fitch). Credit ratings reflect the common nomenclature used by both S&P and Fitch. Where applicable, ratings are converted to the comparable
S&P/Fitch rating tier nomenclature. The Not Rated category consists of securities that have not been rated by an NRSRO. Credit ratings are subject to change.
WERE THERE ANY CHANGES TO THE FUND THIS YEAR?
The following is a summary of certain changes to the Fund since August 1, 2023:
■
The Fund's principal risk disclosure was revised to include Yankee Obligations Risk as a principal risk of the Fund. The Fund's risk disclosure was revised based on changes in the Fund's portfolio which may result in greater exposure to these types of securities.
For more complete information, you should review the Fund's next prospectus, which we expect to be available by September 27, 2024 at
pgim.com/investments/mutual-funds/prospectuses-fact-sheets or by request at (800) 225-1852.
You can find additional information at
pgim.com/investments/mutual-funds/prospectuses-fact-sheets
or by scanning the QR code below,
including the Fund’s prospectus, financial information, fund holdings, and proxy voting information. You can also request this information by
contacting us at (800) 225-1852.
To receive your fund documents online, go to
pgim.com/investments/resource/edelivery
and enroll.
ANNUAL SHAREHOLDER REPORT – July 31, 2024
This annual shareholder report contains important information about the Class Z shares of PGIM Corporate Bond Fund (the “Fund”) for the period
of August 1, 2023 to July 31, 2024.
You can find additional information about the Fund at
pgim.com/investments/mutual-funds/prospectuses-fact-sheets
. You can also request
this information by contacting us at (800) 225-1852.
This report describes changes to the Fund that occurred during the reporting period.
WHAT WERE THE FUND COSTS FOR THE LAST YEAR?
(Based on a hypothetical $10,000 investment)
| Costs of a $10,000 investment | Costs paid as a percentage of a $10,000 investment |
PGIM Corporate Bond Fund—Class Z | | |
WHAT AFFECTED THE FUND’S PERFORMANCE DURING THE REPORTING PERIOD?
■
Although the Federal Reserve (the Fed) has held policy rates steady for eight consecutive Federal Open Market Committee meetings,
moderating economic data provided markets greater confidence that the first Fed interest rate cut would come in the second half of 2024.
Against the backdrop of a steepening US Treasury curve, credit spreads across a broad spectrum of fixed income asset classes generally
tightened during the reporting period.
■
The following contributed most to the Fund’s performance during the reporting period: positioning in US investment-grade corporate bonds and
emerging-market investment-grade bonds; an overweight relative to the Index in the AAA-rated non-agency commercial mortgage-backed
securities sector; security selection in taxable municipals and US high yield corporates; and positioning in midstream energy, electric utilities,
real estate investment trusts, banking, metal & mining, and consumer non-cyclicals.
■
The following detracted most from the Fund’s performance during the reporting period: security selection in US Treasuries; positioning in media
& entertainment, finance companies, life insurance, railroads, and natural gas; and the Fund’s yield curve and duration positioning. (A yield
curve is a line graph that illustrates the relationship between the yields and maturities of fixed income securities. It is created by plotting the
yields of different maturities for the same type of bonds. Duration measures the sensitivity of the price—the value of principal—of a bond to a
change in interest rates.)
■
The Fund employs US Treasury futures and swaps on a limited basis to manage the Fund’s duration and interest-rate risk. The subadviser
believes that using such futures and swaps is more efficient than managing interest-rate risk through the purchase and sale of cash corporate
bonds. This use of derivatives detracted from performance during the reporting period.
HOW HAS THE FUND PERFORMED OVER THE PAST 10 YEARS?
The Fund’s past performance is not a good predictor of the Fund’s future performance.
The returns do not reflect the deduction of
taxes that a shareholder would pay on Fund distributions or redemption of Fund shares.
Visit
pgim.com/investments/mutual-funds/prospectuses-fact-sheets
or call (800) 225-1852 for more recent performance data.
The line graph reflects a hypothetical $10,000 investment in Class Z shares and assumes that all recurring fees (including management fees)
were deducted and dividend and distributions were reinvested. Without waiver of fees and/or expense reimbursements, if any, the returns would
have been lower.
Cumulative Performance: July 31, 2014 to July 31, 2024 Initial Investment of $10,000 |
Average Annual Total Returns as of 7/31/2024 |
| | | |
| Class Z | | | |
| Bloomberg US Credit Index | | | |
| Bloomberg US Aggregate Bond Index | | | |
The Fund has added the Bloomberg US Aggregate Bond Index as a broad-based securities market index in response to new regulatory requirements.
WHAT ARE SOME KEY FUND STATISTICS AS OF 7/31/2024?
| |
| |
Total advisory fees paid for the year | |
Portfolio turnover rate for the year | |
WHAT ARE SOME CHARACTERISTICS OF THE FUND’S HOLDINGS AS OF 7/31/2024?
Credit Quality expressed as a percentage of total investments as of 7/31/2024 (%) |
| |
| |
| |
| |
| |
| |
| |
Credit ratings reflect the highest rating assigned by a nationally recognized statistical rating organization (NRSRO) such as Moody’s Investors Service, Inc. (Moody’s), S&P Global
Ratings (S&P), or Fitch Ratings, Inc. (Fitch). Credit ratings reflect the common nomenclature used by both S&P and Fitch. Where applicable, ratings are converted to the comparable
S&P/Fitch rating tier nomenclature. The Not Rated category consists of securities that have not been rated by an NRSRO. Credit ratings are subject to change.
WERE THERE ANY CHANGES TO THE FUND THIS YEAR?
The following is a summary of certain changes to the Fund since August 1, 2023:
■
The Fund's principal risk disclosure was revised to include Yankee Obligations Risk as a principal risk of the Fund. The Fund's risk disclosure was revised based on changes in the Fund's portfolio which may result in greater exposure to these types of securities.
For more complete information, you should review the Fund's next prospectus, which we expect to be available by September 27, 2024 at
pgim.com/investments/mutual-funds/prospectuses-fact-sheets or by request at (800) 225-1852.
You can find additional information at
pgim.com/investments/mutual-funds/prospectuses-fact-sheets
or by scanning the QR code below,
including the Fund’s prospectus, financial information, fund holdings, and proxy voting information. You can also request this information by
contacting us at (800) 225-1852.
To receive your fund documents online, go to
pgim.com/investments/resource/edelivery
and enroll.
ANNUAL SHAREHOLDER REPORT – July 31, 2024
This annual shareholder report contains important information about the Class R6 shares of PGIM Corporate Bond Fund (the “Fund”) for the
period of August 1, 2023 to July 31, 2024.
You can find additional information about the Fund at
pgim.com/investments/mutual-funds/prospectuses-fact-sheets
. You can also request
this information by contacting us at (800) 225-1852.
This report describes changes to the
Fund
that
occurred
during
the reporting period.
WHAT WERE THE FUND COSTS FOR THE LAST YEAR?
(Based on a hypothetical $10,000 investment)
| Costs of a $10,000 investment | Costs paid as a percentage of a $10,000 investment |
PGIM Corporate Bond Fund—Class R6 | | |
WHAT AFFECTED THE FUND’S PERFORMANCE DURING THE REPORTING PERIOD?
■
Although the Federal Reserve (the Fed) has held policy rates steady for eight consecutive Federal Open Market Committee meetings,
moderating economic data provided markets greater confidence that the first Fed interest rate cut would come in the second half of 2024.
Against the backdrop of a steepening US Treasury curve, credit spreads across a broad spectrum of fixed income asset classes generally
tightened during the reporting period.
■
The following contributed most to the Fund’s performance during the reporting period: positioning in US investment-grade corporate bonds and
emerging-market investment-grade bonds; an overweight relative to the Index in the AAA-rated non-agency commercial mortgage-backed
securities sector; security selection in taxable municipals and US high yield corporates; and positioning in midstream energy, electric utilities,
real estate investment trusts, banking, metal & mining, and consumer non-cyclicals.
■
The following detracted most from the Fund’s performance during the reporting period: security selection in US Treasuries; positioning in media
& entertainment, finance companies, life insurance, railroads, and natural gas; and the Fund’s yield curve and duration positioning. (A yield
curve is a line graph that illustrates the relationship between the yields and maturities of fixed income securities. It is created by plotting the
yields of different maturities for the same type of bonds. Duration measures the sensitivity of the price—the value of principal—of a bond to a
change in interest rates.)
■
The Fund employs US Treasury futures and swaps on a limited basis to manage the Fund’s duration and interest-rate risk. The subadviser
believes that using such futures and swaps is more efficient than managing interest-rate risk through the purchase and sale of cash corporate
bonds. This use of derivatives detracted from performance during the reporting period.
HOW HAS THE FUND PERFORMED OVER THE PAST 10 YEARS?
The Fund’s past performance is not a good predictor of the Fund’s future performance.
The returns do not reflect the deduction of
taxes that a shareholder would pay on Fund distributions or redemption of Fund shares.
Visit
pgim.com/investments/mutual-funds/prospectuses-fact-sheets
or call (800) 225-1852 for more recent performance data.
The line graph reflects a hypothetical $10,000 investment in Class R6 shares and assumes that all recurring fees (including management fees)
were deducted and dividend and distributions were reinvested. Without waiver of fees and/or expense reimbursements, if any, the returns would
have been lower.
Cumulative Performance: May 28, 2015 to July 31, 2024 Initial Investment of $10,000 |
Average Annual Total Returns as of 7/31/2024 |
| | | |
| | | |
Bloomberg US Credit Index | | | |
Bloomberg US Aggregate Bond Index | | | |
Since Inception returns are provided for any share class with less than 10 fiscal years of returns. Since Inception returns for the Indexes are measured from the closest month-end to
the class’s inception date.
The Fund has added the Bloomberg US Aggregate Bond Index as a broad-based securities market index in response to new regulatory requirements.
WHAT ARE SOME KEY FUND STATISTICS AS OF 7/31/2024?
| |
| |
Total advisory fees paid for the year | |
Portfolio turnover rate for the year | |
WHAT ARE SOME CHARACTERISTICS OF THE FUND’S HOLDINGS AS OF 7/31/2024?
Credit Quality expressed as a percentage of total investments as of 7/31/2024 (%) |
| |
| |
| |
| |
| |
| |
| |
Credit ratings reflect the highest rating assigned by a nationally recognized statistical rating organization (NRSRO) such as Moody’s Investors Service, Inc. (Moody’s), S&P Global
Ratings (S&P), or Fitch Ratings, Inc. (Fitch). Credit ratings reflect the common nomenclature used by both S&P and Fitch. Where applicable, ratings are converted to the comparable
S&P/Fitch rating tier nomenclature. The Not Rated category consists of securities that have not been rated by an NRSRO. Credit ratings are subject to change.
WERE THERE ANY CHANGES TO THE FUND THIS YEAR?
The following is a summary of certain changes to the Fund since August 1, 2023:
■
The Fund's principal risk disclosure was revised to include Yankee Obligations Risk as a principal risk of the Fund. The Fund's risk disclosure was revised based on changes in the Fund's portfolio which may result in greater exposure to these types of securities.
For more complete information, you should review the Fund's next prospectus, which we expect to be available by September 27, 2024 at
pgim.com/investments/mutual-funds/prospectuses-fact-sheets or by request at (800) 225-1852.
You can find additional information at
pgim.com/investments/mutual-funds/prospectuses-fact-sheets
or by scanning the QR code below,
including the Fund’s prospectus, financial information, fund holdings, and proxy voting information. You can also request this information by
contacting us at (800) 225-1852.
To receive your fund documents online, go to
pgim.com/investments/resource/edelivery
and enroll.
| | (b) | Copy of each notice transmitted to stockholders in reliance on Rule 30e-3 under the Act (17 CFR 270.30e-3) that contains disclosures specified by paragraph (c)(3) of that rule – Not applicable. |
| Item 2 – | Code of Ethics – See Exhibit (a) |
As of the end of the period covered by this report, the registrant has adopted a code of ethics (the “Section 406 Standards for Investment Companies – Ethical Standards for Principal Executive and Financial Officers”) that applies to the registrant’s Principal Executive Officer, Principal Financial Officer and Principal Accounting Officer.
The registrant hereby undertakes to provide any person, without charge, upon request, a copy of the code of ethics. To request a copy of the code of ethics, contact the registrant 800-225-1852, and ask for a copy of the Section 406 Standards for Investment Companies - Ethical Standards for Principal Executive and Financial Officers.
| Item 3 – | Audit Committee Financial Expert – |
The registrant’s Board has determined that Ms. Grace C. Torres, member of the Board’s Audit Committee is an “audit committee financial expert,” and that she is “independent,” for purposes of this item.
| Item 4 – | Principal Accountant Fees and Services – |
For the fiscal years ended July 31, 2024 and July 31, 2023, PricewaterhouseCoopers LLP (“PwC”), the Registrant’s principal accountant, billed the Registrant $136,740 and $133,000, respectively, for professional services rendered for the audit of the Registrant’s annual financial statements or services that are normally provided in connection with statutory and regulatory filings.
For the fiscal years ended July 31, 2024 and July 31, 2023: none.
For the fiscal years ended July 31, 2024 and July 31, 2023: none.
For the fiscal years ended July 31, 2024 and July 31, 2023: none.
| | (e) (1) | Audit Committee Pre-Approval Policies and Procedures |
THE PGIM MUTUAL FUNDS
AUDIT COMMITTEE POLICY
on
Pre-Approval of Services Provided by the Independent
Accountants
The Audit Committee of each PGIM Mutual Fund is charged with the responsibility to monitor the independence of the Fund’s independent accountants. As part of this responsibility, the Audit Committee must pre-approve the independent accounting firm’s engagement to render audit and/or permissible non-audit services, as required by law. In evaluating a proposed engagement of the independent accountants, the Audit Committee will assess the effect that the engagement might reasonably be expected to have on the accountant’s independence. The Committee’s evaluation will be based on:
| | • | | a review of the nature of the professional services expected to be provided, |
| | • | | a review of the safeguards put into place by the accounting firm to safeguard independence, and |
| | • | | periodic meetings with the accounting firm. |
Policy for Audit and Non-Audit Services Provided to the Funds
On an annual basis, the scope of audits for each Fund, audit fees and expenses, and audit-related and non-audit services (and fees proposed in respect thereof) proposed to be performed by the Fund’s independent accountants will be presented by the Treasurer and the independent accountants to the Audit Committee for review and, as appropriate, approval prior to the initiation of such services.
Such presentation shall be accompanied by confirmation by both the Treasurer and the independent accountants that the proposed non-audit services will not adversely affect the independence of the independent accountants. Such proposed non-audit services shall be described in sufficient detail to enable the Audit Committee to assess the appropriateness of such services and fees, and the compatibility of the provision of such services with the auditor’s independence. The Committee shall receive periodic reports on the progress of the audit and other services which are approved by the Committee or by the Committee Chair pursuant to authority delegated in this Policy.
The categories of services enumerated under “Audit Services”, “Audit-related Services”, and “Tax Services” are intended to provide guidance to the Treasurer and the independent accountants as to those categories of services which the Committee believes are generally consistent with the independence of the independent accountants and which the Committee (or the Committee Chair) would expect upon the presentation of specific proposals to pre-approve. The enumerated categories are not intended as an exclusive list of audit, audit-related or tax services, which the Committee (or the Committee Chair) would consider for pre-approval.
Audit Services
The following categories of audit services are considered to be consistent with the role of the Fund’s independent accountants:
| | • | | Annual Fund financial statement audits |
| | • | | Seed audits (related to new product filings, as required) |
| | • | | SEC and regulatory filings and consents |
Audit-related Services
The following categories of audit-related services are considered to be consistent with the role of the Fund’s independent accountants:
| | • | | Accounting consultations |
| | • | | Fund merger support services |
| | • | | Agreed Upon Procedure Reports |
| | • | | Other Internal Control Reports |
| | |
Individual audit-related services that fall within one of these categories (except for fund merger support services) and are not presented to the Audit Committee as part of the annual pre-approval process are subject to an authorized pre-approval by the Audit Committee so long as the estimated fee for those services does not exceed $30,000. Any services provided under such pre-approval will be reported to the Audit Committee at its next regular meeting. Should the amount of such services exceed $30,000 any additional fees will be subject to pre-approval by the Committee Chair (or any other Committee member on whom this responsibility has been delegated). Fees related to fund merger support services are subject to a separate authorized pre-approval by the Audit Committee with fees determined on a per occurrence and merger complexity basis. | | |
Tax Services
The following categories of tax services are considered to be consistent with the role of the Fund’s independent accountants:
| | • | | Tax compliance services related to the filing or amendment of the following: |
| | • | | Federal, state and local income tax compliance; and, |
| | • | | Sales and use tax compliance |
| | • | | Timely RIC qualification reviews |
| | • | | Tax distribution analysis and planning |
| | • | | Tax authority examination services |
| | • | | Tax appeals support services |
| | • | | Accounting methods studies |
| | • | | Fund merger support services |
| | • | | Tax consulting services and related projects |
Individual tax services that fall within one of these categories and are not presented to the Audit Committee as part of the annual pre-approval process are subject to an authorized pre-approval by the Audit Committee so long as the estimated fee for those services does not exceed $30,000. Any services provided under such pre-approval will be reported to the Audit Committee at its next regular meeting. Should the amount of such services exceed $30,000 any additional fees will be subject to pre-approval by the Committee Chair (or any other Committee member on whom this responsibility has been delegated).
Other Non-Audit Services
Certain non-audit services that the independent accountants are legally permitted to render will be subject to pre-approval by the Committee or by one or more Committee members to whom the Committee has delegated this authority and who will report to the full Committee any pre-approval decisions made pursuant to this Policy. Non-audit services presented for pre-approval pursuant to this paragraph will be accompanied by a confirmation from both the Treasurer and the independent accountants that the proposed services will not adversely affect the independence of the independent accountants.
Proscribed Services
The Fund’s independent accountants will not render services in the following categories of non-audit services:
| | • | | Bookkeeping or other services related to the accounting records or financial statements of the Fund |
| | • | | Financial information systems design and implementation |
| | • | | Appraisal or valuation services, fairness opinions, or contribution-in-kind reports |
| | • | | Internal audit outsourcing services |
| | • | | Management functions or human resources |
| | • | | Broker or dealer, investment adviser, or investment banking services |
| | • | | Legal services and expert services unrelated to the audit |
| | • | | Any other service that the Public Company Accounting Oversight Board determines, by regulation, is impermissible. |
Pre-approval of Non-Audit Services Provided to Other Entities Within the PGIM Fund Complex
Certain non-audit services provided to PGIM Investments LLC or any of its affiliates that also provide ongoing services to the PGIM Mutual Funds will be subject to pre-approval by the Audit Committee. The only non-audit services provided to these entities that will require pre-approval are those related directly to the operations and financial reporting of the Funds. Individual projects that are not presented to the Audit Committee as part of the annual pre-approval process will be subject to pre-approval by the Committee Chair (or any other Committee member on whom this responsibility has been delegated) so long as the estimated fee for those services does not exceed $30,000. Services presented for pre-approval pursuant to this paragraph will be accompanied by a confirmation from both the Treasurer and the independent accountants that the proposed services will not adversely affect the independence of the independent accountants.
Although the Audit Committee will not pre-approve all services provided to PGIM Investments LLC and its affiliates, the Committee will receive an annual report from the Fund’s independent accounting firm showing the aggregate fees for all services provided to PGIM Investments and its affiliates.
(e) (2) Percentage of services described in each of paragraphs (b) through (d) of this Item that were approved by the audit committee pursuant to paragraph (c)(7)(i)(C) of Rule 2-01 of Regulation S-X –
| | | | | | | | | | |
| | | | Fiscal Year Ended July 31, 2024 | | | | Fiscal Year Ended July 31, 2023 | | |
| | 4(b) | | Not applicable. | | | | Not applicable. | | |
| | 4(c) | | Not applicable. | | | | Not applicable. | | |
| | 4(d) | | Not applicable. | | | | Not applicable. | | |
(f) Percentage of hours expended attributable to work performed by other than full time employees of principal accountant if greater than 50%.
The percentage of hours expended on the principal accountant’s engagement to audit the registrant’s financial statements for the most recent fiscal year that were attributed to work performed by persons other than the principal accountant’s full-time, permanent employees was 0%.
(g) Non-Audit Fees
The aggregate non-audit fees billed by the Registrant’s principal accountant for services rendered to the registrant’s investment adviser and any entity controlling, controlled by, or under common control with the investment adviser that provides ongoing services to the registrant for the fiscal years ended July 31, 2024 and July 31, 2023 was $0 and $0, respectively.
(h) Principal Accountant’s Independence
Not applicable as the Registrant’s principal accountant has not provided non-audit services to the registrant’s investment adviser and any entity controlling, controlled by, or under common control with the investment adviser that provides ongoing services to the registrant that were not pre-approved pursuant to Rule 2-01(c)(7)(ii) of Regulation S-X.
(i) Not applicable.
(j) Not applicable.
| Item 5 – | Audit Committee of Listed Registrants – Not applicable. |
| Item 6 – | Investments – The registrant’s Schedule of Investments is included in the financial statements filed under Item 7 of this Form. |
| Items 7 – | 11 (Refer to Report below) |

THE TARGET PORTFOLIO TRUST
PGIM Quant Solutions Small-Cap Value Fund
FINANCIAL STATEMENTS AND OTHER INFORMATION
JULY 31, 2024

| | | | |
Table of Contents | | Financial Statements and Other Information | | July 31, 2024 |
Form N-CSR Item 7 - Financial Statements and Financial Highlights for Open-End Management Investment Companies.
Schedule of Investments
as of July 31, 2024
| | | | | | | | |
| Description | | Shares | | | Value | |
| | |
LONG-TERM INVESTMENTS 100.4% | | | | | | | | |
| | |
COMMON STOCKS 99.9% | | | | | | | | |
| | |
Air Freight & Logistics 0.9% | | | | | | | | |
| | |
Air Transport Services Group, Inc.* | | | 119,700 | | | $ | 1,931,958 | |
| | |
Forward Air Corp.(a) | | | 74,400 | | | | 1,886,784 | |
| | | | | | | | |
| | |
| | | | | | | 3,818,742 | |
| | |
Automobile Components 2.5% | | | | | | | | |
| | |
Adient PLC* | | | 105,900 | | | | 2,727,984 | |
| | |
BorgWarner, Inc. | | | 14,600 | | | | 515,526 | |
| | |
Dana, Inc. | | | 189,800 | | | | 2,412,358 | |
| | |
Goodyear Tire & Rubber Co. (The)* | | | 256,300 | | | | 2,998,710 | |
| | |
Lear Corp. | | | 2,400 | | | | 292,896 | |
| | |
Standard Motor Products, Inc. | | | 54,900 | | | | 1,796,877 | |
| | | | | | | | |
| | |
| | | | | | | 10,744,351 | |
| | |
Automobiles 0.5% | | | | | | | | |
| | |
Harley-Davidson, Inc. | | | 3,900 | | | | 146,250 | |
| | |
Winnebago Industries, Inc. | | | 32,300 | | | | 2,019,396 | |
| | | | | | | | |
| | |
| | | | | | | 2,165,646 | |
| | |
Banks 20.5% | | | | | | | | |
| | |
Ameris Bancorp | | | 38,700 | | | | 2,356,443 | |
| | |
Associated Banc-Corp. | | | 97,100 | | | | 2,231,358 | |
| | |
Atlantic Union Bankshares Corp. | | | 43,700 | | | | 1,804,373 | |
| | |
Banc of California, Inc. | | | 102,800 | | | | 1,437,144 | |
| | |
BankUnited, Inc. | | | 56,800 | | | | 2,187,936 | |
| | |
Banner Corp. | | | 23,900 | | | | 1,415,358 | |
| | |
Berkshire Hills Bancorp, Inc. | | | 30,200 | | | | 833,520 | |
| | |
Brookline Bancorp, Inc. | | | 63,300 | | | | 664,017 | |
| | |
Business First Bancshares, Inc. | | | 7,000 | | | | 177,940 | |
| | |
Byline Bancorp, Inc. | | | 31,900 | | | | 894,795 | |
| | |
Cadence Bank | | | 64,700 | | | | 2,126,689 | |
| | |
Camden National Corp. | | | 2,800 | | | | 116,704 | |
| | |
Capitol Federal Financial, Inc. | | | 26,000 | | | | 164,320 | |
| | |
Cathay General Bancorp | | | 41,400 | | | | 1,834,848 | |
| | |
Central Pacific Financial Corp. | | | 9,500 | | | | 247,855 | |
| | |
Civista Bancshares, Inc. | | | 4,500 | | | | 80,775 | |
| | |
CNB Financial Corp. | | | 28,099 | | | | 721,020 | |
| | |
Community Trust Bancorp, Inc. | | | 14,366 | | | | 728,643 | |
| | |
ConnectOne Bancorp, Inc. | | | 36,600 | | | | 886,452 | |
| | |
CrossFirst Bankshares, Inc.* | | | 17,000 | | | | 315,180 | |
| | |
Customers Bancorp, Inc.* | | | 22,600 | | | | 1,457,248 | |
See Notes to Financial Statements.
PGIM Quant Solutions Small-Cap Value Fund 1
Schedule of Investments (continued)
as of July 31, 2024
| | | | | | | | |
| Description | | Shares | | | Value | |
| | |
COMMON STOCKS (Continued) | | | | | | | | |
| | |
Banks (cont’d.) | | | | | | | | |
| | |
CVB Financial Corp. | | | 46,200 | | | $ | 880,572 | |
| | |
Dime Community Bancshares, Inc. | | | 17,900 | | | | 452,512 | |
| | |
Eastern Bankshares, Inc. | | | 31,000 | | | | 515,840 | |
| | |
Enterprise Financial Services Corp. | | | 24,000 | | | | 1,268,880 | |
| | |
Financial Institutions, Inc. | | | 55,227 | | | | 1,453,575 | |
| | |
First Bancorp | | | 10,600 | | | | 443,080 | |
| | |
First Bancshares, Inc. (The) | | | 15,900 | | | | 529,788 | |
| | |
First Busey Corp. | | | 55,600 | | | | 1,525,664 | |
| | |
First Commonwealth Financial Corp. | | | 60,500 | | | | 1,093,840 | |
| | |
First Financial Bancorp | | | 77,051 | | | | 2,108,115 | |
| | |
First Financial Corp. | | | 15,959 | | | | 717,517 | |
| | |
First Interstate BancSystem, Inc. (Class A Stock) | | | 53,800 | | | | 1,698,466 | |
| | |
First Merchants Corp. | | | 38,000 | | | | 1,533,300 | |
| | |
First Mid Bancshares, Inc. | | | 5,600 | | | | 214,984 | |
| | |
First of Long Island Corp. (The) | | | 24,500 | | | | 321,440 | |
| | |
FS Bancorp, Inc. | | | 1,500 | | | | 66,045 | |
| | |
Fulton Financial Corp. | | | 119,000 | | | | 2,305,030 | |
| | |
Hancock Whitney Corp. | | | 49,900 | | | | 2,731,027 | |
| | |
Hanmi Financial Corp. | | | 23,078 | | | | 470,791 | |
| | |
Heritage Commerce Corp. | | | 28,400 | | | | 293,940 | |
| | |
Heritage Financial Corp. | | | 5,600 | | | | 129,752 | |
| | |
Home BancShares, Inc. | | | 15,300 | | | | 433,449 | |
| | |
Hope Bancorp, Inc. | | | 132,616 | | | | 1,745,227 | |
| | |
Horizon Bancorp, Inc. | | | 28,931 | | | | 462,028 | |
| | |
Independent Bank Corp. | | | 26,200 | | | | 1,680,730 | |
| | |
Kearny Financial Corp. | | | 6,700 | | | | 48,240 | |
| | |
Metropolitan Bank Holding Corp.* | | | 2,700 | | | | 142,371 | |
| | |
Midland States Bancorp, Inc. | | | 20,800 | | | | 493,792 | |
| | |
MidWestOne Financial Group, Inc. | | | 4,762 | | | | 139,574 | |
| | |
National Bank Holdings Corp. (Class A Stock) | | | 16,700 | | | | 699,396 | |
| | |
Northeast Community Bancorp, Inc. | | | 3,900 | | | | 88,842 | |
| | |
Northfield Bancorp, Inc. | | | 13,000 | | | | 162,630 | |
| | |
Northwest Bancshares, Inc. | | | 76,000 | | | | 1,067,040 | |
| | |
OceanFirst Financial Corp. | | | 42,600 | | | | 774,042 | |
| | |
Old National Bancorp | | | 160,843 | | | | 3,220,077 | |
| | |
Old Second Bancorp, Inc. | | | 12,100 | | | | 204,732 | |
| | |
Origin Bancorp, Inc. | | | 9,800 | | | | 336,728 | |
| | |
Orrstown Financial Services, Inc. | | | 3,000 | | | | 105,480 | |
| | |
Pacific Premier Bancorp, Inc. | | | 73,500 | | | | 1,988,910 | |
| | |
Peapack-Gladstone Financial Corp. | | | 23,279 | | | | 657,865 | |
| | |
Peoples Bancorp, Inc. | | | 22,100 | | | | 735,267 | |
| | |
Premier Financial Corp. | | | 37,782 | | | | 957,396 | |
| | |
Provident Financial Services, Inc. | | | 84,120 | | | | 1,559,585 | |
| | |
QCR Holdings, Inc. | | | 11,200 | | | | 856,128 | |
See Notes to Financial Statements.
2
| | | | | | | | |
| Description | | Shares | | | Value | |
| | |
COMMON STOCKS (Continued) | | | | | | | | |
| | |
Banks (cont’d.) | | | | | | | | |
| | |
RBB Bancorp | | | 3,600 | | | $ | 83,052 | |
| | |
Renasant Corp. | | | 44,800 | | | | 1,540,672 | |
| | |
S&T Bancorp, Inc. | | | 31,263 | | | | 1,387,452 | |
| | |
Sandy Spring Bancorp, Inc. | | | 43,300 | | | | 1,326,279 | |
| | |
Seacoast Banking Corp. of Florida | | | 20,800 | | | | 579,072 | |
| | |
Simmons First National Corp. (Class A Stock) | | | 89,800 | | | | 1,933,394 | |
| | |
Southern Missouri Bancorp, Inc. | | | 800 | | | | 45,760 | |
| | |
Southside Bancshares, Inc. | | | 6,400 | | | | 223,936 | |
| | |
SouthState Corp. | | | 29,985 | | | | 2,967,615 | |
| | |
Stellar Bancorp, Inc. | | | 22,300 | | | | 611,020 | |
| | |
Towne Bank | | | 37,300 | | | | 1,239,852 | |
| | |
TriCo Bancshares | | | 8,200 | | | | 381,546 | |
| | |
TrustCo Bank Corp. | | | 9,000 | | | | 320,490 | |
| | |
Trustmark Corp. | | | 32,300 | | | | 1,121,779 | |
| | |
UMB Financial Corp. | | | 1,300 | | | | 132,626 | |
| | |
United Bankshares, Inc. | | | 47,000 | | | | 1,829,710 | |
| | |
United Community Banks, Inc. | | | 44,900 | | | | 1,389,655 | |
| | |
Univest Financial Corp. | | | 20,200 | | | | 558,530 | |
| | |
Valley National Bancorp(a) | | | 252,900 | | | | 2,124,360 | |
| | |
Veritex Holdings, Inc. | | | 48,200 | | | | 1,208,374 | |
| | |
WaFd, Inc. | | | 56,600 | | | | 2,014,394 | |
| | |
Washington Trust Bancorp, Inc. | | | 5,000 | | | | 160,050 | |
| | |
WesBanco, Inc. | | | 55,748 | | | | 1,777,246 | |
| | |
WSFS Financial Corp. | | | 27,300 | | | | 1,542,177 | |
| | | | | | | | |
| | |
| | | | | | | 88,495,346 | |
| | |
Biotechnology 2.5% | | | | | | | | |
| | |
2seventy bio, Inc.* | | | 56,600 | | | | 267,152 | |
| | |
ACELYRIN, Inc.* | | | 54,700 | | | | 328,200 | |
| | |
Agios Pharmaceuticals, Inc.* | | | 13,600 | | | | 631,040 | |
| | |
Akero Therapeutics, Inc.* | | | 10,000 | | | | 267,300 | |
| | |
Allogene Therapeutics, Inc.* | | | 92,700 | | | | 272,538 | |
| | |
Beam Therapeutics, Inc.* | | | 17,000 | | | | 537,880 | |
| | |
Bridgebio Pharma, Inc.* | | | 9,000 | | | | 233,550 | |
| | |
Caribou Biosciences, Inc.* | | | 111,100 | | | | 257,752 | |
| | |
Century Therapeutics, Inc.* | | | 12,400 | | | | 27,652 | |
| | |
Cytokinetics, Inc.* | | | 28,300 | | | | 1,669,983 | |
| | |
Denali Therapeutics, Inc.* | | | 7,800 | | | | 190,086 | |
| | |
Design Therapeutics, Inc.* | | | 54,200 | | | | 276,420 | |
| | |
Fate Therapeutics, Inc.* | | | 70,400 | | | | 375,232 | |
| | |
Generation Bio Co.* | | | 23,400 | | | | 78,156 | |
| | |
Intellia Therapeutics, Inc.* | | | 22,300 | | | | 584,483 | |
| | |
iTeos Therapeutics, Inc.* | | | 18,500 | | | | 325,415 | |
| | |
Kodiak Sciences, Inc.* | | | 76,300 | | | | 222,033 | |
See Notes to Financial Statements.
PGIM Quant Solutions Small-Cap Value Fund 3
Schedule of Investments (continued)
as of July 31, 2024
| | | | | | | | |
| Description | | Shares | | | Value | |
| | |
COMMON STOCKS (Continued) | | | | | | | | |
| | |
Biotechnology (cont’d.) | | | | | | | | |
| | |
Kyverna Therapeutics, Inc.*(a) | | | 24,900 | | | $ | 215,634 | |
| | |
Lyell Immunopharma, Inc.* | | | 132,500 | | | | 213,325 | |
| | |
Myriad Genetics, Inc.* | | | 20,800 | | | | 581,776 | |
| | |
Nkarta, Inc.* | | | 38,300 | | | | 246,269 | |
| | |
Organogenesis Holdings, Inc.* | | | 86,100 | | | | 260,022 | |
| | |
Puma Biotechnology, Inc.* | | | 31,600 | | | | 113,286 | |
| | |
RAPT Therapeutics, Inc.* | | | 51,600 | | | | 162,024 | |
| | |
Relay Therapeutics, Inc.* | | | 18,400 | | | | 151,248 | |
| | |
REVOLUTION Medicines, Inc.* | | | 12,300 | | | | 561,372 | |
| | |
Sage Therapeutics, Inc.* | | | 26,200 | | | | 286,890 | |
| | |
Spyre Therapeutics, Inc.* | | | 3,300 | | | | 90,750 | |
| | |
Tourmaline Bio, Inc. | | | 2,800 | | | | 47,264 | |
| | |
Vanda Pharmaceuticals, Inc.* | | | 49,100 | | | | 286,744 | |
| | |
Veracyte, Inc.* | | | 15,300 | | | | 367,200 | |
| | |
Verve Therapeutics, Inc.* | | | 50,400 | | | | 352,800 | |
| | |
Vir Biotechnology, Inc.* | | | 44,600 | | | | 453,136 | |
| | | | | | | | |
| | |
| | | | | | | 10,934,612 | |
| | |
Broadline Retail 0.0% | | | | | | | | |
| | |
Dillard’s, Inc. (Class A Stock) | | | 300 | | | | 119,577 | |
| | |
Building Products 0.7% | | | | | | | | |
| | |
Resideo Technologies, Inc.* | | | 122,000 | | | | 2,771,840 | |
| | |
UFP Industries, Inc. | | | 1,500 | | | | 197,895 | |
| | | | | | | | |
| | |
| | | | | | | 2,969,735 | |
| | |
Chemicals 1.7% | | | | | | | | |
| | |
AdvanSix, Inc. | | | 50,200 | | | | 1,404,094 | |
| | |
Arcadium Lithium PLC (United Kingdom)* | | | 230,800 | | | | 733,944 | |
| | |
Core Molding Technologies, Inc.* | | | 21,100 | | | | 389,295 | |
| | |
Intrepid Potash, Inc.* | | | 56,300 | | | | 1,468,867 | |
| | |
LSB Industries, Inc.* | | | 51,300 | | | | 467,343 | |
| | |
Mativ Holdings, Inc. | | | 129,900 | | | | 2,479,791 | |
| | |
Rayonier Advanced Materials, Inc.* | | | 82,700 | | | | 549,955 | |
| | | | | | | | |
| | |
| | | | | | | 7,493,289 | |
| | |
Commercial Services & Supplies 1.5% | | | | | | | | |
| | |
ABM Industries, Inc. | | | 4,600 | | | | 255,576 | |
| | |
ACCO Brands Corp. | | | 318,441 | | | | 1,627,234 | |
| | |
Aris Water Solutions, Inc. (Class A Stock) | | | 50,200 | | | | 889,042 | |
| | |
BrightView Holdings, Inc.* | | | 125,200 | | | | 1,801,628 | |
| | |
CoreCivic, Inc.* | | | 73,900 | | | | 1,030,166 | |
See Notes to Financial Statements.
4
| | | | | | | | |
| Description | | Shares | | | Value | |
| | |
COMMON STOCKS (Continued) | | | | | | | | |
| | |
Commercial Services & Supplies (cont’d.) | | | | | | | | |
| | |
MillerKnoll, Inc. | | | 29,500 | | | $ | 915,090 | |
| | |
UniFirst Corp. | | | 300 | | | | 58,362 | |
| | | | | | | | |
| | |
| | | | | | | 6,577,098 | |
| | |
Construction & Engineering 0.7% | | | | | | | | |
| | |
Arcosa, Inc. | | | 6,100 | | | | 566,751 | |
| | |
MDU Resources Group, Inc. | | | 24,700 | | | | 665,418 | |
| | |
Northwest Pipe Co.* | | | 35,800 | | | | 1,365,770 | |
| | |
Tutor Perini Corp.* | | | 21,700 | | | | 540,113 | |
| | | | | | | | |
| | |
| | | | | | | 3,138,052 | |
| | |
Consumer Finance 1.4% | | | | | | | | |
| | |
Bread Financial Holdings, Inc.(a) | | | 51,800 | | | | 2,827,244 | |
| | |
Green Dot Corp. (Class A Stock)* | | | 92,000 | | | | 879,520 | |
| | |
Navient Corp. | | | 140,500 | | | | 2,305,605 | |
| | |
Regional Management Corp. | | | 4,300 | | | | 140,610 | |
| | | | | | | | |
| | |
| | | | | | | 6,152,979 | |
| | |
Consumer Staples Distribution & Retail 2.0% | | | | | | | | |
| | |
Andersons, Inc. (The) | | | 16,700 | | | | 910,651 | |
| | |
Ingles Markets, Inc. (Class A Stock) | | | 32,205 | | | | 2,610,215 | |
| | |
SpartanNash Co. | | | 105,900 | | | | 2,236,608 | |
| | |
United Natural Foods, Inc.* | | | 74,700 | | | | 1,157,850 | |
| | |
Village Super Market, Inc. (Class A Stock) | | | 51,600 | | | | 1,634,688 | |
| | |
Weis Markets, Inc. | | | 2,300 | | | | 173,535 | |
| | | | | | | | |
| | |
| | | | | | | 8,723,547 | |
| | |
Containers & Packaging 0.8% | | | | | | | | |
| | |
Greif, Inc. (Class A Stock) | | | 700 | | | | 46,676 | |
| | |
O-I Glass, Inc.* | | | 199,100 | | | | 2,659,976 | |
| | |
Sealed Air Corp. | | | 4,700 | | | | 178,835 | |
| | |
Sonoco Products Co. | | | 6,200 | | | | 334,304 | |
| | | | | | | | |
| | |
| | | | | | | 3,219,791 | |
| | |
Diversified Consumer Services 0.8% | | | | | | | | |
| | |
ADT, Inc. | | | 121,300 | | | | 943,714 | |
| | |
Chegg, Inc.* | | | 232,400 | | | | 792,484 | |
| | |
Graham Holdings Co. (Class B Stock) | | | 2,000 | | | | 1,549,700 | |
| | | | | | | | |
| | |
| | | | | | | 3,285,898 | |
See Notes to Financial Statements.
PGIM Quant Solutions Small-Cap Value Fund 5
Schedule of Investments (continued)
as of July 31, 2024
| | | | | | | | |
| Description | | Shares | | | Value | |
| | |
COMMON STOCKS (Continued) | | | | | | | | |
| | |
Diversified REITs 1.6% | | | | | | | | |
| | |
Alpine Income Property Trust, Inc. | | | 3,500 | | | $ | 60,795 | |
| | |
American Assets Trust, Inc. | | | 61,600 | | | | 1,633,632 | |
| | |
Broadstone Net Lease, Inc. | | | 107,100 | | | | 1,864,611 | |
| | |
CTO Realty Growth, Inc.(a) | | | 59,483 | | | | 1,193,824 | |
| | |
Essential Properties Realty Trust, Inc. | | | 18,100 | | | | 535,579 | |
| | |
Global Net Lease, Inc. | | | 195,223 | | | | 1,698,440 | |
| | | | | | | | |
| | |
| | | | | | | 6,986,881 | |
| | |
Diversified Telecommunication Services 0.5% | | | | | | | | |
| | |
Liberty Latin America Ltd. (Puerto Rico) (Class A Stock)* | | | 111,000 | | | | 1,163,280 | |
| | |
Liberty Latin America Ltd. (Puerto Rico) (Class C Stock)*(a) | | | 111,700 | | | | 1,184,020 | |
| | | | | | | | |
| | |
| | | | | | | 2,347,300 | |
| | |
Electric Utilities 0.0% | | | | | | | | |
| | |
Portland General Electric Co. | | | 2,500 | | | | 118,450 | |
| | |
Electrical Equipment 0.1% | | | | | | | | |
| | |
Sunrun, Inc.* | | | 21,000 | | | | 368,130 | |
| | |
Electronic Equipment, Instruments & Components 1.2% | | | | | | | | |
| | |
Benchmark Electronics, Inc. | | | 26,900 | | | | 1,287,703 | |
| | |
Kimball Electronics, Inc.* | | | 33,900 | | | | 803,430 | |
| | |
ScanSource, Inc.* | | | 45,200 | | | | 2,352,660 | |
| | |
Vishay Intertechnology, Inc. | | | 27,900 | | | | 678,249 | |
| | | | | | | | |
| | |
| | | | | | | 5,122,042 | |
| | |
Energy Equipment & Services 3.0% | | | | | | | | |
| | |
DMC Global, Inc.* | | | 78,400 | | | | 1,058,400 | |
| | |
Geospace Technologies Corp.* | | | 13,300 | | | | 124,089 | |
| | |
Helmerich & Payne, Inc. | | | 58,300 | | | | 2,356,486 | |
| | |
Patterson-UTI Energy, Inc. | | | 229,800 | | | | 2,525,502 | |
| | |
ProFrac Holding Corp. (Class A Stock)* | | | 128,200 | | | | 1,190,978 | |
| | |
ProPetro Holding Corp.* | | | 155,100 | | | | 1,487,409 | |
| | |
Ranger Energy Services, Inc. | | | 90,300 | | | | 1,171,191 | |
| | |
RPC, Inc. | | | 102,800 | | | | 767,916 | |
| | |
Seadrill Ltd. (Norway)* | | | 9,600 | | | | 528,096 | |
| | |
Select Water Solutions, Inc. (Class A Stock) | | | 98,800 | | | | 1,167,816 | |
| | |
Solaris Oilfield Infrastructure, Inc. (Class A Stock) | | | 30,100 | | | | 395,815 | |
| | | | | | | | |
| | |
| | | | | | | 12,773,698 | |
See Notes to Financial Statements.
6
| | | | | | | | |
| Description | | Shares | | | Value | |
| | |
COMMON STOCKS (Continued) | | | | | | | | |
| | |
Entertainment 0.5% | | | | | | | | |
| | |
Playtika Holding Corp. | | | 23,800 | | | $ | 181,594 | |
| | |
Sphere Entertainment Co.*(a) | | | 43,400 | | | | 1,930,432 | |
| | | | | | | | |
| | |
| | | | | | | 2,112,026 | |
| | |
Financial Services 4.1% | | | | | | | | |
| | |
Acacia Research Corp.* | | | 7,900 | | | | 42,265 | |
| | |
Banco Latinoamericano de Comercio Exterior SA (Panama) | | | | | | | | |
| | |
(Class E Stock) | | | 43,700 | | | | 1,412,821 | |
| | |
Burford Capital Ltd. | | | 26,400 | | | | 372,504 | |
| | |
Enact Holdings, Inc. | | | 65,300 | | | | 2,222,159 | |
| | |
Essent Group Ltd. | | | 50,800 | | | | 3,192,272 | |
| | |
Jackson Financial, Inc. (Class A Stock)(a) | | | 44,400 | | | | 3,909,864 | |
| | |
Mr. Cooper Group, Inc.* | | | 24,000 | | | | 2,157,120 | |
| | |
NMI Holdings, Inc.* | | | 3,000 | | | | 118,050 | |
| | |
Radian Group, Inc. | | | 98,066 | | | | 3,638,249 | |
| | |
Repay Holdings Corp.* | | | 79,600 | | | | 765,752 | |
| | | | | | | | |
| | |
| | | | | | | 17,831,056 | |
| | |
Food Products 2.1% | | | | | | | | |
| | |
B&G Foods, Inc.(a) | | | 210,100 | | | | 1,811,062 | |
| | |
Dole PLC | | | 176,300 | | | | 2,618,055 | |
| | |
Fresh Del Monte Produce, Inc. | | | 96,200 | | | | 2,409,810 | |
| | |
Hain Celestial Group, Inc. (The)* | | | 30,500 | | | | 236,070 | |
| | |
Ingredion, Inc. | | | 8,500 | | | | 1,057,145 | |
| | |
Seaboard Corp. | | | 200 | | | | 649,582 | |
| | |
Seneca Foods Corp. (Class A Stock)*(a) | | | 7,600 | | | | 458,584 | |
| | | | | | | | |
| | |
| | | | | | | 9,240,308 | |
| | |
Gas Utilities 1.3% | | | | | | | | |
| | |
National Fuel Gas Co. | | | 18,000 | | | | 1,054,620 | |
| | |
Northwest Natural Holding Co. | | | 38,700 | | | | 1,547,226 | |
| | |
ONE Gas, Inc. | | | 6,800 | | | | 473,484 | |
| | |
Spire, Inc. | | | 20,200 | | | | 1,345,118 | |
| | |
UGI Corp. | | | 42,300 | | | | 1,048,194 | |
| | | | | | | | |
| | |
| | | | | | | 5,468,642 | |
| | |
Ground Transportation 0.2% | | | | | | | | |
| | |
Avis Budget Group, Inc. | | | 1,500 | | | | 151,515 | |
| | |
Ryder System, Inc. | | | 4,900 | | | | 686,784 | |
| | | | | | | | |
| | |
| | | | | | | 838,299 | |
See Notes to Financial Statements.
PGIM Quant Solutions Small-Cap Value Fund 7
Schedule of Investments (continued)
as of July 31, 2024
| | | | | | | | |
| Description | | Shares | | | Value | |
| | |
COMMON STOCKS (Continued) | | | | | | | | |
| | |
Health Care Equipment & Supplies 1.3% | | | | | | | | |
| | |
Avanos Medical, Inc.* | | | 44,900 | | | $ | 1,074,008 | |
| | |
Omnicell, Inc.* | | | 67,800 | | | | 1,980,438 | |
| | |
OraSure Technologies, Inc.* | | | 234,000 | | | | 1,048,320 | |
| | |
Varex Imaging Corp.* | | | 99,600 | | | | 1,473,084 | |
| | | | | | | | |
| | |
| | | | | | | 5,575,850 | |
| | |
Health Care Providers & Services 1.3% | | | | | | | | |
| | |
AdaptHealth Corp.* | | | 83,800 | | | | 951,968 | |
| | |
Cross Country Healthcare, Inc.* | | | 91,700 | | | | 1,672,608 | |
| | |
OPKO Health, Inc.*(a) | | | 69,700 | | | | 98,974 | |
| | |
Owens & Minor, Inc.* | | | 101,900 | | | | 1,673,198 | |
| | |
Pediatrix Medical Group, Inc.* | | | 94,500 | | | | 788,130 | |
| | |
Premier, Inc. (Class A Stock) | | | 17,800 | | | | 373,444 | |
| | | | | | | | |
| | |
| | | | | | | 5,558,322 | |
| | |
Health Care REITs 0.6% | | | | | | | | |
| | |
American Healthcare REIT, Inc. | | | 32,800 | | | | 522,832 | |
| | |
Community Healthcare Trust, Inc. | | | 4,200 | | | | 91,392 | |
| | |
Global Medical REIT, Inc. | | | 32,400 | | | | 309,420 | |
| | |
Sabra Health Care REIT, Inc. | | | 101,000 | | | | 1,639,230 | |
| | | | | | | | |
| | |
| | | | | | | 2,562,874 | |
| | |
Hotel & Resort REITs 1.5% | | | | | | | | |
| | |
Apple Hospitality REIT, Inc. | | | 51,900 | | | | 767,601 | |
| | |
Braemar Hotels & Resorts, Inc. | | | 88,700 | | | | 314,885 | |
| | |
Chatham Lodging Trust | | | 42,600 | | | | 374,454 | |
| | |
DiamondRock Hospitality Co. | | | 38,200 | | | | 314,386 | |
| | |
Pebblebrook Hotel Trust | | | 68,100 | | | | 932,289 | |
| | |
RLJ Lodging Trust | | | 136,600 | | | | 1,289,504 | |
| | |
Service Properties Trust | | | 194,300 | | | | 1,101,681 | |
| | |
Summit Hotel Properties, Inc. | | | 149,400 | | | | 947,196 | |
| | |
Xenia Hotels & Resorts, Inc. | | | 33,000 | | | | 458,040 | |
| | | | | | | | |
| | |
| | | | | | | 6,500,036 | |
| | |
Hotels, Restaurants & Leisure 0.9% | | | | | | | | |
| | |
Bally’s Corp.* | | | 58,800 | | | | 1,013,124 | |
| | |
Biglari Holdings, Inc. (Class B Stock)* | | | 5,210 | | | | 1,045,907 | |
| | |
El Pollo Loco Holdings, Inc.* | | | 80,100 | | | | 966,006 | |
| | |
Travel + Leisure Co. | | | 15,800 | | | | 728,222 | |
| | | | | | | | |
| | |
| | | | | | | 3,753,259 | |
See Notes to Financial Statements.
8
| | | | | | | | |
| Description | | Shares | | | Value | |
| | |
COMMON STOCKS (Continued) | | | | | | | | |
| | |
Household Durables 3.5% | | | | | | | | |
| | |
Beazer Homes USA, Inc.* | | | 26,700 | | | $ | 898,989 | |
| | |
Century Communities, Inc. | | | 3,400 | | | | 356,014 | |
| | |
Helen of Troy Ltd.* | | | 35,000 | | | | 2,068,850 | |
| | |
Hooker Furnishings Corp. | | | 3,700 | | | | 56,499 | |
| | |
KB Home | | | 30,600 | | | | 2,634,048 | |
| | |
Landsea Homes Corp.* | | | 52,200 | | | | 635,796 | |
| | |
Lifetime Brands, Inc. | | | 9,700 | | | | 83,808 | |
| | |
M/I Homes, Inc.* | | | 13,000 | | | | 2,168,790 | |
| | |
Meritage Homes Corp. | | | 8,000 | | | | 1,622,960 | |
| | |
Mohawk Industries, Inc.* | | | 8,700 | | | | 1,401,309 | |
| | |
Taylor Morrison Home Corp.* | | | 46,900 | | | | 3,146,052 | |
| | | | | | | | |
| | |
| | | | | | | 15,073,115 | |
| | |
Industrial REITs 0.6% | | | | | | | | |
| | |
Industrial Logistics Properties Trust | | | 138,300 | | | | 710,862 | |
| | |
LXP Industrial Trust | | | 76,800 | | | | 791,040 | |
| | |
Terreno Realty Corp. | | | 13,400 | | | | 916,694 | |
| | | | | | | | |
| | |
| | | | | | | 2,418,596 | |
| | |
Insurance 1.9% | | | | | | | | |
| | |
Ambac Financial Group, Inc.* | | | 68,700 | | | | 906,153 | |
| | |
Employers Holdings, Inc. | | | 21,200 | | | | 1,017,812 | |
| | |
Enstar Group Ltd.* | | | 8,900 | | | | 2,887,160 | |
| | |
Fidelis Insurance Holdings Ltd. (United Kingdom) | | | 77,300 | | | | 1,375,167 | |
| | |
Greenlight Capital Re Ltd. (Class A Stock)* | | | 19,900 | | | | 274,620 | |
| | |
SiriusPoint Ltd. (Bermuda)* | | | 125,000 | | | | 1,796,250 | |
| | | | | | | | |
| | |
| | | | | | | 8,257,162 | |
| | |
Interactive Media & Services 0.5% | | | | | | | | |
| | |
Bumble, Inc. (Class A Stock)* | | | 20,400 | | | | 190,536 | |
| | |
Ziff Davis, Inc.* | | | 39,400 | | | | 1,886,472 | |
| | | | | | | | |
| | |
| | | | | | | 2,077,008 | |
| | |
Leisure Products 0.8% | | | | | | | | |
| | |
Clarus Corp. | | | 102,300 | | | | 617,892 | |
| | |
JAKKS Pacific, Inc.* | | | 38,900 | | | | 818,456 | |
| | |
Latham Group, Inc.* | | | 29,900 | | | | 108,836 | |
| | |
Malibu Boats, Inc. (Class A Stock)* | | | 16,200 | | | | 616,248 | |
| | |
Mattel, Inc.* | | | 38,800 | | | | 748,452 | |
See Notes to Financial Statements.
PGIM Quant Solutions Small-Cap Value Fund 9
Schedule of Investments (continued)
as of July 31, 2024
| | | | | | | | |
| Description | | Shares | | | Value | |
| | |
COMMON STOCKS (Continued) | | | | | | | | |
| | |
Leisure Products (cont’d.) | | | | | | | | |
| | |
Solo Brands, Inc. (Class A Stock)* | | | 135,100 | | | $ | 322,889 | |
| | |
Topgolf Callaway Brands Corp.* | | | 15,900 | | | | 262,350 | |
| | | | | | | | |
| | |
| | | | | | | 3,495,123 | |
| | |
Machinery 1.7% | | | | | | | | |
| | |
Allison Transmission Holdings, Inc. | | | 13,300 | | | | 1,178,247 | |
| | |
Columbus McKinnon Corp. | | | 3,300 | | | | 125,928 | |
| | |
Commercial Vehicle Group, Inc.* | | | 20,400 | | | | 111,180 | |
| | |
Enpro, Inc. | | | 900 | | | | 153,846 | |
| | |
Greenbrier Cos., Inc. (The)(a) | | | 43,900 | | | | 2,239,339 | |
| | |
John Bean Technologies Corp. | | | 1,000 | | | | 98,380 | |
| | |
Manitowoc Co., Inc. (The)* | | | 111,700 | | | | 1,411,888 | |
| | |
Park-Ohio Holdings Corp. | | | 2,100 | | | | 65,562 | |
| | |
Terex Corp. | | | 8,000 | | | | 506,080 | |
| | |
Titan International, Inc.* | | | 141,900 | | | | 1,208,988 | |
| | |
Twin Disc, Inc. | | | 4,700 | | | | 67,774 | |
| | | | | | | | |
| | |
| | | | | | | 7,167,212 | |
| | |
Marine Transportation 1.0% | | | | | | | | |
| | |
Costamare, Inc. (Monaco) | | | 123,600 | | | | 1,831,752 | |
| | |
Genco Shipping & Trading Ltd. | | | 45,600 | | | | 885,096 | |
| | |
Golden Ocean Group Ltd. (Norway) | | | 9,100 | | | | 113,022 | |
| | |
Matson, Inc. | | | 4,300 | | | | 570,653 | |
| | |
Pangaea Logistics Solutions Ltd. | | | 142,200 | | | | 1,032,372 | |
| | | | | | | | |
| | |
| | | | | | | 4,432,895 | |
| | |
Media 2.9% | | | | | | | | |
| | |
Advantage Solutions, Inc.* | | | 189,000 | | | | 757,890 | |
| | |
AMC Networks, Inc. (Class A Stock)*(a) | | | 150,100 | | | | 1,670,613 | |
| | |
Cable One, Inc.(a) | | | 6,000 | | | | 2,480,280 | |
| | |
EchoStar Corp. (Class A Stock)* | | | 39,600 | | | | 795,168 | |
| | |
EW Scripps Co. (The) (Class A Stock)* | | | 172,400 | | | | 648,224 | |
| | |
Gray Television, Inc. | | | 182,000 | | | | 1,170,260 | |
| | |
Nexstar Media Group, Inc. | | | 3,000 | | | | 554,370 | |
| | |
Scholastic Corp. | | | 33,600 | | | | 1,052,688 | |
| | |
TEGNA, Inc. | | | 199,600 | | | | 3,179,628 | |
| | | | | | | | |
| | |
| | | | | | | 12,309,121 | |
| | |
Metals & Mining 1.6% | | | | | | | | |
| | |
Commercial Metals Co. | | | 29,900 | | | | 1,796,990 | |
| | |
Metallus, Inc.* | | | 35,000 | | | | 784,700 | |
See Notes to Financial Statements.
10
| | | | | | | | |
| Description | | Shares | | | Value | |
| | |
COMMON STOCKS (Continued) | | | | | | | | |
| | |
Metals & Mining (cont’d.) | | | | | | | | |
| | |
Olympic Steel, Inc. | | | 26,600 | | | $ | 1,348,088 | |
| | |
Radius Recycling, Inc. | | | 43,600 | | | | 790,032 | |
| | |
Ryerson Holding Corp. | | | 81,700 | | | | 1,943,643 | |
| | |
SunCoke Energy, Inc. | | | 26,400 | | | | 308,880 | |
| | | | | | | | |
| | |
| | | | | | | 6,972,333 | |
| | |
Mortgage Real Estate Investment Trusts (REITs) 3.7% | | | | | | | | |
| | |
AFC Gamma, Inc. | | | 26,400 | | | | 236,808 | |
| | |
Apollo Commercial Real Estate Finance, Inc. | | | 178,683 | | | | 1,947,645 | |
| | |
Arbor Realty Trust, Inc.(a) | | | 128,600 | | | | 1,736,100 | |
| | |
ARMOUR Residential REIT, Inc. | | | 52,860 | | | | 1,067,772 | |
| | |
Blackstone Mortgage Trust, Inc. (Class A Stock)(a) | | | 112,100 | | | | 2,000,985 | |
| | |
BrightSpire Capital, Inc. | | | 75,700 | | | | 433,761 | |
| | |
Chicago Atlantic Real Estate Finance, Inc. | | | 18,500 | | | | 295,630 | |
| | |
Chimera Investment Corp. | | | 25,433 | | | | 371,576 | |
| | |
Ellington Financial, Inc.(a) | | | 81,200 | | | | 1,030,428 | |
| | |
Franklin BSP Realty Trust, Inc. | | | 66,300 | | | | 917,592 | |
| | |
Invesco Mortgage Capital, Inc. | | | 69,600 | | | | 631,968 | |
| | |
KKR Real Estate Finance Trust, Inc. | | | 25,900 | | | | 297,332 | |
| | |
Ladder Capital Corp. | | | 110,100 | | | | 1,321,200 | |
| | |
MFA Financial, Inc. | | | 86,500 | | | | 967,935 | |
| | |
PennyMac Mortgage Investment Trust | | | 68,300 | | | | 940,491 | |
| | |
Ready Capital Corp. | | | 176,804 | | | | 1,640,741 | |
| | | | | | | | |
| | |
| | | | | | | 15,837,964 | |
| | |
Multi-Utilities 1.7% | | | | | | | | |
| | |
Avista Corp. | | | 60,000 | | | | 2,350,800 | |
| | |
Black Hills Corp. | | | 46,500 | | | | 2,745,825 | |
| | |
Northwestern Energy Group, Inc. | | | 38,400 | | | | 2,064,768 | |
| | | | | | | | |
| | |
| | | | | | | 7,161,393 | |
| | |
Office REITs 1.5% | | | | | | | | |
| | |
Brandywine Realty Trust | | | 104,900 | | | | 528,696 | |
| | |
City Office REIT, Inc. | | | 77,000 | | | | 465,850 | |
| | |
Douglas Emmett, Inc. | | | 107,300 | | | | 1,726,457 | |
| | |
Paramount Group, Inc. | | | 234,300 | | | | 1,227,732 | |
| | |
Piedmont Office Realty Trust, Inc. (Class A Stock) | | | 122,600 | | | | 1,060,490 | |
| | |
SL Green Realty Corp. | | | 22,400 | | | | 1,492,736 | |
| | | | | | | | |
| | |
| | | | | | | 6,501,961 | |
See Notes to Financial Statements.
PGIM Quant Solutions Small-Cap Value Fund 11
Schedule of Investments (continued)
as of July 31, 2024
| | | | | | | | |
| Description | | Shares | | | Value | |
| | |
COMMON STOCKS (Continued) | | | | | | | | |
| | |
Oil, Gas & Consumable Fuels 7.2% | | | | | | | | |
| | |
Amplify Energy Corp.* | | | 157,100 | | | $ | 1,179,821 | |
| | |
Berry Corp. | | | 178,500 | | | | 1,224,510 | |
| | |
Chord Energy Corp. | | | 3,000 | | | | 514,980 | |
| | |
CNX Resources Corp.*(a) | | | 90,400 | | | | 2,392,888 | |
| | |
Crescent Energy Co. (Class A Stock)(a) | | | 101,200 | | | | 1,237,676 | |
| | |
Diversified Energy Co. PLC | | | 12,100 | | | | 199,045 | |
| | |
Excelerate Energy, Inc. (Class A Stock) | | | 60,800 | | | | 1,223,904 | |
| | |
FutureFuel Corp. | | | 125,800 | | | | 703,222 | |
| | |
Gulfport Energy Corp.* | | | 7,700 | | | | 1,133,517 | |
| | |
Hallador Energy Co.* | | | 85,700 | | | | 682,172 | |
| | |
HighPeak Energy, Inc.(a) | | | 56,600 | | | | 951,446 | |
| | |
Matador Resources Co. | | | 7,200 | | | | 442,656 | |
| | |
Murphy Oil Corp. | | | 71,700 | | | | 2,966,946 | |
| | |
Par Pacific Holdings, Inc.* | | | 62,400 | | | | 1,656,720 | |
| | |
PBF Energy, Inc. (Class A Stock) | | | 60,400 | | | | 2,461,300 | |
| | |
Peabody Energy Corp. | | | 87,400 | | | | 1,941,154 | |
| | |
Permian Resources Corp. | | | 11,200 | | | | 171,808 | |
| | |
SandRidge Energy, Inc. | | | 84,600 | | | | 1,149,714 | |
| | |
Scorpio Tankers, Inc. (Monaco) | | | 4,000 | | | | 306,720 | |
| | |
Sitio Royalties Corp. (Class A Stock) | | | 58,400 | | | | 1,422,040 | |
| | |
SM Energy Co. | | | 28,000 | | | | 1,293,600 | |
| | |
Talos Energy, Inc.* | | | 36,800 | | | | 435,712 | |
| | |
Teekay Corp. (Bermuda)* | | | 137,200 | | | | 1,189,524 | |
| | |
Teekay Tankers Ltd. (Canada) (Class A Stock) | | | 14,500 | | | | 948,880 | |
| | |
VAALCO Energy, Inc. | | | 42,200 | | | | 302,152 | |
| | |
Vital Energy, Inc.*(a) | | | 33,200 | | | | 1,447,852 | |
| | |
World Kinect Corp. | | | 57,500 | | | | 1,605,975 | |
| | | | | | | | |
| | |
| | | | | | | 31,185,934 | |
| | |
Paper & Forest Products 0.6% | | | | | | | | |
| | |
Clearwater Paper Corp.* | | | 45,500 | | | | 2,523,885 | |
| | |
Passenger Airlines 1.1% | | | | | | | | |
| | |
Alaska Air Group, Inc.* | | | 21,700 | | | | 814,401 | |
| | |
Allegiant Travel Co. | | | 38,300 | | | | 2,147,481 | |
| | |
JetBlue Airways Corp.*(a) | | | 67,700 | | | | 433,957 | |
| | |
SkyWest, Inc.* | | | 2,668 | | | | 213,280 | |
| | |
Sun Country Airlines Holdings, Inc.* | | | 94,300 | | | | 1,235,330 | |
| | | | | | | | |
| | |
| | | | | | | 4,844,449 | |
| | |
Personal Care Products 1.1% | | | | | | | | |
| | |
Edgewell Personal Care Co. | | | 41,000 | | | | 1,605,150 | |
See Notes to Financial Statements.
12
| | | | | | | | |
| Description | | Shares | | | Value | |
| | |
COMMON STOCKS (Continued) | | | | | | | | |
| | |
Personal Care Products (cont’d.) | | | | | | | | |
| | |
Medifast, Inc. | | | 57,200 | | | $ | 1,254,396 | |
| | |
Nu Skin Enterprises, Inc. (Class A Stock) | | | 158,000 | | | | 1,772,760 | |
| | | | | | | | |
| | |
| | | | | | | 4,632,306 | |
| | |
Pharmaceuticals 0.7% | | | | | | | | |
| | |
Jazz Pharmaceuticals PLC* | | | 3,300 | | | | 363,825 | |
| | |
Organon & Co. | | | 49,700 | | | | 1,086,442 | |
| | |
Pacira BioSciences, Inc.* | | | 71,200 | | | | 1,470,280 | |
| | | | | | | | |
| | |
| | | | | | | 2,920,547 | |
| | |
Professional Services 1.7% | | | | | | | | |
| | |
Alight, Inc. (Class A Stock)* | | | 344,900 | | | | 2,610,893 | |
| | |
Asure Software, Inc.* | | | 21,600 | | | | 222,480 | |
| | |
Concentrix Corp. | | | 10,100 | | | | 712,050 | |
| | |
Heidrick & Struggles International, Inc. | | | 1,300 | | | | 52,182 | |
| | |
Kelly Services, Inc. (Class A Stock) | | | 65,600 | | | | 1,543,568 | |
| | |
Korn Ferry | | | 4,600 | | | | 339,112 | |
| | |
Resources Connection, Inc. | | | 60,100 | | | | 716,993 | |
| | |
TrueBlue, Inc.* | | | 47,400 | | | | 566,430 | |
| | |
TTEC Holdings, Inc. | | | 94,800 | | | | 756,504 | |
| | | | | | | | |
| | |
| | | | | | | 7,520,212 | |
| | |
Real Estate Management & Development 0.8% | | | | | | | | |
| | |
Forestar Group, Inc.* | | | 38,400 | | | | 1,214,592 | |
| | |
Newmark Group, Inc. (Class A Stock) | | | 83,000 | | | | 1,077,340 | |
| | |
RE/MAX Holdings, Inc. (Class A Stock) | | | 126,800 | | | | 1,223,620 | |
| | | | | | | | |
| | |
| | | | | | | 3,515,552 | |
| | |
Residential REITs 0.3% | | | | | | | | |
| | |
Elme Communities | | | 3,100 | | | | 51,026 | |
| | |
Independence Realty Trust, Inc. | | | 67,300 | | | | 1,255,145 | |
| | | | | | | | |
| | |
| | | | | | | 1,306,171 | |
| | |
Retail REITs 1.6% | | | | | | | | |
| | |
Acadia Realty Trust | | | 86,900 | | | | 1,880,516 | |
| | |
InvenTrust Properties Corp. | | | 41,900 | | | | 1,180,323 | |
| | |
Kite Realty Group Trust | | | 54,100 | | | | 1,334,106 | |
| | |
Macerich Co. (The) | | | 86,294 | | | | 1,381,567 | |
| | |
NETSTREIT Corp.(a) | | | 61,700 | | | | 1,016,199 | |
See Notes to Financial Statements.
PGIM Quant Solutions Small-Cap Value Fund 13
Schedule of Investments (continued)
as of July 31, 2024
| | | | | | | | |
| Description | | Shares | | | Value | |
| | |
COMMON STOCKS (Continued) | | | | | | | | |
| | |
Retail REITs (cont’d.) | | | | | | | | |
| | |
Phillips Edison & Co., Inc. | | | 1,300 | | | $ | 45,630 | |
| | |
Retail Opportunity Investments Corp. | | | 16,700 | | | | 249,665 | |
| | | | | | | | |
| | |
| | | | | | | 7,088,006 | |
| | |
Semiconductors & Semiconductor Equipment 0.8% | | | | | | | | |
| | |
Alpha & Omega Semiconductor Ltd.* | | | 24,200 | | | | 1,001,880 | |
| | |
Diodes, Inc.* | | | 11,600 | | | | 907,120 | |
| | |
SMART Global Holdings, Inc.* | | | 21,900 | | | | 512,460 | |
| | |
Synaptics, Inc.* | | | 11,400 | | | | 995,448 | |
| | | | | | | | |
| | |
| | | | | | | 3,416,908 | |
| | |
Specialized REITs 0.3% | | | | | | | | |
| | |
Safehold, Inc. | | | 48,695 | | | | 1,126,802 | |
| | |
Specialty Retail 2.0% | | | | | | | | |
| | |
Asbury Automotive Group, Inc.* | | | 5,600 | | | | 1,507,632 | |
| | |
Designer Brands, Inc. (Class A Stock) | | | 175,100 | | | | 1,428,816 | |
| | |
Foot Locker, Inc. | | | 24,700 | | | | 717,782 | |
| | |
Gap, Inc. (The) | | | 49,000 | | | | 1,150,520 | |
| | |
Group 1 Automotive, Inc. | | | 2,800 | | | | 1,024,016 | |
| | |
Haverty Furniture Cos., Inc. | | | 1,700 | | | | 49,759 | |
| | |
MarineMax, Inc.* | | | 13,600 | | | | 474,232 | |
| | |
Monro, Inc. | | | 50,000 | | | | 1,541,000 | |
| | |
ODP Corp. (The)* | | | 16,300 | | | | 688,675 | |
| | | | | | | | |
| | |
| | | | | | | 8,582,432 | |
| | |
Technology Hardware, Storage & Peripherals 0.8% | | | | | | | | |
| | |
Eastman Kodak Co.* | | | 209,500 | | | | 1,217,195 | |
| | |
Xerox Holdings Corp. | | | 186,400 | | | | 2,006,596 | |
| | | | | | | | |
| | |
| | | | | | | 3,223,791 | |
| | |
Textiles, Apparel & Luxury Goods 1.8% | | | | | | | | |
| | |
Carter’s, Inc. | | | 2,700 | | | | 163,485 | |
| | |
Crocs, Inc.* | | | 8,100 | | | | 1,088,397 | |
| | |
G-III Apparel Group Ltd.* | | | 85,400 | | | | 2,354,478 | |
| | |
Movado Group, Inc. | | | 42,200 | | | | 1,092,980 | |
| | |
PVH Corp. | | | 8,400 | | | | 856,716 | |
| | |
Rocky Brands, Inc. | | | 24,700 | | | | 846,716 | |
| | |
Vera Bradley, Inc.* | | | 173,000 | | | | 1,190,240 | |
| | | | | | | | |
| | |
| | | | | | | 7,593,012 | |
See Notes to Financial Statements.
14
| | | | | | | | |
| Description | | Shares | | | Value | |
| | |
COMMON STOCKS (Continued) | | | | | | | | |
| | |
Tobacco 0.3% | | | | | | | | |
| | |
Universal Corp. | | | 20,400 | | | $ | 1,089,768 | |
| | |
Trading Companies & Distributors 0.5% | | | | | | | | |
| | |
BlueLinx Holdings, Inc.* | | | 5,000 | | | | 602,950 | |
| | |
Boise Cascade Co. | | | 300 | | | | 42,627 | |
| | |
DNOW, Inc.* | | | 38,100 | | | | 585,216 | |
| | |
GATX Corp. | | | 5,000 | | | | 697,500 | |
| | |
Rush Enterprises, Inc. (Class A Stock) | | | 4,300 | | | | 219,343 | |
| | |
Willis Lease Finance Corp. | | | 1,500 | | | | 129,420 | |
| | | | | | | | |
| | |
| | | | | | | 2,277,056 | |
| | |
Wireless Telecommunication Services 0.2% | | | | | | | | |
| | |
Telephone & Data Systems, Inc. | | | 39,300 | | | | 833,160 | |
| | | | | | | | |
| | |
TOTAL COMMON STOCKS | | | | | | | | |
(cost $375,722,512) | | | | | | | 430,379,710 | |
| | | | | | | | |
| | |
UNAFFILIATED EXCHANGE-TRADED FUND 0.5% | | | | | | | | |
iShares Russell 2000 Value ETF | | | | | | | | |
(cost $1,981,615) | | | 12,600 | | | | 2,157,246 | |
| | | | | | | | |
| | |
TOTAL LONG-TERM INVESTMENTS | | | | | | | | |
(cost $377,704,127) | | | | | | | 432,536,956 | |
| | | | | | | | |
| | |
SHORT-TERM INVESTMENTS 8.3% | | | | | | | | |
| | |
AFFILIATED MUTUAL FUNDS | | | | | | | | |
PGIM Core Government Money Market Fund (7-day effective yield 5.561%)(wb) | | | 1,783,002 | | | | 1,783,002 | |
PGIM Institutional Money Market Fund (7-day effective yield 5.606%)
(cost $34,128,481; includes $33,992,227 of cash collateral for securities on loan)(b)(wb) | | | 34,185,772 | | | | 34,165,261 | |
| | | | | | | | |
| | |
TOTAL SHORT-TERM INVESTMENTS
(cost $35,911,483) | | | | | | | 35,948,263 | |
| | | | | | | | |
| | |
TOTAL INVESTMENTS 108.7%
(cost $413,615,610) | | | | | | | 468,485,219 | |
| | |
Liabilities in excess of other assets (8.7)% | | | | | | | (37,637,329 | ) |
| | | | | | | | |
| | |
NET ASSETS 100.0% | | | | | | $ | 430,847,890 | |
| | | | | | | | |
See Notes to Financial Statements.
PGIM Quant Solutions Small-Cap Value Fund 15
Schedule of Investments (continued)
as of July 31, 2024
Below is a list of the abbreviation(s) used in the annual report:
ETF—Exchange-Traded Fund
REITs—Real Estate Investment Trust
SOFR—Secured Overnight Financing Rate
| * | Non-income producing security. |
| (a) | All or a portion of security is on loan. The aggregate market value of such securities, including those sold and pending settlement, is $33,600,073; cash collateral of $33,992,227 (included in liabilities) was received with which the Fund purchased highly liquid short-term investments. In the event of significant appreciation in value of securities on loan on the last business day of the reporting period, the Fund may reflect a collateral value that is less than the market value of the loaned securities and such shortfall is remedied the following business day. |
| (b) | Represents security, or portion thereof, purchased with cash collateral received for securities on loan and includes dividend reinvestment. |
| (wb) | Represents an investment in a Fund affiliated with the Manager. |
Fair Value Measurements:
Various inputs are used in determining the value of the Fund’s investments. These inputs are summarized in the three broad levels listed below.
Level 1—unadjusted quoted prices generally in active markets for identical securities.
Level 2—quoted prices for similar securities, interest rates and yield curves, prepayment speeds, foreign currency exchange rates and other observable inputs.
Level 3—unobservable inputs for securities valued in accordance with Board approved fair valuation procedures.
The following is a summary of the inputs used as of July 31, 2024 in valuing such portfolio securities:
| | | | | | | | | | | | | | | | | | | | | | | | | | | | |
| | | Level 1 | | | Level 2 | | | Level 3 | |
Investments in Securities | | | | | | | | | | | | | | | | | | | | | | | | | | | | |
Assets | | | | | | | | | | | | | | | | | | | | | | | | | | | | |
Long-Term Investments | | | | | | | | | | | | | | | | | | | | | | | | | | | | |
Common Stocks | | | | | | | | | | | | | | | | | | | | | | | | | | | | |
Air Freight & Logistics | | $ | 3,818,742 | | | | | | | | $— | | | | | | | | | | | | $— | | | | | |
Automobile Components | | | 10,744,351 | | | | | | | | — | | | | | | | | | | | | — | | | | | |
Automobiles | | | 2,165,646 | | | | | | | | — | | | | | | | | | | | | — | | | | | |
Banks | | | 88,495,346 | | | | | | | | — | | | | | | | | | | | | — | | | | | |
Biotechnology | | | 10,934,612 | | | | | | | | — | | | | | | | | | | | | — | | | | | |
Broadline Retail | | | 119,577 | | | | | | | | — | | | | | | | | | | | | — | | | | | |
Building Products | | | 2,969,735 | | | | | | | | — | | | | | | | | | | | | — | | | | | |
Chemicals | | | 7,493,289 | | | | | | | | — | | | | | | | | | | | | — | | | | | |
Commercial Services & Supplies | | | 6,577,098 | | | | | | | | — | | | | | | | | | | | | — | | | | | |
Construction & Engineering | | | 3,138,052 | | | | | | | | — | | | | | | | | | | | | — | | | | | |
Consumer Finance | | | 6,152,979 | | | | | | | | — | | | | | | | | | | | | — | | | | | |
Consumer Staples Distribution & Retail | | | 8,723,547 | | | | | | | | — | | | | | | | | | | | | — | | | | | |
Containers & Packaging | | | 3,219,791 | | | | | | | | — | | | | | | | | | | | | — | | | | | |
Diversified Consumer Services | | | 3,285,898 | | | | | | | | — | | | | | | | | | | | | — | | | | | |
Diversified REITs | | | 6,986,881 | | | | | | | | — | | | | | | | | | | | | — | | | | | |
Diversified Telecommunication Services | | | 2,347,300 | | | | | | | | — | | | | | | | | | | | | — | | | | | |
Electric Utilities | | | 118,450 | | | | | | | | — | | | | | | | | | | | | — | | | | | |
Electrical Equipment | | | 368,130 | | | | | | | | — | | | | | | | | | | | | — | | | | | |
See Notes to Financial Statements.
16
| | | | | | | | | | | | | | | | | | | | | | | | | | | | |
| | | Level 1 | | | Level 2 | | | Level 3 | |
Investments in Securities (continued) | | | | | | | | | | | | | | | | | | | | | | | | | | | | |
Assets (continued) | | | | | | | | | | | | | | | | | | | | | | | | | | | | |
Long-Term Investments (continued) | | | | | | | | | | | | | | | | | | | | | | | | | | | | |
Common Stocks (continued) | | | | | | | | | | | | | | | | | | | | | | | | | | | | |
Electronic Equipment, Instruments & Components | | $ | 5,122,042 | | | | | | | | $— | | | | | | | | | | | | $— | | | | | |
Energy Equipment & Services | | | 12,773,698 | | | | | | | | — | | | | | | | | | | | | — | | | | | |
Entertainment | | | 2,112,026 | | | | | | | | — | | | | | | | | | | | | — | | | | | |
Financial Services | | | 17,831,056 | | | | | | | | — | | | | | | | | | | | | — | | | | | |
Food Products | | | 9,240,308 | | | | | | | | — | | | | | | | | | | | | — | | | | | |
Gas Utilities | | | 5,468,642 | | | | | | | | — | | | | | | | | | | | | — | | | | | |
Ground Transportation | | | 838,299 | | | | | | | | — | | | | | | | | | | | | — | | | | | |
Health Care Equipment & Supplies | | | 5,575,850 | | | | | | | | — | | | | | | | | | | | | — | | | | | |
Health Care Providers & Services | | | 5,558,322 | | | | | | | | — | | | | | | | | | | | | — | | | | | |
Health Care REITs | | | 2,562,874 | | | | | | | | — | | | | | | | | | | | | — | | | | | |
Hotel & Resort REITs | | | 6,500,036 | | | | | | | | — | | | | | | | | | | | | — | | | | | |
Hotels, Restaurants & Leisure | | | 3,753,259 | | | | | | | | — | | | | | | | | | | | | — | | | | | |
Household Durables | | | 15,073,115 | | | | | | | | — | | | | | | | | | | | | — | | | | | |
Industrial REITs | | | 2,418,596 | | | | | | | | — | | | | | | | | | | | | — | | | | | |
Insurance | | | 8,257,162 | | | | | | | | — | | | | | | | | | | | | — | | | | | |
Interactive Media & Services | | | 2,077,008 | | | | | | | | — | | | | | | | | | | | | — | | | | | |
Leisure Products | | | 3,495,123 | | | | | | | | — | | | | | | | | | | | | — | | | | | |
Machinery | | | 7,167,212 | | | | | | | | — | | | | | | | | | | | | — | | | | | |
Marine Transportation | | | 4,432,895 | | | | | | | | — | | | | | | | | | | | | — | | | | | |
Media | | | 12,309,121 | | | | | | | | — | | | | | | | | | | | | — | | | | | |
Metals & Mining | | | 6,972,333 | | | | | | | | — | | | | | | | | | | | | — | | | | | |
Mortgage Real Estate Investment Trusts (REITs) | | | 15,837,964 | | | | | | | | — | | | | | | | | | | | | — | | | | | |
Multi-Utilities | | | 7,161,393 | | | | | | | | — | | | | | | | | | | | | — | | | | | |
Office REITs | | | 6,501,961 | | | | | | | | — | | | | | | | | | | | | — | | | | | |
Oil, Gas & Consumable Fuels | | | 31,185,934 | | | | | | | | — | | | | | | | | | | | | — | | | | | |
Paper & Forest Products | | | 2,523,885 | | | | | | | | — | | | | | | | | | | | | — | | | | | |
Passenger Airlines | | | 4,844,449 | | | | | | | | — | | | | | | | | | | | | — | | | | | |
Personal Care Products | | | 4,632,306 | | | | | | | | — | | | | | | | | | | | | — | | | | | |
Pharmaceuticals | | | 2,920,547 | | | | | | | | — | | | | | | | | | | | | — | | | | | |
Professional Services | | | 7,520,212 | | | | | | | | — | | | | | | | | | | | | — | | | | | |
Real Estate Management & Development | | | 3,515,552 | | | | | | | | — | | | | | | | | | | | | — | | | | | |
Residential REITs | | | 1,306,171 | | | | | | | | — | | | | | | | | | | | | — | | | | | |
Retail REITs | | | 7,088,006 | | | | | | | | — | | | | | | | | | | | | — | | | | | |
Semiconductors & Semiconductor Equipment | | | 3,416,908 | | | | | | | | — | | | | | | | | | | | | — | | | | | |
Specialized REITs | | | 1,126,802 | | | | | | | | — | | | | | | | | | | | | — | | | | | |
Specialty Retail | | | 8,582,432 | | | | | | | | — | | | | | | | | | | | | — | | | | | |
Technology Hardware, Storage & Peripherals | | | 3,223,791 | | | | | | | | — | | | | | | | | | | | | — | | | | | |
Textiles, Apparel & Luxury Goods | | | 7,593,012 | | | | | | | | — | | | | | | | | | | | | — | | | | | |
Tobacco | | | 1,089,768 | | | | | | | | — | | | | | | | | | | | | — | | | | | |
Trading Companies & Distributors | | | 2,277,056 | | | | | | | | — | | | | | | | | | | | | — | | | | | |
Wireless Telecommunication Services | | | 833,160 | | | | | | | | — | | | | | | | | | | | | — | | | | | |
Unaffiliated Exchange-Traded Fund | | | 2,157,246 | | | | | | | | — | | | | | | | | | | | | — | | | | | |
See Notes to Financial Statements.
PGIM Quant Solutions Small-Cap Value Fund 17
Schedule of Investments (continued)
as of July 31, 2024
| | | | | | | | | | | | | | | | | | | | | | | | | | | | |
| | | Level 1 | | | Level 2 | | | Level 3 | |
Investments in Securities (continued) | | | | | | | | | | | | | | | | | | | | | | | | | | | | |
Assets (continued) | | | | | | | | | | | | | | | | | | | | | | | | | | | | |
Short-Term Investments | | | | | | | | | | | | | | | | | | | | | | | | | | | | |
Affiliated Mutual Funds | | $ | 35,948,263 | | | | | | | | $— | | | | | | | | | | | | $— | | | | | |
| | | | | | | | | | | | | | | | | | | | | | | | | | | | |
Total | | $ | 468,485,219 | | | | | | | | $— | | | | | | | | | | | | $— | | | | | |
| | | | | | | | | | | | |
Industry Classification:
The industry classification of investments and liabilities in excess of other assets shown as a percentage of net assets as of July 31, 2024 were as follows:
| | | | |
Banks | | | 20.5 | % |
Affiliated Mutual Funds (7.9% represents investments purchased with collateral from securities on loan) | | | 8.3 | |
Oil, Gas & Consumable Fuels | | | 7.2 | |
Financial Services | | | 4.1 | |
Mortgage Real Estate Investment Trusts (REITs) | | | 3.7 | |
Household Durables | | | 3.5 | |
Energy Equipment & Services | | | 3.0 | |
Media | | | 2.9 | |
Biotechnology | | | 2.5 | |
Automobile Components | | | 2.5 | |
Food Products | | | 2.1 | |
Consumer Staples Distribution & Retail | | | 2.0 | |
Specialty Retail | | | 2.0 | |
Insurance | | | 1.9 | |
Textiles, Apparel & Luxury Goods | | | 1.8 | |
Professional Services | | | 1.7 | |
Chemicals | | | 1.7 | |
Machinery | | | 1.7 | |
Multi-Utilities | | | 1.7 | |
Retail REITs | | | 1.6 | |
Diversified REITs | | | 1.6 | |
Metals & Mining | | | 1.6 | |
Commercial Services & Supplies | | | 1.5 | |
Office REITs | | | 1.5 | |
Hotel & Resort REITs | | | 1.5 | |
Consumer Finance | | | 1.4 | |
Health Care Equipment & Supplies | | | 1.3 | |
Health Care Providers & Services | | | 1.3 | |
Gas Utilities | | | 1.3 | |
Electronic Equipment, Instruments & Components | | | 1.2 | |
Passenger Airlines | | | 1.1 | |
Personal Care Products | | | 1.1 | |
| | | | |
Marine Transportation | | | 1.0 | % |
Air Freight & Logistics | | | 0.9 | |
Hotels, Restaurants & Leisure | | | 0.9 | |
Real Estate Management & Development | | | 0.8 | |
Leisure Products | | | 0.8 | |
Semiconductors & Semiconductor Equipment | | | 0.8 | |
Diversified Consumer Services | | | 0.8 | |
Technology Hardware, Storage & Peripherals | | | 0.8 | |
Containers & Packaging | | | 0.8 | |
Construction & Engineering | | | 0.7 | |
Building Products | | | 0.7 | |
Pharmaceuticals | | | 0.7 | |
Health Care REITs | | | 0.6 | |
Paper & Forest Products | | | 0.6 | |
Industrial REITs | | | 0.6 | |
Diversified Telecommunication Services | | | 0.5 | |
Trading Companies & Distributors | | | 0.5 | |
Automobiles | | | 0.5 | |
Entertainment | | | 0.5 | |
Interactive Media & Services | | | 0.5 | |
Unaffiliated Exchange-Traded Fund | | | 0.5 | |
Residential REITs | | | 0.3 | |
Specialized REITs | | | 0.3 | |
Tobacco | | | 0.3 | |
Ground Transportation | | | 0.2 | |
Wireless Telecommunication Services | | | 0.2 | |
Electrical Equipment | | | 0.1 | |
Broadline Retail | | | 0.0 | * |
See Notes to Financial Statements.
18
Industry Classification (continued):
| | | | |
Electric Utilities | | | 0.0 | *% |
| | | | |
| | | 108.7 | |
Liabilities in excess of other assets | | | (8.7 | ) |
| | | | |
| |
| | | 100.0 | % |
| | | | |
Financial Instruments/Transactions—Summary of Offsetting and Netting Arrangements:
The Fund entered into financial instruments/transactions during the reporting period that are either offset in accordance with current requirements or are subject to enforceable master netting arrangements or similar agreements that permit offsetting. The information about offsetting and related netting arrangements for financial instruments/transactions where the legal right to set-off exists is presented in the summary below.
Offsetting of financial instrument/transaction assets and liabilities:
| | | | | | |
| Description | | Gross Market
Value of
Recognized
Assets/(Liabilities) | | Collateral
Pledged/(Received)(1) | | Net
Amount |
| | | |
Securities on Loan | | $33,600,073 | | $(33,600,073) | | $— |
| (1) | Collateral amount disclosed by the Fund is limited to the market value of financial instruments/transactions. |
See Notes to Financial Statements.
PGIM Quant Solutions Small-Cap Value Fund 19
Statement of Assets and Liabilities
as of July 31, 2024
| | | | |
Assets | | | | |
Investments at value, including securities on loan of $33,600,073: | | | | |
Unaffiliated investments (cost $377,704,127) | | $ | 432,536,956 | |
Affiliated investments (cost $35,911,483) | | | 35,948,263 | |
Receivable for Fund shares sold | | | 425,874 | |
Dividends receivable | | | 249,178 | |
Tax reclaim receivable | | | 1,390 | |
Prepaid expenses | | | 163 | |
| | | | |
Total Assets | | | 469,161,824 | |
| | | | |
| |
Liabilities | | | | |
Payable to broker for collateral for securities on loan | | | 33,992,227 | |
Payable for Fund shares purchased | | | 3,632,530 | |
Accrued expenses and other liabilities | | | 400,301 | |
Management fee payable | | | 204,814 | |
Distribution fee payable | | | 67,923 | |
Affiliated transfer agent fee payable | | | 14,996 | |
Trustees’ fees payable | | | 1,143 | |
| | | | |
Total Liabilities | | | 38,313,934 | |
| | | | |
| |
Net Assets | | $ | 430,847,890 | |
| | | | |
| |
| | | | |
Net assets were comprised of: | | | | |
Shares of beneficial interest, at par | | $ | 21,585 | |
Paid-in capital in excess of par | | | 349,549,134 | |
Total distributable earnings (loss) | | | 81,277,171 | |
| | | | |
Net assets, July 31, 2024 | | $ | 430,847,890 | |
| | | | |
See Notes to Financial Statements.
20
| | | | | | | | |
Class A | | | | | | | | |
| | |
Net asset value, redemption price per share, | | | | | | | | |
($106,909,594 ÷ 5,329,962 shares of beneficial interest issued and outstanding) | | $ | 20.06 | | | | | |
Maximum sales charge (5.50% of offering price) | | | 1.17 | | | | | |
| | | | | | | | |
| | |
Maximum offering price to public | | $ | 21.23 | | | | | |
| | | | | | | | |
| | |
Class C | | | | | | | | |
| | |
Net asset value, offering price and redemption price per share, | | | | | | | | |
($1,611,808 ÷ 80,979 shares of beneficial interest issued and outstanding) | | $ | 19.90 | | | | | |
| | | | | | | | |
| | |
Class R | | | | | | | | |
| | |
Net asset value, offering price and redemption price per share, | | | | | | | | |
($114,603,330 ÷ 5,829,354 shares of beneficial interest issued and outstanding) | | $ | 19.66 | | | | | |
| | | | | | | | |
| | |
Class Z | | | | | | | | |
| | |
Net asset value, offering price and redemption price per share, | | | | | | | | |
($89,853,542 ÷ 4,479,279 shares of beneficial interest issued and outstanding) | | $ | 20.06 | | | | | |
| | | | | | | | |
| | |
Class R2 | | | | | | | | |
| | |
Net asset value, offering price and redemption price per share, | | | | | | | | |
($167,846 ÷ 8,387 shares of beneficial interest issued and outstanding) | | $ | 20.01 | | | | | |
| | | | | | | | |
| | |
Class R4 | | | | | | | | |
| | |
Net asset value, offering price and redemption price per share, | | | | | | | | |
($17,562 ÷ 875 shares of beneficial interest issued and outstanding) | | $ | 20.08 | | | | | |
| | | | | | | | |
| | |
Class R6 | | | | | | | | |
| | |
Net asset value, offering price and redemption price per share, | | | | | | | | |
($117,684,208 ÷ 5,856,521 shares of beneficial interest issued and outstanding) | | $ | 20.09 | | | | | |
| | | | | | | | |
| | |
Net asset value per share may not recalculate due to rounding. | | | | | | | | |
See Notes to Financial Statements.
PGIM Quant Solutions Small-Cap Value Fund 21
Statement of Operations
Year Ended July 31, 2024
| | | | |
Net Investment Income (Loss) | |
| |
Income | | | | |
Unaffiliated dividend income | | $ | 10,512,150 | |
Income from securities lending, net (including affiliated income of $157,650) | | | 160,548 | |
Affiliated dividend income | | | 58,860 | |
| | | | |
| |
Total income | | | 10,731,558 | |
| | | | |
| |
Expenses | | | | |
Management fee | | | 2,364,352 | |
Distribution fee(a) | | | 1,074,590 | |
Shareholder servicing fees(a) | | | 92 | |
Transfer agent’s fees and expenses (including affiliated expense of $95,290)(a) | | | 377,404 | |
Registration fees(a) | | | 75,583 | |
Shareholders’ reports | | | 66,829 | |
Custodian and accounting fees | | | 64,978 | |
Professional fees | | | 40,773 | |
Audit fee | | | 25,440 | |
Trustees’ fees | | | 15,152 | |
Miscellaneous | | | 47,828 | |
| | | | |
| |
Total expenses | | | 4,153,021 | |
Less: Fee waiver and/or expense reimbursement(a) | | | (47,061 | ) |
Distribution fee waiver(a) | | | (303,769 | ) |
| | | | |
| |
Net expenses | | | 3,802,191 | |
| | | | |
| |
Net investment income (loss) | | | 6,929,367 | |
| | | | |
| |
Realized And Unrealized Gain (Loss) On Investments | | | | |
| |
Net realized gain (loss) on investment transactions (including affiliated of $15,760) | | | 39,235,296 | |
Net change in unrealized appreciation (depreciation) on investments (including affiliated of $(11,777)) | | | 18,782,247 | |
| | | | |
| |
Net gain (loss) on investment transactions | | | 58,017,543 | |
| | | | |
| |
Net Increase (Decrease) In Net Assets Resulting From Operations | | $ | 64,946,910 | |
| | | | |
(a) Class specific expenses and waivers were as follows:
| | | | | | | | | | | | | | | | | | | | | | | | | | | | |
| | | Class A | | | Class C | | | Class R | | | Class Z | | | Class R2 | | | Class R4 | | | Class R6 | |
Distribution fee | | | 292,840 | | | | 16,595 | | | | 764,885 | | | | — | | | | 270 | | | | — | | | | — | |
Shareholder servicing fees | | | — | | | | — | | | | — | | | | — | | | | 88 | | | | 4 | | | | — | |
Transfer agent’s fees and expenses | | | 169,394 | | | | 7,476 | | | | 98,684 | | | | 96,779 | | | | 355 | | | | 87 | | | | 4,629 | |
Registration fees | | | 15,374 | | | | 6,297 | | | | 7,538 | | | | 16,372 | | | | 4,986 | | | | 4,986 | | | | 20,030 | |
Fee waiver and/or expense reimbursement | | | (9,761) | | | | (166) | | | | (10,199) | | | | (8,728) | | | | (5,185) | | | | (5,040) | | | | (7,982) | |
Distribution fee waiver | | | (48,807) | | | | — | | | | (254,962) | | | | — | | | | — | | | | — | | | | — | |
See Notes to Financial Statements.
22
Statements of Changes in Net Assets
| | | | | | | | |
| |
| | | Year Ended July 31, | |
| | | | |
| | |
| | | 2024 | | | 2023 | |
Increase (Decrease) in Net Assets | | | | | | | | |
| | |
Operations | | | | | | | | |
Net investment income (loss) | | $ | 6,929,367 | | | $ | 8,621,951 | |
Net realized gain (loss) on investment transactions | | | 39,235,296 | | | | 8,997,316 | |
Net change in unrealized appreciation (depreciation) on investments | | | 18,782,247 | | | | (13,821,917 | ) |
| | | | | | | | |
| | |
Net increase (decrease) in net assets resulting from operations | | | 64,946,910 | | | | 3,797,350 | |
| | | | | | | | |
| | |
Dividends and Distributions | | | | | | | | |
Distributions from distributable earnings | | | | | | | | |
Class A | | | (3,211,149 | ) | | | (18,748,508 | ) |
Class C | | | (33,875 | ) | | | (409,876 | ) |
Class R | | | (3,288,576 | ) | | | (18,678,665 | ) |
Class Z | | | (3,187,744 | ) | | | (20,760,965 | ) |
Class R2 | | | (3,352 | ) | | | (10,666 | ) |
Class R4 | | | (517 | ) | | | (2,323 | ) |
Class R6 | | | (4,032,077 | ) | | | (18,195,989 | ) |
| | | | | | | | |
| | |
| | | (13,757,290 | ) | | | (76,806,992 | ) |
| | | | | | | | |
Fund share transactions (Net of share conversions) | | | | | | | | |
Net proceeds from shares sold | | | 57,491,952 | | | | 65,588,112 | |
Net asset value of shares issued in reinvestment of dividends and distributions | | | 13,559,378 | | | | 74,780,619 | |
Cost of shares purchased | | | (110,559,110 | ) | | | (142,263,777 | ) |
| | | | | | | | |
| | |
Net increase (decrease) in net assets from Fund share transactions | | | (39,507,780 | ) | | | (1,895,046 | ) |
| | | | | | | | |
| | |
Total increase (decrease) | | | 11,681,840 | | | | (74,904,688 | ) |
| | |
Net Assets: | | | | | | | | |
| | |
Beginning of year | | | 419,166,050 | | | | 494,070,738 | |
| | | | | | | | |
| | |
End of year | | $ | 430,847,890 | | | $ | 419,166,050 | |
| | | | | | | | |
See Notes to Financial Statements.
PGIM Quant Solutions Small-Cap Value Fund 23
Financial Highlights
| | | | | | | | | | | | | | | | | | | | |
| | | | | | |
| Class A Shares | | | | | | | | | | | | | | | |
| | | Year Ended July 31, | |
| | | 2024 | | | 2023 | | | 2022 | | | 2021 | | | 2020 | |
| | | | | | |
Per Share Operating Performance(a): | | | | | | | | | | | | | | | | | | | | |
Net Asset Value, Beginning of Year | | | $17.66 | | | | $21.09 | | | | $20.70 | | | | $11.39 | | | | $16.46 | |
Income (loss) from investment operations: | | | | | | | | | | | | | | | | | | | | |
Net investment income (loss) | | | 0.28 | | | | 0.33 | | | | 0.27 | | | | 0.16 | | | | 0.18 | |
| Net realized and unrealized gain (loss) on investment and foreign currency transactions | | | 2.69 | | | | (0.25 | ) | | | 0.38 | | | | 9.31 | | | | (4.35 | ) |
Total from investment operations | | | 2.97 | | | | 0.08 | | | | 0.65 | | | | 9.47 | | | | (4.17 | ) |
Less Dividends and Distributions: | | | | | | | | | | | | | | | | | | | | |
Dividends from net investment income | | | (0.41 | ) | | | (0.39 | ) | | | (0.26 | ) | | | (0.16 | ) | | | (0.48 | ) |
Distributions from net realized gains | | | (0.16 | ) | | | (3.12 | ) | | | - | | | | - | | | | (0.42 | ) |
Total dividends and distributions | | | (0.57 | ) | | | (3.51 | ) | | | (0.26 | ) | | | (0.16 | ) | | | (0.90 | ) |
Net asset value, end of year | | | $20.06 | | | | $17.66 | | | | $21.09 | | | | $20.70 | | | | $11.39 | |
Total Return(b): | | | 17.23 | % | | | 2.02 | % | | | 3.17 | % | | | 83.49 | % | | | (27.01 | )% |
| | | | | | | | | | | | | | | | | | | | | |
| Ratios/Supplemental Data: | | | | | | | | | | | | | | | |
Net assets, end of year (000) | | | $106,910 | | | | $103,703 | | | | $117,179 | | | | $123,223 | | | | $71,928 | |
Average net assets (000) | | | $97,614 | | | | $103,993 | | | | $123,533 | | | | $103,593 | | | | $92,527 | |
Ratios to average net assets(c): | | | | | | | | | | | | | | | | | | | | |
Expenses after waivers and/or expense reimbursement | | | 1.10 | % | | | 1.13 | % | | | 1.09 | % | | | 1.11 | % | | | 1.15 | % |
Expenses before waivers and/or expense reimbursement | | | 1.16 | % | | | 1.19 | % | | | 1.15 | % | | | 1.17 | % | | | 1.21 | % |
Net investment income (loss) | | | 1.63 | % | | | 1.91 | % | | | 1.25 | % | | | 0.95 | % | | | 1.31 | % |
Portfolio turnover rate(d) | | | 78 | % | | | 75 | % | | | 62 | % | | | 63 | % | | | 53 | % |
| (a) | Calculated based on average shares outstanding during the year. |
| (b) | Total return does not consider the effects of sales loads. Total return is calculated assuming a purchase of a share on the first day and a sale on the last day of each year reported and includes reinvestment of dividends and distributions, if any. Total returns may reflect adjustments to conform to GAAP. |
| (c) | Does not include expenses of the underlying funds in which the Fund invests. |
| (d) | The Fund’s portfolio turnover rate is calculated in accordance with regulatory requirements, without regard to transactions involving short-term investments, certain derivatives and in-kind transactions (if any). If such transactions were included, the Fund’s portfolio turnover rate may be higher. |
See Notes to Financial Statements.
24
| | | | | | | | | | | | | | | | | | | | |
| | | | | | |
| Class C Shares | | | | | | | | | | | | | | | |
| | | Year Ended July 31, | |
| | | 2024 | | | 2023 | | | 2022 | | | 2021 | | | 2020 | |
| | | | | | |
Per Share Operating Performance(a): | | | | | | | | | | | | | | | | | | | | |
Net Asset Value, Beginning of Year | | | $17.56 | | | | $21.00 | | | | $20.63 | | | | $11.39 | | | | $16.48 | |
Income (loss) from investment operations: | | | | | | | | | | | | | | | | | | | | |
Net investment income (loss) | | | 0.05 | | | | 0.11 | (b) | | | (- | )(b)(c) | | | - | (c) | | | 0.05 | |
| Net realized and unrealized gain (loss) on investment and foreign currency transactions | | | 2.64 | | | | (0.27 | )(d) | | | 0.39 | | | | 9.27 | | | | (4.40 | ) |
Total from investment operations | | | 2.69 | | | | (0.16 | ) | | | 0.39 | | | | 9.27 | | | | (4.35 | ) |
Less Dividends and Distributions: | | | | | | | | | | | | | | | | | | | | |
Dividends from net investment income | | | (0.19 | ) | | | (0.16 | ) | | | (0.02 | ) | | | (0.03 | ) | | | (0.32 | ) |
Distributions from net realized gains | | | (0.16 | ) | | | (3.12 | ) | | | - | | | | - | | | | (0.42 | ) |
Total dividends and distributions | | | (0.35 | ) | | | (3.28 | ) | | | (0.02 | ) | | | (0.03 | ) | | | (0.74 | ) |
Net asset value, end of year | | | $19.90 | | | | $17.56 | | | | $21.00 | | | | $20.63 | | | | $11.39 | |
Total Return(e): | | | 15.56 | % | | | 0.70 | % | | | 1.89 | % | | | 81.41 | % | | | (27.80 | )% |
| | | | | | | | | | | | | | | | | | | | | |
| Ratios/Supplemental Data: | | | | | | | | | | | | | | | |
Net assets, end of year (000) | | | $1,612 | | | | $2,057 | | | | $2,685 | | | | $3,138 | | | | $5,782 | |
Average net assets (000) | | | $1,659 | | | | $2,311 | | | | $3,025 | | | | $6,774 | | | | $8,456 | |
Ratios to average net assets(f): | | | | | | | | | | | | | | | | | | | | |
Expenses after waivers and/or expense reimbursement | | | 2.49 | % | | | 2.46 | % | | | 2.36 | % | | | 2.19 | % | | | 2.22 | % |
Expenses before waivers and/or expense reimbursement | | | 2.50 | % | | | 2.47 | % | | | 2.37 | % | | | 2.20 | % | | | 2.23 | % |
Net investment income (loss) | | | 0.30 | % | | | 0.61 | % | | | (0.01 | )% | | | 0.01 | % | | | 0.35 | % |
Portfolio turnover rate(g) | | | 78 | % | | | 75 | % | | | 62 | % | | | 63 | % | | | 53 | % |
| (a) | Calculated based on average shares outstanding during the year. |
| (b) | The per share amount of net investment income (loss) does not directly correlate to the amounts reported in the Statement of Operations due to class specific expenses. |
| (c) | Amount rounds to zero. |
| (d) | The per share amount of realized and unrealized gain (loss) on investments does not directly correlate to the amounts reported in the Statement of Operations due to the timing of portfolio share transactions in relation to fluctuating market values. |
| (e) | Total return does not consider the effects of sales loads. Total return is calculated assuming a purchase of a share on the first day and a sale on the last day of each year reported and includes reinvestment of dividends and distributions, if any. Total returns may reflect adjustments to conform to GAAP. |
| (f) | Does not include expenses of the underlying funds in which the Fund invests. |
| (g) | The Fund’s portfolio turnover rate is calculated in accordance with regulatory requirements, without regard to transactions involving short-term investments, certain derivatives and in-kind transactions (if any). If such transactions were included, the Fund’s portfolio turnover rate may be higher. |
See Notes to Financial Statements.
PGIM Quant Solutions Small-Cap Value Fund 25
Financial Highlights (continued)
| | | | | | | | | | | | | | | | | | | | |
| | | | | | |
| Class R Shares | | | | | | | | | | | | | | | |
| | | Year Ended July 31, | |
| | | 2024 | | | 2023 | | | 2022 | | | 2021 | | | 2020 | |
| | | | | | |
Per Share Operating Performance(a): | | | | | | | | | | | | | | | | | | | | |
Net Asset Value, Beginning of Year | | | $17.32 | | | | $20.75 | | | | $20.37 | | | | $11.23 | | | | $16.23 | |
Income (loss) from investment operations: | | | | | | | | | | | | | | | | | | | | |
Net investment income (loss) | | | 0.25 | | | | 0.30 | | | | 0.22 | | | | 0.14 | | | | 0.11 | |
| Net realized and unrealized gain (loss) on investment and foreign currency transactions | | | 2.64 | | | | (0.26 | ) | | | 0.38 | | | | 9.15 | | | | (4.24 | ) |
Total from investment operations | | | 2.89 | | | | 0.04 | | | | 0.60 | | | | 9.29 | | | | (4.13 | ) |
Less Dividends and Distributions: | | | | | | | | | | | | | | | | | | | | |
Dividends from net investment income | | | (0.39 | ) | | | (0.35 | ) | | | (0.22 | ) | | | (0.15 | ) | | | (0.45 | ) |
Distributions from net realized gains | | | (0.16 | ) | | | (3.12 | ) | | | - | | | | - | | | | (0.42 | ) |
Total dividends and distributions | | | (0.55 | ) | | | (3.47 | ) | | | (0.22 | ) | | | (0.15 | ) | | | (0.87 | ) |
Net asset value, end of year | | | $19.66 | | | | $17.32 | | | | $20.75 | | | | $20.37 | | | | $11.23 | |
Total Return(b): | | | 17.06 | % | | | 1.83 | % | | | 2.93 | % | | | 83.14 | % | | | (27.08 | )% |
| | | | | | | | | | | | | | | | | | | | | |
| Ratios/Supplemental Data: | | | | | | | | | | | | | | | |
Net assets, end of year (000) | | $ | 114,603 | | | $ | 112,225 | | | $ | 113,963 | | | $ | 135,981 | | | $ | 110,953 | |
Average net assets (000) | | $ | 101,985 | | | $ | 104,012 | | | $ | 131,067 | | | $ | 137,399 | | | $ | 116,334 | |
Ratios to average net assets(c): | | | | | | | | | | | | | | | | | | | | |
Expenses after waivers and/or expense reimbursement | | | 1.26 | % | | | 1.30 | % | | | 1.29 | % | | | 1.28 | % | | | 1.31 | % |
Expenses before waivers and/or expense reimbursement | | | 1.52 | % | | | 1.56 | % | | | 1.55 | % | | | 1.54 | % | | | 1.57 | % |
Net investment income (loss) | | | 1.46 | % | | | 1.73 | % | | | 1.05 | % | | | 0.88 | % | | | 0.82 | % |
Portfolio turnover rate(d) | | | 78 | % | | | 75 | % | | | 62 | % | | | 63 | % | | | 53 | % |
| (a) | Calculated based on average shares outstanding during the year. |
| (b) | Total return is calculated assuming a purchase of a share on the first day and a sale on the last day of each year reported and includes reinvestment of dividends and distributions, if any. Total returns may reflect adjustments to conform to GAAP. |
| (c) | Does not include expenses of the underlying funds in which the Fund invests. |
| (d) | The Fund’s portfolio turnover rate is calculated in accordance with regulatory requirements, without regard to transactions involving short-term investments, certain derivatives and in-kind transactions (if any). If such transactions were included, the Fund’s portfolio turnover rate may be higher. |
See Notes to Financial Statements.
26
| | | | | | | | | | | | | | | | | | | | |
| | | | | | |
| Class Z Shares | | | | | | | | | | | | | | | |
| | | Year Ended July 31, | |
| | | 2024 | | | 2023 | | | 2022 | | | 2021 | | | 2020 | |
| | | | | | |
Per Share Operating Performance(a): | | | | | | | | | | | | | | | | | | | | |
Net Asset Value, Beginning of Year | | | $17.66 | | | | $21.09 | | | | $20.70 | | | | $11.40 | | | | $16.46 | |
Income (loss) from investment operations: | | | | | | | | | | | | | | | | | | | | |
Net investment income (loss) | | | 0.34 | | | | 0.40 | | | | 0.33 | | | | 0.23 | | | | 0.29 | |
| Net realized and unrealized gain (loss) on investment and foreign currency transactions | | | 2.69 | | | | (0.26 | ) | | | 0.38 | | | | 9.29 | | | | (4.38 | ) |
Total from investment operations | | | 3.03 | | | | 0.14 | | | | 0.71 | | | | 9.52 | | | | (4.09 | ) |
Less Dividends and Distributions: | | | | | | | | | | | | | | | | | | | | |
Dividends from net investment income | | | (0.47 | ) | | | (0.45 | ) | | | (0.32 | ) | | | (0.22 | ) | | | (0.55 | ) |
Distributions from net realized gains | | | (0.16 | ) | | | (3.12 | ) | | | - | | | | - | | | | (0.42 | ) |
Total dividends and distributions | | | (0.63 | ) | | | (3.57 | ) | | | (0.32 | ) | | | (0.22 | ) | | | (0.97 | ) |
Net asset value, end of year | | | $20.06 | | | | $17.66 | | | | $21.09 | | | | $20.70 | | | | $11.40 | |
Total Return(b): | | | 17.56 | % | | | 2.38 | % | | | 3.42 | % | | | 84.07 | % | | | (26.66 | )% |
| | | | | | | | | | | | | | | | | | | | | |
| Ratios/Supplemental Data: | | | | | | | | | | | | | | | |
Net assets, end of year (000) | | | $89,854 | | | | $99,147 | | | | $136,495 | | | | $177,808 | | | | $150,272 | |
Average net assets (000) | | | $87,277 | | | | $110,217 | | | | $165,086 | | | | $199,626 | | | | $307,558 | |
Ratios to average net assets(c): | | | | | | | | | | | | | | | | | | | | |
Expenses after waivers and/or expense reimbursement | | | 0.79 | % | | | 0.82 | % | | | 0.79 | % | | | 0.77 | % | | | 0.73 | % |
Expenses before waivers and/or expense reimbursement | | | 0.80 | % | | | 0.83 | % | | | 0.80 | % | | | 0.78 | % | | | 0.74 | % |
Net investment income (loss) | | | 1.96 | % | | | 2.25 | % | | | 1.56 | % | | | 1.34 | % | | | 2.05 | % |
Portfolio turnover rate(d) | | | 78 | % | | | 75 | % | | | 62 | % | | | 63 | % | | | 53 | % |
| (a) | Calculated based on average shares outstanding during the year. |
| (b) | Total return is calculated assuming a purchase of a share on the first day and a sale on the last day of each year reported and includes reinvestment of dividends and distributions, if any. Total returns may reflect adjustments to conform to GAAP. |
| (c) | Does not include expenses of the underlying funds in which the Fund invests. |
| (d) | The Fund’s portfolio turnover rate is calculated in accordance with regulatory requirements, without regard to transactions involving short-term investments, certain derivatives and in-kind transactions (if any). If such transactions were included, the Fund’s portfolio turnover rate may be higher. |
See Notes to Financial Statements.
PGIM Quant Solutions Small-Cap Value Fund 27
Financial Highlights (continued)
| | | | | | | | | | | | | | | | | | | | |
| | | | | | |
| Class R2 Shares | | | | | | | | | | | | | | | |
| | | Year Ended July 31, | |
| | | 2024 | | | 2023 | | | 2022 | | | 2021 | | | 2020 | |
| | | | | | |
Per Share Operating Performance(a): | | | | | | | | | | | | | | | | | | | | |
Net Asset Value, Beginning of Year | | | $17.63 | | | | $21.05 | | | | $20.65 | | | | $11.38 | | | | $16.43 | |
Income (loss) from investment operations: | | | | | | | | | | | | | | | | | | | | |
Net investment income (loss) | | | 0.26 | | | | 0.19 | | | | 0.28 | | | | 0.19 | | | | 0.17 | |
| Net realized and unrealized gain (loss) on investment and foreign currency transactions | | | 2.69 | | | | (0.11 | ) | | | 0.37 | | | | 9.25 | | | | (4.32 | ) |
Total from investment operations | | | 2.95 | | | | 0.08 | | | | 0.65 | | | | 9.44 | | | | (4.15 | ) |
Less Dividends and Distributions: | | | | | | | | | | | | | | | | | | | | |
Dividends from net investment income | | | (0.41 | ) | | | (0.38 | ) | | | (0.25 | ) | | | (0.17 | ) | | | (0.48 | ) |
Distributions from net realized gains | | | (0.16 | ) | | | (3.12 | ) | | | - | | | | - | | | | (0.42 | ) |
Total dividends and distributions | | | (0.57 | ) | | | (3.50 | ) | | | (0.25 | ) | | | (0.17 | ) | | | (0.90 | ) |
Net asset value, end of year | | | $20.01 | | | | $17.63 | | | | $21.05 | | | | $20.65 | | | | $11.38 | |
Total Return(b): | | | 17.13 | % | | | 2.03 | % | | | 3.11 | % | | | 83.38 | % | | | (26.96 | )% |
| | | | | | | | | | | | | | | | | | | | | |
| Ratios/Supplemental Data: | | | | | | | | | | | | | | | |
Net assets, end of year (000) | | | $168 | | | | $102 | | | | $73 | | | | $157 | | | | $292 | |
Average net assets (000) | | | $108 | | | | $88 | | | | $154 | | | | $192 | | | | $302 | |
Ratios to average net assets(c): | | | | | | | | | | | | | | | | | | | | |
Expenses after waivers and/or expense reimbursement | | | 1.14 | % | | | 1.14 | % | | | 1.14 | % | | | 1.14 | % | | | 1.15 | % |
Expenses before waivers and/or expense reimbursement | | | 5.95 | % | | | 6.57 | % | | | 5.21 | % | | | 5.24 | % | | | 6.28 | % |
Net investment income (loss) | | | 1.48 | % | | | 1.12 | % | | | 1.30 | % | | | 1.21 | % | | | 1.26 | % |
Portfolio turnover rate(d) | | | 78 | % | | | 75 | % | | | 62 | % | | | 63 | % | | | 53 | % |
| (a) | Calculated based on average shares outstanding during the year. |
| (b) | Total return is calculated assuming a purchase of a share on the first day and a sale on the last day of each year reported and includes reinvestment of dividends and distributions, if any. Total returns may reflect adjustments to conform to GAAP. |
| (c) | Does not include expenses of the underlying funds in which the Fund invests. |
| (d) | The Fund’s portfolio turnover rate is calculated in accordance with regulatory requirements, without regard to transactions involving short-term investments, certain derivatives and in-kind transactions (if any). If such transactions were included, the Fund’s portfolio turnover rate may be higher. |
See Notes to Financial Statements.
28
| | | | | | | | | | | | | | | | | | | | |
| | | | | | |
| Class R4 Shares | | | | | | | | | | | | | | | |
| | | Year Ended July 31, | |
| | | 2024 | | | 2023 | | | 2022 | | | 2021 | | | 2020 | |
| | | | | | |
Per Share Operating Performance(a): | | | | | | | | | | | | | | | | | | | | |
Net Asset Value, Beginning of Year | | $ | 17.68 | | | $ | 21.10 | | | $ | 20.71 | | | $ | 11.40 | | | | $16.46 | |
Income (loss) from investment operations: | | | | | | | | | | | | | | | | | | | | |
Net investment income (loss) | | | 0.32 | | | | 0.37 | | | | 0.37 | | | | 0.31 | | | | 0.16 | |
| Net realized and unrealized gain (loss) on investment and foreign currency transactions | | | 2.69 | | | | (0.24 | ) | | | 0.32 | | | | 9.20 | | | | (4.28 | ) |
Total from investment operations | | | 3.01 | | | | 0.13 | | | | 0.69 | | | | 9.51 | | | | (4.12 | ) |
Less Dividends and Distributions: | | | | | | | | | | | | | | | | | | | | |
Dividends from net investment income | | | (0.45 | ) | | | (0.43 | ) | | | (0.30 | ) | | | (0.20 | ) | | | (0.52 | ) |
Distributions from net realized gains | | | (0.16 | ) | | | (3.12 | ) | | | - | | | | - | | | | (0.42 | ) |
Total dividends and distributions | | | (0.61 | ) | | | (3.55 | ) | | | (0.30 | ) | | | (0.20 | ) | | | (0.94 | ) |
Net asset value, end of year | | $ | 20.08 | | | $ | 17.68 | | | $ | 21.10 | | | $ | 20.71 | | | | $11.40 | |
Total Return(b): | | | 17.44 | % | | | 2.31 | % | | | 3.29 | % | | | 83.98 | % | | | (26.80 | )% |
| | | | | | | | | | | | | | | | | | | | | |
| Ratios/Supplemental Data: | | | | | | | | | | | | | | | |
Net assets, end of year (000) | | | $18 | | | | $15 | | | | $14 | | | | $245 | | | | $927 | |
Average net assets (000) | | | $15 | | | | $13 | | | | $41 | | | | $237 | | | | $918 | |
Ratios to average net assets(c): | | | | | | | | | | | | | | | | | | | | |
Expenses after waivers and/or expense reimbursement | | | 0.89 | % | | | 0.89 | % | | | 0.89 | % | | | 0.89 | % | | | 0.89 | % |
Expenses before waivers and/or expense reimbursement | | | 34.32 | % | | | 36.45 | % | | | 15.86 | % | | | 4.13 | % | | | 2.60 | % |
Net investment income (loss) | | | 1.81 | % | | | 2.10 | % | | | 1.78 | % | | | 2.21 | % | | | 1.16 | % |
Portfolio turnover rate(d) | | | 78 | % | | | 75 | % | | | 62 | % | | | 63 | % | | | 53 | % |
| (a) | Calculated based on average shares outstanding during the year. |
| (b) | Total return is calculated assuming a purchase of a share on the first day and a sale on the last day of each year reported and includes reinvestment of dividends and distributions, if any. Total returns may reflect adjustments to conform to GAAP. |
| (c) | Does not include expenses of the underlying funds in which the Fund invests. |
| (d) | The Fund’s portfolio turnover rate is calculated in accordance with regulatory requirements, without regard to transactions involving short-term investments, certain derivatives and in-kind transactions (if any). If such transactions were included, the Fund’s portfolio turnover rate may be higher. |
See Notes to Financial Statements.
PGIM Quant Solutions Small-Cap Value Fund 29
Financial Highlights (continued)
| | | | | | | | | | | | | | | | | | | | |
| | | | | | |
| Class R6 Shares | | | | | | | | | | | | | | | |
| | | Year Ended July 31, | |
| | | 2024 | | | 2023 | | | 2022 | | | 2021 | | | 2020 | |
| | | | | | |
Per Share Operating Performance(a): | | | | | | | | | | | | | | | | | | | | |
Net Asset Value, Beginning of Year | | | $17.69 | | | | $21.13 | | | | $20.73 | | | | $11.41 | | | | $16.47 | |
Income (loss) from investment operations: | | | | | | | | | | | | | | | | | | | | |
Net investment income (loss) | | | 0.35 | | | | 0.41 | | | | 0.37 | | | | 0.24 | | | | 0.25 | |
| Net realized and unrealized gain (loss) on investment and foreign currency transactions | | | 2.70 | | | | (0.26 | ) | | | 0.38 | | | | 9.31 | | | | (4.33 | ) |
Total from investment operations | | | 3.05 | | | | 0.15 | | | | 0.75 | | | | 9.55 | | | | (4.08 | ) |
Less Dividends and Distributions: | | | | | | | | | | | | | | | | | | | | |
Dividends from net investment income | | | (0.49 | ) | | | (0.47 | ) | | | (0.35 | ) | | | (0.23 | ) | | | (0.56 | ) |
Distributions from net realized gains | | | (0.16 | ) | | | (3.12 | ) | | | - | | | | - | | | | (0.42 | ) |
Total dividends and distributions | | | (0.65 | ) | | | (3.59 | ) | | | (0.35 | ) | | | (0.23 | ) | | | (0.98 | ) |
Net asset value, end of year | | | $20.09 | | | | $17.69 | | | | $21.13 | | | | $20.73 | | | | $11.41 | |
Total Return(b): | | | 17.67 | % | | | 2.48 | % | | | 3.58 | % | | | 84.26 | % | | | (26.60 | )% |
| | | | | | | | | | | | | | | | | | | | | |
| Ratios/Supplemental Data: | | | | | | | | | | | | | | | |
Net assets, end of year (000) | | | $117,684 | | | | $101,918 | | | | $123,662 | | | | $226,506 | | | | $193,499 | |
Average net assets (000) | | | $105,401 | | | | $99,623 | | | | $143,522 | | | | $209,675 | | | | $259,226 | |
Ratios to average net assets(c): | | | | | | | | | | | | | | | | | | | | |
Expenses after waivers and/or expense reimbursement | | | 0.68 | % | | | 0.68 | % | | | 0.67 | % | | | 0.66 | % | | | 0.67 | % |
Expenses before waivers and/or expense reimbursement | | | 0.69 | % | | | 0.69 | % | | | 0.67 | % | | | 0.66 | % | | | 0.67 | % |
Net investment income (loss) | | | 2.02 | % | | | 2.35 | % | | | 1.74 | % | | | 1.46 | % | | | 1.83 | % |
Portfolio turnover rate(d) | | | 78 | % | | | 75 | % | | | 62 | % | | | 63 | % | | | 53 | % |
| (a) | Calculated based on average shares outstanding during the year. |
| (b) | Total return is calculated assuming a purchase of a share on the first day and a sale on the last day of each year reported and includes reinvestment of dividends and distributions, if any. Total returns may reflect adjustments to conform to GAAP. |
| (c) | Does not include expenses of the underlying funds in which the Fund invests. |
| (d) | The Fund’s portfolio turnover rate is calculated in accordance with regulatory requirements, without regard to transactions involving short-term investments, certain derivatives and in-kind transactions (if any). If such transactions were included, the Fund’s portfolio turnover rate may be higher. |
See Notes to Financial Statements.
30
Notes to Financial Statements
The Target Portfolio Trust (the “Registered Investment Company” or “RIC”) is registered under the Investment Company Act of 1940, as amended (“1940 Act”), as an open-end management investment company. The RIC is organized as a Delaware Statutory Trust. These financial statements relate only to the PGIM Quant Solutions Small-Cap Value Fund (the “Fund”), a series of the RIC. The fund is classified as a diversified fund for purposes of the 1940 Act.
The investment objective of the Fund is above average capital appreciation.
The Fund follows the investment company accounting and reporting guidance of the Financial Accounting Standards Board (“FASB”) Accounting Standard Codification (“ASC”) Topic 946 Financial Services — Investment Companies. The following is a summary of significant accounting policies followed by the Fund in the preparation of its financial statements. The policies conform to U.S. generally accepted accounting principles (“GAAP”). The Fund consistently follows such policies in the preparation of its financial statements.
Securities Valuation: The Fund holds securities and other assets and liabilities that are fair valued as of the close of each day (generally, 4:00 PM Eastern time) the New York Stock Exchange (“NYSE”) is open for trading. As described in further detail below, the Fund’s investments are valued daily based on a number of factors, including the type of investment and whether market quotations are readily available. The RIC’s Board of Trustees (the “Board”) has approved the Fund’s valuation policies and procedures for security valuation and designated PGIM Investments LLC (“PGIM Investments” or the “Manager”) as the “Valuation Designee,” as defined by Rule 2a-5(b) under the 1940 Act, to perform the fair value determination relating to all Fund investments. Pursuant to the Board’s oversight, the Valuation Designee has established a Valuation Committee to perform the duties and responsibilities of the Valuation Designee under Rule 2a-5. The valuation procedures permit the Fund to utilize independent pricing vendor services, quotations from market makers, and alternative valuation methods when market quotations are either not readily available or not deemed representative of fair value. Fair value is the estimated price that would be received to sell an asset or paid to transfer a liability in an orderly transaction between market participants on the measurement date.
For the fiscal reporting year-end, securities and other assets and liabilities were fair valued at the close of the last U.S. business day. Trading in certain foreign securities may occur when the NYSE is closed (including weekends and holidays). Because such foreign securities
PGIM Quant Solutions Small-Cap Value Fund 31
Notes to Financial Statements (continued)
trade in markets that are open on weekends and U.S. holidays, the values of some of the Fund’s foreign investments may change on days when investors cannot purchase or redeem Fund shares.
Various inputs determine how the Fund’s investments are valued, all of which are categorized according to the three broad levels (Level 1, 2, or 3) detailed in the Schedule of Investments and referred to herein as the “fair value hierarchy” in accordance with FASB ASC Topic 820 Fair Value Measurement.
Common or preferred stocks, exchange-traded funds (“ETFs”) and derivative instruments, if applicable, that are traded on a national securities exchange are valued at the last sale price as of the close of trading on the applicable exchange where the security principally trades. Securities traded via NASDAQ are valued at the NASDAQ official closing price. To the extent these securities are valued at the last sale price or NASDAQ official closing price, they are classified as Level 1 in the fair value hierarchy. In the event that no sale or official closing price on a valuation date exists, these securities are generally valued at the mean between the last reported bid and ask prices, or at the last bid price in the absence of an ask price. These securities are classified as Level 2 in the fair value hierarchy.
Investments in open-end funds (other than ETFs) are valued at their net asset values as of the close of the NYSE on the date of valuation. These securities are classified as Level 1 in the fair value hierarchy since they may be purchased or sold at their net asset values on the date of valuation.
Securities and other assets that cannot be priced according to the methods described above are valued based on policies and procedures approved by the Board. In the event that unobservable inputs are used when determining such valuations, the securities will be classified as Level 3 in the fair value hierarchy. Altering one or more unobservable inputs may result in a significant change to a Level 3 security’s fair value measurement.
When determining the fair value of securities, some of the factors influencing the valuation include: the nature of any restrictions on disposition of the securities; assessment of the general liquidity of the securities; the issuer’s financial condition and the markets in which it does business; the cost of the investment; the size of the holding and the capitalization of the issuer; the prices of any recent transactions or bids/offers for such securities or any comparable securities; and any available analyst media or other reports or information deemed reliable by the Valuation Designee regarding the issuer or the markets or industry in which it operates. Using fair value to price securities may result in a value that is different from a security’s most recent closing price and from the price used by other unaffiliated mutual funds to calculate their net asset values.
32
Master Netting Arrangements: The RIC, on behalf of the Fund, is subject to various Master Agreements, or netting arrangements, with select counterparties. These are agreements which a subadviser may have negotiated and entered into on behalf of all or a portion of the Fund. A master netting arrangement between the Fund and the counterparty permits the Fund to offset amounts payable by the Fund to the same counterparty against amounts to be received and by the receipt of collateral from the counterparty by the Fund to cover the Fund’s exposure to the counterparty. However, there is no assurance that such mitigating factors are easily enforceable. In addition to master netting arrangements, the right to set-off exists when all the conditions are met such that each of the parties owes the other determinable amounts, the reporting party has the right to set-off the amount owed with the amount owed by the other party, the reporting party intends to set-off and the right of set-off is enforceable by law.
Securities Lending: The Fund lends its portfolio securities to banks and broker-dealers. The loans are secured by collateral at least equal to the market value of the securities loaned. Collateral pledged by each borrower is invested in an affiliated money market fund and is marked to market daily, based on the previous day’s market value, such that the value of the collateral exceeds the value of the loaned securities. In the event of significant appreciation in value of the securities on loan on the last business day of the reporting period, the financial statements may reflect a collateral value that is less than the market value of the loaned securities. Such shortfall is remedied as described above. Loans are subject to termination at the option of the borrower or the Fund. Upon termination of the loan, the borrower will return to the Fund securities identical to the loaned securities. The remaining open loans of the securities lending transactions are considered overnight and continuous. Should the borrower of the securities fail financially, the Fund has the right to repurchase the securities in the open market using the collateral.
The Fund recognizes income, net of any rebate and securities lending agent fees, for lending its securities in the form of fees or interest on the investment of any cash received as collateral. The borrower receives all interest and dividends from the securities loaned and such payments are passed back to the lender in amounts equivalent thereto, which are reflected in interest income or unaffiliated dividend income based on the nature of the payment on the Statement of Operations. The Fund also continues to recognize any unrealized gain (loss) in the market price of the securities loaned and on the change in the value of the collateral invested that may occur during the term of the loan. In addition, realized gain (loss) is recognized on changes in the value of the collateral invested upon liquidation of the collateral. Net earnings from securities lending are disclosed in the Statement of Operations.
Equity and Mortgage Real Estate Investment Trusts (collectively “REITs”): The Fund invested in REITs, which report information on the source of their distributions annually. Based on current and historical information, a portion of distributions received from REITs during the period is estimated to be dividend income, capital gain or return of capital and recorded accordingly. When material, these estimates are adjusted periodically when the actual source of distributions is disclosed by the REITs.
PGIM Quant Solutions Small-Cap Value Fund 33
Notes to Financial Statements (continued)
Securities Transactions and Net Investment Income: Securities transactions are recorded on the trade date. Realized gains (losses) from investment and currency transactions are calculated on the specific identification method. Dividend income is recorded on the ex-date, or for certain foreign securities, when the Fund becomes aware of such dividends. Expenses are recorded on an accrual basis, which may require the use of certain estimates by management that may differ from actual expense amounts. Net investment income or loss (other than class specific expenses and waivers, which are allocated as noted below) and unrealized and realized gains (losses) are allocated daily to each class of shares based upon the relative proportion of adjusted net assets of each class at the beginning of the day. Class specific expenses and waivers, where applicable, are charged to the respective share classes. Such class specific expenses and waivers include distribution fees and distribution fee waivers, shareholder servicing fees, transfer agent’s fees and expenses, registration fees and fee waivers and/or expense reimbursements, as applicable.
Taxes: It is the Fund’s policy to continue to meet the requirements of the Internal Revenue Code applicable to regulated investment companies and to distribute all of its taxable net investment income and capital gains, if any, to its shareholders. Therefore, no federal income tax provision is required. Withholding taxes on foreign dividends, interest and capital gains, if any, are recorded, net of reclaimable amounts, at the time the related income is earned.
Dividends and Distributions: Dividends and distributions to shareholders, which are determined in accordance with federal income tax regulations and which may differ from GAAP, are recorded on the ex-date. Permanent book/tax differences relating to income and gain (loss) are reclassified between total distributable earnings (loss) and paid-in capital in excess of par, as appropriate. The chart below sets forth the expected frequency of dividend and capital gains distributions to shareholders. Various factors may impact the frequency of dividend distributions to shareholders, including but not limited to adverse market conditions or portfolio holding-specific events.
| | |
| | |
Expected Distribution Schedule to Shareholders* | | Frequency |
| |
Net Investment Income | | Annually |
| | |
Short-Term Capital Gains | | Annually |
| |
Long-Term Capital Gains | | Annually |
| * | Under certain circumstances, the Fund may make more than one distribution of short-term and/or long-term capital gains during a fiscal year. |
Estimates: The preparation of financial statements requires management to make estimates and assumptions that affect the reported amounts and disclosures in the financial statements. Actual results could differ from those estimates.
34
The RIC, on behalf of the Fund, has a management agreement with the Manager pursuant to which it has responsibility for all investment advisory services, including supervision of the subadviser’s performance of such services, and for rendering administrative services.
The Manager has entered into a subadvisory agreement with PGIM Quantitative Solutions LLC (“PGIM Quantitative Solutions” or the “Subadviser”). The Manager pays for the services of PGIM Quantitative Solutions.
Fees payable under the management agreement are computed daily and paid monthly. For the reporting period ended July 31, 2024, the contractual and effective management fee rates were as follows:
| | | | |
| | |
| Contractual Management Rate | | Effective Management Fee, before any waivers
and/or expense reimbursements | |
0.60% of average daily net assets up to $2 billion; | | | 0.60% | |
0.575% of average daily net assets over $2 billion. | | | | |
The Manager has contractually agreed to waive and/or reimburse up to 0.01% of the fees and expenses from the Fund through November 30, 2025, to the extent that the Fund’s net annual operating expenses and acquired fund fees and expenses (exclusive of taxes, interest, distribution and service (12b-1) fees and certain extraordinary expenses) exceed
0.68% of the Fund’s average daily net assets on an annualized basis. Separately, the Manager has contractually agreed, through November 30, 2025, to limit transfer agency, shareholder servicing, sub-transfer agency, and blue sky fees, as applicable. This contractual expense limitation excludes interest, brokerage, taxes (such as income and foreign withholding taxes, stamp duty and deferred tax expenses), acquired fund fees and expenses, extraordinary expenses, and certain other Fund expenses such as dividend and interest expense and broker charges on short sales.
Where applicable, the Manager agrees to waive management fees or shared operating expenses on any share class to the same extent that it waives such expenses on any other share class. In addition, total annual operating expenses for Class R6 shares will not exceed total annual operating expenses for Class Z shares. Fees and/or expenses waived and/or reimbursed by the Manager for the purpose of preventing the expenses from exceeding a certain expense ratio limit may be recouped by the Manager within the same fiscal year during which such waiver and/or reimbursement is made if such recoupment can be realized without exceeding the expense limit in effect at the time of the waiver/reimbursement and/or recoupment for that fiscal year, as applicable. The expense limitations attributable to each class are as follows:
| | | | | |
| | |
| Class | | Expense
Limitations |
A | | | | — | % |
C | | | | — | |
R | | | | — | |
PGIM Quant Solutions Small-Cap Value Fund 35
Notes to Financial Statements (continued)
| | | | | |
| | |
| Class | | Expense
Limitations |
| |
Z | | | | —% | |
| |
R2 | | | | 1.14 | |
| |
R4 | | | | 0.89 | |
| |
R6 | | | | — | |
The RIC, on behalf of the Fund, has a distribution agreement with Prudential Investment Management Services LLC (“PIMS”), which acts as the distributor of the Class A, Class C, Class R, Class Z, Class R2, Class R4 and Class R6 shares of the Fund. The Fund compensates PIMS for distributing and servicing the Fund’s Class A, Class C, Class R and Class R2 shares, pursuant to the plans of distribution (the “Distribution Plans”), regardless of expenses actually incurred by PIMS.
Pursuant to the Distribution Plans, the Fund compensates PIMS for distribution related activities at an annual rate based on average daily net assets per class. PIMS has contractually agreed through November 30, 2025 to reduce such fees of certain classes based on the average daily net assets. The distribution fees are accrued daily and payable monthly.
The Fund has adopted a Shareholder Services Plan with respect to Class R2 and Class R4 shares. Under the terms of the Shareholder Services Plan, Class R2 and Class R4 shares are authorized to compensate Prudential Mutual Fund Services LLC (“PMFS”), its affiliates or third-party service providers for services rendered to the shareholders of such Class R2 or Class R4 shares. The shareholder service fee is accrued daily and paid monthly, as applicable.
The Fund’s annual gross and net distribution rates and maximum shareholder service fee, where applicable, are as follows:
| | | | | | | | | | | | | | | |
| | | | |
| Class | | Gross Distribution Fee | | Net Distribution Fee | | Shareholder Service Fee |
| | | |
A | | | | 0.30 | % | | | | 0.25 | % | | | | N/A | % |
| | | |
C | | | | 1.00 | | | | | 1.00 | | | | | N/A | |
| | | |
R | | | | 0.75 | | | | | 0.50 | | | | | N/A | |
| | | |
Z | | | | N/A | | | | | N/A | | | | | N/A | |
| | | |
R2 | | | | 0.25 | | | | | 0.25 | | | | | 0.10 | |
| | | |
R4 | | | | N/A | | | | | N/A | | | | | 0.10 | |
| | | |
R6 | | | | N/A | | | | | N/A | | | | | N/A | |
For the year ended July 31, 2024, PIMS received front-end sales charges (“FESL”) resulting from sales of certain class shares and contingent deferred sales charges (“CDSC”) imposed upon redemptions by certain shareholders. From these fees, PIMS paid such sales charges
36
to broker-dealers, who in turn paid commissions to salespersons and incurred other distribution costs. The sales charges are as follows where applicable:
| | | | | | | | | | |
| | | | |
| Class | | FESL | | | | | | CDSC |
A | | $ | 21,383 | | | | | | | $ 6 |
C | | | — | | | | | | | 18 |
PGIM Investments, PIMS, PMFS and PGIM Quantitative Solutions are indirect, wholly-owned subsidiaries of Prudential Financial, Inc. (“Prudential”).
| 4. | Other Transactions with Affiliates |
PMFS, an affiliate of PGIM Investments and an indirect, wholly-owned subsidiary of Prudential, serves as the Fund’s transfer agent and shareholder servicing agent. Transfer agent’s and shareholder servicing agent’s fees and expenses in the Statement of Operations include certain out-of-pocket expenses paid to non-affiliates, where applicable.
The Fund may invest its overnight sweep cash in the PGIM Core Government Money Market Fund (the “Core Government Fund”), a series of the Prudential Government Money Market Fund, Inc., and its securities lending cash collateral in the PGIM Institutional Money Market Fund (the “Money Market Fund”), a series of Prudential Investment Portfolios 2, each registered under the 1940 Act and managed by PGIM Investments. PGIM Investments and/or its affiliates are paid fees or reimbursed for providing their services to the Core Government Fund and the Money Market Fund. In addition to the realized and unrealized gains on investments in the Core Government Fund and the Money Market Fund, earnings from such investments are disclosed on the Statement of Operations as “Affiliated dividend income” and “Income from securities lending, net”, respectively.
The Fund may enter into certain securities purchase or sale transactions under Board approved Rule 17a-7 procedures. Rule 17a-7 is an exemptive rule under the 1940 Act that, subject to certain conditions, permits purchase and sale transactions among affiliated investment companies, or between an investment company and a person that is affiliated solely by reason of having a common (or affiliated) investment adviser, common directors/trustees, and/or common officers. For the year ended July 31, 2024, no Rule 17a-7 transactions were entered into by the Fund.
The aggregate cost of purchases and proceeds from sales of portfolio securities (excluding short-term investments and U.S. Government securities) for the reporting period ended July 31, 2024, were as follows:
| | |
| | |
| Cost of Purchases | | Proceeds from Sales |
| |
$311,163,671 | | $352,718,756 |
PGIM Quant Solutions Small-Cap Value Fund 37
Notes to Financial Statements (continued)
A summary of the cost of purchases and proceeds from sales of shares of affiliated mutual funds for the year ended July 31, 2024, is presented as follows:
| | | | | | | | | | | | | | | | | | | | | | | | | | | | | | | | | | | |
| | | | | | | | |
Value,
Beginning of Year | | Cost of
Purchases | | Proceeds from Sales | | Change in
Unrealized Gain (Loss) | | Realized
Gain
(Loss) | | Value,
End of Year | | Shares,
End
of Year | | Income |
| | | | |
Short-Term Investments - Affiliated Mutual Funds: | | | | | | | | | | | | | | | | | | | | | |
| | |
PGIM Core Government Money Market Fund (7-day effective yield 5.561%)(1)(wb) | | | | | | | | | | | |
| | | | | | | |
$ 1,690,606 | | | | $ 57,273,717 | | | | | $ 57,181,321 | | | | | $ — | | | | | $ — | | | | | $ 1,783,002 | | | | | 1,783,002 | | | | | $ 58,860 | |
|
PGIM Institutional Money Market Fund (7-day effective yield 5.606%)(1)(b)(wb) | |
| | | | | | | |
47,409,709 | | | | 228,899,885 | | | | | 242,148,316 | | | | | (11,777 | ) | | | | 15,760 | | | | | 34,165,261 | | | | | 34,185,772 | | | | | 157,650( | 2) |
| | | | | | | | |
$49,100,315 | | | | $ 286,173,602 | | | | | $ 299,329,637 | | | | | $ (11,777 | ) | | | | $ 15,760 | | | | | $ 35,948,263 | | | | | | | | | | $ 216,510 | |
| (1) | The Fund did not have any capital gain distributions during the reporting period. |
| (2) | The amount, or a portion thereof, represents the affiliated securities lending income shown on the Statement of Operations. |
| (b) | Represents security, or portion thereof, purchased with cash collateral received for securities on loan and includes dividend reinvestment. |
| (wb) | Represents an investment in a Fund affiliated with the Manager. |
6. Distributions and Tax Information
The Fund has a tax year end of October 31st.
Distributions to shareholders, which are determined in accordance with federal income tax regulations and which may differ from GAAP, are recorded on the ex-date.
For the tax year ended October 31, 2023, the tax character of dividends paid as reflected in the Statement of Changes in Net Assets were as follows:
| | | | | | |
| | | | |
Ordinary
Income | | Long-Term
Capital Gains | | Tax Return
of Capital | | Total Dividends
and Distributions |
| | | |
| $24,304,751 | | $52,502,241 | | $— | | $76,806,992 |
For the tax year ended October 31, 2022, the tax character of dividends paid as reflected in the Statement of Changes in Net Assets were as follows:
| | | | | | |
| | | | |
Ordinary
Income | | Long-Term
Capital Gains | | Tax Return
of Capital | | Total Dividends
and Distributions |
| | | |
| $7,947,582 | | $— | | $— | | $7,947,582 |
38
For the latest tax year ended October 31, 2023, the Fund had the following amounts of accumulated undistributed earnings on a tax basis:
| | | | | | | | |
| | | | | |
| | | Undistributed Ordinary Income | | | | Undistributed Long-Term Capital Gains | | |
| | | | |
| | | $9,535,285 | | | | $— | | |
The United States federal income tax basis of the Fund’s investments and the net unrealized appreciation as of July 31, 2024 were as follows:
| | | | | | |
| | | | |
| Tax Basis | | Gross
Unrealized
Appreciation | | Gross
Unrealized
Depreciation | | Net
Unrealized
Appreciation |
| | | |
| $418,939,721 | | $77,678,684 | | $(28,133,186) | | $49,545,498 |
The difference between GAAP and tax basis was primarily attributable to deferred losses on wash sales.
The Manager has analyzed the Fund’s tax positions taken on federal, state and local income tax returns for all open tax years and has concluded that no provision for income tax is required in the Fund’s financial statements for the current reporting period. Since tax authorities can examine previously filed tax returns, the Fund’s U.S. federal and state tax returns for each of the four tax years up to the most recent tax year ended October 31, 2023 are subject to such review.
The Fund offers Class A, Class C, Class R, Class Z, Class R2, Class R4 and Class R6 shares. Class A shares are sold with a maximum front-end sales charge of 5.50%. Investors who purchase $1 million or more of Class A shares and sell these shares within 12 months of purchase are subject to a CDSC of 1%, although they are not subject to an initial sales charge. The Class A CDSC is waived for certain retirement and/or benefit plans. A special exchange privilege is also available for shareholders who qualified to purchase Class A shares at net asset value. Class C shares are sold with a CDSC of 1% on sales made within 12 months of purchase. Class C shares will automatically convert to Class A shares on a monthly basis approximately eight years (ten years prior to January 22, 2021) after purchase. Class R shares are available to certain retirement plans, clearing and settlement firms. Class R, Class Z, Class R2, Class R4 and Class R6 shares are not subject to any sales or redemption charges and are available exclusively for sale to a limited group of investors.
The RIC has authorized an unlimited number of shares of beneficial interest of the Fund at $0.001 par value per share.
Under certain circumstances, an exchange may be made from specified share classes of the Fund to one or more other share classes of the Fund as presented in the table of transactions in shares of beneficial interest, below.
PGIM Quant Solutions Small-Cap Value Fund 39
Notes to Financial Statements (continued)
As of July 31, 2024, Prudential, through its affiliated entities, including affiliated funds (if applicable), owned shares of the Fund as follows:
| | | | |
| | | |
| Class | | Number of Shares | | Percentage of Outstanding Shares |
| | |
Z | | 61,007 | | 1.4% |
| | |
R2 | | 730 | | 8.7 |
| | |
R4 | | 739 | | 84.5 |
At the reporting period end, the number of shareholders holding greater than 5% of the Fund are as follows:
| | | | |
| | | |
| | | Number of Shareholders | | Percentage of Outstanding Shares |
| | |
Affiliated | | — | | —% |
| | |
Unaffiliated | | 5 | | 77.0 |
Transactions in shares of beneficial interest were as follows:
| | | | | | | | |
| | | |
| Share Class | | Shares | | | Amount | |
| | |
Class A | | | | | | | | |
Year ended July 31, 2024: | | | | | | | | |
Shares sold | | | 139,967 | | | $ | 2,474,838 | |
Shares issued in reinvestment of dividends and distributions | | | 176,498 | | | | 3,164,603 | |
Shares purchased | | | (841,775 | ) | | | (14,673,953 | ) |
Net increase (decrease) in shares outstanding before conversion | | | (525,310 | ) | | | (9,034,512 | ) |
Shares issued upon conversion from other share class(es) | | | 20,461 | | | | 369,803 | |
Shares purchased upon conversion into other share class(es) | | | (37,405 | ) | | | (662,340 | ) |
Net increase (decrease) in shares outstanding | | | (542,254 | ) | | $ | (9,327,049 | ) |
| | |
Year ended July 31, 2023: | | | | | | | | |
Shares sold | | | 263,705 | | | $ | 4,541,993 | |
Shares issued in reinvestment of dividends and distributions | | | 1,148,652 | | | | 18,435,859 | |
Shares purchased | | | (1,086,591 | ) | | | (18,554,840 | ) |
Net increase (decrease) in shares outstanding before conversion | | | 325,766 | | | | 4,423,012 | |
Shares issued upon conversion from other share class(es) | | | 21,631 | | | | 356,874 | |
Shares purchased upon conversion into other share class(es) | | | (31,826 | ) | | | (545,947 | ) |
Net increase (decrease) in shares outstanding | | | 315,571 | | | $ | 4,233,939 | |
40
| | | | | | | | |
| | | |
| Share Class | | Shares | | | Amount | |
| | |
Class C | | | | | | | | |
Year ended July 31, 2024: | | | | | | | | |
Shares sold | | | 6,273 | | | $ | 107,810 | |
Shares issued in reinvestment of dividends and distributions | | | 1,859 | | | | 33,351 | |
Shares purchased | | | (25,713 | ) | | | (429,476 | ) |
Net increase (decrease) in shares outstanding before conversion | | | (17,581 | ) | | | (288,315 | ) |
Shares purchased upon conversion into other share class(es) | | | (18,601 | ) | | | (334,613 | ) |
Net increase (decrease) in shares outstanding | | | (36,182 | ) | | $ | (622,928 | ) |
| | |
Year ended July 31, 2023: | | | | | | | | |
Shares sold | | | 10,881 | | | $ | 203,409 | |
Shares issued in reinvestment of dividends and distributions | | | 25,182 | | | | 404,936 | |
Shares purchased | | | (28,177 | ) | | | (480,753 | ) |
Net increase (decrease) in shares outstanding before conversion | | | 7,886 | | | | 127,592 | |
Shares purchased upon conversion into other share class(es) | | | (18,616 | ) | | | (303,480 | ) |
Net increase (decrease) in shares outstanding | | | (10,730 | ) | | $ | (175,888 | ) |
| | |
Class R | | | | | | | | |
Year ended July 31, 2024: | | | | | | | | |
Shares sold | | | 658,291 | | | $ | 11,459,934 | |
Shares issued in reinvestment of dividends and distributions | | | 186,851 | | | | 3,288,576 | |
Shares purchased | | | (1,493,541 | ) | | | (25,544,215 | ) |
Net increase (decrease) in shares outstanding | | | (648,399 | ) | | $ | (10,795,705 | ) |
| | |
Year ended July 31, 2023: | | | | | | | | |
Shares sold | | | 859,848 | | | $ | 13,468,817 | |
Shares issued in reinvestment of dividends and distributions | | | 1,185,194 | | | | 18,678,665 | |
Shares purchased | | | (1,060,158 | ) | | | (17,824,894 | ) |
Net increase (decrease) in shares outstanding | | | 984,884 | | | $ | 14,322,588 | |
| | |
Class Z | | | | | | | | |
Year ended July 31, 2024: | | | | | | | | |
Shares sold | | | 727,735 | | | $ | 12,774,296 | |
Shares issued in reinvestment of dividends and distributions | | | 177,138 | | | | 3,170,771 | |
Shares purchased | | | (2,056,775 | ) | | | (35,523,094 | ) |
Net increase (decrease) in shares outstanding before conversion | | | (1,151,902 | ) | | | (19,578,027 | ) |
Shares issued upon conversion from other share class(es) | | | 24,396 | | | | 431,935 | |
Shares purchased upon conversion into other share class(es) | | | (8,618 | ) | | | (147,687 | ) |
Net increase (decrease) in shares outstanding | | | (1,136,124 | ) | | $ | (19,293,779 | ) |
PGIM Quant Solutions Small-Cap Value Fund 41
Notes to Financial Statements (continued)
| | | | | | | | |
| | | |
| Share Class | | Shares | | | Amount | |
| | |
Year ended July 31, 2023: | | | | | | | | |
Shares sold | | | 898,022 | | | $ | 15,929,840 | |
Shares issued in reinvestment of dividends and distributions | | | 1,288,153 | | | | 20,623,327 | |
Shares purchased | | | (3,062,124 | ) | | | (52,350,644 | ) |
Net increase (decrease) in shares outstanding before conversion | | | (875,949 | ) | | | (15,797,477 | ) |
Shares issued upon conversion from other share class(es) | | | 27,924 | | | | 471,921 | |
Shares purchased upon conversion into other share class(es) | | | (7,319 | ) | | | (120,770 | ) |
Net increase (decrease) in shares outstanding | | | (855,344 | ) | | $ | (15,446,326 | ) |
| | |
Class R2 | | | | | | | | |
Year ended July 31, 2024: | | | | | | | | |
Shares sold | | | 3,932 | | | $ | 71,372 | |
Shares issued in reinvestment of dividends and distributions | | | 187 | | | | 3,352 | |
Shares purchased | | | (1,503 | ) | | | (26,402 | ) |
Net increase (decrease) in shares outstanding | | | 2,616 | | | $ | 48,322 | |
| | |
Year ended July 31, 2023: | | | | | | | | |
Shares sold | | | 13,748 | | | $ | 233,381 | |
Shares issued in reinvestment of dividends and distributions | | | 666 | | | | 10,666 | |
Shares purchased | | | (12,117 | ) | | | (213,945 | ) |
Net increase (decrease) in shares outstanding | | | 2,297 | | | $ | 30,102 | |
| | |
Class R4 | | | | | | | | |
Year ended July 31, 2024: | | | | | | | | |
Shares sold | | | — | ** | | $ | 1 | |
Shares issued in reinvestment of dividends and distributions | | | 29 | | | | 517 | |
Shares purchased | | | (1 | ) | | | (26 | ) |
Net increase (decrease) in shares outstanding | | | 28 | | | $ | 492 | |
| | |
Year ended July 31, 2023: | | | | | | | | |
Shares sold | | | 48 | | | $ | 744 | |
Shares issued in reinvestment of dividends and distributions | | | 145 | | | | 2,323 | |
Shares purchased | | | (1 | ) | | | (15 | ) |
Net increase (decrease) in shares outstanding | | | 192 | | | $ | 3,052 | |
42
| | | | | | | | |
| | | |
| Share Class | | Shares | | | Amount | |
| | |
Class R6 | | | | | | | | |
Year ended July 31, 2024: | | | | | | | | |
Shares sold | | | 1,788,861 | | | $ | 30,603,701 | |
Shares issued in reinvestment of dividends and distributions | | | 217,534 | | | | 3,898,208 | |
Shares purchased | | | (1,931,240 | ) | | | (34,361,944 | ) |
Net increase (decrease) in shares outstanding before conversion | | | 75,155 | | | | 139,965 | |
Shares issued upon conversion from other share class(es) | | | 19,671 | | | | 343,468 | |
Shares purchased upon conversion into other share class(es) | | | (34 | ) | | | (566 | ) |
Net increase (decrease) in shares outstanding | | | 94,792 | | | $ | 482,867 | |
| | |
Year ended July 31, 2023: | | | | | | | | |
Shares sold | | | 1,815,379 | | | $ | 31,209,928 | |
Shares issued in reinvestment of dividends and distributions | | | 1,037,108 | | | | 16,624,843 | |
Shares purchased | | | (2,952,321 | ) | | | (52,838,686 | ) |
Net increase (decrease) in shares outstanding before conversion | | | (99,834 | ) | | | (5,003,915 | ) |
Shares issued upon conversion from other share class(es) | | | 10,923 | | | | 187,231 | |
Shares purchased upon conversion into other share class(es) | | | (2,787 | ) | | | (45,829 | ) |
Net increase (decrease) in shares outstanding | | | (91,698 | ) | | $ | (4,862,513 | ) |
The RIC, on behalf of the Fund, along with other affiliated registered investment companies (the “Participating Funds”), is a party to a Syndicated Credit Agreement (“SCA”) with a group of banks. The purpose of the SCA is to provide an alternative source of temporary funding for capital share redemptions. The table below provides details of the current SCA in effect at the reporting period-end as well as the prior SCA.
| | | | |
| | | Current SCA | | Prior SCA |
Term of Commitment | | 9/29/2023 - 9/26/2024 | | 9/30/2022 – 9/28/2023 |
Total Commitment | | $ 1,200,000,000 | | $ 1,200,000,000 |
Annualized Commitment Fee on the Unused Portion of the SCA | | 0.15% | | 0.15% |
Annualized Interest Rate on Borrowings | | 1.00% plus the higher of (1) the
effective federal funds rate,
(2) the daily SOFR rate plus
0.10% or (3) zero percent | | 1.00% plus the higher of (1) the
effective federal funds rate,
(2) the daily SOFR rate plus
0.10% or (3) zero percent |
Certain affiliated registered investment companies that are parties to the SCA include portfolios that are subject to a predetermined mathematical formula used to manage certain benefit guarantees offered under variable annuity contracts. The formula may result in large scale asset flows into and out of these portfolios. Consequently, these portfolios may be more likely to utilize the SCA for purposes of funding redemptions. It may be possible for those portfolios to fully exhaust the committed amount of the SCA, thereby requiring the Manager
PGIM Quant Solutions Small-Cap Value Fund 43
Notes to Financial Statements (continued)
to allocate available funding per a Board-approved methodology designed to treat the Participating Funds in the SCA equitably.
The Fund utilized the SCA during the year ended July 31, 2024. The average daily balance for the 44 days that the Fund had loans outstanding during the period was approximately $870,000, borrowed at a weighted average interest rate of 6.43%. The maximum loan outstanding amount during the period was $4,041,000. At July 31, 2024, the Fund did not have an outstanding loan amount.
| 9. | Risks of Investing in the Fund |
The Fund’s principal risks include, but are not limited to, some or all of the risks discussed below. For further information on the Fund’s risks, please refer to the Fund’s Prospectus and Statement of Additional Information.
Economic and Market Events Risk: Events in the U.S. and global financial markets, including actions taken by the U.S. Federal Reserve or foreign central banks to stimulate or stabilize economic growth or the functioning of the securities markets, or otherwise reduce inflation, may at times result in unusually high market volatility, which could negatively impact performance. Governmental efforts to curb inflation often have negative effects on the level of economic activity. Relatively reduced liquidity in credit and fixed income markets could adversely affect issuers worldwide.
Equity and Equity-Related Securities Risk: Equity and equity-related securities may be subject to changes in value, and their values may be more volatile than those of other asset classes. In addition to an individual security losing value, the value of the equity markets or a sector in which the Fund invests could go down. Different parts of a market can react differently to adverse issuer, market, regulatory, political and economic developments.
Financials Sector Risk: Banks and other financial services companies can be adversely affected by, among other things, regulatory changes, interest rate movements, the availability of capital and cost to borrow, and the rate of debt defaults.
Increase in Expenses Risk: Your actual cost of investing in the Fund may be higher than the expenses shown in the expense table in the Fund’s prospectus for a variety of reasons. For example, expense ratios may be higher than those shown if average net assets decrease. Net assets are more likely to decrease and Fund expense ratios are more likely to increase when markets are volatile. Active and frequent trading of Fund securities can increase expenses.
44
Large Shareholder and Large Scale Redemption Risk: Certain individuals, accounts, funds (including funds affiliated with the Manager) or institutions, including the Manager and its affiliates, may from time to time own or control a substantial amount of the Fund’s shares. There is no requirement that these entities maintain their investment in the Fund. There is a risk that such large shareholders or that the Fund’s shareholders generally may redeem all or a substantial portion of their investments in the Fund in a short period of time, which could have a significant negative impact on the Fund’s NAV, liquidity, and brokerage costs. Large redemptions could also result in tax consequences to shareholders and impact the Fund’s ability to implement its investment strategy. The Fund’s ability to pursue its investment objective after one or more large scale redemptions may be impaired and, as a result, the Fund may invest a larger portion of its assets in cash or cash equivalents.
Management Risk: Actively managed funds are subject to management risk. The subadviser will apply investment techniques and risk analyses in making investment decisions for the Fund, but the subadviser’s judgments about the attractiveness, value or market trends affecting a particular security, industry or sector or about market movements may be incorrect. Additionally, the investments selected for the Fund may underperform the markets in general, the Fund’s benchmark and other funds with similar investment objectives.
Market Disruption and Geopolitical Risks: Market disruption can be caused by economic, financial or political events and factors, including but not limited to, international wars or conflicts (including Russia’s military invasion of Ukraine and the Israel-Hamas war), geopolitical developments (including trading and tariff arrangements, sanctions and cybersecurity attacks), instability in regions such as Asia, Eastern Europe and the Middle East, terrorism, natural disasters and public health epidemics (including the outbreak of COVID-19 globally).
The extent and duration of such events and resulting market disruptions cannot be predicted, but could be substantial and could magnify the impact of other risks to the Fund. These and other similar events could adversely affect the U.S. and foreign financial markets and lead to increased market volatility, reduced liquidity in the securities markets, significant negative impacts on issuers and the markets for certain securities and commodities and/or government intervention. They may also cause short- or long-term economic uncertainties in the United States and worldwide. As a result, whether or not the Fund invests in securities of issuers located in or with significant exposure to the countries directly affected, the value and liquidity of the Fund’s investments may be negatively impacted. Further, due to closures of certain markets and restrictions on trading certain securities, the value of certain securities held by the Fund could be significantly impacted, which could lead to such securities being valued at zero.
Market Risk: Securities markets may be volatile and the market prices of the Fund’s securities may decline. Securities fluctuate in price based on changes in an issuer’s financial condition and overall market and economic conditions. If the market prices of the securities owned by the Fund fall, the value of your investment in the Fund will decline.
PGIM Quant Solutions Small-Cap Value Fund 45
Notes to Financial Statements (continued)
Model Design Risk: The subadviser uses certain quantitative models to help guide its investment decisions. The design of the underlying models may be flawed or incomplete. The investment models the subadviser uses are based on historical and theoretical underpinnings that it believes are sound. There can be no guarantee, however, that these underpinnings will correlate with security price behavior in the manner assumed by the subadviser’s models. Additionally, the quantitative techniques that underlie the subadviser’s portfolio construction processes may fail to fully anticipate important risks.
Model Implementation Risk: While the subadviser strives to mitigate the likelihood of material implementation errors, it is impossible to completely eliminate the risk of error in the implementation of the computer models that guide the subadviser’s quantitative investment processes. Additionally, it may be difficult to implement model recommendations in volatile and rapidly changing market conditions.
Real Estate Investment Trust (“REIT”) Risk: Investing in REITs involves certain unique risks in addition to those risks associated with investing in the real estate industry in general. REITs may be affected by changes in the value of the underlying property owned by the REITs, while mortgage REITs may be affected by the quality of any credit extended. REITs are dependent upon management skills, may not be diversified geographically or by property/mortgage asset type, and are subject to heavy cash flow dependency, default by borrowers and self-liquidation. REITs may be more volatile and/or more illiquid than other types of equity securities. REITs (especially mortgage REITs) are subject to interest rate risks. REITs may incur significant amounts of leverage. The Fund will indirectly bear a portion of the expenses, including management fees, paid by each REIT in which it invests, in addition to the expenses of the Fund.
REITs must also meet certain requirements under the Internal Revenue Code of 1986, as amended (the Code) to avoid entity level tax and be eligible to pass-through certain tax attributes of their income to shareholders. REITs are consequently subject to the risk of failing to meet these requirements for favorable tax treatment and of failing to maintain their exemptions from registration under the Investment Company Act of 1940. REITs are subject to the risks of changes in the Code affecting their tax status.
Small Company Risk: Small company stocks present above-average risks in comparison to larger companies. Small companies usually offer a smaller range of products and services than larger companies. Smaller companies may also have limited financial resources and may lack management expertise. As a result, stocks issued by smaller companies may be comparatively less liquid and fluctuate in value more than the stocks of larger, more established companies.
46
Value Style Risk: Since the Fund follows a value investment style, there is the risk that the value style may be out of favor for long periods of time, that the market will not recognize a security’s intrinsic value for a long time or at all, or that a stock judged to be undervalued may actually be appropriately priced or overvalued. Issuers of value stocks may have experienced adverse business developments or may be subject to special risks that have caused the stock to be out of favor. In addition, the Fund’s value investment style may go out of favor with investors, negatively affecting the Fund’s performance. If the Fund’s assessment of market conditions or a company’s value is inaccurate, the Fund could suffer losses or produce poor performance relative to other funds.
PGIM Quant Solutions Small-Cap Value Fund 47
Report of Independent Registered Public Accounting Firm
To the Board of Trustees of The Target Portfolio Trust and Shareholders of PGIM Quant Solutions Small-Cap Value Fund
Opinion on the Financial Statements
We have audited the accompanying statement of assets and liabilities, including the schedule of investments, of PGIM Quant Solutions Small-Cap Value Fund (one of the funds constituting The Target Portfolio Trust, referred to hereafter as the “Fund”) as of July 31, 2024, the related statement of operations for the year ended July 31, 2024, the statements of changes in net assets for each of the two years in the period ended July 31, 2024, including the related notes, and the financial highlights for each of the four years in the period ended July 31, 2024 (collectively referred to as the “financial statements”). In our opinion, the financial statements present fairly, in all material respects, the financial position of the Fund as of July 31, 2024, the results of its operations for the year then ended, the changes in its net assets for each of the two years in the period ended July 31, 2024 and the financial highlights for each of the four years in the period ended July 31, 2024 in conformity with accounting principles generally accepted in the United States of America.
The financial statements of the Fund as of and for the year ended July 31, 2020 and the financial highlights for the year ended July 31, 2020 (not presented herein, other than the financial highlights) were audited by other auditors whose report dated September 16, 2020 expressed an unqualified opinion on those financial statements and financial highlights.
Basis for Opinion
These financial statements are the responsibility of the Fund’s management. Our responsibility is to express an opinion on the Fund’s financial statements based on our audits. We are a public accounting firm registered with the Public Company Accounting Oversight Board (United States) (PCAOB) and are required to be independent with respect to the Fund in accordance with the U.S. federal securities laws and the applicable rules and regulations of the Securities and Exchange Commission and the PCAOB.
We conducted our audits of these financial statements in accordance with the standards of the PCAOB. Those standards require that we plan and perform the audit to obtain reasonable assurance about whether the financial statements are free of material misstatement, whether due to error or fraud.
Our audits included performing procedures to assess the risks of material misstatement of the financial statements, whether due to error or fraud, and performing procedures that respond to those risks. Such procedures included examining, on a test basis, evidence regarding the amounts and disclosures in the financial statements. Our audits also included evaluating the accounting principles used and significant estimates made by management, as well as evaluating the overall presentation of the financial statements. Our procedures included confirmation of securities owned as of July 31, 2024 by correspondence with the custodian, transfer agent and broker. We believe that our audits provide a reasonable basis for our opinion.
|
/s/PricewaterhouseCoopers LLP |
| New York, New York |
| September 20, 2024 |
We have served as the auditor of one or more investment companies in the PGIM Retail Funds complex since 2020.
48
Other Information
Form N-CSR Item 8 - Changes in and Disagreements with Accountants for Open-End Management Investment Companies - None.
Form N-CSR Item 9 - Proxy Disclosures for Open-End Management Investment Companies-None.
Form N-CSR Item 10 - Remuneration Paid to Directors, Officers, and Others of Open-End Management Investment Companies – Included as part of the financial statements filed under Item 7 of this Form.
Form N-CSR Item 11 - Statement Regarding Basis for Approval of Investment Advisory Contract.
Approval of Advisory Agreements
PGIM Quant Solutions Small-Cap Value Fund
The Fund’s Board of Trustees
The Board of Trustees (the “Board”) of PGIM Quant Solutions Small-Cap Value Fund (the “Fund”)1 consists of ten individuals, eight of whom are not “interested persons” of the Fund, as defined in the Investment Company Act of 1940, as amended (the “1940 Act”) (the “Independent Trustees”). The Board is responsible for the oversight of the Fund and its operations, and performs the various duties imposed on the directors of investment companies by the 1940 Act. The Independent Trustees have retained independent legal counsel to assist them in connection with their duties. The Chair of the Board is an Independent Trustee. The Board has established five standing committees: the Audit Committee, the Nominating and Governance Committee, the Compliance Committee and two Investment Committees. Each committee is chaired by, and composed of, Independent Trustees.
Annual Approval of the Fund’s Advisory Agreements
As required under the 1940 Act, the Board determines annually whether to renew the Fund’s management agreement with PGIM Investments LLC (“PGIM Investments”) and the Fund’s subadvisory agreement with PGIM Quantitative Solutions LLC (“PGIM Quantitative Solutions”). In considering the renewal of the agreements, the Board, including all of the Independent Trustees, met on May 28 and June 4-6, 2024 (the “Board Meeting”) and approved the renewal of the agreements through July 31, 2025, after concluding that the renewal of the agreements was in the best interests of the Fund and its shareholders.
In advance of the meetings, the Board requested and received materials relating to the agreements, and had the opportunity to ask questions and request further information in connection with its consideration. Among other things, the Board considered comparative fee information from PGIM Investments and PGIM Quantitative Solutions. Also, the Board considered comparisons with other mutual funds in relevant peer universes and peer groups, as is further discussed below.
In approving the agreements, the Board, including the Independent Trustees advised by independent legal counsel, considered the factors it deemed relevant, including the nature, quality and extent of services provided by PGIM Investments and the subadviser, the performance of the Fund, the profitability of PGIM Investments and its affiliates, expenses and fees, and the potential for economies of scale that may be shared with the Fund and its shareholders as the Fund’s assets grow. In their deliberations, the Trustees did not identify any single factor which alone was responsible for the Board’s decision to approve an
1 PGIM Quant Solutions Small-Cap Value Fund is a series of The Target Portfolio Trust.
PGIM Quant Solutions Small-Cap Value Fund
Approval of Advisory Agreements (continued)
agreement with respect to the Fund. In connection with its deliberations, the Board considered information provided by PGIM Investments throughout the year at regular and special Board meetings, presentations from portfolio managers and other information, as well as information furnished at or in advance of the Board Meeting.
The Trustees determined that the overall arrangements between the Fund and PGIM Investments, which serves as the Fund’s investment manager pursuant to a management agreement, and between PGIM Investments and PGIM Quantitative Solutions, which serves as the Fund’s subadviser pursuant to the terms of a subadvisory agreement with PGIM Investments, are in the best interests of the Fund and its shareholders in light of the services performed, fees charged and such other matters as the Trustees considered relevant in the exercise of their business judgment. The Board considered the approval of the agreements for the Fund as part of its consideration of agreements for multiple funds, but its approvals were made on a fund-by-fund basis.
The material factors and conclusions that formed the basis for the Trustees’ reaching their determinations to approve the continuance of the agreements are separately discussed below.
Nature, Quality and Extent of Services
The Board received and considered information regarding the nature, quality and extent of services provided to the Fund by PGIM Investments and PGIM Quantitative Solutions. The Board noted that PGIM Quantitative Solutions is affiliated with PGIM Investments. The Board considered the services provided by PGIM Investments, including but not limited to the oversight of the subadviser for the Fund, as well as the provision of accounting oversight, fund recordkeeping, compliance and other services to the Fund, such as PGIM Investments’ role as administrator for the Fund’s liquidity risk management program and as valuation designee. With respect to PGIM Investments’ oversight of the subadviser, the Board noted that PGIM Investments’ Strategic Investment Research Group (“SIRG”), which is a business unit of PGIM Investments, is responsible for monitoring and reporting to PGIM Investments’ senior management on the performance and operations of the subadviser. The Board also considered that PGIM Investments pays the salaries of all of the officers and interested Trustees of the Fund who are part of Fund management. The Board also considered the investment subadvisory services provided by PGIM Quantitative Solutions, including investment research and security selection as well as adherence to the Fund’s investment restrictions and compliance with applicable Fund policies and procedures. The Board considered PGIM Investments’ evaluation of the subadviser, as well as PGIM Investments’ recommendation, based on its review of the subadviser, to renew the subadvisory agreement.
Visit our website at pgim.com/investments
The Board considered the qualifications, backgrounds and responsibilities of PGIM Investments’ senior management responsible for the oversight of the Fund and PGIM Quantitative Solutions, and also considered the qualifications, backgrounds and responsibilities of the PGIM Quantitative Solutions portfolio managers who are responsible for the day-to-day management of the Fund’s portfolio. The Board was provided with information pertaining to PGIM Investments’ and PGIM Quantitative Solutions’ organizational structure, senior management, investment operations, and other relevant information pertaining to PGIM Investments and PGIM Quantitative Solutions. The Board also noted that it received favorable compliance reports from the Fund’s Chief Compliance Officer (“CCO”) as to PGIM Investments and PGIM Quantitative Solutions.
The Board concluded that it was satisfied with the nature, extent and quality of the investment management services provided by PGIM Investments and the subadvisory services provided to the Fund by PGIM Quantitative Solutions, and that there was a reasonable basis on which to conclude that the Fund benefits from the services provided by PGIM Investments and PGIM Quantitative Solutions under the management and subadvisory agreements.
Costs of Services and Profits Realized by PGIM Investments
The Board was provided with information on the profitability of PGIM Investments and its affiliates in serving as the Fund’s investment manager. The Board discussed with PGIM Investments the methodology utilized in assembling the information regarding profitability and considered its reasonableness. The Board recognized that it is difficult to make comparisons of profitability from fund management contracts because comparative information is not generally publicly available and is affected by numerous factors, including the structure of the particular adviser, the types of funds it manages, its business mix, numerous assumptions regarding allocations of direct and indirect costs, and the adviser’s capital structure and cost of capital. Taking these factors into account, the Board concluded that the profitability of PGIM Investments and its affiliates in relation to the services rendered was not unreasonable.
Economies of Scale
The Board received and discussed information concerning economies of scale that PGIM Investments may realize as the Fund’s assets grow beyond current levels. The Board noted that the management fee schedule for the Fund includes breakpoints, which have the effect of decreasing the fee rate as assets increase. During the course of time, the Board has considered information regarding the launch date of the Fund, the management fees of the Fund compared to those of similarly managed funds and PGIM Investments’ investment in the Fund over time. The Board noted that economies of scale can be shared
PGIM Quant Solutions Small-Cap Value Fund
Approval of Advisory Agreements (continued)
with the Fund in other ways, including low management fees from inception, additional technological and personnel investments to enhance shareholder services, and maintaining existing expense structures in the face of a rising cost environment. The Board also considered PGIM Investments’ assertion that it continually evaluates the management fee schedule of the Fund and the potential to share economies of scale through breakpoints or fee waivers as asset levels increase.
The Board recognized the inherent limitations of any analysis of economies of scale, stemming largely from the Board’s understanding that most of PGIM Investments’ costs are not specific to individual funds, but rather are incurred across a variety of products and services.
Other Benefits to PGIM Investments and PGIM Quantitative Solutions
The Board considered potential ancillary benefits that might be received by PGIM Investments, PGIM Quantitative Solutions and their affiliates as a result of their relationship with the Fund. The Board concluded that potential benefits to be derived by PGIM Investments included transfer agency fees received by the Fund’s transfer agent (which is affiliated with PGIM Investments), and benefits to its reputation as well as other intangible benefits resulting from PGIM Investments’ association with the Fund. The Board concluded that the potential benefits to be derived by PGIM Quantitative Solutions included its ability to use soft dollar credits, as well as the potential benefits consistent with those generally resulting from an increase in assets under management, specifically, potential access to additional research resources and benefits to its reputation. The Board concluded that the benefits derived by PGIM Investments and PGIM Quantitative Solutions were consistent with the types of benefits generally derived by investment managers and subadvisers to mutual funds.
Performance of the Fund / Fees and Expenses
The Board considered certain additional factors and made related conclusions relating to the historical performance of the Fund for the one-, three-, five- and ten-year periods ended December 31, 2023.
The Board also considered the Fund’s actual management fee, as well as the Fund’s net total expense ratio, for the fiscal year ended July 31, 2023. The Board considered the management fee for the Fund as compared to the management fee charged by PGIM Investments to other funds and the fee charged by other advisers to comparable mutual funds in a peer group. The actual management fee represents the fee rate actually paid by Fund shareholders and includes any fee waivers or reimbursements. The net total expense ratio for the Fund represents the actual expense ratio incurred by Fund shareholders.
Visit our website at pgim.com/investments
The mutual funds included in the peer universe, which was used to consider performance, and the peer group, which was used to consider expenses and fees, were objectively determined by Broadridge, an independent provider of mutual fund data. In certain circumstances, PGIM Investments also provided supplemental peer universe or peer group information for reasons addressed with the Board. The comparisons placed the Fund in various quartiles over various periods, with the first quartile being the best 25% of the mutual funds (for performance, the best performing mutual funds and, for expenses, the lowest cost mutual funds).
The section below summarizes key factors considered by the Board and the Board’s conclusions regarding the Fund’s performance, fees and overall expenses. The table sets forth net performance comparisons (which reflect the impact on performance of fund expenses, or any subsidies, expense caps or waivers that may be applicable) with the peer universe, actual management fees with the peer group (which reflect the impact of any subsidies or fee waivers), and net total expenses with the peer group, each of which were key factors considered by the Board.
| | | | | | | | |
| | | | | |
| Net Performance | | 1 Year | | 3 Years | | 5 Years | | 10 Years |
| | 2nd Quartile | | 2nd Quartile | | 3rd Quartile | | 2nd Quartile |
Actual Management Fees: 1st Quartile |
Net Total Expenses: 1st Quartile |
| | · | The Board noted that the Fund outperformed its benchmark index over all periods. |
| | · | The Board and PGIM Investments agreed to retain the Fund’s existing contractual waiver of up to 0.01% to the extent that the Fund’s annual operating expenses and acquired fund fees and expenses (exclusive of certain fees and expenses) exceed 0.68% through November 30, 2024. |
| | · | The Board and PGIM Investments also agreed to continue the Fund’s existing expense cap, which (exclusive of certain fees and expenses) caps transfer agency, shareholder servicing, sub-transfer agency and blue sky fees to the extent that such fees cause the total annual fund operating expenses to exceed 1.14% for Class R2 shares and 0.89% for Class R4 shares through November 30, 2024. |
| | · | In addition, PGIM Investments will waive management fees or shared operating expenses on any share class to the same extent that it waives such expenses on any other share class and has agreed that total annual fund operating expenses for Class R6 shares will not exceed total annual fund operating expenses for Class Z shares. |
| | · | The Board concluded that, in light of the above, it would be in the best interests of the Fund and its shareholders to renew the agreements. |
| | · | The Board concluded that the management fees (including subadvisory fees) and total expenses were reasonable in light of the services provided. |
* * *
After full consideration of these factors, the Board concluded that approval of the agreements was in the best interests of the Fund and its shareholders.
PGIM Quant Solutions Small-Cap Value Fund

THE TARGET PORTFOLIO TRUST
PGIM Core Bond Fund
PGIM Corporate Bond Fund
FINANCIAL STATEMENTS AND OTHER INFORMATION
JULY 31, 2024

| | | | |
Table of Contents | | Financial Statements and Other Information | | July 31, 2024 |
Form N-CSR Item 7 - Financial Statements and Financial Highlights for Open-End Management Investment Companies.
Other Information - Form N-CSR Items 8-11
Glossary
The following abbreviations are used in the Funds’ descriptions:
EUR—Euro
USD—US Dollar
144A—Security was purchased pursuant to Rule 144A under the Securities Act of 1933 and, pursuant to the requirements of Rule 144A, may not be resold except to qualified institutional buyers.
A—Annual payment frequency for swaps
Aces—Alternative Credit Enhancements Securities
BABs—Build America Bonds
BARC—Barclays Bank PLC
BOA—Bank of America, N.A.
CDX—Credit Derivative Index
CGM—Citigroup Global Markets, Inc.
CLO—Collateralized Loan Obligation
CME—Chicago Mercantile Exchange
CMT—Constant Maturity Treasury
COFI—Cost of Funds Index
DAC—Designated Activity Company
DB—Deutsche Bank AG
ETF—Exchange-Traded Fund
FHLMC—Federal Home Loan Mortgage Corporation
GMTN—Global Medium Term Note
GSI—Goldman Sachs International
IO—Interest Only (Principal amount represents notional)
JPM—JPMorgan Chase Bank N.A.
LP—Limited Partnership
MTN—Medium Term Note
OTC—Over-the-counter
PJSC—Public Joint-Stock Company
PO—Principal Only
Q—Quarterly payment frequency for swaps
REITs—Real Estate Investment Trust
REMIC—Real Estate Mortgage Investment Conduit
SOFR—Secured Overnight Financing Rate
STRIPs—Separate Trading of Registered Interest and Principal of Securities
T—Swap payment upon termination
TBA—To Be Announced
USOIS—United States Overnight Index Swap
1
PGIM Core Bond Fund
Schedule of Investments
as of July 31, 2024
| | | | | | | | | | | | |
| | | | |
| Description | | Interest
Rate | | Maturity
Date | | Principal Amount (000)# | | | Value | |
|
LONG-TERM INVESTMENTS 100.3% | |
|
ASSET-BACKED SECURITIES 20.2% | |
|
Automobiles 4.7% | |
| | | | |
AmeriCredit Automobile Receivables Trust, | | | | | | | | | | | | |
Series 2021-02, Class C | | 1.010% | | 01/19/27 | | | 1,300 | | | $ | 1,245,892 | |
Series 2021-03, Class C | | 1.410 | | 08/18/27 | | | 1,400 | | | | 1,326,566 | |
Series 2023-01, Class C | | 5.800 | | 12/18/28 | | | 2,100 | | | | 2,136,589 | |
Series 2023-02, Class C | | 6.000 | | 07/18/29 | | | 900 | | | | 924,875 | |
Avis Budget Rental Car Funding AESOP LLC, | | | | | | | | | | | | |
Series 2021-01A, Class A, 144A | | 1.380 | | 08/20/27 | | | 3,500 | | | | 3,264,379 | |
Series 2021-02A, Class A, 144A | | 1.660 | | 02/20/28 | | | 3,800 | | | | 3,509,451 | |
Series 2022-01A, Class A, 144A | | 3.830 | | 08/21/28 | | | 4,800 | | | | 4,654,107 | |
Series 2023-02A, Class A, 144A | | 5.200 | | 10/20/27 | | | 1,800 | | | | 1,803,107 | |
Series 2023-08A, Class A, 144A | | 6.020 | | 02/20/30 | | | 2,600 | | | | 2,696,512 | |
Series 2024-01A, Class A, 144A | | 5.360 | | 06/20/30 | | | 1,900 | | | | 1,928,728 | |
Series 2024-03A, Class A, 144A | | 5.230 | | 12/20/30 | | | 2,500 | | | | 2,517,459 | |
BOF VII AL Funding Trust I, | | | | | | | | | | | | |
Series 2023-CAR03, Class A2, 144A | | 6.291 | | 07/26/32 | | | 2,080 | | | | 2,100,169 | |
Series 2023-CAR03, Class B, 144A | | 6.632 | | 07/26/32 | | | 807 | | | | 815,650 | |
CarMax Auto Owner Trust, | | | | | | | | | | | | |
Series 2021-02, Class C | | 1.340 | | 02/16/27 | | | 1,100 | | | | 1,062,259 | |
Series 2021-04, Class C | | 1.380 | | 07/15/27 | | | 800 | | | | 757,448 | |
Series 2022-01, Class C | | 2.200 | | 11/15/27 | | | 1,300 | | | | 1,236,888 | |
Series 2022-01, Class D | | 2.470 | | 07/17/28 | | | 600 | | | | 569,285 | |
Chesapeake Funding II LLC,
Series 2024-01A, Class A1, 144A | | 5.520 | | 05/15/36 | | | 1,427 | | | | 1,434,666 | |
Ford Credit Auto Owner Trust, | | | | | | | | | | | | |
Series 2020-02, Class A, 144A | | 1.060 | | 04/15/33 | | | 1,100 | | | | 1,048,327 | |
Series 2021-01, Class B, 144A | | 1.610 | | 10/17/33 | | | 630 | | | | 593,047 | |
Series 2021-02, Class B, 144A | | 1.910 | | 05/15/34 | | | 600 | | | | 559,686 | |
Series 2023-01, Class A, 144A | | 4.850 | | 08/15/35 | | | 4,200 | | | | 4,219,725 | |
Series 2023-02, Class A, 144A | | 5.280 | | 02/15/36 | | | 2,800 | | | | 2,862,499 | |
Ford Credit Floorplan Master Owner Trust,
Series 2020-02, Class A | | 1.060 | | 09/15/27 | | | 2,800 | | | | 2,677,412 | |
GM Financial Consumer Automobile Receivables Trust, | | | | | | | | | | | | |
Series 2023-04, Class B | | 6.160 | | 04/16/29 | | | 1,100 | | | | 1,138,578 | |
Series 2023-04, Class C | | 6.410 | | 05/16/29 | | | 700 | | | | 726,007 | |
GM Financial Revolving Receivables Trust, | | | | | | | | | | | | |
Series 2021-01, Class B, 144A | | 1.490 | | 06/12/34 | | | 200 | | | | 184,908 | |
Series 2023-02, Class A, 144A | | 5.770 | | 08/11/36 | | | 500 | | | | 521,214 | |
Series 2024-01, Class A, 144A | | 4.980 | | 12/11/36 | | | 2,600 | | | | 2,640,460 | |
See Notes to Financial Statements.
2
PGIM Core Bond Fund
Schedule of Investments (continued)
as of July 31, 2024
| | | | | | | | | | | | |
| | | | |
| Description | | Interest
Rate | | Maturity
Date | | Principal Amount (000)# | | | Value | |
|
ASSET-BACKED SECURITIES (Continued) | |
|
Automobiles (cont’d.) | |
| | | | |
Hertz Vehicle Financing III LLC,
Series 2023-01A, Class A, 144A | | 5.490% | | 06/25/27 | | | 3,800 | | | $ | 3,816,697 | |
Hertz Vehicle Financing III LP,
Series 2021-02A, Class A, 144A | | 1.680 | | 12/27/27 | | | 1,900 | | | | 1,758,529 | |
Hertz Vehicle Financing LLC,
Series 2022-02A, Class A, 144A | | 2.330 | | 06/26/28 | | | 5,500 | | | | 5,086,627 | |
OneMain Direct Auto Receivables Trust, | | | | | | | | | | | | |
Series 2019-01A, Class A, 144A | | 3.630 | | 09/14/27 | | | 2,842 | | | | 2,807,772 | |
Series 2021-01A, Class B, 144A | | 1.260 | | 07/14/28 | | | 2,700 | | | | 2,543,229 | |
Series 2023-01A, Class A, 144A | | 5.410 | | 11/14/29 | | | 4,800 | | | | 4,828,125 | |
Santander Drive Auto Receivables Trust, | | | | | | | | | | | | |
Series 2021-02, Class D | | 1.350 | | 07/15/27 | | | 1,566 | | | | 1,528,902 | |
Series 2022-01, Class C | | 2.560 | | 04/17/28 | | | 1,615 | | | | 1,599,492 | |
Series 2023-01, Class C | | 5.090 | | 05/15/30 | | | 800 | | | | 799,093 | |
Series 2023-03, Class C | | 5.770 | | 11/15/30 | | | 1,500 | | | | 1,524,901 | |
Series 2023-04, Class C | | 6.040 | | 12/15/31 | | | 2,500 | | | | 2,561,223 | |
Series 2023-06, Class B | | 5.980 | | 04/16/29 | | | 1,100 | | | | 1,122,529 | |
Series 2023-06, Class C | | 6.400 | | 03/17/31 | | | 300 | | | | 311,491 | |
Series 2024-02, Class C | | 5.840 | | 06/17/30 | | | 1,000 | | | | 1,020,337 | |
SFS Auto Receivables Securitization Trust, | | | | | | | | | | | | |
Series 2023-01A, Class B, 144A | | 5.710 | | 01/22/30 | | | 300 | | | | 305,210 | |
Series 2023-01A, Class C, 144A | | 5.970 | | 02/20/31 | | | 500 | | | | 512,534 | |
Toyota Auto Loan Extended Note Trust,
Series 2020-01A, Class A, 144A | | 1.350 | | 05/25/33 | | | 1,000 | | | | 968,802 | |
Wheels Fleet Lease Funding LLC, | | | | | | | | | | | | |
Series 2023-01A, Class A, 144A | | 5.800 | | 04/18/38 | | | 3,951 | | | | 3,956,333 | |
Series 2024-01A, Class A1, 144A | | 5.490 | | 02/18/39 | | | 3,000 | | | | 3,023,314 | |
World Omni Select Auto Trust,
Series 2021-A, Class C | | 1.090 | | 11/15/27 | | | 600 | | | | 574,380 | |
| | | | | | | | | | | | |
| | | | |
| | | | | | | | | | | 91,805,413 | |
|
Collateralized Loan Obligations 13.7% | |
| | | | |
AGL CLO Ltd. (Cayman Islands),
Series 2021-14A, Class A, 144A, 3 Month SOFR + 1.412% (Cap N/A, Floor 1.150%) | | 6.694(c) | | 12/02/34 | | | 5,250 | | | | 5,251,531 | |
Anchorage Capital CLO Ltd. (Cayman Islands),
Series 2019-11A, Class AR2, 144A, 3 Month SOFR + 1.530% (Cap N/A, Floor 1.530%) | | 6.873(c) | | 07/22/37 | | | 10,000 | | | | 10,013,596 | |
See Notes to Financial Statements.
PGIM Core Bond Fund 3
PGIM Core Bond Fund
Schedule of Investments (continued)
as of July 31, 2024
| | | | | | | | | | | | |
| | | | |
| Description | | Interest
Rate | | Maturity
Date | | Principal Amount (000)# | | | Value | |
|
ASSET-BACKED SECURITIES (Continued) | |
|
Collateralized Loan Obligations (cont’d.) | |
| | | | |
Anchorage Capital CLO Ltd. (Cayman Islands), (cont’d.) | | | | | | | | | | | | |
Series 2021-17A, Class A1, 144A, 3 Month SOFR + 1.432% (Cap N/A, Floor 1.170%) | | 6.733%(c) | | 07/15/34 | | | 6,500 | | | $ | 6,504,149 | |
Apidos CLO Ltd. (United Kingdom),
Series 2023-44A, Class A1, 144A, 3 Month SOFR + 2.000% (Cap N/A, Floor 2.000%) | | 7.279(c) | | 04/26/35 | | | 7,500 | | | | 7,526,268 | |
Bain Capital Credit CLO Ltd. (Cayman Islands),
Series 2019-03A, Class AR, 144A, 3 Month SOFR + 1.422% (Cap N/A, Floor 1.422%) | | 6.704(c) | | 10/21/34 | | | 6,500 | | | | 6,506,126 | |
Balboa Bay Loan Funding Ltd. (Cayman Islands),
Series 2020-01A, Class AR, 144A, 3 Month SOFR + 1.382% (Cap N/A, Floor 1.120%) | | 6.664(c) | | 01/20/32 | | | 4,950 | | | | 4,953,665 | |
Series 2021-01A, Class A, 144A, 3 Month SOFR + 1.462% (Cap N/A, Floor 1.462%) | | 6.744(c) | | 07/20/34 | | | 3,100 | | | | 3,105,119 | |
Barings CLO Ltd. (Cayman Islands),
Series LP-02A, Class A, 144A, 3 Month SOFR + 1.362% (Cap N/A, Floor 1.100%) | | 6.644(c) | | 01/20/34 | | | 11,750 | | | | 11,761,121 | |
Battalion CLO Ltd. (Cayman Islands),
Series 2015-08A, Class A1R2, 144A, 3 Month SOFR + 1.332% (Cap N/A, Floor 1.070%) | | 6.611(c) | | 07/18/30 | | | 503 | | | | 503,933 | |
Series 2015-09A, Class AR, 144A, 3 Month SOFR + 1.362% (Cap N/A, Floor 1.100%) | | 6.663(c) | | 07/15/31 | | | 4,264 | | | | 4,273,061 | |
Series 2016-10A, Class A1R2, 144A, 3 Month SOFR + 1.432% (Cap N/A, Floor 1.170%) | | 6.715(c) | | 01/25/35 | | | 400 | | | | 400,377 | |
Series 2017-11A, Class AR, 144A, 3 Month SOFR + 1.412% (Cap N/A, Floor 1.150%) | | 6.695(c) | | 04/24/34 | | | 5,500 | | | | 5,506,771 | |
Series 2019-16A, Class AR, 144A, 3 Month SOFR + 1.382% (Cap N/A, Floor 1.120%) | | 6.664(c) | | 12/19/32 | | | 3,250 | | | | 3,257,996 | |
Carlyle US CLO Ltd. (Cayman Islands),
Series 2021-05A, Class A1, 144A, 3 Month SOFR + 1.382% (Cap N/A, Floor 1.120%) | | 6.664(c) | | 07/20/34 | | | 7,000 | | | | 7,018,714 | |
CBAM Ltd. (Cayman Islands),
Series 2020-12A, Class AR, 144A, 3 Month SOFR + 1.442% (Cap N/A, Floor 1.442%) | | 6.724(c) | | 07/20/34 | | | 8,500 | | | | 8,520,116 | |
CIFC Funding Ltd. (Cayman Islands),
Series 2021-05A, Class A, 144A, 3 Month SOFR + 1.402% (Cap N/A, Floor 1.402%) | | 6.703(c) | | 07/15/34 | | | 2,000 | | | | 2,004,385 | |
Clover CLO Ltd. (Cayman Islands),
Series 2019-02A, Class AR, 144A, 3 Month SOFR + 1.362% (Cap N/A, Floor 1.362%) | | 6.646(c) | | 10/25/33 | | | 11,000 | | | | 11,008,216 | |
See Notes to Financial Statements.
4
PGIM Core Bond Fund
Schedule of Investments (continued)
as of July 31, 2024
| | | | | | | | | | | | |
| | | | |
| Description | | Interest
Rate | | Maturity
Date | | Principal Amount (000)# | | | Value | |
|
ASSET-BACKED SECURITIES (Continued) | |
|
Collateralized Loan Obligations (cont’d.) | |
| | | | |
Crown Point CLO Ltd. (Cayman Islands),
Series 2021-11A, Class A, 144A, 3 Month SOFR + 1.382% (Cap N/A, Floor 1.120%) | | 6.667%(c) | | 01/17/34 | | | 5,500 | | | $ | 5,503,013 | |
Elevation CLO Ltd. (Cayman Islands),
Series 2021-12A, Class A1R, 144A, 3 Month SOFR + 1.620% (Cap N/A, Floor 1.620%) | | 6.902(c) | | 04/20/37 | | | 10,000 | | | | 10,055,220 | |
Series 2021-13A, Class A1, 144A, 3 Month SOFR + 1.452% (Cap N/A, Floor 1.190%) | | 6.753(c) | | 07/15/34 | | | 3,500 | | | | 3,501,594 | |
Elmwood CLO Ltd. (Cayman Islands),
Series 2019-02A, Class AR, 144A, 3 Month SOFR + 1.412% (Cap N/A, Floor 1.412%) | | 6.694(c) | | 04/20/34 | | | 7,000 | | | | 7,005,928 | |
Generate CLO Ltd. (Cayman Islands),
Series 02A, Class AR, 144A, 3 Month SOFR + 1.412% (Cap N/A, Floor 1.150%) | | 6.694(c) | | 01/22/31 | | | 269 | | | | 269,178 | |
Greywolf CLO Ltd. (Cayman Islands),
Series 2018-01A, Class A1, 144A, 3 Month SOFR + 1.290% (Cap N/A, Floor 0.000%) | | 6.569(c) | | 04/26/31 | | | 584 | | | | 584,491 | |
Series 2020-03RA, Class A1R, 144A, 3 Month SOFR + 1.550% (Cap N/A, Floor 1.290%) | | 6.832(c) | | 04/15/33 | | | 6,500 | | | | 6,520,204 | |
HPS Loan Management Ltd. (Cayman Islands),
Series 2015-06A, Class A1R, 144A, 3 Month SOFR + 1.262% (Cap N/A, Floor 0.000%) | | 6.598(c) | | 02/05/31 | | | 109 | | | | 108,760 | |
Series 2016-10A, Class A1RR, 144A, 3 Month SOFR + 1.402% (Cap N/A, Floor 1.140%) | | 6.684(c) | | 04/20/34 | | | 7,375 | | | | 7,383,186 | |
ICG US CLO Ltd. (Cayman Islands),
Series 2015-02RA, Class A1, 144A, 3 Month SOFR + 1.632% (Cap N/A, Floor 1.370%) | | 6.918(c) | | 01/16/33 | | | 1,375 | | | | 1,376,233 | |
Series 2020-01A, Class AR, 144A, 3 Month SOFR + 1.462% (Cap N/A, Floor 1.200%) | | 6.744(c) | | 01/20/35 | | | 9,000 | | | | 9,022,391 | |
KKR CLO Ltd. (Cayman Islands),
Series 11, Class AR, 144A, 3 Month SOFR + 1.442% (Cap N/A, Floor 1.442%) | | 6.743(c) | | 01/15/31 | | | 299 | | | | 298,716 | |
Madison Park Funding Ltd. (Cayman Islands),
Series 2015-18A, Class ARR, 144A, 3 Month SOFR + 1.202% (Cap N/A, Floor 0.940%) | | 6.484(c) | | 10/21/30 | | | 9,848 | | | | 9,857,722 | |
MidOcean Credit CLO (Cayman Islands),
Series 2014-03A, Class A1R, 144A, 3 Month SOFR + 1.382% (Cap N/A, Floor 1.120%) | | 6.664(c) | | 04/21/31 | | | 340 | | | | 340,544 | |
Series 2018-09A, Class A1, 144A, 3 Month SOFR + 1.412% (Cap N/A, Floor 1.150%) | | 6.694(c) | | 07/20/31 | | | 582 | | | | 582,159 | |
See Notes to Financial Statements.
PGIM Core Bond Fund 5
PGIM Core Bond Fund
Schedule of Investments (continued)
as of July 31, 2024
| | | | | | | | | | | | |
| | | | |
| Description | | Interest
Rate | | Maturity
Date | | Principal Amount (000)# | | | Value | |
|
ASSET-BACKED SECURITIES (Continued) | |
|
Collateralized Loan Obligations (cont’d.) | |
| | | | |
Mountain View CLO Ltd. (Cayman Islands),
Series 2015-09A, Class A1R, 144A, 3 Month SOFR + 1.382% (Cap N/A, Floor 0.000%) | | 6.683%(c) | | 07/15/31 | | | 1,545 | | | $ | 1,545,303 | |
Northwoods Capital Ltd. (Cayman Islands),
Series 2017-15A, Class A1R, 144A, 3 Month SOFR + 1.472% (Cap N/A, Floor 1.472%) | | 6.815(c) | | 06/20/34 | | | 9,750 | | | | 9,757,313 | |
Series 2019-20A, Class A1R, 144A, 3 Month SOFR + 1.592% (Cap N/A, Floor 1.330%) | | 6.876(c) | | 01/25/32 | | | 2,157 | | | | 2,160,252 | |
Oaktree CLO Ltd. (Cayman Islands),
Series 2020-01A, Class AR, 144A, 3 Month SOFR + 1.412% (Cap N/A, Floor 1.150%) | | 6.713(c) | | 07/15/34 | | | 5,000 | | | | 5,007,354 | |
Ocean Trails CLO (Cayman Islands),
Series 2014-05A, Class ARR, 144A, 3 Month SOFR + 1.542% (Cap N/A, Floor 1.280%) | | 6.843(c) | | 10/13/31 | | | 5,033 | | | | 5,037,015 | |
OCP CLO Ltd. (Cayman Islands),
Series 2015-09A, Class A1R2, 144A, 3 Month SOFR + 1.250% (Cap N/A, Floor 1.250%) | | 6.551(c) | | 01/15/33 | | | 3,500 | | | | 3,506,300 | |
OZLM Ltd. (Cayman Islands),
Series 2015-11A, Class A1R, 144A, 3 Month SOFR + 1.512% (Cap N/A, Floor 0.000%) | | 6.767(c) | | 10/30/30 | | | 26 | | | | 26,001 | |
Palmer Square CLO Ltd. (Cayman Islands),
Series 2014-01A, Class A1R2, 144A, 3 Month SOFR + 1.392% (Cap N/A, Floor 1.130%) | | 6.677(c) | | 01/17/31 | | | 170 | | | | 170,023 | |
Series 2015-01A, Class A1A4, 144A, 3 Month SOFR + 1.392% (Cap N/A, Floor 1.392%) | | 6.717(c) | | 05/21/34 | | | 7,000 | | | | 7,002,367 | |
Regatta Funding Ltd. (Cayman Islands),
Series 2016-01A, Class A1R2, 144A, 3 Month SOFR + 1.412% (Cap N/A, Floor 1.150%) | | 6.755(c) | | 06/20/34 | | | 6,500 | | | | 6,506,322 | |
Series 2016-01A, Class AR2, 144A, 3 Month SOFR + 1.422% (Cap N/A, Floor 1.160%) | | 6.704(c) | | 04/20/34 | | | 9,750 | | | | 9,769,666 | |
Romark WM-R Ltd. (Cayman Islands),
Series 2018-01A, Class A1, 144A, 3 Month SOFR + 1.292% (Cap N/A, Floor 0.000%) | | 6.574(c) | | 04/20/31 | | | 672 | | | | 672,340 | |
Sixth Street CLO Ltd. (Cayman Islands),
Series 2020-16A, Class A1R, 144A, 3 Month SOFR + 1.790% (Cap N/A, Floor 1.790%) | | 7.072(c) | | 01/20/37 | | | 4,750 | | | | 4,775,875 | |
Sound Point CLO Ltd. (Cayman Islands),
Series 2013-01A, Class A1R, 144A, 3 Month SOFR + 1.332% (Cap N/A, Floor 1.332%) | | 6.611(c) | | 01/26/31 | | | 545 | | | | 545,273 | |
See Notes to Financial Statements.
6
PGIM Core Bond Fund
Schedule of Investments (continued)
as of July 31, 2024
| | | | | | | | | | | | |
| | | | |
| Description | | Interest
Rate | | Maturity
Date | | Principal Amount (000)# | | | Value | |
|
ASSET-BACKED SECURITIES (Continued) | |
|
Collateralized Loan Obligations (cont’d.) | |
| | | | |
Sound Point CLO Ltd. (Cayman Islands), (cont’d.) | | | | | | | | | | | | |
Series 2019-01A, Class AR, 144A, 3 Month SOFR + 1.342% (Cap N/A, Floor 1.080%) | | 6.624%(c) | | 01/20/32 | | | 1,134 | | | $ | 1,136,316 | |
Series 2019-02A, Class AR, 144A, 3 Month SOFR + 1.432% (Cap N/A, Floor 1.170%) | | 6.733(c) | | 07/15/34 | | | 2,200 | | | | 2,201,066 | |
Symphony CLO Ltd. (Cayman Islands),
Series 2016-18A, Class A1RR, 144A, 3 Month SOFR + 1.362% (Cap N/A, Floor 1.100%) | | 6.645(c) | | 07/23/33 | | | 4,250 | | | | 4,260,416 | |
Telos CLO Ltd. (Cayman Islands),
Series 2013-04A, Class AR, 144A, 3 Month SOFR + 1.502% (Cap N/A, Floor 0.000%) | | 6.787(c) | | 01/17/30 | | | 217 | | | | 217,768 | |
THL Credit Wind River CLO Ltd. (Cayman Islands),
Series 2020-01A, Class A1R, 144A, 3 Month SOFR + 1.570% (Cap N/A, Floor 1.570%) | | 6.852(c) | | 07/20/37 | | | 12,000 | | | | 12,064,531 | |
Tikehau US CLO Ltd. (Bermuda),
Series 2022-02A, Class A1R, 144A, 3 Month SOFR + 1.870% (Cap N/A, Floor 1.870%) | | 7.152(c) | | 01/20/36 | | | 10,500 | | | | 10,509,505 | |
Series 2023-01A, Class A1, 144A, 3 Month SOFR + 2.200% (Cap N/A, Floor 2.200%) | | 7.501(c) | | 07/15/34 | | | 5,500 | | | | 5,548,519 | |
Trimaran Cavu Ltd.,
Series 2019-01A, Class A1, 144A, 3 Month SOFR + 1.722% (Cap N/A, Floor 1.460%) | | 7.004(c) | | 07/20/32 | | | 1,250 | | | | 1,251,346 | |
Voya CLO Ltd. (Cayman Islands),
Series 2013-01A, Class A1AR, 144A, 3 Month SOFR + 1.472% (Cap N/A, Floor 0.000%) | | 6.773(c) | | 10/15/30 | | | 289 | | | | 290,071 | |
Series 2016-01A, Class A1R, 144A, 3 Month SOFR + 1.332% (Cap N/A, Floor 1.070%) | | 6.614(c) | | 01/20/31 | | | 501 | | | | 501,880 | |
Wellfleet CLO Ltd. (Cayman Islands),
Series 2018-01A, Class A, 144A, 3 Month SOFR + 1.362% (Cap N/A, Floor 1.100%) | | 6.647(c) | | 07/17/31 | | | 1,271 | | | | 1,274,273 | |
Series 2020-01A, Class A1AR, 144A, 3 Month SOFR + 1.200% (Cap N/A, Floor 1.200%) | | 6.501(c) | | 04/15/33 | | | 11,000 | | | | 11,000,470 | |
Zais CLO Ltd. (Cayman Islands),
Series 2017-02A, Class A, 144A, 3 Month SOFR + 1.552% (Cap N/A, Floor 0.000%) | | 6.853(c) | | 04/15/30 | | | 45 | | | | 45,295 | |
| | | | | | | | | | | | |
| | | | |
| | | | | | | | | | | 267,307,343 | |
See Notes to Financial Statements.
PGIM Core Bond Fund 7
PGIM Core Bond Fund
Schedule of Investments (continued)
as of July 31, 2024
| | | | | | | | | | | | |
| | | | |
| Description | | Interest
Rate | | Maturity
Date | | Principal Amount (000)# | | | Value | |
|
ASSET-BACKED SECURITIES (Continued) | |
|
Consumer Loans 1.0% | |
| | | | |
Affirm Asset Securitization Trust,
Series 2024-A, Class 1A, 144A | | 5.610% | | 02/15/29 | | | 6,300 | | | $ | 6,327,275 | |
GreenSky Home Improvement Trust,
Series 2024-01, Class A2, 144A | | 5.880 | | 07/25/59 | | | 1,100 | | | | 1,100,219 | |
OneMain Financial Issuance Trust,
Series 2020-02A, Class A, 144A | | 1.750 | | 09/14/35 | | | 2,600 | | | | 2,456,018 | |
Series 2021-01A, Class A2, 144A, 30 Day Average SOFR + 0.760% (Cap N/A, Floor 0.000%) | | 6.097(c) | | 06/16/36 | | | 2,800 | | | | 2,797,501 | |
Series 2022-02A, Class A, 144A | | 4.890 | | 10/14/34 | | | 2,360 | | | | 2,347,594 | |
Series 2023-02A, Class A1, 144A | | 5.840 | | 09/15/36 | | | 5,300 | | | | 5,411,320 | |
| | | | | | | | | | | | |
| | | | |
| | | | | | | | | | | 20,439,927 | |
|
Credit Cards 0.1% | |
| | | | |
Citibank Credit Card Issuance Trust,
Series 2018-A07, Class A7 | | 3.960 | | 10/13/30 | | | 2,100 | | | | 2,058,644 | |
|
Equipment 0.1% | |
| | | | |
MMAF Equipment Finance LLC,
Series 2017-B, Class A5, 144A | | 2.720 | | 06/15/40 | | | 259 | | | | 255,921 | |
Series 2019-A, Class A5, 144A | | 3.080 | | 11/12/41 | | | 416 | | | | 410,453 | |
Series 2019-B, Class A5, 144A | | 2.290 | | 11/12/41 | | | 1,200 | | | | 1,143,236 | |
| | | | | | | | | | | | |
| | | | |
| | | | | | | | | | | 1,809,610 | |
|
Home Equity Loans 0.3% | |
| | | | |
RCKT Mortgage Trust,
Series 2024-CES03, Class A1A, 144A | | 6.591(cc) | | 05/25/44 | | | 970 | | | | 983,596 | |
Towd Point HE Trust,
Series 2023-01, Class A1A, 144A | | 6.875 | | 02/25/63 | | | 346 | | | | 346,204 | |
Towd Point Mortgage Trust,
Series 2023-CES02, Class A1A, 144A | | 7.294(cc) | | 10/25/63 | | | 1,217 | | | | 1,240,767 | |
Series 2024-CES01, Class A1A, 144A | | 5.848(cc) | | 01/25/64 | | | 274 | | | | 274,071 | |
Series 2024-CES03, Class A1, 144A | | 6.290(cc) | | 05/25/64 | | | 2,641 | | | | 2,659,499 | |
| | | | | | | | | | | | |
| | | | |
| | | | | | | | | | | 5,504,137 | |
|
Other 0.0% | |
| | | | |
Home Partners of America Trust,
Series 2021-03, Class A, 144A | | 2.200 | | 01/17/41 | | | 1,096 | | | | 978,120 | |
See Notes to Financial Statements.
8
PGIM Core Bond Fund
Schedule of Investments (continued)
as of July 31, 2024
| | | | | | | | | | | | | | | | |
| | | | |
| Description | | Interest
Rate | | | Maturity
Date | | | Principal Amount (000)# | | | Value | |
|
ASSET-BACKED SECURITIES (Continued) | |
|
Student Loans 0.3% | |
| | | | |
Commonbond Student Loan Trust, | | | | | | | | | | | | | | | | |
Series 2017-BGS, Class A1, 144A | | | 2.680% | | | | 09/25/42 | | | | 148 | | | $ | 135,744 | |
Series 2018-AGS, Class A1, 144A | | | 3.210 | | | | 02/25/44 | | | | 112 | | | | 104,267 | |
Series 2020-AGS, Class A, 144A | | | 1.980 | | | | 08/25/50 | | | | 503 | | | | 445,933 | |
ELFI Graduate Loan Program LLC, | | | | | | | | | | | | | | | | |
Series 2020-A, Class A, 144A | | | 1.730 | | | | 08/25/45 | | | | 845 | | | | 754,409 | |
Laurel Road Prime Student Loan Trust, | | | | | | | | | | | | | | | | |
Series 2019-A, Class A2FX, 144A | | | 2.730 | | | | 10/25/48 | | | | 36 | | | | 35,140 | |
Navient Private Education Refi Loan Trust, | | | | | | | | | | | | | | | | |
Series 2018-CA, Class A2, 144A | | | 3.520 | | | | 06/16/42 | | | | 4 | | | | 4,472 | |
Series 2019-CA, Class A2, 144A | | | 3.130 | | | | 02/15/68 | | | | 181 | | | | 176,042 | |
Series 2020-BA, Class A2, 144A | | | 2.120 | | | | 01/15/69 | | | | 413 | | | | 386,839 | |
Series 2020-DA, Class A, 144A | | | 1.690 | | | | 05/15/69 | | | | 305 | | | | 283,357 | |
Pennsylvania Higher Education Assistance Agency, | | | | | | | | | | | | | | | | |
Series 2021-01A, Class A, 144A, 30 Day Average SOFR + 0.644%
(Cap N/A, Floor 0.530%) | | | 5.992(c) | | | | 05/25/70 | | | | 1,198 | | | | 1,187,949 | |
SoFi Professional Loan Program LLC, | | | | | | | | | | | | | | | | |
Series 2017-F, Class A2FX, 144A | | | 2.840 | | | | 01/25/41 | | | | 131 | | | | 128,417 | |
Series 2019-A, Class A2FX, 144A | | | 3.690 | | | | 06/15/48 | | | | 279 | | | | 272,531 | |
Series 2019-C, Class A2FX, 144A | | | 2.370 | | | | 11/16/48 | | | | 355 | | | | 336,468 | |
SoFi Professional Loan Program Trust, | | | | | | | | | | | | | | | | |
Series 2018-B, Class A2FX, 144A | | | 3.340 | | | | 08/25/47 | | | | 105 | | | | 103,467 | |
Series 2020-A, Class A2FX, 144A | | | 2.540 | | | | 05/15/46 | | | | 661 | | | | 621,624 | |
Series 2020-C, Class AFX, 144A | | | 1.950 | | | | 02/15/46 | | | | 360 | | | | 332,291 | |
| | | | | | | | | | | | | | | | |
| | | | |
| | | | | | | | | | | | | | | 5,308,950 | |
| | | | | | | | | | | | | | | | |
| | | | |
TOTAL ASSET-BACKED SECURITIES
(cost $396,080,253) | | | | | | | | | | | | | | | 395,212,144 | |
| | | | | | | | | | | | | | | | |
| | | | |
COMMERCIAL MORTGAGE-BACKED SECURITIES 13.8% | | | | | | | | | | | | | | | | |
Arbor Multifamily Mortgage Securities Trust, | | | | | | | | | | | | | | | | |
Series 2020-MF01, Class A4, 144A | | | 2.495 | | | | 05/15/53 | | | | 5,500 | | | | 4,884,128 | |
Series 2021-MF02, Class A4, 144A | | | 2.252 | | | | 06/15/54 | | | | 8,900 | | | | 7,565,675 | |
Assurant Commercial Mortgage Trust, | | | | | | | | | | | | | | | | |
Series 2016-01A, Class AS, 144A | | | 3.172 | | | | 05/15/49 | | | | 110 | | | | 108,303 | |
BANK, | | | | | | | | | | | | | | | | |
Series 2019-BN17, Class A3 | | | 3.456 | | | | 04/15/52 | | | | 4,116 | | | | 3,892,548 | |
Series 2019-BN20, Class A2 | | | 2.758 | | | | 09/15/62 | | | | 5,531 | | | | 5,025,137 | |
Series 2019-BN23, Class A2 | | | 2.669 | | | | 12/15/52 | | | | 2,198 | | | | 1,969,707 | |
See Notes to Financial Statements.
PGIM Core Bond Fund 9
PGIM Core Bond Fund
Schedule of Investments (continued)
as of July 31, 2024
| | | | | | | | | | | | |
| | | | |
| Description | | Interest
Rate | | Maturity
Date | | Principal Amount (000)# | | | Value | |
|
COMMERCIAL MORTGAGE-BACKED SECURITIES (Continued) | |
| | | | |
BANK, (cont’d.) | | | | | | | | | | | | |
Series 2020-BN25, Class A4 | | 2.399% | | 01/15/63 | | | 4,300 | | | $ | 3,827,533 | |
Series 2020-BN26, Class A3 | | 2.155 | | 03/15/63 | | | 5,000 | | | | 4,321,110 | |
Series 2020-BN27, Class A4 | | 1.901 | | 04/15/63 | | | 4,700 | | | | 3,912,669 | |
Series 2020-BN29, Class A3 | | 1.742 | | 11/15/53 | | | 2,600 | | | | 2,123,154 | |
Series 2021-BN32, Class A4 | | 2.349 | | 04/15/54 | | | 9,000 | | | | 7,807,719 | |
Series 2021-BN34, Class A4 | | 2.156 | | 06/15/63 | | | 7,000 | | | | 5,772,602 | |
Series 2021-BN38, Class A4 | | 2.275 | | 12/15/64 | | | 5,700 | | | | 4,775,736 | |
BANK5, | | | | | | | | | | | | |
Series 2024-5YR7, Class A3 | | 5.769 | | 06/15/57 | | | 6,250 | | | | 6,440,279 | |
Barclays Commercial Mortgage Securities Trust,
Series 2016-ETC, Class A, 144A | | 2.937 | | 08/14/36 | | | 500 | | | | 464,559 | |
Series 2018-TALL, Class A, 144A, 1 Month SOFR + 0.919%
(Cap N/A, Floor 0.872%) | | 6.248(c) | | 03/15/37 | | | 6,000 | | | | 5,640,000 | |
Series 2020-C07, Class A4 | | 1.786 | | 04/15/53 | | | 5,700 | | | | 4,847,708 | |
Series 2021-C10, Class ASB | | 2.268 | | 07/15/54 | | | 5,275 | | | | 4,764,159 | |
Series 2023-C21, Class A2 | | 6.296(cc) | | 09/15/56 | | | 3,500 | | | | 3,664,670 | |
Series 2023-C22, Class A2 | | 6.728 | | 11/15/56 | | | 5,600 | | | | 5,929,937 | |
Benchmark Mortgage Trust, | | | | | | | | | | | | |
Series 2018-B01, Class A4 | | 3.402 | | 01/15/51 | | | 681 | | | | 658,323 | |
Series 2018-B03, Class A4 | | 3.761 | | 04/10/51 | | | 1,150 | | | | 1,110,232 | |
Series 2019-B10, Class A3 | | 3.455 | | 03/15/62 | | | 2,492 | | | | 2,342,553 | |
Series 2020-B17, Class A4 | | 2.042 | | 03/15/53 | | | 1,800 | | | | 1,524,344 | |
Series 2020-B21, Class A4 | | 1.704 | | 12/17/53 | | | 2,600 | | | | 2,195,014 | |
Series 2020-IG03, Class A2, 144A | | 2.475 | | 09/15/48 | | | 5,059 | | | | 4,952,211 | |
Series 2021-B24, Class A3 | | 2.010 | | 03/15/54 | | | 2,600 | | | | 2,278,031 | |
Series 2021-B31, Class A4 | | 2.420 | | 12/15/54 | | | 6,400 | | | | 5,407,380 | |
Series 2023-B38, Class A2 | | 5.626 | | 04/15/56 | | | 6,000 | | | | 6,014,117 | |
Series 2023-B39, Class A2 | | 6.574(cc) | | 07/15/56 | | | 7,000 | | | | 7,272,822 | |
Series 2023-V03, Class A3 | | 6.363(cc) | | 07/15/56 | | | 7,000 | | | | 7,306,554 | |
BMARK, | | | | | | | | | | | | |
Series 2023-V04, Class A3 | | 6.841(cc) | | 11/15/56 | | | 7,000 | | | | 7,447,983 | |
BMO Mortgage Trust, | | | | | | | | | | | | |
Series 2023-05C01, Class A3 | | 6.534(cc) | | 08/15/56 | | | 7,200 | | | | 7,558,970 | |
Series 2023-05C02, Class A3 | | 7.055(cc) | | 11/15/56 | | | 9,000 | | | | 9,704,425 | |
Cantor Commercial Real Estate Lending,
Series 2019-CF03, Class A3 | | 2.752 | | 01/15/53 | | | 2,900 | | | | 2,567,701 | |
CD Mortgage Trust, | | | | | | | | | | | | |
Series 2016-CD01, Class A3 | | 2.459 | | 08/10/49 | | | 692 | | | | 654,005 | |
Series 2019-CD08, Class A3 | | 2.657 | | 08/15/57 | | | 2,700 | | | | 2,439,998 | |
CF Mortgage Trust, | | | | | | | | | | | | |
Series 2020-P01, Class A1, 144A | | 2.840(cc) | | 04/15/25 | | | 2,809 | | | | 2,737,396 | |
See Notes to Financial Statements.
10
PGIM Core Bond Fund
Schedule of Investments (continued)
as of July 31, 2024
| | | | | | | | | | | | |
| | | | |
| Description | | Interest
Rate | | Maturity
Date | | Principal Amount (000)# | | | Value | |
|
COMMERCIAL MORTGAGE-BACKED SECURITIES (Continued) | |
| | | | |
CFCRE Commercial Mortgage Trust, | | | | | | | | | | | | |
Series 2016-C07, Class A2 | | 3.585% | | 12/10/54 | | | 1,760 | | | $ | 1,684,267 | |
Citigroup Commercial Mortgage Trust, | | | | | | | | | | | | |
Series 2015-GC27, Class A4 | | 2.878 | | 02/10/48 | | | 1,132 | | | | 1,129,251 | |
Series 2015-GC31, Class A4 | | 3.762 | | 06/10/48 | | | 2,625 | | | | 2,563,060 | |
Series 2016-C03, Class A3 | | 2.896 | | 11/15/49 | | | 703 | | | | 670,594 | |
Series 2016-P03, Class A3 | | 3.063 | | 04/15/49 | | | 7,305 | | | | 7,107,378 | |
Series 2017-P08, Class A3 | | 3.203 | | 09/15/50 | | | 1,700 | | | | 1,623,762 | |
Series 2019-C07, Class A3 | | 2.860 | | 12/15/72 | | | 1,120 | | | | 1,017,642 | |
Series 2019-GC41, Class A4 | | 2.620 | | 08/10/56 | | | 3,000 | | | | 2,699,178 | |
Commercial Mortgage Trust, | | | | | | | | | | | | |
Series 2015-DC01, Class A5 | | 3.350 | | 02/10/48 | | | 5,140 | | | | 5,079,381 | |
Series 2015-PC01, Class A4 | | 3.620 | | 07/10/50 | | | 824 | | | | 817,958 | |
Series 2016-COR01, Class A3 | | 2.826 | | 10/10/49 | | | 792 | | | | 753,419 | |
CSAIL Commercial Mortgage Trust, | | | | | | | | | | | | |
Series 2017-C08, Class A3 | | 3.127 | | 06/15/50 | | | 1,084 | | | | 1,021,084 | |
Series 2021-C20, Class A2 | | 2.486 | | 03/15/54 | | | 5,474 | | | | 4,817,012 | |
Deutsche Bank Commercial Mortgage Trust, | | | | | | | | | | | | |
Series 2016-C03, Class A4 | | 2.632 | | 08/10/49 | | | 461 | | | | 441,559 | |
Series 2020-C09, Class A4 | | 1.644 | | 08/15/53 | | | 5,800 | | | | 4,920,268 | |
Fannie Mae-Aces, | | | | | | | | | | | | |
Series 2019-M21, Class 3A1 | | 2.100 | | 06/25/34 | | | 1,431 | | | | 1,362,805 | |
FHLMC Multifamily Structured Pass-Through Certificates, | | | | | | | | | | | | |
Series KW08, Class A2 | | 3.600 | | 01/25/29 | | | 4,500 | | | | 4,342,970 | |
GS Mortgage Securities Trust, | | | | | | | | | | | | |
Series 2015-GC30, Class A3 | | 3.119 | | 05/10/50 | | | 942 | | | | 926,062 | |
Series 2015-GC34, Class A3 | | 3.244 | | 10/10/48 | | | 3,918 | | | | 3,830,356 | |
Series 2021-GSA03, Class A4 | | 2.369 | | 12/15/54 | | | 7,000 | | | | 5,838,127 | |
JPMBB Commercial Mortgage Securities Trust, | | | | | | | | | | | | |
Series 2015-C27, Class A3A1 | | 2.920 | | 02/15/48 | | | 865 | | | | 854,049 | |
JPMCC Commercial Mortgage Securities Trust, | | | | | | | | | | | | |
Series 2017-JP05, Class A4 | | 3.457 | | 03/15/50 | | | 284 | | | | 270,799 | |
JPMDB Commercial Mortgage Securities Trust, | | | | | | | | | | | | |
Series 2017-C05, Class A4 | | 3.414 | | 03/15/50 | | | 936 | | | | 892,698 | |
JPMorgan Chase Commercial Mortgage Securities Trust, | | | | | | | | | | | | |
Series 2016-JP02, Class A3 | | 2.559 | | 08/15/49 | | | 613 | | | | 588,800 | |
Series 2016-JP03, Class A4 | | 2.627 | | 08/15/49 | | | 2,411 | | | | 2,305,430 | |
Ladder Capital Commercial Mortgage Securities Trust, | | | | | | | | | | | | |
Series 2017-LC26, Class A3, 144A | | 3.289 | | 07/12/50 | | | 1,188 | | | | 1,129,062 | |
Morgan Stanley Bank of America Merrill Lynch Trust, | | | | | | | | | | | | |
Series 2015-C23, Class A3 | | 3.451 | | 07/15/50 | | | 3,910 | | | | 3,855,811 | |
See Notes to Financial Statements.
PGIM Core Bond Fund 11
PGIM Core Bond Fund
Schedule of Investments (continued)
as of July 31, 2024
| | | | | | | | | | | | | | | | |
| | | | |
| Description | | Interest Rate | | | Maturity Date | | | Principal Amount (000)# | | | Value | |
|
COMMERCIAL MORTGAGE-BACKED SECURITIES (Continued) | |
| | | | |
Morgan Stanley Capital I Trust, | | | | | | | | | | | | | | | | |
Series 2016-BNK02, Class A3 | | | 2.791% | | | | 11/15/49 | | | | 900 | | | $ | 857,840 | |
Series 2016-UB11, Class A3 | | | 2.531 | | | | 08/15/49 | | | | 1,807 | | | | 1,728,509 | |
UBS Commercial Mortgage Trust, | | | | | | | | | | | | | | | | |
Series 2017-C05, Class A4 | | | 3.212 | | | | 11/15/50 | | | | 1,800 | | | | 1,713,779 | |
Series 2018-C09, Class A3 | | | 3.854 | | | | 03/15/51 | | | | 657 | | | | 629,488 | |
Series 2018-C14, Class A3 | | | 4.180 | | | | 12/15/51 | | | | 1,061 | | | | 1,025,732 | |
Series 2019-C18, Class A3 | | | 2.782 | | | | 12/15/52 | | | | 4,400 | | | | 3,930,629 | |
Wells Fargo Commercial Mortgage Trust, | | | | | | | | | | | | | | | | |
Series 2015-NXS04, Class A4 | | | 3.718 | | | | 12/15/48 | | | | 1,895 | | | | 1,851,653 | |
Series 2016-BNK01, Class A2 | | | 2.399 | | | | 08/15/49 | | | | 1,193 | | | | 1,134,271 | |
Series 2016-C35, Class A3 | | | 2.674 | | | | 07/15/48 | | | | 1,680 | | | | 1,613,892 | |
Series 2016-NXS06, Class A3 | | | 2.642 | | | | 11/15/49 | | | | 1,500 | | | | 1,436,696 | |
Series 2017-C38, Class A4 | | | 3.190 | | | | 07/15/50 | | | | 891 | | | | 851,066 | |
Series 2017-RB01, Class A4 | | | 3.374 | | | | 03/15/50 | | | | 1,012 | | | | 959,933 | |
Series 2018-C46, Class A3 | | | 3.888 | | | | 08/15/51 | | | | 2,000 | | | | 1,921,319 | |
Series 2019-C49, Class A3 | | | 3.749 | | | | 03/15/52 | | | | 3,000 | | | | 2,926,577 | |
Series 2019-C50, Class A4 | | | 3.466 | | | | 05/15/52 | | | | 2,448 | | | | 2,311,983 | |
Series 2019-C52, Class A3 | | | 2.631 | | | | 08/15/52 | | | | 168 | | | | 161,806 | |
Series 2020-C57, Class A3 | | | 1.864 | | | | 08/15/53 | | | | 5,300 | | | | 4,528,190 | |
Series 2021-C59, Class A3 | | | 1.958 | | | | 04/15/54 | | | | 5,921 | | | | 5,058,693 | |
Series 2024-5C1, Class A3 | | | 5.928 | | | | 07/15/57 | | | | 9,900 | | | | 10,238,413 | |
| | | | | | | | | | | | | | | | |
| | | | |
TOTAL COMMERCIAL MORTGAGE-BACKED SECURITIES
(cost $289,047,076) | | | | | | | | | | | | | | | 269,332,643 | |
| | | | | | | | | | | | | | | | |
| | | | |
CORPORATE BONDS 31.2% | | | | | | | | | | | | | | | | |
| | | | |
Aerospace & Defense 0.7% | | | | | | | | | | | | | | | | |
| | | | |
BAE Systems PLC (United Kingdom), | | | | | | | | | | | | | | | | |
Sr. Unsec’d. Notes, 144A | | | 3.400 | | | | 04/15/30 | | | | 335 | | | | 309,887 | |
Sr. Unsec’d. Notes, 144A | | | 5.125 | | | | 03/26/29 | | | | 2,570 | | | | 2,591,822 | |
Boeing Co. (The), | | | | | | | | | | | | | | | | |
Sr. Unsec’d. Notes | | | 2.196 | | | | 02/04/26 | | | | 1,530 | | | | 1,455,726 | |
Sr. Unsec’d. Notes | | | 3.550 | | | | 03/01/38 | | | | 495 | | | | 372,608 | |
Sr. Unsec’d. Notes | | | 3.600 | | | | 05/01/34 | | | | 1,600 | | | | 1,329,993 | |
Sr. Unsec’d. Notes | | | 3.625 | | | | 02/01/31 | | | | 2,950 | | | | 2,648,596 | |
Sr. Unsec’d. Notes | | | 3.850 | | | | 11/01/48 | | | | 455 | | | | 313,716 | |
Sr. Unsec’d. Notes | | | 3.900 | | | | 05/01/49 | | | | 1,405 | | | | 976,528 | |
Sr. Unsec’d. Notes, 144A | | | 6.388 | | | | 05/01/31 | | | | 2,275 | | | | 2,373,546 | |
See Notes to Financial Statements.
12
PGIM Core Bond Fund
Schedule of Investments (continued)
as of July 31, 2024
| | | | | | | | | | | | | | | | |
| | | | |
| Description | | Interest Rate | | | Maturity Date | | | Principal Amount (000)# | | | Value | |
|
CORPORATE BONDS (Continued) | |
|
Aerospace & Defense (cont’d.) | |
HEICO Corp., | | | | | | | | | | | | | | | | |
Gtd. Notes | | | 5.250% | | | | 08/01/28 | | | | 725 | | | $ | 736,480 | |
L3Harris Technologies, Inc., | | | | | | | | | | | | | | | | |
Sr. Unsec’d. Notes | | | 3.832 | | | | 04/27/25 | | | | 30 | | | | 29,658 | |
| | | | | | | | | | | | | | | | |
| | | | |
| | | | | | | | | | | | | | | 13,138,560 | |
| | | | |
Agriculture 0.8% | | | | | | | | | | | | | | | | |
Altria Group, Inc., | | | | | | | | | | | | | | | | |
Gtd. Notes | | | 3.400 | | | | 05/06/30 | | | | 630 | | | | 582,694 | |
Gtd. Notes | | | 3.400 | | | | 02/04/41 | | | | 975 | | | | 724,624 | |
BAT Capital Corp. (United Kingdom), | | | | | | | | | | | | | | | | |
Gtd. Notes | | | 2.259 | | | | 03/25/28 | | | | 1,910 | | | | 1,738,907 | |
Gtd. Notes | | | 2.726 | | | | 03/25/31 | | | | 2,180 | | | | 1,884,305 | |
Gtd. Notes | | | 3.557 | | | | 08/15/27 | | | | 120 | | | | 115,564 | |
Gtd. Notes | | | 4.390 | | | | 08/15/37 | | | | 5,500 | | | | 4,825,923 | |
Gtd. Notes | | | 6.343 | | | | 08/02/30 | | | | 710 | | | | 754,148 | |
BAT International Finance PLC (United Kingdom),
Gtd. Notes | | | 5.931 | | | | 02/02/29 | | | | 1,295 | | | | 1,344,823 | |
Philip Morris International, Inc., | | | | | | | | | | | | | | | | |
Sr. Unsec’d. Notes | | | 5.125 | | | | 02/15/30 | | | | 3,955 | | | | 4,020,961 | |
| | | | | | | | | | | | | | | | |
| | | | |
| | | | | | | | | | | | | | | 15,991,949 | |
| | | | |
Airlines 0.1% | | | | | | | | | | | | | | | | |
American Airlines 2015-1 Class A Pass-Through Trust,
Pass-Through Certificates | | | 3.375 | | | | 11/01/28 | | | | 58 | | | | 55,159 | |
Delta Air Lines 2020-1 Class AA Pass-Through Trust,
Pass-Through Certificates | | | 2.000 | | | | 12/10/29 | | | | 525 | | | | 483,097 | |
United Airlines 2016-2 Class AA Pass-Through Trust,
Pass-Through Certificates | | | 2.875 | | | | 04/07/30 | | | | 267 | | | | 247,224 | |
United Airlines 2019-2 Class AA Pass-Through Trust,
Pass-Through Certificates | | | 2.700 | | | | 11/01/33 | | | | 364 | | | | 316,740 | |
| | | | | | | | | | | | | | | | |
| | | | |
| | | | | | | | | | | | | | | 1,102,220 | |
| | | | |
Auto Manufacturers 0.9% | | | | | | | | | | | | | | | | |
Ford Motor Co., | | | | | | | | | | | | | | | | |
Sr. Unsec’d. Notes | | | 4.750 | | | | 01/15/43 | | | | 320 | | | | 260,518 | |
See Notes to Financial Statements.
PGIM Core Bond Fund 13
PGIM Core Bond Fund
Schedule of Investments (continued)
as of July 31, 2024
| | | | | | | | | | | | | | | | |
| | | | |
| Description | | Interest Rate | | | Maturity Date | | | Principal Amount (000)# | | | Value | |
|
CORPORATE BONDS (Continued) | |
|
Auto Manufacturers (cont’d.) | |
| | | | |
Ford Motor Credit Co. LLC, | | | | | | | | | | | | | | | | |
Sr. Unsec’d. Notes | | | 4.000% | | | | 11/13/30 | | | | 2,650 | | | $ | 2,406,534 | |
Sr. Unsec’d. Notes | | | 4.125 | | | | 08/17/27 | | | | 2,065 | | | | 1,987,310 | |
Sr. Unsec’d. Notes | | | 4.271 | | | | 01/09/27 | | | | 200 | | | | 194,752 | |
General Motors Co., | | | | | | | | | | | | | | | | |
Sr. Unsec’d. Notes | | | 6.250 | | | | 10/02/43 | | | | 900 | | | | 913,730 | |
General Motors Financial Co., Inc., | | | | | | | | | | | | | | | | |
Gtd. Notes | | | 3.850 | | | | 01/05/28 | | | | 490 | | | | 471,851 | |
Sr. Unsec’d. Notes | | | 2.700 | | | | 08/20/27 | | | | 375 | | | | 351,338 | |
Sr. Unsec’d. Notes | | | 5.800 | | | | 06/23/28 | | | | 2,705 | | | | 2,778,327 | |
Sr. Unsec’d. Notes | | | 5.950 | | | | 04/04/34 | | | | 870 | | | | 886,289 | |
Hyundai Capital America, | | | | | | | | | | | | | | | | |
Sr. Unsec’d. Notes, 144A | | | 5.300 | | | | 03/19/27 | | | | 3,260 | | | | 3,284,992 | |
Toyota Motor Credit Corp., | | | | | | | | | | | | | | | | |
Sr. Unsec’d. Notes, MTN | | | 4.800 | | | | 01/05/34 | | | | 2,220 | | | | 2,209,252 | |
Volkswagen Group of America Finance LLC (Germany), | | | | | | | | | | | | | | | | |
Gtd. Notes, 144A | | | 5.250 | | | | 03/22/29 | | | | 2,840 | | | | 2,868,308 | |
| | | | | | | | | | | | | | | | |
| | | | |
| | | | | | | | | | | | | | | 18,613,201 | |
| | | | |
Banks 10.1% | | | | | | | | | | | | | | | | |
| | | | |
Banco Santander SA (Spain), | | | | | | | | | | | | | | | | |
Sr. Non-Preferred Notes | | | 1.849 | | | | 03/25/26 | | | | 200 | | | | 189,235 | |
Sr. Non-Preferred Notes | | | 5.538(ff) | | | | 03/14/30 | | | | 1,000 | | | | 1,009,464 | |
Bank of America Corp., | | | | | | | | | | | | | | | | |
Sr. Unsec’d. Notes | | | 2.687(ff) | | | | 04/22/32 | | | | 12,960 | | | | 11,219,192 | |
Sr. Unsec’d. Notes | | | 5.288(ff) | | | | 04/25/34 | | | | 1,530 | | | | 1,543,847 | |
Sr. Unsec’d. Notes, GMTN | | | 3.593(ff) | | | | 07/21/28 | | | | 1,595 | | | | 1,538,357 | |
Sr. Unsec’d. Notes, MTN | | | 2.496(ff) | | | | 02/13/31 | | | | 2,705 | | | | 2,385,446 | |
Sr. Unsec’d. Notes, MTN | | | 3.824(ff) | | | | 01/20/28 | | | | 1,720 | | | | 1,675,487 | |
Sr. Unsec’d. Notes, MTN | | | 3.974(ff) | | | | 02/07/30 | | | | 5,695 | | | | 5,484,271 | |
Sr. Unsec’d. Notes, MTN | | | 4.271(ff) | | | | 07/23/29 | | | | 320 | | | | 313,284 | |
Sr. Unsec’d. Notes, Series N | | | 1.658(ff) | | | | 03/11/27 | | | | 105 | | | | 99,439 | |
Sr. Unsec’d. Notes, Series N | | | 2.651(ff) | | | | 03/11/32 | | | | 4,500 | | | | 3,893,484 | |
Sub. Notes, MTN | | | 4.000 | | | | 01/22/25 | | | | 800 | | | | 794,394 | |
Sub. Notes, MTN | | | 4.450 | | | | 03/03/26 | | | | 1,500 | | | | 1,486,610 | |
Bank of New York Mellon Corp. (The), | | | | | | | | | | | | | | | | |
Sr. Unsec’d. Notes, MTN | | | 4.975(ff) | | | | 03/14/30 | | | | 3,900 | | | | 3,943,933 | |
Barclays PLC (United Kingdom), | | | | | | | | | | | | | | | | |
Sr. Unsec’d. Notes | | | 3.650 | | | | 03/16/25 | | | | 200 | | | | 197,800 | |
See Notes to Financial Statements.
14
PGIM Core Bond Fund
Schedule of Investments (continued)
as of July 31, 2024
| | | | | | | | | | | | |
| | | | |
| Description | | Interest
Rate | | Maturity
Date | | Principal Amount (000)# | | | Value | |
|
CORPORATE BONDS (Continued) | |
|
Banks (cont’d.) | |
| | | | |
Barclays PLC (United Kingdom), (cont’d.) | | | | | | | | | | | | |
Sr. Unsec’d. Notes | | 5.690%(ff) | | 03/12/30 | | | 1,230 | | | $ | 1,254,126 | |
Sr. Unsec’d. Notes | | 6.496(ff) | | 09/13/27 | | | 4,370 | | | | 4,483,138 | |
Sr. Unsec’d. Notes, MTN | | 4.972(ff) | | 05/16/29 | | | 400 | | | | 398,651 | |
BNP Paribas SA (France), | | | | | | | | | | | | |
Sr. Non-Preferred Notes, 144A | | 1.323(ff) | | 01/13/27 | | | 3,075 | | | | 2,902,968 | |
Sr. Non-Preferred Notes, 144A | | 1.675(ff) | | 06/30/27 | | | 1,425 | | | | 1,334,038 | |
Sr. Non-Preferred Notes, 144A | | 1.904(ff) | | 09/30/28 | | | 1,385 | | | | 1,257,072 | |
Sr. Non-Preferred Notes, 144A | | 2.219(ff) | | 06/09/26 | | | 395 | | | | 384,156 | |
Sr. Non-Preferred Notes, 144A, MTN | | 3.052(ff) | | 01/13/31 | | | 1,080 | | | | 971,010 | |
Sr. Preferred Notes, 144A | | 5.176(ff) | | 01/09/30 | | | 465 | | | | 470,345 | |
BPCE SA (France), | | | | | | | | | | | | |
Sr. Non-Preferred Notes, 144A | | 2.375 | | 01/14/25 | | | 2,650 | | | | 2,611,194 | |
Sr. Preferred Notes, 144A, MTN | | 3.250 | | 01/11/28 | | | 625 | | | | 591,358 | |
Cassa Depositi e Prestiti SpA (Italy),
Sr. Unsec’d. Notes, 144A | | 5.875 | | 04/30/29 | | | 2,000 | | | | 2,064,273 | |
Citigroup, Inc., | | | | | | | | | | | | |
Sr. Unsec’d. Notes | | 1.122(ff) | | 01/28/27 | | | 8,090 | | | | 7,622,976 | |
Sr. Unsec’d. Notes | | 2.561(ff) | | 05/01/32 | | | 1,415 | | | | 1,206,594 | |
Sr. Unsec’d. Notes | | 2.666(ff) | | 01/29/31 | | | 1,400 | | | | 1,245,550 | |
Sr. Unsec’d. Notes | | 3.200 | | 10/21/26 | | | 290 | | | | 280,101 | |
Sr. Unsec’d. Notes | | 3.400 | | 05/01/26 | | | 350 | | | | 341,141 | |
Sr. Unsec’d. Notes | | 3.520(ff) | | 10/27/28 | | | 180 | | | | 172,500 | |
Sr. Unsec’d. Notes | | 3.668(ff) | | 07/24/28 | | | 490 | | | | 473,311 | |
Sr. Unsec’d. Notes | | 3.887(ff) | | 01/10/28 | | | 670 | | | | 653,721 | |
Sr. Unsec’d. Notes(a) | | 5.449(ff) | | 06/11/35 | | | 6,900 | | | | 7,013,256 | |
Sub. Notes | | 4.400 | | 06/10/25 | | | 4,000 | | | | 3,964,607 | |
Sub. Notes | | 4.450 | | 09/29/27 | | | 840 | | | | 828,644 | |
Sub. Notes | | 4.600 | | 03/09/26 | | | 945 | | | | 938,156 | |
Sub. Notes | | 4.750 | | 05/18/46 | | | 460 | | | | 410,099 | |
Sub. Notes | | 5.827(ff) | | 02/13/35 | | | 865 | | | | 874,550 | |
Credit Agricole SA (France),
Sr. Non-Preferred Notes, 144A, MTN | | 1.907(ff) | | 06/16/26 | | | 1,045 | | | | 1,012,935 | |
Deutsche Bank AG (Germany), | | | | | | | | | | | | |
Sr. Non-Preferred Notes | | 2.129(ff) | | 11/24/26 | | | 1,530 | | | | 1,465,555 | |
Sr. Non-Preferred Notes | | 7.146(ff) | | 07/13/27 | | | 525 | | | | 541,995 | |
Fifth Third Bancorp,
Sr. Unsec’d. Notes | | 6.339(ff) | | 07/27/29 | | | 1,310 | | | | 1,365,401 | |
Goldman Sachs Group, Inc. (The),
Sr. Unsec’d. Notes | | 1.431(ff) | | 03/09/27 | | | 3,075 | | | | 2,898,561 | |
See Notes to Financial Statements.
PGIM Core Bond Fund 15
PGIM Core Bond Fund
Schedule of Investments (continued)
as of July 31, 2024
| | | | | | | | | | | | |
| | | | |
| Description | | Interest
Rate | | Maturity
Date | | Principal Amount (000)# | | | Value | |
|
CORPORATE BONDS (Continued) | |
|
Banks (cont’d.) | |
| | | | |
Goldman Sachs Group, Inc. (The), (cont’d.) | | | | | | | | | | | | |
Sr. Unsec’d. Notes | | 1.542%(ff) | | 09/10/27 | | | 3,405 | | | $ | 3,167,693 | |
Sr. Unsec’d. Notes | | 3.272(ff) | | 09/29/25 | | | 1,160 | | | | 1,155,452 | |
Sr. Unsec’d. Notes | | 3.500 | | 01/23/25 | | | 75 | | | | 74,290 | |
Sr. Unsec’d. Notes | | 3.500 | | 04/01/25 | | | 1,230 | | | | 1,214,339 | |
Sr. Unsec’d. Notes | | 3.814(ff) | | 04/23/29 | | | 1,585 | | | | 1,524,781 | |
Sr. Unsec’d. Notes | | 3.850 | | 01/26/27 | | | 475 | | | | 464,641 | |
Sr. Unsec’d. Notes | | 4.223(ff) | | 05/01/29 | | | 125 | | | | 122,017 | |
Sr. Unsec’d. Notes | | 6.484(ff) | | 10/24/29 | | | 6,760 | | | | 7,157,361 | |
Sub. Notes | | 5.150 | | 05/22/45 | | | 335 | | | | 322,610 | |
Huntington Bancshares, Inc., | | | | | | | | | | | | |
Sr. Unsec’d. Notes | | 5.709(ff) | | 02/02/35 | | | 1,535 | | | | 1,551,119 | |
Sr. Unsec’d. Notes | | 6.208(ff) | | 08/21/29 | | | 630 | | | | 654,664 | |
Intesa Sanpaolo SpA (Italy),
Sr. Preferred Notes, Series XR, 144A, MTN | | 4.000 | | 09/23/29 | | | 1,790 | | | | 1,684,468 | |
JPMorgan Chase & Co., | | | | | | | | | | | | |
Jr. Sub. Notes, Series II | | 4.000(ff) | | 04/01/25(oo) | | | 3,920 | | | | 3,840,838 | |
Sr. Unsec’d. Notes | | 1.040(ff) | | 02/04/27 | | | 4,160 | | | | 3,916,993 | |
Sr. Unsec’d. Notes | | 1.578(ff) | | 04/22/27 | | | 215 | | | | 202,837 | |
Sr. Unsec’d. Notes | | 2.580(ff) | | 04/22/32 | | | 2,565 | | | | 2,210,599 | |
Sr. Unsec’d. Notes | | 2.739(ff) | | 10/15/30 | | | 7,000 | | | | 6,325,036 | |
Sr. Unsec’d. Notes | | 2.947(ff) | | 02/24/28 | | | 215 | | | | 205,111 | |
Sr. Unsec’d. Notes | | 3.964(ff) | | 11/15/48 | | | 355 | | | | 291,746 | |
Sr. Unsec’d. Notes | | 4.005(ff) | | 04/23/29 | | | 3,585 | | | | 3,484,563 | |
Sr. Unsec’d. Notes | | 4.323(ff) | | 04/26/28 | | | 165 | | | | 162,920 | |
Sub. Notes | | 2.956(ff) | | 05/13/31 | | | 1,855 | | | | 1,653,260 | |
Sub. Notes | | 3.875 | | 09/10/24 | | | 375 | | | | 374,200 | |
KeyCorp,
Sr. Unsec’d. Notes | | 6.401(ff) | | 03/06/35 | | | 3,120 | | | | 3,253,128 | |
Morgan Stanley, | | | | | | | | | | | | |
Sr. Unsec’d. Notes | | 1.593(ff) | | 05/04/27 | | | 5,600 | | | | 5,274,997 | |
Sr. Unsec’d. Notes | | 5.449(ff) | | 07/20/29 | | | 1,930 | | | | 1,970,569 | |
Sr. Unsec’d. Notes, GMTN | | 2.239(ff) | | 07/21/32 | | | 6,460 | | | | 5,395,342 | |
Sr. Unsec’d. Notes, GMTN | | 3.772(ff) | | 01/24/29 | | | 760 | | | | 733,872 | |
Sr. Unsec’d. Notes, GMTN | | 3.875 | | 01/27/26 | | | 470 | | | | 462,831 | |
Sr. Unsec’d. Notes, GMTN | | 4.000 | | 07/23/25 | | | 455 | | | | 449,852 | |
Sr. Unsec’d. Notes, GMTN(a) | | 4.431(ff) | | 01/23/30 | | | 1,200 | | | | 1,178,349 | |
Sr. Unsec’d. Notes, MTN | | 1.928(ff) | | 04/28/32 | | | 4,245 | | | | 3,489,902 | |
Sr. Unsec’d. Notes, MTN | | 3.591(cc) | | 07/22/28 | | | 310 | | | | 298,080 | |
Sr. Unsec’d. Notes, MTN | | 5.831(ff) | | 04/19/35 | | | 505 | | | | 527,866 | |
See Notes to Financial Statements.
16
PGIM Core Bond Fund
Schedule of Investments (continued)
as of July 31, 2024
| | | | | | | | | | | | |
| | | | |
| Description | | Interest
Rate | | Maturity
Date | | Principal Amount (000)# | | | Value | |
|
CORPORATE BONDS (Continued) | |
|
Banks (cont’d.) | |
| | | | |
Morgan Stanley, (cont’d.) | | | | | | | | | | | | |
Sub. Notes, GMTN | | 4.350% | | 09/08/26 | | | 3,800 | | | $ | 3,755,011 | |
NatWest Group PLC (United Kingdom),
Sr. Unsec’d. Notes | | 1.642(ff) | | 06/14/27 | | | 1,830 | | | | 1,713,796 | |
PNC Financial Services Group, Inc. (The), | | | | | | | | | | | | |
Sr. Unsec’d. Notes | | 5.582(ff) | | 06/12/29 | | | 2,655 | | | | 2,717,647 | |
Sr. Unsec’d. Notes | | 6.875(ff) | | 10/20/34 | | | 765 | | | | 851,677 | |
Societe Generale SA (France), | | | | | | | | | | | | |
Gtd. Notes, 144A | | 2.797(ff) | | 01/19/28 | | | 1,625 | | | | 1,524,942 | |
Sr. Non-Preferred Notes, 144A | | 1.488(ff) | | 12/14/26 | | | 3,800 | | | | 3,597,746 | |
Sr. Non-Preferred Notes, 144A, MTN | | 1.792(ff) | | 06/09/27 | | | 1,020 | | | | 951,440 | |
Sumitomo Mitsui Financial Group, Inc. (Japan),
Sr. Unsec’d. Notes(a) | | 2.348 | | 01/15/25 | | | 2,520 | | | | 2,483,106 | |
Truist Bank,
Sub. Notes | | 2.250 | | 03/11/30 | | | 2,840 | | | | 2,427,073 | |
Truist Financial Corp.,
Sr. Unsec’d. Notes, MTN | | 5.867(ff) | | 06/08/34 | | | 330 | | | | 340,563 | |
U.S. Bancorp,
Sr. Unsec’d. Notes | | 5.836(ff) | | 06/12/34 | | | 4,555 | | | | 4,730,294 | |
UBS Group AG (Switzerland), | | | | | | | | | | | | |
Sr. Unsec’d. Notes, 144A | | 2.193(ff) | | 06/05/26 | | | 555 | | | | 539,737 | |
Sr. Unsec’d. Notes, 144A | | 2.593(ff) | | 09/11/25 | | | 1,730 | | | | 1,725,191 | |
Sr. Unsec’d. Notes, 144A | | 3.126(ff) | | 08/13/30 | | | 1,180 | | | | 1,080,592 | |
Sr. Unsec’d. Notes, 144A | | 3.869(ff) | | 01/12/29 | | | 870 | | | | 835,530 | |
Sr. Unsec’d. Notes, 144A | | 4.282 | | 01/09/28 | | | 350 | | | | 340,013 | |
Wells Fargo & Co., | | | | | | | | | | | | |
Sr. Unsec’d. Notes(a) | | 5.389(ff) | | 04/24/34 | | | 4,350 | | | | 4,401,725 | |
Sr. Unsec’d. Notes | | 6.491(ff) | | 10/23/34 | | | 1,245 | | | | 1,356,003 | |
Sr. Unsec’d. Notes, MTN | | 2.572(ff) | | 02/11/31 | | | 2,740 | | | | 2,425,538 | |
Sr. Unsec’d. Notes, MTN | | 5.013(ff) | | 04/04/51 | | | 2,300 | | | | 2,170,078 | |
Sr. Unsec’d. Notes, MTN | | 5.574(ff) | | 07/25/29 | | | 5,045 | | | | 5,164,495 | |
| | | | | | | | | | | | |
| | | | |
| | | | | | | | | | | 197,734,748 | |
|
Beverages 0.3% | |
| | | | |
Anheuser-Busch Cos. LLC/Anheuser-Busch InBev Worldwide, Inc. (Belgium), | | | | | | | | | | | | |
Gtd. Notes | | 4.700 | | 02/01/36 | | | 180 | | | | 175,336 | |
Gtd. Notes | | 4.900 | | 02/01/46 | | | 1,675 | | | | 1,577,248 | |
See Notes to Financial Statements.
PGIM Core Bond Fund 17
PGIM Core Bond Fund
Schedule of Investments (continued)
as of July 31, 2024
| | | | | | | | | | | | |
| | | | |
| Description | | Interest
Rate | | Maturity
Date | | Principal Amount (000)# | | | Value | |
|
CORPORATE BONDS (Continued) | |
|
Beverages (cont’d.) | |
| | | | |
Anheuser-Busch InBev Worldwide, Inc. (Belgium),
Gtd. Notes | | 4.350% | | 06/01/40 | | | 975 | | | $ | 875,933 | |
Constellation Brands, Inc., | | | | | | | | | | | | |
Gtd. Notes | | 4.650 | | 11/15/28 | | | 450 | | | | 447,196 | |
Sr. Unsec’d. Notes | | 2.250 | | 08/01/31 | | | 1,030 | | | | 866,445 | |
Diageo Capital PLC (United Kingdom),
Gtd. Notes(a) | | 2.125 | | 04/29/32 | | | 1,665 | | | | 1,380,550 | |
| | | | | | | | | | | | |
| | | | |
| | | | | | | | | | | 5,322,708 | |
|
Biotechnology 0.2% | |
| | | | |
Amgen, Inc., | | | | | | | | | | | | |
Sr. Unsec’d. Notes | | 5.150 | | 11/15/41 | | | 910 | | | | 871,613 | |
Sr. Unsec’d. Notes | | 5.250 | | 03/02/33 | | | 2,545 | | | | 2,587,066 | |
| | | | | | | | | | | | |
| | | | |
| | | | | | | | | | | 3,458,679 | |
|
Building Materials 0.0% | |
| | | | |
Martin Marietta Materials, Inc.,
Sr. Unsec’d. Notes, Series CB | | | | | | | | | | | | |
| | 2.500 | | 03/15/30 | | | 885 | | | | 786,979 | |
|
Chemicals 0.2% | |
| | | | |
DuPont de Nemours, Inc.,
Sr. Unsec’d. Notes | | 5.419 | | 11/15/48 | | | 270 | | | | 284,988 | |
LYB International Finance III LLC,
Gtd. Notes | | 4.200 | | 05/01/50 | | | 1,070 | | | | 834,303 | |
Nutrien Ltd. (Canada),
Sr. Unsec’d. Notes | | 5.250 | | 01/15/45 | | | 248 | | | | 233,304 | |
OCP SA (Morocco),
Sr. Unsec’d. Notes, 144A | | 6.750 | | 05/02/34 | | | 1,858 | | | | 1,932,320 | |
Sasol Financing USA LLC (South Africa),
Gtd. Notes | | 6.500 | | 09/27/28 | | | 400 | | | | 388,500 | |
| | | | | | | | | | | | |
| | | | |
| | | | | | | | | | | 3,673,415 | |
|
Commercial Services 0.2% | |
| | | | |
ERAC USA Finance LLC,
Gtd. Notes, 144A | | 4.500 | | 02/15/45 | | | 75 | | | | 66,548 | |
See Notes to Financial Statements.
18
PGIM Core Bond Fund
Schedule of Investments (continued)
as of July 31, 2024
| | | | | | | | | | | | | | | | |
| | | | |
| Description | | Interest
Rate | | | Maturity
Date | | | Principal Amount (000)# | | | Value | |
|
CORPORATE BONDS (Continued) | |
|
Commercial Services (cont’d.) | |
| | | | |
Experian Finance PLC,
Gtd. Notes, 144A | | | 2.750% | | | | 03/08/30 | | | | 1,735 | | | $ | 1,561,867 | |
Global Payments, Inc.,
Sr. Unsec’d. Notes | | | 2.650 | | | | 02/15/25 | | | | 575 | | | | 566,022 | |
Massachusetts Institute of Technology,
Unsec’d. Notes | | | 3.885 | | | | 07/01/2116 | | | | 700 | | | | 531,857 | |
President & Fellows of Harvard College,
Unsec’d. Notes | | | 3.300 | | | | 07/15/56 | | | | 160 | | | | 119,153 | |
Trustees of Boston College,
Unsec’d. Notes | | | 3.129 | | | | 07/01/52 | | | | 637 | | | | 450,122 | |
University of Notre Dame du Lac,
Unsec’d. Notes, Series 2017 | | | 3.394 | | | | 02/15/48 | | | | 365 | | | | 287,860 | |
Verisk Analytics, Inc.,
Sr. Unsec’d. Notes | | | 4.125 | | | | 03/15/29 | | | | 1,185 | | | | 1,160,360 | |
| | | | | | | | | | | | | | | | |
| | | | |
| | | | | | | | | | | | | | | 4,743,789 | |
| | | | |
Computers 0.2% | | | | | | | | | | | | | | | | |
| | | | |
Apple, Inc.,
Sr. Unsec’d. Notes | | | 3.850 | | | | 08/04/46 | | | | 525 | | | | 444,387 | |
Booz Allen Hamilton, Inc.,
Gtd. Notes | | | 5.950 | | | | 08/04/33 | | | | 2,320 | | | | 2,419,541 | |
NetApp, Inc.,
Sr. Unsec’d. Notes | | | 1.875 | | | | 06/22/25 | | | | 1,470 | | | | 1,425,211 | |
| | | | | | | | | | | | | | | | |
| | | | |
| | | | | | | | | | | | | | | 4,289,139 | |
| | | | |
Diversified Financial Services 0.7% | | | | | | | | | | | | | | | | |
| | | | |
Cantor Fitzgerald LP,
Sr. Unsec’d. Notes, 144A | | | 7.200 | | | | 12/12/28 | | | | 1,155 | | | | 1,213,440 | |
Cboe Global Markets, Inc.,
Sr. Unsec’d. Notes | | | 1.625 | | | | 12/15/30 | | | | 2,900 | | | | 2,425,082 | |
Charles Schwab Corp. (The),
Sr. Unsec’d. Notes | | | 1.650 | | | | 03/11/31 | | | | 2,970 | | | | 2,429,027 | |
Jefferies Financial Group, Inc., | | | | | | | | | | | | | | | | |
Sr. Unsec’d. Notes | | | 2.625 | | | | 10/15/31 | | | | 95 | | | | 79,202 | |
Sr. Unsec’d. Notes | | | 5.875 | | | | 07/21/28 | | | | 1,210 | | | | 1,244,263 | |
LPL Holdings, Inc.,
Gtd. Notes | | | 5.700 | | | | 05/20/27 | | | | 1,295 | | | | 1,309,323 | |
See Notes to Financial Statements.
PGIM Core Bond Fund 19
PGIM Core Bond Fund
Schedule of Investments (continued)
as of July 31, 2024
| | | | | | | | | | | | |
| | | | |
| Description | | Interest
Rate | | Maturity
Date | | Principal Amount (000)# | | | Value | |
|
CORPORATE BONDS (Continued) | |
|
Diversified Financial Services (cont’d.) | |
| | | | |
Nomura Holdings, Inc. (Japan), | | | | | | | | | | | | |
Sr. Unsec’d. Notes | | 2.608% | | 07/14/31 | | | 565 | | | $ | 475,638 | |
Sr. Unsec’d. Notes | | 6.070 | | 07/12/28 | | | 3,905 | | | | 4,042,352 | |
| | | | | | | | | | | | |
| | | | |
| | | | | | | | | | | 13,218,327 | |
|
Electric 2.6% | |
| | | | |
Abu Dhabi National Energy Co. PJSC (United Arab Emirates),
Sr. Unsec’d. Notes, 144A, MTN | | 2.000 | | 04/29/28 | | | 515 | | | | 465,914 | |
AEP Transmission Co. LLC,
Sr. Unsec’d. Notes | | 4.250 | | 09/15/48 | | | 830 | | | | 683,332 | |
Alabama Power Co.,
Sr. Unsec’d. Notes | | 2.800 | | 04/01/25 | | | 75 | | | | 73,660 | |
Alfa Desarrollo SpA (Chile),
Sr. Sec’d. Notes, 144A | | 4.550 | | 09/27/51 | | | 655 | | | | 493,144 | |
Ameren Illinois Co.,
First Mortgage | | 3.700 | | 12/01/47 | | | 625 | | | | 480,853 | |
Arizona Public Service Co., | | | | | | | | | | | | |
Sr. Unsec’d. Notes | | 2.200 | | 12/15/31 | | | 2,875 | | | | 2,371,154 | |
Sr. Unsec’d. Notes | | 3.350 | | 05/15/50 | | | 485 | | | | 336,386 | |
CenterPoint Energy Houston Electric LLC,
General Ref. Mortgage, Series Z | | 2.400 | | 09/01/26 | | | 190 | | | | 180,739 | |
CenterPoint Energy, Inc.,
Sr. Unsec’d. Notes | | 3.700 | | 09/01/49 | | | 495 | | | | 364,875 | |
Cleco Corporate Holdings LLC,
Sr. Unsec’d. Notes | | 3.375 | | 09/15/29 | | | 305 | | | | 273,905 | |
Comision Federal de Electricidad (Mexico),
Gtd. Notes, 144A | | 4.688 | | 05/15/29 | | | 1,600 | | | | 1,514,000 | |
Commonwealth Edison Co., | | | | | | | | | | | | |
First Mortgage | | 3.700 | | 03/01/45 | | | 40 | | | | 31,527 | |
First Mortgage | | 4.000 | | 03/01/48 | | | 115 | | | | 92,180 | |
First Mortgage, Series 123 | | 3.750 | | 08/15/47 | | | 775 | | | | 605,812 | |
First Mortgage, Series 130 | | 3.125 | | 03/15/51 | | | 95 | | | | 64,256 | |
Consolidated Edison Co. of New York, Inc., | | | | | | | | | | | | |
Sr. Unsec’d. Notes, Series 2017 | | 3.875 | | 06/15/47 | | | 805 | | | | 636,208 | |
Sr. Unsec’d. Notes, Series C | | 4.300 | | 12/01/56 | | | 40 | | | | 32,503 | |
Delmarva Power & Light Co.,
First Mortgage | | 4.150 | | 05/15/45 | | | 60 | | | | 49,245 | |
See Notes to Financial Statements.
20
PGIM Core Bond Fund
Schedule of Investments (continued)
as of July 31, 2024
| | | | | | | | | | | | |
| | | | |
| Description | | Interest
Rate | | Maturity
Date | | Principal Amount (000)# | | | Value | |
|
CORPORATE BONDS (Continued) | |
|
Electric (cont’d.) | |
| | | | |
Dominion Energy, Inc.,
Sr. Unsec’d. Notes, Series D | | 2.850% | | 08/15/26 | | | 55 | | | $ | 52,765 | |
DTE Electric Co.,
General Ref. Mortgage, Series A | | 4.050 | | 05/15/48 | | | 370 | | | | 304,383 | |
DTE Energy Co.,
Sr. Unsec’d. Notes | | 2.850 | | 10/01/26 | | | 350 | | | | 335,696 | |
Duke Energy Corp., | | | | | | | | | | | | |
Sr. Unsec’d. Notes | | 2.650 | | 09/01/26 | | | 145 | | | | 138,701 | |
Sr. Unsec’d. Notes | | 3.950 | | 08/15/47 | | | 185 | | | | 141,934 | |
Duke Energy Florida LLC, | | | | | | | | | | | | |
First Mortgage | | 3.400 | | 10/01/46 | | | 185 | | | | 133,797 | |
First Mortgage | | 4.200 | | 07/15/48 | | | 205 | | | | 170,081 | |
Duke Energy Progress LLC, | | | | | | | | | | | | |
First Mortgage | | 2.500 | | 08/15/50 | | | 1,860 | | | | 1,107,808 | |
First Mortgage | | 3.700 | | 10/15/46 | | | 75 | | | | 57,439 | |
Enel Finance International NV (Italy), | | | | | | | | | | | | |
Gtd. Notes, 144A | | 2.650 | | 09/10/24 | | | 655 | | | | 652,639 | |
Gtd. Notes, 144A | | 3.500 | | 04/06/28 | | | 475 | | | | 451,875 | |
Entergy Arkansas LLC,
First Mortgage | | 2.650 | | 06/15/51 | | | 2,220 | | | | 1,334,215 | |
Entergy Louisiana LLC,
Collateral Trust | | 4.000 | | 03/15/33 | | | 170 | | | | 156,698 | |
Entergy Texas, Inc.,
First Mortgage | | 4.500 | | 03/30/39 | | | 1,000 | | | | 914,091 | |
Evergy, Inc.,
Sr. Unsec’d. Notes | | 2.450 | | 09/15/24 | | | 2,135 | | | | 2,125,574 | |
Eversource Energy,
Sr. Unsec’d. Notes, Series M | | 3.300 | | 01/15/28 | | | 335 | | | | 317,667 | |
FirstEnergy Pennsylvania Electric Co., | | | | | | | | | | | | |
Sr. Unsec’d. Notes, 144A(a) | | 3.600 | | 06/01/29 | | | 1,435 | | | | 1,357,988 | |
Sr. Unsec’d. Notes, 144A | | 5.200 | | 04/01/28 | | | 865 | | | | 875,150 | |
Fortis, Inc. (Canada),
Sr. Unsec’d. Notes | | 3.055 | | 10/04/26 | | | 217 | | | | 208,049 | |
Georgia Power Co.,
Sr. Unsec’d. Notes, Series B | | 2.650 | | 09/15/29 | | | 1,005 | | | | 914,737 | |
IPALCO Enterprises, Inc.,
Sr. Sec’d. Notes | | 4.250 | | 05/01/30 | | | 240 | | | | 227,725 | |
Israel Electric Corp. Ltd. (Israel), | | | | | | | | | | | | |
Sr. Sec’d. Notes, 144A, GMTN | | 4.250 | | 08/14/28 | | | 235 | | | | 219,431 | |
Sr. Sec’d. Notes, Series 6, 144A | | 5.000 | | 11/12/24 | | | 1,360 | | | | 1,348,100 | |
See Notes to Financial Statements.
PGIM Core Bond Fund 21
PGIM Core Bond Fund
Schedule of Investments (continued)
as of July 31, 2024
| | | | | | | | | | | | |
| | | | |
| Description | | Interest
Rate | | Maturity
Date | | Principal Amount (000)# | | | Value | |
|
CORPORATE BONDS (Continued) | |
|
Electric (cont’d.) | |
| | | | |
MidAmerican Energy Co., | | | | | | | | | | | | |
First Mortgage | | 3.950% | | 08/01/47 | | | 225 | | | $ | 180,604 | |
First Mortgage | | 4.250 | | 07/15/49 | | | 350 | | | | 295,607 | |
Narragansett Electric Co. (The),
Sr. Unsec’d. Notes, 144A | | 3.395 | | 04/09/30 | | | 915 | | | | 853,988 | |
NextEra Energy Capital Holdings, Inc., | | | | | | | | | | | | |
Gtd. Notes | | 4.900 | | 02/28/28 | | | 3,870 | | | | 3,890,353 | |
Gtd. Notes | | 5.749 | | 09/01/25 | | | 2,275 | | | | 2,290,381 | |
Gtd. Notes | | 6.051 | | 03/01/25 | | | 785 | | | | 788,400 | |
NRG Energy, Inc., | | | | | | | | | | | | |
Sr. Sec’d. Notes, 144A | | 2.000 | | 12/02/25 | | | 280 | | | | 267,471 | |
Sr. Sec’d. Notes, 144A | | 2.450 | | 12/02/27 | | | 1,215 | | | | 1,113,958 | |
NSTAR Electric Co.,
Sr. Unsec’d. Notes | | 5.400 | | 06/01/34 | | | 1,130 | | | | 1,161,102 | |
Ohio Power Co.,
Sr. Unsec’d. Notes | | 4.150 | | 04/01/48 | | | 250 | | | | 198,520 | |
Oncor Electric Delivery Co. LLC,
Sr. Sec’d. Notes | | 2.950 | | 04/01/25 | | | 60 | | | | 59,051 | |
Pacific Gas & Electric Co., | | | | | | | | | | | | |
First Mortgage | | 4.500 | | 07/01/40 | | | 3,000 | | | | 2,551,346 | |
First Mortgage | | 4.950 | | 07/01/50 | | | 1,460 | | | | 1,243,464 | |
PacifiCorp,
First Mortgage | | 2.700 | | 09/15/30 | | | 890 | | | | 789,281 | |
PECO Energy Co., | | | | | | | | | | | | |
First Mortgage | | 3.000 | | 09/15/49 | | | 180 | | | | 123,636 | |
First Mortgage | | 3.050 | | 03/15/51 | | | 1,540 | | | | 1,032,753 | |
First Ref. Mortgage | | 4.800 | | 10/15/43 | | | 120 | | | | 110,628 | |
PPL Electric Utilities Corp.,
First Mortgage | | 3.000 | | 10/01/49 | | | 235 | | | | 160,644 | |
Public Service Co. of Colorado, | | | | | | | | | | | | |
First Mortgage | | 4.100 | | 06/15/48 | | | 235 | | | | 185,018 | |
First Mortgage, Series 34 | | 3.200 | | 03/01/50 | | | 720 | | | | 488,657 | |
Public Service Electric & Gas Co., | | | | | | | | | | | | |
First Mortgage, MTN | | 2.250 | | 09/15/26 | | | 370 | | | | 352,131 | |
First Mortgage, MTN | | 2.700 | | 05/01/50 | | | 390 | | | | 251,746 | |
First Mortgage, MTN | | 3.200 | | 05/15/29 | | | 1,265 | | | | 1,191,582 | |
First Mortgage, MTN | | 3.600 | | 12/01/47 | | | 95 | | | | 73,017 | |
First Mortgage, MTN | | 3.700 | | 05/01/28 | | | 590 | | | | 572,257 | |
Sec’d. Notes, MTN | | 4.650 | | 03/15/33 | | | 2,105 | | | | 2,076,242 | |
See Notes to Financial Statements.
22
PGIM Core Bond Fund
Schedule of Investments (continued)
as of July 31, 2024
| | | | | | | | | | | | |
| | | | |
| Description | | Interest
Rate | | Maturity
Date | | Principal Amount (000)# | | | Value | |
|
CORPORATE BONDS (Continued) | |
|
Electric (cont’d.) | |
| | | | |
Public Service Enterprise Group, Inc.,
Sr. Unsec’d. Notes | | 1.600% | | 08/15/30 | | | 1,155 | | | $ | 960,895 | |
San Diego Gas & Electric Co.,
First Mortgage | | 4.150 | | 05/15/48 | | | 420 | | | | 347,677 | |
Southern California Edison Co.,
First Mortgage | | 3.650 | | 02/01/50 | | | 290 | | | | 213,746 | |
Southwestern Electric Power Co.,
Sr. Unsec’d. Notes, Series K | | 2.750 | | 10/01/26 | | | 675 | | | | 642,870 | |
Southwestern Public Service Co.,
First Mortgage | | 3.700 | | 08/15/47 | | | 355 | | | | 259,855 | |
SP PowerAssets Ltd. (Singapore),
Sr. Unsec’d. Notes, 144A, MTN(a) | | 3.000 | | 09/26/27 | | | 465 | | | | 445,005 | |
Tucson Electric Power Co.,
Sr. Unsec’d. Notes | | 4.000 | | 06/15/50 | | | 1,315 | | | | 1,025,607 | |
Union Electric Co.,
Sr. Sec’d. Notes | | 3.650 | | 04/15/45 | | | 50 | | | | 38,736 | |
Virginia Electric & Power Co., | | | | | | | | | | | | |
Sr. Unsec’d. Notes, Series A | | 3.500 | | 03/15/27 | | | 185 | | | | 179,846 | |
Sr. Unsec’d. Notes, Series A | | 3.800 | | 04/01/28 | | | 290 | | | | 281,789 | |
Wisconsin Power & Light Co.,
Sr. Unsec’d. Notes | | 3.050 | | 10/15/27 | | | 535 | | | | 508,527 | |
Xcel Energy, Inc.,
Sr. Unsec’d. Notes | | 3.350 | | 12/01/26 | | | 510 | | | | 492,323 | |
| | | | | | | | | | | | |
| | | | |
| | | | | | | | | | | 49,994,949 | |
|
Engineering & Construction 0.2% | |
Mexico City Airport Trust (Mexico), | | | | | | | | | | | | |
Sr. Sec’d. Notes, 144A | | 3.875 | | 04/30/28 | | | 1,018 | | | | 957,877 | |
Sr. Sec’d. Notes, 144A | | 4.250 | | 10/31/26 | | | 1,972 | | | | 1,907,299 | |
Sr. Sec’d. Notes, 144A | | 5.500 | | 07/31/47 | | | 1,800 | | | | 1,514,250 | |
| | | | | | | | | | | | |
| | | | |
| | | | | | | | | | | 4,379,426 | |
|
Entertainment 0.2% | |
Warnermedia Holdings, Inc., | | | | | | | | | | | | |
Gtd. Notes | | 5.050 | | 03/15/42 | | | 3,095 | | | | 2,441,466 | |
Gtd. Notes | | 5.141 | | 03/15/52 | | | 925 | | | | 687,923 | |
| | | | | | | | | | | | |
| | | | |
| | | | | | | | | | | 3,129,389 | |
See Notes to Financial Statements.
PGIM Core Bond Fund 23
PGIM Core Bond Fund
Schedule of Investments (continued)
as of July 31, 2024
| | | | | | | | | | | | |
| | | | |
| Description | | Interest
Rate | | Maturity
Date | | Principal Amount (000)# | | | Value | |
|
CORPORATE BONDS (Continued) | |
|
Foods 0.2% | |
| | | | |
Ahold Finance USA LLC (Netherlands),
Gtd. Notes | | 6.875% | | 05/01/29 | | | 280 | | | $ | 304,612 | |
Campbell Soup Co.,
Sr. Unsec’d. Notes(a) | | 2.375 | | 04/24/30 | | | 2,175 | | | | 1,919,496 | |
Cencosud SA (Chile),
Gtd. Notes, 144A | | 4.375 | | 07/17/27 | | | 1,320 | | | | 1,273,140 | |
Kraft Heinz Foods Co.,
Gtd. Notes | | 4.375 | | 06/01/46 | | | 1,005 | | | | 843,500 | |
Kroger Co. (The),
Sr. Unsec’d. Notes | | 3.875 | | 10/15/46 | | | 65 | | | | 50,235 | |
| | | | | | | | | | | | |
| | | | |
| | | | | | | | | | | 4,390,983 | |
|
Forest Products & Paper 0.0% | |
| | | | |
Celulosa Arauco y Constitucion SA (Chile), | | | | | | | | | | | | |
Sr. Unsec’d. Notes | | 3.875 | | 11/02/27 | | | 651 | | | | 613,548 | |
Sr. Unsec’d. Notes | | 4.500 | | 08/01/24 | | | 214 | | | | 214,000 | |
Georgia-Pacific LLC,
Sr. Unsec’d. Notes, 144A | | 3.600 | | 03/01/25 | | | 220 | | | | 217,469 | |
| | | | | | | | | | | | |
| | | | |
| | | | | | | | | | | 1,045,017 | |
|
Gas 0.1% | |
| | | | |
Atmos Energy Corp.,
Sr. Unsec’d. Notes | | 3.375 | | 09/15/49 | | | 1,200 | | | | 858,665 | |
NiSource, Inc.,
Sr. Unsec’d. Notes | | 1.700 | | 02/15/31 | | | 785 | | | | 641,281 | |
Piedmont Natural Gas Co., Inc.,
Sr. Unsec’d. Notes | | 3.500 | | 06/01/29 | | | 440 | | | | 415,419 | |
| | | | | | | | | | | | |
| | | | |
| | | | | | | | | | | 1,915,365 | |
|
Healthcare-Products 0.0% | |
| | | | |
Medtronic, Inc.,
Gtd. Notes | | | | | | | | | | | | |
| | 4.375 | | 03/15/35 | | | 235 | | | | 227,022 | |
|
Healthcare-Services 1.2% | |
| | | | |
Aetna, Inc.,
Sr. Unsec’d. Notes | | 3.500 | | 11/15/24 | | | 100 | | | | 99,362 | |
See Notes to Financial Statements.
24
PGIM Core Bond Fund
Schedule of Investments (continued)
as of July 31, 2024
| | | | | | | | | | | | |
| | | | |
| Description | | Interest
Rate | | Maturity
Date | | Principal Amount (000)# | | | Value | |
|
CORPORATE BONDS (Continued) | |
|
Healthcare-Services (cont’d.) | |
| | | | |
Aetna, Inc., (cont’d.) | | | | | | | | | | | | |
Sr. Unsec’d. Notes | | 4.500% | | 05/15/42 | | | 1,000 | | | $ | 860,677 | |
Sr. Unsec’d. Notes | | 6.750 | | 12/15/37 | | | 170 | | | | 187,513 | |
AHS Hospital Corp.,
Unsec’d. Notes | | 5.024 | | 07/01/45 | | | 200 | | | | 196,412 | |
Ascension Health,
Sr. Unsec’d. Notes, Series B | | 3.106 | | 11/15/39 | | | 265 | | | | 212,168 | |
CommonSpirit Health,
Sr. Sec’d. Notes | | 5.318 | | 12/01/34 | | | 4,510 | | | | 4,548,988 | |
Kaiser Foundation Hospitals,
Unsec’d. Notes, Series 2021 | | 2.810 | | 06/01/41 | | | 2,410 | | | | 1,791,129 | |
Laboratory Corp. of America Holdings,
Gtd. Notes | | 2.950 | | 12/01/29 | | | 595 | | | | 541,916 | |
Memorial Sloan-Kettering Cancer Center,
Sr. Unsec’d. Notes, Series 2015 | | 4.200 | | 07/01/55 | | | 75 | | | | 64,863 | |
Mount Sinai Hospital (The),
Sec’d. Notes, Series 2019 | | 3.737 | | 07/01/49 | | | 1,795 | | | | 1,333,153 | |
MyMichigan Health,
Sec’d. Notes, Series 2020 | | 3.409 | | 06/01/50 | | | 740 | | | | 537,615 | |
OhioHealth Corp.,
Unsec’d. Notes, Series 2020 | | 3.042 | | 11/15/50 | | | 795 | | | | 569,026 | |
Piedmont Healthcare, Inc.,
Sec’d. Notes, Series 2032 | | 2.044 | | 01/01/32 | | | 2,670 | | | | 2,211,583 | |
Providence St. Joseph Health Obligated Group, | | | | | | | | | | | | |
Unsec’d. Notes, Series 19A | | 2.532 | | 10/01/29 | | | 420 | | | | 376,863 | |
Unsec’d. Notes, Series H | | 2.746 | | 10/01/26 | | | 40 | | | | 38,103 | |
Quest Diagnostics, Inc., | | | | | | | | | | | | |
Sr. Unsec’d. Notes | | 2.950 | | 06/30/30 | | | 1,910 | | | | 1,737,717 | |
Sr. Unsec’d. Notes | | 3.500 | | 03/30/25 | | | 190 | | | | 187,475 | |
Stanford Health Care, | | | | | | | | | | | | |
Unsec’d. Notes, Series 2018 | | 3.795 | | 11/15/48 | | | 450 | | | | 370,854 | |
UnitedHealth Group, Inc., | | | | | | | | | | | | |
Sr. Unsec’d. Notes | | 3.050 | | 05/15/41 | | | 1,150 | | | | 869,190 | |
Sr. Unsec’d. Notes | | 3.750 | | 07/15/25 | | | 90 | | | | 88,957 | |
Sr. Unsec’d. Notes(h) | | 4.750 | | 05/15/52 | | | 1,900 | | | | 1,717,619 | |
Sr. Unsec’d. Notes(h) | | 5.050 | | 04/15/53 | | | 2,140 | | | | 2,023,502 | |
Sr. Unsec’d. Notes(h) | | 5.500 | | 04/15/64 | | | 865 | | | | 856,826 | |
Sr. Unsec’d. Notes | | 5.750 | | 07/15/64 | | | 1,495 | | | | 1,535,651 | |
| | | | | | | | | | | | |
| | | | |
| | | | | | | | | | | 22,957,162 | |
See Notes to Financial Statements.
PGIM Core Bond Fund 25
PGIM Core Bond Fund
Schedule of Investments (continued)
as of July 31, 2024
| | | | | | | | | | | | |
| | | | |
| Description | | Interest
Rate | | Maturity
Date | | Principal Amount (000)# | | | Value | |
|
CORPORATE BONDS (Continued) | |
|
Insurance 0.6% | |
| | | | |
Arch Capital Finance LLC,
Gtd. Notes | | 5.031% | | 12/15/46 | | | 95 | | | $ | 88,116 | |
Arch Capital Group US, Inc.,
Gtd. Notes | | 5.144 | | 11/01/43 | | | 100 | | | | 94,062 | |
Berkshire Hathaway Finance Corp.,
Gtd. Notes | | 2.850 | | 10/15/50 | | | 1,175 | | | | 783,718 | |
Fairfax Financial Holdings Ltd. (Canada),
Sr. Unsec’d. Notes, 144A | | 6.000 | | 12/07/33 | | | 5,900 | | | | 6,121,262 | |
Liberty Mutual Group, Inc., | | | | | | | | | | | | |
Gtd. Notes, 144A | | 3.950 | | 05/15/60 | | | 185 | | | | 129,023 | |
Gtd. Notes, 144A | | 3.951 | | 10/15/50 | | | 450 | | | | 334,056 | |
Lincoln National Corp.,
Sr. Unsec’d. Notes | | 6.300 | | 10/09/37 | | | 115 | | | | 121,730 | |
Markel Group, Inc., | | | | | | | | | | | | |
Sr. Unsec’d. Notes | | 3.350 | | 09/17/29 | | | 1,625 | | | | 1,522,015 | |
Sr. Unsec’d. Notes | | 5.000 | | 04/05/46 | | | 217 | | | | 196,393 | |
Principal Financial Group, Inc., | | | | | | | | | | | | |
Gtd. Notes | | 3.100 | | 11/15/26 | | | 105 | | | | 100,816 | |
Gtd. Notes | | 4.300 | | 11/15/46 | | | 140 | | | | 118,506 | |
Gtd. Notes | | 4.350 | | 05/15/43 | | | 20 | | | | 17,457 | |
Teachers Insurance & Annuity Association of America, | | | | | | | | | | | | |
Sub. Notes, 144A | | 3.300 | | 05/15/50 | | | 930 | | | | 636,333 | |
Sub. Notes, 144A | | 4.900 | | 09/15/44 | | | 120 | | | | 109,555 | |
Unum Group,
Sr. Unsec’d. Notes | | 6.000 | | 06/15/54 | | | 505 | | | | 498,177 | |
W.R. Berkley Corp.,
Sr. Unsec’d. Notes | | 4.000 | | 05/12/50 | | | 545 | | | | 428,890 | |
| | | | | | | | | | | | |
| | | | |
| | | | | | | | | | | 11,300,109 | |
|
Iron/Steel 0.3% | |
Steel Dynamics, Inc.,
Sr. Unsec’d. Notes | | | | | | | | | | | | |
| | 3.450 | | 04/15/30 | | | 5,710 | | | | 5,293,951 | |
|
Lodging 0.1% | |
Hyatt Hotels Corp.,
Sr. Unsec’d. Notes | | 5.750 | | 01/30/27 | | | 730 | | | | 742,380 | |
Las Vegas Sands Corp.,
Sr. Unsec’d. Notes | | 3.500 | | 08/18/26 | | | 1,230 | | | | 1,187,411 | |
See Notes to Financial Statements.
26
PGIM Core Bond Fund
Schedule of Investments (continued)
as of July 31, 2024
| | | | | | | | | | | | |
| | | | |
| Description | | Interest
Rate | | Maturity
Date | | Principal Amount (000)# | | | Value | |
|
CORPORATE BONDS (Continued) | |
|
Lodging (cont’d.) | |
| | | | |
Marriott International, Inc., | | | | | | | | | | | | |
Sr. Unsec’d. Notes | | 4.900% | | 04/15/29 | | | 510 | | | $ | 513,056 | |
Sr. Unsec’d. Notes, Series R | | 3.125 | | 06/15/26 | | | 250 | | | | 242,052 | |
| | | | | | | | | | | | |
| | | | |
| | | | | | | | | | | 2,684,899 | |
|
Machinery-Diversified 0.1% | |
| | | | |
Ingersoll Rand, Inc.,
Sr. Unsec’d. Notes | | | | | | | | | | | | |
| | 5.700 | | 08/14/33 | | | 1,860 | | | | 1,948,045 | |
|
Media 0.7% | |
| | | | |
Charter Communications Operating LLC/Charter Communications Operating Capital, | | | | | | | | | | | | |
Sr. Sec’d. Notes | | 2.300 | | 02/01/32 | | | 445 | | | | 351,358 | |
Sr. Sec’d. Notes(a) | | 2.800 | | 04/01/31 | | | 2,755 | | | | 2,309,779 | |
Sr. Sec’d. Notes | | 3.900 | | 06/01/52 | | | 370 | | | | 239,364 | |
Sr. Sec’d. Notes | | 5.050 | | 03/30/29 | | | 2,160 | | | | 2,116,863 | |
Sr. Sec’d. Notes | | 5.375 | | 05/01/47 | | | 530 | | | | 437,867 | |
Sr. Sec’d. Notes | | 6.384 | | 10/23/35 | | | 2,480 | | | | 2,480,768 | |
Sr. Sec’d. Notes | | 6.484 | | 10/23/45 | | | 275 | | | | 259,922 | |
Comcast Corp.,
Gtd. Notes | | 4.250 | | 10/15/30 | | | 275 | | | | 268,815 | |
Cox Communications, Inc., | | | | | | | | | | | | |
Sr. Unsec’d. Notes, 144A | | 2.600 | | 06/15/31 | | | 3,535 | | | | 2,984,984 | |
Sr. Unsec’d. Notes, 144A | | 3.150 | | 08/15/24 | | | 276 | | | | 275,692 | |
Sr. Unsec’d. Notes, 144A | | 3.500 | | 08/15/27 | | | 2,000 | | | | 1,920,800 | |
Time Warner Cable LLC,
Sr. Sec’d. Notes | | 5.500 | | 09/01/41 | | | 150 | | | | 128,005 | |
| | | | | | | | | | | | |
| | | | |
| | | | | | | | | | | 13,774,217 | |
|
Mining 0.8% | |
| | | | |
Barrick North America Finance LLC (Canada),
Gtd. Notes | | 5.750 | | 05/01/43 | | | 190 | | | | 194,241 | |
BHP Billiton Finance USA Ltd. (Australia),
Gtd. Notes | | 5.250 | | 09/08/33 | | | 4,245 | | | | 4,344,256 | |
Freeport Indonesia PT (Indonesia),
Sr. Unsec’d. Notes, 144A, MTN | | 4.763 | | 04/14/27 | | | 225 | | | | 222,118 | |
See Notes to Financial Statements.
PGIM Core Bond Fund 27
PGIM Core Bond Fund
Schedule of Investments (continued)
as of July 31, 2024
| | | | | | | | | | | | | | | | |
| | | | |
| Description | | Interest
Rate | | | Maturity
Date | | | Principal Amount (000)# | | | Value | |
|
CORPORATE BONDS (Continued) | |
|
Mining (cont’d.) | |
| | | | |
Newmont Corp., | | | | | | | | | | | | | | | | |
Gtd. Notes | | | 2.250% | | | | 10/01/30 | | | | 845 | | | $ | 738,015 | |
Gtd. Notes | | | 2.800 | | | | 10/01/29 | | | | 1,270 | | | | 1,164,756 | |
Newmont Corp./Newcrest Finance Pty Ltd.,
Gtd. Notes, 144A | | | 5.350 | | | | 03/15/34 | | | | 6,205 | | | | 6,352,655 | |
Yamana Gold, Inc. (Canada),
Gtd. Notes | | | 2.630 | | | | 08/15/31 | | | | 3,120 | | | | 2,637,298 | |
| | | | | | | | | | | | | | | | |
| | | | |
| | | | | | | | | | | | | | | 15,653,339 | |
| | | | |
Miscellaneous Manufacturing 0.2% | | | | | | | | | | | | | | | | |
| | | | |
Teledyne Technologies, Inc.,
Gtd. Notes | | | | | | | | | | | | | | | | |
| | | | |
| | | 2.750 | | | | 04/01/31 | | | | 3,510 | | | | 3,072,489 | |
| | | | |
Multi-National 0.1% | | | | | | | | | | | | | | | | |
| | | | |
Corp. Andina de Fomento (Supranational Bank),
Sr. Unsec’d. Notes | | | | | | | | | | | | | | | | |
| | | 5.000 | | | | 01/24/29 | | | | 1,660 | | | | 1,679,024 | |
| | | | |
Office/Business Equipment 0.1% | | | | | | | | | | | | | | | | |
| | | | |
CDW LLC/CDW Finance Corp.,
Gtd. Notes | | | | | | | | | | | | | | | | |
| | | 2.670 | | | | 12/01/26 | | | | 3,145 | | | | 2,979,410 | |
| | | | |
Oil & Gas 1.5% | | | | | | | | | | | | | | | | |
| | | | |
Aker BP ASA (Norway), | | | | | | | | | | | | | | | | |
Gtd. Notes, 144A | | | 3.100 | | | | 07/15/31 | | | | 770 | | | | 667,566 | |
Sr. Unsec’d. Notes, 144A | | | 2.000 | | | | 07/15/26 | | | | 2,435 | | | | 2,295,942 | |
BP Capital Markets PLC,
Gtd. Notes | | | 4.375(ff) | | | | 06/22/25(oo) | | | | 501 | | | | 492,859 | |
Canadian Natural Resources Ltd. (Canada),
Sr. Unsec’d. Notes | | | 6.250 | | | | 03/15/38 | | | | 175 | | | | 184,853 | |
Cenovus Energy, Inc. (Canada), | | | | | | | | | | | | | | | | |
Sr. Unsec’d. Notes(a) | | | 3.750 | | | | 02/15/52 | | | | 1,685 | | | | 1,223,922 | |
Sr. Unsec’d. Notes | | | 5.400 | | | | 06/15/47 | | | | 229 | | | | 215,914 | |
Sr. Unsec’d. Notes | | | 6.750 | | | | 11/15/39 | | | | 45 | | | | 49,623 | |
Continental Resources, Inc.,
Gtd. Notes, 144A | | | 2.268 | | | | 11/15/26 | | | | 330 | | | | 309,942 | |
See Notes to Financial Statements.
28
PGIM Core Bond Fund
Schedule of Investments (continued)
as of July 31, 2024
| | | | | | | | | | | | | | | | |
| | | | |
| Description | | Interest
Rate | | | Maturity
Date | | | Principal Amount (000)# | | | Value | |
|
CORPORATE BONDS (Continued) | |
|
Oil & Gas (cont’d.) | |
| | | | |
Diamondback Energy, Inc.,
Gtd. Notes | | | 5.400% | | | | 04/18/34 | | | | 5,555 | | | $ | 5,622,986 | |
Ecopetrol SA (Colombia),
Sr. Unsec’d. Notes | | | 8.625 | | | | 01/19/29 | | | | 2,105 | | | | 2,233,405 | |
Equinor ASA (Norway),
Gtd. Notes | | | 2.375 | | | | 05/22/30 | | | | 1,110 | | | | 988,890 | |
Korea National Oil Corp. (South Korea), | | | | | | | | | | | | | | | | |
Sr. Unsec’d. Notes, 144A | | | 4.750 | | | | 04/03/26 | | | | 510 | | | | 508,256 | |
Sr. Unsec’d. Notes, 144A | | | 4.875 | | | | 04/03/28 | | | | 530 | | | | 532,873 | |
Marathon Petroleum Corp.,
Sr. Unsec’d. Notes | | | 3.800 | | | | 04/01/28 | | | | 380 | | | | 367,916 | |
Occidental Petroleum Corp., | | | | | | | | | | | | | | | | |
Sr. Unsec’d. Notes | | | 7.500 | | | | 05/01/31 | | | | 100 | | | | 112,420 | |
Sr. Unsec’d. Notes | | | 7.875 | | | | 09/15/31 | | | | 250 | | | | 285,946 | |
Petroleos Mexicanos (Mexico), | | | | | | | | | | | | | | | | |
Gtd. Notes | | | 5.950 | | | | 01/28/31 | | | | 398 | | | | 327,912 | |
Gtd. Notes | | | 6.490 | | | | 01/23/27 | | | | 1,048 | | | | 1,012,368 | |
Gtd. Notes | | | 6.500 | | | | 03/13/27 | | | | 1,020 | | | | 980,220 | |
Gtd. Notes, MTN | | | 6.875 | | | | 08/04/26 | | | | 870 | | | | 858,046 | |
Phillips 66 Co., | | | | | | | | | | | | | | | | |
Gtd. Notes | | | 3.150 | | | | 12/15/29 | | | | 5,000 | | | | 4,610,890 | |
Gtd. Notes | | | 3.550 | | | | 10/01/26 | | | | 310 | | | | 301,889 | |
QatarEnergy (Qatar), | | | | | | | | | | | | | | | | |
Sr. Unsec’d. Notes, 144A | | | 1.375 | | | | 09/12/26 | | | | 500 | | | | 464,530 | |
Sr. Unsec’d. Notes, 144A | | | 2.250 | | | | 07/12/31 | | | | 1,090 | | | | 928,544 | |
Raizen Fuels Finance SA (Brazil),
Gtd. Notes, 144A | | | 6.450 | | | | 03/05/34 | | | | 1,800 | | | | 1,855,350 | |
Santos Finance Ltd. (Australia),
Gtd. Notes, 144A | | | 6.875 | | | | 09/19/33 | | | | 1,010 | | | | 1,100,736 | |
| | | | | | | | | | | | | | | | |
| | | | |
| | | | | | | | | | | | | | | 28,533,798 | |
| | | | |
Oil & Gas Services 0.0% | | | | | | | | | | | | | | | | |
| | | | |
Schlumberger Holdings Corp.,
Sr. Unsec’d. Notes, 144A | | | | | | | | | | | | | | | | |
| | | 3.900 | | | | 05/17/28 | | | | 487 | | | | 473,211 | |
| | | | |
Packaging & Containers 0.4% | | | | | | | | | | | | | | | | |
| | | | |
Berry Global, Inc.,
Sr. Sec’d. Notes | | | 1.570 | | | | 01/15/26 | | | | 4,740 | | | | 4,502,663 | |
See Notes to Financial Statements.
PGIM Core Bond Fund 29
PGIM Core Bond Fund
Schedule of Investments (continued)
as of July 31, 2024
| | | | | | | | | | | | | | | | |
| | | | |
| Description | | Interest
Rate | | | Maturity
Date | | | Principal Amount (000)# | | | Value | |
|
CORPORATE BONDS (Continued) | |
|
Packaging & Containers (cont’d.) | |
| | | | |
Graphic Packaging International LLC,
Sr. Sec’d. Notes, 144A | | | 1.512% | | | | 04/15/26 | | | | 3,070 | | | $ | 2,873,542 | |
WRKCo, Inc.,
Gtd. Notes | | | 4.650 | | | | 03/15/26 | | | | 560 | | | | 556,044 | |
| | | | | | | | | | | | | | | | |
| | | | |
| | | | | | | | | | | | | | | 7,932,249 | |
| | | | |
Pharmaceuticals 1.4% | | | | | | | | | | | | | | | | |
| | | | |
AbbVie, Inc., | | | | | | | | | | | | | | | | |
Sr. Unsec’d. Notes | | | 3.800 | | | | 03/15/25 | | | | 105 | | | | 103,949 | |
Sr. Unsec’d. Notes | | | 4.050 | | | | 11/21/39 | | | | 285 | | | | 254,632 | |
Sr. Unsec’d. Notes | | | 4.250 | | | | 11/21/49 | | | | 220 | | | | 187,977 | |
Sr. Unsec’d. Notes | | | 4.550 | | | | 03/15/35 | | | | 360 | | | | 350,517 | |
Sr. Unsec’d. Notes | | | 4.700 | | | | 05/14/45 | | | | 1,170 | | | | 1,085,534 | |
Sr. Unsec’d. Notes | | | 4.750 | | | | 03/15/45 | | | | 1,008 | | | | 939,405 | |
Cencora, Inc.,
Sr. Unsec’d. Notes | | | 3.250 | | | | 03/01/25 | | | | 55 | | | | 54,247 | |
Cigna Group (The),
Gtd. Notes(a) | | | 3.400 | | | | 03/01/27 | | | | 325 | | | | 314,589 | |
Gtd. Notes | | | 4.375 | | | | 10/15/28 | | | | 1,950 | | | | 1,923,461 | |
Gtd. Notes | | | 4.500 | | | | 02/25/26 | | | | 457 | | | | 454,234 | |
Sr. Unsec’d. Notes | | | 2.400 | | | | 03/15/30 | | | | 5,340 | | | | 4,733,286 | |
CVS Health Corp., | | | | | | | | | | | | | | | | |
Sr. Unsec’d. Notes | | | 2.700 | | | | 08/21/40 | | | | 385 | | | | 263,152 | |
Sr. Unsec’d. Notes | | | 5.125 | | | | 02/21/30 | | | | 3,190 | | | | 3,217,613 | |
Sr. Unsec’d. Notes | | | 5.125 | | | | 07/20/45 | | | | 465 | | | | 418,865 | |
Sr. Unsec’d. Notes | | | 5.875 | | | | 06/01/53 | | | | 125 | | | | 122,707 | |
Eli Lilly & Co.,
Sr. Unsec’d. Notes | | | 5.000 | | | | 02/09/54 | | | | 1,455 | | | | 1,417,538 | |
Johnson & Johnson,
Sr. Unsec’d. Notes(h) | | | 3.625 | | | | 03/03/37 | | | | 3,205 | | | | 2,873,407 | |
McKesson Corp.,
Sr. Unsec’d. Notes | | | 5.100 | | | | 07/15/33 | | | | 2,525 | | | | 2,578,915 | |
Mylan, Inc., | | | | | | | | | | | | | | | | |
Gtd. Notes | | | 5.200 | | | | 04/15/48 | | | | 1,250 | | | | 1,052,297 | |
Gtd. Notes | | | 5.400 | | | | 11/29/43 | | | | 860 | | | | 770,033 | |
Shire Acquisitions Investments Ireland DAC,
Gtd. Notes | | | 3.200 | | | | 09/23/26 | | | | 28 | | | | 27,093 | |
Utah Acquisition Sub, Inc.,
Gtd. Notes | | | 3.950 | | | | 06/15/26 | | | | 3,130 | | | | 3,068,521 | |
See Notes to Financial Statements.
30
PGIM Core Bond Fund
Schedule of Investments (continued)
as of July 31, 2024
| | | | | | | | | | | | | | | | |
| | | | |
| Description | | Interest
Rate | | | Maturity
Date | | | Principal Amount (000)# | | | Value | |
|
CORPORATE BONDS (Continued) | |
|
Pharmaceuticals (cont’d.) | |
| | | | |
Utah Acquisition Sub, Inc., (cont’d.) | | | | | | | | | | | | | | | | |
Gtd. Notes | | | 5.250% | | | | 06/15/46 | | | | 105 | | | $ | 89,793 | |
Viatris, Inc.,
Gtd. Notes | | | 3.850 | | | | 06/22/40 | | | | 920 | | | | 693,509 | |
| | | | | | | | | | | | | | | | |
| | | | |
| | | | | | | | | | | | | | | 26,995,274 | |
| | | | |
Pipelines 1.8% | | | | | | | | | | | | | | | | |
| | | | |
Boardwalk Pipelines LP,
Gtd. Notes | | | 3.400 | | | | 02/15/31 | | | | 1,300 | | | | 1,161,681 | |
Colonial Enterprises, Inc.,
Gtd. Notes, 144A | | | 3.250 | | | | 05/15/30 | | | | 1,730 | | | | 1,584,606 | |
Colorado Interstate Gas Co. LLC/Colorado Interstate Issuing Corp.,
Gtd. Notes, 144A | | | 4.150 | | | | 08/15/26 | | | | 555 | | | | 544,707 | |
Columbia Pipelines Operating Co. LLC,
Sr. Unsec’d. Notes, 144A | | | 5.927 | | | | 08/15/30 | | | | 935 | | | | 975,401 | |
EIG Pearl Holdings Sarl (Saudi Arabia),
Sr. Sec’d. Notes, 144A | | | 3.545 | | | | 08/31/36 | | | | 1,674 | | | | 1,437,024 | |
Energy Transfer LP, | | | | | | | | | | | | | | | | |
Sr. Unsec’d. Notes | | | 4.950 | | | | 06/15/28 | | | | 430 | | | | 431,396 | |
Sr. Unsec’d. Notes | | | 5.000 | | | | 05/15/50 | | | | 565 | | | | 492,985 | |
Sr. Unsec’d. Notes | | | 5.400 | | | | 10/01/47 | | | | 1,800 | | | | 1,658,216 | |
Sr. Unsec’d. Notes | | | 6.250 | | | | 04/15/49 | | | | 910 | | | | 931,879 | |
Sr. Unsec’d. Notes | | | 6.400 | | | | 12/01/30 | | | | 520 | | | | 559,077 | |
Sr. Unsec’d. Notes | | | 6.550 | | | | 12/01/33 | | | | 2,285 | | | | 2,473,498 | |
Enterprise Products Operating LLC, | | | | | | | | | | | | | | | | |
Gtd. Notes | | | 3.700 | | | | 01/31/51 | | | | 445 | | | | 338,392 | |
Gtd. Notes | | | 3.950 | | | | 01/31/60 | | | | 525 | | | | 399,244 | |
Greensaif Pipelines Bidco Sarl (Saudi Arabia), | | | | | | | | | | | | | | | | |
Sr. Sec’d. Notes, 144A | | | 6.129 | | | | 02/23/38 | | | | 560 | | | | 571,004 | |
Sr. Sec’d. Notes, 144A | | | 6.510 | | | | 02/23/42 | | | | 725 | | | | 754,000 | |
MPLX LP, | | | | | | | | | | | | | | | | |
Sr. Unsec’d. Notes | | | 2.650 | | | | 08/15/30 | | | | 4,920 | | | | 4,344,050 | |
Sr. Unsec’d. Notes | | | 4.000 | | | | 02/15/25 | | | | 130 | | | | 128,793 | |
Sr. Unsec’d. Notes | | | 4.500 | | | | 04/15/38 | | | | 270 | | | | 243,227 | |
Sr. Unsec’d. Notes | | | 4.875 | | | | 06/01/25 | | | | 200 | | | | 199,030 | |
Sr. Unsec’d. Notes | | | 5.200 | | | | 03/01/47 | | | | 5 | | | | 4,599 | |
Sr. Unsec’d. Notes | | | 5.500 | | | | 06/01/34 | | | | 3,340 | | | | 3,365,001 | |
Sr. Unsec’d. Notes | | | 5.500 | | | | 02/15/49 | | | | 210 | | | | 198,570 | |
See Notes to Financial Statements.
PGIM Core Bond Fund 31
PGIM Core Bond Fund
Schedule of Investments (continued)
as of July 31, 2024
| | | | | | | | | | | | | | | | |
| | | | |
| Description | | Interest
Rate | | | Maturity
Date | | | Principal Amount (000)# | | | Value | |
|
CORPORATE BONDS (Continued) | |
|
Pipelines (cont’d.) | |
| | | | |
ONEOK Partners LP,
Gtd. Notes | | | 6.125% | | | | 02/01/41 | | | | 300 | | | $ | 306,268 | |
ONEOK, Inc., | | | | | | | | | | | | | | | | |
Gtd. Notes | | | 3.100 | | | | 03/15/30 | | | | 2,415 | | | | 2,205,800 | |
Gtd. Notes | | | 4.200 | | | | 03/15/45 | | | | 275 | | | | 213,474 | |
Gtd. Notes | | | 4.500 | | | | 03/15/50 | | | | 195 | | | | 159,230 | |
Gtd. Notes(a) | | | 6.050 | | | | 09/01/33 | | | | 2,510 | | | | 2,640,928 | |
Plains All American Pipeline LP/PAA Finance Corp., | | | | | | | | | | | | | | | | |
Sr. Unsec’d. Notes | | | 3.550 | | | | 12/15/29 | | | | 350 | | | | 326,681 | |
Sr. Unsec’d. Notes | | | 4.650 | | | | 10/15/25 | | | | 1,000 | | | | 993,409 | |
Spectra Energy Partners LP,
Gtd. Notes | | | 3.375 | | | | 10/15/26 | | | | 140 | | | | 135,462 | |
Targa Resources Corp., | | | | | | | | | | | | | | | | |
Gtd. Notes | | | 6.125 | | | | 03/15/33 | | | | 1,240 | | | | 1,304,023 | |
Gtd. Notes(a) | | | 6.250 | | | | 07/01/52 | | | | 1,305 | | | | 1,351,123 | |
Gtd. Notes | | | 6.500 | | | | 03/30/34 | | | | 1,095 | | | | 1,185,581 | |
Texas Eastern Transmission LP,
Sr. Unsec’d. Notes, 144A | | | 3.500 | | | | 01/15/28 | | | | 300 | | | | 287,012 | |
Transcontinental Gas Pipe Line Co. LLC, | | | | | | | | | | | | | | | | |
Sr. Unsec’d. Notes | | | 3.950 | | | | 05/15/50 | | | | 625 | | | | 483,525 | |
Sr. Unsec’d. Notes | | | 4.600 | | | | 03/15/48 | | | | 500 | | | | 433,695 | |
Western Midstream Operating LP,
Sr. Unsec’d. Notes | | | 5.300 | | | | 03/01/48 | | | | 320 | | | | 282,118 | |
Williams Cos., Inc. (The), | | | | | | | | | | | | | | | | |
Sr. Unsec’d. Notes | | | 4.000 | | | | 09/15/25 | | | | 350 | | | | 345,675 | |
Sr. Unsec’d. Notes | | | 5.150 | | | | 03/15/34 | | | | 90 | | | | 89,714 | |
Sr. Unsec’d. Notes | | | 5.400 | | | | 03/04/44 | | | | 400 | | | | 383,460 | |
| | | | | | | | | | | | | | | | |
| | | | |
| | | | | | | | | | | | | | | 35,923,558 | |
| | | | |
Real Estate 0.2% | | | | | | | | | | | | | | | | |
Ontario Teachers’ Cadillac Fairview Properties Trust (Canada),
Sr. Unsec’d. Notes, 144A | | | | | | | | | | | | | | | | |
| | | 4.125 | | | | 02/01/29 | | | | 4,190 | | | | 4,035,389 | |
| | | | |
Real Estate Investment Trusts (REITs) 1.4% | | | | | | | | | | | | | | | | |
Alexandria Real Estate Equities, Inc., | | | | | | | | | | | | | | | | |
Gtd. Notes | | | 2.000 | | | | 05/18/32 | | | | 1,645 | | | | 1,319,665 | |
Gtd. Notes | | | 4.750 | | | | 04/15/35 | | | | 425 | | | | 404,043 | |
See Notes to Financial Statements.
32
PGIM Core Bond Fund
Schedule of Investments (continued)
as of July 31, 2024
| | | | | | | | | | | | | | | | |
| | | | |
| Description | | Interest
Rate | | | Maturity
Date | | | Principal Amount (000)# | | | Value | |
|
CORPORATE BONDS (Continued) | |
|
Real Estate Investment Trusts (REITs) (cont’d.) | |
| | | | |
Brixmor Operating Partnership LP, | | | | | | | | | | | | | | | | |
Sr. Unsec’d. Notes | | | 4.050% | | | | 07/01/30 | | | | 3,665 | | | $ | 3,479,028 | |
Sr. Unsec’d. Notes | | | 5.500 | | | | 02/15/34 | | | | 895 | | | | 897,854 | |
COPT Defense Properties LP,
Gtd. Notes | | | 2.900 | | | | 12/01/33 | | | | 1,400 | | | | 1,130,205 | |
CubeSmart LP,
Gtd. Notes | | | 2.250 | | | | 12/15/28 | | | | 3,360 | | | | 3,017,544 | |
Healthpeak OP LLC,
Gtd. Notes | | | 2.875 | | | | 01/15/31 | | | | 630 | | | | 555,629 | |
Prologis LP,
Sr. Unsec’d. Notes(a) | | | 1.250 | | | | 10/15/30 | | | | 2,765 | | | | 2,263,049 | |
Realty Income Corp., | | | | | | | | | | | | | | | | |
Sr. Unsec’d. Notes | | | 1.800 | | | | 03/15/33 | | | | 325 | | | | 251,144 | |
Sr. Unsec’d. Notes | | | 3.250 | | | | 01/15/31 | | | | 985 | | | | 893,654 | |
Sun Communities Operating LP, | | | | | | | | | | | | | | | | |
Gtd. Notes | | | 2.300 | | | | 11/01/28 | | | | 4,585 | | | | 4,100,787 | |
Gtd. Notes | | | 5.500 | | | | 01/15/29 | | | | 2,785 | | | | 2,826,577 | |
VICI Properties LP/VICI Note Co., Inc.,
Gtd. Notes, 144A | | | 5.750 | | | | 02/01/27 | | | | 4,680 | | | | 4,722,367 | |
Welltower OP LLC,
Gtd. Notes | | | 2.700 | | | | 02/15/27 | | | | 775 | | | | 738,896 | |
| | | | | | | | | | | | | | | | |
| | | | |
| | | | | | | | | | | | | | | 26,600,442 | |
| | | | |
Retail 0.2% | | | | | | | | | | | | | | | | |
| | | | |
Alimentation Couche-Tard, Inc. (Canada),
Gtd. Notes, 144A | | | 3.550 | | | | 07/26/27 | | | | 940 | | | | 906,148 | |
AutoZone, Inc.,
Sr. Unsec’d. Notes | | | 1.650 | | | | 01/15/31 | | | | 620 | | | | 509,622 | |
Falabella SA (Chile),
Sr. Unsec’d. Notes, 144A | | | 4.375 | | | | 01/27/25 | | | | 1,700 | | | | 1,682,490 | |
| | | | | | | | | | | | | | | | |
| | | | |
| | | | | | | | | | | | | | | 3,098,260 | |
| | | | |
Semiconductors 0.3% | | | | | | | | | | | | | | | | |
| | | | |
Broadcom, Inc.,
Sr. Unsec’d. Notes, 144A | | | 3.137 | | | | 11/15/35 | | | | 287 | | | | 236,697 | |
See Notes to Financial Statements.
PGIM Core Bond Fund 33
PGIM Core Bond Fund
Schedule of Investments (continued)
as of July 31, 2024
| | | | | | | | | | | | | | | | |
| | | | |
| Description | | Interest
Rate | | | Maturity
Date | | | Principal Amount (000)# | | | Value | |
|
CORPORATE BONDS (Continued) | |
|
Semiconductors (cont’d.) | |
| | | | |
Broadcom, Inc., (cont’d.) | | | | | | | | | | | | | | | | |
Sr. Unsec’d. Notes, 144A | | | 3.187% | | | | 11/15/36 | | | | 1,000 | | | $ | 815,958 | |
Sr. Unsec’d. Notes, 144A | | | 3.419 | | | | 04/15/33 | | | | 4,847 | | | | 4,284,401 | |
| | | | | | | | | | | | | | | | |
| | | | |
| | | | | | | | | | | | | | | 5,337,056 | |
| | | | |
Software 0.2% | | | | | | | | | | | | | | | | |
| | | | |
Oracle Corp.,
Sr. Unsec’d. Notes | | | 4.300 | | | | 07/08/34 | | | | 2,408 | | | | 2,255,482 | |
Workday, Inc.,
Sr. Unsec’d. Notes | | | 3.800 | | | | 04/01/32 | | | | 2,435 | | | | 2,245,351 | |
| | | | | | | | | | | | | | | | |
| | | | |
| | | | | | | | | | | | | | | 4,500,833 | |
| | | | |
Telecommunications 1.7% | | | | | | | | | | | | | | | | |
| | | | |
AT&T, Inc., | | | | | | | | | | | | | | | | |
Sr. Unsec’d. Notes | | | 2.550 | | | | 12/01/33 | | | | 58 | | | | 47,474 | |
Sr. Unsec’d. Notes | | | 3.500 | | | | 09/15/53 | | | | 1,734 | | | | 1,211,976 | |
Sr. Unsec’d. Notes | | | 3.650 | | | | 09/15/59 | | | | 1,717 | | | | 1,185,957 | |
Sr. Unsec’d. Notes | | | 3.800 | | | | 12/01/57 | | | | 1,128 | | | | 810,942 | |
Sr. Unsec’d. Notes | | | 4.500 | | | | 05/15/35 | | | | 205 | | | | 193,251 | |
Sr. Unsec’d. Notes | | | 5.400 | | | | 02/15/34 | | | | 5,030 | | | | 5,135,649 | |
Motorola Solutions, Inc.,
Sr. Unsec’d. Notes | | | 5.400 | | | | 04/15/34 | | | | 4,540 | | | | 4,621,082 | |
Rogers Communications, Inc. (Canada),
Gtd. Notes(a) | | | 5.300 | | | | 02/15/34 | | | | 3,365 | | | | 3,372,153 | |
T-Mobile USA, Inc., | | | | | | | | | | | | | | | | |
Gtd. Notes | | | 2.550 | | | | 02/15/31 | | | | 1,635 | | | | 1,419,323 | |
Gtd. Notes | | | 3.000 | | | | 02/15/41 | | | | 640 | | | | 471,605 | |
Gtd. Notes | | | 3.750 | | | | 04/15/27 | | | | 970 | | | | 945,645 | |
Gtd. Notes | | | 3.875 | | | | 04/15/30 | | | | 4,780 | | | | 4,558,984 | |
Gtd. Notes | | | 4.375 | | | | 04/15/40 | | | | 380 | | | | 336,736 | |
Verizon Communications, Inc., | | | | | | | | | | | | | | | | |
Sr. Unsec’d. Notes | | | 1.680 | | | | 10/30/30 | | | | 170 | | | | 141,573 | |
Sr. Unsec’d. Notes | | | 2.355 | | | | 03/15/32 | | | | 8,190 | | | | 6,851,943 | |
Sr. Unsec’d. Notes | | | 2.550 | | | | 03/21/31 | | | | 2,729 | | | | 2,363,623 | |
| | | | | | | | | | | | | | | | |
| | | | |
| | | | | | | | | | | | | | | 33,667,916 | |
See Notes to Financial Statements.
34
PGIM Core Bond Fund
Schedule of Investments (continued)
as of July 31, 2024
| | | | | | | | | | | | | | | | |
| | | | |
| Description | | Interest
Rate | | | Maturity
Date | | | Principal Amount (000)# | | | Value | |
|
CORPORATE BONDS (Continued) | |
|
Transportation 0.1% | |
| | | | |
Burlington Northern Santa Fe LLC,
Sr. Unsec’d. Notes | | | 3.050% | | | | 02/15/51 | | | | 910 | | | $ | 621,003 | |
Canadian Pacific Railway Co. (Canada),
Gtd. Notes | | | 3.500 | | | | 05/01/50 | | | | 1,585 | | | | 1,167,047 | |
| | | | | | | | | | | | | | | | |
| | | | |
| | | | | | | | | | | | | | | 1,788,050 | |
| | | | |
Trucking & Leasing 0.1% | | | | | | | | | | | | | | | | |
| | | | |
Penske Truck Leasing Co. LP/PTL Finance Corp.,
Sr. Unsec’d. Notes, 144A | | | | | | | | | | | | | | | | |
| | | 5.750 | | | | 05/24/26 | | | | 2,930 | | | | 2,958,034 | |
| | | | |
Water 0.0% | | | | | | | | | | | | | | | | |
| | | | |
American Water Capital Corp.,
Sr. Unsec’d. Notes | | | | | | | | | | | | | | | | |
| | | 4.000 | | | | 12/01/46 | | | | 145 | | | | 117,546 | |
| | | | | | | | | | | | | | | | |
| | | | |
TOTAL CORPORATE BONDS
(cost $648,349,143) | | | | | | | | | | | | | | | 610,460,126 | |
| | | | | | | | | | | | | | | | |
| | | | |
MUNICIPAL BONDS 0.3% | | | | | | | | | | | | | | | | |
| | | | |
Alabama 0.0% | | | | | | | | | | | | | | | | |
| | | | |
Alabama Economic Settlement Authority,
Taxable, Revenue Bonds, Series B | | | 4.263 | | | | 09/15/32 | | | | 40 | | | | 38,995 | |
| | | | |
California 0.0% | | | | | | | | | | | | | | | | |
| | | | |
City of Los Angeles Department of Airports,
Taxable, Revenue Bonds, BABs | | | 6.582 | | | | 05/15/39 | | | | 260 | | | | 284,978 | |
University of California, | | | | | | | | | | | | | | | | |
Taxable, Revenue Bonds, Series AP | | | 3.931 | | | | 05/15/45 | | | | 30 | | | | 27,874 | |
Taxable, Revenue Bonds, Series J | | | 4.131 | | | | 05/15/45 | | | | 30 | | | | 27,537 | |
| | | | | | | | | | | | | | | | |
| | | | |
| | | | | | | | | | | | | | | 340,389 | |
| | | | |
New Jersey 0.0% | | | | | | | | | | | | | | | | |
| | | | |
New Jersey Turnpike Authority,
Taxable, Revenue Bonds, BABs, Series A | | | 7.102 | | | | 01/01/41 | | | | 250 | | | | 292,169 | |
See Notes to Financial Statements.
PGIM Core Bond Fund 35
PGIM Core Bond Fund
Schedule of Investments (continued)
as of July 31, 2024
| | | | | | | | | | | | | | | | |
| | | | |
| Description | | Interest
Rate | | | Maturity
Date | | | Principal Amount (000)# | | | Value | |
|
MUNICIPAL BONDS (Continued) | |
|
New York 0.1% | |
| | | | |
Port Authority of New York & New Jersey,
Revenue Bonds | | | 5.072% | | | | 07/15/53 | | | | 2,525 | | | $ | 2,530,820 | |
| | | | |
Pennsylvania 0.1% | | | | | | | | | | | | | | | | |
| | | | |
Pennsylvania State University (The),
Taxable, Revenue Bonds, Series D | | | 2.840 | | | | 09/01/50 | | | | 745 | | | | 519,364 | |
Pennsylvania Turnpike Commission, | | | | | | | | | | | | | | | | |
Revenue Bonds, BABs | | | 6.105 | | | | 12/01/39 | | | | 70 | | | | 76,049 | |
Revenue Bonds, BABs, Series B | | | 5.511 | | | | 12/01/45 | | | | 150 | | | | 152,791 | |
| | | | | | | | | | | | | | | | |
| | | | |
| | | | | | | | | | | | | | | 748,204 | |
| | | | |
Texas 0.1% | | | | | | | | | | | | | | | | |
| | | | |
City of San Antonio Electric & Gas Systems Revenue,
Revenue Bonds, BABs | | | 5.985 | | | | 02/01/39 | | | | 775 | | | | 824,483 | |
Grand Parkway Transportation Corp.,
Taxable, Revenue Bonds, Series E | | | 5.184 | | | | 10/01/42 | | | | 775 | | | | 793,097 | |
Permanent University Fund - University of Texas System,
Taxable, Revenue Bonds, Series A | | | 3.376 | | | | 07/01/47 | | | | 555 | | | | 438,998 | |
Texas Private Activity Bond Surface Transportation Corp.,
Taxable, Revenue Bonds, Series B | | | 3.922 | | | | 12/31/49 | | | | 340 | | | | 285,736 | |
| | | | | | | | | | | | | | | | |
| | | | |
| | | | | | | | | | | | | | | 2,342,314 | |
| | | | |
Virginia 0.0% | | | | | | | | | | | | | | | | |
| | | | |
University of Virginia,
Taxable, Revenue Bonds, Series C | | | 4.179 | | | | 09/01/2117 | | | | 130 | | | | 107,651 | |
| | | | | | | | | | | | | | | | |
| | | | |
TOTAL MUNICIPAL BONDS
(cost $7,258,296) | | | | | | | | | | | | | | | 6,400,542 | |
| | | | | | | | | | | | | | | | |
| | | | |
RESIDENTIAL MORTGAGE-BACKED SECURITIES 2.2% | | | | | | | | | | | | | | | | |
Alternative Loan Trust,
Series 2003-J03, Class 2A1 | | | 6.250 | | | | 12/25/33 | | | | 1 | | | | 1,505 | |
BCAP LLC Trust,
Series 2011-RR04, Class 7A1, 144A | | | 5.250 | | | | 04/26/37 | | | | 105 | | | | 58,624 | |
Bellemeade Re Ltd.,
Series 2021-03A, Class A2, 144A, 30 Day Average SOFR + 1.000%
(Cap N/A, Floor 1.000%) | | | 6.347(c) | | | | 09/25/31 | | | | 2,200 | | | | 2,199,989 | |
See Notes to Financial Statements.
36
PGIM Core Bond Fund
Schedule of Investments (continued)
as of July 31, 2024
| | | | | | | | | | | | | | | | |
| | | | |
| Description | | Interest
Rate | | | Maturity
Date | | | Principal Amount (000)# | | | Value | |
| | | | |
RESIDENTIAL MORTGAGE-BACKED SECURITIES (Continued) | | | | | | | | | | | | | | | | |
Bellemeade Re Ltd., (cont’d.) | | | | | | | | | | | | | | | | |
Series 2022-01, Class M1A, 144A, 30 Day Average SOFR + 1.750%
(Cap N/A, Floor 1.750%) | | | 7.097%(c) | | | | 01/26/32 | | | | 587 | | | $ | 588,114 | |
BRAVO Residential Funding Trust,
Series 2023-RPL01, Class A1, 144A | | | 5.000(cc) | | | | 05/25/63 | | | | 3,364 | | | | 3,360,029 | |
Chase Home Lending Mortgage Trust, | | | | | | | | | | | | | | | | |
Series 2023-RPL01, Class A1, 144A | | | 3.500(cc) | | | | 06/25/62 | | | | 1,756 | | | | 1,605,809 | |
Series 2024-RPL03, Class A1A, 144A | | | 3.250(cc) | | | | 09/25/64 | | | | 1,493 | | | | 1,321,886 | |
CIM Trust,
Series 2024-R01, Class A1, 144A | | | 4.750(cc) | | | | 06/25/64 | | | | 3,000 | | | | 2,902,257 | |
Connecticut Avenue Securities Trust, | | | | | | | | | | | | | | | | |
Series 2022-R01, Class 1M2, 144A, 30 Day Average SOFR + 1.900% (Cap N/A, Floor 0.000%) | | | 7.247(c) | | | | 12/25/41 | | | | 2,120 | | | | 2,147,836 | |
Series 2023-R08, Class 1M1, 144A, 30 Day Average SOFR + 1.500% (Cap N/A, Floor 0.000%) | | | 6.847(c) | | | | 10/25/43 | | | | 1,259 | | | | 1,265,956 | |
Credit Suisse First Boston Mortgage Securities Corp.,
Series 2003-08, Class 5A1 | | | 6.500 | | | | 04/25/33 | | | | 1 | | | | 691 | |
Credit Suisse Mortgage Trust, | | | | | | | | | | | | | | | | |
Series 2020-RPL06, Class A1, 144A | | | 3.439(cc) | | | | 03/25/59 | | | | 826 | | | | 825,883 | |
Series 2022-RPL04, Class A1, 144A | | | 3.904(cc) | | | | 04/25/62 | | | | 1,081 | | | | 1,028,775 | |
Fannie Mae REMIC, | | | | | | | | | | | | | | | | |
Series 2014-11, Class VB | | | 4.500 | | | | 04/25/42 | | | | 500 | | | | 491,692 | |
Series 2020-24, Class SP, IO, 30 Day Average SOFR x (1) + 5.936%
(Cap 6.050%, Floor 0.000%) | | | 0.588(c) | | | | 04/25/50 | | | | 1,161 | | | | 138,900 | |
Series 2023-54, Class PO, PO | | | 1.842(s) | | | | 11/25/53 | | | | 3,795 | | | | 2,980,008 | |
FHLMC Structured Agency Credit Risk REMIC Trust, | | | | | | | | | | | | | | | | |
Series 2021-DNA05, Class M2, 144A, 30 Day Average SOFR + 1.650% (Cap N/A, Floor 0.000%) | | | 6.997(c) | | | | 01/25/34 | | | | 160 | | | | 161,214 | |
Series 2021-HQA03, Class M1, 144A, 30 Day Average SOFR + 0.850% (Cap N/A, Floor 0.000%) | | | 6.197(c) | | | | 09/25/41 | | | | 4,487 | | | | 4,473,438 | |
Series 2022-DNA01, Class M1A, 144A, 30 Day Average SOFR + 1.000% (Cap N/A, Floor 0.000%) | | | 6.347(c) | | | | 01/25/42 | | | | 1,312 | | | | 1,313,348 | |
FHLMC Structured Pass-Through Certificates,
Series T-59, Class 1A2 | | | 7.000 | | | | 10/25/43 | | | | 57 | | | | 59,119 | |
Freddie Mac REMIC, | | | | | | | | | | | | | | | | |
Series 4249, Class GW | | | 3.500 | | | | 10/15/41 | | | | 724 | | | | 678,403 | |
Series 5019, Class IP, IO | | | 3.000 | | | | 10/25/50 | | | | 807 | | | | 133,984 | |
Series 5021, Class SB, IO, 30 Day Average SOFR x (1) + 3.550%
(Cap 3.550%, Floor 0.000%) | | | 0.000(c) | | | | 10/25/50 | | | | 3,535 | | | | 128,161 | |
Series 5222, Class SA, IO, 30 Day Average SOFR x (1) + 3.500%
(Cap 3.500%, Floor 0.000%) | | | 0.000(c) | | | | 05/25/52 | | | | 446 | | | | 8,672 | |
See Notes to Financial Statements.
PGIM Core Bond Fund 37
PGIM Core Bond Fund
Schedule of Investments (continued)
as of July 31, 2024
| | | | | | | | | | | | | | | | |
| | | | |
| Description | | Interest
Rate | | | Maturity
Date | | | Principal Amount (000)# | | | Value | |
| | | | |
RESIDENTIAL MORTGAGE-BACKED SECURITIES (Continued) | | | | | | | | | | | | | | | | |
Government National Mortgage Assoc., | | | | | | | | | | | | | | | | |
Series 2013-99, Class AX | | | 3.000% | | | | 07/20/43 | | | | 535 | | | $ | 493,930 | |
Series 2014-58, Class PS, IO, 1 Month SOFR x (1) + 5.986%
(Cap 6.100%, Floor 0.000%) | | | 0.640(c) | | | | 09/20/43 | | | | 3,663 | | | | 135,185 | |
Series 2016-46, Class JE | | | 2.500 | | | | 11/20/45 | | | | 131 | | | | 119,401 | |
Series 2018-121, Class KS, IO, 1 Month SOFR x (1) + 3.746%
(Cap 3.860%, Floor 0.000%) | | | 0.000(c) | | | | 09/20/48 | | | | 1,658 | | | | 41,078 | |
Series 2018-148, Class DS, IO, 1 Month SOFR x (1) + 3.726%
(Cap 3.840%, Floor 0.000%) | | | 0.000(c) | | | | 10/20/48 | | | | 2,127 | | | | 56,673 | |
Series 2018-151, Class SL, IO, 1 Month SOFR x (1) + 3.686%
(Cap 3.800%, Floor 0.000%) | | | 0.000(c) | | | | 11/20/48 | | | | 1,904 | | | | 56,881 | |
Series 2018-155, Class PS, IO, 1 Month SOFR x (1) + 3.186%
(Cap 2.000%, Floor 0.000%) | | | 0.000(c) | | | | 11/20/48 | | | | 3,748 | | | | 62,930 | |
Series 2019-023, Class SW, IO, 1 Month SOFR x (1) + 6.086%
(Cap 6.200%, Floor 0.000%) | | | 0.758(c) | | | | 07/16/43 | | | | 4,663 | | | | 303,700 | |
Series 2019-092, Class S, IO, 1 Month SOFR x (1) + 2.696%
(Cap 2.810%, Floor 0.000%) | | | 0.000(c) | | | | 07/20/49 | | | | 6,662 | | | | 91,728 | |
Series 2019-097, Class MS, IO, 1 Month SOFR x (1) + 2.966%
(Cap 3.080%, Floor 0.000%) | | | 0.000(c) | | | | 08/20/49 | | | | 3,943 | | | | 66,043 | |
Series 2019-099, Class SA, IO, 1 Month SOFR x (1) + 3.236%
(Cap 3.350%, Floor 0.000%) | | | 0.000(c) | | | | 08/20/49 | | | | 3,344 | | | | 68,763 | |
Series 2021-165, Class ST, IO, 1 Month SOFR x (1) + 3.246%
(Cap 0.020%, Floor 0.000%) | | | 0.000(c) | | | | 01/20/50 | | | | 740 | | | | 250 | |
Series 2022-051, Class SC, IO, 30 Day Average SOFR x (1) + 3.500%
(Cap 3.500%, Floor 0.000%) | | | 0.000(c) | | | | 03/20/52 | | | | 5,358 | | | | 137,183 | |
Series 2022-066, Class SB, IO, 30 Day Average SOFR x (1) + 3.850%
(Cap 3.850%, Floor 0.000%) | | | 0.000(c) | | | | 04/20/52 | | | | 122 | | | | 3,124 | |
Series 2022-078, Class MS, IO, 30 Day Average SOFR x (1) + 3.600%
(Cap 3.600%, Floor 0.000%) | | | 0.000(c) | | | | 04/20/52 | | | | 4,695 | | | | 113,239 | |
Series 2022-078, Class SB, IO, 30 Day Average SOFR x (1) + 3.750%
(Cap 3.750%, Floor 0.000%) | | | 0.000(c) | | | | 04/20/52 | | | | 3,051 | | | | 81,517 | |
Series 2022-112, Class CM | | | 3.000 | | | | 06/20/52 | | | | 2,851 | | | | 2,116,260 | |
Series 2022-126, Class CS, IO, 30 Day Average SOFR x (1) + 3.760%
(Cap 3.760%, Floor 0.000%) | | | 0.000(c) | | | | 07/20/52 | | | | 6,386 | | | | 126,628 | |
Series 2022-148, Class DS, IO, 30 Day Average SOFR x (1) + 3.600%
(Cap 3.600%, Floor 0.000%) | | | 0.000(c) | | | | 08/20/52 | | | | 2,409 | | | | 46,958 | |
Home Re Ltd., | | | | | | | | | | | | | | | | |
Series 2019-01, Class M1, 144A, 30 Day Average SOFR + 1.764%
(Cap N/A, Floor 0.000%) | | | 7.112(c) | | | | 05/25/29 | | | | 61 | | | | 60,720 | |
Legacy Mortgage Asset Trust, | | | | | | | | | | | | | | | | |
Series 2019-PR01, Class A1, 144A | | | 7.858(cc) | | | | 09/25/59 | | | | 1,292 | | | | 1,291,653 | |
Series 2021-GS01, Class A1, 144A | | | 4.892(cc) | | | | 10/25/66 | | | | 262 | | | | 261,481 | |
See Notes to Financial Statements.
38
PGIM Core Bond Fund
Schedule of Investments (continued)
as of July 31, 2024
| | | | | | | | | | | | | | | | |
| | | | |
| Description | | Interest
Rate | | | Maturity
Date | | | Principal Amount (000)# | | | Value | |
| | | | |
RESIDENTIAL MORTGAGE-BACKED SECURITIES (Continued) | | | | | | | | | | | | | | | | |
MFA Trust,
Series 2021-RPL01, Class A1, 144A | | | 1.131%(cc) | | | | 07/25/60 | | | | 2,049 | | | $ | 1,830,745 | |
Mill City Mortgage Loan Trust,
Series 2018-01, Class A1, 144A | | | 3.250(cc) | | | | 05/25/62 | | | | 88 | | | | 86,118 | |
New Residential Mortgage Loan Trust,
Series 2018-04A, Class A1S, 144A, 1 Month SOFR + 0.864%
(Cap N/A, Floor 0.750%) | | | 6.214(c) | | | | 01/25/48 | | | | 48 | | | | 46,599 | |
Oaktown Re VII Ltd.,
Series 2021-02, Class M1A, 144A, 30 Day Average SOFR + 1.600%
(Cap N/A, Floor 1.600%) | | | 6.947(c) | | | | 04/25/34 | | | | 1,186 | | | | 1,186,641 | |
OBX Trust,
Series 2018-01, Class A2, 144A, 1 Month SOFR + 0.764%
(Cap N/A, Floor 0.000%) | | | 6.114(c) | | | | 06/25/57 | | | | 112 | | | | 108,907 | |
RCKT Mortgage Trust,
Series 2024-CES05, Class A1A, 144A | | | 5.846 | | | | 08/25/44 | | | | 1,000 | | | | 1,004,809 | |
Sequoia Mortgage Trust,
Series 10, Class 2A1, 1 Month SOFR + 0.874%
(Cap 11.750%, Floor 0.760%) | | | 6.220(c) | | | | 10/20/27 | | | | 9 | | | | 8,768 | |
Structured Asset Mortgage Investments II Trust,
Series 2005-AR05, Class A1, 1 Month SOFR + 0.614%
(Cap 11.000%, Floor 0.500%) | | | 5.956(c) | | | | 07/19/35 | | | | 14 | | | | 13,363 | |
Towd Point Mortgage Trust, | | | | | | | | | | | | | | | | |
Series 2017-05, Class A1, 144A, 1 Month SOFR + 0.714%
(Cap N/A, Floor 0.000%) | | | 6.064(c) | | | | 02/25/57 | | | | 56 | | | | 57,714 | |
Series 2019-HY03, Class A1A, 144A, 1 Month SOFR + 1.114%
(Cap N/A, Floor 1.000%) | | | 6.464(c) | | | | 10/25/59 | | | | 112 | | | | 113,949 | |
Series 2020-04, Class A1, 144A | | | 1.750 | | | | 10/25/60 | | | | 573 | | | | 514,406 | |
Series 2021-SJ01, Class A1, 144A | | | 2.250(cc) | | | | 07/25/68 | | | | 1,439 | | | | 1,359,163 | |
Series 2021-SJ02, Class A1A, 144A | | | 2.250(cc) | | | | 12/25/61 | | | | 2,285 | | | | 2,191,104 | |
Washington Mutual Mortgage Pass-Through Certificates Trust, | | | | | | | | | | | | | | | | |
Series 2002-AR06, Class A, Federal Reserve US 12 | | | | | | | | | | | | | | | | |
Month Cumulative Avg 1 Year CMT + 1.400% (Cap N/A, Floor 1.400%) | | | 6.573(c) | | | | 06/25/42 | | | | 19 | | | | 17,196 | |
Series 2002-AR09, Class 1A, Federal Reserve US 12 Month Cumulative Avg 1 Year CMT + 1.400% (Cap N/A, Floor 1.400%) | | | 6.573(c) | | | | 08/25/42 | | | | 2 | | | | 1,508 | |
Series 2005-AR13, Class A1A1, 1 Month SOFR + 0.694%
(Cap 10.500%, Floor 0.580%) | | | 6.044(c) | | | | 10/25/45 | | | | 151 | | | | 146,053 | |
| | | | | | | | | | | | | | | | |
| | | | |
TOTAL RESIDENTIAL MORTGAGE-BACKED SECURITIES
(cost $42,567,846) | | | | | | | | | | | | | | | 42,296,661 | |
| | | | | | | | | | | | | | | | |
See Notes to Financial Statements.
PGIM Core Bond Fund 39
PGIM Core Bond Fund
Schedule of Investments (continued)
as of July 31, 2024
| | | | | | | | | | | | | | | | |
| | | | |
| Description | | Interest
Rate | | | Maturity
Date | | | Principal Amount (000)# | | | Value | |
| | | | |
SOVEREIGN BONDS 0.3% | | | | | | | | | | | | | | | | |
Bermuda Government International Bond (Bermuda), | | | | | | | | | | | | | | | | |
Sr. Unsec’d. Notes, 144A | | | 2.375% | | | | 08/20/30 | | | | 555 | | | $ | 472,617 | |
Sr. Unsec’d. Notes, 144A | | | 3.375 | | | | 08/20/50 | | | | 225 | | | | 156,825 | |
Export-Import Bank of India (India),
Sr. Unsec’d. Notes, 144A | | | 3.875 | | | | 02/01/28 | | | | 290 | | | | 280,929 | |
Indonesia Government International Bond (Indonesia),
Sr. Unsec’d. Notes | | | 3.500 | | | | 01/11/28 | | | | 1,420 | | | | 1,356,544 | |
Japan Finance Organization for Municipalities (Japan),
Sr. Unsec’d. Notes, 144A, MTN | | | 1.750 | | | | 09/05/24 | | | | 200 | | | | 199,246 | |
Mexico Government International Bond (Mexico), | | | | | | | | | | | | | | | | |
Sr. Unsec’d. Notes | | | 3.500 | | | | 02/12/34 | | | | 970 | | | | 807,040 | |
Sr. Unsec’d. Notes | | | 6.000 | | | | 05/07/36 | | | | 1,527 | | | | 1,521,655 | |
Panama Government International Bond (Panama),
Sr. Unsec’d. Notes | | | 4.500 | | | | 04/16/50 | | | | 200 | | | | 138,250 | |
Peruvian Government International Bond (Peru),
Sr. Unsec’d. Notes | | | 2.783 | | | | 01/23/31 | | | | 701 | | | | 609,213 | |
Province of Alberta (Canada), | | | | | | | | | | | | | | | | |
Sr. Unsec’d. Notes | | | 1.300 | | | | 07/22/30 | | | | 185 | | | | 156,449 | |
Sr. Unsec’d. Notes | | | 3.300 | | | | 03/15/28 | | | | 110 | | | | 106,515 | |
Province of Manitoba (Canada),
Sr. Unsec’d. Notes | | | 2.125 | | | | 06/22/26 | | | | 100 | | | | 95,676 | |
Province of Quebec (Canada),
Unsec’d. Notes, Series A, MTN | | | 7.140 | | | | 02/27/26 | | | | 45 | | | | 46,502 | |
| | | | | | | | | | | | | | | | |
| | | | |
TOTAL SOVEREIGN BONDS
(cost $6,600,885) | | | | | | | | | | | | | | | 5,947,461 | |
| | | | | | | | | | | | | | | | |
| | | | |
U.S. GOVERNMENT AGENCY OBLIGATIONS 25.7% | | | | | | | | | | | | | | | | |
Federal Home Loan Mortgage Corp. | | | 1.500 | | | | 02/01/36 | | | | 802 | | | | 704,234 | |
Federal Home Loan Mortgage Corp. | | | 1.500 | | | | 06/01/36 | | | | 905 | | | | 792,027 | |
Federal Home Loan Mortgage Corp. | | | 1.500 | | | | 11/01/50 | | | | 1,735 | | | | 1,330,777 | |
Federal Home Loan Mortgage Corp. | | | 2.000 | | | | 01/01/32 | | | | 248 | | | | 231,418 | |
Federal Home Loan Mortgage Corp. | | | 2.000 | | | | 02/01/36 | | | | 789 | | | | 708,951 | |
Federal Home Loan Mortgage Corp. | | | 2.000 | | | | 10/01/40 | | | | 363 | | | | 311,886 | |
Federal Home Loan Mortgage Corp. | | | 2.000 | | | | 09/01/50 | | | | 11,890 | | | | 9,669,251 | |
Federal Home Loan Mortgage Corp. | | | 2.000 | | | | 11/01/50 | | | | 543 | | | | 440,447 | |
Federal Home Loan Mortgage Corp. | | | 2.000 | | | | 12/01/50 | | | | 1,824 | | | | 1,478,747 | |
Federal Home Loan Mortgage Corp. | | | 2.000 | | | | 03/01/51 | | | | 2,362 | | | | 1,908,123 | |
Federal Home Loan Mortgage Corp. | | | 2.000 | | | | 04/01/51 | | | | 97 | | | | 78,722 | |
Federal Home Loan Mortgage Corp. | | | 2.000 | | | | 05/01/51 | | | | 1,236 | | | | 1,000,795 | |
Federal Home Loan Mortgage Corp. | | | 2.000 | | | | 07/01/51 | | | | 4,147 | | | | 3,354,259 | |
Federal Home Loan Mortgage Corp. | | | 2.000 | | | | 09/01/51 | | | | 433 | | | | 353,825 | |
See Notes to Financial Statements.
40
PGIM Core Bond Fund
Schedule of Investments (continued)
as of July 31, 2024
| | | | | | | | | | | | | | | | |
| | | | |
| Description | | Interest
Rate | | | Maturity
Date | | | Principal Amount (000)# | | | Value | |
| | | | |
U.S. GOVERNMENT AGENCY OBLIGATIONS (Continued) | | | | | | | | | | | | | | | | |
Federal Home Loan Mortgage Corp. | | | 2.500% | | | | 01/01/29 | | | | 118 | | | $ | 113,673 | |
Federal Home Loan Mortgage Corp. | | | 2.500 | | | | 07/01/31 | | | | 226 | | | | 214,673 | |
Federal Home Loan Mortgage Corp. | | | 2.500 | | | | 01/01/32 | | | | 127 | | | | 119,887 | |
Federal Home Loan Mortgage Corp. | | | 2.500 | | | | 10/01/32 | | | | 295 | | | | 277,733 | |
Federal Home Loan Mortgage Corp. | | | 2.500 | | | | 12/01/32 | | | | 540 | | | | 510,052 | |
Federal Home Loan Mortgage Corp. | | | 2.500 | | | | 09/01/46 | | | | 146 | | | | 126,725 | |
Federal Home Loan Mortgage Corp. | | | 2.500 | | | | 11/01/46 | | | | 459 | | | | 398,236 | |
Federal Home Loan Mortgage Corp. | | | 2.500 | | | | 11/01/49 | | | | 793 | | | | 677,363 | |
Federal Home Loan Mortgage Corp. | | | 2.500 | | | | 07/01/50 | | | | 1,107 | | | | 940,910 | |
Federal Home Loan Mortgage Corp. | | | 2.500 | | | | 03/01/51 | | | | 906 | | | | 775,716 | |
Federal Home Loan Mortgage Corp. | | | 2.500 | | | | 04/01/51 | | | | 10,363 | | | | 8,787,031 | |
Federal Home Loan Mortgage Corp. | | | 2.500 | | | | 05/01/51 | | | | 213 | | | | 180,911 | |
Federal Home Loan Mortgage Corp. | | | 2.500 | | | | 07/01/51 | | | | 435 | | | | 369,386 | |
Federal Home Loan Mortgage Corp. | | | 2.500 | | | | 08/01/51 | | | | 873 | | | | 740,042 | |
Federal Home Loan Mortgage Corp. | | | 2.500 | | | | 10/01/51 | | | | 70 | | | | 59,544 | |
Federal Home Loan Mortgage Corp. | | | 2.500 | | | | 10/01/51 | | | | 296 | | | | 252,067 | |
Federal Home Loan Mortgage Corp. | | | 2.500 | | | | 11/01/51 | | | | 5,742 | | | | 4,858,965 | |
Federal Home Loan Mortgage Corp. | | | 2.500 | | | | 12/01/51 | | | | 3,019 | | | | 2,557,303 | |
Federal Home Loan Mortgage Corp. | | | 2.500 | | | | 01/01/52 | | | | 459 | | | | 388,793 | |
Federal Home Loan Mortgage Corp. | | | 3.000 | | | | 02/01/32 | | | | 517 | | | | 495,904 | |
Federal Home Loan Mortgage Corp. | | | 3.000 | | | | 01/01/37 | | | | 124 | | | | 116,351 | |
Federal Home Loan Mortgage Corp. | | | 3.000 | | | | 12/01/37 | | | | 49 | | | | 45,996 | |
Federal Home Loan Mortgage Corp. | | | 3.000 | | | | 06/01/43 | | | | 1,285 | | | | 1,165,672 | |
Federal Home Loan Mortgage Corp. | | | 3.000 | | | | 07/01/43 | | | | 220 | | | | 199,459 | |
Federal Home Loan Mortgage Corp. | | | 3.000 | | | | 06/01/46 | | | | 363 | | | | 325,733 | |
Federal Home Loan Mortgage Corp. | | | 3.000 | | | | 09/01/46 | | | | 2,099 | | | | 1,882,189 | |
Federal Home Loan Mortgage Corp. | | | 3.000 | | | | 12/01/46 | | | | 7,460 | | | | 6,681,233 | |
Federal Home Loan Mortgage Corp. | | | 3.000 | | | | 01/01/47 | | | | 380 | | | | 340,548 | |
Federal Home Loan Mortgage Corp. | | | 3.000 | | | | 02/01/50 | | | | 2,269 | | | | 2,017,290 | |
Federal Home Loan Mortgage Corp. | | | 3.000 | | | | 06/01/50 | | | | 565 | | | | 501,692 | |
Federal Home Loan Mortgage Corp. | | | 3.000 | | | | 03/01/51 | | | | 3,770 | | | | 3,307,508 | |
Federal Home Loan Mortgage Corp. | | | 3.000 | | | | 04/01/52 | | | | 3,946 | | | | 3,449,438 | |
Federal Home Loan Mortgage Corp. | | | 3.500 | | | | 06/01/37 | | | | 637 | | | | 612,619 | |
Federal Home Loan Mortgage Corp. | | | 3.500 | | | | 11/01/37 | | | | 113 | | | | 107,969 | |
Federal Home Loan Mortgage Corp. | | | 3.500 | | | | 06/01/42 | | | | 160 | | | | 149,882 | |
Federal Home Loan Mortgage Corp. | | | 3.500 | | | | 06/01/42 | | | | 168 | | | | 157,213 | |
Federal Home Loan Mortgage Corp. | | | 3.500 | | | | 07/01/42 | | | | 167 | | | | 156,617 | |
Federal Home Loan Mortgage Corp. | | | 3.500 | | | | 09/01/42 | | | | 206 | | | | 192,942 | |
Federal Home Loan Mortgage Corp. | | | 3.500 | | | | 10/01/42 | | | | 256 | | | | 240,163 | |
Federal Home Loan Mortgage Corp. | | | 3.500 | | | | 06/01/43 | | | | 111 | | | | 103,895 | |
Federal Home Loan Mortgage Corp. | | | 3.500 | | | | 05/01/45 | | | | 140 | | | | 130,625 | |
Federal Home Loan Mortgage Corp. | | | 3.500 | | | | 01/01/47 | | | | 103 | | | | 96,020 | |
See Notes to Financial Statements.
PGIM Core Bond Fund 41
PGIM Core Bond Fund
Schedule of Investments (continued)
as of July 31, 2024
| | | | | | | | | | | | | | | | |
| | | | |
| Description | | Interest
Rate | | | Maturity
Date | | | Principal Amount (000)# | | | Value | |
| | | | |
U.S. GOVERNMENT AGENCY OBLIGATIONS (Continued) | | | | | | | | | | | | | | | | |
Federal Home Loan Mortgage Corp. | | | 3.500% | | | | 02/01/47 | | | | 232 | | | $ | 214,785 | |
Federal Home Loan Mortgage Corp. | | | 3.500 | | | | 11/01/47 | | | | 155 | | | | 143,112 | |
Federal Home Loan Mortgage Corp. | | | 3.500 | | | | 03/01/48 | | | | 3,344 | | | | 3,090,507 | |
Federal Home Loan Mortgage Corp. | | | 3.500 | | | | 08/01/48 | | | | 62 | | | | 57,653 | |
Federal Home Loan Mortgage Corp. | | | 3.500 | | | | 10/01/48 | | | | 237 | | | | 219,268 | |
Federal Home Loan Mortgage Corp. | | | 3.500 | | | | 01/01/50 | | | | 1,425 | | | | 1,311,210 | |
Federal Home Loan Mortgage Corp. | | | 3.500 | | | | 01/01/52 | | | | 144 | | | | 130,893 | |
Federal Home Loan Mortgage Corp. | | | 3.500 | | | | 05/01/52 | | | | 10,928 | | | | 9,928,315 | |
Federal Home Loan Mortgage Corp. | | | 3.500 | | | | 07/01/52 | | | | 1,011 | | | | 917,233 | |
Federal Home Loan Mortgage Corp. | | | 4.000 | | | | 09/01/37 | | | | 1,727 | | | | 1,688,366 | |
Federal Home Loan Mortgage Corp. | | | 4.000 | | | | 11/01/37 | | | | 1,534 | | | | 1,500,887 | |
Federal Home Loan Mortgage Corp. | | | 4.000 | | | | 12/01/40 | | | | 47 | | | | 45,428 | |
Federal Home Loan Mortgage Corp. | | | 4.000 | | | | 01/01/41 | | | | 171 | | | | 164,755 | |
Federal Home Loan Mortgage Corp. | | | 4.000 | | | | 04/01/42 | | | | 173 | | | | 167,670 | |
Federal Home Loan Mortgage Corp. | | | 4.000 | | | | 10/01/45 | | | | 91 | | | | 87,213 | |
Federal Home Loan Mortgage Corp. | | | 4.000 | | | | 02/01/46 | | | | 1,257 | | | | 1,213,932 | |
Federal Home Loan Mortgage Corp. | | | 4.000 | | | | 05/01/46 | | | | 81 | | | | 78,006 | |
Federal Home Loan Mortgage Corp. | | | 4.000 | | | | 08/01/46 | | | | 121 | | | | 115,530 | |
Federal Home Loan Mortgage Corp. | | | 4.000 | | | | 11/01/47 | | | | 79 | | | | 75,743 | |
Federal Home Loan Mortgage Corp. | | | 4.000 | | | | 04/01/48 | | | | 124 | | | | 119,287 | |
Federal Home Loan Mortgage Corp. | | | 4.000 | | | | 05/01/48 | | | | 140 | | | | 133,633 | |
Federal Home Loan Mortgage Corp. | | | 4.000 | | | | 07/01/48 | | | | 251 | | | | 240,823 | |
Federal Home Loan Mortgage Corp. | | | 4.000 | | | | 07/01/49 | | | | 355 | | | | 340,313 | |
Federal Home Loan Mortgage Corp. | | | 4.000 | | | | 04/01/52 | | | | 1,555 | | | | 1,476,878 | |
Federal Home Loan Mortgage Corp. | | | 4.000 | | | | 10/01/52 | | | | 5,666 | | | | 5,311,150 | |
Federal Home Loan Mortgage Corp. | | | 4.500 | | | | 06/01/42 | | | | 57 | | | | 55,616 | |
Federal Home Loan Mortgage Corp. | | | 4.500 | | | | 09/01/44 | | | | 74 | | | | 72,979 | |
Federal Home Loan Mortgage Corp. | | | 4.500 | | | | 07/01/45 | | | | 178 | | | | 176,414 | |
Federal Home Loan Mortgage Corp. | | | 4.500 | | | | 04/01/47 | | | | 680 | | | | 669,344 | |
Federal Home Loan Mortgage Corp. | | | 4.500 | | | | 07/01/47 | | | | 76 | | | | 74,479 | |
Federal Home Loan Mortgage Corp. | | | 4.500 | | | | 07/01/47 | | | | 172 | | | | 169,110 | |
Federal Home Loan Mortgage Corp. | | | 4.500 | | | | 11/01/47 | | | | 297 | | | | 291,459 | |
Federal Home Loan Mortgage Corp. | | | 4.500 | | | | 02/01/48 | | | | 95 | | | | 93,619 | |
Federal Home Loan Mortgage Corp. | | | 4.500 | | | | 07/01/48 | | | | 195 | | | | 190,894 | |
Federal Home Loan Mortgage Corp. | | | 4.500 | | | | 05/01/52 | | | | 423 | | | | 407,676 | |
Federal Home Loan Mortgage Corp. | | | 4.500 | | | | 07/01/52 | | | | 3,824 | | | | 3,687,644 | |
Federal Home Loan Mortgage Corp. | | | 4.500 | | | | 08/01/52 | | | | 4,408 | | | | 4,249,714 | |
Federal Home Loan Mortgage Corp. | | | 4.500 | | | | 09/01/52 | | | | 221 | | | | 213,406 | |
Federal Home Loan Mortgage Corp. | | | 4.500 | | | | 09/01/52 | | | | 444 | | | | 428,219 | |
Federal Home Loan Mortgage Corp. | | | 5.000 | | | | 08/01/40 | | | | 164 | | | | 166,695 | |
Federal Home Loan Mortgage Corp. | | | 5.000 | | | | 12/01/47 | | | | 111 | | | | 110,515 | |
Federal Home Loan Mortgage Corp. | | | 5.000 | | | | 02/01/48 | | | | 203 | | | | 204,600 | |
See Notes to Financial Statements.
42
PGIM Core Bond Fund
Schedule of Investments (continued)
as of July 31, 2024
| | | | | | | | | | | | | | | | |
| | | | |
| Description | | Interest
Rate | | | Maturity
Date | | | Principal Amount (000)# | | | Value | |
| | | | |
U.S. GOVERNMENT AGENCY OBLIGATIONS (Continued) | | | | | | | | | | | | | | | | |
Federal Home Loan Mortgage Corp. | | | 5.000% | | | | 10/01/52 | | | | 4,563 | | | $ | 4,499,360 | |
Federal Home Loan Mortgage Corp. | | | 5.000 | | | | 11/01/52 | | | | 457 | | | | 451,080 | |
Federal Home Loan Mortgage Corp. | | | 5.500 | | | | 02/01/53 | | | | 16,026 | | | | 16,065,469 | |
Federal National Mortgage Assoc. | | | 0.875 | | | | 08/05/30 | | | | 235 | | | | 195,156 | |
Federal National Mortgage Assoc. | | | 1.500 | | | | 01/01/36 | | | | 2,108 | | | | 1,851,510 | |
Federal National Mortgage Assoc. | | | 1.500 | | | | 04/01/36 | | | | 874 | | | | 767,306 | |
Federal National Mortgage Assoc. | | | 1.500 | | | | 05/01/36 | | | | 461 | | | | 404,455 | |
Federal National Mortgage Assoc. | | | 1.500 | | | | 06/01/36 | | | | 1,408 | | | | 1,232,989 | |
Federal National Mortgage Assoc. | | | 1.500 | | | | 07/01/36 | | | | 1,760 | | | | 1,541,398 | |
Federal National Mortgage Assoc. | | | 1.500 | | | | 02/01/42 | | | | 431 | | | | 355,671 | |
Federal National Mortgage Assoc. | | | 1.500 | | | | 10/01/50 | | | | 362 | | | | 278,807 | |
Federal National Mortgage Assoc. | | | 1.500 | | | | 11/01/50 | | | | 1,025 | | | | 790,815 | |
Federal National Mortgage Assoc. | | | 1.500 | | | | 12/01/50 | | | | 7,791 | | | | 6,011,346 | |
Federal National Mortgage Assoc. | | | 1.500 | | | | 01/01/51 | | | | 3,811 | | | | 2,932,861 | |
Federal National Mortgage Assoc. | | | 1.500 | | | | 06/01/51 | | | | 668 | | | | 512,791 | |
Federal National Mortgage Assoc. | | | 1.500 | | | | 07/01/51 | | | | 790 | | | | 606,986 | |
Federal National Mortgage Assoc. | | | 1.625 | | | | 01/07/25 | | | | 500 | | | | 492,458 | |
Federal National Mortgage Assoc. | | | 2.000 | | | | TBA | | | | 3,000 | | | | 2,413,007 | |
Federal National Mortgage Assoc. | | | 2.000 | | | | 03/01/31 | | | | 1,229 | | | | 1,154,160 | |
Federal National Mortgage Assoc. | | | 2.000 | | | | 01/01/32 | | | | 2,548 | | | | 2,378,899 | |
Federal National Mortgage Assoc. | | | 2.000 | | | | 05/01/36 | | | | 1,270 | | | | 1,145,324 | |
Federal National Mortgage Assoc. | | | 2.000 | | | | 09/01/36 | | | | 1,343 | | | | 1,206,556 | |
Federal National Mortgage Assoc. | | | 2.000 | | | | 12/01/36 | | | | 2,156 | | | | 1,935,963 | |
Federal National Mortgage Assoc. | | | 2.000 | | | | 02/01/37 | | | | 2,934 | | | | 2,633,501 | |
Federal National Mortgage Assoc. | | | 2.000 | | | | 08/01/40 | | | | 1,852 | | | | 1,593,333 | |
Federal National Mortgage Assoc. | | | 2.000 | | | | 02/01/41 | | | | 1,750 | | | | 1,503,996 | |
Federal National Mortgage Assoc. | | | 2.000 | | | | 05/01/41 | | | | 3,496 | | | | 3,000,916 | |
Federal National Mortgage Assoc. | | | 2.000 | | | | 10/01/50 | | | | 11,733 | | | | 9,521,506 | |
Federal National Mortgage Assoc. | | | 2.000 | | | | 11/01/50 | | | | 357 | | | | 289,890 | |
Federal National Mortgage Assoc. | | | 2.000 | | | | 12/01/50 | | | | 38 | | | | 30,868 | |
Federal National Mortgage Assoc. | | | 2.000 | | | | 01/01/51 | | | | 1,792 | | | | 1,451,221 | |
Federal National Mortgage Assoc. | | | 2.000 | | | | 02/01/51 | | | | 3,665 | | | | 2,960,398 | |
Federal National Mortgage Assoc. | | | 2.000 | | | | 02/01/51 | | | | 8,051 | | | | 6,525,103 | |
Federal National Mortgage Assoc. | | | 2.000 | | | | 03/01/51 | | | | 5,431 | | | | 4,387,078 | |
Federal National Mortgage Assoc. | | | 2.000 | | | | 04/01/51 | | | | 2,753 | | | | 2,227,257 | |
Federal National Mortgage Assoc. | | | 2.000 | | | | 04/01/51 | | | | 4,183 | | | | 3,386,396 | |
Federal National Mortgage Assoc. | | | 2.000 | | | | 05/01/51 | | | | 17,363 | | | | 14,061,743 | |
Federal National Mortgage Assoc. | | | 2.000 | | | | 07/01/51 | | | | 2,021 | | | | 1,632,642 | |
Federal National Mortgage Assoc. | | | 2.000 | | | | 08/01/51 | | | | 2,061 | | | | 1,661,737 | |
Federal National Mortgage Assoc. | | | 2.500 | | | | TBA | | | | 33,500 | | | | 28,123,430 | |
Federal National Mortgage Assoc. | | | 2.500 | | | | 05/01/30 | | | | 154 | | | | 146,538 | |
Federal National Mortgage Assoc. | | | 2.500 | | | | 04/01/31 | | | | 455 | | | | 431,174 | |
See Notes to Financial Statements.
PGIM Core Bond Fund 43
PGIM Core Bond Fund
Schedule of Investments (continued)
as of July 31, 2024
| | | | | | | | | | | | | | | | |
| | | | |
| Description | | Interest
Rate | | | Maturity
Date | | | Principal Amount (000)# | | | Value | |
| | | | |
U.S. GOVERNMENT AGENCY OBLIGATIONS (Continued) | | | | | | | | | | | | | | | | |
Federal National Mortgage Assoc. | | | 2.500% | | | | 11/01/31 | | | | 123 | | | $ | 116,141 | |
Federal National Mortgage Assoc. | | | 2.500 | | | | 07/01/32 | | | | 712 | | | | 670,540 | |
Federal National Mortgage Assoc. | | | 2.500 | | | | 08/01/32 | | | | 780 | | | | 736,373 | |
Federal National Mortgage Assoc. | | | 2.500 | | | | 09/01/32 | | | | 754 | | | | 712,260 | |
Federal National Mortgage Assoc. | | | 2.500 | | | | 07/01/35 | | | | 2,727 | | | | 2,575,550 | |
Federal National Mortgage Assoc. | | | 2.500 | | | | 02/01/43 | | | | 62 | | | | 53,494 | |
Federal National Mortgage Assoc. | | | 2.500 | | | | 06/01/46 | | | | 315 | | | | 271,813 | |
Federal National Mortgage Assoc. | | | 2.500 | | | | 09/01/46 | | | | 157 | | | | 135,212 | |
Federal National Mortgage Assoc. | | | 2.500 | | | | 10/01/46 | | | | 96 | | | | 83,507 | |
Federal National Mortgage Assoc. | | | 2.500 | | | | 10/01/46 | | | | 168 | | | | 144,370 | |
Federal National Mortgage Assoc. | | | 2.500 | | | | 03/01/50 | | | | 613 | | | | 521,181 | |
Federal National Mortgage Assoc. | | | 2.500 | | | | 08/01/50 | | | | 1,588 | | | | 1,349,007 | |
Federal National Mortgage Assoc. | | | 2.500 | | | | 08/01/50 | | | | 4,022 | | | | 3,415,836 | |
Federal National Mortgage Assoc. | | | 2.500 | | | | 11/01/50 | | | | 2,885 | | | | 2,475,101 | |
Federal National Mortgage Assoc. | | | 2.500 | | | | 12/01/50 | | | | 269 | | | | 229,754 | |
Federal National Mortgage Assoc. | | | 2.500 | | | | 01/01/51 | | | | 615 | | | | 526,985 | |
Federal National Mortgage Assoc. | | | 2.500 | | | | 04/01/51 | | | | 5,133 | | | | 4,332,187 | |
Federal National Mortgage Assoc. | | | 2.500 | | | | 05/01/51 | | | | 149 | | | | 126,638 | |
Federal National Mortgage Assoc. | | | 2.500 | | | | 07/01/51 | | | | 3,785 | | | | 3,200,722 | |
Federal National Mortgage Assoc. | | | 2.500 | | | | 08/01/51 | | | | 3,089 | | | | 2,618,997 | |
Federal National Mortgage Assoc. | | | 2.500 | | | | 09/01/51 | | | | 453 | | | | 384,485 | |
Federal National Mortgage Assoc. | | | 2.500 | | | | 10/01/51 | | | | 816 | | | | 691,610 | |
Federal National Mortgage Assoc. | | | 2.500 | | | | 11/01/51 | | | | 3,182 | | | | 2,697,423 | |
Federal National Mortgage Assoc. | | | 2.500 | | | | 12/01/51 | | | | 504 | | | | 428,089 | |
Federal National Mortgage Assoc. | | | 2.500 | | | | 02/01/52 | | | | 442 | | | | 374,280 | |
Federal National Mortgage Assoc. | | | 2.500 | | | | 02/01/52 | | | | 855 | | | | 726,048 | |
Federal National Mortgage Assoc. | | | 3.000 | | | | TBA | | | | 2,500 | | | | 2,183,885 | |
Federal National Mortgage Assoc. | | | 3.000 | | | | 06/01/30 | | | | 89 | | | | 85,533 | |
Federal National Mortgage Assoc. | | | 3.000 | | | | 05/01/31 | | | | 36 | | | | 34,440 | |
Federal National Mortgage Assoc. | | | 3.000 | | | | 12/01/31 | | | | 98 | | | | 93,900 | |
Federal National Mortgage Assoc. | | | 3.000 | | | | 05/01/32 | | | | 110 | | | | 105,542 | |
Federal National Mortgage Assoc. | | | 3.000 | | | | 09/01/32 | | | | 43 | | | | 41,086 | |
Federal National Mortgage Assoc. | | | 3.000 | | | | 11/01/36 | | | | 86 | | | | 80,595 | |
Federal National Mortgage Assoc. | | | 3.000 | | | | 10/01/42 | | | | 118 | | | | 107,338 | |
Federal National Mortgage Assoc. | | | 3.000 | | | | 10/01/42 | | | | 174 | | | | 158,031 | |
Federal National Mortgage Assoc. | | | 3.000 | | | | 02/01/43 | | | | 167 | | | | 151,750 | |
Federal National Mortgage Assoc. | | | 3.000 | | | | 04/01/43 | | | | 211 | | | | 191,431 | |
Federal National Mortgage Assoc. | | | 3.000 | | | | 06/01/43 | | | | 271 | | | | 245,676 | |
Federal National Mortgage Assoc. | | | 3.000 | | | | 12/01/45 | | | | 380 | | | | 343,858 | |
Federal National Mortgage Assoc. | | | 3.000 | | | | 05/01/46 | | | | 481 | | | | 431,070 | |
Federal National Mortgage Assoc. | | | 3.000 | | | | 09/01/46 | | | | 501 | | | | 453,890 | |
Federal National Mortgage Assoc. | | | 3.000 | | | | 10/01/46 | | | | 1,527 | | | | 1,367,305 | |
See Notes to Financial Statements.
44
PGIM Core Bond Fund
Schedule of Investments (continued)
as of July 31, 2024
| | | | | | | | | | | | | | | | |
| | | | |
| Description | | Interest
Rate | | | Maturity
Date | | | Principal Amount (000)# | | | Value | |
| | | | |
U.S. GOVERNMENT AGENCY OBLIGATIONS (Continued) | | | | | | | | | | | | | | | | |
Federal National Mortgage Assoc. | | | 3.000% | | | | 11/01/46 | | | | 562 | | | $ | 502,055 | |
Federal National Mortgage Assoc. | | | 3.000 | | | | 11/01/46 | | | | 1,203 | | | | 1,078,597 | |
Federal National Mortgage Assoc. | | | 3.000 | | | | 03/01/47 | | | | 411 | | | | 364,656 | |
Federal National Mortgage Assoc. | | | 3.000 | | | | 04/01/47 | | | | 869 | | | | 777,140 | |
Federal National Mortgage Assoc. | | | 3.000 | | | | 12/01/49 | | | | 2,094 | | | | 1,854,971 | |
Federal National Mortgage Assoc. | | | 3.000 | | | | 01/01/50 | | | | 880 | | | | 769,317 | |
Federal National Mortgage Assoc. | | | 3.000 | | | | 02/01/50 | | | | 787 | | | | 699,148 | |
Federal National Mortgage Assoc. | | | 3.000 | | | | 02/01/50 | | | | 1,568 | | | | 1,393,751 | |
Federal National Mortgage Assoc. | | | 3.000 | | | | 03/01/50 | | | | 375 | | | | 332,516 | |
Federal National Mortgage Assoc. | | | 3.000 | | | | 06/01/50 | | | | 795 | | | | 705,814 | |
Federal National Mortgage Assoc. | | | 3.000 | | | | 01/01/51 | | | | 1,004 | | | | 888,205 | |
Federal National Mortgage Assoc. | | | 3.000 | | | | 05/01/51 | | | | 1,111 | | | | 979,470 | |
Federal National Mortgage Assoc. | | | 3.000 | | | | 01/01/52 | | | | 2,391 | | | | 2,108,748 | |
Federal National Mortgage Assoc. | | | 3.000 | | | | 02/01/52 | | | | 1,710 | | | | 1,495,814 | |
Federal National Mortgage Assoc. | | | 3.000 | | | | 03/01/52 | | | | 3,238 | | | | 2,831,772 | |
Federal National Mortgage Assoc. | | | 3.000 | | | | 03/01/52 | | | | 3,386 | | | | 2,974,648 | |
Federal National Mortgage Assoc. | | | 3.000 | | | | 04/01/52 | | | | 1,784 | | | | 1,561,689 | |
Federal National Mortgage Assoc. | | | 3.000 | | | | 04/01/52 | | | | 2,241 | | | | 1,959,083 | |
Federal National Mortgage Assoc. | | | 3.000 | | | | 06/01/52 | | | | 2,501 | | | | 2,181,895 | |
Federal National Mortgage Assoc. | | | 3.500 | | | | TBA | | | | 3,000 | | | | 2,723,718 | |
Federal National Mortgage Assoc. | | | 3.500 | | | | 12/01/29 | | | | 43 | | | | 41,860 | |
Federal National Mortgage Assoc. | | | 3.500 | | | | 12/01/30 | | | | 49 | | | | 47,893 | |
Federal National Mortgage Assoc. | | | 3.500 | | | | 07/01/31 | | | | 216 | | | | 211,132 | |
Federal National Mortgage Assoc. | | | 3.500 | | | | 08/01/31 | | | | 208 | | | | 202,456 | |
Federal National Mortgage Assoc. | | | 3.500 | | | | 02/01/33 | | | | 89 | | | | 86,262 | |
Federal National Mortgage Assoc. | | | 3.500 | | | | 05/01/33 | | | | 36 | | | | 34,846 | |
Federal National Mortgage Assoc. | | | 3.500 | | | | 10/01/41 | | | | 68 | | | | 63,527 | |
Federal National Mortgage Assoc. | | | 3.500 | | | | 04/01/42 | | | | 143 | | | | 133,849 | |
Federal National Mortgage Assoc. | | | 3.500 | | | | 05/01/42 | | | | 141 | | | | 131,670 | |
Federal National Mortgage Assoc. | | | 3.500 | | | | 05/01/42 | | | | 910 | | | | 851,486 | |
Federal National Mortgage Assoc. | | | 3.500 | | | | 06/01/42 | | | | 394 | | | | 368,484 | |
Federal National Mortgage Assoc. | | | 3.500 | | | | 10/01/42 | | | | 224 | | | | 209,882 | |
Federal National Mortgage Assoc. | | | 3.500 | | | | 10/01/42 | | | | 246 | | | | 229,862 | |
Federal National Mortgage Assoc. | | | 3.500 | | | | 10/01/42 | | | | 465 | | | | 435,037 | |
Federal National Mortgage Assoc. | | | 3.500 | | | | 06/01/43 | | | | 125 | | | | 116,876 | |
Federal National Mortgage Assoc. | | | 3.500 | | | | 06/01/45 | | | | 137 | | | | 127,672 | |
Federal National Mortgage Assoc. | | | 3.500 | | | | 06/01/45 | | | | 226 | | | | 210,139 | |
Federal National Mortgage Assoc. | | | 3.500 | | | | 09/01/45 | | | | 196 | | | | 182,466 | |
Federal National Mortgage Assoc. | | | 3.500 | | | | 10/01/45 | | | | 216 | | | | 200,485 | |
Federal National Mortgage Assoc. | | | 3.500 | | | | 01/01/46 | | | | 68 | | | | 62,803 | |
Federal National Mortgage Assoc. | | | 3.500 | | | | 01/01/46 | | | | 179 | | | | 165,953 | |
Federal National Mortgage Assoc. | | | 3.500 | | | | 04/01/46 | | | | 1,878 | | | | 1,741,912 | |
See Notes to Financial Statements.
PGIM Core Bond Fund 45
PGIM Core Bond Fund
Schedule of Investments (continued)
as of July 31, 2024
| | | | | | | | | | | | | | | | |
| | | | |
| Description | | Interest
Rate | | | Maturity
Date | | | Principal Amount (000)# | | | Value | |
| | | | |
U.S. GOVERNMENT AGENCY OBLIGATIONS (Continued) | | | | | | | | | | | | | | | | |
Federal National Mortgage Assoc. | | | 3.500% | | | | 11/01/46 | | | | 86 | | | $ | 79,615 | |
Federal National Mortgage Assoc. | | | 3.500 | | | | 06/01/47 | | | | 316 | | | | 292,615 | |
Federal National Mortgage Assoc. | | | 3.500 | | | | 07/01/47 | | | | 198 | | | | 182,999 | |
Federal National Mortgage Assoc. | | | 3.500 | | | | 07/01/47 | | | | 936 | | | | 876,052 | |
Federal National Mortgage Assoc. | | | 3.500 | | | | 08/01/47 | | | | 149 | | | | 137,435 | |
Federal National Mortgage Assoc. | | | 3.500 | | | | 09/01/47 | | | | 249 | | | | 230,072 | |
Federal National Mortgage Assoc. | | | 3.500 | | | | 10/01/47 | | | | 876 | | | | 807,435 | |
Federal National Mortgage Assoc. | | | 3.500 | | | | 11/01/47 | | | | 809 | | | | 747,911 | |
Federal National Mortgage Assoc. | | | 3.500 | | | | 01/01/48 | | | | 147 | | | | 135,993 | |
Federal National Mortgage Assoc. | | | 3.500 | | | | 01/01/48 | | | | 230 | | | | 212,389 | |
Federal National Mortgage Assoc. | | | 3.500 | | | | 01/01/48 | | | | 2,974 | | | | 2,748,162 | |
Federal National Mortgage Assoc. | | | 3.500 | | | | 04/01/48 | | | | 402 | | | | 371,284 | |
Federal National Mortgage Assoc. | | | 3.500 | | | | 06/01/48 | | | | 612 | | | | 565,159 | |
Federal National Mortgage Assoc. | | | 3.500 | | | | 08/01/48 | | | | 321 | | | | 296,474 | |
Federal National Mortgage Assoc. | | | 3.500 | | | | 10/01/48 | | | | 216 | | | | 199,477 | |
Federal National Mortgage Assoc. | | | 3.500 | | | | 11/01/48 | | | | 158 | | | | 145,790 | |
Federal National Mortgage Assoc. | | | 3.500 | | | | 03/01/49 | | | | 721 | | | | 666,520 | |
Federal National Mortgage Assoc. | | | 3.500 | | | | 06/01/49 | | | | 298 | | | | 274,133 | |
Federal National Mortgage Assoc. | | | 3.500 | | | | 08/01/51 | | | | 40 | | | | 36,699 | |
Federal National Mortgage Assoc. | | | 3.500 | | | | 02/01/52 | | | | 438 | | | | 399,879 | |
Federal National Mortgage Assoc. | | | 4.000 | | | | 11/01/37 | | | | 1,704 | | | | 1,666,565 | |
Federal National Mortgage Assoc. | | | 4.000 | | | | 09/01/40 | | | | 114 | | | | 110,474 | |
Federal National Mortgage Assoc. | | | 4.000 | | | | 11/01/40 | | | | 467 | | | | 450,720 | |
Federal National Mortgage Assoc. | | | 4.000 | | | | 02/01/41 | | | | 190 | | | | 183,538 | |
Federal National Mortgage Assoc. | | | 4.000 | | | | 02/01/41 | | | | 301 | | | | 290,827 | |
Federal National Mortgage Assoc. | | | 4.000 | | | | 12/01/41 | | | | 189 | | | | 182,144 | |
Federal National Mortgage Assoc. | | | 4.000 | | | | 10/01/43 | | | | 150 | | | | 146,208 | |
Federal National Mortgage Assoc. | | | 4.000 | | | | 09/01/44 | | | | 84 | | | | 81,184 | |
Federal National Mortgage Assoc. | | | 4.000 | | | | 10/01/44 | | | | 196 | | | | 188,570 | |
Federal National Mortgage Assoc. | | | 4.000 | | | | 12/01/45 | | | | 67 | | | | 64,486 | |
Federal National Mortgage Assoc. | | | 4.000 | | | | 04/01/46 | | | | 63 | | | | 59,939 | |
Federal National Mortgage Assoc. | | | 4.000 | | | | 08/01/46 | | | | 106 | | | | 101,225 | |
Federal National Mortgage Assoc. | | | 4.000 | | | | 09/01/46 | | | | 811 | | | | 783,784 | |
Federal National Mortgage Assoc. | | | 4.000 | | | | 02/01/47 | | | | 303 | | | | 290,773 | |
Federal National Mortgage Assoc. | | | 4.000 | | | | 03/01/47 | | | | 418 | | | | 398,771 | |
Federal National Mortgage Assoc. | | | 4.000 | | | | 06/01/47 | | | | 246 | | | | 235,258 | |
Federal National Mortgage Assoc. | | | 4.000 | | | | 10/01/47 | | | | 79 | | | | 75,096 | |
Federal National Mortgage Assoc. | | | 4.000 | | | | 11/01/47 | | | | 153 | | | | 146,003 | |
Federal National Mortgage Assoc. | | | 4.000 | | | | 12/01/47 | | | | 161 | | | | 154,578 | |
Federal National Mortgage Assoc. | | | 4.000 | | | | 02/01/48 | | | | 149 | | | | 142,951 | |
Federal National Mortgage Assoc. | | | 4.000 | | | | 09/01/48 | | | | 1,172 | | | | 1,123,207 | |
Federal National Mortgage Assoc. | | | 4.000 | | | | 10/01/48 | | | | 224 | | | | 214,734 | |
See Notes to Financial Statements.
46
PGIM Core Bond Fund
Schedule of Investments (continued)
as of July 31, 2024
| | | | | | | | | | | | | | | | |
| | | | |
| Description | | Interest
Rate | | | Maturity
Date | | | Principal Amount (000)# | | | Value | |
| | | | |
U.S. GOVERNMENT AGENCY OBLIGATIONS (Continued) | | | | | | | | | | | | | | | | |
Federal National Mortgage Assoc. | | | 4.000% | | | | 03/01/49 | | | | 604 | | | $ | 578,483 | |
Federal National Mortgage Assoc. | | | 4.000 | | | | 03/01/49 | | | | 935 | | | | 894,328 | |
Federal National Mortgage Assoc. | | | 4.000 | | | | 07/01/49 | | | | 202 | | | | 190,907 | |
Federal National Mortgage Assoc. | | | 4.000 | | | | 01/01/50 | | | | 1,777 | | | | 1,700,417 | |
Federal National Mortgage Assoc. | | | 4.000 | | | | 05/01/50 | | | | 1,856 | | | | 1,762,894 | |
Federal National Mortgage Assoc. | | | 4.000 | | | | 05/01/52 | | | | 1,309 | | | | 1,228,838 | |
Federal National Mortgage Assoc. | | | 4.000 | | | | 06/01/52 | | | | 8,438 | | | | 7,913,568 | |
Federal National Mortgage Assoc. | | | 4.000 | | | | 07/01/52 | | | | 1,236 | | | | 1,164,291 | |
Federal National Mortgage Assoc. | | | 4.000 | | | | 10/01/52 | | | | 447 | | | | 419,423 | |
Federal National Mortgage Assoc. | | | 4.337(s) | | | | 03/17/31 | | | | 945 | | | | 698,439 | |
Federal National Mortgage Assoc. | | | 4.500 | | | | TBA | | | | 4,000 | | | | 3,855,538 | |
Federal National Mortgage Assoc. | | | 4.500 | | | | 08/01/40 | | | | 52 | | | | 51,981 | |
Federal National Mortgage Assoc. | | | 4.500 | | | | 04/01/41 | | | | 65 | | | | 64,378 | |
Federal National Mortgage Assoc. | | | 4.500 | | | | 06/01/41 | | | | 138 | | | | 137,098 | |
Federal National Mortgage Assoc. | | | 4.500 | | | | 08/01/41 | | | | 71 | | | | 70,745 | |
Federal National Mortgage Assoc. | | | 4.500 | | | | 08/01/41 | | | | 185 | | | | 183,163 | |
Federal National Mortgage Assoc. | | | 4.500 | | | | 08/01/44 | | | | 182 | | | | 179,314 | |
Federal National Mortgage Assoc. | | | 4.500 | | | | 01/01/45 | | | | 98 | | | | 97,104 | |
Federal National Mortgage Assoc. | | | 4.500 | | | | 11/01/47 | | | | 115 | | | | 112,404 | |
Federal National Mortgage Assoc. | | | 4.500 | | | | 06/01/48 | | | | 155 | | | | 151,560 | |
Federal National Mortgage Assoc. | | | 4.500 | | | | 07/01/48 | | | | 1,330 | | | | 1,299,238 | |
Federal National Mortgage Assoc. | | | 4.500 | | | | 12/01/48 | | | | 124 | | | | 121,400 | |
Federal National Mortgage Assoc. | | | 4.500 | | | | 02/01/49 | | | | 39 | | | | 38,316 | |
Federal National Mortgage Assoc. | | | 4.500 | | | | 07/01/52 | | | | 375 | | | | 362,104 | |
Federal National Mortgage Assoc. | | | 4.500 | | | | 09/01/52 | | | | 242 | | | | 233,369 | |
Federal National Mortgage Assoc. | | | 5.000 | | | | 09/01/30 | | | | 9 | | | | 9,460 | |
Federal National Mortgage Assoc. | | | 5.000 | | | | 10/01/40 | | | | 93 | | | | 94,160 | |
Federal National Mortgage Assoc. | | | 5.000 | | | | 03/01/42 | | | | 172 | | | | 174,019 | |
Federal National Mortgage Assoc. | | | 5.000 | | | | 10/01/47 | | | | 153 | | | | 153,183 | |
Federal National Mortgage Assoc. | | | 5.000 | | | | 01/01/48 | | | | 38 | | | | 37,890 | |
Federal National Mortgage Assoc. | | | 5.000 | | | | 06/01/49 | | | | 856 | | | | 857,565 | |
Federal National Mortgage Assoc. | | | 5.000 | | | | 07/01/52 | | | | 7,146 | | | | 7,047,008 | |
Federal National Mortgage Assoc. | | | 5.000 | | | | 08/01/52 | | | | 1,270 | | | | 1,253,071 | |
Federal National Mortgage Assoc. | | | 5.000 | | | | 09/01/52 | | | | 1,325 | | | | 1,307,055 | |
Federal National Mortgage Assoc. | | | 5.000 | | | | 10/01/52 | | | | 1,515 | | | | 1,493,721 | |
Federal National Mortgage Assoc. | | | 5.000 | | | | 02/01/53 | | | | 1,431 | | | | 1,410,458 | |
Federal National Mortgage Assoc. | | | 5.000 | | | | 01/01/54 | | | | 1,085 | | | | 1,068,233 | |
Federal National Mortgage Assoc. | | | 5.500 | | | | TBA | | | | 4,500 | | | | 4,507,770 | |
Federal National Mortgage Assoc. | | | 5.500 | | | | 01/01/40 | | | | 95 | | | | 96,307 | |
Federal National Mortgage Assoc. | | | 5.500 | | | | 04/01/53 | | | | 1,962 | | | | 1,966,690 | |
Federal National Mortgage Assoc. | | | 5.500 | | | | 05/01/53 | | | | 18,996 | | | | 19,030,783 | |
Federal National Mortgage Assoc. | | | 6.000 | | | | TBA | | | | 3,500 | | | | 3,549,222 | |
See Notes to Financial Statements.
PGIM Core Bond Fund 47
PGIM Core Bond Fund
Schedule of Investments (continued)
as of July 31, 2024
| | | | | | | | | | | | | | | | |
| | | | |
| Description | | Interest
Rate | | | Maturity
Date | | | Principal Amount (000)# | | | Value | |
| | | | |
U.S. GOVERNMENT AGENCY OBLIGATIONS (Continued) | | | | | | | | | | | | | | | | |
Federal National Mortgage Assoc. | | | 6.000% | | | | 10/01/36 | | | | 48 | | | $ | 49,466 | |
Federal National Mortgage Assoc. | | | 6.000 | | | | 07/01/41 | | | | 52 | | | | 53,957 | |
Federal National Mortgage Assoc. | | | 6.000 | | | | 01/01/53 | | | | 9,836 | | | | 9,992,403 | |
Federal National Mortgage Assoc. | | | 6.000 | | | | 03/01/53 | | | | 2,342 | | | | 2,375,783 | |
Federal National Mortgage Assoc. | | | 6.000 | | | | 09/01/53 | | | | 2,465 | | | | 2,500,145 | |
Federal National Mortgage Assoc. | | | 6.000 | | | | 10/01/53 | | | | 3,766 | | | | 3,819,207 | |
Federal National Mortgage Assoc.(k) | | | 6.625 | | | | 11/15/30 | | | | 485 | | | | 552,635 | |
Federal National Mortgage Assoc.(k) | | | 7.125 | | | | 01/15/30 | | | | 80 | | | | 92,055 | |
Federal National Mortgage Assoc., Enterprise 11th District COFI Institutional Replacement Index + 1.254% (Cap 12.750%,
Floor 5.750%) | | | 5.750(c) | | | | 12/01/30 | | | | — | (r) | | | 142 | |
Government National Mortgage Assoc. | | | 2.000 | | | | TBA | | | | 6,000 | | | | 4,972,264 | |
Government National Mortgage Assoc. | | | 2.000 | | | | 01/20/51 | | | | 5,337 | | | | 4,423,705 | |
Government National Mortgage Assoc. | | | 2.000 | | | | 03/20/51 | | | | 1,022 | | | | 847,446 | |
Government National Mortgage Assoc. | | | 2.000 | | | | 07/20/51 | | | | 5,353 | | | | 4,437,436 | |
Government National Mortgage Assoc. | | | 2.000 | | | | 11/20/51 | | | | 481 | | | | 398,910 | |
Government National Mortgage Assoc. | | | 2.000 | | | | 04/20/52 | | | | 496 | | | | 410,972 | |
Government National Mortgage Assoc. | | | 2.500 | | | | 12/20/46 | | | | 226 | | | | 197,994 | |
Government National Mortgage Assoc. | | | 2.500 | | | | 01/20/51 | | | | 4,261 | | | | 3,673,004 | |
Government National Mortgage Assoc. | | | 2.500 | | | | 03/20/51 | | | | 1,598 | | | | 1,377,178 | |
Government National Mortgage Assoc. | | | 2.500 | | | | 05/20/51 | | | | 7,301 | | | | 6,282,469 | |
Government National Mortgage Assoc. | | | 2.500 | | | | 07/20/51 | | | | 2,278 | | | | 1,960,099 | |
Government National Mortgage Assoc. | | | 2.500 | | | | 08/20/51 | | | | 3,036 | | | | 2,613,392 | |
Government National Mortgage Assoc. | | | 2.500 | | | | 09/20/51 | | | | 3,326 | | | | 2,862,096 | |
Government National Mortgage Assoc. | | | 2.500 | | | | 05/20/52 | | | | 1,982 | | | | 1,705,610 | |
Government National Mortgage Assoc. | | | 3.000 | | | | 07/20/42 | | | | 342 | | | | 310,927 | |
Government National Mortgage Assoc. | | | 3.000 | | | | 03/20/43 | | | | 231 | | | | 210,119 | |
Government National Mortgage Assoc. | | | 3.000 | | | | 08/20/43 | | | | 43 | | | | 39,489 | |
Government National Mortgage Assoc. | | | 3.000 | | | | 09/20/43 | | | | 85 | | | | 77,751 | |
Government National Mortgage Assoc. | | | 3.000 | | | | 01/20/44 | | | | 80 | | | | 72,581 | |
Government National Mortgage Assoc. | | | 3.000 | | | | 05/20/45 | | | | 81 | | | | 73,879 | |
Government National Mortgage Assoc. | | | 3.000 | | | | 08/15/45 | | | | 93 | | | | 83,199 | |
Government National Mortgage Assoc. | | | 3.000 | | | | 05/20/46 | | | | 500 | | | | 452,990 | |
Government National Mortgage Assoc. | | | 3.000 | | | | 07/20/46 | | | | 799 | | | | 723,150 | |
Government National Mortgage Assoc. | | | 3.000 | | | | 08/20/46 | | | | 44 | | | | 39,743 | |
Government National Mortgage Assoc. | | | 3.000 | | | | 10/20/46 | | | | 251 | | | | 227,021 | |
Government National Mortgage Assoc. | | | 3.000 | | | | 03/20/47 | | | | 517 | | | | 467,984 | |
Government National Mortgage Assoc. | | | 3.000 | | | | 01/20/48 | | | | 66 | | | | 59,782 | |
Government National Mortgage Assoc. | | | 3.000 | | | | 08/20/48 | | | | 1,110 | | | | 1,002,259 | |
Government National Mortgage Assoc. | | | 3.000 | | | | 07/20/49 | | | | 372 | | | | 334,758 | |
Government National Mortgage Assoc. | | | 3.000 | | | | 09/20/49 | | | | 460 | | | | 413,434 | |
Government National Mortgage Assoc. | | | 3.000 | | | | 12/20/49 | | | | 513 | | | | 459,477 | |
See Notes to Financial Statements.
48
PGIM Core Bond Fund
Schedule of Investments (continued)
as of July 31, 2024
| | | | | | | | | | | | | | | | |
| | | | |
| Description | | Interest
Rate | | | Maturity
Date | | | Principal Amount (000)# | | | Value | |
| | | | |
U.S. GOVERNMENT AGENCY OBLIGATIONS (Continued) | | | | | | | | | | | | | | | | |
Government National Mortgage Assoc. | | | 3.000% | | | | 01/20/50 | | | | 2,374 | | | $ | 2,132,895 | |
Government National Mortgage Assoc. | | | 3.000 | | | | 02/20/50 | | | | 104 | | | | 93,173 | |
Government National Mortgage Assoc. | | | 3.000 | | | | 09/20/50 | | | | 304 | | | | 272,035 | |
Government National Mortgage Assoc. | | | 3.000 | | | | 10/20/51 | | | | 429 | | | | 383,260 | |
Government National Mortgage Assoc. | | | 3.000 | | | | 11/20/51 | | | | 806 | | | | 719,595 | |
Government National Mortgage Assoc. | | | 3.500 | | | | 01/15/42 | | | | 56 | | | | 52,851 | |
Government National Mortgage Assoc. | | | 3.500 | | | | 12/20/42 | | | | 164 | | | | 154,200 | |
Government National Mortgage Assoc. | | | 3.500 | | | | 01/20/43 | | | | 245 | | | | 230,255 | |
Government National Mortgage Assoc. | | | 3.500 | | | | 02/20/43 | | | | 111 | | | | 103,768 | |
Government National Mortgage Assoc. | | | 3.500 | | | | 08/20/43 | | | | 393 | | | | 368,725 | |
Government National Mortgage Assoc. | | | 3.500 | | | | 10/20/43 | | | | 521 | | | | 489,371 | |
Government National Mortgage Assoc. | | | 3.500 | | | | 03/20/45 | | | | 54 | | | | 50,203 | |
Government National Mortgage Assoc. | | | 3.500 | | | | 04/20/45 | | | | 303 | | | | 283,299 | |
Government National Mortgage Assoc. | | | 3.500 | | | | 04/20/46 | | | | 578 | | | | 538,758 | |
Government National Mortgage Assoc. | | | 3.500 | | | | 07/20/46 | | | | 357 | | | | 333,003 | |
Government National Mortgage Assoc. | | | 3.500 | | | | 10/20/46 | | | | 699 | | | | 651,682 | |
Government National Mortgage Assoc. | | | 3.500 | | | | 12/20/46 | | | | 689 | | | | 641,930 | |
Government National Mortgage Assoc. | | | 3.500 | | | | 05/20/47 | | | | 387 | | | | 360,275 | |
Government National Mortgage Assoc. | | | 3.500 | | | | 10/20/47 | | | | 132 | | | | 122,500 | |
Government National Mortgage Assoc. | | | 3.500 | | | | 11/20/47 | | | | 684 | | | | 635,692 | |
Government National Mortgage Assoc. | | | 3.500 | | | | 01/20/48 | | | | 186 | | | | 172,385 | |
Government National Mortgage Assoc. | | | 3.500 | | | | 10/20/48 | | | | 112 | | | | 104,004 | |
Government National Mortgage Assoc. | | | 3.500 | | | | 11/20/48 | | | | 221 | | | | 205,065 | |
Government National Mortgage Assoc. | | | 3.500 | | | | 12/20/48 | | | | 81 | | | | 74,860 | |
Government National Mortgage Assoc. | | | 3.500 | | | | 02/20/49 | | | | 186 | | | | 172,327 | |
Government National Mortgage Assoc. | | | 3.500 | | | | 05/20/49 | | | | 293 | | | | 272,197 | |
Government National Mortgage Assoc. | | | 3.500 | | | | 06/20/49 | | | | 255 | | | | 236,608 | |
Government National Mortgage Assoc. | | | 3.500 | | | | 08/20/49 | | | | 5,206 | | | | 4,820,650 | |
Government National Mortgage Assoc. | | | 3.500 | | | | 11/20/50 | | | | 5,406 | | | | 5,000,887 | |
Government National Mortgage Assoc. | | | 3.500 | | | | 04/20/51 | | | | 1,854 | | | | 1,714,812 | |
Government National Mortgage Assoc. | | | 3.500 | | | | 02/20/52 | | | | 2,179 | | | | 2,002,595 | |
Government National Mortgage Assoc. | | | 4.000 | | | | 12/20/40 | | | | 126 | | | | 122,706 | |
Government National Mortgage Assoc. | | | 4.000 | | | | 06/20/41 | | | | 53 | | | | 51,708 | |
Government National Mortgage Assoc. | | | 4.000 | | | | 11/15/41 | | | | 74 | | | | 70,914 | |
Government National Mortgage Assoc. | | | 4.000 | | | | 12/20/42 | | | | 132 | | | | 127,697 | |
Government National Mortgage Assoc. | | | 4.000 | | | | 04/20/43 | | | | 88 | | | | 84,948 | |
Government National Mortgage Assoc. | | | 4.000 | | | | 10/20/43 | | | | 74 | | | | 71,131 | |
Government National Mortgage Assoc. | | | 4.000 | | | | 12/20/43 | | | | 162 | | | | 155,351 | |
Government National Mortgage Assoc. | | | 4.000 | | | | 09/20/44 | | | | 95 | | | | 91,983 | |
Government National Mortgage Assoc. | | | 4.000 | | | | 08/20/45 | | | | 156 | | | | 150,839 | |
Government National Mortgage Assoc. | | | 4.000 | | | | 10/20/45 | | | | 73 | | | | 70,598 | |
Government National Mortgage Assoc. | | | 4.000 | | | | 03/20/46 | | | | 143 | | | | 137,443 | |
See Notes to Financial Statements.
PGIM Core Bond Fund 49
PGIM Core Bond Fund
Schedule of Investments (continued)
as of July 31, 2024
| | | | | | | | | | | | | | | | |
| | | | |
| Description | | Interest
Rate | | | Maturity
Date | | | Principal Amount (000)# | | | Value | |
| | | | |
U.S. GOVERNMENT AGENCY OBLIGATIONS (Continued) | | | | | | | | | | | | | | | | |
Government National Mortgage Assoc. | | | 4.000% | | | | 11/20/46 | | | | 106 | | | $ | 101,581 | |
Government National Mortgage Assoc. | | | 4.000 | | | | 03/20/47 | | | | 93 | | | | 88,701 | |
Government National Mortgage Assoc. | | | 4.000 | | | | 05/20/47 | | | | 147 | | | | 139,637 | |
Government National Mortgage Assoc. | | | 4.000 | | | | 07/20/47 | | | | 576 | | | | 552,213 | |
Government National Mortgage Assoc. | | | 4.000 | | | | 11/20/47 | | | | 393 | | | | 376,140 | |
Government National Mortgage Assoc. | | | 4.000 | | | | 12/20/47 | | | | 93 | | | | 88,648 | |
Government National Mortgage Assoc. | | | 4.000 | | | | 06/20/48 | | | | 1,273 | | | | 1,216,161 | |
Government National Mortgage Assoc. | | | 4.000 | | | | 07/20/48 | | | | 176 | | | | 167,979 | |
Government National Mortgage Assoc. | | | 4.000 | | | | 08/20/48 | | | | 62 | | | | 58,791 | |
Government National Mortgage Assoc. | | | 4.000 | | | | 09/20/48 | | | | 156 | | | | 149,310 | |
Government National Mortgage Assoc. | | | 4.000 | | | | 11/20/48 | | | | 66 | | | | 62,407 | |
Government National Mortgage Assoc. | | | 4.000 | | | | 01/20/49 | | | | 79 | | | | 75,273 | |
Government National Mortgage Assoc. | | | 4.000 | | | | 02/20/49 | | | | 158 | | | | 150,574 | |
Government National Mortgage Assoc. | | | 4.000 | | | | 03/20/49 | | | | 99 | | | | 94,524 | |
Government National Mortgage Assoc. | | | 4.000 | | | | 06/20/52 | | | | 1,819 | | | | 1,718,207 | |
Government National Mortgage Assoc. | | | 4.000 | | | | 10/20/52 | | | | 10,348 | | | | 9,771,044 | |
Government National Mortgage Assoc. | | | 4.500 | | | | 12/20/41 | | | | 274 | | | | 274,557 | |
Government National Mortgage Assoc. | | | 4.500 | | | | 10/20/43 | | | | 40 | | | | 39,553 | |
Government National Mortgage Assoc. | | | 4.500 | | | | 01/20/44 | | | | 53 | | | | 52,630 | |
Government National Mortgage Assoc. | | | 4.500 | | | | 04/20/44 | | | | 178 | | | | 175,535 | |
Government National Mortgage Assoc. | | | 4.500 | | | | 03/20/45 | | | | 43 | | | | 42,252 | |
Government National Mortgage Assoc. | | | 4.500 | | | | 07/20/46 | | | | 85 | | | | 83,744 | |
Government National Mortgage Assoc. | | | 4.500 | | | | 08/20/46 | | | | 77 | | | | 75,724 | |
Government National Mortgage Assoc. | | | 4.500 | | | | 11/20/46 | | | | 67 | | | | 66,282 | |
Government National Mortgage Assoc. | | | 4.500 | | | | 01/20/47 | | | | 436 | | | | 429,907 | |
Government National Mortgage Assoc. | | | 4.500 | | | | 01/20/48 | | | | 55 | | | | 54,406 | |
Government National Mortgage Assoc. | | | 4.500 | | | | 02/20/48 | | | | 350 | | | | 343,943 | |
Government National Mortgage Assoc. | | | 4.500 | | | | 03/20/48 | | | | 37 | | | | 36,661 | |
Government National Mortgage Assoc. | | | 4.500 | | | | 07/20/48 | | | | 59 | | | | 58,225 | |
Government National Mortgage Assoc. | | | 4.500 | | | | 08/20/48 | | | | 23 | | | | 22,401 | |
Government National Mortgage Assoc. | | | 4.500 | | | | 12/20/48 | | | | 112 | | | | 110,155 | |
Government National Mortgage Assoc. | | | 4.500 | | | | 05/20/52 | | | | 2,341 | | | | 2,271,987 | |
Government National Mortgage Assoc. | | | 5.000 | | | | 10/20/37 | | | | 5 | | | | 4,973 | |
Government National Mortgage Assoc. | | | 5.000 | | | | 09/20/40 | | | | 52 | | | | 53,045 | |
Government National Mortgage Assoc. | | | 5.000 | | | | 04/20/45 | | | | 29 | | | | 29,460 | |
Government National Mortgage Assoc. | | | 5.000 | | | | 08/20/45 | | | | 105 | | | | 106,677 | |
Government National Mortgage Assoc. | | | 6.000 | | | | 12/15/39 | | | | 71 | | | | 74,159 | |
Government National Mortgage Assoc. | | | 6.500 | | | | TBA | | | | 3,000 | | | | 3,054,127 | |
Tennessee Valley Authority, Sr. Unsec’d. Notes | | | 1.500 | | | | 09/15/31 | | | | 645 | | | | 541,493 | |
| | | | | | | | | | | | | | | | |
| | | | |
TOTAL U.S. GOVERNMENT AGENCY OBLIGATIONS
(cost $525,108,763) | | | | | | | | | | | | | | | 503,782,187 | |
| | | | | | | | | | | | | | | | |
See Notes to Financial Statements.
50
PGIM Core Bond Fund
Schedule of Investments (continued)
as of July 31, 2024
| | | | | | | | | | | | | | | | |
| | | | |
| Description | | Interest
Rate | | | Maturity
Date | | | Principal Amount (000)# | | | Value | |
| | | | |
U.S. TREASURY OBLIGATIONS 6.1% | | | | | | | | | | | | | | | | |
U.S. Treasury Bonds | | | 2.000% | | | | 11/15/41 | | | | 19,255 | | | $ | 13,683,084 | |
U.S. Treasury Bonds(k) | | | 2.250 | | | | 05/15/41 | | | | 19,330 | | | | 14,473,337 | |
U.S. Treasury Bonds | | | 2.375 | | | | 02/15/42 | | | | 18,960 | | | | 14,279,250 | |
U.S. Treasury Bonds | | | 4.250 | | | | 02/15/54 | | | | 60 | | | | 59,016 | |
U.S. Treasury Bonds | | | 4.500 | | | | 02/15/44 | | | | 135 | | | | 136,371 | |
U.S. Treasury Bonds(h) | | | 4.750 | | | | 11/15/53 | | | | 15,250 | | | | 16,279,375 | |
U.S. Treasury Notes | | | 4.000 | | | | 12/15/25 | | | | 6,145 | | | | 6,101,793 | |
U.S. Treasury Notes | | | 4.250 | | | | 12/31/25 | | | | 27,590 | | | | 27,490,848 | |
U.S. Treasury Strips Coupon | | | 1.750(s) | | | | 08/15/42 | | | | 415 | | | | 180,736 | |
U.S. Treasury Strips Coupon(k) | | | 2.062(s) | | | | 05/15/41 | | | | 34,830 | | | | 16,295,270 | |
U.S. Treasury Strips Coupon | | | 2.324(s) | | | | 05/15/42 | | | | 1,195 | | | | 526,267 | |
U.S. Treasury Strips Coupon | | | 2.335(s) | | | | 08/15/44 | | | | 1,620 | | | | 638,634 | |
U.S. Treasury Strips Coupon | | | 2.395(s) | | | | 11/15/43 | | | | 2 | | | | 815 | |
U.S. Treasury Strips Coupon | | | 2.434(s) | | | | 11/15/42 | | | | 16,395 | | | | 7,037,041 | |
U.S. Treasury Strips Coupon | | | 2.434(s) | | | | 11/15/45 | | | | 575 | | | | 214,704 | |
U.S. Treasury Strips Coupon(k) | | | 2.436(s) | | | | 02/15/46 | | | | 415 | | | | 153,372 | |
U.S. Treasury Strips Coupon | | | 3.863(s) | | | | 11/15/41 | | | | 3,405 | | | | 1,544,221 | |
U.S. Treasury Strips Coupon | | | 3.930(s) | | | | 02/15/41 | | | | 1,400 | | | | 663,961 | |
U.S. Treasury Strips Coupon | | | 4.608(s) | | | | 11/15/48 | | | | 95 | | | | 31,061 | |
U.S. Treasury Strips Coupon | | | 4.652(s) | | | | 05/15/49 | | | | 1,210 | | | | 388,807 | |
U.S. Treasury Strips Coupon | | | 4.924(s) | | | | 02/15/49 | | | | 280 | | | | 90,759 | |
U.S. Treasury Strips Coupon | | | 5.356(s) | | | | 05/15/40 | | | | 510 | | | | 251,554 | |
| | | | | | | | | | | | | | | | |
| | | | |
TOTAL U.S. TREASURY OBLIGATIONS
(cost $143,416,305) | | | | | | | | | | | | | | | 120,520,276 | |
| | | | | | | | | | | | | | | | |
| | | | |
| | | | | | | | | Shares | | | | |
AFFILIATED EXCHANGE-TRADED FUND 0.5% | | | | | | | | | | | | | | | | |
PGIM AAA CLO ETF
(cost $9,018,747)(wa) | | | | | | | | | | | 177,000 | | | | 9,052,665 | |
| | | | | | | | | | | | | | | | |
| | | | |
TOTAL LONG-TERM INVESTMENTS
(cost $2,067,447,314) | | | | | | | | | | | | | | | 1,963,004,705 | |
| | | | | | | | | | | | | | | | |
See Notes to Financial Statements.
PGIM Core Bond Fund 51
PGIM Core Bond Fund
Schedule of Investments (continued)
as of July 31, 2024
| | | | | | | | |
| | |
| Description | | Shares | | | Value | |
| | |
SHORT-TERM INVESTMENTS 3.8% | | | | | | | | |
| | |
AFFILIATED MUTUAL FUNDS | | | | | | | | |
PGIM Core Government Money Market Fund (7-day effective yield 5.561%)(wa) | | | 59,810,178 | | | $ | 59,810,178 | |
PGIM Institutional Money Market Fund (7-day effective yield 5.606%)
(cost $14,070,595; includes $13,989,453 of cash collateral for securities on loan)(b)(wa) | | | 14,082,758 | | | | 14,074,308 | |
| | | | | | | | |
| | |
TOTAL SHORT-TERM INVESTMENTS
(cost $73,880,773) | | | | | | | 73,884,486 | |
| | | | | | | | |
| | |
TOTAL INVESTMENTS 104.1%
(cost $2,141,328,087) | | | | | | | 2,036,889,191 | |
Liabilities in excess of other assets(z) (4.1)% | | | | | | | (80,519,181 | ) |
| | | | | | | | |
| | |
NET ASSETS 100.0% | | | | | | $ | 1,956,370,010 | |
| | | | | | | | |
See the Glossary for a list of the abbreviation(s) used in the annual report.
| # | Principal or notional amount is shown in U.S. dollars unless otherwise stated. |
| (a) | All or a portion of security is on loan. The aggregate market value of such securities, including those sold and pending settlement, is $13,759,221; cash collateral of $13,989,453 (included in liabilities) was received with which the Fund purchased highly liquid short-term investments. In the event of significant appreciation in value of securities on loan on the last business day of the reporting period, the Fund may reflect a collateral value that is less than the market value of the loaned securities and such shortfall is remedied the following business day. |
| (b) | Represents security, or portion thereof, purchased with cash collateral received for securities on loan and includes dividend reinvestment. |
| (c) | Variable rate instrument. The interest rate shown reflects the rate in effect at July 31, 2024. |
| (cc) | Variable rate instrument. The rate shown is based on the latest available information as of July 31, 2024. Certain variable rate securities are not based on a published reference rate and spread but are determined by the issuer or agent and are based on current market conditions. These securities do not indicate a reference rate and spread in their description. |
| (ff) | Variable rate security. Security may be issued at a fixed coupon rate, which converts to a variable rate at a specified date. Rate shown is the rate in effect as of period end. |
| (h) | Represents security, or a portion thereof, segregated as collateral for OTC derivatives. |
| (k) | Represents security, or a portion thereof, segregated as collateral for centrally cleared/exchange-traded derivatives. |
| (oo) | Perpetual security. Maturity date represents next call date. |
| (r) | Principal or notional amount is less than $500 par. |
| (s) | Represents zero coupon bond or principal only security. Rate represents yield to maturity at purchase date. |
| (wa) | Represents investments in Funds affiliated with the Manager. |
| (z) | Includes net unrealized appreciation/(depreciation) and/or market value of the below holdings which are excluded from the Schedule of Investments: |
See Notes to Financial Statements.
52
PGIM Core Bond Fund
Schedule of Investments (continued)
as of July 31, 2024
Forward Commitment Contract:
| | | | | | | | | | | | | | | | | | | | | | | | | |
| | | | | | | | | Principal | | |
| | | Interest | | Maturity | | Settlement | | Amount | | |
U.S. Government Agency Obligation | | Rate | | Date | | Date | | (000)# | | Value |
Federal National Mortgage Assoc.
(proceeds receivable $2,396,250) | | | | 2.000 | % | | | | TBA | | | | | 09/16/24 | | | | $ | (3,000 | ) | | | $ | (2,416,288 | ) |
| | | | | | | | | | | | | | | | | | | | | | | | | |
Futures contracts outstanding at July 31, 2024:
| | | | | | | | | | | | | | | | | |
Number of Contracts | | Type | | Expiration
Date | | Current
Notional
Amount | | Value /
Unrealized
Appreciation
(Depreciation) |
Long Positions: | | | | | | | | | | | | | | | |
584 | | 2 Year U.S. Treasury Notes | | | | Sep. 2024 | | | | $ | 119,934,438 | | | | $ | 891,889 | |
373 | | 5 Year U.S. Treasury Notes | | | | Sep. 2024 | | | | | 40,243,205 | | | | | 246,478 | |
240 | | 10 Year U.S. Treasury Notes | | | | Sep. 2024 | | | | | 26,835,000 | | | | | 326,073 | |
183 | | 10 Year U.S. Ultra Treasury Notes | | | | Sep. 2024 | | | | | 21,150,798 | | | | | 317,876 | |
177 | | 30 Year U.S. Ultra Treasury Bonds | | | | Sep. 2024 | | | | | 22,650,469 | | | | | 678,824 | |
| | | | | | | | | | | | | | | | | |
| | | | | | | | | | | | | | | | 2,461,140 | |
| | | | | | | | | | | | | | | | | |
Short Positions: | | | | | | | | | | | | | | | |
112 | | 3 Month CME SOFR | | | | Sep. 2024 | | | | | 26,495,700 | | | | | 18,695 | |
286 | | 20 Year U.S. Treasury Bonds | | | | Sep. 2024 | | | | | 34,543,438 | | | | | (820,170 | ) |
| | | | | | | | | | | | | | | | | |
| | | | | | | | | | | | | | | | (801,475 | ) |
| | | | | | | | | | | | | | | | | |
| | | | | | | | | | | | | | | $ | 1,659,665 | |
| | | | | | | | | | | | | | | | | |
Credit default swap agreements outstanding at July 31, 2024:
| | | | | | | | | | | | | | | | | | | | | | | | | | | | | | | | |
Reference Entity/ Obligation | | Termination
Date | | Fixed Rate | | Notional
Amount
(000)#(3) | | Fair
Value | | Upfront
Premiums
Paid
(Received) | | Unrealized
Appreciation
(Depreciation) | | Counterparty |
| |
OTC Credit Default Swap Agreements on corporate and/or sovereign issues - Buy Protection(1): | | | | | | |
U.S. Treasury Notes | | | | 06/20/25 | | | 0.250%(Q) | | | EUR | 3,530 | | | | $ | (3,332 | ) | | | $ | (1,698 | ) | | | $ | (1,634 | ) | | | | BARC | |
U.S. Treasury Notes | | | | 06/20/25 | | | 0.250%(Q) | | | EUR | 1,175 | | | | | (1,110 | ) | | | | (564 | ) | | | | (546 | ) | | | | BARC | |
| | | | | | | | | | | | | | | | | | | | | | | | | | | | | | | | |
| | | | | | | | | | | | | | | $ | (4,442 | ) | | | $ | (2,262 | ) | | | $ | (2,180 | ) | | | | | |
| | | | | | | | | | | | | | | | | | | | | | | | | | | | | | | | |
See Notes to Financial Statements.
PGIM Core Bond Fund 53
PGIM Core Bond Fund
Schedule of Investments (continued)
as of July 31, 2024
Credit default swap agreements outstanding at July 31, 2024 (continued):
| | | | | | | | | | | | | | | | | | | | | | | | | | | | | | |
Reference Entity/ Obligation | | Termination
Date | | | Fixed
Rate | | | Notional
Amount
(000)#(3) | | | Implied
Credit
Spread at
July 31,
2024(4) | | | Fair
Value | | | Upfront
Premiums
Paid
(Received) | | | Unrealized
Appreciation
(Depreciation) | | | Counterparty |
OTC Credit Default Swap Agreements on corporate and/or sovereign issues - Sell Protection(2): |
U.S. Treasury Notes | | | 12/20/24 | | | | 0.250%(Q) | | | EUR | 3,530 | | | | 0.087% | | | $ | 3,536 | | | $ | 2,251 | | | $ | 1,285 | | | BARC |
U.S. Treasury Notes | | | 12/20/24 | | | | 0.250%(Q) | | | EUR | 1,230 | | | | 0.087% | | | | 1,232 | | | | 1,046 | | | | 186 | | | DB |
U.S. Treasury Notes | | | 12/20/24 | | | | 0.250%(Q) | | | EUR | 1,175 | | | | 0.087% | | | | 1,177 | | | | 747 | | | | 430 | | | BARC |
| | | | | | | | | | | | | | | | | | | | | | | | | | | | | | |
| | | | | | | | | | | | | | | | | | $ | 5,945 | | | $ | 4,044 | | | $ | 1,901 | | | |
| | | | | | | | | | | | | | | | | | | | | | | | | | | | | | |
| | | | | | | | | | | | | | | | | | | | | | | | | | | | | | | | | | | |
Reference Entity/ Obligation | | Termination
Date | | Fixed
Rate | | Notional
Amount
(000)#(3) | | Implied Credit
Spread at
July 31,
2024(4) | | Value at
Trade Date | | Value at
July 31,
2024 | | Unrealized
Appreciation
(Depreciation) |
Centrally Cleared Credit Default Swap Agreement on credit indices - Sell Protection(2): | |
CDX.NA.IG.42.V1 | | | | 06/20/29 | | | | | 1.000%(Q) | | | | | 37,280 | | | | | 0.517 | % | | | $ | 795,957 | | | | $ | 835,970 | | | | $ | 40,013 | |
| | | | | | | | | | | | | | | | | | | | | | | | | | | | | | | | | | | |
The Fund entered into credit default swaps (“CDS”) to provide a measure of protection against defaults or to take an active long or short position with respect to the likelihood of a particular issuer’s default or the reference entity’s credit soundness. CDS contracts generally trade based on a spread which represents the cost a protection buyer has to pay the protection seller. The protection buyer is said to be short the credit as the value of the contract rises the more the credit deteriorates. The value of the CDS contract increases for the protection buyer if the spread increases.
| (1) | If the Fund is a buyer of protection, it pays the fixed rate. When a credit event occurs, as defined under the terms of that particular swap agreement, the Fund will either (i) receive from the seller of protection an amount equal to the notional amount of the swap and make delivery of the referenced obligation or underlying securities comprising the referenced index or (ii) receive a net settlement amount in the form of cash or securities equal to the notional amount of the swap less the recovery value of the referenced obligation or underlying securities comprising the referenced index. |
| (2) | If the Fund is a seller of protection, it receives the fixed rate. When a credit event occurs, as defined under the terms of that particular swap agreement, the Fund will either (i) pay to the buyer of protection an amount equal to the notional amount of the swap and take delivery of the referenced obligation or underlying securities comprising the referenced index or (ii) pay a net settlement amount in the form of cash or securities equal to the notional amount of the swap less the recovery value of the referenced obligation or underlying securities comprising the referenced index. |
| (3) | Notional amount represents the maximum potential amount the Fund could be required to pay as a seller of credit protection or receive as a buyer of credit protection if a credit event occurs as defined under the terms of that particular swap agreement. |
See Notes to Financial Statements.
54
PGIM Core Bond Fund
Schedule of Investments (continued)
as of July 31, 2024
| (4) | Implied credit spreads, represented in absolute terms, utilized in determining the fair value of credit default swap agreements where the Fund is the seller of protection as of the reporting date serve as an indicator of the current status of the payment/ performance risk and represent the likelihood of risk of default for the credit derivative. The implied credit spread of a particular referenced entity reflects the cost of buying/selling protection and may include up-front payments required to be made to enter into the agreement. Wider credit spreads represent a deterioration of the referenced entity’s credit soundness and a greater likelihood of risk of default or other credit event occurring as defined under the terms of the agreement. |
Interest rate swap agreements outstanding at July 31, 2024:
| | | | | | | | | | | | | | | | | | | | | | | | |
Notional
Amount
(000)# | | | Termination
Date | | | Fixed
Rate | | | Floating Rate | | Value at
Trade
Date | | | Value at
July 31,
2024 | | | Unrealized
Appreciation
(Depreciation) | |
|
| | Centrally Cleared Interest Rate Swap Agreements: | |
| | 79,125 | | | | 08/31/24 | | | | 5.384%(T) | | | 1 Day SOFR(2)(T)/ 5.380% | | $ | — | | | $ | (66,121 | ) | | $ | (66,121 | ) |
| | 10,388 | | | | 03/08/25 | | | | 4.946%(A) | | | 1 Day SOFR(2)(A)/ 5.380% | | | — | | | | (27,729 | ) | | | (27,729 | ) |
| | 13,356 | | | | 03/09/25 | | | | 5.110%(A) | | | 1 Day SOFR(2)(A)/ 5.380% | | | — | | | | (13,676 | ) | | | (13,676 | ) |
| | 30,246 | | | | 03/10/25 | | | | 5.088%(A) | | | 1 Day SOFR(2)(A)/ 5.380% | | | — | | | | (37,272 | ) | | | (37,272 | ) |
| | 52,635 | | | | 05/17/25 | | | | 5.113%(T) | | | 1 Day SOFR(2)(T)/ 5.380% | | | — | | | | 55,705 | | | | 55,705 | |
| | 40,800 | | | | 08/31/25 | | | | 4.805%(A) | | | 1 Day SOFR(1)(A)/ 5.380% | | | — | | | | 189,474 | | | | 189,474 | |
| | 26,965 | | | | 05/17/26 | | | | 4.669%(A) | | | 1 Day SOFR(1)(A)/ 5.380% | | | — | | | | (142,003 | ) | | | (142,003 | ) |
| | 2,245 | | | | 09/25/26 | | | | 4.699%(A) | | | 1 Day SOFR(1)(A)/ 5.380% | | | 415 | | | | (11,122 | ) | | | (11,537 | ) |
| | 48,850 | | | | 05/13/27 | | | | 4.497%(A) | | | 1 Day SOFR(2)(A)/ 5.380% | | | 16,904 | | | | 570,761 | | | | 553,857 | |
| | 30,400 | | | | 05/13/29 | | | | 4.253%(A) | | | 1 Day SOFR(1)(A)/ 5.380% | | | (32,323 | ) | | | (608,811 | ) | | | (576,488 | ) |
| | 2,800 | | | | 05/11/54 | | | | 1.350%(A) | | | 1 Day SOFR(1)(A)/ 5.380% | | | 1,278,108 | | | | 1,152,536 | | | | (125,572 | ) |
| | | | | | | | | | | | | | | | | | | | | | | | |
| | | | | | | | | | | | | | $ | 1,263,104 | | | $ | 1,061,742 | | | $ | (201,362 | ) |
| | | | | | | | | | | | | | | | | | | | | | | | |
| (1) | The Fund pays the fixed rate and receives the floating rate. |
| (2) | The Fund pays the floating rate and receives the fixed rate. |
Total return swap agreements outstanding at July 31, 2024:
| | | | | | | | | | | | | | | | | | |
Reference Entity | | Financing
Rate | | Counterparty | | Termination
Date | | Long
(Short)
Notional
Amount
(000)#(1) | | | Fair
Value | | | Upfront
Premiums
Paid
(Received) | | Unrealized
Appreciation
(Depreciation)(2) |
|
OTC Total Return Swap Agreements: |
Total Return Benchmark
Bond Index(T) | | 1 Day USOIS -54bps(T)/ 4.790% | | JPM | | 09/20/24 | | | (8,073 | ) | | $ | 16,690 | | | $— | | $ 16,690 |
U.S. Treasury Bond(T) | | 1 Day USOIS +20bps(T)/ 5.530% | | JPM | | 08/05/24 | | | 16,665 | | | | (554,914 | ) | | — | | (554,914) |
U.S. Treasury Bond(T) | | 1 Day USOIS +21bps(T)/ 5.540% | | BOA | | 09/10/24 | | | 29,165 | | | | (996,784 | ) | | — | | (996,784) |
See Notes to Financial Statements.
PGIM Core Bond Fund 55
PGIM Core Bond Fund
Schedule of Investments (continued)
as of July 31, 2024
Total return swap agreements outstanding at July 31, 2024 (continued):
| | | | | | | | | | | | | | | | | | | | | | | | |
Reference Entity | | Financing Rate | | Counterparty | | Termination
Date | | | Long
(Short)
Notional
Amount
(000)#(1) | | | Fair
Value | | | Upfront
Premiums
Paid
(Received) | | | Unrealized
Appreciation
(Depreciation)(2) | |
OTC Total Return Swap Agreements (cont’d.): | |
U.S. Treasury Bond(T) | | 1 Day USOIS +20bps(T)/ 5.530% | | JPM | | | 10/28/24 | | | | 40,665 | | | $ | 1,658,151 | | | $ | — | | | $ | 1,658,151 | |
U.S. Treasury Bond(T) | | 1 Day USOIS +20bps(T)/ 5.530% | | JPM | | | 12/04/24 | | | | 19,925 | | | | 592,444 | | | | — | | | | 592,444 | |
U.S. Treasury Bond(T) | | 1 Day USOIS +17bps(T)/ 5.500% | | GSI | | | 01/10/25 | | | | 40,595 | | | | 648,693 | | | | — | | | | 648,693 | |
U.S. Treasury Bond(T) | | 1 Day USOIS +23bps(T)/ 5.560% | | GSI | | | 02/03/25 | | | | 22,845 | | | | 110,308 | | | | — | | | | 110,308 | |
| | | | | | | | | | | | | | | | | | | | | | | | |
| | | | | | | | | | | | | | $ | 1,474,588 | | | $ | — | | | $ | 1,474,588 | |
| | | | | | | | | | | | | | | | | | | | | | | | |
| (1) | On a long total return swap, the Fund receives payments for any positive return on the reference entity (makes payments for any negative return) and pays the financing rate. On a short total return swap, the Fund makes payments for any positive return on the reference entity (receives payments for any negative return) and receives the financing rate. |
| (2) | Upfront/recurring fees or commissions, as applicable, are included in the net unrealized appreciation (depreciation). |
Balances Reported in the Statement of Assets and Liabilities for OTC Swap Agreements:
| | | | | | | | |
| | | Premiums Paid | | Premiums Received | | Unrealized
Appreciation | | Unrealized
Depreciation |
OTC Swap Agreements | | $4,044 | | $(2,262) | | $3,028,187 | | $(1,553,878) |
Summary of Collateral for Centrally Cleared/Exchange-traded Derivatives:
Cash and securities segregated as collateral, including pending settlement for closed positions, to cover requirements for centrally cleared/exchange-traded derivatives are listed by broker as follows:
| | | | | | | | | | |
Broker | | Cash and/or Foreign Currency | | Securities Market Value |
CGM | | | | $— | | | | | $4,265,848 | |
| | | | | | | | | | |
Fair Value Measurements:
Various inputs are used in determining the value of the Fund’s investments. These inputs are summarized in the three broad levels listed below.
See Notes to Financial Statements.
56
PGIM Core Bond Fund
Schedule of Investments (continued)
as of July 31, 2024
Level 1—unadjusted quoted prices generally in active markets for identical securities.
Level 2—quoted prices for similar securities, interest rates and yield curves, prepayment speeds, foreign currency exchange rates and other observable inputs.
Level 3—unobservable inputs for securities valued in accordance with Board approved fair valuation procedures.
The following is a summary of the inputs used as of July 31, 2024 in valuing such portfolio securities:
| | | | | | | | | | | | |
| | | Level 1 | | | Level 2 | | | Level 3 | |
Investments in Securities | | | | | | | | | | | | |
Assets | | | | | | | | | | | | |
Long-Term Investments | | | | | | | | | | | | |
Asset-Backed Securities | | | | | | | | | | | | |
Automobiles | | $ | — | | | $ | 91,805,413 | | | | $— | |
Collateralized Loan Obligations | | | — | | | | 267,307,343 | | | | — | |
Consumer Loans | | | — | | | | 20,439,927 | | | | — | |
Credit Cards | | | — | | | | 2,058,644 | | | | — | |
Equipment | | | — | | | | 1,809,610 | | | | — | |
Home Equity Loans | | | — | | | | 5,504,137 | | | | — | |
Other | | | — | | | | 978,120 | | | | — | |
Student Loans | | | — | | | | 5,308,950 | | | | — | |
Commercial Mortgage-Backed Securities | | | — | | | | 269,332,643 | | | | — | |
Corporate Bonds | | | — | | | | 610,460,126 | | | | — | |
Municipal Bonds | | | — | | | | 6,400,542 | | | | — | |
Residential Mortgage-Backed Securities | | | — | | | | 42,296,661 | | | | — | |
Sovereign Bonds | | | — | | | | 5,947,461 | | | | — | |
U.S. Government Agency Obligations | | | — | | | | 503,782,187 | | | | — | |
U.S. Treasury Obligations | | | — | | | | 120,520,276 | | | | — | |
Affiliated Exchange-Traded Fund | | | 9,052,665 | | | | — | | | | — | |
Short-Term Investments | | | | | | | | | | | | |
Affiliated Mutual Funds | | | 73,884,486 | | | | — | | | | — | |
| | | | | | | | | | | | |
Total | | $ | 82,937,151 | | | $ | 1,953,952,040 | | | | $— | |
| | | | | | | | | | | | |
| | | |
Other Financial Instruments* | | | | | | | | | | | | |
Assets | | | | | | | | | | | | |
Futures Contracts | | $ | 2,479,835 | | | $ | — | | | | $— | |
Centrally Cleared Credit Default Swap Agreement | | | — | | | | 40,013 | | | | — | |
OTC Credit Default Swap Agreements | | | — | | | | 5,945 | | | | — | |
Centrally Cleared Interest Rate Swap Agreements | | | — | | | | 799,036 | | | | — | |
OTC Total Return Swap Agreements | | | — | | | | 3,026,286 | | | | — | |
| | | | | | | | | | | | |
Total | | $ | 2,479,835 | | | $ | 3,871,280 | | | | $— | |
| | | | | | | | | | | | |
| | | |
Liabilities | | | | | | | | | | | | |
Forward Commitment Contract | | $ | — | | | $ | (2,416,288 | ) | | | $— | |
Futures Contracts | | | (820,170 | ) | | | — | | | | — | |
OTC Credit Default Swap Agreements | | | — | | | | (4,442 | ) | | | — | |
See Notes to Financial Statements.
PGIM Core Bond Fund 57
PGIM Core Bond Fund
Schedule of Investments (continued)
as of July 31, 2024
| | | | | | | | | | | | |
| | | Level 1 | | | Level 2 | | | Level 3 | |
Other Financial Instruments* (continued) | | | | | | | | | | | | |
Liabilities (continued) | | | | | | | | | | | | |
Centrally Cleared Interest Rate Swap Agreements | | $ | — | | | $ | (1,000,398 | ) | | | $— | |
OTC Total Return Swap Agreements | | | — | | | | (1,551,698 | ) | | | — | |
| | | | | | | | | | | | |
Total | | $ | (820,170 | ) | | $ | (4,972,826 | ) | | | $— | |
| | | | | | | | | | | | |
| * | Other financial instruments are derivative instruments, with the exception of forward commitment contracts, and are not reflected in the Schedule of Investments. Futures, forwards and centrally cleared swap contracts are recorded at unrealized appreciation (depreciation) and OTC swap contracts are recorded at fair value. Forward commitment contracts are recorded at market value. |
Industry Classification:
The industry classification of investments and liabilities in excess of other assets shown as a percentage of net assets as of July 31, 2024 were as follows:
| | | | |
U.S. Government Agency Obligations | | | 25.7 | % |
Commercial Mortgage-Backed Securities | | | 13.8 | |
Collateralized Loan Obligations | | | 13.7 | |
Banks | | | 10.1 | |
U.S. Treasury Obligations | | | 6.1 | |
Automobiles | | | 4.7 | |
Affiliated Mutual Funds (0.7% represents investments purchased with collateral from securities on loan) | | | 3.8 | |
Electric | | | 2.6 | |
Residential Mortgage-Backed Securities | | | 2.2 | |
Pipelines | | | 1.8 | |
Telecommunications | | | 1.7 | |
Oil & Gas | | | 1.5 | |
Pharmaceuticals | | | 1.4 | |
Real Estate Investment Trusts (REITs) | | | 1.4 | |
Healthcare-Services | | | 1.2 | |
Consumer Loans | | | 1.0 | |
Auto Manufacturers | | | 0.9 | |
Agriculture | | | 0.8 | |
Mining | | | 0.8 | |
Media | | | 0.7 | |
Diversified Financial Services | | | 0.7 | |
Aerospace & Defense | | | 0.7 | |
Insurance | | | 0.6 | |
Affiliated Exchange-Traded Fund | | | 0.5 | |
Packaging & Containers | | | 0.4 | |
Municipal Bonds | | | 0.3 | |
| | | | |
Sovereign Bonds | | | 0.3 | % |
Home Equity Loans | | | 0.3 | |
Semiconductors | | | 0.3 | |
Beverages | | | 0.3 | |
Student Loans | | | 0.3 | |
Iron/Steel | | | 0.3 | |
Commercial Services | | | 0.2 | |
Software | | | 0.2 | |
Foods | | | 0.2 | |
Engineering & Construction | | | 0.2 | |
Computers | | | 0.2 | |
Real Estate | | | 0.2 | |
Chemicals | | | 0.2 | |
Biotechnology | | | 0.2 | |
Entertainment | | | 0.2 | |
Retail | | | 0.2 | |
Miscellaneous Manufacturing | | | 0.2 | |
Office/Business Equipment | | | 0.1 | |
Trucking & Leasing | | | 0.1 | |
Lodging | | | 0.1 | |
Credit Cards | | | 0.1 | |
Machinery-Diversified | | | 0.1 | |
Gas | | | 0.1 | |
Equipment | | | 0.1 | |
Transportation | | | 0.1 | |
Multi-National | | | 0.1 | |
Airlines | | | 0.1 | |
See Notes to Financial Statements.
58
PGIM Core Bond Fund
Schedule of Investments (continued)
as of July 31, 2024
Industry Classification (continued):
| | | | |
Forest Products & Paper | | | 0.0 | *% |
Other | | | 0.0 | * |
Building Materials | | | 0.0 | * |
Oil & Gas Services | | | 0.0 | * |
Healthcare-Products | | | 0.0 | * |
Water | | | 0.0 | * |
| | | | |
| |
| | | 104.1 | |
Liabilities in excess of other assets | | | (4.1 | ) |
| | | | |
| |
| | | 100.0 | % |
| | | | |
Effects of Derivative Instruments on the Financial Statements and Primary Underlying Risk Exposure:
The Fund invested in derivative instruments during the reporting period. The primary types of risk associated with these derivative instruments are credit risk and interest rate risk. See the Notes to Financial Statements for additional detail regarding these derivative instruments and their risks. The effect of such derivative instruments on the Fund’s financial position and financial performance as reflected in the Statement of Assets and Liabilities and Statement of Operations is presented in the summary below.
Fair values of derivative instruments as of July 31, 2024 as presented in the Statement of Assets and Liabilities:
| | | | | | | | | | | | |
| | | Asset Derivatives | | | Liability Derivatives | |
Derivatives not accounted for
as hedging instruments, carried at fair value | | Statement of Assets and Liabilities Location | | Fair
Value | | | Statement of Assets and Liabilities Location | | Fair
Value | |
Credit contracts | | Due from/to broker-variation margin swaps | | $ | 40,013 | * | | — | | $ | — | |
| | | | |
Credit contracts | | Premiums paid for OTC swap agreements | | | 4,044 | | | Premiums received for OTC swap agreements | | | 2,262 | |
| | | | |
Credit contracts | | Unrealized appreciation on OTC swap agreements | | | 1,901 | | | Unrealized depreciation on OTC swap agreements | | | 2,180 | |
| | | | |
Interest rate contracts | | Due from/to broker-variation margin futures | | | 2,479,835 | * | | Due from/to broker-variation margin futures | | | 820,170 | * |
| | | | |
Interest rate contracts | | Due from/to broker-variation margin swaps | | | 799,036 | * | | Due from/to broker-variation margin swaps | | | 1,000,398 | * |
See Notes to Financial Statements.
PGIM Core Bond Fund 59
PGIM Core Bond Fund
Schedule of Investments (continued)
as of July 31, 2024
| | | | | | | | | | | | |
| | | Asset Derivatives | | | Liability Derivatives | |
Derivatives not accounted for
as hedging instruments, carried at fair value | | Statement of Assets and Liabilities Location | | Fair
Value | | | Statement of Assets and Liabilities Location | | Fair
Value | |
| | | | |
Interest rate contracts | | Unrealized appreciation on OTC swap agreements | | $ | 3,026,286 | | | Unrealized depreciation on OTC swap agreements | | $ | 1,551,698 | |
| | | | | | | | | | | | |
| | | | |
| | | | $ | 6,351,115 | | | | | $ | 3,376,708 | |
| | | | | | | | | | | | |
| * | Includes cumulative appreciation (depreciation) as reported in the schedule of open futures and centrally cleared swap contracts. Only unsettled variation margin receivable (payable) is reported within the Statement of Assets and Liabilities. |
The effects of derivative instruments on the Statement of Operations for the year ended July 31, 2024 are as follows:
| | | | | | | | | | | | | | | |
Amount of Realized Gain (Loss) on Derivatives Recognized in Income | |
Derivatives not accounted for as hedging instruments, carried at fair value | | Options
Purchased(1) | | Futures | | Swaps |
| | | |
Credit contracts | | | $ | — | | | | $ | — | | | | $ | 393,677 | |
| | | |
Interest rate contracts | | | | (849 | ) | | | | (3,516,480 | ) | | | | (8,130,579 | ) |
| | | | | | | | | | | | | | | |
| | | |
Total | | | $ | (849 | ) | | | $ | (3,516,480 | ) | | | $ | (7,736,902 | ) |
| | | | | | | | | | | | | | | |
| (1) | Included in net realized gain (loss) on investment transactions in the Statement of Operations. |
| | | | | | | | | | | | | | | |
Change in Unrealized Appreciation (Depreciation) on Derivatives Recognized in Income | |
Derivatives not accounted for as hedging instruments, carried at fair value | | Options
Written | | Futures | | Swaps |
| | | |
Credit contracts | | | $ | 96 | | | | $ | — | | | | $ | (41,542 | ) |
| | | |
Interest rate contracts | | | | — | | | | | 2,929,581 | | | | | 2,991,693 | |
| | | | | | | | | | | | | | | |
| | | |
Total | | | $ | 96 | | | | $ | 2,929,581 | | | | $ | 2,950,151 | |
| | | | | | | | | | | | | | | |
For the year ended July 31, 2024, the Fund’s average volume of derivative activities is as follows:
| | | | | | | | |
| Derivative Contract Type | | Average Volume of Derivative Activities* | |
| |
Options Purchased (1) | | | $ 170 | | | | | |
Options Written (2) | | | 11,032,000 | | | | | |
Futures Contracts - Long Positions (2) | | | 227,735,189 | | | | | |
Futures Contracts - Short Positions (2) | | | 69,893,719 | | | | | |
Interest Rate Swap Agreements (2) | | | 184,616,000 | | | | | |
Credit Default Swap Agreements - Buy Protection (2) | | | 1,018,397 | | | | | |
Credit Default Swap Agreements - Sell Protection (2) | | | 37,912,242 | | | | | |
| |
See Notes to Financial Statements.
60
PGIM Core Bond Fund
Schedule of Investments (continued)
as of July 31, 2024
| | |
| Derivative Contract Type | | Average Volume of Derivative Activities* |
|
| |
Total Return Swap Agreements (2) | | $153,634,051 |
|
| * | Average volume is based on average quarter end balances for the year ended July 31, 2024. |
| (2) | Notional Amount in USD. |
Financial Instruments/Transactions—Summary of Offsetting and Netting Arrangements:
The Fund invested in OTC derivatives and entered into financial instruments/transactions during the reporting period that are either offset in accordance with current requirements or are subject to enforceable master netting arrangements or similar agreements that permit offsetting. The information about offsetting and related netting arrangements for OTC derivatives and financial instruments/transactions where the legal right to set-off exists is presented in the summary below.
Offsetting of financial instrument/transaction assets and liabilities:
| | | | | | | | | | | | |
| Description | | Gross Market
Value of Recognized Assets/(Liabilities) | | Collateral
Pledged/(Received)(2) | | Net
Amount |
Securities on Loan | | | $ | 13,759,221 | | | | $ | (13,759,221 | ) | | $— |
Offsetting of OTC derivative assets and liabilities:
| | | | | | | | | | | | | | | | | | | | | | | | | |
Counterparty | | Gross Amounts of
Recognized
Assets(1) | | Gross Amounts of
Recognized
Liabilities(1) | | Net Amounts of
Recognized
Assets/(Liabilities) | | Collateral
Pledged/(Received)(2) | | Net Amount |
BARC | | | $ | 4,713 | | | | $ | (4,442 | ) | | | $ | 271 | | | | $ | — | | | | $ | 271 | |
BOA | | | | — | | | | | (996,784 | ) | | | | (996,784 | ) | | | | 996,784 | | | | | — | |
DB | | | | 1,232 | | | | | — | | | | | 1,232 | | | | | — | | | | | 1,232 | |
GSI | | | | 759,001 | | | | | — | | | | | 759,001 | | | | | — | | | | | 759,001 | |
JPM | | | | 2,267,285 | | | | | (554,914 | ) | | | | 1,712,371 | | | | | (1,229,709 | ) | | | | 482,662 | |
| | | | | | | | | | | | | | | | | | | | | | | | | |
| | | $ | 3,032,231 | | | | $ | (1,556,140 | ) | | | $ | 1,476,091 | | | | $ | (232,925 | ) | | | $ | 1,243,166 | |
| | | | | | | | | | | | | | | | | | | | | | | | | |
| (1) | Includes unrealized appreciation/(depreciation) on swaps and forwards, premiums paid/(received) on swap agreements and market value of purchased and written options, as represented on the Statement of Assets and Liabilities. |
| (2) | Collateral amount disclosed by the Fund is limited to the market value of financial instruments/transactions and the Fund’s OTC derivative exposure by counterparty. |
See Notes to Financial Statements.
PGIM Core Bond Fund 61
PGIM Core Bond Fund
Statement of Assets & Liabilities
as of July 31, 2024
| | | | |
| |
Assets | | | | |
Investments at value, including securities on loan of $13,759,221: | | | | |
Unaffiliated investments (cost $2,058,428,567) | | $ | 1,953,952,040 | |
Affiliated investments (cost $82,899,520) | | | 82,937,151 | |
Foreign currency, at value (cost $35,296) | | | 35,244 | |
Receivable for investments sold | | | 25,930,344 | |
Dividends and interest receivable | | | 11,281,099 | |
Unrealized appreciation on OTC swap agreements | | | 3,028,187 | |
Receivable for Fund shares sold | | | 2,567,319 | |
Due from broker—variation margin futures | | | 180,711 | |
Premiums paid for OTC swap agreements | | | 4,044 | |
Prepaid expenses and other assets | | | 67,471 | |
| | | | |
| |
Total Assets | | | 2,079,983,610 | |
| | | | |
| |
Liabilities | | | | |
Payable for investments purchased | | | 101,116,780 | |
Payable to broker for collateral for securities on loan | | | 13,989,453 | |
Payable for Fund shares purchased | | | 3,604,830 | |
Forward commitment contracts, at value (proceeds receivable $2,396,250) | | | 2,416,288 | |
Unrealized depreciation on OTC swap agreements | | | 1,553,878 | |
Accrued expenses and other liabilities | | | 414,299 | |
Management fee payable | | | 413,140 | |
Dividends payable | | | 53,478 | |
Distribution fee payable | | | 38,018 | |
Affiliated transfer agent fee payable | | | 5,256 | |
Due to broker—variation margin swaps | | | 3,671 | |
Premiums received for OTC swap agreements | | | 2,262 | |
Trustees’ fees payable | | | 2,247 | |
| | | | |
| |
Total Liabilities | | | 123,613,600 | |
| | | | |
| |
Net Assets | | $ | 1,956,370,010 | |
| | | | |
| |
| | | | | |
Net assets were comprised of: | | | | |
Shares of beneficial interest, at par | | $ | 223,380 | |
Paid-in capital in excess of par | | | 2,182,835,121 | |
Total distributable earnings (loss) | | | (226,688,491 | ) |
| | | | |
| |
Net assets, July 31, 2024 | | $ | 1,956,370,010 | |
| | | | |
See Notes to Financial Statements.
62
PGIM Core Bond Fund
Statement of Assets & Liabilities (continued)
as of July 31, 2024
| | | | | | | | |
| | |
Class A | | | | | | | | |
Net asset value and redemption price per share, ($160,304,786 ÷ 18,307,752 shares of beneficial interest issued and outstanding) | | $ | 8.76 | | | | | |
Maximum sales charge (3.25% of offering price) | | | 0.29 | | | | | |
| | | | | | | | |
| | |
Maximum offering price to public | | $ | 9.05 | | | | | |
| | | | | | | | |
| | |
Class C | | | | | | | | |
Net asset value, offering price and redemption price per share, ($5,723,741 ÷ 653,360 shares of beneficial interest issued and outstanding) | | $ | 8.76 | | | | | |
| | | | | | | | |
| | |
Class R | | | | | | | | |
Net asset value, offering price and redemption price per share, ($21,022 ÷ 2,401 shares of beneficial interest issued and outstanding) | | $ | 8.75 | | | | | |
| | | | | | | | |
| | |
Class Z | | | | | | | | |
Net asset value, offering price and redemption price per share, ($399,522,220 ÷ 45,619,448 shares of beneficial interest issued and outstanding) | | $ | 8.76 | | | | | |
| | | | | | | | |
| | |
Class R6 | | | | | | | | |
Net asset value, offering price and redemption price per share, ($1,390,798,241 ÷ 158,797,109 shares of beneficial interest issued and outstanding) | | $ | 8.76 | | | | | |
| | | | | | | | |
| | |
Net asset value per share may not recalculate due to rounding. | | | | | | | | |
See Notes to Financial Statements.
PGIM Core Bond Fund 63
PGIM Core Bond Fund
Statement of Operations
Year Ended July 31, 2024
| | | | |
Net Investment Income (Loss) | |
Income | | | | |
Interest income | | $ | 73,774,833 | |
Affiliated dividend income | | | 2,933,292 | |
Affiliated income from securities lending, net | | | 30,689 | |
| | | | |
| |
Total income | | | 76,738,814 | |
| | | | |
Expenses | | | | |
Management fee | | | 5,397,965 | |
Distribution fee(a) | | | 426,843 | |
Transfer agent’s fees and expenses (including affiliated expense of $26,517)(a) | | | 516,830 | |
Shareholders’ reports | | | 131,923 | |
Registration fees(a) | | | 126,205 | |
Custodian and accounting fees | | | 116,116 | |
Audit fee | | | 68,900 | |
Professional fees | | | 54,032 | |
Trustees’ fees | | | 32,849 | |
SEC registration fees | | | 21,748 | |
Miscellaneous | | | 62,182 | |
| | | | |
| |
Total expenses | | | 6,955,593 | |
Less: Fee waiver and/or expense reimbursement(a) | | | (960,387 | ) |
Distribution fee waiver(a) | | | (47 | ) |
| | | | |
| |
Net expenses | | | 5,995,159 | |
| | | | |
Net investment income (loss) | | | 70,743,655 | |
| | | | |
Realized And Unrealized Gain (Loss) On Investment And Foreign Currency Transactions | |
Net realized gain (loss) on: | | | | |
Investment transactions (including affiliated of $(1,544)) | | | (18,915,738 | ) |
Futures transactions | | | (3,516,480 | ) |
Swap agreement transactions | | | (7,736,902 | ) |
Foreign currency transactions | | | (37 | ) |
| | | | |
| |
| | | (30,169,157 | ) |
| | | | |
Net change in unrealized appreciation (depreciation) on: | | | | |
Investments (including affiliated of $33,354) | | | 60,334,639 | |
Futures | | | 2,929,581 | |
Options written | | | 96 | |
Swap agreements | | | 2,950,151 | |
Foreign currencies | | | (543 | ) |
| | | | |
| |
| | | 66,213,924 | |
| | | | |
Net gain (loss) on investment and foreign currency transactions | | | 36,044,767 | |
| | | | |
| |
Net Increase (Decrease) In Net Assets Resulting From Operations | | $ | 106,788,422 | |
| | | | |
See Notes to Financial Statements.
64
PGIM Core Bond Fund
Statement of Operations (continued)
Year Ended July 31, 2024
| (a) | Class specific expenses and waivers were as follows: |
| | | | | | | | | | | | | | | | | | | | |
| | | Class A | | | Class C | | | Class R | | | Class Z | | | Class R6 | |
| | | | | |
Distribution fee | | | 367,708 | | | | 58,994 | | | | 141 | | | | — | | | | — | |
| | | | | |
Transfer agent’s fees and expenses | | | 93,621 | | | | 6,544 | | | | 98 | | | | 390,875 | | | | 25,692 | |
| | | | | |
Registration fees | | | 25,141 | | | | 14,480 | | | | 7,139 | | | | 25,796 | | | | 53,649 | |
| | | | | |
Fee waiver and/or expense reimbursement | | | (42,147 | ) | | | (15,049 | ) | | | (7,215 | ) | | | (489,517 | ) | | | (406,459 | ) |
| | | | | |
Distribution fee waiver | | | — | | | | — | | | | (47 | ) | | | — | | | | — | |
See Notes to Financial Statements.
PGIM Core Bond Fund 65
PGIM Core Bond Fund
Statements of Changes in Net Assets
| | | | | | | | |
| |
| | | Year Ended
July 31, | |
| | |
| | | 2024 | | | 2023 | |
| | |
Increase (Decrease) in Net Assets | | | | | | | | |
| | |
Operations | | | | | | | | |
Net investment income (loss) | | $ | 70,743,655 | | | $ | 49,064,942 | |
Net realized gain (loss) on investment and foreign currency transactions | | | (30,169,157 | ) | | | (40,154,083 | ) |
Net change in unrealized appreciation (depreciation) on investments and foreign currencies | | | 66,213,924 | | | | (49,476,958 | ) |
| | | | | | | | |
Net increase (decrease) in net assets resulting from operations | | | 106,788,422 | | | | (40,566,099 | ) |
| | | | | | | | |
| | |
Dividends and Distributions | | | | | | | | |
Distributions from distributable earnings | | | | | | | | |
Class A | | | (6,186,905 | ) | | | (4,715,077 | ) |
Class C | | | (201,101 | ) | | | (148,157 | ) |
Class R | | | (731 | ) | | | (523 | ) |
Class Z | | | (17,769,219 | ) | | | (11,466,521 | ) |
Class R6 | | | (51,641,576 | ) | | | (36,832,538 | ) |
| | | | | | | | |
| | | (75,799,532 | ) | | | (53,162,816 | ) |
| | | | | | | | |
Tax return of capital distributions | | | | | | | | |
Class A | | | — | | | | (10,434 | ) |
Class C | | | — | | | | (328 | ) |
Class R | | | — | | | | (1 | ) |
Class Z | | | — | | | | (25,374 | ) |
Class R6 | | | — | | | | (81,507 | ) |
| | | | | | | | |
| | | — | | | | (117,644 | ) |
| | | | | | | | |
Total dividends and distributions | | | (75,799,532 | ) | | | (53,280,460 | ) |
| | | | | | | | |
| | |
Fund share transactions (Net of share conversions) | | | | | | | | |
Net proceeds from shares sold | | | 755,194,198 | | | | 578,723,552 | |
Net asset value of shares issued in reinvestment of dividends and distributions | | | 75,165,046 | | | | 52,915,340 | |
Cost of shares purchased | | | (479,036,206 | ) | | | (434,744,501 | ) |
| | | | | | | | |
Net increase (decrease) in net assets from Fund share transactions | | | 351,323,038 | | | | 196,894,391 | |
| | | | | | | | |
Total increase (decrease) | | | 382,311,928 | | | | 103,047,832 | |
| | |
Net Assets: | | | | | | | | |
Beginning of year | | | 1,574,058,082 | | | | 1,471,010,250 | |
| | | | | | | | |
End of year | | $ | 1,956,370,010 | | | $ | 1,574,058,082 | |
| | | | | | | | |
See Notes to Financial Statements.
66
PGIM Core Bond Fund
Financial Highlights
| | | | | | | | | | | | | | | | | | | | |
| | | | | | |
Class A Shares | | | | | | | | | | | | | | | | | | | | |
| | | Year Ended July 31, | |
| | | 2024 | | | 2023 | | | 2022 | | | 2021 | | | 2020 | |
Per Share Operating Performance(a): | | | | | | | | | | | | | | | | | | | | |
Net Asset Value, Beginning of Year | | | $8.62 | | | | $9.21 | | | | $10.53 | | | | $10.78 | | | | $10.09 | |
Income (loss) from investment operations: | | | | | | | | | | | | | | | | | | | | |
Net investment income (loss) | | | 0.33 | | | | 0.27 | | | | 0.16 | | | | 0.15 | | | | 0.21 | |
Net realized and unrealized gain (loss) on investment and foreign currency transactions | | | 0.17 | | | | (0.57 | ) | | | (1.29 | ) | | | (0.13 | ) | | | 0.74 | |
Total from investment operations | | | 0.50 | | | | (0.30 | ) | | | (1.13 | ) | | | 0.02 | | | | 0.95 | |
Less Dividends and Distributions: | | | | | | | | | | | | | | | | | | | | |
Dividends from net investment income | | | (0.36 | ) | | | (0.29 | ) | | | (0.19 | ) | | | (0.20 | ) | | | (0.26 | ) |
Tax return of capital distributions | | | - | | | | (- | )(b) | | | - | | | | - | | | | - | |
Distributions from net realized gains | | | - | | | | - | | | | - | | | | (0.07 | ) | | | (- | )(b) |
Total dividends and distributions | | | (0.36 | ) | | | (0.29 | ) | | | (0.19 | ) | | | (0.27 | ) | | | (0.26 | ) |
Net asset value, end of year | | | $8.76 | | | | $8.62 | | | | $9.21 | | | | $10.53 | | | | $10.78 | |
Total Return(c): | | | 5.97 | % | | | (3.20 | )% | | | (10.81 | )% | | | 0.17 | % | | | 9.50 | % |
| | | | | | |
| | | | | | | | | | | | | | | | | | | | | |
| | | | | | |
Ratios/Supplemental Data: | | | | | | | | | | | | | | | | | | | | |
Net assets, end of year (000) | | $ | 160,305 | | | $ | 141,074 | | | $ | 148,963 | | | $ | 216,235 | | | $ | 181,510 | |
Average net assets (000) | | $ | 147,083 | | | $ | 140,822 | | | $ | 180,069 | | | $ | 202,963 | | | $ | 119,286 | |
Ratios to average net assets(d): | | | | | | | | | | | | | | | | | | | | |
Expenses after waivers and/or expense reimbursement | | | 0.65 | % | | | 0.65 | % | | | 0.65 | % | | | 0.66 | % | | | 0.70 | % |
Expenses before waivers and/or expense reimbursement | | | 0.68 | % | | | 0.68 | % | | | 0.68 | % | | | 0.69 | % | | | 0.75 | % |
Net investment income (loss) | | | 3.90 | % | | | 3.07 | % | | | 1.62 | % | | | 1.42 | % | | | 2.01 | % |
Portfolio turnover rate(e)(f) | | | 125 | % | | | 207 | % | | | 141 | % | | | 117 | % | | | 90 | % |
| (a) | Calculated based on average shares outstanding during the year. |
| (b) | Amount rounds to zero. |
| (c) | Total return does not consider the effects of sales loads. Total return is calculated assuming a purchase of a share on the first day and a sale on the last day of each year reported and includes reinvestment of dividends and distributions, if any. Total returns may reflect adjustments to conform to GAAP. |
| (d) | Does not include expenses of the investment companies in which the Fund invests. |
| (e) | The Fund accounts for mortgage dollar roll transactions, when applicable, as purchases and sales which, as a result, can increase its portfolio turnover rate. |
| (f) | The Fund’s portfolio turnover rate is calculated in accordance with regulatory requirements, without regard to transactions involving short-term investments, certain derivatives and in-kind transactions (if any). If such transactions were included, the Fund’s portfolio turnover rate may be higher. |
See Notes to Financial Statements.
PGIM Core Bond Fund 67
PGIM Core Bond Fund
Financial Highlights (continued)
| | | | | | | | | | | | | | | | | | | | |
| | | | | | |
Class C Shares | | | | | | | | | | | | | | | | | | | | |
| | | Year Ended July 31, | |
| | | 2024 | | | 2023 | | | 2022 | | | 2021 | | | 2020 | |
Per Share Operating Performance(a): | | | | | | | | | | | | | | | | | | | | |
Net Asset Value, Beginning of Year | | | $8.63 | | | | $9.21 | | | | $10.53 | | | | $10.79 | | | | $10.10 | |
Income (loss) from investment operations: | | | | | | | | | | | | | | | | | | | | |
Net investment income (loss) | | | 0.26 | | | | 0.20 | | | | 0.08 | | | | 0.07 | | | | 0.13 | |
Net realized and unrealized gain (loss) on investment and foreign currency transactions | | | 0.16 | | | | (0.56 | ) | | | (1.29 | ) | | | (0.15 | ) | | | 0.74 | |
Total from investment operations | | | 0.42 | | | | (0.36 | ) | | | (1.21 | ) | | | (0.08 | ) | | | 0.87 | |
Less Dividends and Distributions: | | | | | | | | | | | | | | | | | | | | |
Dividends from net investment income | | | (0.29 | ) | | | (0.22 | ) | | | (0.11 | ) | | | (0.11 | ) | | | (0.18 | ) |
Tax return of capital distributions | | | - | | | | (- | )(b) | | | - | | | | - | | | | - | |
Distributions from net realized gains | | | - | | | | - | | | | - | | | | (0.07 | ) | | | (- | )(b) |
Total dividends and distributions | | | (0.29 | ) | | | (0.22 | ) | | | (0.11 | ) | | | (0.18 | ) | | | (0.18 | ) |
Net asset value, end of year | | | $8.76 | | | | $8.63 | | | | $9.21 | | | | $10.53 | | | | $10.79 | |
Total Return(c): | | | 5.01 | % | | | (3.87 | )% | | | (11.52 | )% | | | (0.71 | )% | | | 8.68 | % |
| | | | | | |
| | | | | | | | | | | | | | | | | | | | | |
| | | | | | |
Ratios/Supplemental Data: | | | | | | | | | | | | | | | | | | | | |
Net assets, end of year (000) | | | $5,724 | | | | $5,920 | | | | $5,692 | | | | $7,664 | | | | $8,596 | |
Average net assets (000) | | | $5,899 | | | | $5,784 | | | | $6,519 | | | | $8,268 | | | | $6,244 | |
Ratios to average net assets(d): | | | | | | | | | | | | | | | | | | | | |
Expenses after waivers and/or expense reimbursement | | | 1.45 | % | | | 1.45 | % | | | 1.45 | % | | | 1.45 | % | | | 1.45 | % |
Expenses before waivers and/or expense reimbursement | | | 1.71 | % | | | 1.74 | % | | | 1.64 | % | | | 1.60 | % | | | 1.78 | % |
Net investment income (loss) | | | 3.10 | % | | | 2.28 | % | | | 0.84 | % | | | 0.64 | % | | | 1.25 | % |
Portfolio turnover rate(e)(f) | | | 125 | % | | | 207 | % | | | 141 | % | | | 117 | % | | | 90 | % |
| (a) | Calculated based on average shares outstanding during the year. |
| (b) | Amount rounds to zero. |
| (c) | Total return does not consider the effects of sales loads. Total return is calculated assuming a purchase of a share on the first day and a sale on the last day of each year reported and includes reinvestment of dividends and distributions, if any. Total returns may reflect adjustments to conform to GAAP. |
| (d) | Does not include expenses of the investment companies in which the Fund invests. |
| (e) | The Fund accounts for mortgage dollar roll transactions, when applicable, as purchases and sales which, as a result, can increase its portfolio turnover rate. |
| (f) | The Fund’s portfolio turnover rate is calculated in accordance with regulatory requirements, without regard to transactions involving short-term investments, certain derivatives and in-kind transactions (if any). If such transactions were included, the Fund’s portfolio turnover rate may be higher. |
See Notes to Financial Statements.
68
PGIM Core Bond Fund
Financial Highlights (continued)
| | | | | | | | | | | | | | | | | | | | |
| | | | | | |
Class R Shares | | | | | | | | | | | | | | | | | | | | |
| | | Year Ended July 31, | |
| | | 2024 | | | 2023 | | | 2022 | | | 2021 | | | 2020 | |
Per Share Operating Performance(a): | | | | | | | | | | | | | | | | | | | | |
Net Asset Value, Beginning of Year | | | $8.62 | | | | $9.20 | | | | $10.52 | | | | $10.78 | | | | $10.09 | |
Income (loss) from investment operations: | | | | | | | | | | | | | | | | | | | | |
Net investment income (loss) | | | 0.31 | | | | 0.24 | | | | 0.13 | | | | 0.12 | | | | 0.19 | |
| Net realized and unrealized gain (loss) on investment and foreign currency transactions | | | 0.15 | | | | (0.56 | ) | | | (1.29 | ) | | | (0.14 | ) | | | 0.73 | |
Total from investment operations | | | 0.46 | | | | (0.32 | ) | | | (1.16 | ) | | | (0.02 | ) | | | 0.92 | |
Less Dividends and Distributions: | | | | | | | | | | | | | | | | | | | | |
Dividends from net investment income | | | (0.33 | ) | | | (0.26 | ) | | | (0.16 | ) | | | (0.17 | ) | | | (0.23 | ) |
Tax return of capital distributions | | | - | | | | (- | )(b) | | | - | | | | - | | | | - | |
Distributions from net realized gains | | | - | | | | - | | | | - | | | | (0.07 | ) | | | (- | )(b) |
Total dividends and distributions | | | (0.33 | ) | | | (0.26 | ) | | | (0.16 | ) | | | (0.24 | ) | | | (0.23 | ) |
Net asset value, end of year | | | $8.75 | | | | $8.62 | | | | $9.20 | | | | $10.52 | | | | $10.78 | |
Total Return(c): | | | 5.53 | % | | | (3.39 | )% | | | (11.10 | )% | | | (0.22 | )% | | | 9.23 | % |
| | | | | | | | | | | | | | | | | | | | | |
| | | | | | |
Ratios/Supplemental Data: | | | | | | | | | | | | | | | | | | | | |
Net assets, end of year (000) | | | $21 | | | | $18 | | | | $18 | | | | $21 | | | | $18 | |
Average net assets (000) | | | $19 | | | | $17 | | | | $19 | | | | $18 | | | | $17 | |
Ratios to average net assets(d): | | | | | | | | | | | | | | | | | | | | |
Expenses after waivers and/or expense reimbursement | | | 0.95 | % | | | 0.95 | % | | | 0.95 | % | | | 0.95 | % | | | 0.95 | % |
Expenses before waivers and/or expense reimbursement | | | 39.64 | % | | | 39.10 | % | | | 38.21 | % | | | 55.36 | % | | | 102.99 | % |
Net investment income (loss) | | | 3.60 | % | | | 2.77 | % | | | 1.34 | % | | | 1.13 | % | | | 1.80 | % |
Portfolio turnover rate(e)(f) | | | 125 | % | | | 207 | % | | | 141 | % | | | 117 | % | | | 90 | % |
| (a) | Calculated based on average shares outstanding during the year. |
| (b) | Amount rounds to zero. |
| (c) | Total return is calculated assuming a purchase of a share on the first day and a sale on the last day of each year reported and includes reinvestment of dividends and distributions, if any. Total returns may reflect adjustments to conform to GAAP. |
| (d) | Does not include expenses of the investment companies in which the Fund invests. |
| (e) | The Fund accounts for mortgage dollar roll transactions, when applicable, as purchases and sales which, as a result, can increase its portfolio turnover rate. |
| (f) | The Fund’s portfolio turnover rate is calculated in accordance with regulatory requirements, without regard to transactions involving short-term investments, certain derivatives and in-kind transactions (if any). If such transactions were included, the Fund’s portfolio turnover rate may be higher. |
See Notes to Financial Statements.
PGIM Core Bond Fund 69
PGIM Core Bond Fund
Financial Highlights (continued)
| | | | | | | | | | | | | | | | | | | | |
| | | | | | |
Class Z Shares | | | | | | | | | | | | | | | | | | | | |
| | | Year Ended July 31, | |
| | | 2024 | | | 2023 | | | 2022 | | | 2021 | | | 2020 | |
Per Share Operating Performance(a): | | | | | | | | | | | | | | | | | | | | |
Net Asset Value, Beginning of Year | | | $8.62 | | | | $9.21 | | | | $10.53 | | | | $10.78 | | | | $10.09 | |
Income (loss) from investment operations: | | | | | | | | | | | | | | | | | | | | |
Net investment income (loss) | | | 0.36 | | | | 0.30 | | | | 0.20 | | | | 0.19 | | | | 0.25 | |
| Net realized and unrealized gain (loss) on investment and foreign currency transactions | | | 0.17 | | | | (0.57 | ) | | | (1.30 | ) | | | (0.14 | ) | | | 0.73 | |
Total from investment operations | | | 0.53 | | | | (0.27 | ) | | | (1.10 | ) | | | 0.05 | | | | 0.98 | |
Less Dividends and Distributions: | | | | | | | | | | | | | | | | | | | | |
Dividends from net investment income | | | (0.39 | ) | | | (0.32 | ) | | | (0.22 | ) | | | (0.23 | ) | | | (0.29 | ) |
Tax return of capital distributions | | | - | | | | (- | )(b) | | | - | | | | - | | | | - | |
Distributions from net realized gains | | | - | | | | - | | | | - | | | | (0.07 | ) | | | (- | )(b) |
Total dividends and distributions | | | (0.39 | ) | | | (0.32 | ) | | | (0.22 | ) | | | (0.30 | ) | | | (0.29 | ) |
Net asset value, end of year | | | $8.76 | | | | $8.62 | | | | $9.21 | | | | $10.53 | | | | $10.78 | |
Total Return(c): | | | 6.18 | % | | | (2.78 | )% | | | (10.53 | )% | | | 0.41 | % | | | 9.98 | % |
| | | | | | | | | | | | | | | | | | | | | |
| | | | | | |
Ratios/Supplemental Data: | | | | | | | | | | | | | | | | | | | | |
Net assets, end of year (000) | | $ | 399,522 | | | $ | 363,763 | | | $ | 291,666 | | | $ | 276,537 | | | $ | 282,256 | |
Average net assets (000) | | $ | 392,772 | | | $ | 311,324 | | | $ | 279,332 | | | $ | 285,073 | | | $ | 220,426 | |
Ratios to average net assets(d): | | | | | | | | | | | | | | | | | | | | |
Expenses after waivers and/or expense reimbursement | | | 0.33 | % | | | 0.33 | % | | | 0.33 | % | | | 0.33 | % | | | 0.35 | % |
Expenses before waivers and/or expense reimbursement | | | 0.45 | % | | | 0.47 | % | | | 0.47 | % | | | 0.46 | % | | | 0.49 | % |
Net investment income (loss) | | | 4.22 | % | | | 3.40 | % | | | 1.99 | % | | | 1.76 | % | | | 2.38 | % |
Portfolio turnover rate(e)(f) | | | 125 | % | | | 207 | % | | | 141 | % | | | 117 | % | | | 90 | % |
| (a) | Calculated based on average shares outstanding during the year. |
| (b) | Amount rounds to zero. |
| (c) | Total return is calculated assuming a purchase of a share on the first day and a sale on the last day of each year reported and includes reinvestment of dividends and distributions, if any. Total returns may reflect adjustments to conform to GAAP. |
| (d) | Does not include expenses of the investment companies in which the Fund invests. |
| (e) | The Fund accounts for mortgage dollar roll transactions, when applicable, as purchases and sales which, as a result, can increase its portfolio turnover rate. |
| (f) | The Fund’s portfolio turnover rate is calculated in accordance with regulatory requirements, without regard to transactions involving short-term investments, certain derivatives and in-kind transactions (if any). If such transactions were included, the Fund’s portfolio turnover rate may be higher. |
See Notes to Financial Statements.
70
PGIM Core Bond Fund
Financial Highlights (continued)
| | | | | | | | | | | | | | | | | | | | |
| | | | | | |
Class R6 Shares | | | | | | | | | | | | | | | | | | | | |
| | | Year Ended July 31, | |
| | | 2024 | | | 2023 | | | 2022 | | | 2021 | | | 2020 | |
Per Share Operating Performance(a): | | | | | | | | | | | | | | | | | | | | |
Net Asset Value, Beginning of Year | | | $8.62 | | | | $9.21 | | | | $10.53 | | | | $10.79 | | | | $10.10 | |
Income (loss) from investment operations: | | | | | | | | | | | | | | | | | | | | |
Net investment income (loss) | | | 0.36 | | | | 0.30 | | | | 0.20 | | | | 0.19 | | | | 0.25 | |
| Net realized and unrealized gain (loss) on investment and foreign currency transactions | | | 0.17 | | | | (0.57 | ) | | | (1.30 | ) | | | (0.15 | ) | | | 0.73 | |
Total from investment operations | | | 0.53 | | | | (0.27 | ) | | | (1.10 | ) | | | 0.04 | | | | 0.98 | |
Less Dividends and Distributions: | | | | | | | | | | | | | | | | | | | | |
Dividends from net investment income | | | (0.39 | ) | | | (0.32 | ) | | | (0.22 | ) | | | (0.23 | ) | | | (0.29 | ) |
Tax return of capital distributions | | | - | | | | (- | )(b) | | | - | | | | - | | | | - | |
Distributions from net realized gains | | | - | | | | - | | | | - | | | | (0.07 | ) | | | (- | )(b) |
Total dividends and distributions | | | (0.39 | ) | | | (0.32 | ) | | | (0.22 | ) | | | (0.30 | ) | | | (0.29 | ) |
Net asset value, end of year | | | $8.76 | | | | $8.62 | | | | $9.21 | | | | $10.53 | | | | $10.79 | |
Total Return(c): | | | 6.20 | % | | | (2.77 | )% | | | (10.52 | )% | | | 0.42 | % | | | 10.00 | % |
| | | | | | | | | | | | | | | | | | | | | |
| | | | | | |
Ratios/Supplemental Data: | | | | | | | | | | | | | | | | | | | | |
Net assets, end of year (000) | | $ | 1,390,798 | | | $ | 1,063,282 | | | $ | 1,024,671 | | | $ | 944,968 | | | $ | 716,750 | |
Average net assets (000) | | $ | 1,141,091 | | | $ | 1,000,004 | | | $ | 1,045,549 | | | $ | 836,649 | | | $ | 595,755 | |
Ratios to average net assets(d): | | | | | | | | | | | | | | | | | | | | |
Expenses after waivers and/or expense reimbursement | | | 0.32 | % | | | 0.32 | % | | | 0.32 | % | | | 0.32 | % | | | 0.33 | % |
Expenses before waivers and/or expense reimbursement | | | 0.36 | % | | | 0.35 | % | | | 0.35 | % | | | 0.36 | % | | | 0.38 | % |
Net investment income (loss) | | | 4.23 | % | | | 3.40 | % | | | 1.98 | % | | | 1.76 | % | | | 2.39 | % |
Portfolio turnover rate(e)(f) | | | 125 | % | | | 207 | % | | | 141 | % | | | 117 | % | | | 90 | % |
| (a) | Calculated based on average shares outstanding during the year. |
| (b) | Amount rounds to zero. |
| (c) | Total return is calculated assuming a purchase of a share on the first day and a sale on the last day of each year reported and includes reinvestment of dividends and distributions, if any. Total returns may reflect adjustments to conform to GAAP. |
| (d) | Does not include expenses of the investment companies in which the Fund invests. |
| (e) | The Fund accounts for mortgage dollar roll transactions, when applicable, as purchases and sales which, as a result, can increase its portfolio turnover rate. |
| (f) | The Fund’s portfolio turnover rate is calculated in accordance with regulatory requirements, without regard to transactions involving short-term investments, certain derivatives and in-kind transactions (if any). If such transactions were included, the Fund’s portfolio turnover rate may be higher. |
See Notes to Financial Statements.
PGIM Core Bond Fund 71
PGIM Corporate Bond Fund
Schedule of Investments
as of July 31, 2024
| | | | | | | | | | | | | | | | |
| Description | | Interest Rate | | | Maturity Date | | | Principal Amount (000)# | | | Value | |
| | | | |
LONG-TERM INVESTMENTS 97.6% | | | | | | | | | | | | | | | | |
| | | | |
COMMERCIAL MORTGAGE-BACKED SECURITIES 7.5% | | | | | | | | | | | | | | | | |
BANK, | | | | | | | | | | | | | | | | |
Series 2019-BN16, Class A3 | | | 3.741% | | | | 02/15/52 | | | | 200 | | | $ | 191,268 | |
Benchmark Mortgage Trust, | | | | | | | | | | | | | | | | |
Series 2019-B09, Class A4 | | | 3.751 | | | | 03/15/52 | | | | 200 | | | | 189,464 | |
CCUBS Commercial Mortgage Trust, | | | | | | | | | | | | | | | | |
Series 2017-C01, Class A3 | | | 3.283(cc) | | | | 11/15/50 | | | | 250 | | | | 238,616 | |
CFCRE Commercial Mortgage Trust, | | | | | | | | | | | | | | | | |
Series 2016-C07, Class A2 | | | 3.585 | | | | 12/10/54 | | | | 264 | | | | 252,640 | |
Citigroup Commercial Mortgage Trust, | | | | | | | | | | | | | | | | |
Series 2016-GC37, Class A3 | | | 3.050 | | | | 04/10/49 | | | | 137 | | | | 133,290 | |
Deutsche Bank Commercial Mortgage Trust, | | | | | | | | | | | | | | | | |
Series 2017-C06, Class A3 | | | 3.269 | | | | 06/10/50 | | | | 60 | | | | 59,723 | |
JPMCC Commercial Mortgage Securities Trust, | | | | | | | | | | | | | | | | |
Series 2017-JP06, Class A4 | | | 3.224 | | | | 07/15/50 | | | | 100 | | | | 94,909 | |
Morgan Stanley Bank of America Merrill Lynch Trust, | | | | | | | | | | | | | | | | |
Series 2016-C29, Class A3 | | | 3.058 | | | | 05/15/49 | | | | 179 | | | | 173,756 | |
Series 2016-C31, Class A4 | | | 2.840 | | | | 11/15/49 | | | | 273 | | | | 260,713 | |
Wells Fargo Commercial Mortgage Trust, | | | | | | | | | | | | | | | | |
Series 2017-C40, Class A3 | | | 3.317 | | | | 10/15/50 | | | | 200 | | | | 191,229 | |
| | | | | | | | | | | | | | | | |
| | | | |
TOTAL COMMERCIAL MORTGAGE-BACKED SECURITIES
(cost $1,863,033) | | | | | | | | | | | | | | | 1,785,608 | |
| | | | | | | | | | | | | | | | |
| | | | |
CORPORATE BONDS 89.7% | | | | | | | | | | | | | | | | |
| | | | |
Aerospace & Defense 0.9% | | | | | | | | | | | | | | | | |
| | | | |
Boeing Co. (The), | | | | | | | | | | | | | | | | |
Sr. Unsec’d. Notes | | | 3.200 | | | | 03/01/29 | | | | 30 | | | | 27,226 | |
Sr. Unsec’d. Notes | | | 5.930 | | | | 05/01/60 | | | | 145 | | | | 133,459 | |
HEICO Corp., | | | | | | | | | | | | | | | | |
Gtd. Notes | | | 5.350 | | | | 08/01/33 | | | | 50 | | | | 50,630 | |
| | | | | | | | | | | | | | | | |
| | | | |
| | | | | | | | | | | | | | | 211,315 | |
| | | | |
Agriculture 2.6% | | | | | | | | | | | | | | | | |
| | | | |
BAT Capital Corp. (United Kingdom), | | | | | | | | | | | | | | | | |
Gtd. Notes | | | 2.259 | | | | 03/25/28 | | | | 100 | | | | 91,042 | |
Gtd. Notes | | | 4.700 | | | | 04/02/27 | | | | 200 | | | | 199,096 | |
Imperial Brands Finance PLC (United Kingdom), | | | | | | | | | | | | | | | | |
Gtd. Notes, 144A, MTN | | | 5.500 | | | | 02/01/30 | | | | 200 | | | | 201,464 | |
See Notes to Financial Statements.
72
PGIM Corporate Bond Fund
Schedule of Investments (continued)
as of July 31, 2024
| | | | | | | | | | | | | | | | |
| Description | | Interest Rate | | | Maturity Date | | | Principal Amount (000)# | | | Value | |
| | | | |
CORPORATE BONDS (Continued) | | | | | | | | | | | | | | | | |
| | | | |
Agriculture (cont’d.) | | | | | | | | | | | | | | | | |
| | | | |
Philip Morris International, Inc., | | | | | | | | | | | | | | | | |
Sr. Unsec’d. Notes | | | 5.125% | | | | 02/13/31 | | | | 30 | | | $ | 30,419 | |
Sr. Unsec’d. Notes | | | 5.375 | | | | 02/15/33 | | | | 100 | | | | 101,958 | |
| | | | | | | | | | | | | | | | |
| | | | |
| | | | | | | | | | | | | | | 623,979 | |
| | | | |
Airlines 0.6% | | | | | | | | | | | | | | | | |
| | | | |
Southwest Airlines Co., | | | | | | | | | | | | | | | | |
Sr. Unsec’d. Notes | | | 5.125 | | | | 06/15/27 | | | | 80 | | | | 80,378 | |
United Airlines, Inc., | | | | | | | | | | | | | | | | |
Sr. Sec’d. Notes, 144A | | | 4.375 | | | | 04/15/26 | | | | 40 | | | | 38,993 | |
Sr. Sec’d. Notes, 144A | | | 4.625 | | | | 04/15/29 | | | | 25 | | | | 23,636 | |
| | | | | | | | | | | | | | | | |
| | | | |
| | | | | | | | | | | | | | | 143,007 | |
| | | | |
Auto Manufacturers 2.3% | | | | | | | | | | | | | | | | |
| | | | |
Ford Motor Credit Co. LLC, | | | | | | | | | | | | | | | | |
Sr. Unsec’d. Notes | | | 4.950 | | | | 05/28/27 | | | | 200 | | | | 197,433 | |
General Motors Co., | | | | | | | | | | | | | | | | |
Sr. Unsec’d. Notes | | | 5.400 | | | | 04/01/48 | | | | 40 | | | | 36,379 | |
Sr. Unsec’d. Notes | | | 6.125 | | | | 10/01/25 | | | | 50 | | | | 50,502 | |
General Motors Financial Co., Inc., | | | | | | | | | | | | | | | | |
Sr. Unsec’d. Notes | | | 5.350 | | | | 07/15/27 | | | | 30 | | | | 30,312 | |
Sr. Unsec’d. Notes | | | 5.400 | | | | 05/08/27 | | | | 60 | | | | 60,654 | |
Stellantis Finance US, Inc., | | | | | | | | | | | | | | | | |
Gtd. Notes, 144A | | | 2.691 | | | | 09/15/31 | | | | 205 | | | | 171,690 | |
| | | | | | | | | | | | | | | | |
| | | | |
| | | | | | | | | | | | | | | 546,970 | |
| | | | |
Banks 23.4% | | | | | | | | | | | | | | | | |
| | | | |
Banco Santander SA (Spain), | | | | | | | | | | | | | | | | |
Sr. Non-Preferred Notes | | | 3.800 | | | | 02/23/28 | | | | 200 | | | | 191,519 | |
Bank of America Corp., | | | | | | | | | | | | | | | | |
Sr. Unsec’d. Notes | | | 2.572(ff) | | | | 10/20/32 | | | | 320 | | | | 272,132 | |
Sr. Unsec’d. Notes, MTN | | | 1.898(ff) | | | | 07/23/31 | | | | 305 | | | | 256,938 | |
Sr. Unsec’d. Notes, MTN | | | 2.087(ff) | | | | 06/14/29 | | | | 75 | | | | 67,734 | |
Sr. Unsec’d. Notes, MTN | | | 4.271(ff) | | | | 07/23/29 | | | | 240 | | | | 234,963 | |
BNP Paribas SA (France), | | | | | | | | | | | | | | | | |
Sr. Non-Preferred Notes, 144A | | | 2.159(ff) | | | | 09/15/29 | | | | 200 | | | | 178,057 | |
See Notes to Financial Statements.
PGIM Corporate Bond Fund 73
PGIM Corporate Bond Fund
Schedule of Investments (continued)
as of July 31, 2024
| | | | | | | | | | | | | | | | |
| Description | | Interest Rate | | | Maturity Date | | | Principal Amount (000)# | | | Value | |
| | | | |
CORPORATE BONDS (Continued) | | | | | | | | | | | | | | | | |
| | | | |
Banks (cont’d.) | | | | | | | | | | | | | | | | |
| | | | |
BPCE SA (France), | | | | | | | | | | | | | | | | |
Sr. Non-Preferred Notes, 144A | | | 2.375% | | | | 01/14/25 | | | | 250 | | | $ | 246,339 | |
Citigroup, Inc., | | | | | | | | | | | | | | | | |
Jr. Sub. Notes, Series V | | | 4.700(ff) | | | | 01/30/25(oo) | | | | 25 | | | | 24,644 | |
Sr. Unsec’d. Notes | | | 2.561(ff) | | | | 05/01/32 | | | | 155 | | | | 132,171 | |
Sr. Unsec’d. Notes | | | 4.412(ff) | | | | 03/31/31 | | | | 300 | | | | 291,308 | |
Sub. Notes | | | 4.450 | | | | 09/29/27 | | | | 100 | | | | 98,648 | |
Comerica, Inc., | | | | | | | | | | | | | | | | |
Sr. Unsec’d. Notes | | | 5.982(ff) | | | | 01/30/30 | | | | 57 | | | | 57,104 | |
Goldman Sachs Group, Inc. (The), | | | | | | | | | | | | | | | | |
Sr. Unsec’d. Notes | | | 1.992(ff) | | | | 01/27/32 | | | | 65 | | | | 53,914 | |
Sr. Unsec’d. Notes | | | 3.210(ff) | | | | 04/22/42 | | | | 195 | | | | 147,941 | |
Sr. Unsec’d. Notes | | | 3.814(ff) | | | | 04/23/29 | | | | 20 | | | | 19,240 | |
Huntington Bancshares, Inc., | | | | | | | | | | | | | | | | |
Sr. Unsec’d. Notes | | | 5.709(ff) | | | | 02/02/35 | | | | 40 | | | | 40,420 | |
Sr. Unsec’d. Notes | | | 6.208(ff) | | | | 08/21/29 | | | | 109 | | | | 113,267 | |
JPMorgan Chase & Co., | | | | | | | | | | | | | | | | |
Sr. Unsec’d. Notes | | | 1.953(ff) | | | | 02/04/32 | | | | 300 | | | | 250,269 | |
Sr. Unsec’d. Notes | | | 2.522(ff) | | | | 04/22/31 | | | | 150 | | | | 132,600 | |
Sr. Unsec’d. Notes | | | 2.545(ff) | | | | 11/08/32 | | | | 90 | | | | 76,741 | |
Sr. Unsec’d. Notes | | | 3.882(ff) | | | | 07/24/38 | | | | 35 | | | | 30,782 | |
Sr. Unsec’d. Notes | | | 4.452(ff) | | | | 12/05/29 | | | | 350 | | | | 344,954 | |
Sr. Unsec’d. Notes | | | 5.336(ff) | | | | 01/23/35 | | | | 25 | | | | 25,415 | |
Morgan Stanley, | | | | | | | | | | | | | | | | |
Sr. Unsec’d. Notes, GMTN | | | 2.239(ff) | | | | 07/21/32 | | | | 515 | | | | 430,124 | |
Sr. Unsec’d. Notes, GMTN | | | 4.431(ff) | | | | 01/23/30 | | | | 225 | | | | 220,940 | |
Sr. Unsec’d. Notes, MTN | | | 5.831(ff) | | | | 04/19/35 | | | | 65 | | | | 67,943 | |
PNC Financial Services Group, Inc. (The), | | | | | | | | | | | | | | | | |
Sr. Unsec’d. Notes | | | 6.875(ff) | | | | 10/20/34 | | | | 25 | | | | 27,833 | |
Societe Generale SA (France), | | | | | | | | | | | | | | | | |
Gtd. Notes, 144A | | | 2.797(ff) | | | | 01/19/28 | | | | 255 | | | | 239,299 | |
Sr. Non-Preferred Notes, 144A | | | 1.488(ff) | | | | 12/14/26 | | | | 200 | | | | 189,355 | |
Sr. Non-Preferred Notes, 144A, MTN | | | 2.625 | | | | 01/22/25 | | | | 200 | | | | 197,161 | |
Truist Financial Corp., | | | | | | | | | | | | | | | | |
Sr. Unsec’d. Notes, MTN | | | 5.711(ff) | | | | 01/24/35 | | | | 25 | | | | 25,547 | |
Sr. Unsec’d. Notes, MTN | | | 7.161(ff) | | | | 10/30/29 | | | | 30 | | | | 32,312 | |
UBS Group AG (Switzerland), | | | | | | | | | | | | | | | | |
Sr. Unsec’d. Notes, 144A | | | 1.305(ff) | | | | 02/02/27 | | | | 250 | | | | 235,312 | |
Wells Fargo & Co., | | | | | | | | | | | | | | | | |
Sr. Unsec’d. Notes | | | 6.491(ff) | | | | 10/23/34 | | | | 35 | | | | 38,121 | |
See Notes to Financial Statements.
74
PGIM Corporate Bond Fund
Schedule of Investments (continued)
as of July 31, 2024
| | | | | | | | | | | | | | | | |
| Description | | Interest Rate | | | Maturity Date | | | Principal Amount (000)# | | | Value | |
| | | | |
CORPORATE BONDS (Continued) | | | | | | | | | | | | | | | | |
| | | | |
Banks (cont’d.) | | | | | | | | | | | | | | | | |
| | | | |
Wells Fargo & Co., (cont’d.) | | | | | | | | | | | | | | | | |
Sr. Unsec’d. Notes, MTN | | | 2.393%(ff) | | | | 06/02/28 | | | | 240 | | | $ | 223,929 | |
Sr. Unsec’d. Notes, MTN | | | 2.572(ff) | | | | 02/11/31 | | | | 410 | | | | 362,946 | |
| | | | | | | | | | | | | | | | |
| | | | |
| | | | | | | | | | | | | | | 5,577,922 | |
| | | | |
Beverages 1.3% | | | | | | | | | | | | | | | | |
| | | | |
Anheuser-Busch Cos. LLC/Anheuser-Busch InBev Worldwide, Inc. (Belgium),
Gtd. Notes | | | 4.900 | | | | 02/01/46 | | | | 185 | | | | 174,204 | |
Bacardi Ltd. (Bermuda), | | | | | | | | | | | | | | | | |
Gtd. Notes, 144A | | | 2.750 | | | | 07/15/26 | | | | 100 | | | | 95,311 | |
Constellation Brands, Inc., | | | | | | | | | | | | | | | | |
Sr. Unsec’d. Notes | | | 2.875 | | | | 05/01/30 | | | | 30 | | | | 27,066 | |
| | | | | | | | | | | | | | | | |
| | | | |
| | | | | | | | | | | | | | | 296,581 | |
| | | | |
Biotechnology 0.4% | | | | | | | | | | | | | | | | |
| | | | |
Amgen, Inc., | | | | | | | | | | | | | | | | |
Sr. Unsec’d. Notes | | | 5.600 | | | | 03/02/43 | | | | 70 | | | | 70,549 | |
Sr. Unsec’d. Notes | | | 5.750 | | | | 03/02/63 | | | | 30 | | | | 30,152 | |
| | | | | | | | | | | | | | | | |
| | | | |
| | | | | | | | | | | | | | | 100,701 | |
| | | | |
Chemicals 1.2% | | | | | | | | | | | | | | | | |
| | | | |
Dow Chemical Co. (The), | | | | | | | | | | | | | | | | |
Sr. Unsec’d. Notes | | | 5.250 | | | | 11/15/41 | | | | 30 | | | | 28,550 | |
DuPont de Nemours, Inc., | | | | | | | | | | | | | | | | |
Sr. Unsec’d. Notes | | | 5.419 | | | | 11/15/48 | | | | 5 | | | | 5,278 | |
FMC Corp., | | | | | | | | | | | | | | | | |
Sr. Unsec’d. Notes | | | 5.650 | | | | 05/18/33 | | | | 100 | | | | 100,982 | |
Huntsman International LLC, | | | | | | | | | | | | | | | | |
Sr. Unsec’d. Notes | | | 2.950 | | | | 06/15/31 | | | | 75 | | | | 62,943 | |
LYB International Finance III LLC, | | | | | | | | | | | | | | | | |
Gtd. Notes | | | 3.375 | | | | 10/01/40 | | | | 50 | | | | 37,724 | |
Yara International ASA (Brazil), | | | | | | | | | | | | | | | | |
Sr. Unsec’d. Notes, 144A | | | 3.148 | | | | 06/04/30 | | | | 20 | | | | 17,710 | |
Sr. Unsec’d. Notes, 144A | | | 4.750 | | | | 06/01/28 | | | | 40 | | | | 39,213 | |
| | | | | | | | | | | | | | | | |
| | | | |
| | | | | | | | | | | | | | | 292,400 | |
See Notes to Financial Statements.
PGIM Corporate Bond Fund 75
PGIM Corporate Bond Fund
Schedule of Investments (continued)
as of July 31, 2024
| | | | | | | | | | | | | | | | |
| Description | | Interest Rate | | | Maturity Date | | | Principal Amount (000)# | | | Value | |
| | | | |
CORPORATE BONDS (Continued) | | | | | | | | | | | | | | | | |
| | | | |
Commercial Services 1.6% | | | | | | | | | | | | | | | | |
| | | | |
California Institute of Technology, | | | | | | | | | | | | | | | | |
Sr. Unsec’d. Notes | | | 4.700% | | | | 11/01/2111 | | | | 50 | | | $ | 44,241 | |
ERAC USA Finance LLC, | | | | | | | | | | | | | | | | |
Gtd. Notes, 144A | | | 4.900 | | | | 05/01/33 | | | | 150 | | | | 149,460 | |
Massachusetts Institute of Technology, | | | | | | | | | | | | | | | | |
Unsec’d. Notes | | | 3.885 | | | | 07/01/2116 | | | | 100 | | | | 75,979 | |
Trustees of the University of Pennsylvania (The), | | | | | | | | | | | | | | | | |
Sr. Unsec’d. Notes | | | 3.610 | | | | 02/15/2119 | | | | 160 | | | | 112,620 | |
| | | | | | | | | | | | | | | | |
| | | | |
| | | | | | | | | | | | | | | 382,300 | |
| | | | |
Computers 0.3% | | | | | | | | | | | | | | | | |
| | | | |
Leidos, Inc., | | | | | | | | | | | | | | | | |
Gtd. Notes | | | 2.300 | | | | 02/15/31 | | | | 35 | | | | 29,625 | |
Gtd. Notes | | | 4.375 | | | | 05/15/30 | | | | 30 | | | | 28,888 | |
| | | | | | | | | | | | | | | | |
| | | | |
| | | | | | | | | | | | | | | 58,513 | |
| | | | |
Distribution/Wholesale 0.3% | | | | | | | | | | | | | | | | |
| | | | |
LKQ Corp., | | | | | | | | | | | | | | | | |
Gtd. Notes | | | 6.250 | | | | 06/15/33 | | | | 75 | | | | 77,793 | |
| | | | |
Diversified Financial Services 1.3% | | | | | | | | | | | | | | | | |
| | | | |
Cantor Fitzgerald LP, | | | | | | | | | | | | | | | | |
Sr. Unsec’d. Notes, 144A | | | 7.200 | | | | 12/12/28 | | | | 20 | | | | 21,012 | |
Jefferies Financial Group, Inc., | | | | | | | | | | | | | | | | |
Sr. Unsec’d. Notes | | | 2.625 | | | | 10/15/31 | | | | 100 | | | | 83,371 | |
LPL Holdings, Inc., | | | | | | | | | | | | | | | | |
Gtd. Notes | | | 6.750 | | | | 11/17/28 | | | | 30 | | | | 31,686 | |
Nomura Holdings, Inc. (Japan), | | | | | | | | | | | | | | | | |
Sr. Unsec’d. Notes | | | 2.172 | | | | 07/14/28 | | | | 200 | | | | 179,446 | |
| | | | | | | | | | | | | | | | |
| | | | |
| | | | | | | | | | | | | | | 315,515 | |
| | | | |
Electric 9.4% | | | | | | | | | | | | | | | | |
| | | | |
AEP Texas, Inc., | | | | | | | | | | | | | | | | |
Sr. Unsec’d. Notes | | | 3.450 | | | | 05/15/51 | | | | 65 | | | | 44,017 | |
Commonwealth Edison Co., | | | | | | | | | | | | | | | | |
First Mortgage | | | 4.700 | | | | 01/15/44 | | | | 100 | | | | 90,531 | |
See Notes to Financial Statements.
76
PGIM Corporate Bond Fund
Schedule of Investments (continued)
as of July 31, 2024
| | | | | | | | | | | | | | | | |
| Description | | Interest Rate | | | Maturity Date | | | Principal Amount (000)# | | | Value | |
| | | | |
CORPORATE BONDS (Continued) | | | | | | | | | | | | | | | | |
| | | | |
Electric (cont’d.) | | | | | | | | | | | | | | | | |
| | | | |
Dominion Energy South Carolina, Inc., | | | | | | | | | | | | | | | | |
First Mortgage | | | 4.600% | | | | 06/15/43 | | | | 150 | | | $ | 134,569 | |
Duke Energy Carolinas LLC, | | | | | | | | | | | | | | | | |
First Mortgage | | | 3.450 | | | | 04/15/51 | | | | 50 | | | | 36,123 | |
FirstEnergy Transmission LLC, | | | | | | | | | | | | | | | | |
Sr. Unsec’d. Notes, 144A | | | 5.450 | | | | 07/15/44 | | | | 100 | | | | 95,668 | |
Florida Power & Light Co., | | | | | | | | | | | | | | | | |
First Mortgage | | | 5.600 | | | | 06/15/54 | | | | 55 | | | | 57,334 | |
Liberty Utilities Finance GP 1, | | | | | | | | | | | | | | | | |
Gtd. Notes, 144A | | | 2.050 | | | | 09/15/30 | | | | 230 | | | | 192,962 | |
MidAmerican Energy Co., | | | | | | | | | | | | | | | | |
First Mortgage | | | 3.950 | | | | 08/01/47 | | | | 20 | | | | 16,054 | |
Mississippi Power Co., | | | | | | | | | | | | | | | | |
Sr. Unsec’d. Notes, Series 12-A | | | 4.250 | | | | 03/15/42 | | | | 140 | | | | 117,382 | |
NextEra Energy Capital Holdings, Inc., | | | | | | | | | | | | | | | | |
Gtd. Notes | | | 2.250 | | | | 06/01/30 | | | | 22 | | | | 19,172 | |
NRG Energy, Inc., | | | | | | | | | | | | | | | | |
Sr. Sec’d. Notes, 144A | | | 2.000 | | | | 12/02/25 | | | | 35 | | | | 33,434 | |
Pacific Gas & Electric Co., | | | | | | | | | | | | | | | | |
First Mortgage | | | 3.950 | | | | 12/01/47 | | | | 100 | | | | 73,959 | |
First Mortgage | | | 4.000 | | | | 12/01/46 | | | | 100 | | | | 74,487 | |
First Mortgage | | | 4.950 | | | | 07/01/50 | | | | 20 | | | | 17,034 | |
PacifiCorp, | | | | | | | | | | | | | | | | |
First Mortgage | | | 4.125 | | | | 01/15/49 | | | | 100 | | | | 78,654 | |
PPL Electric Utilities Corp., | | | | | | | | | | | | | | | | |
First Mortgage | | | 4.750 | | | | 07/15/43 | | | | 100 | | | | 92,106 | |
Progress Energy, Inc., | | | | | | | | | | | | | | | | |
Sr. Unsec’d. Notes | | | 7.000 | | | | 10/30/31 | | | | 190 | | | | 211,917 | |
Public Service Co. of Colorado, | | | | | | | | | | | | | | | | |
First Mortgage | | | 5.750 | | | | 05/15/54 | | | | 40 | | | | 40,819 | |
Public Service Electric & Gas Co., | | | | | | | | | | | | | | | | |
Sr. Sec’d. Notes, MTN | | | 3.650 | | | | 09/01/42 | | | | 75 | | | | 60,397 | |
Puget Energy, Inc., | | | | | | | | | | | | | | | | |
Sr. Sec’d. Notes | | | 3.650 | | | | 05/15/25 | | | | 400 | | | | 393,838 | |
Puget Sound Energy, Inc., | | | | | | | | | | | | | | | | |
First Mortgage | | | 2.893 | | | | 09/15/51 | | | | 20 | | | | 12,769 | |
San Diego Gas & Electric Co., | | | | | | | | | | | | | | | | |
First Mortgage | | | 4.300 | | | | 04/01/42 | | | | 75 | | | | 65,059 | |
Southern California Edison Co., | | | | | | | | | | | | | | | | |
First Ref. Mortgage | | | 5.500 | | | | 03/15/40 | | | | 200 | | | | 200,488 | |
See Notes to Financial Statements.
PGIM Corporate Bond Fund 77
PGIM Corporate Bond Fund
Schedule of Investments (continued)
as of July 31, 2024
| | | | | | | | | | | | | | | | |
| Description | | Interest Rate | | | Maturity Date | | | Principal Amount (000)# | | | Value | |
| | | | |
CORPORATE BONDS (Continued) | | | | | | | | | | | | | | | | |
| | | | |
Electric (cont’d.) | | | | | | | | | | | | | | | | |
| | | | |
Virginia Electric & Power Co., | | | | | | | | | | | | | | | | |
Sr. Unsec’d. Notes | | | 3.300% | | | | 12/01/49 | | | | 65 | | | $ | 45,077 | |
Vistra Operations Co. LLC, | | | | | | | | | | | | | | | | |
Sr. Sec’d. Notes, 144A | | | 3.700 | | | | 01/30/27 | | | | 45 | | | | 43,477 | |
| | | | | | | | | | | | | | | | |
| | | | |
| | | | | | | | | | | | | | | 2,247,327 | |
| | | | |
Electronics 0.4% | | | | | | | | | | | | | | | | |
| | | | |
Honeywell International, Inc., | | | | | | | | | | | | | | | | |
Sr. Unsec’d. Notes | | | 5.250 | | | | 03/01/54 | | | | 50 | | | | 49,610 | |
Sr. Unsec’d. Notes | | | 5.350 | | | | 03/01/64 | | | | 50 | | | | 49,805 | |
| | | | | | | | | | | | | | | | |
| | | | |
| | | | | | | | | | | | | | | 99,415 | |
| | | | |
Engineering & Construction 0.7% | | | | | | | | | | | | | | | | |
| | | | |
Mexico City Airport Trust (Mexico), | | | | | | | | | | | | | | | | |
Sr. Sec’d. Notes, 144A | | | 5.500 | | | | 07/31/47 | | | | 200 | | | | 168,250 | |
| | | | |
Entertainment 0.6% | | | | | | | | | | | | | | | | |
| | | | |
Warnermedia Holdings, Inc., | | | | | | | | | | | | | | | | |
Gtd. Notes | | | 5.050 | | | | 03/15/42 | | | | 45 | | | | 35,498 | |
Gtd. Notes | | | 5.141 | | | | 03/15/52 | | | | 130 | | | | 96,681 | |
| | | | | | | | | | | | | | | | |
| | | | |
| | | | | | | | | | | | | | | 132,179 | |
| | | | |
Foods 1.2% | | | | | | | | | | | | | | | | |
| | | | |
JBS USA Holding Lux Sarl/JBS USA Food Co./JBS Lux Co. Sarl, | | | | | | | | | | | | | | | | |
Gtd. Notes | | | 3.000 | | | | 02/02/29 | | | | 35 | | | | 31,758 | |
Gtd. Notes | | | 3.000 | | | | 05/15/32 | | | | 55 | | | | 46,005 | |
Smithfield Foods, Inc., | | | | | | | | | | | | | | | | |
Sr. Unsec’d. Notes, 144A | | | 2.625 | | | | 09/13/31 | | | | 205 | | | | 167,497 | |
Tyson Foods, Inc., | | | | | | | | | | | | | | | | |
Sr. Unsec’d. Notes | | | 5.700 | | | | 03/15/34 | | | | 35 | | | | 35,818 | |
| | | | | | | | | | | | | | | | |
| | | | |
| | | | | | | | | | | | | | | 281,078 | |
See Notes to Financial Statements.
78
PGIM Corporate Bond Fund
Schedule of Investments (continued)
as of July 31, 2024
| | | | | | | | | | | | | | | | |
| Description | | Interest Rate | | | Maturity Date | | | Principal Amount (000)# | | | Value | |
| | | | |
CORPORATE BONDS (Continued) | | | | | | | | | | | | | | | | |
| | | | |
Gas 0.2% | | | | | | | | | | | | | | | | |
| | | | |
CenterPoint Energy Resources Corp., | | | | | | | | | | | | | | | | |
Sr. Unsec’d. Notes | | | | | | | | | | | | | | | | |
| | | 5.400% | | | | 07/01/34 | | | | 40 | | | $ | 40,445 | |
| | | | |
Hand/Machine Tools 0.1% | | | | | | | | | | | | | | | | |
| | | | |
Regal Rexnord Corp., | | | | | | | | | | | | | | | | |
Gtd. Notes | | | | | | | | | | | | | | | | |
| | | 6.050 | | | | 02/15/26 | | | | 30 | | | | 30,242 | |
| | | | |
Healthcare-Services 2.9% | | | | | | | | | | | | | | | | |
| | | | |
AHS Hospital Corp., | | | | | | | | | | | | | | | | |
Sr. Unsec’d. Notes, Series 2021 | | | 2.780 | | | | 07/01/51 | | | | 30 | | | | 19,642 | |
Elevance Health, Inc., | | | | | | | | | | | | | | | | |
Sr. Unsec’d. Notes | | | 4.625 | | | | 05/15/42 | | | | 100 | | | | 90,449 | |
HCA, Inc., | | | | | | | | | | | | | | | | |
Gtd. Notes | | | 3.125 | | | | 03/15/27 | | | | 40 | | | | 38,302 | |
Mayo Clinic, | | | | | | | | | | | | | | | | |
Unsec’d. Notes | | | 3.774 | | | | 11/15/43 | | | | 85 | | | | 71,092 | |
Piedmont Healthcare, Inc., | | | | | | | | | | | | | | | | |
Sec’d. Notes, Series 2042 | | | 2.719 | | | | 01/01/42 | | | | 55 | | | | 39,359 | |
Sentara Healthcare, | | | | | | | | | | | | | | | | |
Sr. Unsec’d. Notes, Series 2021 | | | 2.927 | | | | 11/01/51 | | | | 100 | | | | 67,928 | |
Texas Health Resources, | | | | | | | | | | | | | | | | |
Sec’d. Notes | | | 4.330 | | | | 11/15/55 | | | | 130 | | | | 113,154 | |
UnitedHealth Group, Inc., | | | | | | | | | | | | | | | | |
Sr. Unsec’d. Notes | | | 3.050 | | | | 05/15/41 | | | | 80 | | | | 60,465 | |
Sr. Unsec’d. Notes | | | 3.250 | | | | 05/15/51 | | | | 90 | | | | 63,397 | |
Sr. Unsec’d. Notes | | | 4.750 | | | | 05/15/52 | | | | 45 | | | | 40,680 | |
Sr. Unsec’d. Notes | | | 5.750 | | | | 07/15/64 | | | | 25 | | | | 25,680 | |
Sr. Unsec’d. Notes | | | 6.875 | | | | 02/15/38 | | | | 55 | | | | 64,441 | |
| | | | | | | | | | | | | | | | |
| | | | |
| | | | | | | | | | | | | | | 694,589 | |
| | | | |
Housewares 0.4% | | | | | | | | | | | | | | | | |
| | | | |
Newell Brands, Inc., | | | | | | | | | | | | | | | | |
Sr. Unsec’d. Notes | | | | | | | | | | | | | | | | |
| | | 4.000 | | | | 12/01/24 | | | | 100 | | | | 99,490 | |
See Notes to Financial Statements.
PGIM Corporate Bond Fund 79
PGIM Corporate Bond Fund
Schedule of Investments (continued)
as of July 31, 2024
| | | | | | | | | | | | | | | | |
| | | | |
| Description | | Interest Rate | | | Maturity Date | | | Principal Amount (000)# | | | Value | |
| | | | |
CORPORATE BONDS (Continued) | | | | | | | | | | | | | | | | |
| | | | |
Insurance 2.5% | | | | | | | | | | | | | | | | |
| | | | |
Arch Capital Finance LLC, | | | | | | | | | | | | | | | | |
Gtd. Notes | | | 5.031% | | | | 12/15/46 | | | | 50 | | | $ | 46,377 | |
Chubb INA Holdings LLC, | | | | | | | | | | | | | | | | |
Gtd. Notes | | | 3.050 | | | | 12/15/61 | | | | 55 | | | | 35,917 | |
CNA Financial Corp., | | | | | | | | | | | | | | | | |
Sr. Unsec’d. Notes | | | 3.900 | | | | 05/01/29 | | | | 80 | | | | 77,060 | |
Corebridge Financial, Inc., | | | | | | | | | | | | | | | | |
Sr. Unsec’d. Notes | | | 3.650 | | | | 04/05/27 | | | | 45 | | | | 43,624 | |
Everest Reinsurance Holdings, Inc., | | | | | | | | | | | | | | | | |
Sr. Unsec’d. Notes | | | 3.125 | | | | 10/15/52 | | | | 95 | | | | 60,108 | |
Sr. Unsec’d. Notes | | | 3.500 | | | | 10/15/50 | | | | 60 | | | | 41,189 | |
Fairfax Financial Holdings Ltd. (Canada), | | | | | | | | | | | | | | | | |
Sr. Unsec’d. Notes | | | 5.625 | | | | 08/16/32 | | | | 90 | | | | 90,986 | |
Sr. Unsec’d. Notes, 144A | | | 6.000 | | | | 12/07/33 | | | | 37 | | | | 38,388 | |
Sr. Unsec’d. Notes, 144A | | | 6.350 | | | | 03/22/54 | | | | 25 | | | | 25,606 | |
Liberty Mutual Group, Inc., | | | | | | | | | | | | | | | | |
Gtd. Notes, 144A | | | 5.500 | | | | 06/15/52 | | | | 50 | | | | 47,317 | |
MetLife, Inc., | | | | | | | | | | | | | | | | |
Sr. Unsec’d. Notes | | | 5.000 | | | | 07/15/52 | | | | 30 | | | | 28,041 | |
Unum Group, | | | | | | | | | | | | | | | | |
Sr. Unsec’d. Notes | | | 6.000 | | | | 06/15/54 | | | | 55 | | | | 54,257 | |
| | | | | | | | | | | | | | | | |
| | | | |
| | | | | | | | | | | | | | | 588,870 | |
| | | | |
Machinery-Diversified 0.3% | | | | | | | | | | | | | | | | |
| | | | |
Flowserve Corp., | | | | | | | | | | | | | | | | |
Sr. Unsec’d. Notes | | | 2.800 | | | | 01/15/32 | | | | 55 | | | | 46,578 | |
Ingersoll Rand, Inc., | | | | | | | | | | | | | | | | |
Sr. Unsec’d. Notes | | | 5.700 | | | | 08/14/33 | | | | 10 | | | | 10,473 | |
Westinghouse Air Brake Technologies Corp., | | | | | | | | | | | | | | | | |
Gtd. Notes | | | 5.611 | | | | 03/11/34 | | | | 20 | | | | 20,597 | |
| | | | | | | | | | | | | | | | |
| | | | |
| | | | | | | | | | | | | | | 77,648 | |
| | | | |
Media 1.9% | | | | | | | | | | | | | | | | |
| | | | |
Charter Communications Operating LLC/Charter Communications Operating Capital, | | | | | | | | | | | | | | | | |
Sr. Sec’d. Notes | | | 3.500 | | | | 03/01/42 | | | | 15 | | | | 10,247 | |
Sr. Sec’d. Notes | | | 5.125 | | | | 07/01/49 | | | | 20 | | | | 15,776 | |
Sr. Sec’d. Notes | | | 6.384 | | | | 10/23/35 | | | | 180 | | | | 180,056 | |
See Notes to Financial Statements.
80
PGIM Corporate Bond Fund
Schedule of Investments (continued)
as of July 31, 2024
| | | | | | | | | | | | | | | | |
| | | | |
| Description | | Interest Rate | | | Maturity Date | | | Principal Amount (000)# | | | Value | |
| | | | |
CORPORATE BONDS (Continued) | | | | | | | | | | | | | | | | |
| | | | |
Media (cont’d.) | | | | | | | | | | | | | | | | |
| | | | |
Comcast Corp., | | | | | | | | | | | | | | | | |
Gtd. Notes | | | 5.500% | | | | 05/15/64 | | | | 130 | | | $ | 127,788 | |
Cox Communications, Inc., | | | | | | | | | | | | | | | | |
Gtd. Notes, 144A | | | 2.950 | | | | 10/01/50 | | | | 35 | | | | 21,503 | |
Gtd. Notes, 144A | | | 5.700 | | | | 06/15/33 | | | | 25 | | | | 25,417 | |
Sr. Unsec’d. Notes, 144A | | | 2.600 | | | | 06/15/31 | | | | 60 | | | | 50,664 | |
Discovery Communications LLC, | | | | | | | | | | | | | | | | |
Gtd. Notes | | | 3.950 | | | | 06/15/25 | | | | 28 | | | | 27,546 | |
| | | | | | | | | | | | | | | | |
| | | | |
| | | | | | | | | | | | | | | 458,997 | |
| | | | |
Mining 1.7% | | | | | | | | | | | | | | | | |
| | | | |
Barrick North America Finance LLC (Canada), | | | | | | | | | | | | | | | | |
Gtd. Notes | | | 7.500 | | | | 09/15/38 | | | | 75 | | | | 88,281 | |
Freeport-McMoRan, Inc., | | | | | | | | | | | | | | | | |
Gtd. Notes | | | 4.375 | | | | 08/01/28 | | | | 200 | | | | 195,451 | |
Newmont Corp., | | | | | | | | | | | | | | | | |
Gtd. Notes | | | 2.800 | | | | 10/01/29 | | | | 75 | | | | 68,785 | |
Newmont Corp./Newcrest Finance Pty Ltd., | | | | | | | | | | | | | | | | |
Gtd. Notes, 144A | | | 5.350 | | | | 03/15/34 | | | | 45 | | | | 46,071 | |
| | | | | | | | | | | | | | | | |
| | | | |
| | | | | | | | | | | | | | | 398,588 | |
| | | | |
Miscellaneous Manufacturing 0.3% | | | | | | | | | | | | | | | | |
| | | | |
Pentair Finance Sarl, | | | | | | | | | | | | | | | | |
Gtd. Notes | | | | | | | | | | | | | | | | |
| | | 4.500 | | | | 07/01/29 | | | | 65 | | | | 63,774 | |
| | | | |
Office/Business Equipment 0.6% | | | | | | | | | | | | | | | | |
| | | | |
CDW LLC/CDW Finance Corp., | | | | | | | | | | | | | | | | |
Gtd. Notes | | | | | | | | | | | | | | | | |
| | | 5.500 | | | | 12/01/24 | | | | 150 | | | | 149,646 | |
| | | | |
Oil & Gas 2.7% | | | | | | | | | | | | | | | | |
| | | | |
Aker BP ASA (Norway), | | | | | | | | | | | | | | | | |
Sr. Unsec’d. Notes, 144A | | | 3.750 | | | | 01/15/30 | | | | 150 | | | | 140,241 | |
Canadian Natural Resources Ltd. (Canada), | | | | | | | | | | | | | | | | |
Sr. Unsec’d. Notes | | | 5.850 | | | | 02/01/35 | | | | 10 | | | | 10,196 | |
Sr. Unsec’d. Notes | | | 6.250 | | | | 03/15/38 | | | | 50 | | | | 52,815 | |
See Notes to Financial Statements.
PGIM Corporate Bond Fund 81
PGIM Corporate Bond Fund
Schedule of Investments (continued)
as of July 31, 2024
| | | | | | | | | | | | | | | | |
| | | | |
| Description | | Interest Rate | | | Maturity Date | | | Principal Amount (000)# | | | Value | |
| | | | |
CORPORATE BONDS (Continued) | | | | | | | | | | | | | | | | |
| | | | |
Oil & Gas (cont’d.) | | | | | | | | | | | | | | | | |
| | | | |
Cenovus Energy, Inc. (Canada), | | | | | | | | | | | | | | | | |
Sr. Unsec’d. Notes | | | 2.650% | | | | 01/15/32 | | | | 40 | | | $ | 33,782 | |
Sr. Unsec’d. Notes | | | 5.250 | | | | 06/15/37 | | | | 21 | | | | 20,536 | |
Sr. Unsec’d. Notes | | | 5.400 | | | | 06/15/47 | | | | 9 | | | | 8,486 | |
ConocoPhillips Co., | | | | | | | | | | | | | | | | |
Gtd. Notes | | | 4.300 | | | | 11/15/44 | | | | 55 | | | | 47,516 | |
Devon Energy Corp., | | | | | | | | | | | | | | | | |
Sr. Unsec’d. Notes | | | 5.000 | | | | 06/15/45 | | | | 55 | | | | 48,243 | |
Diamondback Energy, Inc., | | | | | | | | | | | | | | | | |
Gtd. Notes | | | 4.400 | | | | 03/24/51 | | | | 45 | | | | 36,919 | |
Gtd. Notes | | | 6.250 | | | | 03/15/33 | | | | 75 | | | | 80,089 | |
Helmerich & Payne, Inc., | | | | | | | | | | | | | | | | |
Sr. Unsec’d. Notes | | | 2.900 | | | | 09/29/31 | | | | 90 | | | | 76,849 | |
Occidental Petroleum Corp., | | | | | | | | | | | | | | | | |
Sr. Unsec’d. Notes | | | 5.550 | | | | 10/01/34 | | | | 25 | | | | 25,216 | |
Permian Resources Operating LLC, | | | | | | | | | | | | | | | | |
Sr. Unsec’d. Notes, 144A | | | 6.250 | | | | 02/01/33 | | | | 25 | | | | 25,174 | |
Petroleos Mexicanos (Mexico), | | | | | | | | | | | | | | | | |
Gtd. Notes | | | 6.350 | | | | 02/12/48 | | | | 60 | | | | 39,225 | |
| | | | | | | | | | | | | | | | |
| | | | |
| | | | | | | | | | | | | | | 645,287 | |
| | | | |
Packaging & Containers 1.2% | | | | | | | | | | | | | | | | |
| | | | |
AptarGroup, Inc., | | | | | | | | | | | | | | | | |
Sr. Unsec’d. Notes | | | 3.600 | | | | 03/15/32 | | | | 20 | | | | 17,831 | |
Berry Global, Inc., | | | | | | | | | | | | | | | | |
Sr. Sec’d. Notes | | | 1.570 | | | | 01/15/26 | | | | 130 | | | | 123,491 | |
Graphic Packaging International LLC, | | | | | | | | | | | | | | | | |
Sr. Sec’d. Notes, 144A | | | 1.512 | | | | 04/15/26 | | | | 75 | | | | 70,200 | |
Sealed Air Corp., | | | | | | | | | | | | | | | | |
Sr. Sec’d. Notes, 144A | | | 1.573 | | | | 10/15/26 | | | | 85 | | | | 78,465 | |
| | | | | | | | | | | | | | | | |
| | | | |
| | | | | | | | | | | | | | | 289,987 | |
| | | | |
Pharmaceuticals 1.9% | | | | | | | | | | | | | | | | |
| | | | |
AbbVie, Inc., | | | | | | | | | | | | | | | | |
Sr. Unsec’d. Notes | | | 4.050 | | | | 11/21/39 | | | | 95 | | | | 84,878 | |
Sr. Unsec’d. Notes | | | 4.250 | | | | 11/21/49 | | | | 20 | | | | 17,089 | |
Sr. Unsec’d. Notes | | | 4.400 | | | | 11/06/42 | | | | 60 | | | | 54,083 | |
See Notes to Financial Statements.
82
PGIM Corporate Bond Fund
Schedule of Investments (continued)
as of July 31, 2024
| | | | | | | | | | | | | | | | |
| | | | |
| Description | | Interest Rate | | | Maturity Date | | | Principal Amount (000)# | | | Value | |
| | | | |
CORPORATE BONDS (Continued) | | | | | | | | | | | | | | | | |
| | | | |
Pharmaceuticals (cont’d.) | | | | | | | | | | | | | | | | |
| | | | |
Cigna Group (The), | | | | | | | | | | | | | | | | |
Gtd. Notes | | | 4.900% | | | | 12/15/48 | | | | 100 | | | $ | 89,806 | |
Eli Lilly & Co., | | | | | | | | | | | | | | | | |
Sr. Unsec’d. Notes | | | 5.000 | | | | 02/09/54 | | | | 25 | | | | 24,356 | |
Mylan, Inc., | | | | | | | | | | | | | | | | |
Gtd. Notes | | | 5.200 | | | | 04/15/48 | | | | 20 | | | | 16,837 | |
Utah Acquisition Sub, Inc., | | | | | | | | | | | | | | | | |
Gtd. Notes | | | 3.950 | | | | 06/15/26 | | | | 140 | | | | 137,250 | |
Viatris, Inc., | | | | | | | | | | | | | | | | |
Gtd. Notes | | | 3.850 | | | | 06/22/40 | | | | 25 | | | | 18,845 | |
| | | | | | | | | | | | | | | | |
| | | | |
| | | | | | | | | | | | | | | 443,144 | |
| | | | |
Pipelines 8.1% | | | | | | | | | | | | | | | | |
| | | | |
Boardwalk Pipelines LP, | | | | | | | | | | | | | | | | |
Gtd. Notes | | | 3.400 | | | | 02/15/31 | | | | 100 | | | | 89,360 | |
Colonial Enterprises, Inc., | | | | | | | | | | | | | | | | |
Gtd. Notes, 144A | | | 3.250 | | | | 05/15/30 | | | | 90 | | | | 82,436 | |
Columbia Pipelines Operating Co. LLC, | | | | | | | | | | | | | | | | |
Sr. Unsec’d. Notes, 144A | | | 6.036 | | | | 11/15/33 | | | | 70 | | | | 73,197 | |
DCP Midstream Operating LP, | | | | | | | | | | | | | | | | |
Gtd. Notes | | | 5.125 | | | | 05/15/29 | | | | 310 | | | | 313,352 | |
El Paso Natural Gas Co. LLC, | | | | | | | | | | | | | | | | |
Gtd. Notes, 144A | | | 3.500 | | | | 02/15/32 | | | | 95 | | | | 82,376 | |
Energy Transfer LP, | | | | | | | | | | | | | | | | |
Sr. Unsec’d. Notes | | | 5.400 | | | | 10/01/47 | | | | 150 | | | | 138,185 | |
Sr. Unsec’d. Notes | | | 6.250 | | | | 04/15/49 | | | | 60 | | | | 61,443 | |
Sr. Unsec’d. Notes | | | 6.550 | | | | 12/01/33 | | | | 55 | | | | 59,537 | |
Sr. Unsec’d. Notes, Series 20Y | | | 5.800 | | | | 06/15/38 | | | | 15 | | | | 15,215 | |
Enterprise Products Operating LLC, | | | | | | | | | | | | | | | | |
Gtd. Notes | | | 4.800 | | | | 02/01/49 | | | | 40 | | | | 36,385 | |
Gtd. Notes | | | 4.850 | | | | 03/15/44 | | | | 100 | | | | 92,458 | |
Florida Gas Transmission Co. LLC, | | | | | | | | | | | | | | | | |
Sr. Unsec’d. Notes, 144A | | | 2.300 | | | | 10/01/31 | | | | 100 | | | | 83,276 | |
Kinder Morgan, Inc., | | | | | | | | | | | | | | | | |
Sr. Unsec’d. Notes | | | 5.100 | | | | 08/01/29 | | | | 140 | | | | 141,484 | |
MPLX LP, | | | | | | | | | | | | | | | | |
Sr. Unsec’d. Notes | | | 4.000 | | | | 03/15/28 | | | | 45 | | | | 43,729 | |
Sr. Unsec’d. Notes | | | 4.950 | | | | 03/14/52 | | | | 80 | | | | 69,703 | |
Sr. Unsec’d. Notes | | | 5.200 | | | | 12/01/47 | | | | 75 | | | | 68,140 | |
See Notes to Financial Statements.
PGIM Corporate Bond Fund 83
PGIM Corporate Bond Fund
Schedule of Investments (continued)
as of July 31, 2024
| | | | | | | | | | | | | | | | |
| | | | |
| Description | | Interest Rate | | | Maturity Date | | | Principal Amount (000)# | | | Value | |
| | | | |
CORPORATE BONDS (Continued) | | | | | | | | | | | | | | | | |
| | | | |
Pipelines (cont’d.) | | | | | | | | | | | | | | | | |
| | | | |
ONEOK, Inc., | | | | | | | | | | | | | | | | |
Gtd. Notes | | | 3.100% | | | | 03/15/30 | | | | 45 | | | $ | 41,102 | |
Gtd. Notes | | | 4.350 | | | | 03/15/29 | | | | 2 | | | | 1,959 | |
Gtd. Notes | | | 4.500 | | | | 03/15/50 | | | | 30 | | | | 24,497 | |
Gtd. Notes | | | 4.950 | | | | 07/13/47 | | | | 50 | | | | 43,846 | |
Gtd. Notes | | | 5.650 | | | | 11/01/28 | | | | 10 | | | | 10,312 | |
Gtd. Notes | | | 6.625 | | | | 09/01/53 | | | | 40 | | | | 43,716 | |
Targa Resources Corp., | | | | | | | | | | | | | | | | |
Gtd. Notes | | | 4.950 | | | | 04/15/52 | | | | 20 | | | | 17,506 | |
Gtd. Notes | | | 6.125 | | | | 03/15/33 | | | | 40 | | | | 42,065 | |
Transcontinental Gas Pipe Line Co. LLC, | | | | | | | | | | | | | | | | |
Sr. Unsec’d. Notes | | | 3.950 | | | | 05/15/50 | | | | 80 | | | | 61,891 | |
Western Midstream Operating LP, | | | | | | | | | | | | | | | | |
Sr. Unsec’d. Notes | | | 6.350 | | | | 01/15/29 | | | | 65 | | | | 68,135 | |
Williams Cos., Inc. (The), | | | | | | | | | | | | | | | | |
Sr. Unsec’d. Notes | | | 4.650 | | | | 08/15/32 | | | | 105 | | | | 102,092 | |
Sr. Unsec’d. Notes | | | 5.300 | | | | 08/15/52 | | | | 30 | | | | 28,488 | |
| | | | | | | | | | | | | | | | |
| | | | |
| | | | | | | | | | | | | | | 1,935,885 | |
| | | | |
Real Estate 0.8% | | | | | | | | | | | | | | | | |
| | | | |
Ontario Teachers’ Cadillac Fairview Properties Trust (Canada), | | | | | | | | | | | | | | | | |
Sr. Unsec’d. Notes, 144A | | | | | | | | | | | | | | | | |
| | | 4.125 | | | | 02/01/29 | | | | 200 | | | | 192,620 | |
| | | | |
Real Estate Investment Trusts (REITs) 7.7% | | | | | | | | | | | | | | | | |
| | | | |
Alexandria Real Estate Equities, Inc., | | | | | | | | | | | | | | | | |
Gtd. Notes | | | 5.250 | | | | 05/15/36 | | | | 20 | | | | 19,713 | |
American Tower Corp., | | | | | | | | | | | | | | | | |
Sr. Unsec’d. Notes | | | 3.550 | | | | 07/15/27 | | | | 40 | | | | 38,530 | |
Sr. Unsec’d. Notes | | | 5.200 | | | | 02/15/29 | | | | 85 | | | | 86,142 | |
Brixmor Operating Partnership LP, | | | | | | | | | | | | | | | | |
Sr. Unsec’d. Notes | | | 4.050 | | | | 07/01/30 | | | | 15 | | | | 14,239 | |
Sr. Unsec’d. Notes | | | 4.125 | | | | 06/15/26 | | | | 200 | | | | 196,643 | |
Broadstone Net Lease LLC, | | | | | | | | | | | | | | | | |
Gtd. Notes | | | 2.600 | | | | 09/15/31 | | | | 160 | | | | 131,315 | |
Crown Castle, Inc., | | | | | | | | | | | | | | | | |
Sr. Unsec’d. Notes | | | 4.800 | | | | 09/01/28 | | | | 100 | | | | 99,547 | |
Sr. Unsec’d. Notes | | | 5.600 | | | | 06/01/29 | | | | 30 | | | | 30,820 | |
See Notes to Financial Statements.
84
PGIM Corporate Bond Fund
Schedule of Investments (continued)
as of July 31, 2024
| | | | | | | | | | | | | | | | |
| | | | |
| Description | | Interest Rate | | | Maturity Date | | | Principal Amount (000)# | | | Value | |
| | | | |
CORPORATE BONDS (Continued) | | | | | | | | | | | | | | | | |
| | | | |
Real Estate Investment Trusts (REITs) (cont’d.) | | | | | | | | | | | | | | | | |
| | | | |
CubeSmart LP, | | | | | | | | | | | | | | | | |
Gtd. Notes | | | 2.250% | | | | 12/15/28 | | | | 50 | | | $ | 44,904 | |
GLP Capital LP/GLP Financing II, Inc., | | | | | | | | | | | | | | | | |
Gtd. Notes | | | 3.350 | | | | 09/01/24 | | | | 100 | | | | 99,756 | |
Gtd. Notes | | | 4.000 | | | | 01/15/31 | | | | 170 | | | | 155,579 | |
Gtd. Notes | | | 5.250 | | | | 06/01/25 | | | | 60 | | | | 59,737 | |
Phillips Edison Grocery Center Operating Partnership I LP, | | | | | | | | | | | | | | | | |
Gtd. Notes | | | 2.625 | | | | 11/15/31 | | | | 115 | | | | 95,939 | |
Prologis LP, | | | | | | | | | | | | | | | | |
Sr. Unsec’d. Notes | | | 1.750 | | | | 02/01/31 | | | | 100 | | | | 83,076 | |
Sr. Unsec’d. Notes | | | 5.250 | | | | 03/15/54 | | | | 35 | | | | 33,851 | |
SITE Centers Corp., | | | | | | | | | | | | | | | | |
Sr. Unsec’d. Notes | | | 3.625 | | | | 02/01/25 | | | | 306 | | | | 302,730 | |
Sun Communities Operating LP, | | | | | | | | | | | | | | | | |
Gtd. Notes | | | 2.300 | | | | 11/01/28 | | | | 85 | | | | 76,023 | |
Gtd. Notes | | | 5.500 | | | | 01/15/29 | | | | 25 | | | | 25,373 | |
VICI Properties LP, | | | | | | | | | | | | | | | | |
Sr. Unsec’d. Notes | | | 4.750 | | | | 02/15/28 | | | | 110 | | | | 108,921 | |
Welltower OP LLC, | | | | | | | | | | | | | | | | |
Gtd. Notes | | | 2.800 | | | | 06/01/31 | | | | 100 | | | | 87,493 | |
WP Carey, Inc., | | | | | | | | | | | | | | | | |
Sr. Unsec’d. Notes | | | 2.250 | | | | 04/01/33 | | | | 65 | | | | 51,843 | |
| | | | | | | | | | | | | | | | |
| | | | |
| | | | | | | | | | | | | | | 1,842,174 | |
| | | | |
Retail 0.8% | | | | | | | | | | | | | | | | |
| | | | |
Alimentation Couche-Tard, Inc. (Canada), | | | | | | | | | | | | | | | | |
Gtd. Notes, 144A | | | 3.625 | | | | 05/13/51 | | | | 60 | | | | 44,197 | |
Gtd. Notes, 144A | | | 5.267 | | | | 02/12/34 | | | | 10 | | | | 10,070 | |
AutoNation, Inc., | | | | | | | | | | | | | | | | |
Sr. Unsec’d. Notes | | | 4.750 | | | | 06/01/30 | | | | 100 | | | | 97,818 | |
Home Depot, Inc. (The), | | | | | | | | | | | | | | | | |
Sr. Unsec’d. Notes | | | 4.950 | | | | 06/25/34 | | | | 45 | | | | 45,430 | |
| | | | | | | | | | | | | | | | |
| | | | |
| | | | | | | | | | | | | | | 197,515 | |
| | | | |
Semiconductors 1.5% | | | | | | | | | | | | | | | | |
| | | | |
Broadcom, Inc., | | | | | | | | | | | | | | | | |
Sr. Unsec’d. Notes, 144A | | | 3.419 | | | | 04/15/33 | | | | 303 | | | | 267,830 | |
See Notes to Financial Statements.
PGIM Corporate Bond Fund 85
PGIM Corporate Bond Fund
Schedule of Investments (continued)
as of July 31, 2024
| | | | | | | | | | | | | | | | |
| | | | |
| Description | | Interest Rate | | | Maturity Date | | | Principal Amount (000)# | | | Value | |
| | | | |
CORPORATE BONDS (Continued) | | | | | | | | | | | | | | | | |
| | | | |
Semiconductors (cont’d.) | | | | | | | | | | | | | | | | |
| | | | |
Intel Corp., | | | | | | | | | | | | | | | | |
Sr. Unsec’d. Notes | | | 5.600% | | | | 02/21/54 | | | | 60 | | | $ | 59,606 | |
Sr. Unsec’d. Notes | | | 5.700 | | | | 02/10/53 | | | | 31 | | | | 31,259 | |
| | | | | | | | | | | | | | | | |
| | | | |
| | | | | | | | | | | | | | | 358,695 | |
| | | | |
Shipbuilding 0.4% | | | | | | | | | | | | | | | | |
| | | | |
Huntington Ingalls Industries, Inc., | | | | | | | | | | | | | | | | |
Gtd. Notes | | | | | | | | | | | | | | | | |
| | | 3.483 | | | | 12/01/27 | | | | 100 | | | | 95,518 | |
| | | | |
Software 0.8% | | | | | | | | | | | | | | | | |
| | | | |
Fidelity National Information Services, Inc., | | | | | | | | | | | | | | | | |
Sr. Unsec’d. Notes | | | 3.100 | | | | 03/01/41 | | | | 35 | | | | 25,773 | |
Oracle Corp., | | | | | | | | | | | | | | | | |
Sr. Unsec’d. Notes | | | 3.600 | | | | 04/01/50 | | | | 90 | | | | 64,585 | |
Sr. Unsec’d. Notes | | | 3.900 | | | | 05/15/35 | | | | 45 | | | | 40,003 | |
Sr. Unsec’d. Notes | | | 4.000 | | | | 07/15/46 | | | | 60 | | | | 47,205 | |
Sr. Unsec’d. Notes | | | 6.900 | | | | 11/09/52 | | | | 20 | | | | 22,911 | |
| | | | | | | | | | | | | | | | |
| | | | |
| | | | | | | | | | | | | | | 200,477 | |
| | | | |
Telecommunications 3.9% | | | | | | | | | | | | | | | | |
| | | | |
AT&T, Inc., | | | | | | | | | | | | | | | | |
Sr. Unsec’d. Notes | | | 3.500 | | | | 06/01/41 | | | | 240 | | | | 188,834 | |
Sr. Unsec’d. Notes | | | 3.800 | | | | 12/01/57 | | | | 105 | | | | 75,487 | |
Motorola Solutions, Inc., | | | | | | | | | | | | | | | | |
Sr. Unsec’d. Notes | | | 2.750 | | | | 05/24/31 | | | | 150 | | | | 130,544 | |
Rogers Communications, Inc. (Canada), | | | | | | | | | | | | | | | | |
Gtd. Notes | | | 5.300 | | | | 02/15/34 | | | | 50 | | | | 50,106 | |
T-Mobile USA, Inc., | | | | | | | | | | | | | | | | |
Gtd. Notes | | | 2.050 | | | | 02/15/28 | | | | 110 | | | | 100,315 | |
Gtd. Notes | | | 3.875 | | | | 04/15/30 | | | | 210 | | | | 200,290 | |
Verizon Communications, Inc., | | | | | | | | | | | | | | | | |
Sr. Unsec’d. Notes | | | 2.355 | | | | 03/15/32 | | | | 80 | | | | 66,930 | |
Sr. Unsec’d. Notes | | | 2.650 | | | | 11/20/40 | | | | 175 | | | | 123,605 | |
| | | | | | | | | | | | | | | | |
| | | | |
| | | | | | | | | | | | | | | 936,111 | |
See Notes to Financial Statements.
86
PGIM Corporate Bond Fund
Schedule of Investments (continued)
as of July 31, 2024
| | | | | | | | | | | | | | | | |
| | | | |
| Description | | Interest Rate | | | Maturity Date | | | Principal Amount (000)# | | | Value | |
| | | | |
CORPORATE BONDS (Continued) | | | | | | | | | | | | | | | | |
| | | | |
Trucking & Leasing 0.5% | | | | | | | | | | | | | | | | |
| | | | |
Penske Truck Leasing Co. LP/PTL Finance Corp., | | | | | | | | | | | | | | | | |
Sr. Unsec’d. Notes, 144A | | | 1.700% | | | | 06/15/26 | | | | 90 | | | $ | 84,496 | |
Sr. Unsec’d. Notes, 144A | | | 5.250 | | | | 07/01/29 | | | | 30 | | | | 30,350 | |
| | | | | | | | | | | | | | | | |
| | | | |
| | | | | | | | | | | | | | | 114,846 | |
| | | | | | | | | | | | | | | | |
| | | | |
TOTAL CORPORATE BONDS
(cost $23,310,346) | | | | | | | | | | | | | | | 21,409,793 | |
| | | | | | | | | | | | | | | | |
| | | | |
MUNICIPAL BONDS 0.4% | | | | | | | | | | | | | | | | |
| | | | |
California 0.2% | | | | | | | | | | | | | | | | |
| | | | |
Regents of the University of California Medical Center Pooled Revenue, | | | | | | | | | | | | | | | | |
Taxable, Revenue Bonds, Series Q | | | 4.563 | | | | 05/15/53 | | | | 60 | | | | 54,565 | |
| | | | |
Michigan 0.2% | | | | | | | | | | | | | | | | |
| | | | |
University of Michigan, | | | | | | | | | | | | | | | | |
Taxable, Revenue Bonds, Series A | | | 4.454 | | | | 04/01/2122 | | | | 60 | | | | 51,239 | |
| | | | | | | | | | | | | | | | |
| | | | |
TOTAL MUNICIPAL BONDS
(cost $113,439) | | | | | | | | | | | | | | | 105,804 | |
| | | | | | | | | | | | | | | | |
| | | | |
TOTAL LONG-TERM INVESTMENTS
(cost $25,286,818) | | | | | | | | | | | | | | | 23,301,205 | |
| | | | | | | | | | | | | | | | |
| | | | |
| | | | | | | | | Shares | | | | |
| | | | |
SHORT-TERM INVESTMENT 0.5% | | | | | | | | | | | | | | | | |
| | | | |
AFFILIATED MUTUAL FUND | | | | | | | | | | | | | | | | |
PGIM Core Government Money Market Fund (7-day effective yield 5.561%)
(cost $114,686)(wb) | | | | | | | | | | | 114,686 | | | | 114,686 | |
| | | | | | | | | | | | | | | | |
| | | | |
TOTAL INVESTMENTS 98.1%
(cost $25,401,504) | | | | | | | | | | | | | | | 23,415,891 | |
Other assets in excess of liabilities(z) 1.9% | | | | | | | | | | | | | | | 461,248 | |
| | | | | | | | | | | | | | | | |
| | | | |
NET ASSETS 100.0% | | | | | | | | | | | | | | $ | 23,877,139 | |
| | | | | | | | | | | | | | | | |
See Notes to Financial Statements.
PGIM Corporate Bond Fund 87
PGIM Corporate Bond Fund
Schedule of Investments (continued)
as of July 31, 2024
See the Glossary for a list of the abbreviation(s) used in the annual report.
| # | Principal or notional amount is shown in U.S. dollars unless otherwise stated. |
| (cc) | Variable rate instrument. The rate shown is based on the latest available information as of July 31, 2024. Certain variable rate securities are not based on a published reference rate and spread but are determined by the issuer or agent and are based on current market conditions. These securities do not indicate a reference rate and spread in their description. |
| (ff) | Variable rate security. Security may be issued at a fixed coupon rate, which converts to a variable rate at a specified date. Rate shown is the rate in effect as of period end. |
| (oo) | Perpetual security. Maturity date represents next call date. |
| (wb) | Represents an investment in a Fund affiliated with the Manager. |
| (z) | Includes net unrealized appreciation/(depreciation) and/or market value of the below holdings which are excluded from the Schedule of Investments: |
Futures contracts outstanding at July 31, 2024:
| | | | | | | | | | | | | | |
Number
of
Contracts | | Type | | Expiration
Date | | | Current
Notional
Amount | | | Value /
Unrealized
Appreciation
(Depreciation) | |
Long Positions: | | | | | | | | | | | | |
4 | | 2 Year U.S. Treasury Notes | | | Sep. 2024 | | | $ | 821,469 | | | $ | 5,394 | |
1 | | 5 Year U.S. Treasury Notes | | | Sep. 2024 | | | | 107,891 | | | | 2,046 | |
9 | | 10 Year U.S. Ultra Treasury Notes | | | Sep. 2024 | | | | 1,040,203 | | | | 21,572 | |
1 | | 20 Year U.S. Treasury Bonds | | | Sep. 2024 | | | | 120,781 | | | | 3,850 | |
4 | | 30 Year U.S. Ultra Treasury Bonds | | | Sep. 2024 | | | | 511,875 | | | | 17,616 | |
| | | | | |
| | | | | | | | | | | | | 50,478 | |
| | | | | |
Short Position: | | | | | | | | | | | | |
13 | | 10 Year U.S. Treasury Notes | | | Sep. 2024 | | | | 1,453,563 | | | | (28,604 | ) |
| | | | | |
| | | | | | | | | | | | $ | 21,874 | |
| | | | | |
Interest rate swap agreements outstanding at July 31, 2024:
| | | | | | | | | | | | | | | | | | | | | | | | |
Notional Amount (000)# | | | Termination
Date | | | Fixed
Rate | | | Floating Rate | | Value at
Trade Date | | | Value at
July 31,
2024 | | | Unrealized
Appreciation
(Depreciation) | |
| | | | | | | | | | | | | | | | | | | |
| | Centrally Cleared Interest Rate Swap Agreements: | |
| | 340 | | | | 05/13/27 | | | | 4.497%(A) | | | 1 Day SOFR(2)(A)/ 5.380% | | $ | 118 | | | $ | 3,973 | | | $ | 3,855 | |
| | 210 | | | | 05/13/29 | | | | 4.253%(A) | | | 1 Day SOFR(1)(A)/ 5.380% | | | (223 | ) | | | (4,205 | ) | | | (3,982 | ) |
| | | | | | | | | | | | | | | | | | | | | | | | |
| | | | | | | | | | | | | | $ | (105 | ) | | $ | (232 | ) | | $ | (127 | ) |
| | | | | | | | | | | | | | | | | | | | | | | | |
| (1) | The Fund pays the fixed rate and receives the floating rate. |
| (2) | The Fund pays the floating rate and receives the fixed rate. |
See Notes to Financial Statements.
88
PGIM Corporate Bond Fund
Schedule of Investments (continued)
as of July 31, 2024
Interest rate swap agreements outstanding at July 31, 2024 (continued):
Summary of Collateral for Centrally Cleared/Exchange-traded Derivatives:
Cash and securities segregated as collateral, including pending settlement for closed positions, to cover requirements for centrally cleared/exchange-traded derivatives are listed by broker as follows:
| | | | | | | | | | | | | | | | | | | | | | |
Broker | | Cash and/or Foreign Currency | | | Securities Market Value | |
| | | | | | | |
CGM | | | | $ | 350,000 | | | | | | | | | | | $ | — | | | | | |
| | | | | | | | | | | | | | | | | | | | | | |
Fair Value Measurements:
Various inputs are used in determining the value of the Fund’s investments. These inputs are summarized in the three broad levels listed below.
Level 1—unadjusted quoted prices generally in active markets for identical securities.
Level 2—quoted prices for similar securities, interest rates and yield curves, prepayment speeds, foreign currency exchange rates and other observable inputs.
Level 3—unobservable inputs for securities valued in accordance with Board approved fair valuation procedures.
The following is a summary of the inputs used as of July 31, 2024 in valuing such portfolio securities:
| | | | | | | | | | | | | | | | | | | | | | |
| | | Level 1 | | | | | | Level 2 | | | | | | Level 3 | | | |
Investments in Securities | | | | | | | | | | | | | | | | | | | | | | |
Assets | | | | | | | | | | | | | | | | | | | | | | |
Long-Term Investments | | | | | | | | | | | | | | | | | | | | | | |
Commercial Mortgage-Backed Securities | | $ | — | | | | | | | $ | 1,785,608 | | | | | | | $— | | | | |
Corporate Bonds | | | — | | | | | | | | 21,409,793 | | | | | | | — | | | | |
Municipal Bonds | | | — | | | | | | | | 105,804 | | | | | | | — | | | | |
Short-Term Investment | | | | | | | | | | | | | | | | | | | | | | |
Affiliated Mutual Fund | | | 114,686 | | | | | | | | — | | | | | | | — | | | | |
| | | | | | | | | | | | | | | | | | | | | | |
| | | | | | |
Total | | $ | 114,686 | | | | | | | $ | 23,301,205 | | | | | | | $— | | | | |
| | | | | | | | | | | | | | | | | | | | | | |
| | | | | | |
Other Financial Instruments* | | | | | | | | | | | | | | | | | | | | | | |
Assets | | | | | | | | | | | | | | | | | | | | | | |
Futures Contracts | | $ | 50,478 | | | | | | | $ | — | | | | | | | $— | | | | |
Centrally Cleared Interest Rate Swap Agreement | | | — | | | | | | | | 3,855 | | | | | | | — | | | | |
| | | | | | | | | | | | | | | | | | | | | | |
| | | | | | |
Total | | $ | 50,478 | | | | | | | $ | 3,855 | | | | | | | $— | | | | |
| | | | | | | | | | | | | | | | | | | | | | |
| | | | | | |
Liabilities | | | | | | | | | | | | | | | | | | | | | | |
Futures Contracts | | $ | (28,604 | ) | | | | | | $ | — | | | | | | | $— | | | | |
Centrally Cleared Interest Rate Swap Agreement | | | — | | | | | | | | (3,982 | ) | | | | | | — | | | | |
| | | | | | | | | | | | | | | | | | | | | | |
| | | | | | |
Total | | $ | (28,604 | ) | | | | | | $ | (3,982 | ) | | | | | | $— | | | | |
| | | | | | | | | | | | | | | | | | | | | | |
See Notes to Financial Statements.
PGIM Corporate Bond Fund 89
PGIM Corporate Bond Fund
Schedule of Investments (continued)
as of July 31, 2024
| * | Other financial instruments are derivative instruments not reflected in the Schedule of Investments, such as futures, forwards and centrally cleared swap contracts, which are recorded at unrealized appreciation (depreciation) on the instrument, and OTC swap contracts which are recorded at fair value. |
Industry Classification:
The industry classification of investments and other assets in excess of liabilities shown as a percentage of net assets as of July 31, 2024 were as follows:
| | | | |
Banks | | | 23.4 | % |
Electric | | | 9.4 | |
Pipelines | | | 8.1 | |
Real Estate Investment Trusts (REITs) | | | 7.7 | |
Commercial Mortgage-Backed Securities | | | 7.5 | |
Telecommunications | | | 3.9 | |
Healthcare-Services | | | 2.9 | |
Oil & Gas | | | 2.7 | |
Agriculture | | | 2.6 | |
Insurance | | | 2.5 | |
Auto Manufacturers | | | 2.3 | |
Media | | | 1.9 | |
Pharmaceuticals | | | 1.9 | |
Mining | | | 1.7 | |
Commercial Services | | | 1.6 | |
Semiconductors | | | 1.5 | |
Diversified Financial Services | | | 1.3 | |
Beverages | | | 1.3 | |
Chemicals | | | 1.2 | |
Packaging & Containers | | | 1.2 | |
Foods | | | 1.2 | |
Aerospace & Defense | | | 0.9 | |
Software | | | 0.8 | |
Retail | | | 0.8 | |
| | | | |
Real Estate | | | 0.8 | % |
Engineering & Construction | | | 0.7 | |
Office/Business Equipment | | | 0.6 | |
Airlines | | | 0.6 | |
Entertainment | | | 0.6 | |
Trucking & Leasing | | | 0.5 | |
Affiliated Mutual Fund | | | 0.5 | |
Municipal Bonds | | | 0.4 | |
Biotechnology | | | 0.4 | |
Housewares | | | 0.4 | |
Electronics | | | 0.4 | |
Shipbuilding | | | 0.4 | |
Distribution/Wholesale | | | 0.3 | |
Machinery-Diversified | | | 0.3 | |
Miscellaneous Manufacturing | | | 0.3 | |
Computers | | | 0.3 | |
Gas | | | 0.2 | |
Hand/Machine Tools | | | 0.1 | |
| | | | |
| |
| | | 98.1 | |
Other assets in excess of liabilities | | | 1.9 | |
| | | | |
| |
| | | 100.0 | % |
| | | | |
Effects of Derivative Instruments on the Financial Statements and Primary Underlying Risk Exposure:
The Fund invested in derivative instruments during the reporting period. The primary type of risk associated with these derivative instruments is interest rate risk. See the Notes to Financial Statements for additional detail regarding these derivative instruments and their risks. The effect of such derivative instruments on the Fund’s financial position and financial performance as reflected in the Statement of Assets and Liabilities and Statement of Operations is presented in the summary below.
Fair values of derivative instruments as of July 31, 2024 as presented in the Statement of Assets and Liabilities:
See Notes to Financial Statements.
90
PGIM Corporate Bond Fund
Schedule of Investments (continued)
as of July 31, 2024
| | | | | | | | | | | | |
| | | Asset Derivatives | | | Liability Derivatives | |
Derivatives not accounted for as
hedging instruments, carried at
fair value | | Statement of
Assets and
Liabilities Location | | Fair
Value | | | Statement of
Assets and
Liabilities Location | | Fair
Value | |
| | | | |
Interest rate contracts | | Due from/to
broker-variation margin
futures | | $ | 50,478 | * | | Due from/to
broker-variation margin
futures | | $ | 28,604 | * |
| | | | |
Interest rate contracts | | Due from/to broker-variation
margin swaps | | | 3,855 | * | | Due from/to
broker-variation margin
swaps | | | 3,982 | * |
| | | | | | | | | | | | |
| | | | |
| | | | $ | 54,333 | | | | | $ | 32,586 | |
| | | | | | | | | | | | |
| * | Includes cumulative appreciation (depreciation) as reported in the schedule of open futures and centrally cleared swap contracts. Only unsettled variation margin receivable (payable) is reported within the Statement of Assets and Liabilities. |
The effects of derivative instruments on the Statement of Operations for the year ended July 31, 2024 are as follows:
| | | | | | | | |
Amount of Realized Gain (Loss) on Derivatives Recognized in Income | |
| |
Derivatives not accounted for as hedging instruments, carried at fair value | | Futures | | | Swaps | |
| | |
Interest rate contracts | | $ | (51,197 | ) | | $ | 666 | |
| | | | | | | | |
| | | | | | | | |
Change in Unrealized Appreciation (Depreciation) on Derivatives Recognized in Income | |
| |
Derivatives not accounted for as hedging instruments, carried at fair value | | Futures | | | Swaps | |
| | |
Interest rate contracts | | $ | 50,880 | | | $ | (127 | ) |
| | | | | | | | |
For the year ended July 31, 2024, the Fund’s average volume of derivative activities is as follows:
| | |
| Derivative Contract Type | | Average Volume of Derivative Activities* |
|
| |
Futures Contracts - Long Positions (1) | | $1,804,005 |
| |
Futures Contracts - Short Positions (1) | | 964,041 |
| |
Interest Rate Swap Agreements (1) | | 110,000 |
|
| * | Average volume is based on average quarter end balances for the year ended July 31, 2024. |
| (1) | Notional Amount in USD. |
See Notes to Financial Statements.
PGIM Corporate Bond Fund 91
PGIM Corporate Bond Fund
Statement of Assets & Liabilities
as of July 31, 2024
| | | | |
| |
Assets | | | | |
| |
Investments at value: | | | | |
Unaffiliated investments (cost $25,286,818) | | $ | 23,301,205 | |
Affiliated investments (cost $114,686) | | | 114,686 | |
Deposit with broker for centrally cleared/exchange-traded derivatives | | | 350,000 | |
Dividends and interest receivable | | | 236,182 | |
Receivable for Fund shares sold | | | 19,672 | |
Due from Manager | | | 17,407 | |
Due from broker—variation margin futures | | | 3,859 | |
Prepaid expenses | | | 73 | |
| | | | |
| |
Total Assets | | | 24,043,084 | |
| | | | |
| |
Liabilities | | | | |
| |
Audit fee payable | | | 42,400 | |
Payable for Fund shares purchased | | | 33,928 | |
Dividends payable | | | 30,664 | |
Payable for investments purchased | | | 25,000 | |
Shareholders’ reports payable | | | 11,627 | |
Custodian and accounting fee payable | | | 7,728 | |
Accrued expenses and other liabilities | | | 7,630 | |
Professional fees payable | | | 3,733 | |
Distribution fee payable | | | 1,538 | |
Affiliated transfer agent fee payable | | | 835 | |
Trustees’ fees payable | | | 827 | |
Due to broker—variation margin swaps | | | 35 | |
| | | | |
| |
Total Liabilities | | | 165,945 | |
| | | | |
| |
Net Assets | | $ | 23,877,139 | |
| | | | |
| |
| | | | | |
| |
Net assets were comprised of: | | | | |
Shares of beneficial interest, at par | | $ | 2,389 | |
Paid-in capital in excess of par | | | 28,802,049 | |
Total distributable earnings (loss) | | | (4,927,299 | ) |
| | | | |
| |
Net assets, July 31, 2024 | | $ | 23,877,139 | |
| | | | |
See Notes to Financial Statements.
92
PGIM Corporate Bond Fund
Statement of Assets & Liabilities (continued)
as of July 31, 2024
| | | | | | | | | | |
Class A | | | | | | | | | | |
Net asset value and redemption price per share, ($4,551,262 ÷ 454,453 shares of beneficial interest issued and outstanding) | | | $ | 10.01 | | | | | | |
Maximum sales charge (3.25% of offering price) | | | | 0.34 | | | | | | |
| | | | | | | | | | |
Maximum offering price to public | | | $ | 10.35 | | | | | | |
| | | | | | | | | | |
Class C | | | | | | | | | | |
Net asset value, offering price and redemption price per share, ($681,644 ÷ 68,232 shares of beneficial interest issued and outstanding) | | | $ | 9.99 | | | | | | |
| | | | | | | | | | |
Class R | | | | | | | | | | |
Net asset value, offering price and redemption price per share, ($12,008 ÷ 1,202 shares of beneficial interest issued and outstanding) | | | $ | 9.99 | | | | | | |
| | | | | | | | | | |
Class Z | | | | | | | | | | |
Net asset value, offering price and redemption price per share, ($9,573,546 ÷ 958,062 shares of beneficial interest issued and outstanding) | | | $ | 9.99 | | | | | | |
| | | | | | | | | | |
Class R6 | | | | | | | | | | |
Net asset value, offering price and redemption price per share, ($9,058,679 ÷ 906,870 shares of beneficial interest issued and outstanding) | | | $ | 9.99 | | | | | | |
| | | | | | | | | | |
See Notes to Financial Statements.
PGIM Corporate Bond Fund 93
PGIM Corporate Bond Fund
Statement of Operations
Year Ended July 31, 2024
| | | | |
Net Investment Income (Loss) | | | | |
Income | | | | |
Interest income | | $ | 998,161 | |
Affiliated dividend income | | | 9,986 | |
| | | | |
Total income | | | 1,008,147 | |
| | | | |
| |
Expenses | | | | |
Management fee | | | 108,951 | |
Distribution fee(a) | | | 18,698 | |
Registration fees(a) | | | 43,174 | |
Audit fee | | | 42,400 | |
Professional fees | | | 40,934 | |
Custodian and accounting fees | | | 32,540 | |
Shareholders’ reports | | | 26,287 | |
Transfer agent’s fees and expenses (including affiliated expense of $ 5,214)(a) | | | 18,859 | |
Fund data services | | | 17,826 | |
Trustees’ fees | | | 10,000 | |
Miscellaneous | | | 11,485 | |
| | | | |
Total expenses | | | 371,154 | |
Less: Fee waiver and/or expense reimbursement(a) | | | (216,923 | ) |
Distribution fee waiver(a) | | | (29 | ) |
| | | | |
Net expenses | | | 154,202 | |
| | | | |
Net investment income (loss) | | | 853,945 | |
| | | | |
Realized And Unrealized Gain (Loss) On Investment Transactions | | | | |
| |
Net realized gain (loss) on: | | | | |
Investment transactions | | | (661,422 | ) |
Futures transactions | | | (51,197 | ) |
Swap agreement transactions | | | 666 | |
| | | | |
| | | (711,953 | ) |
| | | | |
Net change in unrealized appreciation (depreciation) on: | | | | |
Investments | | | 1,439,409 | |
Futures | | | 50,880 | |
Swap agreements | | | (127 | ) |
| | | | |
| | | 1,490,162 | |
| | | | |
Net gain (loss) on investment transactions | | | 778,209 | |
| | | | |
Net Increase (Decrease) In Net Assets Resulting From Operations | | $ | 1,632,154 | |
| | | | |
See Notes to Financial Statements.
94
PGIM Corporate Bond Fund
Statement of Operations (continued)
Year Ended July 31, 2024
| (a) | Class specific expenses and waivers were as follows: |
| | | | | | | | | | | | | | | | | | | | | | | | | |
| | | Class A | | Class C | | Class R | | Class Z | | Class R6 |
Distribution fee | | | | 11,610 | | | | | 7,002 | | | | | 86 | | | | | — | | | | | — | |
Registration fees | | | | 10,731 | | | | | 6,792 | | | | | 5,542 | | | | | 13,617 | | | | | 6,492 | |
Transfer agent’s fees and expenses | | | | 6,102 | | | | | 1,185 | | | | | 45 | | | | | 11,309 | | | | | 218 | |
Fee waiver and/or expense reimbursement | | | | (46,554 | ) | | | | (12,458 | ) | | | | (5,657 | ) | | | | (89,406 | ) | | | | (62,848 | ) |
Distribution fee waiver | | | | — | | | | | — | | | | | (29 | ) | | | | — | | | | | — | |
See Notes to Financial Statements.
PGIM Corporate Bond Fund 95
PGIM Corporate Bond Fund
Statements of Changes in Net Assets
| | | | | | | | |
| |
| | | Year Ended July 31, | |
| | | | |
| | |
| | | 2024 | | | 2023 | |
| | |
Increase (Decrease) in Net Assets | | | | | | | | |
| | |
Operations | | | | | | | | |
Net investment income (loss) | | $ | 853,945 | | | $ | 932,568 | |
Net realized gain (loss) on investment transactions | | | (711,953 | ) | | | (1,671,423 | ) |
Net change in unrealized appreciation (depreciation) on investments | | | 1,490,162 | | | | 180,865 | |
| | | | | | | | |
| | |
Net increase (decrease) in net assets resulting from operations | | | 1,632,154 | | | | (557,990 | ) |
| | | | | | | | |
| | |
Dividends and Distributions | | | | | | | | |
Distributions from distributable earnings | | | | | | | | |
Class A | | | (167,622 | ) | | | (236,373 | ) |
Class C | | | (19,996 | ) | | | (24,332 | ) |
Class R | | | (383 | ) | | | (365 | ) |
Class Z | | | (389,470 | ) | | | (428,432 | ) |
Class R6 | | | (338,026 | ) | | | (384,705 | ) |
| | | | | | | | |
| | | (915,497 | ) | | | (1,074,207 | ) |
| | | | | | | | |
Fund share transactions (Net of share conversions) | | | | | | | | |
Net proceeds from shares sold | | | 2,640,628 | | | | 4,594,297 | |
Net asset value of shares issued in reinvestment of dividends and distributions | | | 710,943 | | | | 1,066,194 | |
Cost of shares purchased | | | (5,822,098 | ) | | | (14,051,216 | ) |
| | | | | | | | |
Net increase (decrease) in net assets from Fund share transactions | | | (2,470,527 | ) | | | (8,390,725 | ) |
| | | | | | | | |
Total increase (decrease) | | | (1,753,870 | ) | | | (10,022,922 | ) |
| | |
Net Assets: | | | | | | | | |
| | |
Beginning of year | | | 25,631,009 | | | | 35,653,931 | |
| | | | | | | | |
End of year | | $ | 23,877,139 | | | $ | 25,631,009 | |
| | | | | | | | |
See Notes to Financial Statements.
96
PGIM Corporate Bond Fund
Financial Highlights
| | | | | | | | | | | | | | | | | | | | |
| | | | | | |
Class A Shares | | | | | | | | | | | | | | | | | | | | |
| | | Year Ended July 31, | |
| | | | | | |
| | | 2024 | | | 2023 | | | 2022 | | | 2021 | | | 2020 | |
Per Share Operating Performance(a): | | | | | | | | | | | | | | | | | | | | |
Net Asset Value, Beginning of Year | | | $9.72 | | | | $10.18 | | | | $12.33 | | | | $12.34 | | | | $11.48 | |
Income (loss) from investment operations: | | | | | | | | | | | | | | | | | | | | |
Net investment income (loss) | | | 0.33 | | | | 0.30 | | | | 0.26 | | | | 0.26 | | | | 0.31 | |
| Net realized and unrealized gain (loss) on investment transactions | | | 0.31 | | | | (0.41 | ) | | | (1.88) | | | | 0.03 | | | | 0.89 | |
Total from investment operations | | | 0.64 | | | | (0.11 | ) | | | (1.62 | ) | | | 0.29 | | | | 1.20 | |
Less Dividends and Distributions: | | | | | | | | | | | | | | | | | | | | |
Dividends from net investment income | | | (0.35 | ) | | | (0.35 | ) | | | (0.30 | ) | | | (0.30 | ) | | | (0.34 | ) |
Distributions from net realized gains | | | - | | | | - | | | | (0.23 | ) | | | - | | | | - | |
Total dividends and distributions | | | (0.35 | ) | | | (0.35 | ) | | | (0.53 | ) | | | (0.30 | ) | | | (0.34 | ) |
Net asset value, end of year | | | $10.01 | | | | $9.72 | | | | $10.18 | | | | $12.33 | | | | $12.34 | |
Total Return(b): | | | 6.75 | % | | | (1.05 | )% | | | (13.55 | )% | | | 2.42 | % | | | 10.59 | % |
| | | | | | | | | | | | | | | | | | | | |
| | | | | | |
Ratios/Supplemental Data: | | | | | | | | | | | | | | | | | | | | |
Net assets, end of year (000) | | | $4,551 | | | | $5,077 | | | | $7,622 | | | | $6,980 | | | | $5,021 | |
Average net assets (000) | | | $4,644 | | | | $6,618 | | | | $7,559 | | | | $6,654 | | | | $3,260 | |
Ratios to average net assets(c): | | | | | | | | | | | | | | | | | | | | |
Expenses after waivers and/or expense reimbursement | | | 0.81 | %(d) | | | 0.80 | % | | | 0.80 | % | | | 0.80 | % | | | 0.80 | % |
Expenses before waivers and/or expense reimbursement | | | 1.81 | % | | | 1.56 | % | | | 1.38 | % | | | 1.37 | % | | | 1.89 | % |
Net investment income (loss) | | | 3.36 | % | | | 3.07 | % | | | 2.32 | % | | | 2.17 | % | | | 2.66 | % |
Portfolio turnover rate(e) | | | 17 | % | | | 19 | % | | | 26 | % | | | 61 | % | | | 50 | % |
| (a) | Calculated based on average shares outstanding during the year. |
| (b) | Total return does not consider the effects of sales loads. Total return is calculated assuming a purchase of a share on the first day and a sale on the last day of each year reported and includes reinvestment of dividends and distributions, if any. Total returns may reflect adjustments to conform to GAAP. |
| (c) | Does not include expenses of the underlying funds in which the Fund invests. |
| (d) | Includes certain non-recurring expenses of 0.01% which are being excluded from the Fund’s contractual waiver for the year ended July 31, 2024. |
| (e) | The Fund’s portfolio turnover rate is calculated in accordance with regulatory requirements, without regard to transactions involving short-term investments, certain derivatives and in-kind transactions (if any). If such transactions were included, the Fund’s portfolio turnover rate may be higher. |
See Notes to Financial Statements.
PGIM Corporate Bond Fund 97
PGIM Corporate Bond Fund
Financial Highlights (continued)
| | | | | | | | | | | | | | | | | | | | |
| | | | | | |
Class C Shares | | | | | | | | | | | | | | | | | | | | |
| | | Year Ended July 31, | |
| | | | | | |
| | | 2024 | | | 2023 | | | 2022 | | | 2021 | | | 2020 | |
Per Share Operating Performance(a): | | | | | | | | | | | | | | | | | | | | |
Net Asset Value, Beginning of Year | | | $9.69 | | | | $10.15 | | | | $12.30 | | | | $12.31 | | | | $11.45 | |
Income (loss) from investment operations: | | | | | | | | | | | | | | | | | | | | |
Net investment income (loss) | | | 0.25 | (b) | | | 0.22 | | | | 0.17 | | | | 0.17 | | | | 0.23 | |
| Net realized and unrealized gain (loss) on investment transactions | | | 0.33 | (c) | | | (0.41 | ) | | | (1.88) | | | | 0.03 | | | | 0.88 | |
Total from investment operations | | | 0.58 | | | | (0.19 | ) | | | (1.71 | ) | | | 0.20 | | | | 1.11 | |
Less Dividends and Distributions: | | | | | | | | | | | | | | | | | | | | |
Dividends from net investment income | | | (0.28 | ) | | | (0.27 | ) | | | (0.21 | ) | | | (0.21 | ) | | | (0.25 | ) |
Distributions from net realized gains | | | - | | | | - | | | | (0.23 | ) | | | - | | | | - | |
Total dividends and distributions | | | (0.28 | ) | | | (0.27 | ) | | | (0.44 | ) | | | (0.21 | ) | | | (0.25 | ) |
Net asset value, end of year | | | $9.99 | | | | $9.69 | | | | $10.15 | | | | $12.30 | | | | $12.31 | |
Total Return(d): | | | 6.08 | % | | | (1.80 | )% | | | (14.23 | )% | | | 1.66 | % | | | 9.79 | % |
| | | | | | | | | | | | | | | | | | | | |
| | | | | | |
Ratios/Supplemental Data: | | | | | | | | | | | | | | | | | | | | |
Net assets, end of year (000) | | | $682 | | | | $681 | | | | $945 | | | | $1,667 | | | | $1,783 | |
Average net assets (000) | | | $700 | | | | $865 | | | | $1,265 | | | | $1,741 | | | | $1,627 | |
Ratios to average net assets(e): | | | | | | | | | | | | | | | | | | | | |
Expenses after waivers and/or expense reimbursement | | | 1.56 | %(f) | | | 1.55 | % | | | 1.55 | % | | | 1.55 | % | | | 1.55 | % |
Expenses before waivers and/or expense reimbursement | | | 3.34 | % | | | 2.94 | % | | | 2.82 | % | | | 2.45 | % | | | 3.03 | % |
Net investment income (loss) | | | 2.60 | % | | | 2.32 | % | | | 1.51 | % | | | 1.43 | % | | | 1.92 | % |
Portfolio turnover rate(g) | | | 17 | % | | | 19 | % | | | 26 | % | | | 61 | % | | | 50 | % |
| (a) | Calculated based on average shares outstanding during the year. |
| (b) | The per share amount of net investment income (loss) does not directly correlate to the amounts reported in the Statement of Operations due to class specific expenses. |
| (c) | The per share amount of realized and unrealized gain (loss) on investments does not directly correlate to the amounts reported in the Statement of Operations due to the timing of portfolio share transactions in relation to fluctuating market values. |
| (d) | Total return does not consider the effects of sales loads. Total return is calculated assuming a purchase of a share on the first day and a sale on the last day of each year reported and includes reinvestment of dividends and distributions, if any. Total returns may reflect adjustments to conform to GAAP. |
| (e) | Does not include expenses of the underlying funds in which the Fund invests. |
| (f) | Includes certain non-recurring expenses of 0.01% which are being excluded from the Fund’s contractual waiver for the year ended July 31, 2024. |
| (g) | The Fund’s portfolio turnover rate is calculated in accordance with regulatory requirements, without regard to transactions involving short-term investments, certain derivatives and in-kind transactions (if any). If such transactions were included, the Fund’s portfolio turnover rate may be higher. |
See Notes to Financial Statements.
98
PGIM Corporate Bond Fund
Financial Highlights (continued)
| | | | | | | | | | | | | | | | | | | | |
| | | | | | |
Class R Shares | | | | | | | | | | | | | | | | | | | | |
| | | Year Ended July 31, | |
| | | | | | |
| | | 2024 | | | 2023 | | | 2022 | | | 2021 | | | 2020 | |
Per Share Operating Performance(a): | | | | | | | | | | | | | | | | | | | | |
Net Asset Value, Beginning of Year | | | $9.69 | | | | $10.15 | | | | $12.30 | | | | $12.31 | | | | $11.45 | |
Income (loss) from investment operations: | | | | | | | | | | | | | | | | | | | | |
Net investment income (loss) | | | 0.30 | (b) | | | 0.27 | | | | 0.23 | | | | 0.23 | | | | 0.29 | |
| Net realized and unrealized gain (loss) on investment transactions | | | 0.32 | (c) | | | (0.41 | ) | | | (1.88) | | | | 0.03 | | | | 0.87 | |
Total from investment operations | | | 0.62 | | | | (0.14 | ) | | | (1.65 | ) | | | 0.26 | | | | 1.16 | |
Less Dividends and Distributions: | | | | | | | | | | | | | | | | | | | | |
Dividends from net investment income | | | (0.32 | ) | | | (0.32 | ) | | | (0.27 | ) | | | (0.27 | ) | | | (0.30 | ) |
Distributions from net realized gains | | | - | | | | - | | | | (0.23 | ) | | | - | | | | - | |
Total dividends and distributions | | | (0.32 | ) | | | (0.32 | ) | | | (0.50 | ) | | | (0.27 | ) | | | (0.30 | ) |
Net asset value, end of year | | | $9.99 | | | | $9.69 | | | | $10.15 | | | | $12.30 | | | | $12.31 | |
Total Return(d): | | | 6.60 | % | | | (1.31 | )% | | | (13.80 | )% | | | 2.17 | % | | | 10.34 | % |
| | | | | | | | | | | | | | | | | | | | |
| | | | | | |
Ratios/Supplemental Data: | | | | | | | | | | | | | | | | | | | | |
Net assets, end of year (000) | | | $12 | | | | $11 | | | | $11 | | | | $13 | | | | $13 | |
Average net assets (000) | | | $11 | | | | $11 | | | | $12 | | | | $13 | | | | $19 | |
Ratios to average net assets(e): | | | | | | | | | | | | | | | | | | | | |
Expenses after waivers and/or expense reimbursement | | | 1.06 | %(f) | | | 1.05 | % | | | 1.05 | % | | | 1.05 | % | | | 1.05 | % |
Expenses before waivers and/or expense reimbursement | | | 50.80 | % | | | 46.23 | % | | | 45.50 | % | | | 67.05 | % | | | 81.14 | % |
Net investment income (loss) | | | 3.10 | % | | | 2.82 | % | | | 2.04 | % | | | 1.93 | % | | | 2.45 | % |
Portfolio turnover rate(g) | | | 17 | % | | | 19 | % | | | 26 | % | | | 61 | % | | | 50 | % |
| (a) | Calculated based on average shares outstanding during the year. |
| (b) | The per share amount of net investment income (loss) does not directly correlate to the amounts reported in the Statement of Operations due to class specific expenses. |
| (c) | The per share amount of realized and unrealized gain (loss) on investments does not directly correlate to the amounts reported in the Statement of Operations due to the timing of portfolio share transactions in relation to fluctuating market values. |
| (d) | Total return is calculated assuming a purchase of a share on the first day and a sale on the last day of each year reported and includes reinvestment of dividends and distributions, if any. Total returns may reflect adjustments to conform to GAAP. |
| (e) | Does not include expenses of the underlying funds in which the Fund invests. |
| (f) | Includes certain non-recurring expenses of 0.01% which are being excluded from the Fund’s contractual waiver for the year ended July 31, 2024. |
| (g) | The Fund’s portfolio turnover rate is calculated in accordance with regulatory requirements, without regard to transactions involving short-term investments, certain derivatives and in-kind transactions (if any). If such transactions were included, the Fund’s portfolio turnover rate may be higher. |
See Notes to Financial Statements.
PGIM Corporate Bond Fund 99
PGIM Corporate Bond Fund
Financial Highlights (continued)
| | | | | | | | | | | | | | | | | | | | |
| | | | | | |
Class Z Shares | | | | | | | | | | | | | | | | | | | | |
| | | Year Ended July 31, | |
| | | | | | |
| | | 2024 | | | 2023 | | | 2022 | | | 2021 | | | 2020 | |
Per Share Operating Performance(a): | | | | | | | | | | | | | | | | | | | | |
Net Asset Value, Beginning of Year | | | $9.69 | | | | $10.16 | | | | $12.30 | | | | $12.31 | | | | $11.45 | |
Income (loss) from investment operations: | | | | | | | | | | | | | | | | | | | | |
Net investment income (loss) | | | 0.35 | | | | 0.32 | | | | 0.28 | | | | 0.29 | | | | 0.34 | |
| Net realized and unrealized gain (loss) on investment transactions | | | 0.32 | | | | (0.42 | ) | | | (1.87) | | | | 0.03 | | | | 0.88 | |
Total from investment operations | | | 0.67 | | | | (0.10 | ) | | | (1.59 | ) | | | 0.32 | | | | 1.22 | |
Less Dividends and Distributions: | | | | | | | | | | | | | | | | | | | | |
Dividends from net investment income | | | (0.37 | ) | | | (0.37 | ) | | | (0.32 | ) | | | (0.33 | ) | | | (0.36 | ) |
Distributions from net realized gains | | | - | | | | - | | | | (0.23 | ) | | | - | | | | - | |
Total dividends and distributions | | | (0.37 | ) | | | (0.37 | ) | | | (0.55 | ) | | | (0.33 | ) | | | (0.36 | ) |
Net asset value, end of year | | | $9.99 | | | | $9.69 | | | | $10.16 | | | | $12.30 | | | | $12.31 | |
Total Return(b): | | | 7.14 | % | | | (0.91 | )% | | | (13.29 | )% | | | 2.68 | % | | | 10.89 | % |
| | | | | | | | | | | | | | | | | | | | |
| | | | | | |
Ratios/Supplemental Data: | | | | | | | | | | | | | | | | | | | | |
Net assets, end of year (000) | | | $9,574 | | | | $11,184 | | | | $14,150 | | | | $18,965 | | | | $26,655 | |
Average net assets (000) | | | $10,091 | | | | $11,280 | | | | $16,421 | | | | $24,059 | | | | $21,000 | |
Ratios to average net assets(c): | | | | | | | | | | | | | | | | | | | | |
Expenses after waivers and/or expense reimbursement | | | 0.56 | %(d) | | | 0.55 | % | | | 0.55 | % | | | 0.55 | % | | | 0.55 | % |
Expenses before waivers and/or expense reimbursement | | | 1.45 | % | | | 1.31 | % | | | 1.02 | % | | | 1.02 | % | | | 1.18 | % |
Net investment income (loss) | | | 3.61 | % | | | 3.32 | % | | | 2.50 | % | | | 2.43 | % | | | 2.91 | % |
Portfolio turnover rate(e) | | | 17 | % | | | 19 | % | | | 26 | % | | | 61 | % | | | 50 | % |
| (a) | Calculated based on average shares outstanding during the year. |
| (b) | Total return is calculated assuming a purchase of a share on the first day and a sale on the last day of each year reported and includes reinvestment of dividends and distributions, if any. Total returns may reflect adjustments to conform to GAAP. |
| (c) | Does not include expenses of the underlying funds in which the Fund invests. |
| (d) | Includes certain non-recurring expenses of 0.01% which are being excluded from the Fund’s contractual waiver for the year ended July 31, 2024. |
| (e) | The Fund’s portfolio turnover rate is calculated in accordance with regulatory requirements, without regard to transactions involving short-term investments, certain derivatives and in-kind transactions (if any). If such transactions were included, the Fund’s portfolio turnover rate may be higher. |
See Notes to Financial Statements.
100
PGIM Corporate Bond Fund
Financial Highlights (continued)
| | | | | | | | | | | | | | | | | | | | |
| | | | | | |
Class R6 Shares | | | | | | | | | | | | | | | | | | | | |
| | | Year Ended July 31, | |
| | | | | | |
| | | 2024 | | | 2023 | | | 2022 | | | 2021 | | | 2020 | |
Per Share Operating Performance(a): | | | | | | | | | | | | | | | | | | | | |
Net Asset Value, Beginning of Year | | | $9.69 | | | | $10.15 | | | | $12.30 | | | | $12.31 | | | | $11.45 | |
Income (loss) from investment operations: | | | | | | | | | | | | | | | | | | | | |
Net investment income (loss) | | | 0.35 | | | | 0.32 | | | | 0.28 | | | | 0.29 | | | | 0.34 | |
| Net realized and unrealized gain (loss) on investment transactions | | | 0.32 | | | | (0.41 | ) | | | (1.88) | | | | 0.03 | | | | 0.88 | |
Total from investment operations | | | 0.67 | | | | (0.09 | ) | | | (1.60 | ) | | | 0.32 | | | | 1.22 | |
Less Dividends and Distributions: | | | | | | | | | | | | | | | | | | | | |
Dividends from net investment income | | | (0.37 | ) | | | (0.37 | ) | | | (0.32 | ) | | | (0.33 | ) | | | (0.36 | ) |
Distributions from net realized gains | | | - | | | | - | | | | (0.23 | ) | | | - | | | | - | |
Total dividends and distributions | | | (0.37 | ) | | | (0.37 | ) | | | (0.55 | ) | | | (0.33 | ) | | | (0.36 | ) |
Net asset value, end of year | | | $9.99 | | | | $9.69 | | | | $10.15 | | | | $12.30 | | | | $12.31 | |
Total Return(b): | | | 7.14 | % | | | (0.81 | )% | | | (13.37 | )% | | | 2.68 | % | | | 10.89 | % |
| | | | | | | | | | | | | | | | | | | | |
| | | | | | |
Ratios/Supplemental Data: | | | | | | | | | | | | | | | | | | | | |
Net assets, end of year (000) | | | $9,059 | | | | $8,678 | | | | $12,925 | | | | $15,567 | | | | $9,730 | |
Average net assets (000) | | | $8,765 | | | | $10,103 | | | | $14,287 | | | | $10,732 | | | | $9,091 | |
Ratios to average net assets(c): | | | | | | | | | | | | | | | | | | | | |
Expenses after waivers and/or expense reimbursement | | | 0.56 | %(d) | | | 0.55 | % | | | 0.55 | % | | | 0.55 | % | | | 0.55 | % |
Expenses before waivers and/or expense reimbursement | | | 1.28 | % | | | 1.13 | % | | | 0.90 | % | | | 0.91 | % | | | 1.17 | % |
Net investment income (loss) | | | 3.60 | % | | | 3.31 | % | | | 2.53 | % | | | 2.42 | % | | | 2.93 | % |
Portfolio turnover rate(e) | | | 17 | % | | | 19 | % | | | 26 | % | | | 61 | % | | | 50 | % |
| (a) | Calculated based on average shares outstanding during the year. |
| (b) | Total return is calculated assuming a purchase of a share on the first day and a sale on the last day of each year reported and includes reinvestment of dividends and distributions, if any. Total returns may reflect adjustments to conform to GAAP. |
| (c) | Does not include expenses of the underlying funds in which the Fund invests. |
| (d) | Includes certain non-recurring expenses of 0.01% which are being excluded from the Fund’s contractual waiver for the year ended July 31, 2024. |
| (e) | The Fund’s portfolio turnover rate is calculated in accordance with regulatory requirements, without regard to transactions involving short-term investments, certain derivatives and in-kind transactions (if any). If such transactions were included, the Fund’s portfolio turnover rate may be higher. |
See Notes to Financial Statements.
PGIM Corporate Bond Fund 101
Notes to Financial Statements
The Target Portfolio Trust (the “Registered Investment Company” or “RIC”) is registered under the Investment Company Act of 1940, as amended (“1940 Act”), as an open-end management investment company. The RIC is organized as a Delaware Statutory Trust. These financial statements relate to the following series of the RIC: PGIM Core Bond Fund and PGIM Corporate Bond Fund (each, a “Fund” and collectively, the “Funds”). The Funds are classified as diversified funds for purposes of the 1940 Act.
The Funds have the following investment objectives:
| | | | |
| | | |
Fund | | | | Investment Objective(s) |
PGIM Core Bond Fund | | | | Total return |
(“Core Bond”) | | | | |
PGIM Corporate Bond Fund (“Corporate Bond”) | | | | High current income consistent with the preservation of principal |
The Funds follow the investment company accounting and reporting guidance of the Financial Accounting Standards Board (“FASB”) Accounting Standard Codification (“ASC”) Topic 946 Financial Services — Investment Companies. The following is a summary of significant accounting policies followed by the Funds in the preparation of their financial statements. The policies conform to U.S. generally accepted accounting principles (“GAAP”). The Funds consistently follow such policies in the preparation of their financial statements.
Securities Valuation: The Funds’ hold securities and other assets and liabilities that are fair valued as of the close of each day (generally, 4:00 PM Eastern time) the New York Stock Exchange (“NYSE”) is open for trading. As described in further detail below, the Funds’ investments are valued daily based on a number of factors, including the type of investment and whether market quotations are readily available. The RIC’s Board of Trustees (the “Board”) has approved the Funds’ valuation policies and procedures for security valuation and designated PGIM Investments LLC (“PGIM Investments” or the “Manager”) as the “Valuation Designee,” as defined by Rule 2a-5(b) under the 1940 Act, to perform the fair value determination relating to all Funds’ investments. Pursuant to the Board’s oversight, the Valuation Designee has established a Valuation Committee to perform the duties and responsibilities of the Valuation Designee under Rule 2a-5. The valuation procedures permit the Funds’ to utilize independent pricing vendor services, quotations from market makers, and alternative valuation methods when market quotations are either not readily available or not deemed representative of fair value. Fair value is the estimated price that would be
102
received to sell an asset or paid to transfer a liability in an orderly transaction between market participants on the measurement date.
For the fiscal reporting year-end, securities and other assets and liabilities were fair valued at the close of the last U.S. business day. Trading in certain foreign securities may occur when the NYSE is closed (including weekends and holidays). Because such foreign securities trade in markets that are open on weekends and U.S. holidays, the values of some of the Funds’ foreign investments may change on days when investors cannot purchase or redeem Funds’ shares.
Various inputs determine how each Funds’ investments are valued, all of which are categorized according to the three broad levels (Level 1, 2, or 3) detailed in the Schedule of Investments and referred to herein as the “fair value hierarchy” in accordance with FASB ASC Topic 820 Fair Value Measurement.
Common or preferred stocks, exchange-traded funds (“ETFs”) and derivative instruments, if applicable, that are traded on a national securities exchange are valued at the last sale price as of the close of trading on the applicable exchange where the security principally trades. Securities traded via NASDAQ are valued at the NASDAQ official closing price. To the extent these securities are valued at the last sale price or NASDAQ official closing price, they are classified as Level 1 in the fair value hierarchy. In the event that no sale or official closing price on a valuation date exists, these securities are generally valued at the mean between the last reported bid and ask prices, or at the last bid price in the absence of an ask price. These securities are classified as Level 2 in the fair value hierarchy.
Investments in open-end funds (other than ETFs) are valued at their net asset values as of the close of the NYSE on the date of valuation. These securities are classified as Level 1 in the fair value hierarchy since they may be purchased or sold at their net asset values on the date of valuation.
Fixed income securities traded in the OTC market are generally classified as Level 2 in the fair value hierarchy. Such fixed income securities are typically valued using the market approach which generally involves obtaining data from an approved independent third-party vendor source. The Funds utilize the market approach as the primary method to value securities when market prices of identical or comparable instruments are available. The third-party vendors’ valuation techniques used to derive the evaluated bid price are based on evaluating observable inputs, including but not limited to, yield curves, yield spreads, credit ratings, deal terms, tranche level attributes, default rates, cash flows, prepayment speeds, broker/dealer quotations and reported trades. Certain Level 3 securities are also valued using the market approach when obtaining a single broker quote or when utilizing transaction prices for identical securities that have been used in excess of five business days. During the reporting period, there were no changes to report with respect to the valuation approach and/or valuation techniques discussed above.
103
Notes to Financial Statements (continued)
Securities and other assets that cannot be priced according to the methods described above are valued based on policies and procedures approved by the Board. In the event that unobservable inputs are used when determining such valuations, the securities will be classified as Level 3 in the fair value hierarchy. Altering one or more unobservable inputs may result in a significant change to a Level 3 security’s fair value measurement.
When determining the fair value of securities, some of the factors influencing the valuation include: the nature of any restrictions on disposition of the securities; assessment of the general liquidity of the securities; the issuer’s financial condition and the markets in which it does business; the cost of the investment; the size of the holding and the capitalization of the issuer; the prices of any recent transactions or bids/offers for such securities or any comparable securities; and any available analyst media or other reports or information deemed reliable by the Valuation Designee regarding the issuer or the markets or industry in which it operates. Using fair value to price securities may result in a value that is different from a security’s most recent closing price and from the price used by other unaffiliated mutual funds to calculate their net asset values.
Foreign Currency Translation: The books and records of the Funds are maintained in U.S. dollars. Foreign currency amounts are translated into U.S. dollars on the following basis:
(i) market value of investment securities, other assets and liabilities — at the exchange rate as of the valuation date;
(ii) purchases and sales of investment securities, income and expenses — at the rates of exchange prevailing on the respective dates of such transactions.
Although the net assets of the Funds are presented at the foreign exchange rates and market values at the close of the period, the Funds do not generally isolate that portion of the results of operations arising as a result of changes in the foreign exchange rates from the fluctuations arising from changes in the market prices of long-term portfolio securities held at the end of the period. Similarly, the Funds do not isolate the effect of changes in foreign exchange rates from the fluctuations arising from changes in the market prices of long-term portfolio securities sold during the period. Accordingly, holding period unrealized and realized foreign currency gains (losses) are included in the reported net change in unrealized appreciation (depreciation) on investments and net realized gains (losses) on investment transactions on the Statements of Operations. Notwithstanding the above, the Funds do isolate the effect of fluctuations in foreign currency exchange rates when determining the gain (loss) upon the sale or maturity of foreign currency denominated debt obligations; such amounts are included in net realized gains (losses) on foreign currency transactions.
104
Additionally, net realized gains (losses) on foreign currency transactions represent net foreign exchange gains (losses) from the disposition of holdings of foreign currencies, currency gains (losses) realized between the trade and settlement dates on investment transactions, and the difference between the amounts of interest, dividends and foreign withholding taxes recorded on the Funds’ books and the U.S. dollar equivalent amounts actually received or paid. Net unrealized currency gains (losses) arise from valuing foreign currency denominated assets and liabilities (other than investments) at period end exchange rates.
Options: The Funds may purchase and/or write options in order to hedge against adverse market movements or fluctuations in value caused by changes in prevailing interest rates, value of equities or foreign currency exchange rates with respect to securities or financial instruments which the Funds currently own or intend to purchase. The Funds may also use options to gain additional market exposure. The Funds’ principal reason for writing options is to realize, through receipt of premiums, a greater current return than would be realized on the underlying security alone. When the Funds purchase an option, they pay a premium and an amount equal to that premium is recorded as an asset. When the Funds write an option, they receive a premium and an amount equal to that premium is recorded as a liability. The asset or liability is adjusted daily to reflect the current market value of the option. If an option expires unexercised, the Funds realize a gain (loss) to the extent of the premium received or paid. If an option is exercised, the premium received or paid is recorded as an adjustment to the proceeds from the sale or the cost of the purchase in determining whether the Funds have realized a gain (loss). The difference between the premium and the amount received or paid at the closing of a purchase or sale transaction is also treated as a realized gain (loss). Gain (loss) on purchased options is included in net realized gain (loss) on investment transactions. Gain (loss) on written options is presented separately as net realized gain (loss) on options written transactions.
The Funds, as writer of an option, may have no control over whether the underlying securities or financial instruments may be sold (called) or purchased (put). As a result, the Funds bear the market risk of an unfavorable change in the price of the security or financial instrument underlying the written option. The Funds, as purchaser of an OTC option, bear the risk of the potential inability of the counterparties to meet the terms of their contracts. With exchange-traded options contracts, there is minimal counterparty credit risk to the Funds since the exchanges’ clearinghouse acts as counterparty to all exchange-traded options and guarantees the options contracts against default.
When the Funds write an option on a swap, an amount equal to any premium received by the Funds is recorded as a liability and is subsequently adjusted to the current market value of the written option on the swap. If a call option on a swap is exercised, the Funds become obligated to pay a fixed interest rate (noted as the strike price) and receive a variable interest rate on a notional amount. If a put option on a swap is exercised, the Funds become obligated to pay a variable interest rate and receive a fixed interest rate (noted as the strike price) on a notional amount. Premiums received from writing options on swaps that expire or are exercised are treated as realized gains upon the expiration or exercise of such options on
105
Notes to Financial Statements (continued)
swaps. The risk associated with writing put and call options on swaps is that the Funds will be obligated to be party to a swap agreement if an option on a swap is exercised.
Financial Futures Contracts: A financial futures contract is an agreement to purchase (long) or sell (short) an agreed amount of securities at a set price for delivery on a future date. Upon entering into a financial futures contract, the Funds are required to pledge to the broker an amount of cash and/or other assets equal to a certain percentage of the contract amount. This amount is known as the “initial margin.” Subsequent payments, known as “variation margin,” are made or received by the Funds each day, depending on the daily fluctuations in the value of the underlying security. Such variation margin is recorded for financial statement purposes on a daily basis as unrealized gain (loss). When the contract expires or is closed, the gain (loss) is realized and is presented in the Statement of Operations as net realized gain (loss) on futures transactions.
The Funds invested in financial futures contracts in order to hedge their existing portfolio securities, or securities the Funds intend to purchase, against fluctuations in value caused by changes in prevailing interest rates. Should interest rates move unexpectedly, the Funds may not achieve the anticipated benefits of the financial futures contracts and may realize a loss. The use of futures transactions involves the risk of imperfect correlation in movements in the price of futures contracts, interest rates and the underlying hedged assets. Since futures contracts are exchange-traded, there is minimal counterparty credit risk to the Funds since the exchanges’ clearinghouse acts as counterparty to all exchange-traded futures and guarantees the futures contracts against default.
Swap Agreements: The Funds may enter into certain types of swap agreements detailed in the disclosures below. A swap agreement is an agreement to exchange the return generated by one instrument for the return generated by another instrument. Swap agreements are negotiated in the OTC market and may be executed either directly with a counterparty (“OTC-traded”) or through a central clearing facility, such as a registered exchange. Swap agreements are valued daily at current market value and any change in value is included in the net unrealized appreciation or depreciation on swap agreements. Centrally cleared swaps pay or receive an amount known as “variation margin”, based on daily changes in the valuation of the swap contract. For OTC-traded, upfront premiums paid and received are shown as swap premiums paid and swap premiums received in the Statement of Assets and Liabilities. Risk of loss may exceed amounts recognized on the Statement of Assets and Liabilities. Swap agreements outstanding at period end, if any, are listed on the Schedule of Investments.
Interest Rate Swaps: Interest rate swaps represent an agreement between counterparties to exchange cash flows based on the difference between two interest rates, applied to a notional principal amount for a specified period. The Funds are subject to interest rate risk
106
exposure in the normal course of pursuing their investment objective. The Funds used interest rate swaps to maintain their ability to generate steady cash flow by receiving a stream of fixed rate payments or to increase exposure to prevailing market rates by receiving floating rate payments. The Funds’ maximum risk of loss from counterparty credit risk is the discounted net present value of the cash flows to be received from the counterparty over the contract’s remaining life.
Credit Default Swaps (“CDS”): CDS involve one party (the protection buyer) making a stream of payments to another party (the protection seller) in exchange for the right to receive a specified payment in the event of a default or as a result of a default (collectively a “credit event”) for the referenced entity (typically corporate issues or sovereign issues of an emerging country) on its obligation; or in the event of a write-down, principal shortfall, interest shortfall or default of all or part of the referenced entities comprising a credit index.
The Funds are subject to credit risk in the normal course of pursuing their investment objectives, and as such, have entered into CDS contracts to provide a measure of protection against defaults or to take an active long or short position with respect to the likelihood of a particular issuer’s default or the reference entity’s credit soundness. CDS contracts generally trade based on a spread which represents the cost a protection buyer has to pay the protection seller. The protection buyer is said to be “short the credit” because the higher the contract value rises, the more the credit deteriorates. The value of the CDS contract increases for the protection buyer if the spread increases. The Funds’ maximum risk of loss from counterparty credit risk for purchased CDS is the inability of the counterparty to honor the contract up to the notional value due to a credit event.
As a seller of protection on credit default swap agreements, the Funds generally receive an agreed upon payment from the buyer of protection throughout the term of the swap, provided no credit event occurs. As the seller, the Funds effectively increase their investment risk because, in addition to their total net assets, the Funds may be subject to investment exposure on the notional amount of the swap.
The maximum amount of the payment that the Funds, as a seller of protection, could be required to make under a credit default swap agreement would be equal to the notional amount of the underlying security or index contract as a result of a credit event. This potential amount will be partially offset by any recovery values of the respective referenced obligations or net amounts received from the settlement of buy protection credit default swap agreements which the Funds entered into for the same referenced entity or index. As a buyer of protection, the Funds generally receive an amount up to the notional value of the swap if a credit event occurs.
Implied credit spreads, represented in absolute terms, utilized in determining the market value of credit default swap agreements where the Funds are the seller of protection as of period end are disclosed in the footnotes to the Schedule of Investments, if applicable. These spreads serve as indicators of the current status of the payment/performance risk and represent the likelihood of default risk for the credit derivative. The implied credit spread of a
107
Notes to Financial Statements (continued)
particular referenced entity reflects the cost of buying/selling protection and may include upfront payments required to enter into the agreement. Wider credit spreads and increased market value in absolute terms, when compared to the notional amount of the swap, represent a deterioration of the referenced entity’s credit soundness and a greater likelihood of risk of default or other credit event occurring as defined under the terms of the agreement.
Total Return Swaps: In a total return swap, one party receives payments based on the market value of the security or the commodity involved, or total return of a specific referenced asset, such as an equity, index or bond, and in return pays a defined amount. The Funds are subject to risk exposures associated with the referenced asset in the normal course of pursuing their investment objectives. The Funds may enter into total return swaps to manage their exposure to a security or an index. The Funds’ maximum risk of loss from counterparty credit risk is the change in the value of the security, in the Funds’ favor, from the point of entering into the contract.
Mortgage-Backed and Asset-Backed Securities: Mortgage-backed securities are pass-through securities, meaning that principal and interest payments made by the borrower on the underlying mortgages are passed through to the Funds. Asset-backed securities directly or indirectly represent a participation interest in, or are secured by and payable from, a stream of payments generated by particular assets such as motor vehicle or credit card receivables. Asset-backed securities may be classified as pass-through certificates or collateralized obligations, such as collateralized bond obligations, collateralized loan obligations and other similarly structured securities. The value of mortgage-backed and asset-backed securities varies with changes in interest rates and may be affected by changes in credit quality or value of the mortgage loans or other assets that support the securities.
Stripped mortgage-backed securities are usually structured with two classes that receive different proportions of the interest (“IO”) and principal (“PO”) distributions on a pool of mortgage assets. Payments received for IOs are included in interest income on the Statements of Operations. Because no principal will be received at the maturity of an IO, adjustments are made to the cost of the security on a monthly basis until maturity. These adjustments are included in interest income on the Statements of Operations. Payments received for POs are treated as reductions to the cost and par value of the securities.
Master Netting Arrangements: The RIC, on behalf of each Fund, is subject to various Master Agreements, or netting arrangements, with select counterparties. These are agreements which a subadviser may have negotiated and entered into on behalf of all or a portion of each Fund. A master netting arrangement between each Fund and the counterparty permits the Fund to offset amounts payable by the Fund to the same counterparty against amounts
108
to be received and by the receipt of collateral from the counterparty by each Fund to cover the Fund’s exposure to the counterparty. However, there is no assurance that such mitigating factors are easily enforceable. In addition to master netting arrangements, the right to set-off exists when all the conditions are met such that each of the parties owes the other determinable amounts, the reporting party has the right to set-off the amount owed with the amount owed by the other party, the reporting party intends to set-off and the right of set-off is enforceable by law.
The RIC, on behalf of each Fund, is a party to International Swaps and Derivatives Association, Inc. (“ISDA”) Master Agreements with certain counterparties that govern OTC derivative and foreign exchange contracts entered into from time to time. The Master Agreements may contain provisions regarding, among other things, the parties’ general obligations, representations, agreements, collateral requirements, events of default and early termination. With respect to certain counterparties, in accordance with the terms of the Master Agreements, collateral posted to each Fund is held in a segregated account by the Fund’s custodian and with respect to those amounts which can be sold or re-pledged, is presented in the Schedule of Investments. Collateral pledged by each Fund is segregated by the Fund’s custodian and identified in the Schedule of Investments. Collateral can be in the form of cash or debt securities issued by the U.S. Government or related agencies or other securities as agreed to by the Fund and the applicable counterparty. Collateral requirements are determined based on the Fund’s net position with each counterparty. Termination events applicable to each Fund may occur upon a decline in the Fund’s net assets below a specified threshold over a certain period of time. Termination events applicable to counterparties may occur upon a decline in the counterparty’s long-term and short-term credit ratings below a specified level. In each case, upon occurrence, the other party may elect to terminate early and cause settlement of all derivative and foreign exchange contracts outstanding, including the payment of any losses and costs resulting from such early termination, as reasonably determined by the terminating party. Any decision by one or more of the Fund’s counterparties to elect early termination could impact the Fund’s future derivative activity.
In addition to each instrument’s primary underlying risk exposure (e.g. interest rate, credit, equity or foreign exchange, etc.), swap agreements involve, to varying degrees, elements of credit, market and documentation risk. Such risks involve the possibility that no liquid market for these agreements will exist, the counterparty to the agreement may default on its obligation to perform or disagree on the contractual terms of the agreement, and changes in net interest rates will be unfavorable. In connection with these agreements, securities in the portfolio may be identified or received as collateral from the counterparty in accordance with the terms of the respective swap agreements to provide or receive assets of value and to serve as recourse in the event of default or bankruptcy/insolvency of either party. Such OTC derivative agreements include conditions which, when materialized, give the counterparty the right to cause an early termination of the transactions under those agreements. Any election by the counterparty for early termination of the contract(s) may impact the amounts reported on financial statements.
109
Notes to Financial Statements (continued)
Short sales and OTC contracts, including forward foreign currency exchange contracts, swaps, forward rate agreements and written options involve elements of both market and credit risk in excess of the amounts reflected on the Statement of Assets and Liabilities, if applicable. Such risks may be mitigated by engaging in master netting arrangements.
Delayed-Delivery Transactions: The Funds may purchase or sell securities on a when-issued or delayed-delivery and forward commitment basis, including TBA securities. These transactions involve a commitment by the Funds to purchase or sell securities for a predetermined price or yield, with payment and delivery taking place beyond the customary settlement period. When delayed-delivery purchases are outstanding, the Funds will set aside and maintain an amount of liquid assets sufficient to meet the purchase price in a segregated account until the settlement date. When purchasing a security on a delayed-delivery basis, the Funds assume the rights and risks of ownership of the security, including the risk of price and yield fluctuations, and takes such fluctuations into account when determining its net asset value. The Funds may dispose of or renegotiate a delayed-delivery transaction subsequent to establishment, and may sell when-issued securities before they are delivered, which may result in a realized gain (loss). When selling a security on a delayed-delivery basis, the Funds forfeit their eligibility to realize future gains (losses) with respect to the security.
Securities Lending: The Funds may lend their portfolio securities to banks and broker-dealers. The loans are secured by collateral at least equal to the market value of the securities loaned. Collateral pledged by each borrower is invested in an affiliated money market fund and is marked to market daily, based on the previous day’s market value, such that the value of the collateral exceeds the value of the loaned securities. In the event of significant appreciation in value of the securities on loan on the last business day of the reporting period, the financial statements may reflect a collateral value that is less than the market value of the loaned securities. Such shortfall is remedied as described above. Loans are subject to termination at the option of the borrower or the Funds. Upon termination of the loan, the borrower will return to the Funds securities identical to the loaned securities. The remaining open loans of the securities lending transactions are considered overnight and continuous. Should the borrower of the securities fail financially, the Funds have the right to repurchase the securities in the open market using the collateral.
The Funds recognize income, net of any rebate and securities lending agent fees, for lending their securities in the form of fees or interest on the investment of any cash received as collateral. The borrower receives all interest and dividends from the securities loaned and such payments are passed back to the lender in amounts equivalent thereto, which are reflected in interest income or unaffiliated dividend income based on the nature of the payment on the Statement of Operations. The Funds also continue to recognize any unrealized gain (loss) in the market price of the securities loaned and on the change in the
110
value of the collateral invested that may occur during the term of the loan. In addition, realized gain (loss) is recognized on changes in the value of the collateral invested upon liquidation of the collateral. Net earnings from securities lending are disclosed in the Statement of Operations.
Equity and Mortgage Real Estate Investment Trusts (collectively “REITs”): The Funds invested in REITs, which report information on the source of their distributions annually. Based on current and historical information, a portion of distributions received from REITs during the period is estimated to be dividend income, capital gain or return of capital and recorded accordingly. When material, these estimates are adjusted periodically when the actual source of distributions is disclosed by the REITs.
Securities Transactions and Net Investment Income: Securities transactions are recorded on the trade date. Realized gains (losses) from investment and currency transactions are calculated on the specific identification method. Dividend income is recorded on the ex-date, or for certain foreign securities, when the Funds become aware of such dividends. Interest income, including amortization of premium and accretion of discount on debt securities, as required, is recorded on the accrual basis. Expenses are recorded on an accrual basis, which may require the use of certain estimates by management that may differ from actual expense amounts. Net investment income or loss (other than class specific expenses and waivers, which are allocated as noted below) and unrealized and realized gains (losses) are allocated daily to each class of shares based upon the relative proportion of adjusted net assets of each class at the beginning of the day. Class specific expenses and waivers, where applicable, are charged to the respective share classes. Such class specific expenses and waivers include distribution fees and distribution fee waivers, shareholder servicing fees, transfer agent’s fees and expenses, registration fees and fee waivers and/or expense reimbursements, as applicable.
Taxes: It is the Funds’ policy to continue to meet the requirements of the Internal Revenue Code applicable to regulated investment companies and to distribute all of its taxable net investment income and capital gains, if any, to its shareholders. Therefore, no federal income tax provision is required. Withholding taxes on foreign dividends, interest and capital gains, if any, are recorded, net of reclaimable amounts, at the time the related income is earned.
Dividends and Distributions: Dividends and distributions to shareholders, which are determined in accordance with federal income tax regulations and which may differ from GAAP, are recorded on the ex-date. Permanent book/tax differences relating to income and gain (loss) are reclassified between total distributable earnings (loss) and paid-in capital in excess of par, as appropriate. The chart below sets forth the expected frequency of dividend and capital gains distributions to shareholders. Various factors may impact the frequency of
111
Notes to Financial Statements (continued)
dividend distributions to shareholders, including but not limited to adverse market conditions or portfolio holding-specific events.
| | |
| | |
| Expected Distribution Schedule to Shareholders* | | Frequency |
| |
Net Investment Income | | Monthly |
| |
Short-Term Capital Gains | | Annually |
| |
Long-Term Capital Gains | | Annually |
| * | Under certain circumstances, each Fund may make more than one distribution of short-term and/or long-term capital gains during a fiscal year. |
Estimates: The preparation of financial statements requires management to make estimates and assumptions that affect the reported amounts and disclosures in the financial statements. Actual results could differ from those estimates.
The RIC, on behalf of each Fund, has management agreements with the Manager pursuant to which it has responsibility for all investment advisory services, including supervision of each subadviser’s performance of such services, and for rendering administrative services with respect to each Fund.
The Manager has entered into subadvisory agreements with PGIM, Inc., which provides subadvisory services to each Fund through its business unit PGIM Fixed Income, and PGIM Limited (collectively, the “subadviser”). The Manager pays for the services of the subadviser.
Fees payable under the management agreement are computed daily and paid monthly. For the reporting period ended July 31, 2024, the contractual and effective management fee rates were as follows:
| | | | |
Fund | | Management Fee | | Effective Management Fee, before any waiver and/or expense reimbursements |
| | |
Core Bond | | 0.32% of average daily net assets up to $10 billion; 0.31% of average daily net assets over $10 billion. | | 0.32% |
| | |
Corporate Bond | | 0.45% of average daily net assets up to and including $5 billion; 0.425% of average daily net assets exceeding $5 billion. | | 0.45 |
The Manager has contractually agreed, through November 30, 2025, to limit total annual operating expenses, after fee waivers and/or expense reimbursements. This contractual
112
waiver excludes interest, brokerage, taxes (such as income and foreign withholding taxes, stamp duty and deferred tax expenses), acquired fund fees and expenses, extraordinary expenses, and certain other Fund expenses such as dividend and interest expense and broker charges on short sales.
Where applicable, the Manager agrees to waive management fees or shared operating expenses on any share class to the same extent that it waives such expenses on any other share class. In addition, total annual operating expenses for Class R6 shares will not exceed total annual operating expenses for Class Z shares. Fees and/or expenses waived and/or reimbursed by the Manager for the purpose of preventing the expenses from exceeding a certain expense ratio limit may be recouped by the Manager within the same fiscal year during which such waiver and/or reimbursement is made if such recoupment can be realized without exceeding the expense limit in effect at the time of the waiver/reimbursement and/or recoupment for that fiscal year, as applicable. The expense limitations attributable to each class are as follows:
| | | | | |
| Fund | | Class Expense Limitation |
| |
Core Bond - Class A | | | | 0.70 | % |
| |
Core Bond - Class C | | | | 1.45 | |
| |
Core Bond - Class R | | | | 0.95 | |
| |
Core Bond - Class Z | | | | 0.33 | |
| |
Core Bond - Class R6 | | | | 0.32 | |
| |
Corporate Bond - Class A | | | | 0.80 | |
| |
Corporate Bond - Class C | | | | 1.55 | |
| |
Corporate Bond - Class R | | | | 1.05 | |
| |
Corporate Bond - Class Z | | | | 0.55 | |
| |
Corporate Bond - Class R6 | | | | 0.55 | |
The RIC, on behalf of each Fund, has a distribution agreement with Prudential Investment Management Services LLC (“PIMS”), which acts as the distributor of the Class A, Class C, Class R, Class Z and Class R6 shares of the Fund. Each Fund compensates PIMS for distributing and servicing the Fund’s Class A, Class C and Class R shares, pursuant to the plans of distribution (the “Distribution Plans”), regardless of expenses actually incurred by PIMS.
Pursuant to the Distribution Plans, each Fund compensates PIMS for distribution related activities at an annual rate based on average daily net assets per class. PIMS has contractually agreed through November 30, 2025 to limit such fees on certain classes based on daily net assets. The distribution fees are accrued daily and payable monthly.
The Funds’ annual gross and net distribution rates, where applicable, are as follows:
| | | | | | | | | | |
| Fund | | Gross Distribution Fee | | Net Distribution Fee |
| | |
Core Bond - Class A | | | | 0.25 | % | | | | 0.25 | % |
| | |
Core Bond - Class C | | | | 1.00 | | | | | 1.00 | |
| | |
Core Bond - Class R | | | | 0.75 | | | | | 0.50 | |
| | |
Core Bond - Class Z | | | | N/A | | | | | N/A | |
113
Notes to Financial Statements (continued)
| | | | |
| Fund | | Gross Distribution Fee | | Net Distribution Fee |
| | |
Core Bond - Class R6 | | N/A% | | N/A% |
| | |
Corporate Bond - Class A | | 0.25 | | 0.25 |
| | |
Corporate Bond - Class C | | 1.00 | | 1.00 |
| | |
Corporate Bond - Class R | | 0.75 | | 0.50 |
| | |
Corporate Bond - Class Z | | N/A | | N/A |
Corporate Bond - Class R6 | | N/A | | N/A |
For the year ended July 31, 2024, PIMS received front-end sales charges (“FESL”) resulting from sales of certain class shares and contingent deferred sales charges (“CDSC”) imposed upon redemptions by certain shareholders. From these fees, PIMS paid such sales charges to broker-dealers, who in turn paid commissions to salespersons and incurred other distribution costs. The sales charges are as follows where applicable:
| | | | | | | | |
| Fund | | FESL | | | CDSC | |
| | |
Core Bond - Class A | | | $228,716 | | | | $2,908 | |
Core Bond - Class C | | | — | | | | 367 | |
| | |
Corporate Bond - Class A | | | 4,373 | | | | — | |
Corporate Bond - Class C | | | — | | | | — | |
PGIM Investments, PGIM, Inc., PGIM Limited and PIMS are indirect, wholly-owned subsidiaries of Prudential Financial, Inc. (“Prudential”).
| 4. | Other Transactions with Affiliates |
Prudential Mutual Fund Services LLC (“PMFS”), an affiliate of PGIM Investments and an indirect, wholly-owned subsidiary of Prudential, serves as each Fund’s transfer agent and shareholder servicing agent. Transfer agent’s fees and expenses in the Statement of Operations include certain out-of-pocket expenses paid to non-affiliates, where applicable.
The Funds may invest their overnight sweep cash in the PGIM Core Government Money Market Fund (the “Core Government Fund”), a series of the Prudential Government Money Market Fund, Inc., and their securities lending cash collateral in the PGIM Institutional Money Market Fund (the “Money Market Fund”). The Core Fund and the Money Market Fund are each a series of Prudential Investment Portfolios 2, registered under the 1940 Act and managed by PGIM Investments. PGIM Investments and/or its affiliates are paid fees or reimbursed for providing their services to the Core Fund and the Money Market Fund. In addition to the realized and unrealized gains on investments in the Core Fund and Money Market Fund, earnings from such investments are disclosed on the Statement of Operations as “Affiliated dividend income” and “Affiliated income from securities lending, net”, respectively.
114
The Funds may enter into certain securities purchase or sale transactions under Board approved Rule 17a-7 procedures. Rule 17a-7 is an exemptive rule under the 1940 Act that, subject to certain conditions, permits purchase and sale transactions among affiliated investment companies, or between an investment company and a person that is affiliated solely by reason of having a common (or affiliated) investment adviser, common directors/trustees, and/or common officers. For the year ended July 31, 2024, no Rule 17a-7 transactions were entered into by the Funds.
5. Portfolio Securities
The aggregate cost of purchases and proceeds from sales of portfolio securities (excluding short-term investments and U.S. Government securities) for the reporting period ended July 31, 2024, were as follows:
| | | | | | | | | | |
| Fund | | Cost of Purchases | | Proceeds from Sales |
| | |
Core Bond | | | | $2,378,868,520 | | | | | $2,067,611,985 | |
Corporate Bond | | | | 3,899,478 | | | | | 6,540,151 | |
A summary of the cost of purchases and proceeds from sales of shares of affiliated mutual funds for the year ended July 31, 2024, is presented as follows:
Core Bond :
| | | | | | | | | | | | | | | | | | | | | | | | | | | | | | | | | | | | | | |
Value, Beginning of Year | | Cost of
Purchases | | Proceeds
from Sales | | Change in
Unrealized
Gain (Loss) | | Realized Gain (Loss) | | Value,
End of Year | | Shares, End of Year | | Income |
|
| | | Long-Term Investments - Affiliated Exchange-Traded Fund(wa): | |
|
| | | PGIM AAA CLO ETF | |
| | | $— | | | | $ | 9,018,747 | | | | $ | — | | | | $ | 33,918 | | | | $ | — | | | | $ | 9,052,665 | | | | | 177,000 | | | | $ | 27,095 | |
|
| | | Short-Term Investments - Affiliated Mutual Funds: | |
|
| | | PGIM Core Government Money Market Fund (7-day effective yield 5.561%)(1)(wa) | |
| | | | | | | |
| | | 66,476,191 | | | | | 577,330,207 | | | | | 583,996,220 | | | | | — | | | | | — | | | | | 59,810,178 | | | | | 59,810,178 | | | | | 2,906,197 | |
|
| | | PGIM Institutional Money Market Fund (7-day effective yield 5.606%)(1)(b)(wa) | |
| | | 12,756,348 | | | | | 148,453,170 | | | | | 147,133,102 | | | | | (564 | ) | | | | (1,544 | ) | | | | 14,074,308 | | | | | 14,082,758 | | | | | 30,689 | (2) |
| | | $79,232,539 | | | | $ | 725,783,377 | | | | $ | 731,129,322 | | | | $ | (564 | ) | | | $ | (1,544 | ) | | | $ | 73,884,486 | | | | | | | | | $ | 2,936,886 | |
| | | $79,232,539 | | | | $ | 734,802,124 | | | | $ | 731,129,322 | | | | $ | 33,354 | | | | $ | (1,544 | ) | | | $ | 82,937,151 | | | | | | | | | $ | 2,963,981 | |
115
Notes to Financial Statements (continued)
Corporate Bond:
| | | | | | | | | | | | | | |
Value, Beginning
of Year | | Cost of
Purchases | | Proceeds
from Sales | | Change in
Unrealized Gain (Loss) | | Realized Gain (Loss) | | Value,
End of Year | | Shares, End of Year | | Income |
|
Short-Term Investments - Affiliated Mutual Fund: |
|
PGIM Core Government Money Market Fund (7-day effective yield 5.561%)(1)(wb) |
| $90,430 | | $5,447,678 | | $5,423,422 | | $— | | $— | | $114,686 | | 114,686 | | $9,986 |
| (1) | The Fund did not have any capital gain distributions during the reporting period. |
| (2) | The amount, or a portion thereof, represents the affiliated securities lending income shown on the Statement of Operations. |
| (b) | Represents security, or portion thereof, purchased with cash collateral received for securities on loan and includes dividend reinvestment. |
| (wa) | Represents investments in Funds affiliated with the Manager. |
| (wb) | Represents an investment in a Fund affiliated with the Manager. |
| 6. | Distributions and Tax Information |
Distributions to shareholders, which are determined in accordance with federal income tax regulations and which may differ from GAAP, are recorded on the ex-date. In order to present total distributable earnings (loss) and paid-in capital in excess of par on the Statement of Assets and Liabilities that more closely represent their tax character, certain adjustments have been made to total distributable earnings (loss) and paid-in capital in excess of par for the Funds indicated below.
For the year ended July 31, 2024, the adjustments were as follows:
| | | | | | | | | | |
| Fund | | Total Distributable Earnings (Loss) | | Paid-in Capital in Excess of Par |
Core Bond (a) | | | $ | (117,644 | ) | | | $ | 117,644 | |
Corporate Bond | | | | — | | | | | — | |
| (a) | Prior year post financial statement adjustments. |
For the year ended July 31, 2024, the tax character of dividends paid as reflected in the Statement of Changes in Net Assets were as follows:
| | | | | | | | | | | |
| Fund | | Ordinary Income | | Long-Term Capital Gains | | Tax Return of Capital | | Total Dividends
and Distributions |
Core Bond | | $75,799,532 | | $— | | $— | | | | $75,799,532 | |
Corporate Bond | | 915,497 | | — | | — | | | | 915,497 | |
116
For the year ended July 31, 2023, the tax character of dividends paid as reflected in the Statement of Changes in Net Assets were as follows:
| | | | | | | | | | | |
| Fund | | Ordinary Income | | Long-Term Capital Gains | | Tax Return of Capital | | Total Dividends
and Distributions |
Core Bond | | $53,162,816 | | $— | | $117,644 | | | | $53,280,460 | |
Corporate Bond | | 1,074,207 | | — | | — | | | | 1,074,207 | |
For the year ended July 31, 2024, the Funds had the following amounts of accumulated undistributed earnings on a tax basis:
| | | | | | | | |
| Fund | | Undistributed Ordinary Income | | | Undistributed Long-Term Capital Gains | |
Core Bond | | | $1,709,792 | | | | $— | |
Corporate Bond | | | 58,899 | | | | — | |
The United States federal income tax basis of the Funds’ investments and the net unrealized appreciation/(depreciation) as of July 31, 2024 were as follows:
| | | | | | | | |
| Fund | | Tax Basis | | Gross Unrealized Appreciation | | Gross Unrealized Depreciation | | Net Unrealized Depreciation |
Core Bond | | $2,147,080,795 | | $23,249,227 | | $(132,882,712) | | $(109,633,485) |
Corporate Bond | | 25,754,031 | | 149,027 | | (2,465,419) | | (2,316,392) |
The differences between GAAP and tax basis were primarily attributable to deferred losses on wash sales, amortization of premiums, futures and other cost basis differences between GAAP and tax accounting.
For federal income tax purposes, the following Funds had an approximated capital loss carryforward as of July 31, 2024 which can be carried forward for an unlimited period. No capital gains distributions are expected to be paid to shareholders until net gains have been realized in excess of such losses.
| | | | | | | | |
| Fund | | Capital Loss Carryforward | | | Capital Loss Carryforward Utilized | |
Core Bond | | | $118,508,000 | | | | $— | |
Corporate Bond | | | 2,639,000 | | | | — | |
The Manager has analyzed the Funds’ tax positions taken on federal, state and local income tax returns for all open tax years and has concluded that no provision for income tax is required in the Funds’ financial statements for the current reporting period. Since tax authorities can examine previously filed tax returns, the Funds’ U.S. federal and state tax returns for each of the four fiscal years up to the most recent fiscal year ended July 31, 2024 are subject to such review.
The Funds offer Class A, Class C, Class R, Class Z and Class R6 shares. Class A shares are sold with a maximum front-end sales charge of 3.25%.Investors who purchase $500,000 or
117
Notes to Financial Statements (continued)
more of Class A shares and sell those shares within 12 months of purchase are subject to a CDSC of 1% on sales although these purchases are not subject to a front-end sales charge. The Class A CDSC is waived for certain retirement and/or benefit plans. A special exchange privilege is also available for shareholders who qualified to purchase Class A shares at net asset value. Class C shares are sold with a CDSC of 1% on sales made within 12 months of purchase. Class C shares will automatically convert to Class A shares on a monthly basis approximately eight years (ten years prior to January 22, 2021) after purchase. Class R shares are available to certain retirement plans, clearing and settlement firms. Class R, Class Z and Class R6 shares are not subject to any sales or redemption charges and are available exclusively for sale to a limited group of investors.
Under certain circumstances, an exchange may be made from specified share classes of each Fund to one or more other share classes of the Fund as presented in the table of transactions in shares of beneficial interest, below.
The RIC has authorized an unlimited number of shares of beneficial interest of each Fund at $0.001 par value per share.
As of July 31, 2024, Prudential, through its affiliated entities, including affiliated funds (if applicable), owned shares of the Funds as follows:
| | | | | | | | |
| | | |
| Fund | | Number of Shares | | | Percentage of
Outstanding Shares | |
Core Bond –Class R | | | 1,260 | | | | 52.5% | |
Core Bond –Class Z | | | 43,987 | | | | 0.1 | |
Corporate Bond–Class R | | | 1,202 | | | | 100.0 | |
Corporate Bond–Class Z | | | 17,877 | | | | 1.9 | |
Corporate Bond–Class R6 | | | 900,323 | | | | 99.3 | |
At the reporting period end, the number of shareholders holding greater than 5% of the Funds are as follows:
| | | | | | | | | | |
| | | |
| Fund | | Number of Shareholders | | Percentage of Outstanding Shares |
Affiliated: | | | | | | | | | | |
Core Bond | | | | — | | | | | — | % |
Corporate Bond | | | | 1 | | | | | 37.6 | |
Unaffiliated: | | | | | | | | | | |
Core Bond | | | | 4 | | | | | 80.5 | |
Corporate Bond | | | | 2 | | | | | 39.4 | |
118
Transactions in shares of beneficial interest were as follows:
Core Bond :
| | | | | | | | |
| | | |
| Share Class | | Shares | | | Amount | |
| | |
Class A | | | | | | | | |
| | |
Year ended July 31, 2024: | | | | | | | | |
| | |
Shares sold | | | 6,388,354 | | | $ | 54,750,016 | |
| | |
Shares issued in reinvestment of dividends and distributions | | | 722,105 | | | | 6,181,768 | |
| | |
Shares purchased | | | (5,148,016 | ) | | | (43,944,435 | ) |
| | |
Net increase (decrease) in shares outstanding before conversion | | | 1,962,443 | | | | 16,987,349 | |
| | |
Shares issued upon conversion from other share class(es) | | | 192,308 | | | | 1,647,689 | |
| | |
Shares purchased upon conversion into other share class(es) | | | (207,610 | ) | | | (1,776,332 | ) |
| | |
Net increase (decrease) in shares outstanding | | | 1,947,141 | | | $ | 16,858,706 | |
| | |
Year ended July 31, 2023: | | | | | | | | |
| | |
Shares sold | | | 4,454,426 | | | $ | 38,877,990 | |
| | |
Shares issued in reinvestment of dividends and distributions | | | 543,967 | | | | 4,719,467 | |
| | |
Shares purchased | | | (4,751,908 | ) | | | (41,265,671 | ) |
| | |
Net increase (decrease) in shares outstanding before conversion | | | 246,485 | | | | 2,331,786 | |
| | |
Shares issued upon conversion from other share class(es) | | | 237,188 | | | | 2,064,917 | |
| | |
Shares purchased upon conversion into other share class(es) | | | (303,211 | ) | | | (2,641,748 | ) |
| | |
Net increase (decrease) in shares outstanding | | | 180,462 | | | $ | 1,754,955 | |
| | |
Class C | | | | | | | | |
| | |
Year ended July 31, 2024: | | | | | | | | |
| | |
Shares sold | | | 292,857 | | | $ | 2,509,304 | |
| | |
Shares issued in reinvestment of dividends and distributions | | | 23,369 | | | | 200,144 | |
| | |
Shares purchased | | | (293,768 | ) | | | (2,516,548 | ) |
| | |
Net increase (decrease) in shares outstanding before conversion | | | 22,458 | | | | 192,900 | |
| | |
Shares purchased upon conversion into other share class(es) | | | (55,306 | ) | | | (473,308 | ) |
| | |
Net increase (decrease) in shares outstanding | | | (32,848 | ) | | $ | (280,408 | ) |
| | |
Year ended July 31, 2023: | | | | | | | | |
| | |
Shares sold | | | 365,621 | | | $ | 3,188,839 | |
| | |
Shares issued in reinvestment of dividends and distributions | | | 17,022 | | | | 147,786 | |
| | |
Shares purchased | | | (230,949 | ) | | | (2,003,937 | ) |
| | |
Net increase (decrease) in shares outstanding before conversion | | | 151,694 | | | | 1,332,688 | |
| | |
Shares purchased upon conversion into other share class(es) | | | (83,439 | ) | | | (724,384 | ) |
| | |
Net increase (decrease) in shares outstanding | | | 68,255 | | | $ | 608,304 | |
| | |
Class R | | | | | | | | |
| | |
Year ended July 31, 2024: | | | | | | | | |
| | |
Shares sold | | | 195 | | | $ | 1,679 | |
| | |
Shares issued in reinvestment of dividends and distributions | | | 85 | | | | 731 | |
| | |
Shares purchased | | | (2 | ) | | | (18 | ) |
| | |
Net increase (decrease) in shares outstanding | | | 278 | | | $ | 2,392 | |
119
Notes to Financial Statements (continued)
Core Bond (cont’d.):
| | | | | | | | |
| | | |
| Share Class | | Shares | | | Amount | |
| | |
Year ended July 31, 2023: | | | | | | | | |
| | |
Shares sold | | | 155 | | | $ | 1,344 | |
| | |
Shares issued in reinvestment of dividends and distributions | | | 60 | | | | 524 | |
| | |
Shares purchased | | | (2 | ) | | | (15 | ) |
| | |
Net increase (decrease) in shares outstanding | | | 213 | | | $ | 1,853 | |
| | |
Class Z | | | | | | | | |
| | |
Year ended July 31, 2024: | | | | | | | | |
| | |
Shares sold | | | 27,501,670 | | | $ | 233,482,297 | |
| | |
Shares issued in reinvestment of dividends and distributions | | | 2,072,843 | | | | 17,745,140 | |
| | |
Shares purchased | | | (26,134,941 | ) | | | (222,179,026 | ) |
| | |
Net increase (decrease) in shares outstanding before conversion | | | 3,439,572 | | | | 29,048,411 | |
| | |
Shares issued upon conversion from other share class(es) | | | 174,814 | | | | 1,496,182 | |
| | |
Shares purchased upon conversion into other share class(es) | | | (172,078 | ) | | | (1,471,350 | ) |
| | |
Net increase (decrease) in shares outstanding | | | 3,442,308 | | | $ | 29,073,243 | |
| | |
Year ended July 31, 2023: | | | | | | | | |
| | |
Shares sold | | | 33,451,668 | | | $ | 290,003,200 | |
| | |
Shares issued in reinvestment of dividends and distributions | | | 1,317,293 | | | | 11,434,447 | |
| | |
Shares purchased | | | (23,744,306 | ) | | | (206,503,055 | ) |
| | |
Net increase (decrease) in shares outstanding before conversion | | | 11,024,655 | | | | 94,934,592 | |
| | |
Shares issued upon conversion from other share class(es) | | | 457,223 | | | | 3,999,408 | |
| | |
Shares purchased upon conversion into other share class(es) | | | (980,541 | ) | | | (8,482,654 | ) |
| | |
Net increase (decrease) in shares outstanding | | | 10,501,337 | | | $ | 90,451,346 | |
| | |
Class R6 | | | | | | | | |
| | |
Year ended July 31, 2024: | | | | | | | | |
| | |
Shares sold | | | 54,123,326 | | | $ | 464,450,902 | |
| | |
Shares issued in reinvestment of dividends and distributions | | | 5,959,819 | | | | 51,037,263 | |
| | |
Shares purchased | | | (24,636,558 | ) | | | (210,396,179 | ) |
| | |
Net increase (decrease) in shares outstanding before conversion | | | 35,446,587 | | | | 305,091,986 | |
| | |
Shares issued upon conversion from other share class(es) | | | 211,509 | | | | 1,807,178 | |
| | |
Shares purchased upon conversion into other share class(es) | | | (143,604 | ) | | | (1,230,059 | ) |
| | |
Net increase (decrease) in shares outstanding | | | 35,514,492 | | | $ | 305,669,105 | |
120
Core Bond (cont’d.):
| | | | | | | | |
| | | |
| Share Class | | Shares | | | Amount | |
| | |
Year ended July 31, 2023: | | | | | | | | |
| | |
Shares sold | | | 28,365,083 | | | $ | 246,652,179 | |
| | |
Shares issued in reinvestment of dividends and distributions | | | 4,218,707 | | | | 36,613,116 | |
| | |
Shares purchased | | | (21,247,214 | ) | | | (184,971,823 | ) |
| | |
Net increase (decrease) in shares outstanding before conversion | | | 11,336,576 | | | | 98,293,472 | |
| | |
Shares issued upon conversion from other share class(es) | | | 955,008 | | | | 8,257,160 | |
| | |
Shares purchased upon conversion into other share class(es) | | | (282,113 | ) | | | (2,472,699 | ) |
| | |
Net increase (decrease) in shares outstanding | | | 12,009,471 | | | $ | 104,077,933 | |
Corporate Bond:
| | | | | | | | |
| | | |
| Share Class | | Shares | | | Amount | |
| | |
Class A | | | | | | | | |
| | |
Year ended July 31, 2024: | | | | | | | | |
| | |
Shares sold | | | 60,676 | | | $ | 583,092 | |
| | |
Shares issued in reinvestment of dividends and distributions | | | 16,703 | | | | 162,271 | |
| | |
Shares purchased | | | (148,996 | ) | | | (1,428,615 | ) |
| | |
Net increase (decrease) in shares outstanding before conversion | | | (71,617 | ) | | | (683,252 | ) |
| | |
Shares issued upon conversion from other share class(es) | | | 6,307 | | | | 61,527 | |
| | |
Shares purchased upon conversion into other share class(es) | | | (2,746 | ) | | | (26,558 | ) |
| | |
Net increase (decrease) in shares outstanding | | | (68,056 | ) | | $ | (648,283 | ) |
| | |
Year ended July 31, 2023: | | | | | | | | |
| | |
Shares sold | | | 101,271 | | | $ | 986,984 | |
| | |
Shares issued in reinvestment of dividends and distributions | | | 23,845 | | | | 229,878 | |
| | |
Shares purchased | | | (361,339 | ) | | | (3,484,124 | ) |
| | |
Net increase (decrease) in shares outstanding before conversion | | | (236,223 | ) | | | (2,267,262 | ) |
| | |
Shares issued upon conversion from other share class(es) | | | 9,834 | | | | 96,762 | |
| | |
Net increase (decrease) in shares outstanding | | | (226,389 | ) | | $ | (2,170,500 | ) |
| | |
Class C | | | | | | | | |
| | |
Year ended July 31, 2024: | | | | | | | | |
| | |
Shares sold | | | 10,892 | | | $ | 104,193 | |
| | |
Shares issued in reinvestment of dividends and distributions | | | 2,062 | | | | 19,996 | |
| | |
Shares purchased | | | (8,636 | ) | | | (83,497 | ) |
| | |
Net increase (decrease) in shares outstanding before conversion | | | 4,318 | | | | 40,692 | |
| | |
Shares purchased upon conversion into other share class(es) | | | (6,306 | ) | | | (61,332 | ) |
| | |
Net increase (decrease) in shares outstanding | | | (1,988 | ) | | $ | (20,640 | ) |
121
Notes to Financial Statements (continued)
Corporate Bond (cont’d.):
| | | | | | | | |
| | | |
| Share Class | | Shares | | | Amount | |
| | |
Year ended July 31, 2023: | | | | | | | | |
| | |
Shares sold | | | 15,505 | | | $ | 147,719 | |
| | |
Shares issued in reinvestment of dividends and distributions | | | 2,523 | | | | 24,294 | |
| | |
Shares purchased | | | (36,799 | ) | | | (355,230 | ) |
| | |
Net increase (decrease) in shares outstanding before conversion | | | (18,771 | ) | | | (183,217 | ) |
| | |
Shares purchased upon conversion into other share class(es) | | | (4,096 | ) | | | (39,925 | ) |
| | |
Net increase (decrease) in shares outstanding | | | (22,867 | ) | | $ | (223,142 | ) |
| | |
Class R | | | | | | | | |
| | |
Year ended July 31, 2024: | | | | | | | | |
| | |
Shares issued in reinvestment of dividends and distributions | | | 40 | | | $ | 383 | |
| | |
Net increase (decrease) in shares outstanding | | | 40 | | | $ | 383 | |
| | |
Year ended July 31, 2023: | | | | | | | | |
| | |
Shares issued in reinvestment of dividends and distributions | | | 38 | | | $ | 365 | |
| | |
Net increase (decrease) in shares outstanding | | | 38 | | | $ | 365 | |
| | |
Class Z | | | | | | | | |
| | |
Year ended July 31, 2024: | | | | | | | | |
| | |
Shares sold | | | 202,480 | | | $ | 1,946,121 | |
| | |
Shares issued in reinvestment of dividends and distributions | | | 40,081 | | | | 388,333 | |
| | |
Shares purchased | | | (440,931 | ) | | | (4,269,968 | ) |
| | |
Net increase (decrease) in shares outstanding before conversion | | | (198,370 | ) | | | (1,935,514 | ) |
| | |
Shares issued upon conversion from other share class(es) | | | 2,752 | | | | 26,558 | |
| | |
Shares purchased upon conversion into other share class(es) | | | (20 | ) | | | (195 | ) |
| | |
Net increase (decrease) in shares outstanding | | | (195,638 | ) | | $ | (1,909,151 | ) |
| | |
Year ended July 31, 2023: | | | | | | | | |
| | |
Shares sold | | | 324,339 | | | $ | 3,155,681 | |
| | |
Shares issued in reinvestment of dividends and distributions | | | 44,355 | | | | 426,971 | |
| | |
Shares purchased | | | (602,494 | ) | | | (5,879,382 | ) |
| | |
Net increase (decrease) in shares outstanding before conversion | | | (233,800 | ) | | | (2,296,730 | ) |
| | |
Shares purchased upon conversion into other share class(es) | | | (5,761 | ) | | | (56,837 | ) |
| | |
Net increase (decrease) in shares outstanding | | | (239,561 | ) | | $ | (2,353,567 | ) |
122
Corporate Bond (cont’d.):
| | | | | | | | |
| | | |
| Share Class | | Shares | | | Amount | |
| | |
Class R6 | | | | | | | | |
| | |
Year ended July 31, 2024: | | | | | | | | |
| | |
Shares sold | | | 755 | | | $ | 7,222 | |
| | |
Shares issued in reinvestment of dividends and distributions | | | 14,710 | | | | 139,960 | |
| | |
Shares purchased | | | (4,165 | ) | | | (40,018 | ) |
| | |
Net increase (decrease) in shares outstanding | | | 11,300 | | | $ | 107,164 | |
| | |
Year ended July 31, 2023: | | | | | | | | |
| | |
Shares sold | | | 30,691 | | | $ | 303,913 | |
| | |
Shares issued in reinvestment of dividends and distributions | | | 40,052 | | | | 384,686 | |
| | |
Shares purchased | | | (448,301 | ) | | | (4,332,480 | ) |
| | |
Net increase (decrease) in shares outstanding | | | (377,558 | ) | | $ | (3,643,881 | ) |
The RIC, on behalf of each Fund, along with other affiliated registered investment companies (the “Participating Funds”), is a party to a Syndicated Credit Agreement (“SCA”) with a group of banks. The purpose of the SCA is to provide an alternative source of temporary funding for capital share redemptions. The table below provides details of the current SCA in effect at the reporting period-end as well as the prior SCA.
| | | | | | |
| | | Current SCA | | | | Prior SCA |
Term of Commitment | | 9/29/2023 - 9/26/2024 | | | | 9/30/2022 – 9/28/2023 |
Total Commitment | | $ 1,200,000,000 | | | | $ 1,200,000,000 |
Annualized Commitment Fee on the Unused Portion of the SCA | | 0.15% | | | | 0.15% |
Annualized Interest Rate on Borrowings | | 1.00% plus the higher of (1)
the effective federal funds
rate, (2) the daily SOFR
rate plus 0.10% or (3) zero
percent | | | | 1.00% plus the higher of (1)
the effective federal funds
rate, (2) the daily SOFR
rate plus 0.10% or (3) zero
percent |
Certain affiliated registered investment companies that are parties to the SCA include portfolios that are subject to a predetermined mathematical formula used to manage certain benefit guarantees offered under variable annuity contracts. The formula may result in large scale asset flows into and out of these portfolios. Consequently, these portfolios may be more likely to utilize the SCA for purposes of funding redemptions. It may be possible for those portfolios to fully exhaust the committed amount of the SCA, thereby requiring the Manager to allocate available funding per a Board-approved methodology designed to treat the Participating Funds in the SCA equitably.
The Funds did not utilize the SCA during the year ended July 31, 2024.
123
Notes to Financial Statements (continued)
| 9. | Risks of Investing in the Funds |
Each Fund’s principal risks include, but are not limited to, some or all of the risks discussed below. For further information on the risks applicable to any given Fund, please refer to the Prospectus and Statement of Additional Information of that Fund.
| | | | |
| Risks | | Core Bond | | Corporate
Bond |
Active Trading | | X | | – |
Credit | | X | | X |
Debt Obligations | | X | | X |
Derivatives | | X | | X |
Economic and Market Events | | X | | X |
Emerging Markets | | – | | X |
Foreign Securities | | X | | X |
Increase in Expenses | | X | | X |
Interest Rate | | X | | X |
Junk Bonds | | – | | X |
Large Shareholder and Large Scale Redemption | | X | | X |
Liquidity | | – | | X |
Management | | X | | X |
Market Disruption and Geopolitical | | X | | X |
Market | | X | | X |
Mortgage-Backed and Asset-Backed Securities | | X | | X |
U.S. Government and Agency Securities | | X | | X |
Yankee Obligations | | — | | X |
Active Trading Risk: The Fund actively and frequently trades its portfolio securities. High portfolio turnover results in higher transaction costs, which can affect the Fund’s performance and have adverse tax consequences. In addition, high portfolio turnover may also mean that a proportionately greater amount of distributions to shareholders will be taxed as ordinary income rather than long-term capital gains compared to investment companies with lower portfolio turnover.
Credit Risk: This is the risk that the issuer, the guarantor, or the insurer of a fixed income security, or the counterparty to a contract may be unable or unwilling to make timely principal and interest payments or to otherwise honor its obligations. Additionally, fixed income securities could lose value due to a loss of confidence in the ability of the issuer, guarantor, insurer, or counterparty to pay back debt. The lower the credit quality of a bond, the more sensitive it is to credit risk.
Debt Obligations Risk: Debt obligations are subject to credit risk, market risk and interest rate risk. The Fund’s holdings, share price, yield and total return may also fluctuate in response to bond market movements. The value of bonds may decline for issuer-related
124
reasons, including management performance, financial leverage and reduced demand for the issuer’s goods and services. Certain types of fixed income obligations also may be subject to “call and redemption risk,” which is the risk that the issuer may call a bond held by the Fund for redemption before it matures and the Fund may not be able to reinvest at the same rate of interest and therefore would earn less income.
Derivatives Risk: Derivatives involve special risks and costs and may result in losses to the Fund. The successful use of derivatives requires sophisticated management, and, to the extent that derivatives are used, the Fund will depend on the subadviser’s ability to analyze and manage derivatives transactions. The prices of derivatives may move in unexpected ways, especially in abnormal market conditions. Some derivatives are “leveraged” or may create economic leverage for the Fund. and therefore may magnify or otherwise increase investment losses to the Fund. The Fund’s use of derivatives may also increase the amount of taxes payable by shareholders.
Other risks arise from the potential inability to terminate or sell derivatives positions. A liquid secondary market may not always exist for the Fund’s derivatives positions. In fact, many over-the-counter derivative instruments will not have liquidity beyond the counterparty to the instrument. Over-the-counter derivative instruments also involve the risk that the other party will not meet its obligations to the Fund. The use of derivatives also exposes the Fund to operational issues, such as documentation and settlement issues, systems failures, inadequate control and human error.
Derivatives may also involve legal risks, such as insufficient documentation, the lack of capacity or authority of a counterparty to execute or settle a transaction, and the legality and enforceability of derivatives contracts. The U.S. Government and foreign governments have adopted (and may adopt further) regulations governing derivatives markets, including mandatory clearing of certain derivatives, margin and reporting requirements and risk exposure limitations. Regulation of derivatives may make derivatives more costly, limit their availability or utility to the Fund, or otherwise adversely affect their performance or disrupt markets.
Economic and Market Events Risk: Events in the U.S. and global financial markets, including actions taken by the U.S. Federal Reserve or foreign central banks to stimulate or stabilize economic growth or the functioning of the securities markets, or otherwise reduce inflation, may at times result in unusually high market volatility, which could negatively impact performance. Governmental efforts to curb inflation often have negative effects on the level of economic activity. Relatively reduced liquidity in credit and fixed income markets could adversely affect issuers worldwide.
Foreign Securities Risk: Investments in securities of non-U.S. issuers (including those denominated in U.S. dollars) may involve more risk than investing in securities of U.S. issuers. Foreign political, economic and legal systems, especially those in developing and emerging market countries, may be less stable and more volatile than in the United States. Foreign legal systems generally have fewer regulatory requirements than the U.S. legal
125
Notes to Financial Statements (continued)
system, particularly those of emerging markets. In general, less information is publicly available with respect to non-U.S. companies than U.S. companies. Non-U.S. companies generally are not subject to the same accounting, auditing, and financial reporting standards as are U.S. companies. Additionally, the changing value of foreign currencies and changes in exchange rates could also affect the value of the assets the Fund holds and the Fund’s performance. Certain foreign countries may impose restrictions on the ability of issuers of foreign securities to make payment of principal and interest or dividends to investors located outside the country, due to blockage of foreign currency exchanges or otherwise. Investments in emerging markets are subject to greater volatility and price declines.
In addition, the Fund’s investments in non-U.S. securities may be subject to the risks of nationalization or expropriation of assets, imposition of currency exchange controls or restrictions on the repatriation of non-U.S. currency, confiscatory taxation and adverse diplomatic developments. Special U.S. tax considerations may apply.
Increase in Expenses Risk: Your actual cost of investing in the Fund may be higher than the expenses shown in the expense table in the Fund’s prospectus for a variety of reasons. For example, expense ratios may be higher than those shown if average net assets decrease. Net assets are more likely to decrease and Fund expense ratios are more likely to increase when markets are volatile. Active and frequent trading of Fund securities can increase expenses.
Interest Rate Risk: The value of your investment may go down when interest rates rise. A rise in rates tends to have a greater impact on the prices of longer term or duration debt securities. Similarly, a rise in interest rates may also have a greater negative impact on the value of equity securities whose issuers expect earnings further out in the future. For example, a fixed income security with a duration of three years is expected to decrease in value by approximately 3% if interest rates increase by 1%. This is referred to as “duration risk.” When interest rates fall, the issuers of debt obligations may prepay principal more quickly than expected, and the Fund may be required to reinvest the proceeds at a lower interest rate. This is referred to as “prepayment risk.” For premium bonds (bonds acquired at prices that exceed their par or principal value) purchased by the Fund, prepayment risk may be enhanced. When interest rates rise, debt obligations may be repaid more slowly than expected, and the value of the Fund’s holdings may fall sharply. This is referred to as “extension risk.” The Fund may lose money if short-term or long-term interest rates rise sharply or in a manner not anticipated by the subadviser.
Large Shareholder and Large Scale Redemption Risk: Certain individuals, accounts, funds (including funds affiliated with the Manager) or institutions, including the Manager and its affiliates, may from time to time own or control a substantial amount of the Fund’s shares. There is no requirement that these entities maintain their investment in the Fund. There is a
126
risk that such large shareholders or that the Fund’s shareholders generally may redeem all or a substantial portion of their investments in the Fund in a short period of time, which could have a significant negative impact on the Fund’s NAV, liquidity, and brokerage costs. Large redemptions could also result in tax consequences to shareholders and impact the Fund’s ability to implement its investment strategy. The Fund’s ability to pursue its investment objective after one or more large scale redemptions may be impaired and, as a result, the Fund may invest a larger portion of its assets in cash or cash equivalents.
Management Risk: Actively managed funds are subject to management risk. The subadviser will apply investment techniques and risk analyses in making investment decisions for the Fund, but the subadviser’s judgments about the attractiveness, value or market trends affecting a particular security, industry or sector or about market movements may be incorrect. Additionally, the investments selected for the Fund may underperform the markets in general, the Fund’s benchmark and other funds with similar investment objectives.
Market Disruption and Geopolitical Risks: Market disruption can be caused by economic, financial or political events and factors, including but not limited to, international wars or conflicts (including Russia’s military invasion of Ukraine and the Israel-Hamas war), geopolitical developments (including trading and tariff arrangements, sanctions and cybersecurity attacks), instability in regions such as Asia, Eastern Europe and the Middle East, terrorism, natural disasters and public health epidemics (including the outbreak of COVID-19 globally).
The extent and duration of such events and resulting market disruptions cannot be predicted, but could be substantial and could magnify the impact of other risks to the Fund. These and other similar events could adversely affect the U.S. and foreign financial markets and lead to increased market volatility, reduced liquidity in the securities markets, significant negative impacts on issuers and the markets for certain securities and commodities and/or government intervention. They may also cause short- or long-term economic uncertainties in the United States and worldwide. As a result, whether or not the Fund invests in securities of issuers located in or with significant exposure to the countries directly affected, the value and liquidity of the Fund’s investments may be negatively impacted. Further, due to closures of certain markets and restrictions on trading certain securities, the value of certain securities held by the Fund could be significantly impacted, which could lead to such securities being valued at zero.
Market Risk: Securities markets may be volatile and the market prices of the Fund’s securities may decline. Securities fluctuate in price based on changes in an issuer’s financial condition and overall market and economic conditions. If the market prices of the securities owned by the Fund fall, the value of your investment in the Fund will decline.
Mortgage-Backed and Asset-Backed Securities Risk: Mortgage-backed and asset-backed securities tend to increase in value less than other debt securities when interest rates decline, but are subject to similar risk of decline in market value during periods of rising
127
Notes to Financial Statements (continued)
interest rates. The values of mortgage-backed and asset-backed securities become more volatile as interest rates rise. In a period of declining interest rates, the Fund may be required to reinvest more frequent prepayments on mortgage-backed and asset-backed securities in lower-yielding investments.
U.S. Government and Agency Securities Risk: U.S. Treasury obligations are backed by the “full faith and credit” of the U.S. Government. Securities issued or guaranteed by federal agencies or authorities and U.S. Government-sponsored instrumentalities or enterprises may or may not be backed by the full faith and credit of the U.S. Government. For example, securities issued by the Federal Home Loan Mortgage Corporation, the Federal National Mortgage Association and the Federal Home Loan Banks are neither insured nor guaranteed by the U.S. Government. These securities may be supported by the ability to borrow from the U.S. Treasury or only by the credit of the issuing agency, authority, instrumentality or enterprise and, as a result, are subject to greater credit risk than securities issued or guaranteed by the U.S. Treasury. Further, the U.S. Government and its agencies, authorities, instrumentalities and enterprises do not guarantee the market value of their securities; consequently, the value of such securities will fluctuate. This may be the case especially when there is any controversy or ongoing uncertainty regarding the status of negotiations in the U.S. Congress to increase the statutory debt ceiling. Such controversy or uncertainty could, among other things, result in the credit quality rating of the U.S. Government being downgraded and reduced prices of U.S. Treasury securities. If the U.S. Congress is unable to negotiate an adjustment to the statutory debt ceiling, there is also the risk that the U.S. Government may default on payments on certain U.S. Government securities, including those held by the Fund, which could have a negative impact on the Fund. An increase in demand for U.S. Government securities resulting from an increase in demand for government money market funds may lead to lower yields on such securities.
Yankee Obligations Risk: Foreign markets, economies and political systems, particularly those in developing countries, may not be as stable as those in the US. In addition, Yankee Obligations may be less liquid than US debt obligations. Differences in foreign laws, accounting standards, public information, custody and settlement practices may result in less reliable information on foreign investments and involve more risk. Investments in emerging markets securities are subject to greater volatility and price declines.
128
Report of Independent Registered Public Accounting Firm
To the Board of Trustees of The Target Portfolio Trust and Shareholders of PGIM Core Bond Fund and PGIM Corporate Bond Fund
Opinions on the Financial Statements
We have audited the accompanying statements of assets and liabilities, including the schedules of investments, of PGIM Core Bond Fund and PGIM Corporate Bond Fund (two of the funds constituting The Target Portfolio Trust, referred to hereafter as the “Funds”) as of July 31, 2024, the related statements of operations for the year ended July 31, 2024, the statements of changes in net assets for each of the two years in the period ended July 31, 2024, including the related notes, and the financial highlights for each of the four years in the period ended July 31, 2024 (collectively referred to as the “financial statements”). In our opinion, the financial statements present fairly, in all material respects, the financial position of the Funds as of July 31, 2024, the results each of their operations for the year then ended, the changes in each of their net assets for each of the two years in the period ended July 31, 2024 and each of the financial highlights for each of the four years in the period ended July 31, 2024 in conformity with accounting principles generally accepted in the United States of America.
The financial statements of the Funds as of and for the year ended July 31, 2020 and the financial highlights for the year ended July 31, 2020 (not presented herein, other than the financial highlights) were audited by other auditors whose report dated September 18, 2020 expressed an unqualified opinion on those financial statements and financial highlights.
Basis for Opinions
These financial statements are the responsibility of the Funds’ management. Our responsibility is to express an opinion on the Funds’ financial statements based on our audits. We are a public accounting firm registered with the Public Company Accounting Oversight Board (United States) (PCAOB) and are required to be independent with respect to the Funds in accordance with the U.S. federal securities laws and the applicable rules and regulations of the Securities and Exchange Commission and the PCAOB.
We conducted our audits of these financial statements in accordance with the standards of the PCAOB. Those standards require that we plan and perform the audit to obtain reasonable assurance about whether the financial statements are free of material misstatement, whether due to error or fraud.
Our audits included performing procedures to assess the risks of material misstatement of the financial statements, whether due to error or fraud, and performing procedures that respond to those risks. Such procedures included examining, on a test basis, evidence regarding the amounts and disclosures in the financial statements. Our audits also included evaluating the accounting principles used and significant estimates made by management, as well as evaluating the overall presentation of the financial statements. Our procedures included confirmation of securities owned as of July 31, 2024 by correspondence with the custodian, transfer agent and brokers; when replies were not received from brokers, we performed other auditing procedures. We believe that our audits provide a reasonable basis for our opinions.
/s/PricewaterhouseCoopers LLP
New York, New York
September 20, 2024
We have served as the auditor of one or more investment companies in the PGIM Retail Funds complex since 2020.
129
Other Information
Form N-CSR Item 8 - Changes in and Disagreements with Accountants for Open-End Management Investment Companies - None.
Form N-CSR Item 9 - Proxy Disclosures for Open-End Management Investment Companies- None.
Form N-CSR Item 10 - Remuneration Paid to Directors, Officers, and Others of Open-End Management Investment Companies – Included as part of the financial statements filed under Item 7 of this Form.
Form N-CSR Item 11 - Statement Regarding Basis for Approval of Investment Advisory Contract.
Approval of Advisory Agreements
PGIM Core Bond Fund
The Fund’s Board of Trustees
The Board of Trustees (the “Board”) of PGIM Core Bond Fund (the “Fund”)1 consists of ten individuals, eight of whom are not “interested persons” of the Fund, as defined in the Investment Company Act of 1940, as amended (the “1940 Act”) (the “Independent Trustees”). The Board is responsible for the oversight of the Fund and its operations, and performs the various duties imposed on the directors of investment companies by the 1940 Act. The Independent Trustees have retained independent legal counsel to assist them in connection with their duties. The Chair of the Board is an Independent Trustee. The Board has established five standing committees: the Audit Committee, the Nominating and Governance Committee, the Compliance Committee and two Investment Committees. Each committee is chaired by, and composed of, Independent Trustees.
Annual Approval of the Fund’s Advisory Agreements
As required under the 1940 Act, the Board determines annually whether to renew the Fund’s management agreement with PGIM Investments LLC (“PGIM Investments”), the Fund’s subadvisory agreement with PGIM, Inc. (“PGIM”) on behalf of its PGIM Fixed Income unit, and PGIM Limited (“PGIML”). In considering the renewal of the agreements, the Board, including all the Independent Trustees, met on May 28 and June 4-6, 2024 (the “Board Meeting”) and approved the renewal of the agreements through July 31, 2025, after concluding that the renewal of the agreements was in the best interests of the Fund and its shareholders.
In advance of the meetings, the Board requested and received materials relating to the agreements, and had the opportunity to ask questions and request further information in connection with its consideration. Among other things, the Board considered comparative fee information from PGIM Investments, PGIM, and, where appropriate, affiliates of PGIM. Also, the Board considered comparisons with other mutual funds in relevant peer universes and peer groups, as is further discussed below.
In approving the agreements, the Board, including the Independent Trustees advised by independent legal counsel, considered the factors it deemed relevant, including the nature, quality and extent of services provided by PGIM Investments, the subadviser and, as relevant, its affiliates the performance of the Fund, the profitability of PGIM Investments and its affiliates, expenses and fees, and the potential for economies of scale that may be shared with the Fund and its shareholders as the Fund’s assets grow. In their deliberations, the Trustees did not identify any single factor which alone was responsible for the Board’s
| 1 | PGIM Core Bond Fund is a series of The Target Portfolio Trust. |
PGIM Core Bond Fund
Approval of Advisory Agreements (continued)
decision to approve an agreement with respect to the Fund. In connection with its deliberations, the Board considered information provided by PGIM Investments throughout the year at regular and special Board meetings, presentations from portfolio managers and other information, as well as information furnished at or in advance of the Board Meeting.
The Trustees determined that the overall arrangements between the Fund and PGIM Investments, which serves as the Fund’s investment manager pursuant to a management agreement, and between PGIM Investments and each of PGIML and PGIM, through its PGIM Fixed Income unit, which serve as the Fund’s subadvisers pursuant to the terms of a subadvisory agreement with PGIM Investments, are in the best interests of the Fund and its shareholders in light of the services performed, fees charged and such other matters as the Trustees considered relevant in the exercise of their business judgment. The Board considered the approval of the agreements for the Fund as part of its consideration of agreements for multiple funds, but its approvals were made on a fund-by-fund basis.
The material factors and conclusions that formed the basis for the Trustees’ reaching their determinations to approve the continuance of the agreements are separately discussed below.
Nature, Quality, and Extent of Services
The Board received and considered information regarding the nature, quality and extent of services provided to the Fund by PGIM Investments, PGIM Fixed Income, and PGIML. The Board noted that PGIM Fixed Income and PGIML are affiliated with PGIM Investments. The Board considered the services provided by PGIM Investments, including but not limited to the oversight of the subadviser for the Fund, as well as the provision of accounting oversight, fund recordkeeping, compliance and other services to the Fund, such as PGIM Investments’ role as administrator for the Fund’s liquidity risk management program and as valuation designee. With respect to PGIM Investments’ oversight of the subadviser and, the Board noted that PGIM Investments’ Strategic Investment Research Group (“SIRG”), which is a business unit of PGIM Investments, is responsible for monitoring and reporting to PGIM Investments’ senior management on the performance and operations of the subadviser. The Board also considered that PGIM Investments pays the salaries of all of the officers and interested Trustees of the Fund who are part of Fund management. The Board also considered the investment subadvisory services provided by PGIM Fixed Income and PGIML, including investment research and security selection, as well as adherence to the Fund’s investment restrictions and compliance with applicable Fund policies and procedures. The Board considered PGIM Investments’ evaluation of the subadviser, as well as PGIM Investments’ recommendation, based on its review of the subadviser, to renew the subadvisory agreement.
Visit our website at pgim.com/investments
The Board considered the qualifications, backgrounds and responsibilities of PGIM Investments’ senior management responsible for the oversight of the Fund, PGIM Fixed Income, and PGIML, and also considered the qualifications, backgrounds and responsibilities of PGIM Fixed Income’s portfolio managers who are responsible for the day-to-day management of the Fund’s portfolio. The Board was provided with information pertaining to PGIM Investments’, PGIM Fixed Income’s, and PGIML’s organizational structure, senior management, investment operations, and other relevant information pertaining to PGIM Investments, PGIM Fixed Income, and PGIML. The Board also noted that it received favorable compliance reports from the Fund’s Chief Compliance Officer (“CCO”) as to PGIM Investments, PGIM Fixed Income, and PGIML.
The Board concluded that it was satisfied with the nature, extent and quality of the investment management services provided by PGIM Investments, the subadvisory services provided to the Fund by PGIM Fixed Income and PGIML, and that there was a reasonable basis on which to conclude that the Fund benefits from the services provided by PGIM Investments, PGIM Fixed Income, and PGIML under the management and subadvisory agreements.
Costs of Services and Profits Realized by PGIM Investments
The Board was provided with information on the profitability of PGIM Investments and its affiliates in serving as the Fund’s investment manager. The Board discussed with PGIM Investments the methodology utilized in assembling the information regarding profitability and considered its reasonableness. The Board recognized that it is difficult to make comparisons of profitability from fund management contracts because comparative information is not generally publicly available and is affected by numerous factors, including the structure of the particular adviser, the types of funds it manages, its business mix, numerous assumptions regarding allocations of direct and indirect costs, and the adviser’s capital structure and cost of capital. Taking these factors into account, the Board concluded that the profitability of PGIM Investments and its affiliates in relation to the services rendered was not unreasonable.
Economies of Scale
The Board received and discussed information concerning economies of scale that PGIM Investments may realize as the Fund’s assets grow beyond current levels. The Board noted that the management fee schedule for the Fund includes breakpoints, which have the effect of decreasing the fee rate as assets increase. During the course of time, the Board has considered information regarding the launch date of the Fund, the management fees of the Fund compared to those of similarly managed funds and PGIM Investments’ investment in the Fund over time. The Board noted that economies of scale can be shared with the Fund in other ways, including low management fees from inception, additional
PGIM Core Bond Fund
Approval of Advisory Agreements (continued)
technological and personnel investments to enhance shareholder services, and maintaining existing expense structures in the face of a rising cost environment. The Board also considered PGIM Investments’ assertion that it continually evaluates the management fee schedule of the Fund and the potential to share economies of scale through breakpoints or fee waivers as asset levels increase.
The Board recognized the inherent limitations of any analysis of economies of scale, stemming largely from the Board’s understanding that most of PGIM Investments’ costs are not specific to individual funds, but rather are incurred across a variety of products and services.
Other Benefits to PGIM Investments, PGIM Fixed Income, and PGIML
The Board considered potential ancillary benefits that might be received by PGIM Investments, PGIM Fixed Income, PGIML and their affiliates as a result of their relationship with the Fund. The Board concluded that potential benefits to be derived by PGIM Investments included transfer agency fees received by the Fund’s transfer agent (which is affiliated with PGIM Investments), as well as benefits to its reputation or other intangible benefits resulting from PGIM Investments’ association with the Fund. The Board concluded that the potential benefits to be derived by PGIM Fixed Income and PGIML included the ability to use soft dollar credits, as well as the potential benefits consistent with those generally resulting from an increase in assets under management, specifically, potential access to additional research resources and benefits to their reputations. The Board concluded that the benefits derived by PGIM Investments, PGIM Fixed Income, and PGIML were consistent with the types of benefits generally derived by investment managers and subadvisers to mutual funds.
Performance of the Fund / Fees and Expenses
The Board considered certain additional factors and made related conclusions relating to the historical performance of the Fund for the one-, three-, five- and ten-year periods ended December 31, 2023.
The Board also considered the Fund’s actual management fee, as well as the Fund’s net total expense ratio, for the fiscal year ended July 31, 2023. The Board considered the management fee for the Fund as compared to the management fee charged by PGIM Investments to other funds and the fee charged by other advisers to comparable mutual funds in a peer group. The actual management fee represents the fee rate actually paid by Fund shareholders and includes any fee waivers or reimbursements. The net total expense ratio for the Fund represents the actual expense ratio incurred by Fund shareholders.
The mutual funds included in the peer universe, which was used to consider performance, and the peer group, which was used to consider fees and expenses, were objectively
Visit our website at pgim.com/investments
determined by Broadridge, an independent provider of mutual fund data. In certain circumstances, PGIM Investments also provided supplemental peer universe or peer group information, for reasons addressed with the Board. The comparisons placed the Fund in various quartiles over various periods, with the first quartile being the best 25% of the mutual funds (for performance, the best performing mutual funds and, for expenses, the lowest cost mutual funds).
The section below summarizes key factors considered by the Board and the Board’s conclusions regarding the Fund’s performance, fees and overall expenses. The table sets forth net performance comparisons (which reflect the impact on performance of fund expenses, or any subsidies, expense caps or waivers that may be applicable) with the peer universe, actual management fees with the peer group (which reflect the impact of any subsidies or fee waivers), and net total expenses with the peer group, each of which were key factors considered by the Board.
| | | | | | | | |
| Net Performance | | 1 Year | | 3 Years | | 5 Years | | 10 Years |
| | 1st Quartile | | 2nd Quartile | | 2nd Quartile | | 3rd Quartile |
| Actual Management Fees: 1st Quartile |
| Net Total Expenses: 1st Quartile |
| ● | The Board noted that the Fund outperformed its benchmark index over the one- and five- year periods and underperformed its benchmark index over the other periods. |
| ● | The Board also considered that a portfolio manager was added to the investment team in 2021. |
| ● | The Board and PGIM Investments agreed to retain the Fund’s existing contractual expense cap, which (exclusive of certain fees and expenses) caps total annual operating expenses at 0.70% for Class A shares, 1.45% for Class C shares, 0.95% for Class R shares, 0.33% for Class Z shares, and 0.32% for Class R6 shares through November 30, 2024. |
| ● | In addition, PGIM Investments will waive management fees or shared operating expenses on any share class to the same extent that it waives such expenses on any other share class, and has agreed that total annual fund operating expenses for Class R6 shares will not exceed total annual fund operating expenses for Class Z shares. |
| ● | The Board concluded that, in light of the above, it would be in the best interests of the Fund and its shareholders to renew the agreements. |
| ● | The Board concluded that the management fees (including subadvisory fees) and total expenses were reasonable in light of the services provided. |
* * *
After full consideration of these factors, the Board concluded that the approval of the agreements was in the best interests of the Fund and its shareholders.
PGIM Core Bond Fund
Approval of Advisory Agreements
PGIM Corporate Bond Fund
The Fund’s Board of Trustees
The Board of Trustees (the “Board”) of PGIM Corporate Bond Fund (the “Fund”)1 consists of ten individuals, eight of whom are not “interested persons” of the Fund, as defined in the Investment Company Act of 1940, as amended (the “1940 Act”) (the “Independent Trustees”). The Board is responsible for the oversight of the Fund and its operations, and performs the various duties imposed on the directors of investment companies by the 1940 Act. The Independent Trustees have retained independent legal counsel to assist them in connection with their duties. The Chair of the Board is an Independent Trustee. The Board has established five standing committees: the Audit Committee, the Nominating and Governance Committee, the Compliance Committee and two Investment Committees. Each committee is chaired by, and composed of, Independent Trustees.
Annual Approval of the Fund’s Advisory Agreements
As required under the 1940 Act, the Board determines annually whether to renew the Fund’s management agreement with PGIM Investments LLC (“PGIM Investments”) and the Fund’s subadvisory agreement with PGIM, Inc. (“PGIM”) on behalf of its PGIM Fixed Income unit (“PGIM Fixed Income”) and PGIM Limited (“PGIML”). In considering the renewal of the agreements, the Board, including all of the Independent Trustees, met on May 28 and June 4-6, 2024 (the “Board Meeting”) and approved the renewal of the agreements through July 31, 2025, after concluding that the renewal of the agreements was in the best interests of the Fund and its shareholders.
In advance of the meetings, the Board requested and received materials relating to the agreements, and had the opportunity to ask questions and request further information in connection with its consideration. Among other things, the Board considered comparative fee information from PGIM Investments and PGIM. Also, the Board considered comparisons with other mutual funds in relevant peer universes and peer groups, as is further discussed below.
In approving the agreements, the Board, including the Independent Trustees advised by independent legal counsel, considered the factors it deemed relevant, including the nature, quality and extent of services provided by PGIM Investments and the subadvisers, the performance of the Fund, the profitability of PGIM Investments and its affiliates, expenses and fees, and the potential for economies of scale that may be shared with the Fund and its shareholders as the Fund’s assets grow. In their deliberations, the Trustees did not identify
| 1 | PGIM Corporate Bond Fund is a series of The Target Portfolio Trust. |
Visit our website at pgim.com/investments
any single factor which alone was responsible for the Board’s decision to approve an agreement with respect to the Fund. In connection with its deliberations, the Board considered information provided by PGIM Investments throughout the year at regular and special Board meetings, presentations from portfolio managers and other information, as well as information furnished at or in advance of the Board Meeting.
The Trustees determined that the overall arrangements between the Fund and PGIM Investments, which serves as the Fund’s investment manager pursuant to a management agreement, and between PGIM Investments, PGIML and PGIM, through its PGIM Fixed Income unit, which serve as the Fund’s subadvisers pursuant to the terms of a subadvisory agreement with PGIM Investments, are in the best interests of the Fund and its shareholders in light of the services performed, fees charged and such other matters as the Trustees considered relevant in the exercise of their business judgment. The Board considered the approval of the agreements for the Fund as part of its consideration of agreements for multiple funds, but its approvals were made on a fund-by-fund basis.
The material factors and conclusions that formed the basis for the Trustees’ reaching their determinations to approve the continuance of the agreements are separately discussed below.
Nature, Quality, and Extent of Services
The Board received and considered information regarding the nature, quality and extent of services provided to the Fund by PGIM Investments, PGIM Fixed Income and PGIML. The Board noted that PGIM Fixed Income and PGIML are affiliated with PGIM Investments. The Board considered the services provided by PGIM Investments, including but not limited to the oversight of the subadvisers for the Fund, as well as the provision of accounting oversight, fund recordkeeping, compliance and other services to the Fund, such as PGIM Investments’ role as administrator for the Fund’s liquidity risk management program and as valuation designee. With respect to PGIM Investments’ oversight of the subadvisers, the Board noted that PGIM Investments’ Strategic Investment Research Group (“SIRG”), which is a business unit of PGIM Investments, is responsible for monitoring and reporting to PGIM Investments’ senior management on the performance and operations of the subadvisers. The Board also considered that PGIM Investments pays the salaries of all of the officers and interested Trustees of the Fund who are part of Fund management. The Board also considered the investment subadvisory services provided by PGIM Fixed Income and PGIML, including investment research and security selection, as well as adherence to the Fund’s investment restrictions and compliance with applicable Fund policies and procedures. The Board considered PGIM Investments’ evaluation of the subadvisers, as well as PGIM Investments’ recommendation, based on its review of the subadvisers, to renew the subadvisory agreement.
PGIM Corporate Bond Fund
Approval of Advisory Agreements (continued)
The Board considered the qualifications, backgrounds and responsibilities of PGIM Investments’ senior management responsible for the oversight of the Fund PGIM Fixed Income and PGIML, and also considered the qualifications, backgrounds and responsibilities of PGIM Fixed Income’s and PGIML’s portfolio managers who are responsible for the day-to-day management of the Fund’s portfolio. The Board was provided with information pertaining to PGIM Investments’, PGIM Fixed Income’s and PGIML’s organizational structure, senior management, investment operations, and other relevant information pertaining to PGIM Investments, PGIM Fixed Income and PGIML. The Board also noted that it received favorable compliance reports from the Fund’s Chief Compliance Officer (“CCO”) as to PGIM Investments, PGIM Fixed Income and PGIML.
The Board concluded that it was satisfied with the nature, extent and quality of the investment management services provided by PGIM Investments and the subadvisory services provided to the Fund by PGIM Fixed Income and PGIML, and that there was a reasonable basis on which to conclude that the Fund benefits from the services provided by PGIM Investments, PGIM Fixed Income and PGIML under the management and subadvisory agreements.
Costs of Services and Profits Realized by PGIM Investments
The Board was provided with information on the profitability of PGIM Investments and its affiliates in serving as the Fund’s investment manager. The Board discussed with PGIM Investments the methodology utilized in assembling the information regarding profitability and considered its reasonableness. The Board recognized that it is difficult to make comparisons of profitability from fund management contracts because comparative information is not generally publicly available and is affected by numerous factors, including the structure of the particular adviser, the types of funds it manages, its business mix, numerous assumptions regarding allocations of direct and indirect costs, and the adviser’s capital structure and cost of capital. However, the Board considered that the cost of services provided by PGIM Investments for the year ended December 31, 2023 exceeded the management fees received by PGIM Investments, resulting in an operating loss to PGIM Investments. Taking these factors into account, the Board concluded that the profitability of PGIM Investments and its affiliates in relation to the services rendered was not unreasonable.
Economies of Scale
The Board received and discussed information concerning economies of scale that PGIM Investments may realize as the Fund’s assets grow beyond current levels. The Board noted that the management fee schedule for the Fund includes breakpoints, which have the effect of decreasing the fee rate as assets increase. During the course of time, the Board
Visit our website at pgim.com/investments
has considered information regarding the launch date of the Fund, the management fees of the Fund compared to those of similarly managed funds and PGIM Investments’ investment in the Fund over time. The Board noted that economies of scale can be shared with the Fund in other ways, including low management fees from inception, additional technological and personnel investments to enhance shareholder services, and maintaining existing expense structures in the face of a rising cost environment. The Board also considered PGIM Investments’ assertion that it continually evaluates the management fee schedule of the Fund and the potential to share economies of scale through breakpoints or fee waivers as asset levels increase.
The Board recognized the inherent limitations of any analysis of economies of scale, stemming largely from the Board’s understanding that most of PGIM Investments’ costs are not specific to individual funds, but rather are incurred across a variety of products and services.
Other Benefits to PGIM Investments, PGIM Fixed Income and PGIML
The Board considered potential ancillary benefits that might be received by PGIM Investments, PGIM Fixed Income, PGIML and their affiliates as a result of their relationship with the Fund. The Board concluded that potential benefits to be derived by PGIM Investments included transfer agency fees received by the Fund’s transfer agent (which is affiliated with PGIM Investments), as well as benefits to its reputation or other intangible benefits resulting from PGIM Investments’ association with the Fund. The Board concluded that the potential benefits to be derived by PGIM Fixed Income and PGIML included those generally resulting from an increase in assets under management, specifically, potential access to additional research resources and benefits to its reputation. The Board concluded that the benefits derived by PGIM Investments, PGIM Fixed Income and PGIML were consistent with the types of benefits generally derived by investment managers and subadvisers to mutual funds.
Performance of the Fund / Fees and Expenses
The Board considered certain additional factors and made related conclusions relating to the historical performance of the Fund for the one-, three-, five- and ten-year periods ended December 31, 2023.
The Board also considered the Fund’s actual management fee, as well as the Fund’s net total expense ratio, for the fiscal year ended July 31, 2023. The Board considered the management fee for the Fund as compared to the management fee charged by PGIM Investments to other funds and the fee charged by other advisers to comparable mutual funds in a peer group. The actual management fee represents the fee rate actually paid by
PGIM Corporate Bond Fund
Approval of Advisory Agreements (continued)
Fund shareholders and includes any fee waivers or reimbursements. The net total expense ratio for the Fund represents the actual expense ratio incurred by Fund shareholders.
The mutual funds included in the peer universe, which was used to consider performance, and the peer group, which was used to consider expenses and fees, were objectively determined by Broadridge, an independent provider of mutual fund data. In certain circumstances, PGIM Investments also provided supplemental peer universe or peer group information, for reasons addressed with the Board. The comparisons placed the Fund in various quartiles over various periods, with the first quartile being the best 25% of the mutual funds (for performance, the best performing mutual funds and, for expenses, the lowest cost mutual funds).
The section below summarizes key factors considered by the Board and the Board’s conclusions regarding the Fund’s performance, fees and overall expenses. The table sets forth net performance comparisons (which reflect the impact on performance of fund expenses, or any subsidies, expense caps or waivers that may be applicable) with the peer universe, actual management fees with the peer group (which reflect the impact of any subsidies or fee waivers), and net total expenses with the peer group, each of which were key factors considered by the Board.
| | | | | | | | |
| Net Performance | | 1 Year | | 3 Years | | 5 Years | | 10 Years |
| | 1st Quartile | | 2nd Quartile | | 2nd Quartile | | 3rd Quartile |
| Actual Management Fees: 1st Quartile |
| Net Total Expenses: 1st Quartile |
| ● | The Board noted that the Fund outperformed its benchmark index over the one-year period and underperformed over the other periods. |
| ● | The Board considered that the Fund outperformed its benchmark index over the last quarter of 2023, the first quarter of 2024 and over the one-, five-, and ten-year periods ended March 31, 2024. |
| ● | The Board and PGIM Investments agreed to retain the Fund’s existing contractual expense cap, which (exclusive of certain fees and expenses) caps total annual operating expenses at 0.80% for Class A shares, 1.55% for Class C shares, 0.55% for Class R6 shares, 1.05% for Class R shares and 0.55% for Class Z shares through November 30, 2024. |
| ● | In addition, PGIM Investments will waive management fees or shared operating expenses on any share class to the same extent that it waives such expenses on any other share class and has agreed that total annual fund operating expenses for Class R6 shares will not exceed total annual fund operating expenses for Class Z shares. |
| ● | The Board concluded that, in light of the above, it would be in the best interests of the Fund and its shareholders to renew the agreements. |
Visit our website at pgim.com/investments
| ● | The Board concluded that the management fees (including subadvisory fees) and total expenses were reasonable in light of the services provided. |
* * *
After full consideration of these factors, the Board concluded that the approval of the agreements was in the best interests of the Fund and its shareholders.
PGIM Corporate Bond Fund
| Item 12 – | Disclosure of Proxy Voting Policies and Procedures for Closed-End Management Investment Companies – Not applicable. |
| Item 13 – | Portfolio Managers of Closed-End Management Investment Companies – Not applicable. |
| Item 14 – | Purchases of Equity Securities by Closed-End Management Investment Company and Affiliated Purchasers – Not applicable. |
| Item 15 – | Submission of Matters to a Vote of Security Holders – There have been no material changes to the procedures by which shareholders may recommend nominees to the registrant’s board of directors. |
| Item 16 – | Controls and Procedures |
| | (a) | It is the conclusion of the registrant’s principal executive officer and principal financial officer that the effectiveness of the registrant’s current disclosure controls and procedures (such disclosure controls and procedures having been evaluated within 90 days of the date of this filing) provide reasonable assurance that the information required to be disclosed by the registrant has been recorded, processed, summarized and reported within the time period specified in the Commission’s rules and forms and that the information required to be disclosed by the registrant has been accumulated and communicated to the registrant’s principal executive officer and principal financial officer in order to allow timely decisions regarding required disclosure. |
| | (b) | There has been no significant change in the registrant’s internal control over financial reporting (as defined in Rule 30a-3(d) under the Act (17 CFR 270.30a-3(d))) that occurred during the period covered by this report that has materially affected, or is reasonably likely to materially affect, the registrant’s internal control over financial reporting. |
| Item 17 – | Disclosure of Securities Lending Activities for Closed-End Management Investment Companies – Not applicable. |
| Item 18 – | Recovery of Erroneously Awarded Compensation – Not applicable. |
| | (a)(2) | Policy required by the listing standards adopted pursuant to Rule 10D-1 under the Securities Exchange Act of 1934 – Not applicable. |
| | (a)(3)(1) | Any written solicitation to purchase securities under Rule 23c-1 under the Investment Company Act of 1940 – Not applicable. |
| | (a)(3)(2) | Change in the registrant’s independent public accountant – Not applicable. |
SIGNATURES
Pursuant to the requirements of the Securities Exchange Act of 1934 and the Investment Company Act of 1940, the registrant has duly caused this report to be signed on its behalf by the undersigned, thereunto duly authorized.
| | |
| Registrant: | | The Target Portfolio Trust |
| |
| By: | | /s/ Andrew R. French |
| | Andrew R. French |
| | Secretary |
| |
| Date: | | September 20, 2024 |
Pursuant to the requirements of the Securities Exchange Act of 1934 and the Investment Company Act of 1940, this report has been signed below by the following persons on behalf of the registrant and in the capacities and on the dates indicated.
| | |
| By: | | /s/ Stuart S. Parker |
| | Stuart S. Parker |
| | President and Principal Executive Officer |
| |
| Date: | | September 20, 2024 |
| |
| By: | | /s/ Christian J. Kelly |
| | Christian J. Kelly |
| | Chief Financial Officer (Principal Financial Officer) |
| |
| Date: | | September 20, 2024 |