Vertex Energy, Inc. 8-K
Exhibit 99.2

Third Quarter 2022 Results Conference Call November 2022
Certain of the matters discussed in this communication which are not statements of historical fact constitute forward - looking statements within the meaning of the securities laws, including the Private Securities Litigation Reform Act of 1995 , that involve a number of risks and uncertainties . Words such as “strategy,” “expects,” “continues,” “plans,” “anticipates,” “believes,” “would,” “will,” “estimates,” “intends,” “projects,” “goals,” “targets” and other words of similar meaning are intended to identify forward - looking statements but are not the exclusive means of identifying these statements . Any statements made in this news release other than those of historical fact, about an action, event or development, are forward - looking statements . The important factors that may cause actual results and outcomes to differ materially from those contained in such forward - looking statements include, without limitation, the Company’s projected Outlook for the fourth quarter of 2022 , as discussed above ; the Company’s ability to raise sufficient capital to complete future capital projects and the terms of such funding, to the extent necessary ; the timing of planned capital projects at the Mobile Refinery and the outcome thereof ; the future production of the Mobile Refinery ; the estimated timeline of the renewable diesel capital project, estimated and actual production associated therewith, estimated revenues over the course of the agreement with Idemitsu , anticipated and unforeseen events which could reduce future production at the refinery or delay planned capital projects, changes in commodity and credits values, and certain early termination rights associated with the Idemitsu agreement and conditions precedent to such agreement ; certain mandatory redemption provisions of the outstanding senior convertible notes, the conversion rights associated therewith, and dilution caused by such conversions ; the Company’s ability to comply with required covenants under outstanding senior notes and a term loan and pay amounts due under such senior notes and term loan, including interest and other amounts due thereunder ; the ability of the Company to retain and hire key personnel ; risks associated with the ability of Vertex to complete current plans for expansion and growth, and planned capital projects ; the level of competition in our industry and our ability to compete ; our ability to respond to changes in our industry ; the loss of key personnel or failure to attract, integrate and retain additional personnel ; our ability to protect our intellectual property and not infringe on others’ intellectual property ; our ability to scale our business ; our ability to maintain supplier relationships and obtain adequate supplies of feedstocks ; our ability to obtain and retain customers ; our ability to produce our products at competitive rates ; our ability to execute our business strategy in a very competitive environment ; trends in, and the market for, the price of oil and gas and alternative energy sources ; the impact of inflation on margins and costs ; the volatile nature of the prices for oil and gas caused by supply and demand, including volatility caused by the ongoing Ukraine/Russia conflict ; our ability to maintain our relationships with our partners ; the impact of competitive services and products ; the outcome of pending and potential future litigation, judgments and settlements ; rules and regulations making our operations more costly or restrictive ; changes in environmental and other laws and regulations and risks associated with such laws and regulations ; economic downturns both in the United States and globally, increases in inflation and interest rates, increased costs of borrowing associated therewith and potential declines in the availability of such funding ; risk of increased regulation of our operations and products ; disruptions in the infrastructure that we and our partners rely on ; interruptions at our facilities ; unexpected and expected changes in our anticipated capital expenditures resulting from unforeseen or planned required maintenance, repairs, or upgrades ; our ability to acquire and construct new facilities ; our ability to effectively manage our growth ; decreases in global demand for, and the price of, oil, due to COVID - 19 , state, federal and foreign responses thereto, inflation, recessions or other reasons, including declines in economic activity or global conflicts ; our ability to acquire sufficient amounts of used oil feedstock through our collection routes, to produce finished products, and in the absence of such internally collected feedstocks, and our ability to acquire third - party feedstocks on commercially reasonable terms ; unexpected downtime at our facilities ; risks associated with COVID - 19 , the global efforts to stop the spread of COVID - 19 , potential downturns in the U . S . and global economies due to COVID - 19 and the efforts to stop the spread of the virus, and COVID - 19 in general ; anti - dilutive rights associated with our outstanding securities ; our level of indebtedness, which could affect our ability to fulfill our obligations, impede the implementation of our strategy, and expose us to interest rate risk ; dependence on third party transportation services and pipelines ; risks related to obtaining required crude oil supplies, and the costs of such supplies ; counterparty credit and performance risk ; unanticipated problems at, or downtime effecting, our facilities and those operated by third parties ; risks relating to our hedging activities ; and risks relating to planned divestitures and acquisitions . Other important factors that may cause actual results and outcomes to differ materially from those contained in the forward - looking statements included in this communication are described in the Company’s publicly filed reports, including, but not limited to, the Company’s Annual Report on Form 10 - K for the year ended December 31 , 2021 , and the Company’s Quarterly Report on Form 10 - Q for the quarter ended September 30 , 2022 and future Annual Reports on Form 10 - K and Quarterly Reports on Form 10 - Q . These reports are available at www . sec . gov . The Company cautions that the foregoing list of important factors is not complete . All subsequent written and oral forward - looking statements attributable to the Company or any person acting on behalf of the Company are expressly qualified in their entirety by the cautionary statements referenced above . Other unknown or unpredictable factors also could have material adverse effects on Vertex’s future results . The forward - looking statements included in this document are made only as of the date hereof . Vertex cannot guarantee future results, levels of activity, performance or achievements . Accordingly, you should not place undue reliance on these forward - looking statements . Finally, Vertex undertakes no obligation to update these statements after the date of this release, except as required by law, and takes no obligation to update or correct information prepared by third parties that are not paid for by Vertex . If we update one or more forward - looking statements, no inference should be drawn that we will make additional updates with respect to those or other forward - looking statements . The financial projections (the “Projections”) included herein were prepared by Vertex in good faith using assumptions believed to be reasonable . A significant number of assumptions about the operations of the business of Vertex were based, in part, on economic, competitive, and general business conditions prevailing at the time the Projections were developed . Any future changes in these conditions, may materially impact the ability of Vertex to achieve the financial results set forth in the Projections . The Projections are based on numerous assumptions, including realization of the operating strategy of Vertex ; industry performance ; no material adverse changes in applicable legislation or regulations, or the administration thereof, or generally accepted accounting principles ; general business and economic conditions ; competition ; retention of key management and other key employees ; absence of material contingent or unliquidated litigation, indemnity, or other claims ; minimal changes in current pricing ; static material and equipment pricing ; no significant increases in interest rates or inflation ; and other matters, many of which will be beyond the control of Vertex, and some or all of which may not materialize . The Projections also assume the continued uptime of the Company’s facilities at historical levels and the successful funding of, timely completion of, and successful outcome of, planned capital projects . Additionally, to the extent that the assumptions inherent in the Projections are based upon future business decisions and objectives, they are subject to change . Although the Projections are presented with numerical specificity and are based on reasonable expectations developed by Vertex’s management, the assumptions and estimates underlying the Projections are subject to significant business, economic, and competitive uncertainties and contingencies, many of which will be beyond the control of Vertex . Accordingly, the Projections are only estimates and are necessarily speculative in nature . It is expected that some or all of the assumptions in the Projections will not be realized and that actual results will vary from the Projections . Such variations may be material and may increase over time . In light of the foregoing, readers are cautioned not to place undue reliance on the Projections . The projected financial information contained herein should not be regarded as a representation or warranty by Vertex, its management, advisors, or any other person that the Projections can or will be achieved . Vertex cautions that the Projections are speculative in nature and based upon subjective decisions and assumptions . As a result, the Projections should not be relied on as necessarily predictive of actual future events . DISCLAIMER Forward - looking statement 2
In addition to our results calculated under generally accepted accounting principles in the United States ("GAAP"), in this earnings release we also present Refining Gross Margin, EBITDA and Adjusted EBITDA . Refining Gross Margin, EBITDA and Adjusted EBITDA are “non - GAAP financial measures” presented as supplemental measures of the Company’s performance . They are not presented in accordance with GAAP . Refining gross margin is defined as revenues less the cost of fuel intakes and other fuel costs . It excludes operating expense and depreciation attributable to cost of revenues and other non - operating items in cost of revenues . EBITDA represents net income before interest, taxes, depreciation and amortization, for continued and discontinued operations . Adjusted EBITDA is defined as EBITDA before other income, impairment loss on assets, unrealized (gain)/loss on hedging activities, (gain)/loss on hedge roll (backwardation), environmental clean - up reserve, loss (gain) on change in value of derivative warrant liability, unrealized (gain) loss on derivative instruments, gain (loss) on intermediation agreement, Shell transaction related and acquisition expenses and stock - based compensation expense (for continued and discontinued operations) and other unusual or non - recurring items . Refining gross margin is defined as gross profit (loss) less the cost of fuel intakes and other fuel costs . Refining Gross Margin, EBITDA and Adjusted EBITDA are presented because we believe they provide additional useful information to investors due to the various noncash items during the period . Refining Gross Margin, EBITDA and Adjusted EBITDA are also frequently used by analysts, investors and other interested parties to evaluate companies in our industry . We use Refining Gross Margin, EBITDA and Adjusted EBITDA as supplements to GAAP measures of performance to evaluate the effectiveness of our business strategies, to make budgeting decisions, to allocate resources and to compare our performance relative to our peers . Additionally, these measures, when used in conjunction with related GAAP financial measures, provide investors with an additional financial analytical framework which management uses, in addition to historical operating results, as the basis for financial, operational and planning decisions and present measurements that third parties have indicated are useful in assessing the Company and its results of operations . Refining Gross Margin, EBITDA and Adjusted EBITDA are unaudited, and have limitations as analytical tools, and you should not consider them in isolation, or as a substitute for analysis of our operating results as reported under GAAP . Some of these limitations are : Refining Gross Margin, EBITDA and Adjusted EBITDA do not reflect cash expenditures, or future or contractual commitments ; EBITDA and Adjusted EBITDA do not reflect changes in, or cash requirements for, capital expenditures or working capital needs ; EBITDA and Adjusted EBITDA do not reflect the significant interest expense, or the cash requirements necessary to service interest or principal payments, on debt or cash income tax payments ; although depreciation and amortization are noncash charges, the assets being depreciated and amortized will often have to be replaced in the future, and EBITDA and Adjusted EBITDA do not reflect any cash requirements for such replacements . In addition, other companies in this industry may calculate Refining Gross Margin, EBITDA and Adjusted EBITDA differently than Vertex does, limiting its usefulness as a comparative measure . The Company’s presentation of these measures should not be construed as an inference that future results will be unaffected by unusual or nonrecurring items . We compensate for these limitations by providing a reconciliation of each of these non - GAAP measures to the most comparable GAAP measure . We encourage investors and others to review our business, results of operations, and financial information in their entirety, not to rely on any single financial measure, and to view these non - GAAP measures in conjunction with the most directly comparable GAAP financial measure . For more information on these non - GAAP financial measures, please see the sections titled “Unaudited Reconciliation of Refining Gross Margin and Refining Gross Margin per throughput barrel to Gross Profit”, each included at the end of this release and “Unaudited Consolidated Continued and Discontinued Operations Reconciliations of Net Loss attributable to Vertex Energy, Inc . , to Earnings before Interest, Taxes, Depreciation and Amortization (EBITDA) and Adjusted EBITDA” each included at the end of this release . DISCLAIMER Non - GAAP Financial Measures 3

THIRD QUARTER 2022 Performance Summary
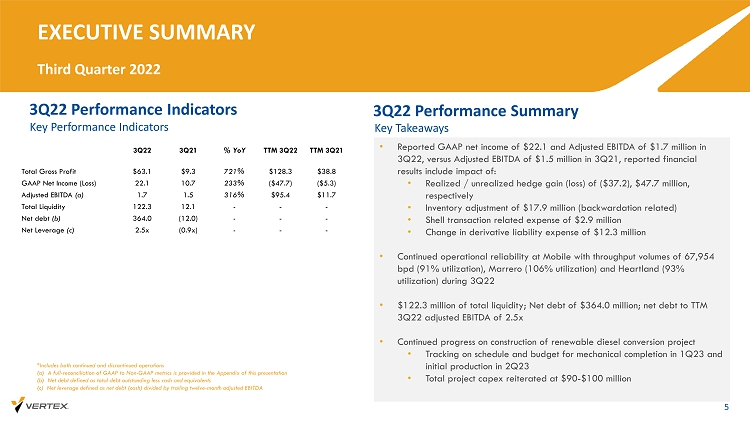
3Q22 Performance Indicators EXECUTIVE SUMMARY Third Quarter 2022 5 *Includes both continued and discontinued operations (a) A full - reconciliation of GAAP to Non - GAAP metrics is provided in the Appendix of this presentation (b) Net debt defined as total debt outstanding less cash and equivalents (c) Net leverage defined as net debt (cash) divided by trailing twelve - month adjusted EBITDA Key Performance Indicators Key Takeaways 3Q22 Performance Summary • Reported GAAP net income of $22.1 and Adjusted EBITDA of $1.7 million in 3Q22, versus Adjusted EBITDA of $1.5 million in 3Q21, reported financial results include impact of: • Realized / unrealized hedge gain (loss) of ($37.2), $47.7 million, respectively • Inventory adjustment of $17.9 million (backwardation related) • Shell transaction related expense of $2.9 million • Change in derivative liability expense of $12.3 million • Continued operational reliability at Mobile with throughput volumes of 67,954 bpd (91% utilization), Marrero (106% utilization) and Heartland (93% utilization) during 3Q22 • $122.3 million of total liquidity; Net debt of $364.0 million; net debt to TTM 3Q22 adjusted EBITDA of 2.5x • Continued progress on construction of renewable diesel conversion project • Tracking on schedule and budget for mechanical completion in 1Q23 and initial production in 2Q23 • Total project capex reiterated at $90 - $100 million 3Q22 3Q21 % YoY TTM 3Q22 TTM 3Q21 Total Gross Profit $63.1 $9.3 721% $128.3 $38.8 GAAP Net Income (Loss) 22.1 10.7 233% ($47.7) ($5.3) Adjusted EBITDA (a) 1.7 1.5 316% $95.4 $11.7 Total Liquidity 122.3 12.1 - - - Net debt (b) 364.0 (12.0) - - - Net Leverage (c) 2.5x (0.9x) - - -
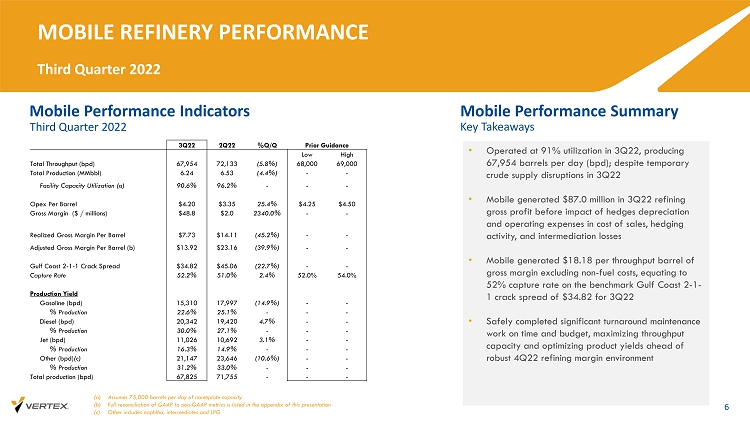
Mobile Performance Indicators MOBILE REFINERY PERFORMANCE Third Quarter 2022 6 Mobile Performance Summary • Operated at 91% utilization in 3Q22, producing 67,954 barrels per day (bpd); despite temporary crude supply disruptions in 3Q22 • Mobile generated $87.0 million in 3Q22 refining gross profit before impact of hedges depreciation and operating expenses in cost of sales, hedging activity, and intermediation losses • Mobile generated $18.18 per throughput barrel of gross margin excluding non - fuel costs, equating to 52% capture rate on the benchmark Gulf Coast 2 - 1 - 1 crack spread of $34.82 for 3Q22 • Safely completed significant turnaround maintenance work on time and budget, maximizing throughput capacity and optimizing product yields ahead of robust 4Q22 refining margin environment (a) Assumes 75,000 barrels per day of nameplate capacity (b) Full reconciliation of GAAP to non - GAAP metrics is listed in the appendix of this presentation (c) Other includes naphtha, intermediates and LPG Third Quarter 2022 Key Takeaways 3Q22 2Q22 %Q/Q Prior Guidance Low High Total Throughput (bpd) 67,954 72,133 (5.8%) 68,000 69,000 Total Production ( MMbbl ) 6.24 6.53 (4.4%) - - Facility Capacity Utilization (a) 90.6% 96.2% - - - Opex Per Barrel $4.20 $3.35 25.4% $4.25 $4.50 Gross Margin ($ / millions) $48.8 $2.0 2340.0% - - Realized Gross Margin Per Barrel $7.73 $14.11 (45.2%) - - Adjusted Gross Margin Per Barrel (b) $13.92 $23.16 (39.9%) - - Gulf Coast 2 - 1 - 1 Crack Spread $34.82 $45.06 (22.7%) - - Capture Rate 52.2% 51.0% 2.4% 52.0% 54.0% Production Yield Gasoline (bpd) 15,310 17,997 (14.9%) - - % Production 22.6% 25.1% - - - Diesel (bpd) 20,342 19,420 4.7% - - % Production 30.0% 27.1% - - - Jet (bpd) 11,026 10,692 3.1% - - % Production 16.3% 14.9% - - - Other (bpd) (c) 21,147 23,646 (10.6%) - - % Production 31.2% 33.0% - - - Total production (bpd) 67,825 71,755 - - -
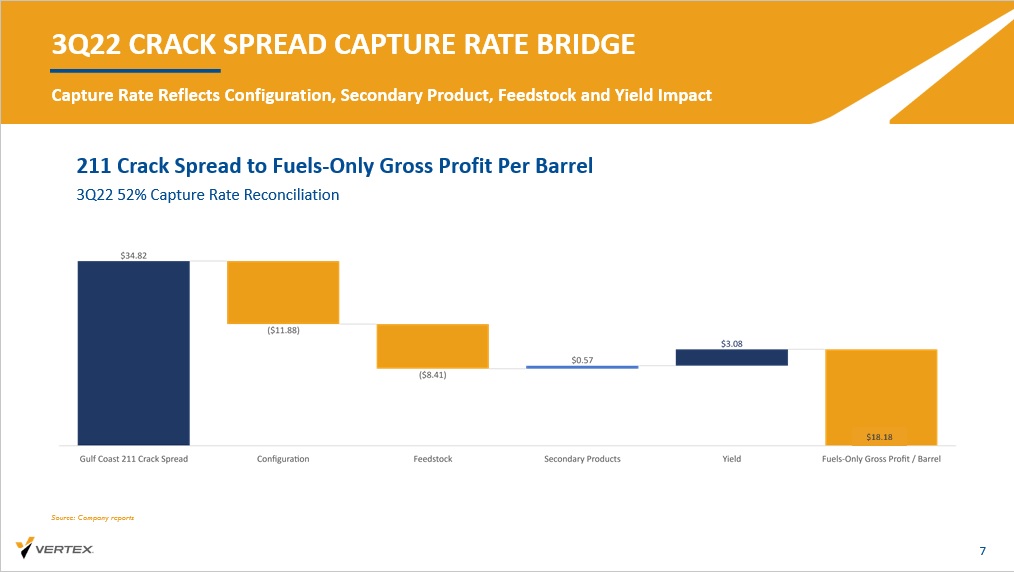
3Q22 CRACK SPREAD CAPTURE RATE BRIDGE 7 211 Crack Spread to Fuels - Only Gross Profit Per Barrel 3Q22 52% Capture Rate Reconciliation $18.18 Source: Company reports Capture Rate Reflects Configuration, Secondary Product, Feedstock and Yield Impact
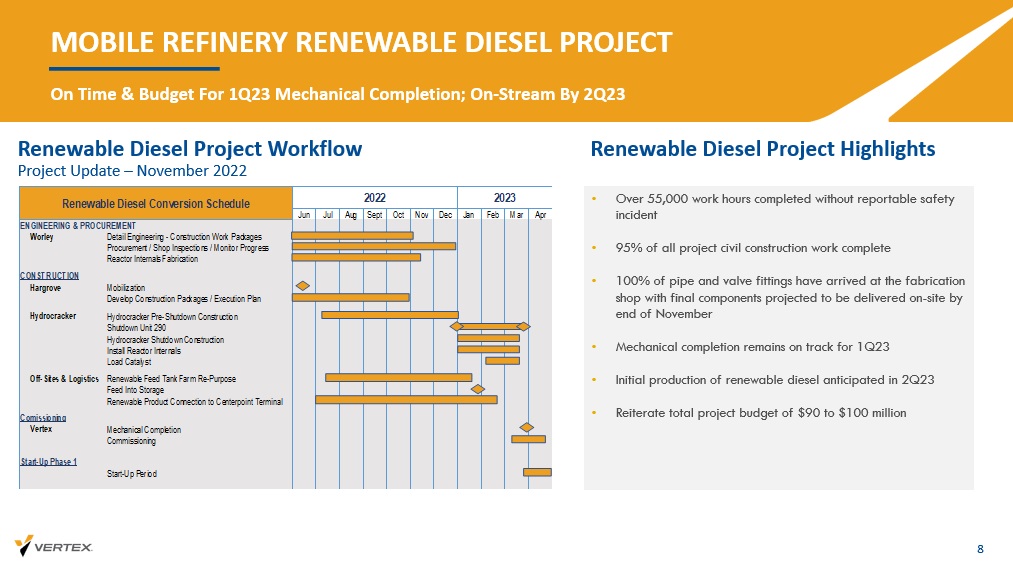
MOBILE REFINERY RENEWABLE DIESEL PROJECT On Time & Budget For 1Q23 Mechanical Completion; On - Stream By 2Q23 8 Renewable Diesel Project Highlights • Over 55,000 work hours completed without reportable safety incident • 95% of all project civil construction work complete • 100% of pipe and valve fittings have arrived at the fabrication shop with final components projected to be delivered on - site by end of November • Mechanical completion remains on track for 1Q23 • Initial production of renewable diesel anticipated in 2Q23 • Reiterate total project budget of $90 to $100 million Renewable Diesel Project Workflow Project Update – November 2022 Jun Jul Aug Sept Oct Nov Dec Jan Feb Mar Apr Worley Detail Engineering - Construction Work Packages Procurement / Shop Inspections / Monitor Progress Reactor Internals Fabrication Hargrove Mobilization Develop Construction Packages / Execution Plan Hydrocracker Hydrocracker Pre-Shutdown Construction Shutdown Unit 290 Hydrocracker Shutdown Construction Install Reactor Internals Load Catalyst Off-Sites & Logistics Renewable Feed Tank Farm Re-Purpose Feed Into Storage Renewable Product Connection to Centerpoint Terminal Vertex Mechanical Completion Commissioning Start-Up Period Start-Up Phase 1 Renewable Diesel Conversion Schedule 2022 2023 ENGINEERING & PROCUREMENT CONSTRUCTION Comissioning
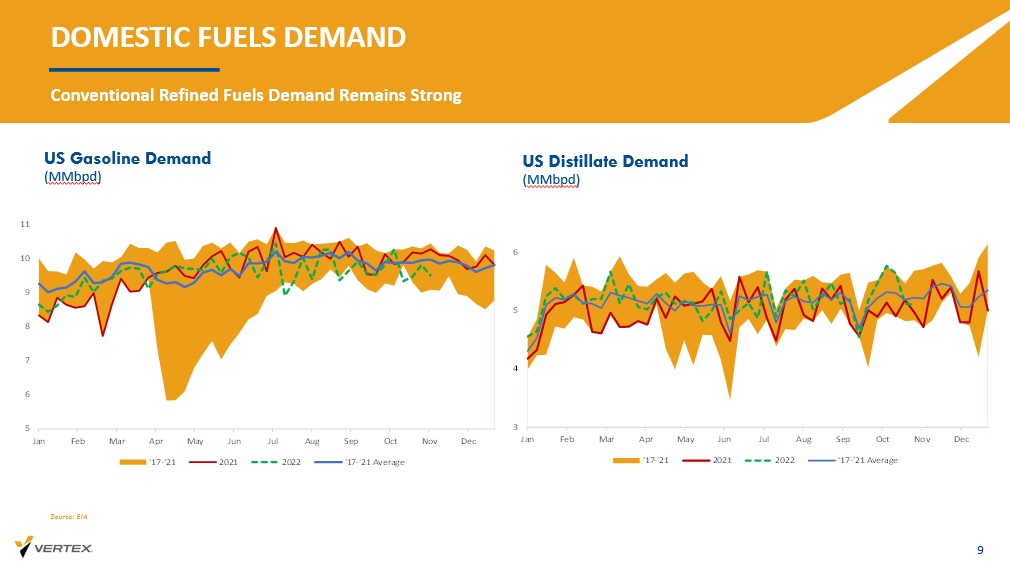
DOMESTIC FUELS DEMAND Conventional Refined Fuels Demand Remains Strong US Gasoline Demand 9 ( MMbpd ) US Distillate Demand ( MMbpd ) Source: EIA 5 6 7 8 9 10 11 Jan Feb Mar Apr May Jun Jul Aug Sep Oct Nov Dec '17-'21 2021 2022 '17-'21 Average 3 4 5 6 Jan Feb Mar Apr May Jun Jul Aug Sep Oct Nov Dec '17-'21 2021 2022 '17-'21 Average
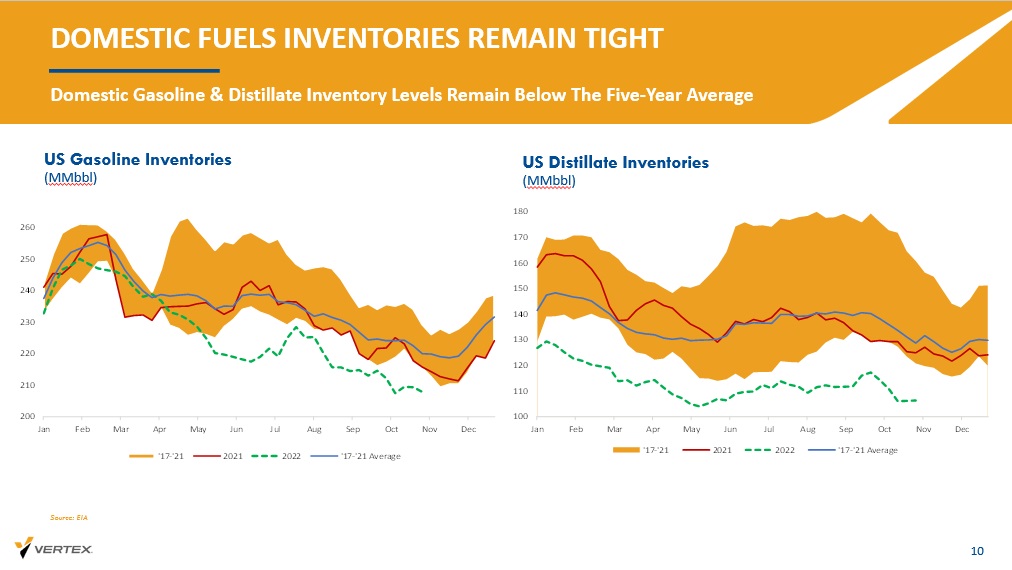
DOMESTIC FUELS INVENTORIES REMAIN TIGHT Domestic Gasoline & Distillate Inventory Levels Remain Below The Five - Year Average US Gasoline Inventories 10 ( MMbbl ) US Distillate Inventories ( MMbbl ) Source: EIA 200 210 220 230 240 250 260 Jan Feb Mar Apr May Jun Jul Aug Sep Oct Nov Dec '17-'21 2021 2022 '17-'21 Average 100 110 120 130 140 150 160 170 180 Jan Feb Mar Apr May Jun Jul Aug Sep Oct Nov Dec '17-'21 2021 2022 '17-'21 Average
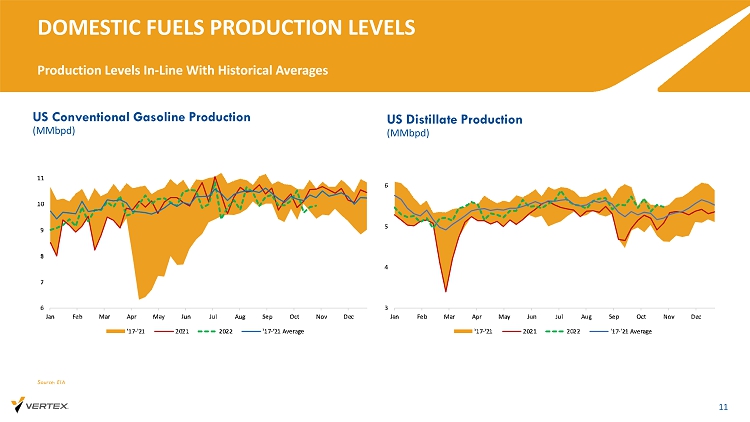
DOMESTIC FUELS PRODUCTION LEVELS Production Levels In - Line With Historical Averages US Conventional Gasoline Production 11 ( MMbpd ) US Distillate Production ( MMbpd ) Source: EIA
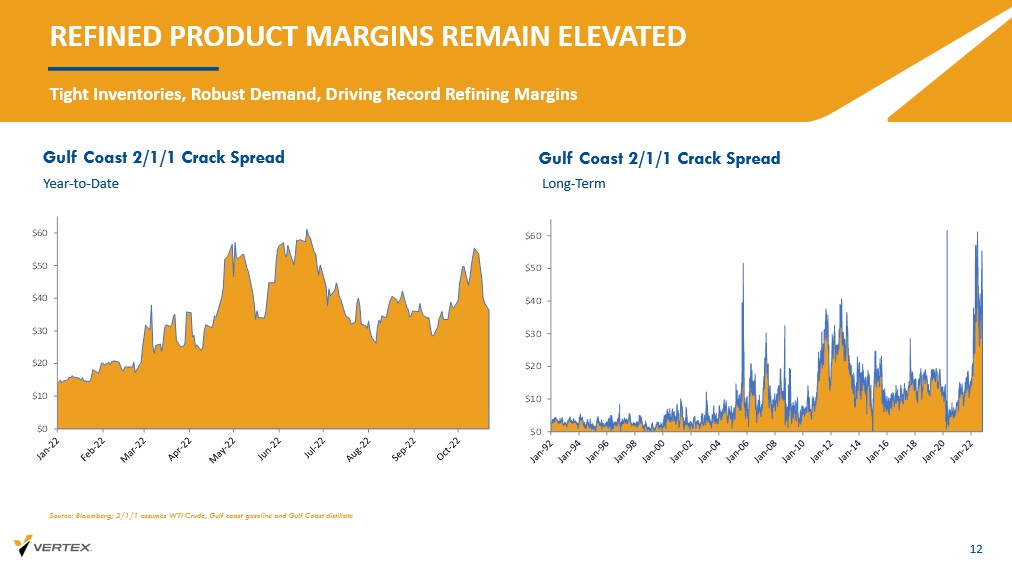
REFINED PRODUCT MARGINS REMAIN ELEVATED Tight Inventories, Robust Demand, Driving Record Refining Margins 12 Gulf Coast 2/1/1 Crack Spread Year - to - Date Source: Bloomberg; 2/1/1 assumes WTI Crude, Gulf coast gasoline and Gulf Coast distillate Gulf Coast 2/1/1 Crack Spread Long - Term $0 $10 $20 $30 $40 $50 $60 $0 $10 $20 $30 $40 $50 $60
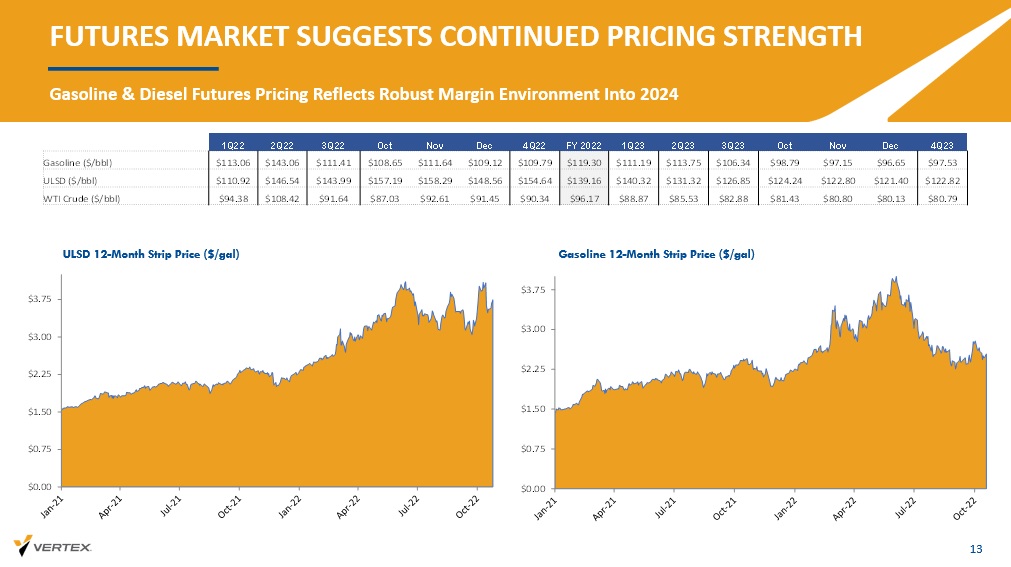
FUTURES MARKET SUGGESTS CONTINUED PRICING STRENGTH Gasoline & Diesel Futures Pricing Reflects Robust Margin Environment Into 2024 13 ULSD 12 - Month Strip Price ($/gal) Gasoline 12 - Month Strip Price ($/gal) $0.00 $0.75 $1.50 $2.25 $3.00 $3.75 $0.00 $0.75 $1.50 $2.25 $3.00 $3.75 1Q22 2Q22 3Q22 Oct Nov Dec 4Q22 FY 2022 1Q23 2Q23 3Q23 Oct Nov Dec 4Q23 Gasoline ($/ bbl ) $113.06 $143.06 $111.41 $108.65 $111.64 $109.12 $109.79 $119.30 $111.19 $113.75 $106.34 $98.79 $97.15 $96.65 $97.53 ULSD ($/ bbl ) $110.92 $146.54 $143.99 $157.19 $158.29 $148.56 $154.64 $139.16 $140.32 $131.32 $126.85 $124.24 $122.80 $121.40 $122.82 WTI Crude ($/ bbl ) $94.38 $108.42 $91.64 $87.03 $92.61 $91.45 $90.34 $96.17 $88.87 $85.53 $82.88 $81.43 $80.80 $80.13 $80.79
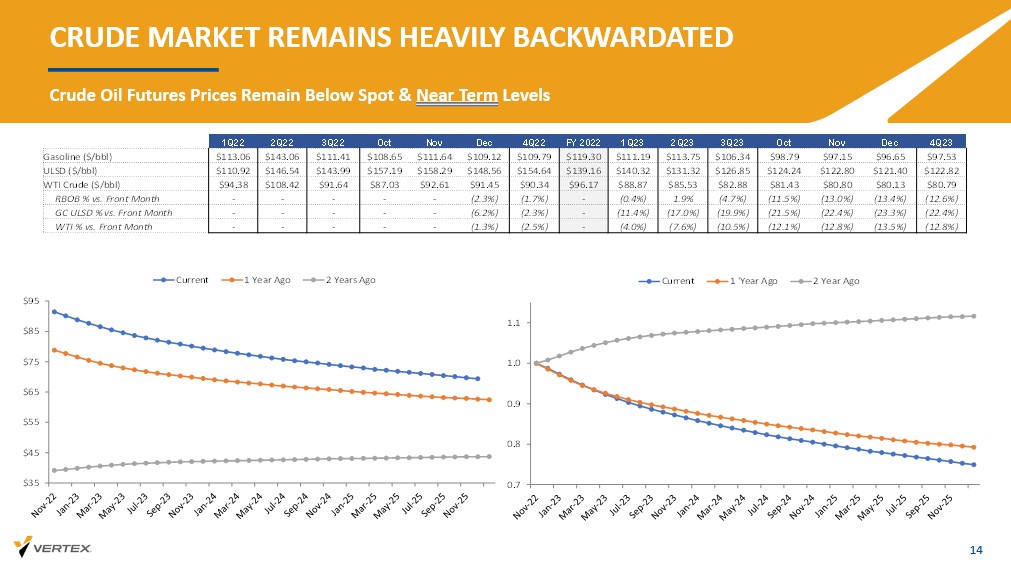
CRUDE MARKET REMAINS HEAVILY BACKWARDATED Crude Oil Futures Prices Remain Below Spot & Near Term Levels 14 0.7 0.8 0.9 1.0 1.1 Current 1 'Year Ago 2 Year Ago $35 $45 $55 $65 $75 $85 $95 Current 1 Year Ago 2 Years Ago 1Q22 2Q22 3Q22 Oct Nov Dec 4Q22 FY 2022 1Q23 2Q23 3Q23 Oct Nov Dec 4Q23 Gasoline ($/ bbl ) $113.06 $143.06 $111.41 $108.65 $111.64 $109.12 $109.79 $119.30 $111.19 $113.75 $106.34 $98.79 $97.15 $96.65 $97.53 ULSD ($/ bbl ) $110.92 $146.54 $143.99 $157.19 $158.29 $148.56 $154.64 $139.16 $140.32 $131.32 $126.85 $124.24 $122.80 $121.40 $122.82 WTI Crude ($/ bbl ) $94.38 $108.42 $91.64 $87.03 $92.61 $91.45 $90.34 $96.17 $88.87 $85.53 $82.88 $81.43 $80.80 $80.13 $80.79 RBOB % vs. Front Month - - - - - (2.3%) (1.7%) - (0.4%) 1.9% (4.7%) (11.5%) (13.0%) (13.4%) (12.6%) GC ULSD % vs. Front Month - - - - - (6.2%) (2.3%) - (11.4%) (17.0%) (19.9%) (21.5%) (22.4%) (23.3%) (22.4%) WTI % vs. Front Month - - - - - (1.3%) (2.5%) - (4.0%) (7.6%) (10.5%) (12.1%) (12.8%) (13.5%) (12.8%)
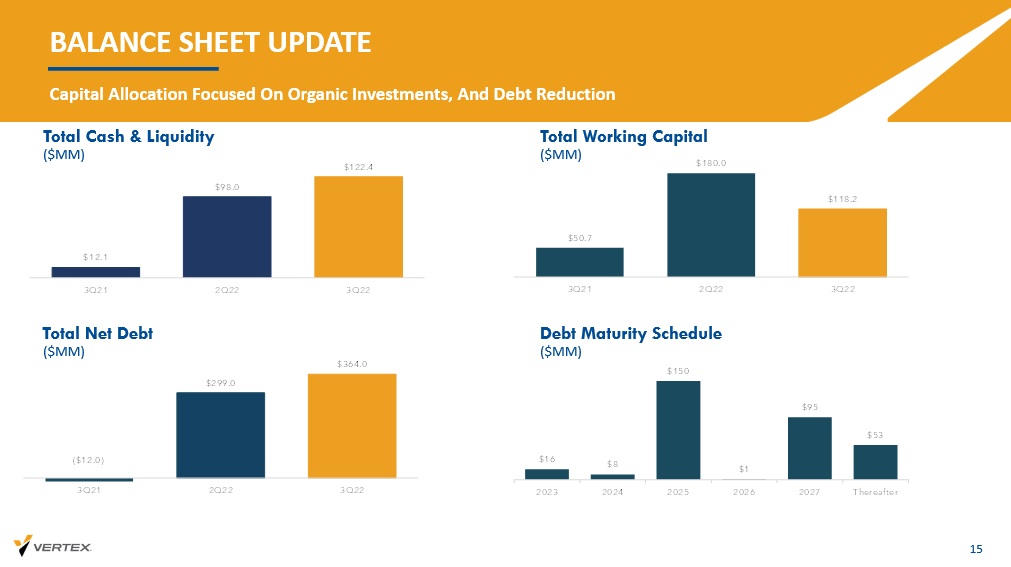
BALANCE SHEET UPDATE Capital Allocation Focused On Organic Investments, And Debt Reduction 15 Total Cash & Liquidity ($MM) Total Working Capital ($MM) Total Net Debt ($MM) Debt Maturity Schedule ($MM) $12.1 $98.0 $122.4 3Q21 2Q22 3Q22 ($12.0) $299.0 $364.0 3Q21 2Q22 3Q22 $16 $8 $150 $1 $95 $53 2023 2024 2025 2026 2027 Thereafter $50.7 $180.0 $118.2 3Q21 2Q22 3Q22
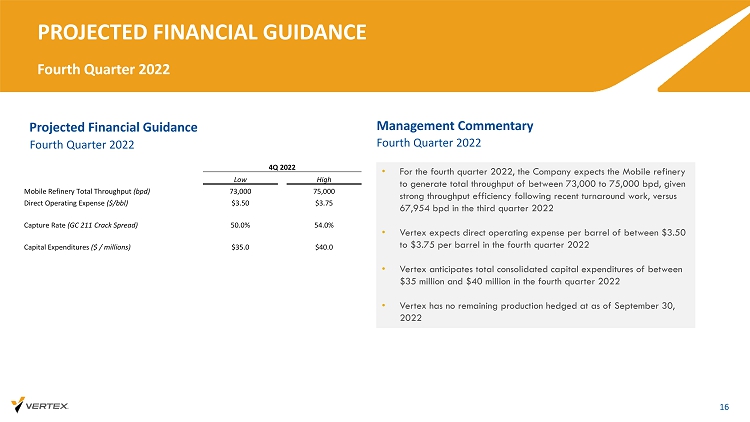
Projected Financial Guidance PROJECTED FINANCIAL GUIDANCE Fourth Quarter 2022 16 Management Commentary • For the fourth quarter 2022, the Company expects the Mobile refinery to generate total throughput of between 73,000 to 75,000 bpd, given strong throughput efficiency following recent turnaround work, versus 67,954 bpd in the third quarter 2022 • Vertex expects direct operating expense per barrel of between $3.50 to $3.75 per barrel in the fourth quarter 2022 • Vertex anticipates total consolidated capital expenditures of between $35 million and $40 million in the fourth quarter 2022 • Vertex has no remaining production hedged at as of September 30, 2022 Fourth Quarter 2022 Fourth Quarter 2022 4Q 2022 Low High Mobile Refinery Total Throughput (bpd) 73,000 75,000 Direct Operating Expense ($/ bbl ) $3.50 $3.75 Capture Rate (GC 211 Crack Spread) 50.0% 54.0% Capital Expenditures ($ / millions) $35.0 $40.0
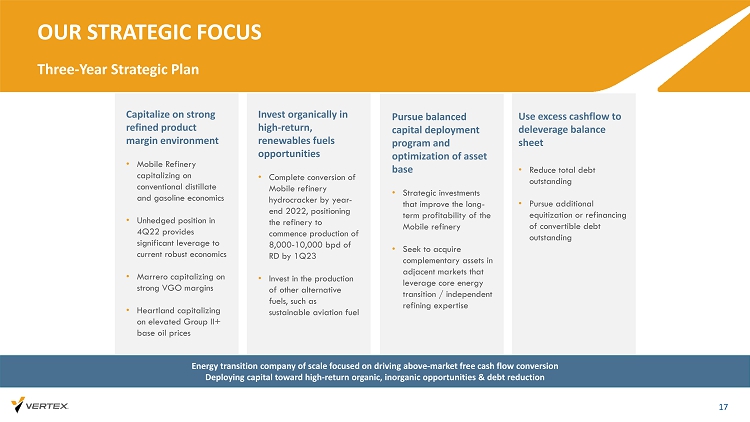
OUR STRATEGIC FOCUS Three - Year Strategic Plan 17 Pursue balanced capital deployment program and optimization of asset base • Strategic investments that improve the long - term profitability of the Mobile refinery • Seek to acquire complementary assets in adjacent markets that leverage core energy transition / independent refining expertise Capitalize on strong refined product margin environment • Mobile Refinery capitalizing on conventional distillate and gasoline economics • Unhedged position in 4Q22 provides significant leverage to current robust economics • Marrero capitalizing on strong VGO margins • Heartland capitalizing on elevated Group II+ base oil prices Invest organically in high - return, renewables fuels opportunities • Complete conversion of Mobile refinery hydrocracker by year - end 2022, positioning the refinery to commence production of 8,000 - 10,000 bpd of RD by 1Q23 • Invest in the production of other alternative fuels, such as sustainable aviation fuel Energy transition company of scale focused on driving above - market free cash flow conversion Deploying capital toward high - return organic, inorganic opportunities & debt reduction Use excess cashflow to deleverage balance sheet • Reduce total debt outstanding • Pursue additional equitization or refinancing of convertible debt outstanding

APPENDIX
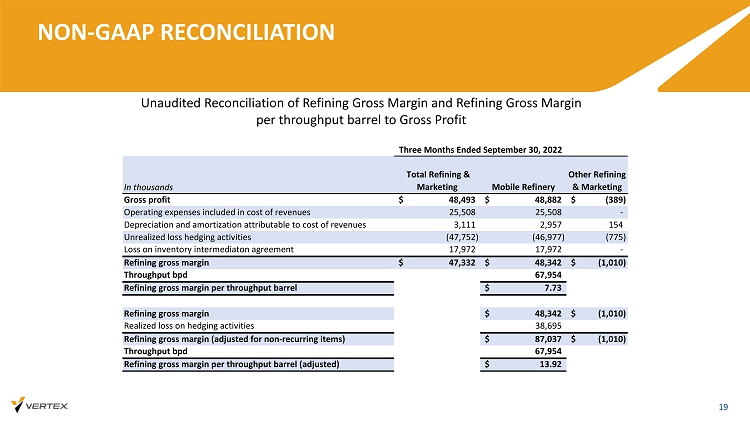
NON - GAAP RECONCILIATION 19 Unaudited Reconciliation of Refining Gross Margin and Refining Gross Margin per throughput barrel to Gross Profit In thousands Total Refining & Marketing Mobile Refinery Other Refining & Marketing Gross profit 48,493$ 48,882$ (389)$ Operating expenses included in cost of revenues 25,508 25,508 - Depreciation and amortization attributable to cost of revenues 3,111 2,957 154 Unrealized loss hedging activities (47,752) (46,977) (775) Loss on inventory intermediaton agreement 17,972 17,972 - Refining gross margin 47,332$ 48,342$ (1,010)$ Throughput bpd 67,954 Refining gross margin per throughput barrel 7.73$ Refining gross margin 48,342$ (1,010)$ Realized loss on hedging activities 38,695 Refining gross margin (adjusted for non-recurring items) 87,037$ (1,010)$ Throughput bpd 67,954 Refining gross margin per throughput barrel (adjusted) 13.92$ Three Months Ended September 30, 2022
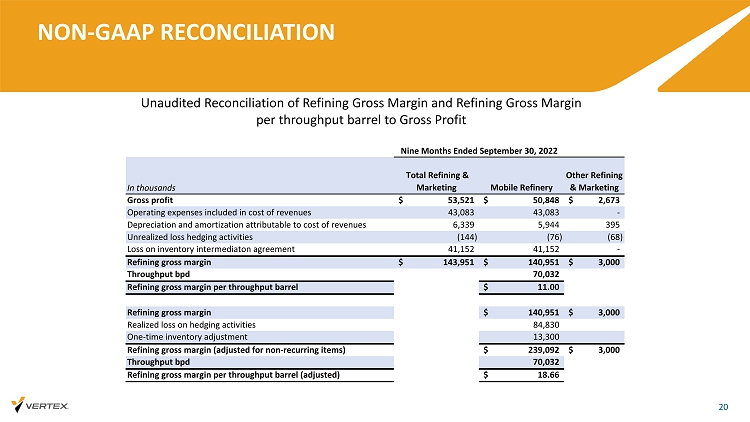
NON - GAAP RECONCILIATION 20 Unaudited Reconciliation of Refining Gross Margin and Refining Gross Margin per throughput barrel to Gross Profit In thousands Total Refining & Marketing Mobile Refinery Other Refining & Marketing Gross profit 53,521$ 50,848$ 2,673$ Operating expenses included in cost of revenues 43,083 43,083 - Depreciation and amortization attributable to cost of revenues 6,339 5,944 395 Unrealized loss hedging activities (144) (76) (68) Loss on inventory intermediaton agreement 41,152 41,152 - Refining gross margin 143,951$ 140,951$ 3,000$ Throughput bpd 70,032 Refining gross margin per throughput barrel 11.00$ Refining gross margin 140,951$ 3,000$ Realized loss on hedging activities 84,830 One-time inventory adjustment 13,300 Refining gross margin (adjusted for non-recurring items) 239,092$ 3,000$ Throughput bpd 70,032 Refining gross margin per throughput barrel (adjusted) 18.66$ Nine Months Ended September 30, 2022
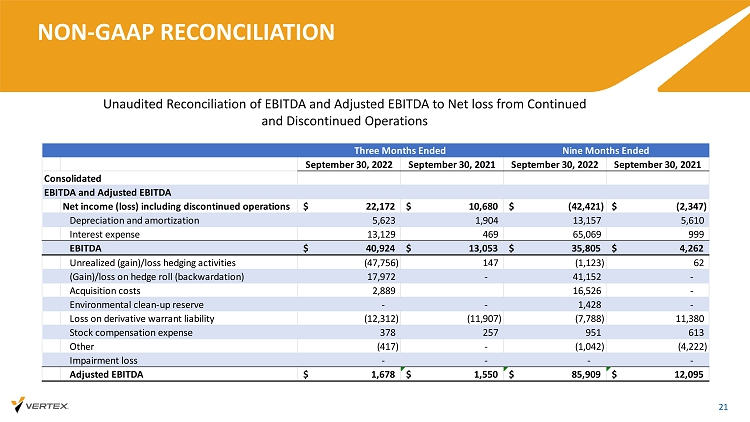
NON - GAAP RECONCILIATION 21 Unaudited Reconciliation of EBITDA and Adjusted EBITDA to Net loss from Continued and Discontinued Operations September 30, 2022 September 30, 2021 September 30, 2022 September 30, 2021 Consolidated EBITDA and Adjusted EBITDA Net income (loss) including discontinued operations 22,172$ 10,680$ (42,421)$ (2,347)$ Depreciation and amortization 5,623 1,904 13,157 5,610 Interest expense 13,129 469 65,069 999 EBITDA 40,924$ 13,053$ 35,805$ 4,262$ Unrealized (gain)/loss hedging activities (47,756) 147 (1,123) 62 (Gain)/loss on hedge roll (backwardation) 17,972 - 41,152 - Acquisition costs 2,889 16,526 - Environmental clean-up reserve - - 1,428 - Loss on derivative warrant liability (12,312) (11,907) (7,788) 11,380 Stock compensation expense 378 257 951 613 Other (417) - (1,042) (4,222) Impairment loss - - - - Adjusted EBITDA 1,678$ 1,550$ 85,909$ 12,095$ Three Months Ended Nine Months Ended
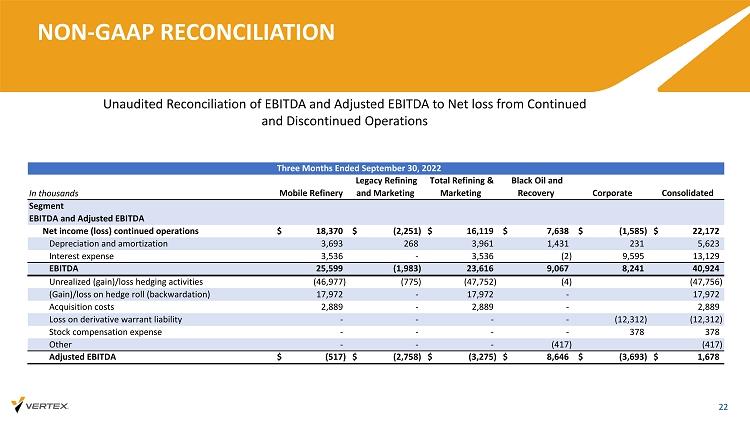
NON - GAAP RECONCILIATION 22 Unaudited Reconciliation of EBITDA and Adjusted EBITDA to Net loss from Continued and Discontinued Operations Three Months Ended September 30, 2022 In thousands Mobile Refinery Legacy Refining and Marketing Total Refining & Marketing Black Oil and Recovery Corporate Consolidated Segment EBITDA and Adjusted EBITDA Net income (loss) continued operations 18,370$ (2,251)$ 16,119$ 7,638$ (1,585)$ 22,172$ Depreciation and amortization 3,693 268 3,961 1,431 231 5,623 Interest expense 3,536 - 3,536 (2) 9,595 13,129 EBITDA 25,599 (1,983) 23,616 9,067 8,241 40,924 Unrealized (gain)/loss hedging activities (46,977) (775) (47,752) (4) (47,756) (Gain)/loss on hedge roll (backwardation) 17,972 - 17,972 - 17,972 Acquisition costs 2,889 - 2,889 - 2,889 Loss on derivative warrant liability - - - - (12,312) (12,312) Stock compensation expense - - - - 378 378 Other - - - (417) (417) Adjusted EBITDA (517)$ (2,758)$ (3,275)$ 8,646$ (3,693)$ 1,678$
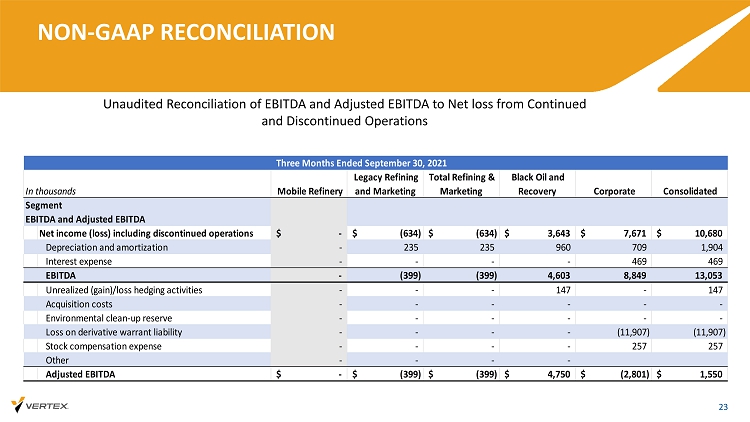
NON - GAAP RECONCILIATION 23 Unaudited Reconciliation of EBITDA and Adjusted EBITDA to Net loss from Continued and Discontinued Operations Three Months Ended September 30, 2021 In thousands Mobile Refinery Legacy Refining and Marketing Total Refining & Marketing Black Oil and Recovery Corporate Consolidated Segment EBITDA and Adjusted EBITDA Net income (loss) including discontinued operations -$ (634)$ (634)$ 3,643$ 7,671$ 10,680$ Depreciation and amortization - 235 235 960 709 1,904 Interest expense - - - - 469 469 EBITDA - (399) (399) 4,603 8,849 13,053 Unrealized (gain)/loss hedging activities - - - 147 - 147 Acquisition costs - - - - - - Environmental clean-up reserve - - - - - - Loss on derivative warrant liability - - - - (11,907) (11,907) Stock compensation expense - - - - 257 257 Other - - - - Adjusted EBITDA -$ (399)$ (399)$ 4,750$ (2,801)$ 1,550$
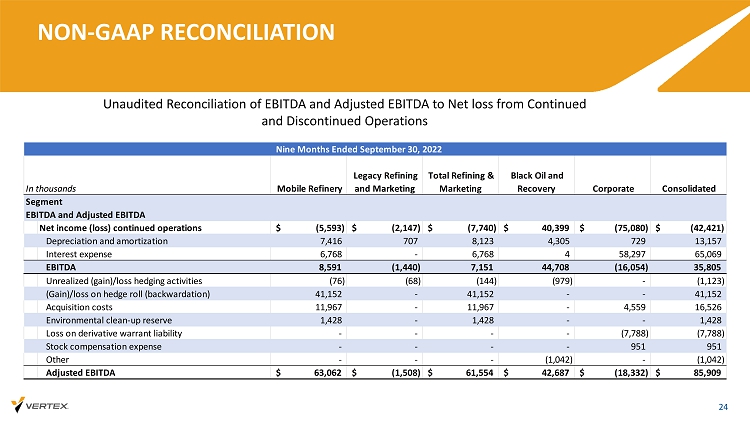
NON - GAAP RECONCILIATION 24 Unaudited Reconciliation of EBITDA and Adjusted EBITDA to Net loss from Continued and Discontinued Operations Nine Months Ended September 30, 2022 In thousands Mobile Refinery Legacy Refining and Marketing Total Refining & Marketing Black Oil and Recovery Corporate Consolidated Segment EBITDA and Adjusted EBITDA Net income (loss) continued operations (5,593)$ (2,147)$ (7,740)$ 40,399$ (75,080)$ (42,421)$ Depreciation and amortization 7,416 707 8,123 4,305 729 13,157 Interest expense 6,768 - 6,768 4 58,297 65,069 EBITDA 8,591 (1,440) 7,151 44,708 (16,054) 35,805 Unrealized (gain)/loss hedging activities (76) (68) (144) (979) - (1,123) (Gain)/loss on hedge roll (backwardation) 41,152 - 41,152 - - 41,152 Acquisition costs 11,967 - 11,967 - 4,559 16,526 Environmental clean-up reserve 1,428 - 1,428 - - 1,428 Loss on derivative warrant liability - - - - (7,788) (7,788) Stock compensation expense - - - - 951 951 Other - - - (1,042) - (1,042) Adjusted EBITDA 63,062$ (1,508)$ 61,554$ 42,687$ (18,332)$ 85,909$
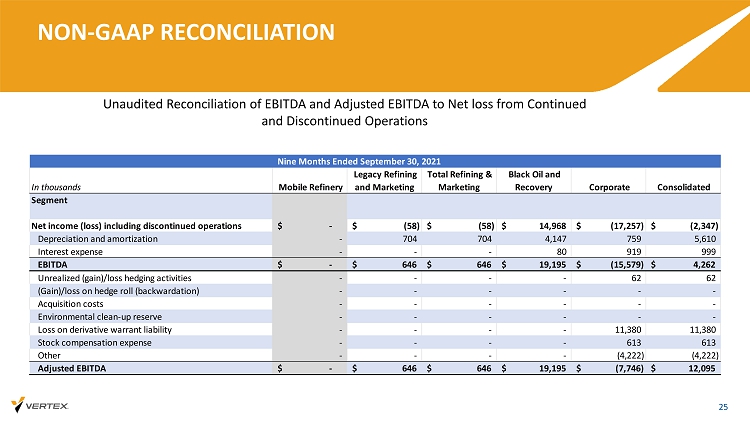
NON - GAAP RECONCILIATION 25 Unaudited Reconciliation of EBITDA and Adjusted EBITDA to Net loss from Continued and Discontinued Operations Nine Months Ended September 30, 2021 In thousands Mobile Refinery Legacy Refining and Marketing Total Refining & Marketing Black Oil and Recovery Corporate Consolidated Segment Net income (loss) including discontinued operations -$ (58)$ (58)$ 14,968$ (17,257)$ (2,347)$ Depreciation and amortization - 704 704 4,147 759 5,610 Interest expense - - - 80 919 999 EBITDA -$ 646$ 646$ 19,195$ (15,579)$ 4,262$ Unrealized (gain)/loss hedging activities - - - - 62 62 (Gain)/loss on hedge roll (backwardation) - - - - - - Acquisition costs - - - - - - Environmental clean-up reserve - - - - - - Loss on derivative warrant liability - - - - 11,380 11,380 Stock compensation expense - - - - 613 613 Other - - - - (4,222) (4,222) Adjusted EBITDA -$ 646$ 646$ 19,195$ (7,746)$ 12,095$