Vertex Energy, Inc. 8-K
Exhibit 99.2
Fourth Quarter & Full Year 2022 Results Summary Presentation February 2023

Certain of the matters discussed in this communication which are not statements of historical fact constitute forward - looking statements within the meaning of the securities laws, including the Private Securities Litigation Reform Act of 1995 , that involve a number of risks and uncertainties . Words such as “strategy,” “expects,” “continues,” “plans,” “anticipates,” “believes,” “would,” “will,” “estimates,” “intends,” “projects,” “goals,” “targets” and other words of similar meaning are intended to identify forward - looking statements but are not the exclusive means of identifying these statements . Any statements made in this news release other than those of historical fact, about an action, event or development, are forward - looking statements . The important factors that may cause actual results and outcomes to differ materially from those contained in such forward - looking statements include, without limitation, the Company’s projected Outlook for the fourth quarter of 2022 , as discussed above ; the Company’s ability to raise sufficient capital to complete future capital projects and the terms of such funding, to the extent necessary ; the timing of planned capital projects at the Mobile Refinery and the outcome thereof ; the future production of the Mobile Refinery ; the estimated timeline of the renewable diesel capital project, estimated and actual production associated therewith, estimated revenues over the course of the agreement with Idemitsu , anticipated and unforeseen events which could reduce future production at the refinery or delay planned capital projects, changes in commodity and credits values, and certain early termination rights associated with the Idemitsu agreement and conditions precedent to such agreement ; certain mandatory redemption provisions of the outstanding senior convertible notes, the conversion rights associated therewith, and dilution caused by such conversions ; the Company’s ability to comply with required covenants under outstanding senior notes and a term loan and pay amounts due under such senior notes and term loan, including interest and other amounts due thereunder ; the ability of the Company to retain and hire key personnel ; risks associated with the ability of Vertex to complete current plans for expansion and growth, and planned capital projects ; the level of competition in our industry and our ability to compete ; our ability to respond to changes in our industry ; the loss of key personnel or failure to attract, integrate and retain additional personnel ; our ability to protect our intellectual property and not infringe on others’ intellectual property ; our ability to scale our business ; our ability to maintain supplier relationships and obtain adequate supplies of feedstocks ; our ability to obtain and retain customers ; our ability to produce our products at competitive rates ; our ability to execute our business strategy in a very competitive environment ; trends in, and the market for, the price of oil and gas and alternative energy sources ; the impact of inflation on margins and costs ; the volatile nature of the prices for oil and gas caused by supply and demand, including volatility caused by the ongoing Ukraine/Russia conflict ; our ability to maintain our relationships with our partners ; the impact of competitive services and products ; the outcome of pending and potential future litigation, judgments and settlements ; rules and regulations making our operations more costly or restrictive ; changes in environmental and other laws and regulations and risks associated with such laws and regulations ; economic downturns both in the United States and globally, increases in inflation and interest rates, increased costs of borrowing associated therewith and potential declines in the availability of such funding ; risk of increased regulation of our operations and products ; disruptions in the infrastructure that we and our partners rely on ; interruptions at our facilities ; unexpected and expected changes in our anticipated capital expenditures resulting from unforeseen or planned required maintenance, repairs, or upgrades ; our ability to acquire and construct new facilities ; our ability to effectively manage our growth ; decreases in global demand for, and the price of, oil, due to COVID - 19 , state, federal and foreign responses thereto, inflation, recessions or other reasons, including declines in economic activity or global conflicts ; our ability to acquire sufficient amounts of used oil feedstock through our collection routes, to produce finished products, and in the absence of such internally collected feedstocks, and our ability to acquire third - party feedstocks on commercially reasonable terms ; unexpected downtime at our facilities ; risks associated with COVID - 19 , the global efforts to stop the spread of COVID - 19 , potential downturns in the U . S . and global economies due to COVID - 19 and the efforts to stop the spread of the virus, and COVID - 19 in general ; anti - dilutive rights associated with our outstanding securities ; our level of indebtedness, which could affect our ability to fulfill our obligations, impede the implementation of our strategy, and expose us to interest rate risk ; dependence on third party transportation services and pipelines ; risks related to obtaining required crude oil supplies, and the costs of such supplies ; counterparty credit and performance risk ; unanticipated problems at, or downtime effecting, our facilities and those operated by third parties ; risks relating to our hedging activities ; and risks relating to planned divestitures and acquisitions . Other important factors that may cause actual results and outcomes to differ materially from those contained in the forward - looking statements included in this communication are described in the Company’s publicly filed reports, including, but not limited to, the Company’s Annual Report on Form 10 - K for the year ended December 31 , 2021 , and the Company’s Quarterly Report on Form 10 - Q for the quarter ended September 30 , 2022 and future Annual Reports on Form 10 - K and Quarterly Reports on Form 10 - Q . These reports are available at www . sec . gov . The Company cautions that the foregoing list of important factors is not complete . All subsequent written and oral forward - looking statements attributable to the Company or any person acting on behalf of the Company are expressly qualified in their entirety by the cautionary statements referenced above . Other unknown or unpredictable factors also could have material adverse effects on Vertex’s future results . The forward - looking statements included in this document are made only as of the date hereof . Vertex cannot guarantee future results, levels of activity, performance or achievements . Accordingly, you should not place undue reliance on these forward - looking statements . Finally, Vertex undertakes no obligation to update these statements after the date of this release, except as required by law, and takes no obligation to update or correct information prepared by third parties that are not paid for by Vertex . If we update one or more forward - looking statements, no inference should be drawn that we will make additional updates with respect to those or other forward - looking statements . The financial projections (the “Projections”) included herein were prepared by Vertex in good faith using assumptions believed to be reasonable . A significant number of assumptions about the operations of the business of Vertex were based, in part, on economic, competitive, and general business conditions prevailing at the time the Projections were developed . Any future changes in these conditions, may materially impact the ability of Vertex to achieve the financial results set forth in the Projections . The Projections are based on numerous assumptions, including realization of the operating strategy of Vertex ; industry performance ; no material adverse changes in applicable legislation or regulations, or the administration thereof, or generally accepted accounting principles ; general business and economic conditions ; competition ; retention of key management and other key employees ; absence of material contingent or unliquidated litigation, indemnity, or other claims ; minimal changes in current pricing ; static material and equipment pricing ; no significant increases in interest rates or inflation ; and other matters, many of which will be beyond the control of Vertex, and some or all of which may not materialize . The Projections also assume the continued uptime of the Company’s facilities at historical levels and the successful funding of, timely completion of, and successful outcome of, planned capital projects . Additionally, to the extent that the assumptions inherent in the Projections are based upon future business decisions and objectives, they are subject to change . Although the Projections are presented with numerical specificity and are based on reasonable expectations developed by Vertex’s management, the assumptions and estimates underlying the Projections are subject to significant business, economic, and competitive uncertainties and contingencies, many of which will be beyond the control of Vertex . Accordingly, the Projections are only estimates and are necessarily speculative in nature . It is expected that some or all of the assumptions in the Projections will not be realized and that actual results will vary from the Projections . Such variations may be material and may increase over time . In light of the foregoing, readers are cautioned not to place undue reliance on the Projections . The projected financial information contained herein should not be regarded as a representation or warranty by Vertex, its management, advisors, or any other person that the Projections can or will be achieved . Vertex cautions that the Projections are speculative in nature and based upon subjective decisions and assumptions . As a result, the Projections should not be relied on as necessarily predictive of actual future events . DISCLAIMER Forward - looking statement 2
In addition to our results calculated under generally accepted accounting principles in the United States ("GAAP"), in this earnings release we also present fuels gross margin, EBITDA and Adjusted EBITDA . fuels gross margin, EBITDA and Adjusted EBITDA are “non - GAAP financial measures” presented as supplemental measures of the Company’s performance . They are not presented in accordance with GAAP . fuels gross margin is defined as revenues less the cost of fuel intakes and other fuel costs . It excludes operating expense and depreciation attributable to cost of revenues and other non - operating items in cost of revenues . EBITDA represents net income before interest, taxes, depreciation and amortization, for continued and discontinued operations . Adjusted EBITDA is defined as EBITDA before other income, impairment loss on assets, unrealized (gain)/loss on hedging activities, (gain)/loss on hedge roll (backwardation), environmental clean - up reserve, loss (gain) on change in value of derivative warrant liability, unrealized (gain) loss on derivative instruments, gain (loss) on intermediation agreement, Shell transaction related and acquisition expenses and stock - based compensation expense (for continued and discontinued operations) and other unusual or non - recurring items . fuels gross margin is defined as gross profit (loss) less the cost of fuel intakes and other fuel costs . fuels gross margin, EBITDA and Adjusted EBITDA are presented because we believe they provide additional useful information to investors due to the various noncash items during the period . fuels gross margin, EBITDA and Adjusted EBITDA are also frequently used by analysts, investors and other interested parties to evaluate companies in our industry . We use fuels gross margin, EBITDA and Adjusted EBITDA as supplements to GAAP measures of performance to evaluate the effectiveness of our business strategies, to make budgeting decisions, to allocate resources and to compare our performance relative to our peers . Additionally, these measures, when used in conjunction with related GAAP financial measures, provide investors with an additional financial analytical framework which management uses, in addition to historical operating results, as the basis for financial, operational and planning decisions and present measurements that third parties have indicated are useful in assessing the Company and its results of operations . fuels gross margin, EBITDA and Adjusted EBITDA are unaudited, and have limitations as analytical tools, and you should not consider them in isolation, or as a substitute for analysis of our operating results as reported under GAAP . Some of these limitations are : fuels gross margin, EBITDA and Adjusted EBITDA do not reflect cash expenditures, or future or contractual commitments ; EBITDA and Adjusted EBITDA do not reflect changes in, or cash requirements for, capital expenditures or working capital needs ; EBITDA and Adjusted EBITDA do not reflect the significant interest expense, or the cash requirements necessary to service interest or principal payments, on debt or cash income tax payments ; although depreciation and amortization are noncash charges, the assets being depreciated and amortized will often have to be replaced in the future, and EBITDA and Adjusted EBITDA do not reflect any cash requirements for such replacements . In addition, other companies in this industry may calculate fuels gross margin, EBITDA and Adjusted EBITDA differently than Vertex does, limiting its usefulness as a comparative measure . The Company’s presentation of these measures should not be construed as an inference that future results will be unaffected by unusual or nonrecurring items . We compensate for these limitations by providing a reconciliation of each of these non - GAAP measures to the most comparable GAAP measure . We encourage investors and others to review our business, results of operations, and financial information in their entirety, not to rely on any single financial measure, and to view these non - GAAP measures in conjunction with the most directly comparable GAAP financial measure . For more information on these non - GAAP financial measures, please see the sections titled “Unaudited Reconciliation of fuels gross margin and fuels gross margin per throughput barrel to Gross Profit”, each included at the end of this release and “Unaudited Consolidated Continued and Discontinued Operations Reconciliations of Net Loss attributable to Vertex Energy, Inc . , to Earnings before Interest, Taxes, Depreciation and Amortization (EBITDA) and Adjusted EBITDA” each included at the end of this release . DISCLAIMER Non - GAAP Financial Measures 3

FOURTH QUARTER & FULL YEAR 2022 Performance Summary
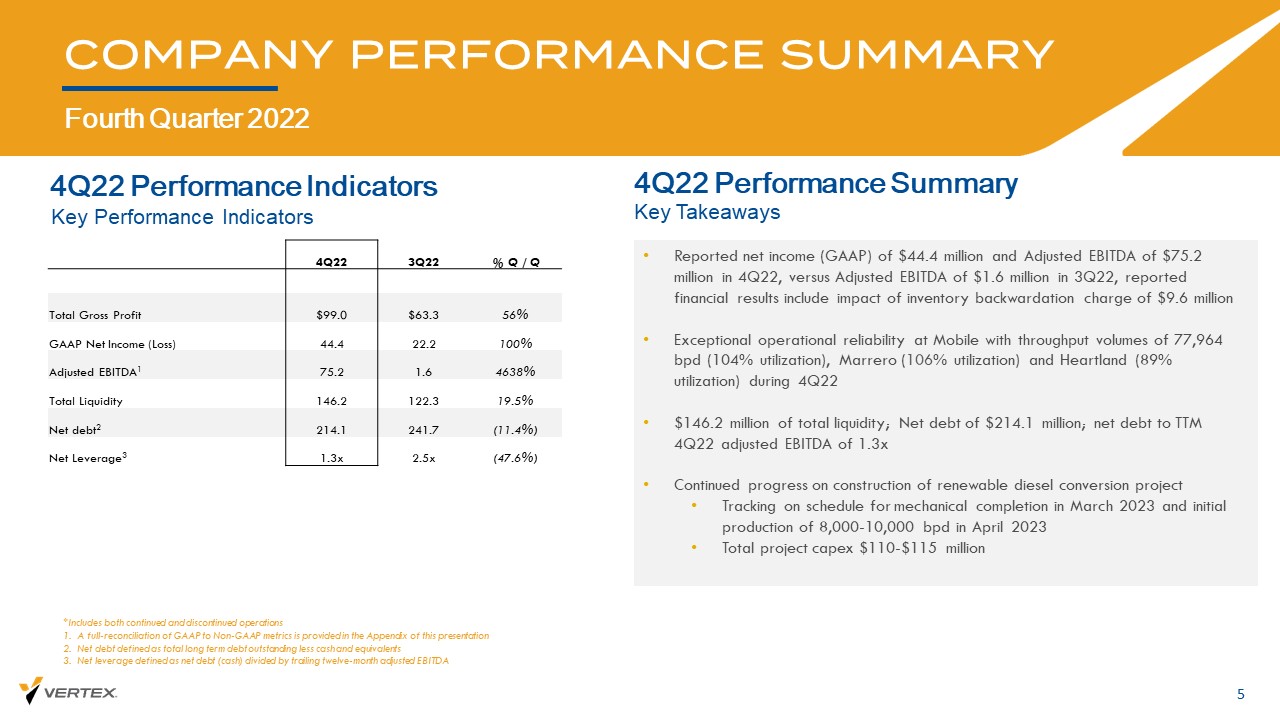
4Q22 Performance Indicators COMPANY PERFORMANCE SUMMARY Fourth Quarter 2022 5 *Includes both continued and discontinued operations 1. A full - reconciliation of GAAP to Non - GAAP metrics is provided in the Appendix of this presentation 2. Net debt defined as total long term debt outstanding less cash and equivalents 3. Net leverage defined as net debt (cash) divided by trailing twelve - month adjusted EBITDA Key Performance Indicators Key Takeaways 4Q22 Performance Summary • Reported net income (GAAP) of $44.4 million and Adjusted EBITDA of $75.2 million in 4Q22, versus Adjusted EBITDA of $1.6 million in 3Q22, reported financial results include impact of inventory backwardation charge of $9.6 million • Exceptional operational reliability at Mobile with throughput volumes of 77,964 bpd (104% utilization), Marrero ( 106 % utilization) and Heartland (89% utilization) during 4Q22 • $146.2 million of total liquidity; Net debt of $214.1 million; net debt to TTM 4Q22 adjusted EBITDA of 1.3x • Continued progress on construction of renewable diesel conversion project • Tracking on schedule for mechanical completion in March 2023 and initial production of 8,000 - 10,000 bpd in April 2023 • Total project capex $110 - $115 million 4Q22 3Q22 % Q / Q Total Gross Profit $99.0 $63.3 56% GAAP Net Income (Loss) 44.4 22.2 100% Adjusted EBITDA 1 75.2 1.6 4638% Total Liquidity 146.2 122.3 19.5% Net debt 2 214.1 241.7 (11.4%) Net Leverage 3 1.3x 2.5x (47.6%)
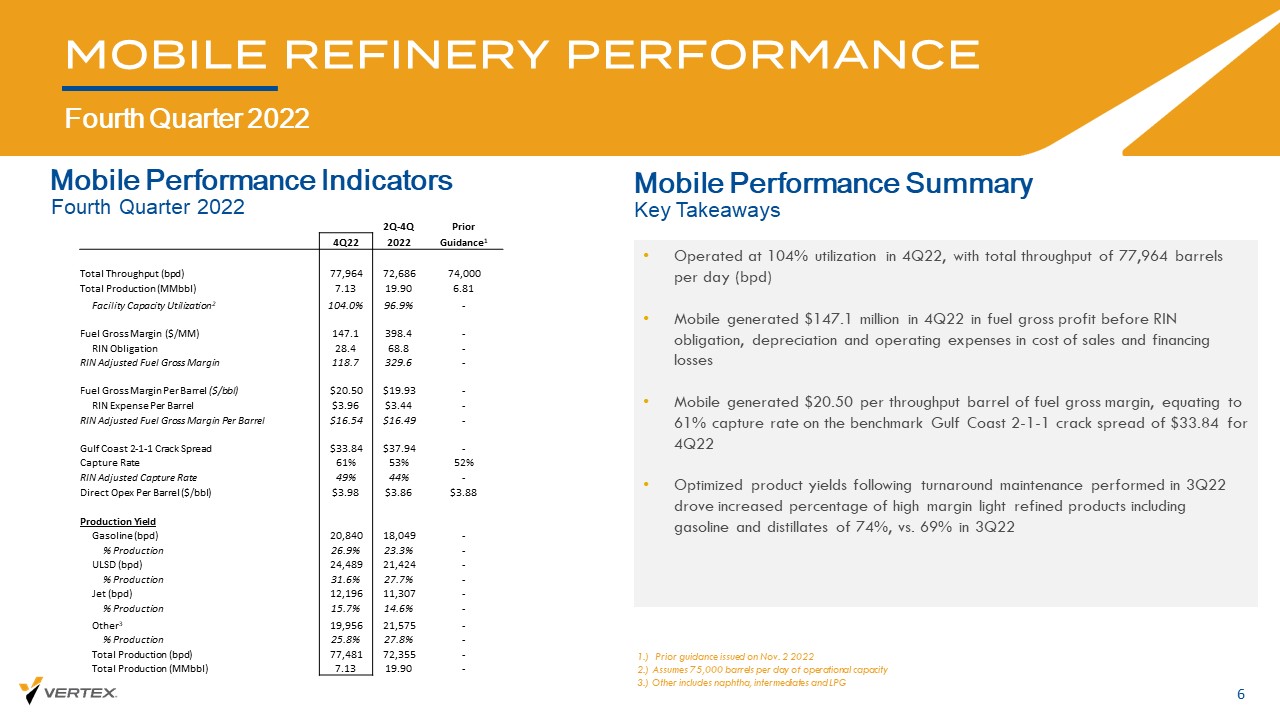
Mobile Performance Indicators MOBILE REFINERY PERFORMANCE Fourth Quarter 2022 6 • Operated at 104% utilization in 4Q22, with total throughput of 77,964 barrels per day (bpd) • Mobile generated $147.1 million in 4Q22 in fuel gross profit before RIN obligation, depreciation and operating expenses in cost of sales and financing losses • Mobile generated $20.50 per throughput barrel of fuel gross margin, equating to 61% capture rate on the benchmark Gulf Coast 2 - 1 - 1 crack spread of $33.84 for 4Q22 • Optimized product yields following turnaround maintenance performed in 3Q22 drove increased percentage of high margin light refined products including gasoline and distillates of 74%, vs. 69% in 3Q22 1.) Prior guidance issued on Nov. 2 2022 2.) Assumes 75,000 barrels per day of operational capacity 3.) Other includes naphtha, intermediates and LPG Fourth Quarter 2022 Mobile Performance Summary Key Takeaways 2Q - 4Q Prior 4Q22 2022 Guidance 1 Total Throughput (bpd) 77,964 72,686 74,000 Total Production ( MMbbl ) 7.13 19.90 6.81 Facility Capacity Utilization 2 104.0% 96.9% - Fuel Gross Margin ($/MM) 147.1 398.4 - RIN Obligation 28.4 68.8 - RIN Adjusted Fuel Gross Margin 118.7 329.6 - Fuel Gross Margin Per Barrel ($/bbl) $20.50 $19.93 - RIN Expense Per Barrel $3.96 $3.44 - RIN Adjusted Fuel Gross Margin Per Barrel $16.54 $16.49 - Gulf Coast 2 - 1 - 1 Crack Spread $33.84 $37.94 - Capture Rate 61% 53% 52% RIN Adjusted Capture Rate 49% 44% - Direct Opex Per Barrel ($/bbl) $3.98 $3.86 $3.88 Production Yield Gasoline (bpd) 20,840 18,049 - % Production 26.9% 23.3% - ULSD (bpd) 24,489 21,424 - % Production 31.6% 27.7% - Jet (bpd) 12,196 11,307 - % Production 15.7% 14.6% - Other 3 19,956 21,575 - % Production 25.8% 27.8% - Total Production (bpd) 77,481 72,355 - Total Production (MMbbl) 7.13 19.90 -
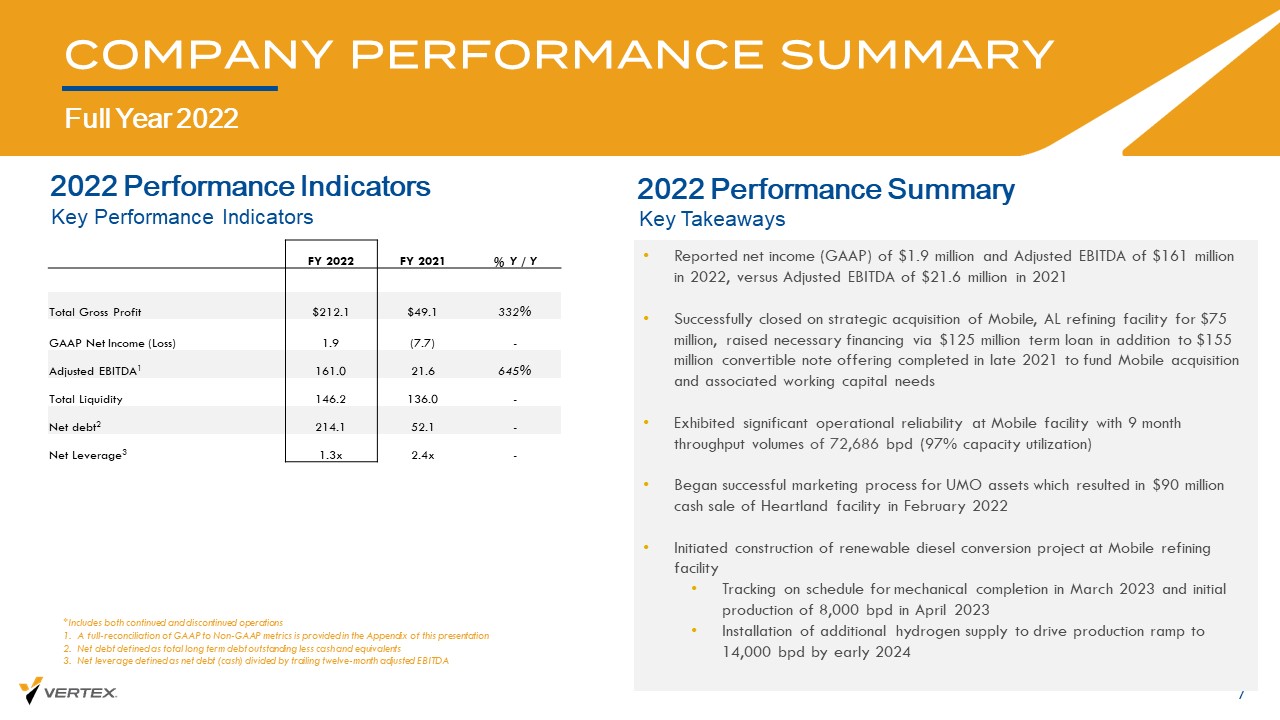
2022 Performance Indicators COMPANY PERFORMANCE SUMMARY Full Year 2022 7 *Includes both continued and discontinued operations 1. A full - reconciliation of GAAP to Non - GAAP metrics is provided in the Appendix of this presentation 2. Net debt defined as total long term debt outstanding less cash and equivalents 3. Net leverage defined as net debt (cash) divided by trailing twelve - month adjusted EBITDA Key Performance Indicators Key Takeaways 2022 Performance Summary • Reported net income (GAAP) of $1.9 million and Adjusted EBITDA of $161 million in 2022, versus Adjusted EBITDA of $21.6 million in 2021 • Successfully closed on strategic acquisition of Mobile, AL refining facility for $75 million, raised necessary financing via $125 million term loan in addition to $155 million convertible note offering completed in late 2021 to fund Mobile acquisition and associated working capital needs • Exhibited significant operational reliability at Mobile facility with 9 month throughput volumes of 72,686 bpd (97% capacity utilization) • Began successful marketing process for UMO assets which resulted in $90 million cash sale of Heartland facility in February 2022 • Initiated construction of renewable diesel conversion project at Mobile refining facility • Tracking on schedule for mechanical completion in March 2023 and initial production of 8,000 bpd in April 2023 • Installation of additional hydrogen supply to drive production ramp to 14,000 bpd by early 2024 FY 2022 FY 2021 % Y / Y Total Gross Profit $212.1 $49.1 332% GAAP Net Income (Loss) 1.9 (7.7) - Adjusted EBITDA 1 161.0 21.6 645% Total Liquidity 146.2 136.0 - Net debt 2 214.1 52.1 - Net Leverage 3 1.3x 2.4x -
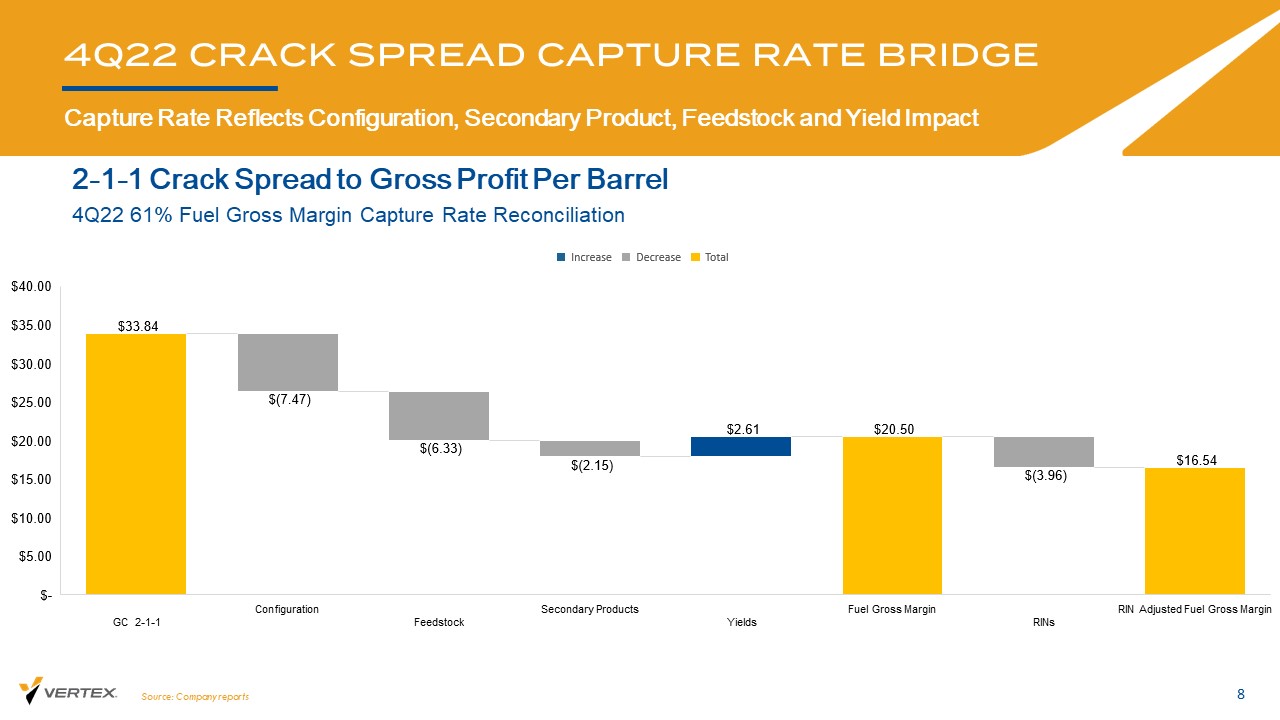
4Q22 CRACK SPREAD CAPTURE RATE BRIDGE 8 2 - 1 - 1 Crack Spread to Gross Profit Per Barrel 4Q22 61% Fuel Gross Margin Capture Rate Reconciliation Source: Company reports Capture Rate Reflects Configuration, Secondary Product, Feedstock and Yield Impact
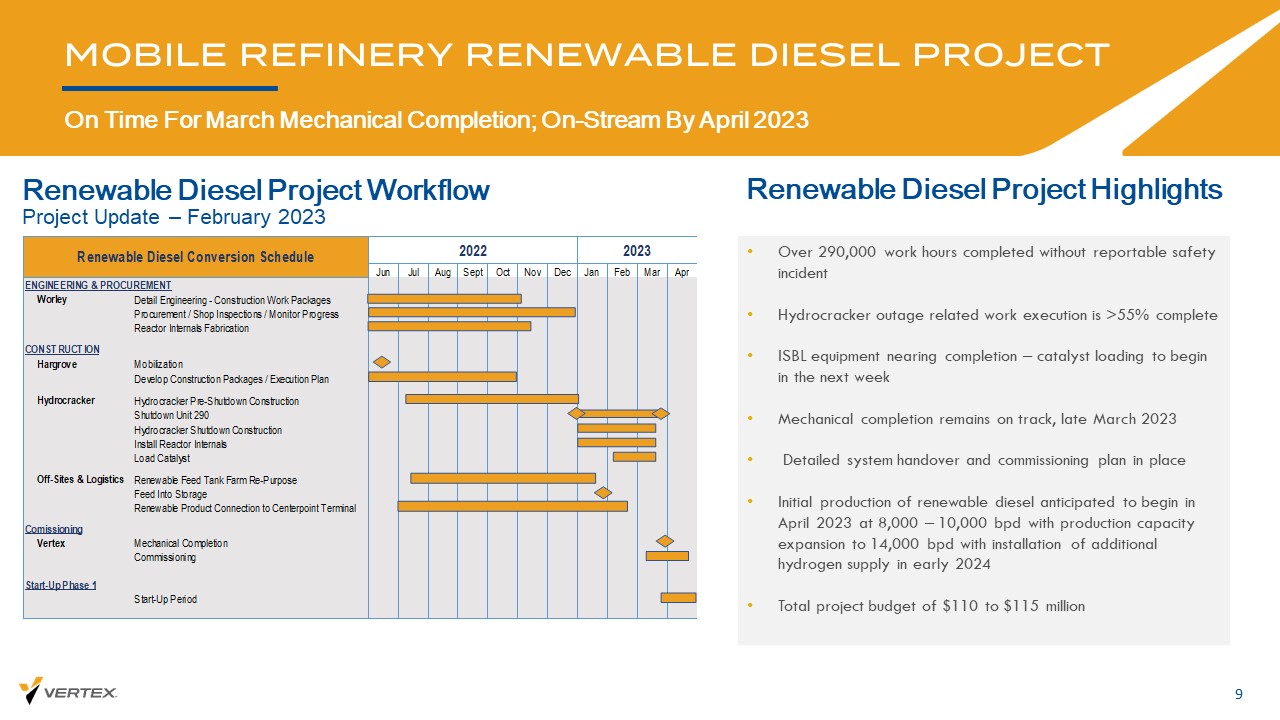
MOBILE REFINERY RENEWABLE DIESEL PROJECT On Time For March Mechanical Completion; On - Stream By April 2023 9 Renewable Diesel Project Highlights Renewable Diesel Project Workflow Project Update – February 2023 Jun Jul Aug Sept Oct Nov Dec Jan Feb Mar Apr Worley Detail Engineering - Construction Work Packages Procurement / Shop Inspections / Monitor Progress Reactor Internals Fabrication Hargrove Mobilization Develop Construction Packages / Execution Plan Hydrocracker Hydrocracker Pre-Shutdown Construction Shutdown Unit 290 Hydrocracker Shutdown Construction Install Reactor Internals Load Catalyst Off-Sites & Logistics Renewable Feed Tank Farm Re-Purpose Feed Into Storage Renewable Product Connection to Centerpoint Terminal Vertex Mechanical Completion Commissioning Start-Up Period Start-Up Phase 1 Renewable Diesel Conversion Schedule 2022 2023 ENGINEERING & PROCUREMENT CONSTRUCTION Comissioning • Over 290,000 work hours completed without reportable safety incident • Hydrocracker outage related work execution is >55% complete • ISBL equipment nearing completion – catalyst loading to begin in the next week • Mechanical completion remains on track, late March 2023 • Detailed system handover and commissioning plan in place • Initial production of renewable diesel anticipated to begin in April 2023 at 8,000 – 10,000 bpd with production capacity expansion to 14,000 bpd with installation of additional hydrogen supply in early 2024 • Total project budget of $110 to $115 million
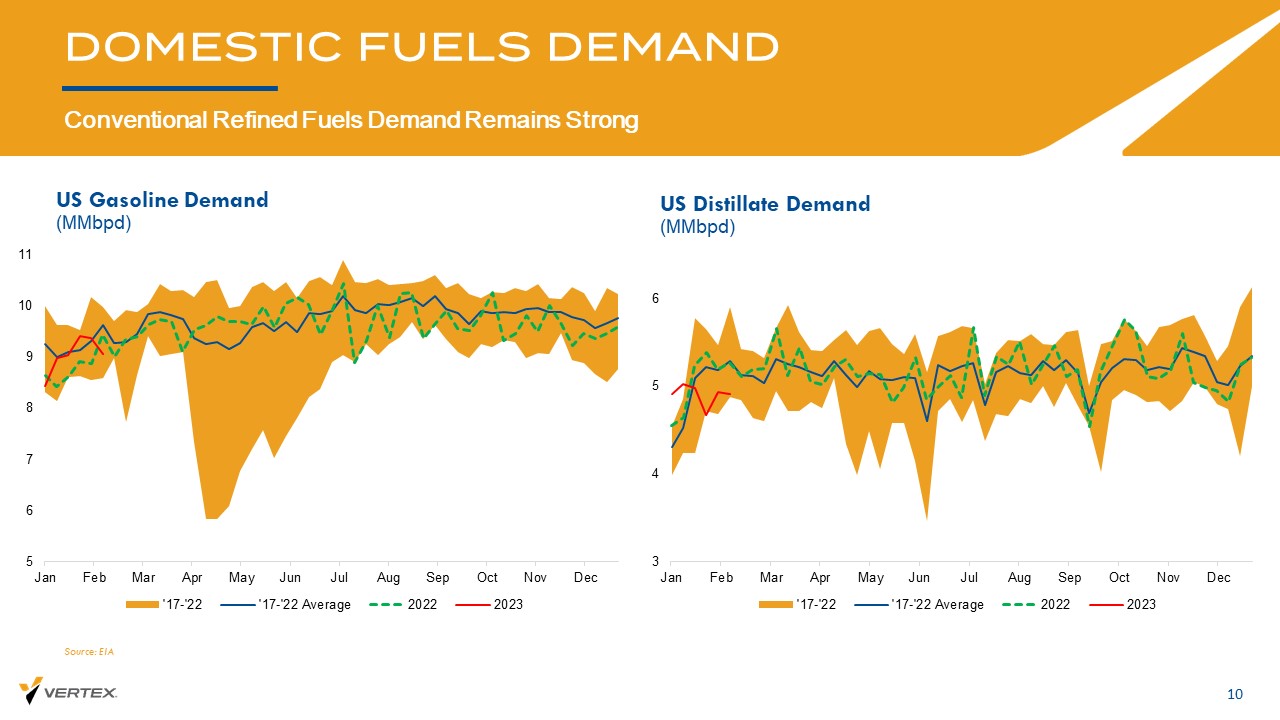
DOMESTIC FUELS DEMAND Conventional Refined Fuels Demand Remains Strong US Gasoline Demand 10 ( MMbpd ) US Distillate Demand ( MMbpd ) Source: EIA 5 6 7 8 9 10 11 Jan Feb Mar Apr May Jun Jul Aug Sep Oct Nov Dec '17-'22 '17-'22 Average 2022 2023 3 4 5 6 Jan Feb Mar Apr May Jun Jul Aug Sep Oct Nov Dec '17-'22 '17-'22 Average 2022 2023
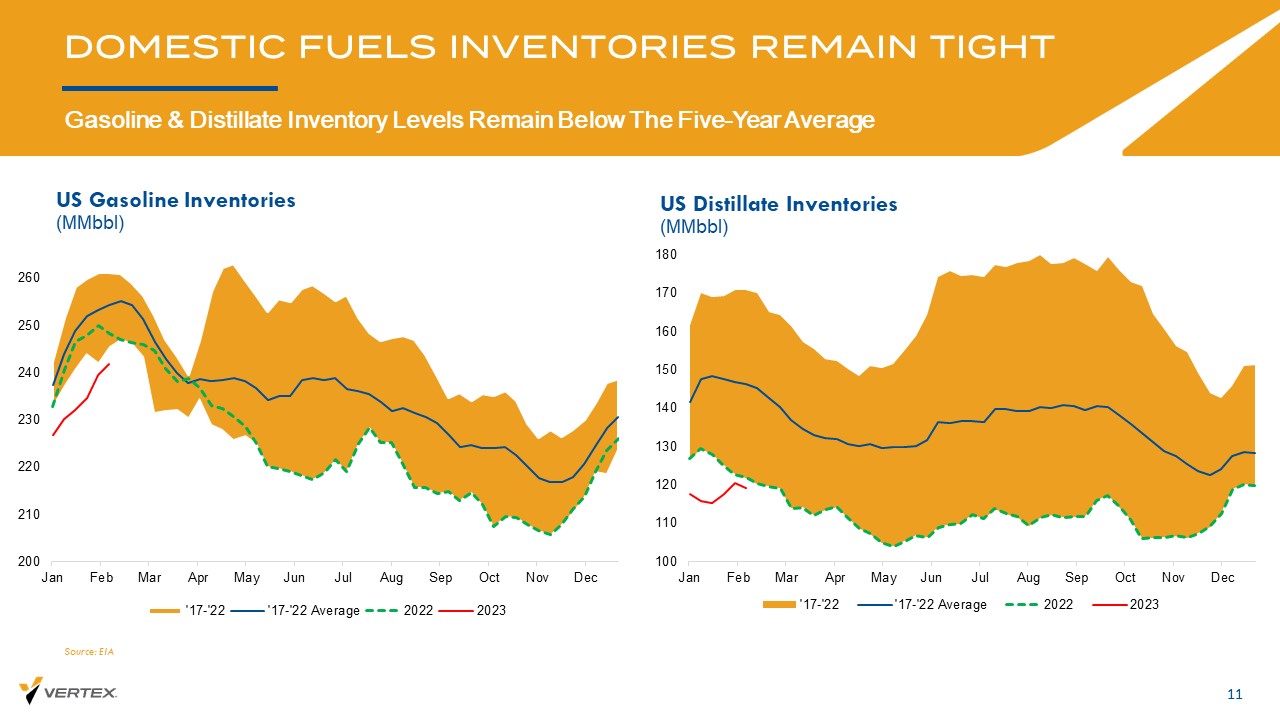
DOMESTIC FUELS INVENTORIES REMAIN TIGHT Gasoline & Distillate Inventory Levels Remain Below The Five - Year Average US Gasoline Inventories 11 ( MMbbl ) US Distillate Inventories ( MMbbl ) Source: EIA 200 210 220 230 240 250 260 Jan Feb Mar Apr May Jun Jul Aug Sep Oct Nov Dec '17-'22 '17-'22 Average 2022 2023 100 110 120 130 140 150 160 170 180 Jan Feb Mar Apr May Jun Jul Aug Sep Oct Nov Dec '17-'22 '17-'22 Average 2022 2023
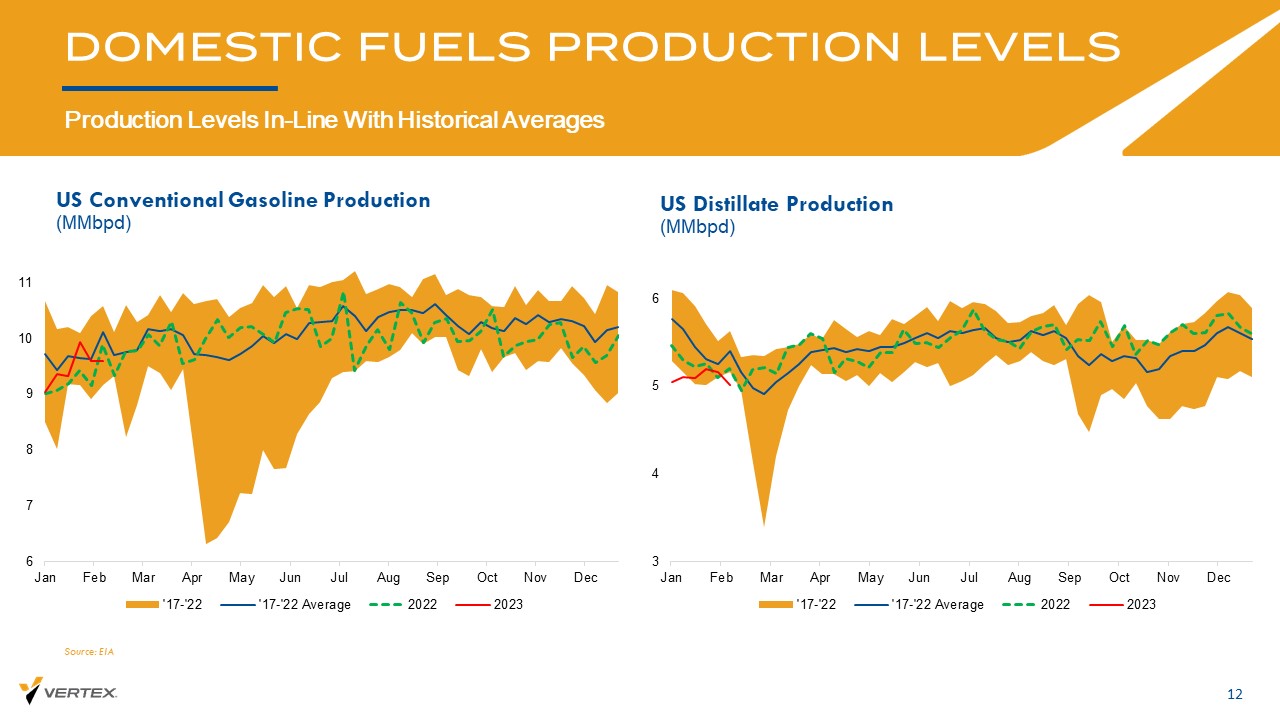
DOMESTIC FUELS PRODUCTION LEVELS Production Levels In - Line With Historical Averages US Conventional Gasoline Production 12 ( MMbpd ) US Distillate Production ( MMbpd ) Source: EIA 6 7 8 9 10 11 Jan Feb Mar Apr May Jun Jul Aug Sep Oct Nov Dec '17-'22 '17-'22 Average 2022 2023 3 4 5 6 Jan Feb Mar Apr May Jun Jul Aug Sep Oct Nov Dec '17-'22 '17-'22 Average 2022 2023
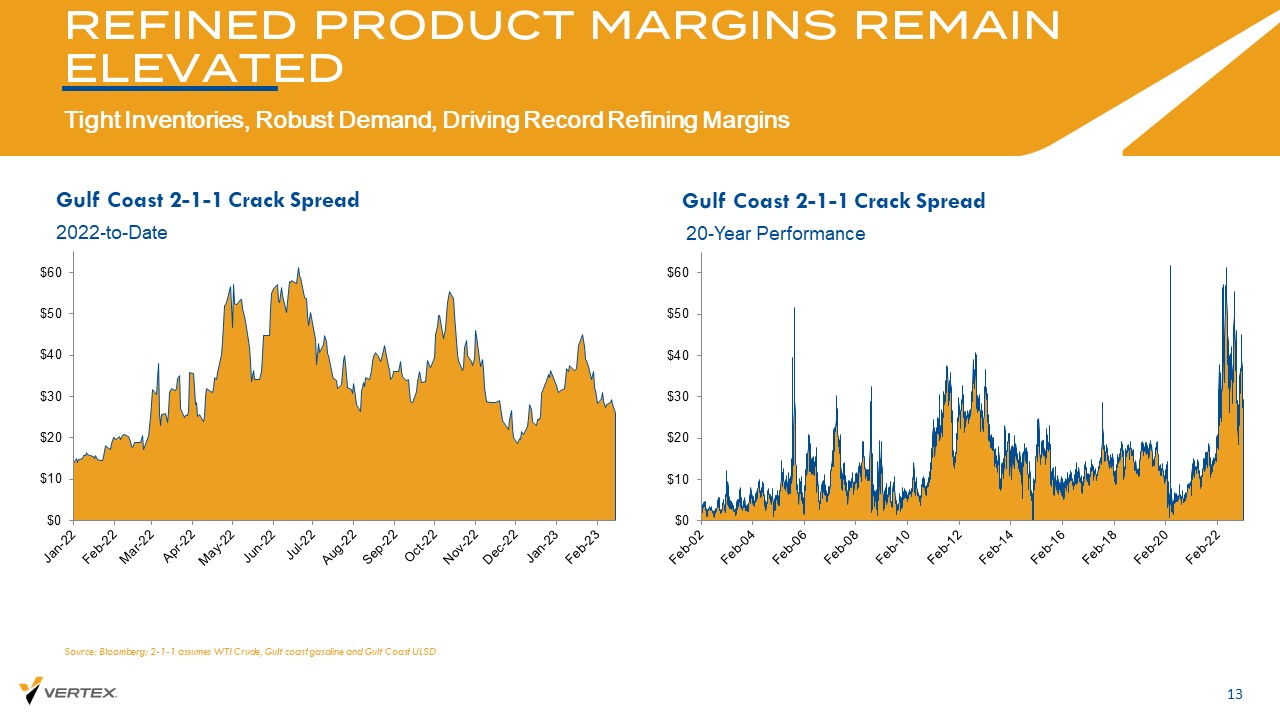
REFINED PRODUCT MARGINS REMAIN ELEVATED Tight Inventories, Robust Demand, Driving Record Refining Margins 13 Gulf Coast 2 - 1 - 1 Crack Spread 2022 - to - Date Source: Bloomberg; 2 - 1 - 1 assumes WTI Crude, Gulf coast gasoline and Gulf Coast ULSD Gulf Coast 2 - 1 - 1 Crack Spread 20 - Year Performance $0 $10 $20 $30 $40 $50 $60 $0 $10 $20 $30 $40 $50 $60
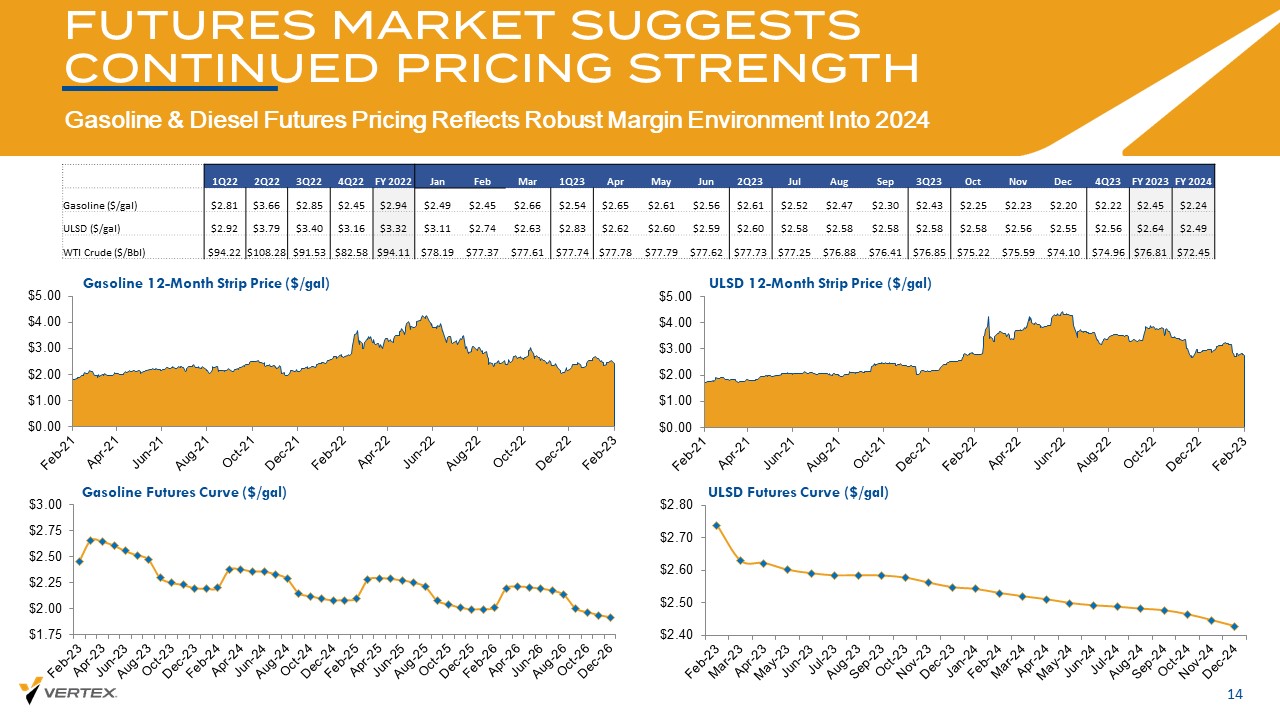
FUTURES MARKET SUGGESTS CONTINUED PRICING STRENGTH Gasoline & Diesel Futures Pricing Reflects Robust Margin Environment Into 2024 14 Gasoline 12 - Month Strip Price ($/gal) ULSD 12 - Month Strip Price ($/gal) 1Q22 2Q22 3Q22 4Q22 FY 2022 Jan Feb Mar 1Q23 Apr May Jun 2Q23 Jul Aug Sep 3Q23 Oct Nov Dec 4Q23 FY 2023 FY 2024 Gasoline ($/gal) $2.81 $3.66 $2.85 $2.45 $2.94 $2.49 $2.45 $2.66 $2.54 $2.65 $2.61 $2.56 $2.61 $2.52 $2.47 $2.30 $2.43 $2.25 $2.23 $2.20 $2.22 $2.45 $2.24 ULSD ($/gal) $2.92 $3.79 $3.40 $3.16 $3.32 $3.11 $2.74 $2.63 $2.83 $2.62 $2.60 $2.59 $2.60 $2.58 $2.58 $2.58 $2.58 $2.58 $2.56 $2.55 $2.56 $2.64 $2.49 WTI Crude ($/ Bbl ) $94.22 $108.28 $91.53 $82.58 $94.11 $78.19 $77.37 $77.61 $77.74 $77.78 $77.79 $77.62 $77.73 $77.25 $76.88 $76.41 $76.85 $75.22 $75.59 $74.10 $74.96 $76.81 $72.45 $0.00 $1.00 $2.00 $3.00 $4.00 $5.00 $0.00 $1.00 $2.00 $3.00 $4.00 $5.00 Gasoline Futures Curve ($/gal) ULSD Futures Curve ($/gal) $2.40 $2.50 $2.60 $2.70 $2.80 $1.75 $2.00 $2.25 $2.50 $2.75 $3.00
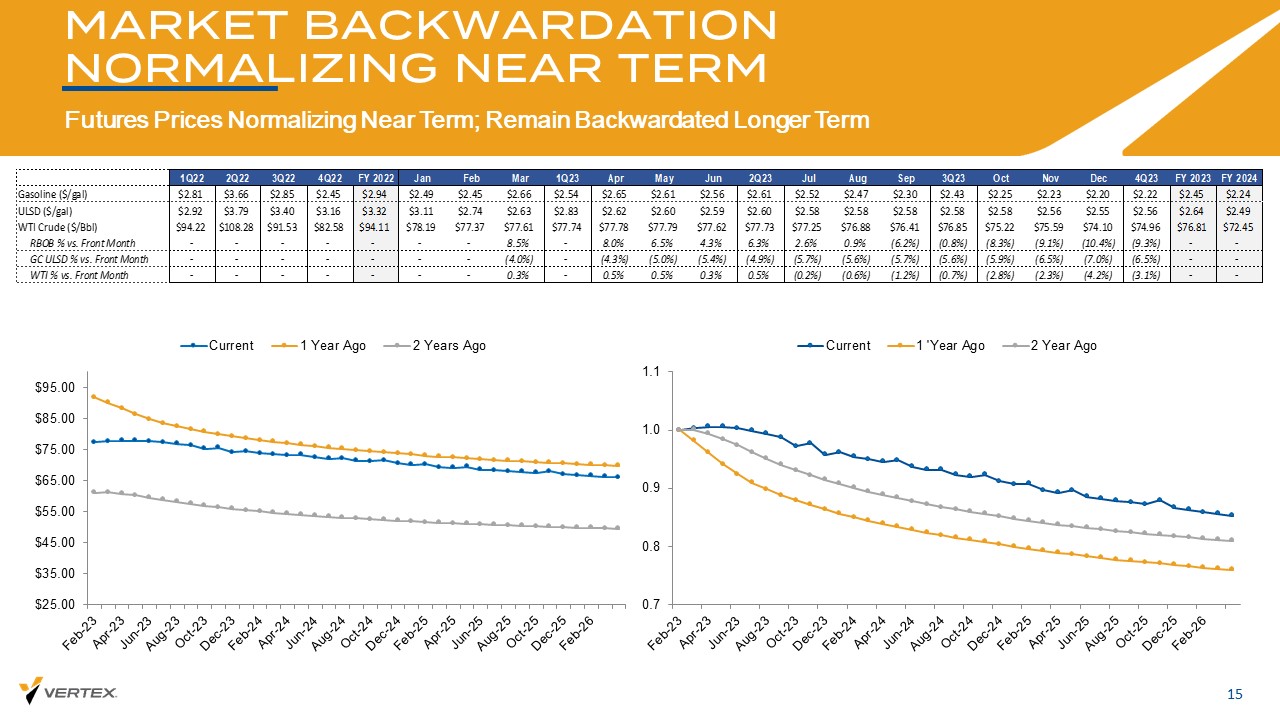
MARKET BACKWARDATION NORMALIZING NEAR TERM Futures Prices Normalizing Near Term; Remain Backwardated Longer Term 15 $25.00 $35.00 $45.00 $55.00 $65.00 $75.00 $85.00 $95.00 Current 1 Year Ago 2 Years Ago 0.7 0.8 0.9 1.0 1.1 Current 1 'Year Ago 2 Year Ago 1Q22 2Q22 3Q22 4Q22 FY 2022 Jan Feb Mar 1Q23 Apr May Jun 2Q23 Jul Aug Sep 3Q23 Oct Nov Dec 4Q23 FY 2023 FY 2024 Gasoline ($/gal) $2.81 $3.66 $2.85 $2.45 $2.94 $2.49 $2.45 $2.66 $2.54 $2.65 $2.61 $2.56 $2.61 $2.52 $2.47 $2.30 $2.43 $2.25 $2.23 $2.20 $2.22 $2.45 $2.24 ULSD ($/gal) $2.92 $3.79 $3.40 $3.16 $3.32 $3.11 $2.74 $2.63 $2.83 $2.62 $2.60 $2.59 $2.60 $2.58 $2.58 $2.58 $2.58 $2.58 $2.56 $2.55 $2.56 $2.64 $2.49 WTI Crude ($/Bbl) $94.22 $108.28 $91.53 $82.58 $94.11 $78.19 $77.37 $77.61 $77.74 $77.78 $77.79 $77.62 $77.73 $77.25 $76.88 $76.41 $76.85 $75.22 $75.59 $74.10 $74.96 $76.81 $72.45 RBOB % vs. Front Month - - - - - - - 8.5% - 8.0% 6.5% 4.3% 6.3% 2.6% 0.9% (6.2%) (0.8%) (8.3%) (9.1%) (10.4%) (9.3%) - - GC ULSD % vs. Front Month - - - - - - - (4.0%) - (4.3%) (5.0%) (5.4%) (4.9%) (5.7%) (5.6%) (5.7%) (5.6%) (5.9%) (6.5%) (7.0%) (6.5%) - - WTI % vs. Front Month - - - - - - - 0.3% - 0.5% 0.5% 0.3% 0.5% (0.2%) (0.6%) (1.2%) (0.7%) (2.8%) (2.3%) (4.2%) (3.1%) - -
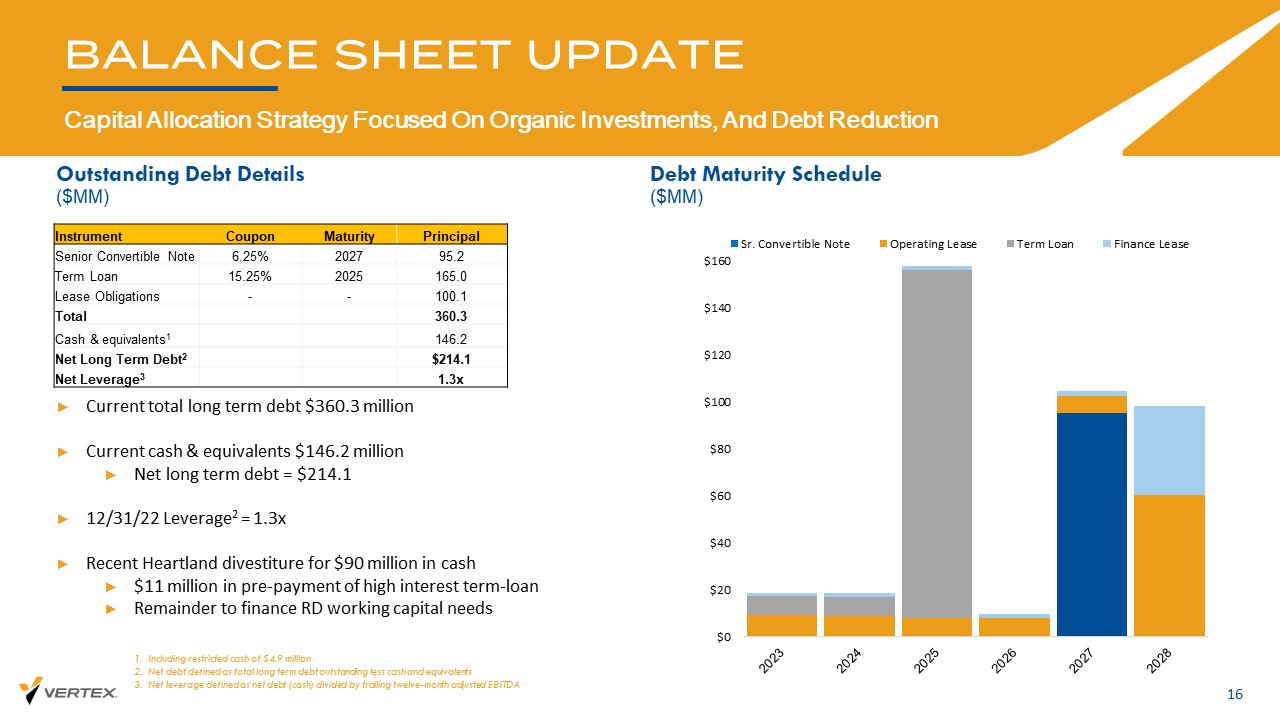
BALANCE SHEET UPDATE Capital Allocation Strategy Focused On Organic Investments, And Debt Reduction 16 Outstanding Debt Details ($MM) Debt Maturity Schedule ($MM) ► Current total long term debt $360.3 million ► Current cash & equivalents $146.2 million ► Net long term debt = $214.1 ► 12/31/22 Leverage 2 = 1.3x ► Recent Heartland divestiture for $90 million in cash ► $11 million in pre - payment of high interest term - loan ► Remainder to finance RD working capital needs $0 $20 $40 $60 $80 $100 $120 $140 $160 Sr. Convertible Note Operating Lease Term Loan Finance Lease Instrument Coupon Maturity Principal Senior Convertible Note 6.25% 2027 95.2 Term Loan 15.25% 2025 165.0 Lease Obligations - - 100.1 Total 360.3 Cash & equivalents 1 146.2 Net Long Term Debt 2 $214.1 Net Leverage 3 1.3x 1. Including restricted cash of $4.9 million 2. Net debt defined as total long term debt outstanding less cash and equivalents 3. Net leverage defined as net debt (cash) divided by trailing twelve - month adjusted EBITDA
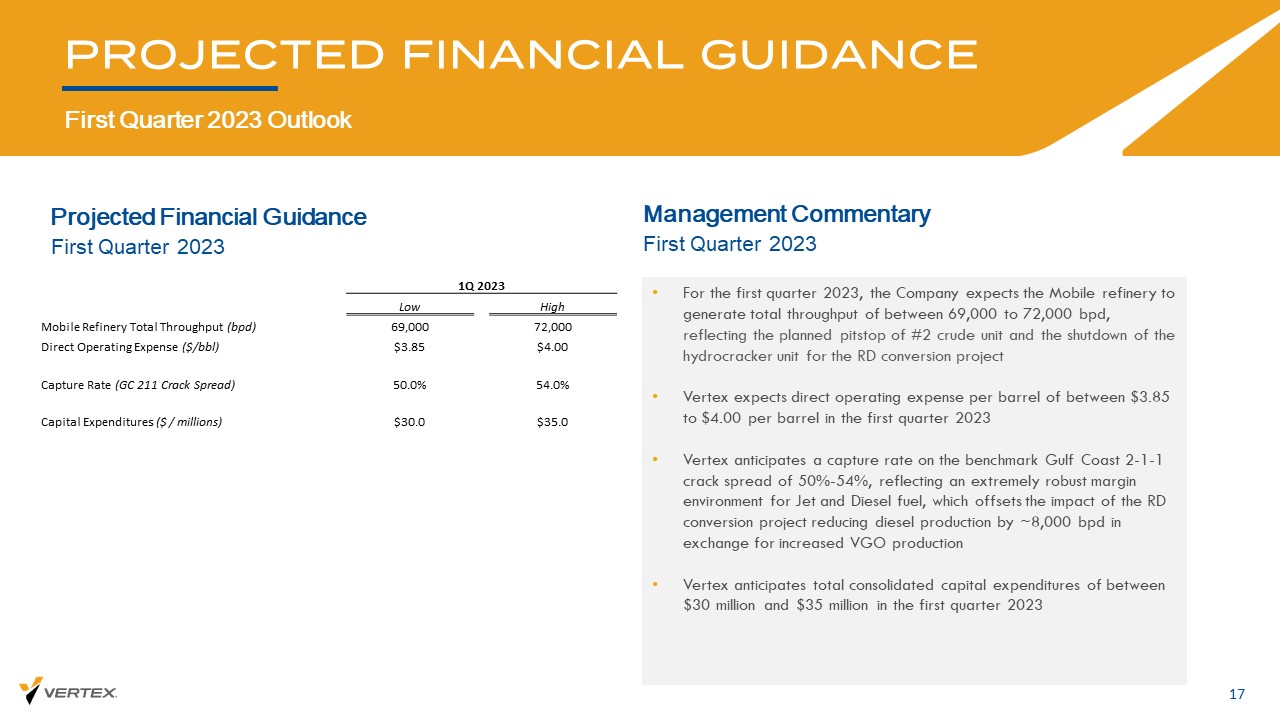
Projected Financial Guidance PROJECTED FINANCIAL GUIDANCE First Quarter 2023 Outlook 17 Management Commentary • For the first quarter 2023, the Company expects the Mobile refinery to generate total throughput of between 69,000 to 72,000 bpd, reflecting the planned pitstop of #2 crude unit and the shutdown of the hydrocracker unit for the RD conversion project • Vertex expects direct operating expense per barrel of between $3.85 to $4.00 per barrel in the first quarter 2023 • Vertex anticipates a capture rate on the benchmark Gulf Coast 2 - 1 - 1 crack spread of 50% - 54%, reflecting an extremely robust margin environment for Jet and Diesel fuel, which offsets the impact of the RD conversion project reducing diesel production by ~8,000 bpd in exchange for increased VGO production • Vertex anticipates total consolidated capital expenditures of between $30 million and $35 million in the first quarter 2023 First Quarter 2023 First Quarter 2023 1Q 2023 Low High Mobile Refinery Total Throughput (bpd) 69,000 72,000 Direct Operating Expense ($/ bbl ) $3.85 $4.00 Capture Rate (GC 211 Crack Spread) 50.0% 54.0% Capital Expenditures ($ / millions) $30.0 $35.0
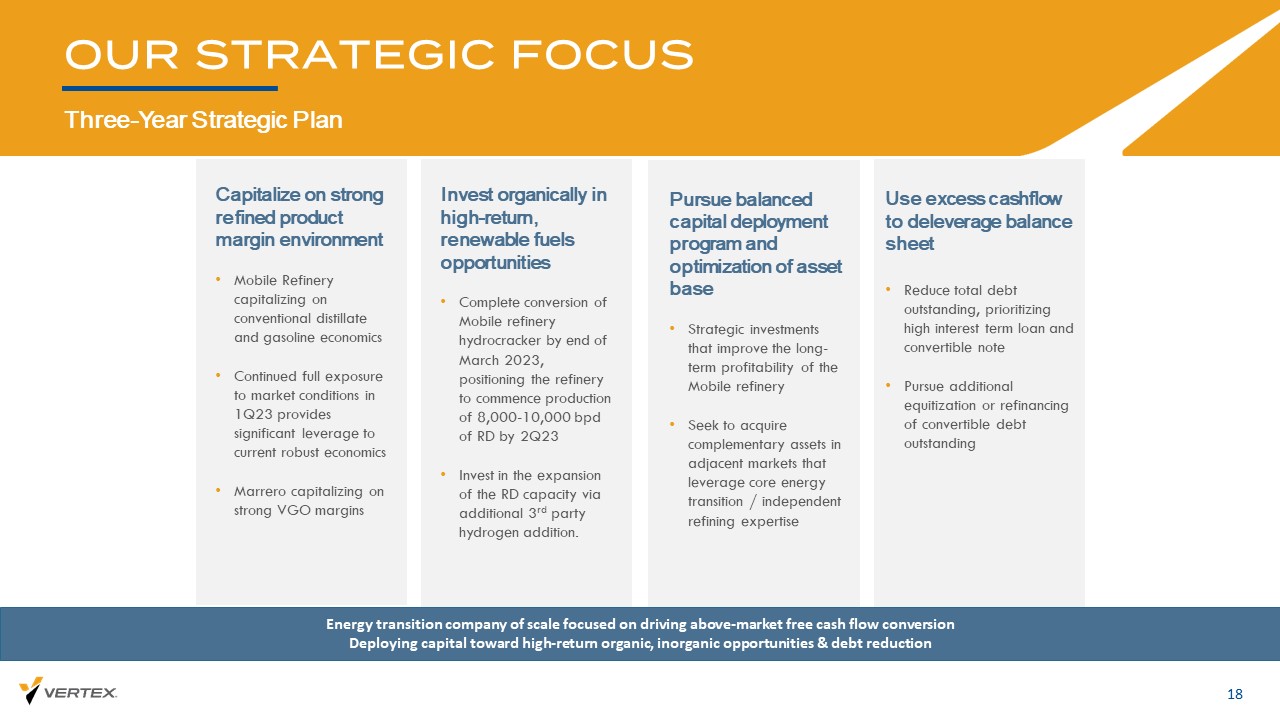
OUR STRATEGIC FOCUS Three - Year Strategic Plan 18 Pursue balanced capital deployment program and optimization of asset base • Strategic investments that improve the long - term profitability of the Mobile refinery • Seek to acquire complementary assets in adjacent markets that leverage core energy transition / independent refining expertise Capitalize on strong refined product margin environment • Mobile Refinery capitalizing on conventional distillate and gasoline economics • Continued full exposure to market conditions in 1Q23 provides significant leverage to current robust economics • Marrero capitalizing on strong VGO margins Invest organically in high - return, renewable fuels opportunities • Complete conversion of Mobile refinery hydrocracker by end of March 2023, positioning the refinery to commence production of 8,000 - 10,000 bpd of RD by 2Q23 • Invest in the expansion of the RD capacity via additional 3 rd party hydrogen addition. Energy transition company of scale focused on driving above - market free cash flow conversion Deploying capital toward high - return organic, inorganic opportunities & debt reduction Use excess cashflow to deleverage balance sheet • Reduce total debt outstanding, prioritizing high interest term loan and convertible note • Pursue additional equitization or refinancing of convertible debt outstanding

APPENDIX
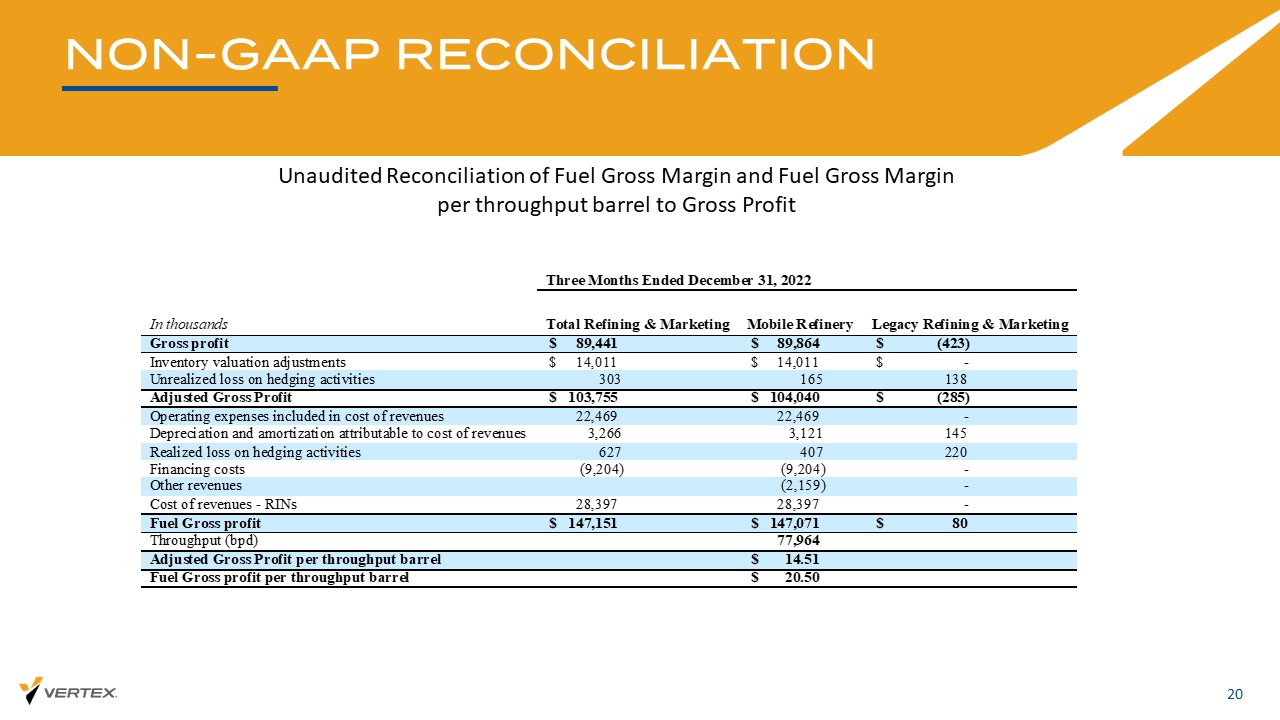
NON - GAAP RECONCILIATION 20 Unaudited Reconciliation of Fuel Gross Margin and Fuel Gross Margin per throughput barrel to Gross Profit Three Months Ended December 31, 2022 In thousands Total Refining & Marketing Mobile Refinery Legacy Refining & Marketing Gross profit $ 89,441 $ 89,864 $ (423) Inventory valuation adjustments $ 14,011 $ 14,011 $ - Unrealized loss on hedging activities 303 165 138 Adjusted Gross Profit $ 103,755 $ 104,040 $ (285) Operating expenses included in cost of revenues 22,469 22,469 - Depreciation and amortization attributable to cost of revenues 3,266 3,121 145 Realized loss on hedging activities 627 407 220 Financing costs (9,204) (9,204) - Other revenues (2,159) - Cost of revenues - RINs 28,397 28,397 - Fuel Gross profit $ 147,151 $ 147,071 $ 80 Throughput (bpd) 77,964 Adjusted Gross Profit per throughput barrel $ 14.51 Fuel Gross profit per throughput barrel $ 20.50
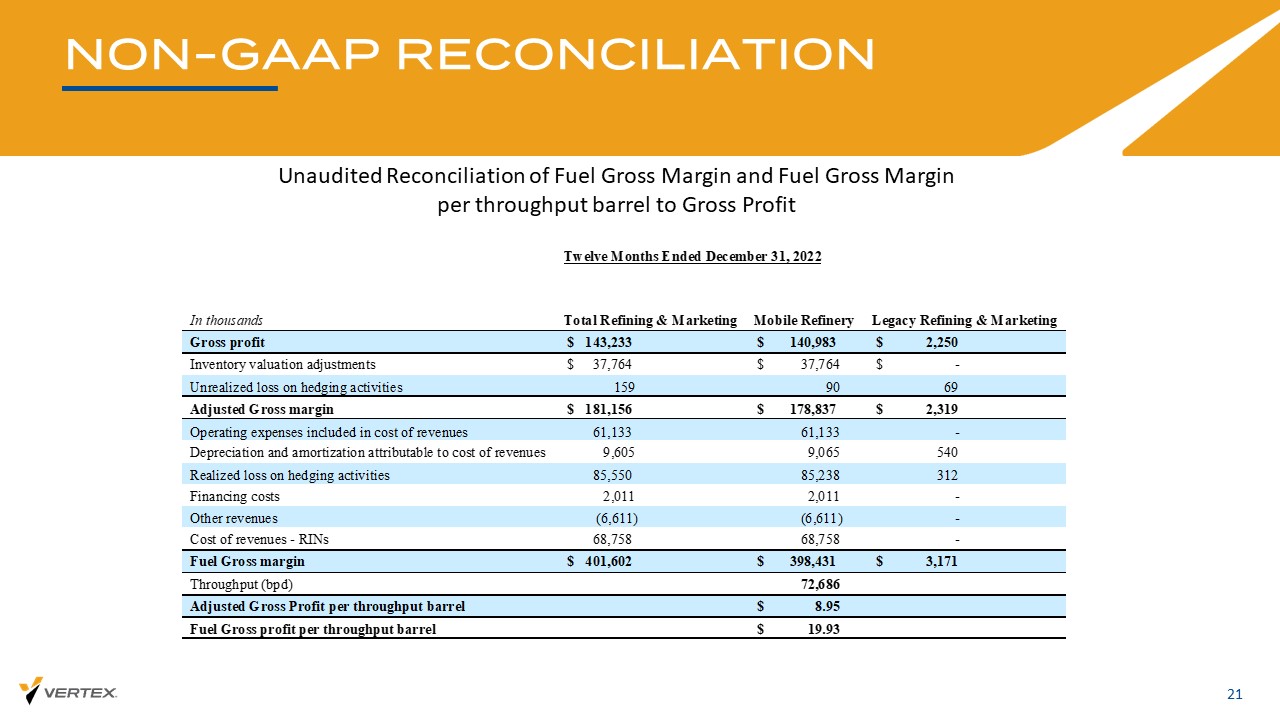
NON - GAAP RECONCILIATION 21 Unaudited Reconciliation of Fuel Gross Margin and Fuel Gross Margin per throughput barrel to Gross Profit Twelve Months Ended December 31, 2022 In thousands Total Refining & Marketing Mobile Refinery Legacy Refining & Marketing Gross profit $ 143,233 $ 140,983 $ 2,250 Inventory valuation adjustments $ 37,764 $ 37,764 $ - Unrealized loss on hedging activities 159 90 69 Adjusted Gross margin $ 181,156 $ 178,837 $ 2,319 Operating expenses included in cost of revenues 61,133 61,133 - Depreciation and amortization attributable to cost of revenues 9,605 9,065 540 Realized loss on hedging activities 85,550 85,238 312 Financing costs 2,011 2,011 - Other revenues (6,611) (6,611) - Cost of revenues - RINs 68,758 68,758 - Fuel Gross margin $ 401,602 $ 398,431 $ 3,171 Throughput (bpd) 72,686 Adjusted Gross Profit per throughput barrel $ 8.95 Fuel Gross profit per throughput barrel $ 19.93
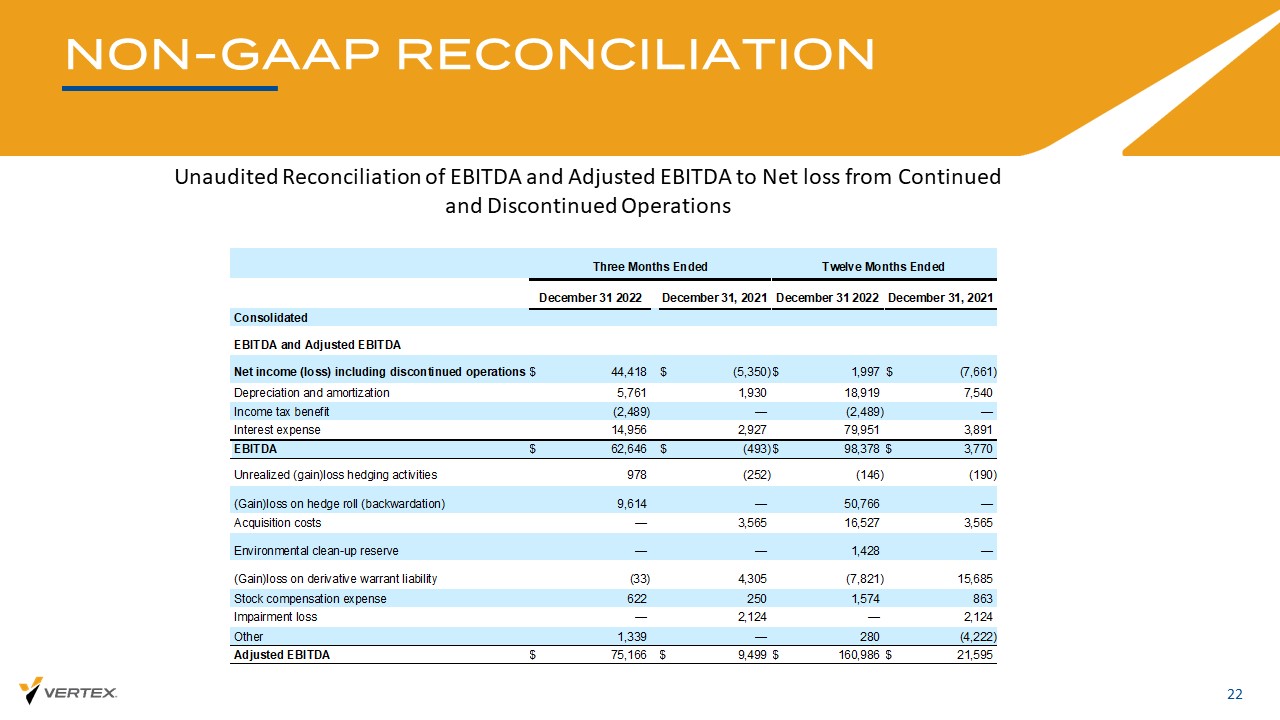
NON - GAAP RECONCILIATION 22 Unaudited Reconciliation of EBITDA and Adjusted EBITDA to Net loss from Continued and Discontinued Operations Three Months Ended Twelve Months Ended December 31 2022 December 31, 2021 December 31 2022 December 31, 2021 Consolidated EBITDA and Adjusted EBITDA Net income (loss) including discontinued operations $ 44,418 $ (5,350) $ 1,997 $ (7,661) Depreciation and amortization 5,761 1,930 18,919 7,540 Income tax benefit (2,489) — (2,489) — Interest expense 14,956 2,927 79,951 3,891 EBITDA $ 62,646 $ (493) $ 98,378 $ 3,770 Unrealized (gain)loss hedging activities 978 (252) (146) (190) (Gain)loss on hedge roll (backwardation) 9,614 — 50,766 — Acquisition costs — 3,565 16,527 3,565 Environmental clean-up reserve — — 1,428 — (Gain)loss on derivative warrant liability (33) 4,305 (7,821) 15,685 Stock compensation expense 622 250 1,574 863 Impairment loss — 2,124 — 2,124 Other 1,339 — 280 (4,222) Adjusted EBITDA $ 75,166 $ 9,499 $ 160,986 $ 21,595
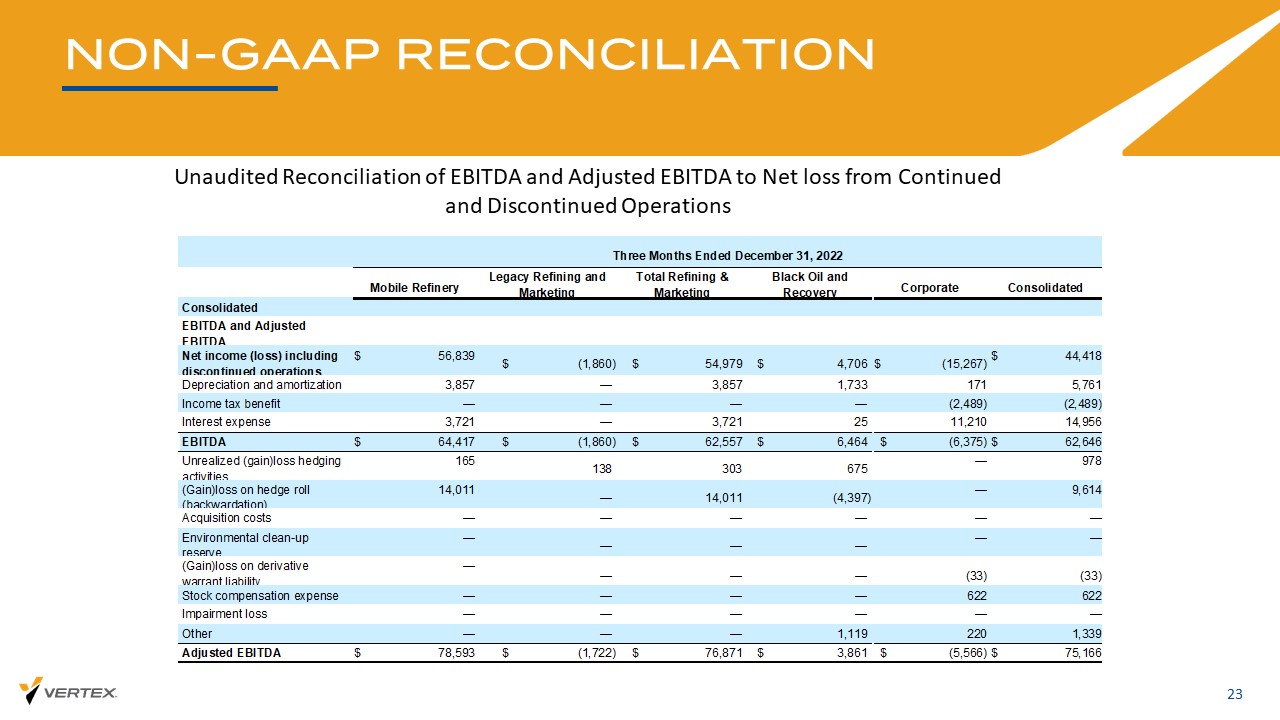
NON - GAAP RECONCILIATION 23 Unaudited Reconciliation of EBITDA and Adjusted EBITDA to Net loss from Continued and Discontinued Operations Three Months Ended December 31, 2022 Mobile Refinery Legacy Refining and Marketing Total Refining & Marketing Black Oil and Recovery Corporate Consolidated Consolidated EBITDA and Adjusted EBITDA Net income (loss) including discontinued operations $ 56,839 $ (1,860) $ 54,979 $ 4,706 $ (15,267) $ 44,418 Depreciation and amortization 3,857 — 3,857 1,733 171 5,761 Income tax benefit — — — — (2,489) (2,489) Interest expense 3,721 — 3,721 25 11,210 14,956 EBITDA $ 64,417 $ (1,860) $ 62,557 $ 6,464 $ (6,375) $ 62,646 Unrealized (gain)loss hedging activities 165 138 303 675 — 978 (Gain)loss on hedge roll (backwardation) 14,011 — 14,011 (4,397) — 9,614 Acquisition costs — — — — — — Environmental clean-up reserve — — — — — — (Gain)loss on derivative warrant liability — — — — (33) (33) Stock compensation expense — — — — 622 622 Impairment loss — — — — — — Other — — — 1,119 220 1,339 Adjusted EBITDA $ 78,593 $ (1,722) $ 76,871 $ 3,861 $ (5,566) $ 75,166
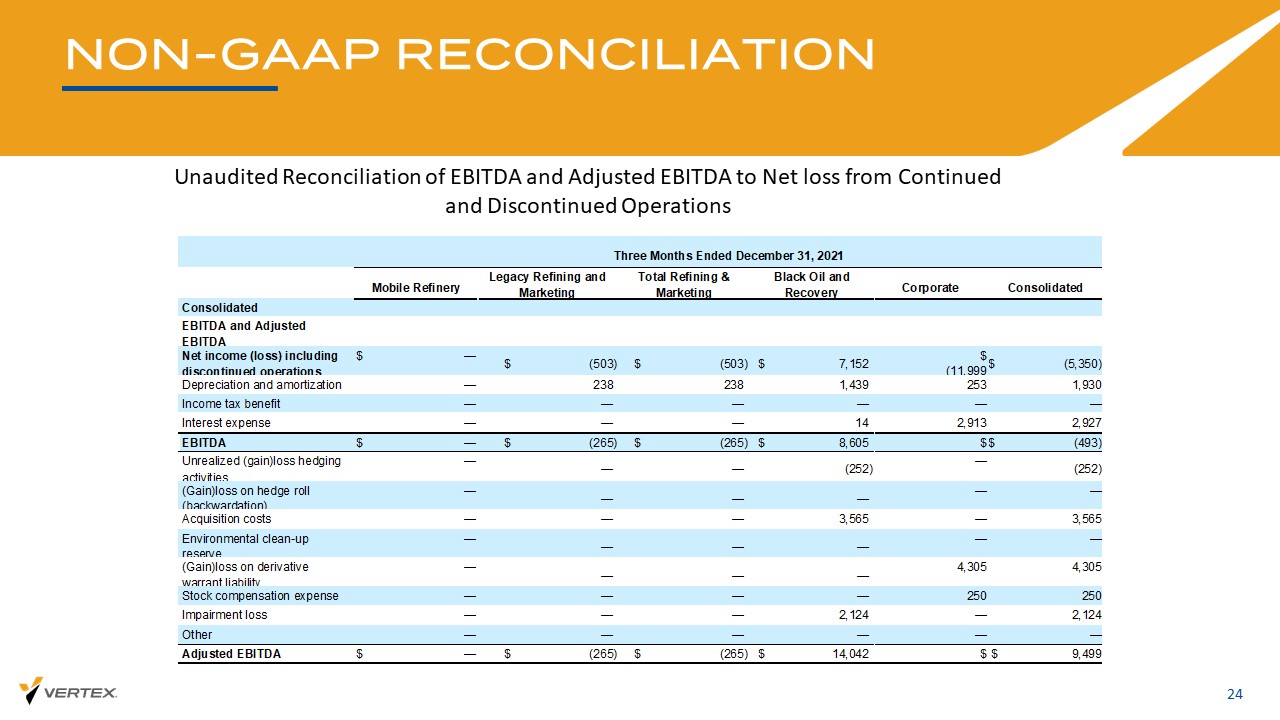
NON - GAAP RECONCILIATION 24 Unaudited Reconciliation of EBITDA and Adjusted EBITDA to Net loss from Continued and Discontinued Operations Three Months Ended December 31, 2021 Mobile Refinery Legacy Refining and Marketing Total Refining & Marketing Black Oil and Recovery Corporate Consolidated Consolidated EBITDA and Adjusted EBITDA Net income (loss) including discontinued operations $ — $ (503) $ (503) $ 7,152 $ (11,999 ) $ (5,350) Depreciation and amortization — 238 238 1,439 253 1,930 Income tax benefit — — — — — — Interest expense — — — 14 2,913 2,927 EBITDA $ — $ (265) $ (265) $ 8,605 $ (8,833 ) $ (493) Unrealized (gain)loss hedging activities — — — (252) — (252) (Gain)loss on hedge roll (backwardation) — — — — — — Acquisition costs — — — 3,565 — 3,565 Environmental clean-up reserve — — — — — — (Gain)loss on derivative warrant liability — — — — 4,305 4,305 Stock compensation expense — — — — 250 250 Impairment loss — — — 2,124 — 2,124 Other — — — — — — Adjusted EBITDA $ — $ (265) $ (265) $ 14,042 $ (4,278 ) $ 9,499
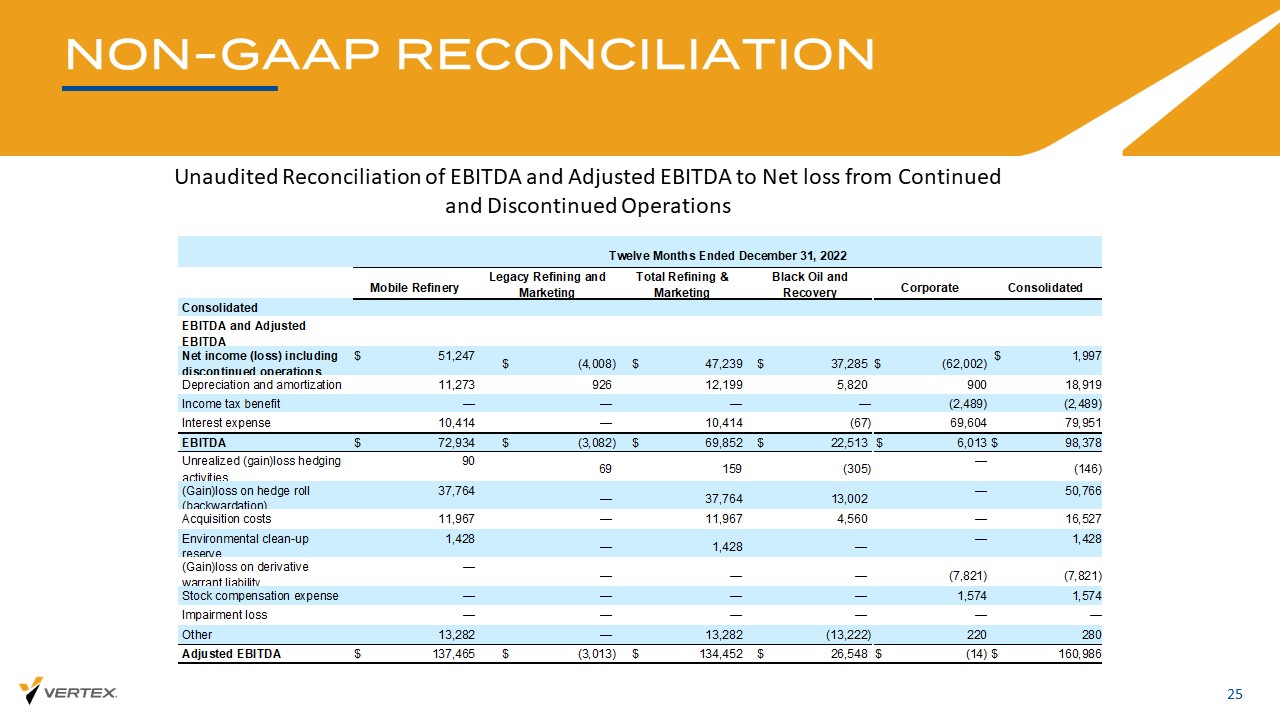
NON - GAAP RECONCILIATION 25 Unaudited Reconciliation of EBITDA and Adjusted EBITDA to Net loss from Continued and Discontinued Operations Twelve Months Ended December 31, 2022 Mobile Refinery Legacy Refining and Marketing Total Refining & Marketing Black Oil and Recovery Corporate Consolidated Consolidated EBITDA and Adjusted EBITDA Net income (loss) including discontinued operations $ 51,247 $ (4,008) $ 47,239 $ 37,285 $ (62,002) $ 1,997 Depreciation and amortization 11,273 926 12,199 5,820 900 18,919 Income tax benefit — — — — (2,489) (2,489) Interest expense 10,414 — 10,414 (67) 69,604 79,951 EBITDA $ 72,934 $ (3,082) $ 69,852 $ 22,513 $ 6,013 $ 98,378 Unrealized (gain)loss hedging activities 90 69 159 (305) — (146) (Gain)loss on hedge roll (backwardation) 37,764 — 37,764 13,002 — 50,766 Acquisition costs 11,967 — 11,967 4,560 — 16,527 Environmental clean-up reserve 1,428 — 1,428 — — 1,428 (Gain)loss on derivative warrant liability — — — — (7,821) (7,821) Stock compensation expense — — — — 1,574 1,574 Impairment loss — — — — — — Other 13,282 — 13,282 (13,222) 220 280 Adjusted EBITDA $ 137,465 $ (3,013) $ 134,452 $ 26,548 $ (14) $ 160,986

NON - GAAP RECONCILIATION 26 Unaudited Reconciliation of EBITDA and Adjusted EBITDA to Net loss from Continued and Discontinued Operations Twelve Months Ended December 31, 2021 Mobile Refinery Legacy Refining and Marketing Total Refining & Marketing Black Oil and Recovery Corporate Consolidated Consolidated EBITDA and Adjusted EBITDA Net income (loss) including discontinued operations $ — $ (560) $ (560) $ 22,156 $ (29,257) $ (7,661) Depreciation and amortization — 943 943 5,585 1,012 7,540 Income tax benefit — — — — — — Interest expense — — — 59 3,832 3,891 EBITDA $ — $ 383 $ 383 $ 27,800 $ (24,413) $ 3,770 Unrealized (gain)loss hedging activities — — — (190) — (190) (Gain)loss on hedge roll (backwardation) — — — — — — Acquisition costs — — — — 3,565 3,565 Environmental clean-up reserve — — — — — — (Gain)loss on derivative warrant liability — — — — 15,685 15,685 Stock compensation expense — — — — 863 863 Impairment loss — — — 2,124 — 2,124 Other — — — — (4,222) (4,222) Adjusted EBITDA $ — $ 383 $ 383 $ 29,734 $ (8,522) $ 21,595