UNITED STATES
SECURITIES AND EXCHANGE COMMISSION
Washington, D.C. 20549
FORM N-CSR
CERTIFIED SHAREHOLDER REPORT OF REGISTERED
MANAGEMENT INVESTMENT COMPANIES
Investment Company Act file number 811-07076
Wilshire Mutual Funds, Inc.
|
| (Exact name of registrant as specified in charter) |
|
Wilshire Associates Incorporated 1299 Ocean Avenue, Suite 700 Santa Monica, CA 90401-1085 |
| (Address of principal executive offices) (Zip code) |
Lawrence Davanzo, President
1299 Ocean Avenue, Suite 700
Santa Monica, CA 90401-1085
|
| (Name and address of agent for service) |
Registrant’s telephone number, including area code: 310-260-6639
Date of fiscal year end: December 31
Date of reporting period: December 31, 2006
Form N-CSR is to be used by management investment companies to file reports with the Commission not later than 10 days after the transmission to stockholders of any report that is required to be transmitted to stockholders under Rule 30e-1 under the Investment Company Act of 1940 (17 CFR 270.30e-1). The Commission may use the information provided on Form N-CSR in its regulatory, disclosure review, inspection, and policymaking roles.
A registrant is required to disclose the information specified by Form N-CSR, and the Commission will make this information public. A registrant is not required to respond to the collection of information contained in Form N-CSR unless the Form displays a currently valid Office of Management and Budget (“OMB”) control number. Please direct comments concerning the accuracy of the information collection burden estimate and any suggestions for reducing the burden to Secretary, Securities and Exchange Commission, 100 F Street, NE, Washington, DC 20549. The OMB has reviewed this collection of information under the clearance requirements of 44 U.S.C. § 3507.
| Item 1. | Reports to Stockholders. |
The Report to Shareholders is attached herewith.

ANNUAL REPORT
LARGE COMPANY GROWTH PORTFOLIO
LARGE COMPANY VALUE PORTFOLIO
SMALL COMPANY GROWTH PORTFOLIO
SMALL COMPANY VALUE PORTFOLIO
DOW JONES WILSHIRE 5000 INDEX PORTFOLIO
December 31, 2006
www.wilfunds.com
Wilshire Mutual Funds, Inc.
This report is for the general information of the shareholders of Large Company Growth Portfolio, Large Company Value Portfolio, Small Company Growth Portfolio, Small Company Value Portfolio and Dow Jones Wilshire 5000 Index Portfolio. Its use in connection with any offering of a Portfolio’s shares is authorized only if accompanied or preceded by the Portfolio’s current prospectus.
Wilshire Mutual Funds, Inc. are distributed by PFPC Distributors, Inc.
Dear Wilshire Mutual Funds Shareholder,
We are pleased to present this Annual report to all shareholders of the Wilshire Mutual Funds, Inc. This report covers the year ended December 31, 2006 (the “Period”), for all share classes of the Large Company Growth, Large Company Value, Small Company Growth, Small Company Value and Dow Jones Wilshire 5000 Index Portfolio.
MARKET ENVIRONMENT
U.S. GDP growth slowed progressively during the year. The latest GDP figure showed annualized growth in GDP of 2.0% for the 3rd quarter of 2006, lower than the 5.6% and 2.6% annualized growth figures recorded for the 1st and 2nd quarter of the year, respectively. Data from the U.S. Department of Labor suggested further strengthening of the labor market. Non-farm payrolls increased by 167,000 in December; and the unemployment rate fell from 4.9% to 4.5% over the year. The Consumer Price Index (“CPI”) climbed by 2.5% for the year, the best showing since 2003 and nearly a full percentage point lower than the 3.4% jump in 2005. The CPI report showed that core inflation, which excludes energy and food costs, rose 2.6% last year, compared with 2.2% gains in both 2004 and 2005. It was the highest increase since a 2.7% jump in 2001.
The U.S. stock market posted its fourth consecutive annual advance in 2006, with the Dow Jones Wilshire 5000 Index up 15.77%. A fifth straight year of double-digit corporate earnings growth and an active mergers and acquisitions environment, fueled in large part by record levels of private equity buyouts, encouraged equity investors to push stocks higher.
Despite concerns of volatile energy prices, higher short-term interest rates, and declining home building activities, investors benefited from a strong 4th quarter rally in the broad U.S. equity market. The market rose 7.2% in the last three months of the year, the strongest quarterly return in two years.
The U.S. equity market advance was led by small cap stocks, whose outperforming trend against large cap stocks was extended to eight consecutive years. The Dow Jones Wilshire Small Cap Index returned 16.99% for the year, outperforming the Dow Jones Wilshire Large Cap Index by 1.37% for the same period. The investment environment for growth investors remained challenging. Healthcare and technology, the traditional growth sectors of the economy lagged behind the more cyclical sectors of Energy and Materials. As a result, the 9.71% return of the Dow Jones Wilshire Top 2500 Growth Index trailed the Dow Jones Wilshire Top 2500 Value Index by 11.93% for the year.
The bond market returns improved in 2006, returning 4.33% as compared to the 2.43% return from the previous year. Bond investors experienced positive returns during the second half of the year as the Fed paused from its interest rate tightening campaign and left short-term interest rate unchanged. After raising the key Fed Funds rate four times in the first six months of the year by a total of 1% from 4.25% to 5.25%, the Fed refrained from further rate hikes for the rest of the year on concerns of rapidly slowing economy. The stability in short-term interest rates served as catalyst for positive bond returns in the latter part of the year.
International equities continued the out-performance against U.S. equities for the fourth consecutive year. Measured in U.S. dollar terms, the MSCI AC World ex. U.S. Index returned 26.65% for the Period, handily outpacing the 15.77% return for the Dow Jones Wilshire 5000 Index. Strong economic growth and higher energy prices boosted returns of emerging markets around the globe. Emerging markets, as measured by the MSCI Emerging Market Index, advanced 32.16% for the Period.
1
FUND PERFORMANCE OVERVIEW*
Wilshire is pleased to discuss the results with our shareholders. With the exception of the Large Company Growth Portfolio, the remaining four funds posted double-digit returns for the Period. The Large Company Value and the Small Company Value portfolios returned 18.49% and 19.64%, respectively, for the Period. Collectively, value stocks provided the most robust returns for equity investors as value stocks continued their dominance over growth stocks. The Small Company Growth Portfolio returned 11.12% for the Period. Despite general optimism concerning a market rebound by growth stocks in 2006, growth stocks lagged value stocks for the seventh consecutive year. The Large Company Growth Portfolio gained 4.96% for the Period, in a challenging environment for large growth stocks. The Dow Jones Wilshire 5000 Index Portfolio, which is designed to provide investors with the broadest U.S. equity market exposure gained 14.46% for the Period.
Sincerely,

Lawrence E. Davanzo, President
| * | The performance stated is for Investment Class Shares. The performance data quoted represents past performance and does not guarantee future results. Current performance may be lower or higher. Performance quoted to the most recent month end may be obtained at www.wilfunds.com. The investment return and principal value of an investment will fluctuate so that shares, when redeemed, may be worth more or less than their original cost. |
2
| | |
LARGE COMPANY GROWTH PORTFOLIO COMMENTARY | |  |
INVESTMENT CLASS SHARES
Average Annual Total Return *
| | | |
One Year Ended 12/31/06 | | 4.96 | % |
Five Years Ended 12/31/06 | | 3.74 | % |
Ten Years Ended 12/31/06 | | 7.75 | % |
Comparison of Change in Value of $10,000 Investment in Shares of
Large Company Growth Portfolio and the Russell 1000 Growth Index
through 12/31/06.
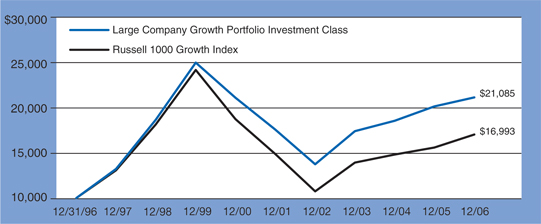
The performance data quoted represents past performance and does not guarantee future results. Current performance may be lower or higher. Performance data current to the most recent month end may be obtained at www.wilfunds.com. The investment return and principal value of an investment will fluctuate so that shares, when redeemed, may be worth more or less than their original cost. The Russell 1000 Growth Index is an unmanaged index that measures the performance of the largest 1,000 U.S. companies with high price-to-book ratios and high forecasted growth values. Index performance is presented for general comparative purposes. Unlike a mutual fund, the performance of an index assumes no taxes, transaction costs, management fees or other expenses. An individual cannot invest directly in any index. The table above does not reflect the deduction that a shareholder would pay on Portfolio distributions or the redemption of Portfolio shares.
The Portfolio’s Investment Class annual operating expense ratio is 1.34% as of 12/31/06.
| * | Assumes reinvestment of all dividends and distributions. During certain periods since inception, certain fees and expenses were waived or reimbursed. For the year ended December 31, 2006, waivers were less than 0.01% of average net assets. Without such waivers and reimbursements, historical total returns would have been lower. |
3
| | |
Large Company Growth Portfolio COMMENTARY - (CONTINUED) | |  |
INSTITUTIONAL CLASS SHARES
Average Annual Total Return *
| | | |
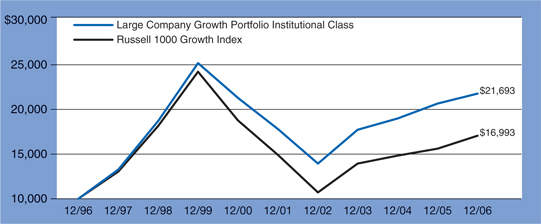
One Year Ended 12/31/06 | | 5.35 | % |
Five Years Ended 12/31/06 | | 4.09 | % |
Ten Years Ended 12/31/06 | | 8.05 | % |
Comparison of Change in Value of $10,000 Investment in Shares of
Large Company Growth Portfolio and the Russell 1000 Growth Index through 12/31/06.
The performance data quoted represents past performance and does not guarantee future results. Current performance may be lower or higher. Performance data current to the most recent month end may be obtained at www.wilfunds.com. The investment return and principal value of an investment will fluctuate so that shares, when redeemed, may be worth more or less than their original cost. The Russell 1000 Growth Index is an unmanaged index that measures the performance of the largest 1,000 U.S. companies with high price-to-book ratios and high forecasted growth values. Index performance is presented for general comparative purposes. Unlike a mutual fund, the performance of an index assumes no taxes, transaction costs, management fees or other expenses. An individual cannot invest directly in any index. The table above does not reflect the deduction that a shareholder would pay on Portfolio distributions or the redemption of Portfolio shares.
The Portfolio’s Institutional Class annual operating expense ratio is 0.98% as of 12/31/06.
| * | Assumes reinvestment of all dividends and distributions. During certain periods since inception, certain fees and expenses were waived or reimbursed. For the year ended December 31, 2006, waivers were less than 0.01% of average net assets. Without such waivers and reimbursements, historical total returns would have been lower. |
4
| | |
LARGE COMPANY GROWTH PORTFOLIO COMMENTARY - (CONTINUED) | | |
Investment Class Shares of the Large Company Growth Portfolio (the “Portfolio”) returned 4.96% while the Institutional Share Class returned 5.35% for the 12-month period ended December 31, 2006 (the “Period”). The Period marked the fourth consecutive year of positive returns for the Portfolio. The Portfolio underperformed its benchmark, the Russell 1000 Growth Index, which returned 9.07% for the same Period.
For the seventh consecutive year, large growth stocks finished behind its value counterparts. Over the seven-year period, value stocks’ annualized return of 7.79% is 12.66% above the annualized return of (4.87)% for growth stocks. For the Period, the Russell 1000 Growth Index returned 9.07% while the Russell 1000 Value Index gained 22.21%. In the growth stock spectrum, smaller growth companies outperformed larger growth companies. Compared to the 9.07% return for the larger growth companies comprised in the Russell 1000 Growth Index, the Russell 2000 Growth Index, which represents smaller growth companies returned 13.35% for the Period.
The Portfolio stayed true to its growth objectives and benefited from holding a handful of slightly smaller growth companies in its portfolio. The Portfolio also participated in the industries where returns were strongest, such as Industrials, Transportation, Energy, and Basic Materials. While most of the Portfolio’s holdings posted positive returns, a handful of core holdings detracted the Portfolio’s performance. Among the greatest detractors of performance for 2006 were a couple of leading performance contributors from the previous year. Posting strong positive returns in 2005, Sandisk Corp. and Genetech, Inc. declined 59% and 14%, respectively, during 2006. While valuations have improved, technology and biotechnology segments of the market continue to be challenging.
The performance data quoted represents past performance and does not guarantee future results. Current performance may be lower or higher. Performance data current to the most recent month end may be obtained at www.wilfunds.com. The investment return and principal value of an investment will fluctuate so that shares, when redeemed, may be worth more or less than their original cost. Portfolio holdings subject to change. The Russell 1000 Growth Index is an unmanaged index that measures the performance of the largest 1,000 companies with high price-to-book ratios and high forecasted growth values. Index performance is presented for general comparative purposes. Unlike a mutual fund, the performance of an index assumes no taxes, transaction costs, management fees or other expenses. An individual cannot invest directly in any index.
5
| | |
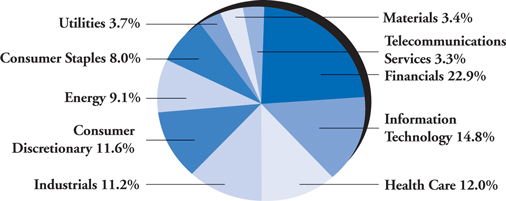
LARGE COMPANY GROWTH PORTFOLIO COMMENTARY - (CONTINUED) | | |
PORTFOLIO SECTOR WEIGHTING*
(As of December 31, 2006)
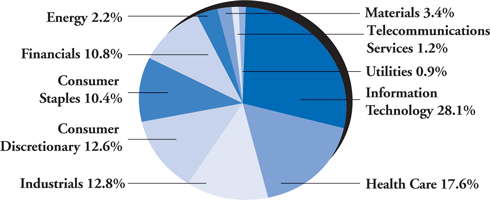
| * | Based on percent of Portfolio’s total investments in securities market value. |
6
| | |
LARGE COMPANY VALUE PORTFOLIO COMMENTARY | | |
INVESTMENT CLASS SHARES
Average Annual Total Return *
| | | |
One Year Ended 12/31/06 | | 18.49 | % |
Five Years Ended 12/31/06 | | 9.23 | % |
Ten Years Ended 12/31/06 | | 9.17 | % |
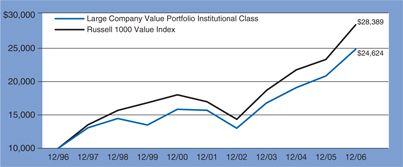
COMPARATIVE PERFORMANCE
Comparison of Change in Value of $10,000 Investment in Shares of
Large Company Value Portfolio and the Russell 1000 Value Index
through 12/31/06.
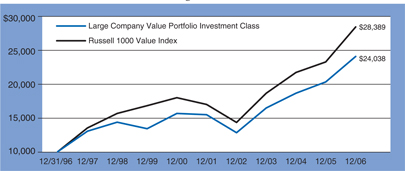
The performance data quoted represents past performance and does not guarantee future results. Current performance may be lower or higher. Performance data current to the most recent month end may be obtained at www.wilfunds.com. The investment return and principal value of an investment will fluctuate so that shares, when redeemed, may be worth more or less than their original cost. The Russell 1000 Value Index is an unmanaged index that measures the performance of the largest 1,000 U.S. companies with lower price-to-book ratios and lower forecasted growth values. Index performance is presented for general comparative purposes. Unlike a mutual fund, the performance of an index assumes no taxes, transaction costs, management fees or other expenses. An individual cannot directly invest in any index. The table above does not reflect the deduction that a shareholder would pay on Portfolio distributions or the redemption of Portfolio shares.
The Portfolio’s Investment Class annual operating expense ratio is 1.39% as of 12/31/06.
| * | Assumes reinvestment of all dividends and distributions. During certain periods since inception, certain fees and expenses were waived or reimbursed. For the year ended December 31, 2006, waivers were less than 0.01% of average net assets. Without such waivers and reimbursements, historical total returns would have been lower. |
7
| | |
LARGE COMPANY VALUE PORTFOLIO COMMENTARY - (CONTINUED) | | |
INSTITUTIONAL CLASS SHARES
Average Annual Total Return *
| | | |
One Year Ended 12/31/06 | | 18.94 | % |
Five Years Ended 12/31/06 | | 9.54 | % |
Ten Years Ended 12/31/06 | | 9.43 | % |
COMPARATIVE PERFORMANCE
Comparison of Change in Value of $10,000 Investment in Shares of
Large Company Value Portfolio and the Russell 1000 Value Index
through 12/31/06.
The performance data quoted represents past performance and does not guarantee future results. Current performance may be lower or higher. Performance data current to the most recent month end may be obtained at www.wilfunds.com. The investment return and principal value of an investment will fluctuate so that shares, when redeemed, may be worth more or less than their original cost. The Russell 1000 Value Index is an unmanaged index that measures the performance of the largest 1,000 U.S. companies with lower price-to-book ratios and lower forecasted growth values. Index performance is presented for general comparative purposes. Unlike a mutual fund, the performance of an index assumes no taxes, transaction costs, management fees or other expenses. An individual cannot directly invest in any index. The table above does not reflect the deduction that a shareholder would pay on Portfolio distributions or the redemption of Portfolio shares.
The Portfolio’s Institutional Class annual operating expense ratio is 1.08% as of 12/31/06.
| * | Assumes reinvestment of all dividends and distributions. During certain periods since inception, certain fees and expenses were waived or reimbursed. For the year ended December 31, 2006, waivers were less than 0.01% of average net assets. Without such waivers and reimbursements, historical total returns would have been lower. |
8
| | |
LARGE COMPANY VALUE PORTFOLIO COMMENTARY - (CONTINUED) | |
|
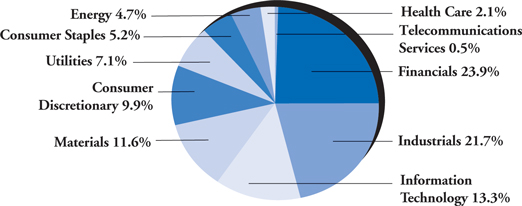
Investment Class Shares of the Large Company Value Portfolio (the “Portfolio”) rose 18.49% while Institutional Class shares gained 18.94% over the 12-month period ended December 31, 2006 (the “Period”). The Period marked the fourth consecutive year of positive returns for the Portfolio. Both classes of the Portfolio underperformed the benchmark, the Russell 1000 Value Index, which surged 22.21% over the Period.
Once again, value stocks strongly outperformed growth counterparts for yet another year. Value stocks have outperformed growth stocks for seven consecutive years since year 2000. Over the seven-year period, value stocks’ annualized return of 7.79% is 12.66% above the annualized return of (4.87)% for growth stocks. Between value stocks, larger value companies underperformed smaller value companies over the Period as the Russell 2000 Value Index returned 1.27% more than the Russell 1000 Value Index.
The Portfolio’s underperformance is primarily attributable to its industry exposures. Despite higher short-term interest rates and volatilities in energy prices, Real Estate and Energy were the two top performing industries in the market over the Period. The Portfolio’s performance was detracted by its underweighting to companies in Real Estate, Energy, and Telecom combined with its overweighting to Insurance companies.
The performance data quoted represents past performance and does not guarantee future results. Current performance may be lower or higher. Performance data current to the most recent month end may be obtained at www.wilfunds.com. The investment return and principal value of an investment will fluctuate so that shares, when redeemed, may be worth more or less than their original cost. Portfolio holdings subject to change. The Russell 1000 Value Index is an unmanaged index that measures the performance of the largest 1,000 companies with lower price-to-book ratios and lower forecasted growth values. Index performance is presented for general comparative purposes. Unlike a mutual fund, the performance of an index assumes no taxes, transaction costs, management fees or other expenses. An individual cannot invest directly in any index.
PORTFOLIO SECTOR WEIGHTING*
(As of December 31, 2006)
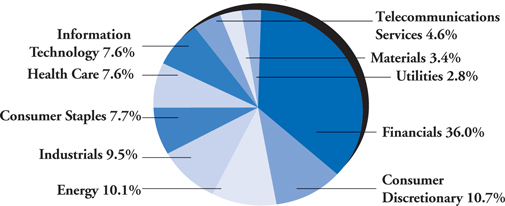
| * | Based on percent of Portfolio’s total investments in securities market value. |
9
| | |
SMALL COMPANY GROWTH PORTFOLIO COMMENTARY | | |
INVESTMENT CLASS SHARES
Average Annual Total Return *
| | | |
One Year Ended 12/31/06 | | 11.12 | % |
Five Years Ended 12/31/06 | | 9.71 | % |
Ten Years Ended 12/31/06 | | 6.73 | % |
COMPARATIVE PERFORMANCE
Comparison of Change in Value of $10,000 Investment in Shares of
Small Company Growth Portfolio and the Russell 2000 Growth Index
through 12/31/06.
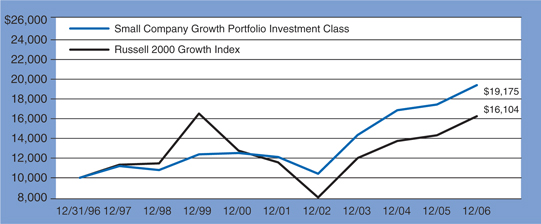
The performance data quoted represents past performance and does not guarantee future results. Current performance may be lower or higher. Performance data current to the most recent month end may be obtained at www.wilfunds.com. The investment return and principal value of an investment will fluctuate so that shares, when redeemed, may be worth more or less than their original cost. The Russell 2000 Growth Index is an unmanaged index that measures the performance of the 2,000 smallest U.S. companies with higher price-to-book ratios and higher forecasted growth values. Index performance is presented for general comparative purposes. Unlike a mutual fund, the performance of an index assumes no taxes, transaction costs, management fees or other expenses. An individual cannot invest directly in any index. The table above does not reflect the deduction that a shareholder would pay on Portfolio distributions or the redemption of Portfolio shares.
The Portfolio’s Investment Class annual operating expense ratio is 1.43% as of 12/31/06.
| * | Assumes reinvestment of all dividends and distributions. During certain periods since inception, certain fees and expenses were waived or reimbursed. For the year ended December 31, 2006, fees totaling 0.62% of average net assets were waived and reimbursed. Without such waivers and reimbursements, total returns since inception would have been lower. |
10
| | |
SMALL COMPANY GROWTH PORTFOLIO COMMENTARY - (CONTINUED) | | |
INSTITUTIONAL CLASS SHARES
Average Annual Total Return *
| | | |
One Year Ended 12/31/06 | | 11.46 | % |
Five Years Ended 12/31/06 | | 9.97 | % |
Ten Years Ended 12/31/06 | | 6.94 | % |
COMPARATIVE PERFORMANCE
Comparison of Change in Value of $10,000 Investment in Shares of
Small Company Growth Portfolio and the Russell 2000 Growth Index
through 12/31/06.
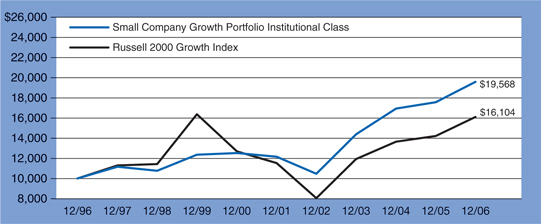
The performance data quoted represents past performance and does not guarantee future results. Current performance may be lower or higher. Performance data current to the most recent month end may be obtained at www.wilfunds.com. The investment return and principal value of an investment will fluctuate so that shares, when redeemed, may be worth more or less than their original cost. The Russell 2000 Growth Index is an unmanaged index that measures the performance of the 2,000 smallest U.S. companies with higher price-to-book ratios and higher forecasted growth values. Index performance is presented for general comparative purposes. Unlike a mutual fund, the performance of an index assumes no taxes, transaction costs, management fees or other expenses. An individual cannot invest directly in any index. The table above does not reflect the deduction that a shareholder would pay on Portfolio distributions or the redemption of Portfolio shares.
The Portfolio’s Institutional Class annual operating expense ratio is 1.15% as of 12/31/06.
| * | Assumes reinvestment of all dividends and distributions. During certain periods since inception, certain fees and expenses were waived or reimbursed. For the year ended December 31, 2006, fees totaling 0.62% of average net assets were waived and reimbursed. Without such waivers and reimbursements, total returns since inception would have been lower. |
11
| | |
SMALL COMPANY GROWTH PORTFOLIO COMMENTARY - (CONTINUED) | |
|
The Small Company Growth Portfolio’s Investment Class Shares (the “Portfolio”) returned 11.12%, while Institutional Class Shares returned 11.46% for the 12-month period ended December 31, 2006 (the “Period”). The Portfolio delivered another year of positive returns to investors though its 11.40% return underperformed the 13.35% return for the Russell 2000 Growth Index over the Period.
For the Period, small growth companies performed much better relative to large growth companies as the Russell 2000 Growth Index outperformed the Russell 1000 Growth Index by 4.28% in 2006. Despite the double digit returns posted by small growth companies, small value companies were much better in 2006 returning 23.48%.
The Portfolio benefited from a quality bias as it focused on holding more companies with sustainable growth and fewer speculative growth companies in its portfolio. The Portfolio also participated in the industries where returns were strongest, such as Real Estate, Industrials, Transportation, and Basic Materials. The Portfolio’s performance was hampered by a handful of companies in its widely diversified portfolio. Investment environment for companies within the Technology sector continued to be challenging as the Portfolio’s holdings in Multi Fineline Electronics, Avid Technology, and Blue Coat Systems were among the main detractors of performance.
The performance data quoted represents past performance and does not guarantee future results. Current performance may be lower or higher. Performance data current to the most recent month end may be obtained at www.wilfunds.com. The investment return and principal value of an investment will fluctuate so that shares, when redeemed, may be worth more or less than their original cost. Small company stocks may be subject to a higher degree of market risk than the securities of more established companies because they tend to be more volatile and less liquid. Portfolio holdings subject to change. The Russell 2000 Growth Index is an unmanaged index that measures the performance of the 2,000 smallest U.S. companies with higher price-to-book ratios and higher forecasted growth values. Index performance is presented for general comparative purposes. Unlike a mutual fund, the performance of an index assumes no taxes, transaction costs, management fees or other expenses. An individual cannot invest directly in any index.
PORTFOLIO SECTOR WEIGHTING*
(As of December 31, 2006)
| * | Based on percent of Portfolio’s total investments in securities market value. |
12
| | |
SMALL COMPANY VALUE PORTFOLIO COMMENTARY | | |
INVESTMENT CLASS SHARES
Average Annual Total Return *
| | | |
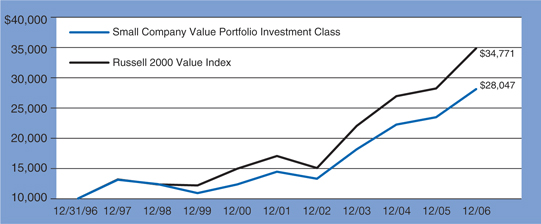
One Year Ended 12/31/06 | | 19.64 | % |
Five Years Ended 12/31/06 | | 14.21 | % |
Ten Years Ended 12/31/06 | | 10.86 | % |
COMPARATIVE PERFORMANCE
Comparison of Change in Value of $10,000 Investment in Shares of
Small Company Value Portfolio and the Russell 2000 Value Index
through 12/31/06.
The performance data quoted represents past performance and does not guarantee future results. Current performance may be lower or higher. Performance data current to the most recent month end may be obtained at www.wilfunds.com. The investment return and principal value of an investment will fluctuate so that shares, when redeemed, may be worth more or less than their original cost. The Russell 2000 Value Index is an unmanaged index that measures the performance of the 2,000 smallest U.S. companies with lower price-to-book ratios and lower forecasted growth values. Index performance is presented for general comparative purposes. Unlike a mutual fund, the performance of an index assumes no taxes, transaction costs, management fees or other expenses. An individual cannot invest directly in any index. The table above does not reflect the deduction that a shareholder would pay on Portfolio distributions or the redemption of Portfolio shares.
The Portfolio’s Investment Class annual operating expense ratio is 1.31% as of 12/31/06.
| * | Assumes reinvestment of all dividends and distributions. During certain periods since inception, certain fees and expenses were waived or reimbursed. For the year ended December 31, 2006, fees totaling 0.60% of average net assets were waived and reimbursed. Without such waivers and reimbursements, total returns since inception would have been lower. |
13
| | |
SMALL COMPANY VALUE PORTFOLIO COMMENTARY - (CONTINUED) | | |
INSTITUTIONAL CLASS SHARES
Average Annual Total Return *
| | | |
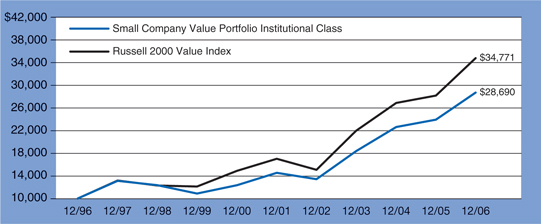
One Year Ended 12/31/06 | | 20.05 | % |
Five Years Ended 12/31/06 | | 14.55 | % |
Ten Years Ended 12/31/06 | | 11.11 | % |
COMPARATIVE PERFORMANCE
Comparison of Change in Value of $10,000 Investment in Shares of
Small Company Value Portfolio and the Russell 2000 Value Index
through 12/31/06.
The performance data quoted represents past performance and does not guarantee future results. Current performance may be lower or higher. Performance data current to the most recent month end may be obtained at www.wilfunds.com. The investment return and principal value of an investment will fluctuate so that shares, when redeemed, may be worth more or less than their original cost. The Russell 2000 Value Index is an unmanaged index that measures the performance of the 2,000 smallest U.S. companies with lower price-to-book ratios and lower forecasted values. Index performance is presented for general comparative purposes. Unlike a mutual fund, the performance of an index assumes no taxes, transaction costs, management fees or other expenses. An individual cannot invest directly in any index. The table above does not reflect the deduction that a shareholder would pay on Portfolio distributions or the redemption of Portfolio shares.
The Portfolio’s Institutional Class annual operating expense ratio is 1.02% as of 12/31/06.
| * | Assumes reinvestment of all dividends and distributions. During certain periods since inception, certain fees and expenses were waived or reimbursed. For the year ended December 31, 2006, fees totaling 0.60% of average net assets were waived and reimbursed. Without such waivers and reimbursements, total returns since inception would have been lower. |
14
| | |
SMALL COMPANY VALUE PORTFOLIO COMMENTARY - (CONTINUED) | | |
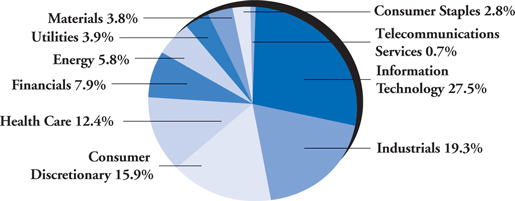
The Small Company Value Portfolio’s Investment Class Shares (the “Portfolio”) gained 19.64% while Institutional Class Shares gained 20.05% during the 12-month period ended December 31, 2006 (the “Period”). The Portfolio delivered investors with strong positive returns though it underperformed the 23.48% return of the Russell 2000 Value Index. Small value companies were the strongest segment in the U.S. market.
For the third year in a row, small value stocks outperformed small growth stocks. Small growth stocks as measured by the Russell 2000 Growth Index returned 13.35% for the same period, trailing small value stocks by 10.13%. Small value companies also outperformed large value companies over the period though by a thinner margin of 1.27%.
Despite rising short-term interest rates and significant volatilities in energy and material prices, Real Estate, Utilities, and Energy were among the top performing industrial sectors within the small value universe. Technology continued to be a difficult sector for value investors. The Portfolio benefited from overall strong stock selection. Within the strong performing sectors, i.e. Real Estate, Utilities, and Energy, top contributors include Trammell Crow Co., Acergy SA and Harvest Natural Resources. These three stocks among a handful of companies in the Portfolio advanced more than 50% for the year. Positive contribution from stock selection was offset by the negative impact of the Portfolio’s relative overweighting to the Technology sector, which hampered the Portfolio’s overall performance for the Period.
The performance data quoted represents past performance and does not guarantee future results. Current performance may be lower or higher. Performance data current to the most recent month end may be obtained at www.wilfunds.com. The investment return and principal value of an investment will fluctuate so that shares, when redeemed, may be worth more or less than their original cost. Small company stocks may be subject to a higher degree of market risk than the securities of more established companies because they tend to be more volatile and less liquid. Portfolio holdings subject to change. The Russell 2000 Value Index is an unmanaged index that measures the performance of the 2,000 smallest U.S. companies with lower price-to-book ratios and lower forecasted growth values. Index performance is presented for general comparative purposes. Unlike a mutual fund, the performance of an index assumes no taxes, transaction costs, management fees or other expenses. An individual cannot invest directly in any index.
15
| | |
SMALL COMPANY VALUE PORTFOLIO COMMENTARY - (CONTINUED) | | |
PORTFOLIO SECTOR WEIGHTING*
(As of December 31, 2006)
| * | Based on percent of Portfolio’s total investments in securities market value. |
16
| | |
DOW JONES WILSHIRE 5000 INDEX PORTFOLIO COMMENTARY | |
|
INVESTMENT CLASS SHARES
Average Annual Total Return *
| | | |
One Year Ended 12/31/06 | | 14.46 | % |
Five Years Ended 12/31/06 | | 6.51 | % |
Inception (2/1/99) through 12/31/06 | | 3.15 | % |
COMPARATIVE PERFORMANCE
Comparison of Change in Value of $10,000 Investment in Shares of
Dow Jones Wilshire 5000 Index Portfolio and the Dow Jones Wilshire 5000 Index
through 12/31/06.
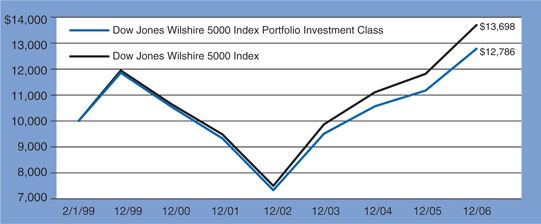
The performance data quoted represents past performance and does not guarantee future results. Current performance may be lower or higher. Performance data current to the most recent month end may be obtained at www.wilfunds.com. The investment return and principal value of an investment will fluctuate so that shares, when redeemed, may be worth more or less than their original cost. The Dow Jones Wilshire 5000 Index is an unmanaged index that measures the performance of all U.S. headquartered equity securities with readily available price data. Index performance is presented for general comparative purposes. Unlike a mutual fund, the performance of an index assumes no taxes, transaction costs, management fees or other expenses. An individual cannot invest directly in any index. The table above does not reflect the deduction that a shareholder would pay on Portfolio distributions or the redemption of Portfolio shares.
The Portfolio’s Investment Class annual operating expense ratio is 0.74% as of 12/31/06.
| * | Assumes reinvestment of all dividends and distributions. During certain periods since inception, certain fees and expenses were waived or reimbursed. For the year ended December 31, 2006, waivers were less than 0.01% of average net assets. Without such waivers and reimbursements, total returns since inception would have been lower. |
17
| | |
DOW JONES WILSHIRE 5000 INDEX PORTFOLIO COMMENTARY - (CONTINUED) | | |
INSTITUTIONAL CLASS SHARES
Average Annual Total Return *
| | | |
One Year Ended 12/31/06 | | 14.66 | % |
Five Years Ended 12/31/06 | | 6.80 | % |
Inception (2/1/99) through 12/31/06 | | 3.43 | % |
COMPARATIVE PERFORMANCE
Comparison of Change in Value of $10,000 Investment in Shares of
Dow Jones Wilshire 5000 Index Portfolio and the Dow Jones Wilshire 5000 Index
through 12/31/06.
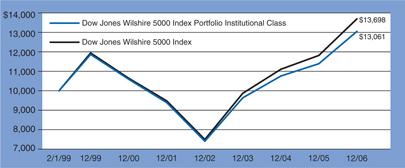
The performance data quoted represents past performance and does not guarantee future results. Current performance may be lower or higher. Performance data current to the most recent month end may be obtained at www.wilfunds.com. The investment return and principal value of an investment will fluctuate so that shares, when redeemed, may be worth more or less than their original cost. The Dow Jones Wilshire 5000 Index is an unmanaged index that measures the performance of all U.S. headquartered equity securities with readily available price data. Index performance is presented for general comparative purposes. Unlike a mutual fund, the performance of an index assumes no taxes, transaction costs, management fees or other expenses. An individual cannot invest directly in any index. The table above does not reflect the deduction that a shareholder would pay on Portfolio distributions or the redemption of Portfolio shares.
The Portfolio’s Institutional Class annual operating expense ratio is 0.47% as of 12/31/06.
| * | Assumes reinvestment of all dividends and distributions. During certain periods since inception, certain fees and expenses were waived or reimbursed. For the year ended December 31, 2006, waivers were less than 0.01% of average net assets. Without such waivers and reimbursements, total returns since inception would have been lower. |
18
| | |
DOW JONES WILSHIRE 5000 INDEX PORTFOLIO COMMENTARY - (CONTINUED) | |
|
QUALIFIED CLASS SHARES
Average Annual Total Return *
| | | |
One Year Ended 12/31/06 | | 14.18 | % |
Five Years Ended 12/31/06 | | 6.37 | % |
Inception (5/10/00) through 12/31/06 | | 2.19 | % |
COMPARATIVE PERFORMANCE
Comparison of Change in Value of $10,000 Investment in Shares of
Dow Jones Wilshire 5000 Index Portfolio and the Dow Jones Wilshire 5000 Index
through 12/31/06.
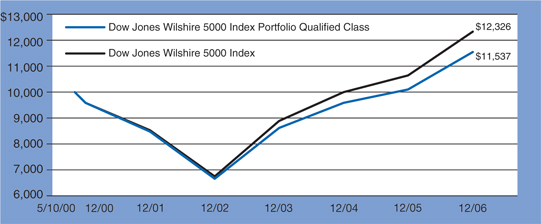
The performance data quoted represents past performance and does not guarantee future results. Current performance may be lower or higher. Performance data current to the most recent month end may be obtained at www.wilfunds.com. The investment return and principal value of an investment will fluctuate so that shares, when redeemed, may be worth more or less than their original cost. The Dow Jones Wilshire 5000 Index is an unmanaged index that measures the performance of all U.S. headquartered equity securities with readily available price data. Index performance is presented for general comparative purposes. Unlike a mutual fund, the performance of an index assumes no taxes, transaction costs, management fees or other expenses. An individual cannot invest directly in any index. The table above does not reflect the deduction that a shareholder would pay on Portfolio distributions or the redemption of Portfolio shares.
The Portfolio’s Qualified Class annual operating expense ratio is 0.83% as of 12/31/06.
| * | Assumes reinvestment of all dividends and distributions. During certain periods since inception, certain fees and expenses were waived or reimbursed. For the year ended December 31, 2006, waivers were less than 0.01% of average net assets. Without such waivers and reimbursements, total returns since inception would have been lower. |
19
| | |
DOW JONES WILSHIRE 5000 INDEX PORTFOLIO COMMENTARY - (CONTINUED) | |
|
HORACE MANN CLASS SHARES
Average Annual Total Return *
| | | |
One Year Ended 12/31/06 | | 14.32 | % |
Five Years Ended 12/31/06 | | 6.44 | % |
Inception (12/10/99) through 12/31/06 | | 3.51 | % |
COMPARATIVE PERFORMANCE
Comparison of Change in Value of $10,000 Investment in Shares of
Dow Jones Wilshire 5000 Index Portfolio and the Dow Jones Wilshire 5000 Index
through 12/31/06.
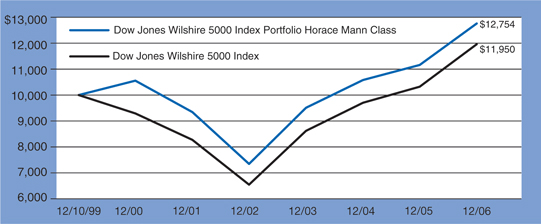
The performance data quoted represents past performance and does not guarantee future results. Current performance may be lower or higher. Performance data current to the most recent month end may be obtained at www.wilfunds.com. The investment return and principal value of an investment will fluctuate so that shares, when redeemed, may be worth more or less than their original cost. The Dow Jones Wilshire 5000 Index is an unmanaged index that measures the performance of all U.S. headquartered equity securities with readily available price data. Index performance is presented for general comparative purposes. Unlike a mutual fund, the performance of an index assumes no taxes, transaction costs, management fees or other expenses. An individual cannot invest directly in any index. The table above does not reflect the deduction that a shareholder would pay on Portfolio distributions or the redemption of Portfolio shares.
The Portfolio’s Horace Mann Class annual operating expense ratio is 0.77% as of 12/31/06.
| * | Assumes reinvestment of all dividends and distributions. During certain periods since inception, certain fees and expenses were waived or reimbursed. For the year ended December 31, 2006, waivers were less than 0.01% of average net assets. Without such waivers and reimbursements, total returns since inception would have been lower. |
20
| | |
DOW JONES WILSHIRE 5000 INDEX PORTFOLIO COMMENTARY - (CONTINUED) | | |
Investment Class Shares of the Dow Jones Wilshire 5000 Index Portfolio (the “Portfolio”) returned 14.46% while Institutional Class Shares gained 14.66% for the 12-month period ended December 31, 2006 (the “Period”). The Period marked the fourth consecutive year of positive returns for the Portfolio and the U.S. equity market. The Portfolio’s benchmark, the Dow Jones Wilshire 5000 Index gained 15.77% for the Period. All classes of the Portfolio underperformed the benchmark.
Plagued by high energy prices, higher short-term interest rates, and declining home building activities, 2006 ended on a strong note as the broad U.S. equity market advanced more than 7% in the fourth quarter and finished the year in double digit returns. For most of the year, the Fed continued its rate hiking campaign, raising the key Fed Funds rate four times from 4.25% to 5.25%. The Period ended with an inverted yield curve despite the Fed’s pause in raising rates in the 4th quarter. Gross Domestic Product (GDP) growth slowed throughout the year from 5.6% in the 1st quarter to 2.0% in the 3rd quarter. Energy prices remained high and volatile throughout the Period. Rebounding in the 4th quarter, oil prices from the high levels of volatility experienced earlier in the year closed at $61 per barrel, down more than 20% from its all-time high near $78 in August.
The Portfolio’s underperformance during the year can be attributed to underweighting a number of the securities that performed significantly well, particularly in the Consumer Discretionary and Information Technology sectors. And the Portfolio did not hold some of the top performing financial companies such as American Real Estate Partner, BlackRock, Inc. and First Marblehead Corp. which detracted from performance as the securities each returned 124.2%, 41.7%, and 151.9%, respectively. However, the Portfolio benefited from its slight tilt towards more attractively priced securities, but it was not enough to offset the security selection in the Portfolio for the year.
The performance data quoted represents past performance and does not guarantee future results. Current performance may be lower or higher. Performance data current to the most recent month end may be obtained at www.wilfunds.com. The investment return and principal value of an investment will fluctuate so that shares, when redeemed, may be worth more or less than their original cost. Portfolio holdings subject to change. The Dow Jones Wilshire 5000 Index is an unmanaged index that measures the performance of all U.S. headquartered equity securities with readily available price data. Index performance is presented for general comparative purposes. Unlike a mutual fund, the performance of an index assumes no taxes, transaction costs, management fees or other expenses. An individual cannot invest directly in any index.
21
| | |
DOW JONES WILSHIRE 5000 INDEX PORTFOLIO COMMENTARY - (CONTINUED) | | |
PORTFOLIO SECTOR WEIGHTING*
(As of December 31, 2006)
| * | Based on percent of Portfolio’s total investments in securities market value. |
22
| | |
WILSHIRE MUTUAL FUNDS, INC. DISCLOSUREOF FUND EXPENSES For the Six Month Period Ended December 31, 2006 | | |
We believe it is important for you to understand the impact of fees regarding your investment. All mutual funds have operating expenses. As a shareholder of a Portfolio (or a “fund”), you incur ongoing costs, which include costs for investment advisory, administrative services, distribution and/or shareholder services and shareholder reports (like this one), among others. Operating expenses, which are deducted from a fund’s gross income, directly reduce the investment return of the fund. A fund’s expenses are expressed as a percentage of its average net assets. This figure is known as the expense ratio. The following examples are intended to help you understand the ongoing fees (in dollars) of investing in your fund and to compare these costs with those of other mutual funds. The examples are based on an investment of $1,000 made at the beginning of the period shown and held for the entire period.
This table illustrates your fund’s costs in two ways:
Actual Fund Return: This section helps you to estimate the actual expenses, after any applicable fee waivers, that you paid over the period. The “Ending Account Value” shown is derived from the Portfolio’s actual return for the past six month period. The “Expense Ratio” column shows the period’s annualized expense ratio and the “Expenses Paid During Period” column shows the dollar amount that would have been paid by an investor who started with $1,000 in the Portfolio at the beginning of the period.
You may use the information here, together with your account value, to estimate the expenses that you paid over the period. To do so, simply divide your account value by $1,000 (for example, an $8,600 account value divided by $1,000 = 8.6), then multiply the result by the number given for your fund in the first line under the heading entitled “Expenses Paid During Period.”
Hypothetical 5% Return: This section is intended to help you compare your fund’s costs with those of other mutual funds. The “Ending Account Value” shown is derived from hypothetical account values and hypothetical expenses based on the Portfolio’s actual expense ratio and assumed rate of return. It assumes that the Portfolio had an annual return of 5% before expenses, but that the expense ratio is unchanged. In this case, because the return used is not the Portfolio’s actual return, the results do not apply to your investment. This example is useful in making comparisons to other mutual funds because the Securities and Exchange Commission requires all mutual funds to calculate expenses based on an assumed 5% annual return. You can assess your fund’s ongoing costs by comparing this hypothetical example with the hypothetical examples that appear in shareholder reports of other funds.
Please note that the expenses shown in the table are meant to highlight and help you compare your ongoing costs only and do not reflect any transactional costs such as sales charges (loads), redemption fees, or exchange fees. Wilshire Mutual Funds, Inc. has no such charges, but these may be present in other funds to which you compare this data. Therefore, the hypothetical portions of the table are useful in comparing ongoing costs only, and will not help you determine the relative total costs of owning different funds.
23
| | |
WILSHIRE MUTUAL FUNDS, INC. DISCLOSUREOF FUND EXPENSES - (Continued) For the Six Month Period Ended December 31, 2006 | | |
| | | | | | | | | | | | |
| | | Beginning
Account
Value
07/01/06 | | Ending
Account
Value
12/31/06 | | Expense
Ratio (1) | | | Expenses Paid During Period
07/01/06 —12/31/06 (2) |
Large Company Growth Portfolio | | | | | | | | | | | | |
Actual Fund Return | | | | | | | | | | | | |
Investment Class | | $ | 1,000.00 | | $ | 1,063.80 | | 1.36 | % | | $ | 7.07 |
Institutional Class | | $ | 1,000.00 | | $ | 1,065.70 | | 1.00 | % | | $ | 5.21 |
Hypothetical 5% Return | | | | | | | | | | | | |
Investment Class | | $ | 1,000.00 | | $ | 1,018.35 | | 1.36 | % | | $ | 6.92 |
Institutional Class | | $ | 1,000.00 | | $ | 1,020.16 | | 1.00 | % | | $ | 5.09 |
| | | | |
Large Company Value Portfolio | | | | | | | | | | | | |
Actual Fund Return | | | | | | | | | | | | |
Investment Class | | $ | 1,000.00 | | $ | 1,132.50 | | 1.39 | % | | $ | 7.47 |
Institutional Class | | $ | 1,000.00 | | $ | 1,134.30 | | 1.09 | % | | $ | 5.86 |
Hypothetical 5% Return | | | | | | | | | | | | |
Investment Class | | $ | 1,000.00 | | $ | 1,018.20 | | 1.39 | % | | $ | 7.07 |
Institutional Class | | $ | 1,000.00 | | $ | 1,019.71 | | 1.09 | % | | $ | 5.55 |
| | | | |
Small Company Growth Portfolio | | | | | | | | | | | | |
Actual Fund Return | | | | | | | | | | | | |
Investment Class | | $ | 1,000.00 | | $ | 1,067.00 | | 1.50 | % | | $ | 7.81 |
Institutional Class | | $ | 1,000.00 | | $ | 1,068.80 | | 1.22 | % | | $ | 6.36 |
Hypothetical 5% Return | | | | | | | | | | | | |
Investment Class | | $ | 1,000.00 | | $ | 1,017.64 | | 1.50 | % | | $ | 7.63 |
Institutional Class | | $ | 1,000.00 | | $ | 1,019.06 | | 1.22 | % | | $ | 6.21 |
| | | | |
Small Company Value Portfolio | | | | | | | | | | | | |
Actual Fund Return | | | | | | | | | | | | |
Investment Class | | $ | 1,000.00 | | $ | 1,078.40 | | 1.24 | % | | $ | 6.50 |
Institutional Class | | $ | 1,000.00 | | $ | 1,080.50 | | 1.01 | % | | $ | 5.30 |
Hypothetical 5% Return | | | | | | | | | | | | |
Investment Class | | $ | 1,000.00 | | $ | 1,018.95 | | 1.24 | % | | $ | 6.31 |
Institutional Class | | $ | 1,000.00 | | $ | 1,020.11 | | 1.01 | % | | $ | 5.14 |
| | | | |
Dow Jones Wilshire 5000 Index Portfolio | | | | | | | | | | | | |
Actual Fund Return | | | | | | | | | | | | |
Investment Class | | $ | 1,000.00 | | $ | 1,114.10 | | 0.69 | % | | $ | 3.68 |
Institutional Class | | $ | 1,000.00 | | $ | 1,114.00 | | 0.45 | % | | $ | 2.40 |
Qualified Class | | $ | 1,000.00 | | $ | 1,111.40 | | 0.81 | % | | $ | 4.31 |
Horace Mann Class | | $ | 1,000.00 | | $ | 1,112.70 | | 0.73 | % | | $ | 3.89 |
Hypothetical 5% Return | | | | | | | | | | | | |
Investment Class | | $ | 1,000.00 | | $ | 1,021.73 | | 0.69 | % | | $ | 3.52 |
Institutional Class | | $ | 1,000.00 | | $ | 1,022.94 | | 0.45 | % | | $ | 2.29 |
Qualified Class | | $ | 1,000.00 | | $ | 1,021.12 | | 0.81 | % | | $ | 4.13 |
Horace Mann Class | | $ | 1,000.00 | | $ | 1,021.53 | | 0.73 | % | | $ | 3.72 |
| (1) | Annualized, based on the Portfolio’s most recent fiscal half-year expenses. |
| (2) | Expenses are equal to the Portfolio’s annualized expense ratio multiplied by the average account value over the period, multiplied by the number of days in the period, then divided by 365. |
24
| | | | |
WILSHIRE MUTUAL FUNDS, INC. LARGE COMPANY GROWTH PORTFOLIO SCHEDULEOF INVESTMENTS | | December 31, 2006 | | |
| | | | | |
| Shares | | Value |
| COMMON STOCK — 99.8% | | | |
| |
| Consumer Discretionary — 12.6% | | | |
| 24,769 | | Amazon.com, Inc.† | | $ | 977,385 |
| 53,250 | | American Eagle Outfitters | | | 1,661,933 |
| 19,556 | | Apollo Group, Inc., Class A† | | | 762,097 |
| 21,900 | | Autoliv, Inc. | | | 1,320,570 |
| 67,500 | | Autonation, Inc.† | | | 1,439,100 |
| 7,600 | | Best Buy Co., Inc. | | | 373,844 |
| 24,200 | | Big Lots, Inc.† | | | 554,664 |
| 24,553 | | Cablevision Systems Corp., Class A | | | 699,269 |
| 67,749 | | CBS Corp., Class B | | | 2,112,414 |
| 23,700 | | Choice Hotels International, Inc. | | | 997,770 |
| 82,266 | | Circuit City Stores, Inc. | | | 1,561,409 |
| 74,200 | | Comcast Corp., Class A† | | | 3,140,886 |
| 49,900 | | Darden Restaurants, Inc. | | | 2,004,483 |
| 38,200 | | Dillard’s, Inc., Class A | | | 1,335,854 |
| 25,200 | | DIRECTV Group, Inc. (The)† | | | 628,488 |
| 7,200 | | Harman International Industries, Inc. | | | 719,352 |
| 5,300 | | Home Depot, Inc. | | | 212,848 |
| 6,300 | | IAC/InterActiveCorp.† | | | 234,108 |
| 175,000 | | International Game Technology | | | 8,085,000 |
| 13,370 | | Jarden Corp.† | | | 465,142 |
| 19,400 | | Johnson Controls, Inc. | | | 1,666,848 |
| 49,300 | | Marriott International, Inc., Class A | | | 2,352,596 |
| 37,900 | | McGraw-Hill Cos., Inc. (The) | | | 2,577,958 |
| 130,000 | | MGM Mirage† | | | 7,455,500 |
| 1,400 | | Nutri/System, Inc.† | | | 88,746 |
| 68,127 | | Office Depot, Inc.† | | | 2,600,408 |
| 39,353 | | OfficeMax, Inc. | | | 1,953,876 |
| 5,300 | | R.H. Donnelley Corp.† | | | 332,469 |
| 25,420 | | Saks, Inc. | | | 452,984 |
| 350,000 | | Staples, Inc. | | | 9,345,000 |
| 78,400 | | Starbucks Corp.† | | | 2,776,928 |
| 4,200 | | Target Corp. | | | 239,610 |
| 1,560 | | Tiffany & Co. | | | 61,214 |
| 211,379 | | Time Warner, Inc. | | | 4,603,835 |
| 25,800 | | TJX Cos., Inc. | | | 735,816 |
| 15,600 | | United Auto Group, Inc. | | | 367,692 |
| 82,900 | | Walt Disney Co. (The) | | | 2,840,983 |
| 115,000 | | Weight Watchers International, Inc. | | | 6,040,950 |
| 9,200 | | Wendy’s International, Inc. | | | 304,428 |
| 800 | | Yum! Brands, Inc. | | | 47,040 |
| | | | | |
| | | | | 76,131,497 |
| | | | | |
| |
| Consumer Staples — 10.4% | | | |
| 29,195 | | Altria Group, Inc. | | | 2,505,515 |
| 15,366 | | Anheuser-Busch Cos., Inc. | | | 756,007 |
| 20,600 | | Archer-Daniels-Midland Co. | | | 658,376 |
| 78,497 | | Avon Products, Inc. | | | 2,593,541 |
| 76,600 | | Coca-Cola Co. (The) | | | 3,695,950 |
| 17,300 | | Colgate-Palmolive Co. | | | 1,128,652 |
| 51,800 | | Costco Wholesale Corp. | | | 2,738,666 |
| 28,666 | | CVS Corp. | | | 886,066 |
| 29,900 | | Dean Foods Co.† | | | 1,264,172 |
| 29,900 | | Energizer Holdings, Inc.† | | | 2,122,601 |
| 60 | | Estee Lauder Cos., Inc.(The), Class A | | | 2,449 |
| 22,900 | | General Mills, Inc. | | | 1,319,040 |
| 8,530 | | HJ Heinz Co. | | | 383,935 |
| 831 | | Kellogg Co. | | | 41,600 |
| 22,900 | | Kroger Co. (The) | | | 528,303 |
| 6,173 | | Molson Coors Brewing Co., Class B | | | 471,864 |
| 57,000 | | PepsiCo, Inc. | | | 3,565,350 |
| 199,185 | | Procter & Gamble Co. | | | 12,801,620 |
| 34,500 | | Safeway, Inc. | | | 1,192,320 |
| 33,111 | | Tyson Foods, Inc., Class A | | | 544,676 |
| 36,100 | | UST, Inc. | | | 2,101,020 |
See Notes to Financial Statements.
25
| | | | |
WILSHIRE MUTUAL FUNDS, INC. LARGE COMPANY GROWTH PORTFOLIO SCHEDULEOF INVESTMENTS - (CONTINUED) | | December 31, 2006 | | |
| | | | | |
| Shares | | Value |
| Consumer Staples (continued) | | | |
| 210,850 | | Walgreen Co. | | $ | 9,675,907 |
| 254,149 | | Wal-Mart Stores, Inc. | | | 11,736,601 |
| | | | | |
| | | | | 62,714,231 |
| | | | | |
| |
| Energy — 2.2% | | | |
| 3,200 | | Baker Hughes, Inc. | | | 238,912 |
| 7,946 | | ConocoPhillips | | | 571,715 |
| 25,900 | | Devon Energy Corp. | | | 1,737,372 |
| 91,600 | | Exxon Mobil Corp. | | | 7,019,308 |
| 11,000 | | Holly Corp. | | | 565,400 |
| 8,000 | | Marathon Oil Corp. | | | 740,000 |
| 20,000 | | Overseas Shipholding Group | | | 1,126,000 |
| 19,000 | | Schlumberger, Ltd. | | | 1,200,040 |
| 4,300 | | Tidewater, Inc. | | | 207,948 |
| | | | | |
| | | | | 13,406,695 |
| | | | | |
| |
| Financials — 10.8% | | | |
| 4,800 | | AMBAC Financial Group, Inc. | | | 427,536 |
| 12,400 | | American Express Co. | | | 752,308 |
| 63,600 | | AmeriCredit Corp.† | | | 1,600,812 |
| 33,800 | | Ameriprise Financial, Inc. | | | 1,842,100 |
| 16,896 | | CB Richard Ellis Group, Inc., Class A† | | | 560,947 |
| 106,000 | | Charles Schwab Corp. (The) | | | 2,050,040 |
| 20,500 | | Chicago Mercantile Exchange Holdings, Inc., Class A | | | 10,449,875 |
| 23,484 | | Commerce Bancorp, Inc. | | | 828,281 |
| 47,400 | | Countrywide Financial Corp. | | | 2,012,130 |
| 1,784 | | Eaton Vance Corp. | | | 58,890 |
| 23,679 | | Fannie Mae | | | 1,406,296 |
| 17,965 | | Federated Investors, Inc., Class B | | | 606,858 |
| 5,993 | | Fidelity National Financial, Inc., Class A | | | 143,113 |
| 9,300 | | Freddie Mac | | | 631,470 |
| 100 | | General Growth Properties, Inc. | | | 5,223 |
| 12,379 | | Hartford Financial Services Group, Inc. | | | 1,155,084 |
| 1 | | Hudson City Bancorp, Inc. | | | 14 |
| 88,000 | | IntercontinentalExchange, Inc.† | | | 9,495,200 |
| 19,600 | | Janus Capital Group, Inc. | | | 423,164 |
| 10,100 | | Jones Lang LaSalle, Inc. | | | 930,917 |
| 46,000 | | JPMorgan Chase & Co. | | | 2,221,800 |
| 14,500 | | Lehman Brothers Holdings, Inc. | | | 1,132,740 |
| 25,215 | | MBIA, Inc. | | | 1,842,208 |
| 192,306 | | Moody’s Corp. | | | 13,280,652 |
| 23,600 | | Morgan Stanley | | | 1,921,748 |
| 559 | | Nationwide Financial Services, Class A | | | 30,298 |
| 4,000 | | Principal Financial Group, Inc. | | | 234,800 |
| 69,708 | | Progressive Corp. (The) | | | 1,688,328 |
| 5,300 | | Public Storage, Inc. | | | 516,750 |
| 10,468 | | Realogy Corp.† | | | 317,390 |
| 13,600 | | SEI Investments Co. | | | 810,016 |
| 8,100 | | SL Green Realty Corp. | | | 1,075,518 |
| 33,958 | | T. Rowe Price Group, Inc. | | | 1,486,341 |
| 73,225 | | TD Ameritrade Holding Corp. | | | 1,184,780 |
| 51,258 | | UnumProvident Corp. | | | 1,065,141 |
| 34,500 | | W.R. Berkley Corp. | | | 1,190,595 |
| | | | | |
| | | | | 65,379,363 |
| | | | | |
| |
| Health Care — 17.5% | | | |
| 26,520 | | Abbott Laboratories | | | 1,291,789 |
| 21,784 | | Abraxis BioScience, Inc.† | | | 595,575 |
| 75,000 | | Allergan, Inc. | | | 8,980,500 |
| 49,200 | | AmerisourceBergen Corp. | | | 2,212,032 |
| 118,341 | | Amgen, Inc.† | | | 8,083,874 |
See Notes to Financial Statements.
26
| | | | |
WILSHIRE MUTUAL FUNDS, INC. LARGE COMPANY GROWTH PORTFOLIO SCHEDULEOF INVESTMENTS - (CONTINUED) | | December 31, 2006 | | |
| | | | | |
| Shares | | Value |
| Health Care (continued) |
| 18,300 | | Amylin Pharmaceuticals, Inc.† | | $ | 660,081 |
| 63,500 | | Applera Corp.—Applied Biosystems Group | | | 2,329,815 |
| 5,000 | | Bard (C.R.), Inc. | | | 414,850 |
| 21,400 | | Becton Dickinson & Co. | | | 1,501,210 |
| 13,700 | | Biogen Idec, Inc.† | | | 673,903 |
| 32,391 | | Cardinal Health, Inc. | | | 2,086,952 |
| 88,745 | | Caremark Rx, Inc. | | | 5,068,227 |
| 43,600 | | Celgene Corp.† | | | 2,508,308 |
| 2,434 | | Cigna Corp. | | | 320,241 |
| 7,000 | | Dentsply International, Inc. | | | 208,950 |
| 28,600 | | Eli Lilly & Co. | | | 1,490,060 |
| 38,500 | | Emdeon Corp.† | | | 477,015 |
| 29,200 | | Forest Laboratories, Inc.† | | | 1,477,520 |
| 169,288 | | Genentech, Inc.† | | | 13,734,336 |
| 59,441 | | Genzyme Corp.† | | | 3,660,377 |
| 400 | | Hospira, Inc.† | | | 13,432 |
| 39,100 | | Humana, Inc.† | | | 2,162,621 |
| 178,828 | | Johnson & Johnson | | | 11,806,225 |
| 34,800 | | King Pharmaceuticals, Inc.† | | | 554,016 |
| 43,500 | | McKesson Corp. | | | 2,205,450 |
| 74,040 | | Medtronic, Inc. | | | 3,961,880 |
| 70,300 | | Merck & Co., Inc. | | | 3,065,080 |
| 3,700 | | PerkinElmer, Inc. | | | 82,251 |
| 83,827 | | Pfizer, Inc. | | | 2,171,119 |
| 2,860 | | Thermo Fisher Scientific, Inc.† | | | 129,529 |
| 195,000 | | UnitedHealth Group, Inc. | | | 10,477,350 |
| 17,600 | | Waters Corp.† | | | 861,872 |
| 20,474 | | Wyeth | | | 1,042,536 |
| 122,700 | | Zimmer Holdings, Inc.† | | | 9,617,226 |
| | | | | |
| | | | | 105,926,202 |
| | | | | |
| Industrials — 12.8% |
| 27,750 | | 3M Co. | | | 2,162,558 |
| 63,498 | | AGCO Corp.† | | | 1,964,628 |
| 26,009 | | American Standard Cos., Inc. | | | 1,192,513 |
| 4,372 | | Avery Dennison Corp. | | | 296,990 |
| 3,747 | | Avis Budget Group, Inc. | | | 81,272 |
| 55,095 | | Boeing Co. | | | 4,894,640 |
| 35,952 | | Burlington Northern Santa Fe Corp. | | | 2,653,617 |
| 23,700 | | Caterpillar, Inc. | | | 1,453,521 |
| 4,136 | | Con-way, Inc. | | | 182,149 |
| 4,000 | | Corrections Corp. of America† | | | 180,920 |
| 72,500 | | CSX Corp. | | | 2,496,175 |
| 15,200 | | DRS Technologies, Inc. | | | 800,736 |
| 165,000 | | Expeditors International Washington, Inc. | | | 6,682,500 |
| 19,280 | | FedEx Corp. | | | 2,094,194 |
| 11,940 | | GATX Corp. | | | 517,360 |
| 220,093 | | General Electric Co. | | | 8,189,661 |
| 16,700 | | Goodrich Corp. | | | 760,685 |
| 46,400 | | Honeywell International, Inc. | | | 2,099,136 |
| 6,400 | | Illinois Tool Works, Inc. | | | 295,616 |
| 6,400 | | ITT Corp. | | | 363,648 |
| 9,900 | | Laidlaw International, Inc. | | | 301,257 |
| 5,800 | | Lockheed Martin Corp . | | | 534,006 |
| 32,000 | | Manpower, Inc. | | | 2,397,760 |
| 51,300 | | Norfolk Southern Corp. | | | 2,579,877 |
| 32,500 | | Northrop Grumman Corp. | | | 2,200,250 |
| 8,900 | | Paccar, Inc. | | | 577,610 |
| 8,700 | | Pall Corp. | | | 300,585 |
| 42,900 | | Pitney Bowes, Inc. | | | 1,981,551 |
| 21,500 | | Precision Castparts Corp. | | | 1,683,020 |
| 9,100 | | Raytheon Co. | | | 480,480 |
| 9,700 | | Republic Services, Inc. | | | 394,499 |
| 4,000 | | Steelcase, Inc., Class A | | | 72,640 |
| 9,100 | | Swift Transportation Co., Inc.† | | | 239,057 |
| 29,300 | | Terex Corp.† | | �� | 1,892,194 |
| 18,151 | | Textron, Inc. | | | 1,702,019 |
| 21,902 | | Timken Co. | | | 639,100 |
| 24,600 | | Tyco International, Ltd. | | | 747,840 |
See Notes to Financial Statements.
27
| | | | |
WILSHIRE MUTUAL FUNDS, INC LARGE COMPANY GROWTH PORTFOLIO SCHEDULEOF INVESTMENTS - (CONTINUED) | | December 31, 2006 | | |
| | | | | |
| Shares | | Value |
| Industrials (continued) | | | |
| 2,000 | | Union Pacific Corp. | | $ | 184,040 |
| 169,944 | | United Parcel Service, Inc., Class B | | | 12,742,401 |
| 8,800 | | United Rentals, Inc.† | | | 223,784 |
| 50,500 | | United Technologies Corp. | | | 3,157,260 |
| 58,400 | | Waste Management, Inc. | | | 2,147,368 |
| 12,300 | | WESCO International, Inc.† | | | 723,363 |
| 1,394 | | YRC Worldwide, Inc.† | | | 52,596 |
| | | | | |
| | | | | 77,317,076 |
| | | | | |
| |
| Information Technology — 28.0% | | | |
| 28,000 | | Agere Systems, Inc.† | | | 536,760 |
| 14,294 | | Amphenol Corp., Class A | | | 887,371 |
| 33,916 | | Analog Devices, Inc. | | | 1,114,819 |
| 2,500 | | Apple Computer, Inc.† | | | 212,100 |
| 3,050 | | Applied Materials, Inc. | | | 56,272 |
| 100 | | Arrow Electronics, Inc.† | | | 3,155 |
| 100 | | Atmel Corp.† | | | 605 |
| 10,400 | | AVX Corp. | | | 153,816 |
| 513,384 | | Cisco Systems, Inc.† | | | 14,030,785 |
| 16,902 | | Citrix Systems, Inc.† | | | 457,199 |
| 37,900 | | Computer Sciences Corp.† | | | 2,022,723 |
| 21,353 | | Corning, Inc.† | | | 399,515 |
| 42,848 | | Cypress Semiconductor Corp.† | | | 722,846 |
| 20,811 | | Dell, Inc.† | | | 522,148 |
| 1,958 | | Diebold, Inc. | | | 91,243 |
| 306,379 | | eBay, Inc.† | | | 9,212,816 |
| 27,490 | | EMC Corp.† | | | 362,868 |
| 80 | | Fidelity National Information Services, Inc. | | | 3,207 |
| 70,000 | | First Data Corp. | | | 1,786,400 |
| 36,420 | | Google, Inc., Class A† | | | 16,770,682 |
| 12,994 | | Hewitt Associates, Inc., Class A† | | | 334,595 |
| 109,400 | | Hewlett-Packard Co. | | | 4,506,186 |
| 257,720 | | Intel Corp. | | | 5,218,830 |
| 40,417 | | International Business Machines Corp. | | | 3,926,512 |
| 31 | | International Rectifier Corp.† | | | 1,194 |
| 91,800 | | Intersil Corp., Class A | | | 2,195,856 |
| 306,900 | | Intuit, Inc.† | | | 9,363,519 |
| 27,564 | | Jabil Circuit, Inc. | | | 676,696 |
| 28,690 | | Juniper Networks, Inc.† | | | 543,389 |
| 1,700 | | KLA-Tencor Corp. | | | 84,575 |
| 4,100 | | Lam Research Corp.† | | | 207,542 |
| 33,400 | | Lexmark International, Inc., Class A† | | | 2,444,880 |
| 17,077 | | Linear Technology Corp. | | | 517,775 |
| 18,362 | | McAfee, Inc.† | | | 521,114 |
| 7,000 | | MEMC Electronic Materials, Inc.† | | | 273,980 |
| 3,928 | | Mettler-Toledo International, Inc.† | | | 309,723 |
| 157,300 | | Micron Technology, Inc.† | | | 2,195,908 |
| 588,166 | | Microsoft Corp. | | | 17,562,637 |
| 120,200 | | Motorola, Inc. | | | 2,471,312 |
| 17,300 | | Network Appliance, Inc.† | | | 679,544 |
| 66,600 | | Novellus Systems, Inc.† | | | 2,292,372 |
| 24,500 | | Oracle Corp.† | | | 419,930 |
| 195,000 | | Paychex, Inc. | | | 7,710,300 |
| 15,100 | | Polycom, Inc.† | | | 466,741 |
| 329,867 | | QUALCOMM, Inc. | | | 12,465,674 |
| 37,000 | | Research In Motion, Ltd.† | | | 4,727,860 |
| 170,000 | | SanDisk Corp.† | | | 7,315,100 |
| 355,000 | | Seagate Technology | | | 9,407,500 |
| 385,982 | | Sun Microsystems, Inc.† | | | 2,092,022 |
| 89,500 | | Symantec Corp.† | | | 1,866,075 |
| 104,078 | | Synopsys, Inc.† | | | 2,782,005 |
| 34,498 | | Tech Data Corp.† | | | 1,306,439 |
| 18,500 | | Teradyne, Inc.† | | | 276,760 |
| 146,118 | | Texas Instruments, Inc. | | | 4,208,198 |
| 100 | | Unisys Corp.† | | | 784 |
| 28,352 | | VeriSign, Inc.† | | | 681,866 |
| 57,400 | | Western Digital Corp.† | | | 1,174,404 |
See Notes to Financial Statements.
28
| | | | |
WILSHIRE MUTUAL FUNDS, INC. LARGE COMPANY GROWTH PORTFOLIO SCHEDULEOF INVESTMENTS - (CONTINUED) | | December 31, 2006 | | |
| | | | | |
| Shares | | Value |
| Information Technology (continued) | | | |
| 238,100 | | Western Union Co. (The) | | $ | 5,338,202 |
| 65,560 | | Yahoo!, Inc.† | | | 1,674,402 |
| | | | | |
| | | | | 169,589,731 |
| | | | | |
| |
| Materials — 3.4% | | | |
| 15,900 | | Ashland, Inc. | | | 1,099,962 |
| 14,596 | | Cabot Corp. | | | 635,948 |
| 83,166 | | Dow Chemical Co. (The) | | | 3,321,650 |
| 19,187 | | FMC Corp. | | | 1,468,765 |
| 10,303 | | Huntsman Corp.† | | | 195,448 |
| 12,064 | | International Flavors & Fragrances, Inc. | | | 593,066 |
| 61,500 | | Monsanto Co. | | | 3,230,595 |
| 7,600 | | Newmont Mining Corp. | | | 343,140 |
| 14,500 | | Nucor Corp. | | | 792,570 |
| 31,666 | | Owens-Illinois, Inc.† | | | 584,237 |
| 125,000 | | Praxair, Inc. | | | 7,416,250 |
| 15,200 | | Southern Copper Corp. | | | 819,128 |
| | | | | |
| | | | | 20,500,759 |
| | | | | |
| |
| Telecommunication Services — 1.2% | | | |
| 24,500 | | CenturyTel, Inc. | | | 1,069,670 |
| 105,316 | | Level 3 Communications, Inc.† | | | 589,770 |
| 4,300 | | NII Holdings, Inc.† | | | 277,092 |
| 142,104 | | Qwest Communications International, Inc.† | | | 1,189,410 |
| 206,157 | | Sprint Nextel Corp. | | | 3,894,306 |
| | | | | |
| | | | | 7,020,248 |
| | | | | |
| Utilities — 0.9% | | | |
| 1,880 | | Exelon Corp. | | | 116,353 |
| 6,749 | | FPL Group, Inc. | | | 367,281 |
| 24,600 | | ONEOK, Inc. | | | 1,060,752 |
| 29,300 | | PG&E Corp. | | | 1,386,769 |
| 49,500 | | TXU Corp. | | | 2,683,395 |
| | | | | |
| | | | | 5,614,550 |
| | | | | |
| | | |
| |
Total Investments — 99.8% | | | |
(Cost $ 491,183,785) | | | 603,600,352 |
Other Assets & Liabilities, Net — 0.2% | | | 1,015,572 |
| | | |
| NET ASSETS — 100.0% | | $ | 604,615,924 |
| | | |
FUTURES CONTRACTS—LONG POSITIONS
| | | | | |
Number of
Contracts | | | | Unrealized Appreciation |
| 4 | | CME E-Mini S&P 500, Expires March 2007 | | $ | 642 |
| | | | | |
| † | Non-income producing security. |
See Notes to Financial Statements.
29
| | | | |
WILSHIRE MUTUAL FUNDS, INC. LARGE COMPANY VALUE PORTFOLIO SCHEDULEOF INVESTMENTS | | December 31, 2006 | | |
| | | | | |
| Shares | | Value |
| COMMON STOCK — 96.2% | | | |
| |
| Consumer Discretionary — 10.3% | | | |
| 2,100 | | Autoliv, Inc. | | $ | 126,630 |
| 7,700 | | Autozone, Inc.† | | | 889,812 |
| 1,200 | | Black & Decker Corp. | | | 95,964 |
| 1,300 | | BorgWarner, Inc. | | | 76,726 |
| 10,000 | | Cablevision Systems Corp., Class A | | | 284,800 |
| 15,702 | | CBS Corp., Class B(a) | | | 489,588 |
| 6,700 | | Comcast Corp., Class A†(a) | | | 283,611 |
| 1,900 | | DaimlerChrysler AG | | | 116,679 |
| 1,700 | | Dillard’s, Inc., Class A | | | 59,449 |
| 1,300 | | Dollar Tree Stores, Inc.† | | | 39,130 |
| 5,700 | | Gap, Inc. (The) | | | 111,150 |
| 800 | | Harman International Industries, Inc. | | | 79,928 |
| 15,000 | | Home Depot, Inc. | | | 602,400 |
| 497 | | Idearc, Inc.† | | | 14,239 |
| 6,300 | | Interpublic Group of Cos., Inc.† | | | 77,112 |
| 9,798 | | Johnson Controls, Inc. | | | 841,844 |
| 1,200 | | Jones Apparel Group, Inc. | | | 40,116 |
| 138 | | Liberty Global, Inc., Class A† | | | 4,023 |
| 5,200 | | Limited Brands, Inc. | | | 150,488 |
| 14,525 | | Magna International, Inc., Class A | | | 1,169,989 |
| 3,100 | | Mattel, Inc. | | | 70,246 |
| 5,900 | | McDonald’s Corp. | | | 261,547 |
| 3,400 | | Office Depot, Inc.†. | | | 129,778 |
| 3,014 | | OfficeMax, Inc. | | | 149,645 |
| 2,600 | | Saks, Inc. | | | 46,332 |
| 39,357 | | Time Warner, Inc. | | | 857,195 |
| 21,350 | | TJX Cos., Inc. | | | 608,902 |
| 1,300 | | Viacom, Inc., Class B† | | | 53,339 |
| 1,300 | | Walt Disney Co. (The) | | | 44,551 |
| 10,525 | | Whirlpool Corp.(a) | | | 873,786 |
| | | | | |
| | | | | 8,648,999 |
| | | | | |
| |
| Consumer Staples — 7.4% | | | |
| 5,624 | | Altria Group, Inc. | | $ | 482,652 |
| 11,532 | | Anheuser-Busch Cos., Inc. | | | 567,374 |
| 18,058 | | Avon Products, Inc.(a) | | | 596,636 |
| 3,300 | | Brown-Forman Corp., Class B | | | 218,592 |
| 4,975 | | Clorox Co. | | | 319,146 |
| 2,300 | | Colgate-Palmolive Co. | | | 150,052 |
| 3,000 | | ConAgra Foods, Inc. | | | 81,000 |
| 2,600 | | General Mills, Inc. | | | 149,760 |
| 200 | | HJ Heinz Co. | | | 9,002 |
| 14,163 | | Kellogg Co. | | | 709,000 |
| 9,200 | | Kimberly-Clark Corp. | | | 625,140 |
| 7,400 | | Kroger Co. (The) | | | 170,718 |
| 600 | | Loews Corp. - Carolina Group | | | 38,832 |
| 1,675 | | Molson Coors Brewing Co., Class B | | | 128,037 |
| 6,600 | | Procter & Gamble Co. | | | 424,182 |
| 2,216 | | Reynolds American, Inc.(a) | | | 145,082 |
| 13,925 | | Sara Lee Corp. | | | 237,143 |
| 500 | | Supervalu, Inc.(a) | | | 17,875 |
| 800 | | Tyson Foods, Inc., Class A | | | 13,160 |
| 500 | | UST, Inc.(a) | | | 29,100 |
| 23,375 | | Wal-Mart Stores, Inc. | | | 1,079,457 |
| | | | | |
| | | | | 6,191,940 |
| | | | | |
| |
| Energy — 9.7% | | | |
| 700 | | Apache Corp. | | | 46,557 |
| 13,195 | | Arch Coal, Inc.(a) | | | 396,246 |
| 10,375 | | BP PLC ADR | | | 696,163 |
| 23,078 | | Chevron Corp. | | | 1,696,925 |
| 20,737 | | ConocoPhillips | | | 1,492,027 |
| 1,368 | | Devon Energy Corp. | | | 91,765 |
| 3,736 | | EOG Resources, Inc. | | | 233,313 |
| 37,049 | | Exxon Mobil Corp. | | | 2,839,065 |
| 425 | | GlobalSantaFe Corp. | | | 24,982 |
| 4,506 | | Hess Corp.(a) | | | 223,362 |
| 2,300 | | Marathon Oil Corp. | | | 212,750 |
See Notes to Financial Statements.
30
| | | | |
WILSHIRE MUTUAL FUNDS, INC. LARGE COMPANY VALUE PORTFOLIO SCHEDULEOF INVESTMENTS - (CONTINUED) | | December 31, 2006 | | |
| | | | | |
| Shares | | Value |
| Energy (continued) | | | |
| 650 | | Occidental Petroleum Corp. | | $ | 31,740 |
| 426 | | Pioneer Natural Resources Co. | | | 16,908 |
| 900 | | Royal Dutch Shell PLC ADR | | | 63,711 |
| 1,300 | | Total SA ADR | | | 93,496 |
| | | | | |
| | | | | 8,159,010 |
| | | | | |
| |
| Financials — 34.6% | | | |
| 1,800 | | ACE, Ltd. | | | 109,026 |
| 15,650 | | Allstate Corp. (The) | | | 1,018,972 |
| 250 | | AMBAC Financial Group, Inc. | | | 22,268 |
| 9,370 | | American International | | | |
| | Group, Inc. | | | 671,454 |
| 10,325 | | AON Corp.(a) | | | 364,886 |
| 700 | | Astoria Financial Corp. | | | 21,112 |
| 50,996 | | Bank of America Corp. | | | 2,722,676 |
| 1,400 | | BB&T Corp. | | | 61,502 |
| 3,100 | | Bear Stearns Cos., Inc. (The) | | | 504,618 |
| 1,600 | | Boston Properties, Inc. | | | 179,008 |
| 400 | | Charles Schwab Corp. (The) | | | 7,736 |
| 1,300 | | Chicago Mercantile Exchange Holdings, Inc., Class A(a) | | | 662,675 |
| 1,800 | | Chubb Corp. | | | 95,238 |
| 60,575 | | Citigroup, Inc. | | | 3,374,027 |
| 200 | | City National Corp.(a) | | | 14,240 |
| 10,175 | | Comerica, Inc.(a) | | | 597,069 |
| 2,600 | | Conseco, Inc.† | | | 51,948 |
| 4,300 | | Countrywide Financial Corp. | | | 182,535 |
| 900 | | Equity Office Properties Trust | | | 43,353 |
| 24,050 | | Fannie Mae | | | 1,428,330 |
| 30,105 | | Fidelity National Financial, Inc., Class A | | | 718,907 |
| 6,001 | | Fifth Third Bancorp(a) | | | 245,621 |
| 17,250 | | Freddie Mac | | | 1,171,275 |
| 5,090 | | Genworth Financial, Inc., Class A(a) | | | 174,129 |
| 3,400 | | Hartford Financial Services Group, Inc.(a) | | | 317,254 |
| 4,400 | | Huntington Bancshares, Inc.. | | | 104,500 |
| 45,271 | | JPMorgan Chase & Co. | | | 2,186,589 |
| 4,100 | | KeyCorp(a) | | | 155,923 |
| 10,386 | | Lehman Brothers Holdings, Inc.(a) | | | 811,354 |
| 2,200 | | Loews Corp. | | | 91,234 |
| 3,400 | | MBIA, Inc.(a). | | | 248,404 |
| 27,750 | | MetLife, Inc. | | | 1,637,528 |
| 1,900 | | MGIC Investment Corp. | | | 118,826 |
| 100 | | Moody’s Corp.(a) | | | 6,906 |
| 14,925 | | Morgan Stanley | | | 1,215,343 |
| 16,006 | | National City Corp.(a) | | | 585,179 |
| 1,100 | | Nationwide Financial Services, Class A | | | 59,620 |
| 5,400 | | Old Republic International Corp. | | | 125,712 |
| 2,200 | | PMI Group, Inc. (The) | | | 103,774 |
| 3,400 | | Prudential Financial, Inc. | | | 291,924 |
| 2,929 | | Realogy Corp.† | | | 88,807 |
| 1,800 | | RenaissanceRe Holdings, Ltd. | | | 108,000 |
| 4,700 | | St. Paul Travelers Cos., Inc. (The) | | | 252,343 |
| 4,200 | | State Street Corp. | | | 283,248 |
| 2,100 | | SunTrust Banks, Inc. | | | 177,345 |
| 1,200 | | Synovus Financial Corp. | | | 36,996 |
| 7,160 | | TD Ameritrade Holding Corp.(a) | | | 115,849 |
| 17,657 | | TD Banknorth, Inc. | | | 569,968 |
| 13,325 | | Torchmark Corp. | | | 849,602 |
| 4,800 | | U.S. Bancorp | | | 173,712 |
| 3,100 | | UnionBanCal Corp. | | | 189,875 |
| 26,958 | | UnumProvident Corp. | | | 560,187 |
| 3,400 | | Wachovia Corp.(a) | | | 193,630 |
See Notes to Financial Statements.
31
| | | | |
WILSHIRE MUTUAL FUNDS, INC. LARGE COMPANY VALUE PORTFOLIO SCHEDULEOF INVESTMENTS - (CONTINUED) | | December 31, 2006 | | |
| | | | | |
| Shares | | Value |
| Financials (continued) | | | |
| 2,100 | | Waddell & Reed Financial, Inc., Class A | | $ | 57,456 |
| 27,196 | | Washington Mutual, Inc.(a) | | | 1,237,146 |
| 7,400 | | Wells Fargo & Co. | | | 263,144 |
| 17,525 | | XL Capital, Ltd., Class A | | | 1,262,150 |
| 1,100 | | Zions Bancorp | | | 90,684 |
| | | | | |
| | | | | 29,012,817 |
| | | | | |
| |
| Health Care — 7.3% | | | |
| 204 | | Abbott Laboratories | | | 9,937 |
| 955 | | Abraxis BioScience, Inc.†(a) | | | 26,110 |
| 6,584 | | Aetna, Inc. | | | 284,297 |
| 8,900 | | AmerisourceBergen Corp. | | | 400,144 |
| 1,000 | | Biogen Idec, Inc.†(a) | | | 49,190 |
| 42,300 | | Bristol-Myers Squibb Co. | | | 1,113,336 |
| 3,721 | | Cardinal Health, Inc. | | | 239,744 |
| 7,669 | | Genentech, Inc.† | | | 622,186 |
| 6,950 | | Johnson & Johnson | | | 458,839 |
| 3,007 | | McKesson Corp. | | | 152,455 |
| 7,900 | | Merck & Co., Inc. | | | 344,440 |
| 81,412 | | Pfizer, Inc. | | | 2,108,571 |
| 5,400 | | Tenet Healthcare Corp.† | | | 37,638 |
| 2,100 | | Thermo Fisher Scientific, Inc.†(a) | | | 95,109 |
| 3,846 | | Wyeth(a) | | | 195,838 |
| | | | | |
| | | | | 6,137,834 |
| | | | | |
| |
| Industrials — 9.1% | | | |
| 400 | | 3M Co. | | | 31,172 |
| 20,858 | | AGCO Corp.†(a) | | | 645,346 |
| 1,500 | | Avery Dennison Corp. | | | 101,895 |
| 1,081 | | Avis Budget Group, Inc. | | | 23,447 |
| 1,600 | | Boeing Co. | | | 142,144 |
| 5,089 | | Burlington Northern Santa Fe Corp. | | | 375,619 |
| 2,500 | | Caterpillar, Inc. | | | 153,325 |
| 96 | | Continental Airlines, Inc., Class B†(a) | | | 3,960 |
| 900 | | Cooper Industries, Ltd., Class A | | | 81,387 |
| 11,311 | | CSX Corp. | | | 389,438 |
| 800 | | Cummins, Inc. | | | 94,544 |
| 1,700 | | Eaton Corp. | | | 127,738 |
| 1,272 | | FedEx Corp.(a) | | | 138,165 |
| 2,910 | | GATX Corp. | | | 126,090 |
| 20,856 | | General Electric Co. | | | 776,052 |
| 1,800 | | Goodrich Corp.(a) | | | 81,990 |
| 16,725 | | Honeywell International, Inc. | | | 756,639 |
| 1,700 | | Jacobs Engineering Group, Inc.† | | | 138,618 |
| 32 | | Laidlaw International, Inc. | | | 974 |
| 2,700 | | Northrop Grumman Corp. | | | 182,790 |
| 2,851 | | Paccar, Inc. | | | 185,030 |
| 400 | | Pall Corp. | | | 13,820 |
| 8,098 | | Pitney Bowes, Inc. | | | 374,047 |
| 1,900 | | SPX Corp. | | | 116,204 |
| 5,816 | | Textron, Inc. | | | 545,366 |
| 2,245 | | Timken Co. | | | 65,509 |
| 28,425 | | Tyco International, Ltd.(a) | | | 864,120 |
| 6,725 | | Union Pacific Corp. | | | 618,834 |
| 6,459 | | United Parcel Service, Inc., Class B | | | 484,296 |
| 343 | | YRC Worldwide, Inc.† | | | 12,941 |
| | | | | |
| | | | | 7,651,500 |
| | | | | |
| |
| Information Technology —7.3% | | | |
| 3,000 | | Accenture, Ltd., Class A | | | 110,790 |
| 10,500 | | Affiliated Computer Services, Inc., Class A† | | | 512,820 |
| 80,535 | | Alcatel-Lucent ADR | | | 1,145,208 |
| 2,142 | | Amphenol Corp., Class A | | | 132,975 |
| 1,500 | | Arrow Electronics, Inc.† | | | 47,325 |
| 18,950 | | CA, Inc. | | | 429,217 |
| 3,800 | | Cisco Systems, Inc.†(a) | | | 103,854 |
See Notes to Financial Statements.
32
| | | | |
WILSHIRE MUTUAL FUNDS, INC. LARGE COMPANY VALUE PORTFOLIO SCHEDULEOF INVESTMENTS - (CONTINUED) | | December 31, 2006 | | |
| | | | | |
| Shares | | Value |
| Information Technology (continued) | | | |
| 2,300 | | Electronic Data Systems Corp. | | $ | 63,365 |
| 8,618 | | Fidelity National Information Services, Inc. | | | 345,496 |
| 8,200 | | Flextronics International, Ltd.† | | | 94,136 |
| 21,862 | | Hewitt Associates, Inc., Class A† | | | 562,946 |
| 3,100 | | Hewlett-Packard Co. | | | 127,689 |
| 400 | | International Business Machines Corp. | | | 38,860 |
| 9,317 | | Juniper Networks, Inc.†(a) | | | 176,464 |
| 28,225 | | Microsoft Corp. | | | 842,798 |
| 4,400 | | Nokia Oyj ADR | | | 89,408 |
| 31,950 | | Oracle Corp.† | | | 547,623 |
| 13,300 | | Sanmina-SCI Corp.† | | | 45,885 |
| 19,400 | | Solectron Corp.† | | | 62,468 |
| 106 | | Sun Microsystems, Inc.† | | | 575 |
| 16,324 | | Tech Data Corp.† | | | 618,190 |
| 1,000 | | Yahoo!, Inc.† | | | 25,540 |
| | | | | |
| | | | | 6,123,632 |
| | | | | |
|
| Materials — 3.3% |
| 600 | | Bemis Co. | | | 20,388 |
| 1,290 | | Cabot Corp. | | | 56,205 |
| 3,000 | | Crown Holdings, Inc.† | | | 62,760 |
| 20,594 | | Dow Chemical Co. (The) | | | 822,525 |
| 1,700 | | du Pont (E.I.) de Nemours & Co. | | | 82,807 |
| 3,526 | | FMC Corp. | | | 269,915 |
| 2,600 | | Hercules, Inc.† | | | 50,206 |
| 11,430 | | Huntsman Corp.† | | | 216,827 |
| 1,700 | | Lubrizol Corp. | | | 85,221 |
| 2,200 | | Mittal Steel Co. NV, Class A | | | 92,796 |
| 35,281 | | Owens-Illinois, Inc.† | | | 650,935 |
| 1,700 | | PPG Industries, Inc. | | | 109,157 |
| 3,900 | | Smurfit-Stone Container Corp.† | | | 41,184 |
| 2,400 | | Temple-Inland, Inc. | | | 110,472 |
| 1,400 | | Weyerhaeuser Co. | | | 98,910 |
| | | | | |
| | | | | 2,770,308 |
| | | | | |
|
| Telecommunication Services — 4.5% |
| 2,884 | | Alltel Corp.(a) | | | 174,424 |
| 1,200 | | American Tower Corp., Class A† | | | 44,736 |
| 17,267 | | AT&T, Inc.(a) | | | 617,295 |
| 6,100 | | BellSouth Corp. | | | 287,371 |
| 1,219 | | CenturyTel, Inc. | | | 53,222 |
| 3,900 | | Crown Castle International Corp.† | | | 125,970 |
| 3,082 | | EMBARQ Corp. | | | 161,990 |
| 48,780 | | Qwest Communications International, Inc.†(a) | | | 408,289 |
| 54,706 | | Sprint Nextel Corp.(a) | | | 1,033,396 |
| 21,355 | | Verizon Communications, Inc.(a) | | | 795,260 |
| 2,781 | | Windstream Corp. | | | 39,546 |
| | | | | |
| | | | | 3,741,499 |
| | | | | |
|
| Utilities — 2.7% |
| 3,000 | | Dominion Resources, Inc.(a) | | | 251,520 |
| 200 | | Duke Energy Corp. | | | 6,642 |
| 1,400 | | Entergy Corp. | | | 129,248 |
| 4,377 | | FPL Group, Inc.(a) | | | 238,196 |
| 4,819 | | ONEOK, Inc. | | | 207,795 |
| 2,500 | | Pinnacle West Capital Corp.(a) | | | 126,725 |
| 12,350 | | Sempra Energy | | | 692,094 |
| 1,900 | | TXU Corp. | | | 102,999 |
| 9,975 | | Wisconsin Energy Corp. | | | 473,414 |
| 1,223 | | Xcel Energy, Inc. | | | 28,203 |
| | | | | |
| | | | | 2,256,836 |
| | | | | |
| Total Common Stock |
| (Cost $ 64,707,102) | | | 80,694,375 |
| | | | | |
See Notes to Financial Statements.
33
| | | | |
WILSHIRE MUTUAL FUNDS, INC. LARGE COMPANY VALUE PORTFOLIO SCHEDULEOF INVESTMENTS - (CONTINUED) | | December 31, 2006 | | |
| | | | |
Shares | | Value | |
WARRANTS — 0.0%# | | | | |
581 Raytheon Co. expire | | | | |
06/16/11 | | | | |
(Cost $9,267)† | | $ | 10,412 | |
| | | | |
| |
MONEY MARKET FUND — 13.8% | | | | |
| |
11,586,096 PNC Institutional Money | | | | |
Market Trust 5.30% | | | | |
(Cost $11,586,096)(b) | | | 11,586,096 | |
| | | | |
| |
Total Investments — 110.0% | | | | |
(Cost $ 76,302,465) | | | 92,290,883 | |
Other Assets & Liabilities, | | | | |
Net — (10.0)% | | | (8,410,859 | ) |
| | | | |
| |
NET ASSETS — 100.0% | | $ | 83,880,024 | |
| | | | |
ADR - American Depository Receipt.
| † | Non-income producing security. |
| # | Amount represents less than 0.1% of net assets. |
| (a) | All or a portion of this security is on loan. |
| (b) | Investment purchased with proceeds from collateral received from securities on loan. |
See Notes to Financial Statements.
34
| | | | |
WILSHIRE MUTUAL FUNDS, INC. SMALL COMPANY GROWTH PORTFOLIO SCHEDULEOF INVESTMENTS | | December 31, 2006 | | |
| | | | | |
| Shares | | Value |
| COMMON STOCK — 99.7% | | | |
| |
| Consumer Discretionary — 15.8% | | | |
| 1,620 | | 1-800-FLOWERS.COM, Inc., Class A† | | $ | 9,979 |
| 1,225 | | Aaron Rents, Inc. | | | 35,256 |
| 600 | | Advo, Inc. | | | 19,560 |
| 700 | | Aeropostale, Inc.† | | | 21,609 |
| 300 | | Ambassadors Group, Inc. | | | 9,105 |
| 360 | | Bebe Stores, Inc.(a) | | | 7,124 |
| 2,400 | | Big Lots, Inc.†(a) | | | 55,008 |
| 1,390 | | BJ’s Restaurants, Inc.† | | | 28,092 |
| 700 | | Bluegreen Corp.† | | | 8,981 |
| 1,700 | | Bon-Ton Stores, Inc. (The)(a) | | | 58,905 |
| 990 | | Building Materials Holding Corp. | | | 24,443 |
| 4,900 | | Cache, Inc.† | | | 123,676 |
| 2,060 | | Carter’s, Inc.† | | | 52,530 |
| 1,265 | | Catalina Marketing Corp. | | | 34,788 |
| 400 | | Charlotte Russe Holding, Inc.† | | | 12,300 |
| 800 | | Childrens Place Retail Stores, Inc. (The)† | | | 50,816 |
| 270 | | Coinstar, Inc.† | | | 8,254 |
| 3,192 | | Coldwater Creek, Inc.† | | | 78,268 |
| 700 | | Corinthian Colleges, Inc.† | | | 9,541 |
| 4,675 | | DeVry, Inc. | | | 130,900 |
| 900 | | Drugstore.com, Inc.† | | | 3,294 |
| 700 | | DXP Enterprises, Inc.†(a) | | | 24,528 |
| 2,290 | | Fred’s, Inc. | | | 27,572 |
| 1,085 | | GameStop Corp., Class A†(a) | | | 59,794 |
| 1,000 | | Genesco, Inc.†(a) | | | 37,300 |
| 300 | | Group 1 Automotive, Inc. | | | 15,516 |
| 400 | | GSI Commerce, Inc.† | | | 7,500 |
| 316 | | IAC/InterActiveCorp.†(a) | | | 11,743 |
| 2,230 | | Jackson Hewitt Tax Service, Inc. | | | 75,753 |
| 400 | | Jarden Corp.† | | | 13,916 |
| 700 | | Kimball International, Inc., Class B | | | 17,010 |
| 965 | | Laureate Education, Inc.†(a) | | | 46,928 |
| 1,535 | | Life Time Fitness, Inc.† | | | 74,463 |
| 500 | | Lifetime Brands, Inc. | | | 8,215 |
| 200 | | MarineMax, Inc.† | | | 5,186 |
| 100 | | Matthews International Corp., Class A | | | 3,935 |
| 1,037 | | Netflix, Inc.†(a) | | | 26,817 |
| 2,380 | | New York & Co., Inc.† | | | 31,130 |
| 500 | | Nutri/System, Inc.†(a) | | | 31,695 |
| 1,170 | | O’Reilly Automotive, Inc.†(a) | | | 37,510 |
| 1,963 | | Overstock.com, Inc.† | | | 31,015 |
| 2,100 | | Payless Shoesource, Inc.† | | | 68,922 |
| 500 | | Pre-Paid Legal Services, Inc.†(a) | | | 19,565 |
| 1,475 | | Red Robin Gourmet Burgers, Inc.† | | | 52,879 |
| 610 | | Restoration Hardware, Inc.†(a) | | | 5,191 |
| 18,047 | | Retail Ventures, Inc.† | | | 343,615 |
| 1,530 | | Ruby Tuesday, Inc. | | | 41,983 |
| 200 | | Scientific Games Corp., Class A†(a) | | | 6,046 |
| 915 | | Shuffle Master, Inc.†(a) | | | 23,973 |
| 1,400 | | Sotheby’s(a) | | | 43,428 |
| 1,390 | | Source Interlink Cos., Inc.† | | | 11,342 |
| 200 | | Stage Stores, Inc. | | | 6,078 |
| 1,437 | | Stamps.com, Inc.† | | | 22,633 |
| 2,000 | | Strayer Education, Inc. | | | 212,100 |
| 1,230 | | Tractor Supply Co.†(a) | | | 54,993 |
| 500 | | United Auto Group, Inc. | | | 11,785 |
| 4,154 | | Valuevision Media, Inc., Class A† | | | 54,584 |
| 1,327 | | Warnaco Group, Inc. (The)† | | | 33,679 |
| 6,400 | | Wet Seal, Inc. (The), Class A† | | | 42,688 |
| 690 | | Yankee Candle Co., Inc. | | | 23,653 |
| 1,700 | | Zale Corp.†(a) | | | 47,957 |
| | | | | |
| | | | | 2,497,049 |
| | | | | |
See Notes to Financial Statements.
35
| | | | |
WILSHIRE MUTUAL FUNDS, INC. SMALL COMPANY GROWTH PORTFOLIO SCHEDULEOF INVESTMENTS - (CONTINUED) | | December 31, 2006 | | |
| | | | | |
| Shares | | Value |
| Consumer Staples — 2.8% | | | |
| 800 | | Alliance One International, Inc.† | | $ | 5,648 |
| 400 | | Andersons, Inc. (The) | | | 16,956 |
| 3,397 | | Central European Distribution Corp.†(a) | | | 100,891 |
| 500 | | Corn Products International, Inc. | | | 17,270 |
| 2,625 | | Elizabeth Arden, Inc.† | | | 50,006 |
| 1,101 | | Gold Kist, Inc.† | | | 23,143 |
| 200 | | Great Atlantic & Pacific Tea Co. | | | 5,148 |
| 600 | | Pantry, Inc. (The)†(a) | | | 28,104 |
| 2,960 | | Performance Food Group Co.†(a) | | | 81,814 |
| 3,600 | | Playtex Products, Inc.† | | | 51,804 |
| 492 | | Spectrum Brands, Inc.† | | | 5,363 |
| 2,090 | | SunOpta, Inc.† | | | 18,392 |
| 710 | | Susser Holdings Corp.† | | | 12,780 |
| 1,800 | | Wild Oats Markets, Inc.† | | | 25,884 |
| | | | | |
| | | | | 443,203 |
| | | | | |
| |
| Energy — 5.8% | | | |
| 3,233 | | Allis-Chalmers Energy, Inc.† | | | 74,488 |
| 850 | | Atwood Oceanics, Inc.† | | | 41,624 |
| 520 | | Core Laboratories NV†(a) | | | 42,120 |
| 2,200 | | Delek US Holdings, Inc. | | | 36,058 |
| 1,550 | | Delta Petroleum Corp.†(a) | | | 35,898 |
| 1,030 | | Duvernay Oil Corp.† | | | 30,560 |
| 19,402 | | Gasco Energy, Inc.†(a) | | | 47,535 |
| 1,500 | | Global Industries, Ltd.† | | | 19,560 |
| 1,130 | | GMX Resources, Inc.† | | | 40,115 |
| 700 | | Hornbeck Offshore Services, Inc.† | | | 24,990 |
| 1,010 | | James River Coal Co.†(a) | | | 9,373 |
| 400 | | Lufkin Industries, Inc. | | | 23,232 |
| 400 | | Metretek Technologies, Inc.† | | | 4,928 |
| 1,647 | | NATCO Group, Inc., Class A† | | | 52,506 |
| 1,325 | | Niko Resources, Ltd. | | | 94,897 |
| 4,030 | | Parallel Petroleum Corp.† | | | 70,807 |
| 2,600 | | Rentech, Inc.†(a) | | | 9,802 |
| 600 | | Superior Energy Services, Inc.† | | | 19,608 |
| 580 | | Superior Well Services, Inc.† | | | 14,825 |
| 667 | | Tesoro Corp.(a) | | | 43,869 |
| 860 | | Tidewater, Inc.(a) | | | 41,590 |
| 200 | | Todco†(a) | | | 6,834 |
| 901 | | Toreador Resources Corp.†(a) | | | 23,219 |
| 965 | | Union Drilling, Inc.† | | | 13,587 |
| 440 | | Universal Compression Holdings, Inc.† | | | 27,328 |
| 500 | | USEC, Inc.† | | | 6,360 |
| 1,300 | | World Fuel Services Corp. | | | 57,798 |
| | | | | |
| | | | | 913,511 |
| | | | | |
| |
| Financials — 7.9% | | | |
| 600 | | Advance America Cash Advance Centers, Inc. | | | 8,790 |
| 1,205 | | Affiliated Managers Group, Inc.†(a) | | | 126,682 |
| 2,150 | | Alexandria Real Estate Equities, Inc. | | | 215,860 |
| 526 | | Anworth Mortgage Asset Corp. | | | 5,002 |
| 850 | | Boston Private Financial Holdings, Inc. | | | 23,979 |
| 1,700 | | Calamos Asset Management, Inc., Class A | | | 45,611 |
| 300 | | CompuCredit Corp.†(a) | | | 11,943 |
| 3,343 | | CVB Financial Corp. | | | 48,340 |
| 150 | | Delphi Financial Group, Class A | | | 6,069 |
| 400 | | Direct General Corp. | | | 8,256 |
| 280 | | Dollar Financial Corp.† | | | 7,801 |
| 461 | | FelCor Lodging Trust, Inc. | | | 10,068 |
| 875 | | Hub International, Ltd. | | | 27,466 |
See Notes to Financial Statements.
36
| | | | |
WILSHIRE MUTUAL FUNDS, INC. SMALL COMPANY GROWTH PORTFOLIO SCHEDULEOF INVESTMENTS - (CONTINUED) | | December 31, 2006 | | |
| | | | | |
| Shares | | Value |
| Financials (continued) | | | |
| 566 | | Independent Bank Corp. | | $ | 20,393 |
| 300 | | International Securities Exchange Holdings, Inc. | | | 14,037 |
| 700 | | Investment Technology Group, Inc.† | | | 30,016 |
| 1,764 | | Longview Fibre Co. | | | 38,720 |
| 592 | | Luminent Mortgage Capital, Inc. | | | 5,748 |
| 300 | | Maguire Properties, Inc. | | | 12,000 |
| 300 | | Mid-State Bancshares | | | 10,917 |
| 900 | | Nasdaq Stock Market, Inc. (The)†(a) | | | 27,711 |
| 512 | | National City Corp.(a) | | | 18,719 |
| 900 | | NYSE Group, Inc.†(a) | | | 87,480 |
| 500 | | Old Second Bancorp, Inc. | | | 14,650 |
| 1,110 | | Portfolio Recovery Associates, Inc.† | | | 51,826 |
| 726 | | PrivateBancorp, Inc. | | | 30,223 |
| 2,617 | | Rewards Network, Inc.† | | | 18,188 |
| 600 | | Senior Housing Properties Trust | | | 14,688 |
| 200 | | Southside Bancshares, Inc. | | | 5,146 |
| 1,335 | | Sterling Financial Corp. | | | 45,136 |
| 400 | | Tejon Ranch Co.† | | | 22,336 |
| 460 | | Texas Capital Bancshares, Inc.† | | | 9,145 |
| 620 | | Tower Group, Inc. | | | 19,263 |
| 1,125 | | United Community Banks, Inc. | | | 36,360 |
| 1,470 | | United Fire & Casualty Co. | | | 51,818 |
| 1,456 | | Wilshire Bancorp, Inc. | | | 27,620 |
| 1,068 | | World Acceptance Corp.† | | | 50,143 |
| 600 | | WSFS Financial Corp. | | | 40,158 |
| | | | | |
| | | | | 1,248,308 |
| | | | | |
| |
| Health Care — 12.4% | | | |
| 700 | | Abaxis, Inc.† | | | 13,475 |
| 400 | | Adams Respiratory Therapeutics, Inc.† | | | 16,324 |
| 600 | | Air Methods Corp.† | | | 16,752 |
| 770 | | Albany Molecular Research, Inc.† | | | 8,131 |
| 172 | | American Medical Systems Holdings, Inc.† | | | 3,185 |
| 950 | | Amsurg Corp.† | | | 21,850 |
| 915 | | Analogic Corp. | | | 51,368 |
| 600 | | Angiodynamics, Inc.† | | | 12,894 |
| 1,060 | | Arrow International, Inc. | | | 37,503 |
| 200 | | Arthrocare Corp.† | | | 7,984 |
| 300 | | Aspect Medical Systems, Inc.† | | | 5,643 |
| 800 | | Biosite, Inc.† | | | 39,080 |
| 2,330 | | Bruker BioSciences Corp.† | | | 17,498 |
| 1,010 | | Cambrex Corp. | | | 22,947 |
| 700 | | Centene Corp.† | | | 17,199 |
| 700 | | Cepheid, Inc.† | | | 5,950 |
| 1,600 | | Chemed Corp. | | | 59,168 |
| 810 | | Cooper Cos., Inc. (The) | | | 36,045 |
| 600 | | Corvel Corp.† | | | 28,542 |
| 850 | | Covance, Inc.† | | | 50,074 |
| 410 | | Digene Corp.† | | | 19,647 |
| 500 | | Dionex Corp.† | | | 28,355 |
| 1,200 | | DJO, Inc.† | | | 51,384 |
| 1,592 | | Eclipsys Corp. | | | 32,732 |
| 2,835 | | Emageon, Inc. | | | 43,546 |
| 3,545 | | eResearch Technology, Inc.† | | | 23,858 |
| 901 | | Five Star Quality Care, Inc.† | | | 10,046 |
| 1,500 | | Greatbatch, Inc.† | | | 40,380 |
| 400 | | Haemonetics Corp.† | | | 18,008 |
| 700 | | HealthExtras, Inc.† | | | 16,870 |
| 560 | | Hologic, Inc.†(a) | | | 26,477 |
| 700 | | Integra LifeSciences Holdings Corp.† | | | 29,813 |
| 510 | | Intuitive Surgical, Inc.†(a) | | | 48,909 |
| 1,000 | | inVentiv Health, Inc.† | | | 35,350 |
| 2,718 | | Inverness Medical Innovations, Inc.† | | | 105,187 |
| 1,300 | | IRIS International, Inc.† | | | 16,445 |
| 200 | | Landauer, Inc. | | | 10,494 |
See Notes to Financial Statements.
37
| | | | |
WILSHIRE MUTUAL FUNDS, INC. SMALL COMPANY GROWTH PORTFOLIO SCHEDULEOF INVESTMENTS - (CONTINUED) | | December 31, 2006 | | |
| | | | | |
| Shares | | Value |
| Health Care (continued) | | | |
| 670 | | Martek Biosciences Corp.† | | $ | 15,638 |
| 1,050 | | Matria Healthcare, Inc.† | | | 30,166 |
| 340 | | Medicines Co.† | | | 10,785 |
| 340 | | Molina Healthcare, Inc.† | | | 11,053 |
| 210 | | New River Pharmaceuticals, Inc.†(a) | | | 11,489 |
| 900 | | Odyssey HealthCare, Inc.† | | | 11,934 |
| 2,326 | | Omnicell, Inc.† | | | 43,333 |
| 2,200 | | Panacos Pharmaceuticals, Inc.† | | | 8,822 |
| 1,050 | | Par Pharmaceutical Cos., Inc.† | | | 23,488 |
| 600 | | Penwest Pharmaceuticals Co.† | | | 9,972 |
| 910 | | Per-Se Technologies, Inc.† | | | 25,280 |
| 400 | | PolyMedica Corp. | | | 16,164 |
| 200 | | Progenics Pharmaceuticals, Inc.† | | | 5,148 |
| 5,700 | | PSS World Medical, Inc.† | | | 111,321 |
| 1,420 | | Resmed, Inc.† | | | 69,892 |
| 2,330 | | Respironics, Inc.† | | | 87,958 |
| 429 | | Savient Pharmaceuticals, Inc.† | | | 4,809 |
| 2,870 | | SonoSite, Inc.† | | | 88,769 |
| 2,000 | | SuperGen, Inc.† | | | 10,160 |
| 1,000 | | SurModics, Inc.†(a) | | | 31,120 |
| 368 | | Symbion, Inc.† | | | 6,812 |
| 268 | | Techne Corp.† | | | 14,861 |
| 1,300 | | ThermoGenesis Corp.† | | | 5,603 |
| 670 | | Trizetto Group, Inc.† | | | 12,308 |
| 3,952 | | United Surgical Partners International, Inc.† | | | 112,039 |
| 400 | | United Therapeutics Corp.† | | | 21,748 |
| 900 | | Valeant Pharmaceuticals International | | | 15,516 |
| 1,000 | | Varian, Inc.† | | | 44,790 |
| 600 | | Ventana Medical Systems, Inc.† | | | 25,818 |
| 300 | | WellCare Health Plans, Inc.† | | | 20,670 |
| 500 | | Wright Medical Group, Inc.† | | | 11,640 |
| | | | | |
| | | | | 1,948,219 |
| | | | | |
| |
| Industrials — 19.2% | | | |
| 680 | | AAR Corp.†(a) | | | 19,849 |
| 4,261 | | ABX Air, Inc.† | | | 29,529 |
| 1,800 | | ACCO Brands Corp.†(a) | | | 47,646 |
| 1,530 | | Actuant Corp., Class A | | | 72,904 |
| 1,300 | | Administaff, Inc.(a) | | | 55,601 |
| 500 | | Advisory Board Co. (The)† | | | 26,770 |
| 1,300 | | AGCO Corp.†(a) | | | 40,222 |
| 3,274 | | Airtran Holdings, Inc.† | | | 38,437 |
| 3,903 | | Alaska Air Group, Inc.†(a) | | | 154,168 |
| 200 | | American Commercial Lines, Inc.† | | | 13,102 |
| 800 | | American Ecology Corp. | | | 14,808 |
| 500 | | Astec Industries, Inc.† | | | 17,550 |
| 300 | | Badger Meter, Inc. | | | 8,310 |
| 1,200 | | Brady Corp., Class A(a) | | | 44,736 |
| 750 | | Bucyrus International, Inc., Class A(a) | | | 38,820 |
| 993 | | C&D Technologies, Inc.(a) | | | 4,707 |
| 3,700 | | Capstone Turbine Corp.†(a) | | | 4,551 |
| 400 | | Cascade Corp. | | | 21,160 |
| 900 | | CDI Corp. | | | 22,410 |
| 1,000 | | Ceradyne, Inc.† | | | 56,500 |
| 1,055 | | ChoicePoint, Inc.† | | | 41,546 |
| 1,100 | | Clean Harbors, Inc.† | | | 53,251 |
| 800 | | Comfort Systems USA, Inc. | | | 10,112 |
| 4,102 | | Corrections Corp. of America† | | | 185,533 |
| 255 | | CoStar Group, Inc.† | | | 13,658 |
| 600 | | CRA International, Inc.† | | | 31,440 |
| 900 | | Diamond Management & Technology Consultants, Inc. | | | 11,196 |
| 1,685 | | EGL, Inc.† | | | 50,179 |
| 300 | | EMCOR Group, Inc.† | | | 17,055 |
See Notes to Financial Statements.
38
| | | | |
WILSHIRE MUTUAL FUNDS, INC. SMALL COMPANY GROWTH PORTFOLIO SCHEDULEOF INVESTMENTS - (CONTINUED) | | December 31, 2006 | | |
| | | | | |
| Shares | | Value |
| Industrials (continued) | | | |
| 100 | | Encore Wire Corp.†(a) | | $ | 2,201 |
| 1,224 | | EnerSys† | | | 19,584 |
| 2,008 | | ESCO Technologies, Inc.† | | | 91,244 |
| 1,447 | | Flow International Corp.† | | | 15,946 |
| 300 | | Forward Air Corp | | | 8,679 |
| 340 | | Franklin Electric Co., Inc | | | 17,473 |
| 1,175 | | FTI Consulting, Inc.† | | | 32,771 |
| 1,957 | | General Cable Corp.† | | | 85,540 |
| 1,600 | | Genlyte Group, Inc.† | | | 124,976 |
| 1,700 | | Greenbrier Cos., Inc | | | 51,000 |
| 600 | | Griffon Corp.† | | | 15,300 |
| 900 | | Healthcare Services Group | | | 26,064 |
| 2,542 | | HUB Group, Inc., Class A† | | | 70,032 |
| 2,048 | | Hudson Highland Group, Inc.† | | | 34,161 |
| 420 | | II-VI, Inc.† | | | 11,735 |
| 300 | | Interline Brands, Inc.† | | | 6,741 |
| 4,500 | | Ionatron, Inc.† | | | 18,450 |
| 1,289 | | Kaman Corp | | | 28,861 |
| 600 | | Kforce, Inc.† | | | 7,302 |
| 800 | | Knight Transportation, Inc. | | | 13,640 |
| 2,130 | | Labor Ready, Inc.† | | | 39,043 |
| 100 | | Ladish Co., Inc.† | | | 3,708 |
| 200 | | Lamson & Sessions Co. (The)† | | | 4,852 |
| 1,400 | | Middleby Corp.† | | | 146,538 |
| 1,970 | | Mobile Mini, Inc.† | | | 53,072 |
| 2,265 | | Navigant Consulting, Inc.† | | | 44,756 |
| 1,530 | | NCI Building Systems, Inc.† | | | 79,177 |
| 870 | | On Assignment, Inc.† | | | 10,222 |
| 1,500 | | Pacer International, Inc. | | | 44,655 |
| 1,700 | | Perini Corp.† | | | 52,326 |
| 500 | | Resources Connection, Inc.† | | | 15,920 |
| 1,688 | | Saia, Inc.† | | | 39,178 |
| 200 | | Shaw Group, Inc. (The)† | | | 6,700 |
| 500 | | Smith (A.O.) Corp. | | | 18,780 |
| 620 | | Superior Essex, Inc.† | | | 20,615 |
| 300 | | TAL International Group, Inc. | | | 8,007 |
| 200 | | Team, Inc.† | | | 6,966 |
| 1,100 | | Tecumseh Products Co., Class A† | | | 18,590 |
| 2,900 | | TeleTech Holdings, Inc.† | | | 69,252 |
| 2,953 | | Tetra Tech, Inc.† | | | 53,420 |
| 300 | | Titan International, Inc.(a) | | | 6,045 |
| 500 | | Trex Co., Inc.†(a) | | | 11,445 |
| 610 | | United Stationers, Inc.† | | | 28,481 |
| 1,263 | | URS Corp.† | | | 54,120 |
| 760 | | US Airways Group, Inc.† | | | 40,926 |
| 700 | | US Xpress Enterprises, Inc., Class A† | | | 11,529 |
| 1,173 | | USA Truck, Inc.† | | | 18,827 |
| 940 | | UTi Worldwide, Inc. | | | 28,106 |
| 5,423 | | Wabtec Corp. | | | 164,751 |
| 700 | | Washington Group International, Inc.† | | | 41,853 |
| 1,300 | | Watson Wyatt Worldwide, Inc., Class A. | | | 58,695 |
| | | | | |
| | | | | 3,028,005 |
| | | | | |
| |
| Information Technology — 27.4% | | | |
| 1,700 | | Acxiom Corp. | | | 43,605 |
| 8,310 | | Aeroflex, Inc.† | | | 97,393 |
| 1,327 | | Agilysys, Inc. | | | 22,214 |
| 655 | | Alliance Data Systems Corp.† | | | 40,918 |
| 500 | | Altiris, Inc.† | | | 12,690 |
| 400 | | AMIS Holdings, Inc.† | | | 4,228 |
| 3,380 | | Amkor Technology, Inc.† | | | 31,569 |
| 1,000 | | Anixter International, Inc.† | | | 54,300 |
| 2,415 | | aQuantive, Inc.†(a) | | | 59,554 |
| 400 | | Arris Group, Inc.† | | | 5,004 |
| 2,093 | | Art Technology Group, Inc.† | | | 4,877 |
| 3,384 | | Asyst Technologies, Inc.† | | | 24,737 |
| 3,380 | | ATMI, Inc.† | | | 103,191 |
See Notes to Financial Statements.
39
| | | | |
WILSHIRE MUTUAL FUNDS, INC. LARGE COMPANY GROWTH PORTFOLIO SCHEDULEOF INVESTMENTS - (CONTINUED) | | December 31, 2006 | | |
| | | | | |
| Shares | | Value |
| |
| Information Technology (continued) | | | |
| 500 | | Avid Technology, Inc.†(a) | | $ | 18,630 |
| 3,205 | | Avocent Corp.† | | | 108,489 |
| 900 | | Bankrate, Inc.†(a) | | | 34,155 |
| 600 | | Bell Microproducts, Inc.† | | | 4,230 |
| 4,050 | | Benchmark Electronics, Inc.† | | | 98,658 |
| 1,450 | | Blue Coat Systems, Inc.† | | | 34,727 |
| 13,224 | | Bookham, Inc.†(a) | | | 53,822 |
| 890 | | Brooks Automation, Inc.† | | | 12,816 |
| 520 | | Cabot Microelectronics Corp.† | | | 17,649 |
| 1,100 | | CACI International, Inc., Class A† | | | 62,150 |
| 2,700 | | Carrier Access Corp.† | | | 17,712 |
| 400 | | C-COR, Inc.† | | | 4,456 |
| 2,330 | | Ceridian Corp.† | | | 65,193 |
| 700 | | Checkpoint Systems, Inc.† | | | 14,140 |
| 1,000 | | Cirrus Logic, Inc.† | | | 6,880 |
| 37,616 | | CMGI, Inc.† | | | 50,405 |
| 280 | | Cogent, Inc.† | | | 3,083 |
| 600 | | Comtech Telecommuni- cations Corp.† | | | 22,842 |
| 1,530 | | Concur Technologies, Inc.†(a) | | | 24,541 |
| 2,400 | | Conexant Systems, Inc.† | | | 4,896 |
| 283 | | Covansys Corp.† | | | 6,495 |
| 1,681 | | CSG Systems International, Inc.† | | | 44,933 |
| 1,050 | | Cymer, Inc.†(a) | | | 46,147 |
| 900 | | Cypress Semiconductor Corp.† | | | 15,183 |
| 900 | | Digital Insight Corp.† | | | 34,641 |
| 1,340 | | Digital River, Inc.†(a) | | | 74,759 |
| 510 | | Digitas, Inc.† | | | 6,839 |
| 707 | | Diodes, Inc.† | | | 25,084 |
| 600 | | DSP Group, Inc.† | | | 13,020 |
| 1,100 | | Emcore Corp.† | | | 6,083 |
| 1,400 | | Emulex Corp.† | | | 27,314 |
| 300 | | eSpeed, Inc., Class A† | | | 2,619 |
| 710 | | Factset Research Systems, Inc. | | | 40,101 |
| 3,095 | | FEI Co.† | | | 81,615 |
| 13,756 | | Gateway, Inc.† | | | 27,650 |
| 200 | | Gevity HR, Inc. | | | 4,738 |
| 1,600 | | Global Imaging Systems, Inc.† | | | 35,120 |
| 500 | | Hypercom Corp.† | | | 3,175 |
| 1,900 | | Hyperion Solutions Corp.† | | | 68,286 |
| 460 | | Infocrossing, Inc.† | | | 7,498 |
| 400 | | Informatica Corp.† | | | 4,884 |
| 5,340 | | Insight Enterprises, Inc.† | | | 100,766 |
| 647 | | Interdigital Communications Corp.† | | | 21,707 |
| 3,140 | | Intermec, Inc.† | | | 76,208 |
| 1,460 | | Internap Network Services Corp.†(a) | | | 29,010 |
| 1,235 | | International Rectifier Corp.† | | | 47,584 |
| 900 | | InterVoice, Inc.† | | | 6,894 |
| 1,300 | | Itron, Inc.†(a) | | | 67,392 |
| 1,000 | | j2 Global Communications, Inc.† | | | 27,250 |
| 750 | | Kronos, Inc.† | | | 27,555 |
| 450 | | Littelfuse, Inc.† | | | 14,346 |
| 800 | | Macrovision Corp.† | | | 22,608 |
| 1,100 | | Manhattan Associates, Inc.† | | | 33,088 |
| 2,560 | | Mantech International Corp., Class A† | | | 94,285 |
| 800 | | Mattson Technology, Inc.† | | | 7,456 |
| 900 | | MicroStrategy, Inc., Class A† | | | 102,609 |
| 3,858 | | Microtune, Inc.† | | | 18,133 |
| 3,400 | | MIPS Technologies, Inc.† | | | 28,220 |
| 2,200 | | Monolithic Power Systems, Inc.† | | | 24,442 |
| 3,340 | | MPS Group, Inc.† | | | 47,361 |
| 1,313 | | Multi-Fineline Electronix, Inc.†(a) | | | 26,641 |
| 1,455 | | NCI, Inc., Class A† | | | 22,247 |
See Notes to Financial Statements.
40
| | | | |
WILSHIRE MUTUAL FUNDS, INC. SMALL COMPANY GROWTH PORTFOLIO SCHEDULEOF INVESTMENTS - (CONTINUED) | | December 31, 2006 | | |
| | | | | |
| Shares | | Value |
| Information Technology (continued) | | | |
| 1,128 | | Netgear, Inc.† | | $ | 29,610 |
| 400 | | Netlogic Microsystems, Inc.† . | | | 8,676 |
| 800 | | Netscout Systems, Inc.† | | | 6,640 |
| 1,490 | | NICE Systems, Ltd. ADR † | | | 45,862 |
| 510 | | Nuance Communications, Inc.†(a) | | | 5,845 |
| 1,480 | | Occam Networks, Inc.† | | | 24,420 |
| 861 | | Omnivision Technologies, Inc.†(a) | | | 11,753 |
| 1,455 | | Online Resources Corp.† | | | 14,855 |
| 3,320 | | Opnet Technologies, Inc.† | | | 47,974 |
| 1,847 | | OSI Systems, Inc.† | | | 38,658 |
| 1,300 | | Paxar Corp.† | | | 29,978 |
| 480 | | Pegasus Wireless Corp.† | | | 677 |
| 1,613 | | Perot Systems Corp., Class A† | | | 26,437 |
| 800 | | Photon Dynamics, Inc.† | | | 9,352 |
| 900 | | Plexus Corp.† | | | 21,492 |
| 900 | | PLX Technology, Inc.† | | | 11,736 |
| 770 | | PMC - Sierra, Inc.† | | | 5,167 |
| 3,230 | | Polycom, Inc.†(a) | | | 99,839 |
| 1,761 | | Powerwave Technologies, Inc.† | | | 11,358 |
| 2,900 | | Progress Software Corp.† | | | 80,997 |
| 1,080 | | Quality Systems, Inc | | | 40,252 |
| 100 | | Rackable Systems, Inc.†(a) | | | 3,097 |
| 1,574 | | Redback Networks, Inc.† | | | 39,256 |
| 2,085 | | RightNow Technologies, Inc.† | | | 35,904 |
| 1,970 | | Rogers Corp.† | | | 116,525 |
| 1,600 | | Rudolph Technologies, Inc.† | | | 25,472 |
| 594 | | SafeNet, Inc.† | | | 14,220 |
| 1,300 | | SI International, Inc.† | | | 42,146 |
| 392 | | Silicon Image, Inc.† | | | 4,986 |
| 1,500 | | Silicon Storage Technology, Inc.† | | | 6,765 |
| 8,900 | | Skyworks Solutions, Inc.† | | | 63,012 |
| 1,480 | | Sohu.com, Inc.† | | | 35,520 |
| 2,076 | | Sonus Networks, Inc.† | | | 13,681 |
| 2,000 | | SRA International, Inc., Class A† | | | 53,480 |
| 400 | | Standard Microsystems Corp.† | | | 11,192 |
| 2,705 | | Symmetricom, Inc.† | | | 24,129 |
| 1,156 | | Synaptics, Inc.† | | | 34,322 |
| 700 | | SYNNEX Corp.† | | | 15,358 |
| 400 | | Syntel, Inc. | | | 10,720 |
| 2,600 | | Talx Corp. | | | 71,370 |
| 6,125 | | Tekelec† | | | 90,834 |
| 2,940 | | Tessera Technologies, Inc.† | | | 118,600 |
| 600 | | TNS, Inc.† | | | 11,550 |
| 200 | | Transaction Systems Architects, Inc.† | | | 6,514 |
| 600 | | TTM Technologies, Inc.† | | | 6,798 |
| 300 | | Ultratech, Inc.† | | | 3,744 |
| 1,100 | | Utstarcom, Inc.†(a) | | | 9,625 |
| 4,163 | | Valueclick, Inc.†(a) | | | 98,372 |
| 1,150 | | Varian Semiconductor Equipment Associates, Inc.†(a) | | | 52,348 |
| 1,310 | | Vasco Data Security International† | | | 15,523 |
| 1,640 | | Veeco Instruments, Inc.† | | | 30,717 |
| 531 | | Verint Systems, Inc.† | | | 18,203 |
| 400 | | Vignette Corp.† | | | 6,828 |
| 556 | | Websense, Inc.† | | | 12,693 |
| 3,621 | | Zoran Corp.† | | | 52,794 |
| | | | | |
| | | | | 4,313,616 |
| | | | | |
| |
| Materials — 3.8% | | | |
| 7,800 | | AK Steel Holding Corp.† | | | 131,820 |
| 1,660 | | Albemarle Corp. | | | 119,188 |
| 1,553 | | American Vanguard Corp . | | | 24,693 |
| 4,512 | | Coeur d’Alene Mines Corp.† | | | 22,334 |
| 1,000 | | H.B. Fuller Co. | | | 25,820 |
| 2,266 | | Hecla Mining Co.† | | | 17,358 |
| 1,100 | | RTI International Metals, Inc.† | | | 86,042 |
See Notes to Financial Statements.
41
| | | | |
WILSHIRE MUTUAL FUNDS, INC. SMALL COMPANY GROWTH PORTFOLIO SCHEDULEOF INVESTMENTS - (CONTINUED) | | December 31, 2006 | | |
| | | | | |
| Shares | | Value |
| Materials (continued) | | | |
| 1,000 | | Schulman (A.), Inc. | | $ | 22,250 |
| 800 | | Silgan Holdings, Inc. | | | 35,136 |
| 300 | | Texas Industries, Inc.(a) | | | 19,269 |
| 4,649 | | Wausau Paper Corp. | | | 69,688 |
| 1,376 | | Wheeling-Pittsburgh Corp.† | | | 25,772 |
| | | | | |
| | | | | 599,370 |
| | | | | |
| |
| Telecommunication Services — 0.7% | | | |
| 1,210 | | Cbeyond, Inc.† | | | 37,014 |
| 750 | | Centennial Communications Corp. | | | 5,393 |
| 2,444 | | Cincinnati Bell, Inc.† | | | 11,169 |
| 150 | | Golden Telecom, Inc. | | | 7,026 |
| 300 | | iPCS, Inc.† | | | 16,608 |
| 490 | | NTELOS Holdings Corp.† | | | 8,761 |
| 280 | | SBA Communications Corp., Class A† | | | 7,700 |
| 400 | | USA Mobility, Inc. | | | 8,948 |
| 1,700 | | Wireless Facilities, Inc.† | | | 4,845 |
| | | | | |
| | | | | 107,464 |
| | | | | |
| |
| Utilities — 3.9% | | | |
| 1,500 | | Allete, Inc.(a) | | | 69,810 |
| 2,700 | | Black Hills Corp. | | | 99,738 |
| 6,654 | | Peoples Energy Corp. | | | 296,569 |
| 2,168 | | PNM Resources, Inc. | | | 67,425 |
| 500 | | South Jersey Industries, Inc. | | | 16,705 |
| 1,540 | | Unisource Energy Corp. | | | 56,256 |
| | | | | |
| | | | | 606,503 |
| | | | | |
| Total Common Stock | | | |
| (Cost $ 13,311,639) | | | 15,705,248 |
| | | | | |
| |
| MONEY MARKET FUND — 16.2% | | | |
| | |
| 2,552,576 | | PNC Institutional Money | | | |
| | Market Trust 5.30% | | | 2,552,576 |
| | | | | |
| | (Cost $2,552,576)(b) | | | |
| | | | |
Total Investments — 115.9% | | | | |
(Cost $ 15,864,215) | | $ | 18,257,824 | |
Other Assets & Liabilities, | | | | |
Net — (15.9)% | | | (2,508,795 | ) |
| | | | |
NET ASSETS — 100.0% | | $ | 15,749,029 | |
| | | | |
| † | Non-income producing security. |
| (a) | All or a portion of this security is on loan. |
| (b) | Investment purchased with proceeds from collateral received from securities on loan. |
See Notes to Financial Statements.
42
| | | | |
WILSHIRE MUTUAL FUNDS, INC. SMALL COMPANY VALUE PORTFOLIO SCHEDULEOF INVESTMENTS | | December 31, 2006 | | |
| | | | | |
| Shares | | Value |
| COMMON STOCK — 98.9% | | | |
| |
| Consumer Discretionary — 9.8% | | | |
| 400 | | Asbury Automotive Group, Inc. | | $ | 9,424 |
| 100 | | Audiovox Corp., Class A† | | | 1,409 |
| 3,500 | | Big Lots, Inc.†(a) | | | 80,220 |
| 1,200 | | Bluegreen Corp.† | | | 15,396 |
| 1,742 | | Bon-Ton Stores, Inc. (The)(a) | | | 60,360 |
| 1,400 | | Building Materials Holding Corp. | | | 34,566 |
| 64 | | Charming Shoppes, Inc.† | | | 866 |
| 337 | | Cost Plus, Inc.†(a) | | | 3,471 |
| 2,177 | | CSK Auto Corp.† | | | 37,336 |
| 922 | | Educate, Inc.† | | | 6,565 |
| 10,650 | | Fossil, Inc.† | | | 240,477 |
| 1,100 | | FTD Group, Inc.† | | | 19,679 |
| 700 | | Genesco, Inc.†(a) | | | 26,110 |
| 4,300 | | Golfsmith International Holdings, Inc.† | | | 41,753 |
| 2,900 | | Group 1 Automotive, Inc. | | | 149,988 |
| 10,600 | | Hooker Furniture Corp. | | | 166,208 |
| 600 | | Interactive Data Corp. | | | 14,424 |
| 700 | | Jo-Ann Stores, Inc.† | | | 17,220 |
| 10 | | K2, Inc.† | | | 132 |
| 800 | | Kimball International, Inc., Class B | | | 19,440 |
| 1,140 | | Lear Corp. | | | 33,664 |
| 1,300 | | Lifetime Brands, Inc. | | | 21,359 |
| 76 | | Men’s Wearhouse, Inc. (The)(a) | | | 2,908 |
| 1,200 | | Modine Manufacturing Co. | | | 30,036 |
| 2,400 | | New York & Co., Inc.† | | | 31,392 |
| 1,160 | | Overstock.com, Inc.†(a) | | | 18,328 |
| 5,441 | | Payless Shoesource, Inc.† | | | 178,574 |
| 882 | | Perry Ellis International, Inc.† | | | 36,162 |
| 170 | | Regis Corp. | | | 6,722 |
| 24,261 | | Retail Ventures, Inc.† | | | 461,929 |
| 7,350 | | Sauer-Danfoss, Inc. | | | 237,037 |
| 830 | | Scholastic Corp.† | | | 29,747 |
| 9,040 | | Source Interlink Cos., Inc.† | | | 73,766 |
| 3,350 | | Stage Stores, Inc. | | | 101,806 |
| 100 | | Stein Mart, Inc. | | | 1,326 |
| 1,744 | | Stewart Enterprises, Inc., Class A | | | 10,900 |
| 500 | | Tenneco, Inc.† | | | 12,360 |
| 2,100 | | United Auto Group, Inc. | | | 49,497 |
| 5,588 | | Valuevision Media, Inc., Class A† | | | 73,426 |
| 2,365 | | Warnaco Group, Inc. (The)† | | | 60,024 |
| 100 | | West Marine, Inc.† | | | 1,727 |
| 1,408 | | Zale Corp.†(a) | | | 39,720 |
| | | | | |
| | | | | 2,457,454 |
| | | | | |
| |
| Consumer Staples — 5.1% | | | |
| 9,001 | | Alliance One International, Inc.† | | | 63,547 |
| 11,400 | | Casey’s General Stores, Inc. | | | 268,470 |
| 4,410 | | Chiquita Brands International, Inc. | | | 70,428 |
| 4,998 | | Corn Products International, Inc. | | | 172,631 |
| 18,150 | | Del Monte Foods Co. | | | 200,194 |
| 2,000 | | Gold Kist, Inc.† | | | 42,040 |
| 2,500 | | Playtex Products, Inc.† | | | 35,975 |
| 6,200 | | Premium Standard Farms, Inc. | | | 115,134 |
| 100 | | Smart & Final, Inc.† | | | 1,890 |
| 6,534 | | Spectrum Brands, Inc.†. | | | 71,221 |
| 2,272 | | Universal Corp. | | | 111,351 |
| 3,550 | | WD-40 Co. | | | 123,788 |
| | | | | |
| | | | | 1,276,669 |
| | | | | |
| |
| Energy — 4.7% | | | |
| 10,900 | | Acergy SA ADR †(a) | | | 209,934 |
| 300 | | Allis-Chalmers Energy, Inc.† | | | 6,912 |
| 3,600 | | Bill Barret Corp.† | | | 97,956 |
See Notes to Financial Statements.
43
| | | | |
WILSHIRE MUTUAL FUNDS, INC. SMALL COMPANY VALUE PORTFOLIO SCHEDULEOF INVESTMENTS - (CONTINUED) | | December 31, 2006 | | |
| | | | | |
| Shares | | Value |
| Energy (continued) | | | |
| 4,150 | | Denbury Resources, Inc.† | | $ | 115,329 |
| 300 | | NATCO Group, Inc., Class A† | | | 9,564 |
| 3,950 | | Range Resources Corp.(a) | | | 108,467 |
| 1,686 | | Tesoro Corp.(a) | | | 110,888 |
| 4,137 | | Universal Compression | | | |
| | Holdings, Inc.† | | | 256,949 |
| 3,240 | | USEC, Inc.† | | | 41,213 |
| 18,000 | | Warren Resources, Inc.† | | | 210,960 |
| | | | | |
| | | | | 1,168,172 |
| | | | | |
| |
| Financials — 23.6% | | | |
| 209 | | 21st Century Insurance Group | | | 3,689 |
| 2,650 | | Affiliated Managers Group, Inc.†(a) | | | 278,594 |
| 8,700 | | Alesco Financial, Inc. | | | 93,090 |
| 2,793 | | Alexandria Real Estate Equities, Inc. | | | 280,417 |
| 100 | | Amcore Financial, Inc. | | | 3,267 |
| 1,716 | | American Equity Investment Life Holding Co.(a) | | | 22,359 |
| 10,231 | | Anworth Mortgage Asset Corp. | | | 97,297 |
| 100 | | Ashford Hospitality Trust, Inc. | | | 1,245 |
| 6,105 | | Bancorp, Inc. (The)† | | | 180,708 |
| 5,000 | | BankAtlantic Bancorp, Inc., Class A | | | 69,050 |
| 818 | | Brandywine Realty Trust | | | 27,198 |
| 200 | | Calamos Asset Management, Inc., Class A | | | 5,366 |
| 100 | | Chittenden Corp. | | | 3,069 |
| 100 | | Citizens Banking Corp.(a) | | | 2,650 |
| 23 | | Clifton Savings Bancorp, Inc. | | | 280 |
| 875 | | Colonial Properties Trust | | | 41,020 |
| 12 | | CVB Financial Corp. | | | 174 |
| 2,950 | | Delphi Financial Group, Class A | | | 119,357 |
| 121 | | Donegal Group, Inc., Class A | | | 2,370 |
| 57 | | Equity One, Inc. | | | 1,520 |
| 445 | | Financial Federal Corp. | | | 13,087 |
| 1,320 | | First Cash Financial Services, Inc.† | | | 34,148 |
| 1,300 | | First Citizens BancShares, Inc., Class A | | | 263,432 |
| 1,060 | | First Community Bancshares, Inc. | | | 41,934 |
| 837 | | First Financial Bankshares, Inc. | | | 35,037 |
| 3,300 | | First Industrial Realty Trust, Inc. | | | 154,737 |
| 5,500 | | First Niagara Financial Group, Inc. | | | 81,730 |
| 2,750 | | First Republic Bank . | | | 107,470 |
| 9,450 | | Franklin Bank Corp.† | | | 194,103 |
| 185 | | GAMCO Investors, Inc., Class A | | | 7,115 |
| 374 | | Harleysville Group, Inc. | | | 13,023 |
| 28 | | Harleysville National Corp. | | | 541 |
| 1,864 | | Highwoods Properties, Inc. | | | 75,977 |
| 2,000 | | Home Properties, Inc. | | | 118,540 |
| 9,700 | | HomeBanc Corp. | | | 41,031 |
| 2,151 | | IBERIABANK Corp. | | | 127,017 |
| 61 | | Independent Bank Corp. | | | 2,198 |
| 3,350 | | IndyMac Bancorp, Inc. | | | 151,286 |
| 228 | | Investors Real Estate Trust | | | 2,339 |
| 5,289 | | Irwin Financial Corp. | | | 119,690 |
| 1,010 | | ITLA Capital Corp. | | | 58,489 |
| 1,668 | | Jones Lang LaSalle, Inc. | | | 153,740 |
| 900 | | Lakeland Financial Corp. | | | 22,977 |
| 1,753 | | LandAmerica Financial Group, Inc.(a) | | | 110,632 |
| 1,690 | | Longview Fibre Co. | | | 37,095 |
See Notes to Financial Statements.
44
| | | | |
WILSHIRE MUTUAL FUNDS, INC. SMALL COMPANY VALUE PORTFOLIO SCHEDULEOF INVESTMENTS - (CONTINUED) | | December 31, 2006 | | |
| | | | | |
| Shares | | Value |
| Financials (continued) | | | |
| 65 | | LTC Properties, Inc. | | $ | 1,775 |
| 11,367 | | Luminent Mortgage Capital, Inc. | | | 110,374 |
| 1,806 | | MAF Bancorp, Inc. | | | 80,710 |
| 700 | | Midland Co. (The) | | | 29,365 |
| 100 | | Mid-State Bancshares | | | 3,639 |
| 101 | | Nasdaq Stock Market, Inc. (The)†(a) | | | 3,110 |
| 100 | | National Health Investors, Inc. | | | 3,300 |
| 1,536 | | National Penn Bancshares, Inc. | | | 31,104 |
| 590 | | Navigators Group, Inc.† | | | 28,426 |
| 1,916 | | NBT Bancorp, Inc. | | | 48,877 |
| 15,300 | | New York Mortgage Trust, Inc. | | | 46,665 |
| 900 | | Odyssey Re Holdings Corp. | | | 33,570 |
| 355 | | Old National Bancorp . | | | 6,717 |
| 17 | | Omega Healthcare Investors, Inc. | | | 301 |
| 420 | | Pennsylvania Real Estate Investment Trust | | | 16,540 |
| 2,221 | | PFF Bancorp, Inc. | | | 76,647 |
| 1,060 | | Philadelphia Consolidated Holding Co.† | | | 47,234 |
| 15,504 | | Phoenix Cos., Inc. (The) | | | 246,359 |
| 6,100 | | PMA Capital Corp., Class A† | | | 56,242 |
| 1,221 | | Portfolio Recovery Associates, Inc.† | | | 57,008 |
| 1,437 | | Potlatch Corp. | | | 62,969 |
| 1,120 | | ProAssurance Corp.† | | | 55,910 |
| 872 | | Prosperity Bancshares, Inc. | | | 30,093 |
| 2,730 | | Provident Bankshares Corp. | | | 97,188 |
| 18,750 | | Quanta Capital Holdings, Ltd.† | | | 40,312 |
| 6,700 | | RAIT Investment Trust | | | 231,016 |
| 700 | | Ramco-Gershenson Properties Trust | | | 26,698 |
| 991 | | Republic Bancorp, Inc. | | | 13,339 |
| 2,300 | | Rewards Network, Inc.† | | | 15,985 |
| 1,200 | | RLI Corp. | | | 67,704 |
| 803 | | Santander BanCorp | | | 14,334 |
| 100 | | Security Bank Corp. | | | 2,282 |
| 1,600 | | Selective Insurance Group | | | 91,664 |
| 3,640 | | Senior Housing Properties Trust | | | 89,107 |
| 1,415 | | Sterling Financial Corp. | | | 47,841 |
| 944 | | Sun Bancorp, Inc.† | | | 19,890 |
| 1,800 | | SVB Financial Group† | | | 83,916 |
| 300 | | Texas Capital Bancshares, Inc.† | | | 5,964 |
| 1,027 | | Umpqua Holdings Corp. | | | 30,225 |
| 200 | | United Community Banks, Inc. | | | 6,464 |
| 3,000 | | United Fire & Casualty Co. | | | 105,750 |
| 32 | | Universal Health Realty Income Trust | | | 1,247 |
| 31 | | USB Holding Co., Inc. | | | 747 |
| 34,200 | | W Holding Co., Inc. | | | 203,832 |
| 3,168 | | World Acceptance Corp.† | | | 148,738 |
| 2,600 | | WSFS Financial Corp. | | | 174,018 |
| 2,300 | | Zenith National Insurance Corp. | | | 107,893 |
| | | | | |
| | | | | 5,903,177 |
| | | | | |
| |
| Health Care — 2.1% | | | |
| 2,200 | | Bio-Rad Laboratories, Inc., Class A† | | | 181,544 |
| 2,107 | | Chemed Corp. | | | 77,917 |
| 400 | | Conmed Corp.† | | | 9,248 |
| 500 | | Eclipsys Corp.† | | | 10,280 |
| 1,504 | | Gentiva Health Services, Inc.† | | | 28,666 |
| 1,715 | | Greatbatch, Inc.† | | | 46,168 |
| 339 | | HealthTronics, Inc.† | | | 2,257 |
| 2,583 | | Inverness Medical Innovations, Inc.† | | | 99,962 |
| 1,300 | | Kindred Healthcare, Inc.† | | | 32,825 |
See Notes to Financial Statements.
45
| | | | |
WILSHIRE MUTUAL FUNDS, INC. SMALL COMPANY VALUE PORTFOLIO SCHEDULEOF INVESTMENTS - (CONTINUED) | | December 31, 2006 | | |
| | | | | |
| Shares | | Value |
| Health Care (continued) | | | |
| 100 | | Matria Healthcare, Inc.† | | $ | 2,873 |
| 80 | | Medcath Corp.† | | | 2,189 |
| 800 | | Providence Service Corp. (The)†(a) | | | 20,104 |
| 300 | | Res-Care, Inc.† | | | 5,445 |
| | | | | |
| | | | | 519,478 |
| | | | | |
| |
| Industrials — 21.5% | | | |
| 1,655 | | ABM Industries, Inc. | | | 37,585 |
| 6,775 | | ABX Air, Inc.† | | | 46,951 |
| 7,400 | | ACCO Brands Corp.† | | | 195,878 |
| 7,900 | | AGCO Corp.†(a) | | | 244,426 |
| 2,700 | | Airtran Holdings, Inc.† | | | 31,698 |
| 12,783 | | Alaska Air Group, Inc.†(a) | | | 504,928 |
| 4,800 | | Albany International Corp., Class A | | | 157,968 |
| 310 | | Astec Industries, Inc.† | | | 10,881 |
| 2,144 | | Blount International, Inc.† | | | 28,858 |
| 2,144 | | Cascade Corp. | | | 113,418 |
| 10,619 | | CBIZ, Inc.† | | | 74,014 |
| 1,084 | | CDI Corp. | | | 26,992 |
| 3,200 | | Commercial Vehicle Group, Inc.† | | | 69,760 |
| 4,449 | | Corrections Corp. of America† | | | 201,228 |
| 1,600 | | Curtiss-Wright Corp. | | | 59,328 |
| 100 | | Diamond Management & Technology Consultants, Inc. | | | 1,244 |
| 1,600 | | Dollar Thrifty Automotive Group† | | | 72,976 |
| 520 | | Dynamic Materials Corp. | | | 14,612 |
| 844 | | EGL, Inc.† | | | 25,134 |
| 1,300 | | EnPro Industries, Inc.† | | | 43,173 |
| 3,679 | | Federal Signal Corp. | | | 59,011 |
| 3,540 | | FTI Consulting, Inc.† | | | 98,731 |
| 80 | | G&K Services, Inc., Class A | | | 3,111 |
| 1,000 | | Gardner Denver, Inc.† | | | 37,310 |
| 381 | | GATX Corp. | | | 16,509 |
| 5,350 | | General Cable Corp.† | | | 233,848 |
| 1,220 | | Genesee & Wyoming, Inc., Class A† | | | 32,013 |
| 2,600 | | Genlyte Group, Inc.† | | | 203,086 |
| 800 | | Greenbrier Cos., Inc. | | | 24,000 |
| 13,800 | | Griffon Corp.† | | | 351,900 |
| 6,700 | | Hudson Highland Group, Inc.† | | | 111,756 |
| 820 | | IKON Office Solutions, Inc. | | | 13,423 |
| 6,300 | | Kadant Inc† | | | 153,594 |
| 4,678 | | Kaman Corp. | | | 104,740 |
| 5,319 | | Kelly Services, Inc., Class A | | | 153,932 |
| 5,100 | | Kennametal, Inc. | | | 300,135 |
| 700 | | Kforce, Inc.† | | | 8,519 |
| 3,310 | | Laidlaw International, Inc. | | | 100,723 |
| 5,000 | | Lincoln Electric Holdings, Inc. | | | 302,100 |
| 11,150 | | Marten Transport, Ltd.† | | | 204,380 |
| 19 | | Moog, Inc., Class A† | | | 726 |
| 88 | | Pacer International, Inc. | | | 2,620 |
| 2,600 | | RBC Bearings, Inc.† | | | 74,516 |
| 2,492 | | Saia, Inc.† | | | 57,839 |
| 300 | | School Specialty, Inc.†(a) | | | 11,247 |
| 1,045 | | Shaw Group, Inc. (The)† | | | 35,008 |
| 710 | | SIRVA, Inc.† | | | 2,471 |
| 2,615 | | Smith (A.O.) Corp. | | | 98,219 |
| 500 | | Spherion Corp.† | | | 3,715 |
| 1,600 | | Superior Essex, Inc.† | | | 53,200 |
| 552 | | TAL International Group, Inc. | | | 14,733 |
| 1,800 | | Tecumseh Products Co., Class A† | | | 30,420 |
| 1,500 | | TeleTech Holdings, Inc.† | | | 35,820 |
| 100 | | Titan International, Inc.(a) | | | 2,015 |
| 754 | | Tredegar Corp. | | | 17,048 |
| 390 | | Trex Co., Inc.†(a) | | | 8,927 |
| 1,937 | | United Stationers, Inc.† | | | 90,439 |
| 2,741 | | URS Corp.† | | | 117,452 |
| 300 | | Viad Corp. | | | 12,180 |
See Notes to Financial Statements.
46
| | | | |
WILSHIRE MUTUAL FUNDS, INC. SMALL COMPANY VALUE PORTFOLIO SCHEDULEOF INVESTMENTS - (CONTINUED) | | December 31, 2006 | | |
| | | | | |
| Shares | | Value |
| Industrials (continued) | | | |
| 1,000 | | Volt Information Sciences, Inc.† | | $ | 50,210 |
| 500 | | Wabtec Corp. | | | 15,190 |
| 2,420 | | Washington Group International, Inc.† | | | 144,692 |
| 400 | | Waste Connections, Inc.† | | | 16,620 |
| | | | | |
| | | | | 5,369,180 |
| | | | | |
| |
| Information Technology — 13.1% | | | |
| 1,970 | | Actel Corp.† | | | 35,775 |
| 748 | | Adaptec, Inc.† | | | 3,486 |
| 13,300 | | Aeroflex, Inc.† | | | 155,876 |
| 5,838 | | Agilysys, Inc. | | | 97,728 |
| 1,350 | | AMIS Holdings, Inc.† | | | 14,270 |
| 100 | | Anaren, Inc.† | | | 1,776 |
| 4,500 | | Anixter International, Inc.† | | | 244,350 |
| 8,207 | | Applied Micro Circuits Corp.† | | | 29,217 |
| 1,400 | | Asyst Technologies, Inc.† | | | 10,234 |
| 1,899 | | Axcelis Technologies, Inc.† | | | 11,071 |
| 5,046 | | Bell Microproducts, Inc.† | | | 35,574 |
| 1,025 | | Benchmark Electronics, Inc.† | | | 24,969 |
| 84 | | BISYS Group, Inc. (The)† | | | 1,085 |
| 18,862 | | Bookham, Inc.† | | | 76,768 |
| 1,092 | | Checkpoint Systems, Inc.† | | | 22,058 |
| 4,262 | | Ciber, Inc.† | | | 28,896 |
| 63,483 | | CMGI, Inc.† | | | 85,067 |
| 200 | | Coherent, Inc.† | | | 6,314 |
| 6,300 | | CommScope, Inc.† | | | 192,024 |
| 800 | | Conexant Systems, Inc.† | | | 1,632 |
| 3,430 | | CTS Corp. | | | 53,851 |
| 2,500 | | Digital Insight Corp.† | | | 96,225 |
| 100 | | Dycom Industries, Inc.† | | | 2,112 |
| 200 | | Electro Scientific Industries, Inc.† | | | 4,028 |
| 12,399 | | Electronics for Imaging† | | | 329,565 |
| 2,266 | | Entegris, Inc.† | | | 24,518 |
| 1,702 | | EPIQ Systems, Inc.† | | | 28,883 |
| 1,822 | | eSpeed, Inc., Class A† | | | 15,906 |
| 16,500 | | Gateway, Inc.† | | | 33,165 |
| 610 | | Imation Corp. | | | 28,322 |
| 200 | | Infospace, Inc.† | | | 4,102 |
| 2,000 | | Insight Enterprises, Inc.† | | | 37,740 |
| 124 | | Interwoven, Inc.† | | | 1,819 |
| 1,500 | | Itron, Inc.†(a) | | | 77,760 |
| 18,150 | | Keithley Instruments, Inc. | | | 238,673 |
| 110 | | Kemet Corp.† | | | 803 |
| 12,200 | | Mattson Technology, Inc.† | | | 113,704 |
| 1,600 | | McData Corp., Class A† | | | 8,880 |
| 2,500 | | Methode Electronics, Inc. | | | 27,075 |
| 300 | | MIPS Technologies, Inc.† | | | 2,490 |
| 100 | | MPS Group, Inc.† | | | 1,418 |
| 100 | | Paxar Corp.† | | | 2,306 |
| 3,613 | | Pegasus Wireless Corp.† | | | 5,094 |
| 100 | | Perot Systems Corp., Class A† | | | 1,639 |
| 100 | | Photon Dynamics, Inc.† | | | 1,169 |
| 2,500 | | Powerwave Technologies, Inc.† | | | 16,125 |
| 36,700 | | Quantum Corp.† | | | 85,144 |
| 400 | | Radisys Corp.† | | | 6,668 |
| 7,200 | | Rudolph Technologies, Inc.† | | | 114,624 |
| 2,600 | | SafeNet, Inc.† | | | 62,244 |
| 5,523 | | Silicon Storage Technology, Inc.† | | | 24,909 |
| 2,542 | | Skyworks Solutions, Inc.† | | | 17,997 |
| 200 | | Standard Microsystems Corp.† | | | 5,596 |
| 1,860 | | SYKES Enterprises, Inc.† | | | 32,810 |
| 1,690 | | SYNNEX Corp.† | | | 37,079 |
| 2,184 | | Talx Corp. | | | 59,951 |
| 10 | | Tech Data Corp.† | | | 379 |
| 300 | | Technitrol, Inc. | | | 7,167 |
| 200 | | TNS, Inc.† | | | 3,850 |
| 1,100 | | Ulticom, Inc.† | | | 10,549 |
| 2,400 | | Vasco Data Security International† | | | 28,440 |
See Notes to Financial Statements.
47
| | | | |
WILSHIRE MUTUAL FUNDS, INC. SMALL COMPANY VALUE PORTFOLIO SCHEDULEOF INVESTMENTS - (CONTINUED) | | December 31, 2006 | | |
| | | | | | |
| Shares | | Value | |
| Information Technology (continued) | | | | |
| 1,290 | | Veeco Instruments, Inc.† | | $ | 24,162 | |
| 893 | | Vignette Corp.† | | | 15,244 | |
| 34,800 | | Zoran Corp.† | | | 507,384 | |
| | | | | | |
| | | | | 3,279,739 | |
| | | | | | |
| |
| Materials — 11.5% | | | | |
| 100 | | AK Steel Holding Corp.† | | | 1,690 | |
| 1,600 | | Aptargroup, Inc. | | | 94,464 | |
| 2,718 | | Arch Chemicals, Inc. | | | 90,537 | |
| 12,516 | | Bowater, Inc.(a) | | | 281,610 | |
| 14,508 | | Buckeye Technologies, Inc.† | | | 173,806 | |
| 2,000 | | Caraustar Industries, Inc.† | | | 16,180 | |
| 5,300 | | Century Aluminum Co.† | | | 236,645 | |
| 968 | | Chesapeake Corp. | | | 16,475 | |
| 1,240 | | Ferro Corp. | | | 25,656 | |
| 10,450 | | Gibraltar Industries, Inc. | | | 245,679 | |
| 7,400 | | Glatfelter | | | 114,700 | |
| 2,890 | | H.B. Fuller Co. | | | 74,620 | |
| 50 | | Pope & Talbot, Inc.† | | | 274 | |
| 700 | | Royal Gold, Inc.(a) | | | 25,186 | |
| 1,939 | | RTI International Metals, Inc.† | | | 151,669 | |
| 12,500 | | Sappi, Ltd. ADR | | | 209,625 | |
| 7,000 | | Schulman (A.), Inc. | | | 155,750 | |
| 1,000 | | Silgan Holdings, Inc. | | | 43,920 | |
| 6,800 | | Smurfit-Stone Container Corp.† | | | 71,808 | |
| 5,670 | | Spartech Corp. | | | 148,667 | |
| 32 | | Terra Industries, Inc.† | | | 383 | |
| 2,883 | | Texas Industries, Inc.(a) | | | 185,175 | |
| 30,309 | | Wausau Paper Corp. | | | 454,332 | |
| 1,710 | | Wheeling-Pittsburgh Corp.† | | | 32,028 | |
| 1,200 | | Worthington Industries, Inc. | | | 21,264 | |
| | | | | | |
| | | | | 2,872,143 | |
| | | | | | |
| |
| Telecommunication Services — 0.4% | | | | |
| 16,420 | | Cincinnati Bell, Inc.† | | | 75,039 | |
| 1,900 | | IDT Corp., Class B† | | | 24,852 | |
| 800 | | USA Mobility, Inc. | | | 17,896 | |
| 66 | | Windstream Corp. | | | 939 | |
| | | | | | |
| | | | | 118,726 | |
| | | | | | |
| |
| Utilities — 7.1% | | | | |
| 1,600 | | Allete, Inc . | | | 74,464 | |
| 12,117 | | Black Hills Corp. | | | 447,602 | |
| 2,024 | | Northwest Natural Gas Co. | | | 85,899 | |
| 13,185 | | Peoples Energy Corp. | | | 587,655 | |
| 8,970 | | PNM Resources, Inc. | | | 278,967 | |
| 8,871 | | Sierra Pacific Resources† | | | 149,299 | |
| 1,100 | | South Jersey Industries, Inc. | | | 36,751 | |
| 2,900 | | Unisource Energy Corp. | | | 105,937 | |
| | | | | | |
| | | | | 1,766,574 | |
| | | | | | |
| |
| Total Common Stock | | | | |
| (Cost $21,028,472) | | | 24,731,312 | |
| | | | | | |
| |
| MONEY MARKET FUND — 9.7% | | | | |
| 2,428,374 | | PNC Institutional Money | | | | |
| | Market Trust 5.30% | | | | |
| | (Cost $2,428,374)(b) | | | 2,428,374 | |
| | | | | | |
| |
| Total Investments — 108.6% | | | | |
| (Cost $23,456,846) | | | 27,159,686 | |
| Other Assets & Liabilities, Net — (8.6)% | | | (2,145,161 | ) |
| | | | | | |
| NET ASSETS — 100.0% | | $ | 25,014,525 | |
| | | | | | |
ADR - American Depository Receipt.
| † | Non-income producing security. |
| (a) | All or a portion of this security is on loan. |
| (b) | Investment purchased with proceeds from collateral received from securities on loan. |
See Notes to Financial Statements.
48
| | | | |
WILSHIRE MUTUAL FUNDS, INC. DOW JONES WILSHIRE 5000 INDEX PORTFOLIO SCHEDULE OF INVESTMENTS | | December 31, 2006 | | |
| | | | | |
| Shares | | Value |
| COMMON STOCK — 99.3% | | | |
| |
| Consumer Discretionary — 11.6% | | | |
| 200 | | 4Kids Entertainment, Inc.† | | $ | 3,644 |
| 700 | | 99 Cents Only Stores† | | | 8,519 |
| 450 | | Aaron Rents, Inc. | | | 12,951 |
| 1,700 | | Abercrombie & Fitch Co., Class A(a) | | | 118,371 |
| 800 | | Acme United Corp. | | | 11,528 |
| 1,650 | | Advance Auto Parts, Inc. | | | 58,674 |
| 1,950 | | Aeropostale, Inc.† | | | 60,196 |
| 200 | | AFC Enterprises† | | | 3,534 |
| 100 | | Aftermarket Technology Corp.† | | | 2,128 |
| 1,000 | | Aldila, Inc. | | | 14,910 |
| 3,700 | | Amazon.com, Inc.†(a) | | | 146,002 |
| 400 | | Ambassadors Group, Inc. | | | 12,140 |
| 2,550 | | American Eagle Outfitters | | | 79,586 |
| 450 | | American Greetings Corp., Class A | | | 10,742 |
| 1,100 | | America’s Car-Mart, Inc.† | | | 13,046 |
| 200 | | Ameristar Casinos, Inc. | | | 6,148 |
| 750 | | AnnTaylor Stores Corp.† | | | 24,630 |
| 2,225 | | Apollo Group, Inc., Class A†(a) | | | 86,708 |
| 2,250 | | Applebees International, Inc. | | | 55,508 |
| 100 | | Applica, Inc.† | | | 799 |
| 750 | | ArvinMeritor, Inc. | | | 13,672 |
| 1,000 | | Asbury Automotive Group, Inc. | | | 23,560 |
| 200 | | Ashworth, Inc.† | | | 1,452 |
| 1,100 | | Autonation, Inc.† | | | 23,452 |
| 1,200 | | Autozone, Inc.† | | | 138,672 |
| 200 | | Avatar Holdings, Inc.†(a) | | | 16,170 |
| 250 | | Aztar Corp.† | | | 13,605 |
| 1,000 | | Bally Technologies, Inc.† | | | 18,680 |
| 1,500 | | Barnes & Noble, Inc. | | | 59,565 |
| 250 | | Bebe Stores, Inc.(a) | | | 4,948 |
| 4,300 | | Bed Bath & Beyond, Inc.† | | | 163,830 |
| 1,100 | | Belo Corp., Class A | | | 20,207 |
| 5,500 | | Best Buy Co., Inc.(a) | | | 270,545 |
| 200 | | Big 5 Sporting Goods Corp. | | | 4,884 |
| 600 | | Big Dog Holdings, Inc.† | | | 9,840 |
| 1,550 | | Big Lots, Inc.†(a) | | | 35,526 |
| 1,500 | | Black & Decker Corp.(a) | | | 119,955 |
| 550 | | Blyth, Inc. | | | 11,412 |
| 400 | | Bon-Ton Stores, Inc. (The)(a) | | | 13,860 |
| 700 | | Books-A-Million, Inc. | | | 15,876 |
| 400 | | Borders Group, Inc. | | | 8,940 |
| 440 | | BorgWarner, Inc. | | | 25,969 |
| 300 | | Boyd Gaming Corp. | | | 13,593 |
| 2,000 | | Brinker International, Inc. | | | 60,320 |
| 1,000 | | Brookfield Homes Corp.(a). | | | 37,550 |
| 1,000 | | Brunswick Corp.(a) | | | 31,900 |
| 2,800 | | Cablevision Systems Corp., Class A | | | 79,744 |
| 200 | | Cache, Inc.† | | | 5,048 |
| 150 | | California Pizza Kitchen, Inc.† | | | 4,996 |
| 500 | | Callaway Golf Co. | | | 7,205 |
| 1,300 | | Career Education Corp.† | | | 32,214 |
| 1,300 | | Caribou Coffee Co., Inc.†(a) | | | 11,089 |
| 1,490 | | Carmax, Inc.† | | | 79,909 |
| 5,250 | | Carnival Corp.(a) | | | 257,512 |
| 1,000 | | Carter’s, Inc.† | | | 25,500 |
| 1,000 | | Cato Corp. (The), Class A | | | 22,910 |
| 8,462 | | CBS Corp., Class B(a) | | | 263,845 |
| 250 | | CEC Entertainment, Inc.† | | | 10,063 |
| 1,800 | | Centex Corp.(a) | | | 101,286 |
| 550 | | Champion Enterprises, Inc.† | | | 5,148 |
| 862 | | Charles & Covard, Ltd. | | | 6,896 |
| 1,250 | | Charming Shoppes, Inc.† | | | 16,912 |
| 750 | | Cheesecake Factory (The)†(a) | | | 18,450 |
| 2,500 | | Chico’s FAS, Inc.† | | | 51,725 |
| 2,500 | | Circuit City Stores, Inc.(a) | | | 47,450 |
See Notes to Financial Statements.
49
| | | | |
WILSHIRE MUTUAL FUNDS, INC. DOW JONES WILSHIRE 5000 INDEX PORTFOLIO SCHEDULE OF INVESTMENTS - (CONTINUED) | | December 31, 2006 | | |
| | | | | |
| Shares | | Value |
| Consumer Discretionary (continued) | | | |
| 1,250 | | Citadel Broadcasting Corp. | | $ | 12,450 |
| 400 | | CKE Restaurants, Inc. | | | 7,360 |
| 800 | | CKX, Inc.† | | | 9,384 |
| 700 | | Claire’s Stores, Inc. | | | 23,198 |
| 6,187 | | Clear Channel Communications, Inc. | | | 219,886 |
| 5,400 | | Coach, Inc.† | | | 231,984 |
| 1,000 | | Coachmen Industries, Inc. | | | 11,000 |
| 700 | | Cobra Electronics Corp. | | | 6,692 |
| 1,000 | | Coldwater Creek, Inc.† | | | 24,520 |
| 200 | | Collectors Universe | | | 2,680 |
| 25,872 | | Comcast Corp., Class A†(a) | | | 1,095,162 |
| 900 | | Comstock Homebuilding Cos., Inc., Class A† | | | 5,175 |
| 1,000 | | Cooper Tire & Rubber Co.(a) | | | 14,300 |
| 550 | | Corinthian Colleges, Inc.† | | | 7,496 |
| 700 | | Cox Radio, Inc., Class A† | | | 11,410 |
| 2,800 | | Crown Media Holdings, Inc., Class A† | | | 10,164 |
| 650 | | CSK Auto Corp.† | | | 11,148 |
| 1,200 | | Cumulus Media, Inc., Class A† | | | 12,468 |
| 350 | | Dana Corp.† | | | 486 |
| 900 | | Darden Restaurants, Inc. | | | 36,153 |
| 200 | | Design Within Reach, Inc.† | | | 986 |
| 250 | | DeVry, Inc. | | | 7,000 |
| 600 | | Dillard’s, Inc., Class A(a) | | | 20,982 |
| 800 | | Directed Electronics, Inc.† | | | 9,160 |
| 9,752 | | DIRECTV Group, Inc. (The)†(a) | | | 243,215 |
| 3,300 | | Discovery Holding Co., Class A† | | | 53,097 |
| 200 | | Dixie Group, Inc.† | | | 2,528 |
| 3,631 | | Dollar General Corp. | | | 58,314 |
| 1,050 | | Dollar Tree Stores, Inc.† | | | 31,605 |
| 1,350 | | Domino’s Pizza, Inc. | | | 37,800 |
| 1,050 | | Dover Downs Gaming & Entertainment, Inc. | | | 14,038 |
| 300 | | Dow Jones & Co., Inc. | | | 11,400 |
| 2,923 | | DR Horton, Inc. | | | 77,430 |
| 200 | | Dreamworks Animation SKG, Inc., Class A† | | | 5,898 |
| 1,000 | | DSW, Inc., Class A†(a) | | | 38,570 |
| 200 | | Dura Automotive Systems, Inc., Class A† | | | 98 |
| 3,400 | | Eastman Kodak Co.(a) | | | 87,720 |
| 2,800 | | EchoStar Communications Corp., Class A†(a) | | | 106,484 |
| 1,000 | | Educate, Inc.† | | | 7,120 |
| 1,219 | | Emmis Communications Corp., Class A | | | 10,045 |
| 1,200 | | Empire Resorts, Inc.† | | | 10,404 |
| 600 | | Entravision Communications Corp., Class A† | | | 4,932 |
| 2,000 | | Escala Group, Inc.†(a) | | | 15,380 |
| 700 | | Everlast Worldwide, Inc.† | | | 11,900 |
| 2,550 | | EW Scripps Co., Class A | | | 127,347 |
| 200 | | Exide Technologies† | | | 870 |
| 3,890 | | Expedia, Inc.† | | | 81,613 |
| 2,300 | | Family Dollar Stores, Inc.(a) | | | 67,459 |
| 200 | | Famous Dave’s Of America, Inc.† | | | 3,294 |
| 7,598 | | Federated Department Stores, Inc.(a) | | | 289,712 |
| 700 | | Finish Line (The), Class A | | | 9,996 |
| 700 | | Fleetwood Enterprises, Inc.† | | | 5,537 |
| 1,600 | | Foot Locker, Inc. | | | 35,088 |
| 24,885 | | Ford Motor Co.(a) | | | 186,886 |
| 2,200 | | Fortune Brands, Inc. | | | 187,858 |
| 400 | | Forward Industries, Inc.† | | | 1,676 |
| 1,500 | | Fossil, Inc.† | | | 33,870 |
| 800 | | Fred’s, Inc. | | | 9,632 |
| 200 | | FTD Group, Inc.† | | | 3,578 |
| 1,100 | | Furniture Brands International, Inc.(a) | | | 17,853 |
| 700 | | Gaiam, Inc., Class A† | | | 9,576 |
| 400 | | GameStop Corp., Class A†(a) | | | 22,044 |
See Notes to Financial Statements.
50
| | | | |
WILSHIRE MUTUAL FUNDS, INC. SMALL COMPANY VALUE PORTFOLIO SCHEDULE OF INVESTMENTS - (CONTINUED) | | December 31, 2006 | | |
| | | | | |
| Shares | | Value |
| Consumer Discretionary (continued) | | | |
| 1,000 | | Gaming Partners International Corp. | | $ | 17,990 |
| 4,000 | | Gannett Co., Inc.(a) | | | 241,840 |
| 7,050 | | Gap, Inc. (The) | | | 137,475 |
| 2,100 | | Garmin, Ltd.(a) | | | 116,886 |
| 200 | | Gaylord Entertainment Co.† | | | 10,186 |
| 100 | | Gemstar-TV Guide International, Inc.† | | | 401 |
| 5,320 | | General Motors Corp.(a) | | | 163,430 |
| 2,060 | | Gentex Corp. | | | 32,054 |
| 2,400 | | Genuine Parts Co.(a) | | | 113,832 |
| 800 | | Getty Images, Inc.† | | | 34,256 |
| 1,850 | | Goodyear Tire & Rubber Co. (The)† | | | 38,832 |
| 100 | | GSI Commerce, Inc.† | | | 1,875 |
| 200 | | Guitar Center, Inc.† | | | 9,092 |
| 3,260 | | H&R Block, Inc.(a) | | | 75,110 |
| 100 | | Handleman Co.(a) | | | 677 |
| 996 | | Hanesbrands, Inc.† | | | 23,526 |
| 3,050 | | Harley-Davidson, Inc. | | | 214,934 |
| 1,200 | | Harman International Industries, Inc. | | | 119,892 |
| 2,457 | | Harrah’s Entertainment, Inc. | | | 203,243 |
| 200 | | Harte-Hanks, Inc. | | | 5,542 |
| 2,050 | | Hasbro, Inc. | | | 55,862 |
| 1,000 | | Hearst-Argyle Television, Inc. | | | 25,500 |
| 1,000 | | Helen of Troy, Ltd.† | | | 24,260 |
| 200 | | Hibbett Sporting Goods, Inc.† | | | 6,106 |
| 5,215 | | Hilton Hotels Corp. | | | 182,004 |
| 27,500 | | Home Depot, Inc. | | | 1,104,400 |
| 700 | | Hooker Furniture Corp. | | | 10,976 |
| 700 | | Hot Topic, Inc.† | | | 9,338 |
| 1,900 | | Hovnanian Enterprises, Inc., Class A†(a) | | | 64,410 |
| 3,090 | | IAC/InterActiveCorp.†(a) | | | 114,826 |
| 2,024 | | Idearc, Inc.† | | | 57,988 |
| 200 | | Infosonics Corp.†(a) | | | 982 |
| 1,100 | | Interface, Inc., Class A† | | | 15,642 |
| 4,650 | | International Game Technology | | | 214,830 |
| 212 | | International Speedway Corp., Class A | | | 10,820 |
| 4,642 | | Interpublic Group of Cos., Inc.† | | | 56,818 |
| 1,000 | | Isle of Capri Casinos, Inc.† | | | 26,580 |
| 1,000 | | J Crew Group, Inc.† | | | 38,550 |
| 2,867 | | J.C. Penney Co., Inc.(a) | | | 221,791 |
| 300 | | Jarden Corp.†(a) | | | 10,437 |
| 2,600 | | Johnson Controls, Inc. | | | 223,392 |
| 1,878 | | Jones Apparel Group, Inc. | | | 62,782 |
| 1,000 | | Journal Communications, Inc., Class A | | | 12,610 |
| 1,300 | | Journal Register Co. | | | 9,490 |
| 717 | | K2, Inc.† | | | 9,457 |
| 500 | | KB Home(a) | | | 25,640 |
| 200 | | Kenneth Cole Productions, Inc., Class A | | | 4,798 |
| 300 | | Keystone Automotive Industries, Inc.† | | | 10,197 |
| 1,000 | | Kimball International, Inc., Class B | | | 24,300 |
| 4,800 | | Kohl’s Corp.†(a) | | | 328,464 |
| 100 | | Krispy Kreme Doughnuts, Inc.† | | | 1,110 |
| 800 | | Lakes Entertainment, Inc.† | | | 8,632 |
| 1,700 | | Lamar Advertising Co., Class A† | | | 111,163 |
| 2,000 | | Las Vegas Sands Corp.†(a) | | | 178,960 |
| 1,300 | | Laureate Education, Inc.†(a) | | | 63,219 |
| 1,100 | | La-Z-Boy, Inc.(a) | | | 13,057 |
| 400 | | Leapfrog Enterprises, Inc.† | | | 3,792 |
| 250 | | Lear Corp. | | | 7,382 |
| 50 | | Lee Enterprises, Inc. | | | 1,553 |
| 2,660 | | Leggett & Platt, Inc. | | | 63,574 |
| 1,800 | | Lennar Corp., Class A. | | | 94,428 |
| 200 | | Lenox Group, Inc.† | | | 1,280 |
See Notes to Financial Statements.
51
| | | | |
WILSHIRE MUTUAL FUNDS, INC. DOW JONES WILSHIRE 5000 INDEX PORTFOLIO SCHEDULE OF INVESTMENTS - (CONTINUED) | | December 31, 2006 | | |
| | | | | |
| Shares | | Value |
| Consumer Discretionary (continued) | | | |
| 5,601 | | Liberty Global, Inc., Class A† | | $ | 163,269 |
| 1,810 | | Liberty Media Holding Corp., Capital Series A† | | | 177,344 |
| 9,150 | | Liberty Media Holding Corp., Interactive A† | | | 197,366 |
| 4,615 | | Limited Brands, Inc. | | | 133,558 |
| 1,100 | | Lin TV Corp., Class A† | | | 10,945 |
| 800 | | Lincoln Educational Services Corp.† | | | 10,792 |
| 398 | | Live Nation, Inc.† | | | 8,915 |
| 1,700 | | Liz Claiborne, Inc. | | | 73,882 |
| 1,500 | | LKQ Corp.† | | | 34,485 |
| 20,806 | | Lowe’s Cos., Inc.(a) | | | 648,107 |
| 1,100 | | Marine Products Corp. | | | 12,914 |
| 5,300 | | Marriott International, Inc., Class A(a) | | | 252,916 |
| 400 | | Marvel Entertainment, Inc.† | | | 10,764 |
| 4,430 | | Mattel, Inc. | | | 100,384 |
| 250 | | Matthews International Corp., Class A | | | 9,838 |
| 546 | | McClatchy Co., Class A | | | 23,642 |
| 16,350 | | McDonald’s Corp. | | | 724,796 |
| 5,250 | | McGraw-Hill Cos., Inc. (The) | | | 357,105 |
| 271 | | MDC Holdings, Inc. | | | 15,461 |
| 767 | | Mediacom Communications Corp., Class A† | | | 6,167 |
| 429 | | Men’s Wearhouse, Inc. (The)(a) | | | 16,414 |
| 1,900 | | MGM Mirage† | | | 108,965 |
| 477 | | Mohawk Industries, Inc.†(a) | | | 35,708 |
| 100 | | Monarch Casino & Resort, Inc.† | | | 2,388 |
| 800 | | Morton’s Restaurant Group, Inc.† | | | 13,320 |
| 200 | | Movado Group, Inc. | | | 5,800 |
| 50 | | Nautilus, Inc. | | | 700 |
| 100 | | Navarre Corp.† | | | 398 |
| 800 | | Netflix, Inc.†(a) | | | 20,688 |
| 900 | | New York & Co., Inc.† | | | 11,772 |
| 1,600 | | New York Times Co., Class A(a) | | | 38,976 |
| 3,126 | | Newell Rubbermaid, Inc. | | | 90,498 |
| 30,538 | | News Corp., Class A | | | 655,956 |
| 2,500 | | Nike, Inc., Class B(a) | | | 247,575 |
| 800 | | Nitches, Inc.† | | | 5,024 |
| 100 | | Noble International, Ltd. | | | 2,005 |
| 3,200 | | Nordstrom, Inc.(a) | | | 157,888 |
| 4,200 | | NTL, Inc. | | | 106,008 |
| 700 | | Oakley, Inc. | | | 14,042 |
| 4,400 | | Office Depot, Inc.†(a) | | | 167,948 |
| 400 | | OfficeMax, Inc. | | | 19,860 |
| 2,800 | | Omnicom Group, Inc. | | | 292,712 |
| 1,900 | | O’Reilly Automotive, Inc.†(a) | | | 60,914 |
| 1,050 | | Orleans Homebuilders, Inc. | | | 19,740 |
| 800 | | OSI Restaurant Partners, Inc. | | | 31,360 |
| 1,000 | | Outdoor Channel Holdings, Inc.† | | | 12,830 |
| 700 | | Pacific Sunwear of California, Inc.† | | | 13,706 |
| 1,000 | | Palm Harbor Homes, Inc.† | | | 14,020 |
| 1,000 | | Papa John’s International, Inc.† | | | 29,010 |
| 550 | | Payless Shoesource, Inc.† | | | 18,051 |
| 1,200 | | PC Mall, Inc.† | | | 12,648 |
| 800 | | Penn National Gaming, Inc.†(a) | | | 33,296 |
| 700 | | PEP Boys-Manny Moe & Jack | | | 10,402 |
| 200 | | Perry Ellis International, Inc.† | | | 8,200 |
| 2,000 | | PetSmart, Inc. | | | 57,720 |
| 1,400 | | Phillips-Van Heusen | | | 70,238 |
| 1,900 | | Pier 1 Imports, Inc. | | | 11,305 |
| 500 | | Pinnacle Entertainment, Inc.† | | | 16,570 |
See Notes to Financial Statements.
52
| | | | |
WILSHIRE MUTUAL FUNDS, INC. DOW JONES WILSHIRE 5000 INDEX PORTFOLIO SCHEDULE OF INVESTMENTS - (CONTINUED) | | December 31, 2006 | | |
| | | | | |
| Shares | | Value |
| Consumer Discretionary (continued) | | | |
| 1,000 | | Playboy Enterprises, Inc., Class B† | | $ | 11,460 |
| 800 | | Polaris Industries, Inc.(a) | | | 37,464 |
| 1,100 | | Polo Ralph Lauren Corp.(a) | | | 85,426 |
| 1,000 | | Pool Corp. | | | 39,170 |
| 100 | | Princeton Review, Inc.† | | | 528 |
| 94 | | Proliance International, Inc.† | | | 432 |
| 2,900 | | Pulte Homes, Inc. | | | 96,048 |
| 900 | | Quiksilver, Inc.†(a) | | | 14,175 |
| 1,741 | | R.H. Donnelley Corp.† | | | 109,213 |
| 1,050 | | Radio One, Inc., Class A† | | | 7,066 |
| 1,650 | | RadioShack Corp. | | | 27,687 |
| 1,900 | | Rare Hospitality International, Inc.† | | | 62,567 |
| 3,000 | | Reader’s Digest Association, Inc. (The) | | | 50,100 |
| 1,500 | | Regal Entertainment Group, Class A(a) | | | 31,980 |
| 200 | | Regis Corp. | | | 7,908 |
| 450 | | Rent-A-Center, Inc.† | | | 13,280 |
| 1,000 | | Retail Ventures, Inc.† | | | 19,040 |
| 500 | | Riviera Holdings Corp.† | | | 12,080 |
| 200 | | Rocky Brands, Inc.† | | | 3,224 |
| 2,100 | | Ross Stores, Inc. | | | 61,530 |
| 1,000 | | Royal Caribbean Cruises, Ltd.(a) | | | 41,380 |
| 2,150 | | Ruby Tuesday, Inc. | | | 58,996 |
| 200 | | Russ Berrie & Co., Inc.† | | | 3,090 |
| 1,100 | | Saks, Inc.(a) | | | 19,602 |
| 600 | | Salem Communications Corp., Class A | | | 7,170 |
| 850 | | Sally Beauty Holdings, Inc.† | | | 6,630 |
| 200 | | Sands Regent† | | | 2,992 |
| 500 | | Sauer-Danfoss, Inc. | | | 16,125 |
| 600 | | Scientific Games Corp., Class A†(a) | | | 18,138 |
| 800 | | Sealy Corp. | | | 11,800 |
| 1,800 | | Sears Holdings Corp.† | | | 302,274 |
| 488 | | Select Comfort Corp.† | | | 8,486 |
| 3,600 | | Service Corp. International | | | 36,900 |
| 3,300 | | ServiceMaster Co. (The) | | | 43,263 |
| 1,000 | | Sharper Image Corp.† | | | 9,250 |
| 1,700 | | Sherwin-Williams Co. (The) | | | 108,086 |
| 400 | | Shoe Carnival, Inc.† | | | 12,640 |
| 1,000 | | Sinclair Broadcast Group, Inc., Class A | | | 10,500 |
| 13,950 | | Sirius Satellite Radio, Inc.†(a) | | | 49,383 |
| 2,100 | | Six Flags, Inc.†(a) | | | 11,004 |
| 200 | | Skechers U.S.A., Inc., Class A† | | | 6,662 |
| 1,500 | | Snap-On, Inc. | | | 71,460 |
| 800 | | Sonic Corp.† | | | 19,160 |
| 153 | | Sotheby’s(a) | | | 4,746 |
| 800 | | Source Interlink Cos., Inc.† | | | 6,528 |
| 2,800 | | Spanish Broadcasting System, Class A† | | | 11,508 |
| 400 | | Speedway Motorsports, Inc. | | | 15,360 |
| 950 | | Standard-Pacific Corp.(a) | | | 25,450 |
| 200 | | Stanley Furniture Co., Inc | | | 4,290 |
| 1,600 | | Stanley Works (The) | | | 80,464 |
| 8,750 | | Staples, Inc. | | | 233,625 |
| 10,350 | | Starbucks Corp.† | | | 366,597 |
| 3,073 | | Starwood Hotels & Resorts Worldwide, Inc. | | | 192,062 |
| 1,300 | | Station Casinos, Inc. | | | 106,171 |
| 550 | | Steak N Shake Co. (The)† | | | 9,680 |
| 100 | | Steinway Musical Instruments† | | | 3,105 |
| 200 | | Stewart Enterprises, Inc., Class A | | | 1,250 |
| 1,800 | | Strayer Education, Inc. | | | 190,890 |
| 200 | | Stride Rite Corp. | | | 3,016 |
| 1,000 | | Sun-Times Media Group, Inc., Class A | | | 4,910 |
| 100 | | Superior Industries International(a) | | | 1,927 |
| 1,000 | | Systemax, Inc.† | | | 17,450 |
See Notes to Financial Statements.
53
| | | | |
WILSHIRE MUTUAL FUNDS, INC. DOW JONES WILSHIRE 5000 INDEX PORTFOLIO SCHEDULE OF INVESTMENTS - (CONTINUED) | | December 31, 2006 | | |
| | | | | |
Shares | | Value |
Consumer Discretionary (continued) | | | |
1,000 | | Talbots, Inc.(a) | | $ | 24,100 |
10,750 | | Target Corp. | | | 613,288 |
1,129 | | Tarragon Corp.(a) | | | 13,740 |
1,037 | | Technical Olympic USA, Inc.(a) | | | 10,546 |
1,800 | | Tempur-Pedic International, Inc.† | | | 36,828 |
700 | | Tenneco, Inc.† | | | 17,304 |
800 | | Texas Roadhouse, Inc., Class A† | | | 10,608 |
2,000 | | Tiffany & Co. | | | 78,480 |
400 | | Timberland Co., Class A† | | | 12,632 |
52,574 | | Time Warner, Inc. | | | 1,145,062 |
1,000 | | Tivo, Inc.† | | | 5,120 |
6,050 | | TJX Cos., Inc. | | | 172,546 |
900 | | Toll Brothers, Inc.† | | | 29,007 |
300 | | Trans World Entertainment Corp.† | | | 1,974 |
1,801 | | Tribune Co.(a) | | | 55,435 |
50 | | Triple Crown Media, Inc.† | | | 387 |
800 | | Tuesday Morning Corp. | | | 12,440 |
1,100 | | Tupperware Brands Corp. | | | 24,871 |
1,000 | | Unifirst Corp. | | | 38,410 |
200 | | Universal Electronics, Inc.† | | | 4,204 |
250 | | Universal Technical Institute, Inc.† | | | 5,552 |
3,265 | | Univision Communications, Inc., Class A† | | | 115,646 |
1,000 | | Urban Outfitters, Inc.† | | | 23,030 |
1,000 | | Valassis Communications, Inc.† | | | 14,500 |
200 | | Value Line, Inc. | | | 9,090 |
600 | | Valuevision Media, Inc., Class A† | | | 7,884 |
1,800 | | VF Corp. | | | 147,744 |
8,662 | | Viacom, Inc., Class B† | | | 355,402 |
1,650 | | Visteon Corp.† | | | 13,992 |
50 | | Volcom, Inc.† | | | 1,478 |
26,470 | | Walt Disney Co. (The) | | | 907,127 |
100 | | Warnaco Group, Inc. (The)† | | | 2,538 |
1,400 | | Warner Music Group Corp. | | | 32,130 |
446 | | Weight Watchers International, Inc. | | | 23,428 |
1,900 | | Wendy’s International, Inc. | | | 62,871 |
700 | | Westwood One, Inc. | | | 4,942 |
1,347 | | Whirlpool Corp.(a). | | | 111,828 |
300 | | Wiley (John) & Sons, Inc., Class A | | | 11,541 |
900 | | Williams-Sonoma, Inc.(a) | | | 28,296 |
400 | | Wolverine World Wide, Inc. | | | 11,408 |
1,000 | | World Wrestling Entertainment, Inc., Class A | | | 16,300 |
600 | | WorldSpace, Inc., Class A† | | | 2,100 |
1,100 | | WPT Enterprises, Inc.† | | | 4,246 |
2,485 | | Wyndham Worldwide Corp.† | | | 79,570 |
1,600 | | Wynn Resorts, Ltd.(a) | | | 150,160 |
800 | | Xerium Technologies, Inc. | | | 7,832 |
4,600 | | XM Satellite Radio Holdings, Inc., Class A† | | | 66,470 |
550 | | Yankee Candle Co., Inc. | | | 18,854 |
200 | | Young Broadcasting, Inc., Class A† | | | 564 |
3,000 | | Yum! Brands, Inc. | | | 176,400 |
400 | | Zale Corp.†(a) | | | 11,283 |
1,000 | | Zumiez, Inc.† | | | 29,540 |
| | | | | |
| | | | | 24,733,664 |
| | | | | |
| |
Consumer Staples — 8.0% | | | |
1,850 | | Alberto-Culver Co. | | | 39,682 |
200 | | Alico, Inc. | | | 10,126 |
200 | | Alliance One International, Inc.† | | | 1,412 |
27,450 | | Altria Group, Inc. | | | 2,355,759 |
9,800 | | Anheuser-Busch Cos., Inc. | | | 482,160 |
8,361 | | Archer-Daniels-Midland Co. | | | 267,218 |
5,450 | | Avon Products, Inc.(a) | | | 180,068 |
600 | | BJ’s Wholesale Club, Inc.† | | | 18,666 |
600 | | Brown-Forman Corp., Class B | | | 39,744 |
See Notes to Financial Statements.
54
| | | | |
WILSHIRE MUTUAL FUNDS, INC. DOW JONES WILSHIRE 5000 INDEX PORTFOLIO SCHEDULE OF INVESTMENTS - (CONTINUED) | | December 31, 2006 | | |
| | | | | |
Shares | | Value |
Consumer Staples (continued) | | | |
1,700 | | Bunge, Ltd.(a) | | $ | 123,267 |
3,400 | | Campbell Soup Co.(a) | | | 132,226 |
1,000 | | Casey’s General Stores, Inc. | | | 23,550 |
800 | | Chiquita Brands International, Inc. | | | 12,776 |
800 | | Church & Dwight Co, Inc. | | | 34,120 |
1,900 | | Clorox Co. | | | 121,885 |
28,520 | | Coca-Cola Co. (The)(a) | | | 1,376,090 |
3,020 | | Coca-Cola Enterprises, Inc. | | | 61,668 |
7,280 | | Colgate-Palmolive Co. | | | 474,947 |
6,873 | | ConAgra Foods, Inc. | | | 185,571 |
2,150 | | Constellation Brands, Inc., Class A†(a) | | | 62,393 |
600 | | Corn Products International, Inc. | | | 20,724 |
5,650 | | Costco Wholesale Corp. | | | 298,716 |
10,230 | | CVS Corp. | | | 316,209 |
1,984 | | Dean Foods Co.† | | | 83,884 |
2,005 | | Del Monte Foods Co. | | | 22,115 |
700 | | Elizabeth Arden, Inc.† | | | 13,335 |
1,333 | | Energizer Holdings, Inc.† | | | 94,630 |
1,900 | | Estee Lauder Cos., Inc.(The), Class A(a) | | | 77,558 |
1,000 | | Flowers Foods, Inc.(a) | | | 26,990 |
4,550 | | General Mills, Inc. | | | 262,080 |
1,000 | | Gold Kist, Inc.† | | | 21,020 |
300 | | Great Atlantic & Pacific Tea Co. | | | 7,722 |
1,000 | | Hansen Natural Corp.† | | | 33,680 |
2,400 | | Hershey Co. (The) | | | 119,520 |
3,400 | | HJ Heinz Co. | | | 153,034 |
900 | | Hormel Foods Corp. | | | 33,606 |
700 | | Inter Parfums, Inc. | | | 13,433 |
1,500 | | J.M. Smucker Co. (The) | | | 72,705 |
3,200 | | Kellogg Co. | | | 160,192 |
6,624 | | Kimberly-Clark Corp. | | | 450,101 |
3,300 | | Kraft Foods, Inc., Class A(a) | | | 117,810 |
9,000 | | Kroger Co. (The) | | | 207,630 |
1,550 | | Loews Corp. - Carolina Group | | | 100,316 |
1,800 | | McCormick & Co., Inc. | | | 69,408 |
1,400 | | Molson Coors Brewing Co., Class B | | | 107,016 |
1,000 | | National Beverage Corp.(a) | | | 14,030 |
200 | | Natural Health Trends Corp.† | | | 300 |
2,100 | | NBTY, Inc.† | | | 87,297 |
500 | | Nu Skin Enterprises, Inc., Class A | | | 9,115 |
2,120 | | Pepsi Bottling Group, Inc. | | | 65,529 |
1,600 | | PepsiAmericas, Inc. | | | 33,568 |
21,790 | | PepsiCo, Inc.(a) | | | 1,362,964 |
1,350 | | Pilgrim’s Pride Corp. | | | 39,731 |
700 | | Playtex Products, Inc.† | | | 10,073 |
1,000 | | PriceSmart, Inc.† | | | 17,910 |
43,302 | | Procter & Gamble Co. | | | 2,783,020 |
700 | | Reliv International, Inc. | | | 6,076 |
2,864 | | Reynolds American, Inc.(a) | | | 187,506 |
67 | | Rocky Mountain Chocolate Factory, Inc. | | | 980 |
5,550 | | Safeway, Inc.(a) | | | 191,808 |
9,570 | | Sara Lee Corp. | | | 162,977 |
700 | | Smart & Final, Inc.† | | | 13,230 |
800 | | Smithfield Foods, Inc.† | | | 20,528 |
600 | | Spartan Stores, Inc. | | | 12,558 |
800 | | Spectrum Brands, Inc.† | | | 8,720 |
2,211 | | Supervalu, Inc.(a) | | | 79,043 |
8,150 | | Sysco Corp. | | | 299,594 |
2,905 | | Tyson Foods, Inc., Class A | | | 47,787 |
1,500 | | USANA Health Sciences, Inc.† | | | 77,490 |
3,400 | | UST, Inc. | | | 197,880 |
550 | | Vector Group, Ltd.(a) | | | 9,763 |
13,050 | | Walgreen Co.(a) | | | 598,864 |
34,220 | | Wal-Mart Stores, Inc. | | | 1,580,280 |
See Notes to Financial Statements.
55
| | | | |
WILSHIRE MUTUAL FUNDS, INC. DOW JONES WILSHIRE 5000 INDEX PORTFOLIO SCHEDULE OF INVESTMENTS - (CONTINUED) | | December 31, 2006 | | |
| | | | | |
| Shares | | Value |
| |
| Consumer Staples (continued) | | | |
| 100 | | Weis Markets, Inc. | | $ | 4,011 |
| 1,900 | | Whole Foods Market, Inc.(a) | | | 89,167 |
| 3,000 | | Wm. Wrigley Jr. Co.(a) | | | 155,160 |
| | | | | |
| | | | | 17,053,721 |
| | | | | |
| |
| Energy — 9.1% | | | |
| 1,200 | | Able Energy†(a) | | | 2,784 |
| 400 | | Alon USA Energy, Inc. | | | 10,524 |
| 5,756 | | Anadarko Petroleum Corp. | | | 250,501 |
| 4,956 | | Apache Corp. | | | 329,624 |
| 3,100 | | Arch Coal, Inc.(a) | | | 93,093 |
| 1,000 | | Aventine Renewable Energy Holdings, Inc.† | | | 23,560 |
| 5,000 | | Baker Hughes, Inc. | | | 373,300 |
| 600 | | Barnwell Industries, Inc. | | | 14,370 |
| 1,000 | | Basic Energy Services, Inc.† | | | 24,650 |
| 300 | | Berry Petroleum Co., Class A | | | 9,303 |
| 4,472 | | BJ Services Co.(a) | | | 131,119 |
| 700 | | Boardwalk Pipeline Partners LP(a) | | | 21,574 |
| 550 | | Bois d’Arc Energy, Inc.† | | | 8,046 |
| 700 | | Bolt Technology Corp.† | | | 15,610 |
| 400 | | BP Prudhoe Bay Royalty Trust | | | 30,792 |
| 1,000 | | Brigham Exploration Co.† | | | 7,310 |
| 1,000 | | Bristow Group, Inc.† | | | 36,090 |
| 250 | | Cabot Oil & Gas Corp. | | | 15,162 |
| 1,000 | | Callon Petroleum Co.† | | | 15,030 |
| 1,700 | | Cameron International Corp.†(a) | | | 90,185 |
| 1,000 | | CARBO Ceramics, Inc. | | | 37,370 |
| 950 | | Cheniere Energy, Inc.†(a) | | | 27,427 |
| 4,950 | | Chesapeake Energy Corp.(a) | | | 143,798 |
| 29,299 | | Chevron Corp. | | | 2,154,355 |
| 1,647 | | Cimarex Energy Co. | | | 60,116 |
| 700 | | Comstock Resources, Inc.† | | | 21,742 |
| 21,351 | | ConocoPhillips | | | 1,536,204 |
| 2,500 | | CONSOL Energy, Inc.† | | | 80,325 |
| 200 | | Copano Energy LLC | | | 11,930 |
| 200 | | Cross Timbers Royalty Trust | | | 10,122 |
| 1,500 | | Delta Petroleum Corp.†(a) | | | 34,740 |
| 1,200 | | Denbury Resources, Inc.†. | | | 33,348 |
| 6,536 | | Devon Energy Corp. | | | 438,435 |
| 1,500 | | Diamond Offshore Drilling, Inc.(a) | | | 119,910 |
| 600 | | Double Hull Tankers, Inc. | | | 9,714 |
| 700 | | Dresser-Rand Group, Inc.†(a) | | | 17,129 |
| 9,214 | | El Paso Corp. | | | 140,790 |
| 1 | | Enbridge Energy Management, LLC† | | | 29 |
| 450 | | Encore Acquisition Co.† | | | 11,038 |
| 2,150 | | ENSCO International, Inc.(a) | | | 107,629 |
| 1,000 | | Enterprise GP Holdings LP | | | 36,970 |
| 4,000 | | EOG Resources, Inc. | | | 249,800 |
| 1,300 | | Evergreen Energy, Inc.†(a) | | | 12,857 |
| 800 | | EXCO Resources, Inc.† | | | 13,528 |
| 1,000 | | Exploration Co. of Delaware, Inc. (The)† | | | 13,340 |
| 65,550 | | Exxon Mobil Corp. | | | 5,023,096 |
| 1,539 | | FMC Technologies, Inc.† | | | 94,849 |
| 1,000 | | Forest Oil Corp.† | | | 32,680 |
| 750 | | Foundation Coal Holdings, Inc.(a) | | | 23,820 |
| 2,000 | | Frontier Oil Corp.(a) | | | 57,480 |
| 1,000 | | GeoMet, Inc.† | | | 10,400 |
| 1,800 | | GeoResources, Inc.† | | | 11,556 |
| 750 | | Global Industries, Ltd.† | | | 9,780 |
| 2,997 | | GlobalSantaFe Corp.(a) | | | 176,164 |
| 1,500 | | Goodrich Petroleum Corp.† | | | 54,270 |
| 1,800 | | Grant Prideco, Inc.†(a) | | | 71,586 |
| 4,000 | | Grey Wolf, Inc.† | | | 27,440 |
| 13,800 | | Halliburton Co.(a) | | | 428,490 |
| 850 | | Hanover Compressor Co.†(a) | | | 16,056 |
See Notes to Financial Statements.
56
| | | | |
WILSHIRE MUTUAL FUNDS, INC. DOW JONES WILSHIRE 5000 INDEX PORTFOLIO SCHEDULEOF INVESTMENTS - (CONTINUED) | | December 31, 2006 | | |
| | | | | |
| Shares | | | | Value |
| Energy (continued) | | | |
| 800 | | Harvest Natural Resources, Inc.† | | $ | 8,504 |
| 2,400 | | Helix Energy Solutions Group, Inc.† | | | 75,288 |
| 700 | | Helmerich & Payne, Inc. | | | 17,129 |
| 3,100 | | Hess Corp.(a) | | | 153,667 |
| 400 | | Holly Corp. | | | 20,560 |
| 470 | | Hugoton Royalty Trust | | | 11,562 |
| 750 | | Inergy Holdings LP | | | 30,000 |
| 900 | | Input/Output, Inc.† | | | 12,267 |
| 3,300 | | International Coal Group, Inc.† | | | 17,985 |
| 1,965 | | Kinder Morgan Management, LLC.† | | | 89,770 |
| 1,600 | | Kinder Morgan, Inc. | | | 169,200 |
| 1,100 | | Linn Energy LLC(a) | | | 35,145 |
| 250 | | Lone Star Technologies, Inc.† | | | 12,102 |
| 100 | | Magellan Midstream Holdings LP | | | 2,230 |
| 4,836 | | Marathon Oil Corp. | | | 447,330 |
| 363 | | Mariner Energy, Inc.† | | | 7,115 |
| 200 | | Martin Midstream Partners, LP | | | 6,648 |
| 2,450 | | Massey Energy Co.(a) | | | 56,914 |
| 1,000 | | Matrix Service Co.† | | | 16,100 |
| 600 | | McMoRan Exploration Co.†(a) | | | 8,532 |
| 2,300 | | Murphy Oil Corp.(a) | | | 116,955 |
| 3,900 | | Nabors Industries, Ltd.†(a) | | | 116,142 |
| 2,219 | | National Oilwell Varco, Inc.†(a) | | | 135,758 |
| 1,900 | | Newfield Exploration Co.†(a) | | | 87,305 |
| 1,400 | | Newpark Resources† | | | 10,094 |
| 2,060 | | Noble Corp. | | | 156,869 |
| 2,350 | | Noble Energy, Inc.(a) | | | 115,314 |
| 10,960 | | Occidental Petroleum Corp. | | | 535,177 |
| 400 | | Oceaneering International, Inc.† | | | 15,880 |
| 500 | | OMI Corp. | | | 10,585 |
| 700 | | Omni Energy Services Corp.† | | | 6,853 |
| 1,000 | | Pacific Ethanol, Inc.†(a) | | | 15,390 |
| 1,000 | | Parallel Petroleum Corp.† | | | 17,570 |
| 1,350 | | Parker Drilling Co.† | | | 11,030 |
| 1,350 | | Patterson-UTI Energy, Inc. | | | 31,360 |
| 4,350 | | Peabody Energy Corp. | | | 175,784 |
| 1,572 | | Petrohawk Energy Corp.† | | | 18,078 |
| 600 | | Petroquest Energy, Inc.† | | | 7,644 |
| 1,000 | | Pioneer Drilling Co.† | | | 13,280 |
| 2,100 | | Pioneer Natural Resources Co. | | | 83,349 |
| 2,500 | | Plains Exploration & Production Co.† | | | 118,825 |
| 1,500 | | Pogo Producing Co. | | | 72,660 |
| 2,750 | | Pride International, Inc.† | | | 82,528 |
| 1,500 | | Quicksilver Resources, Inc.†(a) | | | 54,885 |
| 3,075 | | Range Resources Corp.(a) | | | 84,440 |
| 2,700 | | Rowan Cos., Inc.(a) | | | 89,640 |
| 1,500 | | RPC, Inc. | | | 25,320 |
| 12,950 | | Schlumberger, Ltd. | | | 817,922 |
| 4,200 | | Smith International, Inc.(a) | | | 172,494 |
| 1,900 | | Southwestern Energy Co.†(a) | | | 66,595 |
| 250 | | St. Mary Land & Exploration Co.(a) | | | 9,210 |
| 1,900 | | SulphCo, Inc.†(a) | | | 8,968 |
| 1,940 | | Sunoco, Inc. | | | 120,978 |
| 850 | | Superior Energy Services, Inc.† | | | 27,778 |
| 1,000 | | Superior Well Services, Inc.† | | | 25,560 |
| 700 | | T-3 Energy Services, Inc.† | | | 15,435 |
| 1,350 | | Tesoro Corp.(a) | | | 88,790 |
| 2,300 | | Tetra Technologies, Inc.†(a) | | | 58,834 |
| 1,000 | | TGC Industries, Inc.† | | | 8,400 |
| 1,450 | | Tidewater, Inc.(a) | | | 70,122 |
See Notes to Financial Statements.
57
| | | | |
WILSHIRE MUTUAL FUNDS, INC. DOW JONES WILSHIRE 5000 INDEX PORTFOLIO SCHEDULE OF INVESTMENTS - (CONTINUED) | | December 31, 2006 | | |
| | | | | |
| Shares | | | | Value |
| Energy (continued) | | | |
| 400 | | Todco†(a) | | $ | 13,668 |
| 1,000 | | TransMontaigne Partners L.P. | | | 30,300 |
| 4,413 | | Transocean, Inc.† | | | 356,968 |
| 300 | | Trico Marine Services, Inc.† | | | 11,493 |
| 2,440 | | Ultra Petroleum Corp.† | | | 116,510 |
| 800 | | Union Drilling, Inc.† | | | 11,264 |
| 2,150 | | USEC, Inc.† | | | 27,348 |
| 1,000 | | Vaalco Energy, Inc.† | | | 6,750 |
| 8,464 | | Valero Energy Corp. | | | 433,018 |
| 1,000 | | VeraSun Energy Corp.†(a) | | | 19,750 |
| 700 | | Warren Resources, Inc.† | | | 8,204 |
| 5,050 | | Weatherford International, Ltd.† | | | 211,040 |
| 8,100 | | Williams Cos., Inc. | | | 211,572 |
| 5,288 | | XTO Energy, Inc. | | | 248,800 |
| | | | | |
| | | | | 19,467,474 |
| | | | | |
| |
| Financials — 22.7% | | | |
| 700 | | 21st Century Insurance Group | | | 12,355 |
| 1,000 | | ACA Capital Holdings, Inc.† | | | 15,460 |
| 250 | | Acadia Realty Trust | | | 6,255 |
| 4,400 | | ACE, Ltd. | | | 266,508 |
| 400 | | Advance America Cash Advance Centers, Inc. | | | 5,860 |
| 6,100 | | Aflac, Inc.(a) | | | 280,600 |
| 700 | | Alfa Corp. | | | 13,167 |
| 8,050 | | Allstate Corp. (The) | | | 524,136 |
| 1,700 | | AMB Property Corp. | | | 99,637 |
| 2,000 | | AMBAC Financial Group, Inc. | | | 178,140 |
| 400 | | Amcore Financial, Inc. | | | 13,068 |
| 1,000 | | American Campus Communities, Inc. | | | 28,470 |
| 700 | | American Equity Investment Life Holding Co. | | | 9,121 |
| 15,200 | | American Express Co. | | | 922,184 |
| 300 | | American Financial Group, Inc. | | | 10,773 |
| 1,250 | | American Financial Realty Trust | | | 14,300 |
| 300 | | American Home Mortgage Investment Corp. | | | 10,536 |
| 31,375 | | American International Group, Inc. | | | 2,248,332 |
| 300 | | American Physicians Capital, Inc.† | | | 12,012 |
| 50 | | AmericanWest Bancorp | | | 1,211 |
| 1,600 | | AmeriCredit Corp.† | | | 40,272 |
| 3,080 | | Ameriprise Financial, Inc. | | | 167,860 |
| 310 | | Anchor Bancorp Wisconsin, Inc. | | | 8,934 |
| 3,450 | | Annaly Capital Management, Inc.(a) | | | 47,990 |
| 100 | | Anworth Mortgage Asset Corp. | | | 951 |
| 4,450 | | AON Corp.(a) | | | 157,263 |
| 1,772 | | Apartment Investment & Management Co., Class A | | | 99,267 |
| 200 | | Arbor Realty Trust, Inc. | | | 6,018 |
| 200 | | Arch Capital Group, Ltd.† | | | 13,522 |
| 2,892 | | Archstone-Smith Trust | | | 168,343 |
| 900 | | Arthur J. Gallagher & Co. | | | 26,595 |
| 700 | | Ashford Hospitality Trust, Inc. | | | 8,715 |
| 400 | | Aspen Insurance Holdings, Ltd. | | | 10,544 |
| 700 | | Asset Acceptance Capital Corp.† | | | 11,774 |
| 1,804 | | Associated Banc-Corp. | | | 62,924 |
| 200 | | Associated Estates Realty Corp. | | | 2,748 |
| 1,700 | | Assurant, Inc. | | | 93,925 |
| 800 | | Assured Guaranty, Ltd. | | | 21,280 |
| 2,400 | | Astoria Financial Corp.(a) | | | 72,384 |
| 1,500 | | AvalonBay Communities, Inc. | | | 195,075 |
| 1,700 | | Axis Capital Holdings, Ltd. | | | 56,729 |
| 1,500 | | BancFirst Corp. | | | 81,000 |
| 550 | | BancorpSouth, Inc. | | | 14,751 |
See Notes to Financial Statements.
58
| | | | |
WILSHIRE MUTUAL FUNDS, INC. DOW JONES WILSHIRE 5000 INDEX PORTFOLIO SCHEDULE OF INVESTMENTS - (CONTINUED) | | December 31, 2006 | | |
| | | | | |
| Shares | | Value |
| Financials (continued) | | | |
| 750 | | Bank Mutual Corp. | | $ | 9,083 |
| 61,461 | | Bank of America Corp. | | | 3,281,403 |
| 350 | | Bank of Hawaii Corp. | | | 18,882 |
| 10,400 | | Bank of New York Co., Inc. (The) | | | 409,448 |
| 300 | | BankAtlantic Bancorp, Inc., Class A | | | 4,143 |
| 1,000 | | BankFinancial Corp. | | | 17,810 |
| 300 | | Banner Corp. | | | 13,302 |
| 2,205 | | Bear Stearns Cos., Inc. (The) | | | 358,930 |
| 308 | | Berkshire Hathaway, Inc., Class B†(a) | | | 1,129,128 |
| 2,200 | | BioMed Realty Trust, Inc. | | | 62,920 |
| 2,000 | | BKF Capital Group, Inc.†(a) | | | 6,700 |
| 2,000 | | Boston Properties, Inc. | | | 223,760 |
| 688 | | Brandywine Realty Trust | | | 22,876 |
| 1,200 | | BRE Properties, Inc., Class A | | | 78,024 |
| 800 | | Brookfield Properties Corp. | | | 31,464 |
| 506 | | Brookline Bancorp, Inc. | | | 6,664 |
| 1,200 | | Brown & Brown, Inc. | | | 33,852 |
| 100 | | Camden National Corp. | | | 4,612 |
| 1,500 | | Camden Property Trust | | | 110,775 |
| 350 | | Capital City Bank Group, Inc. | | | 12,355 |
| 5,150 | | Capital One Financial Corp. | | | 395,623 |
| 2,839 | | CapitalSource, Inc. | | | 77,533 |
| 100 | | Capitol Bancorp, Ltd. | | | 4,620 |
| 1,000 | | Capitol Federal Financial | | | 38,420 |
| 200 | | Capstead Mortgage Corp. | | | 1,660 |
| 1,000 | | Cardinal Financial Corp. | | | 10,250 |
| 288 | | Cathay General Bancorp(a) | | | 9,939 |
| 2,800 | | CB Richard Ellis Group, Inc., Class A† | | | 92,960 |
| 700 | | CBL & Associates Properties, Inc. | | | 30,345 |
| 800 | | Centennial Bank Holdings, Inc.† | | | 7,568 |
| 1,000 | | Center Financial Corp. | | | 23,970 |
| 12,764 | | Charles Schwab Corp. (The) | | | 246,856 |
| 300 | | Charter Financial Corp.(a) | | | 15,456 |
| 700 | | CharterMac | | | 15,029 |
| 1,000 | | Chemical Financial Corp. | | | 33,300 |
| 1,050 | | Chicago Mercantile Exchange Holdings, Inc., Class A(a) | | | 535,238 |
| 175 | | Chittenden Corp. | | | 5,371 |
| 5,750 | | Chubb Corp. | | | 304,232 |
| 2,394 | | Cincinnati Financial Corp. | | | 108,472 |
| 2,946 | | CIT Group, Inc. | | | 164,298 |
| 67,425 | | Citigroup, Inc. | | | 3,755,572 |
| 600 | | Citizens Banking Corp.(a) | | | 15,900 |
| 150 | | City Holding Co. | | | 6,134 |
| 1,314 | | City National Corp.(a) | | | 93,557 |
| 1,000 | | CNA Financial Corp.† | | | 40,320 |
| 1,000 | | CoBiz, Inc. | | | 22,040 |
| 400 | | Cohen & Steers, Inc. | | | 16,068 |
| 1,650 | | Colonial BancGroup, Inc. (The) | | | 42,471 |
| 329 | | Colonial Properties Trust | | | 15,424 |
| 276 | | Columbia Banking System, Inc. | | | 9,693 |
| 2,548 | | Comerica, Inc.(a) | | | 149,517 |
| 2,200 | | Commerce Bancorp, Inc. | | | 77,594 |
| 738 | | Commerce Bancshares, Inc. | | | 35,727 |
| 1,000 | | Commerce Group, Inc. | | | 29,750 |
| 463 | | Community Bancorp† | | | 13,978 |
| 550 | | Community Bank System, Inc. | | | 12,650 |
| 1,000 | | Community Banks, Inc. | | | 27,760 |
| 1,000 | | Community Trust Bancorp, Inc. | | | 41,530 |
| 1,950 | | Compass Bancshares, Inc.(a) | | | 116,318 |
| 1,600 | | Conseco, Inc.† | | | 31,968 |
| 250 | | Corporate Office Properties Trust(a) | | | 12,618 |
| 8,248 | | Countrywide Financial Corp.(a) | | | 350,128 |
See Notes to Financial Statements.
59
| | | | |
WILSHIRE MUTUAL FUNDS, INC. DOW JONES WILSHIRE 5000 INDEX PORTFOLIO SCHEDULEOF INVESTMENTS - (CONTINUED) | | December 31, 2006 | | |
| | | | | |
| Shares | | Value |
| |
| Financials (continued) | | | |
| 500 | | Cousins Properties, Inc. | | $ | 17,635 |
| 1,000 | | Credit Acceptance Corp.† | | | 33,330 |
| 600 | | Crescent Real Estate Equities Co. | | | 11,850 |
| 250 | | Cullen/Frost Bankers, Inc. | | | 13,955 |
| 550 | | CVB Financial Corp. | | | 7,953 |
| 800 | | Deerfield Triarc Capital Corp. | | | 13,544 |
| 322 | | Delphi Financial Group, Class A | | | 13,028 |
| 1,826 | | Developers Diversified Realty Corp. | | | 114,947 |
| 900 | | DiamondRock Hospitality Co. | | | 16,209 |
| 300 | | Digital Reality Trust, Inc. | | | 10,269 |
| 200 | | Dollar Financial Corp.† | | | 5,572 |
| 1,550 | | Doral Financial Corp. | | | 4,448 |
| 1,000 | | Douglas Emmett, Inc. | | | 26,590 |
| 2,076 | | Duke Realty Corp. | | | 84,908 |
| 5,037 | | E*Trade Financial Corp.†(a) | | | 112,930 |
| 650 | | East West Bancorp, Inc. | | | 23,023 |
| 250 | | EastGroup Properties, Inc. | | | 13,390 |
| 1,000 | | Eaton Vance Corp. | | | 33,010 |
| 1,600 | | Edwards (A.G.), Inc. | | | 101,264 |
| 1,000 | | Endurance Specialty Holdings, Ltd. | | | 36,580 |
| 500 | | Equity Inns, Inc. | | | 7,980 |
| 4,745 | | Equity Office Properties Trust | | | 228,567 |
| 4,354 | | Equity Residential(a) | | | 220,966 |
| 1,500 | | Erie Indemnity Co., Class A | | | 86,970 |
| 1,300 | | Everest Re Group, Ltd. | | | 127,543 |
| 500 | | Extra Space Storage, Inc. | | | 9,130 |
| 12,700 | | Fannie Mae | | | 754,253 |
| 300 | | FBL Financial Group, Inc., Class A | | | 11,724 |
| 1,200 | | Federal Realty Investment Trust | | | 102,000 |
| 700 | | Federated Investors, Inc., Class B | | | 23,646 |
| 1,550 | | FelCor Lodging Trust, Inc. | | | 33,852 |
| 2,100 | | FFD Financial Corp. | | | 36,771 |
| 2,966 | | Fidelity National Financial, Inc., Class A | | | 70,828 |
| 700 | | Fieldstone Investment Corp. | | | 3,066 |
| 5,685 | | Fifth Third Bancorp(a) | | | 232,687 |
| 1,000 | | Financial Federal Corp. | | | 29,410 |
| 1,000 | | Financial Institutions, Inc. | | | 23,050 |
| 700 | | First Acceptance Corp.† | | | 7,504 |
| 967 | | First American Corp. | | | 39,338 |
| 750 | | First BanCorp. | | | 7,148 |
| 300 | | First Cash Financial Services, Inc.† | | | 7,761 |
| 1,000 | | First Charter Corp. | | | 24,600 |
| 700 | | First Commonwealth Financial Corp. | | | 9,401 |
| 250 | | First Financial Bancorp. | | | 4,152 |
| 1,500 | | First Financial Bankshares, Inc. | | | 62,790 |
| 100 | | First Financial Corp. | | | 3,545 |
| 1,600 | | First Horizon National Corp.(a) | | | 66,848 |
| 800 | | First Industrial Realty Trust, Inc. | | | 37,512 |
| 1,500 | | First Marblehead Corp. (The)(a) | | | 81,975 |
| 900 | | First Midwest Bancorp, Inc. | | | 34,812 |
| 758 | | First Niagara Financial Group, Inc. | | | 11,264 |
| 1,100 | | First Potomac Realty Trust | | | 32,021 |
| 1,000 | | First State Bancorp. | | | 24,750 |
| 400 | | FirstMerit Corp. | | | 9,656 |
| 700 | | Flagstar Bancorp, Inc. | | | 10,388 |
| 1,000 | | FNB Corp. | | | 18,270 |
| 1,500 | | Forest City Enterprises, Class A | | | 87,600 |
| 400 | | Franklin Bank Corp.† | | | 8,216 |
| 2,400 | | Franklin Resources, Inc. | | | 264,408 |
| 700 | | Franklin Street Properties Corp. | | | 14,735 |
See Notes to Financial Statements.
60
| | | | |
WILSHIRE MUTUAL FUNDS, INC. DOW JONES WILSHIRE 5000 INDEX PORTFOLIO SCHEDULE OF INVESTMENTS - (CONTINUED) | | December 31, 2006 | | |
| | | | | |
| Shares | | Value |
| Financials (continued) | | | |
| 9,650 | | Freddie Mac | | $ | 655,235 |
| 1,600 | | Fremont General Corp. | | | 25,936 |
| 3,360 | | Friedman, Billings, Ramsey Group, Inc., Class A | | | 26,880 |
| 2,859 | | Fulton Financial Corp. | | | 47,745 |
| 1,000 | | GAMCO Investors, Inc., Class A | | | 38,460 |
| 3,000 | | General Growth Properties, Inc. | | | 156,690 |
| 5,400 | | Genworth Financial, Inc., Class A(a) | | | 184,734 |
| 200 | | Getty Realty Corp. | | | 6,180 |
| 600 | | GMH Communities Trust | | | 6,090 |
| 5,120 | | Goldman Sachs Group, Inc.(a) | | | 1,020,672 |
| 200 | | Government Properties Trust, Inc. | | | 2,120 |
| 100 | | Gramercy Capital Corp. | | | 3,089 |
| 1,000 | | Great Southern Bancorp, Inc. | | | 29,510 |
| 400 | | Greater Bay Bancorp. | | | 10,532 |
| 229 | | Hancock Holding Co. | | | 12,100 |
| 800 | | Hanmi Financial Corp. | | | 18,024 |
| 1,500 | | Hanover Insurance Group, Inc. (The) | | | 73,200 |
| 1,000 | | Harleysville Group, Inc. | | | 34,820 |
| 370 | | Harleysville National Corp. | | | 7,145 |
| 3,800 | | Hartford Financial Services Group, Inc.(a) | | | 354,578 |
| 850 | | HCC Insurance Holdings, Inc. | | | 27,276 |
| 2,900 | | Health Care Property Investors, Inc. | | | 106,778 |
| 700 | | Health Care REIT, Inc. | | | 30,114 |
| 900 | | Healthcare Realty Trust, Inc. | | | 35,586 |
| 1,000 | | Heritage Commerce Corp. | | | 26,640 |
| 1,000 | | Highland Hospitality Corp. | | | 14,250 |
| 350 | | Highwoods Properties, Inc. | | | 14,266 |
| 800 | | Hospitality Properties Trust | | | 38,024 |
| 6,875 | | Host Hotels & Resorts, Inc.(a) | | | 168,781 |
| 1,100 | | Housevalues, Inc.† | | | 6,193 |
| 2,900 | | HRPT Properties Trust | | | 35,815 |
| 8,326 | | Hudson City Bancorp, Inc. | | | 115,565 |
| 2,913 | | Huntington Bancshares, Inc. | | | 69,184 |
| 1,250 | | IMPAC Mortgage Holdings, Inc. | | | 11,000 |
| 1,000 | | Independent Bank Corp. | | | 36,030 |
| 1,500 | | IndyMac Bancorp, Inc. | | | 67,740 |
| 300 | | Inland Real Estate Corp.(a) | | | 5,616 |
| 100 | | Innkeepers USA Trust. | | | 1,550 |
| 200 | | Integra Bank Corp. | | | 5,504 |
| 1,000 | | Interchange Financial Services Corp. | | | 22,990 |
| 750 | | International Bancshares Corp. | | | 23,182 |
| 300 | | Investment Technology Group., Inc.† | | | 12,864 |
| 800 | | Investors Financial Services Corp.(a) | | | 34,136 |
| 1,100 | | IPC Holdings, Ltd. | | | 34,595 |
| 700 | | Irwin Financial Corp. | | | 15,841 |
| 1,664 | | iStar Financial, Inc. | | | 79,572 |
| 1,850 | | Janus Capital Group, Inc. | | | 39,942 |
| 800 | | Jefferies Group, Inc. | | | 21,456 |
| 46,530 | | JPMorgan Chase & Co. | | | 2,247,399 |
| 1,000 | | Kearny Financial Corp. | | | 16,060 |
| 5,100 | | KeyCorp(a) | | | 193,953 |
| 2,400 | | Kimco Realty Corp. | | | 107,880 |
| 700 | | KKR Financial Corp. | | | 18,753 |
| 1,050 | | Knight Capital Group, Inc., Class A† | | | 20,128 |
| 1,100 | | LaBranche & Co, Inc.†(a) | | | 10,813 |
| 2,300 | | Legg Mason, Inc.(a) | | | 218,615 |
| 7,218 | | Lehman Brothers Holdings, Inc.(a) | | | 563,870 |
| 2,680 | | Leucadia National Corp. | | | 75,576 |
See Notes to Financial Statements.
61
| | | | |
WILSHIRE MUTUAL FUNDS, INC. DOW JONES WILSHIRE 5000 INDEX PORTFOLIO SCHEDULE OF INVESTMENTS - (CONTINUED) | | December 31, 2006 | | |
| | | | | |
| Shares | | | | Value |
| Financials (continued) |
| 450 | | Lexington Corporate | | | |
| | Properties Trust | | $ | 10,089 |
| 1,750 | | Liberty Property Trust(a) | | | 85,995 |
| 4,000 | | Lincoln National Corp. | | | 265,600 |
| 5,850 | | Loews Corp. | | | 242,600 |
| 693 | | Longview Fibre Co. | | | 15,211 |
| 900 | | M&T Bank Corp.(a) | | | 109,944 |
| 1,100 | | Macerich Co. (The) | | | 95,227 |
| 700 | | Mack-Cali Realty Corp. | | | 35,700 |
| 1,149 | | Main Street Trust, Inc. | | | 40,502 |
| 1,050 | | MainSource Financial Group, Inc. | | | 17,787 |
| 6,570 | | Marsh & McLennan Cos., Inc.(a) | | | 201,436 |
| 4,307 | | Marshall & Ilsley Corp.(a) | | | 207,189 |
| 1,400 | | Max Re Capital, Ltd. | | | 34,748 |
| 244 | | MB Financial, Inc. | | | 9,177 |
| 2,200 | | MBIA, Inc.(a) | | | 160,732 |
| 5,200 | | Mellon Financial Corp.(a) | | | 219,180 |
| 1,700 | | Mercantile Bankshares Corp. | | | 79,543 |
| 12,296 | | Merrill Lynch & Co., Inc. | | | 1,144,758 |
| 5,696 | | MetLife, Inc. | | | 336,121 |
| 200 | | MFA Mortgage Investments, Inc. | | | 1,538 |
| 1,900 | | MGIC Investment Corp. | | | 118,826 |
| 100 | | Mid-America Apartment Communities, Inc. | | | 5,724 |
| 247 | | Midland Co. (The) | | | 10,362 |
| 200 | | Midwest Banc Holdings, Inc. | | | 4,750 |
| 600 | | Mills Corp. (The) | | | 12,000 |
| 700 | | Montpelier Re Holdings, Ltd. | | | 13,027 |
| 2,950 | | Moody’s Corp.(a) | | | 203,727 |
| 13,550 | | Morgan Stanley | | | 1,103,376 |
| 800 | | MortgageIT Holdings, Inc. | | | 11,800 |
| 104 | | Move, Inc.† | | | 573 |
| 600 | | Nara Bancorp, Inc. | | | 12,552 |
| 2,600 | | Nasdaq Stock Market, Inc. (The)†(a) | | | 80,054 |
| 800 | | National Atlantic Holdings Corp., Class A† | | | 9,328 |
| 8,163 | | National City Corp.(a) | | | 298,439 |
| 400 | | National Interstate Corp. | | | 9,720 |
| 195 | | National Retail Properties, Inc. | | | 4,475 |
| 620 | | Nationwide Financial Services, Class A | | | 33,604 |
| 1,300 | | Nationwide Health Properties, Inc. | | | 39,286 |
| 200 | | Navigators Group, Inc.† | | | 9,636 |
| 200 | | NBT Bancorp, Inc. | | | 5,102 |
| 1,000 | | Nelnet, Inc., Class A† | | | 27,360 |
| 950 | | New Century Financial Corp.(a) | | | 30,010 |
| 2,500 | | New Plan Excel Realty Trust | | | 68,700 |
| 3,537 | | New York Community Bancorp, Inc. | | | 56,946 |
| 800 | | NewAlliance Bancshares, Inc. | | | 13,120 |
| 700 | | Newcastle Investment Corp. | | | 21,924 |
| 1,000 | | Northern Empire Bancshares† | | | 29,540 |
| 2,700 | | Northern Trust Corp. | | | 163,863 |
| 500 | | Northwest Bancorp, Inc. | | | 13,730 |
| 700 | | Nuveen Investments, Inc., Class A | | | 36,316 |
| 1,500 | | NYSE Group, Inc.†(a) | | | 145,800 |
| 700 | | Ocwen Financial Corp.† | | | 11,102 |
| 1,000 | | Odyssey Re Holdings Corp. | | | 37,300 |
| 600 | | Ohio Casualty Corp. | | | 17,886 |
| 994 | | Old National Bancorp | | | 18,806 |
| 2,737 | | Old Republic International Corp. | | | 63,717 |
| 400 | | Old Second Bancorp, Inc. | | | 11,720 |
| 1,000 | | Omega Financial Corp. | | | 31,920 |
See Notes to Financial Statements.
62
| | | | |
WILSHIRE MUTUAL FUNDS, INC. DOW JONES WILSHIRE 5000 INDEX PORTFOLIO SCHEDULE OF INVESTMENTS - (CONTINUED) | | December 31, 2006 | | |
| | | | | |
| Shares | | | | Value |
| Financials (continued) | | | |
| 1,000 | | optionsXpress Holdings, Inc. | | $ | 22,690 |
| 932 | | Oriental Financial Group | | | 12,069 |
| 283 | | Pacific Capital Bancorp | | | 9,503 |
| 1,300 | | PartnerRe, Ltd. | | | 92,339 |
| 2,325 | | People’s Bank(a) | | | 103,742 |
| 1,000 | | PFF Bancorp, Inc. | | | 34,510 |
| 300 | | Philadelphia Consolidated Holding Co.† | | | 13,368 |
| 2,000 | | Phoenix Cos., Inc. (The) | | | 31,780 |
| 800 | | Platinum Underwriters Holdings, Ltd. | | | 24,752 |
| 2,459 | | Plum Creek Timber Co., Inc. | | | 97,991 |
| 1,600 | | PMI Group, Inc. (The) | | | 75,472 |
| 3,600 | | Popular, Inc. | | | 64,620 |
| 400 | | Presidential Life Corp. | | | 8,780 |
| 700 | | Primus Guaranty, Ltd.† | | | 8,085 |
| 3,200 | | Principal Financial Group, Inc. | | | 187,840 |
| 165 | | ProAssurance Corp.† | | | 8,237 |
| 9,100 | | Progressive Corp. (The) | | | 220,402 |
| 3,994 | | Prologis | | | 242,715 |
| 471 | | Prosperity Bancshares, Inc. | | | 16,254 |
| 800 | | Protective Life Corp. | | | 38,000 |
| 1,789 | | Provident Bankshares Corp. | | | 63,688 |
| 700 | | Provident Financial Services, Inc. | | | 12,691 |
| 500 | | Provident New York Bancorp | | | 7,490 |
| 7,200 | | Prudential Financial, Inc. | | | 618,192 |
| 2,114 | | Public Storage, Inc. | | | 206,115 |
| 370 | | Radian Group, Inc. | | | 19,947 |
| 1,800 | | Raymond James Financial, Inc. | | | 54,558 |
| 601 | | Rayonier, Inc. | | | 24,671 |
| 2,981 | | Realogy Corp.† | | | 90,384 |
| 800 | | Realty Income Corp. | | | 22,160 |
| 1,500 | | Reckson Associates Realty Corp. | | | 68,400 |
| 1,200 | | Regency Centers Corp. | | | 93,804 |
| 10,256 | | Regions Financial Corp.(a) | | | 383,574 |
| 1,300 | | RenaissanceRe Holdings, Ltd. | | | 78,000 |
| 2,170 | | Republic Bancorp, Inc. | | | 29,208 |
| 800 | | Resource Capital Corp. | | | 13,560 |
| 1,000 | | Roma Financial Corp.† | | | 16,560 |
| 1,900 | | Safeco Corp. | | | 118,845 |
| 1,500 | | Safety Insurance Group, Inc. | | | 76,065 |
| 1,000 | | Santander BanCorp | | | 17,850 |
| 800 | | Scottish Re Group, Ltd. | | | 4,272 |
| 700 | | SeaBright Insurance Holdings, Inc.† | | | 12,607 |
| 1,000 | | Seacoast Banking Corp. of Florida | | | 24,800 |
| 1,600 | | SEI Investments Co. | | | 95,296 |
| 200 | | Selective Insurance Group | | | 11,458 |
| 550 | | Senior Housing Properties Trust | | | 13,464 |
| 3,841 | | Simon Property Group, Inc.(a) | | | 389,055 |
| 1,620 | | Sky Financial Group, Inc. | | | 46,235 |
| 1,500 | | SL Green Realty Corp.(a) | | | 199,170 |
| 5,000 | | SLM Corp. | | | 243,850 |
| 650 | | South Financial Group, Inc. (The) | | | 17,284 |
| 1,000 | | Southern Missouri Bancorp, Inc. | | | 14,610 |
| 1,000 | | Southwest Bancorp, Inc. | | | 27,860 |
| 3,902 | | Sovereign Bancorp, Inc. | | | 99,072 |
| 2,700 | | Spirit Finance Corp. | | | 33,669 |
| 1,600 | | St Joe Co. (The)(a) | | | 85,712 |
| 8,434 | | St. Paul Travelers Cos., Inc. (The) | | | 452,821 |
| 540 | | Stancorp Financial Group, Inc. | | | 24,327 |
| 1,000 | | State Auto Financial Corp. | | | 34,730 |
| 4,300 | | State Street Corp. | | | 289,992 |
See Notes to Financial Statements.
63
| | | | |
WILSHIRE MUTUAL FUNDS, INC. DOW JONES WILSHIRE 5000 INDEX PORTFOLIO SCHEDULE OF INVESTMENTS - (CONTINUED) | | December 31, 2006 | | |
| | | | | |
| Shares | | | | Value |
| Financials (continued) | | | |
| 78 | | Sterling Financial Corp. | | $ | 2,637 |
| 300 | | Stewart Information Services Corp. | | | 13,008 |
| 300 | | Stifel Financial Corp.† | | | 11,769 |
| 600 | | Strategic Hotels & Resorts, Inc. | | | 13,074 |
| 711 | | Sun Bancorp, Inc.† | | | 14,981 |
| 700 | | Sunstone Hotel Investors, Inc. | | | 18,711 |
| 4,780 | | SunTrust Banks, Inc.(a) | | | 403,671 |
| 1,000 | | Superior Bancorp† | | | 11,340 |
| 700 | | Susquehanna Bancshares, Inc. | | | 18,816 |
| 250 | | SVB Financial Group† | | | 11,655 |
| 2,906 | | Synovus Financial Corp. | | | 89,592 |
| 3,300 | | T. Rowe Price Group, Inc. | | | 144,441 |
| 550 | | Taubman Centers, Inc. | | | 27,973 |
| 1,000 | | TCF Financial Corp. | | | 27,420 |
| 2,700 | | TD Ameritrade Holding Corp.(a) | | | 43,686 |
| 1,905 | | TD Banknorth, Inc. | | | 61,493 |
| 400 | | Texas Capital Bancshares, Inc.† | | | 7,952 |
| 600 | | Thomas Weisel Partners Group, Inc.† | | | 12,660 |
| 946 | | Thornburg Mortgage, Inc. | | | 23,773 |
| 1,800 | | Torchmark Corp. | | | 114,768 |
| 1,000 | | Tower Group, Inc. | | | 31,070 |
| 700 | | TradeStation Group, Inc.† | | | 9,625 |
| 1,500 | | Triad Guaranty, Inc.† | | | 82,305 |
| 1,000 | | Trico Bancshares | | | 27,210 |
| 508 | | Trustco Bank Corp. | | | 5,649 |
| 650 | | Trustmark Corp. | | | 21,262 |
| 350 | | Trustreet Properties, Inc. | | | 5,898 |
| 20,459 | | U.S. Bancorp(a) | | | 740,411 |
| 600 | | UCBH Holdings, Inc. | | | 10,536 |
| 1,810 | | UMB Financial Corp. | | | 66,083 |
| 700 | | Umpqua Holdings Corp. | | | 20,601 |
| 400 | | UnionBanCal Corp. | | | 24,500 |
| 1,000 | | United America Indemnity Ltd. Class A† | | | 25,330 |
| 650 | | United Community Banks, Inc. | | | 21,008 |
| 1,000 | | United Community Financial Corp. | | | 12,240 |
| 1,900 | | United Dominion Realty Trust, Inc. | | | 60,401 |
| 1,000 | | United Fire & Casualty Co. | | | 35,250 |
| 500 | | United PanAm Financial Corp.† | | | 6,880 |
| 400 | | Unitrin, Inc. | | | 20,044 |
| 1,000 | | Universal American Financial Corp.† | | | 18,640 |
| 3,857 | | UnumProvident Corp. | | | 80,148 |
| 600 | | USB Holding Co., Inc. | | | 14,460 |
| 700 | | USI Holdings Corp.† | | | 10,752 |
| 1,450 | | U-Store-It Trust | | | 29,798 |
| 806 | | Valley National Bancorp | | | 21,367 |
| 900 | | Ventas, Inc. | | | 38,088 |
| 500 | | Vineyard National Bancorp | | | 11,510 |
| 468 | | Virginia Commerce Bancorp, Inc.† | | | 9,304 |
| 2,200 | | Vornado Realty Trust(a) | | | 267,300 |
| 1,981 | | W Holding Co., Inc. | | | 11,807 |
| 700 | | W.P. Stewart & Co., Ltd. | | | 11,088 |
| 1,987 | | W.R. Berkley Corp.(a) | | | 68,571 |
| 26,834 | | Wachovia Corp.(a) | | | 1,528,196 |
| 500 | | Waddell & Reed Financial, Inc., Class A | | | 13,680 |
| 2,333 | | Washington Federal, Inc. | | | 54,895 |
| 12,781 | | Washington Mutual, Inc.(a) | | | 581,408 |
| 250 | | Washington Real Estate Investment Trust | | | 10,000 |
| 400 | | Washington Trust Bancorp, Inc. | | | 11,156 |
| 550 | | Wauwatosa Holdings, Inc.† | | | 9,801 |
| 1,404 | | Webster Financial Corp. | | | 68,403 |
| 1,475 | | Weingarten Realty Investors | | | 68,012 |
| 41,990 | | Wells Fargo & Co. | | | 1,493,164 |
See Notes to Financial Statements.
64
| | | | |
WILSHIRE MUTUAL FUNDS, INC. DOW JONES WILSHIRE 5000 INDEX PORTFOLIO SCHEDULE OF INVESTMENTS - (CONTINUED) | | December 31, 2006 | | |
| | | | | |
| Shares | | | | Value |
| Financials (continued) |
| 300 | | WesBanco, Inc. | | $ | 10,059 |
| 200 | | Wesco Financial Corp. | | | 92,000 |
| 1,000 | | West Coast Bancorp | | | 34,640 |
| 350 | | Western Alliance Bancorp† | | | 12,170 |
| 375 | | Whitney Holding Corp. | | | 12,232 |
| 850 | | Wilmington Trust Corp. | | | 35,844 |
| 550 | | Wilshire Bancorp, Inc. | | | 10,434 |
| 1,500 | | World Acceptance Corp.† | | | 70,425 |
| 1,500 | | WSFS Financial Corp. | | | 100,395 |
| 1,900 | | XL Capital, Ltd., Class A | | | 136,838 |
| 1,505 | | Zions Bancorp | | | 124,072 |
| 900 | | ZipRealty, Inc.†(a) | | | 6,742 |
| | | | | |
| | | | | 48,693,341 |
| | | | | |
| |
| Health Care — 11.9% | | | |
| 700 | | A.D.A.M., Inc.† | | | 4,256 |
| 20,150 | | Abbott Laboratories | | | 981,506 |
| 400 | | Abraxis BioScience, Inc.†(a) | | | 10,936 |
| 800 | | Adeza Biomedical Corp.† | | | 11,928 |
| 700 | | Adolor Corp.† | | | 5,264 |
| 731 | | Advanced Medical Optics, Inc.†(a) | | | 25,731 |
| 7,750 | | Aetna, Inc. | | | 334,645 |
| 600 | | Affymetrix, Inc.† | | | 13,836 |
| 1,000 | | Align Technology, Inc.†(a) | | | 13,970 |
| 750 | | Alkermes, Inc.† | | | 10,027 |
| 2,240 | | Allergan, Inc.(a) | | | 268,218 |
| 1,000 | | Alliance Imaging, Inc.† | | | 6,650 |
| 1,400 | | Allscripts Healthcare Solutions, Inc.† | | | 37,786 |
| 700 | | Altus Pharmaceuticals, Inc.† | | | 13,195 |
| 333 | | Amedisys, Inc.†(a) | | | 10,957 |
| 2,150 | | American Medical Systems Holdings, Inc.† | | | 39,818 |
| 2,150 | | AMERIGROUP Corp.† | | | 77,164 |
| 3,040 | | AmerisourceBergen Corp. | | | 136,678 |
| 15,952 | | Amgen, Inc.† | | | 1,089,681 |
| 1,700 | | Amylin Pharmaceuticals, Inc.†(a) | | | 61,319 |
| 1,000 | | Angeion Corp.† | | | 12,230 |
| 900 | | Anika Therapeutics, Inc.† | | | 11,943 |
| 2,700 | | Applera Corp. - Applied Biosystems Group | | | 99,063 |
| 600 | | Applera Corp. - Celera Group† | | | 8,394 |
| 700 | | Arena Pharmaceuticals, Inc.† | | | 9,037 |
| 1,000 | | Arrow International, Inc. | | | 35,380 |
| 800 | | Atherogenics, Inc.†(a) | | | 7,928 |
| 1,000 | | Auxilium Pharmaceuticals, Inc.† | | | 14,690 |
| 1,800 | | Bard (C.R.), Inc. | | | 149,346 |
| 1,875 | | Barr Pharmaceuticals, Inc.† | | | 93,975 |
| 2,000 | | Bausch & Lomb, Inc.(a) | | | 104,120 |
| 9,463 | | Baxter International, Inc.(a) | | | 438,989 |
| 1,400 | | Beckman Coulter, Inc. | | | 83,720 |
| 2,700 | | Becton Dickinson & Co. | | | 189,405 |
| 4,755 | | Biogen Idec, Inc.† | | | 233,898 |
| 600 | | BioMarin Pharmaceuticals, Inc.† | | | 9,834 |
| 2,450 | | Biomet, Inc. | | | 101,111 |
| 18,039 | | Boston Scientific Corp.† | | | 309,910 |
| 25,550 | | Bristol-Myers Squibb Co. | | | 672,476 |
| 1,500 | | Brookdale Senior Living, Inc.(a) | | | 72,000 |
| 1,000 | | Bruker BioSciences Corp.† | | | 7,510 |
| 200 | | Candela Corp.† | | | 2,474 |
| 1,000 | | Capital Senior Living Corp.† | | | 10,640 |
| 5,636 | | Cardinal Health, Inc. | | | 363,127 |
| 5,578 | | Caremark Rx, Inc. | | | 318,560 |
| 5,000 | | Celgene Corp.†(a) | | | 287,650 |
| 700 | | Centene Corp.† | | | 17,199 |
| 1,200 | | Cephalon, Inc.† | | | 84,492 |
| 1,000 | | Cepheid, Inc.† | | | 8,500 |
| 1,500 | | Cerner Corp.†(a) | | | 68,250 |
| 2,144 | | Charles River Laboratories International, Inc.† | | | 92,728 |
See Notes to Financial Statements.
65
| | | | |
WILSHIRE MUTUAL FUNDS, INC. DOW JONES WILSHIRE 5000 INDEX PORTFOLIO SCHEDULE OF INVESTMENTS - (CONTINUED) | | December 31, 2006 | | |
| | | | | |
| Shares | | | | Value |
| Health Care (continued) | | | |
| 1,300 | | Cigna Corp. | | $ | 171,041 |
| 700 | | Coley Pharmaceutical Group, Inc.† | | | 6,783 |
| 1,000 | | Community Health Systems, Inc.† | | | 36,520 |
| 700 | | Conmed Corp.† | | | 16,184 |
| 755 | | Cooper Cos., Inc. (The) | | | 33,598 |
| 1,550 | | Covance, Inc.† | | | 91,310 |
| 2,191 | | Coventry Health Care, Inc.† | | | 109,660 |
| 100 | | Cross Country Healthcare, Inc.† | | | 2,182 |
| 500 | | Cubist Pharmaceuticals, Inc.† | | | 9,055 |
| 100 | | CuraGen Corp.† | | | 460 |
| 200 | | Curative Health Services, Inc.† | | | 0 |
| 700 | | CV Therapeutics, Inc.† | | | 9,772 |
| 700 | | Cynosure, Inc., Class A† | | | 11,081 |
| 1,100 | | Cytyc Corp.† | | | 31,130 |
| 1,000 | | Dade Behring Holdings, Inc. | | | 39,810 |
| 1,750 | | DaVita, Inc.† | | | 99,540 |
| 200 | | Dendrite International, Inc.† | | | 2,142 |
| 2,200 | | Dentsply International, Inc. | | | 65,670 |
| 700 | | Dialysis Corp. of America† | | | 8,897 |
| 100 | | Diversa Corp.† | | | 1,088 |
| 100 | | Dyax Corp.† | | | 303 |
| 700 | | Edwards Lifesciences Corp.† | | | 32,928 |
| 13,070 | | Eli Lilly & Co.(a) | | | 680,947 |
| 3,345 | | Emdeon Corp.† | | | 41,445 |
| 600 | | Encysive Pharmaceuticals, Inc.†(a) | | | 2,526 |
| 700 | | Endo Pharmaceuticals Holdings, Inc.† | | | 19,306 |
| 300 | | eResearch Technology, Inc.† | | | 2,019 |
| 700 | | ev3, Inc.† | | | 12,061 |
| 400 | | Exelixis, Inc.† | | | 3,600 |
| 1,900 | | Express Scripts, Inc.† | | | 136,040 |
| 200 | | Five Star Quality Care, Inc.† | | | 2,230 |
| 4,050 | | Forest Laboratories, Inc.† | | | 204,930 |
| 6,800 | | Genentech, Inc.† | | | 551,684 |
| 1,450 | | Gen-Probe, Inc.† | | | 75,936 |
| 4,055 | | Genzyme Corp.† | | | 249,707 |
| 5,550 | | Gilead Sciences, Inc.† | | | 360,362 |
| 1,000 | | GTx, Inc.† | | | 17,840 |
| 1,800 | | Hanger Orthopedic Group, Inc.† | | | 13,554 |
| 2,900 | | Health Management Associates, Inc., Class A | | | 61,219 |
| 1,700 | | Health Net, Inc.† | | | 82,722 |
| 1,000 | | Healthsouth Corp.† | | | 22,650 |
| 1,700 | | Henry Schein, Inc.† | | | 83,266 |
| 1,200 | | Hillenbrand Industries, Inc | | | 68,316 |
| 800 | | Hologic, Inc.†(a) | | | 37,824 |
| 2,040 | | Hospira, Inc.† | | | 68,503 |
| 1,000 | | Human Genome Sciences, Inc.†(a) | | | 12,440 |
| 2,300 | | Humana, Inc.† | | | 127,213 |
| 300 | | Hythiam, Inc.†(a) | | | 2,772 |
| 2,150 | | ICOS Corp.† | | | 72,648 |
| 1,100 | | Idenix Pharmaceuticals, Inc.† | | | 9,559 |
| 200 | | Immtech Pharmaceuticals, Inc.† | | | 1,520 |
| 380 | | Immucor, Inc.† | | | 11,107 |
| 2,100 | | IMS Health, Inc. | | | 57,708 |
| 1,000 | | Infinity Pharmaceuticals, Inc.† | | | 12,450 |
| 1,000 | | Invacare Corp. | | | 24,550 |
| 1,300 | | Invitrogen Corp.† | | | 73,567 |
| 200 | | IRIS International, Inc.†(a) | | | 2,530 |
| 1,000 | | Isis Pharmaceuticals, Inc.† | | | 11,120 |
| 39,760 | | Johnson & Johnson | | | 2,624,955 |
| 600 | | Keryx Biopharmaceuticals, Inc.† | | | 7,980 |
| 500 | | Kinetic Concepts, Inc.† | | | 19,775 |
| 3,074 | | King Pharmaceuticals, Inc.† | | | 48,938 |
| 1,900 | | Laboratory Corp. of America Holdings†(a) | | | 139,593 |
| 1,000 | | LCA-Vision, Inc.(a) | | | 34,360 |
See Notes to Financial Statements.
66
| | | | |
WILSHIRE MUTUAL FUNDS, INC. DOW JONES WILSHIRE 5000 INDEX PORTFOLIO SCHEDULE OF INVESTMENTS - (CONTINUED) | | December 31, 2006 | | |
| | | | | |
| Shares | | | | Value |
| Health Care (continued) |
| 600 | | LHC Group, Inc.† | | $ | 17,106 |
| 565 | | LifePoint Hospitals, Inc.† | | | 19,040 |
| 1,000 | | Ligand Pharmaceuticals, Inc., Class B† | | | 10,950 |
| 1,600 | | Lincare Holdings, Inc.† | | | 63,744 |
| 200 | | Luminex Corp.† | | | 2,540 |
| 700 | | MannKind Corp.† | | | 11,543 |
| 1,700 | | Manor Care, Inc. | | | 79,764 |
| 1,000 | | Martek Biosciences Corp.† | | | 23,340 |
| 100 | | Matria Healthcare, Inc.† | | | 2,873 |
| 300 | | Maxygen, Inc.† | | | 3,231 |
| 4,450 | | McKesson Corp. | | | 225,615 |
| 1,200 | | Medarex, Inc.† | | | 17,748 |
| 4,399 | | Medco Health Solutions, Inc.† | | | 235,083 |
| 1,000 | | Medicines Co.† | | | 31,720 |
| 300 | | Medicis Pharmaceutical Corp., Class A | | | 10,539 |
| 3,155 | | MedImmune, Inc.†(a) | | | 102,127 |
| 15,268 | | Medtronic, Inc.(a) | | | 816,991 |
| 700 | | Mentor Corp. | | | 34,209 |
| 28,633 | | Merck & Co., Inc.(a) | | | 1,248,399 |
| 200 | | Merge Technologies, Inc.† | | | 1,312 |
| 1,300 | | MGI Pharma, Inc.† | | | 23,933 |
| 800 | | Micrus Endovascular Corp.† | | | 15,264 |
| 4,000 | | Millennium Pharmaceuticals, Inc.† | | | 43,600 |
| 150 | | Millipore Corp.†(a) | | | 9,990 |
| 1,000 | | Molina Healthcare, Inc.† | | | 32,510 |
| 800 | | Momenta Pharmaceuticals, Inc.†(a) | | | 12,584 |
| 3,600 | | Mylan Laboratories, Inc. | | | 71,856 |
| 700 | | Nastech Pharmaceutical Co., Inc.†(a) | | | 10,591 |
| 950 | | Nektar Therapeutics† | | | 14,450 |
| 1,500 | | New River Pharmaceuticals, Inc.†(a) | | | 82,065 |
| 700 | | Nighthawk Radiology Holdings, Inc.† | | | 17,850 |
| 1,000 | | Northstar Neuroscience, Inc.† | | | 14,380 |
| 1,000 | | NuVasive, Inc.† | | | 23,100 |
| 800 | | Odyssey HealthCare, Inc.† | | | 10,608 |
| 1,700 | | Omnicare, Inc.(a) | | | 65,671 |
| 1,000 | | OSI Pharmaceuticals, Inc.† | | | 34,980 |
| 1,900 | | Patterson Cos., Inc.† | | | 67,469 |
| 1,200 | | PDI, Inc.† | | | 12,180 |
| 1,100 | | PDL BioPharma, Inc.† | | | 22,154 |
| 300 | | Pediatrix Medical Group, Inc.† | | | 14,670 |
| 2,717 | | PerkinElmer, Inc. | | | 60,399 |
| 900 | | Perrigo Co. | | | 15,570 |
| 98,411 | | Pfizer, Inc. | | | 2,548,845 |
| 2,500 | | Pharmaceutical Product Development, Inc. | | | 80,550 |
| 1,000 | | Pharmion Corp.† | | | 25,740 |
| 700 | | Phase Forward, Inc.† | | | 10,486 |
| 200 | | PRA International† | | | 5,054 |
| 200 | | Providence Service Corp. (The)†(a) | | | 5,026 |
| 500 | | PSS World Medical, Inc.† | | | 9,765 |
| 700 | | Psychiatric Solutions, Inc.† | | | 26,264 |
| 2,300 | | Quest Diagnostics, Inc. | | | 121,900 |
| 1,000 | | Radiation Therapy Services, Inc.† | | | 31,520 |
| 1,000 | | Regeneron Pharmaceuticals, Inc.† | | | 20,070 |
| 900 | | Repros Therapeutics, Inc.† | | | 11,349 |
| 600 | | Resmed, Inc.† | | | 29,532 |
| 800 | | Respironics, Inc.† | | | 30,200 |
| 200 | | Rigel Pharmaceuticals, Inc.† | | | 2,374 |
| 800 | | Salix Pharmaceuticals, Ltd.† | | | 9,736 |
| 19,750 | | Schering-Plough Corp.(a) | | | 466,890 |
| 600 | | Sciele Pharma, Inc.† | | | 14,400 |
| 200 | | Senomyx, Inc.† | | | 2,598 |
| 1,800 | | Sepracor, Inc.†(a) | | | 110,844 |
See Notes to Financial Statements.
67
| | | | |
WILSHIRE MUTUAL FUNDS, INC. DOW JONES WILSHIRE 5000 INDEX PORTFOLIO SCHEDULE OF INVESTMENTS - (CONTINUED) | | December 31, 2006 | | |
| | | | | |
| Shares | | | | Value |
| Health Care (continued) | | | |
| 400 | | Sierra Health Services, Inc.† | | $ | 14,416 |
| 1,000 | | Sirna Therapeutics, Inc.† | | | 13,010 |
| 800 | | Solexa, Inc.† | | | 10,520 |
| 1,000 | | Somaxon Pharmaceuticals, Inc.† | | | 14,190 |
| 5,200 | | St. Jude Medical, Inc.† | | | 190,112 |
| 650 | | STERIS Corp. | | | 16,360 |
| 4,220 | | Stryker Corp. | | | 232,564 |
| 700 | | Techne Corp.† | | | 38,815 |
| 500 | | Telik, Inc.†(a) | | | 2,215 |
| 6,126 | | Tenet Healthcare Corp.† | | | 42,698 |
| 700 | | Theravance, Inc.† | | | 21,623 |
| 1,000 | | Thermage, Inc.† | | | 6,990 |
| 5,009 | | Thermo Fisher Scientific, Inc.†(a) | | | 226,858 |
| 1,000 | | Thoratec Corp.† | | | 17,580 |
| 805 | | Triad Hospitals, Inc.† | | | 33,673 |
| 600 | | Trizetto Group, Inc.† | | | 11,022 |
| 1,000 | | United American Healthcare Corp.† | | | 8,380 |
| 200 | | United Therapeutics Corp.† | | | 10,874 |
| 18,312 | | UnitedHealth Group, Inc. | | | 983,904 |
| 1,400 | | Universal Health Services, Inc., Class B | | | 77,602 |
| 1,800 | | Valeant Pharmaceuticals International | | | 31,032 |
| 2,000 | | Varian Medical Systems, Inc.† | | | 95,140 |
| 2,300 | | VCA Antech, Inc.† | | | 74,037 |
| 1,750 | | Vertex Pharmaceuticals, Inc.† | | | 65,485 |
| 1,700 | | Viropharma, Inc.† | | | 24,888 |
| 1,000 | | Visicu, Inc.† | | | 11,200 |
| 200 | | Vital Signs, Inc. | | | 9,984 |
| 1,000 | | Warner Chilcott, Ltd., Class A† | | | 13,820 |
| 1,950 | | Waters Corp.† | | | 95,492 |
| 1,250 | | Watson Pharmaceuticals, Inc.† | | | 32,538 |
| 7,841 | | WellPoint, Inc.† | | | 617,008 |
| 1,000 | | Wright Medical Group, Inc.† | | | 23,280 |
| 18,200 | | Wyeth(a) | | | 926,744 |
| 1,000 | | Xenoport, Inc.† | | | 24,550 |
| 1,000 | | Zevex International Inc.† | | | 9,855 |
| 3,200 | | Zimmer Holdings, Inc.† | | | 250,816 |
| 700 | | Zymogenetics, Inc.† | | | 10,899 |
| | | | | |
| | | | | 25,431,835 |
| | | | | |
| |
| Industrials — 11.1% | | | |
| 9,650 | | 3M Co. | | | 752,024 |
| 273 | | ACCO Brands Corp.†(a) | | | 7,226 |
| 800 | | Accuride Corp.† | | | 9,008 |
| 1,770 | | Actuant Corp., Class A | | | 84,340 |
| 100 | | Acuity Brands, Inc.(a) | | | 5,204 |
| 900 | | Adesa, Inc. | | | 24,975 |
| 750 | | AGCO Corp.†(a) | | | 23,205 |
| 700 | | Airtran Holdings, Inc.† | | | 8,218 |
| 1,000 | | Albany International Corp., Class A | | | 32,910 |
| 350 | | Alexander & Baldwin, Inc. | | | 15,519 |
| 150 | | Alliant Techsystems, Inc.† | | | 11,728 |
| 3,700 | | Allied Waste Industries, Inc.† | | | 45,473 |
| 2,500 | | American Power Conversion Corp. | | | 76,475 |
| 200 | | American Science & Engineering, Inc.†(a) | | | 11,902 |
| 1,800 | | American Standard Cos., Inc.(a) | | | 82,530 |
| 850 | | Ametek, Inc. | | | 27,064 |
| 1,000 | | Ampco-Pittsburgh Corp. | | | 33,480 |
| 2,950 | | AMR Corp.†(a) | | | 89,178 |
| 200 | | Angelica Corp. | | | 5,160 |
| 200 | | Applied Signal Technology, Inc. | | | 2,812 |
| 1,000 | | Aramark Corp., Class B | | | 33,450 |
| 600 | | Armor Holdings, Inc.† | | | 32,910 |
| 400 | | Astec Industries, Inc.† | | | 14,040 |
See Notes to Financial Statements.
68
| | | | |
WILSHIRE MUTUAL FUNDS, INC. DOW JONES WILSHIRE 5000 INDEX PORTFOLIO SCHEDULE OF INVESTMENTS - (CONTINUED) | | December 31, 2006 | | |
| | | | | |
| Shares | | | | Value |
| Industrials (continued) |
| 1,900 | | Avery Dennison Corp. | | $ | 129,067 |
| 992 | | Avis Budget Group, Inc. | | | 21,516 |
| 200 | | Axsys Technologies, Inc.† | | | 3,514 |
| 200 | | Baker (Michael) Corp.† | | | 4,530 |
| 1,700 | | Basin Water, Inc.† | | | 11,509 |
| 1,200 | | BE Aerospace, Inc.† | | | 30,816 |
| 2,150 | | Belden CDT, Inc. | | | 84,044 |
| 900 | | BlueLinx Holdings, Inc. | | | 9,360 |
| 9,950 | | Boeing Co. | | | 883,958 |
| 100 | | Bowne & Co., Inc. | | | 1,594 |
| 1,000 | | Brady Corp., Class A | | | 37,280 |
| 600 | | Briggs & Stratton Corp. | | | 16,170 |
| 250 | | Brink’s Co. (The) | | | 15,980 |
| 600 | | BTU International, Inc.† | | | 5,880 |
| 750 | | Builders FirstSource, Inc.† | | | 13,372 |
| 4,690 | | Burlington Northern Santa Fe Corp. | | | 346,169 |
| 200 | | C&D Technologies, Inc.(a) | | | 948 |
| 2,500 | | C.H. Robinson Worldwide, Inc.(a) | | | 102,225 |
| 200 | | Casella Waste Systems, Inc., Class A† | | | 2,446 |
| 9,450 | | Caterpillar, Inc. | | | 579,568 |
| 400 | | CDI Corp. | | | 9,960 |
| 700 | | Central Parking Corp. | | | 12,600 |
| 1,586 | | ChoicePoint, Inc.† | | | 62,457 |
| 1,882 | | Cintas Corp. | | | 74,734 |
| 400 | | Clarcor, Inc. | | | 13,524 |
| 1,500 | | Clean Harbors, Inc.† | | | 72,615 |
| 400 | | Columbus McKinnon Corp.† | | | 8,408 |
| 800 | | Comfort Systems USA, Inc. | | | 10,112 |
| 400 | | Commercial Vehicle Group, Inc.† | | | 8,720 |
| 200 | | Competitive Technologies, Inc.† | | | 466 |
| 200 | | Consolidated Graphics, Inc† | | | 11,814 |
| 500 | | Continental Airlines, Inc., Class B†(a) | | | 20,625 |
| 500 | | Con-way, Inc. | | | 22,020 |
| 1,900 | | Cooper Industries, Ltd., Class A | | | 171,817 |
| 700 | | Copart, Inc.† | | | 21,000 |
| 200 | | Cornell Cos., Inc.† | | | 3,666 |
| 1,500 | | Corrections Corp. of America† | | | 67,845 |
| 850 | | Covanta Holding Corp.† | | | 18,734 |
| 200 | | Covenant Transport, Inc., Class A† | | | 2,280 |
| 300 | | Crane Co. | | | 10,992 |
| 6,150 | | CSX Corp. | | | 211,744 |
| 2,200 | | Cummins, Inc.(a) | | | 259,996 |
| 300 | | Curtiss-Wright Corp. | | | 11,124 |
| 4,168 | | Danaher Corp.(a) | | | 301,930 |
| 2,800 | | Deere & Co. | | | 266,196 |
| 1,000 | | Deluxe Corp. | | | 25,200 |
| 800 | | Donaldson Co., Inc. | | | 27,768 |
| 2,950 | | Dover Corp. | | | 144,609 |
| 278 | | DRS Technologies, Inc.(a) | | | 14,645 |
| 1,450 | | Dun & Bradstreet Corp.† | | | 120,046 |
| 400 | | Dynamic Materials Corp. | | | 11,240 |
| 1,000 | | Eagle Bulk Shipping, Inc. | | | 17,340 |
| 2,300 | | Eaton Corp. | | | 172,822 |
| 1,000 | | ElkCorp. | | | 41,090 |
| 11,300 | | Emerson Electric Co. | | | 498,217 |
| 300 | | EnerSys† | | | 4,800 |
| 2,100 | | ENGlobal Corp.† | | | 13,503 |
| 2,050 | | Equifax, Inc. | | | 83,230 |
| 700 | | Evergreen Solar, Inc.†(a) | | | 5,299 |
| 1,000 | | Excel Maritime Carriers, Ltd.† | | | 14,610 |
| 2,900 | | Expeditors International Washington, Inc.(a) | | | 117,450 |
| 400 | | Exponent, Inc.† | | | 7,464 |
| 3,500 | | ExpressJet Holdings, Inc.† | | | 28,350 |
| 1,700 | | Fastenal Co. | | | 60,996 |
| 800 | | Federal Signal Corp. | | | 12,832 |
| 3,882 | | FedEx Corp.(a) | | | 421,663 |
See Notes to Financial Statements.
69
| | | | |
WILSHIRE MUTUAL FUNDS, INC. DOW JONES WILSHIRE 5000 INDEX PORTFOLIO SCHEDULE OF INVESTMENTS - (CONTINUED) | | December 31, 2006 | | |
| | | | | |
| Shares | | | | Value |
| Industrials (continued) | | | |
| 1,000 | | First Advantage Corp., Class A† | | $ | 22,960 |
| 800 | | Flanders Corp.† | | | 7,920 |
| 700 | | Flow International Corp.† | | | 7,714 |
| 400 | | Flowserve Corp.† | | | 20,188 |
| 1,600 | | Fluor Corp. | | | 130,640 |
| 300 | | Foster Wheeler, Ltd.† | | | 16,542 |
| 1,500 | | Freightcar America, Inc. | | | 83,175 |
| 1,000 | | Frontier Airlines Holdings, Inc.†(a) | | | 7,400 |
| 200 | | Frozen Food Express Industries | | | 1,720 |
| 600 | | FuelCell Energy, Inc.†(a) | | | 3,876 |
| 1,000 | | Gardner Denver, Inc.† | | | 37,310 |
| 200 | | GATX Corp. | | | 8,666 |
| 300 | | Gehl Co.† | | | 8,259 |
| 600 | | Genco Shipping & Trading, Ltd. | | | 16,764 |
| 1,500 | | General Cable Corp.† | | | 65,565 |
| 5,040 | | General Dynamics Corp.(a) | | | 374,724 |
| 139,346 | | General Electric Co. | | | 5,185,065 |
| 550 | | Global Cash Access Holdings, Inc.† | | | 8,927 |
| 100 | | Global Power Equipment Group, Inc.† | | | 70 |
| 1,700 | | Goodrich Corp.(a) | | | 77,435 |
| 1,487 | | Graco, Inc. | | | 58,915 |
| 1,100 | | GrafTech International, Ltd.† | | | 7,612 |
| 100 | | H&E Equipment Services, Inc.† | | | 2,477 |
| 150 | | Harland (John H.) Co. | | | 7,530 |
| 250 | | Healthcare Services Group | | | 7,240 |
| 533 | | Heartland Express, Inc. | | | 8,006 |
| 1,500 | | Heidrick & Struggles International, Inc.† | | | 63,540 |
| 200 | | Herley Industries, Inc.† | | | 3,238 |
| 700 | | Herman Miller, Inc. | | | 25,452 |
| 550 | | Hexcel Corp.†(a) | | | 9,576 |
| 1,700 | | Hi-Shear Technology Corp. | | | 15,470 |
| 10,025 | | Honeywell International, Inc. | | | 453,531 |
| 550 | | Horizon Lines, Inc., Class A | | | 14,828 |
| 1,400 | | HUB Group, Inc., Class A† | | | 38,570 |
| 400 | | Hubbell, Inc., Class B | | | 18,084 |
| 200 | | Hudson Highland Group,Inc.† | | | 3,336 |
| 400 | | Hurco Cos., Inc.† | | | 12,712 |
| 1,500 | | Huron Consulting Group, Inc.† | | | 68,010 |
| 350 | | IDEX Corp. | | | 16,594 |
| 1,800 | | IHS, Inc., Class A† | | | 71,064 |
| 1,000 | | II-VI, Inc.† | | | 27,940 |
| 700 | | IKON Office Solutions, Inc. | | | 11,459 |
| 7,066 | | Illinois Tool Works, Inc.(a) | | | 326,379 |
| 2,000 | | Imperial Industries, Inc.† | | | 16,240 |
| 3,650 | | Ingersoll-Rand Co., Ltd., Class A | | | 142,824 |
| 100 | | Innovative Solutions & Support, Inc.† | | | 1,703 |
| 100 | | Insituform Technologies, Inc., Class A† | | | 2,586 |
| 1,000 | | Interline Brands, Inc.† | | | 22,470 |
| 1,000 | | Interpool, Inc. | | | 23,360 |
| 900 | | Intersections, Inc.† | | | 9,504 |
| 200 | | Ionatron, Inc.† | | | 820 |
| 2,000 | | ITT Corp. | | | 113,640 |
| 1,400 | | J.B. Hunt Transport Services, Inc. | | | 29,078 |
| 2,200 | | Jacobs Engineering Group, Inc.† | | | 179,388 |
| 800 | | Jacuzzi Brands, Inc.† | | | 9,944 |
| 1,375 | | JetBlue Airways Corp.† | | | 19,525 |
| 1,725 | | Joy Global, Inc.(a) | | | 83,386 |
| 2,573 | | Kansas City Southern† | | | 74,566 |
| 400 | | Kelly Services, Inc., Class A | | | 11,576 |
| 100 | | Kenexa Corp.† | | | 3,326 |
| 300 | | Kennametal, Inc. | | | 17,655 |
| 900 | | Kirby Corp.† | | | 30,717 |
See Notes to Financial Statements.
70
| | | | |
WILSHIRE MUTUAL FUNDS, INC. DOW JONES WILSHIRE 5000 INDEX PORTFOLIO SCHEDULE OF INVESTMENTS - (CONTINUED) | | December 31, 2006 | | |
| | | | | |
| Shares | | | | Value |
| Industrials (continued) |
| 387 | | Knight Transportation, Inc. | | $ | 6,598 |
| 14,400 | | Kreisler Manufacturing Corp.† | | | 138,672 |
| 1,800 | | L-3 Communications Holdings, Inc. | | | 147,204 |
| 600 | | LaBarge, Inc.† | | | 8,058 |
| 1,000 | | Labor Ready, Inc.† | | | 18,330 |
| 700 | | Laidlaw International, Inc. | | | 21,301 |
| 600 | | Landstar System, Inc.(a) | | | 22,908 |
| 900 | | Learning Tree International, Inc.† | | | 8,001 |
| 100 | | LECG Corp.† | | | 1,848 |
| 550 | | Lennox International, Inc. | | | 16,836 |
| 200 | | Lindsay Manufacturing Co. | | | 6,530 |
| 1,000 | | LMI Aerospace, Inc.† | | | 15,480 |
| 4,550 | | Lockheed Martin Corp. | | | 418,918 |
| 200 | | LSI Industries, Inc. | | | 3,970 |
| 100 | | Macquarie Infrastucture Co. Trust | | | 3,548 |
| 500 | | Manitowoc Co., Inc. (The) | | | 29,715 |
| 1,803 | | Manpower, Inc. | | | 135,099 |
| 100 | | Marten Transport, Ltd.† | | | 1,833 |
| 5,300 | | Masco Corp.(a) | | | 158,311 |
| 1,625 | | McDermott International, Inc.† | | | 82,648 |
| 700 | | Meadow Valley Corp.† | | | 7,105 |
| 2,000 | | Mesa Air Group, Inc.† | | | 17,140 |
| 100 | | Middleby Corp.† | | | 10,467 |
| 1,000 | | Midwest Air Group, Inc.† | | | 11,500 |
| 1,600 | | Monster Worldwide, Inc.† | | | 74,624 |
| 300 | | MSC Industrial Direct Co., Class A | | | 11,745 |
| 495 | | Mueller Water Products, Inc., Class B† | | | 7,376 |
| 350 | | Navistar International Corp.† | | | 11,700 |
| 5,850 | | Norfolk Southern Corp. | | | 294,196 |
| 3,000 | | North American Galvanizing & Coating, Inc.† | | | 15,660 |
| 4,550 | | Northrop Grumman Corp. | | | 308,035 |
| 200 | | On Assignment, Inc.† | | | 2,350 |
| 1,500 | | Orbital Sciences Corp.† | | | 27,660 |
| 600 | | Oshkosh Truck Corp. | | | 29,052 |
| 1,000 | | Owens Corning, Inc.† | | | 29,900 |
| 3,337 | | Paccar, Inc. | | | 216,571 |
| 1,900 | | Pall Corp. | | | 65,645 |
| 2,129 | | Parker Hannifin Corp.(a) | | | 163,678 |
| 1,100 | | Pentair, Inc. | | | 34,540 |
| 623 | | PHH Corp.† | | | 17,986 |
| 600 | | Pike Electric Corp.†(a) | | | 9,798 |
| 2,000 | | Pinnacle Airlines Corp.† | | | 33,700 |
| 3,100 | | Pitney Bowes, Inc. | | | 143,189 |
| 800 | | Portec Rail Products, Inc. | | | 8,080 |
| 1,100 | | Power-One, Inc.† | | | 8,008 |
| 2,900 | | Precision Castparts Corp. | | | 227,012 |
| 1,020 | | PRG-Schultz International, Inc.† | | | 8,160 |
| 650 | | Quanta Services, Inc.†(a) | | | 12,786 |
| 100 | | Quipp, Inc. | | | 715 |
| 2,800 | | R.R. Donnelley & Sons Co. | | | 99,512 |
| 1,000 | | RailAmerica, Inc.† | | | 16,080 |
| 6,650 | | Raytheon Co.(a) | | | 351,120 |
| 700 | | Republic Airways Holdings, Inc.† | | | 11,746 |
| 1,500 | | Republic Services, Inc. | | | 61,005 |
| 200 | | Resources Connection, Inc.† | | | 6,368 |
| 2,600 | | Robert Half International, Inc.(a) | | | 96,512 |
| 2,000 | | Rockwell Automation, Inc. | | | 122,160 |
| 2,200 | | Rockwell Collins, Inc. | | | 139,238 |
| 500 | | Rollins, Inc. | | | 11,055 |
| 2,600 | | Roper Industries, Inc.(a) | | | 130,624 |
| 1,300 | | Ryder System, Inc. | | | 66,378 |
| 1,000 | | Saia, Inc.† | | | 23,210 |
| 2,000 | | SAIC, Inc.† | | | 35,580 |
| 1,000 | | School Specialty, Inc.†(a) | | | 37,490 |
| 400 | | Shaw Group, Inc. (The)† | | | 13,400 |
| 1,000 | | Simclar, Inc.†(a) | | | 5,980 |
See Notes to Financial Statements.
71
| | | | |
WILSHIRE MUTUAL FUNDS, INC. DOW JONES WILSHIRE 5000 INDEX PORTFOLIO SCHEDULEOF INVESTMENTS - (CONTINUED) | | December 31, 2006 | | |
| | | | | |
| Shares | | | | Value |
| Industrials (continued) | | | |
| 50 | | Simpson Manufacturing Co., Inc.(a) | | $ | 1,582 |
| 1,100 | | SIRVA, Inc.† | | | 3,828 |
| 1,550 | | SkyWest, Inc. | | | 39,540 |
| 300 | | Smith (A.O.) Corp. | | | 11,268 |
| 9,443 | | Southwest Airlines Co. | | | 144,667 |
| 300 | | Spherion Corp.† | | | 2,229 |
| 1,200 | | Spire Corp.† | | | 9,936 |
| 1,434 | | SPX Corp. | | | 87,703 |
| 200 | | Standard Register Co. (The) | | | 2,400 |
| 1,700 | | Steelcase, Inc., Class A | | | 30,872 |
| 1,000 | | Superior Essex, Inc.† | | | 33,250 |
| 1,000 | | Swift Transportation Co., Inc.† | | | 26,270 |
| 200 | | Sypris Solutions, Inc. | | | 1,390 |
| 550 | | Taleo Corp., Class A† | | | 7,518 |
| 1,000 | | Taser International, Inc.†(a) | | | 7,610 |
| 1,500 | | Terex Corp.†(a) | | | 96,870 |
| 693 | | Tetra Tech, Inc.† | | | 12,536 |
| 2,000 | | Textron, Inc. | | | 187,540 |
| 250 | | Thomas & Betts Corp.† | | | 11,820 |
| 1,000 | | Thomas Group, Inc. | | | 15,040 |
| 800 | | Timken Co. | | | 23,344 |
| 200 | | Titan International, Inc.(a) | | | 4,030 |
| 200 | | Toro Co. | | | 9,326 |
| 1,000 | | TransDigm Group, Inc.† | | | 26,510 |
| 200 | | TRC Cos., Inc.† | | | 1,726 |
| 400 | | Trex Co., Inc.†(a) | | | 9,156 |
| 1,700 | | Trinity Industries, Inc. | | | 59,840 |
| 4,600 | | TRM Corp.† | | | 9,844 |
| 800 | | TurboChef Technologies, Inc.† | | | 13,616 |
| 26,450 | | Tyco International, Ltd.(a) | | | 804,080 |
| 600 | | UAL Corp.† | | | 26,400 |
| 300 | | Ultralife Batteries, Inc.† | | | 3,303 |
| 3,000 | | Union Pacific Corp. | | | 276,060 |
| 200 | | United Industrial Corp. | | | 10,150 |
| 7,850 | | United Parcel Service, Inc., Class B | | | 588,593 |
| 600 | | United Rentals, Inc.† | | | 15,258 |
| 150 | | United Stationers, Inc.† | | | 7,004 |
| 12,544 | | United Technologies Corp. | | | 784,251 |
| 800 | | URS Corp.† | | | 34,280 |
| 1,541 | | US Airways Group, Inc.† | | | 82,983 |
| 300 | | USG Corp.† | | | 16,440 |
| 800 | | UTi Worldwide, Inc. | | | 23,920 |
| 100 | | Viad Corp. | | | 4,060 |
| 700 | | Vicor Corp. | | | 7,777 |
| 200 | | Volt Information Sciences, Inc.† | | | 10,042 |
| 1,700 | | W.W. Grainger, Inc.(a) | | | 118,898 |
| 50 | | Wabash National Corp. | | | 755 |
| 300 | | Wabtec Corp. | | | 9,114 |
| 300 | | Walter Industries, Inc. | | | 8,115 |
| 850 | | Waste Connections, Inc.† | | | 35,318 |
| 7,150 | | Waste Management, Inc. | | | 262,906 |
| 250 | | Werner Enterprises, Inc. | | | 4,370 |
| 1,300 | | WESCO International, Inc.†(a) | | | 76,453 |
| 1,000 | | Williams Scotsman International, Inc.† | | | 19,620 |
| 950 | | YRC Worldwide, Inc.† | | | 35,844 |
| | | | | |
| | | | | 23,835,020 |
| | | | | |
| |
| Information Technology — 14.7% | | | |
| 7,300 | | Accenture, Ltd., Class A | | | 269,589 |
| 800 | | Access Integrated Technologies, Inc., Class A† | | | 6,976 |
| 200 | | Actel Corp.† | | | 3,632 |
| 2,944 | | Activision, Inc.† | | | 50,755 |
| 1,200 | | Acxiom Corp. | | | 30,780 |
| 2,831 | | ADC Telecommunications, Inc.† | | | 41,134 |
| 7,959 | | Adobe Systems, Inc.† | | | 327,274 |
| 700 | | Adtran, Inc. | | | 15,890 |
| 800 | | Advanced Analogic Technologies, Inc.† | | | 4,312 |
See Notes to Financial Statements.
72
| | | | |
WILSHIRE MUTUAL FUNDS, INC. DOW JONES WILSHIRE 5000 INDEX PORTFOLIO SCHEDULEOF INVESTMENTS - (CONTINUED) | | December 31, 2006 | | |
| | | | | |
| Shares | | | | Value |
| Information Technology (continued) | | | |
| 1,200 | | Advanced Energy Industries, Inc.† | | $ | 22,644 |
| 6,600 | | Advanced Micro Devices, Inc.† | | | 134,310 |
| 700 | | Aeroflex, Inc.† | | | 8,204 |
| 1,700 | | Affiliated Computer Services, Inc., Class A† | | | 83,028 |
| 3,440 | | Agere Systems, Inc.†(a) | | | 65,945 |
| 100 | | Agile Software Corp.† | | | 615 |
| 5,346 | | Agilent Technologies, Inc.† | | | 186,308 |
| 500 | | Agilysys, Inc. | | | 8,370 |
| 1,759 | | Akamai Technologies, Inc.† | | | 93,438 |
| 450 | | Alliance Data Systems Corp.† | | | 28,112 |
| 4,600 | | Altera Corp.† | | | 90,528 |
| 200 | | Altiris, Inc.† | | | 5,076 |
| 200 | | American Technology Corp.† | | | 784 |
| 800 | | AMIS Holdings, Inc.† | | | 8,456 |
| 2,100 | | Amkor Technology, Inc.† | | | 19,614 |
| 1,300 | | Amphenol Corp., Class A | | | 80,704 |
| 5,400 | | Analog Devices, Inc. | | | 177,498 |
| 200 | | Anaren, Inc.† | | | 3,552 |
| 1,550 | | Andrew Corp.† | | | 15,856 |
| 1,100 | | Answers Corp.†(a) | | | 14,729 |
| 9,600 | | Apple Computer, Inc.† | | | 814,464 |
| 19,908 | | Applied Materials, Inc.(a) | | | 367,303 |
| 200 | | Aptimus, Inc.† | | | 1,320 |
| 450 | | aQuantive, Inc.†(a) | | | 11,097 |
| 1,000 | | Ariba, Inc.† | | | 7,740 |
| 1,100 | | Arris Group, Inc.† | | | 13,761 |
| 850 | | Arrow Electronics, Inc.† | | | 26,818 |
| 1,000 | | Aspen Technology, Inc.† | | | 11,020 |
| 700 | | Astea International, Inc.† | | | 4,732 |
| 500 | | Atheros Communications, Inc.† | | | 10,660 |
| 1,500 | | Atmel Corp.† | | | 9,075 |
| 3,100 | | Autodesk, Inc.† | | | 125,426 |
| 7,600 | | Automatic Data Processing, Inc. | | | 374,300 |
| 6,690 | | Avaya, Inc.† | | | 93,526 |
| 1,200 | | Avnet, Inc.†(a) | | | 30,636 |
| 350 | | Avocent Corp.† | | | 11,848 |
| 1,189 | | Axcelis Technologies, Inc.† | | | 6,932 |
| 200 | | Bankrate, Inc.†(a) | | | 7,590 |
| 5,550 | | BEA Systems, Inc.† | | | 69,819 |
| 2,900 | | BearingPoint, Inc.†(a) | | | 22,823 |
| 200 | | Bel Fuse, Inc., Class B | | | 6,958 |
| 200 | | Bell Microproducts, Inc.† | | | 1,410 |
| 900 | | Benchmark Electronics, Inc.† | | | 21,924 |
| 3,050 | | BISYS Group, Inc. (The)† | | | 39,376 |
| 1,000 | | Bitstream, Inc., Class A† | | | 8,700 |
| 400 | | Blackboard, Inc.†(a) | | | 12,016 |
| 200 | | Blue Coat Systems, Inc.† | | | 4,790 |
| 2,517 | | BMC Software, Inc.† | | | 81,047 |
| 1,000 | | Brightpoint, Inc.† | | | 13,450 |
| 5,515 | | Broadcom Corp., Class A† | | | 178,190 |
| 3,700 | | Brocade Communications Systems, Inc.† | | | 30,377 |
| 706 | | Brooks Automation, Inc.† | | | 10,166 |
| 6,272 | | CA, Inc. | | | 142,061 |
| 1,000 | | Cabot Microelectronics Corp.† | | | 33,940 |
| 2,927 | | Cadence Design Systems, Inc.† | | | 52,423 |
| 550 | | Carrier Access Corp.† | | | 3,608 |
| 800 | | Cascade Microtech, Inc.† | | | 10,480 |
| 200 | | Catapult Communications Corp.† | | | 1,796 |
| 1,180 | | CDW Corp. | | | 82,978 |
| 2,100 | | Ceridian Corp.† | | | 58,758 |
| 700 | | CheckFree Corp.† | | | 28,112 |
| 200 | | Ciber, Inc.† | | | 1,356 |
| 197 | | Ciena Corp.† | | | 5,459 |
| 700 | | Cirrus Logic, Inc.† | | | 4,816 |
See Notes to Financial Statements.
73
| | | | |
WILSHIRE MUTUAL FUNDS, INC. DOW JONES WILSHIRE 5000 INDEX PORTFOLIO SCHEDULEOF INVESTMENTS - (CONTINUED) | | December 31, 2006 | | |
| | | | | |
| Shares | | Value |
| |
| Information Technology (continued) | | | |
| 82,673 | | Cisco Systems, Inc.†(a) | | $ | 2,259,453 |
| 2,300 | | Citrix Systems, Inc.† | | | 62,215 |
| 3,037 | | CNET Networks, Inc.† | | | 27,606 |
| 800 | | Cogent, Inc.† | | | 8,808 |
| 2,000 | | Cognizant Technology Solutions Corp., Class A† | | | 154,320 |
| 650 | | CommScope, Inc.† | | | 19,812 |
| 2,580 | | Computer Sciences Corp.† | | | 137,695 |
| 4,250 | | Compuware Corp.† | | | 35,402 |
| 100 | | Comtech Telecommunications Corp.† | | | 3,807 |
| 1,731 | | Comverse Technology, Inc.†(a) | | | 36,541 |
| 1,300 | | Convergys Corp.† | | | 30,914 |
| 20,369 | | Corning, Inc.† | | | 381,104 |
| 1,000 | | Covansys Corp.† | | | 22,950 |
| 1,000 | | Cray, Inc.† | | | 11,880 |
| 700 | | Cree, Inc.†(a) | | | 12,124 |
| 150 | | CSG Systems International, Inc.† | | | 4,010 |
| 200 | | CTS Corp. | | | 3,140 |
| 2,900 | | Cypress Semiconductor Corp.† | | | 48,923 |
| 1,000 | | Datalink Corp.† | | | 7,520 |
| 26,700 | | Dell, Inc.†(a) | | | 669,903 |
| 1,450 | | Diebold, Inc.(a) | | | 67,570 |
| 1,000 | | Digi International, Inc.† | | | 13,790 |
| 850 | | Digitas, Inc.† | | | 11,398 |
| 1,000 | | Ditech Networks, Inc.† | | | 6,920 |
| 1,100 | | DSP Group, Inc.† | | | 23,870 |
| 1,500 | | DST Systems, Inc.†(a) | | | 93,945 |
| 200 | | DTS, Inc.† | | | 4,838 |
| 800 | | Eagle Test Systems, Inc.† | | | 11,664 |
| 621 | | Earthlink, Inc.† | | | 4,409 |
| 13,350 | | eBay, Inc.† | | | 401,434 |
| 100 | | Echelon Corp.† | | | 800 |
| 200 | | eCollege.com, Inc.† | | | 3,130 |
| 200 | | EFJ, Inc.† | | | 1,348 |
| 280 | | eFunds Corp.† | | | 7,700 |
| 4,200 | | Electronic Arts, Inc.† | | | 211,512 |
| 6,300 | | Electronic Data Systems Corp.(a) | | | 173,565 |
| 450 | | Electronics for Imaging† | | | 11,961 |
| 200 | | Embarcadero Technologies, Inc.† | | | 1,224 |
| 30,379 | | EMC Corp.† | | | 401,003 |
| 800 | | Emcore Corp.† | | | 4,424 |
| 550 | | Emulex Corp.† | | | 10,730 |
| 600 | | EndWave Corp.† | | | 6,498 |
| 1,086 | | Entegris, Inc.† | | | 11,751 |
| 1,300 | | Epicor Software Corp.† | | | 17,563 |
| 200 | | EPIQ Systems, Inc.† | | | 3,394 |
| 1,000 | | eSpeed, Inc., Class A† | | | 8,730 |
| 300 | | Exar Corp.† | | | 3,900 |
| 800 | | Extreme Networks† | | | 3,352 |
| 250 | | F5 Networks, Inc.† | | | 18,552 |
| 250 | | Factset Research Systems, Inc. | | | 14,120 |
| 1,544 | | Fair Isaac Corp. | | | 62,764 |
| 2,800 | | Fairchild Semiconductor International, Inc.† | | | 47,068 |
| 100 | | FalconStor Software, Inc.† | | | 865 |
| 200 | | FARO Technologies, Inc.† | | | 4,808 |
| 400 | | FEI Co.† | | | 10,548 |
| 1,993 | | Fidelity National Information Services, Inc. | | | 79,899 |
| 9,629 | | First Data Corp. | | | 245,732 |
| 2,728 | | Fiserv, Inc.† | | | 143,002 |
| 113 | | Flextronics International, Ltd.† | | | 1,297 |
| 650 | | Flir Systems, Inc.† | | | 20,690 |
| 250 | | Formfactor, Inc.† | | | 9,312 |
| 200 | | Forrester Research, Inc.† | | | 5,422 |
| 1,850 | | Foundry Networks, Inc.† | | | 27,713 |
| 400 | | Gartner, Inc.†(a) | | | 7,916 |
| 800 | | Genesis Microchip, Inc.† | | | 8,112 |
| 100 | | Global e-Point, Inc.†(a) | | | 43 |
See Notes to Financial Statements.
74
| | | | |
WILSHIRE MUTUAL FUNDS, INC. DOW JONES WILSHIRE 5000 INDEX PORTFOLIO SCHEDULEOF INVESTMENTS - (CONTINUED) | | December 31, 2006 | | |
| | | | | |
| Shares | | Value |
| |
| Information Technology (continued) | | | |
| 1,000 | | Global Imaging Systems, Inc.† | | $ | 21,950 |
| 650 | | Global Payments, Inc. | | | 30,095 |
| 2,800 | | Google, Inc., Class A† | | | 1,289,344 |
| 1,200 | | Harmonic, Inc.† | | | 8,724 |
| 1,500 | | Harris Corp. | | | 68,790 |
| 1,170 | | Hewitt Associates, Inc., Class A† | | | 30,127 |
| 37,377 | | Hewlett-Packard Co. | | | 1,539,559 |
| 150 | | Hittite Microwave Corp.† | | | 4,848 |
| 100 | | Hutchinson Technology, Inc.† | | | 2,357 |
| 1,800 | | Hypercom Corp.† | | | 11,430 |
| 1,000 | | Hyperion Solutions Corp.† | | | 35,940 |
| 200 | | ID Systems, Inc.† | | | 3,764 |
| 550 | | Ikanos Communications, Inc.† | | | 4,780 |
| 200 | | Imergent, Inc.†(a) | | | 5,728 |
| 650 | | Informatica Corp.† | | | 7,936 |
| 150 | | Infospace, Inc.† | | | 3,076 |
| 1,300 | | infoUSA, Inc. | | | 15,483 |
| 2,500 | | Ingram Micro, Inc., Class A† | | | 51,025 |
| 2,710 | | Integrated Device Technology, Inc.†(a) | | | 41,951 |
| 76,416 | | Intel Corp. | | | 1,547,424 |
| 100 | | Interactive Intelligence, Inc.† | | | 2,242 |
| 300 | | Interdigital Communications Corp.† | | | 10,065 |
| 200 | | Intermec, Inc.† | | | 4,854 |
| 1,000 | | Internap Network Services Corp.† | | | 19,870 |
| 20,920 | | International Business Machines Corp. | | | 2,032,378 |
| 2,300 | | International Rectifier Corp.† | | | 88,619 |
| 1,000 | | Internet Capital Group, Inc.† | | | 10,260 |
| 1,000 | | Interphase Corp.† | | | 8,290 |
| 3,100 | | Intersil Corp., Class A | | | 74,152 |
| 300 | | Inter-Tel, Inc. | | | 6,648 |
| 200 | | Interwoven, Inc.† | | | 2,934 |
| 4,700 | | Intuit, Inc.† | | | 143,397 |
| 1,850 | | Iron Mountain, Inc.†(a) | | | 76,479 |
| 1,300 | | Ixia† | | | 12,480 |
| 1,200 | | IXYS Corp.† | | | 10,680 |
| 700 | | j2 Global Communications, Inc.† | | | 19,075 |
| 2,650 | | Jabil Circuit, Inc. | | | 65,058 |
| 1,400 | | Jack Henry & Associates, Inc. | | | 29,960 |
| 1,928 | | JDS Uniphase Corp.†(a) | | | 32,120 |
| 7,090 | | Juniper Networks, Inc.†(a) | | | 134,285 |
| 400 | | Jupitermedia Corp.† | | | 3,168 |
| 1,200 | | Keane, Inc.† | | | 14,292 |
| 200 | | Keithley Instruments, Inc. | | | 2,630 |
| 1,200 | | Kemet Corp.† | | | 8,760 |
| 1,000 | | KEY Tronic Corp.† | | | 4,780 |
| 200 | | Keynote Systems, Inc.† | | | 2,120 |
| 2,600 | | KLA-Tencor Corp.(a) | | | 129,350 |
| 250 | | Komag, Inc.† | | | 9,470 |
| 500 | | Kulicke & Soffa Industries, Inc.† | | | 4,200 |
| 1,473 | | L-1 Identity Solutions, Inc.†(a) | | | 22,286 |
| 1,900 | | Lam Research Corp.†(a) | | | 96,178 |
| 1,000 | | LaserCard Corp.† | | | 10,710 |
| 1,100 | | Lattice Semiconductor Corp.† | | | 7,128 |
| 3,500 | | Lawson Software, Inc.† | | | 25,865 |
| 800 | | Leadis Technologies, Inc.† | | | 3,752 |
| 200 | | LeCroy Corp.†(a) | | | 2,302 |
| 1,400 | | Lexmark International, Inc., Class A†(a) | | | 102,480 |
| 3,900 | | Linear Technology Corp. | | | 118,248 |
| 100 | | Liquidity Services, Inc.† | | | 1,721 |
| 293 | | Local.com Corp.† | | | 1,187 |
| 200 | | LoJack Corp.† | | | 3,416 |
| 1,000 | | LoopNet, Inc.† | | | 14,980 |
See Notes to Financial Statements.
75
| | | | |
WILSHIRE MUTUAL FUNDS, INC. DOW JONES WILSHIRE 5000 INDEX PORTFOLIO SCHEDULE OF INVESTMENTS - (CONTINUED) | | December 31, 2006 | | |
| | | | | |
| Shares | | | | Value |
| Information Technology (continued) | | | |
| 336 | | Loral Space & Communications, Inc.† | | $ | 13,682 |
| 5,690 | | LSI Logic Corp.†(a) | | | 51,210 |
| 1,000 | | Lumera Corp.†(a) | | | 6,100 |
| 200 | | Macrovision Corp.† | | | 5,652 |
| 300 | | Magma Design Automation, Inc.† | | | 2,679 |
| 200 | | Majesco Entertainment Co.† | | | 266 |
| 700 | | MakeMusic, Inc.† | | | 4,158 |
| 1,000 | | Manhattan Associates, Inc.† | | | 30,080 |
| 300 | | Mantech International Corp., Class A† | | | 11,049 |
| 5,800 | | Marvell Technology Group, Ltd.†(a) | | | 111,302 |
| 900 | | Mastec, Inc.† | | | 10,386 |
| 1,500 | | Mastercard, Inc., Class A | | | 147,735 |
| 900 | | Mattson Technology, Inc.† | | | 8,388 |
| 4,490 | | Maxim Integrated Products, Inc. | | | 137,484 |
| 2,200 | | McAfee, Inc.† | | | 62,436 |
| 200 | | Measurement Specialties, Inc.† | | | 4,328 |
| 2,050 | | MEMC Electronic Materials, Inc.† | | | 80,237 |
| 900 | | Mentor Graphics Corp.† | | | 16,227 |
| 200 | | Mercury Computer Systems, Inc.† | | | 2,672 |
| 200 | | Methode Electronics, Inc. | | | 2,166 |
| 700 | | Micrel, Inc.†(a) | | | 7,546 |
| 2,812 | | Microchip Technology, Inc. | | | 91,952 |
| 9,627 | | Micron Technology, Inc.† | | | 134,393 |
| 1,700 | | Micronetics, Inc.† | | | 13,005 |
| 650 | | Microsemi Corp.†(a) | | | 12,772 |
| 118,540 | | Microsoft Corp. | | | 3,539,604 |
| 1,300 | | Midway Games, Inc.†(a) | | | 9,074 |
| 200 | | Mobility Electronics, Inc.† | | | 670 |
| 200 | | Moldflow Corp.† | | | 2,778 |
| 1,925 | | Molex, Inc. | | | 60,888 |
| 2,300 | | MoneyGram International, Inc. | | | 72,128 |
| 600 | | Monolithic Power Systems, Inc.† | | | 6,666 |
| 1,000 | | MoSys, Inc.† | | | 9,250 |
| 31,241 | | Motorola, Inc. | | | 642,315 |
| 1,600 | | MPS Group, Inc.† | | | 22,688 |
| 800 | | Nanometrics, Inc.† | | | 6,328 |
| 1,300 | | Napco Security Systems, Inc.† | | | 7,631 |
| 175 | | National Instruments Corp. | | | 4,767 |
| 3,300 | | National Semiconductor Corp. | | | 74,910 |
| 650 | | NAVTEQ Corp.† | | | 22,730 |
| 2,100 | | NCR Corp.†(a) | | | 89,796 |
| 700 | | Neomagic Corp† | | | 4,109 |
| 200 | | Neoware, Inc.† | | | 2,642 |
| 1,100 | | Netratings, Inc.† | | | 19,261 |
| 800 | | Netscout Systems, Inc.† | | | 6,640 |
| 4,600 | | Network Appliance, Inc.†(a) | | | 180,688 |
| 200 | | NMS Communications Corp.† | | | 410 |
| 5,984 | | Novell, Inc.† | | | 37,101 |
| 2,223 | | Novellus Systems, Inc.†(a) | | | 76,516 |
| 2,000 | | Nuance Communications, Inc.†(a) | | | 22,920 |
| 100 | | NVE Corp.† | | | 3,072 |
| 5,200 | | NVIDIA Corp.† | | | 192,452 |
| 1,000 | | Occam Networks, Inc.† | | | 16,500 |
| 1,000 | | Omniture, Inc.† | | | 14,080 |
| 450 | | Omnivision Technologies, Inc.†(a) | | | 6,142 |
| 1,300 | | ON Semiconductor Corp.† | | | 9,841 |
| 200 | | Online Resources Corp.† | | | 2,042 |
| 1,211 | | Openwave Systems, Inc.† | | | 11,178 |
| 200 | | Opnet Technologies, Inc.† | | | 2,890 |
| 1,100 | | Opsware, Inc.† | | | 9,702 |
| 1,100 | | Optelecom-NKF, Inc.† | | | 11,539 |
| 53,430 | | Oracle Corp.† | | | 915,790 |
See Notes to Financial Statements.
76
| | | | |
WILSHIRE MUTUAL FUNDS, INC. DOW JONES WILSHIRE 5000 INDEX PORTFOLIO SCHEDULE OF INVESTMENTS - (CONTINUED) | | December 31, 2006 | | |
| | | | | |
| Shares | | | | Value |
| Information Technology (continued) | | | |
| 200 | | OSI Systems, Inc.† | | $ | 4,186 |
| 200 | | Overland Storage, Inc.† | | | 900 |
| 1,230 | | Palm, Inc.†(a) | | | 17,331 |
| 700 | | PAR Technology Corp.† | | | 6,314 |
| 1,040 | | Parametric Technology Corp.† | | | 18,741 |
| 800 | | Parkervision, Inc.†(a) | | | 8,920 |
| 100 | | Paxar Corp.† | | | 2,306 |
| 4,800 | | Paychex, Inc. | | | 189,792 |
| 200 | | Pericom Semiconductor Corp.† | | | 2,294 |
| 650 | | Perot Systems Corp., Class A† | | | 10,654 |
| 41 | | PFSweb, Inc.† | | | 45 |
| 200 | | Phoenix Technologies, Ltd.† | | | 900 |
| 100 | | Photon Dynamics, Inc.† | | | 1,169 |
| 1,000 | | Photronics, Inc.† | | | 16,340 |
| 100 | | Pixelworks, Inc.† | | | 229 |
| 200 | | Planar Systems, Inc.† | | | 1,934 |
| 350 | | Plantronics, Inc. | | | 7,420 |
| 200 | | PLATO Learning, Inc.† | | | 1,082 |
| 450 | | Plexus Corp.† | | | 10,746 |
| 200 | | PLX Technology, Inc.† | | | 2,608 |
| 3,350 | | PMC - Sierra, Inc.† | | | 22,478 |
| 750 | | Polycom, Inc.†(a) | | | 23,182 |
| 1,200 | | Portalplayer, Inc.† | | | 16,140 |
| 1,100 | | Power Integrations, Inc.† | | | 25,795 |
| 880 | | Powerwave Technologies, Inc.† | | | 5,676 |
| 200 | | QAD, Inc. | | | 1,678 |
| 2,700 | | QLogic Corp.† | | | 59,184 |
| 22,150 | | QUALCOMM, Inc. | | | 837,048 |
| 1,000 | | Quest Software, Inc.† | | | 14,650 |
| 600 | | Radiant Systems, Inc.† | | | 6,264 |
| 1,850 | | Rambus, Inc.†(a) | | | 35,020 |
| 1,826 | | RealNetworks, Inc.† | | | 19,976 |
| 2,090 | | Red Hat, Inc.† | | | 48,070 |
| 550 | | Redback Networks, Inc.† | | | 13,717 |
| 1,000 | | Relm Wireless Corp.† | | | 5,980 |
| 89 | | REMEC, Inc. | | | 117 |
| 1,000 | | Renaissance Learning, Inc. | | | 17,730 |
| 2,900 | | RF Micro Devices, Inc.† | | | 19,691 |
| 1,000 | | RightNow Technologies, Inc.† | | | 17,220 |
| 440 | | Rudolph Technologies, Inc.† | | | 7,005 |
| 1,700 | | S1 Corp.† | | | 9,367 |
| 2,080 | | Sabre Holdings Corp., Class A | | | 66,331 |
| 500 | | Salesforce.com, Inc.†(a) | | | 18,225 |
| 2,200 | | SanDisk Corp.† | | | 94,666 |
| 3,076 | | Sanmina-SCI Corp.† | | | 10,612 |
| 6,509 | | Seagate Technology | | | 172,488 |
| 300 | | Secure Computing Corp.† | | | 1,968 |
| 200 | | Semitool, Inc.† | | | 2,662 |
| 1,050 | | Semtech Corp.† | | | 13,724 |
| 1,600 | | Sento Corp.† | | | 3,664 |
| 200 | | Sigmatel, Inc.† | | | 876 |
| 1,700 | | Silicon Image, Inc.† | | | 21,624 |
| 800 | | Silicon Laboratories, Inc.† | | | 27,720 |
| 200 | | Silicon Storage Technology, Inc.† | | | 902 |
| 1,000 | | SimpleTech, Inc.†(a) | | | 12,680 |
| 700 | | Sirenza Microdevices, Inc.† | | | 5,502 |
| 350 | | Sirf Technology Holdings, Inc.†(a) | | | 8,932 |
| 2,082 | | Skyworks Solutions, Inc.† | | | 14,741 |
| 800 | | Smart Modular Technologies WWH, Inc.† | | | 10,768 |
| 800 | | Smith Micro Software, Inc.† | | | 11,352 |
| 6,218 | | Solectron Corp.† | | | 20,022 |
| 1,000 | | SonicWALL, Inc.† | | | 8,420 |
| 2,000 | | Spansion, Inc., Class A† | | | 29,720 |
| 200 | | Spectralink Corp.† | | | 1,720 |
| 200 | | SRA International, Inc., Class A† | | | 5,348 |
| 300 | | Staktek Holdings, Inc.† | | | 1,545 |
See Notes to Financial Statements.
77
| | | | |
WILSHIRE MUTUAL FUNDS, INC. DOW JONES WILSHIRE 5000 INDEX PORTFOLIO SCHEDULE OF INVESTMENTS - (CONTINUED) | | December 31, 2006 | | |
| | | | | |
| Shares | | | | Value |
| Information Technology (continued) | | | |
| 200 | | Standard Microsystems Corp.† | | $ | 5,596 |
| 35,700 | | Sun Microsystems, Inc.† | | | 193,494 |
| 1,000 | | Sunpower Corp., Class A†(a) | | | 37,170 |
| 850 | | Sybase, Inc.† | | | 20,995 |
| 550 | | SYKES Enterprises, Inc.† | | | 9,702 |
| 13,333 | | Symantec Corp.† | | | 277,993 |
| 2,838 | | Symbol Technologies, Inc. | | | 42,400 |
| 100 | | Symmetricom, Inc.† | | | 892 |
| 200 | | Synaptics, Inc.† | | | 5,938 |
| 1,000 | | Synchronoss Technologies, Inc.† | | | 13,720 |
| 1,100 | | SYNNEX Corp.† | | | 24,134 |
| 1,392 | | Synopsys, Inc.† | | | 37,208 |
| 1,000 | | Syntel, Inc. | | | 26,800 |
| 1,200 | | Take-Two Interactive Software, Inc.†(a) | | | 21,312 |
| 375 | | Talx Corp. | | | 10,294 |
| 1,000 | | Tech Data Corp.† | | | 37,870 |
| 700 | | Tekelec† | | | 10,381 |
| 550 | | Tektronix, Inc. | | | 16,044 |
| 6,304 | | Tellabs, Inc.† | | | 64,679 |
| 1,800 | | Teradyne, Inc.† | | | 26,928 |
| 200 | | Tessera Technologies, Inc.† | | | 8,068 |
| 20,272 | | Texas Instruments, Inc. | | | 583,834 |
| 300 | | THQ, Inc.† | | | 9,756 |
| 3,150 | | TIBCO Software, Inc.† | | | 29,736 |
| 100 | | Tier Technologies, Inc., Class B† | | | 640 |
| 200 | | TNS, Inc.† | | | 3,850 |
| 1,000 | | Traffic.com, Inc.† | | | 7,980 |
| 150 | | Transaction Systems Architects, Inc.† | | | 4,886 |
| 250 | | Travelzoo, Inc.† | | | 7,488 |
| 1,000 | | Trident Microsystems, Inc.†(a) | | | 18,180 |
| 1,500 | | Trimble Navigation, Ltd.† | | | 76,095 |
| 1,000 | | Trio-Tech International | | | 11,250 |
| 700 | | TRX, Inc.† | | | 4,669 |
| 900 | | TTM Technologies, Inc.† | | | 10,197 |
| 600 | | Ulticom, Inc.† | | | 5,754 |
| 800 | | Unica Corp.† | | | 10,360 |
| 4,170 | | Unisys Corp.† | | | 32,693 |
| 700 | | United Online, Inc. | | | 9,296 |
| 800 | | Utstarcom, Inc.†(a) | | | 7,000 |
| 655 | | Valueclick, Inc.†(a) | | | 15,478 |
| 700 | | Varian Semiconductor Equipment Associates, Inc.†(a) | | | 31,864 |
| 1,000 | | VeriFone Holdings, Inc.†(a) | | | 35,400 |
| 300 | | Verint Systems, Inc.† | | | 10,284 |
| 3,216 | | VeriSign, Inc.† | | | 77,345 |
| 1,000 | | Versant Corp.† | | | 13,620 |
| 400 | | Viasat, Inc.† | | | 11,924 |
| 550 | | Vignette Corp.† | | | 9,388 |
| 800 | | Virage Logic Corp.† | | | 7,432 |
| 1,456 | | Vishay Intertechnology, Inc.† | | | 19,714 |
| 700 | | Vocus, Inc.† | | | 11,760 |
| 400 | | Volterra Semiconductor Corp.† | | | 6,000 |
| 150 | | WebEx Communications, Inc.† | | | 5,234 |
| 100 | | webMethods, Inc.† | | | 736 |
| 1,500 | | Websense, Inc.† | | | 34,245 |
| 800 | | WebSideStory, Inc.† | | | 10,128 |
| 800 | | Website Pros, Inc.† | | | 7,240 |
| 2,500 | | Western Digital Corp.† | | | 51,150 |
| 19,629 | | Western Union Co. (The) | | | 440,082 |
| 700 | | Wind River Systems, Inc.† | | | 7,175 |
| 300 | | Wireless Xcessories Group† | | | 885 |
| 100 | | Witness Systems, Inc.† | | | 1,753 |
| 700 | | WPCS International, Inc.† | | | 7,189 |
| 700 | | Wright Express Corp.†(a) | | | 21,819 |
| 11,900 | | Xerox Corp.† | | | 201,705 |
| 4,850 | | Xilinx, Inc. | | | 115,478 |
| 17,250 | | Yahoo!, Inc.† | | | 440,565 |
See Notes to Financial Statements.
78
| | | | |
WILSHIRE MUTUAL FUNDS, INC. DOW JONES WILSHIRE 5000 INDEX PORTFOLIO SCHEDULE OF INVESTMENTS - (CONTINUED) | | December 31, 2006 | | |
| | | | | |
| Shares | | | | Value |
| Information Technology (continued) | | | |
| 875 | | Zebra Technologies Corp., Class A† | | $ | 30,441 |
| 1,000 | | Zoran Corp.† | | | 14,580 |
| | | | | |
| | | 31,446,457 |
| | | | | |
| Materials — 3.3% | | | |
| 3,050 | | Air Products & Chemicals, Inc. | | | 214,354 |
| 870 | | Airgas, Inc. | | | 35,252 |
| 950 | | AK Steel Holding Corp.† | | | 16,055 |
| 300 | | Albemarle Corp. | | | 21,540 |
| 11,048 | | Alcoa, Inc. | | | 331,550 |
| 1,200 | | Allegheny Technologies, Inc. | | | 108,816 |
| 1,000 | | AMCOL International Corp. | | | 27,740 |
| 600 | | American Vanguard Corp . | | | 9,540 |
| 1,900 | | Aptargroup, Inc. | | | 112,176 |
| 1,400 | | Ashland, Inc. | | | 96,852 |
| 2,750 | | Ball Corp. | | | 119,900 |
| 2,550 | | Bemis Co. | | | 86,649 |
| 550 | | Bowater, Inc.(a) | | | 12,375 |
| 350 | | Brush Engineered Materials, Inc.† | | | 11,820 |
| 1,500 | | Cabot Corp. | | | 65,355 |
| 450 | | Castle (A.M.) & Co. | | | 11,452 |
| 1,700 | | Celanese Corp., Class A | | | 43,996 |
| 1,000 | | CF Industries Holdings, Inc. | | | 25,640 |
| 1,895 | | Chemtura Corp. | | | 18,249 |
| 200 | | Cleveland-Cliffs, Inc.(a) | | | 9,688 |
| 2,200 | | Commercial Metals Co. | | | 56,760 |
| 1,400 | | Crown Holdings, Inc.† | | | 29,288 |
| 1,500 | | Deltic Timber Corp. | | | 83,670 |
| 12,711 | | Dow Chemical Co. (The) | | | 507,677 |
| 12,100 | | du Pont (E.I.) de Nemours & Co.(a) | | | 589,391 |
| 900 | | Eagle Materials, Inc. | | | 38,907 |
| 1,500 | | Eastman Chemical Co. | | | 88,965 |
| 2,600 | | Ecolab, Inc. | | | 117,520 |
| 800 | | Empire Resources, Inc.(a) | | | 8,752 |
| 950 | | Florida Rock Industries, Inc. | | | 40,898 |
| 4,300 | | Freeport-McMoRan Copper & Gold, Inc., Class B(a) | | | 239,639 |
| 1,700 | | Friedman Industries | | | 20,570 |
| 1,100 | | Glatfelter | | | 17,050 |
| 400 | | H.B. Fuller Co. | | | 10,328 |
| 1,000 | | Hecla Mining Co.† | | | 7,660 |
| 900 | | Hercules, Inc.† | | | 17,379 |
| 1,400 | | Huntsman Corp.† | | | 26,558 |
| 800 | | International Flavors & Fragrances, Inc. | | | 39,328 |
| 5,792 | | International Paper Co.(a) | | | 197,507 |
| 472 | | Kronos Worldwide, Inc. | | | 15,368 |
| 900 | | Louisiana-Pacific Corp.(a) | | | 19,377 |
| 2,300 | | Lubrizol Corp. | | | 115,299 |
| 2,755 | | Lyondell Chemical Co. | | | 70,445 |
| 2,776 | | MeadWestvaco Corp. | | | 83,447 |
| 1,150 | | Meridian Gold, Inc.† | | | 31,959 |
| 7,080 | | Monsanto Co. | | | 371,912 |
| 1,300 | | Mosaic Co. (The)† | | | 27,768 |
| 700 | | Myers Industries, Inc. | | | 10,962 |
| 2,850 | | Nalco Holding Co.† | | | 58,311 |
| 1,300 | | Nanophase Technologies Corp.† | | | 7,761 |
| 5,100 | | Newmont Mining Corp.(a) | | | 230,265 |
| 1,000 | | NL Industries | | | 10,340 |
| 200 | | Northwest Pipe Co.† | | | 6,724 |
| 3,170 | | Nucor Corp.(a) | | | 173,272 |
| 1,770 | | Olin Corp. | | | 29,240 |
| 1,200 | | Olympic Steel, Inc. | | | 26,676 |
| 1,200 | | Owens-Illinois, Inc.† | | | 22,140 |
| 1,300 | | Packaging Corp. of America | | | 28,730 |
| 2,150 | | Pactiv Corp.† | | | 76,734 |
| 3,190 | | Phelps Dodge Corp. | | | 381,907 |
| 1,000 | | PolyOne Corp.† | | | 7,500 |
| 2,400 | | PPG Industries, Inc. | | | 154,104 |
| 4,950 | | Praxair, Inc. | | | 293,684 |
See Notes to Financial Statements.
79
| | | | |
WILSHIRE MUTUAL FUNDS, INC. DOW JONES WILSHIRE 5000 INDEX PORTFOLIO SCHEDULE OF INVESTMENTS - (CONTINUED) | | December 31, 2006 | | |
| | | | | |
| Shares | | | | Value |
| Materials (continued) | | | |
| 1,000 | | Reliance Steel & Aluminum Co. | | $ | 39,380 |
| 1,958 | | Rohm & Haas Co. | | | 100,093 |
| 1,000 | | Royal Gold, Inc.(a) | | | 35,980 |
| 1,100 | | RPM International, Inc.(a) | | | 22,979 |
| 1,000 | | Ryerson, Inc. | | | 25,090 |
| 400 | | Schulman (A.), Inc. | | | 8,900 |
| 400 | | Scotts Miracle-Gro Co. (The), Class A | | | 20,660 |
| 1,300 | | Sealed Air Corp. | | | 84,396 |
| 1,200 | | Sigma-Aldrich Corp. | | | 93,264 |
| 2,800 | | Smurfit-Stone Container Corp.† | | | 29,568 |
| 750 | | Sonoco Products Co. | | | 28,545 |
| 400 | | Southern Copper Corp. | | | 21,556 |
| 900 | | Steel Dynamics, Inc. | | | 29,205 |
| 1,100 | | Steel Technologies, Inc. | | | 19,305 |
| 700 | | Stillwater Mining Co.† | | | 8,743 |
| 1,100 | | Symyx Technologies, Inc.† | | | 23,749 |
| 1,700 | | Temple-Inland, Inc. | | | 78,251 |
| 1,200 | | Terra Industries, Inc.† | | | 14,376 |
| 150 | | Texas Industries, Inc.(a) | | | 9,634 |
| 1,000 | | Titanium Metals Corp.†(a) | | | 29,510 |
| 700 | | Tronox, Inc., Class A | | | 11,193 |
| 50 | | United States Lime & Minerals, Inc.† | | | 1,508 |
| 1,900 | | United States Steel Corp. | | | 138,966 |
| 1,000 | | Universal Stainless & Alloy Products, Inc.† | | | 33,480 |
| 1,000 | | Valhi, Inc. | | | 25,980 |
| 700 | | Valspar Corp. | | | 19,348 |
| 1,000 | | Vista Gold Corp.† | | | 8,630 |
| 1,400 | | Vulcan Materials Co.(a) | | | 125,818 |
| 100 | | W.R. Grace & Co.† | | | 1,980 |
| 700 | | Wausau Paper Corp. | | | 10,493 |
| 400 | | Westlake Chemical Corp. | | | 12,552 |
| 4,050 | | Weyerhaeuser Co. | | | 286,133 |
| 400 | | Wheeling-Pittsburgh Corp.† | | | 7,492 |
| 950 | | Worthington Industries, Inc. | | | 16,834 |
| | | | | |
| | | | | 7,194,362 |
| | | | | |
| Telecommunication Services — 3.2% | | | |
| 200 | | @Road, Inc.† | | | 1,460 |
| 700 | | Alaska Communications Systems Group, Inc. | | | 10,633 |
| 4,801 | | Alltel Corp.(a) | | | 290,364 |
| 5,150 | | American Tower Corp., Class A† | | | 191,992 |
| 51,958 | | AT&T, Inc.(a). | | | 1,857,499 |
| 1,000 | | Atlantic Tele-Network, Inc. | | | 29,300 |
| 24,050 | | BellSouth Corp. | | | 1,132,996 |
| 200 | | Boston Communications Group† | | | 500 |
| 700 | | Broadwing Corp.†(a) | | | 10,934 |
| 400 | | Centennial Communications Corp. | | | 2,876 |
| 1,800 | | CenturyTel, Inc. | | | 78,588 |
| 4,800 | | Citizens Communications Co. | | | 68,976 |
| 300 | | Cogent Communications Group, Inc.† | | | 4,866 |
| 100 | | Commonwealth Telephone Enterprises, Inc. | | | 4,186 |
| 700 | | Consolidated Communications Holdings, Inc. | | | 14,630 |
| 2,600 | | Crown Castle International Corp.†(a) | | | 83,980 |
| 1,000 | | CT Communications, Inc. | | | 22,920 |
| 700 | | D&E Communications, Inc. | | | 8,855 |
| 3,100 | | Dobson Communications Corp., Class A† | | | 27,001 |
| 1,557 | | EMBARQ Corp. | | | 81,836 |
| 800 | | Eschelon Telecom, Inc.† | | | 15,848 |
| 200 | | Fairpoint Communications, Inc. | | | 3,790 |
| 700 | | FiberTower Corp.† | | | 4,116 |
See Notes to Financial Statements.
80
| | | | |
WILSHIRE MUTUAL FUNDS, INC. DOW JONES WILSHIRE 5000 INDEX PORTFOLIO SCHEDULE OF INVESTMENTS - (CONTINUED) | | December 31, 2006 | | |
| | | | | |
| Shares | | | | Value |
| Telecommunication Services (continued) | | | |
| 700 | | General Communication, Inc., Class A† | | $ | 11,011 |
| 200 | | Global Crossing, Ltd.† | | | 4,910 |
| 1,000 | | Globalstar, Inc.† | | | 13,910 |
| 600 | | GoAmerica, Inc.† | | | 4,896 |
| 600 | | IDT Corp., Class B† | | | 7,848 |
| 1,000 | | InPhonic, Inc.†(a) | | | 11,090 |
| 600 | | Iowa Telecommunications Services, Inc. | | | 11,826 |
| 1,300 | | Leap Wireless International, Inc.† | | | 77,311 |
| 5,600 | | Level 3 Communications, Inc.† | | | 31,360 |
| 800 | | NeuStar, Inc., Class A† | | | 25,952 |
| 1,700 | | NII Holdings, Inc.†(a) | | | 109,548 |
| 200 | | North Pittsburgh Systems, Inc. | | | 4,828 |
| 700 | | NTELOS Holdings Corp.† | | | 12,516 |
| 700 | | Premiere Global Services, Inc.† | | | 6,608 |
| 600 | | Price Communications Corp. | | | 12,630 |
| 22,820 | | Qwest Communications International, Inc.†(a) | | | 191,003 |
| 2,750 | | SBA Communications Corp., Class A† | | | 75,625 |
| 39,254 | | Sprint Nextel Corp.(a) | | | 741,513 |
| 200 | | SureWest Communications | | | 5,508 |
| 700 | | Syniverse Holdings, Inc.† | | | 10,493 |
| 1,270 | | Telephone & Data Systems, Inc. | | | 68,999 |
| 900 | | Time Warner Telecom, Inc., Class A† | | | 17,937 |
| 1,000 | | US LEC Corp. Class A† | | | 9,310 |
| 400 | | USA Mobility, Inc. | | | 8,948 |
| 38,796 | | Verizon Communications, Inc. | | | 1,444,763 |
| 1,000 | | Vonage Holdings Corp.† | | | 6,940 |
| 6,278 | | Windstream Corp. | | | 89,273 |
| 200 | | Wireless Facilities, Inc.† | | | 570 |
| | | | | |
| | | | | 6,965,272 |
| | | | | |
| |
| Utilities — 3.7% | | | |
| 8,885 | | AES Corp. (The)† | | | 195,825 |
| 900 | | AGL Resources, Inc. | | | 35,019 |
| 1,900 | | Allegheny Energy, Inc.† | | | 87,229 |
| 1,000 | | Alliant Energy Corp. | | | 37,770 |
| 2,700 | | Ameren Corp. | | | 145,071 |
| 5,530 | | American Electric Power Co., Inc. | | | 235,467 |
| 1,521 | | Aqua America, Inc.(a) | | | 34,648 |
| 2,300 | | Atmos Energy Corp. | | | 73,393 |
| 700 | | Avista Corp.(a) | | | 17,717 |
| 200 | | California Water Service Group | | | 8,080 |
| 3,100 | | Centerpoint Energy, Inc.(a) | | | 51,398 |
| 400 | | Cleco Corp. | | | 10,092 |
| 2,000 | | CMS Energy Corp.†(a) | | | 33,400 |
| 3,300 | | Consolidated Edison, Inc.(a) | | | 158,631 |
| 2,500 | | Constellation Energy Group, Inc.(a) | | | 172,175 |
| 4,995 | | Dominion Resources, Inc.(a) | | | 418,781 |
| 1,400 | | DPL, Inc. | | | 38,892 |
| 2,500 | | DTE Energy Co. | | | 121,025 |
| 16,382 | | Duke Energy Corp. | | | 544,046 |
| 700 | | Duquesne Light Holdings, Inc. | | | 13,895 |
| 4,350 | | Edison International | | | 197,838 |
| 700 | | El Paso Electric Co.† | | | 17,059 |
| 500 | | Empire District Electric Co. (The) | | | 12,345 |
| 2,140 | | Energen Corp. | | | 100,452 |
| 1,200 | | Energy East Corp. | | | 29,760 |
| 3,000 | | Entergy Corp. | | | 276,960 |
| 1,900 | | Equitable Resources, Inc.(a) | | | 79,325 |
See Notes to Financial Statements.
81
| | | | |
WILSHIRE MUTUAL FUNDS, INC. DOW JONES WILSHIRE 5000 INDEX PORTFOLIO SCHEDULE OF INVESTMENTS - (CONTINUED) | | December 31, 2006 | | |
| | | | | | |
| Shares | | | | Value | |
| Utilities (continued) | | | | |
| 8,574 | | Exelon Corp.(a) | | $ | 530,645 | |
| 4,750 | | FirstEnergy Corp. | | | 286,425 | |
| 4,760 | | FPL Group, Inc.(a) | | | 259,039 | |
| 700 | | Great Plains Energy, Inc. | | | 22,260 | |
| 2,300 | | Hawaiian Electric Industries, Inc. | | | 62,445 | |
| 800 | | IDACORP, Inc. | | | 30,920 | |
| 2,300 | | KeySpan Corp. | | | 94,714 | |
| 3,225 | | MDU Resources Group, Inc. | | | 82,689 | |
| 2,700 | | Mirant Corp.† | | | 85,239 | |
| 900 | | National Fuel Gas Co.(a) | | | 34,686 | |
| 3,390 | | NiSource, Inc. | | | 81,699 | |
| 1,100 | | Northeast Utilities | | | 30,976 | |
| 1,500 | | NRG Energy, Inc.†(a) | | | 84,015 | |
| 1,690 | | NSTAR(a) | | | 58,068 | |
| 900 | | OGE Energy Corp. | | | 36,000 | |
| 2,600 | | ONEOK, Inc. | | | 112,112 | |
| 100 | | Ormat Technologies, Inc. | | | 3,682 | |
| 2,600 | | Pepco Holdings, Inc. | | | 67,626 | |
| 4,700 | | PG&E Corp.(a) | | | 222,451 | |
| 400 | | Piedmont Natural Gas Co. | | | 10,700 | |
| 2,500 | | Pinnacle West Capital Corp.(a) | | | 126,725 | |
| 700 | | PNM Resources, Inc. | | | 21,770 | |
| 5,400 | | PPL Corp. | | | 193,536 | |
| 3,341 | | Progress Energy, Inc.(a) | | | 163,976 | |
| 3,200 | | Public Service Enterprise Group, Inc.(a) | | | 212,416 | |
| 900 | | Puget Energy, Inc. | | | 22,824 | |
| 1,600 | | Questar Corp.(a) | | | 132,880 | |
| 3,929 | | Reliant Energy, Inc.† | | | 55,831 | |
| 2,579 | | SCANA Corp. | | | 104,759 | |
| 2,900 | | Sempra Energy | | | 162,516 | |
| 1,900 | | Sierra Pacific Resources† | | | 31,977 | |
| 1,000 | | SJW Corp. | | | 38,760 | |
| 10,450 | | Southern Co. (The)(a) | | | 385,187 | |
| 2,672 | | Southern Union Co.(a) | | | 74,683 | |
| 1,130 | | Southwest Water Co. | | | 15,549 | |
| 3,500 | | TECO Energy, Inc. | | | 60,305 | |
| 6,090 | | TXU Corp. | | | 330,139 | |
| 1,200 | | UGI Corp. | | | 32,736 | |
| 2,233 | | Vectren Corp. | | | 63,149 | |
| 2,400 | | Westar Energy, Inc. | | | 62,304 | |
| 350 | | WGL Holdings, Inc. | | | 11,403 | |
| 1,700 | | Wisconsin Energy Corp. | | | 80,682 | |
| 5,025 | | Xcel Energy, Inc. | | | 115,877 | |
| | | | | | |
| | | | | 7,842,668 | |
| | | | | | |
| Total Common Stock | | | | |
| (Cost $ 155,029,071) | | | 212,663,814 | |
| | | | | | |
| WARRANTS — 0.0%# | | | | |
| | |
| 211 | | Expedia, Inc. expire 02/04/09† | | | 418 | |
| 211 | | IAC/InterActiveCorp. expire 02/04/09† | | | 859 | |
| | | | | | |
| Total Warrants | | | | |
| (Cost $ 1,075) | | | 1,277 | |
| | | | | | |
| MONEY MARKET FUND — 22.2% | | | | |
| | |
| 47,494,793 | | PNC Institutional Money | | | | |
| | Market Trust 5.30% | | | | |
| | (Cost $47,494,793)(b) | | | 47,494,793 | |
| | | | | | |
| Total Investments — 121.5% | | | | |
| (Cost $ 202,524,939) | | | 260,159,884 | |
| Other Assets & Liabilities, | | | | |
| Net — (21.5)% | | | (46,099,437 | ) |
| | | | | | |
| NET ASSETS — 100.0% | | $ | 214,060,447 | |
| | | | | | |
| † | Non-income producing security. |
| (a) | All or a portion of this security is on loan. |
| (b) | Investment purchased with proceeds from collateral received from securities on loan. |
| # | Amount represents less than 0.1% of net assets. |
See Notes to Financial Statements.
82
| | |
WILSHIRE MUTUAL FUNDS, INC. STATEMENTSOF ASSETSAND LIABILITIES December 31, 2006 | | |
| | | | | | | | | | | | | | | | | |
| | | LARGE
COMPANY
GROWTH
PORTFOLIO | | | LARGE
COMPANY
VALUE
PORTFOLIO | | SMALL
COMPANY
GROWTH
PORTFOLIO | | SMALL
COMPANY
VALUE
PORTFOLIO | | DOW JONES
WILSHIRE 5000 INDEX
PORTFOLIO | |
ASSETS: | | | | | | | | | | | | | | | | | |
Investments in securities, at value | | $ | 603,600,352 | | | $ | 80,704,787 | | $ | 15,705,248 | | $ | 24,731,312 | | $ | 212,665,091 | |
Investments of collateral, at value | | | — | | | | 11,586,096 | | | 2,552,576 | | | 2,428,374 | | | 47,494,793 | |
| | | | | | | | | | | | | | | | | |
Investments, at value (Note 1) | | $ | 603,600,352 | | | $ | 92,290,883 | | $ | 18,257,824 | | $ | 27,159,686 | | $ | 260,159,884 | |
Cash | | | 453,180 | | | | 541,115 | | | 158,433 | | | 378,925 | | | 1,215,293 | |
Cash on deposit for futures contracts (Note 1) | | | 210,271 | | | | — | | | — | | | — | | | — | |
Receivable for Portfolio shares sold | | | 942,794 | | | | 2,685,074 | | | — | | | — | | | 243,108 | |
Receivable for investment securities sold | | | — | | | | 55,371 | | | — | | | 93,681 | | | — | |
Dividends and interest receivable | | | 609,644 | | | | 109,746 | | | 11,645 | | | 36,018 | | | 291,212 | |
Prepaid expenses and other assets | | | 27,713 | | | | 18,301 | | | 16,815 | | | 17,935 | | | 27,718 | |
| | | | | | | | | | | | | | | | | |
Total Assets | | | 605,843,954 | | | | 95,700,490 | | | 18,444,717 | | | 27,686,245 | | | 261,937,215 | |
| | | | | | | | | | | | | | | | | |
| | | | | |
LIABILITIES: | | | | | | | | | | | | | | | | | |
Payable for Portfolio shares redeemed | | | 539,688 | | | | 127,989 | | | 119,967 | | | 109,742 | | | 217,361 | |
Payable for investment securities purchased | | | 27 | | | | — | | | — | | | 100,938 | | | — | |
Payable for collateral from securities loaned | | | — | | | | 11,586,096 | | | 2,552,576 | | | 2,428,374 | | | 47,494,793 | |
Investment advisory fee payable (Note 2) | | | 387,236 | | | | 51,543 | | | 2,024 | | | 5,340 | | | 16,800 | |
Distribution and service fees payable (Note 3) | | | 143,632 | | | | 20,301 | | | 5,912 | | | 8,446 | | | 66,384 | |
Custody fees payable | | | 20,382 | | | | 4,489 | | | 3,498 | | | 3,491 | | | 15,308 | |
Variation margin | | | 1,080 | | | | — | | | — | | | — | | | — | |
Accrued expenses and other payables | | | 135,985 | | | | 30,048 | | | 11,711 | | | 15,389 | | | 66,122 | |
| | | | | | | | | | | | | | | | | |
Total Liabilities | | | 1,228,030 | | | | 11,820,466 | | | 2,695,688 | | | 2,671,720 | | | 47,876,768 | |
| | | | | | | | | | | | | | | | | |
NET ASSETS | | $ | 604,615,924 | | | $ | 83,880,024 | | $ | 15,749,029 | | $ | 25,014,525 | | $ | 214,060,447 | |
| | | | | | | | | | | | | | | | | |
| | | | | |
NET ASSETS consist of: | | | | | | | | | | | | | | | | | |
Undistributed accumulated net investment income | | $ | — | | | $ | 4,526 | | $ | — | | $ | — | | $ | 328,129 | |
Accumulated net realized gain/(loss) on investments sold and futures contracts | | | (9,771,338 | ) | | | 1,638,640 | | | 415,244 | | | 547,798 | | | (26,599,411 | ) |
Net unrealized appreciation of investments and futures contracts | | | 112,417,209 | | | | 15,988,418 | | | 2,393,609 | | | 3,702,840 | | | 57,634,945 | |
Paid-in capital | | | 501,970,053 | | | | 66,248,440 | | | 12,940,176 | | | 20,763,887 | | | 182,696,784 | |
| | | | | | | | | | | | | | | | | |
NET ASSETS | | $ | 604,615,924 | | | $ | 83,880,024 | | $ | 15,749,029 | | $ | 25,014,525 | | $ | 214,060,447 | |
| | | | | | | | | | | | | | | | | |
| | | | | |
Investments, at cost (Note 1) | | $ | 491,183,785 | | | $ | 76,302,465 | | $ | 15,864,215 | | $ | 23,456,846 | | $ | 202,524,939 | |
Market value of securities on loan (Note 1) | | $ | — | | | $ | 11,188,217 | | $ | 2,445,106 | | $ | 2,317,587 | | $ | 46,110,213 | |
See Notes to Financial Statements.
83
| | |
WILSHIRE MUTUAL FUNDS, INC. STATEMENTSOF ASSETS AND LIABILITIES - (Continued) December 31, 2006 | | |
| | | | | | | | | | | | | | | |
| | | LARGE
COMPANY
GROWTH
PORTFOLIO | | LARGE
COMPANY
VALUE
PORTFOLIO | | SMALL
COMPANY
GROWTH
PORTFOLIO | | SMALL
COMPANY
VALUE
PORTFOLIO | | DOW JONES
WILSHIRE 5000 INDEX
PORTFOLIO |
NET ASSETS: | | | | | | | | | | | | | | | |
Investment Class shares | | $ | 379,226,045 | | $ | 76,481,483 | | $ | 15,553,261 | | $ | 23,639,080 | | $ | 145,952,090 |
| | | | | | | | | | | | | | | |
(50,000,000 shares authorized, per class, per Portfolio, par value $.001 per share) | | | | | | | | | | | | | | | |
Institutional Class shares | | $ | 225,389,879 | | $ | 7,398,541 | | $ | 195,768 | | $ | 1,375,445 | | $ | 65,177,390 |
| | | | | | | | | | | | | | | |
(50,000,000 shares authorized, per class, per Portfolio, par value $.001 per share) | | | | | | | | | | | | | | | |
Qualified Class shares | | | N/A | | | N/A | | | N/A | | | N/A | | $ | 1,114,361 |
| | | | | | | | | | | | | | | |
(10,000,000 shares authorized, per class, per Portfolio, par value $.001 per share) | | | | | | | | | | | | | | | |
Horace Mann Class shares | | | N/A | | | N/A | | | N/A | | | N/A | | $ | 1,816,606 |
| | | | | | | | | | | | | | | |
(10,000,000 shares authorized, per class, per Portfolio, par value $.001 per share) | | | | | | | | | | | | | | | |
| | | | | |
SHARES OUTSTANDING: | | | | | | | | | | | | | | | |
Investment Class shares | | | 10,476,112 | | | 3,326,090 | | | 890,553 | | | 1,259,252 | | | 12,140,886 |
| | | | | | | | | | | | | | | |
Institutional Class shares | | | 6,117,800 | | | 321,163 | | | 10,917 | | | 72,783 | | | 5,422,725 |
| | | | | | | | | | | | | | | |
Qualified Class shares | | | N/A | | | N/A | | | N/A | | | N/A | | | 92,698 |
| | | | | | | | | | | | | | | |
Horace Mann Class shares | | | N/A | | | N/A | | | N/A | | | N/A | | | 151,571 |
| | | | | | | | | | | | | | | |
| | | | | |
INVESTMENT CLASS SHARES: | | | | | | | | | | | | | | | |
Net asset value, offering and redemption price per share | | $ | 36.20 | | $ | 22.99 | | $ | 17.46 | | $ | 18.77 | | $ | 12.02 |
| | | | | | | | | | | | | | | |
| | | | | |
INSTITUTIONAL CLASS SHARES: | | | | | | | | | | | | | | | |
Net asset value, offering and redemption price per share | | $ | 36.84 | | $ | 23.04 | | $ | 17.93 | | $ | 18.90 | | $ | 12.02 |
| | | | | | | | | | | | | | | |
| | | | | |
QUALIFIED CLASS SHARES: | | | | | | | | | | | | | | | |
Net asset value, offering and redemption price per share | | | N/A | | | N/A | | | N/A | | | N/A | | $ | 12.02 |
| | | | | | | | | | | | | | | |
| | | | | |
HORACE MANN CLASS SHARES: | | | | | | | | | | | | | | | |
Net asset value, offering and redemption price per share | | | N/A | | | N/A | | | N/A | | | N/A | | $ | 11.99 |
| | | | | | | | | | | | | | | |
See Notes to Financial Statements.
84
| | |
WILSHIRE MUTUAL FUNDS, INC. STATEMENTSOF OPERATIONS For the Year Ended December 31, 2006 | | |
| | | | | | | | | | | | | | | | | | | | |
| | | LARGE
COMPANY
GROWTH
PORTFOLIO | | | LARGE
COMPANY
VALUE
PORTFOLIO | | | SMALL
COMPANY
GROWTH
PORTFOLIO | | | SMALL
COMPANY
VALUE
PORTFOLIO | | | DOW JONES
WILSHIRE 5000 INDEX
PORTFOLIO | |
INVESTMENT INCOME: | | | | | | | | | | | | | | | | | | | | |
Dividends | | $ | 6,876,667 | | | $ | 1,560,735 | | | $ | 58,170 | | | $ | 277,421 | | | $ | 2,984,171 | |
Interest | | | 125,615 | | | | 55,034 | | | | 7,925 | | | | 20,325 | | | | 53,647 | |
Securities lending income | | | 60,919 | | | | 5,918 | | | | 6,104 | | | | 2,736 | | | | 33,962 | |
Foreign taxes withheld | | | — | | | | (4,497 | ) | | | (40 | ) | | | — | | | | (448 | ) |
| | | | | | | | | | | | | | | | | | | | |
Total Income | | | 7,063,201 | | | | 1,617,190 | | | | 72,159 | | | | 300,482 | | | | 3,071,332 | |
| | | | | | | | | | | | | | | | | | | | |
Investment advisory fee (Note 2) | | | 4,535,906 | | | | 536,239 | | | | 130,438 | | | | 174,686 | | | | 168,830 | |
Distribution (12b-1) fees (Note 3) | | | 969,820 | | | | 156,319 | | | | 36,617 | | | | 47,164 | | | | 287,581 | |
Service fees (Note 3) | | | 521,246 | | | | 39,147 | | | | 12,322 | | | | 18,095 | | | | 74,349 | |
Administration and Accounting fees (Note 2) | | | 497,458 | | | | 71,610 | | | | 33,345 | | | | 33,591 | | | | 222,366 | |
Transfer agent fees (Note 2) | | | 232,800 | | | | 54,600 | | | | 45,325 | | | | 49,215 | | | | 167,460 | |
Professional fees | | | 205,789 | | | | 23,553 | | | | 5,213 | | | | 6,768 | | | | 57,590 | |
Printing fees | | | 150,000 | | | | 32,625 | | | | 10,750 | | | | 18,950 | | | | 54,700 | |
Custodian fees (Note 2) | | | 80,250 | | | | 17,750 | | | | 13,475 | | | | 13,950 | | | | 60,000 | |
Registration and filing fees | | | 35,385 | | | | 22,276 | | | | 21,282 | | | | 21,218 | | | | 30,835 | |
Directors’ fees and expenses (Note 2) | | | 66,773 | | | | 7,727 | | | | 1,717 | | | | 2,256 | | | | 18,562 | |
Other | | | 60,127 | | | | 8,446 | | | | 3,173 | | | | 3,768 | | | | 18,601 | |
| | | | | | | | | | | | | | | | | | | | |
Subtotal | | | 7,355,554 | | | | 970,292 | | | | 313,657 | | | | 389,661 | | | | 1,160,874 | |
Fees waived and reimbursed by investment adviser (Note 2) | | | — | | | | — | | | | (93,456 | ) | | | (123,309 | ) | | | — | |
Fees waived by administrator (Note 2) | | | (1,000 | ) | | | (1,000 | ) | | | (1,000 | ) | | | (1,000 | ) | | | (1,000 | ) |
| | | | | | | | | | | | | | | | | | | | |
Total Net Expenses | | | 7,354,554 | | | | 969,292 | | | | 219,201 | | | | 265,352 | | | | 1,159,874 | |
| | | | | | | | | | | | | | | | | | | | |
| | | | | |
NET INVESTMENT INCOME/(LOSS) | | | (291,353 | ) | | | 647,898 | | | | (147,042 | ) | | | 35,130 | | | | 1,911,458 | |
| | | | | | | | | | | | | | | | | | | | |
| | | | | |
NET REALIZED AND UNREALIZED GAIN/(LOSS) ON INVESTMENTS AND FUTURES CONTRACTS (Notes 1 and 4) | | | | | | | | | | | | | | | | | | | | |
Net realized gain from: | | | | | | | | | | | | | | | | | | | | |
Investments | | | 34,258,824 | | | | 8,078,258 | | | | 1,446,094 | | | | 2,770,894 | | | | 3,107,673 | |
Futures contracts | | | 107,632 | | | | — | | | | — | | | | — | | | | — | |
Net change in unrealized appreciation/(depreciation) on: | | | | | | | | | | | | | | | | | | | | |
Investments | | | (4,566,060 | ) | | | 3,765,954 | | | | 370,170 | | | | 906,008 | | | | 17,314,230 | |
Futures contracts | | | 48,567 | | | | — | | | | — | | | | — | | | | — | |
| | | | | | | | | | | | | | | | | | | | |
| | | | | |
NET REALIZED AND UNREALIZED GAIN ON INVESTMENTS AND FUTURES CONTRACTS | | | 29,848,963 | | | | 11,844,212 | | | | 1,816,264 | | | | 3,676,902 | | | | 20,421,903 | |
| | | | | | | | | | | | | | | | | | | | |
| | | | | |
NET INCREASE IN NET ASSETS RESULTING FROM OPERATIONS | | $ | 29,557,610 | | | $ | 12,492,110 | | | $ | 1,669,222 | | | $ | 3,712,032 | | | $ | 22,333,361 | |
| | | | | | | | | | | | | | | | | | | | |
See Notes to Financial Statements.
85
| | |
WILSHIRE MUTUAL FUNDS, INC. STATEMENTSOF CHANGESIN NET ASSETS For the Year Ended December 31, 2006 | | |
| | | | | | | | | | | | | | | | | | | | |
| | | LARGE
COMPANY
GROWTH
PORTFOLIO | | | LARGE
COMPANY
VALUE
PORTFOLIO | | | SMALL
COMPANY
GROWTH
PORTFOLIO | | | SMALL
COMPANY
VALUE
PORTFOLIO | | | DOW JONES
WILSHIRE 5000 INDEX
PORTFOLIO | |
Operations: | | | | | | | | | | | | | | | | | | | | |
Net investment income/(loss) | | $ | (291,353 | ) | | $ | 647,898 | | | $ | (147,042 | ) | | $ | 35,130 | | | $ | 1,911,458 | |
Net realized gain on investments and futures contracts | | | 34,366,456 | | | | 8,078,258 | | | | 1,446,094 | | | | 2,770,894 | | | | 3,107,673 | |
Net change in unrealized appreciation/ (depreciation) on investments and futures contracts | | | (4,517,493 | ) | | | 3,765,954 | | | | 370,170 | | | | 906,008 | | | | 17,314,230 | |
| | | | | | | | | | | | | | | | | | | | |
Net increase in net assets resulting from operations | | | 29,557,610 | | | | 12,492,110 | | | | 1,669,222 | | | | 3,712,032 | | | | 22,333,361 | |
| | | | | |
Distributions to shareholders from: | | | | | | | | | | | | | | | | | | | | |
Net investment income: | | | | | | | | | | | | | | | | | | | | |
Investment Class shares | | | — | | | | (564,621 | ) | | | — | | | | (31,618 | ) | | | (1,210,738 | ) |
Institutional Class shares | | | — | | | | (80,766 | ) | | | — | | | | (6,064 | ) | | | (718,441 | ) |
Qualified Class shares | | | N/A | | | | N/A | | | | N/A | | | | N/A | | | | (8,672 | ) |
Horace Mann Class shares | | | N/A | | | | N/A | | | | N/A | | | | N/A | | | | (14,079 | ) |
Net realized capital gains: | | | | | | | | | | | | | | | | | | | | |
Investment Class shares | | | — | | | | (5,606,296 | ) | | | (1,086,379 | ) | | | (2,380,330 | ) | | | — | |
Institutional Class shares | | | — | | | | (594,103 | ) | | | (13,310 | ) | | | (143,223 | ) | | | — | |
| | | | | | | | | | | | | | | | | | | | |
Total distributions to shareholders | | | — | | | | (6,845,786 | ) | | | (1,099,689 | ) | | | (2,561,235 | ) | | | (1,951,930 | ) |
| | | | | |
Capital Stock Transactions: (Dollars) | | | | | | | | | | | | | | | | | | | | |
Investment Class shares: | | | | | | | | | | | | | | | | | | | | |
Shares sold | | | 83,807,116 | | | | 20,132,894 | | | | 2,318,040 | | | | 8,291,131 | | | | 28,841,055 | |
Shares issued as reinvestment of distributions | | | — | | | | 6,083,028 | | | | 1,069,045 | | | | 2,371,263 | | | | 1,179,955 | |
Shares redeemed | | | (134,195,732 | ) | | | (10,923,812 | ) | | | (3,306,332 | ) | | | (5,123,644 | ) | | | (24,747,626 | ) |
| | | | | | | | | | | | | | | | | | | | |
Total Investment Class shares | | | (50,388,616 | ) | | | 15,292,110 | | | | 80,753 | | | | 5,538,750 | | | | 5,273,384 | |
| | | | | | | | | | | | | | | | | | | | |
Institutional Class shares: | | | | | | | | | | | | | | | | | | | | |
Shares sold | | | 50,485,879 | | | | 467,802 | | | | 35,000 | | | | 141,334 | | | | 40,881,056 | |
Shares issued as reinvestment of distributions | | | — | | | | 530,379 | | | | 11,110 | | | | 144,477 | | | | 716,153 | |
Shares redeemed | | | (49,199,286 | ) | | | (2,112,437 | ) | | | (66,866 | ) | | | (240,019 | ) | | | (22,443,985 | ) |
| | | | | | | | | | | | | | | | | | | | |
Total Institutional Class shares | | | 1,286,593 | | | | (1,114,256 | ) | | | (20,756 | ) | | | 45,792 | | | | 19,153,224 | |
| | | | | | | | | | | | | | | | | | | | |
Qualified Class shares: | | | | | | | | | | | | | | | | | | | | |
Shares sold | | | N/A | | | | N/A | | | | N/A | | | | N/A | | | | 257,110 | |
Shares issued as reinvestment of distributions | | | N/A | | | | N/A | | | | N/A | | | | N/A | | | | 8,672 | |
Shares redeemed | | | N/A | | | | N/A | | | | N/A | | | | N/A | | | | (146,896 | ) |
| | | | | | | | | | | | | | | | | | | | |
Total Qualified Class shares | | | N/A | | | | N/A | | | | N/A | | | | N/A | | | | 118,886 | |
| | | | | | | | | | | | | | | | | | | | |
Horace Mann Class shares: | | | | | | | | | | | | | | | | | | | | |
Shares sold | | | N/A | | | | N/A | | | | N/A | | | | N/A | | | | 100,812 | |
Shares issued as reinvestment of distributions | | | N/A | | | | N/A | | | | N/A | | | | N/A | | | | 13,966 | |
Shares redeemed | | | N/A | | | | N/A | | | | N/A | | | | N/A | | | | (415,034 | ) |
| | | | | | | | | | | | | | | | | | | | |
Total Horace Mann Class shares | | | N/A | | | | N/A | | | | N/A | | | | N/A | | | | (300,256 | ) |
| | | | | | | | | | | | | | | | | | | | |
Net increase/(decrease) in net assets from Capital Stock transactions | | | (49,102,023 | ) | | | 14,177,854 | | | | 59,997 | | | | 5,584,542 | | | | 24,245,238 | |
| | | | | | | | | | | | | | | | | | | | |
Net increase/(decrease) in net assets | | $ | (19,544,413 | ) | | $ | 19,824,178 | | | $ | 629,530 | | | $ | 6,735,339 | | | $ | 44,626,669 | |
| | | | | | | | | | | | | | | | | | | | |
See Notes to Financial Statements.
86
| | |
WILSHIRE MUTUAL FUNDS, INC. STATEMENTSOF CHANGESIN NET ASSETS - (Continued) For the Year Ended December 31, 2006 | | |
| | | | | | | | | | | | | | | | | | | | |
| | | LARGE
COMPANY
GROWTH
PORTFOLIO | | | LARGE
COMPANY
VALUE
PORTFOLIO | | | SMALL
COMPANY
GROWTH
PORTFOLIO | | | SMALL
COMPANY
VALUE
PORTFOLIO | | | DOW JONES
WILSHIRE 5000 INDEX
PORTFOLIO | |
NET ASSETS: | | | | | | | | | | | | | | | | | | | | |
Beginning of period | | $ | 624,160,337 | | | $ | 64,055,846 | | | $ | 15,119,499 | | | $ | 18,279,186 | | | $ | 169,433,778 | |
| | | | | | | | | | | | | | | | | | | | |
End of period | | $ | 604,615,924 | | | $ | 83,880,024 | | | $ | 15,749,029 | | | $ | 25,014,525 | | | $ | 214,060,447 | |
| | | | | | | | | | | | | | | | | | | | |
Undistributed accumulated net investment income | | $ | — | | | $ | 4,526 | | | $ | — | | | $ | — | | | $ | 328,129 | |
| | | | | | | | | | | | | | | | | | | | |
| | | | | |
Capital Share Transactions: | | | | | | | | | | | | | | | | | | | | |
Investment Class shares: | | | | | | | | | | | | | | | | | | | | |
Shares sold | | | 2,409,761 | | | | 886,333 | | | | 129,859 | | | | 421,421 | | | | 2,577,756 | |
Shares issued as reinvestment of distributions | | | — | | | | 264,945 | | | | 61,440 | | | | 127,695 | | | | 98,248 | |
Shares redeemed | | | (3,870,591 | ) | | | (482,356 | ) | | | (183,984 | ) | | | (266,158 | ) | | | (2,226,564 | ) |
| | | | | | | | | | | | | | | | | | | | |
Net increase/(decrease) in Investment Class shares outstanding | | | (1,460,830 | ) | | | 668,922 | | | | 7,315 | | | | 282,958 | | | | 449,440 | |
| | | | | | | | | | | | | | | | | | | | |
Institutional Class shares: | | | | | | | | | | | | | | | | | | | | |
Shares sold | | | 1,438,103 | | | | 20,619 | | | | 1,816 | | | | 7,432 | | | | 3,381,506 | |
Shares issued as reinvestment of distributions | | | — | | | | 23,060 | | | | 622 | | | | 7,726 | | | | 59,631 | |
Shares redeemed | | | (1,396,856 | ) | | | (91,075 | ) | | | (3,477 | ) | | | (12,460 | ) | | | (2,060,116 | ) |
| | | | | | | | | | | | | | | | | | | | |
Net increase/(decrease) in Institutional Class shares outstanding | | | 41,247 | | | | (47,396 | ) | | | (1,039 | ) | | | 2,698 | | | | 1,381,021 | |
| | | | | | | | | | | | | | | | | | | | |
Qualified Class shares: | | | | | | | | | | | | | | | | | | | | |
Shares sold | | | N/A | | | | N/A | | | | N/A | | | | N/A | | | | 22,401 | |
Shares issued as reinvestment of distributions | | | N/A | | | | N/A | | | | N/A | | | | N/A | | | | 722 | |
Shares redeemed | | | N/A | | | | N/A | | | | N/A | | | | N/A | | | | (13,337 | ) |
| | | | | | | | | | | | | | | | | | | | |
Net increase in Qualified Class shares outstanding | | | N/A | | | | N/A | | | | N/A | | | | N/A | | | | 9,786 | |
| | | | | | | | | | | | | | | | | | | | |
Horace Mann Class shares: | | | | | | | | | | | | | | | | | | | | |
Shares sold | | | N/A | | | | N/A | | | | N/A | | | | N/A | | | | 9,063 | |
Shares issued as reinvestment of distributions | | | N/A | | | | N/A | | | | N/A | | | | N/A | | | | 1,167 | |
Shares redeemed | | | N/A | | | | N/A | | | | N/A | | | | N/A | | | | (37,552 | ) |
| | | | | | | | | | | | | | | | | | | | |
Net decrease in Horace Mann Class shares outstanding | | | N/A | | | | N/A | | | | N/A | | | | N/A | | | | (27,322 | ) |
| | | | | | | | | | | | | | | | | | | | |
See Notes to Financial Statements.
87
| | |
WILSHIRE MUTUAL FUNDS, INC. STATEMENTSOF CHANGESIN NET ASSETS For the Year Ended December 31, 2006 | | |
| | | | | | | | | | | | | | | | | | | | |
| | | LARGE
COMPANY
GROWTH
PORTFOLIO | | | LARGE
COMPANY
VALUE
PORTFOLIO | | | SMALL
COMPANY
GROWTH
PORTFOLIO | | | SMALL
COMPANY
VALUE
PORTFOLIO | | | DOW JONES
WILSHIRE 5000 INDEX
PORTFOLIO | |
Operations: | | | | | | | | | | | | | | | | | | | | |
Net investment income/(loss) | | $ | (1,426,417 | ) | | $ | 407,693 | | | $ | (137,855 | ) | | $ | (72,258 | ) | | $ | 1,577,336 | |
Net realized gain on investments and futures contracts. | | | 22,562,029 | | | | 2,376,323 | | | | 552,331 | | | | 4,103,154 | | | | 1,810,083 | |
Net change in unrealized appreciation/(depreciation) on investments and futures contracts | | | 25,326,404 | | | | 2,426,156 | | | | 105,036 | | | | (4,200,624 | ) | | | 5,880,943 | |
| | | | | | | | | | | | | | | | | | | | |
Net increase/(decrease) in net assets resulting from operations | | | 46,462,016 | | | | 5,210,172 | | | | 519,512 | | | | (169,728 | ) | | | 9,268,362 | |
| | | | | |
Distributions to shareholders from: | | | | | | | | | | | | | | | | | | | | |
Net investment income: | | | | | | | | | | | | | | | | | | | | |
Investment Class shares | | | — | | | | (334,402 | ) | | | — | | | | — | | | | (792,650 | ) |
Institutional Class shares | | | — | | | | (69,705 | ) | | | — | | | | — | | | | (400,624 | ) |
Qualified Class shares | | | N/A | | | | N/A | | | | N/A | | | | N/A | | | | (3,426 | ) |
Horace Mann Class shares | | | N/A | | | | N/A | | | | N/A | | | | N/A | | | | (11,385 | ) |
Return of capital: | | | | | | | | | | | | | | | | | | | | |
Investment Class shares | | | — | | | | (239,986 | ) | | | — | | | | — | | | | — | |
Institutional Class shares | | | — | | | | (34,167 | ) | | | — | | | | — | | | | — | |
Net realized capital gains: | | | | | | | | | | | | | | | | | | | | |
Investment Class shares | | | — | | | | (5,818,070 | ) | | | (1,200,902 | ) | | | (3,952,267 | ) | | | — | |
Institutional Class shares | | | — | | | | (828,336 | ) | | | (16,551 | ) | | | (324,577 | ) | | | — | |
| | | | | | | | | | | | | | | | | | | | |
Total distributions to shareholders | | | — | | | | (7,324,666 | ) | | | (1,217,453 | ) | | | (4,276,844 | ) | | | (1,208,085 | ) |
| | | | | |
Capital Stock Transactions: (Dollars) | | | | | | | | | | | | | | | | | | | | |
Investment Class shares: | | | | | | | | | | | | | | | | | | | | |
Shares sold | | | 92,157,178 | | | | 9,523,031 | | | | 2,748,781 | | | | 7,069,359 | | | | 23,626,742 | |
Shares issued as reinvestment of distributions | | | — | | | | 6,297,877 | | | | 1,182,468 | | | | 3,884,538 | | | | 773,033 | |
Shares redeemed | | | (121,275,692 | ) | | | (7,448,349 | ) | | | (2,245,120 | ) | | | (26,589,713 | ) | | | (28,781,333 | ) |
| | | | | | | | | | | | | | | | | | | | |
Total Investment Class shares | | | (29,118,514 | ) | | | 8,372,559 | | | | 1,686,129 | | | | (15,635,816 | ) | | | (4,381,558 | ) |
| | | | | | | | | | | | | | | | | | | | |
Institutional Class shares: | | | | | | | | | | | | | | | | | | | | |
Shares sold | | | 55,185,224 | | | | 524,208 | | | | — | | | | 166,925 | | | | 2,523,122 | |
Shares issued as reinvestment of distributions | | | — | | | | 735,491 | | | | 13,123 | | | | 313,786 | | | | 397,707 | |
Shares redeemed | | | (41,167,410 | ) | | | (3,269,930 | ) | | | (12,000 | ) | | | (2,906,205 | ) | | | (3,428,111 | ) |
| | | | | | | | | | | | | | | | | | | | |
Total Institutional Class shares | | | 14,017,814 | | | | (2,010,231 | ) | | | 1,123 | | | | (2,425,494 | ) | | | (507,282 | ) |
| | | | | | | | | | | | | | | | | | | | |
Qualified Class shares: | | | | | | | | | | | | | | | | | | | | |
Shares sold | | | N/A | | | | N/A | | | | N/A | | | | N/A | | | | 461,062 | |
Shares issued as reinvestment of distributions | | | N/A | | | | N/A | | | | N/A | | | | N/A | | | | 3,426 | |
Shares redeemed | | | N/A | | | | N/A | | | | N/A | | | | N/A | | | | (1,033,616 | ) |
| | | | | | | | | | | | | | | | | | | | |
Total Qualified Class shares | | | N/A | | | | N/A | | | | N/A | | | | N/A | | | | (569,128 | ) |
| | | | | | | | | | | | | | | | | | | | |
Horace Mann Class shares: | | | | | | | | | | | | | | | | | | | | |
Shares sold | | | N/A | | | | N/A | | | | N/A | | | | N/A | | | | 139,155 | |
Shares issued as reinvestment of distributions | | | N/A | | | | N/A | | | | N/A | | | | N/A | | | | 11,270 | |
Shares redeemed | | | N/A | | | | N/A | | | | N/A | | | | N/A | | | | (313,041 | ) |
| | | | | | | | | | | | | | | | | | | | |
Total Horace Mann Class shares | | | N/A | | | | N/A | | | | N/A | | | | N/A | | | | (162,616 | ) |
| | | | | | | | | | | | | | | | | | | | |
Net increase/(decrease) in net assets from Capital Stock transactions | | | (15,100,700 | ) | | | 6,362,328 | | | | 1,687,252 | | | | (18,061,310 | ) | | | (5,620,584 | ) |
| | | | | | | | | | | | | | | | | | | | |
Net increase/(decrease) in net assets | | $ | 31,361,316 | | | $ | 4,247,834 | | | $ | 989,311 | | | $ | (22,507,882 | ) | | $ | 2,439,693 | |
| | | | | | | | | | | | | | | | | | | | |
See Notes to Financial Statements.
88
| | |
WILSHIRE MUTUAL FUNDS, INC. STATEMENTSOF CHANGESIN NET ASSETS - (Continued) For the Year Ended December 31, 2006 | | |
| | | | | | | | | | | | | | | | | | | | |
| | | LARGE
COMPANY
GROWTH
PORTFOLIO | | | LARGE
COMPANY
VALUE
PORTFOLIO | | | SMALL
COMPANY
GROWTH
PORTFOLIO | | | SMALL
COMPANY
VALUE
PORTFOLIO | | | DOW JONES
WILSHIRE
5000 INDEX
PORTFOLIO | |
NET ASSETS: | | | | | | | | | | | | | | | | | | | | |
Beginning of year | | $ | 592,799,021 | | | $ | 59,808,012 | | | $ | 14,130,188 | | | $ | 40,787,068 | | | $ | 166,994,085 | |
| | | | | | | | | | | | | | | | | | | | |
End of year | | $ | 624,160,337 | | | $ | 64,055,846 | | | $ | 15,119,499 | | | $ | 18,279,186 | | | $ | 169,433,778 | |
| | | | | | | | | | | | | | | | | | | | |
Undistributed net investment income/(loss) | | $ | 5,008 | | | $ | 2,015 | | | $ | 1,134 | | | $ | — | | | $ | 372,743 | |
| | | | | | | | | | | | | | | | | | | | |
| | | | | |
Capital Share Transactions: | | | | | | | | | | | | | | | | | | | | |
Investment Class shares: | | | | | | | | | | | | | | | | | | | | |
Shares sold | | | 2,842,583 | | | | 424,772 | | | | 158,107 | | | | 329,319 | | | | 2,343,713 | |
Shares issued as reinvestment of distributions | | | — | | | | 296,231 | | | | 69,968 | | | | 222,867 | | | | 72,585 | |
Shares redeemed | | | (3,809,046 | ) | | | (333,218 | ) | | | (129,180 | ) | | | (1,290,986 | ) | | | (2,840,968 | ) |
| | | | | | | | | | | | | | | | | | | | |
Net increase/(decrease) in Investment Class shares outstanding | | | (966,463 | ) | | | 387,785 | | | | 98,895 | | | | (738,800 | ) | | | (424,670 | ) |
| | | | | | | | | | | | | | | | | | | | |
Institutional Class shares: | | | | | | | | | | | | | | | | | | | | |
Shares sold | | | 1,675,492 | | | | 23,357 | | | | — | | | | 7,760 | | | | 246,825 | |
Shares issued as reinvestment of distributions | | | — | | | | 34,546 | | | | 760 | | | | 17,900 | | | | 37,273 | |
Shares redeemed | | | (1,278,383 | ) | | | (147,799 | ) | | | (683 | ) | | | (139,771 | ) | | | (336,137 | ) |
| | | | | | | | | | | | | | | | | | | | |
Net increase/(decrease) in Institutional Class shares outstanding | | | 397,109 | | | | (89,896 | ) | | | 77 | | | | (114,111 | ) | | | (52,039 | ) |
| | | | | | | | | | | | | | | | | | | | |
Qualified Class shares: | | | | | | | | | | | | | | | | | | | | |
Shares sold | | | N/A | | | | N/A | | | | N/A | | | | N/A | | | | 45,742 | |
Shares issued as reinvestment of distributions | | | N/A | | | | N/A | | | | N/A | | | | N/A | | | | 320 | |
Shares redeemed | | | N/A | | | | N/A | | | | N/A | | | | N/A | | | | (101,705 | ) |
| | | | | | | | | | | | | | | | | | | | |
Net decrease in Qualified Class shares outstanding | | | N/A | | | | N/A | | | | N/A | | | | N/A | | | | (55,643 | ) |
| | | | | | | | | | | | | | | | | | | | |
Horace Mann Class shares: | | | | | | | | | | | | | | | | | | | | |
Shares sold | | | N/A | | | | N/A | | | | N/A | | | | N/A | | | | 13,813 | |
Shares issued as reinvestment of distributions | | | N/A | | | | N/A | | | | N/A | | | | N/A | | | | 1,059 | |
Shares redeemed | | | N/A | | | | N/A | | | | N/A | | | | N/A | | | | (30,880 | ) |
| | | | | | | | | | | | | | | | | | | | |
Net decrease in Horace Mann Class shares outstanding | | | N/A | | | | N/A | | | | N/A | | | | N/A | | | | (16,008 | ) |
| | | | | | | | | | | | | | | | | | | | |
See Notes to Financial Statements.
89
| | |
WILSHIRE MUTUAL FUNDS, INC. LARGE COMPANY GROWTH PORTFOLIO FINANCIAL HIGHLIGHTS | | |
For a Portfolio Share Outstanding Throughout Each Period.
| | | | | | | | | | | | | | | | | | | | | | | | |
| | | Investment Class Shares | |
| | | Year
Ended
12/31/2006 | | | Year
Ended
12/31/2005 | | | Year
Ended
12/31/2004 | | | Year
Ended
12/31/2003 | | | Four
Month
Period
Ended
12/31/20021 | | | Year
Ended
8/31/2002 | |
Net asset value, beginning of period | | $ | 34.49 | | | $ | 31.80 | | | $ | 29.83 | | | $ | 23.59 | | | $ | 24.22 | | | $ | 29.12 | |
| | | | | | | | | | | | | | | | | | | | | | | | |
| | | | | | |
Income/(loss) from investment operations: | | | | | | | | | | | | | | | | | | | | | | | | |
Net investment income/(loss)* | | | (0.06 | ) | | | (0.12 | ) | | | 0.04 | | | | (0.05 | ) | | | 0.02 | | | | 0.04 | |
Net realized and unrealized gain/(loss) on investments and futures contracts | | | 1.77 | | | | 2.81 | | | | 1.96 | | | | 6.29 | | | | (0.61 | ) | | | (4.86 | ) |
| | | | | | | | | | | | | | | | | | | | | | | | |
Total from investment operations | | | 1.71 | | | | 2.69 | | | | 2.00 | | | | 6.24 | | | | (0.59 | ) | | | (4.82 | ) |
| | | | | | | | | | | | | | | | | | | | | | | | |
| | | | | | |
Less distributions: | | | | | | | | | | | | | | | | | | | | | | | | |
Dividends from net investment income | | | — | | | | — | | | | (0.03 | ) | | | — | | | | (0.04 | ) | | | — | |
Distributions from capital gains | | | — | | | | — | | | | — | | | | — | | | | — | | | | (0.08 | ) |
| | | | | | | | | | | | | | | | | | | | | | | | |
Total distributions | | | — | | | | — | | | | (0.03 | ) | | | — | | | | (0.04 | ) | | | (0.08 | ) |
| | | | | | | | | | | | | | | | | | | | | | | | |
Net asset value, end of period | | $ | 36.20 | | | $ | 34.49 | | | $ | 31.80 | | | $ | 29.83 | | | $ | 23.59 | | | $ | 24.22 | |
| | | | | | | | | | | | | | | | | | | | | | | | |
Total return2 | | | 4.96 | % | | | 8.46 | % | | | 6.70 | % | | | 26.45 | % | | | (2.42 | )%** | | | (16.61 | )% |
| | | | | | | | | | | | | | | | | | | | | | | | |
| | | | | | |
Ratios to average net assets/supplemental data: | | | | | | | | | | | | | | | | | | | | | | | | |
Net assets, end of period (in 000’s) | | $ | 379,226 | | | $ | 411,660 | | | $ | 410,332 | | | $ | 365,658 | | | $ | 243,890 | | | $ | 249,328 | |
Operating expenses excluding custody earnings credit | | | 1.34 | % | | | 1.39 | % | | | 1.44 | % | | | 1.37 | % | | | 0.95 | %*** | | | 0.90 | % |
Operating expenses including reimbursement/waiver/custody earnings credit | | | 1.34 | % | | | 1.38 | % | | | 1.43 | % | | | 1.36 | % | | | 0.95 | %*** | | | 0.89 | % |
Operating expenses excluding reimbursement/waiver/custody earnings credit | | | 1.34 | % | | | 1.39 | % | | | 1.44 | % | | | 1.47 | % | | | 1.45 | %*** | | | 0.90 | % |
Net investment income/(loss) including reimbursement/waiver/custody earnings credit | | | (0.18 | )% | | | (0.37 | )% | | | 0.11 | % | | | (0.20 | )% | | | 0.28 | %*** | | | 0.14 | % |
Portfolio turnover rate | | | 62 | % | | | 58 | % | | | 121 | % | | | 93 | % | | | 21 | %** | | | 47 | % |
1 | The Portfolio’s fiscal year-end changed from August 31 to December 31, effective December 31, 2002. |
2 | Total return represents the total return for the period indicated. |
| * | The selected per share data was calculated using the average shares outstanding method for the period. |
See Notes to Financial Statements.
90
| | |
WILSHIRE MUTUAL FUNDS, INC. LARGE COMPANY GROWTH PORTFOLIO FINANCIAL HIGHLIGHTS - (Continued) | | |
For a Portfolio Share Outstanding Throughout Each Period.
| | | | | | | | | | | | | | | | | | | | | | | | |
| | | Institutional Class Shares | |
| | | Year
Ended
12/31/2006 | | | Year
Ended
12/31/2005 | | | Year
Ended
12/31/2004 | | | Year
Ended
12/31/2003 | | | Four
Month
Period
Ended
12/31/20021 | | | Year
Ended
8/31/2002 | |
Net asset value, beginning of period | | $ | 34.97 | | | $ | 32.13 | | | $ | 30.13 | | | $ | 23.81 | | | $ | 24.51 | | | $ | 29.39 | |
| | | | | | | | | | | | | | | | | | | | | | | | |
| | | | | | |
Income/(loss) from investment operations: | | | | | | | | | | | | | | | | | | | | | | | | |
Net investment income* | | | 0.07 | | | | 0.00 | # | | | 0.13 | | | | 0.03 | | | | 0.05 | | | | 0.12 | |
Net realized and unrealized gain/(loss) on investments and futures contracts | | | 1.80 | | | | 2.84 | | | | 2.01 | | | | 6.36 | | | | (0.62 | ) | | | (4.92 | ) |
| | | | | | | | | | | | | | | | | | | | | | | | |
Total from investment operations | | | 1.87 | | | | 2.84 | | | | 2.14 | | | | 6.39 | | | | (0.57 | ) | | | (4.80 | ) |
| | | | | | | | | | | | | | | | | | | | | | | | |
| | | | | | |
Less distributions: | | | | | | | | | | | | | | | | | | | | | | | | |
Dividends from net investment income | | | — | | | | — | | | | (0.14 | ) | | | (0.07 | ) | | | (0.13 | ) | | | — | |
Distributions from capital gains | | | — | | | | — | | | | — | | | | — | | | | — | | | | (0.08 | ) |
| | | | | | | | | | | | | | | | | | | | | | | | |
Total distributions | | | — | | | | — | | | | (0.14 | ) | | | (0.07 | ) | | | (0.13 | ) | | | (0.08 | ) |
| | | | | | | | | | | | | | | | | | | | | | | | |
Net asset value, end of period | | $ | 36.84 | | | $ | 34.97 | | | $ | 32.13 | | | $ | 30.13 | | | $ | 23.81 | | | $ | 24.51 | |
| | | | | | | | | | | | | | | | | | | | | | | | |
Total return2 | | | 5.35 | % | | | 8.84 | % | | | 7.10 | % | | | 26.85 | % | | | (2.32 | )%** | | | (16.39 | )% |
| | | | | | | | | | | | | | | | | | | | | | | | |
| | | | | | |
Ratios to average net assets/supplemental data: | | | | | | | | | | | | | | | | | | | | | | | | |
Net assets, end of period (in 000’s) | | $ | 225,390 | | | $ | 212,501 | | | $ | 182,467 | | | $ | 160,814 | | | $ | 82,459 | | | $ | 84,271 | |
Operating expenses excluding custody earnings credit . | | | 0.98 | % | | | 1.01 | % | | | 1.10 | % | | | 1.05 | % | | | 0.64 | %*** | | | 0.59 | % |
Operating expenses including reimbursement/waiver/custody earnings credit | | | 0.98 | % | | | 1.01 | % | | | 1.09 | % | | | 1.04 | % | | | 0.64 | %*** | | | 0.58 | % |
Operating expenses excluding reimbursement/waiver/custody earnings credit | | | 0.98 | % | | | 1.01 | % | | | 1.10 | % | | | 1.15 | % | | | 1.14 | %*** | | | 0.59 | % |
Net investment income/(loss) including reimbursement/waiver/custody earnings credit | | | 0.19 | % | | | 0.00 | %(a) | | | 0.45 | % | | | 0.12 | % | | | 0.59 | %*** | | | 0.45 | % |
Portfolio turnover rate | | | 62 | % | | | 58 | % | | | 121 | % | | | 93 | % | | | 21 | %** | | | 47 | % |
| # | Amount is less than $0.01 per share. |
1 | The Portfolio’s fiscal year-end changed from August 31 to December 31, effective December 31, 2002. |
2 | Total return represents the total return for the period indicated. |
| (a) | Amount represents less than 0.01% |
| * | The selected per share data was calculated using the average shares outstanding method for the period. |
See Notes to Financial Statements.
91
| | |
WILSHIRE MUTUAL FUNDS, INC. LARGE COMPANY VALUE PORTFOLIO FINANCIAL HIGHLIGHTS | | |
For a Portfolio Share Outstanding Throughout Each Period.
| | | | | | | | | | | | | | | | | | | | | | | | |
| | | Investment Class Shares | |
| | | Year
Ended
12/31/2006 | | | Year
Ended
12/31/2005 | | | Year
Ended
12/31/2004 | | | Year
Ended
12/31/2003 | | | Four
Month
Period
Ended
12/31/20021 | | | Year
Ended
8/31/2002 | |
Net asset value, beginning of period | | $ | 21.17 | | | $ | 21.92 | | | $ | 20.52 | | | $ | 16.03 | | | $ | 17.59 | | | $ | 21.09 | |
| | | | | | | | | | | | | | | | | | | | | | | | |
| | | | | | |
Income/(loss) from investment operations: | | | | | | | | | | | | | | | | | | | | | | | | |
Net investment income* | | | 0.20 | | | | 0.14 | | | | 0.14 | | | | 0.13 | | | | 0.08 | | | | 0.21 | |
Net realized and unrealized gain/(loss) on investments | | | 3.71 | | | | 1.82 | | | | 2.59 | | | | 4.44 | | | | (1.40 | ) | | | (2.41 | ) |
| | | | | | | | | | | | | | | | | | | | | | | | |
Total from investment operations | | | 3.91 | | | | 1.96 | | | | 2.73 | | | | 4.57 | | | | (1.32 | ) | | | (2.20 | ) |
| | | | | | | | | | | | | | | | | | | | | | | | |
| | | | | | |
Less distributions: | | | | | | | | | | | | | | | | | | | | | | | | |
Dividends from net investment income | | | (0.19 | ) | | | (0.14 | ) | | | (0.39 | ) | | | (0.08 | ) | | | (0.24 | ) | | | (0.27 | ) |
Tax return of capital | | | — | | | | (0.10 | ) | | | — | | | | — | | | | — | | | | — | |
Distributions from capital gains | | | (1.90 | ) | | | (2.47 | ) | | | (0.94 | ) | | | — | | | | — | | | | (1.03 | ) |
| | | | | | | | | | | | | | | | | | | | | | | | |
Total distributions | | | (2.09 | ) | | | (2.71 | ) | | | (1.33 | ) | | | (0.08 | ) | | | (0.24 | ) | | | (1.30 | ) |
| | | | | | | | | | | | | | | | | | | | | | | | |
Net asset value, end of period | | $ | 22.99 | | | $ | 21.17 | | | $ | 21.92 | | | $ | 20.52 | | | $ | 16.03 | | | $ | 17.59 | |
| | | | | | | | | | | | | | | | | | | | | | | | |
Total return2 | | | 18.49 | % | | | 8.90 | % | | | 13.28 | % | | | 28.51 | % | | | (7.49 | )%** | | | (10.94 | )% |
| | | | | | | | | | | | | | | | | | | | | | | | |
| | | | | | |
Ratios to average net assets/supplemental data: | | | | | | | | | | | | | | | | | | | | | | | | |
Net assets, end of period (in 000’s) | | $ | 76,481 | | | $ | 56,245 | | | $ | 49,749 | | | $ | 35,997 | | | $ | 25,327 | | | $ | 30,131 | |
Operating expenses excluding custody earnings credit | | | 1.39 | % | | | 1.50 | % | | | 1.65 | % | | | 1.56 | % | | | 1.17 | %*** | | | 1.04 | % |
Operating expenses including reimbursement/waiver/custody earnings credit | | | 1.39 | % | | | 1.49 | % | | | 1.65 | % | | | 1.55 | % | | | 1.16 | %*** | | | 1.03 | % |
Operating expenses excluding reimbursement/waiver/custody earnings credit | | | 1.39 | % | | | 1.50 | % | | | 1.65 | % | | | 1.67 | % | | | 1.67 | %*** | | | 1.04 | % |
Net investment income including reimbursement/waiver/custody earnings credit | | | 0.87 | % | | | 0.64 | % | | | 0.67 | % | | | 0.75 | % | | | 1.39 | %*** | | | 1.06 | % |
Portfolio turnover rate | | | 50 | % | | | 43 | % | | | 73 | % | | | 103 | % | | | 19 | %** | | | 72 | % |
1 | The Portfolio’s fiscal year-end changed from August 31 to December 31, effective December 31, 2002. |
2 | Total return represents the total return for the period indicated. |
| * | The selected per share data was calculated using the average shares outstanding method for the period. |
See Notes to Financial Statements.
92
| | |
WILSHIRE MUTUAL FUNDS, INC. LARGE COMPANY VALUE PORTFOLIO FINANCIAL HIGHLIGHTS - (Continued) | | |
For a Portfolio Share Outstanding Throughout Each Period.
| | | | | | | | | | | | | | | | | | | | | | | | |
| | | Institutional Class Shares | |
| | | Year
Ended
12/31/2006 | | | Year
Ended
12/31/2005 | | | Year
Ended
12/31/2004 | | | Year
Ended
12/31/2003 | | | Four
Month
Period
Ended
12/31/20021 | | | Year
Ended
8/31/2002 | |
Net asset value, beginning of period | | $ | 21.19 | | | $ | 21.94 | | | $ | 20.55 | | | $ | 16.04 | | | $ | 17.64 | | | $ | 21.14 | |
| | | | | | | | | | | | | | | | | | | | | | | | |
| | | | | | |
Income/(loss) from investment operations: | | | | | | | | | | | | | | | | | | | | | | | | |
Net investment income* | | | 0.27 | | | | 0.20 | | | | 0.21 | | | | 0.18 | | | | 0.09 | | | | 0.26 | |
Net realized and unrealized gain/(loss) on investments | | | 3.74 | | | | 1.83 | | | | 2.59 | | | | 4.44 | | | | (1.40 | ) | | | (2.41 | ) |
| | | | | | | | | | | | | | | | | | | | | | | | |
Total from investment operations | | | 4.01 | | | | 2.03 | | | | 2.80 | | | | 4.62 | | | | (1.31 | ) | | | (2.15 | ) |
| | | | | | | | | | | | | | | | | | | | | | | | |
| | | | | | |
Less distributions: | | | | | | | | | | | | | | | | | | | | | | | | |
Dividends from net investment income | | | (0.26 | ) | | | (0.21 | ) | | | (0.47 | ) | | | (0.11 | ) | | | (0.29 | ) | | | (0.32 | ) |
Tax return of capital | | | — | | | | (0.10 | ) | | | — | | | | — | | | | — | | | | — | |
Distributions from capital gains | | | (1.90 | ) | | | (2.47 | ) | | | (0.94 | ) | | | — | | | | — | | | | (1.03 | ) |
| | | | | | | | | | | | | | | | | | | | | | | | |
Total distributions | | | (2.16 | ) | | | (2.78 | ) | | | (1.41 | ) | | | (0.11 | ) | | | (0.29 | ) | | | (1.35 | ) |
| | | | | | | | | | | | | | | | | | | | | | | | |
Net asset value, end of period | | $ | 23.04 | | | $ | 21.19 | | | $ | 21.94 | | | $ | 20.55 | | | $ | 16.04 | | | $ | 17.64 | |
| | | | | | | | | | | | | | | | | | | | | | | | |
Total return2 | | | 18.94 | % | | | 9.18 | % | | | 13.62 | % | | | 28.83 | % | | | (7.44 | )%** | | | (10.71 | )% |
| | | | | | | | | | | | | | | | | | | | | | | | |
| | | | | | |
Ratios to average net assets/supplemental data: | | | | | | | | | | | | | | | | | | | | | | | | |
Net assets, end of period (in 000’s) | | $ | 7,399 | | | $ | 7,811 | | | $ | 10,059 | | | $ | 30,224 | | | $ | 33,934 | | | $ | 37,133 | |
Operating expenses excluding custody earnings credit | | | 1.08 | % | | | 1.21 | % | | | 1.34 | % | | | 1.31 | % | | | 0.94 | %*** | | | 0.79 | % |
Operating expenses including reimbursement/waiver/custody earnings credit | | | 1.08 | % | | | 1.20 | % | | | 1.34 | % | | | 1.30 | % | | | 0.93 | %*** | | | 0.78 | % |
Operating expenses excluding reimbursement/waiver/custody earnings credit | | | 1.08 | % | | | 1.21 | % | | | 1.34 | % | | | 1.42 | % | | | 1.44 | %*** | | | 0.79 | % |
Net investment income including reimbursement/waiver/custody earnings credit | | | 1.18 | % | | | 0.91 | % | | | 0.97 | % | | | 1.00 | % | | | 1.62 | %*** | | | 1.31 | % |
Portfolio turnover rate | | | 50 | % | | | 43 | % | | | 73 | % | | | 103 | % | | | 19 | %** | | | 72 | % |
1 | The Portfolio’s fiscal year-end changed from August 31 to December 31, effective December 31, 2002. |
2 | Total return represents the total return for the period indicated. |
| * | The selected per share data was calculated using the average shares outstanding method for the period. |
See Notes to Financial Statements.
93
| | |
WILSHIRE MUTUAL FUNDS, INC. SMALL COMPANY GROWTH PORTFOLIO FINANCIAL HIGHLIGHTS | | |
For a Portfolio Share Outstanding Throughout Each Period.
| | | | | | | | | | | | | | | | | | | | | | | | |
| | | Investment Class Shares | |
| | | Year
Ended
12/31/2006 | | | Year
Ended
12/31/2005 | | | Year
Ended
12/31/2004 | | | Year
Ended
12/31/2003 | | | Four
Month
Period
Ended
12/31/20021 | | | Year
Ended
8/31/2002 | |
Net asset value, beginning of period | | $ | 16.88 | | | $ | 17.74 | | | $ | 15.73 | | | $ | 11.48 | | | $ | 11.89 | | | $ | 12.91 | |
| | | | | | | | | | | | | | | | | | | | | | | | |
| | | | | | |
Income/(loss) from investment operations: | | | | | | | | | | | | | | | | | | | | | | | | |
Net investment loss* | | | (0.17 | ) | | | (0.17 | ) | | | (0.24 | ) | | | (0.26 | ) | | | (0.06 | ) | | | (0.19 | ) |
Net realized and unrealized gain/(loss) on investments | | | 2.04 | | | | 0.79 | | | | 2.95 | | | | 4.51 | | | | (0.35 | ) | | | (0.83 | ) |
| | | | | | | | | | | | | | | | | | | | | | | | |
Total from investment operations | | | 1.87 | | | | 0.62 | | | | 2.71 | | | | 4.25 | | | | (0.41 | ) | | | (1.02 | ) |
| | | | | | | | | | | | | | | | | | | | | | | | |
| | | | | | |
Less distributions: | | | | | | | | | | | | | | | | | | | | | | | | |
Distributions from capital gains | | | (1.29 | ) | | | (1.48 | ) | | | (0.70 | ) | | | — | | | | — | | | | — | |
| | | | | | | | | | | | | | | | | | | | | | | | |
Total distributions | | | (1.29 | ) | | | (1.48 | ) | | | (0.70 | ) | | | — | | | | — | | | | — | |
| | | | | | | | | | | | | | | | | | | | | | | | |
Net asset value, end of period | | $ | 17.46 | | | $ | 16.88 | | | $ | 17.74 | | | $ | 15.73 | | | $ | 11.48 | | | $ | 11.89 | |
| | | | | | | | | | | | | | | | | | | | | | | | |
Total return2 | | | 11.12 | % | | | 3.48 | % | | | 17.22 | % | | | 37.02 | % | | | (3.45 | )%** | | | (7.90 | )% |
| | | | | | | | | | | | | | | | | | | | | | | | |
| | | | | | |
Ratios to average net assets/supplemental data: | | | | | | | | | | | | | | | | | | | | | | | | |
Net assets, end of period (in 000’s) | | $ | 15,553 | | | $ | 14,913 | | | $ | 13,916 | | | $ | 11,224 | | | $ | 7,048 | | | $ | 7,253 | |
Operating expenses excluding custody earnings credit | | | 2.05 | % | | | 1.52 | % | | | 1.87 | % | | | 2.51 | % | | | 2.54 | %*** | | | 1.85 | % |
Operating expenses including reimbursement/waiver/custody earnings credit | | | 1.43 | % | | | 1.50 | % | | | 1.87 | % | | | 2.51 | % | | | 2.53 | %*** | | | 1.83 | % |
Operating expenses excluding reimbursement/waiver/custody earnings credit | | | 2.05 | % | | | 2.36 | % | | | 2.82 | % | | | 3.11 | % | | | 3.14 | %*** | | | 1.90 | % |
Net investment loss including reimbursement/waiver/custody earnings credit | | | (0.96 | )% | | | (0.97 | )% | | | (1.46 | )% | | | (1.98 | )% | | | (1.67 | )%*** | | | (1.50 | )% |
Portfolio turnover rate | | | 62 | % | | | 71 | % | | | 106 | % | | | 162 | % | | | 35 | %** | | | 84 | % |
1 | The Portfolio’s fiscal year-end changed from August 31 to December 31, effective December 31, 2002. |
2 | Total return represents the total return for the period indicated. |
| * | The selected per share data was calculated using the average shares outstanding method for the period. |
See Notes to Financial Statements.
94
| | |
WILSHIRE MUTUAL FUNDS, INC. SMALL COMPANY GROWTH PORTFOLIO FINANCIAL HIGHLIGHTS - (Continued) | | |
For a Portfolio Share Outstanding Throughout Each Period.
| | | | | | | | | | | | | | | | | | | | | | | | |
| | | Institutional Class Shares | |
| | | Year
Ended
12/31/2006 | | | Year
Ended
12/31/2005 | | | Year
Ended
12/31/2004 | | | Year
Ended
12/31/2003 | | | Four
Month
Period
Ended
12/31/20021 | | | Year
Ended
8/31/2002 | |
Net asset value, beginning of period | | $ | 17.25 | | | $ | 18.04 | | | $ | 15.94 | | | $ | 11.61 | | | $ | 12.04 | | | $ | 13.04 | |
| | | | | | | | | | | | | | | | | | | | | | | | |
| | | | | | |
Income/(loss) from investment operations: | | | | | | | | | | | | | | | | | | | | | | | | |
Net investment loss* | | | (0.12 | ) | | | (0.12 | ) | | | (0.19 | ) | | | (0.23 | ) | | | (0.06 | ) | | | (0.16 | ) |
Net realized and unrealized gain/(loss) on investments | | | 2.09 | | | | 0.81 | | | | 2.99 | | | | 4.56 | | | | (0.37 | ) | | | (0.84 | ) |
| | | | | | | | | | | | | | | | | | | | | | | | |
Total from investment operations | | | 1.97 | | | | 0.69 | | | | 2.80 | | | | 4.33 | | | | (0.43 | ) | | | (1.00 | ) |
| | | | | | | | | | | | | | | | | | | | | | | | |
| | | | | | |
Less distributions: | | | | | | | | | | | | | | | | | | | | | | | | |
Distributions from capital gains | | | (1.29 | ) | | | (1.48 | ) | | | (0.70 | ) | | | — | | | | — | | | | — | |
| | | | | | | | | | | | | | | | | | | | | | | | |
Total distributions | | | (1.29 | ) | | | (1.48 | ) | | | (0.70 | ) | | | — | | | | — | | | | — | |
| | | | | | | | | | | | | | | | | | | | | | | | |
Net asset value, end of period | | $ | 17.93 | | | $ | 17.25 | | | $ | 18.04 | | | $ | 15.94 | | | $ | 11.61 | | | $ | 12.04 | |
| | | | | | | | | | | | | | | | | | | | | | | | |
Total return2 | | | 11.46 | % | | | 3.81 | % | | | 17.56 | % | | | 37.30 | % | | | (3.57 | )%** | | | (7.67 | )% |
| | | | | | | | | | | | | | | | | | | | | | | | |
Ratios to average net assets/supplemental data: | | | | | | | | | | | | | | | | | | | | | | | | |
Net assets, end of period (in 000’s) | | $ | 196 | | | $ | 206 | | | $ | 214 | | | $ | 159 | | | $ | 290 | | | $ | 3,404 | |
Operating expenses excluding custody earnings credit | | | 1.77 | % | | | 1.21 | % | | | 1.55 | % | | | 2.28 | % | | | 2.27 | %*** | | | 1.57 | % |
Operating expenses including reimbursement/waiver/custody earnings credit | | | 1.15 | % | | | 1.19 | % | | | 1.55 | % | | | 2.28 | % | | | 2.26 | %*** | | | 1.55 | % |
Operating expenses excluding reimbursement/waiver/custody earnings credit | | | 1.77 | % | | | 2.05 | % | | | 2.50 | % | | | 2.88 | % | | | 2.87 | %*** | | | 1.62 | % |
Net investment loss including reimbursement/waiver/custody earnings credit | | | (0.68 | )% | | | (0.66 | )% | | | (1.14 | )% | | | (1.75 | )% | | | (1.40 | )%*** | | | (1.22 | )% |
Portfolio turnover rate | | | 62 | % | | | 71 | % | | | 106 | % | | | 162 | % | | | 35 | %** | | | 84 | % |
1 | The Portfolio’s fiscal year-end changed from August 31 to December 31, effective December 31, 2002. |
2 | Total return represents the total return for the period indicated. |
| * | The selected per share data was calculated using the average shares outstanding method for the period. |
See Notes to Financial Statements.
95
| | |
WILSHIRE MUTUAL FUNDS, INC. SMALL COMPANY VALUE PORTFOLIO FINANCIAL HIGHLIGHTS | | |
For a Portfolio Share Outstanding Throughout Each Period.
| | | | | | | | | | | | | | | | | | | | | | | | |
| | | Investment Class Shares | |
| | | Year
Ended
12/31/2006 | | | Year
Ended
12/31/2005 | | | Year
Ended
12/31/2004 | | | Year
Ended
12/31/2003 | | | Four
Month
Period
Ended
12/31/20021 | | | Year
Ended
8/31/2002 | |
Net asset value, beginning of period | | $ | 17.46 | | | $ | 21.47 | | | $ | 19.52 | | | $ | 14.34 | | | $ | 14.84 | | | $ | 15.53 | |
| | | | | | | | | | | | | | | | | | | | | | | | |
| | | | | | |
Income/(loss) from investment operations: | | | | | | | | | | | | | | | | | | | | | | | | |
Net investment income/(loss)* | | | 0.03 | | | | (0.07 | ) | | | (0.06 | ) | | | 0.04 | | | | 0.04 | | | | 0.16 | |
Net realized and unrealized gain/(loss) on investments | | | 3.38 | | | | 1.22 | | | | 4.51 | | | | 5.18 | | | | (0.29 | ) | | | (0.71 | ) |
| | | | | | | | | | | | | | | | | | | | | | | | |
Total from investment operations | | | 3.41 | | | | 1.15 | | | | 4.45 | | | | 5.22 | | | | (0.25 | ) | | | (0.55 | ) |
| | | | | | | | | | | | | | | | | | | | | | | | |
| | | | | | |
Less distributions: | | | | | | | | | | | | | | | | | | | | | | | | |
Dividends from net investment income | | | (0.03 | ) | | | — | | | | (0.03 | ) | | | (0.04 | ) | | | (0.25 | ) | | | (0.14 | ) |
Distributions from capital gains | | | (2.07 | ) | | | (5.16 | ) | | | (2.47 | ) | | | — | | | | — | | | | — | |
| | | | | | | | | | | | | | | | | | | | | | | | |
Total distributions | | | (2.10 | ) | | | (5.16 | ) | | | (2.50 | ) | | | (0.04 | ) | | | (0.25 | ) | | | (0.14 | ) |
| | | | | | | | | | | | | | | | | | | | | | | | |
Net asset value, end of period | | $ | 18.77 | | | $ | 17.46 | | | $ | 21.47 | | | $ | 19.52 | | | $ | 14.34 | | | $ | 14.84 | |
| | | | | | | | | | | | | | | | | | | | | | | | |
Total return2 | | | 19.64 | % | | | 5.41 | % | | | 22.78 | % | | | 36.41 | % | | | (1.66 | )%** | | | (3.59 | )% |
| | | | | | | | | | | | | | | | | | | | | | | | |
| | | | | | |
Ratios to average net assets/supplemental data: | | | | | | | | | | | | | | | | | | | | | | | | |
Net assets, end of period (in 000’s) | | $ | 23,639 | | | $ | 17,048 | | | $ | 36,826 | | | $ | 13,441 | | | $ | 16,245 | | | $ | 20,325 | |
Operating expenses excluding custody earnings credit | | | 1.92 | % | | | 1.50 | % | | | 1.48 | % | | | 1.52 | % | | | 1.54 | %*** | | | 1.16 | % |
Operating expenses including reimbursement/waiver/custody earnings credit | | | 1.31 | % | | | 1.48 | % | | | 1.46 | % | | | 1.52 | % | | | 1.53 | %*** | | | 1.14 | % |
Operating expenses excluding reimbursement/waiver/custody earnings credit | | | 1.92 | % | | | 2.10 | % | | | 2.09 | % | | | 2.12 | % | | | 2.14 | %*** | | | 1.21 | % |
Net investment income/(loss) including reimbursement/ waiver/custody earnings credit | | | 0.15 | % | | | (0.32 | )% | | | (0.28 | )% | | | 0.22 | % | | | 0.82 | %*** | | | 1.02 | % |
Portfolio turnover rate | | | 72 | % | | | 68 | % | | | 134 | % | | | 124 | % | | | 43 | %** | | | 117 | % |
1 | The Portfolio’s fiscal year-end changed from August 31 to December 31, effective December 31, 2002. |
2 | Total return represents the total return for the period indicated. |
| * | The selected per share data was calculated using the average shares outstanding method for the period. |
See Notes to Financial Statements.
96
| | |
WILSHIRE MUTUAL FUNDS, INC. SMALL COMPANY VALUE PORTFOLIO FINANCIAL HIGHLIGHTS - (Continued) | | |
For a Portfolio Share Outstanding Throughout Each Period.
| | | | | | | | | | | | | | | | | | | | | | | | |
| | | Institutional Class Shares | |
| | | Year
Ended
12/31/2006 | | | Year
Ended
12/31/2005 | | | Year
Ended
12/31/2004 | | | Year
Ended
12/31/2003 | | | Four
Month
Period
Ended
12/31/20021 | | | Year
Ended
8/31/2002 | |
Net asset value, beginning of period | | $ | 17.56 | | | $ | 21.50 | | | $ | 19.55 | | | $ | 14.35 | | | $ | 14.86 | | | $ | 15.53 | |
| | | | | | | | | | | | | | | | | | | | | | | | |
| | | | | | |
Income/(loss) from investment operations: | | | | | | | | | | | | | | | | | | | | | | | | |
Net investment income* | | | 0.09 | | | | 0.00 | # | | | 0.01 | | | | 0.08 | | | | 0.05 | | | | 0.20 | |
Net realized and unrealized gain/(loss) on investments | | | 3.41 | | | | 1.22 | | | | 4.51 | | | | 5.21 | | | | (0.28 | ) | | | (0.71 | ) |
| | | | | | | | | | | | | | | | | | | | | | | | |
Total from investment operations | | | 3.50 | | | | 1.22 | | | | 4.52 | | | | 5.29 | | | | (0.23 | ) | | | (0.51 | ) |
| | | | | | | | | | | | | | | | | | | | | | | | |
| | | | | | |
Less distributions: | | | | | | | | | | | | | | | | | | | | | | | | |
Dividends from net investment income | | | (0.09 | ) | | | — | | | | (0.10 | ) | | | (0.09 | ) | | | (0.28 | ) | | | (0.16 | ) |
Distributions from capital gains | | | (2.07 | ) | | | (5.16 | ) | | | (2.47 | ) | | | — | | | | — | | | | — | |
| | | | | | | | | | | | | | | | | | | | | | | | |
Total distributions | | | (2.16 | ) | | | (5.16 | ) | | | (2.57 | ) | | | (0.09 | ) | | | (0.28 | ) | | | (0.16 | ) |
| | | | | | | | | | | | | | | | | | | | | | | | |
Net asset value, end of period | | $ | 18.90 | | | $ | 17.56 | | | $ | 21.50 | | | $ | 19.55 | | | $ | 14.35 | | | $ | 14.86 | |
| | | | | | | | | | | | | | | | | | | | | | | | |
Total return2 | | | 20.05 | % | | | 5.73 | % | | | 23.11 | % | | | 36.86 | % | | | (1.57 | )%** | | | (3.34 | )% |
| | | | | | | | | | | | | | | | | | | | | | | | |
| | | | | | |
Ratios to average net assets/supplemental data: | | | | | | | | | | | | | | | | | | | | | | | | |
Net assets, end of period (in 000’s) | | $ | 1,375 | | | $ | 1,231 | | | $ | 3,961 | | | $ | 10,142 | | | $ | 9,285 | | | $ | 9,570 | |
Operating expenses excluding custody earnings credit | | | 1.62 | % | | | 1.17 | % | | | 1.17 | % | | | 1.23 | % | | | 1.28 | %*** | | | 0.92 | % |
Operating expenses including reimbursement/waiver/custody earnings credit | | | 1.02 | % | | | 1.16 | % | | | 1.15 | % | | | 1.23 | % | | | 1.27 | %*** | | | 0.90 | % |
Operating expenses excluding reimbursement/waiver/custody earnings credit | | | 1.62 | % | | | 1.78 | % | | | 1.78 | % | | | 1.83 | % | | | 1.88 | %*** | | | 0.97 | % |
Net investment income/(loss) including reimbursement/waiver/custody earnings credit | | | 0.44 | % | | | (0.01 | )% | | | 0.03 | % | | | 0.51 | % | | | 1.08 | %*** | | | 1.26 | % |
Portfolio turnover rate | | | 72 | % | | | 68 | % | | | 134 | % | | | 124 | % | | | 43 | %** | | | 117 | % |
| # | Amount is less than $0.01 per share. |
1 | The Portfolio’s fiscal year-end changed from August 31 to December 31, effective December 31, 2002. |
2 | Total return represents the total return for the period indicated. |
| * | The selected per share data was calculated using the average shares outstanding method for the period. |
See Notes to Financial Statements.
97
| | |
WILSHIRE MUTUAL FUNDS, INC. DOW JONES WILSHIRE 5000 INDEX PORTFOLIO FINANCIAL HIGHLIGHTS | | |
For a Portfolio Share Outstanding Throughout Each Period.
| | | | | | | | | | | | | | | | | | | | | | | | |
| | | Investment Class Shares | |
| | | Year
Ended
12/31/2006 | | | Year
Ended
12/31/2005 | | | Year
Ended
12/31/2004 | | | Year
Ended
12/31/2003 | | | Four
Month
Period
Ended
12/31/20021 | | | Year
Ended
8/31/2002 | |
Net asset value, beginning of period | | $ | 10.59 | | | $ | 10.09 | | | $ | 9.17 | | | $ | 7.10 | | | $ | 7.39 | | | $ | 8.93 | |
| | | | | | | | | | | | | | | | | | | | | | | | |
| | | | | | |
Income/(loss) from investment operations: | | | | | | | | | | | | | | | | | | | | | | | | |
Net investment income* | | | 0.12 | | | | 0.09 | | | | 0.09 | | | | 0.05 | | | | 0.01 | | | | 0.05 | |
Net realized and unrealized gain/(loss) on investments | | | 1.41 | | | | 0.48 | | | | 0.93 | | | | 2.05 | | | | (0.25 | ) | | | (1.55 | ) |
| | | | | | | | | | | | | | | | | | | | | | | | |
Total from investment operations | | | 1.53 | | | | 0.57 | | | | 1.02 | | | | 2.10 | | | | (0.24 | ) | | | (1.50 | ) |
| | | | | | | | | | | | | | | | | | | | | | | | |
| | | | | | |
Less distributions: | | | | | | | | | | | | | | | | | | | | | | | | |
Dividends from net investment income | | | (0.10 | ) | | | (0.07 | ) | | | (0.10 | ) | | | (0.03 | ) | | | (0.05 | ) | | | (0.04 | ) |
| | | | | | | | | | | | | | | | | | | | | | | | |
Total distributions | | | (0.10 | ) | | | (0.07 | ) | | | (0.10 | ) | | | (0.03 | ) | | | (0.05 | ) | | | (0.04 | ) |
| | | | | | | | | | | | | | | | | | | | | | | | |
Net asset value, end of period | | $ | 12.02 | | | $ | 10.59 | | | $ | 10.09 | | | $ | 9.17 | | | $ | 7.10 | | | $ | 7.39 | |
| | | | | | | | | | | | | | | | | | | | | | | | |
Total return2 | | | 14.46 | % | | | 5.63 | % | | | 11.17 | % | | | 29.62 | % | | | (3.23 | )%** | | | (16.95 | )% |
| | | | | | | | | | | | | | | | | | | | | | | | |
| | | | | | |
Ratios to average net assets/supplemental data: | | | | | | | | | | | | | | | | | | | | | | | | |
Net assets, end of period (in 000’s) | | $ | 145,952 | | | $ | 123,809 | | | $ | 122,263 | | | $ | 107,818 | | | $ | 63,224 | | | $ | 59,466 | |
Operating expenses excluding custody earnings credit | | | 0.74 | % | | | 0.82 | % | | | 0.92 | % | | | 1.06 | % | | | 1.23 | %*** | | | 0.87 | % |
Operating expenses including reimbursement/waiver/custody earnings credit | | | 0.74 | % | | | 0.82 | % | | | 0.92 | % | | | 1.05 | % | | | 1.22 | %*** | | | 0.86 | % |
Operating expenses excluding reimbursement/waiver/custody earnings credit | | | 0.74 | % | | | 0.82 | % | | | 0.92 | % | | | 1.06 | % | | | 1.23 | %*** | | | 1.01 | % |
Net investment income including reimbursement/waiver/custody earnings credit | | | 1.08 | % | | | 0.89 | % | | | 0.93 | % | | | 0.66 | % | | | 0.59 | %*** | | | 0.53 | % |
Portfolio turnover rate | | | 69 | % | | | 46 | % | | | 31 | % | | | 3 | % | | | 6 | %** | | | 22 | % |
1 | The Portfolio’s fiscal year-end changed from August 31 to December 31, effective December 31, 2002. |
2 | Total return represents the total return for the period indicated. |
| * | The selected per share data was calculated using the average shares outstanding method for the period. |
See Notes to Financial Statements.
98
| | |
WILSHIRE MUTUAL FUNDS, INC. DOW JONES WILSHIRE 5000 INDEX PORTFOLIO FINANCIAL HIGHLIGHTS - (Continued) | | |
For a Portfolio Share Outstanding Throughout Each Period.
| | | | | | | | | | | | | | | | | | | | | | | | |
| | | Institutional Class Shares | |
| | | Year
Ended
12/31/2006 | | | Year
Ended
12/31/2005 | | | Year
Ended
12/31/2004 | | | Year
Ended
12/31/2003 | | | Four
Month
Period
Ended
12/31/20021 | | | Year
Ended
8/31/2002 | |
Net asset value, beginning of period | | $ | 10.60 | | | $ | 10.11 | | | $ | 9.18 | | | $ | 7.10 | | | $ | 7.41 | | | $ | 8.95 | |
| | | | | | | | | | | | | | | | | | | | | | | | |
| | | | | | |
Income/(loss) from investment operations: | | | | | | | | | | | | | | | | | | | | | | | | |
Net investment income* | | | 0.15 | | | | 0.12 | | | | 0.12 | | | | 0.08 | | | | 0.02 | | | | 0.07 | |
Net realized and unrealized gain/(loss) on investments | | | 1.40 | | | | 0.47 | | | | 0.94 | | | | 2.05 | | | | (0.26 | ) | | | (1.54 | ) |
| | | | | | | | | | | | | | | | | | | | | | | | |
Total from investment operations | | | 1.55 | | | | 0.59 | | | | 1.06 | | | | 2.13 | | | | (0.24 | ) | | | (1.47 | ) |
| | | | | | | | | | | | | | | | | | | | | | | | |
| | | | | | |
Less distributions: | | | | | | | | | | | | | | | | | | | | | | | | |
Dividends from net investment income | | | (0.13 | ) | | | (0.10 | ) | | | (0.13 | ) | | | (0.05 | ) | | | (0.07 | ) | | | (0.07 | ) |
| | | | | | | | | | | | | | | | | | | | | | | | |
Total distributions | | | (0.13 | ) | | | (0.10 | ) | | | (0.13 | ) | | | (0.05 | ) | | | (0.07 | ) | | | (0.07 | ) |
| | | | | | | | | | | | | | | | | | | | | | | | |
Net asset value, end of period | | $ | 12.02 | | | $ | 10.60 | | | $ | 10.11 | | | $ | 9.18 | | | $ | 7.10 | | | $ | 7.41 | |
| | | | | | | | | | | | | | | | | | | | | | | | |
Total return2 | | | 14.66 | % | | | 5.83 | % | | | 11.56 | % | | | 30.05 | % | | | (3.18 | )%** | | | (16.58 | )% |
| | | | | | | | | | | | | | | | | | | | | | | | |
| | | | | | |
Ratios to average net assets/supplemental data: | | | | | | | | | | | | | | | | | | | | | | | | |
Net assets, end of period (in 000’s) | | $ | 65,177 | | | $ | 42,854 | | | $ | 41,368 | | | $ | 23,621 | | | $ | 15,245 | | | $ | 19,999 | |
Operating expenses excluding custody earnings credit | | | 0.47 | % | | | 0.54 | % | | | 0.62 | % | | | 0.76 | % | | | 0.95 | %*** | | | 0.58 | % |
Operating expenses including reimbursement/waiver/custody earnings credit | | | 0.47 | % | | | 0.54 | % | | | 0.62 | % | | | 0.75 | % | | | 0.94 | %*** | | | 0.57 | % |
Operating expenses excluding reimbursement/waiver/custody earnings credit | | | 0.47 | % | | | 0.54 | % | | | 0.62 | % | | | 0.76 | % | | | 0.95 | %*** | | | 0.72 | % |
Net investment income including reimbursement/waiver/custody earnings credit | | | 1.35 | % | | | 1.17 | % | | | 1.22 | % | | | 0.96 | % | | | 0.87 | %*** | | | 0.82 | % |
Portfolio turnover rate | | | 69 | % | | | 46 | % | | | 31 | % | | | 3 | % | | | 6 | %** | | | 22 | % |
1 | The Portfolio’s fiscal year-end changed from August 31 to December 31, effective December 31, 2002. |
2 | Total return represents the total return for the period indicated. |
| * | The selected per share data was calculated using the average shares outstanding method for the period. |
See Notes to Financial Statements.
99
| | |
WILSHIRE MUTUAL FUNDS, INC. DOW JONES WILSHIRE 5000 INDEX PORTFOLIO FINANCIAL HIGHLIGHTS - (Continued) | | |
For a Portfolio Share Outstanding Throughout Each Period.
| | | | | | | | | | | | | | | | | | | | | | | | |
| | | Qualified Class Shares | |
| | | Year
Ended
12/31/2006 | | | Year
Ended
12/31/2005 | | | Year
Ended
12/31/2004 | | | Year
Ended
12/31/2003 | | | Four
Month
Period
Ended
12/31/20021 | | | Year
Ended
8/31/2002 | |
Net asset value, beginning of period | | $ | 10.61 | | | $ | 10.10 | | | $ | 9.15 | | | $ | 7.09 | | | $ | 7.36 | | | $ | 8.90 | |
| | | | | | | | | | | | | | | | | | | | | | | | |
| | | | | | |
Income/(loss) from investment operations: | | | | | | | | | | | | | | | | | | | | | | | | |
Net investment income* | | | 0.11 | | | | 0.08 | | | | 0.08 | | | | 0.04 | | | | 0.01 | | | | 0.04 | |
Net realized and unrealized gain/(loss) on investments | | | 1.39 | | | | 0.47 | | | | 0.94 | | | | 2.05 | | | | (0.25 | ) | | | (1.54 | ) |
| | | | | | | | | | | | | | | | | | | | | | | | |
Total from investment operations | | | 1.50 | | | | 0.55 | | | | 1.02 | | | | 2.09 | | | | (0.24 | ) | | | (1.50 | ) |
| | | | | | | | | | | | | | | | | | | | | | | | |
| | | | | | |
Less distributions: | | | | | | | | | | | | | | | | | | | | | | | | |
Dividends from net investment income | | | (0.09 | ) | | | (0.04 | ) | | | (0.07 | ) | | | (0.03 | ) | | | (0.03 | ) | | | (0.04 | ) |
| | | | | | | | | | | | | | | | | | | | | | | | |
Total distributions | | | (0.09 | ) | | | (0.04 | ) | | | (0.07 | ) | | | (0.03 | ) | | | (0.03 | ) | | | (0.04 | ) |
| | | | | | | | | | | | | | | | | | | | | | | | |
Net asset value, end of period | | $ | 12.02 | | | $ | 10.61 | | | $ | 10.10 | | | $ | 9.15 | | | $ | 7.09 | | | $ | 7.36 | |
| | | | | | | | | | | | | | | | | | | | | | | | |
Total return2 | | | 14.18 | % | | | 5.46 | % | | | 11.13 | % | | | 29.45 | % | | | (3.22 | )%** | | | (16.93 | )% |
| | | | | | | | | | | | | | | | | | | | | | | | |
| | | | | | |
Ratios to average net assets/supplemental data: | | | | | | | | | | | | | | | | | | | | | | | | |
Net assets, end of period (in 000’s) | | $ | 1,114 | | | $ | 880 | | | $ | 1,399 | | | $ | 3,565 | | | $ | 1,730 | | | $ | 2,073 | |
Operating expenses excluding custody earnings credit | | | 0.83 | % | | | 0.93 | % | | | 0.99 | % | | | 1.15 | % | | | 1.35 | %*** | | | 0.98 | % |
Operating expenses including reimbursement/waiver/custody earnings credit | | | 0.83 | % | | | 0.93 | % | | | 0.99 | % | | | 1.14 | % | | | 1.34 | %*** | | | 0.97 | % |
Operating expenses excluding reimbursement/waiver/custody earnings credit | | | 0.83 | % | | | 0.93 | % | | | 0.99 | % | | | 1.15 | % | | | 1.35 | %*** | | | 1.12 | % |
Net investment income including reimbursement/ waiver/custody earnings credit | | | 0.99 | % | | | 0.75 | % | | | 0.85 | % | | | 0.58 | % | | | 0.47 | %*** | | | 0.42 | % |
Portfolio turnover rate | | | 69 | % | | | 46 | % | | | 31 | % | | | 3 | % | | | 6 | %** | | | 22 | % |
1 | The Portfolio’s fiscal year-end changed from August 31 to December 31, effective December 31, 2002. |
2 | Total return represents the total return for the period indicated. |
| * | The selected per share data was calculated using the average shares outstanding method for the period. |
See Notes to Financial Statements.
100
| | |
WILSHIRE MUTUAL FUNDS, INC. DOW JONES WILSHIRE 5000 INDEX PORTFOLIO FINANCIAL HIGHLIGHTS - (Continued) | | |
For a Portfolio Share Outstanding Throughout Each Period.
| | | | | | | | | | | | | | | | | | | | | | | | |
| | | Horace Mann Class Shares | |
| | | Year
Ended
12/31/2006 | | | Year
Ended
12/31/2005 | | | Year
Ended
12/31/2004 | | | Year
Ended
12/31/2003 | | | Four
Month
Period
Ended
12/31/20021 | | | Year
Ended
8/31/2002 | |
Net asset value, beginning of period | | $ | 10.57 | | | $ | 10.08 | | | $ | 9.15 | | | $ | 7.09 | | | $ | 7.38 | | | $ | 8.91 | |
| | | | | | | | | | | | | | | | | | | | | | | | |
| | | | | | |
Income/(loss) from investment operations: | | | | | | | | | | | | | | | | | | | | | | | | |
Net investment income* | | | 0.12 | | | | 0.08 | | | | 0.08 | | | | 0.05 | | | | 0.01 | | | | 0.04 | |
Net realized and unrealized gain/(loss) on investments | | | 1.39 | | | | 0.47 | | | | 0.95 | | | | 2.04 | | | | (0.25 | ) | | | (1.53 | ) |
| | | | | | | | | | | | | | | | | | | | | | | | |
Total from investment operations | | | 1.51 | | | | 0.55 | | | | 1.03 | | | | 2.09 | | | | (0.24 | ) | | | (1.49 | ) |
| | | | | | | | | | | | | | | | | | | | | | | | |
| | | | | | |
Less distributions: | | | | | | | | | | | | | | | | | | | | | | | | |
Dividends from net investment income | | | (0.09 | ) | | | (0.06 | ) | | | (0.10 | ) | | | (0.03 | ) | | | (0.05 | ) | | | (0.04 | ) |
| | | | | | | | | | | | | | | | | | | | | | | | |
Total distributions | | | (0.09 | ) | | | (0.06 | ) | | | (0.10 | ) | | | (0.03 | ) | | | (0.05 | ) | | | (0.04 | ) |
| | | | | | | | | | | | | | | | | | | | | | | | |
Net asset value, end of period | | $ | 11.99 | | | $ | 10.57 | | | $ | 10.08 | | | $ | 9.15 | | | $ | 7.09 | | | $ | 7.38 | |
| | | | | | | | | | | | | | | | | | | | | | | | |
Total return2 | | | 14.32 | % | | | 5.49 | % | | | 11.23 | % | | | 29.44 | % | | | (3.28 | )%** | | | (16.85 | )% |
| | | | | | | | | | | | | | | | | | | | | | | | |
| | | | | | |
Ratios to average net assets/supplemental data: | | | | | | | | | | | | | | | | | | | | | | | | |
Net assets, end of period (in 000’s) | | $ | 1,817 | | | $ | 1,891 | | | $ | 1,964 | | | $ | 1,915 | | | $ | 1,401 | | | $ | 1,401 | |
Operating expenses excluding custody earnings credit | | | 0.77 | % | | | 0.89 | % | | | 0.97 | % | | | 1.11 | % | | | 1.30 | %*** | | | 0.93 | % |
Operating expenses including reimbursement/waiver/custody earnings credit | | | 0.77 | % | | | 0.89 | % | | | 0.97 | % | | | 1.10 | % | | | 1.29 | %*** | | | 0.92 | % |
Operating expenses excluding reimbursement/waiver/custody earnings credit | | | 0.77 | % | | | 0.89 | % | | | 0.97 | % | | | 1.11 | % | | | 1.30 | %*** | | | 1.07 | % |
Net investment income including reimbursement/waiver/custody earnings credit | | | 1.05 | % | | | 0.82 | % | | | 0.87 | % | | | 0.61 | % | | | 0.52 | %*** | | | 0.47 | % |
Portfolio turnover rate | | | 69 | % | | | 46 | % | | | 31 | % | | | 3 | % | | | 6 | %** | | | 22 | % |
1 | The Portfolio’s fiscal year-end changed from August 31 to December 31, effective December 31, 2002. |
2 | Total return represents the total return for the period indicated. |
| * | The selected per share data was calculated using the average shares outstanding method for the period. |
See Notes to Financial Statements.
101
| | |
WILSHIRE MUTUAL FUNDS, INC. NOTESTO FINANCIAL STATEMENTS | | |
1. Significant Accounting Policies.
Wilshire Mutual Funds, Inc. (the “Company”) is registered under the Investment Company Act of 1940, as amended (the “1940 Act”), as an open-end diversified investment company, which was incorporated under Maryland law on July 30, 1992. The Company operates as a series company and presently offers five series: Large Company Growth Portfolio, Large Company Value Portfolio, Small Company Growth Portfolio, Small Company Value Portfolio and Dow Jones Wilshire 5000 Index Portfolio (collectively the “Portfolios”, each a “Portfolio” of the Company). The Company accounts separately for the assets, liabilities and operations of each series.
Each of the Portfolios offers Investment and Institutional Class shares, each of which has equal rights as to voting privileges. The Dow Jones Wilshire 5000 Index Portfolio also offers Qualified Class Shares and Horace Mann Class Shares. Each of the Investment Class, Qualified Class and Horace Mann Class has exclusive voting rights with respect to its particular service and distribution plan. Investment income, realized and unrealized capital gains and losses and the common expenses of each Portfolio are allocated on a pro-rata basis to each class based on the relative net assets of each class to the total net assets of each Portfolio. Each class of shares differs in its respective service and distribution expenses.
The preparation of financial statements in accordance with accounting principles generally accepted in the United States of America requires management to make estimates and assumptions that affect the reported amounts of assets and liabilities and disclosure of contingent assets and liabilities at the date of the financial statements and the reported amounts of revenues and expenses during the reporting period. Actual results could differ from those estimates. The following is a summary of significant accounting policies consistently followed by the Portfolios in the preparation of their financial statements.
Portfolio valuation: A security listed or traded on U.S. exchanges is valued at its last sales price on the exchange where it is principally traded. In the absence of a current quotation, the security is valued at the mean between the last bid and asked prices on that exchange. Securities quoted on the National Association of Securities Dealers Automatic Quotation (NASDAQ) System, for which there have been sales, are valued at the NASDAQ official closing price. If there are no such sales, the most recent bid quotation is used. Securities traded over-the-counter (other than on NASDAQ) are valued at the last current sale price. Debt securities that have a remaining maturity of 60 days or less are valued at cost, plus or minus any amortized premium or discount. In the event market quotations are not readily available, securities are valued at fair value according to procedures established by the Board of Directors or as determined in good faith by the Pricing Committee, whose members include at least one representative of the Adviser who is an officer of the Company and at least one portfolio management professional of the subadviser responsible for managing the portion of the Portfolio whose securities require a fair valuation determination. Fair value is defined as the amount the owner of a security might reasonably expect to receive upon a current sale. Securities whose value does not reflect fair value because a significant valuation event has occurred may be valued at fair value by the Pricing Committee. Significant events include, but are not limited to the following: significant fluctuations in domestic markets, foreign markets or foreign currencies; occurrences not directly tied to the securities markets such as natural disasters, armed conflicts or significant governmental actions; and major announcements affecting a single issuer or an entire market or market sector.
102
| | |
WILSHIRE MUTUAL FUNDS, INC. NOTESTO FINANCIAL STATEMENTS - (continued) | | |
Futures contracts: A futures contract is an agreement to purchase (long) or sell (short) an agreed asset at a set price for delivery on a future date. Upon entering into a futures contract, the Portfolio is required to pledge to the broker an amount of cash and/or other assets equal to a certain percentage of the contract amount. This amount is known as the “initial margin.” Subsequent payments known as “variation margin,” are made or received by the Portfolio each day, depending on the daily fluctuations in the value of the underlying security. The change in the value of the futures contract is recorded for financial statement purposes on a daily basis as unrealized gain or loss. When the contract expires or is closed, the gain or loss is realized and is presented in the Statement of Operations as net realized gain or loss on futures contracts. The use of futures transactions involves the risk of imperfect correlation in movement in the price of futures contracts, interest rates, and underlying hedged assets.
Securities transactions and investment income: Securities transactions are recorded on a trade date basis. Realized gains and losses from securities transactions are recorded on the identified cost basis. Dividend income is recognized on the ex-dividend date and interest income, including, where applicable, accretion of discount and amortization of premium on investments, is recognized on the accrual basis. Distributions received on securities that represent a return of capital or capital gain are reclassed as a reduction of cost of investments and/or as a realized gain. The actual character of income, realized gain and return of capital distributions received from Real Estate Investment Trusts are not known until after the end of the fiscal year, at which time such distributions are appropriately adjusted.
Expenses: Distribution and Service fees directly attributable to a class of shares are charged to that class’ operations. Expenses of the Portfolios other than Distribution and Service fees are prorated among the classes to which the expense relates based on the relative net assets of each class of shares. Expenses and fees, including the advisory fees, are accrued daily and taken into account for the purpose of determining the net asset value of each Portfolio’s shares.
Dividends and distributions to shareholders: Distributions to shareholders are recorded on the ex-dividend date. Distributions from net investment income, if any, are declared and paid annually. The Portfolios’ net realized capital gains, unless offset by any available capital loss carryforward, are distributed to shareholders annually. Additional distributions of net investment income and capital gains may be made at the discretion of the Board of Directors in order to avoid the application of a 4% non-deductible Federal excise tax.
Securities lending: The Portfolios may seek additional income by lending their securities on a short-term basis to banks, brokers and dealers in return for cash collateral, which is invested in short-term securities. A Portfolio may return a portion of the interest earned to the borrower or a third party which is unaffiliated with the Company and acting as a “placing broker.” A Portfolio receives compensation for lending securities in the form of fees. A Portfolio also continues to receive dividends on the securities loaned. Security loans are secured at all times by collateral. It is the Company’s policy that the collateral be equal to at least 102% of the market value of the securities loaned plus accrued interest when the transaction is entered into and that the collateral supporting loans be remarked daily. Gain or loss in the market price of the securities loaned that may occur during the term of the loan are reflected in the value of the Portfolio. The risks from securities lending are that the borrower may not provide additional collateral
103
| | |
WILSHIRE MUTUAL FUNDS, INC. NOTESTO FINANCIAL STATEMENTS - (continued) | | |
when required or return the securities when due or when called for by the Portfolio. PFPC Trust Company, the Portfolio’ custodian, acts as the securities lending agent for the Portfolios. The value of the securities on loan and the value of the related collateral at December 31, 2006 are shown on the Statements of Assets and Liabilities. The related income from securities loaned is reflected in the Statements of Operations.
New accounting pronouncements: In July 2006, the Financial Accounting Standards Board (“FASB”) issued Interpretation No. 48, “Accounting for Uncertainty in Income Taxes an Interpretation of FASB Statement No. 109” (the “Interpretation”). The Interpretation establishes for all entities, including pass-through entities such as the Portfolios, a minimum threshold for financial statement recognition of the benefit of positions taken in filing tax returns (including whether an entity is taxable in a particular jurisdiction), and requires certain expanded tax disclosures. The Interpretation is to be implemented no later than June 29, 2007, and is to be applied to all open tax years as of the date of effectiveness. Management has begun to evaluate the application of the Interpretation to the Portfolios, and is not in a position at this time to estimate the significance of its impact, if any, on the Portfolios’ financial statements.
In addition, in September 2006, FASB issued Statement of Financial Accounting Standards No. 157 “Fair Value Measurements” (“SFAS 157”). This standard establishes a single authoritative definition of fair value, sets out framework for measuring fair value and requires additional disclosure about fair value measurements. SFAS 157 applies to fair value measurements already required or permitted by existing standards. SFAS 157 is effective for fiscal years beginning after November 15, 2007 and interim periods within those fiscal years. The changes to current generally accepted accounting principles from the application of this Statement relate to the definition of fair value, the methods used to measure fair value, and the expanded disclosures about fair value measurements. As of December 31, 2006, the Portfolios do not believe the adoption of SFAS 157 will impact the amounts reported in the financial statements, however, additional disclosures may be required about the inputs used to develop the measurements reported in the financial statements for a fiscal period.
2. Investment Advisory Fee and Other Transactions.
The Advisory Agreement (the “Agreement”) between the Company and Wilshire Associates Incorporated (“Wilshire” or the “Adviser”) permits the Board of Directors and Wilshire to retain sub-advisers to the Portfolios in certain circumstances without shareholder approval. Under the Agreement, Wilshire charges annual fees of 0.75% of average daily net assets for the Large Company Growth and Large Company Value Portfolios, 0.85% of average daily net assets for the Small Company Growth and Small Company Value Portfolios, and 0.10% of average daily net assets for the Dow Jones Wilshire 5000 Index Portfolio. For the year ended December 31, 2006, Wilshire voluntarily waived 0.60% from its fee for the Small Company Growth Portfolio and 0.60% from its fee for the Small Company Value Portfolio. Wilshire also reimbursed the Small Company Growth Portfolio for any expense accruals in excess of 1.50%. Wilshire will not seek recoupment from the Company for expenses previously waived or reimbursed through December 31, 2006.
104
| | |
WILSHIRE MUTUAL FUNDS, INC. NOTESTO FINANCIAL STATEMENTS - (continued) | | |
For the year ended December 31, 2006, Wilshire voluntarily waived fees and reimbursed expenses as follows:
| | | | | | |
Portfolio | | Waived Fees | | Reimbursed Expenses |
Small Company Growth Portfolio | | $ | 92,075 | | $ | 1,381 |
Small Company Value Portfolio | | | 123,309 | | | — |
The Board of Directors of the Company has approved Los Angeles Capital Management and Equity Research (“L.A. Capital”), Delaware Management Company (“Delaware”), Goldman Sachs Asset Management (“Goldman Sachs”), Pzena Investment Management, LLC (“Pzena”), AllianceBernstein L.P. (“AllianceBernstein”), Kalmar Investment Advisers (“Kalmar”) and NWQ Investment Management Company, LP (“NWQ”) (collectively the “Sub-Advisers”) to provide sub-advisory services with respect to the Portfolios. L.A. Capital, Delaware, and Goldman Sachs each manage a portion of the Large Company Growth Portfolio. L.A. Capital, Pzena and AllianceBernstein each manage a portion of the Large Company Value Portfolio. L.A. Capital and Kalmar each manage a portion of the Small Company Growth Portfolio. L.A. Capital and NWQ each manage a portion of the Small Company Value Portfolio. L.A. Capital is the sole sub-adviser for the Dow Jones Wilshire 5000 Index Portfolio.
Wilshire continues to oversee the Sub-Advisers. The fees of the Sub-Advisers are paid by Wilshire.
PFPC Inc. (“PFPC”) serves as the Company’s administrator and accounting agent pursuant to a services agreement. PFPC Trust Company serves as the Company’s custodian. For the year ended December 31, 2006, PFPC waived $5,000 in administration fees.
The officers of the Company receive remuneration from the Adviser. The Company does not pay any remuneration to its officers with the exception of the Company’s Chief Compliance Officer (“CCO”). The Company and Wilshire Variable Insurance Trust each pay a portion of the CCO’s compensation, and the Adviser pays the remainder of such compensation. Effective January 1, 2006, the Company and the Wilshire Variable Insurance Trust together pay each independent director an annual Board member retainer of $10,000, an annual additional Board chair retainer of $16,000, a Board meeting fee of $1,500, a telephonic meeting fee of $1,000, an annual Committee member retainer of $4,000, an annual Committee chair retainer of $8,000 in lieu of the $4,000 Committee member retainer, and a Committee telephonic meeting fee of $500.
3. Distribution and Service Plans.
The Directors of the Company have adopted shareholder services and/or distribution plans (the “Plans”) pursuant to Rule 12b-1 under the 1940 Act, with respect to the Investment Class Shares of each Portfolio and the Qualified Class Shares of the Dow Jones Wilshire 5000 Index Portfolio. Under the Plans, each such Portfolio reimburses PFPC Distributors, Inc. (the “Distributor”), at an annual rate of up to 0.25% of the value of the average daily net assets attributable to the Investment Class Shares and Qualified Class Shares of each Portfolio for certain service fees provided by securities dealers or other financial intermediaries (“service fees”) or for certain distribution expenses for the purpose of financing any activity intended to result in the sale of Investment Class Shares or Qualified Class Shares. For the year ended December 31, 2006, the distribution and service fee expenses incurred for each such class of the Large
105
| | |
WILSHIRE MUTUAL FUNDS, INC. NOTESTO FINANCIAL STATEMENTS - (continued) | | |
Company Growth Portfolio, Large Company Value Portfolio, Small Company Growth Portfolio, Small Company Value Portfolio and Dow Jones Wilshire 5000 Index Portfolio were 0.25%, 0.25%, 0.24%, 0.25% and 0.21% of average net assets, respectively.
In addition, Investment Class Shares and Institutional Class Shares pay the expenses associated with certain shareholder servicing arrangements with third parties, provided that payment of such fees to any such shareholder service provider does not exceed in any year 0.20% and 0.15% for the Investment and Institutional Class Shares, respectively, of the Portfolio’s average net assets attributable to the shares whose holders are serviced by such provider.
For the year ended December 31, 2006, the shareholder service provider fees were as follows (as a percent of average net assets of each class):
| | | | | | |
Portfolio | | Investment Class | | | Institutional Class | |
Large Company Growth Portfolio | | 0.13 | % | | 0.01 | % |
Large Company Value Portfolio | | 0.06 | % | | 0.00 | % |
Small Company Growth Portfolio | | 0.08 | % | | 0.04 | % |
Small Company Value Portfolio | | 0.09 | % | | 0.05 | % |
Dow Jones Wilshire 5000 Index Portfolio | | 0.06 | % | | 0.00 | % |
The Qualified Class Shares of the Dow Jones Wilshire 5000 Index Portfolio has adopted a shareholder services plan which authorizes payments by the Qualified Class Shares of up to 0.15% of the average daily net assets attributable to the Portfolio’s Qualified Class Shares for certain shareholder services provided by Insurers or other financial intermediaries. For the year ended December 31, 2006, the shareholder service provider fees for the Qualified Class Shares were 0.15% of average net assets.
The Directors of the Company have adopted a shareholder services and distribution plan pursuant to Rule 12b-1 with respect to the Horace Mann Class Shares of the Dow Jones Wilshire 5000 Index Portfolio. Under such Plan, the Company reimburses the Distributor for its shareholder service and distribution payments at an annual rate of up to 0.35% of the value of the average daily net assets of the Dow Jones Wilshire 5000 Index Portfolio attributable to the Horace Mann Class Shares.
4. Securities Transactions.
For the year ended December 31, 2006, aggregate cost of purchases and proceeds from sales of securities, other than short-term investments, were as follows:
| | | | | | |
Portfolio | | Purchases | | Sales |
Large Company Growth Portfolio | | $ | 373,421,484 | | $ | 413,124,327 |
Large Company Value Portfolio | | | 42,604,859 | | | 35,524,207 |
Small Company Growth Portfolio | | | 9,373,354 | | | 9,780,934 |
Small Company Value Portfolio | | | 18,510,128 | | | 14,705,608 |
Dow Jones Wilshire 5000 Index Portfolio | | | 144,370,528 | | | 118,072,594 |
106
| | |
WILSHIRE MUTUAL FUNDS, INC. NOTESTO FINANCIAL STATEMENTS - (continued) | | |
The Federal tax cost, unrealized appreciation and depreciation at December 31, 2006 for each Portfolio are as follows:
| | | | | | | | | | | | | |
Portfolio | | Tax Cost | | Unrealized
Appreciation | | Unrealized
Depreciation | | | Net Unrealized
Appreciation |
Large Company Growth Portfolio | | $ | 494,821,934 | | $ | 119,666,348 | | $ | (10,887,930 | ) | | $ | 108,778,418 |
Large Company Value Portfolio | | | 76,426,132 | | | 16,604,272 | | | (739,521 | ) | | | 15,864,751 |
Small Company Growth Portfolio | | | 15,889,395 | | | 2,967,739 | | | (599,310 | ) | | | 2,368,429 |
Small Company Value Portfolio | | | 23,608,477 | | | 4,243,982 | | | (692,773 | ) | | | 3,551,209 |
Dow Jones Wilshire 5000 Index Portfolio | | | 211,742,265 | | | 59,706,247 | | | (11,288,628 | ) | | | 48,417,619 |
5. Significant Shareholder Activity.
On December 31, 2006, the Portfolios had the following concentrations of shareholders holding 10% or more of the outstanding shares of the Portfolios. These represent omnibus shareholder accounts comprised of many individual shareholders.
| | | | | |
Portfolio | | | | | |
Large Company Growth Portfolio (1 omnibus shareholder) | | 53 | % | |
Large Company Value Portfolio (2 omnibus shareholders) | | 59 | % | |
Small Company Growth Portfolio (2 omnibus shareholders) | | 75 | % | |
Small Company Value Portfolio (2 omnibus shareholders) | | 57 | % | |
Dow Jones Wilshire 5000 Index Portfolio (3 omnibus shareholders) | | 67 | % | |
6. Tax Information.
No provision for federal income taxes is required since each Portfolio intends to qualify as a regulated investment company under Subchapter M of the Internal Revenue Code of 1986, as amended, and distribute to shareholders all of its taxable income and gains. Federal income tax regulations differ from accounting principles generally accepted in the United States of America; therefore, distributions determined in accordance with tax regulations may differ in amount or character from net investment income and realized gains for financial reporting purposes. Financial reporting records are adjusted for permanent book/tax differences to reflect tax character. Financial records are not adjusted for temporary differences.
The Portfolios intend to retain realized gains to the extent of available capital loss carryforwards. At December 31, 2006, the following Portfolios had available for Federal income tax purposes unused capital losses as follows:
| | | | | | | | | | | | |
| | | Expiring December 31, |
Portfolio | | 2010 | | 2011 | | 2012 | | 2013 |
Large Company Growth Portfolio | | $ | 6,132,547 | | | — | | | — | | | — |
Dow Jones Wilshire 5000 Index Portfolio | | | 7,939,802 | | $ | 3,810,802 | | $ | 5,509,772 | | $ | 108,266 |
107
| | |
WILSHIRE MUTUAL FUNDS, INC. NOTESTO FINANCIAL STATEMENTS - (continued) | | |
Capital loss carryforwards utilized in the current year were $34,372,589 and $2,411,652 for the Large Company Growth Portfolio and the Dow Jones Wilshire 5000 Index Portfolio, respectively.
The tax character of distributions paid were:
| | | | | | | | | | | | | | | |
Portfolio | | 2006
Ordinary
Income | | 2006 Capital
Gains | | 2005
Ordinary
Income | | 2005
Return of Capital | | 2005 Capital
Gains |
Large Company Value Portfolio | | $ | 1,012,778 | | $ | 5,833,008 | | $ | 1,269,020 | | $ | 274,153 | | $ | 5,781,493 |
Small Company Growth Portfolio | | | — | | | 1,099,689 | | | 446,619 | | | — | | | 770,834 |
Small Company Value Portfolio | | | 543,566 | | | 2,017,669 | | | 1,766,864 | | | — | | | 2,509,980 |
Dow Jones Wilshire 5000 Index Portfolio | | | 1,951,930 | | | — | | | 1,208,085 | | | — | | | — |
At December 31, 2006, the components of distributable accumulated earnings/(losses) on a tax basis were as follows:
| | | | | | | | | | | | | | | | | |
| | | Large
Company
Growth
Portfolio | | | Large
Company
Value
Portfolio | | Small
Company
Growth
Portfolio | | Small
Company
Value
Portfolio | | Dow Jones
Wilshire 5000 Index Portfolio | |
Undistributed ordinary income | | $ | — | | | $ | 495,653 | | $ | 220,425 | | $ | 35,093 | | $ | 314,686 | |
Accumulated capital gain/(loss) | | | (6,132,547 | ) | | | 1,271,180 | | | 219,999 | | | 664,336 | | | (17,368,642 | ) |
Unrealized appreciation | | | 108,778,418 | | | | 15,864,751 | | | 2,368,429 | | | 3,551,209 | | | 48,417,619 | |
| | | | | | | | | | | | | | | | | |
Total accumulated earnings | | $ | 102,645,871 | | | $ | 17,631,584 | | $ | 2,808,853 | | $ | 4,250,638 | | $ | 31,363,663 | |
| | | | | | | | | | | | | | | | | |
The differences between book and tax-basis unrealized appreciation/depreciation) are attributable primarily to the tax deferral of losses on wash sales on all Portfolios.
7. Reclassifications.
Accounting principles generally accepted in the United States of America require that certain components of net assets be reclassified between financial and tax reporting. These reclassifications have no effect on net assets or net asset values per share. The permanent differences are primarily attributable to the net realized gain on sale of partnerships, write-off of net operating losses and the recharacterization of distributions. As of December 31, 2006, the reclassifications were as follows:
| | | | | | | | | | | | |
Portfolio | | Decrease
Paid-in Capital | | | Increase/(Decrease)
Undistributed Net
Investment Income | | | Increase/(Decrease)
Realized Capital Gains | |
Large Company Growth Portfolio | | $ | (286,345 | ) | | $ | 286,345 | | | $ | — | |
Small Company Growth Portfolio | | | — | | | | 145,908 | | | | (145,908 | ) |
Small Company Value Portfolio | | | — | | | | 2,552 | | | | (2,552 | ) |
Dow Jones Wilshire 5000 Index Portfolio | | | — | | | | (4,142 | ) | | | 4,142 | |
108
| | |
WILSHIRE MUTUAL FUNDS, INC. NOTESTO FINANCIAL STATEMENTS - (continued) | | |
8. Indemnifications.
In the normal course of business, the Portfolios enter into contracts that provide general indemnifications. The Portfolios’ maximum exposure under these arrangements is dependent on claims that may be made against the Portfolios in the future and, therefore, cannot be estimated; however, based on experience, the risk of material loss from such claims is considered remote.
9. Subsequent Event.
Effective February 1, 2007, the Large Company Growth Portfolio is managed by Columbus Circle Investors, L.A. Capital, Logan Capital Management, Inc., Payden & Rygel, Quest Investment Management, Inc., Sawgrass Asset Management, Stralem & Company and Victory Capital Management Inc. As of February 1, 2007 Columbus Circle Investors, Delaware, Goldman Sachs and Stralem & Company have not been allocated assets.
109
| | |
WILSHIRE MUTUAL FUNDS, INC. REPORT OF INDEPENDENT REGISTERED PUBLIC ACCOUNTING FIRM | | |
To the Shareholders and Board of Directors
of Wilshire Mutual Funds, Inc.:
In our opinion, the accompanying statements of assets and liabilities, including the condensed schedules of investments, and the related statements of operations and of changes in net assets and the financial highlights present fairly, in all material respects, the financial position of Large Company Growth Portfolio, Large Company Value Portfolio, Small Company Growth Portfolio, Small Company Value Portfolio and Dow Jones Wilshire 5000 Index Portfolio (constituting Wilshire Mutual Funds, Inc. hereafter referred to as the “Company”) at December 31, 2006, the results of each of their operations for the year then ended, the changes in each of their net assets for each of the two years in the period then ended and the financial highlights for each of the periods indicated, in conformity with accounting principles generally accepted in the United States of America. These financial statements and financial highlights (hereafter referred to as “financial statements”) are the responsibility of the Company’s management; our responsibility is to express an opinion on these financial statements based on our audits. We conducted our audits of these financial statements in accordance with the standards of the Public Company Accounting Oversight Board (United States). Those standards require that we plan and perform the audit to obtain reasonable assurance about whether the financial statements are free of material misstatement. An audit includes examining, on a test basis, evidence supporting the amounts and disclosures in the financial statements, assessing the accounting principles used and significant estimates made by management, and evaluating the overall financial statement presentation. We believe that our audits, which included confirmation of securities at December 31, 2006 by correspondence with the custodian and brokers, provide a reasonable basis for our opinion.
PricewaterhouseCoopers LLP
Philadelphia, PA
February 28, 2007
110
| | |
WILSHIRE MUTUAL FUNDS, INC. ADDITIONAL FUND INFORMATION | | |
The Board of Directors has responsibility for the overall management and operations of the Company. The Board establishes the Company’s policies and meets regularly to review the activities of the officers, who are responsible for the day-to-day operations of the Company.
Set forth below are the names of the Directors and executive officers of the Company, their ages, positions and terms of office, their principal occupations during the past five years, and other directorships held by them. The address of each Director and Officer is 1299 Ocean Avenue, Suite 700, Santa Monica, California 90401.
| | | | | | | | | | |
Name and Age | | Position
Held With
Fund | | Term of
Office1and
Length of
Time
Served | | Principal Occupations During the Past 5 Years | | Number of
Portfolios/
Funds in
Complex
Overseen
by Director | | Other Directorships Held By Director |
INTERESTED DIRECTOR |
| | | | | |
Lawrence
Davanzo, 54(2) | | Director and President | | Since 2005 | | Senior Managing Director, October 2004-Present, Wilshire Associates Incorporated; President, 2005-Present, Wilshire Variable Insurance Trust; Managing Director, August 2004-October 2004, Guggenheim Partners; independent investor, August 2001-August 2004; President, February 2000-August 2001, InvestorForce Securities; Managing Director and Founder, February 1991-February 2000, Asset Strategy Consulting (investment consulting firm). | | 19 | | Wilshire Variable Insurance Trust (14 portfolios); Wilshire Associates Incorporated |
111
| | |
WILSHIRE MUTUAL FUNDS, INC. ADDITIONAL FUND INFORMATION - (CONTINUED) | | |
| | | | | | | | | | |
Name and Age | | Position
Held With
Fund | | Term of
Office1and
Length of
Time Served | | Principal Occupations During the Past 5 Years | | Number of
Portfolios/
Funds in
Complex
Overseen
by Director | | Other Directorships Held By Director |
|
| NON-INTERESTED DIRECTORS |
| | | | | |
DeWitt F. Bowman, 76 | | Director | | Since 1996 | | Principal, February 1994-Present, Pension Investment Consulting (pension consulting firm). | | 19 | | Sycuan Funds; Forward Funds; PCG Private Equity Fund; Brandes Institutional International Fund (registered investment companies); RREEF America REIT III; Director, 5/94-present, RREEF America REIT (real estate investment trusts); Pacific Gas & Electric Nuclear Decommis- sioning Trust (trust fund for decommissioning nuclear power plants); Wilshire Variable Insurance Trust (14 portfolios) |
| | | | | |
Roger A. Formisano, 58 | | Director | | Since 2006 | | Vice President, University of Wisconsin Medical Foundation, 2006-Present; formerly Director, The Center for Leadership and Applied Business, UW-Madison School of Business; Principal, R.A. Formisano & Company, LLC. | | 19 | | Integrity Mutual Insurance Company, Wilshire Variable Insurance Trust (14 Portfolios) |
| | | | | |
Richard A. Holt, 65(3) | | Director | | Since 2006 | | Retired; formerly Senior Relationship Manager, Scudder Insurance Asset Management. | | 19 | | Wilshire Variable Insurance Trust (14 Portfolios) |
| | | | | |
Harriet A. Russell, 65 | | Director | | Since 2006 | | President, Greater Cincinnati Credit Union; formerly Vice President, Cincinnati Board of Education; formerly teacher, Walnut Hills High School. | | 19 | | Greater Cincinnati Credit Union Board; Wilshire Variable Insurance Trust (14 Portfolios) |
112
| | |
WILSHIRE MUTUAL FUNDS, INC. ADDITIONAL FUND INFORMATION - (CONTINUED) | |
|
| | | | | | | | | | |
Name and Age | | Position Held With
Fund | | Term of Office1and
Length of Time
Served | | Principal
Occupations During
the Past 5 Years | | Number of
Portfolios/ Funds in
Complex Overseen
by Director | | Other Directorships
Held By Director |
| | | | | |
| George J. Zock, 56 | | Director, Chairman of the Board | | Since 2006 | | Independent Consultant; Consultant, Horace Mann Service Corporation (2004-2005); Executive Vice President, Horace Mann Life Insurance Company and Horace Mann Service Corporation (1997-2003). | | 19 | | Wilshire Variable Insurance Trust (14 Portfolios) |
|
OFFICERS |
| | | | | |
| Scott Boroczi, 46 | | Treasurer | | Since 2005 | | Vice President, Wilshire Associates Incorporated (since 2005); Relationship Manager, Municipal Trustees Services, The Bank of New York Trust Company (1997 to 2005). | | N/A | | N/A |
| | | | | |
| Helen Thompson, 39 | | Chief Compliance Officer and Secretary | | Since 2004 | | Managing Director, Wilshire Associates Incorporated (since 2003); Associate Director, First Quadrant, L.P. (2001 to 2003); Chief Investment Accountant, Financial Controller, Company Secretary, Associate Director, Compliance Officer (1996 to 2003) First Quadrant Limited. | | N/A | | N/A |
(1) | Directors and Officers hold office until they resign or their successors have been elected and qualified. |
(2) | Mr. Davanzo is an interested person because of his position with the Fund’s investment adviser, Wilshire Associates Incorporated. |
(3) | Mr. Holt employs AllianceBernstein, L.P., subadviser to the Large Company Value Portfolio, to manage assets that he controls. |
The Company’s Statement of Additonal Information includes additional information about the Directors of the Company and is available, without charge, upon request, by calling 1-888-200-6796.
113
| | |
WILSHIRE MUTUAL FUNDS, INC. ADDITIONAL FUND INFORMATION - (CONTINUED) | | |
INFORMATIONON PROXY VOTING
The Securities and Exchange Commission (“SEC”) has adopted the requirement that all funds file their complete proxy voting records with the SEC on an annual basis on Form N-PX. Such filing, for the 12-month period ended June 30, must be made no later than August 31 of each year.
A description of policies and procedures that the Portfolios use to determine how to vote proxies relating to portfolio securities, along with each Portfolio’s proxy voting record relating to portfolio securities held during most recent 12-month period ended June 30 is available at no charge, upon request by calling 1-888-200-6796, by e-mailing us at www.wilfunds.com or on the SEC’s website at http://www.sec.gov.
INFORMATIONON FORM N-Q
The Company files its complete schedule of portfolio holdings with the SEC for the first and third quarters of each fiscal year on Form N-Q within sixty days after the end of period. The Company’s Form N-Qs are available on the SEC’s website at http://www.sec.gov, and may be reviewed and copied at the SEC’s Public Reference Room in Washington, DC. Information on the operation of the Public Reference Room may be obtained by calling 1-202-551-8090.
114
| | |
WILSHIRE MUTUAL FUNDS, INC. TAX INFORMATION (Unaudited) | | |
Of the distributions made by the following Portfolios, the corresponding percentage represents the amount of each distribution which will qualify for the dividends received deduction available to corporate shareholders:
| | | | | |
Portfolio | | Percentage | | | |
Large Company Growth Portfolio | | 0.00 | % | |
Large Company Value Portfolio | | 100.00 | % | |
Small Company Growth Portfolio | | 26.74 | % | |
Small Company Value Portfolio | | 48.42 | % | |
Dow Jones Wilshire 5000 Index Portfolio | | 100.00 | % | |
Pursuant to the Jobs and Growth Tax Relief Reconciliation Act of 2003, the Portfolios listed below designate the following percentages of their income dividends distributed in 2006 as qualified dividend income as defined in Section 1(h)(II) of the Internal Revenue Code.
| | | | | |
Portfolio | | Percentage | | | |
Large Company Growth Portfolio | | 0.00 | % | |
Large Company Value Portfolio | | 100.00 | % | |
Small Company Growth Portfolio | | 20.22 | % | |
Small Company Value Portfolio | | 26.69 | % | |
Dow Jones Wilshire 5000 Index Portfolio | | 100.00 | % | |
The following Portfolios designate long-term capital gain distributions pursuant to Section 852(b)(3) of the Internal Revenue Code as follows:
| | | | | |
Portfolio | | | | |
Large Company Value Portfolio | | $ | 5,833,008 | |
Small Company Growth Portfolio | | | 1,099,689 | |
Small Company Value Portfolio | | | 2,017,669 | |
115
| | |
WILSHIRE MUTUAL FUNDS, INC. BOARD APPROVAL OF ADVISORY AND SUB-ADVISORY AGREEMENTS | | |
During the six months ended December 31, 2006, the Board of Directors (the “Board”) of Wilshire Mutual Funds, Inc. (the “Company”) approved the renewal of the Company’s advisory agreement with Wilshire Associates Incorporated (“Wilshire” or the “Adviser”) for additional one year terms with respect to each of the Portfolios of the Company and Wilshire’s subadvisory agreements with the Company’s subadvisers: AllianceBernstein L.P. with respect to the Large Company Value Portfolio, Los Angeles Capital Management and Equity Research, Inc. with respect to each of the Portfolios, Goldman Sachs Asset Management, LLC with respect to the Large Company Growth Portfolio, NWQ Investment Management Company, LLC with respect to the Small Company Value Portfolio, Delaware Management Company with respect to the Large Company Growth Portfolio, Kalmar Investment Advisers with respect to the Small Company Growth Portfolio and Pzena Investment Management, LLC with respect to the Small Company Value Portfolio. In the following text, the subadvisers are referred to as “Subadvisers” and the advisory agreement with Wilshire and the subadvisory agreements between Wilshire and each Subadviser are referred to as “Advisory Agreements.”
The information in this summary outlines the Board’s considerations associated with its approval of each of the Advisory Agreements. In connection with its deliberations regarding the continuation of these relationships, the Board considered such information and factors as it believed to be relevant. As described below, the Board considered the nature, extent and quality of the services performed by Wilshire and the Subadvisers under the existing advisory and subadvisory arrangements; comparative fees and expense ratios as prepared by an independent provider (Lipper Inc.); the profits to be realized by Wilshire and the Subadvisers; the extent to which Wilshire and the Subadviser realize economies of scale as a Portfolio grows; and whether any fall-out benefits are being realized by Wilshire and the Subadvisers. In considering these matters, the Board was advised with respect to relevant legal standards by independent counsel. In addition, the Directors who are not “interested persons” of the Company as defined in the Investment Company Act of 1940 (the “Independent Directors”) discussed the renewal of the Advisory Agreements with management and in private sessions with counsel at which no representatives of Wilshire or the Subadvisers were present.
As required by the Investment Company Act of 1940, each approval was confirmed by the unanimous separate vote of the Independent Directors. In deciding to approve renewal of the Subadvisory Agreements, the Board did not identify any single factor as controlling and this summary does not describe all of the matters considered. However, the Board concluded that each of the various factors referred to below favored such approval.
Information Requested and Received
The Board, including all the Independent Directors, considered the renewal of the Subadvisory Agreements pursuant to a process that concluded at the Board’s August 15, 2006 meeting and the renewal of the Advisory Agreement with Wilshire pursuant to a process that concluded at the Board’s November 10,
116
| | |
WILSHIRE MUTUAL FUNDS, INC. BOARD APPROVAL OF ADVISORY AND SUB-ADVISORY AGREEMENTS (Continued) | | |
2006 meeting, in each case, following an extensive process. At the direction of the Independent Directors, counsel to the Company and the Independent Directors sent memoranda to the Adviser requesting information regarding the Advisory Agreements to be provided to the Directors in advance of meetings of the Contract Review Committee (which is comprised of all the Independent Directors) held on August 14, 2006 and November 9, 2006, as applicable. Based upon a review of such information, counsel sent follow-up memoranda, on behalf of the Independent Directors, requesting additional information to be considered at the August 14, 2006 meeting and November 9, 2006 meeting, respectively.
In response to the requests for information, the Directors received information from the Adviser as to each of the Portfolios describing: (i) the nature, extent and quality of services provided, (ii) the investment performance of each Portfolio as provided by Lipper Inc., (iii) the costs of services provided and estimated profits realized by the Adviser, (iv) the extent to which economies of scale are realized as a Portfolio grows, (v) whether fee levels reflect any possible economies of scale for the benefit of Portfolio shareholders, (vi) comparisons of services rendered and amounts paid to other registered investment companies as provided by Lipper Inc., and (vii) benefits realized by the Adviser from its relationship with each Portfolio. The Directors also received information from each Subadviser as to each Portfolio it managed describing: (i) the nature, extent and quality of services provided, (ii) the investment performance of the Subadviser in connection with the Portfolio, (iii) the financial condition of the Subadviser, (iv) the extent to which economies of scale are realized as a Portfolio grows, (v) whether fee levels reflect any possible economies of scale for the benefit of Portfolio shareholders, (vi) comparisons of services rendered and amounts paid to other registered investment companies and any comparable advisory clients, and (vii) benefits realized by the Subadviser from its relationship with the Portfolio. The Independent Directors also received a memorandum from counsel describing their duties in connection with contract approvals, and they were assisted in their review by independent legal counsel.
Following the receipt of all information, the Contract Review Committee met on August 14, 2006 and November 9, 2006 to discuss the information provided. Following its evaluation of all materials provided, the Contract Review Committee concluded that it was in the best interests of each Portfolio to renew each of the agreements and recommended to the Board that each Advisory Agreement be renewed. At its meetings on August 15, 2006 and November 10, 2006, the Board considered the recommendation of the Contract Review Committee along with the other factors that the Board deemed relevant. The Board also considered a report from the Investment Committee (which is comprised solely of Independent Directors) which, met on November 9, 2006 to review the data Lipper Inc. had prepared on performance, fees and expenses to assist the Board in its consideration of the Advisory Agreement with Wilshire.
Nature, Extent and Quality of Services—Wilshire
As to the Advisory Agreement with Wilshire, with respect to the nature, extent and quality of services
117
| | |
WILSHIRE MUTUAL FUNDS, INC. BOARD APPROVAL OF ADVISORY AND SUB-ADVISORY AGREEMENTS (CONTINUED) | | |
provided by the Adviser, the Board reviewed the functions performed by the Adviser. The Board considered the experience and skills of the senior management leading fund operations, the experience and skills of the personnel performing the functions under the Advisory Agreement and the resources made available to such personnel. The Board also considered the compliance programs established by the Adviser and the level of compliance maintained for the Portfolios. The Board reviewed the processes used by the Adviser to select, monitor and replace subadvisers. The Board concluded that the Adviser was successful in negotiating favorable subadvisory agreements on behalf of the Portfolios. The Board concluded that the Adviser had a robust system in place for selecting, monitoring and terminating subadvisers. The Board also reviewed the Adviser’s financial condition, and considered the financial support provided by the Adviser to the Small Company Growth and Small Company Value Portfolios through voluntary advisory fee waivers. Based upon all relevant factors, the Board concluded that the nature, quality and extent of the services provided by the Adviser to each Portfolio are satisfactory.
The Board reviewed information on the performance of each Portfolio for one, three, five, and where applicable, ten year periods, along with performance information of a relevant benchmark, a peer group of funds from Lipper’s database and a peer universe of funds from Lipper’s database. For the Small Company Value Portfolio, the Board determined that performance was satisfactory, noting that the Portfolio’s performance was competitive as compared to its Lipper peer group over longer term periods, and that its underperformance to its benchmark was modest over longer term periods. For the Large Company Growth Portfolio, the Board determined that performance was satisfactory, noting that the Portfolio’s performance was competitive as compared to its Lipper peer universe and to the Lipper peer group over longer term periods and that its underperformance to its benchmark was modest over longer term periods. For the Large Company Value Portfolio, the Board determined that performance was satisfactory, noting that the Portfolio’s performance was competitive in comparison to its Lipper peer group and peer universe, and that over longer term periods its underperformance to its benchmark was modest. For the Small Company Growth Portfolio, the Board determined that performance was satisfactory, noting that over longer term periods the Portfolio’s performance was competitive with its Lipper peer group and peer universe, and that its underperformance to its benchmark was modest over longer term periods. The Board determined that the underperformance for the Dow Jones Wilshire 5000 Index Fund as compared to its benchmark was a result of its small size and expenses and, therefore concluded that investment performance was satisfactory.
Advisory Fees
The Board reviewed each Portfolio’s advisory fee and total expense ratio and reviewed information comparing the advisory fee and total expense ratio to those of a peer group of funds. The Board determined that the advisory fee and expense ratio for each Portfolio were within a competitive range. Although the Board noted that the Large Company Value Portfolio has a relatively high contractual advisory fee in comparison to its Lipper peer group and peer universe, the Board recognized that the actual management fees charged to the Portfolios are primarily driven by the subadvisory fees paid, which were competitively
118
| | |
WILSHIRE MUTUAL FUNDS, INC. BOARD APPROVAL OF ADVISORY AND SUB-ADVISORY AGREEMENTS (CONTINUED) | | |
negotiated. The Board also noted that higher management fees provide the Adviser with greater flexibility when selecting subadvisers, which is of significant value given the manager of managers format of the Portfolios. The Board had also been advised by the Adviser that over longer term periods there is generally a positive correlation between higher management fees and superior investment performance. In addition, the Board noted that pursuant to the Company’s current arrangement with the Adviser, the Adviser voluntarily limits the total expenses for the Small Company Growth and Small Company Value Portfolios. As to total expenses, the Board noted that total expenses are influenced by the small size of the complex. The Board received information regarding fees charged by the Adviser to other registered investment companies advised by the Adviser and similar to certain Portfolios and determined such fees were comparable to those of the applicable Portfolios. The Board concluded that the advisory fee for each Portfolio was reasonable and appropriate in amount.
Profitability to Wilshire and Economies of Scale
With respect to the profitability of the Advisory Agreement, the Board primarily considered the fee structure of the Advisory Agreement, including the costs of the services provided and the profits realized by the Adviser from its relationship with the Portfolios. The Board concluded that the profits realized by the Adviser were reasonable in comparison with the costs of providing investment advisory services to the Portfolios. In addition, the Board considered the extent to which economies of scale are realized as the Portfolios grow and whether fee levels reasonably reflect economies of scale for the benefit of shareholders. The Board reviewed each Portfolio’s asset size, each Portfolio’s expense ratio, the voluntary advisory fee waivers in place for the Small Company Growth and Small Company Value Portfolios and whether the investment process produced economies of scale. The Board concluded that each Portfolio’s advisory fee reasonably reflected appropriate recognition of any economies of scale.
Fall-Out Benefits—Wilshire
The Board considered the nature and amount of any benefits derived by the Adviser from its relationship with the Portfolios. The Board determined that the advisory fees were reasonable in light of these fallout benefits.
Nature, Extent and Quality of Services—Sub-Advisers
As to each Subadvisory Agreement, the Board considered the nature, extent and quality of services provided under each Subadvisory Agreement. The Board considered the reputation, qualifications and background of the Subadviser, investment approach of the Subadviser, the experience and skills of investment personnel responsible for the day-to-day management of each Portfolio, and the resources made available to such personnel. The Board also considered the Subadviser’s compliance with investment policies
119
| | |
WILSHIRE MUTUAL FUNDS, INC. BOARD APPROVAL OF ADVISORY AND SUB-ADVISORY AGREEMENTS (Continued) | | |
and general legal compliance. In addition, the Board considered the analysis provided under the Adviser’s oversight program, which concluded that each Subadviser was providing reasonable services and recommended that each Subadvisory Agreement for each Portfolio be continued.
Based upon all relevant factors, the Board concluded that the investment performance of Los Angeles Capital Management with respect to the Large Company Growth and Large Company Value Portfolios, Goldman Sachs and Delaware with respect to the Large Company Growth Portfolio and NWQ with respect to the Small Company Value Portfolio met or exceeded acceptable levels of investment performance and, therefore, was satisfactory. The Board concluded that the investment performance of AllianceBernstein with respect to the Large Company Value Portfolio was in a competitive range in comparison to its benchmark. The Board determined that Los Angeles Capital Management’s underperformance with respect to the Dow Jones Wilshire 5000 Index Fund was a result of its small size and expenses and, therefore concluded that investment performance was satisfactory. The Board also determined that, although Los Angeles Capital Management had underperformed with respect to the Small Company Growth and Small Company Value Portfolios over longer term periods, current outperformance resulted in a conclusion that investment performance was satisfactory. The Board determined that Pzena’s investment performance with respect to the Large Company Value Portfolio was satisfactory, based upon outperformance over longer term periods, although Pzena had underperformed over the short term due to its underweight to the energy sector. Based upon Wilshire’s recommendation that Kalmar’s Subadvisory Agreement be renewed while ongoing performance was being reviewed, the Board determined to recommend continuation of the Subadvisory Agreement with Kalmar given Kalmar’s recent tenure as a subadviser of the Small Company Growth Portfolio.
Subadvisory Fees
The Board considered each Portfolio’s subadvisory fees. The Board evaluated the competitiveness of the subadvisory fees based upon data supplied by each Subadviser about the fees charged to other clients. The Board also considered that the subadvisory fee rates were negotiated at arm’s length between the Adviser and each Subadviser, that the Adviser compensates the Subadviser from its fees and that the aggregate advisory fee was deemed reasonable by the Board.
For the Subadvisers that reported fees for “Other Clients” with comparable investment policies and services, the Board noted that most Subadvisers did not charge higher fees to the Adviser for the Portfolios than was charged to their Other Clients. For the Subadvisers where the fees charged to the Adviser were higher than that charged to Other Clients, the Board determined that the fees charged to the Adviser were generally competitive.
Based upon all of the above, the Board determined that the subadvisory fees for each Portfolio were reasonable.
120
| | |
WILSHIRE MUTUAL FUNDS, INC. BOARD APPROVALOF ADVISORYAND SUB-ADVISORY AGREEMENTS (Continued) | | |
Profitability to the Subadvisers
The Board noted that the Adviser compensates each Subadviser from its own advisory fees and that the fees were negotiated at arm’s length between the Adviser and each Subadviser. In addition, the Board noted that the revenues to the various Subadvisers were limited due to the size of the Portfolios. Accordingly, the Board concluded that they need not review estimated levels of profits to the Subadvisers in order to conclude, as they did, that profitability to the Subadvisers was not unreasonable.
Economies of Scale—Subadvisers
The Board considered whether there are economies of scale with respect to the subadvisory services provided to each Portfolio and whether the subadvisory fees reflect such economies of scale through breakpoints in fees. The Board also considered whether the effective subadvisory fee rate for each Portfolio under the Subadvisory Agreement is reasonable in relation to the asset size of such Portfolio. The Board concluded that the fee schedule for each Portfolio reflects an appropriate recognition of any economies of scale.
Fall-Out Benefits – Subadvisers
The Board also considered the character and amount of other incidental benefits received by each Subadviser. The Board considered each Subadviser’s soft dollar practices, where applicable. The Board concluded that, taking into account the benefits arising from these practices, the fees charged under each Subadvisory Agreement were reasonable.
Conclusion
Based upon all of the information considered and the conclusions reached, the Board determined that the terms of each Advisory Agreement continue to be fair and reasonable and that the continuation of each Advisory Agreement is in the best interests of each Portfolio.
121
Wilshire Associates Incorporated
1299 Ocean Avenue
Santa Monica, CA 90401
1-888-200-6796
www.wilfunds.com
| | (a) | The registrant, as of the end of the period covered by this report, has adopted a code of ethics that applies to the registrant’s principal executive officer, principal financial officer, principal accounting officer or controller, or persons performing similar functions, regardless of whether these individuals are employed by the registrant or a third party. |
| | (c) | There have been no amendments, during the period covered by this report, to a provision of the code of ethics that applies to the registrant’s principal executive officer, principal financial officer, principal accounting officer or controller, or persons performing similar functions, regardless of whether these individuals are employed by the registrant or a third party, and that relates to any element of the code of ethics description. |
| | (d) | The registrant has not granted any waivers, including an implicit waiver, from a provision of the code of ethics that applies to the registrant’s principal executive officer, principal financial officer, principal accounting officer or controller, or persons performing similar functions, regardless of whether these individuals are employed by the registrant or a third party, that relates to one or more of the items set forth in paragraph (b) of this item’s instructions. |
| Item 3. | Audit Committee Financial Expert. |
The Registrant’s Board of Directors has determined that the Registrant has at least one “audit committee financial expert” (as defined by Item 3 of Form N-CSR) serving on its audit committee. Mr. Roger A. Formisano, the Registrant’s audit committee financial expert, is “independent,” for purposes of Item 3 of Form N-CSR.
An “audit committee financial expert” is not an “expert” for any purpose, including for purposes of Section 11 of the Securities Act of 1933, as a result of being designated as an “audit committee financial expert.” Further, the designation of a person as an “audit committee financial expert” does not mean that the person has any greater duties, obligations, or liability than those imposed on the person without the “audit committee financial expert” designation. Similarly, the designation of a person as an “audit committee financial expert” does not affect the duties, obligations, or liability of any other member of the audit committee or Board of Directors.
| Item 4. | Principal Accountant Fees and Services. |
Audit Fees
| | (a) | The aggregate fees billed for each of the last two fiscal years for professional services rendered by the principal accountant for the audit of the registrant’s annual financial statements or services |
| | that are normally provided by the accountant in connection with statutory and regulatory filings or engagements for those fiscal years are $124,650 for 2006 and $117,600 for 2005. |
Audit-Related Fees
| | (b) | The aggregate fees billed in each of the last two fiscal years for assurance and related services by the principal accountant that are reasonably related to the performance of the audit of the registrant’s financial statements and are not reported under paragraph (a) of this Item are $0 for 2006 and $0 for 2005. |
Tax Fees
| | (c) | The aggregate fees billed in each of the last two fiscal years for professional services rendered by the principal accountant for tax compliance, tax advice, tax planning and tax training are $11,915 for 2006 and $11,240 for 2005. Such services consisted of quarterly diversification review, annual distribution review and tax return review. |
All Other Fees
| | (d) | The aggregate fees billed in each of the last two fiscal years for products and services provided by the principal accountant, other than the services reported in paragraphs (a) through (c) of this Item are $0 for 2006 and $0 for 2005. |
| | (e)(1) | Audit Committee Pre-Approval Policies and Procedures. |
Pursuant to Registrant’s Audit Committee Charter (the “Charter”), the Audit Committee is responsible for pre-approving any engagement of the principal accountant to provide non-prohibited services to the Registrant, including the fees and other compensation to be paid to the principal accountant, to the extent required by Rule 2-01(c)(7) of Regulation S-X. The Chairman of the Audit Committee may grant pre-approval for engagements of less than $5,000. All such delegated pre-approvals will be presented to the Audit Committee no later than the next Audit Committee meeting.
Pursuant to the Charter, the Audit Committee is also responsible for pre-approving any engagement of the principal accountant, including the fees and other compensation to be paid to the principal accountant, to provide non-audit services to the Registrant’s investment adviser (or any entity controlling, controlled by, or under common control with the adviser that provides ongoing services to the Registrant), if the engagement relates directly to the operations and financial reporting of the Registrant, to the extent required by Rule 2-01(c)(7) of Regulation S-X. The Chairman of the Audit Committee may grant pre-approval for engagements of less than $5,000. All such delegated pre-approvals will be presented to the Audit Committee no later than the next Audit Committee meeting.
| | (e)(2) | The percentage of services described in each of paragraphs (b) through (d) of this Item that were approved by the audit committee pursuant to paragraph (c)(7)(i)(C) of Rule 2-01 of Regulation S-X are as follows: |
(b) Not applicable
(c) 100%
(d) Not applicable.
| | (f) | The percentage of hours expended on the principal accountant’s engagement to audit the registrant’s financial statements for the most recent fiscal year that were attributed to work performed by persons other than the principal accountant’s full-time, permanent employees was 0%. |
| | (g) | The aggregate non-audit fees billed by the registrant’s accountant for services rendered to the registrant, and rendered to the registrant’s investment adviser (not including any sub-adviser whose role is primarily portfolio management and is subcontracted with or overseen by another investment adviser), and any entity controlling, controlled by, or under common control with the adviser that provides ongoing services to the registrant for each of the last two fiscal years of the registrant was $209,120 for 2006 and $145,470 for 2005. |
| | (h) | The registrant’s audit committee of the board of directors has considered whether the provision of non-audit services that were rendered to the registrant’s investment adviser (not including any sub-adviser whose role is primarily portfolio management and is subcontracted with or overseen by another investment adviser), and any entity controlling, controlled by, or under common control with the investment adviser that provides ongoing services to the registrant that were not pre-approved pursuant to paragraph (c)(7)(ii) of Rule 2-01 of Regulation S-X is compatible with maintaining the principal accountant’s independence. |
| Item 5. | Audit Committee of Listed registrants. |
Not applicable.
| Item 6. | Schedule of Investments. |
Schedule of Investments in securities of unaffiliated issuers as of the close of the reporting period is included as part of the report to shareholders filed under Item 1 of this form.
| Item 7. | Disclosure of Proxy Voting Policies and Procedures for Closed-End Management Investment Companies. |
Not applicable.
| Item 8. | Portfolio Managers of Closed-End Management Investment Companies. |
Not applicable.
| Item 9. | Purchases of Equity Securities by Closed-End Management Investment Company and Affiliated Purchasers. |
Not applicable.
| Item 10. | Submission of Matters to a Vote of Security Holders. |
There have been no changes to the procedures by which shareholders may recommend nominees to the Registrant’s Board of Directors since the registrant last disclosed such procedures in the definitive proxy statement filed with the SEC on January 10, 2006.
| Item 11. | Controls and Procedures. |
| | (a) | The registrant’s principal executive and principal financial officers, or persons performing similar functions, have concluded that the registrant’s disclosure controls and procedures (as defined in Rule 30a-3(c) under the Investment Company Act of 1940, as amended (the “1940 Act”) (17 CFR 270.30a-3(c))) are effective, as of a date within 90 days of the filing date of the report that includes the disclosure required by this paragraph, based on their evaluation of these controls and procedures required by Rule 30a-3(b) under the 1940 Act (17 CFR 270.30a-3(b)) and Rules 13a-15(b) or 15d-15(b) under the Securities Exchange Act of 1934, as amended (17 CFR 240.13a-15(b) or 240.15d-15(b)). |
| | (b) | There were no changes in the registrant’s internal control over financial reporting (as defined in Rule 30a-3(d) under the 1940 Act (17 CFR 270.30a-3(d)) that occurred during the registrant’s second fiscal quarter of the period covered by this report that has materially affected, or is reasonably likely to materially affect, the registrant’s internal control over financial reporting. |
| | (a)(1) | Code of ethics, or any amendment thereto, that is the subject of disclosure required by Item 2 is incorporated by reference to the registrant’s Form N-CSR as filed with the SEC on March 10, 2005. |
| | (a)(2) | Certifications pursuant to Rule 30a-2(a) under the 1940 Act and Section 302 of the Sarbanes-Oxley Act of 2002 are attached hereto. |
| | (b) | Certifications pursuant to Rule 30a-2(b) under the 1940 Act and Section 906 of the Sarbanes-Oxley Act of 2002 are attached hereto. |
SIGNATURES
Pursuant to the requirements of the Securities Exchange Act of 1934 and the Investment Company Act of 1940, the registrant has duly caused this report to be signed on its behalf by the undersigned, thereunto duly authorized.
| | |
| (Registrant) Wilshire Mutual Funds, Inc. |
| |
| By (Signature and Title)* | | /s/ Lawrence E. Davanzo |
| | Lawrence E. Davanzo, President (principal executive officer) |
Date March 5, 2007
Pursuant to the requirements of the Securities Exchange Act of 1934 and the Investment Company Act of 1940, this report has been signed below by the following persons on behalf of the registrant and in the capacities and on the dates indicated.
| | |
| |
| By (Signature and Title)* | | /s/ Lawrence E. Davanzo |
| | Lawrence E. Davanzo, President (principal executive officer) |
| Date March 5, 2007 |
| |
| By (Signature and Title)* | | /s/ Scott Boroczi |
| | Scott Boroczi, Treasurer (principal financial officer) |
Date March 5, 2007
| * | Print the name and title of each signing officer under his or her signature. |