UNITED STATES
SECURITIES AND EXCHANGE COMMISSION
Washington, D.C. 20549
FORM 6-K
REPORT OF FOREIGN PRIVATE ISSUER
PURSUANT TO RULE 13a-16 OR 15d-16 UNDER THE
SECURITIES EXCHANGE ACT OF 1934
Long Form of Press Release
Commission File Number 1-11414
BANCO LATINOAMERICANO DE COMERCIO EXTERIOR, S.A.
(Exact name of Registrant as specified in its Charter)
FOREIGN TRADE BANK OF LATIN AMERICA, INC.
(Translation of Registrant’s name into English)
Business Park Torre V, Ave. La Rotonda, Costa del Este
P.O. Box 0819-08730
Panama City, Republic of Panama
(Address of Registrant’s Principal Executive Offices)
Indicate by check mark whether the registrant files or will file annual reports under cover of Form 20-F or Form 40-F.
Form 20-F x Form 40-F ¨
Indicate by check mark if the registrant is submitting the Form 6-K in paper as permitted by Regulation S-T Rule 101(b)(1):
Yes ¨ No x
Indicate by check mark if the registrant is submitting the Form 6-K in paper as permitted by Regulation S-T Rule 101(b)(7):
Yes ¨ No x
SIGNATURES
Pursuant to the requirements of the Securities Exchange Act of 1934, the registrant has duly caused this report to be signed on its behalf by the undersigned, thereunto duly authorized.
Date: February 15, 2021
| FOREIGN TRADE BANK OF LATIN AMERICA, INC. | |||
| (Registrant) | |||
| By: | /s/ Ana Graciela de Méndez | ||
| Name: Ana Graciela de Méndez | |||
| Title: CFO | |||

BLADEX ANNOUNCES 9% FOURTH QUARTER COMMERCIAL PORTFOLIO GROWTH
AND QUARTERLY PROFIT OF $15.7 MILLION, OR $0.40 PER SHARE
PANAMA CITY, REPUBLIC OF PANAMA, February 12, 2021
Banco Latinoamericano de Comercio Exterior, S.A. (NYSE: BLX, “Bladex”, or “the Bank”), a Panama-based multinational bank originally established by the central banks of 23 Latin-American and Caribbean countries to promote foreign trade and economic integration in the region, today announced its results for the Fourth Quarter (“4Q20”) and Full-Year (“FY20”) ended December 31, 2020.
The consolidated financial information in this document has been prepared in accordance with International Financial Reporting Standards (“IFRS”) as issued by the International Accounting Standards Board (“IASB”).
FINANCIAL SNAPSHOT |
| (US$ million, except percentages and per share amounts) | 2020 | 2019 | 4Q20 | 3Q20 | 4Q19 | |||||||||||||||
| Key Income Statement Highlights | ||||||||||||||||||||
| Net Interest Income ("NII") | $ | 92.5 | $ | 109.5 | $ | 22.3 | $ | 22.6 | $ | 26.9 | ||||||||||
| Fees and commissions, net | $ | 10.4 | $ | 15.6 | $ | 2.8 | $ | 2.6 | $ | 5.4 | ||||||||||
| Loss on financial instruments, net | $ | (4.8 | ) | $ | (1.4 | ) | $ | (0.1 | ) | $ | (0.4 | ) | $ | (2.0 | ) | |||||
| Total revenues | $ | 99.2 | $ | 126.7 | $ | 25.3 | $ | 25.2 | $ | 31.4 | ||||||||||
| Reversal (provision) for credit losses | $ | 1.5 | $ | (0.4 | ) | $ | 0.3 | $ | (1.5 | ) | $ | 1.9 | ||||||||
| Operating expenses | $ | (37.3 | ) | $ | (40.7 | ) | $ | (10.2 | ) | $ | (8.3 | ) | $ | (11.3 | ) | |||||
| Profit for the period | $ | 63.6 | $ | 86.1 | $ | 15.7 | $ | 15.4 | $ | 22.1 | ||||||||||
| Profitability Ratios | ||||||||||||||||||||
| Earnings per Share ("EPS") (1) | $ | 1.60 | $ | 2.17 | $ | 0.40 | $ | 0.39 | $ | 0.56 | ||||||||||
| Return on Average Equity (“ROAE”) (2) | 6.2 | % | 8.6 | % | 6.1 | % | 6.0 | % | 8.7 | % | ||||||||||
| Return on Average Assets (“ROAA”) | 1.0 | % | 1.4 | % | 1.0 | % | 1.0 | % | 1.3 | % | ||||||||||
| Net Interest Margin ("NIM") (3) | 1.41 | % | 1.74 | % | 1.37 | % | 1.42 | % | 1.65 | % | ||||||||||
| Net Interest Spread ("NIS") (4) | 1.13 | % | 1.19 | % | 1.17 | % | 1.19 | % | 1.18 | % | ||||||||||
| Efficiency Ratio (5) | 37.6 | % | 32.1 | % | 40.2 | % | 33.1 | % | 35.9 | % | ||||||||||
| Assets, Capital, Liquidity & Credit Quality | ||||||||||||||||||||
| Credit Portfolio (6) | $ | 5,946 | $ | 6,582 | $ | 5,946 | $ | 5,320 | $ | 6,582 | ||||||||||
| Commercial Portfolio (7) | $ | 5,551 | $ | 6,502 | $ | 5,551 | $ | 5,087 | $ | 6,502 | ||||||||||
| Investment Portfolio | $ | 395 | $ | 80 | $ | 395 | $ | 234 | $ | 80 | ||||||||||
| Total assets | $ | 6,289 | $ | 7,250 | $ | 6,289 | $ | 6,311 | $ | 7,250 | ||||||||||
| Total equity | $ | 1,038 | $ | 1,016 | $ | 1,038 | $ | 1,026 | $ | 1,016 | ||||||||||
| Market capitalization (8) | $ | 628 | $ | 847 | $ | 628 | $ | 482 | $ | 847 | ||||||||||
| Tier 1 Basel III Capital Ratio (9) | 26.0 | % | 19.8 | % | 26.0 | % | 26.5 | % | 19.8 | % | ||||||||||
| Total assets / Total equity (times) | 6.1 | 7.1 | 6.1 | 6.2 | 7.1 | |||||||||||||||
| Liquid Assets / Total Assets (10) | 16.7 | % | 16.0 | % | 16.7 | % | 23.2 | % | 16.0 | % | ||||||||||
| Credit-impaired loans to Loan Portfolio (11) | 0.22 | % | 1.05 | % | 0.22 | % | 0.00 | % | 1.05 | % | ||||||||||
| Total allowance for losses to Credit Portfolio (12) | 0.75 | % | 1.56 | % | 0.75 | % | 0.84 | % | 1.56 | % | ||||||||||
| Total allowance for losses to credit-impaired loans (times) (12) | 4.2 | 1.7 | 4.2 | n.m. | 1.7 |
"n.m." means not meaningful.
BUSINESS HIGHLIGHTS |
| · | Bladex’s Commercial Portfolio growth accelerated during 4Q20, up 9% QoQ to reach $5.6 billion at year-end, driven by higher loan origination (+18% QoQ), with a continued emphasis on defensive sectors and under stricter credit underwriting standards. In addition, considering the 69% QoQ increase in the Investment Portfolio, mostly focused on highly liquid corporate debt securities rated above ‘A-‘, the Bank’s Credit Portfolio totaled $5.9 billion at the end of the 4Q20 (+12% QoQ). |
| · | During 4Q20, Bladex sustained preceding quarterly trend in collecting virtually all loan maturities (99% in 4Q20 and since the onset of Covid-19), evidencing the high quality of the Bank’s borrower base and short-term nature of its business. |
| · | As of December 31, 2020, Bladex’s Commercial Portfolio remained well-diversified and focused on high quality exposures, with 59% in investment grade countries, 54% with financial institutions and 16% with sovereign and state-owned corporations. In addition, exposure to higher risk sectors has been downsized since the onset of Covid-19, such as sugar (-43%) and airlines (-67%), now representing 1% and 0.9% of the total portfolio, respectively. |
| · | Lower Loan Portfolio balances and the collection of loans in higher risk sectors and countries resulted in a $1.5 million net reversal of credit reserves for FY20. As of December 31, 2020, asset quality remained sound with $11 million recorded as a credit-impaired loan (“NPL”), representing 0.22% of the total Loan Portfolio, compared to zero NPLs in the previous quarter and $62 million or 1.05% of the total Loan Portfolio a year ago. |
| · | Bladex maintained a sound and diversified funding structure in 4Q20, primarily supported by the continued growth of its deposit base (+3 QoQ; +9% YoY), coupled with ample and constant access to interbank and debt capital markets. In turn, the Bank reduced its liquidity position, which stood at $1.0 billion (17% of Total Assets) at year-end. |
| · | Bladex’s Profit for 4Q20 was $15.7 million (+2% QoQ), totaling $63.6 million for FY20 (-26% YoY), denoting sustainable results as Bladex’s unique business model represents a key advantage in a year deeply impacted by Covid-19 pandemic and prevailing market uncertainty. |

| · | Net Interest Income (“NII”) for 4Q20 was nearly stable QoQ (-1%), impacted by lower ‘NIM’ on lower rates, offseting the effects of higher average lending volumes. FY20 NII & NIM were below pre-Covid levels (-16% YoY and -33 bps YoY, respectively), as a result of the Bank’s defensive approach to favor liquidity over loan growth during most part of the year, coupled with the impact of decreased market rates. |
| · | Fees and commissions income totaled $2.8 million for 4Q20, up 7% QoQ, driven by higher fees from the letters of credit business. FY20 fees and commissions were 33% lower YoY mostly on the absence of mandated structured transactions in a year impacted by market uncertainty. |
| · | FY20 Operating Expenses decreased 8% YoY, mainly on lower variable compensation and other savings in the current context. FY20 Efficiency Ratio stood at 37.6%, on lower total revenues on the account of the Bank’s implemented measures to mitigate the risks associated to Covid-19 pandemic. 4Q20 Efficiency Ratio was 40% on seasonal higher operating expenses while revenues remained stable QoQ. |
CEO’s Comments |
Mr. Jorge Salas, Bladex’s Chief Executive Officer said: “2020 proved to be a very challenging year for Bladex’s markets, as Latin American economic growth was severely impacted from high uncertainty and volatility derived from the deep effects of the Covid-19 pandemic, evidenced by the estimates of 7.4% GDP regional contraction. Notwithstanding, Bladex’s unique business model – characterized by its short-term trade nature and high-quality borrower base – proved to be a fundamental and differentiating advantage throughout the year, allowing us to swiftly recompose the risk in our portfolio, while working closely and attending our clients’ needs under tighter credit underwriting standards, as we also strengthen our liquidity levels, supported by broad access to debt capital markets and the continued support of deposits from our Class A shareholders.”
Mr. Salas added: “During the fourth quarter, we continued the preceding quarterly trend of higher disbursements, resulting in a Commercial Portfolio growth of 13% compared to the lowest level at the end of the first half of the year, complemented by the increase of our credit investments with good quality LatAm bond instruments and by the creation of a highly liquid corporate debt securities portfolio, allowing us to gradually reduce the cash balances while still preserving a solid liquidity level. Bladex’s solid financial position remains, despite all the challenges faced throughout a very complex economic year, and is underlined by the Bank’s ability to deliver sustainable and quality results, with a healthier and well-diversified asset composition, and a stronger funding structure with increased tenors and diversification.”
Mr. Salas concluded: “We remain prudently cautious in the face of the uncertainty that still lies ahead for this year 2021. I am extremely proud of and thankful to all my colleagues at Bladex, and of the way they have come together to navigate the storm so far, quickly adapting to the unprecedented circumstances, working from home and keeping safe, while remaining strongly committed and successfully serving our clients, standing by them during these trying times. We will continue to promote foreign trade and economic integration in our Region, committed to the best long-term interest of our shareholders.”
RESULTS BY BUSINESS SEGMENT
The Bank’s activities are managed and executed through two business segments, Commercial and Treasury. Information related to each reportable segment is set out below. Business segment results are based on the Bank’s managerial accounting process, which assigns assets, liabilities, revenue and expense items to each business segment on a systemic basis.
COMMERCIAL BUSINESS SEGMENT
The Commercial Business Segment encompasses the Bank’s core business of financial intermediation and fee generation activities developed to cater to corporations, financial institutions and investors in Latin America. These activities include the origination of bilateral short-term and medium- term loans, structured and syndicated credits, loan commitments, and financial guarantee contracts such as issued and confirmed letters of credit, stand-by letters of credit, guarantees covering commercial risk, and other assets consisting of customers’ liabilities under acceptances.
Profits from the Commercial Business Segment include (i) net interest income from loans; (ii) fees and commissions from the issuance, confirmation and negotiation of letters of credit, guarantees and loan commitments, as well as through loan structuring and syndication activities; (iii) gain on sale of loans generated through loan intermediation activities, such as sales and distribution in the primary market; (iv) gain (loss) on sale of financial instruments measured at FVTPL; (v) reversal (provision) for credit losses, (vi) reversal (impairment) on non-financial assets; and (vii) direct and allocated operating expenses.
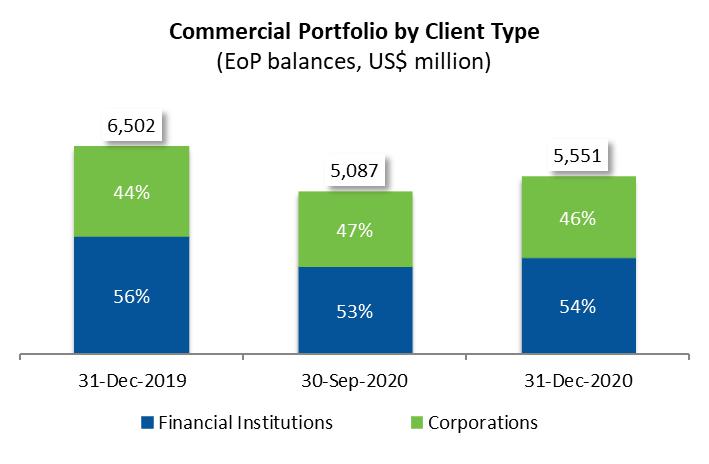 |  |
Bladex’s Commercial Portfolio reached $5.6 billion at the end of 4Q20, a 9% QoQ increase compared to $5.1 billion a quarter ago, and a 15% YoY decrease compared to pre-Covid levels from a year ago. The 9% QoQ increase was driven by higher loan origination (+18% QoQ), with a continued emphasis on defensive sectors and under stricter credit underwriting standards. Meanwhile, during 4Q20 the Bank sustained preceding quarterly trend in collecting virtually all loan maturities (99% during the 4Q20 and since the onset of Covid-19), evidencing the high quality of the Bank’s borrower base and short-term nature of its business. On an average basis, Commercial Portfolio balances reached $5.2 billion for the 4Q20 (+5% QoQ; -16% YoY) and $5.4 billion for FY20 (-11% YoY), also evidencing the growth during the quarter, but still trailing pre-Covid levels on the Bank’s defensive approach to favor liquidity over loan growth during most part of the year.
As of December 31, 2020, 75% of the Commercial Portfolio was scheduled to mature within a year, up 2 pp compared to 73% from a quarter and year ago. Trade finance transactions represented 57% of the short-term origination, also up 2 pp compared 55% a quarter ago and up 4 pp compared to 53% a year ago.
3
The following graphs illustrate the geographic distribution of the Bank’s Commercial Portfolio, highlighting the portfolio´s risk diversification by country and across industry segments:

As of December 31, 2020, 59% of the portfolio remained geographically distributed in investment grade countries, unchanged from the previous quarter and up 5 pp from a year ago, as the Bank weighted during the year its portfolio towards lower-risk countries, taking advantage of good risk/return opportunities. On a country-risk basis, Brazil represented the largest country-risk exposure at 18% of the total Commercial Portfolio, of which 91% were with financial institutions. Other relevant country-risk exposures were to investment grade countries such as Colombia at 14%, Mexico at 11%, Chile at 10%, and top-rated countries outside of Latin America (which relates to transactions carried out in Latin America) at 9% of the total portfolio. The Bank also continued adjusting its exposure towards lower-risk countries, evidenced by a $184 million, or 135% increase in Peru, now representing 6% of total Commercial Portfolio, while continuing to decrease exposure in Argentina, down 10% QoQ now representing 2% of the total Commercial Portfolio.
The Commercial Portfolio by industries remained well-diversified and focused on high quality borrowers, as exposure to the Bank’s traditional client base of financial institutions increased $308 million QoQ, or 12%, now representing 54% of the total Commercial Portfolio, up 1 pp QoQ, while exposure to sovereign and state-owned corporations increased 2 pp QoQ to reach 16% of the total portfolio at the end of 4Q20, and the remainder remains with top tier corporates throughout the Region. Across corporate sectors, most industries represented 5% or less of the total Commercial Portfolio, except for certain sectors that the Bank considers as defensive under the current context, such as Oil & Gas (Downstream) at 7%, and Electric Power and Food and Beverage, each at 6% of the Commercial Portfolio at the end of 4Q20. In addition, the Bank maintained minimal exposure to higher risk sectors, such as the airline and sugar industries, which together have decreased by $156 million or 56% since March 31, 2020, now representing 0.9% and 1% of the total portfolio at the end of 4Q20.
4
Refer to Exhibit IX for additional information related to the Bank’s Commercial Portfolio distribution by country, and Exhibit XI for the Bank’s distribution of loan disbursements by country.
| (US$ million) | 2020 | 2019 | YoY (%) | 4Q20 | 3Q20 | 4Q19 | QoQ (%) | YoY (%) | ||||||||||||||||||||
| Commercial Business Segment: | ||||||||||||||||||||||||||||
| Net interest income | $ | 87.9 | $ | 108.4 | -19 | % | $ | 21.0 | $ | 21.2 | $ | 26.1 | -1 | % | -19 | % | ||||||||||||
| Other income | 8.6 | 15.6 | -45 | % | 3.1 | 2.9 | 6.3 | 6 | % | -51 | % | |||||||||||||||||
| Total revenues | 96.5 | 124.0 | -22 | % | 24.1 | 24.1 | 32.4 | 0 | % | -25 | % | |||||||||||||||||
| Reversal (provision) for credit losses | 1.9 | (0.7 | ) | 354 | % | 0.5 | (1.4 | ) | 1.9 | 137 | % | -72 | % | |||||||||||||||
| Reversal on non-financial assets | 0.3 | 0.5 | -41 | % | 0.3 | 0.1 | 0.0 | 111 | % | n.m. | ||||||||||||||||||
| Operating expenses | (28.0 | ) | (31.2 | ) | 10 | % | (7.9 | ) | (6.5 | ) | (8.7 | ) | -22 | % | 9 | % | ||||||||||||
| Profit for the segment | $ | 70.7 | $ | 92.5 | -24 | % | $ | 17.1 | $ | 16.3 | $ | 25.6 | 4 | % | -33 | % | ||||||||||||
| "n.m." means not meaningful. |
The Commercial Business Segment’s Profit was $17.1 million for 4Q20 (+4% QoQ; -33% YoY) and $70.7 million for FY20 (-24% YoY). The QoQ 4% increase was mainly attributable to a $0.5 million reversal for credit losses versus a $1.4 million provision for credit losses recorded in the previous quarter, while total revenues remained stable QoQ. The YoY Profit decrease was mainly due to lower core income generation from interest and commission income, as total revenues decreased 25% YoY for 4Q20 and 22% YoY for FY20, impacted by the Bank’s defensive approach to favor liquidity over loan growth during most part of the year, coupled with the impact of decreased market rates, and the absence of mandated structured transactions in 2020 given the market uncertainty.
TREASURY BUSINESS SEGMENT
The Treasury Business Segment focuses on managing the Bank’s investment portfolio and the overall structure of its assets and liabilities to achieve more efficient funding and liquidity positions for the Bank, mitigating the traditional financial risks associated with the balance sheet, such as interest rate, liquidity, price and currency risks. Interest-earning assets managed by the Treasury Business Segment include liquidity positions in cash and cash equivalents, as well as highly liquid corporate debt securities rated above ‘A-‘, and financial instruments related to the investment management activities, consisting of securities at fair value through other comprehensive income (“FVOCI”) and securities at amortized cost (the “Investment Portfolio”). The Treasury Business Segment also manages the Bank’s interest-bearing liabilities, which constitute its funding sources, mainly deposits, short- and long-term borrowings and debt.
Profits from the Treasury Business Segment include net interest income derived from the above-mentioned treasury assets and liabilities, and related net other income (net results from derivative financial instruments and foreign currency exchange, gain (loss) per financial instruments at fair value through profit or loss (“FVTPL”), gain (loss) on sale of securities at FVOCI, and other income), recovery or impairment loss on financial instruments, and direct and allocated operating expenses.
The Bank’s liquid assets, mostly consisting of cash and due from banks, and most recently, highly rated corporate debt securities (above ‘A-‘), totaled $1,048 million at the end of 4Q20, down from $1,465 million a quarter ago and $1,160 million a year ago, as the Bank gradually returns its liquidity position to a prudent level similar to pre-Covid from a year ago. As of December 31, 2020, $689 million, or 66% of total liquid assets represented deposits placed with the Federal Reserve Bank of New York, while $202 million, or 19% of total liquid assets represented corporate debt securities classified as high quality liquid assets (“HQLA”) in accordance with the specifications of the Basel Committee. As of the end of 4Q20, 3Q20, and 4Q19, liquidity balances to total assets represented 17%, 23% and 16%, respectively, while the liquidity balances to total deposits ratio was 33%, 48% and 40%, respectively.
5
In addition, financial instruments related to the Treasury’s investment management activities continued to gradually increase to $193 million at the end of 4Q20, compared to $127 million a quarter ago and $80 million a year ago. Consequently, the total Investment Portfolio balances amounted to $395 million as of December 31, 2020, up 69% from $234 million a quarter ago, and up 394% from $80 million a year ago. Overall, the Investment Portfolio mostly consisted of readily-quoted Latin American and Multilateral securities, out of which 62% represented sovereign or state-owned risk at the end of the 4Q20, compared to 54% a quarter ago and 72% a year ago (refer to Exhibit X for a per-country risk distribution of the Investment Portfolio).
On the funding side, deposit balances increased to $3.1 billion at the end of 4Q20, up 3% QoQ and 9% YoY. The continued growth in the Bank’s deposit base denotes the growth of its new Yankee CD program which complements the short-term funding structure, and the steady support from the Bank’s Class A shareholders (i.e.: central banks and their designees), which represented 50% of total deposits at the end of 4Q20, compared to 51% and 61% of total deposits a quarter and year ago, respectively. As of December 31, 2020, total deposits represented 61% of total funding sources, up from 48% a year ago. Consequently, short- and medium-term borrowings and debt totaled $2.0 billion at the end of 4Q20 (-4% QoQ and -37% YoY). Weighted average funding costs improved to 1.11% in 4Q20 (-15 bps QoQ; -158 bps YoY), and 1.59% for FY20 (-151 bps YoY), benefiting from the impact of lower market rates on its narrow, liability-sensitive interest rate gap position, and on a higher average deposit base.
| (US$ million) | 2020 | 2019 | YoY (%) | 4Q20 | 3Q20 | 4Q19 | QoQ (%) | YoY (%) | ||||||||||||||||||||||||
| Treasury Business Segment: | ||||||||||||||||||||||||||||||||
| Net interest income | $ | 4.5 | $ | 1.1 | 305 | % | $ | 1.3 | $ | 1.4 | $ | 0.8 | -9 | % | 59 | % | ||||||||||||||||
| Other income (expense) | (1.9 | ) | 1.6 | -221 | % | (0.1 | ) | (0.3 | ) | (1.8 | ) | 66 | % | 93 | % | |||||||||||||||||
| Total revenues | 2.6 | 2.7 | -2 | % | 1.2 | 1.1 | (1.0 | ) | 10 | % | 220 | % | ||||||||||||||||||||
| (Provision) reversal for credit losses | (0.4 | ) | 0.3 | -235 | % | (0.2 | ) | (0.1 | ) | 0.0 | -96 | % | n.m. | |||||||||||||||||||
| Operating expenses | (9.3 | ) | (9.5 | ) | 2 | % | (2.3 | ) | (1.8 | ) | (2.5 | ) | -23 | % | 11 | % | ||||||||||||||||
| Loss for the segment | $ | (7.1 | ) | $ | (6.5 | ) | -9 | % | $ | (1.3 | ) | $ | (0.9 | ) | $ | (3.5 | ) | -49 | % | 62 | % | |||||||||||
| "n.m." means not meaningful. |
The Treasury Business Segment’s results were a $1.3 million loss for 4Q20 and a $7.1 million loss for FY20. 4Q20 results were mainly impacted by increased seasonal allocated operating expenses, while revenues remained relatively stable on absolute terms QoQ. Annual FY20 results reflect increased NII benefiting from the Bank’s liability sensitive interest rate gap in a declining interest rate environment, coupled with increased bond portfolio driving higher yields of assets managed by the Treasury Division. These effects were offset in FY20 by losses on financial instruments related to ineffectiveness from its hedging derivatives position.
6
NET INTEREST INCOME AND MARGINS
| (US$ million, except percentages) | 2020 | 2019 | YoY (%) | 4Q20 | 3Q20 | 4Q19 | QoQ (%) | YoY (%) | ||||||||||||||||||||||||
| Net Interest Income | ||||||||||||||||||||||||||||||||
| Interest income | $ | 181.0 | $ | 273.7 | -34 | % | $ | 37.8 | $ | 39.7 | $ | 64.1 | -5 | % | -41 | % | ||||||||||||||||
| Interest expense | (88.5 | ) | (164.2 | ) | 46 | % | (15.5 | ) | (17.1 | ) | (37.2 | ) | 9 | % | 58 | % | ||||||||||||||||
| Net Interest Income ("NII") | $ | 92.5 | $ | 109.5 | -16 | % | $ | 22.3 | $ | 22.6 | $ | 26.9 | -1 | % | -17 | % | ||||||||||||||||
| Net Interest Spread ("NIS") | 1.13 | % | 1.19 | % | -5 | % | 1.17 | % | 1.19 | % | 1.18 | % | -1 | % | -1 | % | ||||||||||||||||
| Net Interest Margin ("NIM") | 1.41 | % | 1.74 | % | -19 | % | 1.37 | % | 1.42 | % | 1.65 | % | -3 | % | -17 | % |
NII and NIM were $22.3 million and 1.37% for 4Q20, and $92.5 million and 1.41% for FY20, respectively. Compared to the previous quarter, NII decreased 1% QoQ on a 5 bps decrease in NIM, mainly associated to the continued downward repricing of loans at lower market (Libor) rates. On a YoY comparison, NII and NIM were impacted by the Bank’s defensive approach to favor liquidity over loan growth during most part of the year, as evidenced by higher average cash position levels (24% and 23% of average interest-earning assets in 4Q20 and FY20, respectively), coupled with the impact of lower market (Libor) rates on the Bank’s assets financed by its ample equity base. These effects were partly compensated by the widening of the Bank’s net lending spread differential throughout FY20, as liabilities repriced faster than loans in a decreasing market rate environment, and as the Bank was able to increase lending spreads in its origination to top quality borrowers as Covid-19 crisis emerged.
FEES AND COMMISSIONS
Fees and Commissions, net, includes the fee income associated with letters of credit and the fee income derived from loan structuring and syndication activities, together with loan intermediation and distribution activities in the primary market, and other commissions, mostly from other contingent credits, such as guarantees and credit commitments, net of fee expenses.
| (US$ million) | 2020 | 2019 | YoY (%) | 4Q20 | 3Q20 | 4Q19 | QoQ (%) | YoY (%) | ||||||||||||||||||||||||
| Letters of credit fees | 9.0 | 9.5 | -5 | % | 2.5 | 2.3 | 2.5 | 8 | % | 0 | % | |||||||||||||||||||||
| Loan syndication fees | 0.6 | 5.6 | -89 | % | 0.1 | 0.1 | 2.7 | 44 | % | -97 | % | |||||||||||||||||||||
| Other commissions, net | 0.8 | 0.5 | 57 | % | 0.2 | 0.3 | 0.2 | -9 | % | 39 | % | |||||||||||||||||||||
| Fees and Commissions, net | $ | 10.4 | $ | 15.6 | -33 | % | $ | 2.8 | $ | 2.6 | $ | 5.4 | 7 | % | -48 | % |
Fees and Commissions income totaled $2.8 million for 4Q20 and $10.4 million for FY20. The 7% QoQ increase was mostly driven by higher fees from the Bank’s letters of credit business, performing similarly to pre-Covid levels. The YoY reductions in fees and commissions were mainly attributable to the absence of mandated structured transactions impacted by market uncertainty.
7
PORTFOLIO QUALITY AND TOTAL ALLOWANCE FOR LOSSES
| (US$ million, except percentages) | 31-Dec-20 | 30-Sep-20 | 30-Jun-20 | 31-Mar-20 | 31-Dec-19 | |||||||||||||||
| Allowance for loan losses | ||||||||||||||||||||
| Balance at beginning of the period | $ | 42.5 | $ | 45.4 | $ | 99.9 | $ | 99.3 | $ | 101.4 | ||||||||||
| (Reversals) provisions | (1.3 | ) | 1.5 | (2.4 | ) | 0.5 | (2.1 | ) | ||||||||||||
| Write-offs, net of recoveries | 0.0 | (4.4 | ) | (52.1 | ) | 0.1 | 0.0 | |||||||||||||
| End of period balance | $ | 41.2 | $ | 42.5 | $ | 45.4 | $ | 99.9 | $ | 99.3 | ||||||||||
| Allowance for loan commitments and financial guarantee contract losses | ||||||||||||||||||||
| Balance at beginning of the period | $ | 2.1 | $ | 2.1 | $ | 2.4 | $ | 3.0 | $ | 2.7 | ||||||||||
| Provisions (reversals) | 0.8 | (0.1 | ) | (0.3 | ) | (0.6 | ) | 0.4 | ||||||||||||
| End of period balance | $ | 2.9 | $ | 2.1 | $ | 2.1 | $ | 2.4 | $ | 3.0 | ||||||||||
| Allowance for Investment Portfolio losses | ||||||||||||||||||||
| Balance at beginning of the period | $ | 0.3 | $ | 0.2 | $ | 0.1 | $ | 0.1 | $ | 0.3 | ||||||||||
| Provisions (reversals) | 0.2 | 0.1 | 0.1 | (0.0 | ) | (0.2 | ) | |||||||||||||
| End of period balance | $ | 0.5 | $ | 0.3 | $ | 0.2 | $ | 0.1 | $ | 0.1 | ||||||||||
| Total allowance for losses | $ | 44.6 | $ | 44.9 | $ | 47.8 | $ | 102.5 | $ | 102.5 | ||||||||||
| Total allowance for losses to Credit Portfolio | 0.75 | % | 0.84 | % | 0.95 | % | 1.73 | % | 1.56 | % | ||||||||||
| Credit-impaired loans to Loan Portfolio | 0.22 | % | 0.00 | % | 0.00 | % | 1.16 | % | 1.05 | % | ||||||||||
| Total allowance for losses to credit-impaired loans (times) | 4.2 | n.m. | n.m. | 1.7 | 1.7 | |||||||||||||||
| Stage 1 (low risk) to Total Credit Portfolio | 94 | % | 94 | % | 90 | % | 93 | % | 95 | % | ||||||||||
| Stage 2 (increased risk) to Total Credit Portfolio | 6 | % | 6 | % | 10 | % | 6 | % | 4 | % | ||||||||||
| Stage 3 (credit impaired) to Total Credit Portfolio | 0 | % | 0 | % | 0 | % | 1 | % | 1 | % | ||||||||||
| "n.m." means not meaningful. | ||||||||||||||||||||
The total allowance for credit losses decreased to $44.6 million, representing a coverage ratio to the Credit Portfolio of 75 bps as of December 31, 2020, compared to $44.9 million, or 84 bps, a quarter ago and compared to $102.5 million, or 156 bps, a year ago. The quarterly decrease was mainly related to lower provision requirements in Stage 1, notwithstanding increased portfolio, due to high quality origination during the quarter (i.e. increased high quality liquid bonds and loan growth in investment grade countries), more than offsetting higher provision requirement for an $11 million credit impaired loan classified in Stage 3 from Stage 2. The YoY decrease was associated to the sale of a former credit-impaired loan and watchlist loan, totaling $56.5 million in write-offs against previously constituted reserves, coupled with the Bank’s improved mix of its Credit Portfolio exposure.
As of December 31, 2020, asset quality remained sound, with credit-impaired loans (“NPL”) representing 0.22% of the total Loan Portfolio, compared to zero in the previous quarter and to 1.05% of the total Loan Portfolio a year ago.
8
OPERATING EXPENSES
| 2020 | 2019 | YoY (%) | 4Q20 | 3Q20 | 4Q19 | QoQ (%) | YoY (%) | |||||||||||||||||||||||||
| Operating expenses | ||||||||||||||||||||||||||||||||
| Salaries and other employee expenses | 21.5 | 24.2 | -11 | % | 5.7 | 4.6 | 6.4 | 22 | % | -11 | % | |||||||||||||||||||||
| Depreciation of equipment and leasehold improvements | 3.6 | 2.9 | 26 | % | 0.9 | 1.1 | 0.7 | -21 | % | 20 | % | |||||||||||||||||||||
| Amortization of intangible assets | 0.8 | 0.7 | 7 | % | 0.2 | 0.2 | 0.2 | 3 | % | 2 | % | |||||||||||||||||||||
| Other expenses | 11.5 | 12.9 | -11 | % | 3.4 | 2.4 | 4.0 | 43 | % | -13 | % | |||||||||||||||||||||
| Total Operating Expenses | $ | 37.3 | $ | 40.7 | -8 | % | $ | 10.2 | $ | 8.3 | $ | 11.3 | 22 | % | -10 | % | ||||||||||||||||
| Efficiency Ratio | 37.6 | % | 32.1 | % | 40.2 | % | 33.1 | % | 35.9 | % |
The Bank’s 4Q20 and FY20 operating expenses totaled $10.2 million (+22% QoQ; -10% YoY) and $37.3 million (-8% YoY), respectively. The 22% QoQ increase was mainly related to higher personnel expenses and other seasonal operating expenses. The YoY decreases were primarily related to lower personnel expenses, mostly due to a lower performance-based variable compensation provision, and other cost savings in the current context.
4Q20 and FY20 Efficiency Ratio stood at 40.2% and 37.6%, respectively. The quarterly increase was mainly associated to seasonal higher operating expenses as total revenues remained relatively stable. The YoY increases in Efficiency Ratios were mostly attributed to lower income generation on the account of the Bank’s implemented measures to mitigate the risks associated to Covid-19 pandemic.
CAPITAL RATIOS AND CAPITAL MANAGEMENT
The following table shows capital amounts and ratios as of the dates indicated:
| (US$ million, except percentages and shares outstanding) | 31-Dec-20 | 30-Sep-20 | 31-Dec-19 | QoQ (%) | YoY (%) | |||||||||||||||
| Tier 1 Capital (9) | $ | 1,038 | $ | 1,026 | $ | 1,016 | 1 | % | 2 | % | ||||||||||
| Risk-Weighted Assets Basel III (9) | $ | 3,995 | $ | 3,878 | $ | 5,138 | 3 | % | -22 | % | ||||||||||
| Tier 1 Basel III Capital Ratio (9) | 26.0 | % | 26.5 | % | 19.8 | % | -2 | % | 31 | % | ||||||||||
| Total equity | $ | 1,038 | $ | 1,026 | $ | 1,016 | 1 | % | 2 | % | ||||||||||
| Total equity to total assets | 16.5 | % | 16.3 | % | 14.0 | % | 2 | % | 18 | % | ||||||||||
| Accumulated other comprehensive income (loss) ("OCI") | $ | 0 | $ | (6 | ) | $ | (2 | ) | 104 | % | 111 | % | ||||||||
| Total assets / Total equity (times) | 6.1 | 6.2 | 7.1 | -2 | % | -15 | % | |||||||||||||
| Shares outstanding (in thousand) | 39,678 | 39,672 | 39,602 | 0 | % | 0 | % | |||||||||||||
The Bank’s equity consists entirely of issued and fully paid ordinary common stock, with 39.7 million common shares outstanding as of December 31, 2020. At the same date, the Bank’s ratio of total assets to total equity stood at 6.1 times, and the Bank’s Tier 1 Basel III Capital Ratio stood at 26.0%, as risk-weighted assets calculated with an advanced internal ratings-based approach (IRB) for credit risk, increased QoQ due to the Bank’s portfolio growth, with an equity base slightly up 1% QoQ.
9
RECENT EVENTS
| § | Quarterly dividend payment: The Bank’s Board of Directors (the “Board”) approved a quarterly common dividend of $0.25 per share corresponding to the fourth quarter 2020. The cash dividend will be paid on March 10, 2021, to shareholders registered as of February 23, 2021. |
| § | Ratings updates: On February 10, 2021, Fitch Ratings (“Fitch”) affirmed Bladex’s long- and short-term foreign currency Issuer Default Rating (“IDR”) at ‘BBB/F3’, respectively. The outlook for the Long-Term IDRs remains ‘Negative’. According to Fitch: “The affirmation of Bladex’s ratings following the downgrade of Panama’s sovereign ratings to ‘BBB-‘ from ‘BBB’, reflect the international nature of Bladex’s operations despite being domiciled in Panama. Bladex’s VR is one notch above Panama’s sovereign rating because, according to Fitch’s criteria, its high geographical diversification helps it to offset any potential negative impact of Panama’s sovereign risks.” |
Notes:
| - | Numbers and percentages set forth in this earnings release have been rounded and accordingly may not total exactly. |
| - | QoQ and YoY refer to quarter-on-quarter and year-on-year variations, respectively. |
Footnotes:
| 1) | Earnings per Share (“EPS”) calculation is based on the average number of shares outstanding during each period. |
| 2) | ROAE refers to return on average stockholders’ equity which is calculated on the basis of unaudited daily average balances. |
| 3) | NIM refers to net interest margin which constitutes to Net Interest Income (“NII”) divided by the average balance of interest-earning assets. |
| 4) | NIS refers to net interest spread which constitutes the average yield earned on interest-earning assets, less the average yield paid on interest-bearing liabilities. |
| 5) | Efficiency Ratio refers to consolidated operating expenses as a percentage of total revenues. |
| 6) | The Bank’s “Credit Portfolio” includes gross loans at amortized cost (or the “Loan Portfolio”), securities at FVOCI and at amortized cost, gross of interest receivable and the allowance for expected credit losses, loan commitments and financial guarantee contracts, such as confirmed and stand-by letters of credit, and guarantees covering commercial risk; and other assets consisting of customers’ liabilities under acceptances. |
| 7) | The Bank’s “Commercial Portfolio” includes gross loans at amortized cost (or the “Loan Portfolio”), loan commitments and financial guarantee contracts, such as issued and confirmed letters of credit, stand-by letters of credit, guarantees covering commercial risk and other assets consisting of customers’ liabilities under acceptances. |
| 8) | Market capitalization corresponds to total outstanding common shares multiplied by market close price at the end of each corresponding period. |
| 9) | Tier 1 Capital is calculated according to Basel III capital adequacy guidelines and is equivalent to stockholders’ equity excluding certain effects such as the OCI effect of the financial instruments at fair value through OCI. Tier 1 Capital ratio is calculated as a percentage of risk-weighted assets. Risk-weighted assets are estimated based on Basel III capital adequacy guidelines. |
| 10) | Liquid assets refer to total cash and cash equivalents, consisting of cash and due from banks and interest-bearing deposits in banks, excluding pledged deposits and margin calls; as well as highly rated corporate debt securities (above ‘A-‘). Liquidity ratio refers to liquid assets as a percentage of total assets. |
10
| 11) | Loan Portfolio refers to gross loans at amortized cost, excluding interest receivable, the allowance for loan losses, and unearned interest and deferred fees. Credit-impaired loans are also commonly referred to as Non-Performing Loans or NPLs. |
| 12) | Total allowance for losses refers to allowance for loan losses plus allowance for loan commitments and financial guarantee contract losses and allowance for investment securities losses. |
SAFE HARBOR STATEMENT
This press release contains forward-looking statements of expected future developments within the meaning of the Private Securities Litigation Reform Act of 1995 and Section 21E of the Securities Exchange Act of 1934. Forward-looking statements can be identified by words such as: “anticipate”, “intend”, “plan”, “goal”, “seek”, “believe”, “project”, “estimate”, “expect”, “strategy”, “future”, “likely”, “may”, “should”, “will” and similar references to future periods. The forward-looking statements in this press release include the Bank’s financial position, asset quality and profitability, among others. These forward-looking statements reflect the expectations of the Bank’s management and are based on currently available data; however, actual performance and results are subject to future events and uncertainties, which could materially impact the Bank’s expectations. Among the factors that can cause actual performance and results to differ materially are as follows: the coronavirus (COVID-19) pandemic and government actions intended to limit its spread; the anticipated changes in the Bank’s credit portfolio; the continuation of the Bank’s preferred creditor status; the impact of increasing/decreasing interest rates and of the macroeconomic environment in the Region on the Bank’s financial condition; the execution of the Bank’s strategies and initiatives, including its revenue diversification strategy; the adequacy of the Bank’s allowance for expected credit losses; the need for additional allowance for expected credit losses; the Bank’s ability to achieve future growth, to reduce its liquidity levels and increase its leverage; the Bank’s ability to maintain its investment-grade credit ratings; the availability and mix of future sources of funding for the Bank’s lending operations; potential trading losses; the possibility of fraud; and the adequacy of the Bank’s sources of liquidity to replace deposit withdrawals. Factors or events that could cause our actual results to differ may emerge from time to time, and it is not possible for us to predict all of them. Readers are cautioned not to place undue reliance on these forward-looking statements, which speak only as of the date hereof. We undertake no obligation to publicly update any forward-looking statement, whether as a result of new information, future developments or otherwise, except as may be required by law.
ABOUT BLADEX
Bladex, a multinational bank originally established by the central banks of Latin-American and Caribbean countries, began operations in 1979 to promote foreign trade and economic integration in the Region. The Bank, headquartered in Panama, also has offices in Argentina, Brazil, Colombia, Mexico, and the United States of America, and a Representative License in Peru, supporting the regional expansion and servicing its customer base, which includes financial institutions and corporations.
Bladex is listed on the NYSE in the United States of America (NYSE: BLX), since 1992, and its shareholders include: central banks and state-owned banks and entities representing 23 Latin American countries; commercial banks and financial institutions; and institutional and retail investors through its public listing.
CONFERENCE CALL INFORMATION
There will be a conference call to discuss the Bank’s quarterly results on Friday, February 12, 2021 at 11:00 a.m. New York City time (Eastern Time). For those interested in participating, please dial 1-877-271-1828 in the United States or, if outside the United States, 1-334-323-9871. Participants should use conference passcode 51834133, and dial in five minutes before the call is set to begin. There will also be a live audio webcast of the conference at http://www.bladex.com. The webcast presentation will be available for viewing and downloads on http://www.bladex.com.
11
The conference call will become available for review on Conference Replay one hour after its conclusion and will remain available for 60 days. Please dial (877) 919-4059 or (334) 323-0140 and follow the instructions. The replay passcode is: 17239100.
For more information, please access http://www.bladex.com or contact:
Mrs. Ana Graciela de Méndez
Chief Financial Officer
Tel: +507 210-8563
E-mail address: amendez@bladex.com
12
EXHIBIT I
CONSOLIDATED STATEMENTS OF FINANCIAL POSITION
| AT THE END OF, | ||||||||||||||||||||||||||||
| (A) | (B) | (C) | ||||||||||||||||||||||||||
| December 31, 2020 | September 30, 2020 | December 31, 2019 | (A) - (B) CHANGE | % | (A) - (C) CHANGE | % | ||||||||||||||||||||||
| (In US$ thousand) | ||||||||||||||||||||||||||||
| Assets | ||||||||||||||||||||||||||||
| Cash and due from banks | $ | 863,812 | $ | 1,401,669 | $ | 1,178,170 | $ | (537,857 | ) | (38 | )% | ($ | 314,358 | ) | (27 | )% | ||||||||||||
| Securities and other financial assets, net | 398,068 | 238,572 | 88,794 | 159,496 | 67 | 309,274 | 348 | |||||||||||||||||||||
| Loans, net | 4,896,647 | 4,546,926 | 5,823,333 | 349,721 | 8 | (926,686 | ) | (16 | ) | |||||||||||||||||||
| Customers' liabilities under acceptances | 74,366 | 89,576 | 115,682 | (15,210 | ) | (17 | ) | (41,316 | ) | (36 | ) | |||||||||||||||||
| Derivative financial instruments - assets | 27,778 | 6,943 | 11,157 | 20,835 | 300 | 16,621 | 149 | |||||||||||||||||||||
| Equipment and leasehold improvements, net | 16,213 | 16,620 | 18,752 | (407 | ) | (2 | ) | (2,539 | ) | (14 | ) | |||||||||||||||||
| Intangibles, net | 1,984 | 864 | 1,427 | 1,120 | 130 | 557 | 39 | |||||||||||||||||||||
| Investment properties | 3,214 | 3,285 | 3,494 | (71 | ) | (2 | ) | (280 | ) | (8 | ) | |||||||||||||||||
| Other assets | 6,816 | 6,739 | 8,857 | 77 | 1 | (2,041 | ) | (23 | ) | |||||||||||||||||||
| Total assets | $ | 6,288,898 | $ | 6,311,194 | $ | 7,249,666 | $ | (22,296 | ) | (0 | )% | $ | (960,768 | ) | (13 | )% | ||||||||||||
| Liabilities | ||||||||||||||||||||||||||||
| Demand deposits | $ | 170,660 | $ | 361,230 | $ | 85,786 | $ | (190,570 | ) | (53 | )% | $ | 84,874 | 99 | % | |||||||||||||
| Time deposits | 2,968,240 | 2,693,965 | 2,802,550 | 274,275 | 10 | 165,690 | 6 | |||||||||||||||||||||
| 3,138,900 | 3,055,195 | 2,888,336 | 83,705 | 3 | 250,564 | 9 | ||||||||||||||||||||||
| Interest payable | 1,975 | 3,431 | 5,219 | (1,456 | ) | (42 | ) | (3,244 | ) | (62 | ) | |||||||||||||||||
| Total deposits | 3,140,875 | 3,058,626 | 2,893,555 | 82,249 | 3 | 247,320 | 9 | |||||||||||||||||||||
| Securities sold under repurchase agreements | 10,663 | 10,663 | 40,530 | 0 | 0 | (29,867 | ) | (74 | ) | |||||||||||||||||||
| Borrowings and debt, net | 1,985,070 | 2,066,943 | 3,138,310 | (81,873 | ) | (4 | ) | (1,153,240 | ) | (37 | ) | |||||||||||||||||
| Interest payable | 9,175 | 9,649 | 10,554 | (474 | ) | (5 | ) | (1,379 | ) | (13 | ) | |||||||||||||||||
| Customers' liabilities under acceptances | 74,366 | 89,576 | 115,682 | (15,210 | ) | (17 | ) | (41,316 | ) | (36 | ) | |||||||||||||||||
| Derivative financial instruments - liabilities | 9,211 | 33,315 | 14,675 | (24,104 | ) | (72 | ) | (5,464 | ) | (37 | ) | |||||||||||||||||
| Allowance for loan commitments and financial guarantee contract losses | 2,904 | 2,088 | 3,044 | 816 | 39 | (140 | ) | (5 | ) | |||||||||||||||||||
| Other liabilities | 18,714 | 14,627 | 17,149 | 4,087 | 28 | 1,565 | 9 | |||||||||||||||||||||
| Total liabilities | $ | 5,250,978 | $ | 5,285,487 | $ | 6,233,499 | $ | (34,509 | ) | (1 | )% | $ | (982,521 | ) | (16 | )% | ||||||||||||
| Equity | ||||||||||||||||||||||||||||
| Common stock | $ | 279,980 | $ | 279,980 | $ | 279,980 | $ | 0 | 0 | % | $ | 0 | 0 | % | ||||||||||||||
| Treasury stock | (57,999 | ) | (57,866 | ) | (59,669 | ) | (133 | ) | (0 | ) | 1,670 | 3 | ||||||||||||||||
| Additional paid-in capital in excess of value assigned of common stock | 120,414 | 119,850 | 120,362 | 564 | 0 | 52 | 0 | |||||||||||||||||||||
| Capital reserves | 95,210 | 95,210 | 95,210 | 0 | 0 | 0 | 0 | |||||||||||||||||||||
| Regulatory reserves | 136,019 | 136,019 | 136,019 | 0 | 0 | 0 | 0 | |||||||||||||||||||||
| Retained earnings | 464,088 | 458,265 | 446,083 | 5,823 | 1 | 18,005 | 4 | |||||||||||||||||||||
| Other comprehensive income (loss) | 208 | (5,751 | ) | (1,818 | ) | 5,959 | 104 | 2,026 | 111 | |||||||||||||||||||
| Total equity | $ | 1,037,920 | $ | 1,025,707 | $ | 1,016,167 | $ | 12,213 | 1 | % | $ | 21,753 | 2 | % | ||||||||||||||
| Total liabilities and equity | $ | 6,288,898 | $ | 6,311,194 | $ | 7,249,666 | $ | (22,296 | ) | (0 | )% | $ | (960,768 | ) | (13 | )% | ||||||||||||
13
EXHIBIT II
| CONSOLIDATED STATEMENTS OF PROFIT OR LOSS | ||||||||||||||||||||||||||||
| (In US$ thousand, except per share amounts and ratios) | ||||||||||||||||||||||||||||
| FOR THE THREE MONTHS ENDED | ||||||||||||||||||||||||||||
| (A) | (B) | (C) | ||||||||||||||||||||||||||
| December 31, 2020 | September 30, 2020 | December 31, 2019 | (A) - (B) CHANGE | % | (A) - (C) CHANGE | % | ||||||||||||||||||||||
| Net Interest Income: | ||||||||||||||||||||||||||||
| Interest income | $ | 37,782 | $ | 39,694 | $ | 64,084 | ($ | 1,912 | ) | (5 | )% | ($ | 26,302 | ) | (41 | )% | ||||||||||||
| Interest expense | (15,464 | ) | (17,086 | ) | (37,178 | ) | 1,622 | 9 | 21,714 | 58 | ||||||||||||||||||
| Net Interest Income | 22,318 | 22,608 | 26,906 | (290 | ) | (1 | ) | (4,588 | ) | (17 | ) | |||||||||||||||||
| Other income (expense): | ||||||||||||||||||||||||||||
| Fees and commissions, net | 2,794 | 2,611 | 5,354 | 183 | 7 | (2,560 | ) | (48 | ) | |||||||||||||||||||
| Loss on financial instruments, net | (50 | ) | (437 | ) | (2,029 | ) | 387 | 89 | 1,979 | 98 | ||||||||||||||||||
| Other income, net | 245 | 407 | 1,200 | (162 | ) | (40 | ) | (955 | ) | (80 | ) | |||||||||||||||||
| Total other income, net | 2,989 | 2,581 | 4,525 | 408 | 16 | (1,536 | ) | (34 | ) | |||||||||||||||||||
| Total revenues | 25,307 | 25,189 | 31,431 | 118 | 0 | (6,124 | ) | (19 | ) | |||||||||||||||||||
| Reversal (provision) for credit losses | 311 | (1,543 | ) | 1,935 | 1,854 | 120 | (1,624 | ) | (84 | ) | ||||||||||||||||||
| Reversal on non-financial assets | 296 | 140 | 0 | 156 | 111 | 296 | n.m. | (*) | ||||||||||||||||||||
| Operating expenses: | ||||||||||||||||||||||||||||
| Salaries and other employee expenses | (5,657 | ) | (4,626 | ) | (6,389 | ) | (1,031 | ) | (22 | ) | 732 | 11 | ||||||||||||||||
| Depreciation of equipment and leasehold improvements | (882 | ) | (1,116 | ) | (734 | ) | 234 | 21 | (148 | ) | (20 | ) | ||||||||||||||||
| Amortization of intangible assets | (191 | ) | (185 | ) | (187 | ) | (6 | ) | (3 | ) | (4 | ) | (2 | ) | ||||||||||||||
| Other expenses | (3,443 | ) | (2,415 | ) | (3,960 | ) | (1,028 | ) | (43 | ) | 517 | 13 | ||||||||||||||||
| Total operating expenses | (10,173 | ) | (8,342 | ) | (11,270 | ) | (1,831 | ) | (22 | ) | 1,097 | 10 | ||||||||||||||||
| Profit for the period | $ | 15,741 | $ | 15,444 | $ | 22,096 | $ | 297 | 2 | % | ($ | 6,355 | ) | (29 | )% | |||||||||||||
| PER COMMON SHARE DATA: | ||||||||||||||||||||||||||||
| Basic earnings per share | $ | 0.40 | $ | 0.39 | $ | 0.56 | ||||||||||||||||||||||
| Diluted earnings per share | $ | 0.40 | $ | 0.39 | $ | 0.56 | ||||||||||||||||||||||
| Book value (period average) | $ | 26.00 | $ | 25.85 | $ | 25.45 | ||||||||||||||||||||||
| Book value (period end) | $ | 26.16 | $ | 25.85 | $ | 25.66 | ||||||||||||||||||||||
| Weighted average basic shares | 39,678 | 39,672 | 39,602 | |||||||||||||||||||||||||
| Weighted average diluted shares | 39,678 | 39,672 | 39,602 | |||||||||||||||||||||||||
| Basic shares period end | 39,678 | 39,672 | 39,602 | |||||||||||||||||||||||||
| PERFORMANCE RATIOS: | ||||||||||||||||||||||||||||
| Return on average assets | 1.0 | % | 1.0 | % | 1.3 | % | ||||||||||||||||||||||
| Return on average equity | 6.1 | % | 6.0 | % | 8.7 | % | ||||||||||||||||||||||
| Net interest margin | 1.37 | % | 1.42 | % | 1.65 | % | ||||||||||||||||||||||
| Net interest spread | 1.17 | % | 1.19 | % | 1.18 | % | ||||||||||||||||||||||
| Efficiency Ratio | 40.2 | % | 33.1 | % | 35.9 | % | ||||||||||||||||||||||
| Operating expenses to total average assets | 0.62 | % | 0.52 | % | 0.69 | % | ||||||||||||||||||||||
(*) "n.m." means not meaningful.
14
EXHIBIT III
| CONSOLIDATED STATEMENTS OF PROFIT OR LOSS | ||||||||||||||||
| (In US$ thousand, except per share amounts and ratios) | ||||||||||||||||
| FOR THE YEAR ENDED | ||||||||||||||||
| (A) | (B) | |||||||||||||||
| December 31, 2020 | December 31, 2019 | (A) - (B) CHANGE | % | |||||||||||||
| Net Interest Income: | ||||||||||||||||
| Interest income | $ | 180,973 | $ | 273,682 | ($ | 92,709 | ) | (34 | )% | |||||||
| Interest expense | (88,523 | ) | (164,167 | ) | 75,644 | 46 | ||||||||||
| Net Interest Income | 92,450 | 109,515 | (17,065 | ) | (16 | ) | ||||||||||
| Other income (expense): | ||||||||||||||||
| Fees and commissions, net | 10,418 | 15,647 | (5,229 | ) | (33 | ) | ||||||||||
| Loss on financial instruments, net | (4,794 | ) | (1,379 | ) | (3,415 | ) | (248 | ) | ||||||||
| Other income, net | 1,083 | 2,874 | (1,791 | ) | (62 | ) | ||||||||||
| Total other income, net | 6,707 | 17,142 | (10,435 | ) | (61 | ) | ||||||||||
| Total revenues | 99,157 | 126,657 | (27,500 | ) | (22 | ) | ||||||||||
| Reversal (provision) for credit losses | 1,464 | (430 | ) | 1,894 | 440 | |||||||||||
| Reversal on non-financial assets | 296 | 500 | (204 | ) | (41 | ) | ||||||||||
| Operating expenses: | ||||||||||||||||
| Salaries and other employee expenses | (21,462 | ) | (24,179 | ) | 2,717 | 11 | ||||||||||
| Depreciation of equipment and leasehold improvements | (3,587 | ) | (2,854 | ) | (733 | ) | (26 | ) | ||||||||
| Amortization of intangible assets | (753 | ) | (702 | ) | (51 | ) | (7 | ) | ||||||||
| Other expenses | (11,522 | ) | (12,939 | ) | 1,417 | 11 | ||||||||||
| Total operating expenses | (37,324 | ) | (40,674 | ) | 3,350 | 8 | ||||||||||
| Profit for the period | $ | 63,593 | $ | 86,053 | ($ | 22,460 | ) | (26 | )% | |||||||
| PER COMMON SHARE DATA: | ||||||||||||||||
| Basic earnings per share | $ | 1.60 | $ | 2.17 | ||||||||||||
| Diluted earnings per share | $ | 1.60 | $ | 2.17 | ||||||||||||
| Book value (period average) | $ | 25.90 | $ | 25.41 | ||||||||||||
| Book value (period end) | $ | 26.16 | $ | 25.66 | ||||||||||||
| Weighted average basic shares | 39,656 | 39,575 | ||||||||||||||
| Weighted average diluted shares | 39,656 | 39,575 | ||||||||||||||
| Basic shares period end | 39,678 | 39,602 | ||||||||||||||
| PERFORMANCE RATIOS: | ||||||||||||||||
| Return on average assets | 1.0 | % | 1.4 | % | ||||||||||||
| Return on average equity | 6.2 | % | 8.6 | % | ||||||||||||
| Net interest margin | 1.41 | % | 1.74 | % | ||||||||||||
| Net interest spread | 1.13 | % | 1.19 | % | ||||||||||||
| Efficiency Ratio | 37.6 | % | 32.1 | % | ||||||||||||
| Operating expenses to total average assets | 0.56 | % | 0.64 | % | ||||||||||||
15
EXHIBIT IV
| CONSOLIDATED NET INTEREST INCOME AND AVERAGE BALANCES | ||||||||||||||||||||||||||||||||||||
| FOR THE THREE MONTHS ENDED | ||||||||||||||||||||||||||||||||||||
| December 31, 2020 | September 30, 2020 | December 31, 2019 | ||||||||||||||||||||||||||||||||||
| AVERAGE | AVG. | AVERAGE | AVG. | AVERAGE | AVG. | |||||||||||||||||||||||||||||||
| BALANCE | INTEREST | RATE | BALANCE | INTEREST | RATE | BALANCE | INTEREST | RATE | ||||||||||||||||||||||||||||
| (In US$ thousand) | ||||||||||||||||||||||||||||||||||||
| INTEREST EARNING ASSETS | ||||||||||||||||||||||||||||||||||||
| Cash and cash equivalents | $ | 1,525,717 | $ | 623 | 0.16 | % | $ | 1,737,338 | $ | 897 | 0.20 | % | $ | 810,691 | $ | 3,716 | 1.79 | % | ||||||||||||||||||
| Securities at fair value through OCI | 184,677 | 197 | 0.42 | 30,318 | 40 | 0.52 | 7,729 | 54 | 2.71 | |||||||||||||||||||||||||||
| Securities at amortized cost (1) | 152,615 | 1,106 | 2.84 | 104,762 | 871 | 3.25 | 74,761 | 662 | 3.47 | |||||||||||||||||||||||||||
| Loans, net of unearned interest | 4,611,060 | 35,858 | 3.04 | 4,472,974 | 37,886 | 3.31 | 5,573,386 | 59,652 | 4.19 | |||||||||||||||||||||||||||
| TOTAL INTEREST EARNING ASSETS | $ | 6,474,070 | $ | 37,783 | 2.28 | % | $ | 6,345,392 | $ | 39,694 | 2.45 | % | $ | 6,466,567 | $ | 64,084 | 3.88 | % | ||||||||||||||||||
| Allowance for expected credit losses on loans | (41,630 | ) | (40,654 | ) | (103,221 | ) | ||||||||||||||||||||||||||||||
| Non interest earning assets | 116,474 | 137,993 | 158,324 | |||||||||||||||||||||||||||||||||
| TOTAL ASSETS | $ | 6,548,914 | $ | 6,442,730 | $ | 6,521,669 | ||||||||||||||||||||||||||||||
| INTEREST BEARING LIABILITIES | ||||||||||||||||||||||||||||||||||||
| Deposits | 3,534,462 | $ | 4,247 | 0.47 | % | 3,067,604 | $ | 4,400 | 0.56 | % | $ | 2,703,014 | $ | 14,154 | 2.05 | % | ||||||||||||||||||||
| Securities sold under repurchase agreement and short-term borrowings and debt | 294,881 | 2,288 | 3.04 | 878,831 | 4,586 | 2.04 | 1,160,886 | 8,533 | 2.88 | |||||||||||||||||||||||||||
| Long-term borrowings and debt, net (2) | 1,611,988 | 8,929 | 2.17 | 1,350,266 | 8,100 | 2.35 | 1,537,943 | 14,491 | 3.69 | |||||||||||||||||||||||||||
| TOTAL INTEREST BEARING LIABILITIES | $ | 5,441,331 | $ | 15,464 | 1.11 | % | $ | 5,296,700 | $ | 17,086 | 1.26 | % | $ | 5,401,844 | $ | 37,178 | 2.69 | % | ||||||||||||||||||
| Non interest bearing liabilities and other liabilities | $ | 75,917 | $ | 120,370 | $ | 112,039 | ||||||||||||||||||||||||||||||
| TOTAL LIABILITIES | 5,517,247 | 5,417,070 | 5,513,883 | |||||||||||||||||||||||||||||||||
| EQUITY | 1,031,667 | 1,025,660 | 1,007,786 | |||||||||||||||||||||||||||||||||
| TOTAL LIABILITIES AND EQUITY | $ | 6,548,914 | $ | 6,442,730 | $ | 6,521,669 | ||||||||||||||||||||||||||||||
| NET INTEREST SPREAD | 1.17 | % | 1.19 | % | 1.18 | % | ||||||||||||||||||||||||||||||
| NET INTEREST INCOME AND NET INTEREST MARGIN | $ | 22,319 | 1.37 | % | $ | 22,608 | 1.42 | % | $ | 26,906 | 1.65 | % | ||||||||||||||||||||||||
| (1) | Gross of the allowance for losses relating to securities at amortized cost. |
| (2) | Includes lease liabilities, net of prepaid commissions. |
| Note: Interest income and/or expense includes the effect of derivative financial instruments used for hedging. |
16
EXHIBIT V
CONSOLIDATED NET INTEREST INCOME AND AVERAGE BALANCES
| FOR THE YEAR ENDED | ||||||||||||||||||||||||
| December 31, 2020 | December 31, 2019 | |||||||||||||||||||||||
| AVERAGE | AVG. | AVERAGE | AVG. | |||||||||||||||||||||
| BALANCE | INTEREST | RATE | BALANCE | INTEREST | RATE | |||||||||||||||||||
| (In US$ thousand) | ||||||||||||||||||||||||
| INTEREST EARNING ASSETS | ||||||||||||||||||||||||
| Cash and cash equivalents | $ | 1,502,339 | $ | 4,895 | 0.32 | % | $ | 755,781 | $ | 17,011 | 2.22 | % | ||||||||||||
| Securities at fair value through OCI | 56,583 | 268 | 0.47 | 13,975 | 568 | 4.01 | ||||||||||||||||||
| Securities at amortized cost (1) | 100,403 | 3,263 | 3.20 | 75,854 | 2,641 | 3.43 | ||||||||||||||||||
| Loans, net of unearned interest | 4,880,845 | 172,548 | 3.48 | 5,448,716 | 253,462 | 4.59 | ||||||||||||||||||
| TOTAL INTEREST EARNING ASSETS | $ | 6,540,170 | $ | 180,973 | 2.72 | % | $ | 6,294,326 | $ | 273,682 | 4.29 | % | ||||||||||||
| Allowance for expected credit losses on loans | (67,233 | ) | (100,907 | ) | ||||||||||||||||||||
| Non interest earning assets | 134,730 | 153,061 | ||||||||||||||||||||||
| TOTAL ASSETS | $ | 6,607,668 | $ | 6,346,480 | ||||||||||||||||||||
| INTEREST BEARING LIABILITIES | ||||||||||||||||||||||||
| Deposits | $ | 2,974,549 | $ | 25,800 | 0.85 | % | $ | 2,718,736 | $ | 67,435 | 2.45 | % | ||||||||||||
| Securities sold under repurchase agreement and short-term borrowings and debt | 1,060,800 | 23,960 | 2.22 | 1,116,876 | 38,944 | 3.44 | ||||||||||||||||||
| Long-term borrowings and debt, net (2) | 1,440,239 | 38,763 | 2.65 | 1,388,113 | 57,788 | 4.11 | ||||||||||||||||||
| TOTAL INTEREST BEARING LIABILITIES | $ | 5,475,588 | $ | 88,523 | 1.59 | % | $ | 5,223,725 | $ | 164,167 | 3.10 | % | ||||||||||||
| Non interest bearing liabilities and other liabilities | $ | 105,032 | $ | 117,190 | ||||||||||||||||||||
| TOTAL LIABILITIES | 5,580,619 | 5,340,915 | ||||||||||||||||||||||
| EQUITY | 1,027,048 | 1,005,565 | ||||||||||||||||||||||
| TOTAL LIABILITIES AND EQUITY | $ | 6,607,668 | $ | 6,346,480 | ||||||||||||||||||||
| NET INTEREST SPREAD | 1.13 | % | 1.19 | % | ||||||||||||||||||||
| NET INTEREST INCOME AND NET INTEREST MARGIN | $ | 92,450 | 1.41 | % | $ | 109,515 | 1.74 | % | ||||||||||||||||
(1) Gross of the allowance for losses relating to securities at amortized cost.
(2) Includes lease liabilities, net of prepaid commissions.
Note: Interest income and/or expense includes the effect of derivative financial instruments used for hedging.
17
EXHIBIT VI
CONSOLIDATED STATEMENT OF PROFIT OR LOSS
(In US$ thousand, except per share amounts and ratios)
| FOR THE YEAR | FOR THE THREE MONTHS ENDED | FOR THE YEAR | ||||||||||||||||||||||||||
| ENDED | ENDED | |||||||||||||||||||||||||||
| DEC 31/20 | DEC 31/20 | SEP 30/20 | JUN 30/20 | MAR 31/20 | DEC 31/19 | DEC 31/19 | ||||||||||||||||||||||
| Net Interest Income: | ||||||||||||||||||||||||||||
| Interest income | $ | 180,973 | $ | 37,782 | $ | 39,694 | $ | 44,507 | $ | 58,990 | $ | 64,084 | $ | 273,682 | ||||||||||||||
| Interest expense | (88,523 | ) | (15,464 | ) | (17,086 | ) | (22,784 | ) | (33,189 | ) | (37,178 | ) | (164,167 | ) | ||||||||||||||
| Net Interest Income | 92,450 | 22,318 | 22,608 | 21,723 | 25,801 | 26,906 | 109,515 | |||||||||||||||||||||
| Other income (expense): | ||||||||||||||||||||||||||||
| Fees and commissions, net | 10,418 | 2,794 | 2,611 | 1,940 | 3,073 | 5,354 | 15,647 | |||||||||||||||||||||
| Loss on financial instruments, net | (4,794 | ) | (50 | ) | (437 | ) | (3,949 | ) | (358 | ) | (2,029 | ) | (1,379 | ) | ||||||||||||||
| Other income, net | 1,083 | 245 | 407 | 191 | 240 | 1,200 | 2,874 | |||||||||||||||||||||
| Total other income, net | 6,707 | 2,989 | 2,581 | (1,818 | ) | 2,955 | 4,525 | 17,142 | ||||||||||||||||||||
| Total revenues | 99,157 | 25,307 | 25,189 | 19,905 | 28,756 | 31,431 | 126,657 | |||||||||||||||||||||
| Reversal (provision) for credit losses | 1,464 | 311 | (1,543 | ) | 2,607 | 89 | 1,935 | (430 | ) | |||||||||||||||||||
| Reversal (impairment) on non-financial assets | 296 | 296 | 140 | (140 | ) | 0 | 0 | 500 | ||||||||||||||||||||
| Total operating expenses | (37,324 | ) | (10,173 | ) | (8,342 | ) | (8,266 | ) | (10,543 | ) | (11,270 | ) | (40,674 | ) | ||||||||||||||
| Profit for the period | $ | 63,593 | $ | 15,741 | $ | 15,444 | $ | 14,106 | $ | 18,302 | $ | 22,096 | $ | 86,053 | ||||||||||||||
| SELECTED FINANCIAL DATA | ||||||||||||||||||||||||||||
| PER COMMON SHARE DATA | ||||||||||||||||||||||||||||
| Basic earnings per share | $ | 1.60 | $ | 0.40 | $ | 0.39 | $ | 0.36 | $ | 0.46 | $ | 0.56 | $ | 2.17 | ||||||||||||||
| PERFORMANCE RATIOS | ||||||||||||||||||||||||||||
| Return on average assets | 1.0 | % | 1.0 | % | 1.0 | % | 0.8 | % | 1.1 | % | 1.3 | % | 1.4 | % | ||||||||||||||
| Return on average equity | 6.2 | % | 6.1 | % | 6.0 | % | 5.5 | % | 7.2 | % | 8.7 | % | 8.6 | % | ||||||||||||||
| Net interest margin | 1.41 | % | 1.37 | % | 1.42 | % | 1.28 | % | 1.59 | % | 1.65 | % | 1.74 | % | ||||||||||||||
| Net interest spread | 1.13 | % | 1.17 | % | 1.19 | % | 1.01 | % | 1.17 | % | 1.18 | % | 1.19 | % | ||||||||||||||
| Efficiency Ratio | 37.6 | % | 40.2 | % | 33.1 | % | 41.5 | % | 36.7 | % | 35.9 | % | 32.1 | % | ||||||||||||||
| Operating expenses to total average assets | 0.56 | % | 0.62 | % | 0.52 | % | 0.48 | % | 0.65 | % | 0.69 | % | 0.64 | % | ||||||||||||||
18
EXHIBIT VII
BUSINESS SEGMENT ANALYSIS
(In US$ thousand)
| FOR THE YEAR ENDED | FOR THE THREE MONTHS ENDED | |||||||||||||||||||
| DEC 31/20 | DEC 31/19 | DEC 31/20 | SEP 30/20 | DEC 31/19 | ||||||||||||||||
| COMMERCIAL BUSINESS SEGMENT: | ||||||||||||||||||||
| Net interest income | $ | 87,921 | $ | 108,398 | $ | 21,033 | $ | 21,201 | $ | 26,100 | ||||||||||
| Other income | 8,597 | 15,577 | 3,109 | 2,929 | 6,298 | |||||||||||||||
| Total revenues | 96,518 | 123,975 | 24,142 | 24,130 | 32,398 | |||||||||||||||
| Reversal (provision) for credit losses | 1,889 | (744 | ) | 533 | (1,430 | ) | 1,935 | |||||||||||||
| Reversal on non-financial assets | 296 | 500 | 296 | 140 | 0 | |||||||||||||||
| Operating expenses | (28,021 | ) | (31,183 | ) | (7,909 | ) | (6,507 | ) | (8,724 | ) | ||||||||||
| Profit for the segment | $ | 70,682 | $ | 92,548 | $ | 17,062 | $ | 16,333 | $ | 25,609 | ||||||||||
| Segment assets | 4,989,009 | 5,967,157 | 4,989,009 | 4,657,429 | 5,967,157 | |||||||||||||||
| TREASURY BUSINESS SEGMENT: | ||||||||||||||||||||
| Net interest income | $ | 4,529 | $ | 1,117 | $ | 1,285 | $ | 1,407 | $ | 806 | ||||||||||
| Other income (expense) | (1,890 | ) | 1,565 | (120 | ) | (348 | ) | (1,773 | ) | |||||||||||
| Total revenues | 2,639 | 2,682 | 1,165 | 1,059 | (967 | ) | ||||||||||||||
| (Provision) reversal for credit losses | (425 | ) | 314 | (222 | ) | (113 | ) | 0 | ||||||||||||
| Operating expenses | (9,303 | ) | (9,491 | ) | (2,264 | ) | (1,835 | ) | (2,546 | ) | ||||||||||
| Loss for the segment | $ | (7,089 | ) | $ | (6,495 | ) | $ | (1,321 | ) | $ | (889 | ) | (3,513 | ) | ||||||
| Segment assets | 1,293,081 | 1,273,678 | 1,293,081 | 1,647,046 | 1,273,678 | |||||||||||||||
| TOTAL: | ||||||||||||||||||||
| Net interest income | $ | 92,450 | $ | 109,515 | $ | 22,318 | $ | 22,608 | $ | 26,906 | ||||||||||
| Other income | 6,707 | 17,142 | 2,989 | 2,581 | 4,525 | |||||||||||||||
| Total revenues | 99,157 | 126,657 | 25,307 | 25,189 | 31,431 | |||||||||||||||
| Reversal (provision) for credit losses | 1,464 | (430 | ) | 311 | (1,543 | ) | 1,935 | |||||||||||||
| Reversal on non-financial assets | 296 | 500 | 296 | 140 | 0 | |||||||||||||||
| Operating expenses | (37,324 | ) | (40,674 | ) | (10,173 | ) | (8,342 | ) | (11,270 | ) | ||||||||||
| Profit for the period | $ | 63,593 | $ | 86,053 | $ | 15,741 | $ | 15,444 | $ | 22,096 | ||||||||||
| Total segment assets | 6,282,090 | 7,240,835 | 6,282,090 | 6,304,475 | 7,240,835 | |||||||||||||||
| Unallocated assets | 6,808 | 8,831 | 6,808 | 6,719 | 8,831 | |||||||||||||||
| Total assets | 6,288,898 | 7,249,666 | 6,288,898 | 6,311,194 | 7,249,666 | |||||||||||||||
19
EXHIBIT VIII
CREDIT PORTFOLIO
DISTRIBUTION BY COUNTRY
(In US$ million)
| AT THE END OF, | ||||||||||||||||||||||||||||||||
| (A) | (B) | (C) | ||||||||||||||||||||||||||||||
| Dec. 31, 2020 | Sept. 30, 2020 | Dec. 31, 2019 | Change in Amount | |||||||||||||||||||||||||||||
| COUNTRY | Amount | % of Total Outstanding | Amount | % of Total Outstanding | Amount | % of Total Outstanding | (A) - (B) | (A) - (C) | ||||||||||||||||||||||||
| ARGENTINA | $ | 131 | 2 | $ | 146 | 3 | $ | 226 | 3 | $ | (15 | ) | $ | (95 | ) | |||||||||||||||||
| BOLIVIA | 15 | 0 | 8 | 0 | 7 | 0 | 7 | 8 | ||||||||||||||||||||||||
| BRAZIL | �� | 1,063 | 18 | 914 | 17 | 1,067 | 16 | 149 | (4 | ) | ||||||||||||||||||||||
| CHILE | 583 | 10 | 510 | 10 | 688 | 10 | 73 | (105 | ) | |||||||||||||||||||||||
| COLOMBIA | 795 | 13 | 732 | 14 | 972 | 15 | 63 | (177 | ) | |||||||||||||||||||||||
| COSTA RICA | 203 | 3 | 178 | 3 | 280 | 4 | 25 | (77 | ) | |||||||||||||||||||||||
| DOMINICAN REPUBLIC | 219 | 4 | 194 | 4 | 306 | 5 | 25 | (87 | ) | |||||||||||||||||||||||
| ECUADOR | 211 | 4 | 174 | 3 | 427 | 6 | 37 | (216 | ) | |||||||||||||||||||||||
| EL SALVADOR | 41 | 1 | 46 | 1 | 60 | 1 | (5 | ) | (19 | ) | ||||||||||||||||||||||
| GUATEMALA | 325 | 5 | 319 | 6 | 323 | 5 | 6 | 2 | ||||||||||||||||||||||||
| HONDURAS | 10 | 0 | 62 | 1 | 129 | 2 | (52 | ) | (119 | ) | ||||||||||||||||||||||
| JAMAICA | 23 | 0 | 29 | 1 | 38 | 1 | (6 | ) | (15 | ) | ||||||||||||||||||||||
| MEXICO | 656 | 11 | 639 | 12 | 803 | 12 | 17 | (147 | ) | |||||||||||||||||||||||
| PANAMA | 313 | 5 | 340 | 6 | 330 | 5 | (27 | ) | (17 | ) | ||||||||||||||||||||||
| PARAGUAY | 113 | 2 | 108 | 2 | 139 | 2 | 5 | (26 | ) | |||||||||||||||||||||||
| PERU | 346 | 6 | 148 | 3 | 158 | 2 | 198 | 188 | ||||||||||||||||||||||||
| TRINIDAD & TOBAGO | 166 | 3 | 177 | 3 | 182 | 3 | (11 | ) | (16 | ) | ||||||||||||||||||||||
| URUGUAY | 34 | 1 | 27 | 1 | 1 | 0 | 7 | 33 | ||||||||||||||||||||||||
| MULTILATERAL ORGANIZATIONS | 113 | 2 | 57 | 1 | 0 | 0 | 56 | 113 | ||||||||||||||||||||||||
| OTHER NON-LATAM (1) | 586 | 10 | 512 | 10 | 446 | 7 | 74 | 140 | ||||||||||||||||||||||||
| TOTAL CREDIT PORTFOLIO (2) | $ | 5,946 | 100 | % | $ | 5,320 | 100 | % | $ | 6,582 | 100 | % | $ | 626 | $ | (636 | ) | |||||||||||||||
| UNEARNED INTEREST AND DEFERRED FEES | (6 | ) | (7 | ) | (12 | ) | 1 | 6 | ||||||||||||||||||||||||
| TOTAL CREDIT PORTFOLIO, NET OF UNEARNED INTEREST & DEFERRED FEES | $ | 5,940 | $ | 5,313 | $ | 6,570 | $ | 627 | $ | (630 | ) | |||||||||||||||||||||
| (1) | Risk in highly rated countries outside the Region, mostly in Europe and North America, related to transactions carried out in the Region. |
| (2) | Includes gross loans (or the “Loan Portfolio”), securities at FVOCI and at amortized cost, gross of interest receivable and the allowance for expected credit losses, loan commitments and financial guarantee contracts, such as confirmed and stand-by letters of credit, and guarantees covering commercial risk; and other assets consisting of customers’ liabilities under acceptances. |
20
EXHIBIT IX
COMMERCIAL PORTFOLIO
DISTRIBUTION BY COUNTRY
(In US$ million)
| AT THE END OF, | ||||||||||||||||||||||||||||||||
| (A) | (B) | (C) | ||||||||||||||||||||||||||||||
| Dec. 31, 2020 | Sept. 30, 2020 | Dec. 31, 2019 | Change in Amount | |||||||||||||||||||||||||||||
| COUNTRY | Amount | % of Total Outstanding | Amount | % of Total Outstanding | Amount | % of Total Outstanding | (A) - (B) | (A) - (C) | ||||||||||||||||||||||||
| ARGENTINA | $ | 131 | 2 | $ | 146 | 3 | $ | 226 | 3 | $ | (15 | ) | $ | (95 | ) | |||||||||||||||||
| BOLIVIA | 15 | 0 | 8 | 0 | 7 | 0 | 7 | 8 | ||||||||||||||||||||||||
| BRAZIL | 1,022 | 18 | 888 | 17 | 1,065 | 16 | 134 | (43 | ) | |||||||||||||||||||||||
| CHILE | 542 | 10 | 504 | 10 | 683 | 11 | 38 | (141 | ) | |||||||||||||||||||||||
| COLOMBIA | 765 | 14 | 703 | 14 | 957 | 15 | 62 | (192 | ) | |||||||||||||||||||||||
| COSTA RICA | 203 | 4 | 178 | 3 | 280 | 4 | 25 | (77 | ) | |||||||||||||||||||||||
| DOMINICAN REPUBLIC | 219 | 4 | 194 | 4 | 306 | 5 | 25 | (87 | ) | |||||||||||||||||||||||
| ECUADOR | 211 | 4 | 174 | 3 | 427 | 7 | 37 | (216 | ) | |||||||||||||||||||||||
| EL SALVADOR | 41 | 1 | 46 | 1 | 60 | 1 | (5 | ) | (19 | ) | ||||||||||||||||||||||
| GUATEMALA | 325 | 6 | 319 | 6 | 323 | 5 | 6 | 2 | ||||||||||||||||||||||||
| HONDURAS | 10 | 0 | 62 | 1 | 129 | 2 | (52 | ) | (119 | ) | ||||||||||||||||||||||
| JAMAICA | 23 | 0 | 29 | 1 | 38 | 1 | (6 | ) | (15 | ) | ||||||||||||||||||||||
| MEXICO | 612 | 11 | 595 | 12 | 781 | 12 | 17 | (169 | ) | |||||||||||||||||||||||
| PANAMA | 303 | 5 | 332 | 7 | 294 | 5 | (29 | ) | 9 | |||||||||||||||||||||||
| PARAGUAY | 113 | 2 | 108 | 2 | 139 | 2 | 5 | (26 | ) | |||||||||||||||||||||||
| PERU | 320 | 6 | 136 | 3 | 158 | 2 | 184 | 162 | ||||||||||||||||||||||||
| TRINIDAD & TOBAGO | 166 | 3 | 177 | 3 | 182 | 3 | (11 | ) | (16 | ) | ||||||||||||||||||||||
| URUGUAY | 34 | 1 | 27 | 1 | 1 | 0 | 7 | 33 | ||||||||||||||||||||||||
| OTHER NON-LATAM (1) | 496 | 9 | 461 | 9 | 446 | 7 | 35 | 50 | ||||||||||||||||||||||||
| TOTAL COMMERCIAL PORTFOLIO (2) | $ | 5,551 | 100 | % | $ | 5,087 | 100 | % | $ | 6,502 | 100 | % | $ | 464 | ($ | 951 | ) | |||||||||||||||
| UNEARNED INTEREST AND DEFERRED FEES | (6 | ) | (7 | ) | (12 | ) | 1 | 6 | ||||||||||||||||||||||||
| TOTAL COMMERCIAL PORTFOLIO, NET OF UNEARNED INTEREST & DEFERRED FEES | $ | 5,545 | $ | 5,080 | $ | 6,490 | $ | 465 | $ | (945 | ) | |||||||||||||||||||||
| (1) | Risk in highly rated countries outside the Region, mostly in Europe and North America, related to transactions carried out in the Region. |
| (2) | Includes gross loans (or the “Loan Portfolio”), loan commitments and financial guarantee contracts, such as confirmed and stand-by letters of credit, and guarantees covering commercial risk; and other assets consisting of customers’ liabilities under acceptances. |
21
EXHIBIT X
INVESTMENT PORTFOLIO
DISTRIBUTION BY COUNTRY
(In US$ million)
| AT THE END OF, | ||||||||||||||||||||||||||||||||
| (A) | (B) | (C) | ||||||||||||||||||||||||||||||
| Dec. 31, 2020 | Sept. 30, 2020 | Dec. 31, 2019 | Change in Amount | |||||||||||||||||||||||||||||
| COUNTRY | Amount | % of Total Outstanding | Amount | % of Total Outstanding | Amount | % of Total Outstanding | (A) - (B) | (A) - (C) | ||||||||||||||||||||||||
| BRAZIL | $ | 41 | 10 | $ | 26 | 11 | $ | 2 | 2 | $ | 15 | $ | 39 | |||||||||||||||||||
| CHILE | 41 | 10 | 6 | 3 | 5 | 6 | 35 | 36 | ||||||||||||||||||||||||
| COLOMBIA | 30 | 8 | 30 | 13 | 15 | 19 | 0 | 15 | ||||||||||||||||||||||||
| MEXICO | 44 | 11 | 44 | 19 | 22 | 27 | 0 | 22 | ||||||||||||||||||||||||
| PANAMA | 10 | 3 | 8 | 4 | 36 | 45 | 2 | (26 | ) | |||||||||||||||||||||||
| PERU | 26 | 7 | 12 | 5 | 0 | 0 | 14 | 26 | ||||||||||||||||||||||||
| MULTILATERAL ORGANIZATIONS | 113 | 28 | 57 | 24 | 0 | 0 | 56 | 113 | ||||||||||||||||||||||||
| OTHER NON-LATAM (1) | 90 | 23 | 51 | 22 | 0 | 0 | 39 | 90 | ||||||||||||||||||||||||
| TOTAL INVESTMENT PORTOFOLIO (2) | $ | 395 | 100 | % | $ | 234 | 100 | % | $ | 80 | 100 | % | $ | 161 | $ | 315 | ||||||||||||||||
| (1) | Risk in highly rated countries outside the Region. |
| (2) | Includes securities at FVOCI and at amortized cost, gross of interest receivable and the allowance for losses. |
22
EXHIBIT XI
LOAN DISBURSEMENTS
DISTRIBUTION BY COUNTRY
(In US$ million)
| ANNUALLY | QUARTERLY | Change in Amount | ||||||||||||||||||||||||||||||
| COUNTRY | (A) 2020 | (B) 2019 | (C) 4Q20 | (D) 3Q20 | (E) 4Q19 | (A) - (B) | (C) - (D) | (C) - (E) | ||||||||||||||||||||||||
| ARGENTINA | $ | 22 | $ | 193 | $ | 1 | $ | 20 | $ | 0 | ($ | 171 | ) | $ | (19 | ) | $ | 1 | ||||||||||||||
| BOLIVIA | 12 | 7 | 7 | 5 | 2 | 5 | 2 | 5 | ||||||||||||||||||||||||
| BRAZIL | 1,076 | 1,194 | 366 | 373 | 415 | (118 | ) | (7 | ) | (49 | ) | |||||||||||||||||||||
| CHILE | 479 | 1,157 | 217 | 116 | 262 | (678 | ) | 101 | (45 | ) | ||||||||||||||||||||||
| COLOMBIA | 695 | 1,424 | 199 | 94 | 429 | (729 | ) | 105 | (230 | ) | ||||||||||||||||||||||
| COSTA RICA | 211 | 466 | 79 | 60 | 146 | (255 | ) | 19 | (67 | ) | ||||||||||||||||||||||
| DOMINICAN REPUBLIC | 503 | 556 | 97 | 199 | 127 | (53 | ) | (102 | ) | (30 | ) | |||||||||||||||||||||
| ECUADOR | 248 | 775 | 1 | 51 | 179 | (527 | ) | (50 | ) | (178 | ) | |||||||||||||||||||||
| EL SALVADOR | 67 | 126 | 10 | 20 | 29 | (59 | ) | (10 | ) | (19 | ) | |||||||||||||||||||||
| GUATEMALA | 306 | 490 | 84 | 111 | 159 | (184 | ) | (27 | ) | (75 | ) | |||||||||||||||||||||
| HONDURAS | 70 | 150 | 10 | 0 | 17 | (80 | ) | 10 | (7 | ) | ||||||||||||||||||||||
| JAMAICA | 177 | 291 | 35 | 43 | 134 | (114 | ) | (8 | ) | (99 | ) | |||||||||||||||||||||
| MEXICO | 2,148 | 3,666 | 534 | 472 | 892 | (1,518 | ) | 62 | (358 | ) | ||||||||||||||||||||||
| PANAMA | 614 | 611 | 172 | 108 | 165 | 3 | 64 | 7 | ||||||||||||||||||||||||
| PARAGUAY | 137 | 173 | 40 | 25 | 72 | (36 | ) | 15 | (32 | ) | ||||||||||||||||||||||
| PERU | 389 | 287 | 196 | 51 | 97 | 102 | 145 | 99 | ||||||||||||||||||||||||
| TRINIDAD & TOBAGO | 10 | 126 | 0 | 0 | 0 | (116 | ) | 0 | 0 | |||||||||||||||||||||||
| UNITED STATES | 115 | 0 | 115 | 0 | 0 | 115 | 115 | 115 | ||||||||||||||||||||||||
| URUGUAY | 59 | 25 | 0 | 0 | 1 | 34 | 0 | (1 | ) | |||||||||||||||||||||||
| OTHER NON-LATAM (1) | 716 | 439 | 90 | 167 | 286 | 277 | (77 | ) | (196 | ) | ||||||||||||||||||||||
| TOTAL LOAN DISBURSED (2) | $ | 8,054 | $ | 12,156 | $ | 2,253 | $ | 1,915 | $ | 3,412 | $ | (4,102 | ) | $ | 338 | $ | (1,159 | ) | ||||||||||||||
| (1) | Origination in highly rated countries outside the Region, mostly in Europe and North America, related to transactions carried out in the Region. |
| (2) | Total loan disbursed does not include loan commitments and financial guarantee contracts, nor other interest-earning assets such as investment securities. |
23

24