UNITED STATES
SECURITIES AND EXCHANGE COMMISSION
Washington, D.C. 20549
FORM 6-K
REPORT OF FOREIGN PRIVATE ISSUER
PURSUANT TO RULE 13a-16 OR 15d-16 UNDER THE
SECURITIES EXCHANGE ACT OF 1934
Long Form of Press Release
Commission File Number 1-11414
BANCO LATINOAMERICANO DE COMERCIO EXTERIOR, S.A.
(Exact name of Registrant as specified in its Charter)
FOREIGN TRADE BANK OF LATIN AMERICA, INC.
(Translation of Registrant’s name into English)
Business Park Torre V, Ave. La Rotonda, Costa del Este
P.O. Box 0819-08730
Panama City, Republic of Panama
(Address of Registrant’s Principal Executive Offices)
Indicate by check mark whether the registrant files or will file annual reports under cover of Form 20-F or Form 40-F.
Form 20-F x Form 40-F ¨
Indicate by check mark if the registrant is submitting the Form 6-K in paper as permitted by Regulation S-T Rule 101(b)(1):
Yes ¨ No x
Indicate by check mark if the registrant is submitting the Form 6-K in paper as permitted by Regulation S-T Rule 101(b)(7):
Yes ¨ No x
SIGNATURES
Pursuant to the requirements of the Securities Exchange Act of 1934, the registrant has duly caused this report to be signed on its behalf by the undersigned, thereunto duly authorized.
| Date: February 24, 2022 | ||
| FOREIGN TRADE BANK OF LATIN AMERICA, INC. | ||
| (Registrant) | ||
| By: | /s/ Ana Graciela de Méndez | |
| Name: | Ana Graciela de Méndez | |
| Title: | CFO |

BLADEX ANNOUNCES PROFIT FOR THE FOURTH QUARTER 2021 OF $20.1 MILLION, OR $0.54 PER SHARE
FULL-YEAR 2021 PROFIT OF $62.7 MILLION, OR $1.62 PER SHARE
PANAMA CITY, REPUBLIC OF PANAMA, February 22, 2022
Banco Latinoamericano de Comercio Exterior, S.A. (NYSE: BLX, “Bladex”, or “the Bank”), a Panama-based multinational bank originally established by the central banks of 23 Latin-American and Caribbean countries to promote foreign trade and economic integration in the Region, today announced its results for the Fourth Quarter (“4Q21”) and Full-Year (“FY21”) ended December 31, 2021.
The consolidated financial information in this document has been prepared in accordance with International Financial Reporting Standards (“IFRS”) as issued by the International Accounting Standards Board (“IASB”).
FINANCIAL SNAPSHOT
| (US$ million, except percentages and per share amounts) | 4Q21 | 3Q21 | 4Q20 | 2021 | 2020 | |||||||||||||||
| Key Income Statement Highlights | ||||||||||||||||||||
| Net Interest Income ("NII") | $ | 24.8 | $ | 22.1 | $ | 22.3 | $ | 86.8 | $ | 92.5 | ||||||||||
| Fees and commissions, net | $ | 6.2 | $ | 4.8 | $ | 2.8 | $ | 18.3 | $ | 10.4 | ||||||||||
| (Loss) gain on financial instruments, net | $ | (1.3 | ) | $ | (0.1 | ) | $ | (0.1 | ) | $ | (1.3 | ) | $ | (4.8 | ) | |||||
| Other income, net | $ | 0.1 | $ | 0.1 | $ | 0.2 | $ | 0.4 | $ | 1.1 | ||||||||||
| Total revenues | $ | 29.8 | $ | 26.8 | $ | 25.3 | $ | 104.2 | $ | 99.2 | ||||||||||
| (Provision for) reversal of credit losses | $ | (0.2 | ) | $ | (0.8 | ) | $ | 0.3 | $ | (2.3 | ) | $ | 1.5 | |||||||
| Gain on non-financial assets, net | $ | 0.7 | $ | 0.0 | $ | 0.3 | $ | 0.7 | $ | 0.3 | ||||||||||
| Operating expenses | $ | (10.3 | ) | $ | (10.3 | ) | $ | (10.2 | ) | $ | (39.9 | ) | $ | (37.3 | ) | |||||
| Profit for the period | $ | 20.1 | $ | 15.7 | $ | 15.7 | $ | 62.7 | $ | 63.6 | ||||||||||
| Profitability Ratios | ||||||||||||||||||||
| Earnings per Share ("EPS") (1) | $ | 0.54 | $ | 0.41 | $ | 0.40 | $ | 1.62 | $ | 1.60 | ||||||||||
| Return on Average Equity (“ROAE”) (2) | 7.9 | % | 6.1 | % | 6.1 | % | 6.1 | % | 6.2 | % | ||||||||||
| Return on Average Assets (“ROAA”) | 1.1 | % | 0.9 | % | 1.0 | % | 0.9 | % | 1.0 | % | ||||||||||
| Net Interest Margin ("NIM") (3) | 1.42 | % | 1.33 | % | 1.37 | % | 1.32 | % | 1.41 | % | ||||||||||
| Net Interest Spread ("NIS") (4) | 1.26 | % | 1.17 | % | 1.17 | % | 1.15 | % | 1.13 | % | ||||||||||
| Efficiency Ratio (5) | 34.6 | % | 38.5 | % | 40.2 | % | 38.3 | % | 37.6 | % | ||||||||||
| Assets, Capital, Liquidity & Credit Quality | ||||||||||||||||||||
| Credit Portfolio (6) | $ | 7,365 | $ | 6,956 | $ | 5,946 | $ | 7,365 | $ | 5,946 | ||||||||||
| Commercial Portfolio (7) | $ | 6,540 | $ | 6,188 | $ | 5,551 | $ | 6,540 | $ | 5,551 | ||||||||||
| Investment Portfolio | $ | 825 | $ | 768 | $ | 395 | $ | 825 | $ | 395 | ||||||||||
| Total assets | $ | 8,038 | $ | 6,977 | $ | 6,289 | $ | 8,038 | $ | 6,289 | ||||||||||
| Total equity | $ | 992 | $ | 1,013 | $ | 1,038 | $ | 992 | $ | 1,038 | ||||||||||
| Market capitalization (8) | $ | 601 | $ | 667 | $ | 628 | $ | 601 | $ | 628 | ||||||||||
| Tier 1 Capital to risk-weighted assets (Basel III – IRB) (9) | 19.1 | % | 21.3 | % | 26.0 | % | 19.1 | % | 26.0 | % | ||||||||||
| Capital Adequacy Ratio (Regulatory) (10) | 15.6 | % | 16.9 | % | 20.2 | % | 15.6 | % | 20.2 | % | ||||||||||
| Total assets / Total equity (times) | 8.1 | 6.9 | 6.1 | 8.1 | 6.1 | |||||||||||||||
| Liquid Assets / Total Assets (11) | 17.5 | % | 11.9 | % | 16.7 | % | 17.5 | % | 16.7 | % | ||||||||||
| Credit-impaired loans to Loan Portfolio (12) | 0.2 | % | 0.2 | % | 0.2 | % | 0.2 | % | 0.2 | % | ||||||||||
| Total allowance for losses to Credit Portfolio (13) | 0.6 | % | 0.7 | % | 0.7 | % | 0.6 | % | 0.7 | % | ||||||||||
| Total allowance for losses to credit-impaired loans (times) (13) | 4.4 | 4.4 | 4.2 | 4.4 | 4.2 |
BUSINESS HIGHLIGHTS
| • | Bladex’s Profit for 4Q21 totaled $20.1 million (+28% QoQ; +27% YoY), as Net Interest Income (“NII”) and fee income improved, and operating expenses remained relatively stable. |
| • | The Bank’s Profit for FY21 reached $62.7 million, nearly stable versus FY20 (-1% YoY), as higher top-line revenues (up 5% YoY) from net positive effect in volumes, and increased fee income generation (+76% YoY), nearly offset the impact of lower market rates, higher credit provision charges mainly associated to the Bank’s credit growth, and increased operating expenses back to pre-pandemic levels. |
| • | NII continued its quarterly growth trend, up 12% QoQ and 11% YoY, to $24.8 million for 4Q21, mainly driven by an improved portfolio mix with higher average lending and investment volumes and higher lending spreads. FY21 NII was down 6% YoY due to the net rate effect of lower market base rates on the Bank’s assets and liabilities, partly offset by higher average credit portfolio balances and improved interest-earning assets mix. |
| • | Fees and commissions income increased 31% QoQ and 123% to $6.2 million in 4Q21, and up 76% YoY to $18.3 million for FY21, due to the improved activity in its transaction-based structuring and syndications business and sustained results in the Bank’s letters of credit business. |
| • | The Bank’s Credit Portfolio continued its quarterly growth trend (+6% QoQ and +24% YoY) to reach $7.4 billion as of December 31, 2021, propelled by higher lending origination (+29% QoQ; +80% YoY) and a threefold YoY increase in its portfolio of credit investment securities to complement the Bank’s lending business. |
| • | The solid Commercial Portfolio’s growth trend, reaching $6.5 billion at 4Q21 (+6% QoQ; +18% YoY), remained centered on diversification across the Region and high-quality borrowers, evidenced by the successful collection of all scheduled loan maturities, as well as the short-term nature of its business (75% maturing in less than a year). |
| • | Bladex’s asset quality remained pristine with credit-impaired loans (“NPLs”) unchanged at $11 million or 0.2% of total Loan Portfolio as of December 31, 2021. Credits categorized as Stage 2 under IFRS 9 (with increased risk since origination) represented 2% of total credits, down from 3% and 6% a quarter and year ago, respectively, with the remaining 98% categorized as Stage 1 or low-risk credits. |
| • | As of December 31, 2021, the total allowance for credit losses increased to $47.1 million, representing 4.4 times NPL balances. Provision for credit losses of $2.3 million in FY21 was mostly associated to the Bank’s credit growth. |
| • | Bladex´s liquidity position stood at $1.4 billion, or 17% of total assets as of December 31, 2021, led by its resilient level of deposits and well diversified funding structure, favoring its ample access to capital markets. |
| • | As of December 31, 2021, the Bank´s capitalization remained solid with a Tier 1 Basel III Capital Ratio of 19.1% and a Regulatory Capital Adequacy Ratio of 15.6%. Equity levels were down (-2% QoQ; -4% YoY) mainly due to the completion of the Bank’s open market stock repurchase program for a total of $60 million, under which 3.6 million shares were repurchased at a volume-weighted average price per share of $16.86, since its launching in mid-May of 2021. |

CEO’s Comments
Mr. Jorge Salas, Bladex’s Chief Executive Officer said: “Fourth quarter results have been the best since the onset of the pandemic. Top-line revenues were positively impacted by higher lending spreads and volumes, coupled with a solid performance in fee income, having consolidated the reactivation of our syndication business with two new structured transactions closed during the quarter and a record-year performance in our letters of credit business. Meanwhile, operating expenses and credit quality remained under control.”
Mr. Salas added: “Our Credit Portfolio continued its growth trend for the sixth consecutive quarter, as disbursements reached their highest level in more than three years, and the investment portfolio increased by another 10%. Overall, interest-earning assets surpassed pre-pandemic levels by 9%, financed by a stable and well diversified funding base. During the fourth quarter, Bladex successfully completed a new debt placement in the Mexican market for MXN 3,000 million (approximately USD 150 million), which was considerably oversubscribed and followed by a reopening for a similar amount in late January of 2022. The Bank remains very active in the global debt/syndicated and capital markets; with these resources Bladex is well prepared to satisfy the needs of its client base while maintaining a cost-efficient and resilient funding base.”
Mr. Salas concluded: “During the quarter, Bladex completed its open market stock repurchase program for a total of $60 million, through which a total of 3.6 million Class E common shares were repurchased at prevailing market prices. In addition, the Board recently declared a quarterly dividend of $0.25 per share, representing 46% of fourth quarter earnings. Solid capitalization continues to be a fundamental component for the Bank’s future growth opportunities in a post-pandemic environment. Looking ahead, we cautiously believe Bladex is positioned to tackle the current environment, particularly as it relates to raising interest rates both in the U.S. and in the Latin American Region.”
RESULTS BY BUSINESS SEGMENT
The Bank’s activities are managed and executed through two business segments, Commercial and Treasury. Information related to each reportable segment is set out below. Business segment results are based on the Bank’s managerial accounting process, which assigns assets, liabilities, revenue, and expense items to each business segment on a systemic basis.
COMMERCIAL BUSINESS SEGMENT
The Commercial Business Segment encompasses the Bank’s core business of financial intermediation and fee generation activities developed to cater to corporations, financial institutions, and investors in Latin America. These activities include the origination of bilateral short-term and medium-term loans, structured and syndicated credits, loan commitments, and financial guarantee contracts such as issued and confirmed letters of credit, stand-by letters of credit, guarantees covering commercial risk, and other assets consisting of customers’ liabilities under acceptances.
Profits from the Commercial Business Segment include (i) net interest income from loans; (ii) fees and commissions from the issuance, confirmation and negotiation of letters of credit, guarantees and loan commitments, as well as through loan structuring and syndication activities; (iii) gain on sale of loans generated through loan intermediation activities, such as sales and distribution in the primary market; (iv) gain (loss) on sale of financial instruments measured at FVTPL; (v) reversal (provision) for credit losses, (vi) gain (loss) on non-financial assets; and (vii) direct and allocated operating expenses.
| 3 |

Bladex’s high-quality and diversified Commercial Portfolio maintained its persistent quarterly growth trend, reaching $6.5 billion at the end of 4Q21, a 6% QoQ increase compared to $6.2 billion a quarter ago, and a 18% YoY increase compared to $5.6 billion a year ago. On an average basis, Commercial Portfolio balances reached $6.2 billion for the 4Q21 (+4% QoQ; +20% YoY) and $5.9 billion for FY21 (+10% YoY). The increased levels of EoP balances and average volumes were driven by higher lending origination (+29% QoQ; +80% YoY), as the Bank continues to collect all scheduled loan maturities, evidencing the high quality of the Bank’s borrower base and short-term nature of its business.
As of December 31, 2021, 75% of the Commercial Portfolio was scheduled to mature within a year, down 2 pp compared from the previous quarter and stable from a year ago. Trade finance transactions represented 64% of the short-term origination, down 5 pp compared to a quarter ago and up 7 pp compared to a year ago.
The following graphs illustrate the geographic distribution of the Bank’s Commercial Portfolio, highlighting the portfolio´s risk diversification by country and across industry segments, as of December 31, 2021:
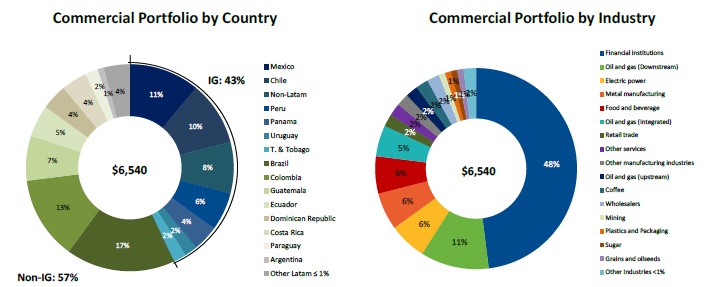
| 4 |
Bladex’s credit quality remains sound with a well-diversified exposure across countries. As of December 31, 2021, 43% of the Commercial Portfolio was geographically distributed in investment grade countries, down 3 pp from the previous quarter, but still centered on preserving sound credit quality through well diversified exposures with top-tier clients across the Region, and down 16 pp from a year ago, which is mostly explained by the Bank´s conservative decision to classify Colombia as non-investment grade following the downgrades by two of the three main credit rating agencies. Brazil continues to represent the largest country-risk exposure at 17% of the total Commercial Portfolio, of which 75% was with financial institutions. Other relevant country-risk exposures were Colombia at 13% and investment grade countries such as Mexico at 11%, Chile at 10% and top-rated countries outside of Latin America (which relates to transactions carried out in Latin America) at 8% of the total portfolio.
The Commercial Portfolio by industries also remained well-diversified and focused on high quality borrowers, as exposure to the Bank’s traditional client base of financial institutions represented 48% of the total Commercial Portfolio, and exposure to sovereign and state-owned corporations remained at 17% of the total portfolio at the end of 4Q21. The remaining of the portfolio comprises top tier corporates throughout the Region, well diversified across sectors, in which most industries represented 5% or less of the total Commercial Portfolio, except for certain sectors that the Bank considers strategic supported by higher commodity prices and LatAm trade flows, such as Oil & Gas (Downstream) at 11% and Electric power, Metal manufacturing and Food and beverage, each at 6% of the Commercial Portfolio at the end of 4Q21.
Refer to Exhibit IX for additional information related to the Bank’s Commercial Portfolio distribution by country, and Exhibit XI for the Bank’s distribution of loan disbursements by country.
| (US$ million) | 4Q21 | 3Q21 | 4Q20 | QoQ (%) | YoY (%) | 2021 | 2020 | YoY (%) | ||||||||||||||||||
| Commercial Business Segment: | ||||||||||||||||||||||||||
| Net interest income | $ | 23.3 | $ | 21.3 | $ | 21.0 | 9 | % | 11 | % | $ | 83.8 | $ | 87.9 | -5 | % | ||||||||||
| Other income | 6.5 | 4.9 | 3.1 | 32 | % | 109 | % | 19.2 | 8.6 | 123 | % | |||||||||||||||
| Total revenues | 29.8 | 26.2 | 24.1 | 14 | % | 23 | % | 103.0 | 96.5 | 7 | % | |||||||||||||||
| (Provision for) reversal of credit losses | (0.2 | ) | 0.1 | 0.5 | -239 | % | -130 | % | (1.1 | ) | 1.9 | -156 | % | |||||||||||||
| Gain on non-financial assets, net | 0.7 | 0.0 | 0.3 | n.m. | 151 | % | 0.7 | 0.3 | 151 | % | ||||||||||||||||
| Operating expenses | (7.8 | ) | (7.9 | ) | (7.9 | ) | 0 | % | 1 | % | (30.8 | ) | (28.0 | ) | -10 | % | ||||||||||
| Profit for the segment | $ | 22.5 | $ | 18.5 | $ | 17.1 | 22 | % | 32 | % | $ | 71.9 | $ | 70.7 | 2 | % | ||||||||||
| "n.m." means not meaningful. | ||||||||||||||||||||||||||
The Commercial Business Segment’s Profit was $22.5 million for 4Q21 (+22% QoQ; +32% YoY). The increases were mostly attributable to improved total revenues (+14% QoQ; +23% YoY) on higher NII mainly driven by an improved portfolio mix with higher average lending and investment volumes and higher lending spreads, coupled with the improved activity in its transaction-based structuring and syndications business and the sustained results in the Bank’s letters of credit business. In addition, the Commercial Business reported a $0.7 million gain on non-financial assets in 4Q21, resulting from the renegotiation of the Bank’s Head Office lease agreement.
FY21 Commercial Business Segment’s Profit totaled $71.9 million (+2% YoY), as the more than doubled other income (+123% YoY) on increased fees and commissions income from the Bank’s improved transaction-based structuring and syndications activity (+$3.7 million) and strong letters of credit business (+35% YoY), offset the 5% YoY decrease in NII primarily impacted by lower market base rates, and the $1.1 million provision charge for credit losses associated to portfolio growth, which compares to $1.9 million reversals in FY20.
| 5 |
TREASURY BUSINESS SEGMENT
The Treasury Business Segment focuses on managing the Bank’s investment portfolio and the overall structure of its assets and liabilities to achieve more efficient funding and liquidity positions for the Bank, mitigating the traditional financial risks associated with the balance sheet, such as interest rate, liquidity, price and currency risks. Interest-earning assets managed by the Treasury Business Segment include liquidity positions in cash and cash equivalents, as well as highly liquid corporate debt securities rated above ‘A-‘, and financial instruments related to the investment management activities, consisting of securities at fair value through other comprehensive income (“FVOCI”) and securities at amortized cost (the “Investment Portfolio”). The Treasury Business Segment also manages the Bank’s interest-bearing liabilities, which constitute its funding sources, mainly deposits, short- and long-term borrowings and debt.
Profits from the Treasury Business Segment include net interest income derived from the above-mentioned Treasury assets and liabilities, and related net other income (net results from derivative financial instruments and foreign currency exchange, gain (loss) per financial instruments at fair value through profit or loss (“FVTPL”), gain (loss) on sale of securities at FVOCI, and other income), recovery or impairment loss on financial instruments, and direct and allocated operating expenses.
The Bank’s liquid assets, mostly consisting of cash and due from banks, as well as highly rated corporate debt securities (above ‘A-‘) aimed to enhance liquidity yields, totaled $1.4 billion at the end of 4Q21, up from $0.8 billion a quarter ago and $1.0 billion a year ago, as the Bank increased its liquidity position led by its resilient level of deposits and well diversified funding structure, favoring most recently its ample access to capital markets. As of December 31, 2021, $1,201 million, or 86% of total liquid assets represented deposits placed with the Federal Reserve Bank of New York, while $194 million, or 14% of total liquid assets represented corporate debt securities classified as high quality liquid assets (“HQLA”) in accordance with the specifications of the Basel Committee. As of the end of 4Q21, 3Q21, and 4Q20, liquidity balances to total assets represented 17%, 12% and 17%, respectively, while the liquidity balances to total deposits ratio was 46%, 24% and 33%, respectively.
The credit investment portfolio, related to the Treasury’s investment management activities aimed to complement the Bank’s Commercial Portfolio, increased to $631 million at the end of 4Q21, a 10% increase compared to $573 million a quarter ago and more than three times higher compared to $193 million a year ago. Consequently, the Bank’s total Investment Portfolio amounted to $825 million as of December 31, 2021, mostly consisting of readily-quoted U.S., Latin American and Multilateral securities, up 7% from $768 million a quarter ago, and more than two times higher from $395 million a year ago. Refer to Exhibit X for a per-country risk distribution of the Investment Portfolio.
On the funding side, deposit balances remained above $3.0 billion at the end of 4Q21, but down 10% QoQ and 3% YoY. The resilient level and importance of the Bank’s deposit base enhances the significance of its Yankee CD program, which complements the short-term funding structure, and the steady support from the Bank’s Class A shareholders (i.e.: central banks and their designees), which represented 49% of total deposits at the end of 4Q21, compared to 47% and 50% of total deposits a quarter and year ago, respectively. As of December 31, 2021, total deposits represented 45% of total funding sources, compared to 60% the previous quarter and 61% a year ago, as the Bank relies on its well diversified funding structure, and most recently favoring its ample access to capital markets. In turn, funding through securities sold under repurchase agreements (“Repos”) increased to $428 million at the end of 4Q21 (+29% QoQ and +$417 million YoY), and short- and medium-term borrowings and debt totaled $3.3 billion at the end of 4Q21 (+69% QoQ and +67% YoY). Weighted average funding costs resulted in 0.95% for 4Q21 (+5 bps QoQ; -16 bps YoY) and 0.96% in FY21 (-63 bps YoY). The quarterly increase is mostly attributed to higher borrowings and debt average balances, while the year-to-date funding cost reduction continued benefiting from the impact of lower market rates, as well as lower spreads paid on funding.
| 6 |
| (US$ million) | 4Q21 | 3Q21 | 4Q20 | QoQ (%) | YoY (%) | 2021 | 2020 | YoY (%) | ||||||||||||||||||||||||
| Treasury Business Segment: | ||||||||||||||||||||||||||||||||
| Net interest income | $ | 1.5 | $ | 0.8 | $ | 1.3 | 91 | % | 18 | % | $ | 3.0 | $ | 4.5 | -34 | % | ||||||||||||||||
| Other income (expense) | (1.5 | ) | (0.2 | ) | (0.1 | ) | -696 | % | -1148 | % | (1.8 | ) | (1.9 | ) | 7 | % | ||||||||||||||||
| Total revenues | 0.0 | 0.6 | 1.2 | -97 | % | -98 | % | 1.2 | 2.6 | -54 | % | |||||||||||||||||||||
| Provision for credit losses | (0.0 | ) | (0.9 | ) | (0.2 | ) | 99 | % | 94 | % | (1.3 | ) | (0.4 | ) | -201 | % | ||||||||||||||||
| Operating expenses | (2.5 | ) | (2.5 | ) | (2.3 | ) | -1 | % | -9 | % | (9.2 | ) | (9.3 | ) | 1 | % | ||||||||||||||||
| Loss for the segment | $ | (2.5 | ) | $ | (2.7 | ) | $ | (1.3 | ) | 10 | % | -87 | % | $ | (9.2 | ) | $ | (7.1 | ) | -30 | % | |||||||||||
The Treasury Business Segment’s results were a $2.5 million loss for 4Q21 (+10% QoQ; -87% YoY) and a $9.2 million loss for FY21 (-30% YoY). 4Q21 loss was mainly impacted by higher losses from financial instruments related to ineffectiveness from its hedging derivatives position. Annual FY21 loss was mainly associated to lower NII on lower market base rates and a conservative liquidity gap position, and higher provision for credit losses due to the significant increase in the Investment Portfolio.
NET INTEREST INCOME AND MARGINS
| (US$ million, except percentages) | 4Q21 | 3Q21 | 4Q20 | QoQ (%) | YoY (%) | 2021 | 2020 | YoY (%) | ||||||||||||||||||||||||
| Net Interest Income | ||||||||||||||||||||||||||||||||
| Interest income | $ | 39.0 | $ | 34.8 | $ | 37.8 | 12 | % | 3 | % | $ | 140.9 | $ | 181.0 | -22 | % | ||||||||||||||||
| Interest expense | (14.2 | ) | (12.7 | ) | (15.5 | ) | -12 | % | 8 | % | (54.1 | ) | (88.5 | ) | 39 | % | ||||||||||||||||
| Net Interest Income ("NII") | $ | 24.8 | $ | 22.1 | $ | 22.3 | 12 | % | 11 | % | $ | 86.8 | $ | 92.5 | -6 | % | ||||||||||||||||
| Net Interest Spread ("NIS") | 1.26 | % | 1.17 | % | 1.17 | % | 8 | % | 8 | % | 1.15 | % | 1.13 | % | 1 | % | ||||||||||||||||
| Net Interest Margin ("NIM") | 1.42 | % | 1.33 | % | 1.37 | % | 7 | % | 4 | % | 1.32 | % | 1.41 | % | -7 | % | ||||||||||||||||
NII totaled $24.8 million for 4Q21 (+12% QoQ; +11% YoY), mainly driven by an improved portfolio mix with higher average lending and investment volumes, with reduced cash levels, and a quarterly net positive rate effect, mainly on higher average lending rates (+14 bps QoQ).
For FY21, NII decreased 6% YoY to $86.8 million, due to the net rate effect of lower market base rates on the Bank’s assets and liabilities, partly offset by higher average credit portfolio balances and improved interest-earning assets mix – with increased average loans and investments and decreased low-yielding average liquidity balances, with cash balances mostly invested in the Federal Reserve Bank of New York.
| 7 |
FEES AND COMMISSIONS
Fees and Commissions, net, includes the fee income associated with letters of credit and the fee income derived from loan structuring and syndication activities, together with loan intermediation and distribution activities in the primary market, and other commissions, mostly from other contingent credits, such as guarantees and credit commitments, net of fee expenses.
| (US$ million) | 4Q21 | 3Q21 | 4Q20 | QoQ (%) | YoY (%) | 2021 | 2020 | YoY (%) | ||||||||||||||||||||||||
| Letters of credit fees | 3.1 | 3.1 | 2.5 | 3 | % | 27 | % | 12.1 | 9.0 | 35 | % | |||||||||||||||||||||
| Loan syndication fees | 2.4 | 1.3 | 0.1 | 84 | % | 2621 | % | 4.3 | 0.6 | 607 | % | |||||||||||||||||||||
| Other commissions, net | 0.7 | 0.4 | 0.2 | 78 | % | 178 | % | 1.9 | 0.8 | 134 | % | |||||||||||||||||||||
| Fees and Commissions, net | $ | 6.2 | $ | 4.8 | $ | 2.8 | 31 | % | 123 | % | $ | 18.3 | $ | 10.4 | 76 | % |
Fees and Commissions income increased to $6.2 million for 4Q21 (+31% QoQ and +123% YoY) and to $18.3 million for the FY21 (+76%), as the Bank experienced improved activity in its transaction-based structuring and syndications business, coupled with the sustained results in the Bank’s letters of credit business.
PORTFOLIO QUALITY AND TOTAL ALLOWANCE FOR CREDIT LOSSES
| (US$ million, except percentages) | 31-Dec-21 | 30-Sep-21 | 30-Jun-21 | 31-Mar-21 | 31-Dec-20 | |||||||||||||||
| Allowance for loan losses | ||||||||||||||||||||
| Balance at beginning of the period | $ | 41.4 | $ | 41.4 | $ | 41.1 | $ | 41.2 | $ | 42.5 | ||||||||||
| Provisions (reversals) | 0.1 | 0.0 | 0.1 | (0.1 | ) | (1.3 | ) | |||||||||||||
| Write-offs, net of recoveries | 0.0 | 0.0 | 0.2 | 0.0 | 0.0 | |||||||||||||||
| End of period balance | $ | 41.5 | $ | 41.4 | $ | 41.4 | $ | 41.1 | $ | 41.2 | ||||||||||
| Allowance for loan commitments and financial guarantee contract losses | ||||||||||||||||||||
| Balance at beginning of the period | $ | 3.7 | $ | 3.8 | $ | 2.9 | $ | 2.9 | $ | 2.1 | ||||||||||
| (Reversals) provisions | 0.1 | (0.1 | ) | 0.9 | 0.0 | 0.8 | ||||||||||||||
| End of period balance | $ | 3.8 | $ | 3.7 | $ | 3.8 | $ | 2.9 | $ | 2.9 | ||||||||||
| Allowance for Investment Portfolio losses | ||||||||||||||||||||
| Balance at beginning of the period | $ | 1.8 | $ | 0.9 | $ | 0.6 | $ | 0.5 | $ | 0.3 | ||||||||||
| Provisions (reversals) | 0.0 | 0.9 | 0.3 | 0.1 | 0.2 | |||||||||||||||
| End of period balance | $ | 1.8 | $ | 1.8 | $ | 0.9 | $ | 0.6 | $ | 0.5 | ||||||||||
| Total allowance for losses | $ | 47.1 | $ | 46.9 | $ | 46.1 | $ | 44.6 | $ | 44.6 | ||||||||||
| Total allowance for losses to Credit Portfolio | 0.6 | % | 0.7 | % | 0.7 | % | 0.7 | % | 0.7 | % | ||||||||||
| Credit-impaired loans to Loan Portfolio | 0.2 | % | 0.2 | % | 0.2 | % | 0.2 | % | 0.2 | % | ||||||||||
| Total allowance for losses to credit-impaired loans (times) | 4.4 | 4.4 | 4.4 | 4.2 | 4.2 | |||||||||||||||
| Stage 1 (low risk) to Total Credit Portfolio | 98 | % | 97 | % | 96 | % | 95 | % | 94 | % | ||||||||||
| Stage 2 (increased risk) to Total Credit Portfolio | 2 | % | 3 | % | 4 | % | 5 | % | 6 | % | ||||||||||
| Stage 3 (credit impaired) to Total Credit Portfolio | 0 | % | 0 | % | 0 | % | 0 | % | 0 | % | ||||||||||
| 8 |
As of December 31, 2021, the total allowance for credit losses increased to $47.1 million, representing a coverage ratio to the Credit Portfolio of 0.6%, compared to $46.9 million, or 0.7%, at the end of 3Q21 and compared to $44.6 million, or 0.7%, at the end of 4Q20. The allowance increase was mostly related to provisions for credit losses associated to the growth of the Credit Portfolio, as balances increased 6% QoQ and 24% YoY at the end of 4Q21.
The Bank’s asset quality remained pristine with credit-impaired loans (“NPL”) unchanged at $11 million, or 0.2% of the total Loan Portfolio as of December 31, 2021. Credits categorized as Stage 2 under IFRS 9 (with increased risk since origination) represented 2% of total credits, down from 3% and 6% a quarter and year ago, respectively, with the remaining 98% categorized as Stage 1 or low-risk credits.
OPERATING EXPENSES
| (US$ million, except percentages) | 4Q21 | 3Q21 | 4Q20 | QoQ (%) | YoY (%) | 2021 | 2020 | YoY (%) | ||||||||||||||||||||||||
| Operating expenses | ||||||||||||||||||||||||||||||||
| Salaries and other employee expenses | 4.9 | 6.0 | 5.7 | -18 | % | -14 | % | 21.7 | 21.5 | 1 | % | |||||||||||||||||||||
| Depreciation of investment property, equipment and improvements | 0.6 | 0.6 | 0.9 | -1 | % | -30 | % | 2.7 | 3.6 | -23 | % | |||||||||||||||||||||
| Amortization of intangible assets | 0.1 | 0.1 | 0.2 | 20 | % | -38 | % | 0.7 | 0.8 | -1 | % | |||||||||||||||||||||
| Other expenses | 4.7 | 3.7 | 3.4 | 29 | % | 37 | % | 14.8 | 11.5 | 28 | % | |||||||||||||||||||||
| Total Operating Expenses | $ | 10.3 | $ | 10.3 | $ | 10.2 | 0 | % | 2 | % | $ | 39.9 | $ | 37.3 | 7 | % | ||||||||||||||||
| Efficiency Ratio | 34.6 | % | 38.5 | % | 40.2 | % | 38.3 | % | 37.6 | % |
The Bank’s 4Q21 and FY21 operating expenses totaled $10.3 million (stable QoQ; +2% YoY) and $39.9 million (+7% YoY), respectively. The YoY increases were mostly related to reduced expenses in the comparable periods, as cost saving measures were implemented at the onset of Covid-19.
The Bank’s Efficiency Ratio improved to 34.6% in 4Q21, due to higher total revenues, as operating expenses remained stable. FY21 Efficiency Ratio stood at 38.3%, compared to 37.6% a year ago, as the 5% improvement in total revenues was offset by the 7% increase in operating expenses back to pre-pandemic levels.
CAPITAL RATIOS AND CAPITAL MANAGEMENT
The following table shows capital amounts and ratios as of the dates indicated:
| (US$ million, except percentages and shares outstanding) | 31-Dec-21 | 30-Sep-21 | 31-Dec-20 | QoQ (%) | YoY (%) | |||||||||||||||
| Total equity | $ | 992 | $ | 1,013 | $ | 1,038 | -2 | % | -4 | % | ||||||||||
| Tier 1 capital to risk weighted assets (Basel III – IRB) (9) | 19.1 | % | 21.3 | % | 26.0 | % | -10 | % | -26 | % | ||||||||||
| Risk-Weighted Assets (Basel III – IRB) (9) | $ | 5,189 | $ | 4,749 | $ | 3,995 | 9 | % | 30 | % | ||||||||||
| Capital Adequacy Ratio (Regulatory) (10) | 15.6 | % | 16.9 | % | 20.2 | % | -8 | % | -23 | % | ||||||||||
| Risk-Weighted Assets (Regulatory) (10) | $ | 6,513 | $ | 6,107 | $ | 5,187 | 7 | % | 26 | % | ||||||||||
| Total assets / Total equity (times) | 8.1 | 6.9 | 6.1 | 18 | % | 34 | % | |||||||||||||
| Shares outstanding (in thousand) | 36,231 | 38,017 | 39,678 | -5 | % | -9 | % | |||||||||||||
9
The Bank’s equity consists entirely of issued and fully paid ordinary common stock. As of December 31, 2021, the Bank’s common shares outstanding decreased 5% QoQ and 9% YoY to 36.2 million, mainly due to the completion of the Bank’s open market stock repurchase program for a total of $60 million, under which 3.6 million shares repurchased at a volume-weighted average price per share of $16.86, since its launching in mid-May of 2021. Consequently, the Bank’s total equity also decreased 2% QoQ and 4% YoY to reach $992 million as of December 31, 2021.
As of December 31, 2021, the Bank’s ratio of total assets to total equity stood at 8.1 times, and the Bank’s Tier 1 Basel III Capital Ratio stood at 19.1%, in which risk-weighted assets are calculated under the advanced internal ratings-based approach (IRB) for credit risk. In addition, the Bank’s Capital Adequacy Ratio, as defined by Panama’s banking regulator, was 15.6% as of December 31, 2021, well above the required minimum of 8%. Under this methodology, credit risk-weighted assets are calculated under Basel’s standardized approach.
RECENT EVENTS
| § | Quarterly dividend payment: The Board approved a quarterly common dividend of $0.25 per share corresponding to the fourth quarter 2021. The cash dividend will be paid on March 22, 2022, to shareholders registered as of March 7, 2022. |
| § | Stock Repurchase Program: On January 4, 2022, the Bank announced the completion of its $60 million common stock repurchase program authorized by the Bank’s Board of Directors and announced on May 5, 2021 (“the Program”), under which 3.6 million shares were repurchased with an approximate volume-weighted average price per share of $16.86. |
Notes:
| - | Numbers and percentages set forth in this earnings release have been rounded and accordingly may not total exactly. |
| - | QoQ and YoY refer to quarter-on-quarter and year-on-year variations, respectively. |
Footnotes:
| 1) | Earnings per Share (“EPS”) calculation is based on the average number of shares outstanding during each period. |
| 2) | ROAE refers to return on average stockholders’ equity which is calculated on the basis of unaudited daily average balances. |
| 3) | NIM refers to net interest margin which constitutes to Net Interest Income (“NII”) divided by the average balance of interest-earning assets. |
| 4) | NIS refers to net interest spread which constitutes the average yield earned on interest-earning assets, less the average yield paid on interest-bearing liabilities. |
| 5) | Efficiency Ratio refers to consolidated operating expenses as a percentage of total revenues. |
| 6) | The Bank’s “Credit Portfolio” includes gross loans at amortized cost (or the “Loan Portfolio”), securities at FVOCI and at amortized cost, gross of interest receivable and the allowance for expected credit losses, loan commitments and financial guarantee contracts, such as confirmed and stand-by letters of credit, and guarantees covering commercial risk; and other assets consisting of customers’ liabilities under acceptances. |
| 7) | The Bank’s “Commercial Portfolio” includes gross loans at amortized cost (or the “Loan Portfolio”), loan commitments and financial guarantee contracts, such as issued and confirmed letters of credit, stand-by letters of credit, guarantees covering commercial risk and other assets consisting of customers’ liabilities under acceptances. |
| 8) | Market capitalization corresponds to total outstanding common shares multiplied by market close price at the end of each corresponding period. |
10
| 9) | Tier 1 Capital ratio is calculated according to Basel III capital adequacy guidelines, and as a percentage of risk-weighted assets. Risk-weighted assets are estimated based on Basel III capital adequacy guidelines, utilizing internal-ratings based approach or “IRB” for credit risk and standardized approach for operational risk. |
| 10) | As defined by the Superintendency of Banks of Panama through Rules No. 01-2015 and 03-2016, based on Basel III standardized approach. The capital adequacy ratio is defined as the ratio of capital funds to risk-weighted assets, rated according to the asset’s categories for credit risk. In addition, risk-weighted assets consider calculations for market risk and operating risk. |
| 11) | Liquid assets refer to total cash and cash equivalents, consisting of cash and due from banks and interest-bearing deposits in banks, excluding pledged deposits and margin calls; as well as highly rated corporate debt securities (above ‘A-‘). Liquidity ratio refers to liquid assets as a percentage of total assets. |
| 12) | Loan Portfolio refers to gross loans at amortized cost, excluding interest receivable, the allowance for loan losses, and unearned interest and deferred fees. Credit-impaired loans are also commonly referred to as Non-Performing Loans or NPLs. |
| 13) | Total allowance for losses refers to allowance for loan losses plus allowance for loan commitments and financial guarantee contract losses and allowance for investment securities losses. |
SAFE HARBOR STATEMENT
This press release contains forward-looking statements of expected future developments within the meaning of the Private Securities Litigation Reform Act of 1995 and Section 21E of the Securities Exchange Act of 1934. Forward-looking statements can be identified by words such as: “anticipate”, “intend”, “plan”, “goal”, “seek”, “believe”, “project”, “estimate”, “expect”, “strategy”, “future”, “likely”, “may”, “should”, “will” and similar references to future periods. The forward-looking statements in this press release include the Bank’s financial position, asset quality and profitability, among others. These forward-looking statements reflect the expectations of the Bank’s management and are based on currently available data; however, actual performance and results are subject to future events and uncertainties, which could materially impact the Bank’s expectations. Among the factors that can cause actual performance and results to differ materially are as follows: the coronavirus (COVID-19) pandemic and government actions intended to limit its spread; the anticipated changes in the Bank’s credit portfolio; the continuation of the Bank’s preferred creditor status; the impact of increasing/decreasing interest rates and of the macroeconomic environment in the Region on the Bank’s financial condition; the execution of the Bank’s strategies and initiatives, including its revenue diversification strategy; the adequacy of the Bank’s allowance for expected credit losses; the need for additional allowance for expected credit losses; the Bank’s ability to achieve future growth, to reduce its liquidity levels and increase its leverage; the Bank’s ability to maintain its investment-grade credit ratings; the availability and mix of future sources of funding for the Bank’s lending operations; potential trading losses; the possibility of fraud; and the adequacy of the Bank’s sources of liquidity to replace deposit withdrawals. Factors or events that could cause our actual results to differ may emerge from time to time, and it is not possible for us to predict all of them. Readers are cautioned not to place undue reliance on these forward-looking statements, which speak only as of the date hereof. We undertake no obligation to publicly update any forward-looking statement, whether as a result of new information, future developments or otherwise, except as may be required by law.
ABOUT BLADEX
Bladex, a multinational bank originally established by the central banks of Latin-American and Caribbean countries, began operations in 1979 to promote foreign trade and economic integration in the Region. The Bank, headquartered in Panama, also has offices in Argentina, Brazil, Colombia, Mexico, and the United States of America, and a Representative License in Peru, supporting the regional expansion and servicing its customer base, which includes financial institutions and corporations.
Bladex is listed on the NYSE in the United States of America (NYSE: BLX), since 1992, and its shareholders include: central banks and state-owned banks and entities representing 23 Latin American countries; commercial banks and financial institutions; and institutional and retail investors through its public listing.
11
CONFERENCE CALL INFORMATION
There will be a conference call to discuss the Bank’s quarterly results on Tuesday, February 22, 2022 at 11:00 a.m. New York City time (Eastern Time). For those interested in participating, please dial (800) 420-1271 in the United States or, if outside the United States, (785) 424-1205. Participants should use conference passcode 52607, and dial in five minutes before the call is set to begin. There will also be a live audio webcast of the conference at http://www.bladex.com. The webcast presentation will be available for viewing and downloads on http://www.bladex.com.
The conference call will become available for review on Conference Replay one hour after its conclusion and will remain available for 60 days. Please dial (800) 945-0804 and follow the instructions. The replay passcode is: 52607.
For more information, please access http://www.bladex.com or contact:
Mrs. Ana Graciela de Méndez
Chief Financial Officer
Tel: +507 210-8563
E-mail address: amendez@bladex.com
| 12 |
EXHIBIT I
CONSOLIDATED STATEMENTS OF FINANCIAL POSITION
| AT THE END OF, | ||||||||||||||||||||||||||||
| (A) | (B) | (C) | (A) - (B) | (A) - (C) | ||||||||||||||||||||||||
| December 31, 2021 | September 30, 2021 | December 31, 2020 | CHANGE | % | CHANGE | % | ||||||||||||||||||||||
| (In US$ thousand) | ||||||||||||||||||||||||||||
| Assets | ||||||||||||||||||||||||||||
| Cash and due from banks | $ | 1,253,052 | $ | 663,975 | $ | 863,812 | $ | 589,077 | 89 | % | $ | 389,240 | 45 | % | ||||||||||||||
| Securities and other financial assets, net | 831,913 | 772,957 | 398,068 | 58,956 | 8 | 433,845 | 109 | |||||||||||||||||||||
| Loans, net | 5,713,022 | 5,268,827 | 4,896,647 | 444,195 | 8 | 816,375 | 17 | |||||||||||||||||||||
| Customers' liabilities under acceptances | 201,515 | 239,544 | 74,366 | (38,029 | ) | (16 | ) | 127,149 | 171 | |||||||||||||||||||
| Derivative financial instruments - assets | 10,805 | 7,124 | 27,778 | 3,681 | 52 | (16,973 | ) | (61 | ) | |||||||||||||||||||
| Equipment and leasehold improvements, net | 17,779 | 15,294 | 16,213 | 2,485 | 16 | 1,566 | 10 | |||||||||||||||||||||
| Intangibles, net | 1,595 | 1,658 | 1,984 | (63 | ) | (4 | ) | (389 | ) | (20 | ) | |||||||||||||||||
| Investment properties | 0 | 2,050 | 3,214 | (2,050 | ) | (100 | ) | (3,214 | ) | (100 | ) | |||||||||||||||||
| Other assets | 8,430 | 5,651 | 6,816 | 2,779 | 49 | 1,614 | 24 | |||||||||||||||||||||
| Total assets | $ | 8,038,111 | $ | 6,977,080 | $ | 6,288,898 | $ | 1,061,031 | 15 | % | $ | 1,749,213 | 28 | % | ||||||||||||||
| Liabilities | ||||||||||||||||||||||||||||
| Demand deposits | $ | 362,356 | $ | 431,874 | $ | 170,660 | $ | (69,518 | ) | (16 | )% | $ | 191,696 | 112 | % | |||||||||||||
| Time deposits | 2,673,872 | 2,946,944 | 2,968,240 | (273,072 | ) | (9 | ) | (294,368 | ) | (10 | ) | |||||||||||||||||
| 3,036,228 | 3,378,818 | 3,138,900 | (342,590 | ) | (10 | ) | (102,672 | ) | (3 | ) | ||||||||||||||||||
| Interest payable | 1,229 | 3,027 | 1,975 | (1,798 | ) | (59 | ) | (746 | ) | (38 | ) | |||||||||||||||||
| Total deposits | 3,037,457 | 3,381,845 | 3,140,875 | (344,388 | ) | (10 | ) | (103,418 | ) | (3 | ) | |||||||||||||||||
| Securities sold under repurchase agreements | 427,497 | 330,998 | 10,663 | 96,499 | 29 | 416,834 | 3,909 | |||||||||||||||||||||
| Borrowings and debt, net | 3,321,911 | 1,960,699 | 1,985,070 | 1,361,212 | 69 | 1,336,841 | 67 | |||||||||||||||||||||
| Interest payable | 11,322 | 9,813 | 9,175 | 1,509 | 15 | 2,147 | 23 | |||||||||||||||||||||
| Acceptance outstanding | 201,515 | 239,544 | 74,366 | (38,029 | ) | (16 | ) | 127,149 | 171 | |||||||||||||||||||
| Derivative financial instruments - liabilities | 28,455 | 23,770 | 9,211 | 4,685 | 20 | 19,244 | 209 | |||||||||||||||||||||
| Allowance for loan commitments and financial guarantee contract losses | 3,803 | 3,654 | 2,904 | 149 | 4 | 899 | 31 | |||||||||||||||||||||
| Other liabilities | 14,361 | 14,033 | 18,714 | 328 | 2 | (4,353 | ) | (23 | ) | |||||||||||||||||||
| Total liabilities | $ | 7,046,321 | $ | 5,964,356 | $ | 5,250,978 | $ | 1,081,965 | 18 | % | $ | 1,795,343 | 34 | % | ||||||||||||||
| Equity | ||||||||||||||||||||||||||||
| Common stock | $ | 279,980 | $ | 279,980 | $ | 279,980 | $ | 0 | 0 | % | $ | 0 | 0 | % | ||||||||||||||
| Treasury stock | (115,799 | ) | (84,366 | ) | (57,999 | ) | (31,433 | ) | (37 | ) | (57,800 | ) | (100 | ) | ||||||||||||||
| Additional paid-in capital in excess of value assigned of common stock | 120,043 | 119,627 | 120,414 | 416 | 0 | (371 | ) | (0 | ) | |||||||||||||||||||
| Capital reserves | 95,210 | 95,210 | 95,210 | 0 | 0 | 0 | 0 | |||||||||||||||||||||
| Regulatory reserves | 136,019 | 136,019 | 136,019 | 0 | 0 | 0 | 0 | |||||||||||||||||||||
| Retained earnings | 487,885 | 477,109 | 464,088 | 10,776 | 2 | 23,797 | 5 | |||||||||||||||||||||
| Other comprehensive income (loss) | (11,548 | ) | (10,855 | ) | 208 | (693 | ) | (6 | ) | (11,756 | ) | (5,652 | ) | |||||||||||||||
| Total equity | $ | 991,790 | $ | 1,012,724 | $ | 1,037,920 | $ | (20,934 | ) | (2 | )% | $ | (46,130 | ) | (4 | )% | ||||||||||||
| Total liabilities and equity | $ | 8,038,111 | $ | 6,977,080 | $ | 6,288,898 | $ | 1,061,031 | 15 | % | $ | 1,749,213 | 28 | % | ||||||||||||||
| 13 |
EXHIBIT II
CONSOLIDATED STATEMENTS OF PROFIT OR LOSS
(In US$ thousand, except per share amounts and ratios)
| FOR THE THREE MONTHS ENDED | ||||||||||||||||||||||||||||
| (A) | (B) | (C) | (A) - (B) | (A) - (C) | ||||||||||||||||||||||||
| December 31, 2021 | September 30, 2021 | December 31, 2020 | CHANGE | % | CHANGE | % | ||||||||||||||||||||||
| Net Interest Income: | ||||||||||||||||||||||||||||
| Interest income | $ | 39,031 | $ | 34,770 | $ | 37,782 | $ | 4,261 | 12 | % | $ | 1,249 | 3 | % | ||||||||||||||
| Interest expense | (14,221 | ) | (12,691 | ) | (15,464 | ) | (1,530 | ) | (12 | ) | 1,243 | 8 | ||||||||||||||||
| Net Interest Income | 24,810 | 22,079 | 22,318 | 2,731 | 12 | 2,492 | 11 | |||||||||||||||||||||
| Other income (expense): | ||||||||||||||||||||||||||||
| Fees and commissions, net | 6,235 | 4,752 | 2,794 | 1,483 | 31 | 3,441 | 123 | |||||||||||||||||||||
| (Loss) gain on financial instruments, net | (1,347 | ) | (112 | ) | (50 | ) | (1,235 | ) | (1,103 | ) | (1,297 | ) | (2,594 | ) | ||||||||||||||
| Other income, net | 127 | 111 | 245 | 16 | 14 | (118 | ) | (48 | ) | |||||||||||||||||||
| Total other income, net | 5,015 | 4,751 | 2,989 | 264 | 6 | 2,026 | 68 | |||||||||||||||||||||
| Total revenues | 29,825 | 26,830 | 25,307 | 2,995 | 11 | 4,518 | 18 | |||||||||||||||||||||
| Provision for credit losses | (173 | ) | (771 | ) | 311 | 598 | 78 | (484 | ) | (156 | ) | |||||||||||||||||
| Gain on non-financial assets, net | 742 | 0 | 296 | 742 | n.m. | (*) | 446 | 151 | ||||||||||||||||||||
| Operating expenses: | ||||||||||||||||||||||||||||
| Salaries and other employee expenses | (4,888 | ) | (5,952 | ) | (5,657 | ) | 1,064 | 18 | 769 | 14 | ||||||||||||||||||
| Depreciation of investment properties, equipment and improvements | (617 | ) | (622 | ) | (882 | ) | 5 | 1 | 265 | 30 | ||||||||||||||||||
| Amortization of intangible assets | (119 | ) | (99 | ) | (191 | ) | (20 | ) | (20 | ) | 72 | 38 | ||||||||||||||||
| Other expenses | (4,704 | ) | (3,655 | ) | (3,443 | ) | (1,049 | ) | (29 | ) | (1,261 | ) | (37 | ) | ||||||||||||||
| Total operating expenses | (10,328 | ) | (10,328 | ) | (10,173 | ) | 0 | 0 | (155 | ) | (2 | ) | ||||||||||||||||
| Profit for the period | $ | 20,066 | $ | 15,731 | $ | 15,741 | $ | 4,335 | 28 | % | $ | 4,325 | 27 | % | ||||||||||||||
| PER COMMON SHARE DATA: | ||||||||||||||||||||||||||||
| Basic earnings per share | $ | 0.54 | $ | 0.41 | $ | 0.40 | ||||||||||||||||||||||
| Diluted earnings per share | $ | 0.54 | $ | 0.41 | $ | 0.40 | ||||||||||||||||||||||
| Book value (period average) | $ | 27.05 | $ | 26.46 | $ | 26.00 | ||||||||||||||||||||||
| Book value (period end) | $ | 27.37 | $ | 26.64 | $ | 26.16 | ||||||||||||||||||||||
| Weighted average basic shares | 37,073 | 38,789 | 39,678 | |||||||||||||||||||||||||
| Weighted average diluted shares | 37,073 | 38,789 | 39,678 | |||||||||||||||||||||||||
| Basic shares period end | 36,231 | 38,017 | 39,678 | |||||||||||||||||||||||||
| PERFORMANCE RATIOS: | ||||||||||||||||||||||||||||
| Return on average assets | 1.1 | % | 0.9 | % | 1.0 | % | ||||||||||||||||||||||
| Return on average equity | 7.9 | % | 6.1 | % | 6.1 | % | ||||||||||||||||||||||
| Net interest margin | 1.42 | % | 1.33 | % | 1.37 | % | ||||||||||||||||||||||
| Net interest spread | 1.26 | % | 1.17 | % | 1.17 | % | ||||||||||||||||||||||
| Efficiency Ratio | 34.6 | % | 38.5 | % | 40.2 | % | ||||||||||||||||||||||
| Operating expenses to total average assets | 0.58 | % | 0.61 | % | 0.62 | % | ||||||||||||||||||||||
(*)"n.m." means not meaningful.
14
EXHIBIT III
CONSOLIDATED STATEMENTS OF PROFIT OR LOSS
(In US$ thousand, except per share amounts and ratios)
| FOR THE YEAR ENDED | ||||||||||||||||
| (A) | (B) | (A) - (B) | ||||||||||||||
| December 31, 2021 | December 31, 2020 | CHANGE | % | |||||||||||||
| Net Interest Income: | ||||||||||||||||
| Interest income | $ | 140,883 | $ | 180,973 | $ | (40,090 | ) | (22 | )% | |||||||
| Interest expense | (54,101 | ) | (88,523 | ) | 34,422 | 39 | ||||||||||
| Net Interest Income | 86,782 | 92,450 | (5,668 | ) | (6 | ) | ||||||||||
| Other income (expense): | ||||||||||||||||
| Fees and commissions, net | 18,298 | 10,418 | 7,880 | 76 | ||||||||||||
| Gain (loss) on financial instruments, net | (1,296 | ) | (4,794 | ) | 3,498 | 73 | ||||||||||
| Other income, net | 422 | 1,083 | (661 | ) | (61 | ) | ||||||||||
| Total other income, net | 17,424 | 6,707 | 10,717 | 160 | ||||||||||||
| Total revenues | 104,206 | 99,157 | 5,049 | 5 | ||||||||||||
| (Provision for) reversal of credit losses | (2,328 | ) | 1,464 | (3,792 | ) | (259 | ) | |||||||||
| Gain on non-financial assets, net | 742 | 296 | 446 | 151 | ||||||||||||
| Operating expenses: | ||||||||||||||||
| Salaries and other employee expenses | (21,652 | ) | (21,462 | ) | (190 | ) | (1 | ) | ||||||||
| Depreciation of investment properties, equipment and improvements | (2,749 | ) | (3,587 | ) | 838 | 23 | ||||||||||
| Amortization of intangible assets | (742 | ) | (753 | ) | 11 | 1 | ||||||||||
| Other expenses | (14,780 | ) | (11,522 | ) | (3,258 | ) | (28 | ) | ||||||||
| Total operating expenses | (39,923 | ) | (37,324 | ) | (2,599 | ) | (7 | ) | ||||||||
| Profit for the period | $ | 62,697 | $ | 63,593 | $ | (896 | ) | (1 | )% | |||||||
| PER COMMON SHARE DATA: | ||||||||||||||||
| Basic earnings per share | $ | 1.62 | $ | 1.60 | ||||||||||||
| Diluted earnings per share | $ | 1.62 | $ | 1.60 | ||||||||||||
| Book value (period average) | $ | 26.48 | $ | 25.90 | ||||||||||||
| Book value (period end) | $ | 27.37 | $ | 26.16 | ||||||||||||
| Weighted average basic shares | 38,796 | 39,656 | ||||||||||||||
| Weighted average diluted shares | 38,796 | 39,656 | ||||||||||||||
| Basic shares period end | 36,231 | 39,678 | ||||||||||||||
| PERFORMANCE RATIOS: | ||||||||||||||||
| Return on average assets | 0.9 | % | 1.0 | % | ||||||||||||
| Return on average equity | 6.1 | % | 6.2 | % | ||||||||||||
| Net interest margin | 1.32 | % | 1.41 | % | ||||||||||||
| Net interest spread | 1.15 | % | 1.13 | % | ||||||||||||
| Efficiency Ratio | 38.3 | % | 37.6 | % | ||||||||||||
| Operating expenses to total average assets | 0.59 | % | 0.56 | % | ||||||||||||
15

| EXHIBIT IV | ||||||||||||
| CONSOLIDATED NET INTEREST INCOME AND AVERAGE BALANCES | ||||||||||||
| FOR THE THREE MONTHS ENDED | ||||||||||||||||||||||||||||||||||||
| December 31, 2021 | September 30, 2021 | December 31, 2020 | ||||||||||||||||||||||||||||||||||
| AVERAGE | AVG. | AVERAGE | AVG. | AVERAGE | AVG. | |||||||||||||||||||||||||||||||
| BALANCE | INTEREST | RATE | BALANCE | INTEREST | RATE | BALANCE | INTEREST | RATE | ||||||||||||||||||||||||||||
| (In US$ thousand) | ||||||||||||||||||||||||||||||||||||
| INTEREST EARNING ASSETS | ||||||||||||||||||||||||||||||||||||
| Cash and due from banks | $ | 726,519 | $ | 282 | 0.15 | % | $ | 765,621 | $ | 287 | 0.15 | % | $ | 1,525,717 | $ | 623 | 0.16 | % | ||||||||||||||||||
| Securities at fair value through OCI | 194,099 | 176 | 0.35 | 204,258 | 190 | 0.36 | 184,677 | 197 | 0.42 | |||||||||||||||||||||||||||
| Securities at amortized cost (1) | 595,935 | 3,634 | 2.39 | 415,598 | 2,377 | 2.24 | 152,615 | 1,106 | 2.84 | |||||||||||||||||||||||||||
| Loans, net of unearned interest | 5,396,919 | 34,939 | 2.53 | 5,219,597 | 31,916 | 2.39 | 4,611,060 | 35,858 | 3.04 | |||||||||||||||||||||||||||
| TOTAL INTEREST EARNING ASSETS | $ | 6,913,473 | $ | 39,031 | 2.21 | % | $ | 6,605,074 | $ | 34,770 | 2.06 | % | $ | 6,474,070 | $ | 37,783 | 2.28 | % | ||||||||||||||||||
| Allowance for loan losses | (42,056 | ) | (40,237 | ) | (41,630 | ) | ||||||||||||||||||||||||||||||
| Non interest earning assets | 212,698 | 187,830 | 116,474 | |||||||||||||||||||||||||||||||||
| TOTAL ASSETS | $ | 7,084,115 | $ | 6,752,667 | $ | 6,548,914 | ||||||||||||||||||||||||||||||
| INTEREST BEARING LIABILITIES | ||||||||||||||||||||||||||||||||||||
| Deposits | 3,167,728 | $ | 2,812 | 0.35 | % | 3,374,609 | $ | 3,093 | 0.36 | % | $ | 3,534,462 | $ | 4,247 | 0.47 | % | ||||||||||||||||||||
| Securities sold under repurchase agreement and short-term borrowings and debt | 1,118,020 | 2,148 | 0.75 | 640,547 | 801 | 0.49 | 294,881 | 2,288 | 3.04 | |||||||||||||||||||||||||||
| Long-term borrowings and debt, net (2) | 1,586,340 | 9,261 | 2.28 | 1,544,324 | 8,797 | 2.23 | 1,611,988 | 8,929 | 2.17 | |||||||||||||||||||||||||||
| TOTAL INTEREST BEARING LIABILITIES | $ | 5,872,087 | $ | 14,221 | 0.95 | % | $ | 5,559,481 | $ | 12,691 | 0.89 | % | $ | 5,441,331 | $ | 15,464 | 1.11 | % | ||||||||||||||||||
| Non interest bearing liabilities and other liabilities | $ | 209,344 | $ | 166,661 | $ | 75,917 | ||||||||||||||||||||||||||||||
| TOTAL LIABILITIES | 6,081,431 | 5,726,142 | 5,517,247 | |||||||||||||||||||||||||||||||||
| EQUITY | 1,002,683 | 1,026,525 | 1,031,667 | |||||||||||||||||||||||||||||||||
| TOTAL LIABILITIES AND EQUITY | $ | 7,084,115 | $ | 6,752,667 | $ | 6,548,914 | ||||||||||||||||||||||||||||||
| NET INTEREST SPREAD | 1.26 | % | 1.17 | % | 1.17 | % | ||||||||||||||||||||||||||||||
| NET INTEREST INCOME AND NET INTEREST MARGIN | $ | 24,810 | 1.42 | % | $ | 22,079 | 1.33 | % | $ | 22,319 | 1.37 | % | ||||||||||||||||||||||||
| (1) | Gross of the allowance for losses relating to securities at amortized cost. |
| (2) | Includes lease liabilities, net of prepaid commissions. |
| Note: Interest income and/or expense includes the effect of derivative financial instruments used for hedging. |
| 16 |
| EXHIBIT V | ||||||||
| CONSOLIDATED NET INTEREST INCOME AND AVERAGE BALANCES | ||||||||
| FOR THE YEAR ENDED | ||||||||||||||||||||||||
| December 31, 2021 | December 31, 2020 | |||||||||||||||||||||||
| AVERAGE | AVG. | AVERAGE | AVG. | |||||||||||||||||||||
| BALANCE | INTEREST | RATE | BALANCE | INTEREST | RATE | |||||||||||||||||||
| (In US$ thousand) | ||||||||||||||||||||||||
| INTEREST EARNING ASSETS | ||||||||||||||||||||||||
| Cash and due from banks | $ | 831,336 | $ | 1,186 | 0.14 | % | $ | 1,502,339 | $ | 4,895 | 0.32 | % | ||||||||||||
| Securities at fair value through OCI | 211,693 | 819 | 0.38 | 56,583 | 268 | 0.47 | ||||||||||||||||||
| Securities at amortized cost (1) | 354,716 | 9,120 | 2.54 | 100,403 | 3,263 | 3.20 | ||||||||||||||||||
| Loans, net of unearned interest | 5,180,506 | 129,758 | 2.47 | 4,880,845 | 172,547 | 3.48 | ||||||||||||||||||
| TOTAL INTEREST EARNING ASSETS | $ | 6,578,251 | $ | 140,883 | �� | 2.11 | % | $ | 6,540,170 | $ | 180,973 | 2.72 | % | |||||||||||
| Allowance for loan losses | (41,248 | ) | (67,233 | ) | ||||||||||||||||||||
| Non interest earning assets | 175,934 | 134,730 | ||||||||||||||||||||||
| TOTAL ASSETS | $ | 6,712,936 | $ | 6,607,668 | ||||||||||||||||||||
| INTEREST BEARING LIABILITIES | ||||||||||||||||||||||||
| Deposits | $ | 3,299,993 | $ | 12,846 | 0.38 | % | $ | 2,974,549 | $ | 25,800 | 0.85 | % | ||||||||||||
| Securities sold under repurchase agreement and short-term borrowings and debt | 695,163 | 5,940 | 0.84 | 1,060,800 | 23,960 | 2.22 | ||||||||||||||||||
| Long-term borrowings and debt, net (2) | 1,539,493 | 35,315 | 2.26 | 1,440,239 | 38,763 | 2.65 | ||||||||||||||||||
| TOTAL INTEREST BEARING LIABILITIES | $ | 5,534,650 | $ | 54,101 | 0.96 | % | $ | 5,475,588 | $ | 88,523 | 1.59 | % | ||||||||||||
| Non interest bearing liabilities and other liabilities | $ | 151,045 | $ | 105,032 | ||||||||||||||||||||
| TOTAL LIABILITIES | 5,685,694 | 5,580,619 | ||||||||||||||||||||||
| EQUITY | 1,027,242 | 1,027,048 | ||||||||||||||||||||||
| TOTAL LIABILITIES AND EQUITY | $ | 6,712,936 | $ | 6,607,668 | ||||||||||||||||||||
| NET INTEREST SPREAD | 1.15 | % | 1.13 | % | ||||||||||||||||||||
| NET INTEREST INCOME AND NET INTEREST MARGIN | $ | 86,782 | 1.32 | % | $ | 92,450 | 1.41 | % | ||||||||||||||||
| (1) | Gross of the allowance for losses relating to securities at amortized cost. |
| (2) | Includes lease liabilities, net of prepaid commissions. |
| Note: Interest income and/or expense includes the effect of derivative financial instruments used for hedging. | |
17
| EXHIBIT VI | ||||||||
| CONSOLIDATED STATEMENT OF PROFIT OR LOSS | ||||||||
| (In US$ thousand, except per share amounts and ratios) | ||||||||
| YEAR | FOR THE THREE MONTHS ENDED | YEAR | ||||||||||||||||||||||||||
| ENDED | ENDED | |||||||||||||||||||||||||||
| DIC 31/21 | DIC 31/21 | SEP 30/21 | JUN 30/21 | MAR 31/21 | DIC 31/20 | DIC 31/20 | ||||||||||||||||||||||
| Net Interest Income: | ||||||||||||||||||||||||||||
| Interest income | $ | 140,883 | $ | 39,031 | $ | 34,770 | $ | 34,164 | $ | 32,918 | $ | 37,782 | $ | 180,973 | ||||||||||||||
| Interest expense | (54,101 | ) | (14,221 | ) | (12,691 | ) | (13,166 | ) | (14,023 | ) | (15,464 | ) | (88,523 | ) | ||||||||||||||
| Net Interest Income | 86,782 | 24,810 | 22,079 | 20,998 | 18,895 | 22,318 | 92,450 | |||||||||||||||||||||
| Other income (expense): | ||||||||||||||||||||||||||||
| Fees and commissions, net | 18,298 | 6,235 | 4,752 | 4,271 | 3,040 | 2,794 | 10,418 | |||||||||||||||||||||
| Gain (loss) on financial instruments, net | (1,296 | ) | (1,347 | ) | (112 | ) | 234 | (71 | ) | (50 | ) | (4,794 | ) | |||||||||||||||
| Other income, net | 422 | 127 | 111 | 87 | 97 | 245 | 1,083 | |||||||||||||||||||||
| Total other income, net | 17,424 | 5,015 | 4,751 | 4,592 | 3,066 | 2,989 | 6,707 | |||||||||||||||||||||
| Total revenues | 104,206 | 29,825 | 26,830 | 25,590 | 21,961 | 25,307 | 99,157 | |||||||||||||||||||||
| (Provision for) reversal of credit losses | (2,328 | ) | (173 | ) | (771 | ) | (1,384 | ) | 0 | 311 | 1,464 | |||||||||||||||||
| Gain on non-financial assets, net | 742 | 742 | 0 | 0 | 0 | 296 | 296 | |||||||||||||||||||||
| Total operating expenses | (39,923 | ) | (10,328 | ) | (10,328 | ) | (10,122 | ) | (9,145 | ) | (10,173 | ) | (37,324 | ) | ||||||||||||||
| Profit for the period | $ | 62,697 | $ | 20,066 | $ | 15,731 | $ | 14,084 | $ | 12,816 | $ | 15,741 | $ | 63,593 | ||||||||||||||
| SELECTED FINANCIAL DATA | ||||||||||||||||||||||||||||
| PER COMMON SHARE DATA | ||||||||||||||||||||||||||||
| Basic earnings per share | $ | 1.62 | $ | 0.54 | $ | 0.41 | $ | 0.36 | $ | 0.32 | $ | 0.40 | $ | 1.60 | ||||||||||||||
| PERFORMANCE RATIOS | ||||||||||||||||||||||||||||
| Return on average assets | 0.9 | % | 1.1 | % | 0.9 | % | 0.8 | % | 0.8 | % | 1.0 | % | 1.0 | % | ||||||||||||||
| Return on average equity | 6.1 | % | 7.9 | % | 6.1 | % | 5.4 | % | 5.0 | % | 6.1 | % | 6.2 | % | ||||||||||||||
| Net interest margin | 1.32 | % | 1.42 | % | 1.33 | % | 1.27 | % | 1.24 | % | 1.37 | % | 1.41 | % | ||||||||||||||
| Net interest spread | 1.15 | % | 1.26 | % | 1.17 | % | 1.11 | % | 1.04 | % | 1.17 | % | 1.13 | % | ||||||||||||||
| Efficiency Ratio | 38.3 | % | 34.6 | % | 38.5 | % | 39.6 | % | 41.6 | % | 40.2 | % | 37.6 | % | ||||||||||||||
| Operating expenses to total average assets | 0.59 | % | 0.58 | % | 0.61 | % | 0.60 | % | 0.59 | % | 0.62 | % | 0.56 | % | ||||||||||||||
18
EXHIBIT VII
BUSINESS SEGMENT ANALYSIS
(In US$ thousand)
| FOR THE YEAR ENDED | FOR THE THREE MONTHS ENDED | |||||||||||||||||||
| DEC 31/21 | DEC 31/20 | DEC 31/21 | SEP 30/21 | DEC 31/20 | ||||||||||||||||
| COMMERCIAL BUSINESS SEGMENT: | ||||||||||||||||||||
| Net interest income | $ | 83,792 | $ | 87,921 | $ | 23,295 | $ | 21,286 | $ | 21,033 | ||||||||||
| Other income | 19,188 | 8,597 | 6,512 | 4,939 | 3,109 | |||||||||||||||
| Total revenues | 102,980 | 96,518 | 29,807 | 26,225 | 24,142 | |||||||||||||||
| (Provision for) reversal of credit losses | (1,050 | ) | 1,889 | (160 | ) | 115 | 533 | |||||||||||||
| Gain on non-financial assets, net | 742 | 296 | 742 | 0 | 296 | |||||||||||||||
| Operating expenses | (30,751 | ) | (28,021 | ) | (7,849 | ) | (7,874 | ) | (7,909 | ) | ||||||||||
| Profit for the segment | $ | 71,921 | $ | 70,682 | $ | 22,540 | $ | 18,466 | $ | 17,062 | ||||||||||
| Segment assets | 5,931,201 | 4,989,009 | 5,931,201 | 5,524,936 | 4,989,009 | |||||||||||||||
| TREASURY BUSINESS SEGMENT: | ||||||||||||||||||||
| Net interest income | $ | 2,990 | $ | 4,529 | $ | 1,515 | $ | 793 | $ | 1,285 | ||||||||||
| Other income (expense) | (1,764 | ) | (1,890 | ) | (1,497 | ) | (188 | ) | (120 | ) | ||||||||||
| Total revenues | 1,226 | 2,639 | 18 | 605 | 1,165 | |||||||||||||||
| Provision for credit losses | (1,278 | ) | (425 | ) | (13 | ) | (886 | ) | (222 | ) | ||||||||||
| Operating expenses | (9,172 | ) | (9,303 | ) | (2,479 | ) | (2,454 | ) | (2,264 | ) | ||||||||||
| Loss for the segment | $ | (9,224 | ) | $ | (7,089 | ) | $ | (2,474 | ) | $ | (2,735 | ) | (1,321 | ) | ||||||
| Segment assets | 2,098,492 | 1,293,081 | 2,098,492 | 1,446,516 | 1,293,081 | |||||||||||||||
| TOTAL: | ||||||||||||||||||||
| Net interest income | $ | 86,782 | $ | 92,450 | $ | 24,810 | $ | 22,079 | $ | 22,318 | ||||||||||
| Other income | 17,424 | 6,707 | 5,015 | 4,751 | 2,989 | |||||||||||||||
| Total revenues | 104,206 | 99,157 | 29,825 | 26,830 | 25,307 | |||||||||||||||
| (Provision) reversal for credit losses | (2,328 | ) | 1,464 | (173 | ) | (771 | ) | 311 | ||||||||||||
| Gain on non-financial assets, net | 742 | 296 | 742 | 0 | 296 | |||||||||||||||
| Operating expenses | (39,923 | ) | (37,324 | ) | (10,328 | ) | (10,328 | ) | (10,173 | ) | ||||||||||
| Profit for the period | $ | 62,697 | $ | 63,593 | $ | 20,066 | $ | 15,731 | $ | 15,741 | ||||||||||
| Total segment assets | 8,029,693 | 6,282,090 | 8,029,693 | 6,971,452 | 6,282,090 | |||||||||||||||
| Unallocated assets | 8,418 | 6,808 | 8,418 | 5,628 | 6,808 | |||||||||||||||
| Total assets | 8,038,111 | 6,288,898 | 8,038,111 | 6,977,080 | 6,288,898 | |||||||||||||||
| 19 |
EXHIBIT VIII
CREDIT PORTFOLIO
DISTRIBUTION BY COUNTRY
(In US$ million)
| AT THE END OF, | ||||||||||||||||||||||||||||||||
| (A) | (B) | (C) | ||||||||||||||||||||||||||||||
| Dec. 31, 2021 | Sep. 30, 2021 | Dec. 31, 2020 | Change in Amount | |||||||||||||||||||||||||||||
| COUNTRY | Amount | % of Total Outstanding | Amount | % of Total Outstanding | Amount | % of Total Outstanding | (A) - (B) | (A) - (C) | ||||||||||||||||||||||||
| ARGENTINA | $ | 74 | 1 | $ | 97 | 1 | $ | 131 | 2 | $ | (23 | ) | $ | (57 | ) | |||||||||||||||||
| BOLIVIA | 6 | 0 | 13 | 0 | 15 | 0 | (7 | ) | (9 | ) | ||||||||||||||||||||||
| BRAZIL | 1,201 | 16 | 1,240 | 18 | 1,063 | 18 | (39 | ) | 138 | |||||||||||||||||||||||
| CHILE | 773 | 10 | 714 | 10 | 583 | 10 | 59 | 190 | ||||||||||||||||||||||||
| COLOMBIA | 884 | 12 | 684 | 10 | 795 | 13 | 200 | 89 | ||||||||||||||||||||||||
| COSTA RICA | 272 | 4 | 197 | 3 | 203 | 3 | 75 | 69 | ||||||||||||||||||||||||
| DOMINICAN REPUBLIC | 297 | 4 | 292 | 4 | 219 | 4 | 5 | 78 | ||||||||||||||||||||||||
| ECUADOR | 319 | 4 | 293 | 4 | 211 | 4 | 26 | 108 | ||||||||||||||||||||||||
| EL SALVADOR | 80 | 1 | 86 | 1 | 41 | 1 | (6 | ) | 39 | |||||||||||||||||||||||
| GUATEMALA | 493 | 7 | 415 | 6 | 325 | 5 | 78 | 168 | ||||||||||||||||||||||||
| HONDURAS | 50 | 1 | 26 | 0 | 10 | 0 | 24 | 40 | ||||||||||||||||||||||||
| JAMAICA | 5 | 0 | 37 | 1 | 23 | 0 | (32 | ) | (18 | ) | ||||||||||||||||||||||
| ��MEXICO | 787 | 11 | 911 | 13 | 656 | 11 | (124 | ) | 131 | |||||||||||||||||||||||
| PANAMA | 293 | 4 | 287 | 4 | 313 | 5 | 6 | (20 | ) | |||||||||||||||||||||||
| PARAGUAY | 108 | 1 | 55 | 1 | 113 | 2 | 53 | (5 | ) | |||||||||||||||||||||||
| PERU | 473 | 6 | 366 | 5 | 346 | 6 | 107 | 127 | ||||||||||||||||||||||||
| TRINIDAD & TOBAGO | 141 | 2 | 153 | 2 | 166 | 3 | (12 | ) | (25 | ) | ||||||||||||||||||||||
| UNITED STATES OF AMERICA | 314 | 4 | 324 | 5 | 204 | 3 | (10 | ) | 110 | |||||||||||||||||||||||
| URUGUAY | 149 | 2 | 178 | 3 | 34 | 1 | (29 | ) | 115 | |||||||||||||||||||||||
| MULTILATERAL ORGANIZATIONS | 105 | 1 | 106 | 2 | 113 | 2 | (1 | ) | (8 | ) | ||||||||||||||||||||||
| OTHER NON-LATAM (1) | 541 | 7 | 482 | 7 | 382 | 6 | 59 | 159 | ||||||||||||||||||||||||
| TOTAL CREDIT PORTFOLIO (2) | $ | 7,365 | 100 | % | $ | 6,956 | 100 | % | $ | 5,946 | 100 | % | $ | 409 | $ | 1,419 | ||||||||||||||||
| UNEARNED INTEREST AND DEFERRED FEES | (9 | ) | (8 | ) | (6 | ) | (1 | ) | (3 | ) | ||||||||||||||||||||||
| TOTAL CREDIT PORTFOLIO, NET OF UNEARNED INTEREST & DEFERRED FEES | $ | 7,356 | $ | 6,948 | $ | 5,940 | $ | 408 | $ | 1,416 | ||||||||||||||||||||||
| (1) | Risk in highly rated countries outside the Region related to transactions carried out in the Region. |
| (2) | Includes gross loans (or the “Loan Portfolio”), securities at FVOCI and at amortized cost, gross of interest receivable and the allowance for expected credit losses, loan commitments and financial guarantee contracts, such as confirmed and stand-by letters of credit, and guarantees covering commercial risk; and other assets consisting of customers’ liabilities under acceptances. |
| 20 |
EXHIBIT IX
COMMERCIAL PORTFOLIO
DISTRIBUTION BY COUNTRY
(In US$ million)
| AT THE END OF, | ||||||||||||||||||||||||||||||||
| (A) | (B) | (C) | ||||||||||||||||||||||||||||||
| Dec. 31, 2021 | Sep. 30, 2021 | Dec. 31, 2020 | Change in Amount | |||||||||||||||||||||||||||||
| COUNTRY | Amount | % of Total Outstanding | Amount | % of Total Outstanding | Amount | % of Total Outstanding | (A) - (B) | (A) - (C) | ||||||||||||||||||||||||
| ARGENTINA | $ | 74 | 1 | $ | 97 | 2 | $ | 131 | 2 | $ | (23 | ) | $ | (57 | ) | |||||||||||||||||
| BOLIVIA | 6 | 0 | 13 | 0 | 15 | 0 | (7 | ) | (9 | ) | ||||||||||||||||||||||
| BRAZIL | 1,102 | 17 | 1,142 | 18 | 1,022 | 18 | (40 | ) | 80 | |||||||||||||||||||||||
| CHILE | 667 | 10 | 614 | 10 | 542 | 10 | 53 | 125 | ||||||||||||||||||||||||
| COLOMBIA | 846 | 13 | 649 | 10 | 765 | 14 | 197 | 81 | ||||||||||||||||||||||||
| COSTA RICA | 270 | 4 | 193 | 3 | 203 | 4 | 77 | 67 | ||||||||||||||||||||||||
| DOMINICAN REPUBLIC | 292 | 4 | 287 | 5 | 219 | 4 | 5 | 73 | ||||||||||||||||||||||||
| ECUADOR | 319 | 5 | 293 | 5 | 211 | 4 | 26 | 108 | ||||||||||||||||||||||||
| EL SALVADOR | 80 | 1 | 86 | 1 | 41 | 1 | (6 | ) | 39 | |||||||||||||||||||||||
| GUATEMALA | 490 | 7 | 412 | 7 | 325 | 6 | 78 | 165 | ||||||||||||||||||||||||
| HONDURAS | 50 | 1 | 26 | 0 | 10 | 0 | 24 | 40 | ||||||||||||||||||||||||
| JAMAICA | 5 | 0 | 37 | 1 | 23 | 0 | (32 | ) | (18 | ) | ||||||||||||||||||||||
| MEXICO | 731 | 11 | 865 | 14 | 612 | 11 | (134 | ) | 119 | |||||||||||||||||||||||
| PANAMA | 270 | 4 | 274 | 4 | 303 | 5 | (4 | ) | (33 | ) | ||||||||||||||||||||||
| PARAGUAY | 108 | 2 | 55 | 1 | 113 | 2 | 53 | (5 | ) | |||||||||||||||||||||||
| PERU | 409 | 6 | 308 | 5 | 320 | 6 | 101 | 89 | ||||||||||||||||||||||||
| TRINIDAD & TOBAGO | 141 | 2 | 153 | 2 | 166 | 3 | (12 | ) | (25 | ) | ||||||||||||||||||||||
| URUGUAY | 149 | 2 | 178 | 3 | 34 | 1 | (29 | ) | 115 | |||||||||||||||||||||||
| OTHER NON-LATAM (1) | 531 | 8 | 506 | 8 | 496 | 9 | 25 | 35 | ||||||||||||||||||||||||
| TOTAL COMMERCIAL PORTFOLIO (2) | $ | 6,540 | 100 | % | $ | 6,188 | 100 | % | $ | 5,551 | 100 | % | $ | 352 | $ | 989 | ||||||||||||||||
| UNEARNED INTEREST AND DEFERRED FEES | (9 | ) | (8 | ) | (6 | ) | (1 | ) | (3 | ) | ||||||||||||||||||||||
| TOTAL COMMERCIAL PORTFOLIO, NET OF UNEARNED INTEREST & DEFERRED FEES | $ | 6,531 | $ | 6,180 | $ | 5,545 | $ | 351 | $ | 986 | ||||||||||||||||||||||
| (1) | Risk in highly rated countries outside the Region related to transactions carried out in the Region. As of December 31, 2021, “Other Non-Latam” was comprised of United States of America ($19 million), European countries ($426 million) and Asian countries ($86 million). |
| (2) | Includes gross loans (or the “Loan Portfolio”), loan commitments and financial guarantee contracts, such as confirmed and stand-by letters of credit, and guarantees covering commercial risk; and other assets consisting of customers’ liabilities under acceptances. |
| 21 |
EXHIBIT X
INVESTMENT PORTFOLIO
DISTRIBUTION BY COUNTRY
(In US$ million)
| AT THE END OF, | ||||||||||||||||||||||||||||||||
| (A) | (B) | (C) | �� | |||||||||||||||||||||||||||||
| Dec. 31, 2021 | Sep. 30, 2021 | Dec. 31, 2020 | Change in Amount | |||||||||||||||||||||||||||||
| COUNTRY | Amount | % of Total Outstanding | Amount | % of Total Outstanding | Amount | % of Total Outstanding | (A) - (B) | (A) - (C) | ||||||||||||||||||||||||
| BRAZIL | $ | 99 | 12 | $ | 98 | 13 | $ | 41 | 10 | $ | 1 | $ | 58 | |||||||||||||||||||
| CHILE | 106 | 13 | 100 | 13 | 41 | 10 | 6 | 65 | ||||||||||||||||||||||||
| COLOMBIA | 38 | 5 | 35 | 5 | 30 | 8 | 3 | 8 | ||||||||||||||||||||||||
| COSTA RICA | 2 | 0 | 4 | 1 | 0 | 0 | (2 | ) | 2 | |||||||||||||||||||||||
| DOMINICAN REPUBLIC | 5 | 1 | 5 | 1 | 0 | 0 | 0 | 5 | ||||||||||||||||||||||||
| GUATEMALA | 3 | 0 | 3 | 0 | 0 | 0 | 0 | 3 | ||||||||||||||||||||||||
| MEXICO | 56 | 7 | 46 | 6 | 44 | 11 | 10 | 12 | ||||||||||||||||||||||||
| PANAMA | 23 | 3 | 13 | 2 | 10 | 3 | 10 | 13 | ||||||||||||||||||||||||
| PERU | 64 | 8 | 58 | 8 | 26 | 7 | 6 | 38 | ||||||||||||||||||||||||
| UNITED STATES OF AMERICA | 295 | 36 | 279 | 36 | 90 | 23 | 16 | 205 | ||||||||||||||||||||||||
| MULTILATERAL ORGANIZATIONS | 105 | 13 | 106 | 14 | 113 | 28 | (1 | ) | (8 | ) | ||||||||||||||||||||||
| OTHER NON-LATAM (1) | 29 | 3 | 21 | 3 | 0 | 0 | 8 | 29 | ||||||||||||||||||||||||
| TOTAL INVESTMENT PORTFOLIO (2) | $ | 825 | 100 | % | $ | 768 | 100 | % | $ | 395 | 100 | % | $ | 57 | $ | 430 | ||||||||||||||||
(1) Risk in highly rated countries outside the Region.
(2) Includes securities at FVOCI and at amortized cost, gross of interest receivable and the allowance for losses.
| 22 |
EXHIBIT XI
LOAN DISBURSEMENTS
DISTRIBUTION BY COUNTRY
(In US$ million)
| ANNUALLY | QUARTERLY | Change in Amount | ||||||||||||||||||||||||||||||
| (A) | (B) | (C) | (D) | (E) | ||||||||||||||||||||||||||||
| COUNTRY | 2021 | 2020 | 4Q21 | 3Q21 | 4Q20 | (A) - (B) | (C) - (D) | (C) - (E) | ||||||||||||||||||||||||
| ARGENTINA | $ | 11 | $ | 22 | $ | 0 | $ | 0 | $ | 1 | $ | (11 | ) | $ | 0 | $ | (1 | ) | ||||||||||||||
| BOLIVIA | 15 | 12 | 0 | 3 | 7 | 3 | (3 | ) | (7 | ) | ||||||||||||||||||||||
| BRAZIL | 1,459 | 1,076 | 630 | 272 | 366 | 383 | 358 | 264 | ||||||||||||||||||||||||
| CHILE | 1,250 | 479 | 289 | 345 | 217 | 771 | (56 | ) | 72 | |||||||||||||||||||||||
| COLOMBIA | 1,359 | 695 | 532 | 226 | 199 | 664 | 306 | 333 | ||||||||||||||||||||||||
| COSTA RICA | 219 | 211 | 97 | 85 | 79 | 8 | 12 | 18 | ||||||||||||||||||||||||
| DOMINICAN REPUBLIC | 840 | 503 | 321 | 143 | 97 | 337 | 178 | 224 | ||||||||||||||||||||||||
| ECUADOR | 21 | 248 | 12 | 0 | 1 | (227 | ) | 12 | 11 | |||||||||||||||||||||||
| EL SALVADOR | 117 | 67 | 10 | 57 | 10 | 50 | (47 | ) | 0 | |||||||||||||||||||||||
| GUATEMALA | 619 | 306 | 187 | 179 | 84 | 313 | 8 | 103 | ||||||||||||||||||||||||
| HONDURAS | 65 | 70 | 30 | 12 | 10 | (5 | ) | 18 | 20 | |||||||||||||||||||||||
| JAMAICA | 214 | 177 | 40 | 37 | 35 | 37 | 3 | 5 | ||||||||||||||||||||||||
| MEXICO | 3,098 | 2,148 | 909 | 1,020 | 534 | 950 | (111 | ) | 375 | |||||||||||||||||||||||
| PANAMA | 547 | 614 | 64 | 186 | 172 | (67 | ) | (122 | ) | (108 | ) | |||||||||||||||||||||
| PARAGUAY | 148 | 137 | 70 | 0 | 40 | 11 | 70 | 30 | ||||||||||||||||||||||||
| PERU | 601 | 389 | 260 | 125 | 196 | 212 | 135 | 64 | ||||||||||||||||||||||||
| TRINIDAD & TOBAGO | 20 | 10 | 20 | 0 | 0 | 10 | 20 | 20 | ||||||||||||||||||||||||
| UNITED STATES | 251 | 115 | 39 | 35 | 115 | 136 | 4 | (76 | ) | |||||||||||||||||||||||
| URUGUAY | 391 | 59 | 171 | 72 | 0 | 332 | 99 | 171 | ||||||||||||||||||||||||
| OTHER NON-LATAM (1) | 684 | 716 | 272 | 125 | 90 | (32 | ) | 147 | 182 | |||||||||||||||||||||||
| TOTAL LOAN DISBURSED (2) | $ | 11,929 | $ | 8,054 | $ | 3,953 | $ | 2,922 | $ | 2,253 | $ | 3,875 | $ | 1,031 | $ | 1,700 | ||||||||||||||||
| (1) | Origination in highly rated countries outside the Region, mostly in Europe and North America, related to transactions carried out in the Region. |
| (2) | Total loan disbursed does not include loan commitments and financial guarantee contracts, nor other interest-earning assets such as investment securities. |
23