UNITED STATES
SECURITIES AND EXCHANGE COMMISSION
Washington, D.C. 20549
FORM 6-K
REPORT OF FOREIGN PRIVATE ISSUER
PURSUANT TO RULE 13a-16 OR 15d-16 UNDER THE
SECURITIES EXCHANGE ACT OF 1934
For the month of February, 2025
Commission File Number 1-11414
BANCO LATINOAMERICANO DE COMERCIO EXTERIOR, S.A.
(Exact name of Registrant as specified in its Charter)
FOREIGN TRADE BANK OF LATIN AMERICA, INC.
(Translation of Registrant’s name into English)
Business Park Torre V, Ave. La Rotonda, Costa del Este
P.O. Box 0819-08730
Panama City, Republic of Panama
(Address of Principal Executive Office)
Indicate by check mark whether the registrant files or will file annual reports under cover of Form 20-F or Form 40-F.
Form 20-F x Form 40-F o
SIGNATURES
Pursuant to the requirements of the Securities Exchange Act of 1934, the registrant has duly caused this report to be signed on its behalf by the undersigned, thereunto duly authorized.
| | | | | | | | |
| | | FOREIGN TRADE BANK OF LATIN AMERICA, INC. |
| | | (Registrant) |
| | | |
| Date: February 28, 2025 | By: | /s/ Ana Graciela de Méndez |
| Name: | Ana Graciela de Méndez |
| Title: | Chief Financial Officer |
BLADEX ANNOUNCES 4Q24 NET PROFIT OF $51.5 MILLION, OR $1.40 PER SHARE, REACHING AN ANNUAL RECORD NET PROFIT OF $205.9 MILLION, OR $5.60 PER SHARE
PANAMA CITY, REPUBLIC OF PANAMA, FEBRUARY 27, 2025
Banco Latinoamericano de Comercio Exterior, S.A. (NYSE: BLX, “Bladex”, or “the Bank”), a Panama-based multinational bank originally established by the central banks of 23 Latin-American and Caribbean countries to promote foreign trade and economic integration in the Region, announced today its results for the Fourth Quarter (“4Q24”) and Full-year (“FY24”) ended December 31, 2024.
The consolidated financial information in this document has been prepared in accordance with International Financial Reporting Standards (“IFRS”) as issued by the International Accounting Standards Board (“IASB”).
FINANCIAL SNAPSHOT
| | | | | | | | | | | | | | | | | | | | | | | | | | | | | | | | |
| (US$ million, except percentages and per share amounts) | | 4Q24 | | 3Q24 | | 4Q23 | | 2024 | | 2023 |
| Key Income Statement Highlights | | | | | | | | | | |
| Net Interest Income ("NII") | | $ | 66.9 | | | $ | 66.6 | | | $ | 65.6 | | | $ | 259.2 | | | $ | 233.2 | |
| Fees and commissions, net | | $ | 11.9 | | | $ | 10.5 | | | $ | 10.1 | | | $ | 44.4 | | | $ | 32.5 | |
| (Loss) gain on financial instruments, net | | $ | (0.6) | | | $ | 0.3 | | | $ | 1.9 | | | $ | (0.5) | | | $ | 0.0 | |
| | | | | | | | | | |
| Total revenues | | $ | 78.4 | | | $ | 77.6 | | | $ | 77.8 | | | $ | 303.6 | | | $ | 266.1 | |
| Provision for credit losses | | $ | (4.0) | | | $ | (3.5) | | | $ | (10.0) | | | $ | (17.3) | | | $ | (27.5) | |
| | | | | | | | | | |
| Operating expenses | | $ | (22.9) | | | $ | (21.0) | | | $ | (21.4) | | | $ | (80.5) | | | $ | (72.5) | |
| Profit for the period | | $ | 51.5 | | | $ | 53.0 | | | $ | 46.4 | | | $ | 205.9 | | | $ | 166.2 | |
| Profitability Ratios | | | | | | | | | | |
Earnings per Share ("EPS") (1) | | $ | 1.40 | | | $ | 1.44 | | | $ | 1.27 | | | $ | 5.60 | | | $ | 4.55 | |
Return on Average Equity (“ROE”) (2) | | 15.5 | % | | 16.4 | % | | 15.5 | % | | 16.2 | % | | 14.7 | % |
Return on Average Assets (ROA) (3) | | 1.8 | % | | 1.9 | % | | 1.8 | % | | 1.9 | % | | 1.7 | % |
Net Interest Margin ("NIM") (4) | | 2.44 | % | | 2.55 | % | | 2.62 | % | | 2.47 | % | | 2.49 | % |
Net Interest Spread ("NIS") (5) | | 1.69 | % | | 1.78 | % | | 1.92 | % | | 1.75 | % | | 1.84 | % |
Efficiency Ratio (6) | | 29.2 | % | | 27.1 | % | | 27.6 | % | | 26.5 | % | | 27.2 | % |
| Assets, Capital, Liquidity & Credit Quality | | | | | | | | | | |
Credit Portfolio (7) | | $ | 11,224 | | | $ | 10,875 | | | $ | 9,532 | | | $ | 11,224 | | | $ | 9,532 | |
Commercial Portfolio (8) | | $ | 10,035 | | | $ | 9,673 | | | $ | 8,521 | | | $ | 10,035 | | | $ | 8,521 | |
| Investment Portfolio | | $ | 1,189 | | | $ | 1,202 | | | $ | 1,011 | | | $ | 1,189 | | | $ | 1,011 | |
| Total assets | | $ | 11,859 | | | $ | 11,412 | | | $ | 10,744 | | | $ | 11,859 | | | $ | 10,744 | |
| Total equity | | $ | 1,337 | | | $ | 1,310 | | | $ | 1,204 | | | $ | 1,337 | | | $ | 1,204 | |
Market capitalization (9) | | $ | 1,309 | | | $ | 1,195 | | | $ | 904 | | | $ | 1,309 | | | $ | 904 | |
Tier 1 Capital to risk-weighted assets (Basel III – IRB) (10) | | 15.5 | % | | 16.0 | % | | 15.4 | % | | 15.5 | % | | 15.4 | % |
Capital Adequacy Ratio (Regulatory) (11) | | 13.6 | % | | 13.7 | % | | 13.6 | % | | 13.6 | % | | 13.6 | % |
| Total assets / Total equity (times) | | 8.9 | | 8.7 | | 8.9 | | 8.9 | | 8.9 |
Liquid Assets / Total Assets (12) | | 16.2 | % | | 15.0 | % | | 18.6 | % | | 16.2 | % | | 18.6 | % |
Credit-impaired loans to Loan Portfolio (13) | | 0.2 | % | | 0.2 | % | | 0.1 | % | | 0.2 | % | | 0.1 | % |
Impaired credits (14) to Credit Portfolio | | 0.2 | % | | 0.2 | % | | 0.1 | % | | 0.2 | % | | 0.1 | % |
Total allowance for losses to Credit Portfolio (15) | | 0.8 | % | | 0.7 | % | | 0.7 | % | | 0.8 | % | | 0.7 | % |
Total allowance for losses to Impaired credits (times) (15) | | 5.0 | | 4.7 | | 6.5 | | 5.0 | | 6.5 |
FINANCIAL & BUSINESS HIGHLIGHTS
•Record annual Net Profits of $205.9 million in FY24 (+24% YoY), fostered by higher total revenues (+14% YoY), strong efficiency levels and contained credit costs. These remarkable results boosted the Bank’s Return on Equity (“ROE”) to 16.2% in FY24 (+153 bps YoY).
•Strong quarterly profitability, with $51.5 million Net Profit (+11% YoY), enhanced by improved top line performance, reaching an annualized ROE of 15.5% in 4Q24 (stable YoY).
•Record Level Net Interest Income (“NII”) of $66.9 million in 4Q24 (+2% YoY) and $259.2 million in FY24 (+11% YoY) mainly driven by a constant increase in business volumes throughout the year. Net Interest Margin (“NIM”) remained relatively stable at 2.47% in FY24 and stood at 2.44% in 4Q24.
•Solid Fee Income of $11.9 million for 4Q24 (+18% YoY), totaling an annual record of $44.4 million for FY24 (+37% YoY), stemming from the continued cross-sell efforts, streamlined processes, the successful execution of structuring transactions and the enhancement of the Bank’s Project Finance business.
•Efficiency Ratio stood at 29.2% for 4Q24, and 26.5% for FY24, as higher total revenues overcompensated for the increase in operating expenses (+7% YoY in 4Q24; +11% YoY in FY24), mostly associated with higher personnel expenses and other expenses resulting from strategy execution.
•New all-time high Credit Portfolio at $11,224 million as of December 31, 2024 (+18% YoY).
◦Commercial Portfolio EoP balances also reached a new record level of $10,035 million at the end of 4Q24 (+18% YoY), denoting higher lending volumes on continued demand and business growth from new client onboarding.
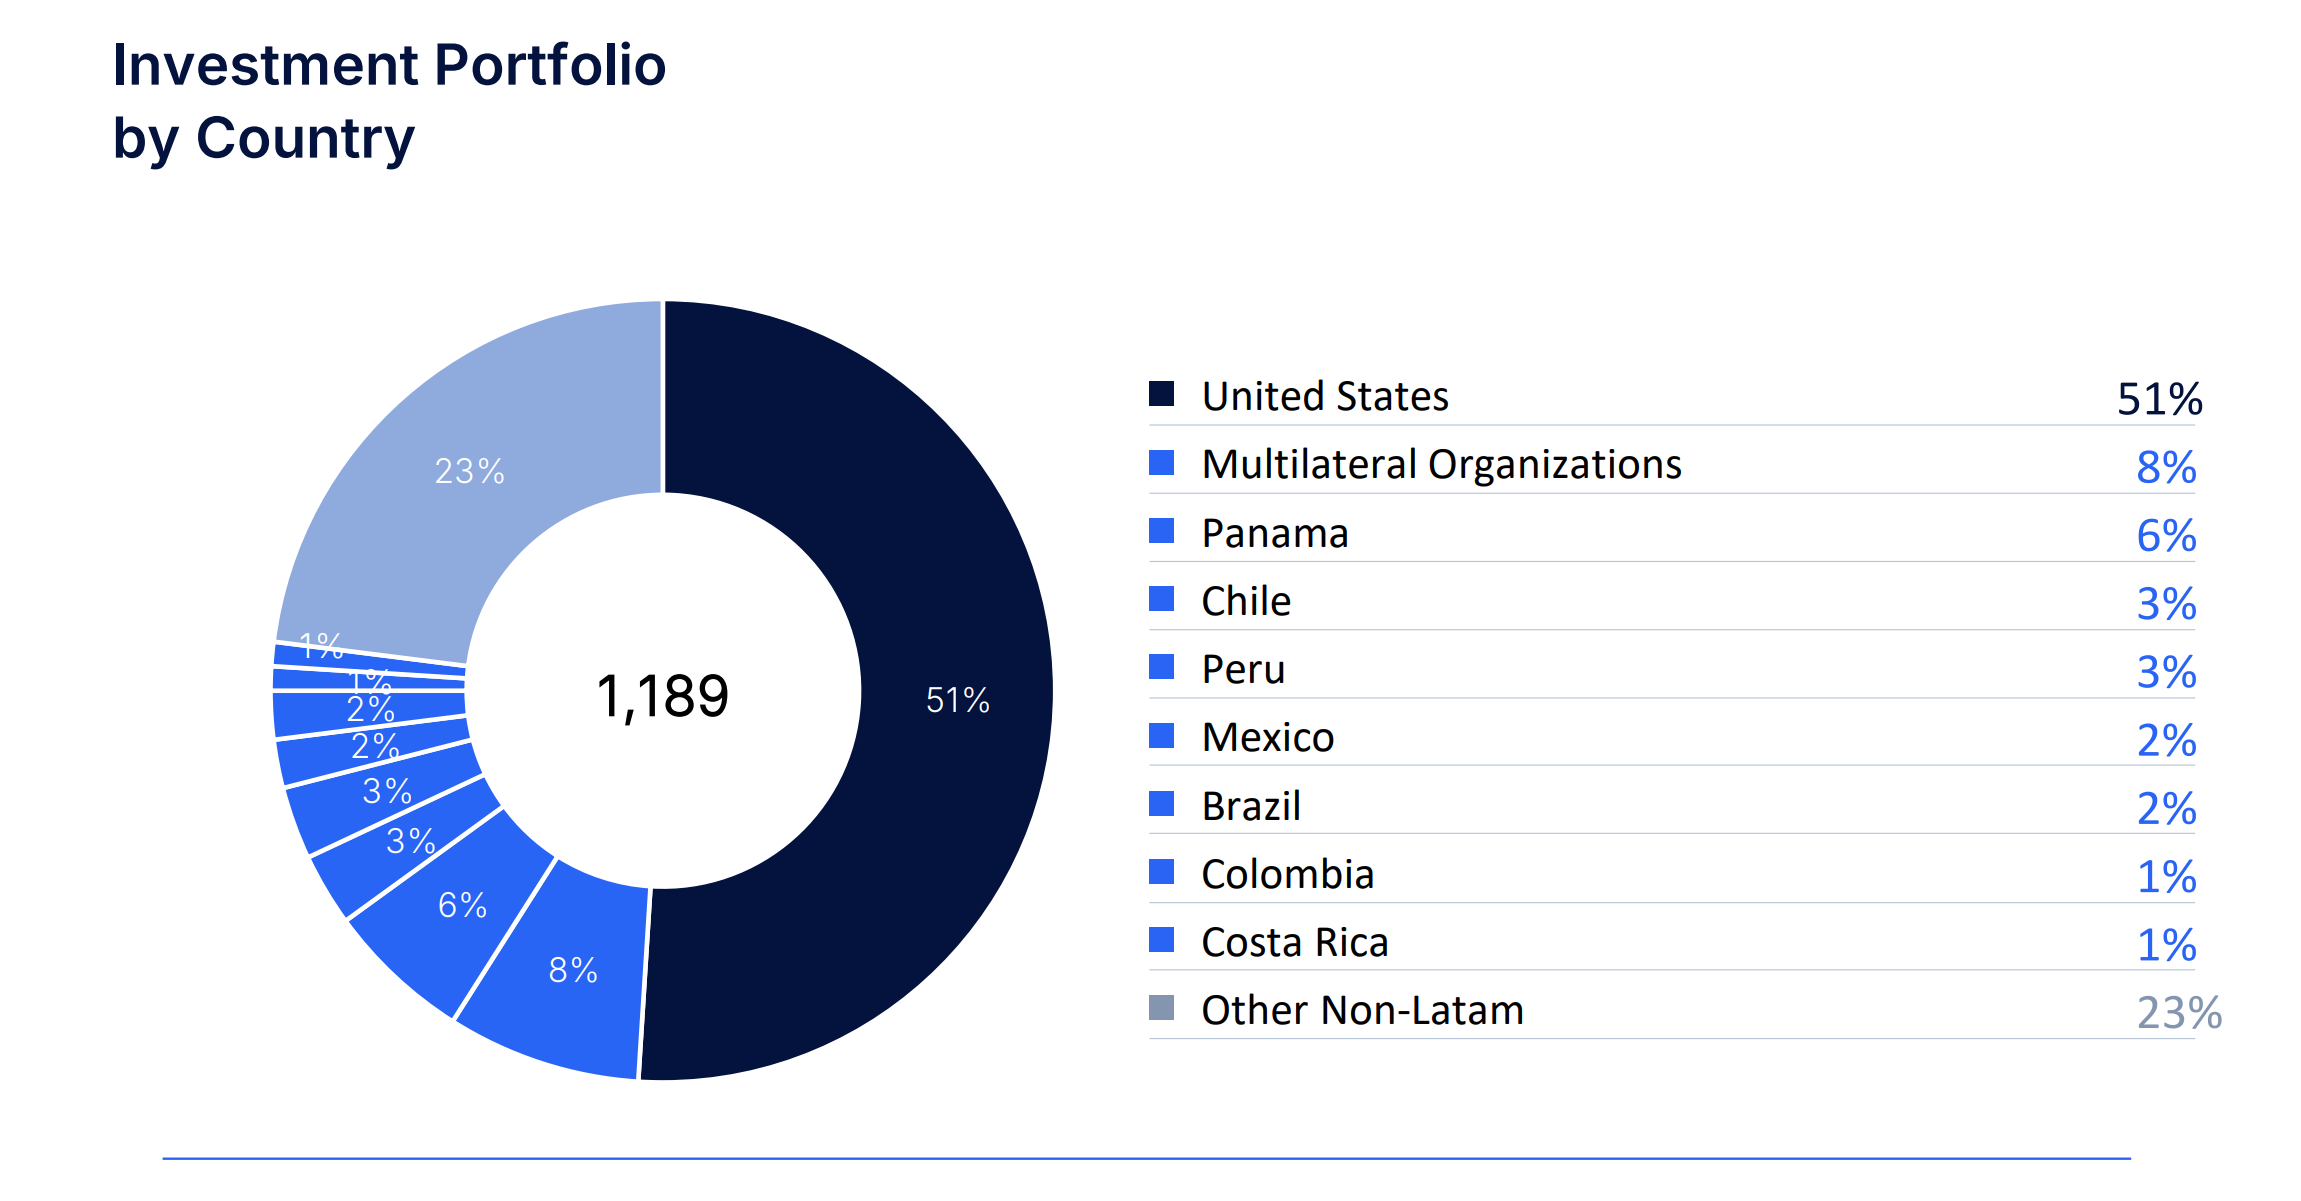
◦Investment Portfolio amounted to $1,189 million (+18% YoY). It mostly consists of investment-grade securities held at amortized cost, in order to further enhance country and credit-risk exposure diversification and to provide contingent liquidity funding.
•Healthy asset quality. Most of the credit portfolio (96.4%) continues to be low risk or Stage 1. At the end of 4Q24, impaired credits (Stage 3) remained at $17 million or 0.2% of total Credit Portfolio, with a reserve coverage of 5.0x.
•Expanding deposit base, reaching $5,413 million at the end of 4Q24 (+23% YoY), representing 54% of the Bank’s total funding sources. The Bank also counts on ample and constant access to interbank and debt capital markets.
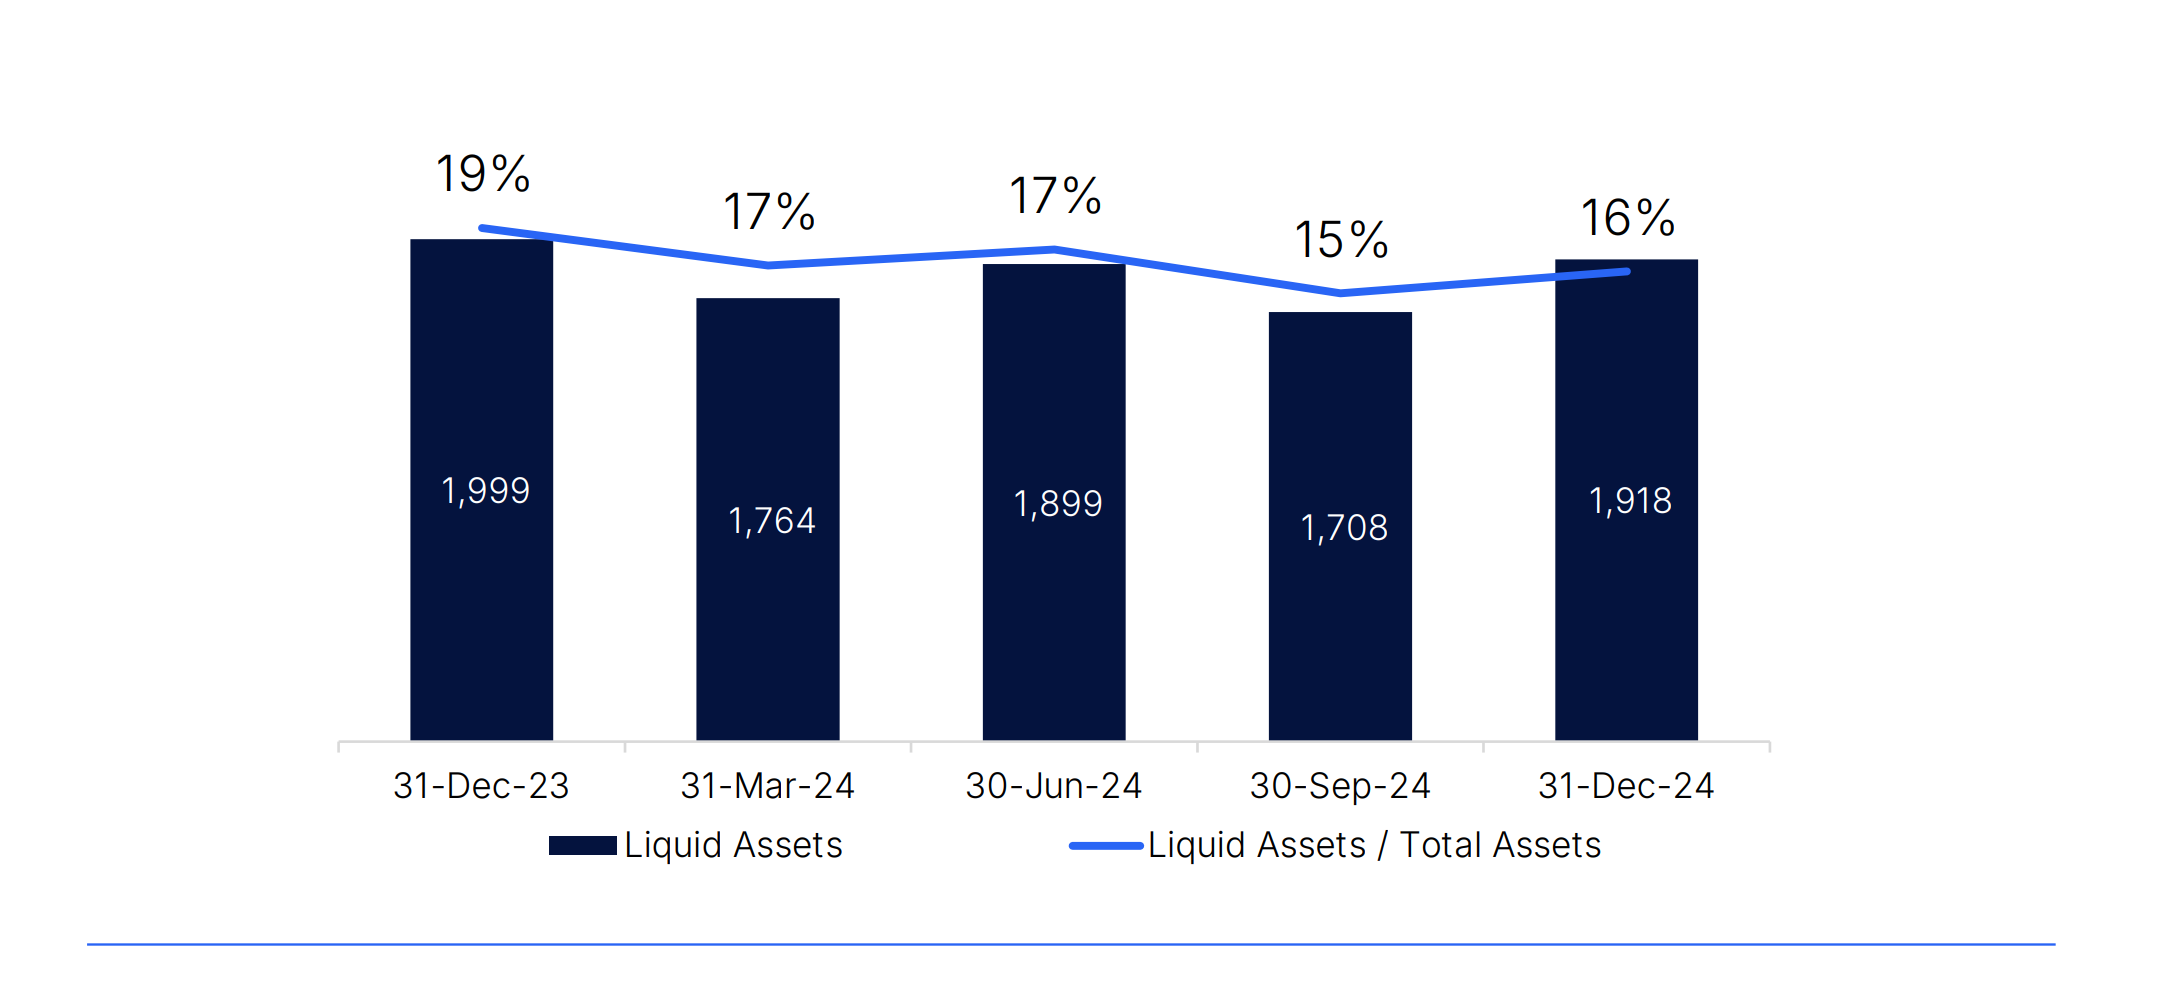
•Liquidity position at $1,918 million, or 16% of total assets as of December 31, 2024, mainly consisting of deposits placed with the Federal Reserve Bank of New York (53%) and highly rated U.S. banks (33%).
•The Bank´s Tier 1 Basel III Capital and Regulatory Capital Adequacy Ratios stood at 15.5% and 13.6%, respectively, enhanced by strong earnings generation and within the Bank’s risk appetite.
RESULTS BY BUSINESS SEGMENT
Bladex’s activities are comprised of two business segments, Commercial and Treasury. Information related to each reportable segment is set out below. Business segment reporting is based on the Bank’s managerial accounting process, which assigns assets, liabilities, revenue, and expense items to each business segment on a systemic basis.
COMMERCIAL BUSINESS SEGMENT
The Commercial Business Segment encompasses the Bank’s core business of financial intermediation and fee generation activities developed to cater to corporations, financial institutions, and investors in Latin America. These activities include the origination of bilateral short-term and medium-term loans, structured and syndicated credits, loan commitments, and financial guarantee contracts such as issued and confirmed letters of credit, stand-by letters of credit, guarantees covering commercial risk, and other assets consisting of customers’ liabilities under acceptances.
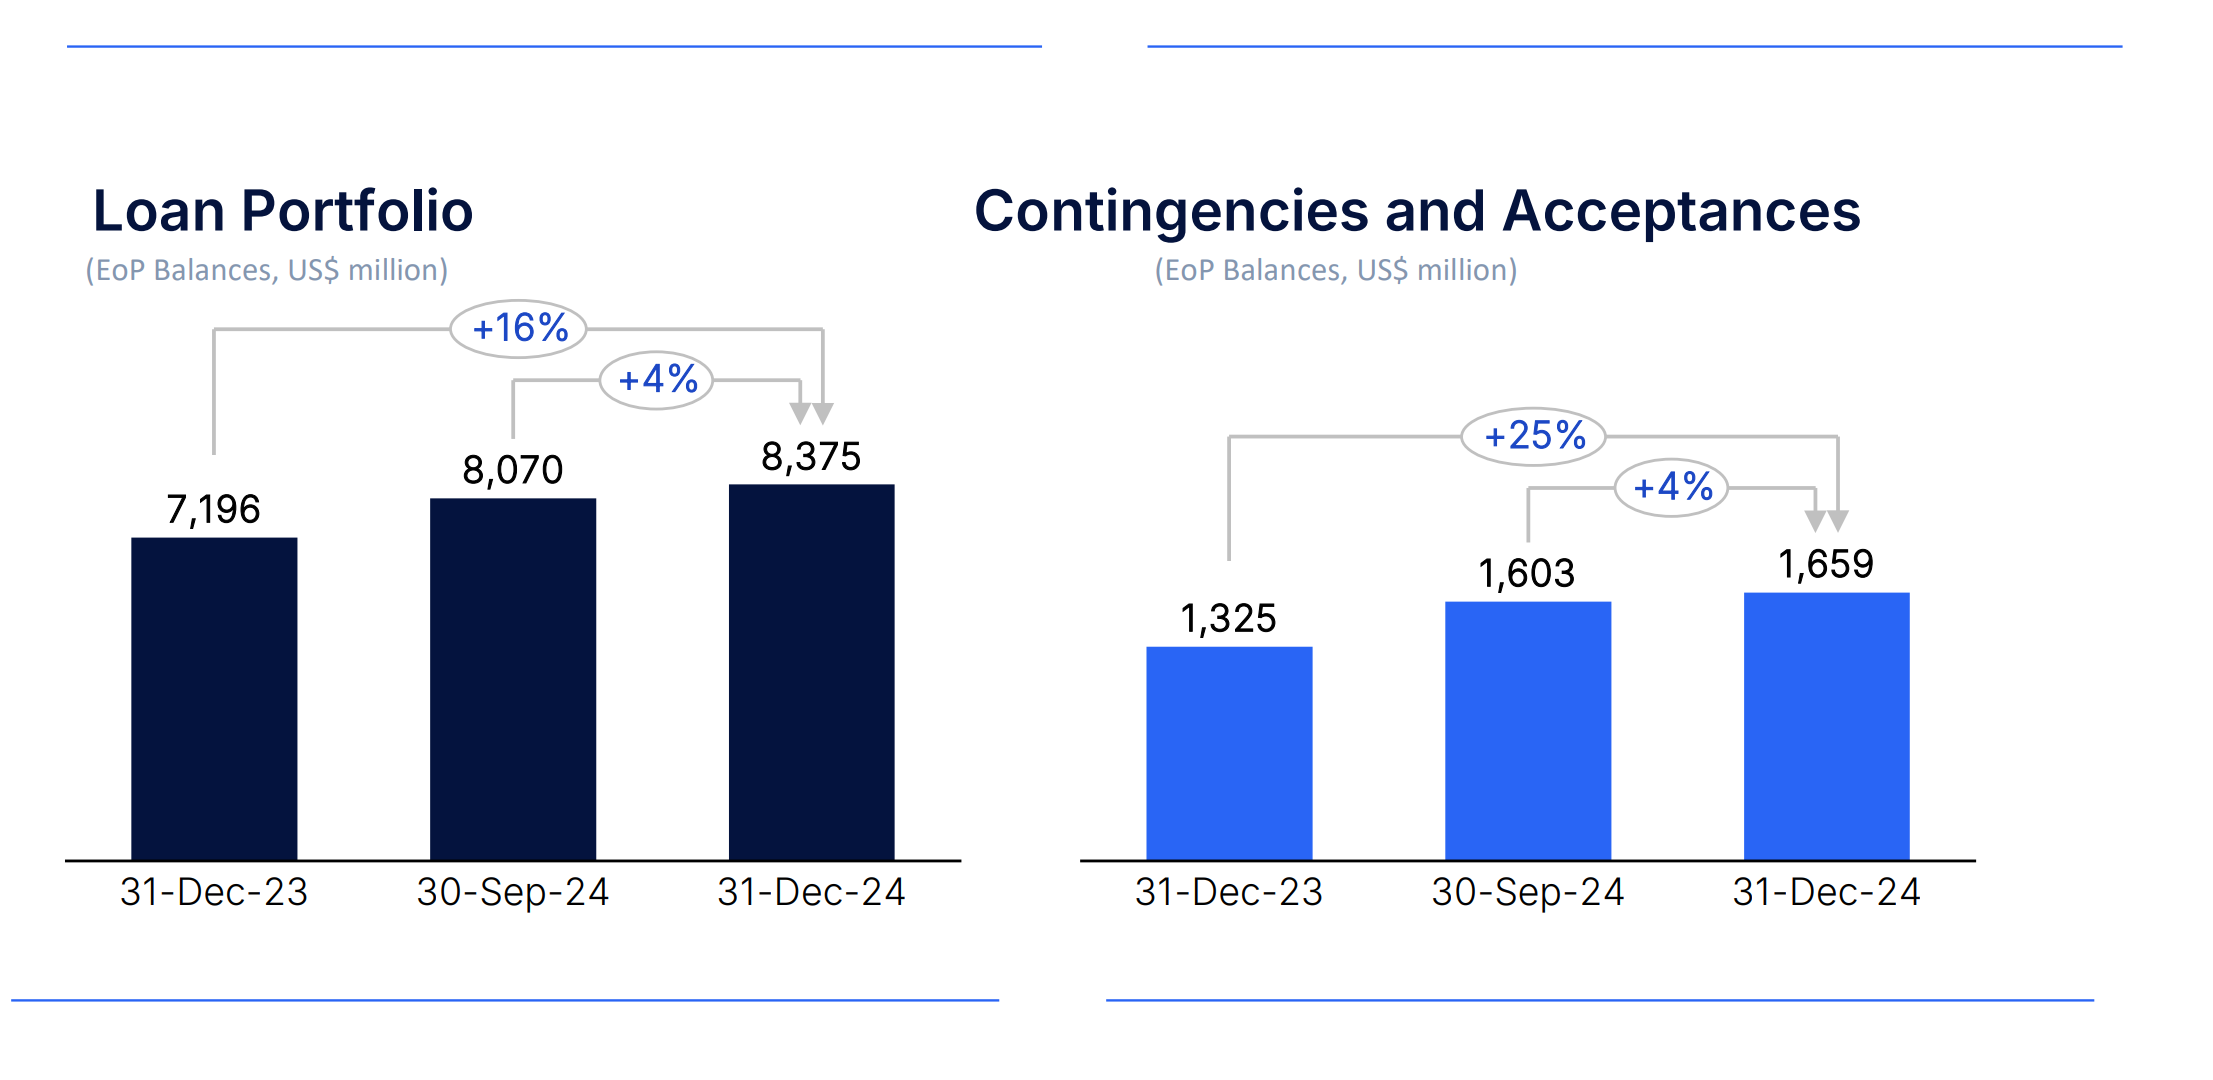
The majority of the Bank’s core financial intermediation business, consisting of gross loans outstanding (or the “Loan Portfolio”), amounted to $8,375 million at the end of 4Q24, increasing 4% QoQ and 16% YoY, denoting continued demand and business growth from new client onboarding and product cross-selling. In addition, contingencies and acceptances amounted to $1,659 million at the end of 4Q24 (+4% QoQ; +25% YoY).
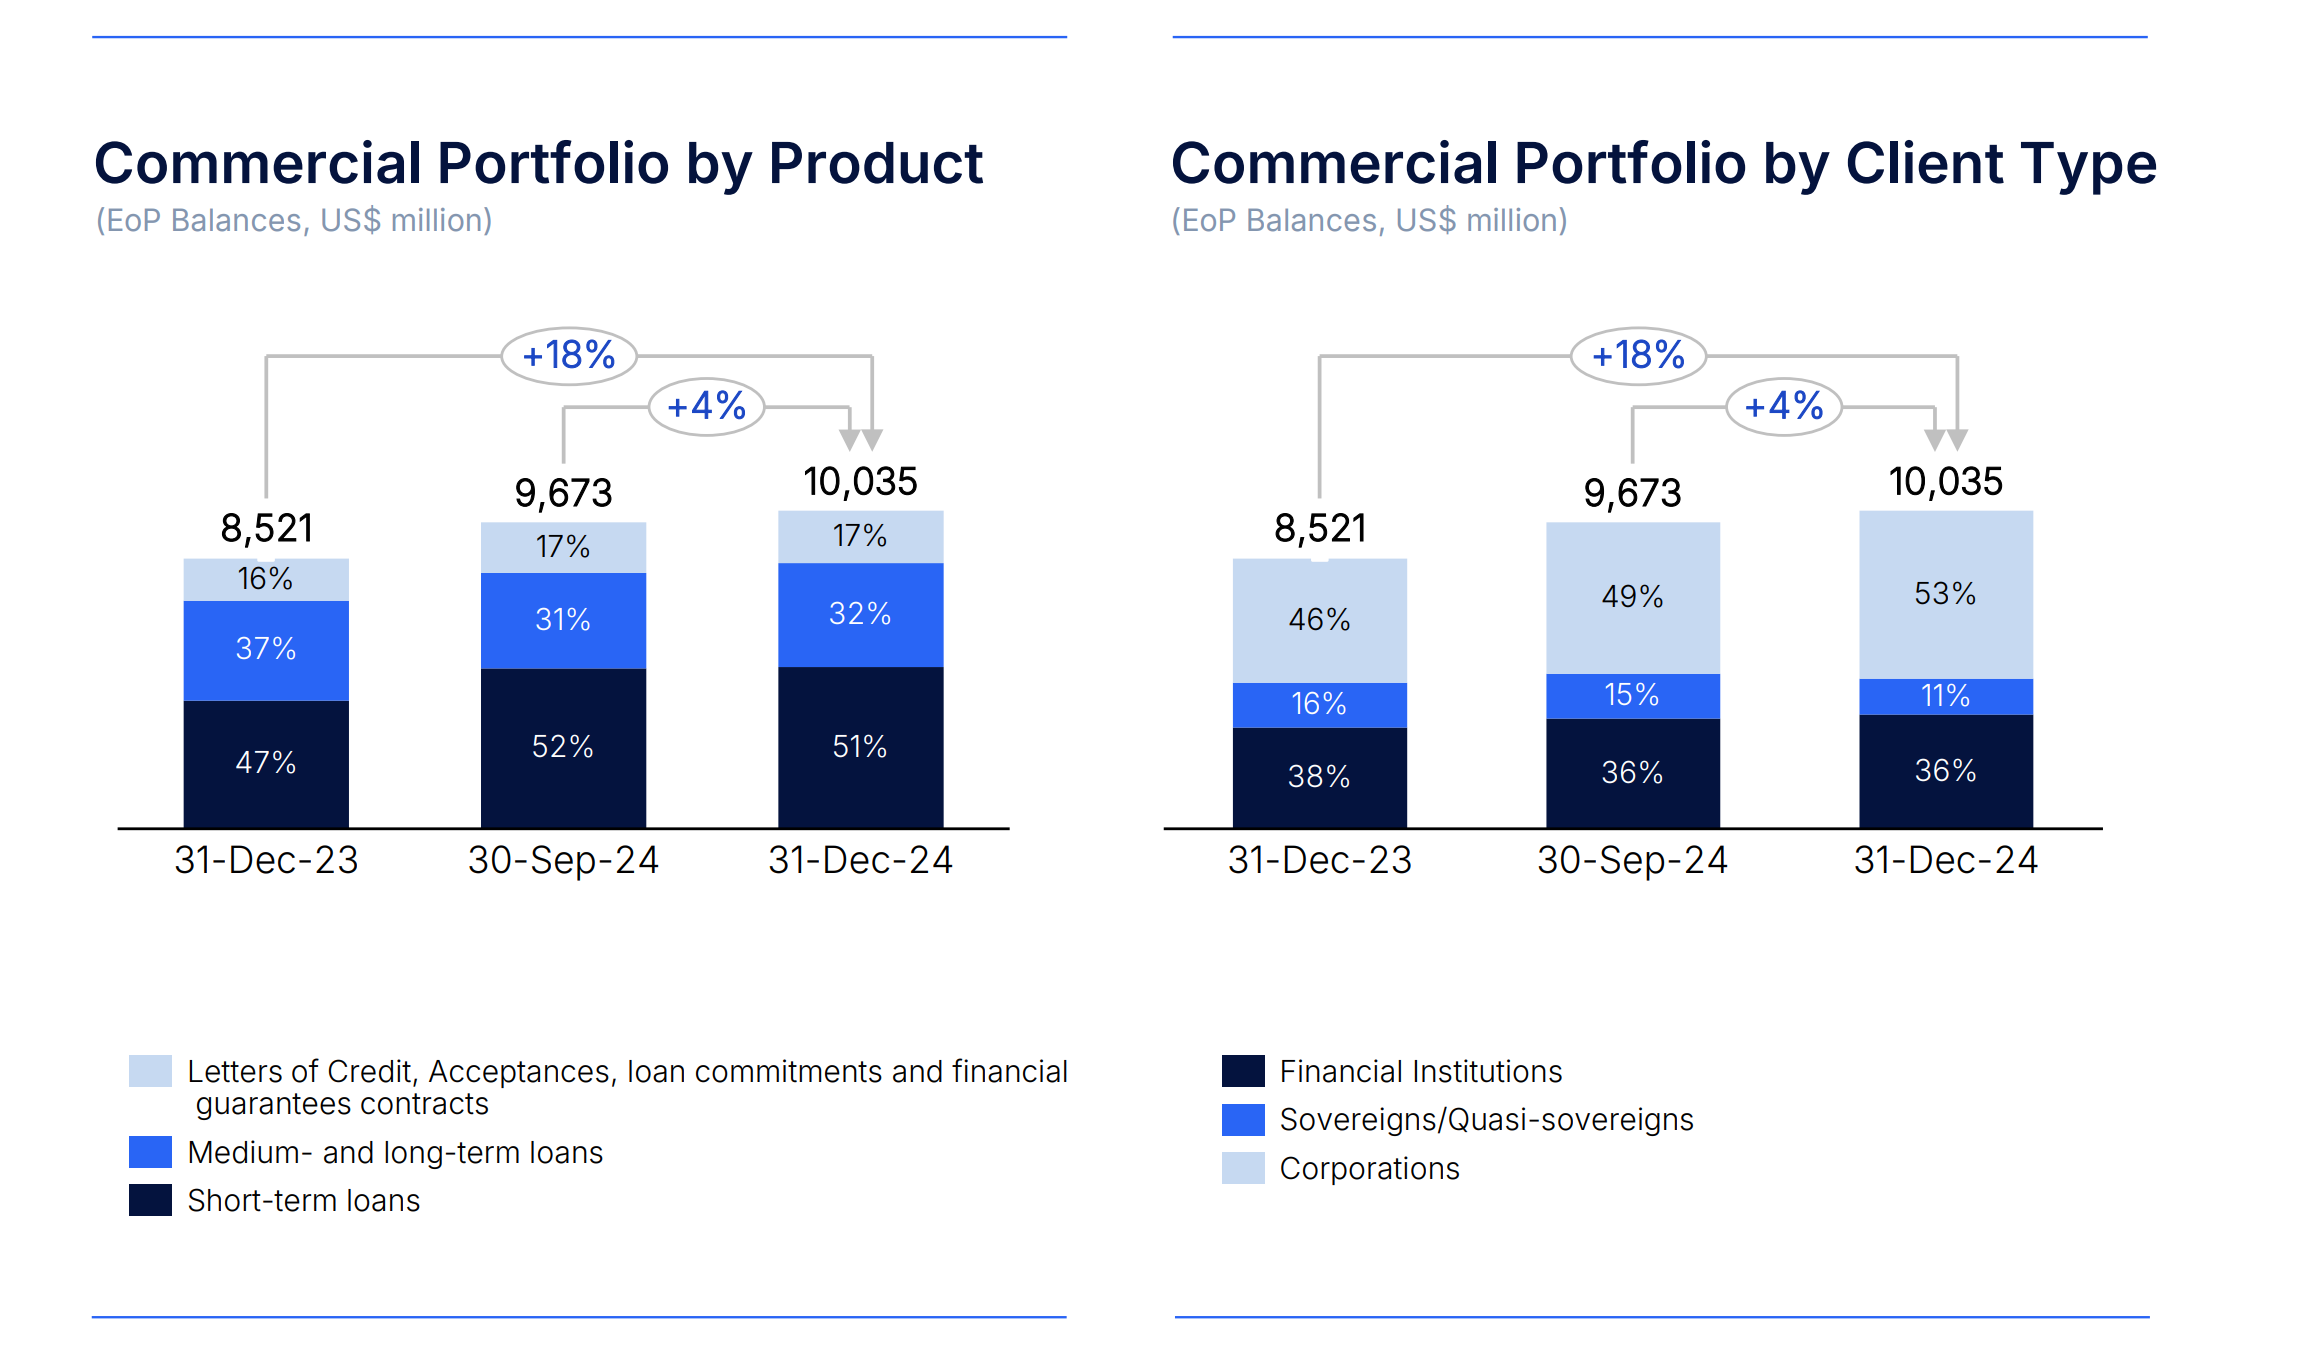
Consequently, the Bank’s Commercial Portfolio reached an all-time high of $10,035 million at the end of 4Q24, increasing 4% from $9,673 million in the prior quarter and increasing 18% from $8,521 million a year ago. In addition, the average Commercial Portfolio balance increased to $9,623 million in 4Q24 (+5% QoQ and +13% YoY) and to $9,046 million in FY24 (+12% YoY).
As of December 31, 2024, 73% of the Commercial Portfolio was scheduled to mature within a year and trade finance transactions accounted for 58% of the Bank’s short-term original book.
Weighted average lending rates stood at 7.90% in 4Q24 (-54bps QoQ; -84bps YoY) and 8.33% in FY24 (+14bps YoY), reflecting USD market-based interest rates reductions during the second half of the year.
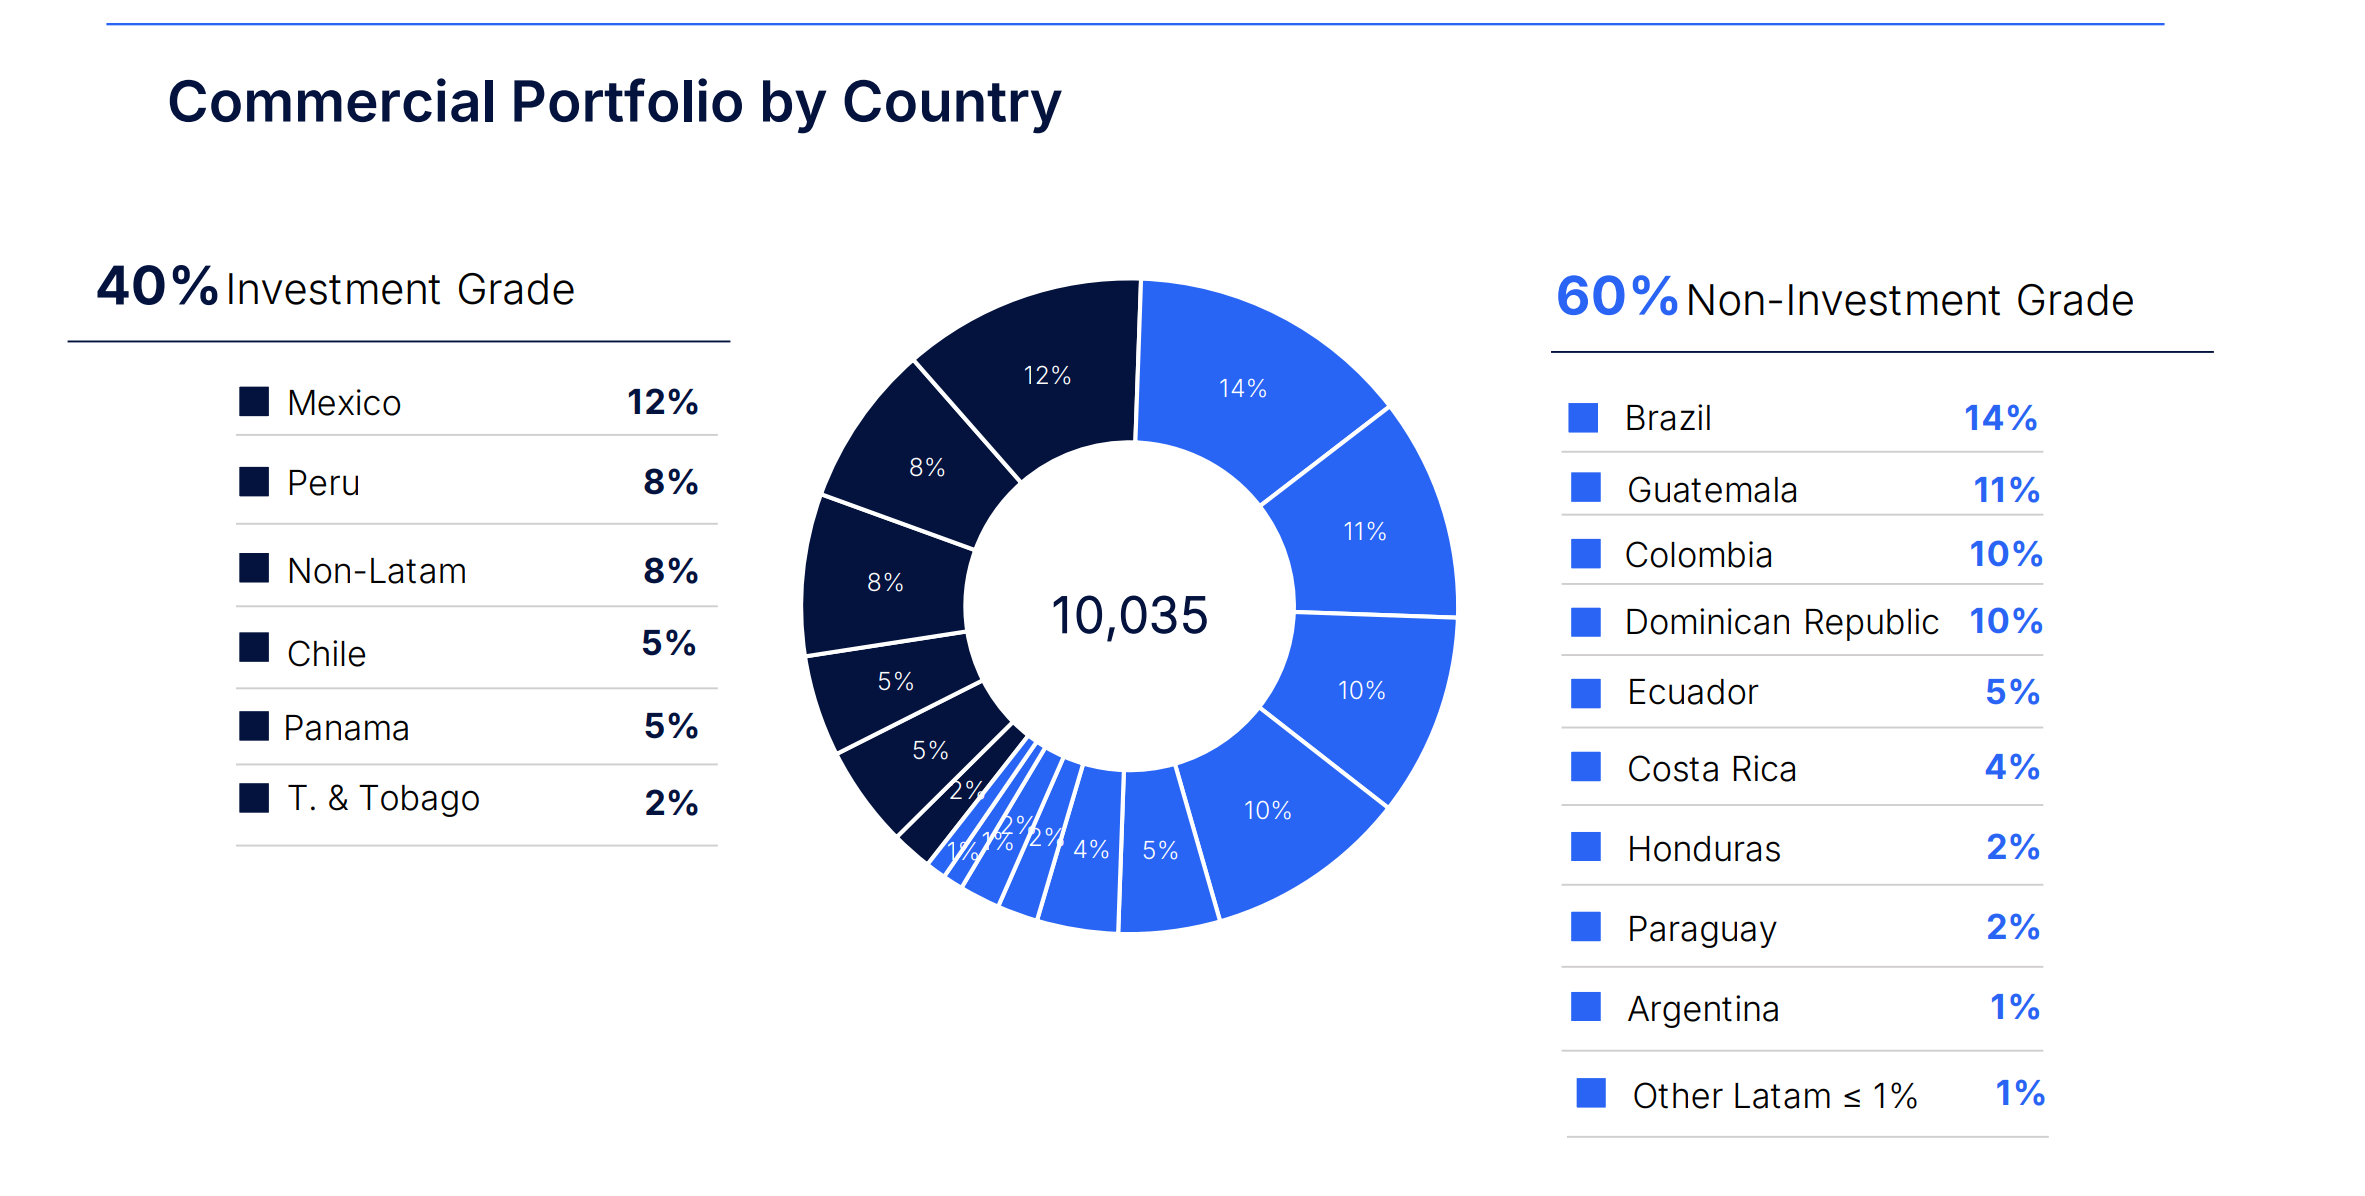
Bladex’s maintains well-diversified exposures across countries and industries. Brazil at 14% of the total Commercial Portfolio, continues to represent the largest country-risk exposure, followed by Mexico at 12%, Guatemala at 11% and Colombia and the Dominican Republic at 10% each. Exposure to top-rated countries outside of Latin America, which relates to transactions carried out in the Region, represented 8% of the portfolio at the end of 4Q24. As of December 31, 2024, 40% of the Commercial Portfolio was geographically distributed in investment grade countries.
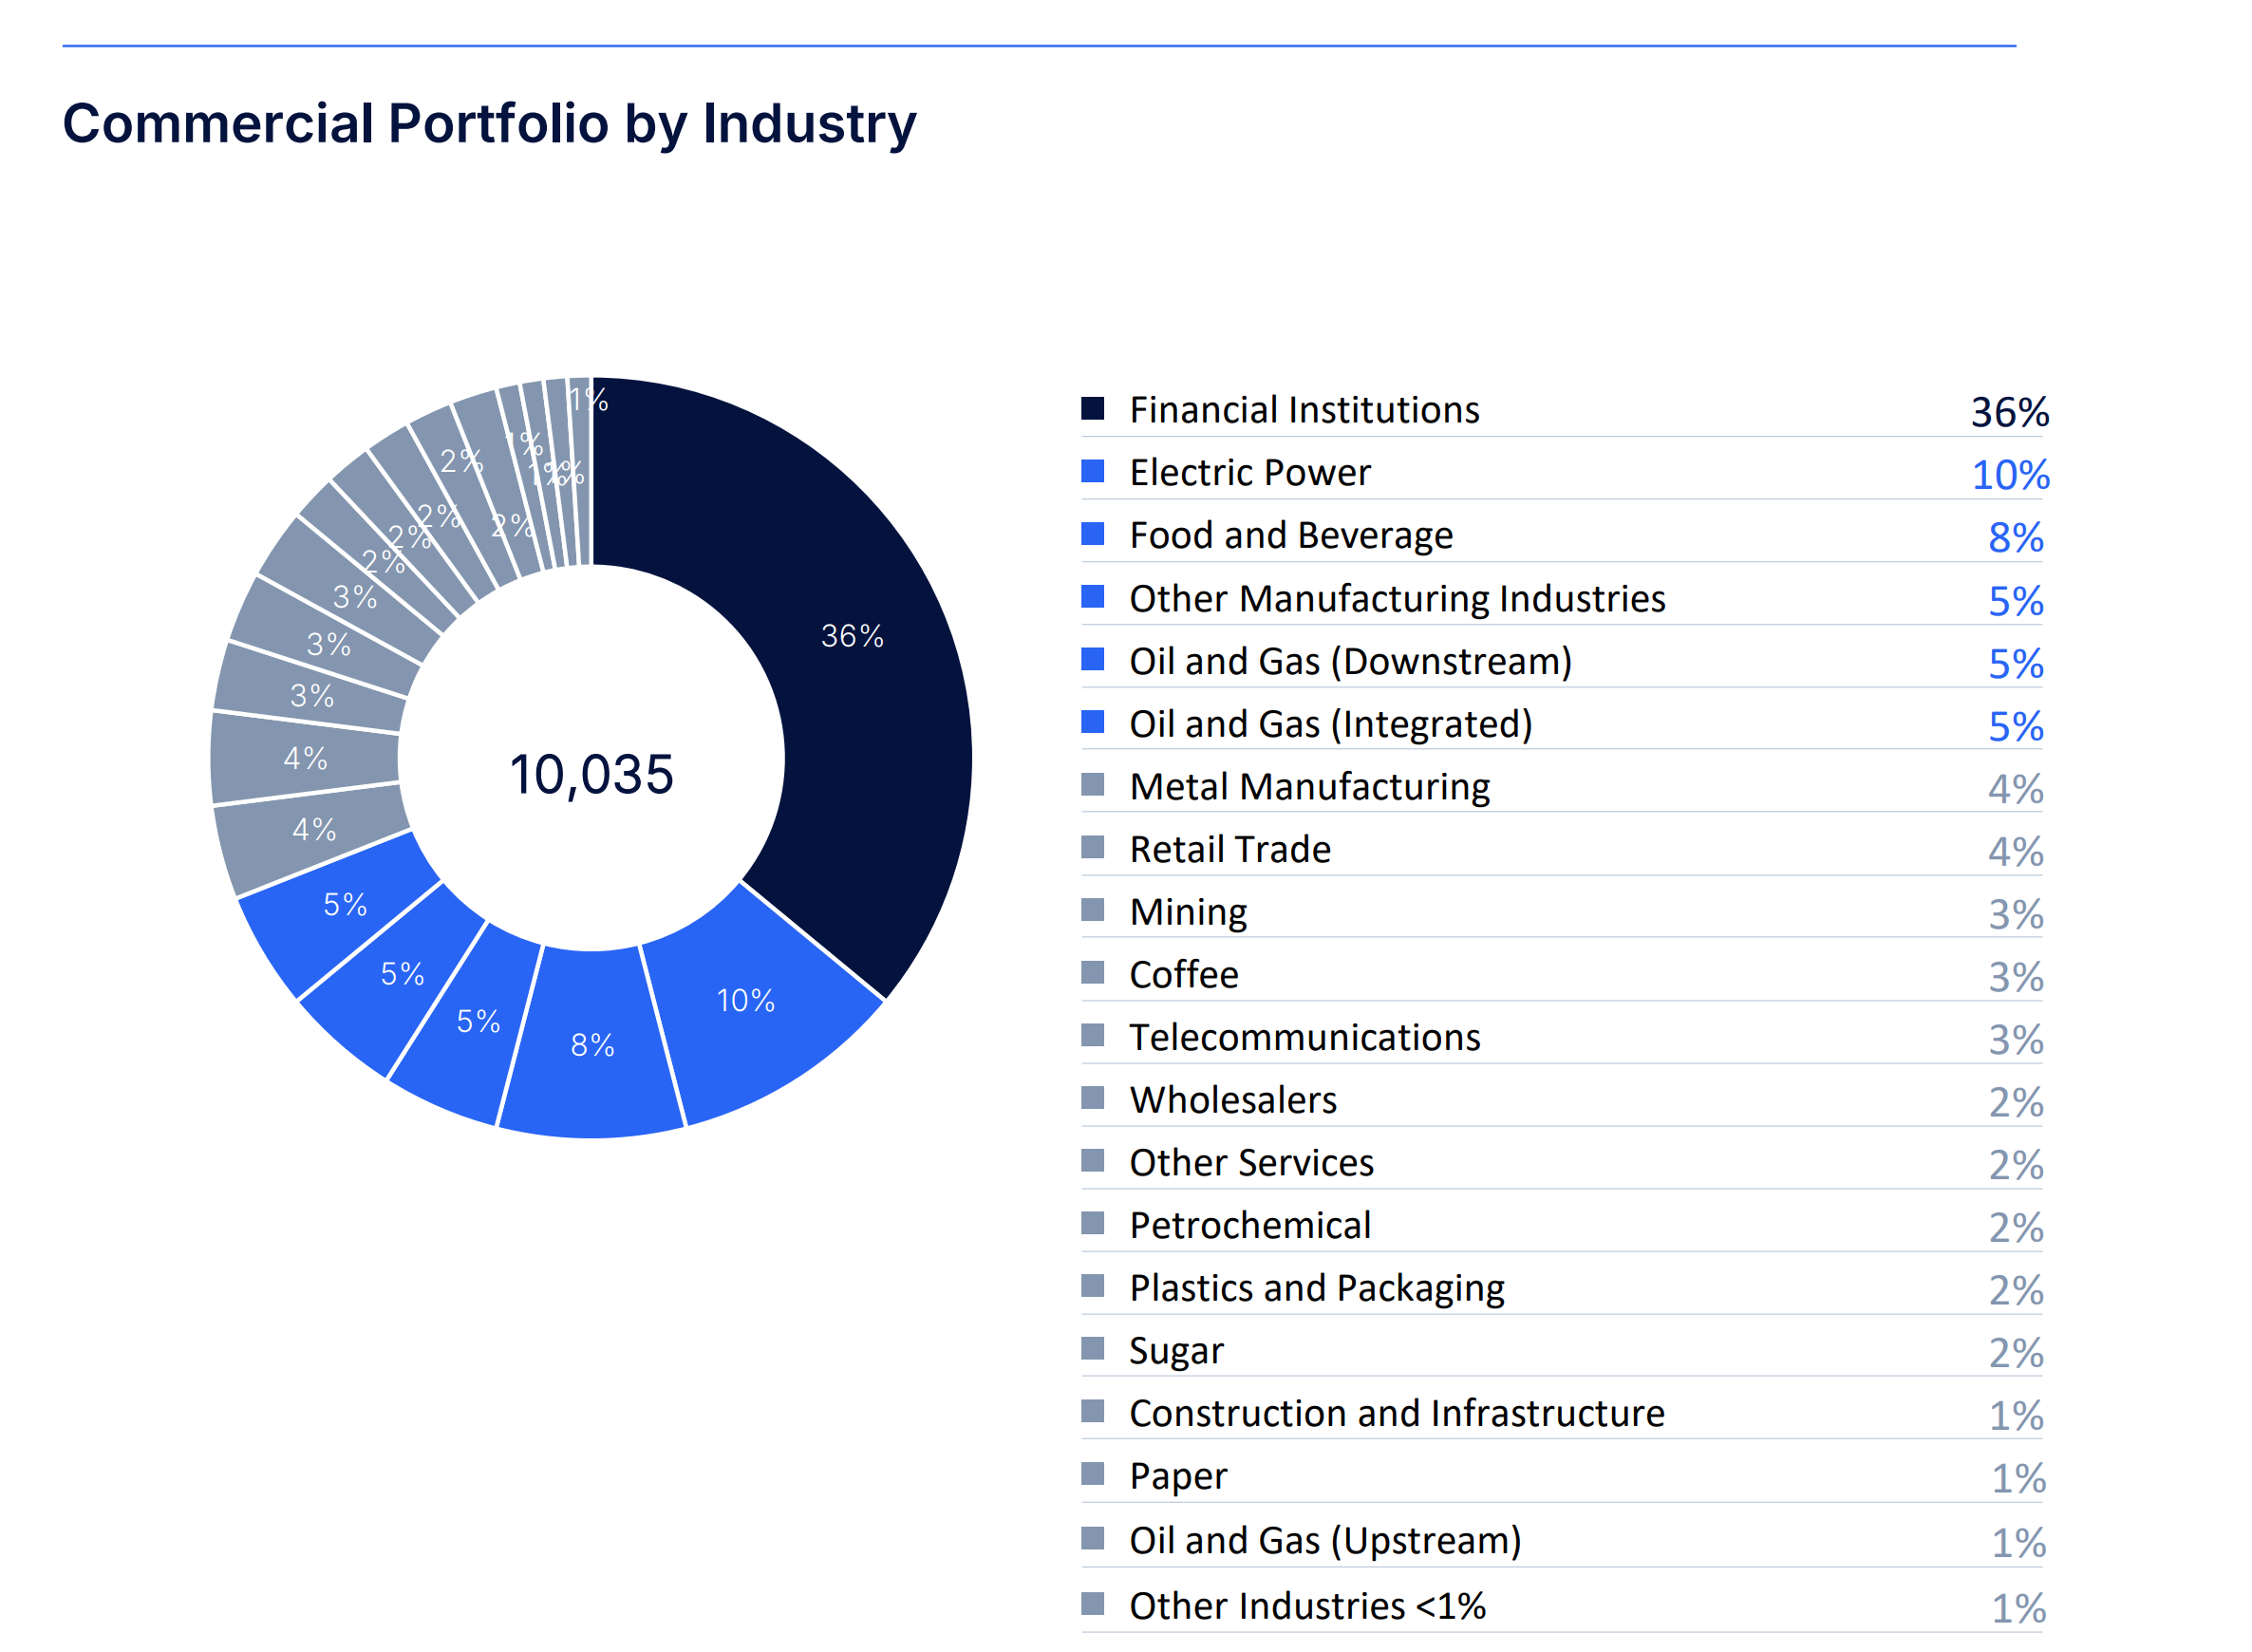
Exposure to the Bank’s traditional client base comprising financial institutions represented 36% of the total, while sovereign and state-owned corporations accounted for another 11%. Exposure to corporates accounted for the remainder 53% of the Commercial Portfolio, comprised of top-tier clients well diversified across sectors, with the most significant exposures in Electric Power at 10%, Food and Beverage at 8% and Other Manufacturing Industries, Oil & Gas (Downstream) and Oil & Gas (Integrated), each at 5% of the Commercial Portfolio at the end of 4Q24.
Refer to Exhibit IX for additional information related to the Bank’s Commercial Portfolio distribution by country.
| | | | | | | | | | | | | | | | | | | | | | | | | | | | | | | | | | | | | | | | | | | | | | | | | | |
| (US$ million) | | 4Q24 | | 3Q24 | | 4Q23 | | QoQ (%) | | YoY (%) | | 2024 | | 2023 | | YoY (%) |
| Commercial Business Segment: | | | | | | | | | | | | | | | | |
| Net interest income | | $ | 59.4 | | | $ | 59.2 | | | $ | 58.0 | | | 0 | % | | 2 | % | | $ | 231.0 | | | $ | 203.7 | | | 13 | % |
| Other income | | 12.2 | | 10.8 | | 10.7 | | 12 | % | | 14 | % | | 45.4 | | 33.8 | | 34 | % |
| Total revenues | | 71.6 | | 70.1 | | 68.7 | | 2 | % | | 4 | % | | 276.4 | | 237.5 | | 16 | % |
| Provision for credit losses | | (4.3) | | (3.4) | | (10.0) | | -26 | % | | 58 | % | | (17.9) | | (26.8) | | 33 | % |
| | | | | | | | | | | | | | | | |
| Operating expenses | | (17.8) | | (16.9) | | (17.1) | | -5 | % | | -4 | % | | (64.0) | | (57.3) | | -12 | % |
| Profit for the segment | | $ | 49.5 | | | $ | 49.8 | | | $ | 41.6 | | | 0 | % | | 19 | % | | $ | 194.5 | | | $ | 153.4 | | | 27 | % |
| | | | | | | | | | | | | | | | |
| | | | | | | | | | | | | | | | |
Commercial Segment Profitability
Profits from the Commercial Business Segment include: (i) net interest income from loans; (ii) fees and commissions from the issuance, confirmation and negotiation of letters of credit, guarantees and loan commitments, as well as through loan structuring and syndication activities; (iii) gain on sale of loans generated through loan intermediation activities, such as sales and distribution in the primary market; (iv) gain (loss) on sale of loans measured at FVTPL; (v) reversal (provision) for credit losses; and (vi) direct and allocated operating expenses.
Commercial Segment Profit totaled $49.5 million in 4Q24 (stable QoQ and +19% YoY) and $194.5 million in FY24 (+27% YoY). The Commercial Segment results were mostly driven by improved top line performance in NII and fee income generation, offsetting provision requirements that resulted from increased Commercial Portfolio balances and higher operating expenses due to increased headcount and the implementation of strategic initiatives.
TREASURY BUSINESS SEGMENT
The Treasury Business Segment manages the Bank’s investment portfolio and overall asset and liability structure to enhance funding efficiency and liquidity, mitigating the traditional financial risks associated with the balance sheet, such as interest rate, liquidity, price, and currency risks. Interest-earning assets managed by the Treasury Business Segment include liquidity positions in cash and cash equivalents, as well as highly liquid corporate debt securities rated ‘A-‘ or above, and financial instruments related to investment management activities, consisting of securities at fair value through other comprehensive income (“FVOCI”) and securities at amortized cost (the “Investment Portfolio”). The Treasury Business Segment also manages the Bank’s interest-bearing liabilities, consisting of deposits, securities sold under repurchased agreements, borrowed funds and floating and fixed rate debt placements.
Liquidity
The Bank’s liquid assets, mostly consisting of cash and due from banks, totaled $1,918 million as of December 31, 2024, compared to $1,708 million as of September 30, 2024, and $1,999 million as of December 31, 2023, conforming with the Bank’s proactive and prudent liquidity management approach, which follows Basel methodology’s liquidity coverage ratio, as required by Panamanian banking regulator. At the end of those periods, liquidity balances to total assets represented 16%, 15% and 19%, respectively, while the liquidity balances to total deposits ratio was 35%, 30% and 45%, respectively. As of December 31, 2024, 53% of total liquid assets represented deposits placed with the Federal Reserve Bank of New York (“FED”), and 33% of total liquid assets represented deposits placed with highly rated U.S. banks.
Investment Portfolio
The Investment Portfolio, aimed to further diversify credit-risk exposures and provide contingent liquidity funding, amounted to $1,189 million in principal amount as of December 31, 2024, down 1% from the previous quarter and up 18% from a year ago. 85% of the Investment Portfolio consists of investment-grade credit securities eligible for the FED discount window, and $99 million consists of highly rated corporate debt securities (‘A-‘ or above) classified as high quality liquid assets (“HQLA”) in accordance with the specifications of the Basel Committee. Refer to Exhibit X for a per-country risk distribution of the Investment Portfolio.
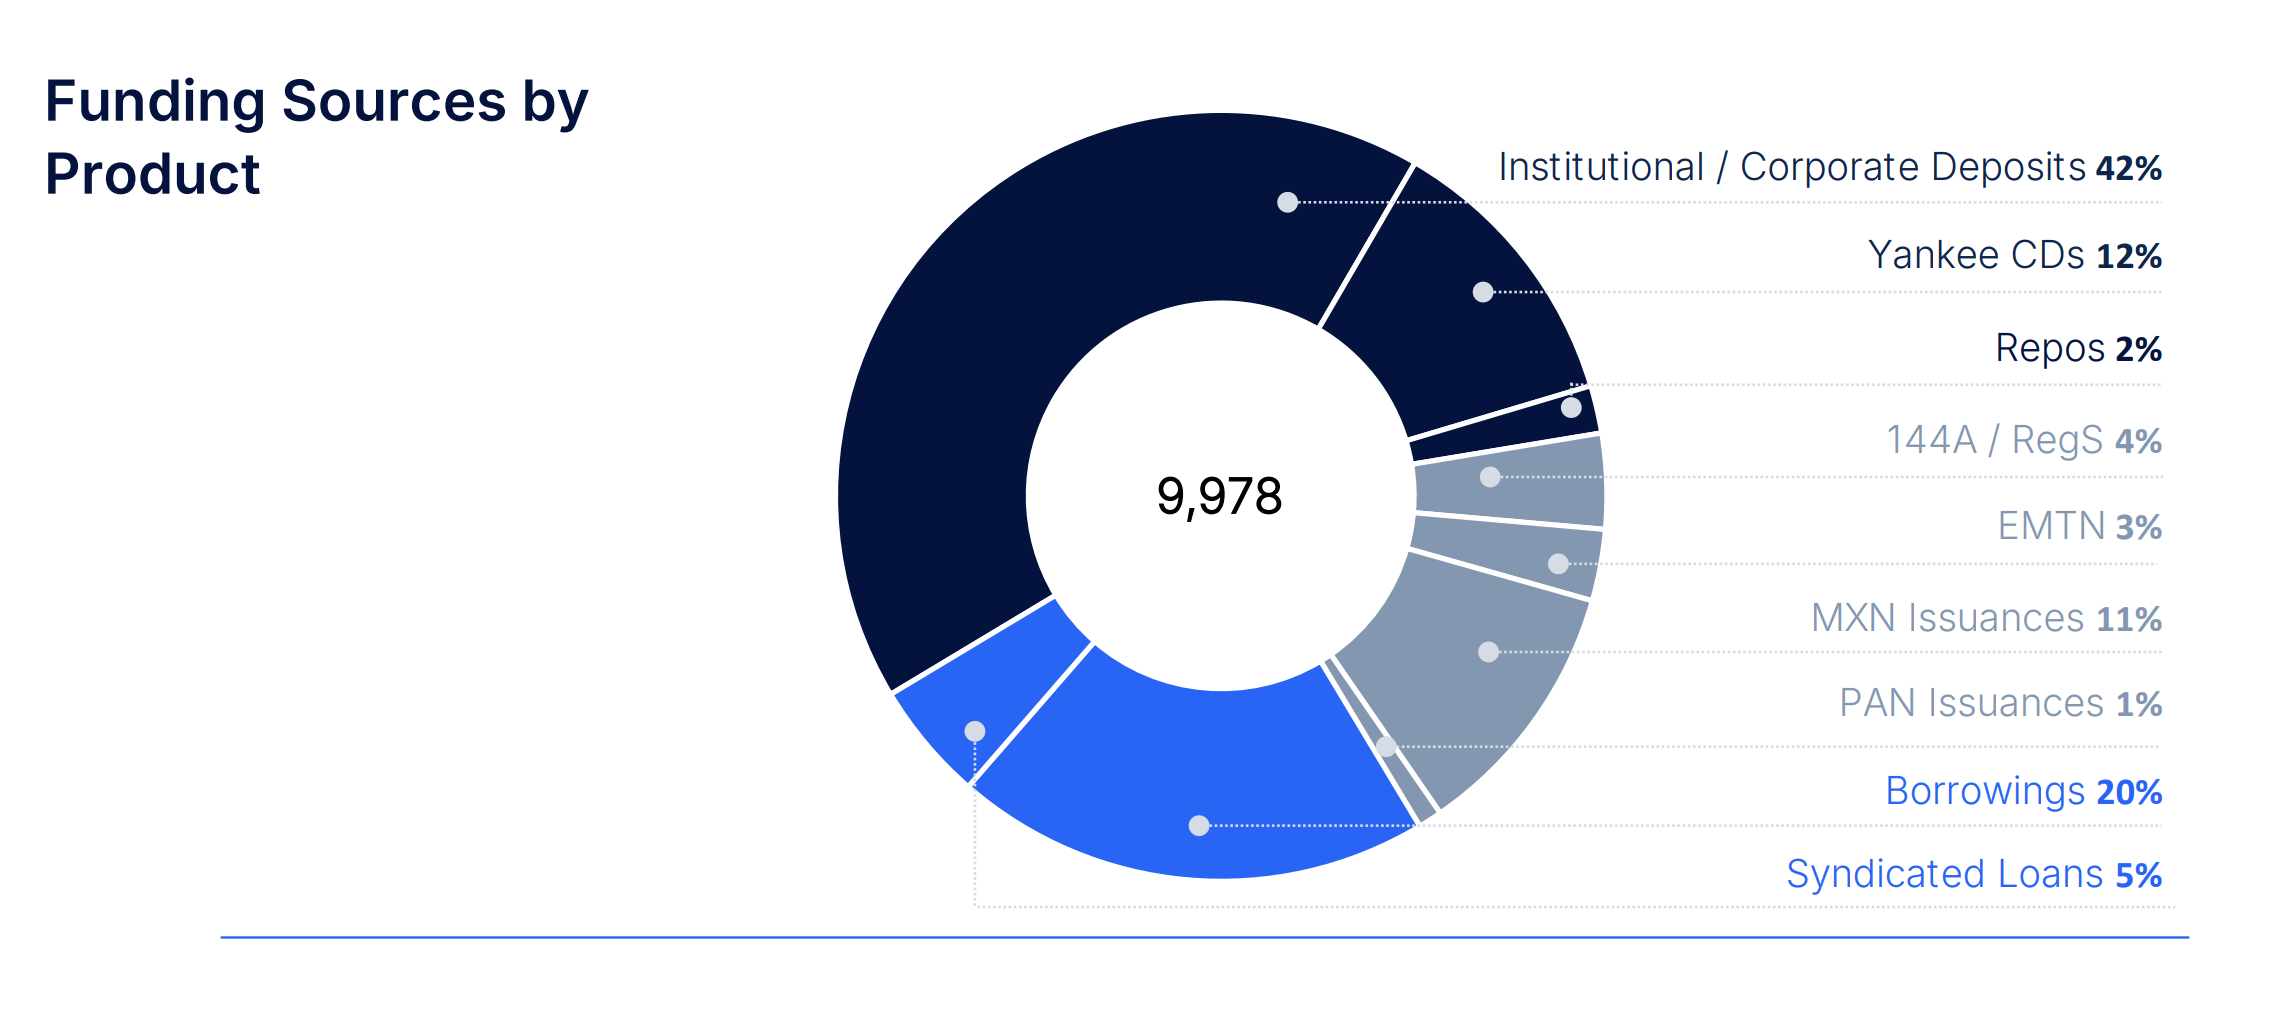
Funding
The Bank’s principal sources of funds are deposits, borrowed funds and floating and fixed rate debt placements. As of December 31, 2024, total net funding amounted to $9,978 million, a 4% increase compared to $9,556 million a quarter ago, and a 10% increase compared to $9,070 million a year ago, as the Bank’s ongoing strategic initiative further enhanced its deposit base.
The Bank obtains deposits from central banks, as well as from multilaterals and commercial banks and corporations primarily located in the Region. Total deposits amounted to $5,413 million at the end of 4Q24 (-4% QoQ and +23% YoY), representing 54% of total funding sources, compared to 49% a year ago, reflecting the change in the funding structure towards increased reliance in deposits.
As of December 31, 2024, the Bank’s Yankee CD program totaled $1,208 million, or 12% of total funding sources, providing granularity and complementing the short-term funding structure and long-standing support from the Bank’s Class A shareholders (i.e.: central banks and their designees), which represented 38% of total deposits at the end of 4Q24.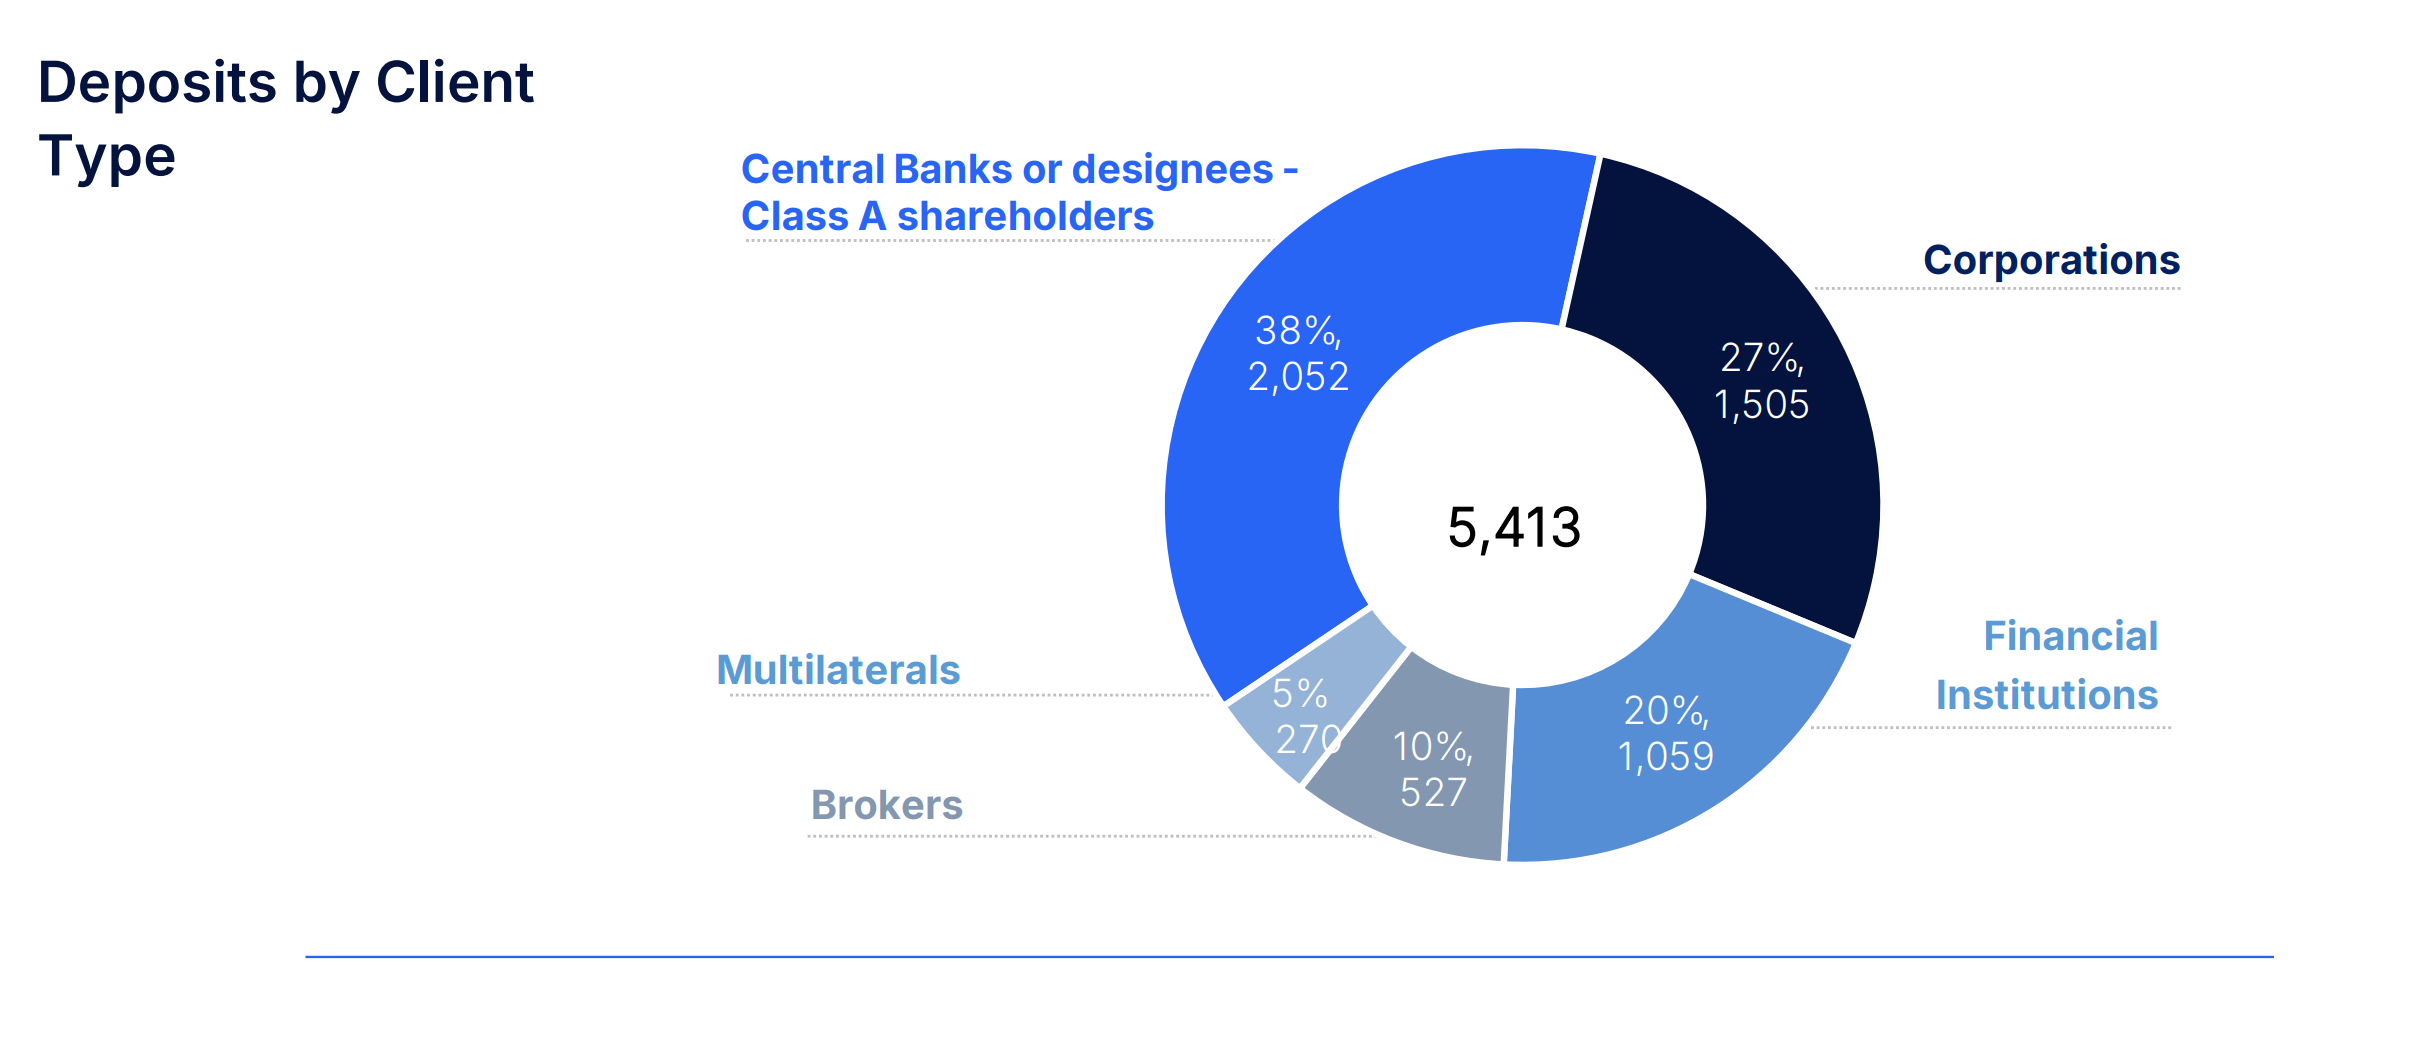
Funding through short- and medium-term borrowings and debt, net increased 22% QoQ and remained stable YoY to $4,352 million at year-end 2024. This ample and constant access to interbank and debt capital markets is clearly evidenced through public debt issuances in Mexico, Panama and the United States, coupled with private debt issuances placed in different markets primarily in Asia, Europe and Latin America. Funding through securities sold under repurchase agreements (“Repos”) reached $213 million at the end of 4Q24 (-39% QoQ; -31% YoY).
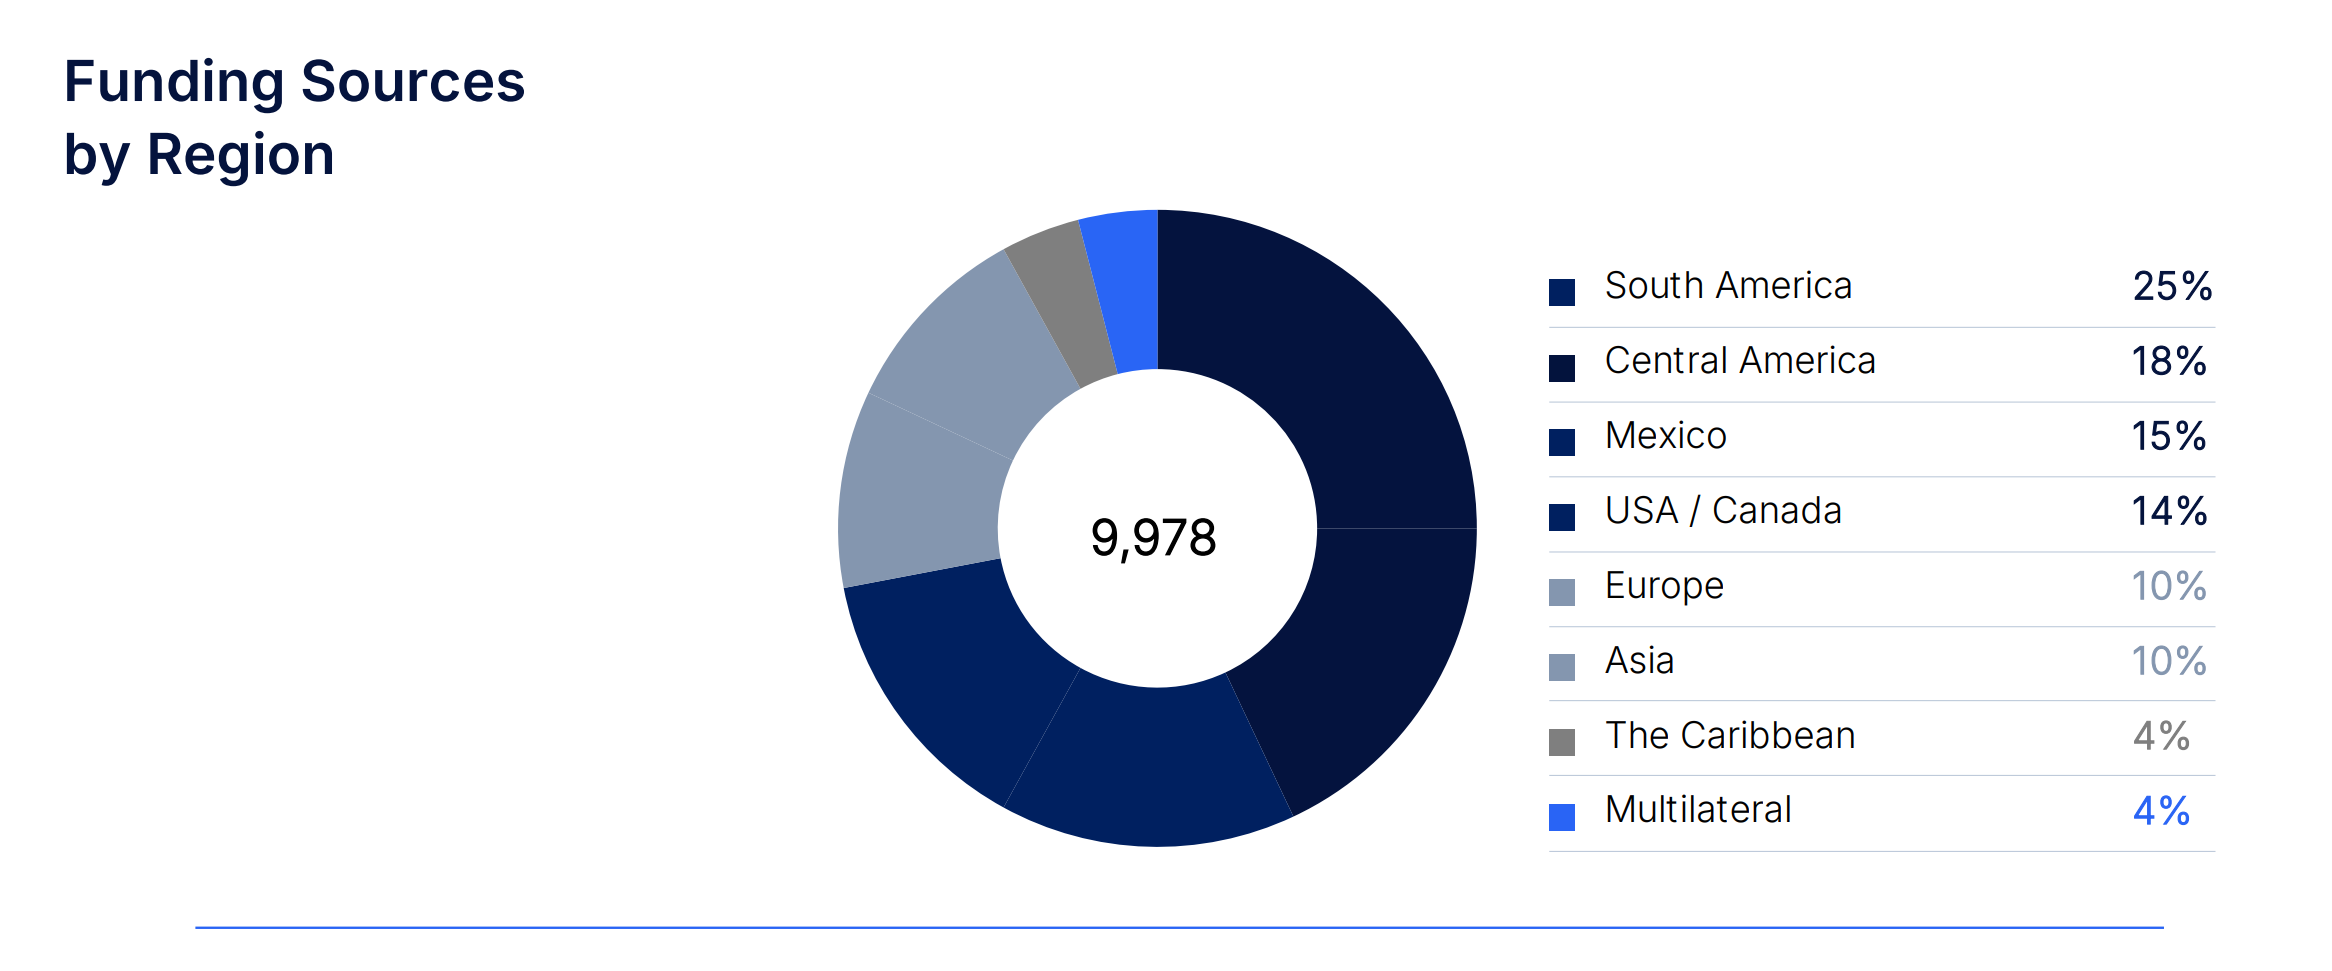
The Bank's funding sources are well diversified across geographies and currencies. In addition, the Bank has no significant foreign exchange risk, nor does it hold material open foreign exchange positions. Funding obtained in other currencies is hedged with derivatives in order to avoid any currency mismatch.
Weighted average funding costs resulted in 5.38% in 4Q24 (-33 bps QoQ; -35 bps YoY) and 5.61% in FY24 (+31 bps), mostly reflecting the market interest rates reductions during the second half of the year.
Treasury Segment Profitability
Profits from the Treasury Business Segment include net interest income derived from the above-mentioned Treasury assets and liabilities, and related net other income (net results from derivative financial instruments and foreign currency exchange, gain (loss) per financial instruments at fair value through profit or loss (“FVTPL”), gain (loss) on sale of securities at FVOCI, and other income), recovery or impairment loss on financial instruments, and direct and allocated operating expenses.
| | | | | | | | | | | | | | | | | | | | | | | | | | | | | | | | | | | | | | | | | | | | | | | | | | |
| (US$ million) | | 4Q24 | | 3Q24 | | 4Q23 | | QoQ (%) | | YoY (%) | | 2024 | | 2023 | | YoY (%) |
| Treasury Business Segment: | | | | | | | | | | | | | | | | |
| Net interest income | | $ | 7.5 | | | $ | 7.4 | | | $ | 7.5 | | | 2 | % | | 0 | % | | $ | 28.3 | | | $ | 29.4 | | | -4 | % |
| Other (expense) income | | (0.7) | | 0.1 | | 1.6 | | -599 | % | | -144 | % | | (1.0) | | (0.9) | | -18 | % |
| Total revenues | | 6.8 | | 7.5 | | 9.1 | | -9 | % | | -25 | % | | 27.2 | | 28.6 | | -5 | % |
| Reversal of (provision for) credit losses | | 0.2 | | (0.2) | | 0.1 | | 216 | % | | 194 | % | | 0.6 | | (0.7) | | 193 | % |
| Operating expenses | | (5.1) | | (4.1) | | (4.3) | | -24 | % | | -17 | % | | (16.5) | | (15.2) | | -9 | % |
| Profit for the segment | | $ | 2.0 | | | $ | 3.2 | | | $ | 4.8 | | | -39 | % | | -59 | % | | $ | 11.4 | | | $ | 12.7 | | | -10 | % |
| | | | | | | | | | | | | | | | |
| | | | | | | | | | | | | | |
The Treasury Business Segment recorded a $2.0 million profit for 4Q24 (-39% QoQ; -59% YoY) and $11.4 million profit for FY24 (-10% YoY). The Treasury’s quarterly and yearly net profit decreases mainly resulted from lower total revenues driven by other expenses mostly related to its hedging derivatives position in 4Q24, along with higher operating expenses. These effects were partially offset by reversals of provisions for credit losses due to increased investment-grade credit securities.
NET INTEREST INCOME AND MARGINS
| | | | | | | | | | | | | | | | | | | | | | | | | | | | | | | | | | | | | | | | | | | | | | | | | | |
| (US$ million, except percentages) | | 4Q24 | | 3Q24 | | 4Q23 | | QoQ (%) | | YoY (%) | | 2024 | | 2023 | | YoY (%) |
| Net Interest Income | | | | | | | | | | | | | | | | |
| Interest income | | $ | 197.4 | | | $ | 198.7 | | | $ | 193.9 | | | -1 | % | | 2 | % | | $ | 785.0 | | | $ | 679.3 | | | 16 | % |
| Interest expense | | (130.5) | | | (132.1) | | | (128.4) | | | -1 | % | | 2 | % | | (525.8) | | | (446.1) | | | 18 | % |
| Net Interest Income ("NII") | | $ | 66.9 | | | $ | 66.6 | | | $ | 65.6 | | | 0 | % | | 2 | % | | $ | 259.2 | | | $ | 233.2 | | | 11 | % |
| | | | | | | | | | | | | | | | |
| Net Interest Spread ("NIS") | | 1.69 | % | | 1.78 | % | | 1.92 | % | | | | | | 1.75 | % | | 1.84 | % | | |
| | | | | | | | | | | | | | | | |
| Net Interest Margin ("NIM") | | 2.44 | % | | 2.55 | % | | 2.62 | % | | | | | | 2.47 | % | | 2.49 | % | | |
Quarterly NII remained relatively stable QoQ and increased 2% YoY to $66.9 million in 4Q24. For the year 2024, NII increased 11% to $259.2 million. The improved NII levels denote a constant increase in business volumes throughout the year, supported by new client on-boarding and cross-selling efforts, together with a higher deposit base allowing for an efficient cost of funds. All of these were partly offset by the effect of USD market interest rates reductions during the second half of the year coupled with increased USD market liquidity towards the end of the year. As a result, NIM decreased to 2.44% in 4Q24 (-11 bps QoQ; -18 bps YoY), while it remained relatively stable at 2.47% in FY24 (-2 bps YoY).
FEES AND COMMISSIONS
Fees and Commissions, net, include revenues associated with the letter of credit business and guarantees, credit commitments, loan structuring and syndication, loan intermediation and distribution in the primary market, and other commissions, net of fee expenses.
| | | | | | | | | | | | | | | | | | | | | | | | | | | | | | | | | | | | | | | | | | | | | | | | | | |
| (US$ million) | | 4Q24 | | 3Q24 | | 4Q23 | | QoQ (%) | | YoY (%) | | 2024 | | 2023 | | YoY (%) |
| Letters of credit and guarantees | | 6.9 | | 7.1 | | 5.9 | | -2 | % | | 18 | % | | 26.5 | | 21.5 | | 24 | % |
| Structuring services | | 3.7 | | 1.5 | | 3.5 | | 153 | % | | 6 | % | | 10.2 | | 7.4 | | 38 | % |
| Credit commitments | | 1.6 | | 2.1 | | 1.2 | | -26 | % | | 36 | % | | 7.7 | | 4.7 | | 65 | % |
| Other commissions | | 0.1 | | | 0.1 | | | 0.0 | | | -36 | % | | n.m. | | 1.0 | | | 0.0 | | | n.m. |
| Total fee and commission income | | 12.3 | | | 10.8 | | | 10.5 | | | 14 | % | | 17 | % | | 45.5 | | | 33.6 | | | 36 | % |
| Fees and commission expense | | -0.4 | | | -0.3 | | | -0.4 | | | -39 | % | | 10 | % | | -1.1 | | | -1.0 | | | -3 | % |
| Fees and Commissions, net | | $ | 11.9 | | | $ | 10.5 | | | $ | 10.1 | | | 13 | % | | 18 | % | | $ | 44.4 | | | $ | 32.5 | | | 37 | % |
Fees and Commissions, net, resulted in $11.9 million in 4Q24 (+13% QoQ; +18% YoY) and $44.4 million in FY24 (+37% YoY). The quarterly results were mostly driven by the increase in activity from the Bank’s loan syndication desk, as well as solid fees from our off-balance sheet business (letters of credit and commitments). The yearly increase was driven by stronger fees in each of the Bank’s business lines, stemming from the continued addition of new clients, streamlined processes and the capture of profitable transactional opportunities.
PORTFOLIO QUALITY AND TOTAL ALLOWANCE FOR CREDIT LOSSES
| | | | | | | | | | | | | | | | | | | | | | | | | | | | | | | | | | | | | | | | | | | | |
| (US$ million, except percentages) | | 4Q24 | | 3Q24 | | 2Q24 | | 1Q24 | | 4Q23 | | 2024 | | 2023 |
| Allowance for loan losses | | | | | | | | | | | | | | |
| Balance at beginning of the period | | $ | 71.9 | | | $ | 63.3 | | | $ | 59.6 | | | $ | 59.4 | | | $ | 49.9 | | | $ | 59.4 | | | $ | 55.2 | |
| Provisions (reversals) | | 6.3 | | | 7.5 | | | 3.7 | | | 0.1 | | | 9.5 | | | 17.6 | | | 25.4 | |
| Recoveries (write-offs) | | 0.0 | | | 1.1 | | | 0.0 | | | 0.0 | | | 0.0 | | | 1.1 | | | (21.1) | |
| End of period balance | | $ | 78.2 | | | $ | 71.9 | | | $ | 63.3 | | | $ | 59.6 | | | $ | 59.4 | | | $ | 78.2 | | | $ | 59.4 | |
| | | | | | | | | | | | | | |
| Allowance for loan commitments and financial guarantee contract losses | | | | | | | | | | | | | | |
| Balance at beginning of the period | | $ | 7.4 | | | $ | 11.5 | | | $ | 8.6 | | | $ | 5.1 | | | $ | 4.5 | | | $ | 5.1 | | | $ | 3.6 | |
| Provisions (reversals) | | (2.0) | | | (4.1) | | | 2.9 | | | 3.6 | | | 0.5 | | | 0.3 | | | 1.4 | |
| End of period balance | | $ | 5.4 | | | $ | 7.4 | | | $ | 11.5 | | | $ | 8.6 | | | $ | 5.1 | | | $ | 5.4 | | | $ | 5.1 | |
| | | | | | | | | | | | | | |
| Allowance for Investment Portfolio losses | | | | | | | | | | | | | | |
| Balance at beginning of the period | | $ | 1.5 | | | $ | 1.4 | | | $ | 1.3 | | | $ | 1.6 | | | $ | 1.7 | | | $ | 1.6 | | | $ | 8.0 | |
| Provisions (reversals) | | (0.2) | | | 0.2 | | | 0.1 | | | (0.7) | | | (0.1) | | | (0.6) | | | 0.7 | |
| Recoveries (write-offs) | | 0.0 | | | 0.0 | | | 0.0 | | | 0.3 | | | 0.0 | | | 0.3 | | | (7.0) | |
| End of period balance | | $ | 1.3 | | | $ | 1.5 | | | $ | 1.4 | | | $ | 1.3 | | | $ | 1.6 | | | $ | 1.3 | | | $ | 1.6 | |
| | | | | | | | | | | | | | |
| Total allowance for losses | | $ | 84.9 | | | $ | 80.8 | | | $ | 76.1 | | | $ | 69.5 | | | $ | 66.1 | | | $ | 84.9 | | | $ | 66.1 | |
| | | | | | | | | | | | | | |
(at the end of each period)
Total allowance for losses to Credit Portfolio | | 0.8 | % | | 0.7 | % | | 0.7 | % | | 0.7 | % | | 0.7 | % | | 0.8 | % | | 0.7 | % |
| Credit-impaired loans to Loan Portfolio | | 0.2 | % | | 0.2 | % | | 0.1 | % | | 0.1 | % | | 0.1 | % | | 0.2 | % | | 0.1 | % |
| Impaired Credits to Credit Portfolio | | 0.2 | % | | 0.2 | % | | 0.1 | % | | 0.1 | % | | 0.1 | % | | 0.2 | % | | 0.1 | % |
| Total allowance for losses to credit-impaired loans (times) | | 5.0 | | 4.7 | | 7.5 | | 6.9 | | 6.5 | | 5.0 | | 6.5 |
| | | | | | | | | | | | | | |
| Stage 1 Exposure (low risk) to Total Credit Portfolio | | 96.4 | % | | 95.7 | % | | 94.5 | % | | 96.5 | % | | 96.1 | % | | 96.4 | % | | 96.1 | % |
| Stage 2 Exposure (increased risk) to Total Credit Portfolio | | 3.5 | % | | 4.1 | % | | 5.5 | % | | 3.4 | % | | 3.8 | % | | 3.5 | % | | 3.8 | % |
| Stage 3 Exposure (credit impaired) to Total Credit Portfolio | | 0.2 | % | | 0.2 | % | | 0.1 | % | | 0.1 | % | | 0.1 | % | | 0.2 | % | | 0.1 | % |
As of December 31, 2024, the total allowance for credit losses stood at $84.9 million, representing a coverage ratio of 0.8% for the Credit Portfolio, compared to $80.8 million, or 0.7%, at the end of 3Q24, and $66.1 million, or 0.7%, at the end of
4Q23. The $4.1 million quarterly increase in total allowance for credit losses mostly resulted from the growth of the Bank’s Credit Portfolio (+3% QoQ), along with increased reserves for certain exposures in Stage 2.
As of December 31, 2024, impaired credits (Stage 3) remained at $17 million, or 0.2% of total Credit Portfolio, with ample reserve coverage, compared to $17 million in the previous quarter and $10 million a year ago. Total allowance for credit losses to impaired credits resulted in 5.0 times. Credits categorized as Stage 1 or low-risk credits under IFRS 9 accounted for 96.4% of total credits, while Stage 2 credits represented 3.5% of total credits.
OPERATING EXPENSES AND EFFICIENCY
| | | | | | | | | | | | | | | | | | | | | | | | | | | | | | | | | | | | | | | | | | | | | | | | | | |
| (US$ million, except percentages) | | 4Q24 | | 3Q24 | | 4Q23 | | QoQ (%) | | YoY (%) | | 2024 | | 2023 | | YoY (%) |
| Operating expenses | | | | | | | | | | | | | | | | |
| Salaries and other employee expenses | | 14.3 | | | 14.2 | | | 13.5 | | | 1 | % | | 6 | % | | 51.9 | | | 47.2 | | | 10 | % |
| Depreciation and amortization of equipment, leasehold improvements | | 0.7 | | | 0.6 | | | 0.6 | | | 14 | % | | 16 | % | | 2.5 | | | 2.3 | | | 10 | % |
| Amortization of intangible assets | | 0.3 | | | 0.3 | | | 0.2 | | | 12 | % | | 42 | % | | 1.1 | | | 0.8 | | | 31 | % |
| Other expenses | | 7.6 | | | 6.0 | | | 7.2 | | | 27 | % | | 5 | % | | 25.0 | | | 22.2 | | | 13 | % |
| Total Operating Expenses | | $ | 22.9 | | | $ | 21.0 | | | $ | 21.4 | | | 9 | % | | 7 | % | | $ | 80.5 | | | $ | 72.5 | | | 11 | % |
| Efficiency Ratio | | 29.2 | % | | 27.1 | % | | 27.6 | % | | | | | | 26.5 | % | | 27.2 | % | | |
Operating expenses totaled $22.9 million in 4Q24 (+9% QoQ; +7% YoY) and $80.5 million in FY24 (+11% YoY). Overall expense increases were mostly associated with higher personnel expenses from increased headcount aimed at enhancing business volumes and strengthening the Bank’s strategy execution capabilities, and other expenses resulting from ongoing investments in technology and business initiatives related to strategy execution.
The Efficiency Ratio stood at 29.2% in 4Q24, compared to 27.1% in 3Q24 and 27.6% a year ago, denoting an annual increase and seasonally higher expenses at year-end. The Efficiency Ratio for FY24 improved to 26.5%, compared to 27.2% a year ago, as the 14% increase in total revenues overcompensated the 11% increase in operating expenses throughout the year.
CAPITAL RATIOS AND CAPITAL MANAGEMENT
The following table shows capital amounts and ratios as of the dates indicated:
| | | | | | | | | | | | | | | | | | | | | | | | | | | | | | | | |
| (US$ million, except percentages and shares outstanding) | | 31-Dec-24 | | 30-Sep-24 | | 31-Dec-23 | | QoQ (%) | | YoY (%) |
| Total equity | | $ | 1,337 | | | $ | 1,310 | | | $ | 1,204 | | | 2 | % | | 11 | % |
Tier 1 capital to risk weighted assets (Basel III – IRB)(10) | | 15.5 | % | | 16.0 | % | | 15.4 | % | | -3 | % | | 1 | % |
Risk-Weighted Assets (Basel III – IRB)(10) | | $ | 8,604 | | | $ | 8,193 | | | $ | 7,806 | | | 5 | % | | 10 | % |
Capital Adequacy Ratio (Regulatory) (11) | | 13.6 | % | | 13.7 | % | | 13.6 | % | | -1 | % | | 0 | % |
Risk-Weighted Assets (Regulatory) (11) | | $ | 9,874 | | | $ | 9,572 | | | $ | 8,898 | | | 3 | % | | 11 | % |
| Total assets / Total equity (times) | | 8.9 | | 8.7 | | 8.9 | | 2 | % | | -1 | % |
| Shares outstanding (in thousand) | | 36,791 | | 36,787 | | 36,540 | | 0 | % | | 1 | % |
The Bank’s equity consists entirely of issued and fully paid ordinary common stock, with 36.8 million common shares outstanding as of December 31, 2024. At the same date, the Tier 1 Basel III Capital Ratio, in which risk-weighted assets
are calculated under the advanced internal ratings-based approach (IRB) for credit risk, resulted in 15.5%, enhanced by strong earnings generation and within the Bank’s risk appetite. Similarly, the Bank’s Capital Adequacy Ratio, as defined by Panama’s banking regulator under Basel’s standardized approach, was 13.6% as of December 31, 2024, well above the regulatory minimum.
RECENT EVENTS
•Quarterly dividend payment: The Board of Directors approved a quarterly common dividend of $0.625 per share corresponding to 4Q24. The cash dividend will be paid on March 25, 2025, to shareholders registered as of March 10, 2025.
•Bond issuance process in Colombia: On February 14, 2025, Resolution No. 0124 of January 29, 2025, became final and non-appealable, through which the Financial Superintendency of Colombia authorized the registration and public offering of up to COP $300,000,000,000 ordinary bonds of the Bank in the National Registry of Securities and Issuers - Registro Nacional de Valores y Emisores.
•CFO succession: As previously announced on Form 6-K submitted to the SEC on November 19, 2024, Mrs. Ana Graciela de Mendez has decided to retire as Chief Financial Officer and will be succeeded by Mrs. Annette van Hoorde de Solis effective in April 2025.
Notes:
•Numbers and percentages set forth in this earnings release have been rounded and accordingly may not total exactly.
•QoQ and YoY refer to quarter-on-quarter and year-on-year variations, respectively.
Footnotes:
(1)Earnings per Share ("EPS") calculation is based on the average number of shares outstanding during each period.
(2)ROE refers to return on average stockholders' equity which is calculated on the basis of unaudited daily average balances.
(3)ROA refers to return on average assets which is calculated on the basis of unaudited daily average balances.
(4)NIM refers to net interest margin which constitutes to Net Interest Income (NII) divided by the average balance of interest-earning assets.
(5)NIS refers to net interest spread which constitutes the average yield earned on interest-earning assets, less the average yield paid on interest-bearing liabilities.
(6)Efficiency Ratio refers to consolidated operating expenses as a percentage of total revenues.
(7)The Bank's Credit Portfolio includes gross loans outstanding (or the Loan Portfolio), securities at FVOCI and at amortized cost, gross of interest receivable and the allowance for expected credit losses, loan commitments and financial guarantee contracts, such as confirmed and stand-by letters of credit, and guarantees covering commercial risk; and other assets consisting of customers' liabilities under acceptances.
(8)The Bank's Commercial Portfolio includes gross loans outstanding (or the Loan Portfolio), loan commitments and financial guarantee contracts, such as issued and confirmed letters of credit, stand-by letters of credit, guarantees covering commercial risk and other assets consisting of customers' liabilities under acceptances.
(9)Market capitalization corresponds to total outstanding common shares multiplied by market close price at the end of each corresponding period.
(10)Tier 1 Capital ratio is calculated according to Basel III capital adequacy guidelines, and as a percentage of risk-weighted assets. Risk-weighted assets are estimated based on Basel III capital adequacy guidelines, utilizing internal-ratings based approach or IRB for credit risk and standardized approach for operational risk.
(11)As defined by the Superintendency of Banks of Panama through Rules No. 01-2015, 03-2016 and 05-2023, based on Basel III standardized approach. The capital adequacy ratio is defined as the ratio of capital funds to risk-weighted
assets, rated according to the asset's categories for credit risk. In addition, risk-weighted assets consider calculations for market risk and operating risk.
(12)Liquid assets consist of total cash and due from banks, less time deposits with original maturity over 90 days and other restricted deposits, as well as corporate debt securities rated A- or above. Liquidity ratio refers to liquid assets as a percentage of total assets.
(13)Loan Portfolio refers to gross loans outstanding, excluding interest receivable, the allowance for loan losses, and unearned interest and deferred fees. Credit-impaired loans are also commonly referred to as Non-Performing Loans or NPLs.
(14)Impaired Credits refers to Non-Performing Loans or NPLs and non-performing securities at FVOCI and at amortized cost.
(15)Total allowance for losses refers to allowance for loan losses plus allowance for loan commitments and financial guarantee contract losses and allowance for investment securities losses.
SAFE HARBOR STATEMENT
This press release contains forward-looking statements of expected future developments within the meaning of the Private Securities Litigation Reform Act of 1995 and Section 21E of the Securities Exchange Act of 1934. Forward-looking statements can be identified by words such as: “anticipate”, “intend”, “plan”, “goal”, “seek”, “believe”, “project”, “estimate”, “expect”, “strategy”, “future”, “likely”, “may”, “should”, “will” and similar references to future periods. The forward-looking statements in this press release include the Bank’s financial position, asset quality and profitability, among others. These forward-looking statements reflect the expectations of the Bank’s management and are based on currently available data; however, actual performance and results are subject to future events and uncertainties, which could materially impact the Bank’s expectations. Among the factors that can cause actual performance and results to differ materially are as follows: the coronavirus (COVID-19) pandemic and geopolitical events; the anticipated changes in the Bank’s credit portfolio; the continuation of the Bank’s preferred creditor status; the impact of increasing/decreasing interest rates and of the macroeconomic environment in the Region on the Bank’s financial condition; the execution of the Bank’s strategies and initiatives, including its revenue diversification strategy; the adequacy of the Bank’s allowance for expected credit losses; the need for additional allowance for expected credit losses; the Bank’s ability to achieve future growth, to reduce its liquidity levels and increase its leverage; the Bank’s ability to maintain its investment-grade credit ratings; the availability and mix of future sources of funding for the Bank’s lending operations; potential trading losses; the possibility of fraud; and the adequacy of the Bank’s sources of liquidity to replace deposit withdrawals. Factors or events that could cause our actual results to differ may emerge from time to time, and it is not possible for us to predict all of them. Readers are cautioned not to place undue reliance on these forward-looking statements, which speak only as of the date hereof. We undertake no obligation to publicly update any forward-looking statement, whether as a result of new information, future developments or otherwise, except as may be required by law.
ABOUT BLADEX
Bladex, a multinational bank originally established by the central banks of Latin-American and Caribbean countries, began operations in 1979 to promote foreign trade and economic integration in the Region. The Bank, headquartered in Panama, also has offices in Argentina, Brazil, Colombia, Mexico, and the United States of America, and a Representative License in Peru, supporting the regional expansion and servicing its customer base, which includes financial institutions and corporations.
Bladex is listed on the NYSE in the United States of America (NYSE: BLX), since 1992, and its shareholders include: central banks and state-owned banks and entities representing 23 Latin American countries; commercial banks and financial institutions; and institutional and retail investors through its public listing.
CONFERENCE CALL INFORMATION
There will be a conference call to discuss the Bank’s quarterly results on Friday, February 28, 2025, at 10:00 a.m. New York City time (Eastern Time). For those interested in participating, please click here to pre-register to our conference call or visit our website at http://www.bladex.com. Participants should register five minutes before the call is set to begin. The webcast presentation will be available for viewing and downloads on http://www.bladex.com. The conference call will become available for review one hour after its conclusion.
For more information, please access http://www.bladex.com or contact:
| | | | | |
|
Mr. Carlos Daniel Raad
Chief Investor Relations Officer
Tel: +507 366-4925 ext. 7925
E-mail: craad@bladex.com / ir@bladex.com
|
EXHIBIT I
CONSOLIDATED STATEMENTS OF FINANCIAL POSITION | | | | | | | | | | | | | | | | | | | | | | | | | | | | | | | | | | | | | | | | | |
| AT THE END OF, | | | | | | | | |
| (A) | | (B) | | (C) | | (A) - (B) | | | | (A) - (C) | | |
| December 31, 2024 | | September 30, 2024 | | December 31, 2023 | | CHANGE | | % | | CHANGE | | % |
| | | | | | | | | | | | | |
| (In US$ thousand) | | | | | | | | |
| Assets | | | | | | | | | | | | | |
| | | | | | | | | | | | | |
| Cash and due from banks | $ | 1,963,838 | | | $ | 1,709,503 | | | $ | 2,047,452 | | | $ | 254,335 | | | 15 | % | | $ | (83,614) | | | (4) | % |
| | | | | | | | | | | | | |
| Investment securities | 1,201,930 | | | 1,213,329 | | | 1,022,131 | | | (11,399) | | | (1) | | 179,799 | | | 18 |
| | | | | | | | | | | | | |
| Loans | 8,383,829 | | | 8,090,061 | | | 7,220,520 | | | 293,768 | | | 4 | | 1,163,309 | | | 16 |
| | | | | | | | | | | | | |
| Customers' liabilities under acceptances | 245,065 | | | 292,542 | | | 261,428 | | | (47,477) | | | (16) | | (16,363) | | | (6) |
| Derivative financial instruments - assets | 22,315 | | | 71,487 | | | 157,267 | | | (49,172) | | | (69) | | (134,952) | | | (86) |
| Equipment, leases and leasehold improvements, net | 19,676 | | | 15,985 | | | 16,794 | | | 3,691 | | | 23 | | 2,882 | | | 17 |
| Intangible assets | 3,663 | | | 3,086 | | | 2,605 | | | 577 | | | 19 | | 1,058 | | | 41 |
| | | | | | | | | | | | | |
| Other assets | 18,357 | | | 16,150 | | | 15,595 | | | 2,207 | | | 14 | | 2,762 | | | 18 |
| | | | | | | | | | | | | |
| Total assets | $ | 11,858,673 | | | $ | 11,412,143 | | | $ | 10,743,792 | | | $ | 446,530 | | | 4 | % | | $ | 1,114,881 | | | 10 | % |
| | | | | | | | | | | | | |
| Liabilities | | | | | | | | | | | | | |
| | | | | | | | | | | | | |
| Demand deposits | $ | 440,029 | | | $ | 622,932 | | | $ | 510,195 | | | $ | (182,903) | | | (29) | % | | $ | (70,166) | | | (14) | % |
| Time deposits | 4,972,695 | | | 5,015,987 | | | 3,897,954 | | | (43,292) | | | (1) | | 1,074,741 | | | 28 |
| 5,412,724 | | | 5,638,919 | | | 4,408,149 | | | (226,195) | | | (4) | | 1,004,575 | | | 23 |
| Interest payable | 49,177 | | | 52,973 | | | 42,876 | | | (3,796) | | | (7) | | 6,301 | | | 15 |
| Total deposits | 5,461,901 | | | 5,691,892 | | | 4,451,025 | | | (229,991) | | | (4) | | 1,010,876 | | | 23 |
| | | | | | | | | | | | | |
| Securities sold under repurchase agreements | 212,931 | | | 346,299 | | | 310,197 | | | (133,368) | | | (39) | | (97,266) | | | (31) |
| Borrowings and debt, net | 4,352,316 | | | 3,571,404 | | | 4,351,988 | | | 780,912 | | | 22 | | 328 | | | 0 |
| Interest payable | 37,508 | | | 40,040 | | | 49,217 | | | (2,532) | | | (6) | | (11,709) | | | (24) |
| | | | | | | | | | | | | |
| Lease Liabilities | 19,232 | | | 15,867 | | | 16,707 | | | 3,365 | | | 21 | | 2,525 | | | 15 |
| Acceptance outstanding | 245,065 | | | 292,542 | | | 261,428 | | | (47,477) | | | (16) | | (16,363) | | | (6) |
| Derivative financial instruments - liabilities | 141,705 | | | 90,837 | | | 40,613 | | | 50,868 | | | 56 | | 101,092 | | | 249 |
| Allowance for loan commitments and financial guarantee contract losses | 5,375 | | | 7,403 | | | 5,059 | | | (2,028) | | | (27) | | 316 | | | 6 |
| Other liabilities | 45,431 | | | 46,039 | | | 53,734 | | | (608) | | | (1) | | (8,303) | | | (15) |
| | | | | | | | | | | | | |
| Total liabilities | $ | 10,521,464 | | | $ | 10,102,323 | | | $ | 9,539,968 | | | $ | 419,141 | | | 4 | % | | $ | 981,496 | | | 10 | % |
| | | | | | | | | | | | | |
| Equity | | | | | | | | | | | | | |
| | | | | | | | | | | | | |
| Common stock | $ | 279,980 | | | $ | 279,980 | | | $ | 279,980 | | | $ | 0 | | | 0 | % | | $ | 0 | | | 0 | % |
| Treasury stock | (105,601) | | | (105,672) | | | (110,174) | | | 71 | | | 0 | | 4,573 | | | 4 |
| Additional paid-in capital in excess of value assigned of common stock | 124,970 | | | 122,472 | | | 122,046 | | | 2,498 | | | 2 | | 2,924 | | | 2 |
| Capital reserves | 95,210 | | | 95,210 | | | 95,210 | | | 0 | | | 0 | | 0 | | | 0 |
| Regulatory reserves | 149,666 | | | 145,117 | | | 136,019 | | | 4,549 | | | 3 | | 13,647 | | | 10 |
| Retained earnings | 792,005 | | | 763,460 | | | 673,281 | | | 28,545 | | | 4 | | 118,724 | | | 18 |
| Other comprehensive income | 979 | | | 9,253 | | | 7,462 | | | (8,274) | | | (89) | | (6,483) | | | (87) |
| | | | | | | | | | | | | |
| Total equity | $ | 1,337,209 | | | $ | 1,309,820 | | | $ | 1,203,824 | | | $ | 27,389 | | | 2 | % | | $ | 133,385 | | | 11 | % |
| | | | | | | | | | | | | |
| Total liabilities and equity | $ | 11,858,673 | | | $ | 11,412,143 | | | $ | 10,743,792 | | | $ | 446,530 | | | 4 | % | | $ | 1,114,881 | | | 10 | % |
| | | | | | | | | | | | | |
EXHIBIT II
CONSOLIDATED STATEMENTS OF PROFIT OR LOSS
(In US$ thousand, except per share amounts and ratios)
| | | | | | | | | | | | | | | | | | | | | | | | | | | | | | | | | | | | | | | | | |
| | FOR THE THREE MONTHS ENDED | | | | | | | | |
| | (A) | | (B) | | (C) | | (A) - (B) | | | | (A) - (C) | | |
| | December 31, 2024 | | September 30, 2024 | | December 31, 2023 | | CHANGE | | % | | CHANGE | | % |
| Net Interest Income: | | | | | | | | | | | | | |
| Interest income | $ | 197,405 | | | $ | 198,682 | | | $ | 193,946 | | | $ | (1,277) | | | (1) | % | | $ | 3,459 | | | 2 | % |
| Interest expense | (130,468) | | | (132,052) | | | (128,381) | | | 1,584 | | | 1 | | (2,087) | | | (2) |
| | | | | | | | | | | | | | |
| Net Interest Income | 66,937 | | | 66,630 | | | 65,565 | | | 307 | | | 0 | | 1,372 | | | 2 |
| | | | | | | | | | | | | | |
| Other income (expense): | | | | | | | | | | | | | |
| Fees and commissions, net | 11,906 | | | 10,490 | | | 10,091 | | | 1,416 | | | 13 | | 1,815 | | | 18 |
| (Loss) gain on financial instruments, net | (620) | | | 328 | | | 1,866 | | | (948) | | | (289) | | (2,486) | | | (133) |
| Other income, net | 202 | | | 135 | | | 265 | | | 67 | | | 50 | | (63) | | | (24) |
| Total other income, net | 11,488 | | | 10,953 | | | 12,222 | | | 535 | | | 5 | | (734) | | | (6) |
| | | | | | | | | | | | | | |
| Total revenues | 78,425 | | | 77,583 | | | 77,787 | | | 842 | | | 1 | | 638 | | | 1 |
| | | | | | | | | | | | | | |
| Provision for credit losses | (4,038) | | | (3,548) | | | (9,953) | | | (490) | | | (14) | | 5,915 | | | 59 |
| | | | | | | | | | | | | |
| | | | | | | | | | | | | | |
| Operating expenses: | | | | | | | | | | | | | |
| Salaries and other employee expenses | (14,314) | | | (14,177) | | | (13,450) | | | (137) | | | (1) | | (864) | | | (6) |
| Depreciation and amortization of equipment, leasehold improvements | (700) | | | (614) | | | (602) | | | (86) | | | (14) | | (98) | | | (16) |
| Amortization of intangible assets | (312) | | | (279) | | | (220) | | | (33) | | | (12) | | (92) | | | (42) |
| Other expenses | (7,571) | | | (5,972) | | | (7,177) | | | (1,599) | | | (27) | | (394) | | | (5) |
| Total operating expenses | (22,897) | | | (21,042) | | | (21,449) | | | (1,855) | | | (9) | | (1,448) | | | (7) |
| | | | | | | | | | | | | | |
| Profit for the period | $ | 51,490 | | | $ | 52,993 | | | $ | 46,385 | | | $ | (1,503) | | | (3) | % | | $ | 5,105 | | | 11 | % |
| | | | | | | | | | | | | | |
| PER COMMON SHARE DATA: | | | | | | | | | | | | | |
| Basic earnings per share | $ | 1.40 | | | $ | 1.44 | | | $ | 1.27 | | | | | | | | | |
| Diluted earnings per share | $ | 1.40 | | | $ | 1.44 | | | $ | 1.27 | | | | | | | | | |
| Book value (period average) | $ | 35.87 | | | $ | 35.05 | | | $ | 32.49 | | | | | | | | | |
| Book value (period end) | $ | 36.35 | | | $ | 35.61 | | | $ | 32.95 | | | | | | | | | |
| | | | | | | | | | | | | | |
| Weighted average basic shares | 36,790 | | | 36,787 | | | 36,540 | | | | | | | | | |
| Weighted average diluted shares | 36,790 | | | 36,787 | | | 36,540 | | | | | | | | | |
| Basic shares period end | 36,791 | | | 36,787 | | | 36,540 | | | | | | | | | |
| | | | | | | | | | | | | | |
| PERFORMANCE RATIOS: | | | | | | | | | | | | | |
| Return on average assets | 1.8 | % | | 1.9 | % | | 1.8 | % | | | | | | | | |
| Return on average equity | 15.5 | % | | 16.4 | % | | 15.5 | % | | | | | | | | |
| Net interest margin | 2.44 | % | | 2.55 | % | | 2.62 | % | | | | | | | | |
| Net interest spread | 1.69 | % | | 1.78 | % | | 1.92 | % | | | | | | | | |
| Efficiency Ratio | 29.2 | % | | 27.1 | % | | 27.6 | % | | | | | | | | |
| Operating expenses to total average assets | 0.80 | % | | 0.77 | % | | 0.82 | % | | | | | | | | |
| | | | | | | | | | | | | |
EXHIBIT III
CONSOLIDATED STATEMENTS OF PROFIT OR LOSS
(In US$ thousand, except per share amounts and ratios)
| | | | | | | | | | | | | | | | | | | | | | | |
| | FOR THE YEAR ENDED | | | | |
| | (A) | | (B) | | (A) - (B) | | |
| | December 31, 2024 | | December 31, 2023 | | CHANGE | | % |
| Net Interest Income: | | | | | | | |
| Interest income | $ | 785,032 | | | $ | 679,260 | | | $ | 105,772 | | | 16 | % |
| Interest expense | (525,821) | | | (446,077) | | | (79,744) | | | (18) | |
| | | | | | | | |
| Net Interest Income | 259,211 | | | 233,183 | | | 26,028 | | | 11 | |
| | | | | | | | |
| Other income (expense): | | | | | | | |
| Fees and commissions, net | 44,401 | | | 32,519 | | | 11,882 | | | 37 | |
| Loss on financial instruments, net | (483) | | | (45) | | | (438) | | | (973) | |
| Other income, net | 507 | | | 462 | | | 45 | | | 10 | |
| Total other income, net | 44,425 | | | 32,936 | | | 11,489 | | | 35 | |
| | | | | | | | |
| Total revenues | 303,636 | | | 266,119 | | | 37,517 | | | 14 | |
| | | | | | | | |
| Provision for credit losses | (17,299) | | | (27,463) | | | 10,164 | | | 37 | |
| | | | | | | |
| | | | | | | | |
| Operating expenses: | | | | | | | |
| Salaries and other employee expenses | (51,923) | | | (47,232) | | | (4,691) | | | (10) | |
| Depreciation and amortization of equipment, leasehold improvements | (2,499) | | | (2,280) | | | (219) | | | (10) | |
| Amortization of intangible assets | (1,064) | | | (814) | | | (250) | | | (31) | |
| Other expenses | (24,978) | | | (22,172) | | | (2,806) | | | (13) | |
| Total operating expenses | (80,464) | | | (72,498) | | | (7,966) | | | (11) | |
| | | | | | | | |
| Profit for the period | $ | 205,873 | | | $ | 166,158 | | | $ | 39,715 | | | 24 | % |
| | | | | | | | |
| PER COMMON SHARE DATA: | | | | | | | |
| Basic earnings per share | $ | 5.60 | | | $ | 4.55 | | | | | |
| Diluted earnings per share | $ | 5.60 | | | $ | 4.55 | | | | | |
| Book value (period average) | $ | 34.58 | | | $ | 31.03 | | | | | |
| Book value (period end) | $ | 36.35 | | | $ | 32.95 | | | | | |
| | | | | | | | |
| Weighted average basic shares | 36,740 | | | 36,481 | | | | | |
| Weighted average diluted shares | 36,740 | | | 36,481 | | | | | |
| Basic shares period end | 36,791 | | | 36,540 | | | | | |
| | | | | | | | |
| PERFORMANCE RATIOS: | | | | | | | |
| Return on average assets | 1.9 | % | | 1.7 | % | | | | |
| Return on average equity | 16.2 | % | | 14.7 | % | | | | |
| Net interest margin | 2.47 | % | | 2.49 | % | | | | |
| Net interest spread | 1.75 | % | | 1.84 | % | | | | |
| Efficiency Ratio | 26.5 | % | | 27.2 | % | | | | |
| Operating expenses to total average assets | 0.73 | % | | 0.74 | % | | | | |
EXHIBIT IV
CONSOLIDATED NET INTEREST INCOME AND AVERAGE BALANCES
| | | | | | | | | | | | | | | | | | | | | | | | | | | | | | | | | | | | | | | | | | | | | | | | | | | | | |
| | FOR THE THREE MONTHS ENDED |
| | December 31, 2024 | | September 30, 2024 | | December 31, 2023 |
| | AVERAGE BALANCE | | INTEREST | | AVG. RATE | | AVERAGE BALANCE | | INTEREST | | AVG. RATE | | AVERAGE BALANCE | | INTEREST | | AVG. RATE |
| | (In US$ thousand) |
| INTEREST EARNING ASSETS | | | | | | | | | | | | | | | | | |
| Cash and due from banks | $ | 1,636,566 | | | $ | 19,610 | | | 4.69 | % | | $ | 1,645,945 | | | $ | 22,271 | | | 5.29 | % | | $ | 1,764,236 | | | $ | 24,048 | | | 5.33 | % |
| Securities at fair value through OCI | 98,840 | | | 1,158 | | | 4.58 | | 98,857 | | | 1,157 | | | 4.58 | | 1,269 | | | 14 | | | 4.28 |
Securities at amortized cost (1) | 1,100,582 | | | 13,308 | | | 4.73 | | 1,058,540 | | | 11,925 | | | 4.41 | | 998,550 | | | 10,059 | | | 3.94 |
Loans, net of unearned interest (1) | 8,093,728 | | | 163,329 | | | 7.90 | | 7,575,593 | | | 163,329 | | | 8.44 | | 7,153,306 | | | 159,825 | | | 8.74 |
| | | | | | | | | | | | | | | | | | |
| TOTAL INTEREST EARNING ASSETS | $ | 10,929,716 | | | $ | 197,405 | | | 7.07 | % | | $ | 10,378,934 | | | $ | 198,682 | | | 7.49 | % | | $ | 9,917,361 | | | $ | 193,946 | | | 7.65 | % |
| | | | | | | | | | | | | | | | | | |
| Allowance for loan losses | (73,044) | | | | | | (65,075) | | | | | | (50,741) | | | | |
| Non interest earning assets | 525,505 | | | | | | 537,412 | | | | | | 555,027 | | | | |
| | | | | | | | | | | | | | | | | | |
| TOTAL ASSETS | $ | 11,382,177 | | | | | | | $ | 10,851,271 | | | | | | | $ | 10,421,647 | | | | | |
| | | | | | | | | | | | | | | | | | |
| INTEREST BEARING LIABILITIES | | | | | | | | | | | | | | | | | |
| Deposits | 5,653,629 | | $ | 74,977 | | | 5.19 | % | | 5,511,150 | | $ | 79,370 | | | 5.64 | % | | $ | 4,498,987 | | | $ | 65,701 | | | 5.71 | % |
| Securities sold under repurchase agreement | 172,193 | | 2,400 | | | 5.45 | | 217,637 | | 3,119 | | | 5.61 | | 195,391 | | | 1,815 | | | 3.64 |
| Short-term borrowings and debt | 894,216 | | 12,062 | | | 5.28 | | 553,401 | | 9,475 | | | 6.70 | | 1,512,561 | | | 25,541 | | | 6.61 |
| | | | | | | | | | | | | | | | | |
Long-term borrowings and debt, net (2) | 2,777,677 | | 41,029 | | | 5.78 | | 2,767,088 | | 40,088 | | | 5.67 | | 2,563,419 | | 35,324 | | | 5.39 |
| | | | | | | | | | | | | | | | | | |
| TOTAL INTEREST BEARING LIABILITIES | $ | 9,497,714 | | | $ | 130,468 | | | 5.38 | % | | $ | 9,049,276 | | | $ | 132,052 | | | 5.71 | % | | $ | 8,770,358 | | | $ | 128,381 | | | 5.73 | % |
| | | | | | | | | | | | | | | | | | |
| Non interest bearing liabilities and other liabilities | $ | 564,674 | | | | | | | $ | 512,625 | | | | | | | $ | 464,273 | | | | | |
| | | | | | | | | | | | | | | | | | |
| TOTAL LIABILITIES | 10,062,389 | | | | | | | 9,561,900 | | | | | | | 9,234,631 | | | | | |
| | | | | | | | | | | | | | | | | | |
| TOTAL EQUITY | 1,319,788 | | | | | | | 1,289,371 | | | | | | | 1,187,016 | | | | | |
| | | | | | | | | | | | | | | | | | |
| TOTAL LIABILITIES AND EQUITY | $ | 11,382,177 | | | | | | | $ | 10,851,271 | | | | | | | $ | 10,421,647 | | | | | |
| | | | | | | | | | | | | | | | | | |
| NET INTEREST SPREAD | | | | | 1.69 | % | | | | | | 1.78 | % | | | | | | 1.92 | % |
| | | | | | | | | | | | | | | | | | |
| NET INTEREST INCOME AND NET INTEREST MARGIN | | | $ | 66,937 | | | 2.44 | % | | | | $ | 66,630 | | | 2.55 | % | | | | $ | 65,565 | | | 2.62 | % |
(1)Gross of interest receivable and the allowance for losses relating to financial instruments at amortized cost.
(2)Includes lease liabilities, net of prepaid commissions.
Note: Interest income and/or expense includes the effect of derivative financial instruments used for hedging.
EXHIBIT V
CONSOLIDATED NET INTEREST INCOME AND AVERAGE BALANCES
| | | | | | | | | | | | | | | | | | | | | | | | | | | | | | | | | | | |
| | FOR THE YEAR ENDED |
| | December 31, 2024 | | December 31, 2023 |
| | AVERAGE BALANCE | | INTEREST | | AVG. RATE | | AVERAGE BALANCE | | INTEREST | | AVG. RATE |
| | (In US$ thousand) |
| INTEREST EARNING ASSETS | | | | | | | | | | | |
| Cash and due from banks | $ | 1,755,729 | | | $ | 92,549 | | | 5.18 | % | | $ | 1,584,068 | | | $ | 80,622 | | | 5.02 | % |
| Securities at fair value through OCI | 94,669 | | | 4,429 | | | 4.60 | | 20,070 | | | 72 | | | 0.35 |
Securities at amortized cost (1) | 1,056,357 | | | 46,377 | | | 4.32 | | 953,679 | | | 32,354 | | | 3.35 |
Loans, net of unearned interest (1) | 7,577,521 | | | 641,677 | | | 8.33 | | 6,816,381 | | | 566,212 | | | 8.19 |
| | | | | | | | | | | | |
| TOTAL INTEREST EARNING ASSETS | $ | 10,484,276 | | | $ | 785,032 | | | 7.36 | % | | $ | 9,374,198 | | | $ | 679,260 | | | 7.15 | % |
| | | | | | | | | | | | |
| Allowance for loan losses | (64,628) | | | | | | (50,726) | | | | |
| Non interest earning assets | 547,685 | | | | | | 497,819 | | | | |
| | | | | | | | | | | | |
| TOTAL ASSETS | $ | 10,967,334 | | | | | | | $ | 9,821,292 | | | | | |
| | | | | | | | | | | | |
| INTEREST BEARING LIABILITIES | | | | | | | | | | | |
| Deposits | $ | 5,331,861 | | | $ | 300,890 | | | 5.55 | % | | $ | 4,018,590 | | | $ | 217,042 | | | 5.33 | % |
| Securities sold under repurchase agreement | 215,255 | | $ | 11,675 | | | 5.33 | | 272,589 | | $ | 9,232 | | | 3.34 |
| Short-term borrowings and debt | 929,812 | | $ | 59,450 | | | 6.29 | | 1,620,826 | | $ | 94,200 | | | 5.73 |
| | | | | | | | | | | |
Long-term borrowings and debt, net (2) | 2,734,492 | | | 153,806 | | | 5.53 | | 2,382,882 | | | 125,603 | | | 5.20 |
| | | | | | | | | | | | |
| TOTAL INTEREST BEARING LIABILITIES | $ | 9,211,420 | | | $ | 525,821 | | | 5.61 | % | | $ | 8,294,887 | | | $ | 446,077 | | | 5.30 | % |
| | | | | | | | | | | | |
| Non interest bearing liabilities and other liabilities | $ | 485,434 | | | | | | | $ | 394,484 | | | | | |
| | | | | | | | | | | | |
| TOTAL LIABILITIES | 9,696,854 | | | | | | | 8,689,371 | | | | | |
| | | | | | | | | | | | |
| TOTAL EQUITY | 1,270,480 | | | | | | | 1,131,921 | | | | | |
| | | | | | | | | | | | |
| TOTAL LIABILITIES AND EQUITY | $ | 10,967,334 | | | | | | | $ | 9,821,292 | | | | | |
| | | | | | | | | | | | |
| NET INTEREST SPREAD | | | | | 1.75 | % | | | | | | 1.84 | % |
| | | | | | | | | | | | |
| NET INTEREST INCOME AND NET INTEREST MARGIN | | | $ | 259,211 | | | 2.47 | % | | | | $ | 233,183 | | | 2.49 | % |
(1)Gross of interest receivable and the allowance for losses relating to financial instruments at amortized cost.
(2)Includes lease liabilities, net of prepaid commissions.
Note: Interest income and/or expense includes the effect of derivative financial instruments used for hedging.
EXHIBIT VI
CONSOLIDATED STATEMENT OF PROFIT OR LOSS
(In US$ thousand, except per share amounts and ratios)
| | | | | | | | | | | | | | | | | | | | | | | | | | | | | | | | | | | | | | | | | |
| | YEAR ENDED | | FOR THE THREE MONTHS ENDED | | YEAR ENDED |
| | DEC
31/24 | | DEC 31/24 | | SEP 30/24 | | JUN 30/24 | | MAR
31/24 | | DEC
31/23 | | DEC
31/23 |
| Net Interest Income: | | | | | | | | | | | | | |
| Interest income | $ | 785,032 | | $ | 197,405 | | $ | 198,682 | | $ | 195,373 | | $ | 193,572 | | $ | 193,946 | | $ | 679,260 |
| Interest expense | (525,821) | | (130,468) | | (132,052) | | (132,614) | | (130,687) | | (128,381) | | (446,077) |
| Net Interest Income | 259,211 | | 66,937 | | 66,630 | | 62,759 | | 62,885 | | 65,565 | | 233,183 |
| | | | | | | | | | | | | | |
| Other income (expense): | | | | | | | | | | | | | |
| Fees and commissions, net | 44,401 | | 11,906 | | 10,490 | | 12,533 | | 9,472 | | 10,091 | | 32,519 |
| (Loss) gain on financial instruments, net | (483) | | (620) | | 328 | | (351) | | 160 | | 1,866 | | (45) |
| Other income, net | 507 | | 202 | | 135 | | 99 | | 71 | | 265 | | 462 |
| Total other income, net | 44,425 | | 11,488 | | 10,953 | | 12,281 | | 9,703 | | 12,222 | | 32,936 |
| | | | | | | | | | | | | | |
| Total revenues | 303,636 | | 78,425 | | 77,583 | | 75,040 | | 72,588 | | 77,787 | | 266,119 |
| | | | | | | | | | | | | | |
| Provision for credit losses | (17,299) | | (4,038) | | (3,548) | | (6,684) | | (3,029) | | (9,953) | | (27,463) |
| | | | | | | | | | | | | |
| Total operating expenses | (80,464) | | (22,897) | | (21,042) | | (18,234) | | (18,291) | | (21,449) | | (72,498) |
| | | | | | | | | | | | | | |
| Profit for the period | $ | 205,873 | | $ | 51,490 | | $ | 52,993 | | $ | 50,122 | | $ | 51,268 | | $ | 46,385 | | $ | 166,158 |
| | | | | | | | | | | | | | |
| SELECTED FINANCIAL DATA | | | | | | | | | | | | | |
| | | | | | | | | | | | | | |
| PER COMMON SHARE DATA | | | | | | | | | | | | | |
| Basic earnings per share | $ | 5.60 | | | $ | 1.40 | | | $ | 1.44 | | | $ | 1.36 | | | $ | 1.40 | | | $ | 1.27 | | | $ | 4.55 | |
| | | | | | | | | | | | | | |
| PERFORMANCE RATIOS | | | | | | | | | | | | | |
| Return on average assets | 1.9 | % | | 1.8 | % | | 1.9 | % | | 1.9 | % | | 1.9 | % | | 1.8 | % | | 1.7 | % |
| Return on average equity | 16.2 | % | | 15.5 | % | | 16.4 | % | | 16.2 | % | | 16.8 | % | | 15.5 | % | | 14.7 | % |
| Net interest margin | 2.47 | % | | 2.44 | % | | 2.55 | % | | 2.43 | % | | 2.47 | % | | 2.62 | % | | 2.49 | % |
| Net interest spread | 1.75 | % | | 1.69 | % | | 1.78 | % | | 1.74 | % | | 1.80 | % | | 1.92 | % | | 1.84 | % |
| Efficiency Ratio | 26.5 | % | | 29.2 | % | | 27.1 | % | | 24.3 | % | | 25.2 | % | | 27.6 | % | | 27.2 | % |
| Operating expenses to total average assets | 0.73 | % | | 0.80 | % | | 0.77 | % | | 0.68 | % | | 0.68 | % | | 0.82 | % | | 0.74 | % |
EXHIBIT VII
BUSINESS SEGMENT ANALYSIS
(In US$ thousand)
| | | | | | | | | | | | | | | | | | | | | | | | | | | | | |
| | FOR THE YEAR ENDED | | FOR THE THREE MONTHS ENDED |
| | DEC 31/24 | | DEC 31/23 | | DEC 31/24 | | SEP 30/24 | | DEC 31/23 |
| COMMERCIAL BUSINESS SEGMENT: | | | | | | | | | |
| | | | | | | | | | |
| Net interest income | $ | 230,959 | | | $ | 203,748 | | | $ | 59,415 | | | $ | 59,241 | | | $ | 58,022 | |
| Other income | 45,436 | | | 33,792 | | | 12,167 | | | 10,817 | | | 10,672 | |
| Total revenues | 276,395 | | | 237,540 | | | 71,582 | | | 70,058 | | | 68,694 | |
| Provision for credit losses | (17,930) | | | (26,785) | | | (4,250) | | | (3,365) | | | (10,025) | |
| | | | | | | | | |
| Operating expenses | (63,983) | | (57,324) | | (17,809) | | (16,934) | | (17,110) |
| | | | | | | | | | |
| Profit for the segment | $ | 194,482 | | | $ | 153,431 | | | $ | 49,523 | | | $ | 49,759 | | | $ | 41,559 | |
| | | | | | | | | | |
| Segment assets | 8,649,283 | | | 7,498,230 | | | 8,649,283 | | | 8,399,113 | | | 7,498,230 | |
| | | | | | | | | | |
| TREASURY BUSINESS SEGMENT: | | | | | | | | | |
| | | | | | | | | | |
| Net interest income | $ | 28,252 | | | $ | 29,435 | | | $ | 7,522 | | | $ | 7,389 | | | $ | 7,543 | |
| Other (expense) income | (1,011) | | | (856) | | | (679) | | | 136 | | | 1,550 | |
| Total revenues | 27,241 | | | 28,579 | | | 6,843 | | | 7,525 | | | 9,093 | |
| Reversal of (provision for) credit losses | 631 | | | (678) | | | 212 | | | (183) | | | 72 | |
| Operating expenses | (16,481) | | | (15,174) | | | (5,088) | | | (4,108) | | | (4,339) | |
| | | | | | | | | | |
| Profit for the segment | $ | 11,391 | | | $ | 12,727 | | | $ | 1,967 | | | $ | 3,234 | | | $ | 4,826 | |
| | | | | | | | | | |
| Segment assets | 3,192,339 | | | 3,231,534 | | | 3,192,339 | | | 2,998,801 | | | 3,231,534 | |
| | | | | | | | | | |
| TOTAL: | | | | | | | | | |
| | | | | | | | | | |
| Net interest income | $ | 259,211 | | | $ | 233,183 | | | $ | 66,937 | | | $ | 66,630 | | | $ | 65,565 | |
| Other income | 44,425 | | | 32,936 | | | 11,488 | | | 10,953 | | | 12,222 | |
| Total revenues | 303,636 | | | 266,119 | | | 78,425 | | | 77,583 | | | 77,787 | |
| Provision for credit losses | (17,299) | | | (27,463) | | | (4,038) | | | (3,548) | | | (9,953) | |
| | | | | | | | | |
| Operating expenses | (80,464) | | | (72,498) | | | (22,897) | | | (21,042) | | | (21,449) | |
| Profit for the period | $ | 205,873 | | | $ | 166,158 | | | $ | 51,490 | | | $ | 52,993 | | | $ | 46,385 | |
| Total segment assets | 11,841,622 | | | 10,729,764 | | | 11,841,622 | | | 11,397,914 | | | 10,729,764 | |
| Unallocated assets | 17,051 | | | 14,028 | | | 17,051 | | | 14,229 | | | 14,028 | |
| Total assets | 11,858,673 | | | 10,743,792 | | | 11,858,673 | | | 11,412,143 | | | 10,743,792 | |
EXHIBIT VIII
CREDIT PORTFOLIO
DISTRIBUTION BY COUNTRY
(In US$ million)
| | | | | | | | | | | | | | | | | | | | | | | | | | | | | | | | | | | | | | | | | | | | | | | | | | |
| | | AT THE END OF, |
| | | (A) | | (B) | | (C) | | | | |
| | | December 31, 2024 | | September 30, 2024 | | December 31, 2023 | | Change in Amount |
| COUNTRY | | Amount | | % of Total
Outstanding | | Amount | | % of Total
Outstanding | | Amount | | % of Total
Outstanding | | (A) - (B) | | (A) - (C) |
| ARGENTINA | | $ | 110 | | | 1 | | $ | 139 | | | 1 | | $ | 52 | | | 1 | | $ | (29) | | | $ | 58 | |
| BOLIVIA | | 1 | | | 0 | | 4 | | | 0 | | 4 | | | 0 | | (3) | | | (3) | |
| BRAZIL | | 1,455 | | | 13 | | 1,390 | | | 13 | | 1,124 | | | 12 | | 65 | | | 331 | |
| CHILE | | 539 | | | 5 | | 508 | | | 5 | | 550 | | | 6 | | 31 | | | (11) | |
| COLOMBIA | | 1,006 | | | 9 | | 1,120 | | | 10 | | 1,030 | | | 11 | | (114) | | | (24) | |
| COSTA RICA | | 415 | | | 4 | | 413 | | | 4 | | 345 | | | 4 | | 2 | | | 70 | |
| DOMINICAN REPUBLIC | | 974 | | | 9 | | 981 | | | 9 | | 800 | | | 8 | | (7) | | | 174 | |
| ECUADOR | | 487 | | | 4 | | 475 | | | 4 | | 450 | | | 5 | | 12 | | | 37 | |
| EL SALVADOR | | 90 | | | 1 | | 65 | | | 1 | | 83 | | | 1 | | 25 | | | 7 | |
| GUATEMALA | | 1,111 | | | 10 | | 977 | | | 9 | | 804 | | | 8 | | 134 | | | 307 | |
| HONDURAS | | 216 | | | 2 | | 222 | | | 2 | | 223 | | | 2 | | (6) | | | (7) | |
| JAMAICA | | 43 | | | 0 | | 69 | | | 1 | | 102 | | | 1 | | (26) | | | (59) | |
| MEXICO | | 1,231 | | | 11 | | 1,076 | | | 10 | | 984 | | | 10 | | 155 | | | 247 | |
| PANAMA | | 545 | | | 5 | | 469 | | | 4 | | 438 | | | 5 | | 76 | | | 107 | |
| PARAGUAY | | 192 | | | 2 | | 183 | | | 2 | | 187 | | | 2 | | 9 | | | 5 | |
| PERU | | 801 | | | 7 | | 871 | | | 8 | | 791 | | | 8 | | (70) | | | 10 | |
| PUERTO RICO | | 32 | | | 0 | | 37 | | | 0 | | 0 | | 0 | | (5) | | | 32 | |
| TRINIDAD & TOBAGO | | 167 | | | 1 | | 138 | | | 1 | | 133 | | | 1 | | 29 | | | 34 | |
| UNITED STATES OF AMERICA | | 753 | | | 7 | | 728 | | | 7 | | 614 | | | 6 | | 25 | | | 139 | |
| URUGUAY | | 67 | | | 1 | | 81 | | | 1 | | 113 | | | 1 | | (14) | | | (46) | |
| MULTILATERAL ORGANIZATIONS | | 99 | | | 1 | | 100 | | | 1 | | 12 | | | 0 | | (1) | | | 87 | |
OTHER NON-LATAM (1) | | 890 | | | 8 | | 829 | | | 8 | | 693 | | | 7 | | 61 | | | 197 | |
| | | | | | | | | | | | | | | | | |
TOTAL CREDIT PORTFOLIO (2) | | $ | 11,224 | | | 100 | % | | $ | 10,875 | | | 100 | % | | $ | 9,532 | | | 100 | % | | $ | 349 | | | $ | 1,631 | |
| | | | | | | | | | | | | | | | | |
| UNEARNED INTEREST AND DEFERRED FEES | | (31) | | | | | (27) | | | | | (25) | | | | | (4) | | | (6) | |
| | | | | | | | | | | | | | | | |
| TOTAL CREDIT PORTFOLIO, NET OF UNEARNED INTEREST & DEFERRED FEES | | $ | 11,193 | | | | | $ | 10,848 | | | | | $ | 9,507 | | | | | $ | 345 | | | $ | 1,686 | |
(1)Risk in highly rated countries outside the Region related to transactions carried out in the Region. As of December 31, 2024, Other Non-Latam was comprised of Canada ($82 million), European countries ($411 million) and Asian-Pacific countries ($397 million).
(2)Includes gross loans (or the Loan Portfolio), securities at FVOCI and at amortized cost, gross of interest receivable and the allowance for expected credit losses, loan commitments and financial guarantee contracts, such as confirmed and stand-by letters of credit, and guarantees covering commercial risk; and other assets consisting of customers liabilities under acceptances.
EXHIBIT IX
COMMERCIAL PORTFOLIO
DISTRIBUTION BY COUNTRY
(In US$ million)
| | | | | | | | | | | | | | | | | | | | | | | | | | | | | | | | | | | | | | | | | | | | | | | | | | |
| | | AT THE END OF, |
| | | (A) | | (B) | | (C) | | | | |
| | | December 31, 2024 | | September 30, 2024 | | December 31, 2023 | | Change in Amount |
| COUNTRY | | Amount | | % of Total
Outstanding | | Amount | | % of Total
Outstanding | | Amount | | % of Total
Outstanding | | (A) - (B) | | (A) - (C) |
| ARGENTINA | | $ | 110 | | | 1 | | $ | 139 | | | 1 | | $ | 52 | | | 1 | | $ | (29) | | | $ | 58 | |
| BOLIVIA | | 1 | | | 0 | | 4 | | | 0 | | 4 | | | 0 | | (3) | | | (3) | |
| BRAZIL | | 1,431 | | | 14 | | 1,366 | | | 14 | | 1,093 | | | 13 | | 65 | | | 338 | |
| CHILE | | 502 | | | 5 | | 480 | | | 5 | | 471 | | | 6 | | 22 | | | 31 | |
| COLOMBIA | | 991 | | | 10 | | 1,105 | | | 11 | | 1,006 | | | 12 | | (114) | | | (15) | |
| COSTA RICA | | 407 | | | 4 | | 405 | | | 4 | | 337 | | | 4 | | 2 | | | 70 | |
| DOMINICAN REPUBLIC | | 974 | | | 10 | | 981 | | | 10 | | 795 | | | 9 | | (7) | | | 179 | |
| ECUADOR | | 487 | | | 5 | | 475 | | | 5 | | 450 | | | 5 | | 12 | | | 37 | |
| EL SALVADOR | | 90 | | | 1 | | 65 | | | 1 | | 83 | | | 1 | | 25 | | | 7 | |
| GUATEMALA | | 1,111 | | | 11 | | 977 | | | 10 | | 804 | | | 9 | | 134 | | | 307 | |
| HONDURAS | | 216 | | | 2 | | 222 | | | 2 | | 223 | | | 3 | | (6) | | | (7) | |
| JAMAICA | | 43 | | | 0 | | 69 | | | 1 | | 102 | | | 1 | | (26) | | | (59) | |
| MEXICO | | 1,203 | | | 12 | | 1,030 | | | 11 | | 922 | | | 11 | | 173 | | | 281 | |
| PANAMA | | 474 | | | 5 | | 399 | | | 4 | | 404 | | | 5 | | 75 | | | 70 | |
| PARAGUAY | | 192 | | | 2 | | 183 | | | 2 | | 187 | | | 2 | | 9 | | | 5 | |
| PERU | | 771 | | | 8 | | 840 | | | 9 | | 760 | | | 9 | | (69) | | | 11 | |
| PUERTO RICO | | 32 | | | 0 | | 37 | | | 0 | | 0 | | 0 | | (5) | | | 32 | |
| TRINIDAD & TOBAGO | | 167 | | | 2 | | 138 | | | 1 | | 133 | | | 2 | | 29 | | | 34 | |
| URUGUAY | | 67 | | | 0 | | 81 | | | 1 | | 113 | | | 1 | | (14) | | | (46) | |
OTHER NON-LATAM (1) | | 766 | | | 8 | | 677 | | | 7 | | 582 | | | 7 | | 89 | | | 184 | |
| | | | | | | | | | | | | | | | | |
TOTAL COMMERCIAL PORTFOLIO (2) | | $ | 10,035 | | | 100 | % | | $ | 9,673 | | | 100 | % | | $ | 8,521 | | | 100 | % | | $ | 362 | | | $ | 1,514 | |
| | | | | | | | | | | | | | | | | |
| UNEARNED INTEREST AND DEFERRED FEES | | (31) | | | | | (27) | | | | | (25) | | | | | (4) | | | (6) | |
| | | | | | | | | | | | | | | | |
| TOTAL COMMERCIAL PORTFOLIO, NET OF UNEARNED INTEREST & DEFERRED FEES | | $ | 10,004 | | | | | $ | 9,646 | | | | | $ | 8,496 | | | | | $ | 358 | | | $ | 1,508 | |
(1)Risk in highly rated countries outside the Region related to transactions carried out in the Region. As of December 31, 2024, Other Non-Latam was comprised of United States of America ($142 million), Canada ($38 million), European countries ($274 million) and Asian-Pacific countries ($312 million).
(2)Includes gross loans (or the Loan Portfolio), loan commitments and financial guarantee contracts, such as confirmed and stand-by letters of credit, and guarantees covering commercial risk; and other assets consisting of customers liabilities under acceptances.
EXHIBIT X
INVESTMENT PORTFOLIO
DISTRIBUTION BY COUNTRY
(In US$ million)
| | | | | | | | | | | | | | | | | | | | | | | | | | | | | | | | | | | | | | | | | | | | | | | | | | |
| | | AT THE END OF, |
| | | (A) | | (B) | | (C) | | | | |
| | | December 31, 2024 | | September 30, 2024 | | December 31, 2023 | | Change in Amount |
| COUNTRY | | Amount | | % of Total
Outstanding | | Amount | | % of Total
Outstanding | | Amount | | % of Total
Outstanding | | (A) - (B) | | (A) - (C) |
| BRAZIL | | $ | 24 | | | 2 | | $ | 24 | | | 2 | | $ | 31 | | | 3 | | $ | 0 | | | $ | (7) | |
| CHILE | | 37 | | 3 | | 28 | | | 2 | | 79 | | | 8 | | 9 | | | (42) | |
| COLOMBIA | | 15 | | | 1 | | 15 | | | 1 | | 24 | | | 2 | | 0 | | | (9) | |
| COSTA RICA | | 8 | | | 1 | | 8 | | | 1 | | 8 | | | 1 | | 0 | | | 0 | |
| DOMINICAN REPUBLIC | | 0 | | | 0 | | 0 | | | 0 | | 5 | | | 1 | | 0 | | | (5) | |
| | | | | | | | | | | | | | | | |
| MEXICO | | 28 | | | 2 | | 46 | | | 4 | | 62 | | | 6 | | (18) | | | (34) | |
| PANAMA | | 71 | | | 6 | | 70 | | | 6 | | 34 | | | 3 | | 1 | | | 37 | |
| PERU | | 30 | | | 3 | | 31 | | | 3 | | 31 | | | 3 | | (1) | | | (1) | |
| UNITED STATES OF AMERICA | | 611 | | | 51 | | 623 | | | 52 | | 540 | | | 53 | | (12) | | | 71 | |
| MULTILATERAL ORGANIZATIONS | | 99 | | | 8 | | 100 | | | 8 | | 12 | | | 1 | | (1) | | | 87 | |
OTHER NON-LATAM (1) | | 266 | | | 23 | | 257 | | | 21 | | 185 | | | 19 | | 9 | | | 81 | |
| | | | | | | | | | | | | | | | | |
TOTAL INVESTMENT PORTFOLIO (2) | | $ | 1,189 | | | 100 | % | | $ | 1,202 | | | 100 | % | | $ | 1,011 | | | 100 | % | | $ | (13) | | | $ | 178 | |
(1)Risk in highly rated countries outside the Region. As of December 31, 2024, Other Non-Latam was comprised of Canada ($44 million), European countries ($137 million) and Asian-Pacific countries ($85 million).
(2)Includes securities at FVOCI and at amortized cost, gross of interest receivable and the allowance for losses.