Table of Contents
UNITED STATES
SECURITIES AND EXCHANGE COMMISSION
WASHINGTON, D.C. 20549
FORM 20-F
| ¨ | REGISTRATION STATEMENT PURSUANT TO SECTION 12(b) OR (g) OF THE SECURITIES EXCHANGE ACT OF 1934 |
OR
| x | ANNUAL REPORT PURSUANT TO SECTION 13 OR 15(d) OF THE SECURITIES EXCHANGE ACT OF 1934 |
For the fiscal year ended December 31, 2014
OR
| ¨ | TRANSITION REPORT PURSUANT TO SECTION 13 OR 15(d) OF THE SECURITIES EXCHANGE ACT OF 1934 |
For the transition period from to
OR
| ¨ | SHELL COMPANY REPORT PURSUANT TO SECTION 13 OR 15(d) OF THE SECURITIES EXCHANGE ACT OF 1934 |
Date of event requiring this shell company report
For the transition period from to
Commission file number 033-51000
VIDEOTRON LTD. / VIDÉOTRON LTÉE
(Exact name of Registrant as specified in its charter)
Province of Québec, Canada
(Jurisdiction of incorporation or organization)
612 St. Jacques Street
Montréal, Québec, Canada H3C 4M8
(Address of principal executive offices)
Securities registered or to be registered pursuant to Section 12(b) of the Act.
| Title of each class | Name of each exchange on which registered | |||
| None | None |
Securities registered or to be registered pursuant to Section 12(g) of the Act.
None
(Title of Class)
Securities for which there is a reporting obligation pursuant to Section 15(d) of the Act.
6 3/8% Senior Notes due December 15, 2015
5% Senior Notes due July 15, 2022
(Title of Class)
Indicate the number of outstanding shares of each of the issuer’s classes of capital or common stock as of the close of the period covered by the annual report.
2,516,829 Class “A” Common Shares
Indicate by check mark if the registrant is a well-known seasoned issuer, as defined in Rule 405 of the Securities Act. ¨ Yes x No
If this report is an annual or transition report, indicate by check mark if the registrant is not required to file reports pursuant to Section 13 or 15(d) of the Securities Exchange Act of 1934. ¨ Yes x No
Indicate by check mark whether the registrant (1) has filed all reports required to be filed by Section 13 or 15(d) of the Securities Exchange Act of 1934 during the preceding 12 months (or for such shorter period that the registrant was required to file such reports), and (2) has been subject to such filing requirements for the past 90 days. x Yes ¨ No
Indicate by check mark whether the registrant is a large accelerated filer, an accelerated filer, or a non-accelerated filer. See definition of “accelerated filer and large accelerated filer” in Rule 12b-2 of the Exchange Act. (Check one):
Large accelerated filer ¨ Accelerated filer ¨ Non-accelerated filer x
Indicate by check mark which basis of accounting the registrant has used to prepare the financial statements included in this filing:
U.S. GAAP ¨ | International Financial Reporting Standards as issued by the International Accounting Standards Board x | Other | ¨ | |||
If “Other” has been checked in response to the previous question, indicate by check mark which financial statement item the registrant has elected to follow. ¨ Item 17 ¨ Item 18
If this is an annual report, indicate by check mark whether the registrant is a shell company (as defined in Rule 12b-2 of the Exchange Act). ¨ Yes x No
Table of Contents
| Page | ||||
| ii | ||||
| ii | ||||
| ii | ||||
| ii | ||||
| iv | ||||
ITEM 1 – Identity of Directors, Senior Management and Advisers | 1 | |||
| 1 | ||||
| 1 | ||||
| 19 | ||||
| 44 | ||||
| 45 | ||||
| 75 | ||||
| 81 | ||||
| 83 | ||||
| 83 | ||||
| 84 | ||||
ITEM 11 – Quantitative and Qualitative Disclosures About Market Risk | 104 | |||
ITEM 12 – Description of Securities Other Than Equity Securities | 106 | |||
| 106 | ||||
ITEM 14 – Material Modifications to the Rights of Security Holders and Use of Proceeds | 106 | |||
| 106 | ||||
| 107 | ||||
| 107 | ||||
| 107 | ||||
| 107 | ||||
ITEM 16D – Exemptions from the Listing Standards for Audit Committees | 108 | |||
ITEM 16E – Purchases of Equity Securities by the Issuer and Affiliated Purchasers | 108 | |||
| 108 | ||||
| 108 | ||||
| 108 | ||||
| 108 | ||||
| 108 | ||||
| 114 | ||||
| F-1 | ||||
Table of Contents
All references in this annual report to “Videotron” or “our Corporation”, as well as the use of the terms “we”, “us”, “our” or similar terms, are references to Videotron Ltd. and, unless the context otherwise requires, its consolidated subsidiaries. All references in this annual report to “Quebecor Media” are to our parent corporation Quebecor Media Inc., all references to “TVA Group” are to TVA Group Inc., a public subsidiary of Quebecor Media, and all references to “Quebecor” are to Quebecor Inc., the majority shareholder of Quebecor Media. In this annual report, all references to the “CRTC” are references to the Canadian Radio-television and Telecommunications Commission.
All references in this annual report to our “Senior Notes” are to, collectively, our issued and outstanding 6 3/8% Senior Notes due December 15, 2015, our 9 1/8% Senior Notes due April 15, 2018, our 7 1/8% Senior Notes due January 15, 2020, our 6 7/8% Senior Notes due July 15, 2021, our 5% Senior Notes due July 15, 2022, our 5 3/8% Senior Notes due June 15, 2024 and our 5 5/8% Senior Notes due June 15, 2025.
Industry statistics and market data used throughout this annual report were obtained from internal surveys, market research, publicly available information and industry publications, including the CRTC, Numeris, the National Cable & Telecommunications Association (“NCTA”), A.C. Nielsen Media Research and SNL Kagan. Industry publications generally state that the information they contain has been obtained from sources believed to be reliable, but that the accuracy and completeness of this information is not guaranteed. Cable penetration and market share data contained in this annual report is generally based on sources published in the first quarter of 2015. Industry and company data is approximate and may reflect rounding in certain cases.
PRESENTATION OF FINANCIAL INFORMATION
IFRS and Functional Currency
Our audited consolidated financial statements for the years ended December 31, 2014, 2013, 2012, 2011 and 2010 have been prepared in accordance with International Financial Reporting Standards (“IFRS”) as issued by the International Accounting Standards Board.
In this annual report, references to Canadian Dollars, CAN$ or $ are to the lawful currency of Canada, our functional currency, and references to US Dollars or US$ are to the currency of the United States.
Non-IFRS Measures
In this annual report, we use certain financial measures that are not calculated in accordance with IFRS. We use these non-IFRS financial measures, such as average monthly revenue per user (“ARPU”), adjusted operating income, adjusted operating income margin and long-term debt, excluding QMI subordinated loans, because we believe that they are meaningful measures of our performance. Our method of calculating these non-IFRS financial measures may differ from the methods used by other companies and, as a result, the non-IFRS financial measures presented in this annual report may not be comparable to other similarly titled measures disclosed by other companies.
We provide a definition of adjusted operating income, adjusted operating income margin and ARPU under “Item 5. Operating and Financial Review and Prospects –Non-IFRS Financial Measures”. We also provide a definition of adjusted operating income, a reconciliation of adjusted operating income and a reconciliation of long-term debt, excluding QMI subordinated loans to the most directly comparable financial measures under IFRS in footnotes 3 and 4 to the tables under “Item 3. Key Information – A. Selected Financial Data”.
Unless otherwise indicated, information provided in this annual report, including all operating data presented, is as of December 31, 2014.
The following table sets forth, for the periods indicated, the average, high, low and end of period noon rates published by the Bank of Canada. Such rates are presented as U.S. dollars per CAN$1.00. On March 19, 2015, the noon
ii
Table of Contents
rate was CAN$1.00 equals US$0.7847. We do not make any representation that Canadian dollars could have been converted into U.S. dollars at the rates shown or at any other rate. You should note that the rates set forth below may differ from the actual rates used in our accounting processes and in the preparation of our consolidated financial statements.
Year Ended: | Average(1) | High | Low | Period End | ||||||||||||
December 31, 2014 | 0.9054 | 0.9422 | 0.8589 | 0.8620 | ||||||||||||
December 31, 2013 | 0.9710 | 1.0164 | 0.9348 | 0.9402 | ||||||||||||
December 31, 2012 | 1.0004 | 1.0299 | 0.9599 | 1.0051 | ||||||||||||
December 31, 2011 | 1.0111 | 1.0583 | 0.9430 | 0.9833 | ||||||||||||
December 31, 2010 | 0.9709 | 1.0054 | 0.9278 | 1.0054 | ||||||||||||
Month Ended: | Average(2) | High | Low | Period End | ||||||||||||
March 2015 (through March 19, 2015) | 0.7907 | 0.8039 | 0.7811 | 0.7847 | ||||||||||||
February 28, 2015 | 0.8000 | 0.8063 | 0.7915 | 0.7995 | ||||||||||||
January 31, 2015 | 0.8254 | 0.8527 | 0.7863 | 0.7863 | ||||||||||||
December 31, 2014 | 0.8671 | 0.8815 | 0.8589 | 0.8620 | ||||||||||||
November 30, 2014 | 0.8829 | 0.8900 | 0.8751 | 0.8751 | ||||||||||||
October 31, 2014 | 0.8919 | 0.8980 | 0.8858 | 0.8869 | ||||||||||||
September 30, 2014 | 0.9081 | 0.9206 | 0.8922 | 0.8922 | ||||||||||||
| (1) | The average of the daily noon rates for each day during the applicable year. |
| (2) | The average of the daily noon rates for each day during the applicable month. |
iii
Table of Contents
CAUTIONARY STATEMENT REGARDING FORWARD-LOOKING STATEMENTS
This annual report contains forward-looking statements with respect to our financial condition, results of operations, business and certain of our plans and objectives. These forward-looking statements are made pursuant to the “Safe Harbor” provisions of theUnited States Private Securities Litigation Reform Act of 1995. These forward-looking statements are based on current expectations, estimates, forecasts and projections about the industries in which we operate as well as beliefs and assumptions made by our management. Such statements include, in particular, statements about our plans, prospects, financial position and business strategies. Words such as “may,” “will,” “expect,” “continue,” “intend,” “estimate,” “anticipate,” “plan,” “foresee,” “believe” or “seek” or the negatives of these terms or variations of them or similar terminology are intended to identify such forward-looking statements. Although we believe that the expectations reflected in these forward-looking statements are reasonable, these statements, by their nature, involve risks and uncertainties and are not guarantees of future performance. Such statements are also subject to assumptions concerning, among other things: our anticipated business strategies; anticipated trends in our business; anticipated reorganizations of any of our segments or businesses, and any related restructuring provisions or impairment charges; and our ability to continue to control costs. We can give no assurance that these estimates and expectations will prove to have been correct. Actual outcomes and results may, and often do, differ from what is expressed, implied or projected in such forward-looking statements, and such differences may be material. Some important factors that could cause actual results to differ materially from those expressed in these forward-looking statements include, but are not limited to:
| • | our ability to successfully continue developing our network and facilities-based mobile offering; |
| • | general economic, financial or market conditions; |
| • | the intensity of competitive activity in the industries in which we operate; |
| • | new technologies that might change consumer behaviour towards our product suite; |
| • | unanticipated higher capital spending required to deploy our network or to address continued development of competitive alternative technologies, or the inability to obtain additional capital to continue the development of our business; |
| • | our ability to implement successfully our business and operating strategies and manage our growth and expansion; |
| • | disruptions to the network through which we provide our digital television, Internet access and telephony services, and our ability to protect such services from piracy; |
| • | labour disputes or strikes; |
| • | changes in our ability to obtain services and equipment critical to our operations; |
| • | changes in laws and regulations, or in their interpretations, which could result, among other things, in the loss (or reduction in value) of our licenses or markets or in an increase in competition, compliance costs or capital expenditures; |
| • | our substantial indebtedness, the tightening of credit markets, and the restrictions on our business imposed by the terms of our debt; and |
| • | interest rate fluctuations that affect a portion of our interest payment requirements on long-term debt. |
We caution you that the above list of cautionary statements is not exhaustive. These and other factors are discussed in further detail elsewhere in this annual report, including under “Item 3. Key Information – Risk Factors” of this annual report. Each of these forward-looking statements speaks only as of the date of this annual report. We disclaim any obligation to update these statements unless applicable securities laws require us to do so. We advise you to consult any documents we may file or furnish with the U.S. Securities and Exchange Commission (“SEC”), as described under “Item 10. Additional Information – Documents on Display” of this annual report.
iv
Table of Contents
ITEM 1 – IDENTITY OF DIRECTORS, SENIOR MANAGEMENT AND ADVISERS
Not applicable.
ITEM 2 – OFFER STATISTICS AND EXPECTED TIMETABLE
Not applicable.
| A- | Selected Financial Data |
The following tables present selected consolidated financial information for our business presented in accordance with IFRS for each of the years ended December 31, 2014, 2013, 2012, 2011 and 2010. We derived this selected consolidated financial information from our audited consolidated financial statements, which are comprised of consolidated balance sheets as at December 31, 2014, 2013, 2012, 2011 and 2010 and the related consolidated statements of income, comprehensive income, equity and cash flows for each of the years in the five-year period ended December 31, 2014. The selected consolidated financial information presented below should be read in conjunction with the information contained in “Item 5. Operating and Financial Review and Prospects” and our audited consolidated financial statements as at December 31, 2014 and 2013 and for the years ended December 31, 2014, 2013 and 2012 and notes thereto contained in “Item 18. Financial Statements” of this annual report (beginning on page F-1). Our audited consolidated financial statements as at December 31, 2012, 2011 and 2010 and for the years ended December 31, 2011 and 2010, are not included in this annual report. Our consolidated financial statements as at December 31, 2014, 2013, 2012, 2011 and 2010 and for the years ended December 31, 2014, 2013, 2012, 2011 and 2010, prepared in accordance with IFRS, have been audited by Ernst & Young LLP, an independent registered public accounting firm. Ernst & Young LLP’s report on our consolidated financial statements as at December 31, 2014 and 2013 and for the years ended December 31, 2014, 2013 and 2012 is included in this annual report.
The information presented below the caption “Other Financial Data and Ratios” is unaudited except for cash flows, capital expenditures and additions to spectrum licenses, which have been derived from our consolidated financial statements. The information presented below the caption “Operating Data” is not derived from our consolidated financial statements and is unaudited.
Our historical results are not necessarily indicative of our future financial condition or results of operations.
1
Table of Contents
SELECTED FINANCIAL DATA
| Year ended December 31, | ||||||||||||||||||||
| 2014 | 2013 | 2012 | 2011 | 2010 | ||||||||||||||||
| (dollars in thousands, except percentages, ratios and Operating Data) | ||||||||||||||||||||
Consolidated Statement of Income Data: | ||||||||||||||||||||
Operating revenues: | ||||||||||||||||||||
Cable television | $ | 1,074,821 | $ | 1,090,261 | $ | 1,079,343 | $ | 1,012,604 | $ | 950,590 | ||||||||||
Internet | 868,264 | 818,400 | 772,497 | 698,234 | 644,283 | |||||||||||||||
Cable telephony | 475,143 | 473,798 | 454,861 | 436,694 | 409,858 | |||||||||||||||
Mobile telephony | 287,665 | 220,561 | 171,624 | 112,762 | 53,167 | |||||||||||||||
Business solutions | 65,632 | 63,525 | 64,945 | 63,109 | 59,863 | |||||||||||||||
Equipment sales | 45,627 | 36,524 | 43,412 | 55,953 | 59,976 | |||||||||||||||
Other | 9,613 | 8,754 | 11,162 | 9,974 | 8,161 | |||||||||||||||
|
|
|
|
|
|
|
|
|
| |||||||||||
Total operating revenues | 2,826,765 | 2,711,823 | 2,597,844 | 2,389,330 | 2,185,898 | |||||||||||||||
Employee costs | 342,399 | 347,097 | 338,591 | 294,472 | 240,205 | |||||||||||||||
Purchase of goods and services | 1,136,055 | 1,079,919 | 1,055,549 | 1,021,270 | 922,769 | |||||||||||||||
Depreciation and amortization | 601,381 | 561,743 | 485,385 | 407,011 | 290,977 | |||||||||||||||
Financial expenses(1) | 169,177 | 174,145 | 179,498 | 161,211 | 154,208 | |||||||||||||||
Loss (gain) on valuation and translation of financial instruments | 3,430 | 163,725 | (75,738 | ) | (53,869 | ) | (24,373 | ) | ||||||||||||
Loss (gain) on debt refinancing | 21,403 | 18,912 | (7,608 | ) | (4,986 | ) | — | |||||||||||||
Restructuring of operations, impairment of assets and other special items | 39,445 | 684 | 478 | 15,094 | 10,500 | |||||||||||||||
Income taxes expense | 93,283 | 29,449 | 115,855 | 105,067 | 103,675 | |||||||||||||||
Income from discontinued operations | — | 40,706 | 8,145 | 12,175 | 7,757 | |||||||||||||||
|
|
|
|
|
|
|
|
|
| |||||||||||
Net income | $ | 420,192 | $ | 376,855 | $ | 513,979 | $ | 456,235 | $ | 495,694 | ||||||||||
|
|
|
|
|
|
|
|
|
| |||||||||||
Consolidated Balance Sheet Data (at year end): | ||||||||||||||||||||
Cash and cash equivalents | $ | 342,802 | $ | 322,469 | $ | 163,231 | $ | 94,093 | $ | 95,509 | ||||||||||
Total assets | 6,255,596 | 7,029,396 | 6,992,107 | 6,545,195 | 5,489,038 | |||||||||||||||
Long-term debt, excluding QMI subordinated loans(2)(3) | 2,924,540 | 2,399,105 | 2,127,057 | 1,857,057 | 1,786,076 | |||||||||||||||
QMI subordinated loans(2)(3) | 1,080,000 | 2,280,000 | 1,630,000 | 1,630,000 | 1,630,000 | |||||||||||||||
Capital stock | 3,401 | 3,401 | 3,401 | 3,401 | 3,401 | |||||||||||||||
Equity attributable to shareholder | 793,096 | 820,807 | 773,269 | 975,475 | 714,501 | |||||||||||||||
Cash dividends declared | 410,000 | 361,880 | 760,000 | 140,000 | 437,000 | |||||||||||||||
Other Financial Data and Ratios: | ||||||||||||||||||||
Adjusted operating income(4) | $ | 1,348,311 | $ | 1,284,807 | $ | 1,203,704 | $ | 1,073,588 | $ | 1,022,924 | ||||||||||
Adjusted operating income margin(4) | 47.7 | % | 47.4 | % | 46.3 | % | 44.9 | % | 46.8 | % | ||||||||||
Cash flows provided by operating activities | 1,106,452 | 1,058,340 | 1,147,847 | 892,453 | 780,436 | |||||||||||||||
Cash flows used in investing activities | (905,095 | ) | (524,875 | ) | (708,810 | ) | (823,222 | ) | (1,061,094 | ) | ||||||||||
Cash flows (used in) provided by financing activities | (181,024 | ) | (377,399 | ) | (380,674 | ) | (82,455 | ) | 226,596 | |||||||||||
Capital expenditures(5) | 693,224 | 582,530 | 745,853 | 795,972 | 722,312 | |||||||||||||||
Additions to spectrum licenses(5) | 217,364 | 15,964 | — | — | — | |||||||||||||||
Ratio of earnings to fixed charges(6) | 3.8x | 3.2x | 4.3x | 4.3x | 4.6x | |||||||||||||||
Operating Data (at year end, except ARPU): | ||||||||||||||||||||
Homes passed(7) | 2,777,264 | 2,742,476 | 2,701,242 | 2,657,315 | 2,612,406 | |||||||||||||||
Basic cable customers(8) | 1,782,242 | 1,825,081 | 1,854,981 | 1,861,477 | 1,811,570 | |||||||||||||||
Basic cable penetration(9) | 64.2 | % | 66.5 | % | 68.7 | % | 70.1 | % | 69.3 | % | ||||||||||
Digital customers | 1,561,692 | 1,531,361 | 1,484,589 | 1,400,814 | 1,219,599 | |||||||||||||||
Digital penetration(10) | 87.6 | % | 83.9 | % | 80.0 | % | 75.3 | % | 67.3 | % | ||||||||||
Cable Internet customers(12) | 1,537,532 | 1,505,992 | 1,443,992 | 1,359,600 | 1,268,083 | |||||||||||||||
Cable Internet penetration(9)(12) | 55.4 | % | 54.9 | % | 53.5 | % | 51.2 | % | 48.5 | % | ||||||||||
Cable telephony lines(12) | 1,349,010 | 1,348,520 | 1,316,327 | 1,245,893 | 1,145,063 | |||||||||||||||
Cable telephony penetration(9)(12) | 48.6 | % | 49.2 | % | 48.7 | % | 46.9 | % | 43.8 | % | ||||||||||
Mobile telephony lines(12) | 632,766 | 504,314 | 403,804 | 290,742 | 136,111 | |||||||||||||||
ARPU(11) | $ | 125.16 | $ | 118.03 | $ | 111.57 | $ | 103.28 | $ | 95.73 | ||||||||||
| (1) | We are party to a number of back-to-back transactions with Quebecor Media and 9101-0835 Québec inc., a subsidiary of Quebecor Media. With respect to these back-to-back transactions, we recorded interest expense of $218.6 million for the year ended December 31, 2014, $265.9 million for the |
2
Table of Contents
| year ended December 31, 2013, $213.9 million for the year ended December 31, 2012, $171.6 million for the year ended December 31, 2011 and $169.4 million for the year ended December 31, 2010, but we recorded $224.2 million, $272.5 million, $221.1 million, $177.4 million and $175.0 million in dividends from Quebecor Media in 2014, 2013, 2012, 2011 and 2010 respectively. See “Item 5. Operating and Financial Review and Prospects — Uses of Liquidity and Capital Resources - Purchase of Shares of Quebecor Media and Servicing of Subsidiary Subordinated Loan”. |
| (2) | For the years ended December 31, 2014, 2013, 2012, 2011 and 2010, the term “QMI subordinated loans” refers to the $1.0 billion subordinated loan due in 2022 we entered into in 2007 in favor of Quebecor Media (entirely redeemed for $670.0 million and $330.0 million in 2010 and 2014, respectively), the $870.0 million subordinated loan due in 2022 we entered into in 2007 in favor of Quebecor Media (entirely redeemed for $110.0 million, $500.0 million and $260.0 million in 2008, 2009 and 2010, respectively), the $1.3 billion subordinated loan due in 2025 we entered into in 2010 in favor of Quebecor Media (partly redeemed for $870.0 million in 2014), and the $3.25 billion subordinated loan due in 2043 we entered into in 2013 in favor of Quebecor Media (partly redeemed for $2.6 billion in 2013). See “Item 5. Operating and Financial Review and Prospects — Uses of Liquidity and Capital Resources - Purchase of Shares of Quebecor Media and Servicing of Subsidiary Subordinated Loan”. |
| (3) | We believe that long-term debt, excluding QMI subordinated loans, provides investors with a meaningful measure of our long-term debt because the QMI subordinated loans are subordinated in right of payment to the prior payment in full of our senior indebtedness, including our notes, and because the proceeds of our QMI subordinated loans due 2022, 2025 and 2043 were invested in retractable preferred shares of Quebecor Media or its subsidiaries as part of back-to-back transactions to reduce our income tax obligations. Consequently, we disclose long-term debt, excluding QMI subordinated loans, as a supplemental measure of our indebtedness in this annual report. Long-term debt, excluding QMI subordinated loans, is not intended to be, and should not be, regarded as an alternative to other financial reporting measures, and it should not be considered in isolation as a substitute for measures of liabilities prepared in accordance with IFRS. Long-term debt, excluding QMI subordinated loans, is calculated from and reconciled to long-term debt as follows: |
| At December 31 | ||||||||||||||||||||
| 2014 | 2013 | 2012 | 2011 | 2010 | ||||||||||||||||
(Canadian dollars in millions) (unaudited) | ||||||||||||||||||||
Long-term debt | $ | 4,004.5 | $ | 4,679.1 | $ | 3,757.1 | $ | 3,487.1 | $ | 3,416.1 | ||||||||||
QMI subordinated loans(2) | (1,080.0 | ) | (2,280.0 | ) | (1,630.0 | ) | (1,630.0 | ) | (1,630.0 | ) | ||||||||||
|
|
|
|
|
|
|
|
|
| |||||||||||
Long-term debt, excluding QMI subordinated loans, as defined | $ | 2,924.5 | $ | 2,399.1 | $ | 2,127.1 | $ | 1,857.1 | $ | 1,786.1 | ||||||||||
|
|
|
|
|
|
|
|
|
| |||||||||||
| (4) | Adjusted operating income and ratios based on this measure are not required by or recognized under IFRS. We define adjusted operating income, as reconciled to net income under IFRS, as net income before depreciation and amortization, financial expenses, gain or loss on valuation and translation of financial instruments, gain or loss on debt refinancing, restructuring of operations, impairment of assets and other special items, income taxes and income from discontinued operations. We define adjusted operating income margin as the adjusted operating income expressed as a percentage of revenues under IRFS. Adjusted operating income, and ratios using this measure, are not intended to be regarded as alternatives to other financial operating performance measures or to the consolidated statement of cash flows as a measure of liquidity and should not be considered in isolation or as a substitute for measures of performance prepared in accordance with IFRS. We use adjusted operating income because we believe that it is a meaningful measure in evaluating Videotron’s consolidated results. As such, this measure eliminates the effect of significant levels of non-cash charges related to depreciation of tangible assets and amortization of certain intangible assets and is unaffected by the capital structure or investment activities of Videotron. A limitation of this measure, however, is that it does not reflect the periodic costs of capitalized tangible and intangible assets used in generating revenues. Measures like adjusted operating income are commonly used by the investment community to analyze and compare the performance of companies in the industries in which we are engaged. Our definition of adjusted operating income may not be the |
3
Table of Contents
| same as similarly titled measures reported by other companies, therefore limiting its usefulness as a comparative measure. See “Presentation of Financial Information — Non-IFRS Measures”. Our adjusted operating income is calculated from and reconciled to net income under IFRS for the years ended December 31, 2014, 2013, 2012, 2011 and 2010 in the table below: |
| Year ended December 31, | ||||||||||||||||||||
| 2014 | 2013 | 2012 | 2011 | 2010 | ||||||||||||||||
(dollars in millions) (unaudited) | ||||||||||||||||||||
Net income | $ | 420.2 | $ | 376.9 | $ | 514.0 | $ | 456.2 | $ | 495.7 | ||||||||||
Depreciation and amortization | 601.4 | 561.7 | 485.4 | 407.0 | 291.0 | |||||||||||||||
Financial expenses(1) | 169.2 | 174.1 | 179.4 | 161.2 | 154.2 | |||||||||||||||
Loss (gain) on valuation and translation of financial instruments | 3.4 | 163.7 | (75.7 | ) | (53.9 | ) | (24.4 | ) | ||||||||||||
Loss (gain) on debt refinancing | 21.4 | 18.9 | (7.6 | ) | (5.0 | ) | — | |||||||||||||
Restructuring of operations, impairment of assets and other special items | 39.4 | 0.7 | 0.5 | 15.1 | 10.5 | |||||||||||||||
Income taxes expense | 93.3 | 29.4 | 115.8 | 105.1 | 103.7 | |||||||||||||||
Income from discontinued operations | — | (40.7 | ) | (8.1 | ) | (12.1 | ) | (7.7 | ) | |||||||||||
|
|
|
|
|
|
|
|
|
| |||||||||||
Adjusted operating income, as defined | $ | 1,348.3 | $ | 1,284.7 | $ | 1,203.7 | $ | 1,073.6 | $ | 1,023.0 | ||||||||||
|
|
|
|
|
|
|
|
|
| |||||||||||
| (5) | Capital expenditures are comprised of additions to fixed assets and intangible assets, excluding additions to spectrum licenses, which are presented separately in the table. |
| (6) | For the purpose of calculating the ratio of earnings to fixed charges, (i) earnings consist of net income plus income taxes, fixed charges, amortized capitalized interest, less interest capitalized, and (ii) fixed charges consist of interest expensed and capitalized, excluding interest on QMI subordinated loans, plus premiums and discounts amortization, financing fees amortization and an estimate of the interest within rental expense. |
| (7) | “Homes passed” means the number of residential premises, such as single dwelling units or multiple dwelling units, and commercial premises passed by the cable television distribution network in a given cable system service area in which the programming services are offered. |
| (8) | “Basic cable customers” are customers who receive basic cable television service in either analog or digital mode. |
| (9) | Represents customers as a percentage of total homes passed. |
| (10) | Represents customers for the digital service as a percentage of basic cable customers. |
| (11) | ARPU is not a measurement that is calculated in accordance with IFRS, and our definition and calculation of ARPU may not be the same as identically titled measurements reported by other companies. We calculate our combined ARPU by dividing our combined cable television, Internet access, cable and mobile telephony revenues by the average number of basic cable customers during the applicable period, and then dividing the resulting amount by the number of months in the applicable period. |
| (12) | Due to changes in product definitions, customer statistics and their related penetration rates for the financial years ended December 31, 2013, 2012, 2011 and 2010 have been restated. |
4
Table of Contents
| B- | Capitalization and Indebtedness |
Not applicable.
| C- | Reasons for the Offer and Use of Proceeds |
Not applicable.
| D- | Risk Factors |
This section describes some of the risks that could materially affect our business, revenues, results of operations and financial condition, as well as the market value of our Senior Notes. The factors below should be considered in connection with any forward-looking statements in this document and with the cautionary statements contained in the section “Cautionary Statement Regarding Forward-Looking Statements” at the forepart of this annual report. The risks below are not the only ones that we face. Some risks may not yet be known to us and some that we do not currently believe to be material could later turn out to be material.
Risks Relating to Our Business
We operate in highly competitive industries that are experiencing rapid technological developments, and our inability to compete successfully could have a material adverse effect on our business, prospects, revenues, financial condition and results of operations.
In our cable business, we compete against incumbent local exchange carriers (or “ILECs”) the primary of which in our market holds a regional license to provide terrestrial broadcasting distribution in Montréal and several other communities in the Province of Québec. Such primary ILEC launched its own Internet protocol television (or “IPTV”) service in Montréal (including a portion of the greater Montréal area), in Québec City and in other locations in the Province of Québec and also secured licenses to launch video distribution services using video digital subscriber line (or “VDSL”) technology. We also compete against providers of direct broadcast satellite (or “DBS”, which in Canada are also referred to as “DTH” for “direct-to-home” satellite providers), multichannel multipoint distribution systems (or “MMDS”), and satellite master antenna television systems. The direct access to some broadcasters’ websites that provide streaming of video-on-demand content is also available for some of the channels we offer in our television programming. In addition, third-party Internet access providers could launch IP video services in our footprint.
We also face competition from illegal providers of cable television services and illegal access to non-Canadian DBS (also called grey market piracy), as well as from signal theft of DBS that enables customers to access programming services from U.S. and Canadian DBS without paying any fees (also called black market piracy). Competitors in the video business also include emerging content delivery platforms. Furthermore, over-the-top (or “OTT”) content providers, such as Netflix and Apple TV, compete for viewership.
Due to ongoing technological developments, the distinction between traditional platforms (broadcasting, Internet and telephony) is fading rapidly. For instance, the Internet, through wired and mobile devices, is becoming an important broadcasting and distribution platform. In addition, mobile operators, with the development of their respective 4G and Long Term Evolution (also known as “LTE”) networks, are now offering wireless and fixed wireless Internet services. In addition, our VoIP telephony service also competes with Internet-based solutions.
In our Internet access business, we compete against other Internet service providers (or “ISPs”) offering residential and commercial Internet access services as well as WiMAX and open Wi-Fi networks in some cities. The main competitors are the ILECs that offer Internet access through digital subscriber line (or “DSL”), fibre to the node and fibre to the home technologies, often offering comparable download speeds to ours. In addition, satellite operators such as Xplornet are increasing their existing high-speed Internet access (or “HSIA”) capabilities with the launch of high-throughput satellites, targeting households in rural and remote locations and claiming future download speeds comparable to our low and medium download speeds. The CRTC also requires cable and ILEC network providers, including ourselves, to offer wholesale access to our high-speed Internet systems to third party ISP competitors for the purpose of providing retail Internet access services. These third party ISP competitors may also provide telephony and networking applications.
5
Table of Contents
Our cable telephony business has numerous competitors, including ILECs, competitive local exchange carriers (or “CLECs”), mobile telephony service operators and other providers of telephony, VoIP and Internet communications, including competitors that are not facility-based and therefore have a much lower infrastructure cost. In addition, Internet protocol-based (“IP-based”) products and services are generally subject to downward pricing pressure, lower margins and technological evolution, all of which could have an adverse effect on our business, prospects and results of operation.
In our mobile telephony business, we compete against a mix of market participants, some of them active in some or all of the products we offer, with others offering only mobile telephony services. In addition, users of mobile voice and data systems may find their communication needs satisfied by other current or developing adjunct technologies, such as Wi-Fi, WiMax, “hotspots” or trunk radio systems, which have the technical capability to handle mobile data communication and mobile telephone calls. There can be no assurance that current or future competitors will not provide network capacity and/or services comparable or superior to those we provide or may in the future provide, or at lower prices, or adapt more quickly to evolving industry trends or changing market requirements, or introduce competing services. For instance, some providers of mobile telephony services (including most of the incumbent carriers as well as at least one other new entrant) have launched lower-cost mobile telephony services in order to acquire additional market share. Also, we may not be able to compete successfully in the future against existing or potential competitors, and increased competition could have a material adverse effect on our business, prospects, revenues, financial condition and results of operations.
Finally, a few of our competitors are offering special discounts to customers who subscribe to two or more of their services (cable television or IPTV, Internet, residential phone and mobile telephony services). As a result, should we fail to keep our existing customers and lose them to such competitors, we may end up losing up to one subscriber for each of our services. This could have an adverse effect on our business, prospects, revenues, financial condition and results of operation.
We have entered into roaming agreements with other mobile operators in order to provide worldwide coverage to our mobile telephony customers. Our inability to extend our worldwide coverage or to renew, or substitute for, these roaming agreements at their respective terms and on acceptable terms may place us at a competitive disadvantage, which could adversely affect our ability to operate our mobile business successfully and profitably.
We have entered into roaming agreements with multiple carriers around the world (including Canada, the United States and Europe), and have established worldwide coverage. Our inability to extend our worldwide coverage or to renew, or substitute for, these roaming agreements at their respective or better terms or on acceptable terms, may place us at a competitive disadvantage, which could adversely affect our ability to operate our mobile business successfully and profitably.
In addition, various aspects of mobile communication operations, including the ability of mobile providers to enter into interconnection agreements with traditional landline telephone companies and the ability of mobile providers to manage data traffic on their networks, are subject to regulation by the CRTC. Regulations adopted or actions taken by the government agencies having jurisdiction over any mobile business that we may develop could adversely affect our mobile business and operations, including actions that could increase competition or our costs.
Our reputation may be negatively impacted, which could have a material adverse effect on our business, financial condition and results of operations.
We have generally enjoyed a good reputation among the public. Our ability to maintain our existing customer relationships and to attract new customers depends to a large extent on our reputation. While we have put in place certain mechanisms to mitigate the risk that our reputation may be tarnished, including good governance practices and a Code of Ethics, we cannot be assured that we will continue to enjoy a good reputation nor can we be assured that events that are beyond our control will not cause our reputation to be negatively impacted. The loss or tarnishing of our reputation could have a material adverse effect on our business, prospects, financial condition and results of operations.
6
Table of Contents
Our inventory may become obsolete
Our wireless handset devices inventory generally has a relatively short product life cycles due to frequent wireless handset introductions. If we cannot effectively manage inventory levels based on product demand, this may increase the risk of inventory obsolescence.
We are regularly required to make capital expenditures to remain technologically and economically competitive. We may not be able to obtain additional capital to implement our business strategies and make capital expenditures.
Our strategy of maintaining a leadership position in the suite of products and services we offer and launching new products and services requires capital investments in our network and infrastructure to support growth in our customer base and demands for increased bandwidth capacity and other services. In this regard, we have in the past required substantial capital for the upgrade, expansion and maintenance of our network and the launch and deployment of new or additional services. We expect that additional capital expenditures will continue to be required in the short and medium term in order to expand and maintain our systems and services, including expenditures relating to advancements in Internet access and high definition television (“HDTV”), as well as the cost of our mobile services infrastructure deployment.
The demand for wireless data services has been growing at unprecedented rates and it is projected that this demand will further accelerate, driven by the following increases: levels of broadband penetration; need for personal connectivity and networking; affordability of smartphones and Internet-only devices (e.g., high-usage data devices such as mobile Internet keys, tablets and electronic book readers); multimedia-rich services and applications; wireless competition; and unlimited data plans. The anticipated levels of data traffic will represent a growing challenge to the current mobile network’s ability to serve this traffic. We may have to acquire additional spectrum, if available and if economically reasonable, in order to address this increased demand. The ability to acquire additional spectrum (if needed) is dependent on the timing and the rules established by Industry Canada. If we are not successful in acquiring additional spectrum we may need on reasonable terms, it could have a material adverse effect on our business, prospects and financial condition. See also “Item 4. Information on the Corporation — Regulation — Canadian Telecommunications Services — Regulatory Framework for Mobile Wireless Services.”
Developing our LTE network requires capital expenditures to remain competitive and to comply with our obligations under the agreement with our partner governing the joint built-out of our LTE network. In addition, we may be required to make further capital expenditures in the future on our LTE network to remain competitive and in order to comply with our obligations. See also “Item 4. Information on the Corporation — History and Development of the Corporation.” A geographical expansion of our LTE network may require us to incur significant costs and to make significant capital expenditures.
There can be no assurance that we will be able to generate or otherwise obtain the funds to finance any portion of these capital improvement programs, new strategies and services or other capital expenditure requirements, whether through cash from operations, additional borrowings or other sources. If we are unable to generate sufficient funds or obtain additional financing on acceptable terms, we may be unable to implement our business strategies or proceed with the capital expenditures and investments required to maintain our leadership position, and our business, financial condition, results of operations, reputation and prospects could be materially adversely affected. Even if we are able to obtain adequate funding, the period of time required to upgrade our network could have a material adverse effect on our ability to successfully compete in the future. Moreover, additional investments in our business may not translate into incremental revenues, cash flows or profitability.
See also the risk factors “— We operate in highly competitive industries that are experiencing rapid technological developments, and our inability to compete successfully could have a material adverse effect on our business, prospects, revenues, financial condition and results of operations” and “— Risks Relating to our Senior Notes and our Capital Structure — We may be required from time to time to refinance certain of our indebtedness. Our inability to do so on favorable terms, or at all, could have a material adverse effect on us.”
We may need to support increasing costs in securing access to support structures needed for our cable network.
We require access to the support structures of hydroelectric and telephone utilities and need municipal rights of way to deploy our cable network. Where access to the structures of telephone utilities cannot be secured, we may apply to the CRTC to obtain a right of access under theTelecommunications Act (Canada) (the “Telecommunications Act”). We
7
Table of Contents
have entered into comprehensive support structure access agreements with all of the major hydroelectric companies and all of the major telecommunications companies in our service territory. In the event that we seek to renew or to renegotiate these agreements, we cannot guarantee that these agreements will continue to be available on favourable terms.
We may not successfully implement our business and operating strategies.
Our business strategies are based on leveraging an integrated platform of media assets. Our strategies include offering multi-platform advertising solutions, generating and distributing content across a spectrum of media properties and assets, launching and deploying additional value-added products and services, pursuing cross-promotional opportunities, maintaining our advanced broadband network, pursuing enhanced content development to reduce costs, further integrating the operations of our subsidiaries, leveraging geographic clustering and maximizing customer satisfaction. We may not be able to fully implement these strategies or realize their anticipated results without incurring significant costs or not implement them at all. In addition, our ability to successfully implement these strategies could be adversely affected by a number of factors beyond our control, including operating difficulties, increased ongoing operating costs, regulatory developments, general or local economic conditions, increased competition, technological changes and other factors described in this “Risk Factors” section. While the centralization of certain business operations and processes has the advantage of standardizing our practices, thereby reducing costs and increasing effectiveness, it also represents a risk in itself should a business solution implemented by a centralized office throughout the organization fail to produce the intended results. We may also be required to make capital expenditures or other investments, that may affect our ability to implement our business strategies if we are unable to secure additional financing on acceptable terms or to generate sufficient funds internally to cover those requirements. Any material failure to implement our strategies could have a material adverse effect on our reputation, business, financial condition, prospects and results of operations, as well as on our ability to meet our obligations, including our ability to service our indebtedness.
As part of our strategy, in recent years, we have entered into certain agreements with third-parties under which we are committed to making significant operating expenditures in the future. We can provide no assurance that we will be successful in developing new activities in relation to these new engagements, including the development of new revenue sources.
We could be adversely impacted by consumers’ trend to abandon cable telephony and television services.
The recent trend toward mobile substitution or “cord-cutting” (when users cancel their landline telephony services and opt for mobile telephony services only) is largely the result of the increasing mobile penetration rate in Canada and the various unlimited offers launched by mobile operators. In addition, there is also a consumer trend to abandon and substitute wire and cable television for Internet access service in order to stream directly from broadcasters and over-the-top content providers. We may not be successful in converting our existing cable telephony subscriber base to our mobile telephony services or in attracting customers to our over-the-top entertainment platforms (such as Club illico), which could have a material adverse effect on our business, our results of operation and our financial condition.
We could be adversely affected by the rapid growth of traffic volumes on the Internet.
Internet users are downloading an increasing amount of data each year and households are now connected to the Internet through a combination of several computers, tablets and other mobile devices, leading to simultaneous flows per home, which constitutes a departure from the past, when a majority of households were connected to the Internet through a single computer. In addition, some content on the Internet, such as videos, is now available at a higher bandwidth for which high-definition (or “HD”), as opposed to standard definition, is gradually becoming the norm. There has therefore been an increase in data consumption and an intensification of Internet traffic during peak periods, which calls for increased bandwidth capacity to address the needs of our customers.
Equipment costs are under pressure in an effort to counterbalance customers’ demand for bandwidth. While we can relay some of this pressure on costs to our manufacturers, adopt new technologies that allow cost reduction and implement other cost reduction initiatives, our inability to fully meet our increasing need for bandwidth may result in price hikes or in reduced profitability.
8
Table of Contents
We compete, and will continue to compete, with alternative technologies and we may be required to invest a significant amount of capital to address continuing technological evolution and development.
The media industry is experiencing rapid and significant technological changes, which have resulted in alternative means of program and content transmission. The continued growth of the Internet has presented alternative content distribution options that compete with traditional media. Furthermore, in our video distribution markets, industry regulators have authorized DTH, microwave services and VDSL services and may authorize other alternative methods of transmitting television and other content with improved speed and quality. We may not be able to successfully compete with existing or newly developed alternative technologies, such as IPTV, or we may be required to acquire, develop or integrate new technologies. The cost of the acquisition, development or implementation of new technologies could be significant and our ability to fund such implementation may be limited, which could have a material adverse effect on our ability to successfully compete in the future. Any such difficulty or inability to compete could have a material adverse effect on our business, reputation, prospects, financial condition or results of operations.
The continuous technological improvements to the Internet, combined with higher download speeds and cost reductions for customers, may divert a portion of our existing television subscriber base from our services to new video-over-the-Internet model. While having a positive impact on the demand for our Internet services, video-over-the-Internet could adversely impact the demand for our other services.
If we do not effectively manage our growth, our business, results of operations and financial condition could be adversely affected.
We have experienced substantial growth in our business and have significantly expanded our operations over the years. We have sought in the past, and may, in the future, seek to further expand the types of businesses in which we participate, under appropriate conditions. We can provide no assurance that we will be successful in either developing or fulfilling the objectives of any such business expansion.
In addition, our expansion may require us to incur significant costs or divert significant resources, and may limit our ability to pursue other strategic and business initiatives, which could have an adverse effect on our business, financial condition, prospects or results of operations. Furthermore, if we are not successful in managing our growth, or if we are required to incur significant or unforeseen costs, our business, results of operations and financial condition could be adversely affected.
The implementation of changes to the structure of our business may be more expensive than expected and we may not gain all the anticipated benefits.
We have and we will continue to implement changes to the structure of our business due to many factors such as the necessity of a corporate restructuring, a system replacement and upgrade, a process redesign and the integration of business acquisitions or existing business units. These changes must be managed carefully to ensure that we capture the intended benefits. The implementation process may lead to greater-than-expected operational challenges and costs, expenses, customer loss and business disruption for us, which could adversely affect our business and our ability to gain our anticipated benefits.
We depend on key personnel and our inability to retain skilled employees may have an adverse effect on our financial condition and results of operations.
Our success depends to a large extent on the continued services of our senior management and our ability to retain skilled employees. There is intense competition for qualified management and skilled employees, and our failure to recruit, train and retain such employees could have a material adverse effect on our business, financial condition and results of operations. In addition, in order to implement and manage our businesses and operating strategies effectively, we must sustain a high level of efficiency and performance and maintain content quality, we must continually enhance our operational and management systems, and continue to effectively attract, train, motivate and manage our employees. If we are not successful in these efforts, it may have a material adverse effect on our business, prospects, results of operations and financial condition.
9
Table of Contents
Our financial performance could be materially adversely affected if we cannot continue to distribute a wide range of television programming on commercially reasonable terms.
The financial performance of our cable and mobile services depends in large part on our ability to distribute a wide range of appealing, conveniently-scheduled television programming at reasonable rates. We obtain television programming rights from suppliers pursuant to programming contracts. In recent years, these suppliers have become vertically integrated and are now more limited in number. The quality and amount of television programming we offer affect the attractiveness of our services to customers and, accordingly, the rates we can charge for these services. We may be unable to maintain key programming contracts at commercially reasonable rates for television programming. Loss of programming contracts, our inability to obtain programming at reasonable rates or our inability to pass-through rate increases to our customers could have a material adverse effect on our business, financial condition, results of operations and prospects.
In addition, our ability to attract and retain cable customers depends, to a certain extent, on our capacity to offer quality content, high-definition programming, an appealing variety of programming choices and packages, as well as multiplatform distribution and on-demand content, at competitive prices. If the number of specialty channels being offered does not increase at the level and pace comparable to our competitors, if the content offered on such channels does not receive audience acceptance, or if we are unable to offer multiplatform availability, high definition programming and on-demand content, for capacity reasons among others, this may have a negative impact on revenues from our cable operations.
The multiplication of foreign and deregulated content providers (often global players on the Internet) puts pressure on the viability of our current business model for television distribution. Substantial capital expenditures on our infrastructure and in our research and development may be required to remain competitive.
We provide our digital television, Internet access and cable telephony services through a single clustered network, which may be more vulnerable to widespread disruption.
We provide our digital television, Internet access and cable telephony services through a primary headend and our analog television services through twelve additional regional headends in our single clustered network. Despite available emergency backup or replacement sites, a failure in our primary headend, including exogenous threats, such as natural disasters, sabotage or terrorism, or dependence on certain external infrastructure providers (such as electric utilities), could prevent us from delivering some of our products and services throughout our network until the failure has been resolved, which may result in significant customer dissatisfaction, loss of revenues and potential civil litigation.
We are dependent upon our information technology systems and those of certain third-parties. The inability to enhance our systems, or to protect them from a security breach, disaster or cyber-security threat, could have an adverse impact on our financial results and operations.
The day-to-day operation of our business is highly dependent on information technology systems, including those of certain third-party suppliers. An inability to maintain and enhance our existing information technology systems or obtain new systems to accommodate additional customer growth or to support new products and services could have an adverse impact on our ability to acquire new subscribers, retain existing customers, produce accurate and timely billing, generate revenue growth and manage operating expenses, all of which could adversely impact our financial results and position. In addition, although we use industry standard networks and established information technology security and survivability/disaster recovery practices, a security breach, disaster, cyber-security threat or a violation of our Internet security could have a material adverse effect on our reputation, business, prospects, financial condition and results of operations.
We may not be able to protect our services from piracy, which may have an adverse effect on our customer base and lead to a possible decline in revenues.
In our cable, Internet access and telephony business, we may not be able to protect our services and data from piracy. We may be unable to prevent electronic attacks to gain unauthorized access to our network, analog and digital programming, and our Internet access services. We use encryption technology to protect our cable signals from unauthorized access and to control programming access based on subscription packages. We may not be able to develop
10
Table of Contents
or acquire adequate technology to prevent unauthorized access to our network, programming and data, which may have an adverse effect on our customer base and lead to a possible decline in our revenues as well as significant remediation costs and legal claims.
Malicious and abusive Internet practices could impair our cable data services.
Our cable data customers utilize our network to access the Internet and, as a consequence, we or they may become a victim of common malicious and abusive Internet activities, such as unsolicited mass advertising (or spam) and dissemination of viruses, worms and other destructive or disruptive software. These activities could have adverse consequences on our network and our customers, including deterioration of service, excessive call volume to call centers and damage to our customers’ equipment and data or ours. Significant incidents could lead to customer dissatisfaction and, ultimately, to loss of customers or revenues, in addition to increased costs to service our customers and protect our network. Any significant loss of cable data, customers or revenue, or a significant increase in the costs of serving those customers could adversely affect our reputation, growth, business, prospects, financial condition and results of operations.
We depend on third-party suppliers and providers for services, information and other items critical to our operations.
We depend on third-party suppliers and providers for certain services, hardware and equipment that are critical to our operations and network evolution. These materials and services include set-top boxes, mobile telephony handsets and network equipment, cable and telephony modems, servers and routers, fibre-optic cable, telephony switches, inter-city links, support structures, software, the “backbone” telecommunications network for our Internet access and telephony services, and construction services for expansion and upgrades of our cable and mobile networks. These services and equipment are available from a limited number of suppliers and therefore we face the risks of supplier disruption, including business difficulties, restructuring or supply-chain issues. If no supplier can provide us with the equipment or services that we require or that comply with evolving Internet and telecommunications standards or that are compatible with our other equipment and software, our business, financial condition and results of operations could be materially adversely affected. In addition, if we are unable to obtain critical equipment, software, services or other items on a timely basis and at an acceptable cost, our ability to offer our products and services and roll out our advanced services may be delayed, and our business, financial condition and results of operations could be materially adversely affected.
We may be adversely affected by litigation and other claims.
In the normal course of business, we are involved in various legal proceedings and other claims relating to the conduct of our business. Although, in the opinion of our management, the outcome of current pending claims and other litigation is not expected to have a material adverse effect on our reputation, results of operations, liquidity or financial position, a negative outcome in respect of any such claim or litigation could have such an adverse effect. Moreover, the cost of defending against lawsuits and diversion of management’s attention could be significant. See also “Item 8. Financial Information – Legal Proceedings” in this annual report.
We may be adversely affected by strikes and other labour protests.
As of December 31, 2014, approximately 60% of our employees are unionized, and the terms of their employment are governed by one of our four regional collective bargaining agreements.
One of our collective bargaining agreements for the region of Montréal is currently being negotiated. However, we are not currently subject to a labour dispute. We can neither predict the outcome of current or future negotiations relating to labour disputes, union representation or renewal of collective bargaining agreements, nor guarantee that we will not experience future work stoppages, strikes or other forms of labour protests pending the outcome of any current or future negotiations. If our unionized workers engage in a strike or any other form of work stoppage, we could experience a significant disruption to our operations, damage to our property and/or interruption to our services, which could adversely affect our business, assets, financial position, results of operations and reputation. Even if we do not experience strikes or other forms of labour protests, the outcome of labour negotiations could adversely affect our business and results of operations. Such could be the case if current or future labour negotiations or contracts were to further restrict our ability to maximize the efficiency of our operations. In addition, our ability to make short-term adjustments to control compensation and benefits costs is limited by the terms of our collective bargaining agreements.
11
Table of Contents
Our defined benefit pension plans are currently underfunded and our pension funding requirements could increase significantly due to a reduction in funded status as a result of a variety of factors.
The economic cycle and employee demographics could have a negative impact on the funding of our defined benefit pension plans and related expenditures. There is no guarantee that the expenditures and contributions required to fund these pension plans will not increase in the future and therefore negatively impact our operating results and financial position. Risks related to the funding of defined benefit plans may materialize if total obligations with respect to a pension plan exceed the total value of its trust fund. Shortfalls may arise due to lower-than-expected returns on investments, changes in the discount rate used to assess the pension plan’s obligations, and actuarial losses.
We may be adversely affected by exchange rate fluctuations.
Most of our revenues and expenses are denominated in Canadian dollars. However, certain expenditures, such as the purchase of set-top boxes and cable modems, mobile devices (handsets) and certain capital expenditures, including certain costs related to the development and maintenance of our mobile network, are paid in U.S. dollars. Also, a substantial portion of our debt is denominated in U.S. dollars, and interest, principal and premium, if any, are payable in U.S. dollars. For the purposes of financial reporting, any change in the value of the Canadian dollar against the U.S. dollar during a given financial reporting period would result in a foreign exchange gain or loss on the translation of any unhedged U.S.dollar-denominated debt into Canadian dollars. Consequently, our reported earnings and debt could fluctuate materially as a result of foreign-exchange gains or losses. Although we have entered into transactions to hedge the exchange rate risk with respect to our U.S. dollar-denominated debt outstanding at December 31, 2014, and we intend in the future to enter into such transactions for new U.S. dollar-denominated debt, these hedging transactions could, in certain circumstances, prove economically ineffective and may not be successful in protecting us against exchange rate fluctuations, or we may in the future be required to provide cash and other collateral to secure our obligations with respect to such hedging transactions, or we may in the future be unable to enter into such transactions on favorable terms, or at all.
In addition, certain cross-currency interest rate swaps entered into by Videotron include an option that allows each party to unwind the transaction on a specific date at the then settlement amount.
The fair value of the derivative financial instruments we are party to is estimated using period-end market rates and reflects the amount we would receive or pay if the instruments were terminated and settled at those dates, as adjusted for counterparties’non-performance risk. At December 31, 2014, the net aggregate fair value of our cross-currency interest rate swaps and foreign-exchange forward contracts was in a net asset position of $111.2 million on a consolidated basis. See also “Item 11. Quantitative and Qualitative Disclosures About Market Risk” of this annual report.
The volatility and disruptions in the capital and credit markets could adversely affect our business, including the cost of new capital, our ability to refinance our scheduled debt maturities and meet our other obligations as they become due.
The capital and credit markets have experienced significant volatility and disruption over the last several years, resulting in periods of upward pressure on the cost of new debt capital and severe restrictions in credit availability for many companies. In such periods, the disruptions in the capital and credit markets have also resulted in higher interest rates or greater credit spreads on issuance of debt securities and increased costs under credit facilities. Disruptions in the capital and credit markets could increase our interest expense, thereby adversely affecting our results of operations and financial position.
Our access to funds under our existing credit facilities is dependent on the ability of the financial institutions that are parties to those facilities to meet their funding commitments. Those financial institutions may not be able to meet their funding commitments if they experience shortages of capital and liquidity or if they experience excessive volumes of borrowing requests within a short period of time. Moreover, the obligations of the financial institutions under our credit facilities are several and not joint and, as a result, a funding default by one or more institutions does not need to be made up by the others.
12
Table of Contents
Extended periods of volatility and disruptions in the capital and credit markets as a result of uncertainty, changing or increased regulation of financial institutions, reduced financing alternatives or failures of significant financial institutions could adversely affect the availability and the affordability of funding needed for our businesses in the longer term. Such disruptions could require us to take measures to conserve cash until the markets stabilize or until alternative credit arrangements or other funding for our business needs can be arranged. Market disruptions and broader economic challenges may lead to lower demand for certain of our products and increased incidences of customer inability to pay or timely pay for the services or products that we provide. Events such as these could adversely impact our results of operations, cash flows, financial position and prospects.
A failure to adopt an ethical business conduct may adversely affect our reputation.
Any failure or perceived failure to adhere to our policies, the law or ethical business practices could significantly affect our reputation and brands and could therefore negatively impact our financial performance. Our framework for managing ethical business conduct includes the adoption of a Code of Ethics which our directors and employees are required to acknowledge and agree to on a regular basis, and as part of an independent audit and security function, maintenance of a whistle-blowing hotline. There can be no assurance that these measures will be effective to prevent violations or perceived violations of law or ethical business practices.
Subject to the realization of various conditions and factors, we may have to record, in the future, asset impairment charges, which could be material and could adversely affect our future reported results of operations and equity.
We have recorded in the past asset impairment charges which, in some cases, have been material. Subject to the realization of various factors, including, but not limited to, weak economic or market conditions, we may be required to record in the future, in accordance with IFRS accounting valuation principles, additional non-cash impairment charges if the carrying value of an asset in our financial statements is in excess of its recoverable value. Any such asset impairment charge could be material and may adversely affect our future reported results of operations and equity, although such charges would not affect our cash flow.
We perform acquisitions, dispositions, business combinations, or joint ventures from time to time which may involve significant risks and uncertainties.
From time to time, we engage in discussions and activities with respect to possible acquisitions, dispositions, business combinations, or joint ventures intended to complement or expand our business, some of which may be significant transactions for us and involve significant risks and uncertainties. We may not realize the anticipated benefit from any of the transactions we pursue, and may have difficulty incorporating or integrating any acquired business. Regardless of whether we consummate any such transaction, the negotiation of a potential transaction (including associated litigation), as well as the integration of any acquired business, could require us to incur significant costs and cause diversion of management’s time and resources and disrupt our business operations. We could face several challenges in the consolidation and integration of information technology, accounting systems, personnel and operations.
If we determine to sell individual properties or other assets or businesses, we will benefit from the net proceeds realized from such sales. However, our revenues may suffer in the long term due to the disposition of a revenue generating asset, or the timing of such dispositions may be poor, causing us to fail to realize the full value of the disposed asset, all of which may diminish our ability to repay our indebtedness at maturity.
Any of the foregoing could have a material adverse effect on our business, financial condition, operating results, liquidity and prospects.
The competition for retail locations and the consolidation of independent retailers may adversely affect the expansion of our Telecommunications business’ sale network.
The competition to offer products in the best available retail commercial spaces is fierce in the telecommunications business. Some of our Telecommunications business’ competitors have pursued a strategy to sell their products through independent retailers to extend their presence on the market and some of our competitors have also
13
Table of Contents
acquired certain independent retailers and created new distribution networks. This may result in limiting the expansion of our retail network and may contribute to isolate us from our competitors, which could have an adverse effect on our business, prospects and results of operation.
Risks Relating to Regulation
We are subject to extensive government regulation and policy-making. Changes in government regulation or policies could adversely affect our business, financial condition, prospects and results of operations.
Our operations are subject to extensive government regulation and policy-making in Canada. Laws and regulations govern the issuance, amendment, renewal, transfer, suspension, revocation and ownership of broadcast programming and distribution licenses. With respect to distribution, regulations govern, among other things, the distribution of Canadian and non-Canadian programming services and the maximum fees to be charged to the public in certain circumstances. There are significant restrictions on the ability of non-Canadian entities to own or control broadcasting licenses and telecommunications carriers in Canada, although the federal government recently eliminated the foreign ownership restrictions on telecommunications companies with less than 10 percent of total Canadian telecommunications market revenues. Our broadcasting distribution and telecommunications operations (including Internet access service) are regulated respectively by theBroadcasting Act (Canada) (the “Broadcasting Act”) and the Telecommunications Act and regulations thereunder. The CRTC, which administers the Broadcasting Act and the Telecommunications Act, has the power to grant, amend, suspend, revoke and renew broadcasting licenses, approve certain changes in corporate ownership and control, and make regulations and policies in accordance with the Broadcasting Act and the Telecommunications Act, subject to certain directions from the federal cabinet. For instance, the CRTC recently adopted a new Wireless Code which regulates numerous aspects of the provision of retail wireless services. Our wireless and cable operations are also subject to technical requirements, license conditions and performance standards under theRadiocommunication Act (Canada) (the “Radiocommunication Act”), which is administered by Industry Canada.
In addition, laws relating to communications, data protection, e-commerce, direct marketing and digital advertising and the use of public records have become more prevalent in recent years. Existing and proposed legislation and regulations, including changes in the manner in which such legislation and regulations are interpreted by courts in Canada, the United States and other jurisdictions may impose limits on our collection and use of certain kinds of information. On December 17, 2014, an amendment to the Telecommunications Act and the Radiocommunication Act was adopted to give to the CRTC and Industry Canada the power to impose monetary sanctions for failure to comply with current regulations. For a more extensive description of the regulatory environment affecting our business, see “Item 4. Information on the Corporation – Regulation”.
Changes to the laws, regulations and policies governing our operations, the introduction of new laws, regulations, policies or terms of license, the issuance of new licenses, including additional spectrum licenses to our competitors or changes in the treatment of the tax deductibility of advertising expenditures could have a material adverse effect on our business (including how we provide products and services), financial condition, prospects and results of operations. In addition, we may incur increased costs in order to comply with existing and newly adopted laws and regulations or penalties for any failure to comply. It is difficult to predict in what form laws and regulations will be adopted or how they will be construed by the relevant courts, or the extent to which any changes might adversely affect us.
Industry Canada may not renew our AWS or 700 MHz licenses on acceptable terms, or at all.
Our AWS licenses were issued in December 2008 for a 10-year term. At least two years before the end of this term, and any subsequent term, we may apply for a renewed license for a term of up to 10 years. AWS license renewal, including whether license fees should apply for a subsequent license term, will be subject to a public consultation process initiated in the eighth year of the license.
Our 700 MHz licenses were issued in April 2014 for a 20-year term. At the end of this term, we expect that new licenses will be issued for a subsequent term through a renewal process, unless a breach of license condition by us has occurred, a fundamental reallocation of spectrum to a new service is required, or in the event that an overriding policy need arises. The process for issuing or renewing licenses after this term, including the terms and conditions of the new licenses and whether license fees should apply for a subsequent license term, are expected to be determined by the Minister of Industry (Canada) following a public consultation.
14
Table of Contents
We are required to provide third-party ISPs with access to our cable systems, which may result in increased competition.
The largest cable operators in Canada, including Videotron, have been required by the CRTC to provide third-party ISPs with access to their cable systems at mandated cost-based rates. Several third-party ISPs are interconnected to our cable network and are thereby providing retail Internet access services.
The CRTC also requires large cable carriers, such as us, to allow third party ISPs to provide telephony and networking (LAN/VPN) applications in addition to retail Internet access services. As a result of these requirements, we may experience increased competition for retail cable Internet and residential telephony customers.
In a notice of consultation issued on October 15, 2013, the CRTC initiated a comprehensive review of wholesale services and associated policies. Among the issues considered in this proceeding are whether to extend mandatory wholesale high-speed access services to include fibre-to-the-premises (FTTP) services, or alternatively whether the CRTC should forbear from regulating any existing wholesale services, as well as the approaches and principles the CRTC relies on to set rates for wholesale services. A public hearing on these matters took place in November and December, 2014, and a ruling is expected by April 2015. As a result of this proceeding, we may experience increased competition for retail cable Internet and telephony customers. In addition, because our third-party Internet access rates are regulated by the CRTC, we could be limited in our ability to recover our costs associated with providing this access.
We are subject to a variety of environmental laws and regulations.
We are subject to a variety of environmental laws and regulations. Some of our facilities are subject to federal, provincial, state and municipal laws and regulations concerning, for example, emissions to the air, water and sewer discharge, the handling and disposal of hazardous materials and waste, recycling, soil remediation of contaminated sites, or otherwise relating to the protection of the environment. In addition, laws and regulations relating to workplace safety and worker health, which, among other things, regulate employee exposure to hazardous substances in the workplace, also govern our operations. Failure to comply with present or future laws or regulations could result in substantial liability for us.
Environmental laws and regulations and their interpretation have changed rapidly in recent years and may continue to do so in the future. For instance, most Canadian provinces have recently implemented Extended Producer Responsibility (EPR) regulations in order to encourage sustainability practices such as the “Ecological recovery and reclamation of electronic products”, which sets certain recovery targets and which may require us to monitor and adjust our practices in the future.
Our properties, as well as areas surrounding those properties, particularly those in areas of long-term industrial use, may have had historic uses, or may have current uses, in the case of surrounding properties, which may affect our properties and require further study or remedial measures. We cannot provide assurance that all environmental liabilities have been determined, that any prior owner of our properties did not create a material environmental condition not known to us, that a material environmental condition does not otherwise exist on any of our properties, or that expenditure will not be required to deal with known or unknown contamination.
Concerns about alleged health risks relating to radiofrequency emissions may adversely affect our business.
Some studies have alleged links between radiofrequency emissions from certain wireless devices and cell sites and various health problems or possible interference with electronic medical devices, including hearing aids and pacemakers. All our cell sites comply with applicable laws and we rely on our suppliers to ensure that the network equipment and customer equipment supplied to us meets all applicable safety requirements. While there is no definitive evidence of harmful effects from exposure to radiofrequency emissions when the limits imposed by applicable laws and regulations are complied with, additional studies of radiofrequency emissions are ongoing and we cannot be sure that the results of any such future studies will not demonstrate a link between radiofrequency emissions and health problems.
15
Table of Contents
The current concerns over radiofrequency emissions or perceived health risks of exposure to radiofrequency emissions could lead to additional governmental regulation, diminished use of wireless services, including Videotron’s, or expose us to potential litigation. Any of these could have a material adverse effect on our business, prospects, revenues, financial condition and results of operations.
Risks Relating to our Senior Notes and our Capital Structure
Our indebtedness and significant interest payment requirements could adversely affect our financial condition and therefore make it more difficult for us to fulfill our obligations, including our obligations under our Senior Notes.
We currently have a substantial amount of debt and significant interest payment requirements. As at December 31, 2014, we had $2.9 billion of consolidated long-term debt (excluding QMI subordinated loans). Our indebtedness could have significant consequences, including the following:
| • | increase our vulnerability to general adverse economic and industry conditions; |
| • | require us to dedicate a substantial portion of our cash flow from operations to making interest and principal payments on our indebtedness, reducing the availability of our cash flow to fund capital expenditures, working capital and other general corporate purposes; |
| • | limit our flexibility in planning for, or reacting to, changes in our businesses and the industries in which we operate; |
| • | place us at a competitive disadvantage compared to our competitors that have less debt or greater financial resources; and |
| • | limit, along with the financial and other restrictive covenants in our indebtedness, our ability to, among other things, borrow additional funds on commercially reasonable terms, if at all. |
Although we have significant indebtedness, as at December 31, 2014, we had approximately $575.0 million available for additional borrowings under our existing credit facilities on a consolidated basis, and the indentures governing our outstanding Senior Notes permit us to incur substantial additional indebtedness in the future. If we or our subsidiaries incur additional debt, the risks we now face as a result of our leverage could intensify. For more information regarding our long-term debt and its maturities, refer to Note 18 to our audited consolidated financial statements for the year ended December 31, 2014 included under “Item 18. Financial Statements” of this annual report. See also the risk factor “— Restrictive covenants in our outstanding debt instruments may reduce our operating and financial flexibility, which may prevent us from capitalizing on certain business opportunities.”
Restrictive covenants in our outstanding debt instruments may reduce our operating and financial flexibility, which may prevent us from capitalizing on certain business opportunities.
Our senior secured credit facilities and the respective indentures governing our Senior Notes contain a number of operating and financial covenants restricting our ability to, among other things:
| • | incur indebtedness; |
| • | create liens; |
| • | pay dividends on or redeem or repurchase our stock; |
| • | make certain types of investments; |
| • | restrict dividends or other payments from restricted subsidiaries; |
| • | enter into transactions with affiliates; |
16
Table of Contents
| • | issue guarantees of debt; and |
| • | sell assets or merge with other companies. |
If we are unable to comply with these covenants and are unable to obtain waivers from our creditors, we would be unable to make additional borrowings under our credit facilities, our indebtedness under these agreements would be in default and that could, if not cured or waived, result in an acceleration of such indebtedness and cause cross-defaults under our other debt, including our Senior Notes. If our indebtedness is accelerated, we may not be able to repay our indebtedness or borrow sufficient funds to refinance it, and any such prepayment or refinancing could adversely affect our financial condition. In addition, if we incur additional debt in the future or refinance existing debt, we may be subject to additional covenants, which may be more restrictive than those to which we are currently subject. Even if we are able to comply with all applicable covenants, the restrictions on our ability to manage our business in our sole discretion could adversely affect our business by, among other things, limiting our ability to take advantage of financings, mergers, acquisitions and other corporate opportunities that we believe would be beneficial to us.
We may be required from time to time to refinance certain of our indebtedness. Our inability to do so on favorable terms, or at all, could have a material adverse effect on us.
We may be required from time to time to refinance certain of our existing debt at or prior to maturity. Our ability to obtain additional financing to repay such existing debt at maturity will depend upon a number of factors, including prevailing market conditions, credit availability and our operating performance. There can be no assurance that any such financing will be available to us on favorable terms, or at all. See also the risk factor “— The volatility and disruptions in the capital and credit markets could adversely affect our business, including the cost of new capital, our ability to refinance our scheduled debt maturities and meet our other obligations as they become due.”
There is no public market for our Senior Notes.
There is currently no established trading market for our issued and outstanding Senior Notes and we do not intend to apply for listing of any of our Senior Notes on any securities exchange or to arrange for any quotation on any automated dealer quotation systems. No assurance can be given as to the prices or liquidity of, or trading markets for, any series of our Senior Notes. The liquidity of any market for our Senior Notes will depend upon the number of holders of our Senior Notes, the interest of securities dealers in making a market in our Senior Notes, prevailing interest rates, the market for similar securities and other factors, including general economic conditions, our financial condition and performance and our prospects. The absence of an active market for our Senior Notes could adversely affect their market price and liquidity.
In addition, the market for non-investment grade debt has historically been subject to disruptions that have caused volatility in prices of securities. It is possible that the market for our Senior Notes will be subject to such disruptions. Any such disruptions may have a negative effect on a holder’s ability to sell our Senior Notes, regardless of our prospects and financial performance.
We may not be able to finance an offer to purchase our Senior Notes following a change of control as required by the respective indentures governing our Senior Notes because we may not have sufficient funds at the time of the change of control or our senior secured credit facilities may not allow the repurchases.
If we experience certain change of control events, as specified in the respective indentures governing our Senior Notes, we may be required to make an offer to repurchase all of our Senior Notes prior to maturity. We can provide no assurance that we will have sufficient funds or be able to arrange for additional financing to repurchase our Senior Notes following such change of control. There is no sinking fund with respect to our outstanding Senior Notes.
In addition, a change of control would be an event of default under our senior secured credit facilities. Any future credit agreement or other agreements relating to our senior indebtedness to which we become a party may contain similar provisions. Our failure to repurchase our Senior Notes if required upon a change of control would, pursuant to the terms of the respective indentures governing our outstanding Senior Notes, constitute an event of default under such indentures. Any such default could, in turn, constitute an event of default under future indebtedness, any of which may cause the related debt to be accelerated after the expiry of any applicable notice or grace periods. If debt were to be accelerated, we may not have sufficient funds to repurchase our Senior Notes and repay the debt.
17
Table of Contents
Although our Senior Notes are referred to as “senior notes,” they are effectively subordinated to our secured indebtedness and structurally subordinated to the liabilities of our subsidiaries.
Our Senior Notes are unsecured and, therefore, are effectively subordinated to any secured indebtedness that we may incur to the extent of the assets securing such indebtedness. In the event of a bankruptcy or similar proceeding involving us, the assets that serve as collateral for any secured indebtedness will be available to satisfy the obligations under the secured indebtedness before any payments are made on the Senior Notes. The Senior Notes are effectively subordinated to any borrowings under our senior secured credit facilities. In addition, our senior secured credit facilities and the respective indentures governing our Senior Notes permit us to incur additional secured indebtedness in the future, which could be significant.
Canadian bankruptcy and insolvency laws may impair the trustees’ ability to enforce remedies under the indentures governing our Senior Notes or the Senior Notes themselves.
The rights of the trustees, who represent the holders of our Senior Notes, to enforce remedies could be delayed by the restructuring provisions of applicable Canadian federal bankruptcy, insolvency and other restructuring legislation if the benefit of such legislation is sought with respect to us. For example, both theBankruptcy and Insolvency Act(Canada) and theCompanies’ Creditors Arrangement Act (Canada) (the “CCAA”) contain provisions enabling an insolvent person to obtain a stay of proceedings against its creditors and to file a proposal to be voted on by the various classes of its affected creditors. A restructuring proposal, if accepted by the requisite majorities of each affected class of creditors, and if approved by the relevant Canadian court, would be binding on all creditors within each affected class, including those creditors that did not vote to accept the proposal. Moreover, this legislation, in certain instances, permits the insolvent debtor to retain possession and administration of its property, subject to court oversight, even though it may be in default under the applicable debt instrument, during the period that the stay against proceedings remains in place. In addition, it may be possible in certain circumstances to restructure certain debt obligations under the corporate governing statute applicable to the debtor.
The powers of the court under theBankruptcy and Insolvency Act (Canada) and particularly under the CCAA have been interpreted and exercised broadly so as to protect a restructuring entity from actions taken by creditors and other parties. Accordingly, we cannot predict whether payments under our outstanding Senior Notes would be made during any proceedings in bankruptcy, insolvency or other restructuring, whether or when the trustees could exercise their respective rights under the respective indentures governing each series of our Senior Notes or whether and to what extent holders of our Senior Notes would be compensated for any delays in payment, if any, of principal, interest and costs, including the fees and disbursements of the respective trustees.
Non-U.S. holders of our Senior Notes are subject to restrictions on the transfer or resale of our Senior Notes.
Although we have registered certain series of our Senior Notes under the Securities Act, we did not, and we do not intend to, qualify our Senior Notes by prospectus in Canada, and, accordingly, the Senior Notes remain subject to restrictions on resale and transfer in Canada. In addition, non-U.S. holders remain subject to restrictions imposed by the jurisdiction in which the holder is resident.
U.S. investors in our Senior Notes may have difficulties enforcing civil liabilities.
We are incorporated under the laws of the Province of Québec. Substantially all of our directors, controlling persons and officers are residents of Canada or other jurisdictions outside the United States, and all or a substantial portion of their assets and substantially all of our assets are located outside the United States. We have agreed, in accordance with the terms of the respective indentures governing each series of our Senior Notes (other than our Canadian-dollar denominated Senior Notes), to accept service of process in any suit, action or proceeding with respect to the indentures or such Senior Notes brought in any federal or state court located in New York City by an agent designated for such purpose, and to submit to the jurisdiction of such courts in connection with such suits, actions or proceedings. However, it may be difficult for holders of our Senior Notes to effect service of process within the United States upon directors, controlling persons, officers and experts who are not residents of the United States or to enforce against us or
18
Table of Contents
them in the United States upon judgments of courts of the United States predicated upon civil liability under United States federal or state securities laws or other laws of the United States. In addition, there is doubt as to the enforceability in Canada of liabilities predicated solely upon United States federal or state securities laws against us or against our directors, controlling persons, officers and experts who are not residents of the United States, in original actions or in actions for enforcement of judgments of courts of the United States.
We are controlled by Quebecor Media and its interests may differ from those of holders of the Senior Notes.
All of our issued and outstanding common shares are held by Quebecor Media. As a result, Quebecor Media controls our policies and operations. The interests of Quebecor Media, as our sole common shareholder, may conflict with the interests of the holders of our outstanding Senior Notes. In addition, actions taken by Quebecor Media, as well as its financial condition, matters over which we have no control, may affect us.
Also, Quebecor Media is a holding company with no significant assets other than its equity interests in its subsidiaries. Its principal source of cash needed to pay its own obligations is the cash that we and other subsidiaries generate from operations and borrowings. We have the ability to pay significant dividends under the terms of our indebtedness and applicable law and currently expect to make distributions to our shareholder in the future, subject to the terms of our indebtedness and applicable law. See “Item 8. Financial Information — Dividend Policy” elsewhere in this annual report.
ITEM 4 – INFORMATION ON THE CORPORATION
| A- | History and Development of the Corporation |
Our legal and commercial name is Videotron Ltd. We were founded on September 1, 1989 as part of the amalgamation of our two predecessor companies, namely Videotron Ltd. and Télé-Câble St-Damien inc., under Part IA of theCompanies Act (Québec) (since February 14, 2011, theBusiness Corporations Act (Québec)). On October 23, 2000, we were acquired by Quebecor Media.
Our registered office is located at 612 St-Jacques Street, Montréal, Québec, Canada H3C 4M8, and our telephone number is(514) 281-1232. Our corporate website may be accessed through the URLhttp://www.videotron.com. The information found on our corporate website or on any other website to which we refer in this annual report does not, however, form part of this annual report and is not incorporated by reference herein. Our agent for service of process in the United States with respect to our Senior Notes (other than our Senior Notes due 2020, 2021 and 2025) is CT Corporation System, 111 Eighth Avenue, New York, New York 10011.
Since December 31, 2011, we have undertaken and/or completed several business acquisitions, capital expenditures, business development projects and transactions, including, among others, the following:
| • | We have continued to actively pursue the roll-out of our mobile network. As of December 31, 2014, our mobile telephony services covered the Province of Québec (7.4 million people) and Eastern Ontario. During 2014, we activated 128,452 net new lines on our advanced mobile network at a pace of approximately 10,704 net new lines per month, bringing our total mobile customer base to 632,766 activated lines. |
| • | On March 11, 2015, we issued a notice of redemption for all of our outstanding 6 3/8% Senior Notes due December 15, 2015. The redemption is anticipated to be completed on April 10, 2015. |
| • | On March 11, 2015, we announced a transaction whereby we acquired 4Degrees Colocation and its data centre, the largest in Québec City, for a cash consideration of $31.5 million, which could increase to $35.5 million if certain targets are reached. 4Degrees Colocation is one of the few data centres in the Province of Québec to be Tier III certified by the Uptime Institute, an international standard that ensures maximum reliability and operational sustainability. |
| • | On March 6, 2015, Industry Canada announced that we were the successful bidder for four 30 MHz licenses in the auction for AWS-3 commercial mobile spectrum. We obtained the 30 MHz licenses for Eastern Québec, Southern Québec, Northern Québec and Eastern Ontario / Outaouais, covering 100% of Québec’s population and that of the Ottawa region, for a total price of $31.8 million. |
19
Table of Contents
| • | On September 10, 2014, we launched our LTE network, which reaches nearly 90% of the population of the Province of Québec and supports speed of up to 150 mbps. |
| • | On April 9, 2014, we announced the closing of the offering and sale of 5 3/8% Senior Notes, maturing on June 15, 2024, in the aggregate principal amount of US$600.0 million for net proceeds of $654.5 million (net of financing expenses). The proceeds of this offering were used on April 24, 2014 to finance the early redemption and withdrawal of US$260.0 million aggregate principal amount of our outstanding 9 1/8% Senior Notes, issued on March 5, 2009 and maturing in April 15, 2018, to repay borrowings under our revolving credit facility, to pay related fees and expenses and the remainder for general corporate purposes. |
| • | On April 3, 2014, after final payment was made on the spectrum awarded in the auction ended February 19, 2014, Industry Canada issued us seven 700 MHz licenses. The operating licenses, acquired for $233.3 million, cover the entire provinces of Québec, Ontario (except Northern Ontario), Alberta and British Columbia, for a total covered population of more than 28 million, representing approximately 80% of Canada’s population. |
| • | On June 17, 2013, we announced the closing of the offering and sale of 5 5/8% Senior Notes, maturing on June 15, 2025, in the aggregate principal amount of $400.0 million for net proceeds of $394.8 million (net of financing expenses). The proceeds of this offering were used on July 2, 2013 to finance the early redemption and withdrawal of US$380.0 million aggregate principal amount of our outstanding 9 1/8% Senior Notes, issued on April 15, 2008 and maturing in April 2018 and to settle the related hedging contracts. |
| • | In June 2013, we amended our $575.0 million secured revolving credit facility to extend the maturity date to July 2018 and to amend some of its terms and conditions. |
| • | On May 31, 2013, we sold our specialized web sites Jobboom and Réseau Contact to our parent corporation Quebecor Media for a total consideration of $65.0 million. On the same day, Quebecor Media announced that Mediagrif Interactive Technologies (“Mediagrif”) and Quebecor Media reached a definitive agreement pursuant to which Mediagrif acquired Jobboom and Réseau Contact. |
| • | On May 29, 2013, we announced an agreement with Rogers Communications Partnership (“Rogers”) for the cooperation and collaboration in the build-out and operation of a shared LTE wireless network in the Province of Québec and the Ottawa region (the “Rogers LTE Agreement”). We will maintain our business independence, including product and service portfolios, billing systems and customer data. As part of the Rogers LTE Agreement, we will provide each other with services for which we will receive $93.0 million and Rogers will receive $200.0 million, payable over a period of 10 years. In addition to the LTE network build-out and sharing agreement, we have also come to an agreement with Rogers regarding our unused AWS spectrum in the Greater Toronto Area. We have the option to transfer our Toronto spectrum license to Rogers since January 1, 2014 for an aggregate consideration of $180.0 million. |
| • | On March 14, 2012, we issued US$800.0 million aggregate principal amount of our 5% Senior Notes due 2022 for net proceeds of $787.6 million (net of financing expenses). We used the proceeds to repurchase and retire all US$395.0 million aggregate principal amount of our outstanding 6 7/8% Senior Notes due 2014, to fully repay the borrowings under our revolving credit facility, to pay related fees and expenses and the remainder for general corporate purposes. |
| B- | Business Overview |
Overview
We are the largest cable operator in the Province of Québec and the third largest in Canada, in each case based on the number of cable customers, as well as an Internet service provider and a provider of cable and mobile telephony services in the Province of Québec. Our cable network covers approximately 79% of the Province of Québec’s
20
Table of Contents
approximately 3.5 million residential and commercial premises. The deployment of our LTE network and our enhanced offering of mobile communication services for residential and business customers allow us to consolidate our position as a provider of integrated telecommunication services.
Videotron Business Solutions is a premier full-service telecommunications provider serving small, medium and large sized companies as well as telecommunication carriers. Products and services for small and medium-sized businesses are supported by extensive coaxial, fiber-optic and LTE wireless networks. In recent years, we have significantly grown our customer base and have become an important player in the business telecommunication segment in the Province of Québec. Products and services include Internet, television, telephony, mobile services, and business solutions products such as hosting, private network connectivity, WIFI, audio and video transmission. Through 4Degrees Colocation, we operate a data centre in Québec City which is one of the few data centres in the Province of Québec to be Tier III certified by the Uptime Institute, an international standard that recognizes maximum reliability and operational sustainability.
Competitive Strengths
Leading Market Positions
We are the largest cable operator in the Province of Québec and the third largest in Canada, in each case based on the number of cable customers. We believe that our strong market position has enabled us to launch and deploy new products and services more effectively. For example, since the introduction of our cable Internet access service, we estimate that we have become the largest provider of such service in the areas we serve. Our extensive proprietary and third-party retail distribution network of stores and points of sale, including our Videotron-branded stores and kiosks, assist us in marketing and distributing our advanced telecommunications services, such as cable Internet access, digital television and cable and mobile telephony, on a large scale basis.
Differentiated Bundled Services
Through our technologically advanced fixed and mobile network, we offer a differentiated, bundled suite of entertainment, information and communication services and products, including digital television, cable Internet access, video-on-demand and other interactive television services, as well as residential and commercial cable telephony services using VoIP technology, and mobile telephony services. In addition, we deliver high-quality services and products, including, for example, our standard cable Internet access service that enables our customers to download data at a higher speed than currently offered by standard digital subscriber line or DSL technology. We also offer the widest range of French-language programming in Canada including content from our illico-on-Demand service available on our illico Digital TV, illico.tv, illico.tv tablet app (for Android and iPad) and illico mobile platforms. Customers can interrupt and resume programming at will on any of these four illico platforms.
Advanced Broadband Network
We are able to leverage our advanced broadband network, substantially all of which is bi-directional, to offer a wide range of advanced services on the same media, such as digital television, video-on-demand, cable Internet access and cable telephony services. We are committed to maintaining and upgrading our network capacity and, to that end, we currently anticipate that ongoing capital expenditures will be required to accommodate the evolution of our products and services and to meet the demand for increased capacity.
Focused and Highly Reliable Network Cluster
Our single hybrid fibre coaxial clustered network covers approximately 79% of the Province of Québec’s total addressable market and nine of the province’s top ten urban areas. We believe that our single cluster and network architecture provides many benefits, including a higher quality and more reliable network, the ability to launch and deploy new products and services such as illico TV new generation, and a lower cost structure through reduced maintenance and technical support costs.
21
Table of Contents
Strong, Market-Focused Management Team
We have a strong, market-focused management team that has extensive experience and expertise in a range of areas, including marketing, finance, telecommunications and technology. Under the leadership of our senior management team, we have, among other things, improved penetration of our HSIA offering, our VoIP telephony services, our cable products and our mobile telephony services, including through the successful build-out and launch of our mobile telephony network.
Products and Services
We currently offer to our customers cable services, mobile telephony services and business telecommunications services.
Cable Services
| i. | Advanced Cable-Based Products and Services |
Our cable’s large bandwidth is a key factor in the successful delivery of advanced products and services. Several emerging technologies and increasing Internet usage by our customers have presented us with significant opportunities to expand our sources of revenue. We currently offer a variety of advanced products and services, including cable Internet (Hybrid Fibre) access, digital television, residential telephony and selected interactive services. In 2012, we launched illico TV new generation, offering a new interface with entirely redesigned ergonomics for fluid, intuitive navigation, as well as additional value-added features. As of December 31, 2014, 65.8% of our digital customers were using illico TV new generation. In 2014, we introduced on the market the very latest in technology: illico X8. This high-tech PVR has a processor 4 times more powerful than the previous generation, thus allowing the customers to program up to eight simultaneous recordings and keep up to 230 hours of HD recording. We intend to continue to develop and deploy additional value-added services to further broaden our service offering.
| • | Cable Internet Access. Leveraging our advanced cable infrastructure, we offer cable Internet access to our customers primarily via cable modems. We provide this service at download speeds of up to 60 Mbps and in nearly half of the network up to 200 Mbps. As of December 31, 2014, we had 1,537,532 cable Internet access customers, representing 86.3% of our basic customers and 55.4% of our total homes passed. Based on internal estimates, we are the largest provider of Internet access services in the areas we serve with an estimated market share of 54.4% as of December 31, 2014. |
| • | Digital Television. We have installed headend equipment through an hybrid optical fibre and coax network capable of delivering digitally encoded transmissions to a two-way digital set-top box in the customer’s home and premises. This digital connection provides significant advantages. In particular, it increases channel capacity, which allows us to increase both programming and service offerings while providing increased flexibility in packaging our services and a high definition quality. All of our television packages include 52 basic television channels, audio services providing digital-quality music, 21 FM radio channels and an interactive programming guide. Our extended digital television offering allows customers to customize their choices with the ability to choose between custom or pre-assembled packages with a selection of more than 300 additional channels, including U.S. super-stations and other special entertainment programs. This also offers customers significant programming flexibility including the option of French-language only, English-language only or a combination of French- and English-language programming, as well as many foreign-language channels. As of December 31, 2014, we had 1,561,692 customers for our digital television service, representing 87.6% of our total basic customers and 56.2% of our total homes passed. |
| • | Cable Telephony.We offer cable telephony service using VoIP technology. We offer discounts to our customers who subscribe to more than one of our services. As of December 31, 2014, we had 1,349,010 subscribers to our cable telephony service, representing a penetration rate of 75.7% of our basic cable subscribers and 48.6% of our homes passed. |
| • | Video-On-Demand. Video-on-demand service enables digital cable customers to rent content from a library of movies, documentaries and other programming through their digital set-top box, computer, tablet or mobile |
22
Table of Contents
phone respectively through illico Digital TV, illico.tv, our illico tablet app and illico mobile. Our digital cable customers are able to rent their video-on-demand selections for a period of up to 24 hours, which they are then able to watch at their convenience with full stop, rewind, fast forward, pause and replay functionality during their rental period. In addition, customers can now resume viewing on-demand programming that was paused on either the television, illico.tv, the illico tablet app, or illico mobile. Moreover, we also launched a new application for iPad in 2014. This application features a customizable, intuitive interface that brings up selections of content based on the customer’s individual settings and enhances the experience by suggesting personalized themed content. This iPad application smartly and swiftly highlights any content available from the entire illico catalog, including video-on-demand titles, live television broadcasts or recorded shows, and allows the customer to transfer it directly and seamlessly from their iPad to their television. We sometimes group movies, events or TV programs available on video-on-demand and offer them, when available, for a period of seven days. We also offer a substantial amount of video-on-demand content free of charge to our digital cable customers, comprised predominantly of previously aired television programs and youth-oriented programming. In March of 2013, we introduced Club illico (formerly Club Unlimited), a flat-fee plan offering a rich and varied selection of unlimited, on-demand content (movies, television shows, children’s shows, documentaries, comedy performances and concerts). Club illico began in late 2013 co-producing television series and offering them in their first broadcast window, prior to their linear broadcast. On December 31, 2014, the Club illico service had already reached 177,700 subscribers. In addition, we offer pay television channels on a subscription basis that permits our customers to access and watch most of the movies available on the linear pay TV channels these customers subscribe to. |
| • | Pay-Per-View (Indigo). Indigo is a group of pay-per-view channels that allows our digital customers to order live events and movies based on a pre-determined schedule. |
| ii. | Traditional Cable Television Services |
Customers subscribing to our traditional analog “basic” and analog “extended basic” services generally receive a line-up of 42 channels of television programming, depending on the bandwidth capacity of their local cable system. We are no longer offering this service to new customers.
As of December 31, 2014, we had 220,550 customers for our analog television service, representing 12.4% of our total basic customers.
Mobile Services
On September 9, 2010, we launched our High Speed Packet Access (“HSPA”) mobile communication network (3G) which was upgraded to HSPA+ (4G), on June 30, 2011.
Under an arrangement with Industry Canada, we offer fixed wireless Internet access in selected rural areas of the Province of Québec. Powered by our HSPA+ network, this service allows thousands of households and businesses that had no access to high speed cable Internet to benefit from a reliable and professionally installed high speed Internet. As a result, we extended our residential and business Internet footprint to dozens of previously underserved municipalities across the Province of Québec.
In 2013, we signed a 20-year agreement with Rogers for the cooperation and collaboration in the build-out and operation of a shared LTE wireless network in the Province of Québec and the Ottawa region. In September 2014, we have launched our shared LTE wireless network, with Rogers. This shared network delivers an optimal user experience for consumers and businesses and yields the expected capital and operating savings, allowing us to reinvest in our customers and networks. We maintain our business independence throughout this agreement, including our product and service portfolios, billing systems and customer data.
In April 2014, we added Apple’s mobile devices, including the iPhone, to our extensive line-up of mobile hardware, thus enabling us to reach a significantly untapped segment of our addressable market, in particular the young mobile users. Subsequently, we launched new illico applications for iPhone (4, 5C, 5S, 6) and iPad.
23
Table of Contents
In the 700 MHz auction held in 2014, we acquired a package of seven spectrum licenses consisting of a single paired 5+5 MHz spectrum block in the upper 700 MHz band over a geographic territory which encompasses the provinces of Québec, Ontario (excluding the region of Northern Ontario), Alberta and British Columbia, for a total covered population of more than 28 million. The 700 MHz band presents certain superior propagation characteristics and benefits from well-developed LTE equipment and device ecosystems in North America. Ownership of the licenses acquired during the auction held in 2014 enhances our ability to maintain a leading edge, high capacity wireless network in Québec and in the Ottawa region, and provides us with a number of options to maximize the value of our investment in the rest of Ontario, Alberta and British Columbia. As of December 31, 2014, most households and businesses on our cable footprint had access to our advanced mobile services. As of December 31, 2014, there were 632,766 lines activated on our mobile network, representing a year-over-year increase of 128,452 lines (25.5%).
In the Industry Canada auction for AWS-3 commercial mobile spectrum held on March 3, 2015, we acquired four 30 MHz licenses for Eastern Québec, Southern Québec, Northern Québec and Eastern Ontario / Outaouais, covering 100% of Québec’s population and that of the Ottawa region. This spectrum, which supports LTE technology, will further enhance our ability to maintain a leading-edge, high-capacity wireless network in Québec and in the Ottawa region.
Business Telecommunications Services
Videotron Business Solutions is a premier telecommunications service provider, offering reliable and state-of-the-art mobile telephony, Internet, cable telephony, data and cable television solutions to all business segments: small and medium-sized companies, large corporations and other telecommunications carriers. Through 4Degrees Colocation, we operate a data centre in Québec City which is one of the few data centres in the Province of Québec to be Tier III certified by the Uptime Institute, an international standard that recognizes maximum reliability and operational sustainability.
We serve customers with dedicated sales and customer service teams with solid expertise in business services. Videotron Business Solutions relies on its extensive coaxial, fiber optic and LTE wireless networks to provide the best possible customized solutions to all of its customers.
Customer Statistics Summary
The following table summarizes our customer statistics for our suit of advanced products and services:
As of December 31, | ||||||||||||||||||||
| 2014 | 2013 | 2012 | 2011 | 2010 | ||||||||||||||||
Homes passed(1) | 2,777,264 | 2,742,476 | 2,701,242 | 2,657,315 | 2,612,406 | |||||||||||||||
Cable Television | ||||||||||||||||||||
Basic customers(2) | 1,782,242 | 1,825,081 | 1,854,981 | 1,861,477 | 1,811,570 | |||||||||||||||
Penetration(3) | 64.2% | 66.5% | 68.7% | 70.1% | 69.3% | |||||||||||||||
Digital customers | 1,561,692 | 1,531,361 | 1,484,589 | 1,400,814 | 1,219,599 | |||||||||||||||
Penetration(4) | 87.6% | 83.9% | 80.0% | 75.3% | 67.3% | |||||||||||||||
Cable Internet | ||||||||||||||||||||
Cable Internet customers | 1,537,532 | 1,505,992 | 1,443,992 | 1,359,600 | 1,268,083 | |||||||||||||||
Penetration(3) | 55.4% | 54.9% | 53.5% | 51.2% | 48.5% | |||||||||||||||
Telephony Services | ||||||||||||||||||||
Cable telephony lines | 1,349,010 | 1,348,520 | 1,316,327 | 1,245,893 | 1,145,063 | |||||||||||||||
Penetration(3) | 48.6% | 49.2% | 48.7% | 46.9% | 43.8% | |||||||||||||||
Mobile telephony lines | 632,766 | 504,314 | 403,804 | 290,742 | 136,111 | |||||||||||||||
| (1) | Homes passed means the number of residential premises, such as single dwelling units or multiple dwelling units, and commercial premises passed by our cable television distribution network in a given cable system service area in which the programming services are offered. |
| (2) | Basic customers are customers who receive basic cable service in either the analog or digital mode. |
| (3) | Represents customers as a percentage of total homes passed. |
| (4) | Represents customers for the digital service as a percentage of basic customers. |
24
Table of Contents
Industry Overview
Cable Television Industry
| Industry Data |
Cable television has been available in Canada for more than 50 years and is awell-developed market. As of August 31, 2013, the most recent date for which data is available, there were approximately 8.8 million cable television customers in Canada. For the twelve months ended August 31, 2013 (the most recent data available), total industry revenue was estimated to be over $12.3 billion and is expected to grow in the future based on the fact that Canadian cable operators have aggressively upgraded their networks and broadened their offerings of products and services. The following table summarizes the most recent available annual key statistics for the Canadian cable television industry.
| Twelve Months Ended August 31, | ||||||||||||||||||||||||
| 2013 | 2012 | 2011 | 2010 | 2009 | CAGR (1) | |||||||||||||||||||
| (Dollars in billions and basic cable customers in millions) | ||||||||||||||||||||||||
Canada | ||||||||||||||||||||||||
Industry Revenue(2) | $ | 12.3 | $ | 11.5 | $ | 10.9 | $ | 10.1 | $ | 9.2 | 6.0 | % | ||||||||||||
Basic Cable Customers(2) | 8.8 | 8.7 | 8.5 | 8.3 | 8.1 | 1.7 | % | |||||||||||||||||
Source of Canadian data: CRTC.
| (1) | Compounded Canadian annual growth rate from 2009 through 2013. |
| (2) | Including IPTV. |
Mobile Telephony Industry
In terms of wireless penetration rate (i.e., the number of active SIM cards and/or connected lines versus total population, expressed as a percentage), the Canadian mobile telephony market is relatively under-developed. As of December 31, 2013 (the most recent data available), the Province of Québec had a penetration rate under the Canadian average (66.6% vs. 79.1% according to the CRTC). As of September 30, 2014, incumbents were still dominant in the industry in Canada, with market share of approximately 91% in the Province of Québec, according to the CRTC.
With an increasing number of regional operators competing on price, coverage, handset offers and technological reliability, the Canadian wireless industry is highly competitive. With the deployment of advanced wireless networks throughout the country and the increasing penetration rate among younger customers, the demand for technologically advanced bandwidth-hungry devices (smartphones, tablets, etc.) is increasing rapidly. As of September 30, 2014, there were more than 28.5 million subscribers in Canada.
Pricing of our Products and Services
Our revenues are derived from the monthly fees our customers pay for cable television, Internet and telephony and mobile services. The rates we charge vary based on the market served and the level of service selected. Rates are usually adjusted annually. We also offer discounts to our customers who subscribe to more than one of our services, when compared to the sum of the prices of the individual services provided to these customers. As of December 31, 2014, the average monthly invoice on recurring subscription fees per residential customer was $109.22 (representing a 6% year-over-year increase) and approximately 81% of our customers were bundling two services or more. A one-time installation fee, which may be waived in part during certain promotional periods, is charged to new customers. In 2014, we introduced the possibility for customers to get the complete optimization of their Wi-Fi signal, including the installation of up to two Wi-Fi optimizers, if necessary. Monthly fees for rented equipment, such as set-top boxes or Wi-Fi routers, are also charged to customers.
Although our service offerings vary by market, because of differences in the bandwidth capacity of the cable systems in each of our markets and other factors, our services are typically offered at monthly price ranges, which reflect discounts for bundled service offerings.
25
Table of Contents
Our Network Technology
Cable
As of December 31, 2014, our cable system consisted of 32,930 km of fibre-optic cable and 45,992 km of coaxial cable, covering approximately 2.8 million homes and serving approximately 2.2 million customers. Our network is the largest broadband network in the Province of Québec covering approximately 79% of households and, according to our estimates, more than 77% of the businesses located in the major metropolitan areas of the Province of Québec. Our extensive network supports direct connectivity with networks in Ontario, the Maritimes and the United States.
Our cable television networks are comprised of four distinct parts including signal acquisition networks, main headends, distribution networks and subscriber drops. The signal acquisition network picks up a wide variety of television, radio and multimedia signals. These signals and services originate from either a local source or content provider or are picked up from distant sites chosen for satellite or over-the-air reception quality and transmitted to the main headends by way of fibre-optic relay systems. Each main headend processes, modulates, scrambles and combines the signals in order to distribute them throughout the network. Each main headend is connected to the primary headend in order to receive the digital MPEG2 signals and the IP backbone for the Internet services. The first stage of this distribution consists of a fibre-optic link which distributes the signals to distribution or secondary headends. After that, the signal uses the hybrid fibre coaxial cable network made of wide-band optical nodes, amplifiers and coaxial cables capable of serving up to 30 km in radius from the distribution or secondary headends to the subscriber drops. The subscriber drop brings the signal into the customer’s television set directly or, depending on the area or the services selected, through various types of customer equipment including set-top boxes and cable modems.
We have adopted the hybrid fibre coaxial (“HFC”) network architecture as the standard for our ongoing system upgrades. HFC network architecture combines the use of both fibre-optic and coaxial cables. Fibre-optic cable has good broadband frequency characteristics, noise immunity and physical durability and can carry hundreds of video and data channels over extended distances. Coaxial cable is less expensive and requires greater signal amplification in order to obtain the desired transmission levels for delivering channels. In most systems, we deliver our signals via fibre-optic cable from the headend to a group of optical nodes and then via coax to the homes passed served by the nodes. Traditionally, our system design provided for cells of approximately 500 homes each to be served by fibre-optic cable. To allow for this configuration, secondary headends were put into operation in the Greater Montréal Area, in the Greater Québec City Area and in the Greater Gatineau City Area. Remote secondary headends must also be connected with fibre-optic links. From the secondary headends to the homes, the customer services are provided through the transmission of a radiofrequency (“RF”) signal which contains both downstream and upstream information (two-way). The loop structure of the two-way HFC networks brings reliability through redundancy, the cell size improves flexibility and capacity, while the reduced number of amplifiers separating the home from the headend improves signal quality and reliability. The HFC network design provided us with significant flexibility to offer customized programming to individual cells of approximately 500 homes, which is critical to our advanced services, such as video-on-demand, Switched Digital Video Broadcast and the continued expansion of our interactive services. Starting in 2008, we began an extensive network modernization effort in the Greater Montréal Area in order to meet the ever expanding service needs of the customer in terms of video, telephony and Internet services. This ongoing modernization implies an extension of the upper limit of the RF spectrum available for service offerings and a deep fibre deployment, which significantly extends the fibre portion in the HFC network (thereby reducing the coax portion). Additional optical nodes were systematically deployed to increase the segmentation of customer cells, both for upstream and downstream traffic. This modernization initiative results in (i) a network architecture where the segmentation for the upstream traffic is for 125 homes while that for the downstream traffic is set to 250 (which can evolve to 125 homes), and (ii) the availability of a 1 GHz spectrum for service offerings. The robustness of the network is greatly enhanced (much less active equipment in the network such as RF amplifiers for the coax portion), the service offering potential and customization to the customer base is significantly improved (through the extension of the spectrum to 1 GHz and the increased segmentation) and allows much greater speeds of transmission for Internet services which are presently unrivalled. The overall architecture employs Division Wavelength Multiplexing (“DWM”), which allows us to limit the amount of fibre required, while providing an effective customization potential. As such, in addition to the broadcast information, up to 24 wavelengths can be combined on a transport fibre from the secondary headend to a 3,000 home aggregation point. Each of these wavelengths is dedicated to the specific requirements of 125 homes. The RF spectrum is set with analog content (to be phased out eventually) and digital information using quadrature amplitude modulation. MPEG video compression techniques and the Data over Cable Service Interface Specification (“DOCSIS”) protocol allow us to provide a great service offering of standard definition and high definition
26
Table of Contents
video, as well as complete voice and Internet services. This modernization project gives us flexibility to meet customer needs and future network evolution requirements. The modernization of the Greater Montréal Area network is scheduled to be completed by 2020.
Our strategy of maintaining a leadership position in respect of the suite of products and services that we offer and launching new products and services requires investments in our network to support growth in our customer base and increases in bandwidth requirements. Approximately 99.85% of our network in the Province of Québec has been upgraded to a bandwidth of 750 MHz or greater. Also, in light of the greater availability of HDTV programming, the ever increasing speed of Internet access and increasing demand for our cable telephony service, further investment in our network will be required.
Mobile Telephony
As of December 31, 2014, our shared network reached approximately 90% of the population of the Province of Québec and the Greater Ottawa Area, allowing the vast majority of our potential clients to have access to the latest mobile services. The vast majority of our towers and transmission equipment being linked through our fibre-optic network using a multiple label switching – or MPLS – protocol, our network is designed to support important customer growth in coming years as well as rapidly evolving mobile technologies.
Our strategy in the coming years is to build on our position as a telecommunication leader with our LTE mobile services and to keep the technology at the cutting edge as it continues to evolve rapidly and new market standards such as LTE-Advanced (“LTE A”) are being commercialized. The Rogers LTE Agreement provides and allows Rogers and us to continue the evolution of the shared network. Our contribution into spectrum, as well as that of Rogers, will allow us to continue to exploit LTE technologies and to provide our subscribers with high throughput data connections.
During 2014, we maintained our HSPA+ network throughout the Province of Québec and over the Greater Ottawa Area.
Marketing and Customer Care
Our long term marketing objective is to increase our cash flow through deeper market penetration of our services, development of new services and revenue and operating margin growth per customer. We believe that customers will come to view our cable connection as the best distribution channel to their home for a multitude of services. To achieve this objective, we are pursuing the following strategies:
| • | develop attractive bundle offers to encourage our customers to subscribe to two or more products, which increases average revenue per user – or ARPU – customer retention and operating margins; |
| • | continue to rapidly deploy advanced products on all our services – cable, Internet, telephony, content and mobile – to maintain and increase our leadership and offer competitive mobile rate plans and products to gain additional market share; |
| • | design product offers that provide greater opportunities for customer entertainment and information ; |
| • | develop targeted marketing programs to attract former customers and households that have never subscribed to certain of our services and customers of alternative or competitive services as well as target specific market segments; |
| • | enhance the relationship between customer service representatives and our customers by training and motivating customer service representatives to promote advanced products and services; |
| • | leverage the retail presence of our Videotron-branded stores and kiosks, and third-party commercial retailers; |
| • | maintain and promote our leadership in content and entertainment by leveraging the wide variety of services offered within the Quebecor Media group to our existing and future customers; |
27
Table of Contents
| • | introduce new value added packages of products and services, which we believe will increase ARPU and improve customer retention; and |
| • | leverage our business market, using our network and expertise with our commercial customer base, to offer additional bundled services to our customers. |
We continue to invest time, effort and financial resources in marketing new and existing services. To increase both customer penetration and the number of services used by our customers, we use integrated marketing techniques, including door-to-door solicitation, telemarketing, drive-to-store, media advertising, e-marketing and direct mail solicitation. Those initiatives are also strongly supported by business intelligence tools such as predictive churn models.
Maximizing customer satisfaction is a key element of our business strategy. In support of our commitment to customer satisfaction, we are now offering the service of dedicated, knowledgeable and well-trained technical experts which we call our “PROS”, the primary mission of which is to support our customers by helping them get the most out of what we have to offer. Through personalized demonstration sessions, the PROS provide customers with continued customer service after subscription has been made. We continue to provide a 24-hour customer service hotline seven days a week across most of our systems, in addition to our web-based customer service capabilities. All of our customer service representatives and technical support staff are trained to assist customers with all of our products and services, which in turn allows our customers to be served more efficiently and seamlessly. Our customer care representatives continue to receive extensive training to perfect their product knowledge and skills, which contributes to retention of customers and higher levels of customer service. We utilize surveys, focus groups and other research tools to assist us in our marketing efforts and anticipate customer needs. To increase customer loyalty, we are also starting to leverage strategic partnerships to offer exclusive promotions, privileges and contests which contribute in expanding our value proposition to our customers.
Programming
We believe that offering a wide variety of conveniently scheduled programming is an important factor in influencing a customer’s decision to subscribe to and retain our cable services. We devote resources to obtaining access to a wide range of programming that we believe will appeal to both existing and potential customers. We rely on extensive market research, customer demographics and local programming preferences to determine our channel and package offerings. The CRTC currently regulates the distribution of foreign content in Canada and, as a result, we are limited in our ability to provide such programming to our customers. We obtain basic and premium programming from a number of suppliers, including all major Canadian media groups.
Our programming contracts generally provide for a fixed term of up to five years, and are subject to negotiated renewal. Programming tends to be made available to us for a flat fee per customer. Our overall programming costs have increased in recent years and may continue to increase due to factors including, but not limited to, additional programming being provided to customers as a result of system rebuilds that increase channel capacity, increased costs to produce or purchase specialty programming, inflationary or negotiated annual increases, the concentration of broadcasters following recent acquisitions in the market and the significant increased costs of sports content rights.
Competition
We operate in a competitive business environment in the areas of price, product and service offerings and service reliability. We compete with other providers of television signals and other sources of home entertainment. Due to ongoing technological developments, the distinctions among traditional platforms (broadcasting, Internet, and telecommunications) are fading rapidly. The Internet as well as mobile devices are becoming important broadcasting and distribution platforms. In addition, mobile operators, with the development of their respective mobile networks, are now offering wireless and fixed wireless Internet services and our VoIP telephony service is also competing with Internet-based solutions.
| • | Providers of Other Entertainment.Cable systems face competition from alternative methods of distributing and receiving television signals and from other sources of entertainment such as live sporting events, movie theatres and home video products, including digital recorders, OTT content providers, such as Netflix and Apple TV, DVD players and video games. The extent to which a cable television service is competitive |
28
Table of Contents
depends in significant part upon the cable system’s ability to provide a greater variety of programming, superior technical performance and superior customer service than are available through competitive alternative delivery sources. Our introduction of Club illico, a flat-fee plan offering a rich and varied selection of unlimited, on-demand content, aims to reduce the effect of competition from alternative delivery sources. |
| • | DSL.The deployment of digital subscriber line technology (“DSL”) provides customers with Internet access at data transmission speeds greater than that available over conventional telephone lines. DSL service provides access speeds that are comparable to low-to-medium speeds of cable-modem Internet access but that decreases with the distance between the DSL modem and the line card. |
| • | FTTN and FTTH. Fibre to the neighborhood (“FTTN”) technology addresses the distance limitation by bringing the fibre closer to the end user. The last mile is provided by the DSL technology. Fibre to the home (“FTTH”) brings the fibre up to the end user location. The speed is then limited by the end equipment rather than the medium (fibre) itself. It provides speeds comparable to high speeds of cable-modem Internet access. Because of the cost involved with FTTH and FTTN, deployment of these technologies is progressive. The main competition for cable-modem Internet access comes from a provider of DSL and Fibre to the x (FTTx) services. |
| • | Internet Video Streaming. The continuous technology improvement of the Internet, combined with higher download speeds, contributes to the emergence of alternative technologies such as IPTV digital content (movies, television shows and other video programming) offered on various Internet streaming platforms. While having a positive impact on the demand for our Internet services, this model could adversely impact the demand for our cable television services. |
| • | VDSL.VDSL technology increases the available capacity of DSL lines, thereby allowing the distribution of digital video. Multi-system operators are now facing competition from ILECs, which have been granted licenses to launch video distribution services using this technology, which operates over copper phone lines. The transmission capabilities of VDSL will be significantly boosted with the deployment of technologies such as vectoring (the reduction or elimination of the effects of far-end crosstalk) and twisted pair bonding (use of additional twisted pairs to increase data carriage capacity). Certain ILECs have already started replacing many of their main feeds with fibre-optic cable and positioning VDSL transceivers, a VDSL gateway, in larger multiple-dwelling units, in order to overcome the initial distance limitations of VDSL. With this added capacity, along with the evolution of compression technology, VDSL-2 will offer significant opportunities for services and increase its competitive threat against other multi-system operators. |
| • | Direct Broadcast Satellite. DBS is also a competitor to cable systems. DBS delivers programming via signals sent directly to receiving dishes from medium and high-powered satellites, as opposed to cable delivery transmissions. This form of distribution generally provides more channels than some of our television systems and is fully digital. DBS service can be received virtually anywhere in Canada through the installation of a small rooftop orside-mounted antenna. Like digital cable distribution, DBS systems use video compression technology to increase channel capacity and digital technology to improve the quality of the signals transmitted to their customers. |
| • | Mobile Telephony Services.With our mobile network, we compete against a mix of participants, some of them being active in some or all the products we offer, while others only offer mobile telephony services in our market. The Canadian incumbents have deployed their LTE networks and this technology is deemed to become an industry standard. We launched our LTE network on September 10, 2014. |
| • | Private Cable.Additional competition is posed by satellite master antenna television systems known as “SMATV systems” serving multi dwelling units, such as condominiums, apartment complexes, and private residential communities. |
| • | Wireless Distribution.Cable television systems also compete with wireless program distribution services such as MMDS. This technology uses microwave links to transmit signals from multiple transmission sites to line-of-sight antennas located within the customer’s premises. |
29
Table of Contents
| • | Grey and Black Market Providers.Cable and other distributors of television signals continue to face competition from the use of access codes and equipment that enable the unauthorized decoding of encrypted satellite signals, from unauthorized access to our analog and digital cable signals (black market) and from the reception of foreign signals through subscriptions to foreign satellite television providers that are not lawful distributors in Canada (grey market). |
| • | Telephony Service.Our cable telephony service competes against other telephony service providers, including the incumbent telephone service provider in most of the Province of Québec, which used to control a significant portion of the telephony market in the Province of Québec, VoIP telephony service providers and mobile telephony service providers. |
| • | Other Internet Service Providers.In the Internet access business, cable operators compete against other Internet service providers offering residential and commercial Internet access services. The CRTC requires the large Canadian incumbent cable operators to offer access to their high-speed Internet network to competitive Internet service providers at mandated rates. |
| C- | Regulation |
Foreign Ownership Restrictions Applicable under the Telecommunications Act
On June 29, 2012, the Government of Canada’s omnibus budget implementation bill (C-38) received Royal Assent. Included in the bill were provisions to exempt telecommunications companies with less than 10% of total Canadian telecommunications market revenues from foreign investment restrictions under the Telecommunications Act. Companies that are successful in growing their market shares in excess of 10% of total Canadian telecommunications market revenues other than by way of merger or acquisition will continue to be exempt from the restrictions.
Ownership and Control of Canadian Broadcast Undertakings
The Governor in Council, through an Order-in-Council referred to as the Direction to the CRTC (Ineligibility of Non-Canadians), has directed the CRTC not to issue, amend or renew a broadcasting license to an applicant that is a non-Canadian. Canadian, a defined term in the Direction, means, among other things, a citizen or a permanent resident of Canada, a qualified corporation, a Canadian government, a non-share capital corporation of which a majority of the directors are appointed or designated by statute, regulation or specified governmental authorities, or a qualified mutual insurance company, qualified pension fund society or qualified cooperative of which not less than 80% of the directors or members are Canadian. A qualified corporation is one incorporated or continued in Canada, of which the chief executive officer (or if there is no chief executive officer, the person performing functions similar to those performed by a chief executive officer) and not less than 80% of the directors are Canadian, and not less than 80% of the issued and outstanding voting shares and not less than 80% of the votes are beneficially owned and controlled, directly or indirectly, by Canadians. In addition to the above requirements, Canadians must beneficially own and control, directly or indirectly, not less than 66.6% of the issued and outstanding voting shares and not less than 66.6% of the votes of the parent corporation that controls the subsidiary, and neither the parent corporation nor its directors may exercise control or influence over any programming decisions of the subsidiary if Canadians beneficially own and control less than 80% of the issued and outstanding shares and votes of the parent corporation, if the chief executive officer of the parent corporation is a non-Canadian or if less than 80% of the parent corporation’s directors are Canadian. There are no specific restrictions on the number of non-voting shares which may be owned by non-Canadians. Finally, an applicant seeking to acquire, amend or renew a broadcasting license must not otherwise be controlled in fact by non-Canadians, a question of fact which may be determined by the CRTC in its discretion. Control is defined broadly in the Direction to mean control in any manner that results in control in fact, whether directly through the ownership of securities or indirectly through a trust, agreement or arrangement, the ownership of a corporation or otherwise. We are a qualified Canadian corporation.
Regulations made under the Broadcasting Act require the prior approval of the CRTC for any transaction that directly or indirectly results in (i) a change in effective control of the licensee of a broadcasting distribution undertaking or a television programming undertaking (such as a conventional television station, network or pay or specialty undertaking service), (ii) a person or a person and its associates acquiring control of 30% or more of the voting interests of a licensee or of a person who has, directly or indirectly, effective control of a licensee, or (iii) a person or a person and its associates acquiring 50% or more of the issued common shares of the licensee or of a person who has direct or indirect effective
30
Table of Contents
control of a licensee. In addition, if any act, agreement or transaction results in a person or a person and its associates acquiring control of at least 20% but less than 30% of the voting interests of a licensee, or of a person who has, directly or indirectly, effective control of the licensee, the CRTC must be notified of the transaction. Similarly, if any act, agreement or transaction results in a person or a person and its associates acquiring control of 40% or more but less than 50% of the voting interests of a licensee, or a person who has directly or indirectly effective control of the licensee, the CRTC must be notified.
“Diversity of Voices”
The CRTC’s Broadcasting Public Notice CRTC 2008-4, entitled “Diversity of Voices,” sets forth the CRTC’s policies with respect to cross-media ownership; the common ownership of television services, including pay and specialty services; the common ownership of broadcasting distribution undertakings (“BDUs”); and the common ownership of over-the-air (“OTA”) television and radio undertakings. Pursuant to these policies, the CRTC will generally permit ownership by one person of no more than one conventional television station in one language in a given market. The CRTC, as a general rule, will not approve applications for a change in the effective control of broadcasting undertakings that would result in the ownership or control, by one person, of a local radio station, a local television station and a local newspaper serving the same market. Where a person that controls a local radio station and a local television station acquires a local newspaper serving the same market, the CRTC will, at the earliest opportunity, require the licensee to explain why, in light of this policy, its radio or television license(s) should be renewed. The CRTC, as a general rule, will not approve applications for a change in effective control that would result in the control, by one person, of a dominant position in the delivery of television services to Canadians that would impact on the diversity of programming available to television audiences. In terms of BDUs, the CRTC, as a general rule, will not approve applications for a change in the effective control of BDUs in a market that would result in one person being in a position to effectively control the delivery of programming services in that market. The CRTC is not prepared to allow one person to control all BDUs in any given market.
Jurisdiction Over Canadian Broadcast Undertakings
Our cable distribution undertakings are subject to the Broadcasting Act and regulations made under the Broadcasting Act that empower the CRTC, subject to directions from the Governor in Council, to regulate and supervise all aspects of the Canadian broadcasting system in order to implement the policy set out in the Broadcasting Act. Certain of our undertakings are also subject to the Radiocommunication Act, which empowers Industry Canada to establish and administer the technical standards that networks and transmitters must comply with, namely, maintaining the technical quality of signals.
The CRTC has, among other things, the power under the Broadcasting Act and regulations promulgated thereunder to issue, subject to appropriate conditions, amend, renew, suspend and revoke broadcasting licenses, approve certain changes in corporate ownership and control, and establish and oversee compliance with regulations and policies concerning broadcasting, including various programming and distribution requirements, subject to certain directions from the Federal Cabinet.
Canadian Broadcasting Distribution (Cable Television)
Licensing of Canadian Broadcasting Distribution Undertakings
A cable distribution undertaking distributes broadcasting services to customers predominantly over closed transmission paths. A license to operate a cable distribution undertaking gives the cable television operator the right to distribute television programming services in its licensed service area. Broadcasting licenses may be issued for periods not exceeding seven years and are usually renewed, except in particular circumstances or in cases of a serious breach of the conditions attached to the license or the regulations of the CRTC. The CRTC is required to hold a public hearing in connection with the issuance, suspension or revocation of a license. We operate 53 cable systems pursuant either to the issuance of a license or of an order that exempts certain network operations from the obligation to hold a license.
Cable systems with 20,000 customers or fewer and operating their own local headend are exempted from the obligation to hold a license pursuant to exemption orders issued by the CRTC on February 15, 2010 (Broadcasting Order CRTC 2009-544). These cable systems are required to comply with a number of programming carriage requirements set out in the exemption order and comply with the Canadian ownership and control requirements in the Direction to the CRTC. Pursuant to Decision CRTC 2010-87, we remain with only 8 cable distribution licenses.
31
Table of Contents
In order to conduct our business, we must maintain our broadcasting distribution undertaking licenses in good standing. Failure to meet the terms of our licenses may result in their short-term renewal, suspension, revocation or non-renewal. We have never failed to obtain a license renewal for any cable systems.
On August 30, 2013, we filed a request to amend our distribution licenses of Montréal, Montréal West and Terrebonne, in order to allocate up to 2% of our required contribution to Canadian programming to an English-language community channel. On February 4, 2015, in Broadcasting Decision CRTC 2015-32, the CRTC approved in part our application to amend the broadcasting licenses for our broadcasting distribution undertakings serving Montréal, Montréal West and Terrebonne. Specifically, we are seeking to launch a separate English-language community channel to be known as MYtv in our service areas. Given that the introduction of English-language community programming would allow the Anglophone community and various other cultural communities of Montréal to benefit from a new outlet for local expression, the CRTC authorized us to launch MYtv. However, we also asked to be authorized to reallocate up to 2% of our gross annual revenues from our broadcasting activities to the new English-language channel in addition to what it is currently authorized to allocate to its French-language community channel MAtv. The CRTC denied this part of the application given that Videotron is operating MAtv in non-compliance with regulatory requirements relating to access programming and local programming (as noted in Broadcasting Decision 2015-31) and that an additional 2% contribution to MYtv would deprive the Canada Media Fund and other funds of significant funding.
As noted in Broadcasting Decision CRTC 2015-31, the CRTC directs Videotron to take concrete steps to bring MAtv into compliance by August 2015, the time of Videotron’s next licence renewal. Moreover, the CRTC expects Videotron to form, by March 15, 2015, a citizen advisory board that will take into account the view of different members of the community, including volunteers, to determine the mix, scope and types of programs that would best serve the needs and interests of the greater Montréal community, and to provide evidence in regard to the above by no later than April 1, 2015.
On November 27, 2013 the CRTC issued administrative renewals, until August 31, 2015, for the following cable distribution licenses: Gatineau and surrounding areas (Aylmer, Gatineau, Hull), Montreal, Montreal (West), Québec and Terrebonne (Broadcasting Decision CRTC 2013-633).
Distribution of Canadian Content
The Broadcasting Distribution Regulations issued by the CRTC pursuant to the Broadcasting Act mandate the types of Canadian and non-Canadian programming services that may be distributed by BDUs, including cable television systems. For example, local television stations are subject to “must carry” rules which require terrestrial distributors, such as cable and MMDS operators, to carry these signals and, in some instances, those of regional television stations as part of their basic service. The guaranteed carriage enjoyed by local television broadcasters under the “must carry” rules is designed to ensure that the signals of local broadcasters reach cable households. Furthermore, cable operators, direct-to-home (“DTH”) operators and MMDS operators must offer their customers more Canadian programming than non-Canadian programming services. In summary, each cable television system is required to distribute all of the Canadian programming services that the CRTC has determined are appropriate for the market it serves, which includes local and regional television stations, certain specialty channels and pay television channels, and a pay-per-view service, but does not include Category B and mainstream sports Category C digital services.
Broadcasting Distribution Regulations
The Broadcasting Distribution Regulations which came into force in 1998 (the “1998 Regulations”), apply to broadcasting distribution undertakings in Canada. The 1998 Regulations promote competition among broadcasting distribution undertakings and the development of new technologies for the distribution of such services while ensuring that quality Canadian programs are broadcast. The 1998 Regulations introduced important new rules, including the following:
| • | Competition and Carriage Rules. The 1998 Regulations provide equitable opportunities for all distributors of broadcasting services. Similar to the signal carriage and substitution requirements that are imposed on existing cable television systems, |
32
Table of Contents
under the 1998 Regulations, new broadcasting distribution undertakings are also subject to carriage and substitution requirements. The 1998 Regulations prohibit a distributor from giving an undue preference to any person, including itself, or subjecting any person to an undue disadvantage. This gives the CRTC the ability to address complaints of anti-competitive behaviour on the part of certain distributors. |
| • | Signal Substitution. A significant aspect of television broadcasting in Canada is simultaneous program substitution, or simulcasting, a regulatory requirement under which Canadian distribution undertakings, such as cable television systems with over 2,000 customers and DTH satellite operators, are required to substitute the foreign programming service, with local Canadian signal, including Canadian commercials, for broadcasts of identical programs by a U.S. station when both programs are exhibited at the same time. These requirements are designed to protect the program rights that Canadian broadcasters acquire for their respective local markets. On January 29, 2015, the CRTC issued Broadcasting Regulatory Policy CRTC 2015-25. The CRTC will continue to allow the practice of simultaneous substitution for the time being. However, to ensure that simultaneous substitution is executed in a seamless fashion, the CRTC is introducing meaningful consequences should broadcasters and distributors make errors. Further, distributors will no longer be allowed to perform simultaneous substitution for the Super Bowl as of the end of the 2016 NFL season (which represents the January/February 2017 broadcast of the Super Bowl). On March 2, 2015, Bell Canada filed a motion for leave to appeal with the Federal Court of Appeal regarding this Regulatory Policy. |
| • | Contribution to local expression, Canadian programming and community television. All distributors, except systems with fewer than 2,000 customers, are required to contribute at least 5% of their gross annual broadcast revenues to the creation and presentation of Canadian programming including community programming. |
| • | Inside Wiring Rules. The CRTC determined that the inside wiring portion of cable networks creates a bottleneck facility that could affect competition if open access is not provided to other distributors. Incumbent cable companies may retain the ownership of the inside wiring but must allow usage by competitive undertakings to which the cable company may charge a just and reasonable fee for the use of the inside wire. On September 3, 2002, the CRTC established a fee of $0.52 per customer per month for the use of cable inside wire in multiple-dwelling units. In Broadcasting Regulatory PolicyCRTC 2011-774, the CRTC found that it was appropriate to amend the Broadcasting Distribution Regulations to permit access by subscribers and competing broadcasting distribution undertakings to inside wire in commercial and institutional properties. Therefore, the CRTC directed all licensees to negotiate appropriate terms and conditions, including a just and reasonable rate, for the use by competitors of the inside wire such licensees own in commercial and institutional properties. If the inside wire configuration resembles that in a multi-unit dwelling, the CRTC would expect that the established $0.52 per subscriber per month rate would be reasonable. If parties cannot come to an agreement, either party may apply to the CRTC for dispute resolution. |
| • | Mandatory distribution of emergency alert messages. On August 29, 2014, in Broadcasting Regulatory Policy CRTC 2014-444, the CRTC required broadcasters and distributors to fully participate in Canada’s National Public Alerting System. By March 31, 2015, radio and television broadcasters, as well as BDUs and video-on-demand (VOD) undertakings in Canada will be required to alert Canadians of imminent threats to life. As a result, Canadians across the country who are listening to radio or watching television will receive notification of imminent emergencies issued by public officials so that they can take appropriate action. Alert messages include messages relating to events such as tornadoes, floods, forest fires, industrial disasters and tsunamis. |
Rates
Our revenue related to cable television is derived mainly from (a) monthly subscription fees for basic cable service; (b) fees for premium services such as specialty services, pay-television, pay-per-view television and video-on-demand; and (c) installation and additional outlets charges.
33
Table of Contents
The CRTC does not regulate the fees charged by cable or non-cable broadcast distribution undertakings.
Vertical Integration
In September 2011, the CRTC released Broadcasting Regulatory Policy CRTC 2011-601 (the “Policy”) setting out its decisions on the regulatory framework for vertical integration. Vertical integration refers to the ownership or control by one entity of both programming services, such as conventional television stations or pay and specialty services, as well as distribution services, such as cable systems or DTH satellite services. The Policy: (i) prohibits companies from offering television programs on an exclusive basis to their mobile or Internet subscribers in a manner that they are dependent on the subscription to a specific mobile or retail Internet access service. Any program broadcast on television, including hockey games and other live events, must be made available to competitors under fair and reasonable terms; (ii) allows companies to offer exclusive programming to their Internet or mobile customers provided that it is produced specifically for an Internet portal or a mobile device; and (iii) adopts a code of conduct to prevent anti-competitive behaviour and ensure all distributors, broadcasters and online programming services negotiate in good faith (to protect Canadians from losing a television service during a dispute, broadcasters must continue to provide the service in question and distributors must continue to offer it to their subscribers on the same terms and conditions as it did before the dispute.)
On July 26, 2012, the CRTC published Broadcasting Regulatory Policy CRTC 2012-407 and announced amendments to the Television Broadcasting Regulations, the Pay Television Regulations, the Specialty Services Regulations, and the Broadcasting Distribution Regulations. These amendments, related to the distribution of Category B services, the “no head start” rule, the prohibition against tied selling, the standstill provisions and dispute resolution provisions, implement determinations made by the CRTC in Regulatory framework relating to vertical integration, Broadcasting Regulatory Policy CRTC 2011-601, September 21, 2011.
On July 26, 2012, the CRTC published Broadcasting Order CRTC 2012-408. The CRTC amended the terms and conditions of the exemption order for terrestrial broadcasting distribution undertakings serving fewer than 20,000 subscribers. These amendments implement determinations made by the CRTC in Regulatory framework relating to vertical integration, Broadcasting Regulatory Policy CRTC 2011-601, September 21, 2011.
Pay-Per-View License
On October 23, 2013, the CRTC published a revised regulatory framework for pay-per-view services, Broadcasting Regulatory Policy CRTC 2013-561, October 23, 2013. The revised framework simplifies the CRTC’s policy and makes it more consistent with the regulatory framework for video-on-demand services, with which pay-per-view services compete. On June 25, 2014, the pay-per-view license of Canal Indigo was renewed until August 31, 2019. Canal Indigo has to adhere to the standard conditions of license set out in Broadcasting Regulatory Policy CRTC 2013-561. On September 30, 2014, the CRTC approved our application to amend our broadcasting license for our French-language pay-per-view television service Canal Indigo to make it a bilingual service. On October 14, 2014, we filed an amendment request with the CRTC in order to modify the condition of license regarding the number of English-language signals. Canal Indigo is requesting to maintain a French-to-English ratio of 4:1, including a minimum of two English-language signals instead of three. On February 20, 2015 in Broadcasting Decision CRTC 2015-60, the CRTC approved Canal Indigo’s request.
Video-on-demand (VOD) License
In Broadcasting Regulatory Policy CRTC 2015-86 issued on March 12, 2015, the CRTC considered appropriate to authorize a third category of VOD services based on a hybrid regulatory approach. The CRTC will authorize these hybrid services to operate with the same flexibility as those services operating under the Digital Media Exemption Order (DMEO), provided certain conditions are met. In this regard, the CRTC will amend and expand the current exemption order for VOD services in order to include hybrid VOD services as a new type of exempt undertaking. The hybrid VOD services will benefit from the following incentives:
| • | the ability to offer exclusive programming in the same manner as services operating under the DMEO; and |
34
Table of Contents
| • | the ability to offer their service on a closed BDU network in the same manner as traditional VOD services without the regulatory requirements relating to financial contributions to and shelf space for Canadian programming that would normally be imposed on those traditional VOD services. |
However, in order to be eligible for exemption under the expanded order, the services must also be offered on the Internet to all Canadians without authentication to a BDU subscription. Therefore, Club illico qualifies as a hybrid VOD service.
New Media Broadcasting Undertakings
On October 22, 2009, the CRTC amended the Exemption Order applying to new media broadcasting undertakings (Appendix A to the Public NoticeCRTC 1999-197). As such, the description of a “new media broadcasting undertaking” was amended to encompass all Internet-based and mobile point-to-point broadcasting services, to introduce an undue preference provision for new media broadcasting undertakings, and to introduce a reporting requirement for such undertakings (Broadcasting OrderCRTC 2009-660).
On July 28, 2009, in Broadcasting Regulatory PolicyCRTC 2009-329 entitled “Review of Broadcasting in New Media”, the CRTC set out its determinations in its proceeding on Canadian broadcasting in new media. However, the CRTC did not determine the legal issue as to whether Internet access providers carry on, in whole or in part, “broadcasting undertakings” pursuant to the Broadcasting Act when they provide access to broadcasting through the Internet. Instead, the CRTC stated that it would refer the matter to the Federal Court of Appeal. Hence, the CRTC referred this question to the Federal Court of Appeal for hearing and determination in its Broadcasting OrderCRTC 2009-452. On July 7, 2010, the Federal Court of Appeal determined that ISPs play a “content-neutral role” in the transmission of data and do not carry on broadcasting activities. On February 9, 2012, the Supreme Court of Canada subsequently upheld the Federal Court of Appeal’s decision.
On July 26, 2012, the CRTC amended the Exemption Order for new media broadcasting undertakings / Digital Media Exemption Order, Broadcasting Order CRTC 2012-409. These amendments implement determinations made by the CRTC in regulatory framework relating to vertical integration (Broadcasting Regulatory PolicyCRTC 2011-601). As such, the CRTC implemented the following:
| • | A “no head start” rule, where the CRTC expects that digital media broadcasting undertakings that intend to provide exclusive access to television programming in a manner that restricts access based on a consumer’s specific mobile or retail Internet access service will provide other digital media broadcasting undertakings with appropriate notice in order to allow these undertakings to exercise their options; |
| • | A provision to preclude undertakings operating under that exemption order from providing exclusive access to programming designed primarily for conventional television, specialty, pay or VOD services in situations where such access to the programming was restricted on the basis of a consumer’s specific mobile or retail Internet access service; |
| • | A standstill rule whereby an undertaking that was in a dispute with another undertaking concerning the terms of carriage of programming or any right or obligation under the Broadcasting Act would be required to continue providing or distributing the service that was subject to the dispute on the same terms and conditions that prevailed before the dispute; and |
| • | A dispute resolution mechanism. |
Copyright Board Proceedings
Certain copyrights in radio, television, Internet and pay audio content are administered collectively by copyright societies according to tariffs set by the Copyright Board of Canada (the “Copyright Board”). Tariffs certified by the Copyright Board are generally applicable until a public process is held and a decision of the Copyright Board is rendered for a renewed tariff. Renewed tariffs are often applicable retroactively.
35
Table of Contents
Royalties for the Retransmission of Distant Signals
Following the implementation in 1989 of the Canada-U.S. Free Trade Agreement, the Copyright Act (Canada) was amended to require retransmitters, including Canadian cable television operators, to pay royalties in respect of the retransmission of distant television and radio signals.
Since this legislative amendment, the Copyright Act (Canada) empowers the Copyright Board to quantify the amount of royalties payable to retransmit these signals and to allocate them among collective societies representing the holders of copyright in the works thus retransmitted. Such royalties might be a component of an application for a basic cable service rate charged by cable television operators.
For 2013, the royalties have been set to between $0.41 and $0.98 per customer per month depending on the number of customers receiving the signal. For 2014-2018, the collective societies are demanding substantive increases representing more than 7% for 2014. All the proposed tariffs have been opposed.
Royalties for the Transmission of Pay and Specialty Services
In 1989, the Copyright Act (Canada) was amended, in particular, to define copyright as including the exclusive right to “communicate works to the public by telecommunication.” Prior to the amendment, it was generally believed that copyright holders did not have an exclusive right to authorize the transmission of works carried on radio and television station signals when these signals were not broadcasted but rather transmitted originally by cable television operators to their customers. In 1996, at the request of the Society of Composers, Authors and Music Publishers of Canada (“SOCAN”), the Copyright Board approved Tariff 17A, which required the payment of royalties by broadcasting distribution undertakings, including cable television operators, that transmit musical works to their customers in the course of transmitting television services on a subscription basis. Through a series of industry agreements, this liability was shared with the pay and specialty programming services.
Royalties for Commercial Television and Specialty Services for Communication to the Public
Tariffs 2A and 17 of the SOCAN require the payment of a royalty to SOCAN by the commercial television stations and by the specialty services in compensation for the right to communicate to the public by telecommunication in Canada the musical works forming part of SOCAN’s repertoire and contained in the audiovisual works broadcast. The tariffs represent a percentage of the gross income of the stations and services. In January 1998, the Copyright Board reduced the applicable rate under Tariff 2.A from 2.1% to 1.8%, and fixed a “modified blanket license”, allowing television stations to “withdraw” from the standard blanket license regarding certain broadcasts. The same changes were applied to Tariff 17 by Copyright Board in February 2001. Both decisions made such changes retroactively applicable as of January 1, 1997.
SOCAN Tariff 2A has been fixed at the following percentages of the gross incomes of the relevant channels, according to the definitions of the applicable regulations, and subject to the exceptions and special conditions of application of such Tariff: 1.8% from 1997 to 2001, and 1.9 % from 2002 to 2008. SOCAN Tariff 17 has been fixed at the following percentages of the gross income of the relevant channels, according to the definitions of the applicable regulations, subject to the exceptions and special conditions of application of such Tariff and subject to sharing of the royalties with the broadcasting distribution undertakings distributing the specialty channels: 1.8% from 1997 to 2000, 1.78% in 2001, and 1.9 % from 2002 to 2008.
SOCAN has filed proposed Tariffs 2.A and 17 before the Copyright Board for the years 2009 to 2015, proposing royaty rates at 1.9% for the 2009-2012 period and an increase to 2.1% for the years 2013 to 2015. All such proposed Tariffs have been opposed by commercial television stations and specialty services. As none of these proposed Tariffs have yet been approved by the Copyright Board, royalties payable to SOCAN since 2008 remain at a rate of 1.9%.
Webcasting of SOCAN’s repertoire is governed by Tariff 22 D 1, which currently represents 1.9% of the gross income coming from this platform, subject to the exceptions and special conditions of application of the Tariff. The proposed increase from the current rate to 2.1% for 2014 and 2015 has been opposed.
36
Table of Contents
Royalties for Pay Audio Services
The royalties payable by distribution undertakings for the communication to the public by telecommunication of musical works in SOCAN’s repertoire in connection with the transmission of a pay audio signal other than retransmitted signals are as follows: a monthly fee of 12.35% of the affiliation payments payable by a distribution undertaking for the transmission for private or domestic use of a pay audio signal, or an annual fee of 6.175% of the affiliation payments payable where the distribution undertaking is a small cable transmission system, an unscrambled low power or very low power television station or an equivalent small transmission system. SOCAN has filed a proposed Pay Audio Tariff for the years 2008 through 2015 that proposes to maintain those rates.
For its part, Re: Sound filed a proposed Pay Audio Tariff for the period 2012-2016 asking for a monthly fee of 15% of the affiliation payments payable by a distribution undertaking for the transmission for private or domestic use of a pay audio signal, or an annual fee of 7.5% of the affiliation payments payable where the distribution undertaking is a small cable transmission system, an unscrambled low power or very low power television station or an equivalent small transmission system. The proposed rates have been opposed.
Royalties for Ringtones
Since 2006, we sell ringtones directly to cellular phone users. After negotiating a proposed increase, SOCAN and the industry, including Videotron, came to an agreement on a new Tariff 24 for the period July 1, 2006 to and including the year 2013, the rate is 6% with a minimum royalty of six cents for the period 2006 to 2009, and 5% with a minimum royalty of five cents for the period 2009 to and including 2013.
In July 2012, the Supreme Court of Canada issued decisions in five copyright cases in which the court ruled that songwriters and music publishers (represented by SOCAN) are not entitled to royalties for certain downloads and samples. Pursuant to those rulings, the industry has filed a lawsuit seeking a refund of the royalties paid and the annulment of Tariff 24. The Supreme Court of Canada concluded that no royalty for the communication of musical work to the public by telecommunication was payable for the downloading of ringtones, but the Federal Court of Canada has concluded on March 6, 2015, that SOCAN has legal reasons to keep royalties paid pursuant to Tariff 24. A Notice to Appeal has been filed on March 16, 2015, before the Federal Court of Appeal of Canada asking to set aside such decision and for the reimbursement of all royalties paid to SOCAM under Tariff 24. It is thus expected that this matter will continue to be litigated.
ISP Liability
In 1996, SOCAN proposed a tariff to be applied against ISPs, in respect of composers’/publishers’ rights in musical works communicated over the Internet to ISPs’ customers. SOCAN’s proposed tariff was challenged by a number of industry groups and companies. In 1999, the Copyright Board decided that ISPs should not be liable for the communication of musical works by their customers, although they might be liable if they themselves operated a musical website. In June 2004, the Supreme Court of Canada upheld this portion of the decision of the Copyright Board and determined that ISPs do not incur liability for copyright content when they engage in normal intermediary activities, including web hosting for third parties and caching. As a consequence, ISPs may, however, be found liable if their conduct leads to the inference that they have authorized a copyright violation. At the end of 2012, amendments to the Copyright Act (Canada) received royal assent. These amendments clarify ISPs’ liability with respect to acts other than communication to the public by telecommunication, such as reproductions, implements “safe harbours” for the benefit of ISPs, and further put in place a “notice and notice” process to be followed by ISPs, meaning that copyright infringement notices must now be sent to the Internet end-users by ISPs.
Canadian Telecommunications Services
Jurisdiction
The provision of telecommunications services in Canada is regulated by the CRTC pursuant to theTelecommunications Act. The Telecommunications Act provides for the regulation of facilities-based telecommunications common carriers under federal jurisdiction. With certain exceptions, companies that own or operate transmission facilities in Canada that are used to offer telecommunications services to the public for compensation are deemed “telecommunications common carriers” under the Telecommunications Act administered by the CRTC and are subject to regulation. Cable operators offering telecommunications services are deemed “Broadcast Carriers.”
37
Table of Contents
In the Canadian telecommunications market, we operate as a CLEC and a Broadcast Carrier. We also operate our own 4G mobile wireless network and offer services over this network as a Wireless Service Provider (“WSP”).
The issuance of licenses for the use of radiofrequency spectrum in Canada is administered by Industry Canada under the Radiocommunication Act. Use of spectrum is governed by conditions of license which address such matters as license term, transferability and divisibility, technical compliance, lawful interception, research and development requirements, and requirements related to antenna site sharing and mandatory roaming.
Our AWS licenses were issued on December 23, 2008, for a term of ten years. At a minimum of two years before the end of this term, and any subsequent terms, we may apply for license renewal for an additional license term of up to ten years. AWS license renewal, including whether license fees should apply for a subsequent license term, will be subject to a public consultation process initiated in year eight. Our 700 MHz licenses were issued on April 3, 2014, for a term of 20 years. At the end of this term, we will have a high expectation that new licenses will be issued for a subsequent term through a renewal process unless a breach of license condition has occurred, a fundamental reallocation of spectrum to a new service is required, or an overriding policy need arises. The process for issuing licenses after this term and any issues relating to renewal, including the terms and conditions of the new licenses, will be determined by the Minister of Industry Canada following a public consultation. Our AWS-3 licenses are expected to be issued on or after April 21, 2015, upon final payment of our winning bids, and will have a term of 20 years. License renewal at the end of this term will be governed by conditions identical to those just described for our 700 MHz licenses.
Application of Canadian Telecommunications Regulation
In a series of decisions, the CRTC has determined that the carriage of “non-programming” services by a cable company results in that company being regulated as a carrier under the Telecommunications Act. This applies to a company serving its own customers, or allowing a third party to use its distribution network to provide non-programming services to customers, such as providing access to cable Internet services.
In addition, the CRTC regulates the provision of telephony services in Canada.
Elements of the CRTC’s local telecommunications regulatory framework to which we are subject include: interconnection standards and inter-carrier compensation arrangements; the mandatory provision of equal access (i.e. customer choice of long distance provider); standards for the provision of 911 service, message relay service and certain privacy features; the obligation not to prevent other local exchange carriers from accessing end-users on a timely basis under reasonable terms and conditions in multi dwelling units where we provide service; and the payment of contribution on VoIP revenues for the purposes of the revenue-based contribution regime established by the CRTC to subsidize residential telephone services in rural and remote parts of Canada.
As a CLEC, we are not subject to retail price regulation. ILECs remain subject to retail price regulation in those geographic areas where facilities-based competition is insufficient to protect the interests of consumers. Our ILEC competitors have requested and been granted forbearance from regulation of local exchange services in the vast majority of residential markets in which we compete, as well as in a large number of business markets, including all of the largest metropolitan markets in the Province of Québec.
Right to Access to Telecommunications and Support Structures
The CRTC has concluded that some provisions of theTelecommunications Act may be characterized as encouraging joint use of existing support structures of telephone utilities to facilitate efficient deployment of cable distribution undertakings by Canadian carriers. We access these support structures in exchange for a tariff that is regulated by the CRTC. If it were not possible to agree on the use or conditions of access with a support structure owner, we could apply to the CRTC for a right of access to a supporting structure of a telephone utility. The Supreme Court of Canada, however, held on May 16, 2003, that the CRTC does not have jurisdiction under the Telecommunications Act to establish the terms and conditions of access to the support structures of hydro-electricity utilities. Terms of access to the support structures of hydro-electricity utilities must therefore be negotiated with those utilities.
38
Table of Contents
We have entered into comprehensive support structure access agreements with all of the major hydro-electric companies and all of the major telecommunications companies in its service territory.
Right to Access to Municipal Rights-of-Way
Pursuant to sections 42, 43 and 44 of the Telecommunications Act, the CRTC possesses certain construction and expropriation powers related to the installation, operation and maintenance of telecommunication facilities. In the past, most notably in Telecom Decision CRTC 2001-23 (the “Ledcor Decision”), the CRTC has used these powers to grant Canadian carriers access to municipal rights-of-way under terms and conditions set out in a municipal access agreement.
On September 23, 2011, the CRTC initiated a public proceeding to consider the development of a model agreement for access by Canadian carriers to municipal rights-of-way, such as street crossings and other municipal property. As part of this proceeding, anad hoc working group, including representatives from Canadian municipalities and the telecommunication industry, was tasked with developing a model agreement based on the principles established in the Ledcor Decision.
On November 21, 2013, the CRTC issued its ruling in this proceeding in the form of Telecom Decision CRTC 2013-618. This ruling approved a partial model agreement incorporating consensus recommendations from thead hoc working group on matters such as the use of rights-of-way, permitting practices and the manner of work. At the same time, the CRTC declined to rule on a series of non-consensus items including the treatment of incorrectly located equipment, indemnification clauses, the definition of causal costs and the reimbursement of collocation costs. In declining to rule on these items, the CRTC stated its expectation that they be negotiated between individual carriers and municipalities. Should negotiations fail, the CRTC retains the power to resolve disputes.
We have outstanding disputes with several Québec municipalities related to the use of municipal rights-of-way. Should these disputes not be resolved to the mutual satisfaction of the parties, and should they be referred to the CRTC for resolution, the outcome of which could have a material impact on our costs for municipal access for our wireline facilities.
Access by Third Parties to Cable Networks
In Canada, access to the Internet is a telecommunications service. While Internet access services are not regulated on a retail (price and terms of service) basis, Internet access for third-party ISPs is mandated and tariffed according to conditions approved by the CRTC for cable operators.
The largest cable operators in Canada, including us, have been required by the CRTC to provide third-party ISPs with access to our cable systems at mandated cost-based rates. In a decision issued on August 30, 2010, the CRTC reaffirmed the network model underlying the cable operators’ third-party Internet access (or “TPIA”) services, and also reaffirmed its directive that, at the same time we offer any new retail Internet service speed, we file proposed revisions to our TPIA tariff to include this new speed offering. TPIA tariff items have been filed and approved for all our Internet service speeds. Several third party ISPs are interconnected to our cable network and are thereby providing retail Internet access services.
The CRTC also requires the large cable carriers, such as us, to allow third party ISPs to provide telephony and networking (LAS/VPN) applications services in addition to retail Internet access services. The CRTC has also approved technical solutions for the provision of static IP addresses under TPIA.
In a decision dated November 15, 2011, the CRTC made substantial changes to the practices that may be employed by incumbent telephone companies and cable operators to bill third parties for the access to and use of their underlying networks. The objective of these changes was to grant third parties greater flexibility to bring pricing discipline, innovation and consumer choice to the retail Internet service market. The new rules, which entered into force on February 1, 2012, required Videotron to replace its former end-user usage-based billing model by a new aggregate capacity-based billing model, for the vast majority of Videotron’s third party customers. On February 21, 2013, the CRTC ruled on a series of disputes related to the new wholesale regime. These rulings did not fundamentally alter the nature of the new regime.
In a notice of consultation issued on October 15, 2013, the CRTC initiated a comprehensive review of wholesale services and associated policies. Among the issues considered in this proceeding are whether to extend mandatory
39
Table of Contents
wholesale high-speed access services to include fibre-to-the-premises (FTTP) services, or alternatively whether the CRTC should forbear from regulating any existing wholesale services, as well as the approaches and principles the CRTC relies on to set rates for wholesale services. A public hearing on these matters took place in November and December 2014, and a ruling is expected by April 2015. As a result of this proceeding, we may experience increased competition for retail cable Internet and telephony customers. In addition, because our third-party Internet access rates are regulated by the CRTC, we could be limited in our ability to recover our costs associated with providing this access.
Internet Traffic Management Practices
On October 21, 2009, the CRTC issued a regulatory policy regarding the Internet traffic management practices (ITMPs) of ISPs. The policy attempts to balance the freedom of Canadians to use the Internet for various purposes with the legitimate interests of ISPs to manage the traffic thus generated on their networks, consistent with legislation, including privacy legislation. Among other things, the policy sets rules for ensuring transparency in the use of economic and technical ITMPs, and establishes an ITMP framework that provides a structured approach to evaluating whether existing and future ITMPs are in compliance with the prohibition on unjust discrimination (e.g. as against specific applications or content) found in the Telecommunications Act. Specific rules are also established to ensure that wholesale customers are not subjected to unjust discrimination.
On June 30, 2010, the CRTC determined that the policy framework regarding ITMPs applies to the use of mobile wireless data services to provide Internet access.
While we consider our current ITMPs to be fully compliant with the policy, we note that the policy may limit the range of ITMPs we could choose in the future, thereby potentially constraining our ability to recover our costs associated with providing access to our network.
Regulatory Framework for Mobile Wireless Services
On March 14, 2012, the Government of Canada announced its policy framework for the auction of spectrum in the 700 MHz and 2500 MHz bands, both of which are considered attractive candidates for the deployment of LTE A mobile wireless technology. The policy framework includes several measures intended to sustain competition and robust investment in wireless telecommunications and promote the timely availability of advanced services, including:
| • | Foreign investment restrictions have been lifted for companies that initially have a market share of less than 10% of the Canadian telecommunications market. |
| • | Spectrum caps have been and will be employed in both the 700 MHz and the 2500 MHz auctions to ensure that in each region of Canada no fewer than four operators gain access to prime spectrum. |
| • | Tower sharing and roaming policies have been improved and extended. |
| • | Obligations have been imposed on 700 MHz license holders to ensure advanced wireless services are quickly delivered to rural Canadians. |
In the context of the 700 MHz spectrum auction concluded on February 19, 2014, we were declared the provisional winner of a package of seven spectrum licenses for a final price of $233.3 million. Eligibility documentation and payment equal to 20% of the final price was submitted to Industry Canada on March 5, 2014. Payment equal to the remaining 80% of the final price was submitted on April 2, 2014. Our licenses were issued on April 3, 2014.
On January 10, 2014, the Government of Canada announced the final rules for the upcoming 2500 MHz spectrum auction, which is scheduled to begin on April 14, 2015. We will be studying the detailed auction format and rules in depth and will be setting its auction strategy accordingly. On January 30, 2015, we filed an application to participate in the auction. We were declared a qualified bidder on February 13, 2015.
On December 18, 2014, the Government of Canada published its final technical, policy and licensing framework for the auction of spectrum licenses in the AWS-3 band. The AWS-3 band is adjacent to the initial AWS band (also referred to as the AWS-1 band), and is considered a key component for future deployment of LTE technology. The final rules included the set-aside of a single 30 MHz block (of a total 50 MHz available) in each of fourteen regions of Canada.
40
Table of Contents
Eligibility to bid on the set-aside block in each region was limited to new entrant wireless carriers already offering commercial mobile wireless services over their own network in that region. The auction took place on March 3, 2015, and we were declared the successful bidder for four 30 MHz licenses, one in each of Eastern Québec, Southern Québec, Northern Québec and Eastern Ontario / Outaouais, for a final price of $31.8 million. Eligibility documentation and a payment equal to 20% of the final price must be submitted to Industry Canada on March 20, 2015. Payment equal to the remaining 80% of the final price must be submitted on April 21, 2015.
In June 2013, Industry Canada published its new framework relating to transfers, divisions and subordinate licensing of spectrum licenses for commercial mobile spectrum. The framework sets out a series of considerations and criteria for reviewing license transfers and prospective transfers, while refraining from imposing specific quantitative or other approval thresholds. Among the considerations and criteria are: the current license holdings of the applicants in the licensed area, the overall distribution of holdings in the band and other commercial mobile bands in the licensed area, the availability of alternative spectrum, and the degree to which the applicants have deployed networks. The framework also sets out review procedures and timelines (normally 12 weeks from the time of receipt of all required information) and establishes a definition of “deemed transfers” subject to review. The new framework applies to license transfers and prospective transfers on or after the date of publication, and therefore will apply if and when we exercise our option to sell our Toronto AWS license to Rogers under the Rogers LTE Agreement.
The CRTC also regulates mobile wireless services under theTelecommunications Act. On August 12, 1994, the CRTC released a decision forbearing from the exercise of most of its powers under the Telecommunications Act as they relate to mobile wireless service. However, the CRTC did maintain its ability to require conditions governing customer confidential information and to place other general conditions on the provision of mobile wireless service. Since 1994, the CRTC has exercised this power, for example, to mandate wireless number portability, and to require all WSPs to upgrade their networks to more precisely determine the location of a person using a mobile phone to call 911.
On October 11, 2012, the CRTC released a decision determining that the conditions for forbearance have not changed sufficiently to require the CRTC to regulate rates or interfere in the competitiveness of the retail mobile wireless voice and data services market. However, on the same date, to ensure that consumers are able to participate in the competitive market in an informed and effective manner, and to fulfill the policy objectives of the Telecommunications Act, the CRTC initiated a public proceeding to establish a mandatory code for mobile wireless service providers to address the clarity and content of mobile wireless service contracts and related issues for consumers.
The new Wireless Code was published on June 3, 2013 and came into force on December 2, 2013. It includes, among other things, a limit on early cancellation fees to ensure customers can take advantage of competitive offers at least every two years, as well as measures requiring service providers to unlock wireless devices, to offer a trial period for wireless contracts, and to set default caps on data overage charges and data roaming charges.
On December 12, 2013 the CRTC initiated a proceeding to consider whether or not there is a situation of unjust discrimination or undue preference with respect to inter-carrier wireless roaming arrangements in Canada and, if so, what remedies would be appropriate. The CRTC issued its decision on July 31, 2014, ruling that there were clear instances of unjust discrimination and undue preference by one incumbent wireless carrier, and taking action to prohibit exclusivity provisions in wholesale mobile wireless roaming agreements between Canadian carriers for service in Canada. On February 20, 2014, the CRTC also initiated a broader proceeding to determine whether the wholesale mobile wireless services market is sufficiently competitive and whether greater regulatory oversight, including mandating access to any existing or potential wholesale mobile wireless service, would be appropriate. In this regard, the CRTC is examining the market conditions for wholesale roaming and wholesale tower and site sharing, as well as the market conditions for other wholesale mobile wireless services. A public hearing on these matters took place in September and October 2014, and a ruling is not expected before March 20, 2015.
On June 19, 2014, the Government of Canada’s first omnibus budget implementation bill for 2014 (C-31) received Royal Assent. This bill amends the Telecommunications Act by putting a cap on domestic wireless roaming rates, preventing wireless providers from charging other companies more than they charge their own customers for mobile voice, data and text services. This measure will be in place until such time as the CRTC makes a decision on roaming rates.
41
Table of Contents
On December 17, 2014, the Government of Canada’s second omnibus budget implementation bill for 2014 (C-43) received Royal Assent. This bill amends both the Telecommunications Act and the Radiocommunication Act to give the CRTC and Industry Canada the option to impose monetary penalties on companies that violate established rules such as the Wireless Code and those related to the deployment of spectrum, services to rural areas and tower sharing.
The remedies or measures that result from the CRTC’s wholesale wireless proceeding or the Government’s legislative amendments could have an impact on our cost structure for domestic roaming or tower sharing and hence on our competitiveness in the wireless market.
Municipal Siting Processes for Wireless Antenna Systems
On February 28, 2013, the Canadian Wireless Telecommunications Association, of which we are a member, and the Federation of Canadian Municipalities signed a joint protocol on the siting process for wireless antenna systems. The protocol establishes a more comprehensive notification and consultation process than current regulations, and emphasizes the need for meaningful pre-consultation to ensure local land use priorities and sensitivities are fully reflected in the location and design of new antenna systems. Telecommunications carriers have agreed for the first time to notify municipalities of all antennas being installed before their construction, regardless of height, and to undertake full public consultation for towers under 15 meters - whenever deemed necessary by the municipality.
Effective implementation of the joint protocol requires a willingness on the part of both carriers and municipalities to engage in constructive discussions related to antenna siting within the framework of current Industry Canada regulations. Any efforts by municipalities to refrain from constructive discussions or to impose requirements that fall outside of the framework of current Industry Canada regulations could have a material impact on our ability to expand our existing HSPA+ network or our LTE network on a timely and cost-effective basis.
On June 26, 2014, the Minister of Industry (Canada) announced changes to the policy guiding the installation of new antenna towers, most notably to require companies to consult communities on all commercial tower installations regardless of height and to ensure residents are well informed of upcoming consultations. These changes are largely consistent with the joint protocol cited above.
D- Organizational Structure
Videotron is a wholly-owned subsidiary of Quebecor Media. Quebecor Media is a 75.4% owned subsidiary of Quebecor. The remaining 24.6% of Quebecor Media is owned by a subsidiary of CDPQ, one of Canada’s largest pension fund managers. The following chart illustrates the corporate structure of Videotron as of March 20, 2015, including Videotron’s significant subsidiaries, together with the jurisdiction of incorporation or organization of each entity.
42
Table of Contents
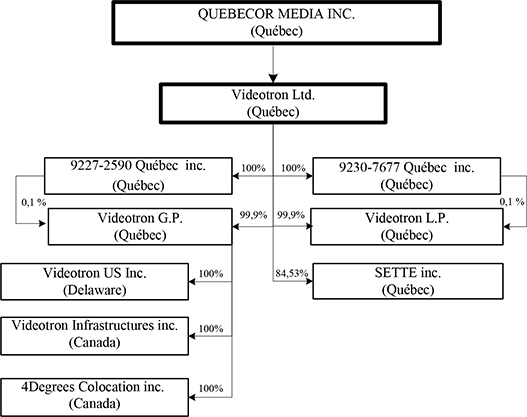
E- Property, Plants and Equipment
Our corporate offices are located in leased space at 612 St-Jacques Street, Montréal, Québec, Canada H3C 4M8, (187,592 square feet), in the same building as Quebecor Media’s head office. We also own several buildings in Montréal, the largest building of which is located at 2155 Pie IX Street in Montréal (approximately 128,000 square feet). We also own a building located at 150 Beaubien Street in Montréal (approximately 72,000 square feet). We lease approximately 52,000 square feet of office space in a building located at 800 de la Gauchetière Street in Montréal to accommodate staffing growth. We also lease approximately 54,000 square feet in a building located at 4545 Frontenac Street in Montréal and 49,000 square feet in a building located at 888 De Maisonneuve Street in Montréal. In Québec City, we own a building of approximately 40,000 square feet located at 2200 Jean-Perrin Street where our regional headend for the Québec City region is located. We also own or lease a significant number of smaller locations for signal reception sites and customer service and business offices.
Our senior secured credit facilities are secured by charges over all of our assets and those of most of our subsidiaries.
Intellectual Property
We use a number of trademarks for our products and services. Many of these trademarks are registered by us in the appropriate jurisdictions. In addition, we have legal rights in the unregistered marks arising from their use. We have taken affirmative legal steps to protect our trademarks and we believe our trademarks are adequately protected.
Environment
Our operations are subject to Canadian, provincial and municipal laws and regulations concerning, among other things, emissions to the air, water and sewer discharge, handling and disposal of hazardous materials, the recycling of waste, the soil remediation of contaminated sites, or otherwise relating to the protection of the environment. Laws and regulations relating to workplace safety and worker health, which among other things, regulate employee exposure to hazardous substances in the workplace, also govern our operations.
43
Table of Contents
Compliance with these laws has not had, and management does not expect it to have, a material effect upon our capital expenditures, net income or competitive position. Environmental laws and regulations and the interpretation of such laws and regulations, however, have changed rapidly in recent years and may continue to do so in the future. We have monitored the changes closely and have modified our practices where necessary or appropriate. For example, Québec’s regulation on the recovery and reclamation of products by enterprises officially came into force on July 13, 2011. This regulation requires to implement a recycling program or to become member of a program from an organization accredited by Recyc-Québec. Recovery rates are stipulated for different categories of products commercialized by companies to which this regulation applies. Starting in 2020, penalties will be imposed upon those companies that have failed to achieve the recovery targets between 2015 and 2020 as set forth in the regulation and will vary as a function of the amount of products commercialized and the actual recovery rates of the company, with potential penalties reaching up to $600,000 annually and with fines for non-compliance ranging between $5,000 and $250,000.
Our past and current properties, as well as areas surrounding those properties, particularly those in areas of long-term industrial use, may have had historic uses, or may have current uses, in the case of surrounding properties, which may affect our properties and require further study or remedial measures.
We are not currently conducting or planning any material study or remedial measure. Furthermore, we cannot provide assurance that all environmental liabilities have been determined, that any prior owner of our properties did not create a material environmental condition not known to us, that a material environmental condition does not otherwise exist as to any such property, or that expenditure will not be required to deal with known or unknown contamination.
ITEM 4A – UNRESOLVED STAFF COMMENTS
None.
44
Table of Contents
FINANCIAL REVIEW
ITEM 5 – OPERATING AND FINANCIAL REVIEW AND PROSPECTS
The following Management Discussion and Analysis (“MD&A”) provides information concerning the operating results and financial condition of Videotron Ltd (“Videotron”, the “Corporation”, “we” or “our”). This discussion should be read in conjunction with our consolidated financial statements and accompanying notes. The Corporation’s consolidated financial statements have been prepared in accordance with International Financial Reporting Standards, as issued by the International Accounting Standards Board.
All amounts are in Canadian dollars, unless otherwise indicated. This discussion contains forward-looking statements, which are subject to a variety of factors that could cause actual results to differ materially from those contemplated by these statements. Factors that could cause or contribute to these differences include, but are not limited to, those discussed under “Cautionary Statement Regarding Forward-Looking Statements” and in “Item 3. Key Information – Risk Factors.”
Due to rounding, minor differences may exist between amounts shown in this MD&A and the consolidated financial statements.
CORPORATE PROFILE
We are a wholly owned subsidiary of Quebecor Media Inc. (“Quebecor Media”), incorporated under the Business Corporations Act (Québec). We are the largest cable operator in the Province of Québec and the third-largest in Canada, based on the number of cable customers, as well as being a major cable Internet service and telephony services provider in the Province of Québec. Our cable network covers approximately 79% of the Province of Québec’s approximately 3.5 million residential and commercial premises. The deployment of our LTE network and our enhanced offering of mobile communication services for residential and business customers allow us to consolidate our position as a provider of integrated telecommunication services.
Videotron Business Solutions is a premier full-service telecommunications provider serving small-medium and large-sized businesses, as well as telecommunications carriers. Products and services for small and medium-sized businesses are supported by extensive coaxial, fiberoptic and LTE wireless networks.
Videotron’s primary sources of revenue include: subscriptions for cable television, cable Internet access and cable and mobile telephony services.
TREND INFORMATION
Competition continues to be intense in the cable and alternative multichannel broadcast distribution industry and in the mobile telephony market. Moreover, the significant subscriber growth recorded in past years is not necessarily indicative of future growth due to penetration rates currently reached.
The Corporation requires substantial capital for the upgrade, expansion and maintenance of its cable and mobile networks, the launch and expansion of new and additional services to support growth in its customer base and demand for increased bandwidth capacity and other services. The Corporation expects that additional capital expenditures will be required in the short and medium term in order to expand and upgrade systems and services, including expenditures relating to advancements in Internet access and high definition television (“HDTV”), as well as the cost of its mobile services’ infrastructure deployment and upgrade.
Moreover, the demand for wireless data services has been growing at unprecedented rates and it is projected that this demand will further accelerate. The anticipated levels of data traffic will represent a growing challenge to the current mobile network’s ability to serve this traffic. The Corporation may have to acquire additional spectrum, if available, in order to address this increased demand.
HIGHLIGHTS SINCE DECEMBER 31, 2013
| • | In 2014, revenues and ARPU grew 4.2% and 6.0%, respectively, compared to 2013. Solid adjusted operating income margin of 47.7% in 2014, compared with 47.4% for 2013. |
45
Table of Contents
| • | Net growth of 117,700 revenue-generating units (RGUs) in 2014 (representing the total of our cable television and cable Internet subscribers and cable and mobile telephony lines), compared with 164,800 net RGUs added in 2013. Total RGUs were 5,301,600 as of December 31, 2014. |
| • | We activated 128,500 net new lines on our advanced mobile network, the largest annual increase since 2011, bringing our total mobile customer base to 632,800 lines. |
| • | For the tenth consecutive year, Videotron was ranked Québec’s most admired company in the telecommunication industry by market research firm Léger. |
| • | On March 11, 2015, we issued a notice of redemption for all of our outstanding 6 3/8% Senior Notes due December 15, 2015. The redemption is anticipated to be completed on April 10, 2015. |
| • | On March 11, 2015, Videotron announced the acquisition of 4Degrees Colocation and its data centre, the largest in Québec City, for a cash consideration of $31.5 million, which may increase to $35.5 million if certain criteria are satisfied. The acquisition will enable Videotron to meet its business customers’ growing technological and hosting needs. |
| • | On March 6, 2015, the Québec Court of Appeal ruled in favour of Videotron and TVA Group, an affiliated corporation, and ordered Bell ExpressVu Limited Partnership (“Bell ExpressVu”), a subsidiary of Bell, to pay compensation totalling $136.0 million for having deliberately neglected to implement an appropriate security system to prevent piracy of the signals broadcast by its satellite television service between 1999 and 2005. The judgement stated that Bell ExpressVu knew and must have foreseen that this practice would cause serious harm to its competitors, including the Corporation, its main rival in Québec. |
| • | On March 6, 2015, Industry Canada announced that the Corporation was the successful bidder for four 30 MHz licences in the auction forAWS-3 commercial mobile spectrum. Videotron obtained the licences for Eastern Québec, Southern Québec, Northern Québec and Eastern Ontario / Outaouais, covering 100% of Québec’s population and the Ottawa area, for a total price of $31.8 million. |
| • | On September 10, 2014, Videotron launched its LTE mobile network (“LTE network”), which reaches nearly 90% of Québec’s population and supports speeds of up to 150 mbps, enabling consumers and business people to use their mobile devices to their full potential by accessing the best available technology to obtain the fastest data transfer speeds. |
| • | On August 27, 2014, Videotron launched the brand-new X8 multi-room recorder. Introducing new innovative features, including the ability to record eight programs at the same time and to store up to 2 terabytes, the X8 is taking the television watching experience to the next level. |
| • | On July 16, 2014, Videotron announced revamped residential Internet access plans. Its new Hybrid Fiber plans make high Internet access speeds more affordable. |
| • | On April 9, 2014, the Corporation announced the closing of its issuance and sale of US$600.0 million aggregate principal amount of 5.375% Senior Notes, due in June 2024 (the “2024 Notes”) for net proceeds of $654.5 million, net of financing fees of $7.8 million. Videotron has fully hedged the foreign currency risk associated with the new Senior Notes by using cross-currency swaps, while converting the interest rate from a fixed rate to a floating rate on US$158.6 million principal amount of the Senior Notes. Videotron used the proceeds of this issuance to redeem, on April 24, 2014, US$260.0 million in aggregate principal amount of its outstanding 9.125% Senior Notes due in April 2018, to repay drawings under its revolving credit facility, to pay transaction fees and for general corporate purposes. |
| • | On April 3, 2014, Industry Canada issued to the Corporation seven 700 MHz spectrum licences in Canada’s four most populous provinces. The operating licences, acquired for $233.3 million, cover the entirety of the provinces of Québec, Ontario (except Northern Ontario), Alberta and British Columbia, for a total covered population of more than 28 million. Ownership of these licenses enhances Videotron’s ability to maintain a leading edge, high capacity wireless network in Québec and in the Ottawa region, and provides Videotron with a number of options to maximize the value of its investment in Ontario, Alberta and British Columbia. |
| • | On March 28, 2014, Apple products were added to the extensive selection of mobile devices Videotron offers its customers. Subsequently, Videotron launched new illico apps for iPhone (4, 5C, 5S, 6) and iPad. The free apps, featuring customizable, intuitive user interfaces, make thousands of hours of French- and English-language programming from some 50 television channels available to subscribers to Videotron’s cable television service. |
NON-IFRS FINANCIAL MEASURES
The non-IFRS financial measures used by the Corporation to assess its financial performance, such as average monthly revenue per user (“ARPU”), adjusted operating income and adjusted operating income margin are not calculated in accordance with, or
46
Table of Contents
recognized by IFRS. The Corporation’s method of calculating these non-IFRS financial measures may differ from methods used by other companies and, as a result, the non-IFRS financial measures presented in this document may not be comparable to other similarly titled measures disclosed by other companies.
Average Monthly Revenue per User
ARPU is an industry metric that the Corporation uses to measure its monthly cable television, Internet access and cable and mobile telephony revenues per average basic cable customer. ARPU is not a measurement that is calculated in accordance with IFRS and the Corporation’s definition and calculation of ARPU may not be the same as identically titled measurements reported by other companies. The Corporation calculates ARPU by dividing its combined cable television, Internet access and cable and mobile telephony revenues by the average number of basic cable customers during the applicable period, and then dividing the resulting amount by the number of months in the applicable period.
Adjusted Operating Income Margin
The Corporation defines adjusted operating income margin as the adjusted operating income expressed as a percentage of revenues under IFRS.
Adjusted Operating Income
The Corporation defines adjusted operating income, as reconciled to net income under IFRS, as net income before depreciation and amortization, financial expenses, gain or loss on valuation and translation of financial instruments, gain or loss on debt refinancing, restructuring of operations, impairment of assets and other special items, income taxes and income or loss from discontinued operations. Adjusted operating income as defined above is not a measure of results that is consistent with IFRS. It is not intended to be regarded as an alternative to other financial operating performance measures or to the consolidated statement of cash flows as a measure of liquidity and should not be considered in isolation or as a substitute for measures of performance prepared in accordance with IFRS. Our management and Board of Directors use this measure in evaluating our consolidated results. As such, this measure eliminates the effect of significant levels of non-cash charges related to the depreciation of tangible assets and amortization of certain intangible assets and is unaffected by the capital structure or investment activities of the Corporation. Adjusted operating income is also relevant because it is a significant component of our annual incentive compensation programs. A limitation of this measure, however, is that it does not reflect the periodic costs of tangible and intangible assets used in generating revenues. Our definition of adjusted operating income may not be the same as similarly titled measures reported by other companies.
Table 1 below presents a reconciliation of adjusted operating income to net income as disclosed in our consolidated financial statements. The consolidated income statement data for the three-month periods ended December 31, 2014 and 2013 is derived from the unaudited consolidated statements for such periods are not included in this annual report.
Table 1
Reconciliation of the adjusted operating income measure used in this report to the net income measure used in the consolidated financial statements
(in millions of dollars)
| Three - month period ended December 31 | Twelve - month period ended December 31 | |||||||||||||||||||
| 2014 | 2013 | 2014 | 2013 | 2012 | ||||||||||||||||
Adjusted operating income | $ | 343.9 | $ | 322.3 | $ | 1,348.3 | $ | 1,284.7 | $ | 1,203.7 | ||||||||||
Depreciation and amortization | (158.2 | ) | (145.4 | ) | (601.4 | ) | (561.7 | ) | (485.4 | ) | ||||||||||
Financial expenses | (43.4 | ) | (41.4 | ) | (169.2 | ) | (174.1 | ) | (179.4 | ) | ||||||||||
(Loss) / gain on valuation and translation of financial instruments | (5.0 | ) | (17.2 | ) | (3.4 | ) | (163.7 | ) | 75.7 | |||||||||||
(Loss) / gain on debt refinancing | – | – | (21.4 | ) | (18.9 | ) | 7.6 | |||||||||||||
Restructuring of operations, impairment of assets and other special items | (38.5 | ) | (0.8 | ) | (39.4 | ) | (0.7 | ) | (0.5 | ) | ||||||||||
Income taxes | (29.2 | ) | 0.7 | (93.3 | ) | (29.4 | ) | (115.8 | ) | |||||||||||
Income from discontinued operations | – | 0.3 | – | 40.7 | 8.1 | |||||||||||||||
|
|
|
|
|
|
|
|
|
| |||||||||||
Net income | $ | 69.6 | $ | 118.5 | $ | 420.2 | $ | 376.9 | $ | 514.0 | ||||||||||
|
|
|
|
|
|
|
|
|
| |||||||||||
47
Table of Contents
Analysis of Consolidated Results of Videotron
2014/2013 Year Comparison
Customer Statistics
Revenue-generating units– As of December 31, 2014, the total number of revenue-generating units stood at 5,301,600, an increase of 117,700 (2.3%) in 2014, compared with an increase of 164,800 (3.3%) in 2013.
Cable television services– Our combined customer base for cable television services decreased by 42,800 (2.3%) in 2014, compared with a decrease of 29,900 (1.6%) in 2013. As of December 31, 2014, our cable network household penetration rate (number of subscribers as a proportion of the 2,777,300 total homes passed) was 64.2%, compared with 66.5% a year earlier.
| • | The number of subscribers to illico Digital TV stood at 1,561,700 as at the end of 2014, an increase of 30,300 (2.0%) in 2014, compared with an increase of 46,800 (3.2%) in 2013. As of December 31, 2014, 87.6% of our cable television customers were subscribers to our illico Digital TV services, compared with 83.9% as of December 31, 2013. As of December 31, 2014, illico Digital TV had a household penetration rate of 56.2%, compared with 55.8% as of December 31, 2013. |
| • | The customer base for analog cable television services decreased by 73,100 (24.9%) in 2014, compared with a decrease of 76,700 customers (20.7%) in 2013, mainly as a result of customer migration to illico Digital TV services. |
Cable Internet access services– The number of subscribers to cable Internet access services stood at 1,537,500 as at the end of 2014, an increase of 31,500 (2.1%) in 2014, compared with an increase of 62,000 (4.3%) in 2013. As of December 31, 2014, our cable Internet access services household penetration rate was 55.4%, compared with 54.9% as of December 31, 2013.
Cable telephony services– The number of cable telephony lines stood at 1,349,000 as at the end of 2014, an increase of 500 (0.1%) in 2014, compared with an increase of 32,200 (2.4%) in 2013. As of December 31, 2014, the cable telephony services household penetration rate was 48.6%, compared with 49.2% as of December 31, 2013.
Mobile telephony services– As of December 31, 2014, 632,800 lines were activated on our mobile telephony network, an increase of 128,500 (25.5%) in 2014, compared with an increase of 100,500 (24.9%) in 2013.
Table 2
End-of-year customer numbers(1)
(in thousands of customers)
| 2014 | 2013 | 2012 | 2011 | 2010 | ||||||||||||||||
Cable television: | ||||||||||||||||||||
Analog | 220.6 | 293.7 | 370.4 | 460.7 | 592.0 | |||||||||||||||
Digital | 1,561.7 | 1,531.4 | 1,484.6 | 1,400.8 | 1,219.6 | |||||||||||||||
|
|
|
|
|
|
|
|
|
| |||||||||||
Total cable television | 1,782.3 | 1,825.1 | 1,855.0 | 1,861.5 | 1,811.6 | |||||||||||||||
Cable Internet | 1,537.5 | 1,506.0 | 1,444.0 | 1,359.6 | 1,268.1 | |||||||||||||||
Cable telephony (in thousands of lines) | 1,349.0 | 1,348.5 | 1,316.3 | 1,245.9 | 1,145.1 | |||||||||||||||
Mobile telephony (in thousands of lines) | 632.8 | 504.3 | 403.8 | 290.7 | 136.1 | |||||||||||||||
|
|
|
|
|
|
|
|
|
| |||||||||||
Revenue-generating units (RGU) | 5,301.6 | 5,183.9 | 5,019.1 | 4,757.7 | 4,360.9 | |||||||||||||||
|
|
|
|
|
|
|
|
|
| |||||||||||
| (1) | The customer statistics above have been modified for previous years as a result of changes in product definition. |
48
Table of Contents
2014/2013 Analysis of Results
Revenues: $2,826.8 million, an increase of $115.0 million (4.2%) compared with 2013.
Revenues from cable television services decreased by $15.5 million (1.4%) to $1,074.8 million mainly due to a decrease in our combined customer base for cable television services, as detailed above.
Revenues from Internet access services increased by $49.9 million (6.1%) to $868.3 million. The favourable variance was mainly due to increased usage, higher revenues from Internet access resellers, customer base growth and higher revenues per customer.
Revenues from cable telephony services increased by $1.3 million (0.3%) to $475.1 million. This increase was mainly due to price increases and customer growth, partly offset by a decrease in long distance call revenues.
Revenues from mobile telephony services increased by $67.1 million (30.4%) to $287.7 million, essentially due to customer growth.
Revenues from business solutions increased by $2.1 million (3.3%) to $65.6 million.
Revenues from equipment sales increased by $9.1 million (24.9%) to $45.6 million, mainly due to mobile devices.
Other revenues increased by 0.9 million (10.3%) in 2014 at $9.6 million.
Monthly ARPU: $125.16 in 2014, compared with $118.03 in 2013, an increase of $7.13 (6.0%). This growth is mainly explained by an increase in revenues from mobile telephony and internet access services, as detailed above.
Adjusted operating income: $1,348.3 million in 2014, an increase of $63.6 million (5.0%).
| • | This increase was primarily due to: |
| ¡ | revenue increase, as detailed above; |
| ¡ | non-recurring adjustment to programming fees; and |
| ¡ | net decrease in employee costs due to higher capitalization to fixed assets and intangible assets, mainly as the result of an increase in investments in our LTE network. |
Partially offset by:
| ¡ | increase in marketing costs; |
| ¡ | non-recurring adjustments recorded in the second quarter of 2013 mainly related to CRTC licence fees; and |
| ¡ | increase in losses on sale of mobile devices. The average acquisition cost per new mobile subscriber is $499. |
Purchase of goods and services, expressed as a percentage of revenues: 40.2% in 2014, compared with 39.8% in 2013.
| • | Purchase of goods and services expenses as a proportion of revenues increased, primarily due to: |
| ¡ | increase in losses on sale of mobile devices; |
| ¡ | increase in marketing costs; and |
| ¡ | non-recurring adjustments recorded in the second quarter of 2013 mainly related to CRTC licence fees. |
Employee costs, expressed as a percentage of revenues: 12.1% in 2014, compared with 12.8% in 2013.
| • | Employee costs as a proportion of revenues decreased slightly as revenues grew more rapidly. |
Depreciation and amortization charge: $601.4 million, an increase of $39.7 million (7.1%) over 2013.
| • | The increase was mainly due to: |
| ¡ | increase in illico Digital TV set-top boxes related to our rental program; |
49
Table of Contents
| ¡ | increase in fixed assets related to cable Internet access services and to the upgrade and expansion of our wireline and wireless networks; and |
| ¡ | increase in assets related to our wireless LTE network launched in September 2014. |
Financial expenses(primarily comprised of interest on long-term debt): $169.2 million, a decrease of $4.9 million (2.8%) over 2013.
| • | The decrease was mainly due to: |
| ¡ | $2.8 million decrease in interest costs on defined benefit plans; and |
| ¡ | $2.5 million decrease in interest on long-term debt, mainly due to lower interest rates on our indebtedness; partially offset by higher indebtedness. |
Partially offset by:
| ¡ | $1.2 million increase in loss on foreign currency translation of short-term monetary items. |
Gain or loss on valuation and translation of financial instruments: Loss of $3.4 million in 2014, compared with a loss of $163.7 million in 2013, a favourable variance of $160.3 million.
| • | The change was mainly due to the variance in the fair value of early settlement options caused by fluctuations in valuation assumptions, including interest rates and credit premiums implicit in the adjusted prices of the underlying instruments, and to the favourable variation on loss on reversal of embedded derivatives upon debt redemption. |
Restructuring of operations, impairment of assets and other special items: $39.4 million expense recorded in 2014, compared with $0.7 million in 2013.
| • | The increase of $38.7 million was mainly due to a $34.3 million charge recorded in 2014 as a result of an unfavourable judgment against the Corporation in a legal action. The Corporation intends to appeal this judgment. |
Income tax expense: $93.3 million (effective tax rate of 18.2%) in 2014, compared with $29.4 million (effective tax rate of 8.1%) in 2013.
| • | The increase of $63.9 million was mainly due to: |
| ¡ | $39.8 million related to an increase in taxable income; |
| ¡ | $12.5 million related to other non-taxable or non-deductible items and other items; and |
| ¡ | $9.9 million related to changes in tax consolidation arrangements with our parent corporation and affiliated corporations. |
Net income attributable to shareholder: $420.2 million, an increase of $43.7 million (11.6%).
| • | The increase was mainly due to: |
| ¡ | $160.3 million favourable variance in gain or loss on valuation and translation of financial instruments; |
| ¡ | $63.6 million increase in adjusted operating income; and |
| ¡ | $4.9 million decrease in financial expenses. |
Partially offset by:
| ¡ | $63.9 million increase in income taxes; |
| ¡ | $40.7 million decrease in income from discontinued operations; |
| ¡ | $39.7 million increase in depreciation and amortization charges; |
| ¡ | $38.7 million increase in restructuring of operations, impairment of assets and other items; and |
| ¡ | $2.5 million unfavourable variance in gain or loss on debt refinancing. |
50
Table of Contents
2014/2013 Fourth Quarter Comparison
Customer statistics
Revenue-generating units – 25,100 (0.5%) increase in the fourth quarter of 2014, compared with an increase of 46,700 (0.9%) in the same period of 2013.
Cable television services– The combined customer base for cable television services decreased by 14,000 (0.8%) in the fourth quarter of 2014, compared with a decrease of 5,300 (0.3%) in the fourth quarter of 2013.
| • | The number of subscribers to illico Digital TV stood at 1,561,700 as at the end of the fourth quarter of 2014, an increase of 12,700 (0.8%) during the quarter, compared with an increase of 13,800 (0.9%) in the fourth quarter of 2013. |
| • | The customer base for analog cable television services decreased by 26,700 (10.8%) in the fourth quarter of 2014, compared with a decrease of 19,100 customers (6.1%) in the fourth quarter of 2013, primarily as a result of customer migration to illico Digital TV. |
Cable Internet access services – The number of subscribers to cable Internet access services stood at 1,537,500 as at the end of the fourth quarter of 2014, an increase of 3,700 (0.2%) in the quarter, compared with an increase of 19,300 (1.3%) during the fourth quarter of 2013.
Cable telephony services– The number of cable telephony lines stood at 1,349,000 as at the end of the fourth quarter of 2014, a decrease of 7,000 (0.5%) in the quarter, compared with an increase of 7,500 (0.6%) in the same quarter of 2013.
Mobile telephony services– As of December 31, 2014, 632,800 lines were activated on our mobile telephony services, an increase of 42,400 (7.2%) in the quarter, compared with an increase of 25,200 (5.3%) in the same quarter of 2013.
2014/2013 Fourth Quarter Analysis of Results
Revenues: $730.2 million, an increase of $37.1 million (5.4%) compared with the fourth quarter of 2013.
Revenues from cable television services decreased by $8.1 million (2.9%) to $268.2 million mainly due to a lower combined customer base for cable television services and a decrease in revenues from pay television, video-on-demand and pay-per-view services. These decreases were partially offset by higher rental revenues from our set-top boxes and higher revenues per customer.
Revenues from Internet access services increased by $12.3 million (5.9%) to $222.2 million. The favorable variance was mainly due to increased usage, higher revenues per customer, increasing sales to third-party Internet service providers and customer growth.
Revenues from cable telephony service increased by $1.9 million (1.6%) to $120.6 million. This increase was mainly due to price increases in basic services and customer growth, partially offset by a decrease in long distance call revenues.
Revenues from mobile telephony services increased by $23.9 million (40.1%) to $83.5 million, essentially due to customer growth.
Revenues from business solutions increased by $1.0 million (6.3%) to $16.8 million.
Revenues from equipment sales increased by $5.8 million (54.2%) to $16.5 million, mainly due to mobile devices.
Other revenues remained stable in the fourth quarter at $2.5 million.
Monthly ARPU: $129.36 in the fourth quarter of 2014, compared with $121.22 in the same period of 2013, an increase of $8.14 (6.7%). This growth is mainly explained by an increase in revenues from mobile telephony and Internet access services, as detailed above.
Adjusted operating income: $343.9 million in the fourth quarter of 2014, an increase of $21.6 million (6.7%) compared to the same quarter of 2013.
51
Table of Contents
| • | This increase was primarily due to: |
| ¡ | revenue increase, as detailed above; |
| ¡ | non-recurring adjustment to programming fees; and |
| ¡ | net decrease in employee costs due to higher capitalization to fixed assets and intangible assets. |
Partially offset by:
| ¡ | increase in losses on sale of mobile devices. The average acquisition cost per new mobile subscriber is $499. |
Purchase of goods and services, expressed as a percentage of revenues: Stable at 40.8% in 2014, compared with 40.7% in 2013.
Employee costs, expressed as a percentage of revenues: 12.1% in 2014, compared with 12.8% in 2013.
| • | Employee costs as a proportion of revenues decreased, primarily due to increase in employee costs capitalized to fixed assets and intangible assets, mostly related to the modernization and expansion of our wireline and wireless networks. |
Depreciation and amortization charge: $158.2 million, an increase of $12.8 million (8.8%), compared with 2013.
| • | The increase was mainly due to: |
| ¡ | increase in illico Digital TV set-top boxes related to our rental program; |
| ¡ | increase in fixed assets, mostly related to cable Internet access services and to the upgrade and expansion of our wireline and wireless networks; and |
| ¡ | increase in assets related to our wireless LTE network launched in September 2014. |
Financial expenses(primarily comprised of interest on long-term debt): $43.4 million in 2014, an increase of $2.0 million (4.8%) compared with 2013.
| • | The increase was mainly due to: |
| ¡ | $1.0 million increase in interest on long-term debt, mainly due to higher indebtedness, partially offset by lower interest rates on our indebtedness; and |
| ¡ | $1.5 million decrease in net dividend income from affiliated corporations and parent corporation, due to changes in tax consolidation arrangements. |
Partially offset by:
| ¡ | $0.6 million decrease in the interest cost on defined benefit plans. |
Gain or loss on valuation and translation of financial instruments: $5.0 million loss in the fourth quarter of 2014, compared with a $17.2 million loss in the same quarter of 2013, a favourable variance of $12.2 million.
| • | The positive variance was mainly due to the variance in the fair value of early settlement options caused by fluctuations in valuation assumptions, including interest rates and credit premiums implicit in the adjusted prices of the underlying instruments. |
Restructuring of operations, impairment of assets and other special items: $38.5 million expense recorded in the fourth quarter of 2014, compared with $0.8 million in the same quarter of 2013.
| • | The increase of $37.7 million was mainly due to a $34.3 million charge recorded in 2014 as a result of an unfavourable judgment against the Corporation in a legal action. The Corporation intends to appeal this judgment. |
Income tax expense: $29.2 million expense (effective tax rate of 29.6 %) in the fourth quarter of 2014, compared with $0.7 million recovery (effective tax rate of -0.6%) in the same quarter of 2013.
| • | The unfavourable variance of $29.9 million was mainly due to: |
| ¡ | $24.2 million related to changes in tax consolidation arrangements with our parent corporation and affiliated corporations; and |
| ¡ | $9.4 million related to other non-taxable or non-deductible items, and other items. |
52
Table of Contents
Partially offset by:
| ¡ | $5.1 million related to the decrease in taxable income. |
Net income attributable to shareholder: $69.5 million, a decrease of $48.9 million (41.3%).
| • | The decrease was mainly due to: |
| ¡ | $37.7 million increase in restructuring of operations, impairment of assets and other special items; |
| ¡ | $29.9 million increase in income taxes expense; |
| ¡ | $12.8 million increase in depreciation and amortization charges; |
| ¡ | $2.0 million increase in financial expenses; and |
| ¡ | $0.3 million decrease in income from discontinued operations. |
Partially offset by:
| ¡ | $21.6 million increase in adjusted operating income; and |
| ¡ | $12.2 million favourable variance in gain or loss on valuation and translation of financial instruments. |
2013/2012 Year Comparison
Customer Statistics
Revenue-generating units – As of December 31, 2013, the total number of revenue-generating units stood at 5,183,900, an increase of 164,800 (3.3%) in 2013, compared with an increase of 261,400 (5.5%) in 2012.
Cable television services– Our combined customer base for cable television services decreased by 29,900 (1.6%) in 2013, compared with a decrease of 6,500 (0.4%) in 2012. As of December 31, 2013, our cable network household penetration rate (number of subscribers as a proportion of the 2,742,500 total homes passed) was 66.5%, compared with 68.7% a year earlier.
| • | The number of subscribers to illico Digital TV stood at 1,531,400 as at the end of 2013, an increase of 46,800 (3.2%) in 2013, compared with an increase of 83,800 (6.0%) in 2012. As of December 31, 2013, 83.9% of our cable television customers were subscribers to our illico Digital TV services, compared with 80.0% as of December 31, 2012. As of December 31, 2013, illico Digital TV had a household penetration rate of 55.8%, compared with 55.0% as of December 31, 2012. |
| • | The customer base for analog cable television services decreased by 76,700 (20.7%) in 2013, compared with a decrease of 90,300 customers (19.6%) in 2012, mainly as a result of customer migration to illico Digital TV services. |
Cable Internet access services– The number of subscribers to cable Internet access services stood at 1,506,000 as at the end of 2013, an increase of 62,000 (4.3%) in 2013, compared with an increase of 84,400 (6.2%) in 2012. As of December 31, 2013, our cable Internet access services household penetration rate was 54.9%, compared with 53.5% as of December 31, 2012.
Cable telephony services– The number of cable telephony lines stood at 1,348,500 as at the end of 2013, an increase of 32,200 (2.4%) in 2013, compared with an increase of 70,400 (5.7%) in 2012. As of December 31, 2013, the cable telephony services household penetration rate was 49.2%, compared with 48.7% as of December 31, 2012.
Mobile telephony services– As of December 31, 2013, 504,300 lines were activated on our mobile telephony network, an increase of 100,500 (24.9%) in 2013, compared with an increase of 113,100 (38.9%) in 2012.
2013/2012 Analysis of Results
Revenues: $2,711.8 million, an increase of $114.0 million (4.4%) compared with 2012.
Revenues from cable television services increased by $10.9 million (1.0%) to $1,090.3 million. This increase was primarily due to higher set-top box rental revenues, the migration of customers from analog to digital services, increase in pay-per-view and pay television services and an increase in subscribers to our High Definition packages.
Revenues from Internet access services increased by $45.9 million (5.9%) to $818.4 million. The improvement was mainly due to customer growth and increasing sales to third party Internet service providers.
53
Table of Contents
Revenues from cable telephony services increased by $18.9 million (4.2%) to $473.8 million. This increase was mainly due to customer growth and price increases.
Revenues from mobile telephony services increased by $48.9 million (28.5%) to $220.6 million, essentially due to customer growth.
Revenues from business solutions decreased by $1.4 million (2.2%) to $63.5 million.
Revenues from equipment sales decreased by $6.9 million (15.9%) to $36.5 million.
Other revenues decreased in 2013 at $8.8 million.
Monthly combined ARPU: $118.03 in 2013, compared with $111.57 in 2012, an increase of $6.46 (5.8%). This growth is mainly explained by an increase in customers subscribing to two or more services and price increases in television, Internet and cable telephony services.
Adjusted operating income: $1,284.7 million in 2013, an increase of $81.0 million (6.7%).
| • | This increase was primarily due to: |
| ¡ | revenue increase, as detailed above; and |
| ¡ | decrease in purchase of goods and services as a percentage of revenues. |
Partially offset by:
| ¡ | increase in losses on sale of mobile devices. The average acquisition cost per new mobile subscriber was $462. |
Purchase of goods and services, expressed as a percentage of revenues: 39.8% in 2013, compared with 40.6% in 2012.
| • | Purchase of goods and services expenses as a proportion of revenues decreased, primarily due to: |
| ¡ | fixed-cost base, which does not fluctuate in sync with revenue growth; |
| ¡ | positive impact of an adjustment to licence fees in order to match the CRTC’s billing period; and |
| ¡ | decrease in marketing and distribution expenses. |
Employee costs, expressed as a percentage of revenues: stable at 12.8% in 2013, compared with 13.0% in 2012.
Depreciation and amortization charge: $561.7 million, an increase of $76.3 million (15.7%) compared with 2012.
| • | The increase was mainly due to: |
| ¡ | increase in fixed assets, mostly related to cable Internet access services and to the upgrade of our wireline network; and |
| ¡ | increase in illico Digital TV set-top boxes related to our rental program. |
Financial expenses(primarily comprised of interest on long-term debt): $174.1 million, a decrease of $5.3 million (3.0%) compared with 2012.
| • | The decrease was mainly due to: |
| ¡ | $3.6 million decrease in interest expenses, mainly due to lower interest rates on our indebtedness; and |
| ¡ | $1.0 million increase in net dividend income from affiliated corporations and parent corporation, due to changes in tax consolidation arrangements. |
Gain or loss on valuation and translation of financial instruments: Loss of $163.7 million in 2013, compared with a gain of $75.7 million in 2012.
| • | The unfavourable variance of $239.4 million was mainly due to: |
| ¡ | the variance in the fair value of early settlement options due to fluctuations in the valuation assumptions, including interest rates and credit premiums implicit in the adjusted prices of the underlying instruments; and |
| ¡ | The reversal of the fair value of early settlement options on the Senior Notes redeemed on July 2, 2013. |
Restructuring of operations and other special items: $0.7 million expense recorded in 2013, compared with $0.5 million in 2012.
54
Table of Contents
Income tax expense: $29.4 million (effective tax rate of 8.1%) in 2013, compared with $115.8 million (effective tax rate of 18.6%) in 2012.
| • | The decrease of $86.4 million was mainly due to: |
| ¡ | $68.9 million related to the decrease in taxable income; and |
| ¡ | $18.1 million related to changes in tax consolidation arrangements with our parent corporation and affiliated corporations. |
Partially offset by:
| ¡ | $0.6 million related to other non-taxable or non-deductible items, and other items. |
Net income attributable to shareholder: $376.5 million, a decrease of $137.2 million (26.7%).
| • | The decrease was mainly due to: |
| ¡ | $239.4 million unfavourable variance in gain or loss on valuation and translation of financial instruments; |
| ¡ | $76.3 million increase in depreciation and amortization charges; and |
| ¡ | $26.5 million unfavourable variance in gain or loss on debt refinancing. |
Partially offset by:
| ¡ | $86.4 million decrease in income taxes; |
| ¡ | $81.0 million increase in adjusted operating income; |
| ¡ | $32.6 million increase in income from discontinued operations; and |
| ¡ | $5.3 million decrease in financial expenses. |
55
Table of Contents
CASH FLOW AND FINANCIAL POSITION
This section provides an analysis of sources and uses of cash flows, as well as a financial position analysis as of the balance sheet date. This section should be read in conjunction with the discussions on trends under “Trend Information” above and on the Corporation’s financial risks under “Financial Instruments and Financial Risk Management” below.
Operating activities
2014 Financial Year
Cash flows provided by operating activities: $1,106.5 million in 2014, compared with $1,058.3 million in 2013, an increase of $48.2 million (4.6%).
| • | The increase was mainly due to: |
| ¡ | $63.6 million increase in adjusted operating income; |
| ¡ | $45.7 million favourable variance in non-cash balances related to operations, mainly due to a $83.5 million favourable a net variation in accounts payable, accrued charges and provisions; partially offset by a $70.0 million unfavourable net variation in income taxes payable; and |
| ¡ | $5.6 million favourable variance on other items. |
Partially offset by:
| ¡ | $38.8 million increase in restructuring of operations, impairment of assets and other special items; and |
| ¡ | $28.0 million increase in current income tax expenses. |
Working capital:Negative $332.3 million as of December 31, 2014, compared with negative $195.4 million as of December 31, 2013. The difference mainly reflects the reclassification to short-term liabilities of our US$175 million Senior Notes due in December 2015 and a $34.3 million provision recorded due to an unfavourable judgment against the Corporation; partially offset by the impact of the settlement of the derivative financial instruments in January 2014.
2013 Financial Year
Cash flows provided by operating activities: $1,058.3 million in 2013, compared with $1,147.8 million in 2012, a decrease of $89.5 million (7.8%).
| • | The decrease was mainly due to: |
| ¡ | $136.2 million unfavourable variance in non-cash balances related to operations, mainly due to a $26.1 million increase in inventories, and a $129.2 million decrease in accounts payable and accrued charges; partially offset by a $18.8 million increase in income taxes payable; and |
| ¡ | $38.4 million increase in current income tax expenses. |
Partially offset by:
| ¡ | $81.0 million increase in adjusted operating income; and |
| ¡ | $6.4 million decrease in cash financial expense, due to a lower average interest rate on our indebtedness. |
Working capital:Negative $195.4 million as of December 31, 2013, compared with negative $242.9 million as of December 31, 2012. The difference mainly reflects an increase in cash and cash equivalents and a decrease in accounts payable and accrued charges; partially offset by the reclassification to short-term liabilities of derivative financial instruments due in January 2014 and an increase in income taxes payable.
56
Table of Contents
Investing Activities
2014 Financial Year
Additions to fixed assets: $606.0 million in 2014, compared with $530.9 million in 2013. The increase is mainly explained by investments made on our recently-launched wireless LTE network and our Internet infrastructure.
Additions to intangible assets: $304.5 million in 2014, compared with $67.6 million in 2013. In 2014, the Corporation acquired 700 MHz operating licenses, for which total payments of $217.4 million were made during the year ($15.9 million in 2013). The variance is also due to various software upgrade projects and licence purchases made in 2014, in addition to the development of our LTE technology platform.
Proceeds from disposal of assets: $5.5 million in 2014, compared with $12.8 million in 2013. The decrease of $7.7 million is mainly explained by significant disposals recorded in 2013.
2013 Financial Year
Additions to fixed assets: $530.9 million in 2013, compared with $670.2 million in 2012. The variance is mainly due to a reduction in overall expenditures on network infrastructure following the significant investments made in previous years.
Additions to intangible assets: $67.6 million in 2013, compared with $75.6 million in 2012.
Net proceeds from business disposal:$50.3 million in 2013 from the disposal of our specialized web sites Jobboom and Réseau Contact.
Proceeds from disposal of assets: $12.8 million in 2013, compared with $7.2 million in 2012. The increase of $5.6 million is mainly explained by significant disposals recorded in 2013.
Financing Activities
2014 Financial Year
Consolidated debt(long-term debt plus bank borrowings): $525.4 million increase in 2014.
| • | Summary of debt increases in 2014: |
| ¡ | issuance, on April 9, 2014, of US$600.0 million aggregate principal amount of Senior Notes for net proceeds of $654.5 million, net of financing fees of $7.8 million. The Notes bear interest at 5.375% per annum and mature on June 15, 2024; |
| ¡ | $145.1 million unfavourable impact of exchange rate fluctuations. This increase in long-term debt is offset by a decrease in the liability (or an increase in the asset) related to cross-currency interest rate swaps, recorded under “Derivative financial instruments”; and |
| ¡ | $8.2 million adjustment to record the change in the fair value of long-term debt related to hedged interest rate risk. |
| • | Summary of debt reductions during the same period: |
| ¡ | redemption and retirement, on April 24, 2014, of US$260.0 million aggregate principal amount of 9.125% Senior Notes due in April 2018; and |
| ¡ | repayment of $10.7 million of borrowings under a bank credit facility. |
Assets and liabilities related to derivative financial instruments: Net asset of $111.2 million as of December 31, 2014, compared with a net liability of $163.9 million as of December 31, 2013. This $275.1 million favourable variance was due primarily to the settlement of hedging contracts in January 2014 and to the favourable net impact of exchange rate and interest rate fluctuations on the value of derivative financial instruments.
Dividends: Net increase of $48.1 million in cash distributions to our parent corporation in 2014 compared with 2013.
57
Table of Contents
2013 Financial Year
Consolidated debt(long-term debt plus bank borrowings): $272.0 million increase in 2013.
| • | Summary of debt increases in 2013: |
| ¡ | issuance, on June 17, 2013, of $400.0 million aggregate principal amount of Senior Notes for net proceeds of $394.8 million, net of financing fees of $5.2 million. The Notes bear interest at 5.625% per annum and mature on June 15, 2025; |
| ¡ | $164.4 million increase in debt due to an unfavourable variance in the fair value of early redemption options, resulting mainly from fluctuations in the valuation assumptions, including interest rate and credit premium implicit in the adjusted prices of the underlying instruments, in addition to the elimination of the early redemption option of the 9.125% Senior Notes that were redeemed on July 2, 2013; and |
| ¡ | $111.1 million unfavourable impact of exchange rate fluctuations. This increase in long-term debt is offset by a decrease in the liability (or an increase in the asset) related to cross-currency interest rate swaps, recorded under “Derivative financial instruments”. |
| • | Summary of debt reductions during the same period: |
| ¡ | redemption and retirement on July 2, 2013 of US$380.0 million aggregate principal amount of 9.125% Senior Notes due in April 2018; and |
| ¡ | repayment of $10.7 million of borrowings under a bank credit facility. |
| • | In June 2013, the Corporation amended its $575.0 million revolving credit facility to extend the maturity date to July 2018 and amended certain terms and conditions. |
Assets and liabilities related to derivative financial instruments: Net liability of $163.9 million as of December 31, 2013, compared with a net liability of $231.2 million as of December 31, 2012. This $67.3 million favourable variance was due primarily to the favourable net impact of exchange rate and interest rate fluctuations on the value of derivative financial instruments partially offset by the unwinding of hedging contracts in an asset position in connection with the redemption on July 2, 2013 of US$380.0 million aggregate principal amount of our outstanding 9.125% Senior Notes.
Dividends:Net decrease of $398.1 million in cash distributions to our parent corporation in 2013 compared with 2012.
58
Table of Contents
Financial Position as of December 31, 2014
Net available liquid assets: $915.6 million for the Corporation and its wholly owned subsidiaries, consisting of $340.9 million in cash and cash equivalents and $574.7 million in unused availabilities under credit facilities.
Uses of Liquidity and Capital Resources
Our principal liquidity and capital resource requirements consist of:
| • | capital expenditures to maintain and upgrade our network in order to support the growth in our customer base and the launch and expansion of new or additional services, including the expansion and upgrade of our wireless network; |
| • | servicing and repayment of debt; |
| • | tax consolidation arrangements; and |
| • | distributions to our shareholder. |
Capital expenditures: $910.5 million in 2014, an increase of $312.0 million (52.1%) compared with 2013.
| • | The increase was mainly due to: |
| ¡ | The acquisition of 700 MHz operating licenses, for which total payments of $217.4 million were made during the year, and investments made on our recently-launched wireless LTE network. |
Table 3
Additions to fixed and intangible assets
(in millions of dollars)
| 2014 | 2013 | 2012 | ||||||||||
Customer premises equipment | $ | 220.5 | $ | 231.5 | $ | 247.1 | ||||||
Scalable infrastructure | 233.2 | 162.2 | 235.6 | |||||||||
Line extensions | 59.1 | 52.9 | 54.5 | |||||||||
Upgrade/rebuild | 74.6 | 66.1 | 107.0 | |||||||||
Support capital and other | 323.1 | 85.8 | 101.7 | |||||||||
|
|
|
|
|
| |||||||
Total additions to fixed and intangible assets | $ | 910.5 | $ | 598.5 | $ | 745.9 | ||||||
|
|
|
|
|
| |||||||
59
Table of Contents
Consolidated long-term debt (long-term debt plus bank borrowings): $2,924.5 million as of December 31, 2014, an increase of $525.4 million; $275.1 million favourable net variance in assets and liabilities related to derivative financial instruments (see “Financing Activities” above).
As of December 31, 2014, mandatory debt repayments on the Corporation’s long-term debt in the coming years are as follows:
Table 4
Minimum principal payments on Videotron’s long-term debt
12 months ending December 31
(in millions of dollars)
2015 | $ | 213.7 | ||
2016 | 10.7 | |||
2017 | 10.7 | |||
2018 | 91.8 | |||
2019 | – | |||
2020 and thereafter | 2,624.1 | |||
|
| |||
Total | $ | 2,951.0 | ||
|
|
The weighted average term of Videotron’s consolidated debt was approximately 7.3 years as of December 31, 2014 (6.9 years as of December 31, 2013). The debt consisted of approximately 85.0% fixed-rate debt (83.6% as of December 31, 2013) and 15.0% floating-rate debt (16.4% as of December 31, 2013).
Videotron’s management believes that cash flows from continuing operations and available sources of financing should be sufficient to cover committed cash requirements for capital investments, including investments required for our wireline and wireless networks, working capital, interest payments, debt repayments, pension plan contributions, and dividends in the future. Videotron has access to cash flows generated by its subsidiaries through dividends and cash advances paid by its wholly owned subsidiaries. The Corporation believes it will be able to meet future debt maturities, which are fairly staggered over the coming years.
Pursuant to their financing agreements, the Corporation is required to maintain certain financial ratios. The key indicators listed in these financing agreements include debt service coverage ratio and debt ratio(long-term debt over adjusted operating income). As of December 31, 2014, the Corporation was in compliance with all required financial ratios.
Servicing and Repayment of Debt: Cash interest payments of $168.2 million in 2014, a decrease of $0.2 million compared with 2013.
Purchase of Shares of Quebecor Media and Servicing of Subsidiary Subordinated Loan: Unlike corporations in the United States, corporations in Canada are not permitted to file consolidated tax returns. As a result, we have entered into certain transactions described below that have the effect of using tax losses within the Quebecor Media group.
Tax Consolidation Arrangements with the Parent Corporation:On September 20, 2013, the Corporation contracted a subordinated loan of $3.25 billion from Quebecor Media Inc., bearing interest at a rate of 10.75%, payable every six months on June 20 and December 20, and maturing on September 20, 2043. On the same day, the Corporation invested the total proceeds of $3.25 billion into 3,250,000 preferred shares, Series B, of9101-0835 Québec Inc., a subsidiary of Quebecor Media Inc. These shares carry the right to receive an annual dividend of 10.85%, payable semi-annually.
On December 27, 2013, 9101-0835 Québec Inc., a subsidiary of Quebecor Media Inc., redeemed 2,600,000 preferred shares, Series B, for a total cash consideration of $2.6 billion, and settled cumulative unpaid dividends of $5.4 million. On the same day, the Corporation used the total proceeds of $2.6 billion to repay part of its subordinated loan contracted from Quebecor Media Inc.
On October 28, 2014, 9101-0835 Québec Inc., a subsidiary of Quebecor Media Inc., redeemed 1,200,000 preferred shares, Series B, for a total cash consideration of $1.2 billion, and settled cumulative unpaid dividends of $46.4 million. On the same day, the Corporation used the total proceeds of $1.2 billion to repay part of its subordinated loan contracted from Quebecor Media Inc.
60
Table of Contents
Tax Consolidation Arrangements with Affiliated Corporations: On October 31, 2012, Vidéotron Infrastructures inc., a wholly owned subsidiary of the Corporation, issued a subordinated loan of $800.0 million to Le Superclub Vidéotron Ltée, now a wholly owned subsidiary of Quebecor Media Inc., bearing interest at a rate of 11.00% payable every 6 months on June 20 and December 20 and maturing on October 31, 2027. On the same day, Vidéotron Infrastructures inc. issued 800,000 redeemable preferred shares, Class G to Le Superclub Vidéotron Ltée for a total cash consideration of $800.0 million. These shares carry the right to receive an annual dividend of 11.25%, payable semi-annually.
On January 21, 2013, Vidéotron Infrastructures inc. redeemed from Le Superclub Vidéotron Ltée 720,000 preferred shares, Class G, for a total cash consideration of $720.0 million, and settled cumulative unpaid dividends of $7.1 million. On the same day, Le Superclub Vidéotron Ltée used the total proceeds of $720.0 million to repay a portion of the subordinated loan contracted from Vidéotron Infrastructures Inc.
On October 18, 2013, Vidéotron Infrastructures inc. redeemed from Le Superclub Vidéotron Ltée 80,000 preferred shares, Class G, for a total cash consideration of $80.0 million, and settled cumulative unpaid dividends of $3.0 million. On the same day, Le Superclub Vidéotron Ltée used the total proceeds of $80.0 million to repay the outstanding portion of the subordinated loan contracted from Vidéotron Infrastructures Inc.
The above transactions were carried out for tax consolidation purposes of Quebecor Media Inc. and its subsidiaries, on terms equivalent to those that prevail on an arm’s length basis and accounted for at the consideration agreed between parties.
Distributions to our shareholder: There were no dividends paid to our shareholder, Quebecor Media, in the fourth quarter of 2014 and 2013. For the year ended December 31, 2014, we distributed $410.0 million in dividends to our shareholder, compared with total cash distributions of $361.9 million in 2013. We expect to make cash distributions to our shareholder in the future, as determined by our Board of Directors, and within the limits set by the terms of our indebtedness and applicable laws.
AWS-3 and 2500 MHz wireless spectrum auction: In January 2015, the Corporation entered into new unsecured on demand credit facilities, under which letters of credit were issued and filed with Industry Canada as pre-auction financial deposits in respect to its application to participate to the 2500 MHz and AWS-3 spectrum auctions. Under Industry Canada’s published rules respecting restrictions on communications during the auction process, it is strictly forbidden for the Corporation to disclose the amount of the letters of credit, which can be withdrawn by the Corporation at any time prior to the auction commencement.
On March 6, 2015, the Corporation announced that it had acquired four 30 MHz licences in the auction forAWS-3 commercial mobile spectrum at a total price of $31.8 million. The process will resume on April 14, 2015 with the auction for spectrum in the 2500 MHz band.
61
Table of Contents
Analysis of Consolidated Balance Sheets as of December 31, 2014
Table 5
Consolidated Balance Sheets of Videotron
Analysis of significant variances between December 31, 2014 and December 31, 2013
(in millions of dollars)
| December 31, 2014 | December 31, 2013 | Variance | Variance detail | |||||||||||
Assets | ||||||||||||||
Cash and cash equivalents | $ | 342.8 | $ | 322.5 | 20.3 | Cash inflows provided by operating activities less outflows related to investing and financing activities | ||||||||
Investments | 1,080.0 | 2,280.0 | (1,200.0 | ) | Redemption of preferred shares of an affiliated corporation for tax consolidation purposes | |||||||||
Fixed assets | 3,000.8 | 2,892.1 | 108.7 | Additions of fixed assets related to our LTE network, Internet infrastructure and illico set-top boxes, net of depreciation | ||||||||||
Intangible assets | 830.6 | 640.0 | 190.6 | Acquisition of 700 MHz spectrum licences and software and licences, partially offset by amortization of AWS spectrum licences | ||||||||||
Liabilities | ||||||||||||||
| Provisions | 45.7 | 10.8 | 34.9 | Provision related to an unfavourable judgement in a legal action | ||||||||||
Long-term debt, including short-term portion | 2,924.5 | 2,399.1 | 525.4 | See “Financing Activities” above | ||||||||||
Subordinated loan from parent corporation | 1,080.0 | 2,280.0 | (1,200.0 | ) | Partial repayment of loan from parent corporation for tax consolidation purposes | |||||||||
Derivative financial instruments asset (liability)(1) | 111.2 | (163.9 | ) | (275.1 | ) | See “Financing Activities” above | ||||||||
| Other liabilities | 86.9 | 53.0 | 33.9 | Increase due to defined benefit plans re-measurement loss | ||||||||||
| 1 | Long-term assets less current and long-term liabilities |
62
Table of Contents
ADDITIONAL INFORMATION
Contractual Obligations and Other Commercial Commitments
As of December 31, 2014, material contractual obligations included: capital repayment and interest payments on long-term debt, obligations related to derivative financial instruments, less estimated future receipts on derivative financial instruments, operating lease arrangements and capital asset purchases and other commitments. Table 6 below shows a summary of our contractual obligations.
Table 6
Contractual obligations of the Corporation as of December 31, 2014
(in millions of dollars)
| Total | Less than 1 year | 1-3 years | 3-5 years | 5 years or more | ||||||||||||||||
Contractual obligations1 | ||||||||||||||||||||
Accounts payable and accrued charges | $ | 412.9 | $ | 412.9 | $ | – | $ | – | $ | – | ||||||||||
Amounts payable to affiliated corporations | 49.4 | 49.4 | – | – | – | |||||||||||||||
Bank credit facility | 37.5 | 10.7 | 21.4 | 5.4 | – | |||||||||||||||
6 3/8% Senior Notes due December 15, 2015 | 203.0 | 203.0 | – | – | – | |||||||||||||||
9 1/8% Senior Notes due April 15, 2018 | 86.4 | – | – | 86.4 | – | |||||||||||||||
7 1/8% Senior Notes due January 15, 2020 | 300.0 | – | – | – | 300.0 | |||||||||||||||
6 7/8% Senior Notes due July 15, 2021 | 300.0 | – | – | – | 300.0 | |||||||||||||||
5% Senior Notes due July 15, 2022 | 928.1 | – | – | – | 928.1 | |||||||||||||||
5 3/8% Senior Notes due June 15, 2024 | 696.0 | – | – | – | 696.0 | |||||||||||||||
5 5/8% Senior Notes due June 15, 2025 | 400.0 | – | – | – | 400.0 | |||||||||||||||
Interest payments2 | 1,201.5 | 136.2 | 309.9 | 296.4 | 459.0 | |||||||||||||||
Derivative financial instruments3 | (109.9 | ) | 7.8 | 55.1 | (10.4 | ) | (162.4 | ) | ||||||||||||
Operating lease commitments | 176.3 | 36.4 | 50.3 | 38.0 | 51.6 | |||||||||||||||
Services and capital equipment commitments | 399.6 | 111.5 | 147.6 | 44.5 | 96.0 | |||||||||||||||
|
|
|
|
|
|
|
|
|
| |||||||||||
Total contractual cash obligations | $ | 5,080.8 | $ | 967.9 | $ | 584.3 | $ | 460.3 | $ | 3,068.3 | ||||||||||
|
|
|
|
|
|
|
|
|
| |||||||||||
| 1 | Excludes obligations under subordinated loans due to Quebecor Media, our parent corporation; the proceeds of which are used to invest in preferred shares of an affiliated corporation for tax consolidation purposes for the Quebecor Media group. |
| 2 | Estimated interest payable on long-term debt, based on interest rates, hedging of interest rates and hedging of foreign exchange rates as of December 31, 2014. |
| 3 | Estimated future receipts, net of disbursements, related to foreign exchange hedging using derivative financial instruments. |
Material commitments included in Table 6
The Corporation leases sites for its LTE mobile network under operating lease contracts, and has contracted long-term commitments to acquire equipment for a total future disbursement of $184.3 million.
In May 2013, the Corporation and Rogers have announced a 20-year agreement to build out and operate a shared LTE mobile network in the Province of Québec and in the Ottawa Region. As of December 31, 2014, a total commitment of $193.3 million was outstanding under this agreement.
Pension plan contributions
The expected employer contributions to the Corporation’s defined benefit pension plans and postretirement benefits plans will be $22.7 million in 2015 (contributions of $24.0 million were paid in 2014).
63
Table of Contents
Related Party Transactions
In addition to the related party transactions disclosed elsewhere in this annual report, the Corporation entered into the following transactions with affiliated corporations and the parent corporation. These transactions were accounted for at the consideration agreed between parties:
Table 7
Related party transactions
(in millions of dollars)
| 2014 | 2013 | 2012 | ||||||||||
Ultimate parent and parent corporation : | ||||||||||||
Revenues | $ | 0.7 | $ | 0.5 | $ | 0.6 | ||||||
Purchase of goods and services | 7.6 | 8.5 | 6.5 | |||||||||
Operating expenses recovered | (0.7 | ) | (4.2 | ) | (1.2 | ) | ||||||
Affiliated corporations : | ||||||||||||
Revenues | 10.3 | 11.0 | 13.1 | |||||||||
Purchase of goods and services | 81.1 | 73.2 | 75.6 | |||||||||
Operating expenses recovered | (0.7 | ) | (3.4 | ) | (2.5 | ) | ||||||
Off-Balance Sheet Arrangements
Guarantees
In the normal course of business, the Corporation enters into numerous agreements containing guarantees, including the following:
| • | Operating Leases |
The Corporation has guaranteed a portion of the residual values of certain assets under operating leases for the benefit of the lessor. Should the Corporation terminate these leases prior to term (or at the end of the lease terms) and should the fair value of the assets be less than the guaranteed residual value, then the Corporation must, under certain conditions, compensate the lessor for a portion of the shortfall. As of December 31, 2014, the maximum exposure with respect to the guarantees was $13.0 million and no liability has been recorded in the consolidated balance sheet.
| • | Business and asset disposals |
In the sale of all or part of a business or an asset, in addition to possible indemnification relating to failure to perform covenants and breach of representations or warranties, the Corporation may agree to indemnify against claims related to the past conduct of the business. Typically, the term and amount of such indemnification will be limited by the agreement. The nature of these indemnification agreements prevents the Corporation from estimating the maximum potential liability it could be required to pay to guaranteed parties. The Corporation has not accrued any amount with respect of these items in the consolidated balance sheets.
| • | Outsourcing Companies and Suppliers |
In the normal course of its operations, the Corporation enters into contractual agreements with outsourcing companies and suppliers. In some cases, the Corporation agrees to provide indemnifications in the event of legal procedures initiated against them. In other cases, the Corporation provides indemnification to counterparties for damages resulting from the outsourcing companies and suppliers. The nature of the indemnification agreements prevents the Corporation from estimating the maximum potential liability it could be required to pay. No amount has been accrued in the consolidated balance sheet with respect to these indemnifications.
64
Table of Contents
| • | Guarantees Related to our Bank Credit Facilities |
The bank credit facilities provide for a $575.0 million secured revolving credit facility that matures in July 2018 and a $75.0 million secured export financing facility providing for a term loan that matures in June 2018. The revolving credit facility bears interest at Bankers’ acceptance rate, Canadian prime rate or U.S. prime rate, plus a margin, depending on the Corporation’s leverage ratio. Advances under the export financing facility bear interest at Bankers’ acceptance rate plus a margin. The bank credit facilities are secured by a first ranking hypothec on the universality of all tangible and intangible assets, current and future, of the Corporation and most of its wholly owned subsidiaries. As of December 31, 2014, the bank credit facilities of the Corporation were secured by assets with a carrying value of $6,238.3 million ($7,013.7 million in 2013). The bank credit facilities contain covenants such as maintaining certain financial ratios, limitations on the Corporation’s ability to incur additional indebtedness, pay dividends and make other distributions. As of December 31, 2014 and 2013, no amount was drawn on the revolving credit facility. As of December 31, 2014, $37.5 million ($48.2 million in 2013) was outstanding on the export financing facility.
Financial instruments and financial risk management
The Corporation’s financial risk management policies have been established in order to identify and analyze the risks faced by the Corporation, to set appropriate risk limits and controls, and to monitor risks and adherence to limits. Risk management policies are reviewed regularly to reflect changes in market conditions and in the Corporation’s activities.
The Corporation uses a number of financial instruments, mainly cash and cash equivalents, accounts receivable, accounts payable and accrued charges, provisions, long-term debt, and derivative financial instruments. As a result of its use of financial instruments, the Corporation is exposed to credit risk, liquidity risk and market risks relating to foreign exchange fluctuations and interest rate fluctuations.
In order to manage its foreign exchange and interest rate risks, the Corporation uses derivative financial instruments (i) to set in Canadian dollars future payments on debts denominated in U.S. dollars (interest and principal) and certain purchases of inventories and other capital expenditures denominated in a foreign currency, (ii) to achieve a targeted balance of fixed- and floating-rate debts and (iii) to lock-in the value of certain derivative financial instruments through offsetting transactions. The Corporation does not intend to settle its derivative financial instruments prior to their maturity as none of these instruments is held or issued for speculative purposes.
Description of Derivative Financial Instruments
Table 8
Foreign exchange forward contracts as of December 31, 2014
(in millions of dollars)
| Maturity | Canadian dollar average exchange rate per one U.S. dollar | Notional amount sold | Notional amount bought | |||||||||
Less than 1 year | 1.1198 | $ | 106.3 | US$ | 94.9 | |||||||
20171 | 1.1204 | US$ | 260.0 | $ | 291.3 | |||||||
65
Table of Contents
Table 9
Cross-currency interest rate swaps as of December 31, 2014
(in millions of dollars)
Hedged item | Hedging instrument | |||||||||||||||
| Period covered | Notional amount | Annual interest rate on notional amount in Canadian dollars | Canadian dollar exchange rate on interest and capital payments per one U.S. dollar | |||||||||||||
6.375% Senior Notes due 2015 | 2005 to 2015 | US$ | 175.0 | 5.98% | 1.1781 | |||||||||||
9.125% Senior Notes due 2018 | 2008 to 2018 | US$ | 75.0 | 9.64% | 1.0215 | |||||||||||
5.000% Senior Notes due 2022 | 2014 to 2022 | US$ | 543.1 | 6.01% | 0.9983 | |||||||||||
5.000% Senior Notes due 2022 | 2012 to 2022 | US$ | 256.9 | 5.81% | 1.0016 | |||||||||||
5.375% Senior Notes due 20241 | 2014 to 2017 | US$ | 260.0 | 9.21% | 1.2965 | |||||||||||
5.375% Senior Notes due 2024 | 2014 to 2024 | US$ | 158.6 |
| Bankers’ acceptances 3 months +2.67% |
| 1.1034 | |||||||||
5.375% Senior Notes due 2024 | 2017 to 2024 | US$ | 441.4 | 5.62% | 1.1039 | |||||||||||
| 1 | The Corporation initially entered into these cross-currency interest rate swaps to hedge the foreign currency risk exposure under its 9.125% Senior Notes due in 2018 redeemed in 2014. These swaps are now used to set in CAN dollars all coupon payments through 2017 on US$441.4 million of notional amount under its 5.375% Senior Notes due in 2024 and issued on April 9, 2014. In conjunction with the repurposing of these swaps, the Corporation has entered into US$260.0 million offsetting foreign exchange forward contracts to lock-in the value of its hedging position related to the December 15, 2017 notional exchange. |
Certain cross-currency interest rate swaps entered into by the Corporation include an option that allows each party to unwind the transaction on a specific date at the then settlement amount.
The gain or loss on valuation and translation of financial instruments for the years ended December 31, 2014, 2013 and 2012 is summarized in the following table.
Table 10
Loss (gain) on valuation and translation of financial instruments
(in millions of dollars)
| 2014 | 2013 | 2012 | ||||||||||
Loss (gain) on embedded derivatives | $ | 4.9 | $ | 97.4 | $ | (80.6 | ) | |||||
(Gain) loss on reversal of embedded derivatives upon debt redemption | (0.6 | ) | 67.0 | 6.3 | ||||||||
Loss (gain) on derivative financial instruments for which hedge accounting is not used | 3.1 | 0.4 | (1.4 | ) | ||||||||
Gain on the ineffective portion of cash flow hedges | (0.8 | ) | (1.1 | ) | – | |||||||
Gain on the ineffective portion of fair value hedges | (3.2 | ) | – | – | ||||||||
|
|
|
|
|
| |||||||
| $ | 3.4 | $ | 163.7 | $ | (75.7 | ) | ||||||
|
|
|
|
|
| |||||||
A gain of $7.2 million was recorded under “Other comprehensive income” in 2014 in relation to cash flow hedging relationships (loss of $25.0 million in 2013 and gain of $18.9 million in 2012).
Fair value of financial instruments
The fair value of long-term debt in Table 11 is estimated based on quoted market prices when available or on valuation models. When the Corporation uses valuation models, the fair value is estimated using discounted cash flows using year-end market yields or the market value of similar instruments with the same maturity.
66
Table of Contents
The fair value of cash equivalents classified as held for trading and accounted for at their fair value on the consolidated balance sheets, is determined using inputs that are observable for the asset or liability, either directly (i.e., as prices) or indirectly (i.e., derived from prices).
The fair value of derivative financial instruments recognized on the consolidated balance sheet is estimated as per the Corporation’s valuation models. These models project future cash flows and discount the future amounts to a present value using the contractual terms of the derivative instrument and factors observable in external markets data, such as period-end swap rates and foreign exchange rates. An adjustment is also included to reflect non-performance risk impacted by the financial and economic environment prevailing at the date of the valuation, in the recognized measure of the fair value of the derivative instruments by applying a credit default premium estimated using a combination of observable and unobservable inputs in the market to the net exposure of the counterparty or the Corporation.
The fair value of early settlement options recognized as embedded derivatives is determined by option pricing models using market inputs, including volatility, discount factors and underlying instruments adjusted implicit interest rate and credit premium.
The carrying value and fair value of long-term debt and derivative financial instruments as of December 31, 2014 and 2013 are as follows:
Table 11
Fair value of long-term debt and derivative financial instruments
(in millions of dollars)
| 2014 | 2013 | |||||||||||||||
Asset (liability) | Carrying value | Fair value | Carrying value | Fair value | ||||||||||||
Long-term debt1, 2 | $ | (2,951.0 | ) | $ | (3,020.9 | ) | $ | (2,438.5 | ) | $ | (2,486.0 | ) | ||||
Derivative financial instruments3 | ||||||||||||||||
Early settlement options | 5.6 | 5.6 | 11.8 | 11.8 | ||||||||||||
Foreign exchange forward contracts4 | 4.2 | 4.2 | 1.8 | 1.8 | ||||||||||||
Cross-currency interest rate swaps4 | 107.0 | 107.0 | (165.7 | ) | (165.7 | ) | ||||||||||
| 1 | The carrying value of long-term debt excludes adjustments to record changes in the fair value of long-term debt related to hedged interest rate risk, embedded derivatives and financing fees. |
| 2 | The fair value of long-term debt excludes the fair value of early settlement options, which is presented separately in the table. |
| 3 | The fair value of the derivative financial instruments designated as hedges is in an asset position of $111.2 million as of December 31, 2014 (liability position of $93.8 million as of December 31, 2013). |
| 4 | The value of foreign exchange forward contracts entered into to lock-in the value of existing hedging positions is netted from the value of the offset financial instruments. |
Due to the judgment used in applying a wide range of acceptable techniques and estimates in calculating fair value amounts, fair values are not necessarily comparable among financial institutions or other market participants and may not be realized in an actual sale or on the immediate settlement of the instrument.
Credit Risk Management
Credit risk is the risk of financial loss to the Corporation if a customer or counterparty to a financial asset fails to meet its contractual obligations.
In the normal course of business, the Corporation continuously monitors the financial condition of its customers and reviews the credit history of each new customer. As of December 31, 2014, no customer balance represented a significant portion of the Corporation’s consolidated accounts receivable. The Corporation establishes an allowance for doubtful accounts based on the specific credit risk of its customers and historical trends. The allowance for doubtful accounts amounted to $15.4 million as of December 31, 2014 ($15.7 million as of December 31, 2013). As of December 31, 2014, 7.0% of accounts receivable were 90 days past their billing date (8.6% as of December 31, 2013), of which 82.6% had an allowance for doubtful accounts (71.1% as of December 31, 2013).
67
Table of Contents
The following table shows changes to the allowance for doubtful accounts for the years ended December 31, 2014 and 2013:
Table 12
Changes in Allowance for Doubtful Accounts
(in millions of dollars)
| 2014 | 2013 | |||||||
Balance as of beginning of year | $ | 15.7 | $ | 16.6 | ||||
Charged to income | 28.9 | 36.9 | ||||||
Utilization | (29.2 | ) | (37.8 | ) | ||||
|
|
|
| |||||
Balance as of end of year | $ | 15.4 | $ | 15.7 | ||||
|
|
|
| |||||
The Corporation believes that its product lines and the diversity of its customer base are instrumental in reducing its credit risk, as well as the impact of fluctuations in product-line demand. The Corporation does not believe that it is exposed to an unusual level of customer credit risk.
As a result of its use of derivative financial instruments, the Corporation is exposed to the risk of non-performance by a third party. When the Corporation enters into derivative contracts, the counterparties (either foreign or Canadian) must have credit ratings at least in accordance with the Corporation’s risk management policy and are subject to concentration limits. These credit ratings and concentration limits are monitored on an ongoing basis but at least quarterly.
Liquidity risk management
Liquidity risk is the risk that the Corporation will not be able to meet its financial obligations as they fall due or the risk that those financial obligations will have to be met at excessive cost. The Corporation manages this exposure through staggered debt maturities. The weighted average term of the Corporation’s consolidated debt was approximately 7.3 years as of December 31, 2014 (6.9 years as of December 31, 2013). (see also “Contractual obligations” above).
Market Risk
Market risk is the risk that changes in market prices due to foreign exchange rates and/or interest rates will affect the value of the Corporation’s financial instruments. The objective of market risk management is to mitigate and control exposures within acceptable parameters while optimizing the return on risk.
Foreign Currency Risk
Most of the Corporation’s consolidated revenues and expenses, other than interest expense onU.S.-dollar-denominated debt, purchases of set-top boxes, handsets and cable modems and certain capital expenditures, are received or denominated in Canadian dollars. A significant portion of the interest, principal and premium, if any, payable on its debt is payable in U.S. dollars. The Corporation has entered into transactions to hedge the foreign currency risk exposure on itsU.S.-dollar-denominated debt obligations outstanding as of December 31, 2014, to hedge its exposure on certain purchases of set-top boxes, handsets, cable modems and capital expenditures and to lock-in the value of certain derivative financial instruments through offsetting transactions. Accordingly, the Corporation’s sensitivity to variations in foreign exchange rates is economically limited.
68
Table of Contents
The following table summarizes the estimated sensitivity on income and other comprehensive income, before income tax, of a variance of $0.10 in the year-end exchange rate of a Canadian dollar per one U.S. dollar:
Table 13
Estimated Sensitivity of Variances in Year-end Exchange Rate
(in millions of dollars)
Increase (decrease) | Income | Other comprehensive income | ||||||
Increase of $0.10 | ||||||||
U.S.-dollar-denominated accounts payable | $ | (1.0 | ) | $ | – | |||
| Gain on valuation and translation of financial instruments and derivative financial instruments | 2.4 | 30.9 | ||||||
Decrease of $0.10 | ||||||||
U.S.-dollar-denominated accounts payable | 1.0 | – | ||||||
| Gain on valuation and translation of financial instruments and derivative financial instruments | (2.4 | ) | (30.9 | ) | ||||
Interest Rate Risk
The Corporation’s bank credit facilities bear interest at floating rates based on the following reference rates: (i) Bankers’ acceptance rate, (ii) Canadian prime rate and (iii) U.S. prime rate. The Senior Notes issued by the Corporation bear interest at fixed rates. The Corporation has entered into variouscross-currency interest rate swap agreements in order to manage interest rate risk exposure. As of December 31, 2014, after taking into account the hedging instruments,long-term debt was comprised of 85.0% fixed-rate debt (83.6% in 2013) and 15.0% floating-rate debt (16.4% in 2013).
The estimated sensitivity on interest payments of a 100 basis point variance in theyear-end Canadian Banker’s acceptance rate as of December 31, 2014 is $4.2 million.
The estimated sensitivity on income and other comprehensive income, before income tax, of a 100 basis point variance in the discount rate used to calculate the fair value of financial instruments, as per the Corporation’s valuation model, is as follows:
Table 14
Estimated Sensitivity of Variances in the Discount Rate
(in millions of dollars)
Increase (decrease) | Income | Other comprehensive income | ||||||
Increase of 100 basis points | $ | 0.4 | $ | (9.8 | ) | |||
Decrease of 100 basis points | (0.4 | ) | 9.8 | |||||
Capital Management
The Corporation’s primary objective in managing capital is to maintain an optimal capital base in order to support the capital requirements of its various businesses, including growth opportunities.
In managing its capital structure, the Corporation takes into account the asset characteristics of its subsidiaries and planned requirements for funds. Management of the capital structure involves the issuance of new debt, the repayment of existing debt using cash flows generated by operations, and the level of distributions to the parent corporation. The Corporation has not significantly changed its strategy regarding the management of its capital structure since the last financial year.
69
Table of Contents
The Corporation’s capital structure is composed of equity, long-term debt and net assets and liabilities related to derivative financial instruments, less cash and cash equivalents. The capital structure as of December 31, 2014 and 2013 is as follows:
Table 15
Capital Structure of the Corporation
(in millions of dollars)
| December 31, 2014 | December 31, 2013 | |||||||
Long-term debt | $ | 2,924.5 | $ | 2,399.1 | ||||
Derivative financial instruments (asset) liability | (111.2 | ) | 163.9 | |||||
Cash and cash equivalents | (342.8 | ) | (322.5 | ) | ||||
|
|
|
| |||||
Net liabilities | 2,470.5 | 2,240.5 | ||||||
Equity | $ | 793.9 | $ | 821.8 | ||||
|
|
|
| |||||
The Corporation is not subject to any externally imposed capital requirements other than certain restrictions under the terms of its borrowing agreements, which relate to permitted investments, inter-corporation transactions, and the declaration and payment of dividends or other distributions.
Contingencies and legal disputes
There are a number of legal proceedings against the Corporation and its subsidiaries that are pending. In the opinion of the management of the Corporation and its subsidiaries, the outcome of those proceedings is not expected to have a material adverse effect on the Corporation’s results or on its financial position.
Management of the Corporation, after taking legal advice, has established provisions for specific claims or actions considering the facts of each case. The Corporation cannot determine when and if a payment related to these provisions will be made.
Critical Accounting Policies and Estimates
Revenue recognition
The Corporation recognizes operating revenues when the following criteria are met:
| • | the amount of revenue can be measured reliably; |
| • | the receipt of economic benefits associated with the transaction is probable; |
| • | the costs incurred or to be incurred in respect of the transaction can be measured reliably; |
| • | the stage of completion can be measured reliably where services have been rendered; and |
| • | significant risks and rewards of ownership, including effective control, have been transferred to the buyer where goods have been sold. |
The portion of revenue that is unearned is recorded under “Deferred revenue” when customers are invoiced.
Revenue recognition policies for each of the Corporation’s main product lines are as follows:
The cable and mobile services are provided under arrangements with multiple deliverables, for which there are two separate accounting units: one for subscriber services (cable television, Internet, cable telephony or mobile telephony, including connection costs and rental of equipment); the other for equipment sales to subscribers. Components of multiple deliverable arrangements are separately accounted for, provided the delivered elements havestand-alone value to the customer and the fair value of any undelivered elements can be objectively and reliably determined. Arrangement consideration is allocated among the separate accounting units based on their relative fair values.
Cable connection revenues are deferred and recognized as revenues over the estimated average period that subscribers are expected to remain connected to the network. The incremental and direct costs related to cable connection costs, in an amount not exceeding the revenue, are deferred and recognized as an operating expense over the same period. The excess of those costs over the related revenues is recognized immediately in income. Operating revenues from cable and other services, such as Internet access, cable and mobile telephony, are recognized when services are rendered. Promotional offers and rebates are accounted for as a reduction in the service revenue to which they relate. Revenues from equipment sales to subscribers and their costs are recognized in income when the equipment is delivered. Promotional offers related to equipment, with the exclusion of mobile devices, are accounted for as a reduction of related equipment sales on delivery while promotional offers related to the sale of mobile devices are accounted for as a reduction of related equipment sales on activation. Operating revenues related to service contracts are recognized in income over the life of the specific contracts on astraight-line basis over the period in which the services are provided.
70
Table of Contents
Impairment of assets
For the purposes of assessing impairment, assets are grouped in cash-generating units (“CGUs”), which represent the lowest levels for which there are separately identifiable cash inflows generated by those assets. The Corporation reviews at each balance sheet date whether events or circumstances have occurred to indicate that the carrying amounts of its long-lived assets with finite useful lives may be less than their recoverable amounts. Goodwill, other intangible assets having an indefinite useful life, and intangible assets not yet available for use are tested for impairment each financial year, as well as whenever there is an indication that the carrying amount of the asset, or the CGU to which an asset has been allocated, exceeds its recoverable amount. The recoverable amount is the higher of the fair value less costs to sell and the value in use of the asset or the CGU. Fair value less costs to sell represents the amount an entity could obtain at the valuation date from the asset’s disposal in an arm’s length transaction between knowledgeable, willing parties, after deducting the costs of disposal. The value in use represents the present value of the future cash flows expected to be derived from the asset or the CGU.
The Corporation uses the discounted cash flow method to estimate the recoverable amount, consisting of future cash flows derived mainly from the most recent budget and three-year strategic plan approved by the Corporation’s management and presented to the Board of Directors. These forecasts consider each CGU’s past operating performance and market share as well as economic trends, along with specific and market industry trends and corporate strategies. In particular, specifics assumptions are used for each type of revenues generated by a CGU or for each nature of expenses as well as for future capital expenditures. As such, assumptions will consider, among many other factors, subscribers, competitive landscape, evolution of products and services offerings, wireless penetration growth, proliferation of media platforms, technology evolution, bargaining agreements, Canadian GDP rates and operating cost structures. A range of growth rates is used for cash flows beyond this three-year period. The discount rate used by the Corporation is a pre-tax rate derived from the weighted average cost of capital pertaining to each CGU, which reflects the current market assessment of (i) the time value of money; and (ii) the risk specific to the assets for which the future cash flow estimates have not been risk-adjusted. The perpetual growth rate has been determined with regard to the specific markets in which the CGUs participate.
An impairment loss is recognized in the amount by which the carrying amount of an asset or a CGU exceeds its recoverable amount. When the recoverable amount of a CGU to which goodwill has been allocated is lower than the CGU’s carrying amount, the related goodwill is first impaired. Any excess amount of impairment is recognized and attributed to assets in the CGU, prorated to the carrying amount of each asset in the CGU.
An impairment loss recognized in prior periods for long-lived assets with finite useful lives and intangible assets having an indefinite useful life, other than goodwill, can be reversed through the consolidated statement of income to the extent that the resulting carrying value does not exceed the carrying value that would have been the result if no impairment losses had been previously recognized.
The determination of CGUs requires judgment when determining the lowest level for which there are separately identifiable cash inflows generated by the asset category.
In addition, when determining the recoverable amount of an asset or CGU, assessment of the information available at the valuation date is based on management’s judgment and may involve estimates and assumptions. Furthermore, the discounted cash flow method used in determining the recoverable amount of an asset or CGU relies on the use of estimates such as the amount and timing of cash flows, expected variations in the amount or timing of those cash flows, the time value of money as represented by the risk-free rate, and the risk premium associated with the asset or CGU.
Therefore, the judgment used in determining the recoverable amount of an asset or CGU may affect the amount of the impairment loss to an asset or CGU to be recorded, as well as the potential reversal of the impairment charge in the future.
Based on the data and assumptions used in its last impairment test, the Corporation believes that at this time there are no significant amounts of long-lived assets with finite useful lives, or goodwill and intangible assets with indefinite useful lives on its books that present a significant risk of impairment in the near future.
The net book value of goodwill as of December 31, 2014 was $429.3 million.
Derivative financial instruments and hedge accounting
The Corporation uses various derivative financial instruments to manage its exposure to fluctuations in foreign currency exchange rates and interest rates. The Corporation does not hold or use any derivative financial instruments for speculative purposes. Under hedge accounting, the Corporation documents all hedging relationships between hedging items and hedged items, as well as its strategy for using hedges and its risk management objectives. It also designates its derivative financial instruments as either fair value hedges or cash flow hedges when they qualify for hedge accounting. The Corporation assesses the effectiveness of derivative financial instruments when the hedge is put in place and on an ongoing basis.
71
Table of Contents
The Corporation generally enters into the following types of derivative financial instruments:
| • | The Corporation uses foreign exchange forward contracts to hedge foreign currency rate exposure on anticipated equipment or inventory purchases in a foreign currency. The Corporation also uses offsetting foreign exchange forward contracts in combination with cross-currency interest rate swaps to hedge foreign currency rate exposure on interest and principal payments on foreign currency denominated debt. These foreign exchange forward contracts are designated as cash flow hedges. |
| • | The Corporation uses cross-currency interest rate swaps to hedge (i) foreign currency rate exposure on interest and principal payments on foreign currency denominated debt and/or (ii) fair value exposure on certain debt resulting from changes in interest rates. The cross-currency interest rate swaps that set all future interest and principal payments on U.S.-dollar-denominated debt in fixed CAN dollars, in addition to converting an interest rate from a floating rate to a floating rate or from a fixed rate to a fixed rate, are designated as cash flow hedges. The cross-currency interest rate swaps are designated as fair value hedges when they set all future interest and principal payments on U.S.-dollar-denominated debt in fixed CAN dollars, in addition to converting the interest rate from a fixed rate to a floating rate. |
Under hedge accounting, the Corporation applies the following accounting policies:
| • | For derivative financial instruments designated as fair value hedges, changes in the fair value of the hedging derivative recorded in income are substantially offset by changes in the fair value of the hedged item to the extent that the hedging relationship is effective. When a fair value hedge is discontinued, the carrying value of the hedged item is no longer adjusted and the cumulative fair value adjustments to the carrying value of the hedged item are amortized to income over the remaining term of the original hedging relationship. |
| • | For derivative financial instruments designated as cash flow hedges, the effective portion of a hedge is reported in other comprehensive income until it is recognized in income during the same period in which the hedged item affects income, while the ineffective portion is immediately recognized in income. When a cash flow hedge is discontinued, the amounts previously recognized in accumulated other comprehensive income are reclassified to income when the variability in the cash flows of the hedged item affects income. |
Any change in the fair value of these derivative financial instruments recorded in income is included in gain or loss on valuation and translation of financial instruments. Interest expense on hedgedlong-term debt is reported at the hedged interest and foreign currency rates.
Derivative financial instruments that do not qualify for hedge accounting, including derivatives that are embedded in financial ornon-financial contracts that are not closely related to the host contracts, such as early settlement options on long-term debt, are reported on a fair value basis in the consolidated balance sheets. Any change in the fair value of these derivative financial instruments is recorded in income as a gain or loss on valuation and translation of financial instruments.
Early settlement options are accounted for separately from the debt when the corresponding option exercise price is not approximately equal to the amortized cost of the debt.
The judgment used in determining the fair value of derivative financial instruments including embedded derivatives, using valuation and pricing models, may have a significant effect on the value of the gain or loss on valuation and translation of financial instruments recorded in the consolidated statements of income, and the value of the gain or loss on derivative financial instruments recorded in the consolidated statements of comprehensive income. Also, valuation and financial models are based on a number of assumptions including future cash flows, period end swap rates, foreign exchange rates, credit default premium, volatility, discount factors and underlying instrument adjusted implicit interest rate and credit premium.
In addition, judgment is required to determine if an option exercise price is not approximately equal to the amortized cost of the debt. This determination may have a significant impact on the amount of gains or losses on valuation and translation of financial instruments recorded in the consolidated statements of income.
Pension and postretirement benefits
The Corporation offers defined benefit pension plans and defined contribution pension plans to some of its employees.
Defined benefit obligations with respect to defined benefit pension plan and postretirement benefits plan are measured at present value and assessed on the basis of a number of economic and demographic assumptions, which are established with the assistance of Videotron’s actuaries. Key assumptions relate to the discount rate, the rate of increase in compensation, retirement age of employees, healthcare costs, and other actuarial factors. Defined benefit pension plan assets are measured at fair value and consist of equities and corporate and governmentfixed-income securities.
72
Table of Contents
Re-measurements of the net defined benefit liability or asset are recognized immediately in other comprehensive income.
Recognition of a net benefit asset is limited under certain circumstances to the amount recoverable, which is primarily based on the present value of future contributions to the plan to the extent to which the Corporation can unilaterally reduce those future contributions. In addition, an adjustment to the net benefit asset or the net benefit liability can be recorded to reflect a minimum funding liability in a certain number of the Corporation’s pension plans. The assessment of the amount recoverable in the future, for the purpose of calculating the limit on the net benefit asset, is based on a number of assumptions, including future service costs and reductions in future plan contributions.
The Corporation considers all the assumptions used to be reasonable in view of the information available at this time. However, variances from certain of these assumptions may have a significant impact on the costs and obligations of pension plans and postretirement benefits in future periods.
Stock-based compensation
Stock-based awards to employees that call for settlement in cash or other assets at the option of the employee are accounted for at fair value and classified as a liability. The compensation cost is recognized in expenses over the vesting period. Changes in the fair value of stock-based awards between the grant date and the measurement date result in a change in the liability and compensation cost.
Estimates of the fair value of stock option awards are determined by applying an option-pricing model, taking into account the terms and conditions of the grant and assumptions such as the risk-free interest rate, the dividend yield, the expected volatility and the expected remaining life of the option.
The judgment and assumptions used in determining the fair value of liability classified stock-based awards may have an effect on the compensation cost recorded in the statements of income.
Provisions
Provisions are recognized when (i) the Corporation has a present legal or constructive obligation as a result of a past event and it is probable that an outflow of economic benefits will be required to settle the obligation; and when (ii) the amount of the obligation can be reliably estimated.
Provisions are reviewed at each balance sheet date and changes in estimates are reflected in the consolidated statements of income in the reporting period in which changes occur.
The amount recognized as a provision is the best estimate of the expenditure required to settle the present obligation at the balance sheet date or to transfer it to a third party at that time, and is adjusted for the effect of time value when material. The amount recognized for onerous contracts is the lower of the cost necessary to fulfill the obligations, net of expected economic benefits deriving from the contracts, and any indemnity or penalty arising from failure to fulfill those obligations.
No amounts are recognized for obligations that are possible but not probable or for those for which an amount cannot be reasonably estimated.
Allowance for doubtful accounts
The Corporation maintains an allowance for doubtful accounts to cover anticipated losses from customers who are unable to pay their debts. The allowance is reviewed periodically and is based on an analysis of specific significant accounts outstanding, the age of the receivable, customer creditworthiness, and historical collection experience.
Income taxes
Deferred income taxes are accounted for using the liability method. Under this method, deferred income tax assets and liabilities are recognized for the estimated future tax consequences attributable to differences between the carrying amounts of existing assets and liabilities in the consolidated financial statements and their respective tax bases. Deferred income tax assets and liabilities are measured using enacted or substantively enacted tax rates in effect for the year in which those temporary differences are expected to be recovered or settled. The effect of a change in tax rates on deferred income tax assets and liabilities is recognized in income in the period that includes the substantive enactment date. A deferred tax asset is recognized initially when it is probable that future taxable income will be sufficient to use the related tax benefits and may be subsequently reduced, if necessary, to an amount that is more likely than not to be realized.
73
Table of Contents
The assessment of deferred income taxes is judgmental in nature and is dependent on assumptions and estimates as to the availability and character of future taxable income. The ultimate amount of deferred income tax asset realized could be slightly different from that recorded, since it is influenced by the Corporation’s future operating results.
The Corporation is at all times under audit by various tax authorities in each of the jurisdictions in which it operates. A number of years may elapse before a particular matter for which management has established a reserve is audited and resolved. The number of years between each tax audit varies depending on the tax jurisdiction. Management believes that its estimates are reasonable and reflect the probable outcome of known tax contingencies, although the final outcome is difficult to predict.
Changes in Accounting policies
On January 1, 2014, the Corporation adopted retrospectively IFRIC 21 – Levies, which clarifies the timing of accounting for a liability in relation with outflow of resources that is imposed by governments in accordance with legislation, based on the activity that triggers the payment. The adoption of this interpretation did not have a material impact on the consolidated financial statements.
Recent Accounting Pronouncements
The Corporation has not yet completed its assessment of the impact of the adoption of these pronouncements on its consolidated financial statements.
| (i) | IFRS 9 –Financial Instruments is required to be applied retrospectively for annual periods beginning on or after January 1, 2018, with early adoption permitted. |
IFRS 9 simplifies the measurement and classification of financial assets by reducing the number of measurement categories in IAS 39,Financial Instruments: Recognition and Measurement. The new standard also provides for a fair value option in the designation of anon-derivative financial liability and its related classification and measurement, as well as for a new hedge accounting model more closely aligned with risk management activities undertaken by entities.
| (ii) | IFRS 15 – Revenue from Contracts with Customersis required to be applied retrospectively for annual periods beginning on or after January 1, 2017, with early adoption permitted. |
IFRS 15 specifies how and when an entity will recognize revenue as well as requiring such entities to provide users of financial statements with more informative disclosures. The standard provides a single, principles based five-step model to be applied to all contracts with customers.
74
Table of Contents
ITEM 6 – DIRECTORS, SENIOR MANAGEMENT AND EMPLOYEES
| A- | Directors and Senior Management |
The following table sets forth certain information concerning our directors and executive officers at March 20, 2015:
Name and Municipality of Residence | Age | Position | ||
THERIGHT HONOURABLE BRIAN MULRONEY, Westmount, Québec | 75 | Director and Chair of the Board | ||
JEAN LA COUTURE, FCPA, FCA(1) Montréal, Québec | 68 | Director and Chair of the Audit Committee | ||
SYLVIE LALANDE Lachute, Québec | 64 | Director | ||
A. MICHEL LAVIGNE, FCPA, FCA(1) Laval, Québec | 64 | Director | ||
NORMAND PROVOST(1) Brossard, Québec | 60 | Director | ||
MANON BROUILLETTE Montréal, Québec | 46 | President and Chief Executive Officer | ||
JEAN NOVAK Beaconsfield, Québec | 51 | President, Videotron Business Solutions and Senior Vice President, Sales Network and Retail Sector | ||
HUGUES SIMARD Toronto, Ontario | 48 | Senior Vice President and Chief Financial Officer | ||
DANIEL PROULX Montréal, Québec | 56 | Chief Technological Officer | ||
SYLVAIN BROSSEAU Varennes, Québec | 50 | Senior Vice President, Operations, Customer Service | ||
MYRIANNE COLLIN Montréal, Québec | 40 | Senior Vice President, Strategy and Market Development | ||
PIERRE BONIN Westmount, Québec | 52 | Vice President, Information Technology | ||
CHLOE POIRIER Nun’s Island, Québec | 45 | Vice President and Treasurer | ||
MARC M. TREMBLAY Westmount, Québec | 54 | Corporate Secretary | ||
| (1) | Member of the Audit Committee |
The Right Honourable Brian Mulroney, P.C., C.C., LL.D, Director and Chairman of the Board. Mr. Mulroney was appointed as Director and Chairman of the Board of Videotron on June 19, 2014. He has been a Director of Quebecor Media since January 31, 2001. He also served as Vice Chairman of the Board of Quebecor from November 2009 to June 2014 and as Vice-Chairman of the Board of Quebecor Media from March 2014 to June 2014. He was appointed Chairman of the Board of Quebecor and Quebecor Media on June 19, 2014. Mr. Mulroney has also served as
75
Table of Contents
Chairman of the Board of Directors of Quebecor World Inc. from April 2002 to July 2009. Mr. Mulroney served as Chairman of the Board of Directors of Sun Media Corporation from January 2000 to June 2001. Since 1993, Mr. Mulroney has been a Senior Partner with the law firm Norton Rose Fulbright Canada LLP (formerly Ogilvy Renault LLP) in Montréal, Québec. Prior to that, Mr. Mulroney was the Prime Minister of Canada from 1984 until 1993. Mr. Mulroney practiced law in Montréal and served as President of The Iron Ore Company of Canada before entering politics in 1983. Mr. Mulroney serves as a Director of a number of public corporations, including Wyndham Worldwide Corporation (New Jersey), The Blackstone Group LP (New York) and Lion Capital (London). He is also Chairman of the International Advisory Board of Barrick Gold Corporation. He is Companion of the Order of Canada as well asGrand Officier de l’Ordre national du Québec.
Jean La Couture, FCPA, FCA, Director and Chairman of the Audit Committee.Mr. La Couture has served as a Director and as Chair of our Audit Committee since October 2003. Mr. La Couture is a Director and Chair of the Audit Committee of Quebecor and Quebecor Media. He was a Director of Quebecor World Inc. from December 2007 to December 2008. Mr. La Couture, a Fellow Chartered Professional Accountant, is President of Huis Clos Ltée., a management and mediation firm. He is also President of theRegroupement des assureurs de personnes à charte du Québec (RACQ), a position he has held since August 1995. He headed Le Groupe Mallette (an accounting firm) before becoming, from 1990 to 1994, President and Chief Executive Officer of The Guarantee Company of North America. He is Chairman of the Board of Innergex Renewable Energy Inc., Chairman of the Board of Groupe Pomerleau (a Québec-based construction company) and a Director and Chair of the Investment and Risk Management Committee of CDPQ.
Sylvie Lalande,Director.Ms. Lalande is a Director of Videotron since July 2014 and of Quebecor Media since May 2013. She has served as a Director of Quebecor since May 2011. She is a member of the Human Resources and Compensation Committee of Quebecor and Quebecor Media since June 2014. She is a Director of TVA Group since December 2001, and was appointed as Chair of the Board on March 10, 2014. She also serves as Chair of the Human Resources and Corporate Governance Committee since May 2013. Ms. Lalande held several senior positions in the media, marketing, communication marketing and company communications sectors. Until October 2001, she was Chief Communications Officer of Bell Canada. From 1994 to 1997, she was President and Chief Executive Officer of UBI Consortium, a consortium formed to develop and manage interactive and transactional communication services. From 1987 to 1994, she occupied several senior positions within TVA Group and Le Groupe Vidéotron ltée. Ms. Lalande began her career in the radio industry, after which she founded her own consultation firm. In 2006, Ms. Lalande earned a degree in corporate governance from the Collège des administrateurs de sociétés. In November 2013, Ms. Lalande was appointed Chair of the Board of the Collège des administrateurs de sociétés (CAS) ofUniversité Laval.
A. Michel Lavigne, FCPA, FCA, Director and member of the Audit Committee. Mr. Lavigne has served as a Director of Videotron and as a member of its Audit Committee since June 30, 2005. Mr. Lavigne has also served as a Director and member of the Audit Committee and the Human Resources and Compensation Committee of Quebecor Media since June 30, 2005. He was appointed Chair of the Human Resources and Compensation Committee in June 2014. Since June 30, 2005, Mr. Lavigne has also served as a Director and a member of the Audit Committee of TVA Group. Since May 2013, he is also a member of the Human Resources and Corporate Governance Committee of TVA Group. He also is a Director and member of the Audit Committee and of the Human Resources and Compensation Committee of Quebecor since May 2013 and as Chair of the latter committee since June 2014. Mr. Lavigne is a Director, a member of the Audit Committee and Chair of the Pension Committee of Canada Post, a Director and member of the Audit Committee of Laurentian Bank of Canada and, the Chair of the Board of Directors and of the Audit Committee of Teraxion Inc. Until May 2005, he served as President and Chief Executive Officer of Raymond Chabot Grant Thornton in Montréal, Québec, as Chairman of the Board of Grant Thornton Canada and as a member of the Board of Governors of Grant Thornton International. Mr. Lavigne is a Fellow Chartered Professional Accountant of theOrdre des comptables professionnels agréés du Québec and a member of the Canadian Institute of Chartered Accountants since 1973.
Normand Provost, Director. Mr. Provost is a Director of Videotron since June 2014. He has served as a Director of Quebecor Media since July 2004 and a Director of Quebecor since May 2013. He also serves as a member of the Audit Committee of Quebecor, Quebecor Media. since June 2014. Since May 2014, Mr. Provost is Assistant to the President of CDPQ, one of the largest institutional fund managers in Canada and North America. Mr. Provost joined CDPQ in 1980 and has held various management positions during his time there. He served as President of CDP Capital Americas from 1995 to 2003. He has served as Executive Vice President, Private Equity, of CDPQ from October 2003 until May 2014. In addition to his responsibilities in the investment sector, Mr. Provost served as Chief Operations Officer of CDPQ from April 2009 to March 2012. Mr. Provost is a Director of theFondation de l’Entrepreneurship.
76
Table of Contents
Manon Brouillette, President and Chief Executive Officer. In May 2014, Ms. Brouillette was promoted President and Chief Executive Officer of Videotron. From May 2013 to May 2014, she acted as President and Chief Operating Officer of Videotron, after acting as President, Consumer Market from January 2012 to May 2013. She acted as Executive Vice President, Strategy and Market Development of Videotron from March 2009 to January 2012, as President, Consumer Market. From January 2011 to May 2012, she also acted as Vice President and Chief Digital Officer of Quebecor Media. From June 2008 to March 2009, she acted as Senior Vice President, Strategic Development and Market Development of Quebecor Media. She joined Videotron in July 2004 and acted as Vice President, Marketing, from July 2004 to January 2005, as Vice President, New Product Development, from January 2005 to August 2006 and as Senior Vice President, Marketing, Content and New Product Development, from September 2006 to June 2008. Before joining the Corporation, Ms. Brouillette was Vice President, Marketing and Communications of the San Francisco Group from April 2003 to February 2004. She was also responsible for the national and regional accounts of the Blitz division of Groupe Cossette Communication Marketing from April 2002 to April 2003. From September 1998 to April 2002, she worked at Publicité Martin inc. Ms. Brouillette holds a Bachelor’s degree in communications with a minor in marketing fromUniversité Laval.
Jean Novak, President, Videotron Business Solutions and Senior Vice President, Sales Network and Retail Sector. Mr. Novak was appointed to his current position in August 2014. From May 2013 to August 2014, he was President, Videotron Business Solutions and Senior Vice-President, Sales Channel. He has served as President, Videotron Business Solutions since January 2005. Mr. Novak joined Videotron in May 2004 as Vice President, Sales. Between 1988 and May 2004, Mr. Novak held various management positions in sales and distribution for Molson Breweries, Canada’s largest brewing company, including General Manager for all on premise accounts and the Montréal sales region as well as Manager, Customer Service and Telesales in Québec. Mr. Novak holds a Bachelor’s degree in marketing from the HEC Montréal.
Hugues Simard, Senior Vice President and Chief Financial Officer. Mr. Simard was appointed to his current position in August 2014. Mr. Simard has served as Vice President Finance of Sun Media Corporation from January 2011 to August 2014 and as Vice President, Corporate Advertising Sales from December 2008 to January 2011. He was also Senior Vice President, Development and Strategy of Quebecor Media from February 2007 to January 2011. Mr. Simard joined the Quebecor group of companies in July 1998 as Director, Business Development of Quebecor Printing which became Quebecor World in 1999. He was appointed Vice President, Corporate Development of Quebecor New Media in 1999 and President & CEO of Netgraphe/Canoe in 2000. He rejoined Quebecor World in 2003, first as Vice President, Development and Planning and then as President of the Commercial Printing Group in 2004. Prior to his appointment as Senior Vice President, Development and Strategy at Quebecor Media, he spent a year in Paris, France as Managing Director of Secor Conseil, a management consulting firm. Mr. Simard holds a Bachelor’s degree of Applied Science degree in industrial engineering from the University of Toronto and an MBA from Harvard Business School.
Daniel Proulx, Chief Technological Officer.Mr. Proulx was appointed Chief Technological Officer in April 2011. Prior to his appointment, he had served as Vice President, Engineering since July 2003 and as Vice President, Information Technology since July 2002. Mr. Proulx has held various management positions within Videotron since joining the Corporation in 1995. Mr. Proulx holds a Bachelor’s degree in Engineering froml’École polytechnique de Montréal.
Sylvain Brosseau.Senior Vice President, Operations, Customer Service. Mr. Brosseau was appointed to his current position in May 2013. He has served as Vice President, Customer Service, Consumer division since July 2003. Mr. Brosseau has held various management positions within Videotron since joining the Corporation in 1996.
Myrianne Collin, Senior Vice President, Strategy and Market Development. Ms. Collin was promoted to her current position in December 2011. She had served as Vice President, Marketing, Consumer division since June 2008. She joined Videotron in April 2005 as Senior Director Marketing, Cable Telephony and Bundling. In September 2006, Ms. Collin was appointed Senior Director, Broadcast Services & Relationship Marketing. From 1995 to 2005, Ms. Collin held various positions with Bell Canada and Alliance Data System (Air Miles). She holds a Bachelor’s degree in marketing fromUniversité de Sherbrooke.
Pierre Bonin, Vice President, Information Technology. Mr. Bonin was appointed Vice President, Information Technology in March 2014. Prior to joining the Corporation, Mr. Bonin was President and Chief Executive Officer of StrongKase Enterprise Inc., a private equity firm where, from 2005 to 2014, he has been actively involved in the data
77
Table of Contents
center industry through various investments and ventures. Prior to 2005, Mr. Bonin held various executive positions in the telecommunications industry as Executive Vice President and Chief Information Technology Officer at Microcell Telecommunications Inc. (FIDO), Vice President Information Technology as well as Vice President Finance and Administration at Bell Canada. Mr. Bonin graduated in Mathematics and Computer Science fromUniversité de Sherbrooke and received an MBA from HEC Montreal. He holds the designation of Chartered Director from theCollège des administrateurs de sociétés (CAS)ofl’Université Laval and from the Directors College of McMaster University.
Chloé Poirier, Vice President and Treasurer. Ms. Poirier was promoted Vice President and Treasurer in June 2013 from her previous position as Treasurer, a position she held since August 2009. She also serves as Vice President and Treasurer of Quebecor and Quebecor Media and as Treasurer of Sun Media Corporation. Ms. Poirier joined the Corporation in 2001 as Director, Treasury / Assistant Treasurer, Treasury Operations. Prior to that, she was Analyst, Treasury and Finance with Natrel inc./Agropur from 1997 to 2001 and trader at the Caisse de dépôt et placement du Québecfrom 1995 to 1997. She is a Chartered Financial Analyst (CFA) and holds a Bachelor’s degree in Actuarial Science and an MBA fromUniversité Laval.
Marc M. Tremblay, Corporate Secretary. Mr. Tremblay was appointed Corporate Secretary in September 2014. He also serves as Senior Vice President, Chief Legal Officer and Public Affairs and Corporate Secretary of Quebecor and Quebecor Media since September 2014. Prior to that date, he was Senior Vice President and Chief Legal Officer and Public Affairs of Quebecor Media, a position he held from October 2013. Prior to that date, Mr. Tremblay was Senior Vice President, Legal Affairs, a position he held from March 2012. Prior to that date, he was Vice President, Legal Affairs of Quebecor Media, a position he held from March 2007. Prior to that date, Mr. Tremblay practiced law at Ogilvy Renault LLP (now Norton Rose Fulbright Canada LLP) for 22 years. He has been a member of theBarreau du Québec since 1983.
| B- | Compensation |
Our Directors do not receive any remuneration for acting in their capacity as directors of Videotron. Since July 1, 2013, the Chairman of our Audit Committee receives an annual fee of $25,000 while the two other members receive an annual fee of $10,000. Our Directors are reimbursed for their reasonable out-of-pocket expenses incurred in connection with meetings of our Board of Directors and our Audit Committee. During the financial year ended December 31, 2014, the amount of compensation (including benefits in kind) paid to four of our directors for services in all capacities to Videotron and its subsidiaries was $45,000. None of our directors have contracts with us or any of our subsidiaries that provide for benefits upon termination of employment.
The aggregate amount of compensation we paid for the year ended December 31, 2014 to our executive officers as a group, excluding those who are also executive officers of, and compensated by, Quebecor Media, was approximately $5.8 million, including salaries, bonuses and profit-sharing payments.
Quebecor Media’s Stock Option Plan
Under a stock option plan established by Quebecor Media, 6,180,140 common shares of Quebecor Media (representing 6% of all outstanding common shares of Quebecor Media) have been set aside for directors, officers, senior employees and other key employees of Quebecor Media and its subsidiaries, including Videotron. Each option may be exercised within a maximum period of ten years following the date of grant at an exercise price not lower than, as the case may be, the fair market value of Quebecor Media common shares at the date of grant, as determined by its Board of Directors (if Quebecor Media common shares are not listed on a stock exchange at the time of the grant) or the 5-day weighted average closing price ending on the day preceding the date of grant of the common shares of Quebecor Media on the stock exchange(s) where such shares are listed at the time of grant. For so long as the shares of Quebecor Media are not listed on a recognized stock exchange, optionees may exercise their vested options during one of the following annual periods: from March 1 to March 30, from June 1 to June 29, from September 1 to September 29 and from December 1 to December 30. Holders of options under the plan have the choice at the time of exercising their options to receive an amount in cash equal to the difference between the fair market value, as determined by Quebecor Media’s Board of Directors, and the exercise price of their vested options or, subject to certain stated conditions, purchase common shares of Quebecor Media at the exercise price. Except under specific circumstances, and unless Quebecor Media’s Human Resources and Compensation Committee decides otherwise, options vest over a five-year period in accordance with one of the following vesting schedules as determined by Quebecor Media’s Human Resources and Compensation Committee
78
Table of Contents
at the time of grant: (i) equally over five years with the first 20% vesting on the first anniversary of the date of the grant; (ii) equally over four years with the first 25% vesting on the second anniversary of the date of grant; and (iii) equally over three years with the first 33 1/3% vesting on the third anniversary of the date of grant. Pursuant to the terms of this plan, no optionee may hold options representing more than 5% of the outstanding common shares of Quebecor Media.
During the year ended December 31, 2014, a total of 14,000 options were granted under this plan to executive officers of Videotron (excluding directors, officers and employees who, at the date of grant, were directors, officers or employees at multiple Quebecor Media group of companies). During the year ended December 31, 2014, a total of 32,850 options were exercised by officers and employees of Videotron, for aggregate gross value realized of $0.7 million. The value realized on option exercises represents the difference between the option exercise price and the fair market value of Quebecor Media common shares (as determined as set forth above) at the date of exercise. As of December 31, 2014, an aggregate total of 241,211 options granted to directors, officers and employees of Videotron (excluding directors, officers and employees who, at the date of grant, were directors, officers or employees at multiple Quebecor Media group companies) remain outstanding, with a weighted average exercise price of $56.20 per share, as determined by Quebecor Media’s Human Resources and Compensation Committee. For more information on this stock option plan, see Note 21 to our audited consolidated financial statements included under “Item 18. Financial Statements” of this annual report.
Quebecor’s Stock Option Plan
Under a stock option plan established by Quebecor, 13,000,000 Quebecor Class B Shares have been set aside for Directors, officers, senior employees and other key employees of Quebecor and its subsidiaries, including Videotron. The exercise price of each option is equal to the weighted average trading price of Quebecor Class B Shares on the Toronto Stock Exchange over the last five trading days immediately preceding the grant of the option. Each option may be exercised during a period not exceeding ten years from the date granted. Options usually vest as follows: 1/3 after one year, 2/3 after two years, and 100% three years after the original grant. Holders of options under the Quebecor stock option plan have the choice, when they want to exercise their options, to acquire Quebecor Class B Shares at the corresponding option exercise price or to receive a cash payment from Quebecor equivalent to the difference between the market value of the underlying shares and the exercise price of the option. The Board of Directors of Quebecor may, at its discretion, affix different vesting periods at the time of each grant.
During the year ended December 31, 2014, a total of 50,000 options to purchase Quebecor Class B Shares, with a weighted average exercise price of $25.49 per share, were granted to one senior executive officer of Videotron. As of December 31, 2014, a total of 50,000 options to purchase Quebecor Class B Shares, with a weighted average exercise price of $25.49 per share, were held by one senior executive officer of Videotron for acting in such capacity. The closing sale price of the Quebecor Class B Shares on the TSX on December 31, 2014, was $31.94.
Pension Benefits
Both Quebecor Media and Videotron maintain pension plans for our non-unionized employees and certain officers.
Videotron’s pension plan provides pension benefits to our executive officers equal to 2.0% of salary (excluding bonuses) for each year of membership in the plan. The pension benefits so calculated are payable at the normal retirement age of 65 years, or sooner at the election of the executive officer, subject to an early retirement reduction. In addition, the pension benefits may be deferred, but not beyond the age limit under the relevant provisions of theIncome Tax Act (Canada), in which case the pension benefits are adjusted to take into account the delay in their payment in relation to the normal retirement age. The maximum pension benefits payable under our pension plan are as prescribed under theIncome Tax Act (Canada). An executive officer contributes to this plan an amount equals to 5.0% of his or her salary up to a maximum of $7,047 in respect of 2015. Videotron changed this pension plan to a defined contribution plan for new employees hired on and after May 1, 2012.
Quebecor Media’s pension plan provides greater pension benefits to eligible executive officers than it does to other employees. The higher pension benefits under this plan equal 2.0% of the average salary over the best five consecutive years of salary (including bonuses), multiplied by the number of years of membership in the plan as an executive officer. The pension benefits so calculated are payable at the normal retirement age of 65 years, or sooner at the election of the executive officer, and, from age 61, without early retirement reduction. In addition, the pension benefits may be deferred, but not beyond the age limit under the relevant provisions of theIncome Tax Act (Canada), in which case the pension benefits are adjusted to take into account the delay in their payment in relation to the normal retirement age. The maximum pension benefits payable under Quebecor Media’s pension plan are as prescribed by theIncome Tax Act (Canada) and is based on a maximum salary of $140,945. An executive officer contributes to this plan an amount equals to 5.0% of his or her salary up to a maximum of $7,047 in respect of 2015. Videotron has no liability regarding Quebecor Media’s pension plan. Quebecor Media closed this pension plan to all new employees hired on and after December 27, 2008. New employees are eligible to enroll in a retirement savings plan.
The table below indicates the annual pension benefits that would be payable at the normal retirement age of 65 years under both Quebecor Media’s and our pension plans:
| Years of Participation | ||||||||||||||||||||
Compensation | 10 | 15 | 20 | 25 | 30 | |||||||||||||||
$140,945 or more | $ | 28,189 | $ | 42,283 | $ | 56,378 | $ | 70,472 | $ | 84,567 | ||||||||||
Liability Insurance
Quebecor carries liability insurance for the benefit of its directors and officers, as well as for the directors and officers of its subsidiaries, including Videotron and our subsidiaries, against certain liabilities incurred by them in such
79
Table of Contents
capacity. These policies are subject to customary deductibles and exceptions. The premiums in respect of this insurance are entirely paid by Quebecor, which is then reimbursed by Quebecor Media and its subsidiaries, including Videotron, for their rateable portion thereof.
| C- | Board Practices |
Reference is made to “A. Directors and Senior Management” above for the current term of office, if applicable, and the period during which our directors and senior management have served in that office.
There are no directors’ service contracts with us or any of our subsidiaries providing for benefits upon termination of employment.
Our Board of Directors is comprised of five directors. Each director is nominated and elected by Quebecor Media, our parent corporation, to serve until a successor director is elected or appointed. Our Board of Directors has an Audit Committee, but we do not have a compensation committee. The Human Resources and Compensation Committee of Quebecor Media decides certain matters relating to the compensation of officers and employees of Videotron, including certain matters relating to the Quebecor Media stock option plan, as discussed above.
Audit Committee
Videotron’s Audit Committee is currently composed of three Directors, namely Messrs. Jean La Couture, A. Michel Lavigne and Normand Provost. Mr. La Couture is the Chair of our Audit Committee and our Board of Directors has determined that Mr. La Couture is an “audit committee financial expert” as defined under SEC rules. See “Item 16A. Audit Committee Financial Expert”. Our Board of Directors has adopted the mandate of our Audit Committee in light of the Sarbanes-Oxley Act of 2002 and related SEC rulemaking. Our Audit Committee assists our Board of Directors in overseeing our financial controls and reporting. Our Audit Committee also oversees our compliance with financial covenants and legal and regulatory requirements governing financial disclosure matters and financial risk management.
The current mandate of our Audit Committee provides, among other things, that our Audit Committee reviews our annual and quarterly financial statements before they are submitted to our Board of Directors, as well as the financial information contained in our annual reports on Form 20-F, our management’s discussion and analysis of financial condition and results of operations, our quarterly reports furnished to the SEC under cover of Form 6-K and other documents containing similar information before their public disclosure or filing with regulatory authorities; reviews our accounting policies and practices; and discusses with our independent auditors the scope of their audit, as well as our auditors’ recommendations and observations with respect to the audit, our accounting policies and financial reporting, and the responses of our management with respect thereto. Our Audit Committee is also responsible for ensuring that we have in place adequate and effective internal control and management information systems to monitor our financial information and to ensure that our transactions with related parties are made on terms that are fair for us. Our Audit Committee pre-approves all audit services and permitted non-audit services and pre-approves all the fees pertaining to those services that are payable to our independent auditor, and submits the appropriate recommendations to our Board of Directors in connection with these services and fees. At least every five years, our Audit Committee carries out an assessment of the external auditor. It also reviews and approves our Code of Ethics for our President and Chief Executive Officer and principal financial officers.
| D- | Employees |
At December 31, 2014, we had approximately 6,432 employees. At December 31, 2013 and 2012, we had approximately 6,310 and 6,460 employees, respectively (excluding, at December 31, 2013, the employees of Jobboom inc., which was sold in 2013). Substantially all of our employees are based and work in the Province of Quebec. Approximately 3,860 of our employees are unionized, and the terms of their employment are governed by one of our four regional collective bargaining agreements. Our most important collective bargaining agreement, covering our unionized employees in the Montréal region, had terms extending to December 31, 2013. Negotiations regarding the Montréal collective bargaining agreement are still in progress; an agreement in principle has been reached, which remains subject to ratification. We also have two collective bargaining agreements covering our unionized employees in the Québec and Saguenay regions, with terms running through December 31, 2018 and December 31, 2019 respectively. Our Gatineau region collective bargaining agreement has a term extending to August 31, 2015, and one other collective bargaining agreement, covering approximately 60 employees of our SETTE inc. subsidiary has a term extending to December 31, 2015.
80
Table of Contents
| E- | Share Ownership |
No Videotron equity securities are held by any of our Directors or senior executive officers.
ITEM 7 – MAJOR SHAREHOLDERS AND RELATED PARTY TRANSACTIONS
| A- | Major Shareholders |
We are a wholly-owned subsidiary of Quebecor Media, a leading Canadian-based media and telecommunications company with interests in newspaper publishing operations, television broadcasting, telecommunications, book and magazine publishing and new media services. Through these interests, Quebecor Media holds leading positions in the creation, promotion and distribution of news, entertainment and Internet related services that are designed to appeal to audiences in every demographic category.
Quebecor holds, directly and indirectly, 77,812,366 common shares of Quebecor Media, representing a 75.4% voting and equity interest in Quebecor Media and CDPQ, indirectly holds 25,439,134 shares of Quebecor Media, representing a 24.6% interest in Quebecor Media. The primary asset of Quebecor, a communications holding company, is its interest in Quebecor Media. CDPQ is one of Canada’s largest pension fund managers.
| B- | Related Party Transactions |
The Corporation enters into related party transactions from time to time. These related party transactions are further described under “Item 5. Operating and Financial Review and Prospects – Cash Flow and Financial Position – Financial Position as of December 31, 2014” and in Note 8, in Note 9, in Note 11 and in Note 26 to our audited consolidated financial statements included under “Item 18. Financial Statements” in this annual report. These related party transactions have been accounted for at the consideration agreed between parties:
| As of December 31, | ||||||||||||
| 2014 | 2013 | 2012 | ||||||||||
| (in thousands of dollars) | ||||||||||||
Ultimate Parent and Parent Corporation: | ||||||||||||
Revenues | $ | 680 | $ | 541 | $ | 553 | ||||||
Purchase of goods and services | 7,572 | 8,508 | 6,539 | |||||||||
Operating expenses recovered | (682 | ) | (4,207 | ) | (1,154 | ) | ||||||
Affiliated Corporations: | ||||||||||||
Revenues | 10,349 | 11,019 | 13,084 | |||||||||
Purchase of goods and services | 81,148 | 73,193 | 75,641 | |||||||||
Operating expenses recovered | (701 | ) | (3,418 | ) | (2,496 | ) | ||||||
Management fee
The Corporation pays annual management fees to the parent corporation for services rendered to the Corporation, including internal audit, legal and corporate, financial planning and treasury, tax, real estate, human resources, risk management, public relations and other services. Management fees amounted to $43.5 million in 2014, $45.0 million in 2013 and $34.6 million in 2012. The agreement provides for an annual management fee to be agreed upon for the year 2015. In addition, the parent corporation is entitled to the reimbursement of out-of-pocket expenses incurred in connection with the services provided under the agreement.
81
Table of Contents
Income tax transactions
On September 20, 2013, the Corporation contracted a subordinated loan of $3.25 billion from Quebecor Media, bearing interest at a rate of 10.75%, payable every six months on June 20 and December 20, and maturing on September 20, 2043. On the same day, the Corporation invested the total proceeds of $3.25 billion into 3,250,000 preferred shares, Series B, of 9101-0835 Québec inc., a subsidiary of Quebecor Media. These shares carry the right to receive an annual dividend of 10.85%, payable semi-annually.
On December 27, 2013, 9101-0835 Québec inc., a subsidiary of Quebecor Media, redeemed 2,600,000 preferred shares, Series B, for a total cash consideration of $2.6 billion, and settled cumulative unpaid dividends of $5.4 million. On the same day, the Corporation used the total proceeds of $2.6 billion to repay part of its subordinated loan contracted from Quebecor Media.
On October 28, 2014, 9101-0835 Québec inc., a subsidiary of Quebecor Media, redeemed 1,200,000 preferred shares, Series B, for a total cash consideration of $1.2 billion, and settled cumulative unpaid dividends of $46.4 million. On the same day, the Corporation used the total proceeds of $1.2 billion to repay part of its subordinated loan contracted from Quebecor Media.
On October 31, 2012, Vidéotron Infrastructures inc., a wholly owned subsidiary of the Corporation, issued a subordinated loan of $800.0 million to Le SuperClub Vidéotron, now a wholly owned subsidiary of Quebecor Media, bearing interest at a rate of 11.00% payable every 6 months on June 20 and December 20 and maturing on October 31, 2027. On the same day, Vidéotron Infrastructures inc. issued 800,000 preferred shares, Class G to Le SuperClub Vidéotron for a total cash consideration of $800.0 million. These shares carry the right to receive an annual dividend of 11.25%, payable semi-annually.
On January 21, 2013, Vidéotron Infrastructures inc. redeemed from Le SuperClub Vidéotron 720,000 preferred shares, Class G, for a total cash consideration of $720.0 million, and settled cumulative unpaid dividends of $7.1 million. On the same day, Le SuperClub Vidéotron used the total proceeds of $720.0 million to repay a portion of the subordinated loan contracted from Vidéotron Infrastructures Inc.
On October 18, 2013, Vidéotron Infrastructures inc. redeemed from Le SuperClub Vidéotron 80,000 preferred shares, Class G, for a total cash consideration of $80.0 million, and settled cumulative unpaid dividends of $3.0 million. On the same day, Le SuperClub Vidéotron used the total proceeds of $80.0 million to repay the outstanding portion of the subordinated loan contracted from Vidéotron Infrastructures Inc.
The above transactions were carried out for tax consolidation purposes of Quebecor Media and its subsidiaries, on terms equivalent to those that prevail on an arm’s length basis and accounted for at the consideration agreed between parties.
Purchase of shares of Quebecor Media and subsidiary subordinated loans
Unlike corporations in the United States, corporations in Canada are not permitted to file consolidated tax returns. As a result, we enter into certain transactions from time to time that have the effect of using tax losses within the Quebecor Media Group. These transactions are described further under “Item 5. Operating and Financial Review and Prospects – Cash Flow and Financial Position – Financial Position as of December 31, 2014” and in Note 11 and in Note 26 to our audited consolidated financial statements which are included under “Item 18. Financial Statements” in this annual report.
| C- | Interests of Experts and Counsel |
Not applicable.
82
Table of Contents
ITEM 8 – FINANCIAL INFORMATION
| A- | Consolidated Statements and Other Financial Information |
Our consolidated balance sheets as at December 31, 2014 and 2013, and our consolidated statements of income, comprehensive income, equity and cash flows for the years ended December 31, 2014, 2013 and 2012, including the notes thereto and together with the report of Independent Registered Public Accounting Firm, are included beginning on pageF-1 of this annual report.
Legal Proceedings
In 2001, we refused to complete the acquisition of Cable-Axion, a cable operator, claiming that a material adverse change had occurred. However, Telus and Novacap disagreed and, as shareholders and interest owners of Cable-Axion, they filed an action in damages against us for an amount of $18.8 million in 2002. The trial occurred during the fall of 2014. On January 20, 2015, the Superior Court of Québec rendered a judgement against us in the amount of $34.3 million (including accrued interest). On February 18, 2015, we filed an appeal against this judgment with the Court of Appeal of Québec.
Dividend Policy
During the year ended December 31, 2014, we paid aggregate cash dividends of $410,000,000 on our common shares. During the year ended December 31, 2013, we paid aggregate cash dividends of $361,880,099.43 on our common shares. During the year ended December 31, 2012, we paid aggregate cash dividends of $760,000,000 on our common shares. We currently expect to pay dividends and other distributions on our common shares in the future. The declaration and payment of dividends and other distributions is in the sole discretion of our Board of Directors, and any decision regarding the declaration of dividends and other distributions will be made by our Board of Directors depending on, among other things, our financial resources, the cash flows generated by our business, our capital needs, and other factors considered relevant by our Board of Directors, including the terms of our indebtedness and applicable law.
| B- | Significant Changes |
Except as otherwise disclosed in this annual report, there has been no other material adverse change in our financial position since December 31, 2014.
ITEM 9 – THE OFFER AND LISTING
| A- | Offer and Listing Details |
Not applicable.
| B- | Plan of Distribution |
Not applicable.
| C- | Markets |
Outstanding Notes
On April 9, 2014, we issued and sold US$600.0 million aggregate principal amount of our 5 3/8% Senior Notes due June 15, 2024, in a private placements exempt from the registration requirement of the Securities Act and the prospectus requirements of applicable Canadian securities laws.
On June 17, 2013, we issued and sold $400.0 million aggregate principal amount of our 5 5/8% Senior Notes due June 15, 2025 in private placements exempt from the registration requirement of the Securities Act and the prospectus requirements of applicable Canadian securities laws.
83
Table of Contents
On March 14, 2012, we issue and sold US$800.0 million aggregate principal amount of our 5% Senior Notes due July 15, 2022 in private placements exempt from the registration requirements of the Securities Act. In connection with the issuance of these unregistered notes, we filed a registration statement on FormF-4 with the SEC on May 17, 2012 and completed the registered exchange offer in July 2012. As a result, our 5% Senior Notes due July 15, 2022 have been registered under the Securities Act.
On July 5, 2011, we issued and sold $300.0 million aggregate principal amount of our 6 7/8% Senior Notes due July 15, 2021 in private placements exempt from the registration requirement of the Securities Act and the prospectus requirements of applicable Canadian securities laws.
On January 13, 2010, we issued and sold $300.0 million aggregate principal amount of our 7 1/8% Senior Notes due January 15, 2020 in private placements exempt from the registration requirement of the Securities Act and the prospectus requirements of applicable Canadian securities laws.
On April 15, 2008, we issued and sold US$455.0 million aggregate principal amount of our 9 1/8% Senior Notes due April 15, 2018 in private placements exempt from the registration requirements of the Securities Act, and on March 5, 2009, we issued and sold an additional aggregate principal amount of US$260.0 million of these 9 1/8% Senior Notes due April 15, 2018 (under the same indenture) in a private placement exempt from the registration requirements of the Securities Act. On July 2, 2013, we repurchased and redeemed US$380.0 million aggregate principal amount of our 9 1/8% Senior Notes due April 15, 2018. On April 24, 2014, we repurchased and redeemed US$260.0 million aggregate principal amount of our 9 1/8% Senior Notes due April 15, 2018.
On September 16, 2005, we issued and sold US$175.0 million aggregate principal amount of our 6 3/8% Senior Notes due December 15, 2015 in private placements exempt from the registration requirements of the Securities Act. In connection with the issuance of these unregistered notes, we filed a registration statement on FormF-4 with the SEC on December 16, 2005 and completed the registered exchange offer on February 6, 2006. As a result, our 6 3/8% Senior Notes due December 15, 2015 have been registered under the Securities Act. On March 11, 2015, we issued a notice of redemption for all of our outstanding 6 3/8% Senior Notes due December 15, 2015. The redemption is anticipated to be completed on April 10, 2015.
There is currently no established trading market for our Senior Notes. There can be no assurance as to the liquidity of any market that may develop for our outstanding Senior Notes, the ability of the holders of any such Senior Notes to sell them or the prices at which any such sales may be made. We have not and do not presently intend to apply for a listing of our outstanding Senior Notes on any exchange or automated dealer quotation system.
The record holder of each series of our Senior Notes (other than our 7 1/8% Senior Notes due 2020, our 6 7/8% Senior Notes due 2021 and our 5 5/8% Senior Notes due 2025) is Cede & Co., a nominee of The Depository Trust Corporation, and the record holder of our 7 1/8% Senior Notes due 2020, our 6 7/8% Senior Notes due 2021 and our 5 5/8% Senior Notes due 2025 is CDS Clearing and Depository Services Inc.
| D- | Selling Shareholders |
Not applicable.
| E- | Dilution |
Not applicable.
| F- | Expenses of the Issue |
Not applicable.
ITEM 10 – ADDITIONAL INFORMATION
| A- | Share Capital |
Not applicable.
84
Table of Contents
| B- | Memorandum and Articles of Association |
The Articles of Amalgamation of Videotron, dated as of July 1, 2006, and the Articles of Amendment of Videotron, dated as of June 30, 2008 and December 12, 2008 are referred to as our “Articles”. Our Articles are included as exhibits to this annual report. The following is a summary of certain provisions of our Articles and by-laws:
On July 1, 2006, Vidéotron ltée and 9101-0827 Québec inc. amalgamated, under Part IA of theCompanies Act (Québec), into a single corporation using the name “Videotron Ltd.” (or “Vidéotron ltée” in French) with the Designating Number 1163819882. Since its coming into force on February 14, 2011, Videotron is governed by theBusiness Corporations Act (Québec). The Articles provide no restrictions on the purposes or activities that may be undertaken by Videotron.
| 1. (a) | Our by-laws provide that a director must disclose the nature and value of any interest he has in a contract or transaction to which our Corporation is a party. A director must also disclose a contract or transaction to which the Corporation and any of the following are a party: |
| (i) | an associate of the director; |
| (ii) | a group of which the director is a director; |
| (iii) | a group in which the director or an associate of the director has an interest. |
No director may vote on a resolution to approve, amend or terminate the contract or transaction, or be present during deliberations concerning the approval, amendment or termination of such a contract or transaction unless the contract or transaction:
| (i) | relates primarily to the remuneration of the director or an associate of the director as a director of the Corporation or an affiliate of the Corporation; |
| (ii) | relates primarily to the remuneration of the director or an associate of the director as an officer, employee or mandatary of the Corporation or an affiliate of the Corporation, if the Corporation is not a reporting issuer; |
| (iii) | is for the indemnification of the directors in certain circumstances or liability insurance taken out by the Corporation; |
| (iv) | is with an affiliate of the Corporation, and the sole interest of the director is as a director or officer of the affiliate. |
| (b) | Neither the Articles nor our by-laws contain provisions with respect to directors’ power, in the absence of an independent quorum, to determine their remuneration. |
| (c) | Subject to any restriction which may from time to time be included in the Articles or our by-laws, or the terms, rights or restrictions of any of our shares or securities outstanding, our directors may authorize us, by ordinary resolution, to borrow money and obtain advances upon the credit of our corporation when they consider it appropriate. Our directors also may, by ordinary resolution, when they consider it appropriate, (i) issue bonds or other securities of our corporation and give them in guarantee or sell them for prices and amounts deemed appropriate; (ii) mortgage, pledge or give as surety our present or future movable and immovable property to ensure the payment of these bonds or other securities or give a part only of these guarantees for the same purposes; and (iii) mortgage or pledge our real estate or give as security or otherwise encumber with any charge our movables or give these various kinds of securities to assure the payment of loans made other than by the issuance of bonds as well as the payment or the execution of other debts, contracts and commitments of our corporation. |
Neither the Articles nor our by-laws contain any provision with respect to (i) the retirement or non-retirement of our directors under an age limit requirement or (ii) the number of shares, if any, required for the qualification of our directors.
85
Table of Contents
| 2. | The rights, preferences and restrictions attaching to our common shares and our preferred shares (consisting of our Class “A” Common Shares and our authorized classes of preferred shares, comprised or our Class “B” Preferred Shares, Class “C” Preferred Shares, Class “D” Preferred Shares, Class “E” Preferred Shares, Class “F” Preferred Shares, Class “G” Preferred Shares and Class “H” Preferred Shares) are set forth below: |
Common Shares
Class “A” Common Shares
| (a) | Dividend rights: Subject to the rights of the holders of our preferred shares (including their redemption rights) and subject to applicable law, each Class “A” Common Share is entitled to receive such dividends as our Board of Directors shall determine. |
| (b) | Voting rights:The holders of Class “A” Common Shares are entitled to vote at each shareholders’ meeting with the exception of meetings at which only the holders of another class of shares are entitled to vote. Each Class “A” Common Share entitles the holder to one vote. The holders of the Class “A” Common Shares shall elect the directors of Videotron at an annual or special meting of shareholders called for that purpose, except that any vacancy occurring in the Board of Directors may be filled, for the remainder of the term, by our Directors. At any meeting of shareholders called for such purpose, directors are elected by a majority of the votes cast in respect of such election. |
| (c) | Rights to share in our profits: Other than as described in paragraph (a) above (whereby the holders of our Class “A” Common Shares are entitled to receive dividends as determined by our Board of Directors subject to certain restrictions) and paragraph (d) below (whereby the holders of our Class “A” Common Shares are entitled to participation in the remaining property and assets of our company available for distribution in the event of liquidation or dissolution), None. |
| (d) | Rights upon liquidation: In the event of our liquidation or dissolution or any other distribution of our assets among our shareholders for the purpose of winding-up our affairs, whether voluntarily or involuntarily, the holders of our Class “A” Common Shares shall be entitled, subject to the rights of the holders of our preferred shares, to participate equally, share for share, in our residual property and assets available for distribution to our shareholders, without preference or distinction. |
| (e) | Redemption provisions:None. |
| (f) | Sinking fund provisions:None. |
| (g) | Liability to further capital calls by us: None, provided that our directors may make calls upon the shareholders in respect of any moneys unpaid upon their shares. |
| (h) | Provisions discriminating against existing or prospective holders of common shares as a result of such holders owning a substantial number of common shares: None. |
Preferred Shares
Class “B” Preferred Shares
| (a) | Dividend rights: When our Board of Directors declares a dividend, the holders of our Class “B” Preferred Shares have the right to receive, in priority over the holders of our Class “A” Common Shares, Class “C” Preferred Shares, Class “D” Preferred Shares, Class “E” Preferred Shares, Class “F” Preferred Shares and Class “H” Preferred Shares, but subordinated to the holders of our Class “G” Preferred Shares, a preferential and non-cumulative dividend at the fixed rate of 1% per month, calculated on the basis of the applicable redemption value of our Class “B” Preferred Shares. A dividend may be declared and payable in cash, in kind or through the issuance of fully paid shares of any class of our corporation. |
86
Table of Contents
| (b) | Voting rights: Subject to applicable law and except as expressly otherwise provided, the holders of our Class “B” Preferred Shares do not have the right to receive notice of meetings of shareholders or to attend any such meeting or vote at any such meeting. |
| (c) | Rights to share in our profits:Other than as described in paragraph (a) above (whereby the holders of our Class “B” Preferred Shares are entitled to receive certain dividends, if and when declared by our Board of Directors), paragraph (d) below (whereby the holders of our Class “B” Preferred Shares are entitled to participate in the distribution of the residual property and assets of Videotron available for distribution in the event of our liquidation or winding-up) and paragraph (e) below (whereby the holders of our Class “B” Preferred Shares have certain redemption rights): None. |
| (d) | Rights upon liquidation: In the event of our liquidation, dissolution or other distribution of our assets among our shareholders for the purpose of winding-up our affairs, whether voluntarily or involuntarily, the holders of the Class “B” Preferred Shares shall be entitled to repayment of the amount paid for the Class “B” Preferred Shares in the subdivision of the issued and paid-up share capital account relating to the Class “B” Preferred Shares. |
In addition, in the event of our liquidation, dissolution or other distribution of our assets among our shareholders for the purpose of winding-up our affairs, whether voluntarily or involuntarily, the rights of holders of Class “B” Preferred Shares as regards to payment of dividends and the right to participate in the distribution of residual assets, shall rank in priority to the rights of the holders of our Class “A” Common Shares, Class “C” Preferred Shares, Class “D” Preferred Shares, Class “E” Preferred Shares, Class “F” Preferred Shares and Class “H” Preferred Shares, but subordinated to the rights of holders of our Class “G” Preferred Shares.
| (e) | Redemption provisions: Subject to the provisions of theBusiness Corporations Act (Québec), the holders of our Class “B” Preferred Shares have, at any time, the right to require Videotron to redeem (referred to as a “retraction right”) any or all of their Class “B” Preferred Shares at a redemption price equal to the amount paid for such shares in the subdivision of the issued and paid-up share capital account relating to such shares, plus a specified premium, if applicable, plus the amount of any declared and unpaid dividends. |
In addition, Videotron may, at its option, redeem any or all of the Class “B” Preferred Shares outstanding at any time at an aggregate redemption price equal to the consideration received by Videotron for these Class “B” Preferred Shares. Videotron may also, when it deems it appropriate and without giving notice or taking into account the other classes of shares, buy, pursuant to a private agreement, all or some of the Class “B” Preferred Shares outstanding at a purchase price for any such Class “B” Preferred Shares not exceeding the retraction right purchase price described above or the book value of Videotron’s net assets.
| (f) | Sinking fund provisions: None. |
| (g) | Liability to further capital calls by us: None, provided that our directors may make calls upon the shareholders in respect of any moneys unpaid upon their shares. |
| (h) | Provisions discriminating against existing or prospective holders of our Class “B” Preferred Shares as a result of such holder owning a substantial number of our Class “B” Preferred Shares: None. |
Class “C” Preferred Shares
| (a) | Dividend rights:When our Board of Directors declares a dividend, the holders of our Class “C” Preferred Shares have the right to receive, in priority over the holders of our Class “A” Common Shares, Class “D” Preferred Shares, Class “E” Preferred Shares, Class “F” Preferred Shares and Class “H” Preferred Shares, but subordinated to the holders of our Class “B” Preferred Shares and Class “G” Preferred Shares, a preferential and non-cumulative dividend at the fixed rate of 1% per month, calculated on the basis of the applicable redemption value of our Class “C” Preferred Shares. A dividend may be declared and payable in cash, in kind or through the issuance of fully paid shares of any class of our corporation. |
87
Table of Contents
| (b) | Voting rights: Subject to applicable law and except as expressly otherwise provided, the holders of our Class “C” Preferred Shares do not have the right to receive notice of meetings of shareholders or to attend any such meeting or vote at any such meeting. |
| (c) | Rights to share in our profits: Other than as described in paragraph (a) above (whereby the holders of our Class “C” Preferred Shares are entitled to receive certain dividends, if and when declared by our Board of Directors), paragraph (d) below (whereby the holders of our Class “C” Preferred Shares are entitled to participate in the distribution of the residual property and assets of Videotron available for distribution in the event of our liquidation or winding-up) and paragraph (e) below (whereby the holders of our Class “C” Preferred Shares have certain redemption rights): None. |
| (d) | Rights upon liquidation: In the event of our liquidation, dissolution or other distribution of our assets among our shareholders for the purpose of winding-up our affairs, whether voluntarily or involuntarily, the holders of the Class “C” Preferred Shares shall be entitled to repayment of the amount paid for the Class “C” Preferred Shares in the subdivision of the issued and paid-up share capital account relating to the Class “C” Preferred Shares. |
In addition, in the event of our liquidation, dissolution or other distribution of our assets among our shareholders for the purpose of winding-up our affairs, whether voluntarily or involuntarily, the rights of holders of Class “C” Preferred Shares as regards to payment of dividends and the right to participate in the distribution of residual assets, shall rank in priority to the rights of the holders of our Class “A” Common Shares, Class “D” Preferred Shares, Class “E” Preferred Shares, Class “F” Preferred Shares and Class “H” Preferred Shares, but subordinated to the rights of holders of our Class “B” Preferred Shares and Class “G” Preferred Shares.
| (e) | Redemption provisions: Subject to the provisions of theBusiness Corporations Act (Québec), the holders of our Class “C” Preferred Shares have, at any time, the right to require Videotron to redeem (referred to as a “retraction right”) any or all of their Class “C” Preferred Shares at a redemption price equal to the amount paid for such shares in the subdivision of the issued and paid-up share capital account relating to such shares, plus a specified premium, if applicable, plus the amount of any declared and unpaid dividends. |
In addition, Videotron may, at its option, redeem any or all of the Class “C” Preferred Shares outstanding at any time at an aggregate redemption price equal to the consideration received by Videotron for these Class “C” Preferred Shares. Videotron may also, when it deems it appropriate and without giving notice or taking into account the other classes of shares, buy, pursuant to a private agreement, all or some of the Class “C” Preferred Shares outstanding at a purchase price for any such Class “C” Preferred Shares not exceeding the retraction right purchase price described above or the book value of Videotron’s net assets.
| (f) | Sinking fund provisions: None. |
| (g) | Liability to further capital calls by us:None, provided that our directors may make calls upon the shareholders in respect of any moneys unpaid upon their shares. |
| (h) | Provisions discriminating against existing or prospective holders of our Class “C” Preferred Shares as a result of such holder owning a substantial number of our Class “C” Preferred Shares: None. |
Class “D” Preferred Shares
| (a) | Dividend rights: When our Board of Directors declares a dividend, the holders of our Class “D” Preferred Shares have the right to receive, in priority over the holders of our Class “A” Common Shares, Class “E” Preferred Shares, Class “F” Preferred Shares and Class “H” Preferred Shares, but subordinated to the holders of our Class “B” Preferred Shares, Class “C” Preferred Shares and Class “G” Preferred Shares, a preferential and non cumulative dividend at the fixed rate of 1% per month, calculated on the basis of the applicable redemption value of our Class “D” Preferred Shares. A dividend may be declared and payable in cash, in kind or through the issuance of fully paid shares of any class of our corporation. |
88
Table of Contents
| (b) | Voting rights:Subject to applicable law and except as expressly otherwise provided, the holders of our Class “D” Preferred Shares do not have the right to receive notice of meetings of shareholders or to attend any such meeting or vote at any such meeting. |
| (c) | Rights to share in our profits: Other than as described in paragraph (a) above (whereby the holders of our Class “D” Preferred Shares are entitled to receive certain dividends, if and when declared by our Board of Directors), paragraph (d) below (whereby the holders of our Class “D” Preferred Shares are entitled to participate in the distribution of the residual property and assets of Videotron available for distribution in the event of our liquidation or winding-up) and paragraph (e) below (whereby the holders of our Class “D” Preferred Shares have certain redemption rights): None. |
| (d) | Rights upon liquidation:In the event of our liquidation, dissolution or other distribution of our assets among our shareholders for the purpose of winding-up our affairs, whether voluntarily or involuntarily, the holders of the Class “D” Preferred Shares shall be entitled to repayment of the amount paid for the Class “D” Preferred Shares in the subdivision of the issued and paid-up share capital account relating to the Class “D” Preferred Shares. |
In addition, in the event of our liquidation, dissolution or other distribution of our assets among our shareholders for the purpose of winding-up our affairs, whether voluntarily or involuntarily, the rights of holders of Class “D” Preferred Shares as regards to payment of dividends and the right to participate in the distribution of residual assets, shall rank in priority to the rights of the holders of our Class “A” Common Shares, Class “E” Preferred Shares, Class “F” Preferred Shares and Class “H” Preferred Shares, but subordinated to the rights of holders of our Class “B” Preferred Shares, Class “C” Preferred Shares and Class “G” Preferred Shares.
| (e) | Redemption provisions: Subject to the provisions of theBusiness Corporations Act (Québec), the holders of our Class “D” Preferred Shares have, at any time, the right to require Videotron to redeem (referred to as a “retraction right”) any or all of their Class “D” Preferred Shares at a redemption price equal to the amount paid for such shares in the subdivision of the issued and paid-up share capital account relating to such shares, plus a specified premium, if applicable, plus the amount of any declared and unpaid dividends. |
In addition, Videotron may, at its option, redeem any or all of the Class “D” Preferred Shares outstanding at any time at an aggregate redemption price equal to the consideration received by Videotron for these Class “D” Preferred Shares. Videotron may also, when it deems it appropriate and without giving notice or taking into account the other classes of shares, buy, pursuant to a private agreement, all or some of the Class “D” Preferred Shares outstanding at a purchase price for any such Class “D” Preferred Shares not exceeding the retraction right purchase price described above or the book value of Videotron’s net assets.
| (f) | Sinking fund provisions:None. |
| (g) | Liability to further capital calls by us: None, provided that our directors may make calls upon the shareholders in respect of any moneys unpaid upon their shares. |
| (h) | Provisions discriminating against existing or prospective holders of our Class “D” Preferred Shares as a result of such holder owning a substantial number of our Class “D” Preferred Shares:None. |
Class “E” Preferred Shares
| (a) | Dividend rights: When our Board of Directors declares a dividend, the holders of our Class “E” Preferred Shares have the right to receive, in priority over the holders of our Class “A” Common Shares, Class “F” Preferred Shares and Class “H” Preferred Shares, but subordinated to the holders of our Class “B” Preferred Shares, Class “C” Preferred Share, Class “D” Preferred Share and Class “G” Preferred Shares, a preferential and non cumulative dividend at the fixed rate of 1% per month, calculated on the basis of the applicable redemption value of our Class “E” Preferred Shares. A dividend may be declared and payable in cash, in kind or through the issuance of fully paid shares of any class of our corporation. |
89
Table of Contents
| (b) | Voting rights: Subject to applicable law and except as expressly otherwise provided, the holders of our Class “E” Preferred Shares do not have the right to receive notice of meetings of shareholders or to attend any such meeting or vote at any such meeting. |
| (c) | Rights to share in our profits: Other than as described in paragraph (a) above (whereby the holders of our Class “E” Preferred Shares are entitled to receive certain dividends, if and when declared by our Board of Directors), paragraph (d) below (whereby the holders of our Class “E” Preferred Shares are entitled to participate in the distribution of the residual property and assets of Videotron available for distribution in the event of our liquidation or winding-up) and paragraph (e) below (whereby the holders of our Class “E” Preferred Shares have certain redemption rights): None. |
| (d) | Rights upon liquidation:In the event of our liquidation, dissolution or other distribution of our assets among our shareholders for the purpose of winding-up our affairs, whether voluntarily or involuntarily, the holders of the Class “E” Preferred Shares shall be entitled to repayment of the amount paid for the Class “E” Preferred Shares in the subdivision of the issued and paid-up share capital account relating to the Class “E” Preferred Shares. |
In addition, in the event of our liquidation, dissolution or other distribution of our assets among our shareholders for the purpose of winding-up our affairs, whether voluntarily or involuntarily, the rights of holders of Class “E” Preferred Shares as regards to payment of dividends and the right to participate in the distribution of residual assets, shall rank in priority to the rights of the holders of our Class “A” Common Share, Class “F” Preferred Shares and Class “H” Preferred Shares, but subordinated to the rights of holders of our Class “B” Preferred Shares, Class “C” Preferred Shares, Class “D” Preferred Shares and Class “G” Preferred Shares.
| (e) | Redemption provisions:Subject to the provisions of theBusiness Corporations Act (Québec), the holders of our Class “E” Preferred Shares have, at any time, the right to require Videotron to redeem (referred to as a “retraction right”) any or all of their Class “E” Preferred Shares at a redemption price equal to the amount paid for such shares in the subdivision of the issued and paid-up share capital account relating to such shares, plus a specified premium, if applicable, plus the amount of any declared and unpaid dividends. |
In addition, Videotron may, at its option, redeem any or all of the Class “E” Preferred Shares outstanding at any time at an aggregate redemption price equal to the consideration received by Videotron for these Class “E” Preferred Shares. Videotron may also, when it deems it appropriate and without giving notice or taking into account the other classes of shares, buy, pursuant to a private agreement, all or some of the Class “E” Preferred Shares outstanding at a purchase price for any such Class “E” Preferred Shares not exceeding the retraction right purchase price described above or the book value of Videotron’s net assets.
| (f) | Sinking fund provisions: None. |
| (g) | Liability to further capital calls by us:None, provided that our directors may make calls upon the shareholders in respect of any moneys unpaid upon their shares. |
| (h) | Provisions discriminating against existing or prospective holders of our Class “E” Preferred Shares as a result of such holder owning a substantial number of our Class “E” Preferred Shares: None. |
Class “F” Preferred Shares
| (a) | Dividend rights: When our Board of Directors declares a dividend, the holders of our Class “F” Preferred Shares have the right to receive, in priority over the holders of our Class “A” Common Shares and Class “H” Preferred Shares, but subordinated to the holders of our Class “B” Preferred Shares, Class “C” Preferred Shares, Class “D” Preferred Shares, Class “E” Preferred Shares and Class “G” Preferred Shares, a preferential and non-cumulative dividend at the fixed rate of 1% per month, calculated on the basis of the applicable redemption value of our Class “F” Preferred Shares. A dividend may be declared and payable in cash, in kind or through the issuance of fully paid shares of any class of our corporation. |
90
Table of Contents
| (b) | Voting rights:Subject to applicable law and except as expressly otherwise provided, the holders of our Class “F” Preferred Shares do not have the right to receive notice of meetings of shareholders or to attend any such meeting or vote at any such meeting. |
| (c) | Rights to share in our profits: Other than as described in paragraph (a) above (whereby the holders of our Class “F” Preferred Shares are entitled to receive certain dividends, if and when declared by our Board of Directors), paragraph (d) below (whereby the holders of our Class “F” Preferred Shares are entitled to participate in the distribution of the residual property and assets of Videotron available for distribution in the event of our liquidation or winding-up) and paragraph (e) below (whereby the holders of our Class “F” Preferred Shares have certain redemption rights): None. |
| (d) | Rights upon liquidation:In the event of our liquidation, dissolution or other distribution of our assets among our shareholders for the purpose of winding-up our affairs, whether voluntarily or involuntarily, the holders of the Class “F” Preferred Shares shall be entitled to repayment of the amount paid for the Class “F” Preferred Shares in the subdivision of the issued and paid-up share capital account relating to the Class “F” Preferred Shares. |
In addition, in the event of our liquidation, dissolution or other distribution of our assets among our shareholders for the purpose of winding-up our affairs, whether voluntarily or involuntarily, the rights of holders of Class “F” Preferred Shares as regards to payment of dividends and the right to participate in the distribution of residual assets, shall rank in priority to the rights of the holders of our Class “A” Common Shares and Class “H” Preferred Shares, but subordinated to the rights of holders of our Class “B” Preferred Shares, Class “C” Preferred Shares, Class “D” Preferred Shares, Class “E” Preferred Shares and Class “G” Preferred Shares.
| (e) | Redemption provisions: Subject to the provisions of theBusiness Corporations Act (Québec), the holders of our Class “F” Preferred Shares have, at any time, the right to require Videotron to redeem (referred to as a “retraction right”) any or all of their Class “F” Preferred Shares at a redemption price equal to the amount paid for such shares in the subdivision of the issued and paid-up share capital account relating to such shares, plus a specified premium, if applicable, plus the amount of any declared and unpaid dividends. |
In addition, Videotron may, at its option, redeem any or all of the Class “F” Preferred Shares outstanding at any time at an aggregate redemption price equal to the consideration received by Videotron for these Class “F” Preferred Shares. Videotron may also, when it deems it appropriate and without giving notice or taking into account the other classes of shares, buy, pursuant to a private agreement, all or some of the Class “F” Preferred Shares outstanding at a purchase price for any such Class “F” Preferred Shares not exceeding the retraction right purchase price described above or the book value of Videotron’s net assets.
| (f) | Sinking fund provisions: None. |
| (g) | Liability to further capital calls by us: None, provided that our directors may make calls upon the shareholders in respect of any moneys unpaid upon their shares. |
| (h) | Provisions discriminating against existing or prospective holders of our Class “F” Preferred Shares as a result of such holder owning a substantial number of our Class “F” Preferred Shares: None. |
Class “G” Preferred Shares
| (a) | Dividend rights: When our Board of Directors declares a dividend, the holders of our Class “G” Preferred Shares have the right to receive, in priority over the holders of our common shares and preferred shares of other series, a preferential and cumulative dividend, payable semi-annually, at the fixed rate of 11.25% per year, calculated daily on the basis of the applicable redemption value of our Class “G” Preferred Shares. No dividends may be paid on any common shares or preferred shares of other series unless all dividends which shall have become payable on the Class “G” Preferred Shares have been paid or set aside for payment. |
91
Table of Contents
| (b) | Voting rights: Subject to applicable law and except as expressly otherwise provided, the holders of our Class “G” Preferred Shares do not have the right to receive notice of meetings of shareholders or to attend any such meeting or vote at any such meeting. |
However, in the event that we shall have failed to pay eight (8) half-yearly dividends, whether or not consecutive, on the Class “G” Preferred Shares, and only for so long as the dividend remains in arrears, the holders of Class “G” Preferred Shares shall have the right to receive notice of meetings of shareholders and to attend and vote at any such meetings, except meetings at which only holders of another specified series or class of shares are entitled to vote. At each such meeting, each Class “G” Preferred Share shall entitle the holder thereof to one vote.
| (c) | Rights to share in our profits: Except as described in paragraph (a) above (whereby the holders of our Class “G” Preferred Shares are entitled to receive a 11.25% cumulative preferred dividend in preference to the holders of our common shares and other series of our preferred shares), paragraph (d) below (whereby the holders of our Class “G” Preferred Shares are entitled to receive, in preference to the holders of our common shares and other series of our preferred shares, an amount equal to $1,000 per Class “G” Preferred Share and any accumulated and unpaid dividends with respect thereto in the event of our liquidation, winding-up or reorganization) and paragraph (e) below (whereby the holders of our Class “G” Preferred Shares may require us to redeem the Class “G” Preferred Shares at a redemption price of $1,000 per share plus any accrued and unpaid dividends with respect thereto): None. |
| (d) | Rights upon liquidation: In the event of our liquidation, dissolution or reorganization or any other distribution of our assets among our shareholders for the purpose of winding-up our affairs, whether voluntarily or involuntarily, the holders of our Class “G” Preferred Shares shall be entitled to receive in preference to the holders of our common shares and our preferred shares of other series an amount equal to $1,000 per Class “G” Preferred Share and any accrued and unpaid dividends with respect thereto. |
Our Class “G” Preferred Shares have priority over our common shares and our preferred shares of other series as to the order of priority of the distribution of assets in case of the liquidation or dissolution of our corporation, voluntary or involuntary, or of any other distribution of our assets to our shareholders for the purpose of winding up our affairs.
| (e) | Redemption provisions: Subject to the provisions of theBusiness Corporations Act (Québec), the holders our Class “G” Preferred Shares have, at any time, the right to require Videotron to redeem any and all of their shares at a redemption price equal to $1,000 per share plus any accrued and unpaid dividends with respect thereto. In addition, we may, at our option, redeem any and all Class “G” Preferred Shares at any time at a redemption price equal to $1,000 per share plus any accrued and unpaid dividends with respect thereto. |
| (f) | Sinking fund provisions:None. |
| (g) | Liability to further capital calls by us: None, provided that our directors may make calls upon the shareholders in respect of any moneys unpaid upon their shares. |
| (h) | Provisions discriminating against existing or prospective holders of our Class “G” Preferred Shares as a result of such holder owning a substantial number of our Class “G” Preferred Shares: None. |
Class “H” Preferred Shares
| (a) | Dividend rights:The holders of Class “H” Preferred Shares shall be entitled to receive, every year, in such manner and at such time as our Board of Directors may declare, a non cumulative dividend at the fixed rate of 1% per month, calculated on the redemption price of the Class “H” Preferred Shares, payable in cash, property or through the issuance of fully paid shares of any class of the Corporation. |
| (b) | Voting rights: Subject to applicable law and except as expressly otherwise provided, the holders of our Class “H” Preferred Shares do not have the right to receive notice of meetings of shareholders or to attend any such meeting or vote at any such meeting. |
92
Table of Contents
| (c) | Rights to share in our profits: Except as described in paragraph (a) above (whereby the holders of our Class “H” Preferred Shares are entitled to receive, every year, in such manner and at such time as our Board of Directors may declare, a non cumulative dividend at the fixed rate of 1% per month), paragraph (d) below (whereby the holders of our Class “H” Preferred Shares are entitled to entitled to repayment of the amount paid for the Class “H” Preferred Shares in the event of our liquidation, winding-up or reorganization) and paragraph (e) below (whereby the holders of our Class “H” Preferred Shares may require us to redeem the Class “H” Preferred Shares at a specified redemption price): None. |
| (d) | Rights upon liquidation: In the event of our liquidation, dissolution or reorganization or any other distribution of our assets among our shareholders for the purpose of winding-up our affairs, whether voluntarily or involuntarily, the holders of our Class “H” Preferred Shares shall be entitled to repayment of the amount paid for the Class “H” Preferred Shares into the subdivision of the issued and paid-up share capital account relating to the Class “H” Preferred Shares. |
| (e) | Redemption provisions:Subject to the provisions of theBusiness Corporations Act (Québec), we may elect to redeem the Class “H” Preferred Shares at any time at a price equal to the specified redemption price plus an amount equal to any dividends declared thereon but unpaid up to the date of redemption. The specified redemption price is, subject to certain conditions, equal to the aggregate consideration received for such share. |
| (f) | Sinking fund provisions: None. |
| (g) | Liability to further capital calls by us:None, provided that our directors may make calls upon the shareholders in respect of any moneys unpaid upon their shares. |
| (h) | Provisions discriminating against existing or prospective holders of our Class “H” Preferred Shares as a result of such holder owning a substantial number of our Class “H” Preferred Shares: None. |
| 3. | Actions necessary to change the rights of shareholders. Under theBusiness Corporations Act (Québec), (i) the Articles may only be amended by the affirmative vote of the holders of two-thirds ( 2/3) of the votes cast by the shareholders at a special meeting called for that purpose and (ii) our by-laws may be amended by our Board of Directors and ratified by a majority of the votes cast by the shareholders at the next shareholders meeting. Unless they are rejected by the shareholders at the close of the meeting or not submitted to the shareholders, the amendedby-laws are effective as of the date of the resolution of the Board of Directors approving them. However,by-law amendments relating to procedural matters with respect to shareholders meetings take effect only once they have received shareholders approval. In addition, pursuant to theBusiness Corporations Act (Québec), we may not make any amendments to the Articles that affect the rights, conditions, privileges or restrictions attaching to issued shares of any series outstanding, other than an increase in the share capital or the number of our authorized shares, without obtaining the consent of all the shareholders concerned by the amendment, whether or not they are eligible to vote. In order to change the rights of our shareholders, we would need to amend our Articles to effect the change. Such an amendment would require the approval of holders of two-thirds ( 2/3) of the shares at a duly called special meeting. For amendments affecting the rights of a particular class or series of shares, the holders of such class or series of shares are entitled to a separate vote, whether or not shares of this class or series otherwise carry the right to vote. Such a proposed amendment will be effected only if it receives the approval of two-thirds ( 2/3) of holders of each such affected class or series of shares. In respect of certain amendments, a shareholder is entitled to dissent and, if the resolution is adopted and we implement the changes, demand that we repurchase all of its shares of such class or series for which a separate vote was carried out at their fair value. |
| 4. | Shareholder Meetings. Our by-laws and theBusiness Corporations Act (Québec) provide that the annual meeting of our shareholders shall be held within fifteen (15) months after the last preceding annual meeting. All shareholders meetings shall be held within the province of Québec at the place and time determined by our Board of Directors and may be called by order of our Board of Directors. |
Our by-laws provide that notice specifying the place, date, time and purpose of any meeting of our shareholders shall be sent to all the shareholders entitled to vote and to each director at least 21 days but not more than 60 days before the meeting by any means providing proof of the date of sending at the addresses indicated in Videotron’s records.
93
Table of Contents
Our chairman of the board or, in his absence, our vice-chair of the board, if any, or in his absence, our president and chief executive officer or any other person that may be named by the board shall preside at all meetings of our shareholders. If the person who is to chair the meeting is not present at the meeting within 15 minutes after the time appointed for the meeting, the shareholders present choose one of their own to chair the meeting.
Our by-laws provide that a quorum of shareholders is present at a shareholders meeting if, at the opening of the meeting, one or several holders of 50% or more of the shares that carry the right to vote at the meeting are present in person or represented by proxy.
| 5. | Limitations on right to own securities. There is no limitation imposed by Canadian law or by the Articles or our other constituent documents on the right of non-residents or foreign owners to hold or vote shares, other than as provided in theInvestment Canada Act (Canada) and the Radiocommunication Act. TheInvestment Canada Act (Canada) requires “non-Canadian” (as defined in theInvestment Canada Act (Canada)) individuals, governments, corporations and other entities who wish to acquire control of a “Canadian business” (as defined in theInvestment Canada Act (Canada)) to file either an application for review (when certain asset value thresholds are met) or a post closing notification with the Director of Investments appointed under theInvestment Canada Act (Canada), unless a specific exemption applies. TheInvestment Canada Act (Canada) requires that, when an acquisition of control of a Canadian business by a “non-Canadian” is subject to review, it must be approved by the Minister responsible for theInvestment Canada Act (Canada) on the basis that the Minister is satisfied that the acquisition is “likely to be of net benefit to Canada”, having regard to criteria set forth in theInvestment Canada Act (Canada). Radio licenses may be issued under the Radiocommunication Act to radiocommunication service providers (“Service Providers”) that meet the eligibility criteria of Canadian ownership and control set forth in theCanadian Telecommunications Common Carrier Ownership and Control Regulations(the “CTCCOCR”). Under the CTCCOCR, the Service Provider may refuse to accept any subscription for or register the transfer of any of its voting shares unless it receives a declaration that such subscription or transfer would not result in the percentage of the total voting shares of the Service Provider that are beneficially owned and controlled by non-Canadians exceeding 33 1/3%. |
| 6. | Provisions that could have the effect of delaying, deferring or preventing a change of control. The Articles provide that our directors shall refuse to issue (including on the occasion or because of a conversion of shares or in shares), and to allow a transfer of, any share of our capital stock if this issuance or transfer would, in the opinion of our directors, affect our eligibility or of any other corporation or partnership in which we have or may have an interest, to obtain, preserve or renew a license or authorization required for the operation or continuation of its broadcasting company (as defined in the Broadcasting Act, as amended) (or any part thereof) or of any other activity necessary for the continuation of our corporation. See “Item 4. Information on the Corporation — Regulation — Ownership and Control of Canadian Broadcast Undertakings”. |
| 7. | Not applicable. |
| 8. | Not applicable. |
| 9. | Not applicable. |
| C- | Material Contracts |
The following is a summary of each material contract, other than contracts entered into in the ordinary course of business, to which we or any of our subsidiaries is a party, for the two years preceding publication of this annual report.
| (a) | Indenture relating to US$175,000,000 of our 6 3/8% Senior Notes due December 15, 2015, dated as of September 16, 2005, by and among Videotron, the guarantors party thereto, and Wells Fargo Bank, National Association, as trustee. |
On September 16, 2005, we issued US$175,000,000 aggregate principal amount of our 6 3/8% Senior Notes due December 15, 2015, pursuant to an Indenture, dated as of September 16, 2005, by and among
94
Table of Contents
Videotron, the guarantors party thereto, and Wells Fargo Bank, National Association, as trustee. These senior notes are unsecured and mature on December 15, 2015. Interest on these senior notes is payable in cash semi-annually in arrears on June 15 and December 15 of each year. These senior notes are guaranteed on a senior unsecured basis by most, but not all, of our subsidiaries. These senior notes are redeemable, at our option, under certain circumstances and at the redemption prices set forth in the indenture. The indenture contains customary restrictive covenants with respect to us and certain of our subsidiaries, and customary events of default. If an event of default occurs and is continuing, other than our bankruptcy or insolvency, the trustee or the holders of at least 25% in principal amount at maturity of the then-outstanding senior notes may declare all the senior notes to be due and payable immediately. On March 11, 2015, we issued a notice of redemption for all of our outstanding 6 3/8% Senior Notes due December 15, 2015. The redemption is anticipated to be completed on April 10, 2015.
| (b) | Indenture relating to US$715,000,000 of our 9 1/8% Senior Notes due April 15, 2018, dated as of April 15, 2008, as supplemented, by and among Videotron, the guarantors party thereto, and Wells Fargo Bank, National Association, as trustee. |
On April 15, 2008, we issued US$455,000,000 aggregate principal amount of our 9 1/8% Senior Notes due April 15, 2018, and on March 5, 2009, we issued and sold an additional US$260,000,000 aggregate principal amount of our 9 1/8% Senior Notes due April 15, 2018, in each case pursuant to an Indenture, dated as of April 15, 2008, by and among Videotron, the guarantors party thereto, and Wells Fargo Bank, National Association, as trustee. These senior notes, which form a single series and class, are unsecured and mature on April 15, 2018. Interest on these senior notes is payable in cash semi-annually in arrears on June 15 and December 15 of each year. These senior notes are guaranteed on a senior unsecured basis by most, but not all, of our subsidiaries. These senior notes are redeemable, at our option, under certain circumstances and at the redemption prices set forth in an indenture dated as of April 15, 2008. This indenture contains customary restrictive covenants with respect to us and certain of our subsidiaries and customary events of default. If an event of default occurs and is continuing, other than our bankruptcy or insolvency, the trustee or the holders of at least 25% in principal amount at maturity of the then-outstanding 9 1/8% Senior Notes may declare all of such senior notes to be due and payable immediately. On July 2, 2013 we redeemed and retired US$380,000,000 aggregate principal amount of our outstanding 9 1/8% Senior Notes due 2018. On April 24, 2014, we redeemed and retired US$260,000,000 aggregate principal amount of our outstanding 9 1/8% Senior Notes due 2018.
| (c) | Indenture relating to CAN$300,000,000 of our 7 1/8% Senior Notes due January 15, 2020, dated as of January 13, 2010, as supplemented, by and among Videotron, the guarantors party thereto, and Computershare Trust Company of Canada, as trustee. |
On January 13, 2010, we issued CAN$300,000,000 aggregate principal amount of our 7 1/8% Senior Notes due January 15, 2020, pursuant to an Indenture, dated as of January 13, 2010, by and among Videotron, the guarantors party thereto, and Computershare Trust Company of Canada, as trustee. These senior notes are unsecured and mature on January 15, 2020. Interest on these senior notes is payable in cash semi-annually in arrears on June 15 and December 15 of each year. These senior notes are guaranteed on a senior unsecured basis by most, but not all, of our subsidiaries. These senior notes are redeemable, at our option, under certain circumstances and at the redemption prices set forth in the indenture. The indenture contains customary restrictive covenants with respect to us and certain of our subsidiaries, and customary events of default. If an event of default occurs and is continuing, other than our bankruptcy or insolvency, the trustee or the holders of at least 25% in principal amount at maturity of the then-outstanding senior notes may declare all the senior notes to be due and payable immediately. The senior notes issued pursuant to this indenture were not and will not be registered under the Securities Act or under the laws of any other jurisdiction.
| (d) | Indenture relating to CAN$300,000,000 of our 6 7/8% Senior Notes due July 15, 2021, dated as of July 5, 2011, as supplemented, by and among Videotron, the guarantors party thereto, and Computershare Trust Company of Canada, as trustee. |
On July 5, 2011, we issued CAN$300,000,000 aggregate principal amount of our 6 7/8% Senior Notes due July 15, 2021, pursuant to an Indenture, dated as of July 5, 2011, by and among Videotron, the guarantors party thereto, and Computershare Trust Company of Canada, as trustee. These senior notes are unsecured and mature on July 5, 2021. Interest on these senior notes is payable in cash semi-annually in arrears on June 15 and December 15 of each year. These senior notes are guaranteed on a senior unsecured basis by most, but not all, of our subsidiaries. These senior notes are redeemable, at our option, under certain circumstances and at the redemption prices set forth in the indenture. The indenture contains customary restrictive covenants with respect to us and certain of our subsidiaries, and customary events of default. If an event of default occurs and is continuing, other than our bankruptcy or insolvency, the trustee or the holders of at least 25% in principal amount at maturity of the then-outstanding notes may declare all the senior notes to be due and payable immediately. The senior notes issued pursuant to this indenture were not and will not be registered under the Securities Act or under the laws of any other jurisdiction.
95
Table of Contents
| (e) | Indenture relating to US$800,000,000 of our 5% Senior Notes due July 15, 2022, dated as of March 14, 2012, by and among Videotron, the guarantors party thereto, and Wells Fargo Bank, National Association, as trustee. |
On March 14, 2012, we issued US$800,000,000 aggregate principal amount of our 5% Senior Notes due July 15, 2022, pursuant to an Indenture, dated as of March 14, 2012, by and among Videotron, the guarantors party thereto, and Wells Fargo Bank, National Association, as trustee. These senior notes are unsecured and mature on July 15, 2022. Interest on these senior notes is payable in cash semi-annually in arrears on January 15 and July 15 of each year. These senior notes are guaranteed on a senior unsecured basis by most, but not all, of our subsidiaries. These senior notes are redeemable, at our option, under certain circumstances and at the make-whole redemption price set forth in the indenture. This indenture contains customary restrictive covenants with respect to us and certain of our subsidiaries and customary events of default. If an event of default occurs and is continuing, other than our bankruptcy or insolvency, the trustee or the holders of at least 25% in principal amount at maturity of the then-outstanding senior notes may declare all the senior notes to be due and payable immediately.
| (f) | Indenture relating to CAN$400,000,000 of our 5 5/8% Senior Notes due June 15, 2025, dated as of June 17, 2013, by and among Videotron, the guarantors party thereto, and Computershare Trust Company of Canada, as trustee. |
On June 17, 2013, we issued CAN$400,000,000 aggregate principal amount of our 5 5/8% Senior Notes due 2025, pursuant to an Indenture, dated as of June 17, 2013, by and among Videotron, the guarantors party thereto, and Computershare Trust Company of Canada, as trustee. These senior notes are unsecured and mature on June 15, 2025. Interest on these senior notes is payable in cash semi-annually in arrears on April 15 and October 15 of each year. These senior notes are guaranteed on a senior unsecured basis by most, but not all, of our subsidiaries. These senior notes are redeemable, at our option, under certain circumstances and at the make-whole redemption price set forth in the indenture. The indenture contains customary restrictive covenants with respect to us and certain of our subsidiaries, and customary events of default. If an event of default occurs and is continuing, other than our bankruptcy or insolvency, the trustee or the holders of at least 25% in principal amount at maturity of the then-outstanding senior notes may declare all the senior notes to be due and payable immediately. The senior notes issued pursuant to this indenture have not been and will not be registered under the Securities Act or under the laws of any other jurisdiction.
| (g) | Indenture relating to US$600,000,000 of our 5 3/8% Senior Notes due June 15, 2024, dated as of April 9, 2014, by and among Videotron, the guarantors party thereto, and Wells Fargo Bank, National Association, as trustee. |
On April 9, 2014, we issued US$600,000,000 aggregate principal amount of its 5 3/8% Senior Notes due June 15, 2024, pursuant to an Indenture, dated as of April 9, 2014, by and among Videotron, the guarantors party thereto, and Wells Fargo Bank, National Association, as trustee. These senior notes are unsecured and mature on June 15, 2024. Interest on these senior notes is payable in cash semi-annually in arrears on June 15 and December 15 of each year. These senior notes are guaranteed on a senior
96
Table of Contents
unsecured basis by most, but not all, of our subsidiaries. These senior notes are redeemable, at our option, under certain circumstances and at the make-whole redemption price set forth in the indenture. The indenture contains customary restrictive covenants with respect to us and certain of our subsidiaries, and customary events of default. If an event of default occurs and is continuing, other than our bankruptcy or insolvency, the trustee or the holders of at least 25% in principal amount at maturity of the then-outstanding senior notes may declare all the senior notes to be due and payable immediately. The senior notes issued pursuant to this indenture have not been and will not be registered under the Securities Act or under the laws of any other jurisdiction.
| (h) | Credit Agreement originally dated as of November 28, 2000, as amended and restated as of July 20, 2011, by and among Videotron, as borrower, the guarantors party thereto, the financial institutions party thereto from time to time, as lenders, and Royal Bank of Canada, as administrative agent, as amended on June 14, 2013. |
Our $650,000,000 senior secured credit facilities provide for a $575,000,000 secured revolving credit facility that matures on July 19, 2018 and a $75,000,000 secured export financing facility providing for a term loan that matures on June 15, 2018. The proceeds of the revolving credit facility can be used for general corporate purposes including, without limitation, to issue letters of credit and to pay dividends to Quebecor Media subject to certain conditions. The proceeds of the term loan were used for payments and reimbursement of payments of export equipment and local services in relation to our contracts for mobile infrastructure equipment with an affiliate of Nokia Corporation and also for the financing of the Finnvera guarantee fee (Finnvera plc being a specialized financing company owned by the State of Finland which is providing an export buyer credit guarantee in favor of the lenders under the export financing facility covering political and commercial risks).
Advances under our revolving credit facility bear interest at the Canadian prime rate, the U.S. prime rate (solely under the swingline commitment) or the bankers’ acceptance rate plus, in each instance, an applicable margin determined by the Leverage Ratio (as defined in our credit agreement) of the Relevant Group (as defined in our credit agreement). The applicable margin for Canadian prime rate advances and U.S. prime rate advances ranges from 0.325% when this ratio is less than 1.5x, to 1.625% when this ratio is greater than or equal to 4.5x. The applicable margin for bankers’ acceptance advances or letters of credit fees ranges from 1.325% when this ratio is less than 1.5x, to 2.625% when this ratio is greater than or equal to 4.5x. We have also agreed to pay specified commitment fees. Advances under our export financing facility bear interest at the bankers’ acceptance rate plus a margin at a rate of 0.875%.
The revolving credit facility will be repayable in full on July 19, 2018. Drawdowns under the export financing facility are repayable by way of seventeen equal and consecutive semi-annual payments that commenced on June 15, 2010.
Borrowings under our senior secured credit facilities and under eligible derivative instruments are secured by a first-ranking hypothec or security interest (subject to certain permitted encumbrances) on all current and future assets of Videotron and of the guarantors under the credit facilities (which include most, but not all of Videotron’s subsidiaries), guarantees by such guarantors, pledges of shares by us and such guarantors and other security.
Our senior secured credit facilities contain customary covenants that restrict and limit the ability of Videotron and the members of the VL Group (as defined in the credit agreement to mean Videotron and all of its wholly-owned subsidiaries) to, among other things, enter into merger or amalgamation transactions or liquidate or dissolve, grant encumbrances, sell assets, pay dividends or make other distributions, issue shares of capital stock, incur indebtedness and enter into related party transactions. In addition, our senior secured credit facilities contain customary financial covenants and customary events of default including the non-payment of principal or interest, the breach of any financial covenant, the failure to perform or observe any other covenant, certain bankruptcy events relating to us or any member of the VL Group (other than an Immaterial Subsidiary, as defined in the credit agreement), and the occurrence of a change of control.
97
Table of Contents
| D- | Exchange Controls |
There are currently no laws, decrees, regulations or other legislation in Canada that restricts the export or import of capital, or affects the remittance of dividends, interest or other payments to non-resident holders of our securities, other than withholding tax requirements. See “— Taxation — Canadian Material Federal Income Tax Considerations for Residents of the United States” below.
There is no limitation imposed by Canadian law or by the Articles or our other charter documents on the right of a non-resident to hold our voting shares, other than as provided by theInvestment Canada Act (Canada), as amended, as amended by theNorth American Free Trade Agreement Implementation Act(Canada), and theWorld Trade Organization (WTO) Agreement Implementation Act. TheInvestment Canada Act (Canada) requires notification and, in certain cases, advance review and approval by the Government of Canada of the acquisition by a “non-Canadian” of “control of a Canadian business”, all as defined in theInvestment Canada Act (Canada). Generally, the threshold for review will be higher in monetary terms for a member of the WTO or NAFTA. In addition, there are regulations related to the ownership and control of Canadian broadcast undertakings. See “Item 4. Information on the Corporation — Regulation”.
| E- | Taxation |
Certain U.S. Federal Income Tax Considerations
The following discussion is a summary of certain U.S. federal income tax consequences applicable to the purchase, ownership and disposition of (i) our 6 3/8% Senior Notes due 2015 (our “6 3/8% Senior Notes”), (ii) our 9 1/8% Senior Notes due 2018 (our “9 1/8% Senior Notes”), (iii) our 7 1/8% Senior Notes due 2020 (our “7 1/8% Senior Notes”), (iv) our 6 7/8% Senior Notes due 2021 (our “6 7/8% Senior Notes”), (v) our 5% Senior Notes due 2022 (our “5% Senior Notes”), (vi) our 5 3/8% Senior Notes due 2024 (our “5 3/8% Senior Notes”), and (vii) our 5 5/8% Senior Notes due 2025 (our “5 5/8% Senior Notes”) (collectively, the “notes”) by a U.S. Holder (as defined below), but does not purport to be a complete analysis of all potential U.S. federal income tax effects. Our 9 1/8% Senior Notes were issued in two instances, on April 7, 2008 and February 26, 2009, under the same indenture. Our 7 1/8% Senior Notes, our 6 7/8% Senior Notes and our 5 5/8% Senior Notes are denominated in Canadian dollars (the “Canadian dollar Notes”). This summary is based on the Internal Revenue Code of 1986, as amended (the “Code”), U.S. Treasury regulations promulgated thereunder, Internal Revenue Service (“IRS”) rulings and judicial decisions now in effect. All of these are subject to change, possibly with retroactive effect, or different interpretations.
This summary does not address all aspects of U.S. federal income taxation that may be relevant to particular U.S. Holders in light of their specific circumstances (for example, U.S. Holders subject to the alternative minimum tax provisions of the Code or U.S. Holders subject to the 3.8% Medicare tax on net investment income) or to U.S. Holders that may be subject to special rules under U.S. federal income tax law, including:
| • | dealers in stocks, securities or currencies; |
| • | persons using a mark-to-market accounting method; |
| • | banks and financial institutions; |
| • | insurance companies; |
| • | regulated investment companies; |
| • | real estate investment trusts; |
| • | tax-exempt organizations; |
| • | persons holding notes as part of a hedging or conversion transaction or a straddle; |
| • | persons deemed to sell notes under the constructive sale provisions of the Code; |
98
Table of Contents
| • | persons who or that are, or may become, subject to the expatriation provisions of the Code; |
| • | persons whose functional currency is not the U.S. dollar; and |
| • | direct, indirect or constructive owners of 10% or more of our outstanding voting shares. |
The summary also does not discuss any aspect of state, local or non-U.S., or U.S. federal estate and gift tax law as applicable to U.S. Holders. Moreover, this discussion is limited to U.S. Holders who acquire and hold the notes as “capital assets” within the meaning of Section 1221 of the Code (generally, property held for investment). In addition, this summary assumes that the notes are properly characterized as debt that is not contingent debt for U.S. federal income tax purposes.
For purposes of this summary, “U.S. Holder” means the beneficial holder of a note who or that for U.S. federal income tax purposes is:
| • | an individual citizen or resident alien of the United States; |
| • | a corporation or other entity treated as such formed in or under the laws of the United States, any state thereof or the District of Columbia; |
| • | an estate, the income of which is subject to U.S. federal income taxation regardless of its source; or |
| • | a trust, if a court within the United States is able to exercise primary supervision over the administration of such trust and one or more “U.S. persons” (within the meaning of the Code) have the authority to control all substantial decisions of the trust, or if a valid election is in effect to be treated as a U.S. person. |
No ruling has been or will be sought from the IRS with respect to the matters discussed below. There can be no assurance that the IRS will not take a different position concerning the tax consequences of the purchase, ownership or disposition of the notes or that any such position will not be sustained.
If a partnership or other entity or arrangement treated as a partnership for U.S. federal income tax purposes holds the notes, the U.S. federal income tax treatment of a partner generally will depend on the status of the partner and the activities of the partnership. Such partner should consult its own tax advisor as to the tax consequences of the partnership purchasing, owning and disposing of the notes.
U.S. INVESTORS SHOULD CONSULT THEIR OWN TAX ADVISORS WITH REGARD TO THE APPLICATION OF THE TAX CONSEQUENCES DESCRIBED BELOW TO THEIR PARTICULAR SITUATIONS AS WELL AS THE APPLICATION OF ANY STATE, LOCAL, NON-U.S. OR OTHER TAX LAWS, INCLUDING GIFT AND ESTATE TAX LAWS.
Interest on the Notes
Payments of stated interest on the notes generally will be taxable to a U.S. Holder as ordinary income at the time that such payments are received or accrued, in accordance with the U.S. Holder’s method of accounting for U.S. federal income tax purposes. Interest on the notes will constitute income from sources outside the United States and generally, with certain exceptions, will be “passive category income” which is treated separately from other income for purposes of computing the foreign tax credit allowable to a U.S. Holder under the federal income tax laws. Due to the complexity of the foreign tax credit rules, U.S. Holders should consult their own tax advisors with respect to the amount of foreign taxes that may be claimed as a credit.
In certain circumstances we may be obligated to pay amounts in excess of stated interest or principal on the notes or may make payments or redeem the notes in advance of their expected maturity. According to U.S. Treasury regulations, the possibility that any such payments or redemptions will be made will not affect the amount of interest income a U.S. Holder recognizes if there is only a remote chance as of the date the notes were issued that such payments will be made, or if such payments are incidental. We believe the likelihood that we will make any such payments is remote and/or that such payment will be incidental. Therefore, we do not intend to treat the potential payments or
99
Table of Contents
redemptions pursuant to the provisions related to changes in Canadian laws or regulations applicable to tax-related withholdings or deductions, any registration rights provisions, or the other redemption and repurchase provisions as part of the yield to maturity of the notes or as affecting the tax treatment of the notes. Our determination that these contingencies are remote and/or incidental is binding on a U.S. Holder unless such holder discloses its contrary position in the manner required by applicable U.S. Treasury regulations. Our determination is not, however, binding on the IRS, and if the IRS were to challenge this determination, a U.S. Holder may be required to accrue income on its notes in excess of stated interest and to treat as ordinary income rather than capital gain any income realized on the taxable disposition of a note before the resolution of the contingencies. In the event a contingency occurs, it would affect the amount and timing of the income recognized by a U.S. Holder. If we pay additional amounts on the notes, U.S. Holders will be required to recognize such amounts as income.
In the issuance of our 6 3/8% Senior Notes and in the issuance of our 9 1/8% Senior Notes, the notes were issued with ade minimis amount of original issue discount (“OID”). OID is the excess, if any, of a note’s “stated redemption price at maturity” over its “issue price”. A note’s stated redemption price at maturity is the sum of all payments provided by the note other than payments of qualified stated interest (i.e., stated interest that is unconditionally payable in cash or other property (other than debt of the issuer)). The “issue price” is the first price at which a substantial amount of the notes in the issuance that includes the notes is sold (excluding sales to bond houses, brokers or similar persons or organizations acting in the capacity of underwriters, agents or wholesalers). The amount of original issue discount with respect to a note will be treated as zero if it is less than an amount equal to 0.0025 multiplied by the product of the stated redemption price at maturity and the number of complete years to maturity (or weighted average maturity, as applicable) (“de minimis OID”). Generally, anyde minimis OID must be included in income as principal payments are received on the securities in the proportion that each such payment bears to the original principal balance of the security. The treatment of the resulting gain is subject to the general rules discussed under “— Sale, Exchange or Retirement of a Note” below.
Interest on the Canadian dollar Notes will be included in a U.S. Holder’s gross income in an amount equal to the U.S. dollar value of the Canadian dollar amount, regardless of whether the Canadian dollars are converted into U.S. dollars. Generally, a U.S. Holder that uses the cash method of tax accounting will determine such U.S. dollar value using the spot rate of exchange on the date of receipt. A cash method U.S. Holder generally will not realize foreign currency gain or loss on the receipt of the interest payment but may have foreign currency gain or loss attributable to the actual disposition of the Canadian dollars received.
Generally, a U.S. Holder of Canadian dollar Notes that uses the accrual method of tax accounting will determine the U.S. dollar value of accrued interest income using the average rate of exchange for the accrual period (or, with respect to an accrual period that spans two taxable years, at the average rate for the partial period within the U.S. Holder’s taxable year). Alternatively, an accrual basis U.S. Holder may make an election (which must be applied consistently to all debt instruments from year to year and cannot be changed without the consent of the IRS) to translate accrued interest income at the spot rate of exchange on the last day of the accrual period (or the last day of the taxable year in the case of a partial accrual period) or the spot rate on the date of receipt, if that date is within five business days of the last day of the accrual period. A U.S. Holder that uses the accrual method of accounting for tax purposes will recognize foreign currency gain or loss on the receipt of an interest payment if the exchange rate in effect on the date payment is received differs from the rate applicable to an accrual of that interest. The amount of foreign currency gain or loss to be recognized by such U.S. Holder will be an amount equal to the difference between the U.S. dollar value of the Canadian dollar interest payment (determined on the basis of the spot rate on the date the interest income is received) in respect of the accrual period and the U.S. dollar value of the interest income that has accrued during the accrual period (as determined above). This foreign currency gain or loss will be ordinary income or loss and generally will not be treated as an adjustment to interest income or expense.
Foreign currency gain or loss generally will be U.S. source provided that the residence of a taxpayer is considered to be the United States for purposes of the rules regarding foreign currency gain or loss.
Market Discount and Bond Premium
Market Discount
If a U.S. Holder purchases notes for an amount less than their stated redemption price at maturity, the difference is treated as market discount. Subject to ade minimis exception, gain realized on the maturity, sale, exchange or
100
Table of Contents
retirement of a market discount note will be treated as ordinary income to the extent of any accrued market discount not previously recognized (including in the case of a note exchanged for a registered note pursuant to a registration offer, any market discount accrued on the related outstanding note). A U.S. Holder may elect to include market discount in income currently as it accrues, on either a ratable or constant yield method. In that case, a U.S. Holder’s tax basis in its notes will increase by such income inclusions. An election to include market discount in income currently, once made, will apply to all market discount obligations acquired by the U.S. Holder during the taxable year of the election and thereafter, and may not be revoked without the consent of the IRS. If a U.S. Holder does not make such an election, in general, all or a portion of such holder’s interest expense on any indebtedness incurred or continued in order to purchase or carry notes may be deferred until the maturity of the notes, or certain earlier dispositions. Unless a U.S. Holder elects to accrue market discount under a constant yield method, any market discount will accrue ratably during the period from the date of acquisition of the related outstanding note to its maturity date.
In the case of Canadian dollar Notes, market discount is accrued in Canadian dollars, and the amount includible in income by a U.S. Holder upon a sale of such note in respect of accrued market discount will be the U.S. dollar value of the amount accrued. Such U.S. dollar value is generally calculated at the spot rate of exchange on the date such note is sold. Any market discount on a Canadian dollar Note that is currently includible in income under the election noted above will be translated into U.S. dollars at the average exchange rate for the accrual period or portion of such accrual period within the U.S. Holder’s taxable year. In such case, a U.S. Holder generally will recognize foreign currency gain or loss with respect to accrued market discount under the rules similar to those that apply to accrued interest on a note received by an accrual basis U.S. Holder, as described above.
Bond Premium
If a U.S. Holder purchases notes for an amount greater than the sum of all amounts (other than qualified stated interest) payable with respect to the notes after the date of acquisition, such holder will have purchased such notes with amortizable bond premium. A U.S. Holder generally may elect to amortize that premium from the purchase date to the maturity date of the notes under a constant yield method. Amortizable premium generally may be deducted against interest income on such notes and generally may not be deducted against other income. A U.S. Holder’s basis in a note will be reduced by any premium amortization deductions. An election to amortize premium on a constant yield method, once made, generally applies to all debt obligations held or subsequently acquired by a U.S. Holder during the taxable year of the election and thereafter, and may not be revoked without IRS consent. For a U.S. Holder that did not elect to amortize bond premium, the amount of such premium will be included in such U.S. Holder’s tax basis upon the sale of a note. In the case of Canadian dollar Notes, premium is computed in Canadian dollars. At the time amortized bond premium offsets interest income, foreign currency gain or loss (taxable as ordinary income or loss) will be realized on such amortized bond premium based on the difference between the spot rate of exchange on the date or dates such premium is recovered through interest payments on the Canadian dollar Note and the spot rate of exchange on the date on which the U.S. Holder acquired the note.
The market discount and bond premium rules are complicated, and U.S. Holders are urged to consult their own tax advisors regarding the tax consequences of owning and disposing of notes with market discount or bond premium, including the availability of certain elections.
Sale, Exchange or Retirement of a Note
A U.S. Holder generally will recognize gain or loss upon the sale, exchange (other than in a tax-free transaction), redemption, retirement or other taxable disposition of a note, equal to the difference, if any, between:
| • | the amount realized (or the U.S. dollar value thereof if received in a foreign currency) less any portion allocable to the payment of accrued interest not previously included in income, which amount will be taxable as ordinary interest income; and |
| • | the U.S. Holder’s adjusted tax basis in the note. |
Except with respect to gains or losses attributable to changes in exchange rates, as described below, gain or loss so recognized generally will be capital gain or loss (except as described under “— Market Discount and Bond Premium” above) and generally will be long-term capital gain or loss if the note has been held or deemed held for more than one
101
Table of Contents
year at the time of the disposition. Long-term capital gains of noncorporate U.S. Holders, including individuals, may be taxed at lower rates than items of ordinary income. The ability of a U.S. Holder to offset capital losses against ordinary income is limited. Any capital gain or loss recognized by a U.S. Holder on the sale or other disposition of a note generally will be treated as income from sources within the United States or loss allocable to income from sources within the United States. U.S. Holders should consult their own tax advisors regarding the source of gain attributable to market discount.
A U.S. Holder’s adjusted tax basis in a note will generally equal the U.S. Holder’s U.S. dollar cost therefor, increased by the amount of market discount, if any, previously included in income in respect of the note and decreased (but not below zero) by the amount of principal payments received by such U.S. Holder in respect of the note, any amounts treated as a return of pre-issuance accrued interest and the amount of amortized bond premium, if any, previously taken into account with respect to the note. If a U.S. Holder purchases a Canadian dollar Note with Canadian dollars, the U.S. dollar cost of the Canadian dollar Note will generally be the U.S. dollar value of the purchase price on the date of purchase calculated at the spot rate of exchange on that date. The amount realized upon the disposition of a Canadian dollar Note will generally be the U.S. dollar value of the amount received on the date of the disposition calculated at the spot rate of exchange on that date. However, if the Canadian dollar Note is traded on an established securities market, a cash basis U.S. Holder (and, if it so elects, an accrual basis U.S. Holder) will determine the U.S. dollar value of the cost of or amount received on the Canadian dollar Note, as applicable, by translating the amount paid or received at the spot rate of exchange on the settlement date of the purchase or disposition. The election available to accrual basis U.S. Holders in respect of the purchase and disposition of Canadian dollar Notes traded on an established securities market must be applied consistently to all debt instruments from year to year and cannot be changed without the consent of the IRS.
Gain or loss recognized by a U.S. Holder on the sale, exchange or retirement of a Canadian dollar Note that is attributable to changes in the rate of exchange between the U.S. dollar and foreign currency generally will be treated as U.S. source ordinary income or loss. Such foreign currency gain or loss will equal the difference between (i) the U.S. dollar value of the U.S. Holder’s Canadian dollar purchase price for the Canadian dollar Note calculated at the spot rate of exchange on the date of the sale, exchange, retirement or other disposition and (ii) the U.S. dollar value of the U.S. Holder’s Canadian dollar purchase price for the Canadian dollar Note calculated at the spot rate of exchange on the date of purchase of the Canadian dollar Note. If the Canadian dollar Note is traded on an established securities market, with respect to a cash basis U.S. Holder (and, if it so elects, an accrual basis U.S. Holder), such foreign currency gain or loss will equal the difference between (x) the U.S. dollar value of the U.S. Holder’s Canadian dollar purchase price for the Canadian dollar Note calculated at the spot rate of exchange on the settlement date of the disposition and (y) the U.S. dollar value of the U.S. Holder’s Canadian dollar purchase price for the Canadian dollar Note calculated at the spot rate of exchange on the settlement date of the purchase of the Canadian dollar Note. Such foreign currency gain or loss is recognized on the sale or retirement of such Note only to the extent of total gain or loss recognized on the sale or retirement of such Note. Prospective investors should consult their own tax advisors regarding certain foreign currency translation elections that may be available with respect to a sale, exchange, or redemption of the Canadian dollar Notes.
Transactions in Foreign Currency
Foreign currency received as a payment of interest on, or on the sale or retirement of, a Canadian dollar Note will have a tax basis equal to its U.S. dollar value at the time such interest is received or at the time the note is disposed of or payment is received in consideration of such sale or retirement (as applicable). The amount of gain or loss recognized on a subsequent sale or other disposition of such foreign currency will be equal to the difference between (i) the amount of U.S. dollars, or the fair market value in U.S. dollars of the other currency or property received in such sale or other disposition, and (ii) the tax basis of the recipient in such foreign currency. A U.S. Holder who acquires such Note with previously owned foreign currency will recognize ordinary income or loss in an amount equal to the difference, if any, between such U.S. Holder’s tax basis in the foreign currency and the U.S. dollar fair market value of the note on the date of acquisition. Such gain or loss generally will be treated as income or loss from sources within the United States for foreign tax credit limitation purposes.
Reportable Transaction Reporting
Under certain U.S. Treasury Regulations, U.S. Holders that participate in “reportable transactions” (as defined in the regulations) must attach to their U.S. federal income tax returns a disclosure statement on IRS Form 8886. Under the relevant rules, a U.S. Holder may be required to treat a foreign currency exchange loss from the Canadian dollar Note as a reportable transaction if this loss exceeds the relevant threshold in the regulations. For individuals and trusts, this loss
102
Table of Contents
threshold is US$50,000 in any single year. U.S. Holders should consult their own tax advisors as to the possible obligation to file IRS Form 8886 with respect to the ownership or disposition of the Canadian dollar Notes, or any related transaction, including without limitation, the disposition of any non-U.S. currency received as interest or as proceeds from the sale, exchange, retirement or other disposition of the Canadian dollar Notes.
Information Reporting and Backup Withholding
In general, information reporting requirements may apply to payments of principal and interest on a note and to the proceeds of the sale or other disposition of a note made to U.S. Holders other than certain exempt recipients (such as corporations). A U.S. Holder of the notes may be subject to “backup withholding” with respect to certain “reportable payments”, including interest payments and, under certain circumstances, principal payments on the notes or upon the receipt of proceeds upon the sale or other disposition of such notes. These backup withholding rules apply if the U.S. Holder, among other things:
| • | fails to furnish a social security number or other taxpayer identification number (“TIN”) certified under penalty of perjury within a reasonable time after the request for the TIN; |
| • | furnishes an incorrect TIN; |
| • | is notified by the IRS that it has failed to report properly interest or dividends; or |
| • | under certain circumstances, fails to provide a certified statement, signed under penalties of perjury, that the TIN furnished is the correct number and that such holder is not subject to backup withholding. |
A U.S. Holder that does not provide us with its correct TIN also may be subject to penalties imposed by the IRS. Any amount withheld from a payment to a U.S. Holder under the backup withholding rules is creditable against the U.S. Holder’s federal income tax liability,provided that the required information is timely furnished to the IRS. Backup withholding will not apply, however, with respect to payments made to certain exempt U.S. Holders, including corporations and tax-exempt organizations,provided their exemptions from backup withholding are properly established.
In addition, U.S. individuals that hold specified foreign financial assets (including stock and securities of a foreign issuer) with an aggregate value in excess of US$50,000 on the last day of the taxable year or US$75,000 at any time during the taxable year are required to report their holdings, along with other information, on their tax returns, with certain exceptions. Holders should consult their own tax advisors to determine the scope of these disclosure responsibilities.
Certain Canadian Material Federal Income Tax Considerations for Residents of the United States
The following is, at the date hereof, a summary of the principal Canadian federal income tax considerations generally applicable to a holder who acquires, as beneficial owner, the Senior Notes, including entitlement to all payments thereunder, pursuant to this offering and who, at all relevant times and for the purposes of theIncome Tax Act(Canada) (the “Tax Act”) and the regulations thereunder, (i) is not, and is not deemed to be, resident in Canada (including as a consequence of the Canada-United States Income Tax Convention (1980), as amended), (ii) deals at arm’s length with Videotron and with any transferee resident or deemed resident in Canada to whom the holder disposes of Senior Notes, (iii) does not use or hold and is not deemed to use or hold the Senior Notes in or in the course of carrying on business in Canada, (iv) does not receive any payment of interest (including any amounts deemed to be interest) on the Senior Notes in respect of a debt or other obligation to pay an amount to a person with whom Videotron does not deal at arm’s length, (v) is not an “authorized foreign bank”, as defined in the Tax Act, (vi) is not a “registered non-resident insurer”, as defined in the Tax Act, (vii) is not an insurer carrying on an insurance business in Canada and elsewhere, and (viii) is not a, and deals at arm’s length with any, “specified shareholder” of Videotron for purposes of the thin capitalization rules in the Tax Act (a “Non-Resident Holder”). A “specified shareholder” for these purposes generally includes a person who (either alone or together with persons with whom that person is not dealing at arm’s length for the purposes of the Tax Act) owns or has the right to acquire or control or is otherwise deemed to own 25% or more of Videotron’s shares determined on a votes or fair market value basis.
103
Table of Contents
This summary is based on the current provisions of the Tax Act and the regulations thereunder and the current administrative and assessing practices and policies of the Canada Revenue Agency published in writing prior to the date hereof. This summary takes into account all specific proposals to amend the Tax Act and the regulations thereunder announced by or on behalf of the Minister of Finance of Canada prior to the date hereof (the “Proposed Amendments”) and assumes that all Proposed Amendments will be enacted in the form proposed. However, no assurance can be given that the Proposed Amendments will be enacted as proposed or at all. This summary does not otherwise take into account or anticipate any changes in law or any administrative or assessing practice, whether by judicial, governmental, regulatory or legislative decision or action, nor does it take into account provincial, territorial or foreign income tax considerations which may differ from the Canadian federal income tax considerations described herein.
THIS SUMMARY IS OF A GENERAL NATURE ONLY AND IS NOT EXHAUSTIVE OF ALL CANADIAN FEDERAL INCOME TAX CONSIDERATIONS THAT MAY BE RELEVANT TO A PARTICULAR HOLDER. THIS SUMMARY IS NOT INTENDED TO BE, AND SHOULD NOT BE INTERPRETED AS, LEGAL OR TAX ADVICE TO ANY PARTICULAR HOLDER, AND NO REPRESENTATION WITH RESPECT TO THE INCOME TAX CONSEQUENCES TO ANY PARTICULAR HOLDER IS MADE. ACCORDINGLY, YOU SHOULD CONSULT YOUR OWN TAX ADVISORS WITH RESPECT TO YOUR PARTICULAR CIRCUMSTANCES.
No Canadian withholding tax will apply to interest (including any amounts deemed to be interest), principal or premium paid or credited by Videotron on the Senior Notes to a Non-Resident Holder, or to the proceeds received by a Non-Resident Holder on a disposition of a Senior Note, including a redemption, payment on maturity, repurchase or purchase for cancellation.
No other taxes on income or gains will be payable under the Tax Act by a Non-Resident Holder on interest (including any amounts deemed to be interest), principal or premium or on the proceeds received by such Non-Resident Holder on the disposition of a Senior Note, including a redemption, payment on maturity, repurchase or purchase for cancellation.
| F- | Dividends and Paying Agents |
Not applicable.
| G- | Statement By Experts |
Not applicable.
| H- | Documents on Display |
We file periodic reports and other information with the SEC. These reports include certain financial and statistical information about us and may be accompanied by exhibits. You may read and copy this information at the SEC’s Public Reference Room at 100 F Street, N.E., Room 1580, Washington, D.C. 20549, or obtain copies of this information by mail from the public reference room at the prescribed rates. You may call the SEC at 1-800-SEC-0330 for further information on the SEC’s Public Reference Room. The SEC also maintains an Internet website that contains reports and other information about issuers like us who file electronically with the SEC. The URL of that website is http://www.sec.gov. Any documents referred to in this annual report may also be inspected at our offices at 612 St. Jacques Street, Montréal, Québec, Canada, H3C 4M8.
| I- | Subsidiary Information |
Not applicable.
ITEM 11 – QUANTITATIVE AND QUALITATIVE DISCLOSURES ABOUT MARKET RISK
Videotron’s financial risk management policies have been established in order to identify and analyze the risks faced by Videotron, to set appropriate risk limits and controls, and to monitor risks and adherence to limits. Risk management policies are reviewed regularly to reflect changes in market conditions and in Videotron’s activities.
Videotron uses a number of financial instruments, mainly cash and cash equivalents, accounts receivable, accounts payable and accrued charges, provisions, long-term debt and derivative financial instruments. As a result of its use of financial instruments, Videotron is exposed to credit risk, liquidity risk and market risks relating to foreign exchange fluctuations and interest rate fluctuations.
104
Table of Contents
In order to manage its foreign exchange and interest rate risks, Videotron uses derivative financial instruments (i) to set in Canadian dollars future payments on debts denominated in U.S. dollars (interest and principal) and certain purchases of inventories and other capital expenditures denominated in a foreign currency, (ii) to achieve a targeted balance of fixed and floating rate debts and (iii) to lock-in the value of certain derivative financial instruments through offsetting transactions. Videotron does not intend to settle its derivative financial instruments prior to their maturity as none of these instruments is held or issued for speculative purposes.
Foreign Currency Risk
Most of our consolidated revenues and expenses, other than interest expense onU.S.-dollar-denominated debt, purchases of set-top boxes, handsets and cable modems and certain capital expenditures, are received or denominated in Canadian dollars. A large portion of the interest, principal and premium, if any, payable on our debt is payable in U.S. dollars. We have entered into transactions to hedge the foreign currency risk exposure on ourU.S.-dollar-denominated debt obligations outstanding as of December 31, 2014, to hedge our exposure on certain purchases of set-top boxes, handsets, cable modems and capital expenditures and to lock-in the value of certain derivative financial instruments through offsetting transactions.
Foreign exchange forward contracts:
Maturity | Canadian dollar average exchange rate per one U.S. dollar | Notional amount sold (in millions of dollars) | Notional amount bought (in millions of dollars) | |||||||||
Less than 1 year | 1.1198 | $ | 106.3 | US$ | 94.9 | |||||||
2017 | 1.1204 | US$ | 260.0 | $ | 291.3 | |||||||
Interest Rate Risk
Videotron’s bank credit facilities bear interest at floating rates based on the following reference rates: (i) Bankers’ acceptance rate, (ii) Canadian prime rate and (iii) U.S. prime rate. The Senior Notes issued by Videotron bear interest at fixed rates. Videotron has entered into cross-currency interest rate swap agreements in order to manage interest rate risk exposure. As of December 31, 2014, after taking into account the hedging instruments, long-term debt was comprised of 85.0% fixed rate debt (83.6% in 2013) and 15.0% floating rate debt (16.4% in 2013).
The estimated sensitivity on interest payments of a 100 basis-point variance in the year-end Canadian Bankers’ acceptance rate as of December 31, 2014 is $4.2 million.
Credit Risk
Credit risk is the risk of financial loss to Videotron if a customer or counterparty to a financial asset fails to meet its contractual obligations.
In the normal course of business, Videotron continuously monitors the financial condition of its customers and reviews the credit history of each new customer. As of December 31, 2014, no customer balance represented a significant portion of Videotron’s consolidated accounts receivables. Videotron establishes an allowance for doubtful accounts based on the specific credit risk of its customers and historical trends. The allowance for doubtful accounts amounted to $15.4 million as of December 31, 2014 ($15.7 million as of December 31, 2013). As of December 31, 2014, 7.0% of accounts receivables were 90 days past their billing date (8.6% as of December 31, 2013), of which 82.6% had an allowance for doubtful accounts (71.1% as of December 31, 2013).
Videotron believes that its product lines and the diversity of its customer base are instrumental in reducing its credit risk, as well as the impact of fluctuations in product-line demand. Videotron does not believe that it is exposed to an unusual level of customer credit risk.
As a result of its use of derivative financial instruments, Videotron is exposed to the risk of non-performance by a third party. When Videotron enters into derivative contracts, the counterparties (either foreign or Canadian) must have credit ratings at least in accordance with Videotron’s risk management policy and are subject to concentration limits. These credit ratings and concentration limits are monitored on an ongoing basis but at least quarterly.
105
Table of Contents
Fair Value of Financial Instruments
See “Item 5 – Operating and Financial Review and Prospects – Additional Information – Financial Instruments and Financial Risks – Fair Value of Financial Instruments” in this annual report.
Material Limitations
Fair value estimates are made at a specific point in time and are based on relevant market information about the financial instruments. These estimates are subjective in nature and involve uncertainties and matters of significant judgment and therefore cannot be determined with precision. Changes in assumptions could significantly affect the estimates.
Principal Repayments
As at December 31, 2014, the aggregate amount of minimum principal payments on long-term debt required in each of the next five years and thereafter based on borrowing levels as at that date, are as follows:
Year ending December 31, | (in millions of dollars) | |||
2015 | $ | 213.7 | ||
2016 | 10.7 | |||
2017 | 10.7 | |||
2018 | 91.8 | |||
2019 | — | |||
2020 and thereafter | 2,624.1 | |||
ITEM 12 – DESCRIPTION OF SECURITIES OTHER THAN EQUITY SECURITIES
Not applicable.
ITEM 13 – DEFAULTS, DIVIDEND ARREARAGES AND DELINQUENCIES
None.
ITEM 14 – MATERIAL MODIFICATIONS TO THE RIGHTS OF SECURITY HOLDERS AND USE OF PROCEEDS
Material Modifications to the Rights of Security Holders
There have been no material modifications to the rights of security holders.
Use of Proceeds
Not applicable.
ITEM 15 – CONTROLS AND PROCEDURES
As at the end of the period covered by this report, Videotron’s President and Chief Executive Officer and Videotron’s Vice President, Finance and Chief Financial Officer, together with members of Videotron’s senior management, have carried out an evaluation of the effectiveness of Videotron’s disclosure controls and procedures. These are defined (in Rule 13a-15(e) or 15d-15(e) under the Securities Exchange Act of 1934, as amended) as controls and procedures designed to ensure that information required to be disclosed in reports filed under the Exchange Act is recorded, processed, summarized and reported within specified time periods. As of the date of the evaluation, Videotron’s President and Chief Executive Officer and Videotron’s Vice President, Finance and Chief Financial Officer, concluded that Videotron’s disclosure controls and procedures were effective to ensure that information required to be disclosed in the reports that Videotron files or submits under the Exchange Act is accumulated and communicated to management, including the company’s principal executive and principal financial officer, to allow timely decisions regarding disclosure.
106
Table of Contents
Videotron’s management is responsible for establishing and maintaining adequate internal control over financial reporting of the company (as defined by Rules 13a-15(f) and 15d-15(f) under the Securities Exchange Act of 1934). Videotron’s internal control over financial reporting is a process designed to provide reasonable assurance regarding the reliability of financial reporting and the preparation of consolidated financial statements for external purposes in accordance with IFRS. Our internal control over financial reporting includes those policies and procedures that (i) pertain to the maintenance of records that, in reasonable detail, accurately and fairly reflect the transactions and dispositions of the assets of Videotron; (ii) provide reasonable assurance that transactions are recorded as necessary to permit preparation of consolidated financial statements in accordance with IFRS, and that receipts and expenditures of Videotron are being made only in accordance with authorizations of Videotron’s management and directors; and (iii) provide reasonable assurance regarding prevention or timely detection of unauthorized acquisition, use, or disposition of Videotron’s assets that could have a material effect on the consolidated financial statements. Because of its inherent limitations, internal controls over financial reporting may not prevent or detect misstatements. Also, projections of any evaluation of effectiveness to future periods are subject to the risk that controls may become inadequate because of changes in conditions, or that the degree of compliance with the policies or procedures may deteriorate.
Videotron’s management conducted an evaluation of the effectiveness of internal control over financial reporting based on the original framework inInternal Control – Integrated Framework issued by the Committee of Sponsoring Organizations of the Treadway Commission. Based on this evaluation, management concluded that Videotron’s internal control over financial reporting was effective as of December 31, 2014.
Pursuant to theDodd–Frank Wall Street Reform and Consumer Protection Act of 2010 and related SEC rules, Videotron is not required to include in its annual report an attestation report of Videotron’s independent registered public accounting firm regarding Videotron’s internal control over financial reporting. Our management’s report regarding the effectiveness of our internal control over financial reporting was therefore not subject to attestation procedures by Videotron’s independent registered public accounting firm.
There have been no changes in Videotron’s internal control over financial reporting (as defined in Rule 13a-15 or 15d-15 under the Exchange Act) that occurred during the period covered by this annual report that have materially affected, or are reasonably likely to materially affect, Videotron’s internal control over financial reporting.
ITEM 16A – AUDIT COMMITTEE FINANCIAL EXPERT
Our Board of Directors has determined that Mr. La Couture is an “audit committee financial expert” (as defined in Item 16A of Form 20-F) serving on our Audit Committee. Our Board of Directors has determined that Mr. La Couture is an “independent” director, as defined under SEC rules.
We have a Code of Ethics (as defined in Item 16B ofForm 20-F) that applies to all directors, officers and employees of Videotron, including our Chief Executive Officer, Chief Financial Officer, principal accounting officer, controller and persons performing similar functions. Our Code of Ethics is included as an exhibit to this annual report onForm 20-F.
ITEM 16C – PRINCIPAL ACCOUNTANT FEES AND SERVICES
Ernst & Young LLP has served as our independent registered public accounting firm for the fiscal years ended December 31, 2014, 2013 and 2012. The audited consolidated financial statements for each of the fiscal years in the three-year period ended December 31, 2014 are included in this annual report onForm 20-F.
The Audit Committee establishes the independent auditors’ compensation. The Audit Committee adopted a policy relating to the pre-approval of services to be rendered by its independent auditors. The Audit Committee pre-approves all audit services, determines which non-audit services the independent auditors are prohibited from providing, and authorizes permitted non-audit services to be performed by the independent auditors to the extent those services are permitted by the Sarbanes-Oxley Act and Canadian law. For each of the years ended December 31, 2014, 2013 and 2012, none of the non-audit services described below were approved by the Audit Committee of our Board of Directors pursuant
107
Table of Contents
to the “de minimis exception” to the pre-approval requirement for non-audit services. The following table presents the aggregate fees billed for professional services and other services rendered by our independent auditors, Ernst & Young LLP, for the years ended December 31, 2014, 2013 and 2012.
| 2014 | 2013 | 2012 | ||||||||||
Audit Fees(1) | $ | 916,811 | $ | 1,055,899 | $ | 947,524 | ||||||
Audit related Fees(2) | 62,467 | 48,837 | 74,051 | |||||||||
All Other Fees(3) | 17,347 | 10,710 | 11,918 | |||||||||
Total | $ | 996,625 | $ | 1,115,446 | $ | 1,033,493 | ||||||
| (1) | Audit Fees consist of fees approved for the annual audit of the Corporation’s consolidated financial statements and quarterly reviews of interim financial statements of the Corporation with the SEC, including required assistance or services that only the external auditor reasonably can provide and accounting consultations on specific issues. |
| (2) | Audit-Related Fees include fees for the review of one subsidiary’s financial statements and various reports to statutory authorities. |
| (3) | All Other Fees include fees billed for assistance with Canadian, U.S. and international tax compliance. |
ITEM 16D – EXEMPTIONS FROM THE LISTING STANDARDS FOR AUDIT COMMITTEES
Not applicable.
ITEM 16E – PURCHASES OF EQUITY SECURITIES BY THE ISSUER AND AFFILIATED PURCHASERS
Not applicable.
ITEM 16F – CHANGES IN REGISTRANT’S CERTIFYING ACCOUNTANT
Not applicable.
ITEM 16G – CORPORATE GOVERNANCE
Not applicable.
ITEM 17 – FINANCIAL STATEMENTS
Not applicable.
ITEM 18 – FINANCIAL STATEMENTS
Our consolidated balance sheets as at December 31, 2014 and 2013 and the related consolidated statements of income, comprehensive income, equity and cash flows for each of the years in the three-year period ended December 31, 2014, including the notes thereto and together with the report of the Independent Registered Public Accounting Firm, are included beginning on page F-1 of this annual report.
Exhibits
The following documents are filed as exhibits to this Form 20-F:
| 1.1 | Certificate and Articles of Amalgamation of Videotron Ltd. as of July 1, 2006 (translation) (incorporated by reference to Exhibit 1.1 to Videotron Ltd.’s Annual Report on Form 20-F for the fiscal year ended December 31, 2006, filed on March 30, 2007). | |
| 1.2 | Certificate and Articles of Amendment of Videotron Ltd. as of June 30, 2008 (incorporated by reference to Exhibit 1.2 of Videotron Ltd.’s Annual Report on Form 20-F for the fiscal year ended December 31, 2008, filed on March 6, 2009). | |
108
Table of Contents
| 1.3 | Certificate and Articles of Amendment of Videotron Ltd. as of December 12, 2008 (incorporated by reference to Exhibit 1.3 of Videotron Ltd.’s Annual Report on Form 20-F for the fiscal year ended December 31, 2008, filed on March 6, 2009). | |
| 1.4 | By-laws of Videotron Ltd. (translation) (incorporated by reference to Exhibit 1.4 of Videotron Ltd.’s Annual Report on Form 20-F for the fiscal year ended December 31, 2011, filed on March 21, 2012). | |
| 1.5 | Certificate and Articles of Amalgamation of Le SuperClub Vidéotron ltée (translation) (incorporated by reference to Exhibit 1.5 of Videotron Ltd.’s Annual Report on Form 20-F for the fiscal year ended December 31, 2008, filed on March 6, 2009). | |
| 1.6 | By-laws of Le SuperClub Vidéotron ltée (translation) (incorporated by reference to Exhibit 1.6 of Videotron Ltd.’s Annual Report on Form 20-F for the fiscal year ended December 31, 2011, filed on March 21, 2012). | |
| 1.7 | Certificate of Amendment for Le SuperClub Vidéotron Ltée (translation) (incorporated by reference to Exhibit 1.7 to Videotron Ltd.’s Annual Report on Form 20-F for the fiscal year ended December 31, 2013, filed on March 20, 2014, Commission file, No. 033-51000). | |
| 1.8 | Articles of Incorporation of Vidéotron Infrastructures Inc., as amended as of February 17, 2011 (incorporated by reference to Exhibit 1.7 to Videotron Ltd.’s Annual Report on Form 20-F for the fiscal year ended December 31, 2010, filed on March 21, 2011). | |
| 1.9 | By-laws of Vidéotron Infrastructures Inc. (translation) (incorporated by reference to Exhibit 1.8 of Videotron Ltd.’s Annual Report on Form 20-F for the fiscal year ended December 31, 2011, filed on March 21, 2012). | |
| 1.10 | Certificate of Incorporation of Videotron US Inc. as of September 20, 2007 (incorporated by reference to Exhibit 1.9 of Videotron Ltd.’s Annual Report on Form 20-F for the fiscal year ended December 31, 2008, filed on March 6, 2009). | |
| 1.11 | Amended and Restated Certificate of Incorporation of Videotron US Inc. as of October 1, 2008 (incorporated by reference to Exhibit 1.10 of Videotron Ltd.’s Annual Report on Form 20-F for the fiscal year ended December 31, 2008, filed on March 6, 2009). | |
| 1.12 | By-laws of Videotron US Inc. (incorporated by reference to Exhibit 1.11 of Videotron Ltd.’s Annual Report on Form 20-F for the fiscal year ended December 31, 2008, filed on March 6, 2009). | |
| 1.13 | Declaration of registration of Videotron G.P. (incorporated by reference to Exhibit 1.12 to Videotron Ltd.’s Annual Report on Form 20-F for the fiscal year ended December 31, 2010, filed on March 21, 2011). | |
| 1.14 | Declaration of registration of Videotron L.P. (incorporated by reference to Exhibit 1.13 to Videotron Ltd.’s Annual Report on Form 20-F for the fiscal year ended December 31, 2010, filed on March 21, 2011). | |
| 1.15 | Certificate and Articles of Constitution of 9230-7677 Québec inc. (translation) (incorporated by reference to Exhibit 1.14 to Videotron Ltd.’s Annual Report on Form 20-F for the fiscal year ended December 31, 2010, filed on March 21, 2011). | |
| 1.16 | By-laws of 9230-7677 Québec inc. (translation) (incorporated by reference to Exhibit 1.15 of Videotron Ltd.’s Annual Report on Form 20-F for the fiscal year ended December 31, 2011, filed on March 21, 2012). | |
| 1.17 | Certificate and Articles of Incorporation of Jobboom inc. (translation) (incorporated by reference to Exhibit 1.16 of Videotron Ltd.’s Annual Report on Form 20-F for the fiscal year ended December 31, 2011, filed on March 21, 2012). | |
| 1.18 | By-laws of Jobboom inc. (translation) (incorporated by reference to Exhibit 1.17 of Videotron Ltd.’s Annual Report on Form 20-F for the fiscal year ended December 31, 2011, filed on March 21, 2012). | |
| 1.19 | Certificate and Articles of Amalgamation of Jobboom Inc. as of May 30, 2013 (translation) (incorporated by reference to Exhibit 1.19 to Videotron Ltd.’s Annual Report on Form 20-F for the fiscal year ended December 31, 2013, filed on March 20, 2014, Commission file, No. 033-51000). | |
109
Table of Contents
| 1.20 | Certificate of Amendment of 8487782 Canada Inc. as of May 30, 2013 (translation) (incorporated by reference to Exhibit 1.20 to Videotron Ltd.’s Annual Report on Form 20-F for the fiscal year ended December 31, 2013, filed on March 20, 2014, Commission file, No. 033-51000). | |
| 1.21 | By-laws of 8487782 Canada Inc (translation) (incorporated by reference to Exhibit 1.21 to Videotron Ltd.’s Annual Report on Form 20-F for the fiscal year ended December 31, 2013, filed on March 20, 2014, Commission file, No. 033-51000). | |
| 1.22 | Certificate and Articles of Constitution of 9227-2590 Québec inc. (translation) (incorporated by reference to Exhibit 1.18 of Videotron Ltd.’s Annual Report on Form 20-F for the fiscal year ended December 31, 2011, filed on March 21, 2012). | |
| 1.23 | By-laws of 9227-2590 Québec inc. (translation) (incorporated by reference to Exhibit 1.19 of Videotron Ltd.’s Annual Report on Form 20-F for the fiscal year ended December 31, 2011, filed on March 21, 2012). | |
| 2.1 | Form of 6 3/8% Senior Notes due December 15, 2015 of Videotron Ltd. (incorporated by reference to Exhibit A to Exhibit 4.3 to Videotron Ltd.’s Registration Statement on Form F-4 dated October 14, 2005, Registration StatementNo. 333-128998). | |
| 2.2 | Form of Notation of Guarantee by the subsidiary guarantors of the 6 3/8% Senior Notes due December 15, 2015 of Videotron Ltd. (incorporated by reference to Exhibit E to Exhibit 4.3 to Videotron Ltd.’s Registration Statement on Form F-4 dated October 14, 2005, Registration StatementNo. 333-128998). | |
| 2.3 | Indenture, dated as of September 16, 2005, by and among Videotron Ltd., the subsidiary guarantors signatory thereto and Wells Fargo Bank, National Association, as trustee (incorporated by reference to Exhibit 4.3 to Videotron Ltd.’s Registration Statement on Form F-4 dated October 14, 2005, Registration StatementNo. 333-128998). | |
| 2.4 | Supplemental Indenture, dated as of April 15, 2008, by and among Videotron Ltd., Videotron US Inc., as guarantor, and Wells Fargo Bank, National Association, as trustee, to the Indenture dated as of September 16, 2005 (incorporated by reference to Exhibit 2.10 of Videotron Ltd.’s Annual Report on Form 20-F for the fiscal year ended December 31, 2008, filed on March 6, 2009). | |
| 2.5 | Supplemental Indenture, dated as of September 29, 2010, by and among Videotron Ltd., 9227-2590 Québec inc., as guarantor, and Wells Fargo Bank, National Association, as trustee, to the Indenture dated as of September 16, 2005 (incorporated by reference to Exhibit 2.14 to Videotron Ltd.’s Annual Report on Form 20-F for the fiscal year ended December 31, 2010, filed on March 21, 2011). | |
| 2.6 | Supplemental Indenture, dated as of December 22, 2010, by and among Videotron Ltd., Videotron G.P., Videotron L.P. and 9230-7677 Québec inc., as guarantors, and Wells Fargo Bank, National Association, as trustee, to the Indenture dated as of September 16, 2005 (incorporated by reference to Exhibit 2.15 to Videotron Ltd.’s Annual Report on Form 20-F for the fiscal year ended December 31, 2010, filed on March 21, 2011). | |
| 2.7 | Supplemental Indenture, dated as of May 2, 2011, by and among Videotron Ltd., Jobboom inc., as guarantor, and Wells Fargo Bank, National Association, as trustee, to the Indenture dated as of September 16, 2005 (incorporated by reference to Exhibit 2.19 to Videotron’s Annual Report on Form 20-F for the fiscal year ended December 31, 2011, filed on March 21, 2012). | |
| 2.8 | Form of 9 1/8% Senior Notes due April 15, 2018 of Videotron Ltd. (incorporated by reference to Exhibit A to Exhibit 2.14 of Videotron Ltd.’s Annual Report on Form 20-F for the fiscal year ended December 31, 2008, filed on March 6, 2009, Commission file No. 033-51000). | |
| 2.9 | Form of Notation of Guarantee of the subsidiary guarantors of the 9 1/8% Senior Notes due April 15, 2018 of Videotron Ltd. (incorporated by reference to Exhibit E to Exhibit 2.14 of Videotron Ltd.’s Annual Report on Form 20-F for the fiscal year ended December 31, 2008, filed on March 6, 2009, Commission file No. 033-51000). | |
| 2.10 | Indenture, dated as of April 15, 2008, by and among Videotron Ltd., the subsidiary guarantors signatory thereto and Wells Fargo Bank, National Association, as trustee (incorporated by reference to Exhibit 2.14 of Videotron Ltd.’s Annual Report on Form 20-F for the fiscal year ended December 31, 2008, filed on March 6, 2009, Commission file No. 033-51000). | |
110
Table of Contents
| 2.11 | Supplemental Indenture, dated as of March 5, 2009, by and among Videotron Ltd., Le SuperClub Vidéotron Ltée, CF Cable TV Inc., Videotron US Inc. and 9193-2926 Québec inc., as guarantors, and Wells Fargo Bank, National Association, as trustee, to the Indenture dated as of April 15, 2008 (incorporated by reference to Exhibit 2.16 of Videotron Ltd.’s Annual Report on Form 20-F for the fiscal year ended December 31, 2009, filed on March 16, 2010). | |
| 2.12 | Supplemental Indenture, dated as of September 29, 2010, by and among Videotron Ltd., 9227-2590 Québec inc., as guarantor, and Wells Fargo Bank, National Association, as trustee, to the Indenture dated as of April 15, 2008 (incorporated by reference to Exhibit 2.21 to Videotron Ltd.’s Annual Report on Form 20-F for the fiscal year ended December 31, 2010, filed on March 21, 2011). | |
| 2.13 | Supplemental Indenture, dated as of December 22, 2010, by and among Videotron Ltd., Videotron G.P., Videotron L.P. and 9230-7677 Québec inc., as guarantors, and Wells Fargo Bank, National Association, as trustee, to the Indenture dated as of April 15, 2008 (incorporated by reference to Exhibit 2.22 to Videotron Ltd.’s Annual Report on Form 20-F for the fiscal year ended December 31, 2010, filed on March 21, 2011). | |
| 2.14 | Supplemental Indenture, dated as of May 2, 2011, by and among Videotron Ltd., Jobboom inc., as guarantor, and Wells Fargo Bank, National Association, as trustee, to the Indenture dated as of April 15, 2008 (incorporated by reference to Exhibit 2.29 to Videotron’s Annual Report on Form 20-F for the fiscal year ended December 31, 2011, filed on March 21, 2012). | |
| 2.15 | Form of 7 1/8% Senior Notes due January 15, 2020 of Videotron Ltd. (included as Exhibit A to Exhibit 2.17 of Videotron Ltd.’s Annual Report on Form 20-F for the fiscal year ended December 31, 2009, filed on March 16, 2010, Commission file No. 033-51000). | |
| 2.16 | Form of Notation of Guarantee of the subsidiary guarantors of the 7 1/8% Senior Notes due January 15, 2020 of Videotron Ltd. (included as Exhibit E to Exhibit 2.17 of Videotron Ltd.’s Annual Report on Form 20-F for the fiscal year ended December 31, 2009, filed on March 16, 2010, Commission file No. 033-51000). | |
| 2.17 | Indenture, dated as of January 13, 2010, by and among Videotron Ltd., the subsidiary guarantors signatory thereto and Computershare Trust Company of Canada, as trustee (incorporated by reference to Exhibit 2.17 of Videotron Ltd.’s Annual Report on Form 20-F for the fiscal year ended December 31, 2009, filed on March 16, 2010, Commissionfile No. 033-51000). | |
| 2.18 | Supplemental Indenture, dated as of September 29, 2010, by and among Videotron Ltd., 9227-2590 Québec inc., as guarantor, and Computershare Trust Company of Canada, as trustee, to the Indenture dated as of January 13, 2010 (incorporated by reference to Exhibit 2.24 to Videotron Ltd.’s Annual Report on Form 20-F for the fiscal year ended December 31, 2010, filed on March 21, 2011). | |
| 2.19 | Supplemental Indenture, dated as of December 22, 2010, by and among Videotron Ltd., Videotron G.P., Videotron L.P. and 9230-7677 Québec inc., as guarantors, and Computershare Trust Company of Canada, as trustee, to the Indenture dated as of January 13, 2010 (incorporated by reference to Exhibit 2.25 to Videotron Ltd.’s Annual Report on Form 20-F for the fiscal year ended December 31, 2010, filed on March 21, 2011). | |
| 2.20 | Supplemental Indenture, dated as of May 2, 2011, by and among Videotron Ltd., Jobboom inc., as guarantor, and Computershare Trust Company of Canada, as trustee, to the Indenture dated as of January 13, 2010 (incorporated by reference to Exhibit 2.37 to Videotron’s Annual Report on Form 20-F for the fiscal year ended December 31, 2011, filed on March 21, 2012). | |
| 2.21 | Form of 6 7/8% Senior Notes due July 15, 2021 of Videotron Ltd. (included as Exhibit A Exhibit 2.42 of Videotron Ltd.’s Annual Report on Form 20-F for the fiscal year ended December 31, 2011, filed on March 21, 2012, Commission file No. 033-51000). | |
| 2.22 | Form of Notation of Guarantee of the subsidiary guarantors of the 6 7/8% Senior Notes due July 15, 2021 of Videotron Ltd. (included as Exhibit E to Exhibit 2.42 of Videotron Ltd.’s Annual Report on Form 20-F for the fiscal year ended December 31, 2011, filed on March 21, 2012, Commission file No. 033-51000). | |
111
Table of Contents
| 2.23 | Indenture, dated as of July 5, 2011, by and among Videotron Ltd., the subsidiary guarantors signatory thereto and Computershare Trust Company of Canada, as trustee (incorporated by reference to Exhibit 2.42 of Videotron Ltd.’s Annual Report on Form 20-F for the fiscal year ended December 31, 2011, filed on March 21, 2012, Commission fileNo. 033-51000). | |
| 2.24 | Form of 5% Senior Notes due July 15, 2022 of Videotron Ltd. (included as Exhibit A to Exhibit 2.47 of Videotron Ltd.’s Annual Report on Form 20-F for the fiscal year ended December 31, 2011, filed on March 21, 2012, Commission file No. 033-51000). | |
| 2.25 | Form of Notation of Guarantee by the subsidiary guarantors of the 5% Senior Notes due July 15, 2022 of Videotron Ltd. (included as Exhibit E to Exhibit 2.47 of Videotron Ltd.’s Annual Report on Form 20-F for the fiscal year ended December 31, 2011, filed on March 21, 2012, Commission file No. 033-51000). | |
| 2.26 | Indenture, dated as of March 14, 2012, by and among Videotron Ltd., the subsidiary guarantors signatory thereto and Wells Fargo Bank, National Association, as trustee (incorporated by reference to Exhibit 2.47 of Videotron Ltd.’s Annual Report on Form 20-F for the fiscal year ended December 31, 2011, filed on March 21, 2012, Commission file No. 033-51000). | |
| 2.27 | Form of 5 5/8% Senior Notes due June 15, 2025 of Videotron Ltd. (incorporated by reference to Exhibit A to Exhibit 2.40 to Videotron’s Annual Report on Form 20-F for the fiscal year ended December 31, 2013, filed on March 20, 2014, Commission file No. 033-51000). | |
| 2.28 | Form of Notation of Guarantee of the subsidiary guarantors of the 5 5/8% Senior Notes due June 15, 2025 of Videotron Ltd. (incorporated by reference to Exhibit E to Exhibit 2.40 to Videotron’s Annual Report on Form 20-F for the fiscal year ended December 31, 2013, filed on March 20, 2014, Commission file No. 033-5100). | |
| 2.29 | Indenture, dated as of June 17, 2013, by and among Videotron Ltd., the subsidiary guarantors party thereto, and Computershare Trust Company of Canada, as trustee (incorporated by reference to Exhibit 2.40 to Videotron’s Annual Report on Form 20-F for the fiscal year ended December 31, 2013, filed on March 20, 2014, Commission fileNo. 033-51000). | |
| 2.30 | Form of 5 5/8% Senior Notes due June 15, 2024 of Videotron Ltd. (incorporated by reference to Exhibit A to Exhibit 2.32 below). | |
| 2.31 | Form of Notation of Guarantee by the subsidiary guarantors of the 5 5/8% Senior Notes due June 15, 2024 of Videotron Ltd. (incorporated by reference to Exhibit A to Exhibit 2.32 below). | |
| 2.32 | Indenture, dated as of April 9, 2014, by and among Videotron Ltd., the subsidiary guarantors signatory thereto and Wells Fargo Bank, National Association, as trustee. | |
| 4.1 | Amended and Restated Credit Agreement, dated as of July 20, 2011, by and among Videotron, Royal Bank of Canada, as administrative agent, and the financial institutions signatory thereto and acknowledged by Le SuperClub Videotron, Videotron Infrastructures Inc., Jobboom Inc., Videotron US Inc., 9227-2590 Québec inc., 9230-7677 Québec inc., Videotron G.P., and Videotron L.P., as guarantors (incorporated by reference to Exhibit 4.1 of Videotron Ltd.’s Annual Report on Form 20-F for the fiscal year ended December 31, 2011, filed on March 21, 2012). | |
| 4.2 | First Amending Agreement, dated as of June 14, 2013, amending the Amended and Restated Credit Agreement, dated as of July 20, 2011, by and among Videotron, Royal Bank of Canada, as administrative agent, and the financial institutions signatory thereto and acknowledged by Le SuperClub Videotron, Videotron Infrastructures Inc., Videotron US Inc.,9227-2590 Québec inc., 9230-7677 Québec inc., Videotron G.P., Videotron L.P. and 8487782 Canada Inc. as guarantors (incorporated by reference to Exhibit 4.2 to Videotron Ltd.’s Annual Report onForm 20-F for the fiscal year ended December 31, 2013, filed on March 20, 2014, Commission file,No. 033-51000). | |
| 4.3 | Form of Guarantee of the Guarantors of the Credit Agreement (included as Schedule D of Exhibit 4.1 above). | |
112
Table of Contents
| 4.4 | Form of Share Pledge of the shares of Videotron Ltd. and the Guarantors of the Credit Agreement (included as Schedule E of Exhibit 4.1 above). | |
| 4.5 | Management Services Agreement, effective as of January 1, 2002, between Quebecor Media and Videotron Ltd. (incorporated by reference to Exhibit 10.5 to Videotron Ltd.’s Registration Statement on Form F-4 dated November 24, 2003, Registration Statement No. 333-110697). | |
| 7.1 | Statement regarding calculation of ratio of earnings to fixed charges. | |
| 8.1 | Subsidiaries of Videotron Ltd. | |
| 11.1 | Code of Ethics. (incorporated by reference to Exhibit 11.1 of Videotron Ltd.’s Annual Report on Form 20-F for the fiscal year ended December 31, 2008, filed on March 6, 2009). | |
| 12.1 | Certification of Manon Brouillette, President and Chief Executive Officer of Videotron Ltd., pursuant to 15 U.S.C. Section 78(m)(a), as adopted pursuant to Section 302 of the Sarbanes-Oxley Act of 2002. | |
| 12.2 | Certification of Hugues Simard, Senior Vice President and Chief Financial Officer of Videotron Ltd., pursuant to 15 U.S.C. Section 78(m)(a), as adopted pursuant to Section 302 of the Sarbanes-Oxley Act of 2002. | |
| 13.1 | Certification of Manon Brouillette, President and Chief Executive Officer of Videotron Ltd., pursuant to 18 U.S.C. Section 1350 as adopted pursuant to Section 906 of the Sarbanes Oxley Act of 2002. | |
| 13.2 | Certification of Hugues Simard, Senior Vice President and Chief Financial Officer of Videotron Ltd. pursuant to 18 U.S.C. Section 1350 as adopted pursuant to Section 906 of the Sarbanes Oxley Act of 2002. | |
113
Table of Contents
The registrant hereby certifies that it meets all of the requirements for filing on Form 20-F and that it has duly caused and authorized the undersigned to sign this annual report on its behalf.
| VIDEOTRON LTD. | ||
| By: | /s/ Hugues Simard | |
| Hugues Simard | ||
Senior Vice President and Chief Financial Officer | ||
Dated: March 20, 2015
114
Table of Contents
CONSOLIDATED FINANCIAL STATEMENTS
Years ended December 31, 2014, 2013 and 2012
| F-2 | ||||
Consolidated financial statements | ||||
| F-3 | ||||
| F-4 | ||||
| F-5 | ||||
| F-6 | ||||
| F-8 | ||||
| F-10 | ||||
F-1
Table of Contents
Report of Independent Registered Public Accounting Firm
To the Board of Directors and to the shareholder of Videotron Ltd.
We have audited the accompanying consolidated balance sheets of Videotron Ltd. as of December 31, 2014 and 2013, and the related consolidated statements of income, comprehensive income, equity and cash flows for each of the three years in the period ended December 31, 2014. These consolidated financial statements are the responsibility of the Corporation’s management. Our responsibility is to express an opinion on these consolidated financial statements based on our audits.
We conducted our audits in accordance with the standards of the Public Company Accounting Oversight Board (United States). Those standards require that we plan and perform the audit to obtain reasonable assurance about whether the consolidated financial statements are free of material misstatement. We were not engaged to perform an audit of the Corporation’s internal control over financial reporting. Our audits included consideration of internal control over financial reporting as a basis for designing audit procedures that are appropriate in the circumstances, but not for the purpose of expressing an opinion on the effectiveness of the Corporation’s internal control over financial reporting. Accordingly, we express no such opinion. An audit also includes examining, on a test basis, evidence supporting the amounts and disclosures in the consolidated financial statements, assessing the accounting principles used and significant estimates made by management, and evaluating the overall financial statement presentation. We believe that our audits provide a reasonable basis for our opinion.
In our opinion, the consolidated financial statements referred to above present fairly, in all material respects, the consolidated financial position of Videotron Ltd. at December 31, 2014 and 2013, and the consolidated results of its operations and its cash flows for each of the three years in the period ended December 31, 2014, in conformity with International Financial Reporting Standards as issued by the International Accounting Standards Board.
/S/ ERNST & YOUNG LLP1
Montreal, Canada
March 19, 2015
| 1 | FCPA auditor, CA, public accountancy permit no. A107913 |
 | ||
| A member firm of Ernst & Young Global Limited | ||
F-2
Table of Contents
CONSOLIDATED STATEMENTS OF INCOME
Years ended December 31, 2014, 2013 and 2012
(in thousands of Canadian dollars)
| Note | 2014 | 2013 | 2012 | |||||||||||||
Revenues | ||||||||||||||||
Cable television | $ | 1,074,821 | $ | 1,090,261 | $ | 1,079,343 | ||||||||||
Internet | 868,264 | 818,400 | 772,497 | |||||||||||||
Cable telephony | 475,143 | 473,798 | 454,861 | |||||||||||||
Mobile telephony | 287,665 | 220,561 | 171,624 | |||||||||||||
Business solutions | 65,632 | 63,525 | 64,945 | |||||||||||||
Equipment sales | 45,627 | 36,524 | 43,412 | |||||||||||||
Other | 9,613 | 8,754 | 11,162 | |||||||||||||
|
|
|
|
|
| |||||||||||
| 2,826,765 | 2,711,823 | 2,597,844 | ||||||||||||||
Employee costs | 2 | 342,399 | 347,097 | 338,591 | ||||||||||||
Purchase of goods and services | 2 | 1,136,055 | 1,079,919 | 1,055,549 | ||||||||||||
Depreciation and amortization | 601,381 | 561,743 | 485,385 | |||||||||||||
Financial expenses | 3 | 169,177 | 174,145 | 179,498 | ||||||||||||
Loss (gain) on valuation and translation of financial instruments | 4 | 3,430 | 163,725 | (75,738 | ) | |||||||||||
Loss (gain) on debt refinancing | 5 | 21,403 | 18,912 | (7,608 | ) | |||||||||||
Restructuring of operations, impairment of assets and other special items | 6 | 39,445 | 684 | 478 | ||||||||||||
|
|
|
|
|
| |||||||||||
Income before income taxes | 513,475 | 365,598 | 621,689 | |||||||||||||
Income taxes | ||||||||||||||||
Current | 7 | 107,839 | 79,792 | 41,347 | ||||||||||||
Deferred | 7 | (14,556 | ) | (50,343 | ) | 74,508 | ||||||||||
|
|
|
|
|
| |||||||||||
| 93,283 | 29,449 | 115,855 | ||||||||||||||
|
|
|
|
|
| |||||||||||
Income from continuing operations | 420,192 | 336,149 | 505,834 | |||||||||||||
Income from discontinued operations | 8 | — | 40,706 | 8,145 | ||||||||||||
|
|
|
|
|
| |||||||||||
Net income | $ | 420,192 | $ | 376,855 | $ | 513,979 | ||||||||||
|
|
|
|
|
| |||||||||||
Net income from continuing operations attributable to | ||||||||||||||||
Shareholder | $ | 420,169 | $ | 335,842 | $ | 505,610 | ||||||||||
Non-controlling interests | 23 | 307 | 224 | |||||||||||||
Net income attributable to | ||||||||||||||||
Shareholder | $ | 420,169 | $ | 376,548 | $ | 513,755 | ||||||||||
Non-controlling interests | 23 | 307 | 224 | |||||||||||||
See accompanying notes to consolidated financial statements.
F-3
Table of Contents
CONSOLIDATED STATEMENTS OF COMPREHENSIVE INCOME
Years ended December 31, 2014, 2013 and 2012
(in thousands of Canadian dollars)
| Note | 2014 | 2013 | 2012 | |||||||||||||
Net income | $ | 420,192 | $ | 376,855 | $ | 513,979 | ||||||||||
Other comprehensive (loss) income: | ||||||||||||||||
Items that may be reclassified to income: | ||||||||||||||||
Cash flows hedges: | ||||||||||||||||
Gain (loss) on valuation of derivative financial instruments | 7,193 | (24,975 | ) | 18,895 | ||||||||||||
Deferred income taxes | (10,006 | ) | (349 | ) | 672 | |||||||||||
Items that will not be reclassified to income: | ||||||||||||||||
Defined benefit plans: | ||||||||||||||||
Re-measurement (loss) gain | 27 | (47,918 | ) | 56,755 | (11,072 | ) | ||||||||||
Deferred income taxes | 12,890 | (15,197 | ) | 2,979 | ||||||||||||
Reclassification to income: | ||||||||||||||||
Loss (gain) related to cash flows hedges | 5 | 1,640 | (6,516 | ) | 4,065 | |||||||||||
Deferred income taxes | (1,679 | ) | 199 | (1,500 | ) | |||||||||||
|
|
|
|
|
| |||||||||||
| (37,880 | ) | 9,917 | 14,039 | |||||||||||||
|
|
|
|
|
| |||||||||||
Comprehensive income | $ | 382,312 | $ | 386,772 | $ | 528,018 | ||||||||||
|
|
|
|
|
| |||||||||||
Comprehensive income attributable to | ||||||||||||||||
Shareholder | $ | 382,289 | $ | 386,465 | $ | 527,794 | ||||||||||
Non-controlling interests | 23 | 307 | 224 | |||||||||||||
See accompanying notes to consolidated financial statements.
F-4
Table of Contents
CONSOLIDATED STATEMENTS OF EQUITY
Years ended December 31, 2014, 2013 and 2012
(in thousands of Canadian dollars)
| Equity attributable to shareholder | ||||||||||||||||||||
| Capital stock (note 20) | Retained earnings | Accumulated other comprehensive loss (note 22) | Equity attributable to non-controlling interests | Total equity | ||||||||||||||||
Balance as of December 31, 2011 | $ | 3,401 | $ | 1,005,139 | $ | (33,065 | ) | $ | 1,314 | $ | 976,789 | |||||||||
|
|
|
|
|
|
|
|
|
| |||||||||||
Net income | — | 513,755 | — | 224 | 513,979 | |||||||||||||||
Other comprehensive income | — | — | 14,039 | — | 14,039 | |||||||||||||||
Related party transaction (note 9) | — | 30,000 | — | — | 30,000 | |||||||||||||||
Acquisition of a non-controlling interest | — | — | — | (38 | ) | (38 | ) | |||||||||||||
Dividends | — | (760,000 | ) | — | (463 | ) | (760,463 | ) | ||||||||||||
|
|
|
|
|
|
|
|
|
| |||||||||||
Balance as of December 31, 2012 | 3,401 | 788,894 | (19,026 | ) | 1,037 | 774,306 | ||||||||||||||
Net income | — | 376,548 | — | 307 | 376,855 | |||||||||||||||
Other comprehensive income | — | — | 9,917 | — | 9,917 | |||||||||||||||
Related party transaction (note 9) | — | 22,953 | — | — | 22,953 | |||||||||||||||
Dividends | — | (361,880 | ) | — | (401 | ) | (362,281 | ) | ||||||||||||
|
|
|
|
|
|
|
|
|
| |||||||||||
Balance as of December 31, 2013 | 3,401 | 826,515 | (9,109 | ) | 943 | 821,750 | ||||||||||||||
Net income | — | 420,169 | — | 23 | 420,192 | |||||||||||||||
Other comprehensive loss | — | — | (37,880 | ) | — | (37,880 | ) | |||||||||||||
Dividends | — | (410,000 | ) | — | (155 | ) | (410,155 | ) | ||||||||||||
|
|
|
|
|
|
|
|
|
| |||||||||||
Balance as of December 31, 2014 | $ | 3,401 | $ | 836,684 | $ | (46,989 | ) | $ | 811 | $ | 793,907 | |||||||||
|
|
|
|
|
|
|
|
|
| |||||||||||
See accompanying notes to consolidated financial statements.
F-5
Table of Contents
CONSOLIDATED STATEMENTS OF CASH FLOWS
Years ended December 31, 2014, 2013 and 2012
(in thousands of Canadian dollars)
| Note | 2014 | 2013 | 2012 | |||||||||||||
Cash flows related to operating activities | ||||||||||||||||
Income from continuing operations | $ | 420,192 | $ | 336,149 | $ | 505,834 | ||||||||||
Adjustments for: | ||||||||||||||||
Depreciation of fixed assets | �� | 12 | 490,501 | 455,189 | 388,455 | |||||||||||
Amortization of intangible assets | 13 | 110,880 | 106,554 | 96,930 | ||||||||||||
Loss (gain) on valuation and translation of financial instruments | 4 | 3,430 | 163,725 | (75,738 | ) | |||||||||||
Amortization of financing costs and long-term debt premium or discount | 3 | 4,650 | 5,263 | 5,572 | ||||||||||||
Deferred income taxes | 7 | (14,556 | ) | (50,343 | ) | 74,508 | ||||||||||
Loss (gain) on debt refinancing | 5 | 21,403 | 18,912 | (7,608 | ) | |||||||||||
Other | 4,262 | 2,882 | 3,679 | |||||||||||||
|
|
|
|
|
| |||||||||||
| 1,040,762 | 1,038,331 | 991,632 | ||||||||||||||
Net change in non-cash balances related to operating activities | 65,690 | 20,009 | 156,215 | |||||||||||||
|
|
|
|
|
| |||||||||||
Cash flows provided by continuing operating activities | 1,106,452 | 1,058,340 | 1,147,847 | |||||||||||||
Cash flows related to investing activities | ||||||||||||||||
Additions to fixed assets | 12 | (606,040 | ) | (530,878 | ) | (670,238 | ) | |||||||||
Additions to intangible assets | 13 | (304,548 | ) | (67,616 | ) | (75,615 | ) | |||||||||
Net proceeds from business disposal | 8 | — | 50,318 | — | ||||||||||||
Dividends from an affiliated corporation | 9 | — | 10,500 | 30,000 | ||||||||||||
Proceeds from disposal of assets | 5,493 | 12,801 | 7,178 | |||||||||||||
Other | — | — | (135 | ) | ||||||||||||
|
|
|
|
|
| |||||||||||
Cash flows used in continuing investing activities | (905,095 | ) | (524,875 | ) | (708,810 | ) | ||||||||||
Cash flows related to financing activities | ||||||||||||||||
Issuance of long-term debt, net of financing fees | 18 | 654,475 | 394,820 | 787,571 | ||||||||||||
Net borrowings under bank credit facilities | 18 | (10,714 | ) | (10,714 | ) | (10,714 | ) | |||||||||
Repayment of long-term debt | 5, 18 | (295,446 | ) | (417,833 | ) | (394,094 | ) | |||||||||
Settlement of hedging contracts | 5 | (119,157 | ) | 19,431 | (2,934 | ) | ||||||||||
Dividends | (410,000 | ) | (361,880 | ) | (760,000 | ) | ||||||||||
Other | (182 | ) | (1,223 | ) | (503 | ) | ||||||||||
|
|
|
|
|
| |||||||||||
Cash flows used in continuing financing activities | (181,024 | ) | (377,399 | ) | (380,674 | ) | ||||||||||
Net change in cash and cash equivalents from continuing operations | 20,333 | 156,066 | 58,363 | |||||||||||||
Cash flows provided by discontinued operations | 8 | — | 3,172 | 10,775 | ||||||||||||
Cash and cash equivalents at beginning of year | 322,469 | 163,231 | 94,093 | |||||||||||||
|
|
|
|
|
| |||||||||||
Cash and cash equivalents at end of year | $ | 342,802 | $ | 322,469 | $ | 163,231 | ||||||||||
|
|
|
|
|
| |||||||||||
F-6
Table of Contents
VIDEOTRON LTD.
CONSOLIDATED STATEMENTS OF CASH FLOWS (continued)
Years ended December 31, 2014, 2013 and 2012
(in thousands of Canadian dollars)
| 2014 | 2013 | 2012 | ||||||||||
Additional information on the consolidated statements of cash flows | ||||||||||||
Cash and cash equivalents consist of | ||||||||||||
Cash | $ | 103,369 | $ | 93,156 | $ | 10,522 | ||||||
Cash equivalents | 239,433 | 229,313 | 152,709 | |||||||||
|
|
|
|
|
| |||||||
| $ | 342,802 | $ | 322,469 | $ | 163,231 | |||||||
|
|
|
|
|
| |||||||
Changes in non-cash balances related to operating activities | ||||||||||||
Accounts receivable | $ | (8,860 | ) | $ | 4,444 | $ | (1,161 | ) | ||||
Amounts receivable from and payable to affiliated corporations | 18,836 | 11,341 | 9,846 | |||||||||
Inventories | 15,194 | 1,147 | 27,246 | |||||||||
Prepaid expenses | 1,938 | (9,344 | ) | (2,406 | ) | |||||||
Accounts payable, accrued charges and provisions | 39,582 | (43,944 | ) | 85,286 | ||||||||
Income taxes | (10,672 | ) | 59,320 | 40,563 | ||||||||
Stock-based compensation | 798 | (3,477 | ) | (2,920 | ) | |||||||
Deferred revenues | 8,159 | (1,249 | ) | (408 | ) | |||||||
Defined benefit plans | (6,765 | ) | (6,068 | ) | (1,381 | ) | ||||||
Other | 7,480 | 7,839 | 1,550 | |||||||||
|
|
|
|
|
| |||||||
| $ | 65,690 | $ | 20,009 | $ | 156,215 | |||||||
|
|
|
|
|
| |||||||
Non-cash investing activities | ||||||||||||
Net change in additions to fixed assets and intangible assets financed with accounts payable | $ | 1,387 | $ | (1,243 | ) | $ | 49,516 | |||||
|
|
|
|
|
| |||||||
Interest and taxes reflected as operating activities | ||||||||||||
Cash interest payments | $ | 168,164 | $ | 168,436 | $ | 165,025 | ||||||
Cash income tax payments (net of refunds) | 120,277 | 21,789 | 912 | |||||||||
See accompanying notes to consolidated financial statements.
F-7
Table of Contents
CONSOLIDATED BALANCE SHEETS
December 31, 2014 and 2013
(in thousands of Canadian dollars)
| Note | 2014 | 2013 | ||||||||||
Assets | ||||||||||||
Current assets | ||||||||||||
Cash and cash equivalents | $ | 342,802 | $ | 322,469 | ||||||||
Accounts receivable | 259,030 | 250,170 | ||||||||||
Income taxes | 7 | — | 1,615 | |||||||||
Amounts receivable from affiliated corporations | 26 | 18,324 | 26,113 | |||||||||
Inventories | 10 | 79,066 | 94,260 | |||||||||
Prepaid expenses | 23,735 | 26,941 | ||||||||||
|
|
|
| |||||||||
Total current assets | 722,957 | 721,568 | ||||||||||
|
|
|
| |||||||||
Non-current assets | ||||||||||||
Investments | 11 | 1,080,000 | 2,280,000 | |||||||||
Fixed assets | 12 | 3,000,816 | 2,892,118 | |||||||||
Intangible assets | 13 | 830,585 | 640,030 | |||||||||
Goodwill | 14 | 429,252 | 429,252 | |||||||||
Derivative financial instruments | 25 | 164,859 | 29,638 | |||||||||
Other assets | 15 | 27,127 | 36,790 | |||||||||
|
|
|
| |||||||||
Total non-current assets | 5,532,639 | 6,307,828 | ||||||||||
|
|
|
| |||||||||
Total assets | $ | 6,255,596 | $ | 7,029,396 | ||||||||
|
|
|
| |||||||||
F-8
Table of Contents
VIDEOTRON LTD.
CONSOLIDATED BALANCE SHEETS (continued)
December 31, 2014 and 2013
(in thousands of Canadian dollars)
| Note | 2014 | 2013 | ||||||||||
Liabilities and equity | ||||||||||||
Current liabilities | ||||||||||||
Accounts payable and accrued charges | 16 | $ | 412,917 | $ | 408,621 | |||||||
Amounts payable to affiliated corporations | 26 | 49,384 | 38,338 | |||||||||
Provisions | 17 | 45,744 | 10,757 | |||||||||
Deferred revenue | 262,496 | 247,753 | ||||||||||
Income taxes | 7 | 69,819 | 84,522 | |||||||||
Derivative financial instruments | 25 | 902 | 116,230 | |||||||||
Current portion of long-term debt | 18 | 213,688 | 10,714 | |||||||||
|
|
|
| |||||||||
Total current liabilities | 1,054,950 | 916,935 | ||||||||||
|
|
|
| |||||||||
Non-current liabilities | ||||||||||||
Long-term debt | 18 | 2,710,852 | 2,388,391 | |||||||||
Subordinated loan from parent corporation | 11 | 1,080,000 | 2,280,000 | |||||||||
Derivative financial instruments | 25 | 52,718 | 77,278 | |||||||||
Deferred income taxes | 7 | 476,317 | 492,078 | |||||||||
Other liabilities | 19 | 86,852 | 52,964 | |||||||||
|
|
|
| |||||||||
Total non-current liabilities | 4,406,739 | 5,290,711 | ||||||||||
|
|
|
| |||||||||
Total liabilities | 5,461,689 | 6,207,646 | ||||||||||
|
|
|
| |||||||||
Equity | ||||||||||||
Capital stock | 20 | 3,401 | 3,401 | |||||||||
Retained earnings | 836,684 | 826,515 | ||||||||||
Accumulated other comprehensive loss | 22 | (46,989 | ) | (9,109 | ) | |||||||
|
|
|
| |||||||||
Equity attributable to shareholder | 793,096 | 820,807 | ||||||||||
Non-controlling interests | 811 | 943 | ||||||||||
|
|
|
| |||||||||
Total equity | 793,907 | 821,750 | ||||||||||
Commitments and contingencies | 17, 23 | |||||||||||
Guarantees | 24 | |||||||||||
Subsequent events | 28 | |||||||||||
|
|
|
| |||||||||
Total liabilities and equity | $ | 6,255,596 | $ | 7,029,396 | ||||||||
|
|
|
| |||||||||
See accompanying notes to consolidated financial statements.
On March 19, 2015, the Board of Directors approved the consolidated financial statements for the years ended December 31, 2014, 2013 and 2012.
On behalf of the Board of Directors,
| /s/ Jean La Couture | /s/ A. Michel Lavigne | |
| Jean La Couture, Director | A. Michel Lavigne, Director |
F-9
Table of Contents
NOTES TO CONSOLIDATED FINANCIAL STATEMENTS
Years ended December 31, 2014, 2013 and 2012
(tabular amounts in thousands of Canadian dollars, except for option data)
Videotron Ltd. (the “Corporation”) is incorporated under the laws of Québec and is a wholly owned subsidiary of Quebecor Media Inc. (the parent corporation) and is a subsidiary of Quebecor Inc. (the ultimate parent corporation). The Corporation’s head office and registered office is located at 612, rue Saint-Jacques, Montréal (Québec), Canada. The percentages of voting rights and of equity in its major subsidiaries are as follows:
| % equity and voting | ||||
Videotron G.P. | 100.0 | % | ||
Videotron L.P. | 100.0 | % | ||
Videotron Infrastructures Inc. | 100.0 | % | ||
Videotron US Inc. | 100.0 | % | ||
SETTE Inc. | 84.53 | % | ||
The Corporation offers television distribution, Internet, business solutions, cable and mobile telephony services in Canada and is engaged in the rental of movies and televisual products through its video-on-demand services.
F-10
Table of Contents
VIDEOTRON LTD.
NOTES TO CONSOLIDATED FINANCIAL STATEMENTS (continued)
Years ended December 31, 2014, 2013 and 2012
(tabular amounts in thousands of Canadian dollars, except for option data)
| 1. | SUMMARY OF SIGNIFICANT ACCOUNTING POLICIES |
| (a) | Basis of presentation |
The consolidated financial statements have been prepared in accordance with IFRS as issued by the International Accounting Standards Board.
These consolidated financial statements have been prepared on a historical cost basis, except for certain financial instruments (note 1(j)), the liability related to stock-based compensation (note 1(s)), and the net defined benefit liability (note 1(t)), and are presented in Canadian dollars (“CAN dollars”), which is the currency of the primary economic environment in which the Corporation and its subsidiaries operate (“functional currency”).
Comparative figures for the years ended December 31, 2013 and 2012 have been restated to conform to the presentation adopted for the year ended December 31, 2014.
| (b) | Changes in accounting policies |
On January 1, 2014, the Corporation adopted retrospectively IFRIC 21 –Levies, which clarifies the timing of accounting for a liability in relation with outflow of resources that is imposed by governments in accordance with legislation, based on the activity that triggers the payment. The adoption of this interpretation did not have a material impact on the consolidated financial statements.
| (c) | Consolidation |
The consolidated financial statements include the accounts of the Corporation and its subsidiaries. Intercompany transactions and balances are eliminated on consolidation.
A subsidiary is an entity controlled by the Corporation. Control is achieved when the Corporation is exposed, or has rights, to variable returns from its involvement with the entity and has the ability to affect those returns through its power over the entity.
Non-controlling interests in the net assets and results of consolidated subsidiaries are identified separately from the parent’s ownership interest in them. Non-controlling interests in the equity of a subsidiary consist of the amount ofnon-controlling interests calculated at the date of the original business combination and their share of changes in equity since that date. Changes innon-controlling interests in a subsidiary that do not result in a loss of control by the Corporation are accounted for as equity transactions.
| (d) | Business combinations |
A business combination is accounted for by the acquisition method. The cost of an acquisition is measured at the fair value of the consideration given in exchange for control of the business acquired at the acquisition date. This consideration can be comprised of cash, assets transferred, financial instruments issued, or future contingent payments. The identifiable assets and liabilities of the business acquired are recognized at their fair value at the acquisition date. Results of operations of a business acquired are included in the Corporation’s consolidated financial statements from the date of the business acquisition. Business acquisition and integration costs are expensed as incurred.
Non-controlling interests in an entity acquired are presented in the consolidated balance sheet within equity, separately from the equity attributable to the shareholder and are initially measured at fair value.
| (e) | Foreign currency translation |
Foreign currency transactions are translated to the functional currency by applying the exchange rate prevailing at the date of the transactions. Translation gains and losses on assets and liabilities denominated in a foreign currency are included in financial expenses, or in gain or loss on valuation and translation of financial instruments, unless hedge accounting is used.
F-11
Table of Contents
VIDEOTRON LTD.
NOTES TO CONSOLIDATED FINANCIAL STATEMENTS (continued)
Years ended December 31, 2014, 2013 and 2012
(tabular amounts in thousands of Canadian dollars, except for option data)
| 1. | SUMMARY OF SIGNIFICANT ACCOUNTING POLICIES (continued) |
| (f) | Revenue recognition |
The Corporation recognizes operating revenues when the following criteria are met:
| • | the amount of revenue can be measured reliably; |
| • | the receipt of economic benefits associated with the transaction is probable; |
| • | the costs incurred or to be incurred in respect of the transaction can be measured reliably; |
| • | the stage of completion can be measured reliably where services have been rendered; and |
| • | significant risks and rewards of ownership, including effective control, have been transferred to the buyer where goods have been sold. |
The portion of revenue that is unearned is recorded under “Deferred revenue” when customers are invoiced.
Revenue recognition policies for each of the Corporation’s main product lines are as follows:
The cable and mobile services are provided under arrangements with multiple deliverables, for which there are two separate accounting units: one for subscriber services (cable television, Internet, cable telephony or mobile telephony, including connection costs and rental of equipment); the other for equipment sales to subscribers. Components of multiple deliverable arrangements are separately accounted for, provided the delivered elements havestand-alone value to the customer and the fair value of any undelivered elements can be objectively and reliably determined. Arrangement consideration is allocated among the separate accounting units based on their relative fair values.
Cable connection revenues are deferred and recognized as revenues over the estimated average period that subscribers are expected to remain connected to the network. The incremental and direct costs related to cable connection costs, in an amount not exceeding the revenue, are deferred and recognized as an operating expense over the same period. The excess of those costs over the related revenues is recognized immediately in income. Operating revenues from cable and other services, such as Internet access, cable and mobile telephony, are recognized when services are rendered. Promotional offers and rebates are accounted for as a reduction in the service revenue to which they relate. Revenues from equipment sales to subscribers and their costs are recognized in income when the equipment is delivered. Promotional offers related to equipment, with the exclusion of mobile devices, are accounted for as a reduction of related equipment sales on delivery, while promotional offers related to the sale of mobile devices are accounted for as a reduction of related equipment sales on activation. Operating revenues related to service contracts are recognized in income over the life of the specific contracts on astraight-line basis over the period in which the services are provided.
| (g) | Impairment of assets |
For the purposes of assessing impairment, assets are grouped in cash-generating units (“CGUs”), which represent the lowest levels for which there are separately identifiable cash inflows generated by those assets. The Corporation reviews at each balance sheet date whether events or circumstances have occurred to indicate that the carrying amounts of itslong-lived assets with finite useful lives may be less than their recoverable amounts. Goodwill, other intangible assets having an indefinite useful life, and intangible assets not yet available for use are tested for impairment each financial year, as well as whenever there is an indication that the carrying amount of the asset, or the CGU to which an asset has been allocated, exceeds its recoverable amount. The recoverable amount is the higher of the fair value less costs to sell and the value in use of the asset or the CGU. Fair value less costs to sell represents the amount an entity could obtain at the valuation date from the asset’s disposal in an arm’s length transaction between knowledgeable, willing parties, after deducting the costs of disposal. The value in use represents the present value of the future cash flows expected to be derived from the asset or the CGU.
F-12
Table of Contents
VIDEOTRON LTD.
NOTES TO CONSOLIDATED FINANCIAL STATEMENTS (continued)
Years ended December 31, 2014, 2013 and 2012
(tabular amounts in thousands of Canadian dollars, except for option data)
| 1. | SUMMARY OF SIGNIFICANT ACCOUNTING POLICIES (continued) |
| (g) | Impairment of assets (continued) |
An impairment loss is recognized in the amount by which the carrying amount of an asset or a CGU exceeds its recoverable amount. When the recoverable amount of a CGU to which goodwill has been allocated is lower than the CGU’s carrying amount, the related goodwill is first impaired. Any excess amount of impairment is recognized and attributed to assets in the CGU, prorated to the carrying amount of each asset in the CGU.
An impairment loss recognized in prior periods for long-lived assets with finite useful lives and intangible assets having an indefinite useful life, other than goodwill, can be reversed through the consolidated statement of income to the extent that the resulting carrying value does not exceed the carrying value that would have been the result if no impairment losses had been previously recognized.
| (h) | Income taxes |
Current income taxes are recognized with respect to amounts expected to be paid or recovered under the tax rates and laws that have been enacted or substantively enacted at the balance sheet date.
Deferred income taxes are accounted for using the liability method. Under this method, deferred income tax assets and liabilities are recognized for the estimated future tax consequences attributable to differences between the carrying amounts of existing assets and liabilities in the consolidated financial statements and their respective tax bases. Deferred income tax assets and liabilities are measured using enacted or substantively enacted tax rates in effect for the year in which those temporary differences are expected to be recovered or settled. The effect of a change in tax rates on deferred income tax assets and liabilities is recognized in income in the period that includes the substantive enactment date. A deferred tax asset is recognized initially when it is probable that future taxable income will be sufficient to use the related tax benefits and may be subsequently reduced, if necessary, to an amount that is more likely than not to be realized. A deferred tax expense or benefit is recognized in other comprehensive income or otherwise directly in equity to the extent that it relates to items that are recognized in other comprehensive income or directly in equity in the same or a different period.
In the course of the Corporation’s operations, there are a number of uncertain tax positions due to the complexity of certain transactions and due to the fact that related tax interpretations and legislation are continually changing. When a tax position is uncertain, the Corporation recognizes an income tax benefit or reduces an income tax liability only when it is probable that the tax benefit will be realized in the future or that the income tax liability is no longer probable.
| (i) | Leases |
Assets under leasing agreements are classified at the inception of the lease as (i) finance leases whenever the terms of the lease transfer substantially all the risks and rewards of ownership of the asset to the lessee, or as (ii) operating leases for all other leases.
Operating lease rentals are recognized in the consolidated statement of income on astraight-line basis over the period of the lease. Any lessee incentives are deferred and then recognized evenly over the lease term.
F-13
Table of Contents
VIDEOTRON LTD.
NOTES TO CONSOLIDATED FINANCIAL STATEMENTS (continued)
Years ended December 31, 2014, 2013 and 2012
(tabular amounts in thousands of Canadian dollars, except for option data)
| 1. | SUMMARY OF SIGNIFICANT ACCOUNTING POLICIES (continued) |
| (j) | Financial instruments |
Classification, recognition and measurement
Financial instruments are classified as held for trading, available-for-sale, held-to-maturity, loans and receivables, or as other financial liabilities, and measurement in subsequent periods depends on their classification. The Corporation has classified its financial instruments (except derivative financial instruments) as follows:
Held for trading | Loans and receivables | Available-for-sale | Other liabilities | |||
• Cash and cash equivalents | • Accounts receivable
• Amounts receivable from affiliated corporations
• Investments | • Other portfolio investments included in “Other assets” | • Accounts payable and accrued charges
• Amounts payable to affiliated corporations
• Provisions
• Long-term debt
• Subordinated loan from parent corporation
• Other long-term financial liabilities included in “Other liabilities” | |||
Financial instruments held for trading are measured at fair value with changes recognized in income as a gain or loss on valuation and translation of financial instruments. Available-for-sale portfolio investments are measured at fair value or at cost in the case of equity investments that do not have a quoted market price in an active market and where fair value is insufficiently reliable, and changes in fair value are recorded in other comprehensive income. Financial assets classified as loans and receivables and financial liabilities classified as other liabilities are initially measured at fair value and subsequently measured at amortized cost, using the effective interest rate method of amortization.
Derivative financial instruments and hedge accounting
The Corporation uses various derivative financial instruments to manage its exposure to fluctuations in foreign currency exchange rates and interest rates. The Corporation does not hold or use any derivative financial instruments for speculative purposes. Under hedge accounting, the Corporation documents all hedging relationships between hedging items and hedged items, as well as its strategy for using hedges and its risk management objective. It also designates its derivative financial instruments as either fair value hedges or cash flow hedges when they qualify for hedge accounting. The Corporation assesses the effectiveness of derivative financial instruments when the hedge is put in place and on an ongoing basis.
F-14
Table of Contents
VIDEOTRON LTD.
NOTES TO CONSOLIDATED FINANCIAL STATEMENTS (continued)
Years ended December 31, 2014, 2013 and 2012
(tabular amounts in thousands of Canadian dollars, except for option data)
| 1. | SUMMARY OF SIGNIFICANT ACCOUNTING POLICIES (continued) |
| (j) | Financial instruments (continued) |
The Corporation generally enters into the following types of derivative financial instruments:
| • | The Corporation uses foreign exchange forward contracts to hedge foreign currency rate exposure on anticipated equipment or inventory purchases in a foreign currency. The Corporation also uses offsetting foreign exchange forward contracts in combination with cross-currency interest rate swaps to hedge foreign currency rate exposure on interest and principal payments on foreign currency denominated debt. These foreign exchange forward contracts are designated as cash flow hedges. |
| • | The Corporation uses cross-currency interest rate swaps to hedge (i) foreign currency rate exposure on interest and principal payments on foreign currency denominated debt and/or (ii) fair value exposure on certain debt resulting from changes in interest rates. Thecross-currency interest rate swaps that set all future interest and principal payments on U.S.-dollar-denominated debt in fixed CAN dollars, in addition to converting an interest rate from a floating rate to a floating rate or from a fixed rate to a fixed rate, are designated as cash flow hedges. The cross-currency interest rate swaps are designated as fair value hedges when they set all future interest and principal payments on U.S.-dollar-denominated debt in fixed CAN dollars, in addition to converting the interest rate from a fixed rate to a floating rate. |
Under hedge accounting, the Corporation applies the following accounting policies:
| • | For derivative financial instruments designated as fair value hedges, changes in the fair value of the hedging derivative recorded in income are substantially offset by changes in the fair value of the hedged item to the extent that the hedging relationship is effective. When a fair value hedge is discontinued, the carrying value of the hedged item is no longer adjusted and the cumulative fair value adjustments to the carrying value of the hedged item are amortized to income over the remaining term of the original hedging relationship. |
| • | For derivative financial instruments designated as cash flow hedges, the effective portion of a hedge is reported in other comprehensive income until it is recognized in income during the same period in which the hedged item affects income, while the ineffective portion is immediately recognized in income. When a cash flow hedge is discontinued, the amounts previously recognized in accumulated other comprehensive income are reclassified to income when the variability in the cash flows of the hedged item affects income. |
Any change in the fair value of these derivative financial instruments recorded in income is included in gain or loss on valuation and translation of financial instruments. Interest expense on hedgedlong-term debt is reported at the hedged interest and foreign currency rates.
Derivative financial instruments that do not qualify for hedge accounting, including derivatives that are embedded in financial ornon-financial contracts that are not closely related to the host contracts, such as early settlement options on long-term debt, are reported on a fair value basis in the consolidated balance sheets. Any change in the fair value of these derivative financial instruments is recorded in income as a gain or loss on valuation and translation of financial instruments.
Early settlement options are accounted for separately from the debt when the corresponding option exercise price is not approximately equal to the amortized cost of the debt.
| (k) | Financing fees |
Financing fees related to long-term debt are capitalized in reduction of long-term debt and amortized using the effective interest rate method.
F-15
Table of Contents
VIDEOTRON LTD.
NOTES TO CONSOLIDATED FINANCIAL STATEMENTS (continued)
Years ended December 31, 2014, 2013 and 2012
(tabular amounts in thousands of Canadian dollars, except for option data)
| 1. | SUMMARY OF SIGNIFICANT ACCOUNTING POLICIES (continued) |
| (l) | Tax credits and government assistance |
The Corporation receives tax credits mainly related to its research and development activities. Government financial assistance is accounted for as revenue or as a reduction in related costs, whether capitalized and amortized or expensed, in the year the costs are incurred and when management has reasonable assurance that the conditions of the government programs are met.
| (m) | Cash and cash equivalents |
Cash and cash equivalents include highly liquid investments purchased three months or less from maturity and are recorded at fair value. These highly liquid investments consisted mainly of Bankers’ acceptances and term deposits.
| (n) | Accounts receivable |
Accounts receivable are stated at their nominal value, less an allowance for doubtful accounts. The Corporation establishes an allowance for doubtful accounts based on the specific credit risk of its customers and historical trends. Individual accounts receivable are written off when management deems them not collectible.
| (o) | Inventories |
Inventories are valued at the lower of cost, determined by theweighted-average cost method, and net realizable value. Net realizable value represents the estimated selling price in the ordinary course of business, less the estimated costs of completion and the estimated costs necessary to make the sale. When the circumstances that previously caused inventories to be written down below cost no longer exist, the amount of thewrite-down is reversed.
| (p) | Fixed assets |
Fixed assets are stated at cost. Cost represents the acquisition costs, net of government grants and investment tax credits, or construction costs, including preparation, installation and testing costs. In the case of projects to construct cable and mobile networks, the cost includes equipment, direct labour and related overhead costs. Projects under development may also be comprised of advance payments made to suppliers for equipment under construction.
Borrowing costs are also included in the cost of fixed assets when the development of the asset commenced after January 1, 2010. Expenditures such as maintenance and repairs are expensed as incurred.
Depreciation is calculated on a straight-line basis over the following estimated useful lives:
Assets | Estimated useful life | |||
Buildings and their components | 25 to 40 years | |||
Furniture and equipment | 3 to 7 years | |||
Receiving, distribution and telecommunication networks | 3 to 20 years | |||
Customer equipment | 3 to 7 years | |||
Depreciation methods, residual values, and the useful lives of significant fixed assets are reviewed at each financial year-end. Any change is accounted for prospectively as a change in accounting estimate.
Leasehold improvements are depreciated over the shorter of the term of the lease and economic life.
F-16
Table of Contents
VIDEOTRON LTD.
NOTES TO CONSOLIDATED FINANCIAL STATEMENTS (continued)
Years ended December 31, 2014, 2013 and 2012
(tabular amounts in thousands of Canadian dollars, except for option data)
| 1. | SUMMARY OF SIGNIFICANT ACCOUNTING POLICIES (continued) |
| (p) | Fixed assets (continued) |
The Corporation does not record any decommissioning obligations in connection with its cable distribution networks. The Corporation expects to renew all of its agreements with utility companies to access their support structures in the future, making the retirement date so far into the future that the present value of the restoration costs is insignificant for these assets. A decommissioning obligation is however recorded for the rental of sites related to the advanced mobile network.
The Corporation is engaged in an agreement to operate a shared Long-Term Evolution mobile network in the Province of Québec and in the Ottawa region.
| (q) | Goodwill and intangible assets |
Goodwill
For all business acquisitions entered into since January 1, 2010, goodwill initially arising from a business acquisition is measured and recognized as the excess of the fair value of the consideration paid over the fair value of the recognized identifiable assets acquired and liabilities assumed. When the Corporation acquires less than 100% of the equity interests in the business acquired at the acquisition date, goodwill attributable to the non-controlling interests is also recognized at fair value.
For business acquisitions that occurred prior to January 1, 2010, goodwill represented the excess of the cost of acquisition over the Corporation’s interest in the fair value of the identifiable assets and liabilities of the business acquired at the date of acquisition. No goodwill attributable to non-controlling interests was recognized for these business acquisitions.
Goodwill is allocated as at the date of a business acquisition to a CGU for purposes of impairment testing (note 1(g)). The allocation is made to the CGU or group of CGUs expected to benefit from the synergies of the business acquisition.
Intangible assets
Internally generated intangible assets are mainly comprised of internal costs in connection with the development of software to be used internally or for providing services to customers. These costs are capitalized when the development stage of the software application begins and costs incurred prior to that stage are recognized as expenses.
Borrowing costs directly attributable to the acquisition, development or production of an intangible asset that commenced after January 1, 2010 are also included as part of the cost of that asset during the development phase.
Intangible assets with finite useful lives are amortized over their useful lives using thestraight-line method over the following periods:
Assets | Estimated useful life | |||
Spectrum licences | 10 years | |||
Software and other intangible assets | 3 to 7 years | |||
Amortization methods, residual values, and the useful lives of significant intangible assets are reviewed at each financial year-end. Any change is accounted for prospectively as a change in accounting estimate.
F-17
Table of Contents
VIDEOTRON LTD.
NOTES TO CONSOLIDATED FINANCIAL STATEMENTS (continued)
Years ended December 31, 2014, 2013 and 2012
(tabular amounts in thousands of Canadian dollars, except for option data)
| 1. | SUMMARY OF SIGNIFICANT ACCOUNTING POLICIES (continued) |
| (r) | Provisions |
Provisions are recognized when (i) the Corporation has a present legal or constructive obligation as a result of a past event and it is probable that an outflow of economic benefits will be required to settle the obligation, and when (ii) the amount of the obligation can be reliably estimated.
Provisions are reviewed at each balance sheet date and changes in estimates are reflected in the consolidated statement of income in the reporting period in which changes occur.
| (s) | Stock-based compensation |
Stock-based awards to employees that call for settlement in cash or other assets at the option of the employee are accounted for at fair value and classified as a liability. The compensation cost is recognized in expenses over the vesting period. Changes in the fair value of stock-based awards between the grant date and the measurement date result in a change in the liability and compensation cost.
Estimates of the fair value of stock option awards are determined by applying an option pricing model, taking into account the terms and conditions of the grant. Key assumptions are described in note 21.
| (t) | Pension plans and postretirement benefits |
The Corporation offers defined contribution pension plans and defined benefit pension plans to some of its employees.
| (i) | Defined contribution pension plans |
Under its defined contribution pension plans, the Corporation pays fixed contributions to participating employees’ pension plans and has no legal or constructive obligation to pay any further amounts. Obligations for contributions to defined contribution pension plans are recognized as employee benefits in the consolidated statements of income when the contributions become due.
| (ii) | Defined benefit pension plans and postretirement plans |
Defined benefit pension plan costs are determined using actuarial methods and are accounted for using the projected unit credit method, which incorporates management’s best estimates of future salary levels, other cost escalations, retirement ages of employees, and other actuarial factors. Defined benefit pension costs recognized in the consolidated statements of income as employee costs, mainly include the following:
| • | service costs provided in exchange for employee services rendered during the period; |
| • | prior service costs recognized at the earlier of (a) when the employee benefit plan is amended or (b) when restructuring costs are recognized; |
| • | curtailment or settlement gain or loss. |
Interest on net defined benefit liability or asset recognized in the consolidated statements of income, as financial expenses, is determined by multiplying the net defined benefit liability or asset by the discount rate used to determine the defined benefit obligation.
F-18
Table of Contents
VIDEOTRON LTD.
NOTES TO CONSOLIDATED FINANCIAL STATEMENTS (continued)
Years ended December 31, 2014, 2013 and 2012
(tabular amounts in thousands of Canadian dollars, except for option data)
| 1. | SUMMARY OF SIGNIFICANT ACCOUNTING POLICIES (continued) |
| (t) | Pension plans and postretirement benefits (continued) |
| (ii) | Defined benefit pension plans and postretirement plans (continued) |
Re-measurements of the net defined benefit liability or asset are recognized immediately in other comprehensive income and in accumulated other comprehensive income. Re-measurements are comprised of the following:
| • | actuarial gains and losses arising from changes in financial and demographic actuarial assumptions used to determine the defined benefit obligation or from experience adjustments on liabilities; |
| • | the difference between actual return on plan assets and interest income on plan assets anticipated as part of the interest on net defined benefit liability or asset calculation; |
| • | changes in the net benefit asset limit or in the minimum funding liability. |
Recognition of a net benefit asset is limited under certain circumstances to the amount recoverable, which is primarily based on the present value of future contributions to the plan, to the extent to which the Corporation can unilaterally reduce those future contributions. In addition, an adjustment to the net benefit asset or the net benefit liability can be recorded to reflect a minimum funding liability in a certain number of the Corporation’s pension plans.
The Corporation also offers rebates on telecommunication services and health and life insurance plans to some of its retired employees. The cost of postretirement benefits is determined using an accounting methodology similar to that for defined benefit pension plans. The benefits related to these plans are funded by the Corporation as they become due.
| (u) | Use of estimates and judgments |
The preparation of consolidated financial statements in accordance with IFRS requires management to make estimates, assumptions and judgments that affect the reported amounts of assets and liabilities, related amounts of revenues and expenses, and disclosure of contingent assets and liabilities. Although these estimates are based on management’s best judgment and information available at the time of the assessment date, actual results could differ from these estimates.
The following significant areas represent management’s most difficult, subjective or complex estimates:
| (i) | Recoverable amount of an asset or a CGU |
When an impairment test is performed on an asset or a CGU, management estimates the recoverable amount of the asset or CGU based on its fair value less costs to sell or its value in use. These estimates are based on valuation models requiring the use of a number of assumptions such as pre-tax discount rate (WACC) and perpetual growth rate. These assumptions have a significant impact on the results of impairment tests and on the impairment charge, as the case may be, recorded in the consolidated statement of income. A description of key assumptions used in the goodwill impairment tests and a sensitivity analysis of recoverable amounts are presented in note 14.
| (ii) | Fair value of derivative financial instruments, including embedded derivatives |
Derivative financial instrument must be accounted for at their fair value, which is estimated using valuation models based on a number of assumptions such as future cash flows, period-end swap rates, foreign exchange rates, and credit default premium. Also, the fair value of embedded derivatives related to early settlement options on debt is determined with option pricing models using market inputs, including volatility, discount factors and underlying instruments adjusted implicit interest rate and credit premium. The assumptions used in the valuation models have a significant impact on the gain or loss on valuation and translation of financial instruments recorded in the consolidated statement of income, the gain or loss on valuation of financial instruments recorded in the consolidated statement of comprehensive income, and the carrying value of derivative financial instruments in the consolidated balance sheet. A description of valuation models used and sensitivity analysis on key assumptions are presented in note 25.
F-19
Table of Contents
VIDEOTRON LTD.
NOTES TO CONSOLIDATED FINANCIAL STATEMENTS (continued)
Years ended December 31, 2014, 2013 and 2012
(tabular amounts in thousands of Canadian dollars, except for option data)
| 1. | SUMMARY OF SIGNIFICANT ACCOUNTING POLICIES (continued) |
| (u) | Use of estimates and judgments (continued) |
| (iii) | Costs and obligations related to pension and postretirement benefit plans |
Estimates of costs and obligations related to pension and postretirement benefit obligations are based on a number of assumptions, such as the discount rate, the rate of increase in compensation, the retirement age of employees, health care costs, and other actuarial factors. Certain of these assumptions may have a significant impact on employee costs and financial expenses recorded in the consolidated statements of income, the re-measurement gain or loss on defined benefit plans recorded in the consolidated statements of comprehensive income, and on the carrying value of other assets or other liabilities in the consolidated balance sheets. Key assumptions and sensitivity analysis on the discount rate are presented in note 27.
| (iv) | Provisions |
The recognition of provisions requires management to estimate expenditures required to settle a present obligation or to transfer it to third parties at the date of assessment. An assessment of the probable outcomes of legal proceedings or other contingency is also required. A description of the main provisions, including management expectations on the potential effect on the consolidated financial statements of the possible outcomes of legal disputes, is presented in note 17.
The following areas represent management’s most significant judgments, apart from those involving estimates:
| (i) | Determination of useful life periods for the depreciation and amortization of assets with finite useful lives |
For each class of assets with finite useful lives, management has to determine over which period the Corporation will consume the assets’ future economic benefits. The determination of a useful life period involves judgment and has an impact on the depreciation and amortization charge recorded in the consolidated statements of income.
| (ii) | Determination of CGUs for the purpose of impairment test |
The determination of CGUs requires judgment when determining the lowest level for which there are separately identifiable cash inflows generated by the group of assets. In identifying assets to group in CGUs, the Corporation considers, among other factors, offering bundled services, sharing telecommunication networks infrastructure, similarity on exposure to market risk, and materiality. The determination of CGUs could affect the results of impairment tests and, as the case may be, the impairment charge recorded in the consolidated statements of income.
| (iii) | Determination if early settlement options are not closely related to their debt contract |
Early settlement options are not considered closely related to their debt contract when the corresponding option exercise price is not approximately equal to the amortized cost of the debt. Judgment is required to determine if an option exercise price is not approximately equal to the amortized cost of the debt. This determination may have a significant impact on the amount of gains or losses on valuation and translation of financial instruments recorded in the consolidated statements of income.
| (iv) | Interpretation of laws and regulations |
Interpretation of laws and regulation, including tax regulations, requires judgment from management that could have an impact on the recognition of provisions for legal litigation and income taxes in the consolidated financial statements.
F-20
Table of Contents
VIDEOTRON LTD.
NOTES TO CONSOLIDATED FINANCIAL STATEMENTS (continued)
Years ended December 31, 2014, 2013 and 2012
(tabular amounts in thousands of Canadian dollars, except for option data)
| 1. | SUMMARY OF SIGNIFICANT ACCOUNTING POLICIES (continued) |
| (v) | Recent accounting pronouncements |
The Corporation has not yet completed its assessment of the impact of the adoption of these pronouncements on its consolidated financial statements.
| (i) | IFRS 9 – Financial Instrumentsis required to be applied retrospectively for annual periods beginning on or after January 1, 2018, with early adoption permitted. |
IFRS 9 simplifies the measurement and classification of financial assets by reducing the number of measurement categories in IAS 39, Financial Instruments: Recognition and Measurement. The new standard also provides for a fair value option in the designation of anon-derivative financial liability and its related classification and measurement, as well as for a new hedge accounting model more closely aligned with risk management activities undertaken by entities.
| (ii) | IFRS 15 – Revenue from Contracts with Customersis required to be applied retrospectively for annual periods beginning on or after January 1, 2017, with early adoption permitted. |
IFRS 15 specifies how and when an entity will recognize revenue as well as requiring such entities to provide users of financial statements with more informative disclosures. The standard provides a single, principles based five-step model to be applied to all contracts with customers.
F-21
Table of Contents
VIDEOTRON LTD.
NOTES TO CONSOLIDATED FINANCIAL STATEMENTS (continued)
Years ended December 31, 2014, 2013 and 2012
(tabular amounts in thousands of Canadian dollars, except for option data)
| 2. | EMPLOYEE COSTS AND PURCHASE OF GOODS AND SERVICES |
The main components are as follows:
| 2014 | 2013 | 2012 | ||||||||||
Employee costs | $ | 495,906 | $ | 488,901 | $ | 479,579 | ||||||
Less: employee costs capitalized to fixed assets and intangible assets | (153,507 | ) | (141,804 | ) | (140,988 | ) | ||||||
|
|
|
|
|
| |||||||
| 342,399 | 347,097 | 338,591 | ||||||||||
Purchase of goods and services | ||||||||||||
Royalties and rights | 413,922 | 426,455 | 425,103 | |||||||||
Cost of retail products | 193,421 | 144,891 | 134,639 | |||||||||
Subcontracting costs | 115,778 | 126,774 | 134,056 | |||||||||
Marketing and distribution expenses | 61,097 | 57,101 | 68,321 | |||||||||
Other | 351,837 | 324,698 | 293,430 | |||||||||
|
|
|
|
|
| |||||||
| 1,136,055 | 1,079,919 | 1,055,549 | ||||||||||
|
|
|
|
|
| |||||||
| $ | 1,478,454 | $ | 1,427,016 | $ | 1,394,140 | |||||||
|
|
|
|
|
| |||||||
| 3. | FINANCIAL EXPENSES |
| 2014 | 2013 | 2012 | ||||||||||
Third parties : | ||||||||||||
Interest on long-term debt | $ | 169,274 | $ | 171,803 | $ | 175,433 | ||||||
Amortization of financing costs and long-term debt premium or discount | 4,650 | 5,263 | 5,572 | |||||||||
Loss on foreign currency translation on short-term monetary items | 3,568 | 2,333 | 2,683 | |||||||||
Other | (3,751 | ) | (2,755 | ) | (2,297 | ) | ||||||
|
|
|
|
|
| |||||||
| 173,741 | 176,644 | 181,391 | ||||||||||
Affiliated corporations : | ||||||||||||
Interest expense (net of interest income) | 218,587 | 254,580 | 188,146 | |||||||||
Dividend income (net of dividend expense) | (224,194 | ) | (260,909 | ) | (193,518 | ) | ||||||
|
|
|
|
|
| |||||||
| (5,607 | ) | (6,329 | ) | (5,372 | ) | |||||||
Interest on net defined benefit liability | 1,043 | 3,830 | 3,479 | |||||||||
|
|
|
|
|
| |||||||
| $ | 169,177 | $ | 174,145 | $ | 179,498 | |||||||
|
|
|
|
|
| |||||||
F-22
Table of Contents
VIDEOTRON LTD.
NOTES TO CONSOLIDATED FINANCIAL STATEMENTS (continued)
Years ended December 31, 2014, 2013 and 2012
(tabular amounts in thousands of Canadian dollars, except for option data)
| 4. | LOSS (GAIN) ON VALUATION AND TRANSLATION OF FINANCIAL INSTRUMENTS |
| 2014 | 2013 | 2012 | ||||||||||
Loss (gain) on embedded derivatives related to long-term debt | $ | 4,913 | $ | 97,423 | $ | (80,674 | ) | |||||
(Gain) loss on reversal of embedded derivatives upon debt redemption (note 5) | (611 | ) | 67,002 | 6,316 | ||||||||
Loss (gain) on derivative financial instruments for which hedge accounting is not used | 3,078 | 448 | (1,380 | ) | ||||||||
Gain on the ineffective portion of cash flow hedges | (737 | ) | (1,148 | ) | — | |||||||
Gain on the ineffective portion of fair value hedges | (3,213 | ) | — | — | ||||||||
|
|
|
|
|
| |||||||
| $ | 3,430 | $ | 163,725 | $ | (75,738 | ) | ||||||
|
|
|
|
|
| |||||||
| 5. | LOSS (GAIN) ON DEBT REFINANCING |
2014
In April 2014, the Corporation redeemed US$260.0 million in aggregate principal amount of its issued and outstanding 9.125% Senior Notes due April 2018 for a total cash consideration of $295.4 million. This transaction resulted in a total loss of $21.4 million (before income taxes), including a loss of $1.6 million previously recorded in other comprehensive income.
2013
In 2013, the Corporation redeemed US$380.0 million in aggregate principal amount of its issued and outstanding 9.125% Senior Notes due April 2018 and settled its related hedging contracts for a total cash consideration of $399.6 million. This transaction resulted in a total loss of $18.9 million (before income taxes), including a gain of $6.5 million previously recorded in other comprehensive income.
2012
In March 2012, the Corporation redeemed all of its 6.875% Senior Notes due January 2014 in an aggregate principal amount of US$395.0 million for a total cash consideration of $394.1 million. This transaction resulted in a total gain of $7.6 million (before income taxes), including a loss of $4.1 million previously recorded in other comprehensive income.
| 6. | RESTRUCTURING OF OPERATIONS, IMPAIRMENT OF ASSETS AND OTHER SPECIAL ITEMS |
| 2014 | 2013 | 2012 | ||||||||||
Restructuring of operations | $ | 1,725 | $ | 1,917 | $ | 407 | ||||||
Loss related to a legal action1 | 34,323 | — | — | |||||||||
Impairment of assets | 3,397 | — | — | |||||||||
Other | — | (1,233 | ) | 71 | ||||||||
|
|
|
|
|
| |||||||
| $ | 39,445 | $ | 684 | $ | 478 | |||||||
|
|
|
|
|
| |||||||
| 1 | In 2014, the Corporation recorded a charge of $34.3 million, including interest, as a result of an unfavourable judgment against it in a legal action. The Corporation intends to appeal this judgment. |
F-23
Table of Contents
VIDEOTRON LTD.
NOTES TO CONSOLIDATED FINANCIAL STATEMENTS (continued)
Years ended December 31, 2014, 2013 and 2012
(tabular amounts in thousands of Canadian dollars, except for option data)
| 7. | INCOME TAXES |
The following table reconciles income taxes at the Corporation’s domestic statutory tax rate of 26.9% in 2014, 2013 and 2012, and income taxes in the consolidated statements of income:
| 2014 | 2013 | 2012 | ||||||||||
Income taxes at domestic statutory tax rate | $ | 138,125 | $ | 98,346 | $ | 167,234 | ||||||
(Reduction) increase resulting from: | ||||||||||||
Effect of non-deductible charges, non-taxable income and differences between current and future tax rates | 9,932 | (1,856 | ) | (2,522 | ) | |||||||
Change in benefit arising from the recognition of current and prior year tax losses | 1,661 | — | — | |||||||||
Effect of tax consolidation transactions with the parent corporation and affiliated corporations | (60,308 | ) | (70,185 | ) | (52,057 | ) | ||||||
Other | 3,873 | 3,144 | 3,200 | |||||||||
|
|
|
|
|
| |||||||
Income taxes | $ | 93,283 | $ | 29,449 | $ | 115,855 | ||||||
|
|
|
|
|
| |||||||
The significant items comprising the Corporation’s net deferred income tax liability and their impact on the deferred income tax expense are as follows:
| Consolidated balance sheets | Consolidated income statements | |||||||||||||||||||
| 2014 | 2013 | 2014 | 2013 | 2012 | ||||||||||||||||
Loss carryforwards | $ | — | $ | — | $ | — | $ | — | $ | (41,495 | ) | |||||||||
Accounts payable, accrued charges and provisions | 4,948 | 3,816 | 1,132 | (102 | ) | (583 | ) | |||||||||||||
Defined benefit plans | 13,507 | 2,085 | (1,468 | ) | (544 | ) | 576 | |||||||||||||
Fixed assets | (382,433 | ) | (369,348 | ) | (13,085 | ) | (20,133 | ) | (30,412 | ) | ||||||||||
Goodwill and intangible assets | (50,891 | ) | (55,566 | ) | 4,675 | 5,936 | (5,746 | ) | ||||||||||||
Benefits from a general partnership | (56,510 | ) | (87,370 | ) | 30,860 | 14,461 | 6,815 | |||||||||||||
Long-term debt and derivative financial instruments | 2,269 | 22,988 | (9,034 | ) | 48,674 | (3,901 | ) | |||||||||||||
Other | (7,207 | ) | (8,683 | ) | 1,476 | 2,051 | 238 | |||||||||||||
|
|
|
|
|
|
|
|
|
| |||||||||||
| $ | (476,317 | ) | $ | (492,078 | ) | $ | 14,556 | $ | 50,343 | $ | (74,508 | ) | ||||||||
|
|
|
|
|
|
|
|
|
| |||||||||||
F-24
Table of Contents
VIDEOTRON LTD.
NOTES TO CONSOLIDATED FINANCIAL STATEMENTS (continued)
Years ended December 31, 2014, 2013 and 2012
(tabular amounts in thousands of Canadian dollars, except for option data)
| 7. | INCOME TAXES (continued) |
Changes in the net deferred income tax liability are as follows:
| 2014 | 2013 | |||||||
Balance as of beginning of the year | $ | (492,078 | ) | $ | (523,165 | ) | ||
Recognized in income as continuing operations | 14,556 | 50,343 | ||||||
Recognized in other comprehensive income | 1,205 | (15,347 | ) | |||||
Discontinued operations and other | — | (3,909 | ) | |||||
|
|
|
| |||||
Balance as of the end of the year | $ | (476,317 | ) | $ | (492,078 | ) | ||
|
|
|
| |||||
The Corporation has not recognized a deferred income tax liability for the undistributed earnings of its foreign subsidiary in the current or prior years since the Corporation does not expect to sell or repatriate funds from those investments, in which case the undistributed earnings might become taxable.
There are no income tax consequences attached to the payment of dividends in 2014, 2013 or 2012 by the Corporation to its shareholder.
| 8. | DISCONTINUED OPERATIONS |
On May 31, 2013, the Corporation sold its specialized Web sitesJobboom andRéseau Contact to its parent corporation, for a total consideration of $65.0 million. This transaction resulted in a gain on sale of $38.0 million. The results and cash flows related to these businesses, as well as the gain of $38.0 million on the sale ofJobboom andRéseau Contact, were reclassified as discontinued operations in the consolidated statements of income and cash flows, as this transaction occurred in connection with the sale ofJobboom andRéseau Contact by the parent corporation to an external party in 2013.
| 9. | CORPORATE REORGANIZATION |
On December 29, 2013, the Corporation sold all the operating assets and liabilities of Le Superclub Videotron to a wholly owned subsidiary of its parent corporation for a total consideration of $11.1 million. Since as a result of this transaction, no substantive changes have occurred in the parent corporation reporting group and in accordance with the reporting group accounting policy, all figures related to Le Superclub Videotron have been restated as if Le Superclub Videotron had never been a subsidiary of the Corporation.
The total consideration received in 2013, as well as dividends received in 2013 and in prior years were presented directly in retained earnings.
F-25
Table of Contents
VIDEOTRON LTD.
NOTES TO CONSOLIDATED FINANCIAL STATEMENTS (continued)
Years ended December 31, 2014, 2013 and 2012
(tabular amounts in thousands of Canadian dollars, except for option data)
| 10. | INVENTORIES |
| 2014 | 2013 | |||||||
Customer equipment | $ | 62,709 | $ | 78,831 | ||||
Network materials | 16,357 | 15,429 | ||||||
|
|
|
| |||||
| $ | 79,066 | $ | 94,260 | |||||
|
|
|
| |||||
Cost of inventories included in purchase of goods and services amounted to $165.6 million in 2014 ($120.7 million in 2013 and $110.6 million in 2012).Write-downs of inventories totalling $1.4 million were recognized in purchase of goods and services in 2014 ($0.5 million in 2013 and $2.7 million in 2012).
| 11. | SUBORDINATED LOAN FROM PARENT CORPORATION |
| 2014 | 2013 | |||||||
Subordinated loan – Quebecor Media Inc. | $ | 1,080,000 | $ | 2,280,000 | ||||
On September 20, 2013, the Corporation contracted a subordinated loan of $3.25 billion from Quebecor Media Inc., bearing interest at a rate of 10.75%, payable every six months on June 20 and December 20, and maturing on September 20, 2043. On the same day, the Corporation invested the total proceeds of $3.25 billion into 3,250,000 preferred shares, Series B, of9101-0835 Québec Inc., a subsidiary of Quebecor Media Inc. These shares carry the right to receive an annual dividend of 10.85%, payable semi-annually.
On December 27, 2013, 9101-0835 Québec Inc., a subsidiary of Quebecor Media Inc., redeemed 2,600,000 preferred shares, Series B, for a total cash consideration of $2.6 billion, and settled cumulative unpaid dividends of $5.4 million. On the same day, the Corporation used the total proceeds of $2.6 billion to repay part of its subordinated loan contracted from Quebecor Media Inc.
On October 28, 2014, 9101-0835 Québec Inc., a subsidiary of Quebecor Media Inc., redeemed 1,200,000 preferred shares, Series B, for a total cash consideration of $1.2 billion, and settled cumulative unpaid dividends of $46.4 million. On the same day, the Corporation used the total proceeds of $1.2 billion to repay part of its subordinated loan contracted from Quebecor Media Inc.
The above transactions were carried out for tax consolidation purposes of Quebecor Media Inc. and its subsidiaries.
F-26
Table of Contents
VIDEOTRON LTD.
NOTES TO CONSOLIDATED FINANCIAL STATEMENTS (continued)
Years ended December 31, 2014, 2013 and 2012
(tabular amounts in thousands of Canadian dollars, except for option data)
| 12. | FIXED ASSETS |
For the years ended December 31, 2014 and 2013, changes in the net carrying amount of fixed assets are as follows:
| Land and buildings | Furniture and equipment | Receiving and distribution networks | Customer equipment | Projects under development | Total | |||||||||||||||||||
Cost: | ||||||||||||||||||||||||
Balance as of December 31, 2012 | $ | 152,718 | $ | 439,291 | $ | 4,503,038 | $ | 390,594 | $ | 42,663 | $ | 5,528,304 | ||||||||||||
Additions | 15,608 | 46,286 | 293,773 | 119,899 | 55,312 | 530,878 | ||||||||||||||||||
Net change in additions financed with accounts payable | — | (48 | ) | (4,994 | ) | (1,540 | ) | 1,095 | (5,487 | ) | ||||||||||||||
Reclassification and other items | — | 11,916 | 50,968 | — | (64,086 | ) | (1,202 | ) | ||||||||||||||||
Retirement or disposals | (101 | ) | (4,967 | ) | (66,727 | ) | (13,922 | ) | — | (85,717 | ) | |||||||||||||
|
|
|
|
|
|
|
|
|
|
|
| |||||||||||||
Balance as of December 31, 2013 | 168,225 | 492,478 | 4,776,058 | 495,031 | 34,984 | 5,966,776 | ||||||||||||||||||
Additions | 16,609 | 47,190 | 289,055 | 111,622 | 141,564 | 606,040 | ||||||||||||||||||
Net change in additions financed with accounts payable | — | (24 | ) | (1,226 | ) | 1,906 | 1,004 | 1,660 | ||||||||||||||||
Reclassification and other items | — | 28,354 | 119,131 | — | (147,618 | ) | (133 | ) | ||||||||||||||||
Impairment of assets | — | — | — | — | (3,397 | ) | (3,397 | ) | ||||||||||||||||
Retirement or disposals | (149 | ) | (45,045 | ) | (80,784 | ) | (15,572 | ) | — | (141,550 | ) | |||||||||||||
|
|
|
|
|
|
|
|
|
|
|
| |||||||||||||
Balance as of December 31, 2014 | $ | 184,685 | $ | 522,953 | $ | 5,102,234 | $ | 592,987 | $ | 26,537 | $ | 6,429,396 | ||||||||||||
|
|
|
|
|
|
|
|
|
|
|
| |||||||||||||
F-27
Table of Contents
VIDEOTRON LTD.
NOTES TO CONSOLIDATED FINANCIAL STATEMENTS (continued)
Years ended December 31, 2014, 2013 and 2012
(tabular amounts in thousands of Canadian dollars, except for option data)
| 12. | FIXED ASSETS (continued) |
| Land and buildings | Furniture and equipment | Receiving and distribution networks | Customer equipment | Projects under development | Total | |||||||||||||||||||
Accumulated depreciation: | ||||||||||||||||||||||||
Balance as of December 31, 2012 | $ | (45,650 | ) | $ | (209,127 | ) | $ | (2,275,242 | ) | $ | (167,265 | ) | $ | — | $ | (2,697,284 | ) | |||||||
Depreciation | (5,093 | ) | (54,052 | ) | (309,054 | ) | (86,990 | ) | — | (455,189 | ) | |||||||||||||
Retirement and disposals | 101 | 3,211 | 65,717 | 8,786 | — | 77,815 | ||||||||||||||||||
|
|
|
|
|
|
|
|
|
|
|
| |||||||||||||
Balance as of December 31, 2013 | (50,642 | ) | (259,968 | ) | (2,518,579 | ) | (245,469 | ) | — | (3,074,658 | ) | |||||||||||||
Depreciation | (5,718 | ) | (59,298 | ) | (319,970 | ) | (105,515 | ) | — | (490,501 | ) | |||||||||||||
Retirement and disposals | 149 | 44,635 | 79,911 | 11,884 | — | 136,579 | ||||||||||||||||||
|
|
|
|
|
|
|
|
|
|
|
| |||||||||||||
Balance as of December 31, 2014 | $ | (56,211 | ) | $ | (274,631 | ) | $ | (2,758,638 | ) | $ | (339,100 | ) | $ | — | $ | (3,428,580 | ) | |||||||
|
|
|
|
|
|
|
|
|
|
|
| |||||||||||||
Net carrying amount: | ||||||||||||||||||||||||
As of December 31, 2013 | 117,583 | 232,510 | 2,257,479 | 249,562 | 34,984 | 2,892,118 | ||||||||||||||||||
As of December 31, 2014 | $ | 128,474 | $ | 248,322 | $ | 2,343,596 | $ | 253,887 | $ | 26,537 | $ | 3,000,816 | ||||||||||||
|
|
|
|
|
|
|
|
|
|
|
| |||||||||||||
F-28
Table of Contents
VIDEOTRON LTD.
NOTES TO CONSOLIDATED FINANCIAL STATEMENTS (continued)
Years ended December 31, 2014, 2013 and 2012
(tabular amounts in thousands of Canadian dollars, except for option data)
| 13. | INTANGIBLE ASSETS |
For the years ended December 31, 2014 and 2013, changes in the net carrying amount of intangible assets are as follows:
| Spectrum licences1,2 | Software and other intangible assets | Projects under development | Total | |||||||||||||
Cost: | ||||||||||||||||
Balance as of December 31, 2012 | $ | 554,549 | $ | 417,340 | $ | 17,162 | $ | 989,051 | ||||||||
Additions | 15,964 | 37,431 | 14,221 | 67,616 | ||||||||||||
Net change in additions financed with accounts payable | — | 4,246 | (2 | ) | 4,244 | |||||||||||
Business disposal (note 8) | — | (4,012 | ) | — | (4,012 | ) | ||||||||||
Retirements | — | (5,839 | ) | — | (5,839 | ) | ||||||||||
Reclassification and other items | — | 19,590 | (21,509 | ) | (1,919 | ) | ||||||||||
|
|
|
|
|
|
|
| |||||||||
Balance as of December 31, 2013 | 570,513 | 468,756 | 9,872 | 1,049,141 | ||||||||||||
Additions | 217,364 | 64,439 | 22,745 | 304,548 | ||||||||||||
Net change in additions financed with accounts payable | — | 1,065 | (1,338 | ) | (273 | ) | ||||||||||
Retirements | — | (11,090 | ) | — | (11,090 | ) | ||||||||||
Reclassification and other items | — | 26,438 | (28,284 | ) | (1,846 | ) | ||||||||||
|
|
|
|
|
|
|
| |||||||||
Balance as of December 31, 2014 | $ | 787,877 | $ | 549,608 | $ | 2,995 | $ | 1,340,480 | ||||||||
|
|
|
|
|
|
|
| |||||||||
| 1 | The Corporation has the option, effective as of January 1, 2014, to sell its unused AWS spectrum licence in the Toronto region to Rogers Communications Partnership for a price of $180.0 million. The spectrum licence was purchased at a cost of $96.4 million in 2008. |
| 2 | In 2014, the Corporation acquired seven 700 MHz spectrum licences, covering the entirety of the provinces of Québec, Ontario (except Northern Ontario), Alberta and British Columbia, for a total price of $233.3 million, for which the Corporation made a cash deposit of $15.9 million in 2013 and paid the balance in 2014. |
The cost of internally generated intangible assets, mainly composed of software, was $373.3 million as of December 31, 2014 ($319.4 million as of December 31, 2013). For the year ended December 31, 2014, the Corporation recorded additions of internally generated intangible assets of $54.8 million ($37.2 million in 2013 and $41.4 million in 2012).
F-29
Table of Contents
VIDEOTRON LTD.
NOTES TO CONSOLIDATED FINANCIAL STATEMENTS (continued)
Years ended December 31, 2014, 2013 and 2012
(tabular amounts in thousands of Canadian dollars, except for option data)
| 13. | INTANGIBLE ASSETS (continued) |
| Spectrum licences | Software and other intangible assets | Projects under development | Total | |||||||||||||
Accumulated amortization: | ||||||||||||||||
Balance as of December 31, 2012 | $ | (122,498 | ) | $ | (184,612 | ) | $ | — | $ | (307,110 | ) | |||||
Amortization | (55,630 | ) | (50,924 | ) | — | (106,554 | ) | |||||||||
Retirements | — | 2,618 | — | 2,618 | ||||||||||||
Business disposal (note 8) | — | 1,935 | — | 1,935 | ||||||||||||
|
|
|
|
|
|
|
| |||||||||
Balance as of December 31, 2013 | (178,128 | ) | (230,983 | ) | — | (409,111 | ) | |||||||||
Amortization | (55,630 | ) | (55,250 | ) | — | (110,880 | ) | |||||||||
Retirements | — | 10,096 | — | 10,096 | ||||||||||||
|
|
|
|
|
|
|
| |||||||||
Balance as of December 31, 2014 | $ | (233,758 | ) | $ | (276,137 | ) | $ | — | $ | (509,895 | ) | |||||
|
|
|
|
|
|
|
| |||||||||
Net carrying amount: | ||||||||||||||||
As of December 31, 2013 | 392,385 | 237,773 | 9,872 | 640,030 | ||||||||||||
As of December 31, 2014 | $ | 554,119 | $ | 273,471 | $ | 2,995 | $ | 830,585 | ||||||||
|
|
|
|
|
|
|
| |||||||||
The accumulated amortization of internally generated intangible assets, mainly composed of software, was $181.0 million as of December 31, 2014 ($142.2 million as of December 31, 2013). For the year ended December 31, 2014, the Corporation recorded $38.8 million of amortization ($33.6 million in 2013 and $29.1 million in 2012) for its internally generated intangible assets.
The net carrying value of internally generated intangible assets was $192.3 million as of December 31, 2014 ($177.2 million as of December 31, 2013).
F-30
Table of Contents
VIDEOTRON LTD.
NOTES TO CONSOLIDATED FINANCIAL STATEMENTS (continued)
Years ended December 31, 2014, 2013 and 2012
(tabular amounts in thousands of Canadian dollars, except for option data)
| 14. | GOODWILL |
For the years ended December 31, 2014 and 2013, changes in the net carrying amount of goodwill are as follows:
Cost: | ||||
Balance as of December 31, 2012 | $ | 482,063 | ||
Business disposal (note 8) | (19,500 | ) | ||
|
| |||
Balance as of December 31, 2014 and 2013 | 462,563 | |||
|
| |||
Accumulated amortization: | ||||
Balance as of December 31, 2014 and 2013 | $ | (33,311 | ) | |
|
| |||
Net carrying amount: | ||||
As of December 31, 2014 and 2013 | $ | 429,252 | ||
|
| |||
The net carrying amount of goodwill as of December 31, 2014 and 2013 is allocated to the Telecommunications CGU.
Recoverable amounts
The recoverable amount of the Telecommunications CGU was determined based on the higher of value in use or fair value less costs of disposal with respect to the impairment tests performed. The Corporation uses the discounted cash flow method to estimate the recoverable amount, consisting of future cash flows derived primarily from the most recent budget andthree-year strategic plan approved by the Corporation’s management and presented to the Board of Directors. These forecasts considered the CGU’s past operating performance and market share as well as economic trends, along with specific and market industry trends and corporate strategies. In particular, specific assumptions are used for each type of revenues generated by the CGU or for each nature of expenses as well as for future capital expenditures. As such, assumptions will consider, among many other factors, subscribers, competitive landscape, evolution of products and services offerings, wireless penetration growth, technology evolution, bargaining agreements, Canadian GDP rates and operating cost structures.
A perpetual growth rate is used for cash flows beyond the strategic planthree-year period. The discount rate used by the Corporation is a pre-tax rate derived from the weighted average cost of capital pertaining to the CGU, which reflects the current market assessment of (i) the time value of money, and (ii) the risk specific to the assets for which the future cash flow estimates have not been risk-adjusted. The perpetual growth rate was determined with regard to the specific markets in which the CGU participates.
The following key assumptions were used to determine recoverable amounts in the most recent impairment tests performed:
| 2014 | 2013 | |||||||||||||||
Group of CGUs | Pre-tax discount rate (WACC) | Perpetual growth rate | Pre-tax discount rate (WACC) | Perpetual growth rate | ||||||||||||
Telecommunications1 | 8.9 | % | 2.5 | % | 9.0 | % | 3.0 | % | ||||||||
| 1 | The recoverable amount of this CGU was based on value in use in 2014 and 2013. |
F-31
Table of Contents
VIDEOTRON LTD.
NOTES TO CONSOLIDATED FINANCIAL STATEMENTS (continued)
Years ended December 31, 2014, 2013 and 2012
(tabular amounts in thousands of Canadian dollars, except for option data)
14. GOODWILL (continued)
Sensitivity of recoverable amounts
An incremental increase in the pre-tax discount rate of 11.2% and an incremental decrease in the perpetual growth rate of 12.8% would have been required in the most recently performed test for the recoverable amount to equal the carrying value of the Telecommunications CGU in 2014.
| 15. | OTHER ASSETS |
| 2014 | 2013 | |||||||
Deferred connection costs | $ | 24,340 | $ | 31,614 | ||||
Defined benefit plans (note 27) | — | 3,050 | ||||||
Other | 2,787 | 2,126 | ||||||
|
|
|
| |||||
| $ | 27,127 | $ | 36,790 | |||||
|
|
|
| |||||
| 16. | ACCOUNTS PAYABLE AND ACCRUED CHARGES |
| 2014 | 2013 | |||||||
Trade and accruals | $ | 305,026 | $ | 297,958 | ||||
Salaries and employee benefits | 74,968 | 79,606 | ||||||
Interest payable | 31,481 | 30,072 | ||||||
Stock-based compensation | 1,442 | 985 | ||||||
|
|
|
| |||||
| $ | 412,917 | $ | 408,621 | |||||
|
|
|
| |||||
F-32
Table of Contents
VIDEOTRON LTD.
NOTES TO CONSOLIDATED FINANCIAL STATEMENTS (continued)
Years ended December 31, 2014, 2013 and 2012
(tabular amounts in thousands of Canadian dollars, except for option data)
| 17. | PROVISIONS AND CONTINGENCIES |
| Contingencies, legal disputes and other | ||||
Balance as of December 31, 2013 | $ | 14,354 | ||
Recognized in income | 36,442 | |||
Payments | (1,367 | ) | ||
Other | 961 | |||
|
| |||
Balance as of December 31, 2014 | $ | 50,390 | ||
|
| |||
Current portion | $ | 45,744 | ||
Non-current portion1 | 4,646 | |||
| 1 | The non-current portion of provisions and contingencies is included in other liabilities (note 19) |
The recognition of provisions, in terms of both timing and amounts, requires the exercise of judgment based on relevant circumstances and events that can be subject to change over time. Provisions are primarily comprised of the following:
Contingencies and legal disputes
There are a number of legal proceedings against the Corporation and its subsidiaries that are pending. In the opinion of the management of the Corporation and its subsidiaries, the outcome of those proceedings is not expected to have a material adverse effect on the Corporation’s results or on its financial position. Management of the Corporation, after taking legal advice, has established provisions for specific claims or actions considering the facts of each case. The Corporation cannot determine when and if a payment related to these provisions will be made.
Other
Other provisions are principally related to decommissioning obligations.
F-33
Table of Contents
VIDEOTRON LTD.
NOTES TO CONSOLIDATED FINANCIAL STATEMENTS (continued)
Years ended December 31, 2014, 2013 and 2012
(tabular amounts in thousands of Canadian dollars, except for option data)
| 18. | LONG-TERM DEBT |
| Effective interest rate as of December 31, 2014 | 2014 | 2013 | ||||||||||
Bank credit facilities (i) | 2.78 | % | 37,500 | 48,214 | ||||||||
Senior Notes (ii) (note 5) | (ii | ) | 2,913,511 | 2,390,265 | ||||||||
|
|
|
|
|
| |||||||
Total long-term debt | 2,951,011 | 2,438,479 | ||||||||||
Change in fair value related to hedged interest rate risk | 8,168 | — | ||||||||||
Adjustments related to embedded derivatives | (3,559 | ) | (7,861 | ) | ||||||||
Financing fees, net of amortization | (31,080 | ) | (31,513 | ) | ||||||||
|
|
|
| |||||||||
| (26,471 | ) | (39,374 | ) | |||||||||
|
|
|
| |||||||||
Less current portion | (213,688 | ) | (10,714 | ) | ||||||||
|
|
|
| |||||||||
| $ | 2,710,852 | $ | 2,388,391 | |||||||||
|
|
|
| |||||||||
| (i) | The bank credit facilities provide for a $575.0 million secured revolving credit facility that matures in July 2018 and a $75.0 million secured export financing facility providing for a term loan that matures in June 2018. The revolving credit facility bears interest at Bankers’ acceptance rate, Canadian prime rate or U.S. prime rate, plus a margin, depending on the Corporation’s leverage ratio. Advances under the export financing facility bear interest at Bankers’ acceptance rate plus a margin. The bank credit facilities are secured by a first ranking hypothec on the universality of all tangible and intangible assets, current and future, of the Corporation and most of its wholly owned subsidiaries. As of December 31, 2014, the bank credit facilities were secured by assets with a carrying value of $6,238.3 million ($7,013.7 million in 2013). The bank credit facilities contain covenants such as maintaining certain financial ratios, limitations on the Corporation’s ability to incur additional indebtedness, pay dividends and make other distributions. As of December 31, 2014 and 2013, no amount was drawn on the revolving credit facility. As of December 31, 2014, $37.5 million ($48.2 million in 2013) was outstanding on the export financing facility. |
F-34
Table of Contents
VIDEOTRON LTD.
NOTES TO CONSOLIDATED FINANCIAL STATEMENTS (continued)
Years ended December 31, 2014, 2013 and 2012
(tabular amounts in thousands of Canadian dollars, except for option data)
| 18. | LONG-TERM DEBT (continued) |
| (ii) | The Senior Notes are unsecured and contain certain restrictions on the Corporation, including limitations on its ability to incur additional indebtedness, pay dividends or make other distributions. Some notes are redeemable at the option of the issuer, in whole or in part, at a price based on amake-whole formula during the first five years of the term of the notes and at a decreasing premium thereafter, while the remaining notes are redeemable at a price based on a make-whole formula at any time prior to their maturity. The notes are guaranteed by specific subsidiaries of the Corporation and, on a non-consolidated basis, the Corporation has no independent assets or operations, the guarantees are full and unconditional and joint and several and any non-guarantor subsidiaries are minor. The following table summarizes terms of the outstanding Senior Notes as of December 31, 2014: |
Principal amount | Annual nominal interest rate | Effective interest rate (after discount or premium at issuance) | Maturity date | Interest payable every 6 months on | ||||||||||||
US$ 175,000 | 6.375 | % | 6.444 | % | December 15, 2015 | June and December 15 | ||||||||||
US$ 75,000 | 9.125 | % | 9.375 | % | April 15, 2018 | June and December 15 | ||||||||||
$ 300,000 | 7.125 | % | 7.125 | % | January 15, 2020 | June and December 15 | ||||||||||
$ 300,000 | 6.875 | % | 6.875 | % | July 15, 2021 | June and December 15 | ||||||||||
US$ 800,0001 | 5.000 | % | 5.000 | % | July 15, 2022 | January and July 15 | ||||||||||
US$ 600,0002 | 5.375 | % | 5.375 | % | June 15, 2024 | June and December 15 | ||||||||||
$ 400,0003 | 5.625 | % | 5.625 | % | June 15, 2025 | April and October 15 | ||||||||||
| 1 | The notes were issued in March 2012 for net proceeds of $787.6 million, net of financing fees of $11.9 million. |
| 2 | The notes were issued in April 2014 for net proceeds of $654.5 million, net of financing fees of $7.8 million. |
| 3 | The notes were issued in June 2013 for net proceeds of $394.8 million, net of financing fees of $5.2 million. |
On December 31, 2014, the Corporation and its subsidiaries were in compliance with all debt covenants.
Principal repayments of long-term debt over the coming years are as follows:
2015 | $ | 213,688 | ||
2016 | 10,714 | |||
2017 | 10,714 | |||
2018 | 91,754 | |||
2019 | — | |||
2020 and thereafter | 2,624,141 |
F-35
Table of Contents
VIDEOTRON LTD.
NOTES TO CONSOLIDATED FINANCIAL STATEMENTS (continued)
Years ended December 31, 2014, 2013 and 2012
(tabular amounts in thousands of Canadian dollars, except for option data)
| 19. | OTHER LIABILITIES |
| Note | 2014 | 2013 | ||||||||||
Defined benefit plans | 27 | $ | 55,886 | $ | 16,739 | |||||||
Deferred revenue | 24,458 | 31,848 | ||||||||||
Stock-based compensation1 | 21 | 965 | 624 | |||||||||
Asset retirement obligation | 17 | 4,646 | 3,597 | |||||||||
Other | 897 | 156 | ||||||||||
|
|
|
| |||||||||
| $ | 86,852 | $ | 52,964 | |||||||||
|
|
|
| |||||||||
| 1 | The current portion of stock-based compensation of $1.4 million is included in accounts payable and accrued charges ($1.0 million in 2013) (note 16). |
| 20. | CAPITAL STOCK |
| (a) | Authorized capital stock |
An unlimited number of Common Shares, without par value, voting and participating
An unlimited number of Preferred Shares, Series B, Series C, Series D, Series E, Series F, and Series H, without par value, ranking prior to the Common Shares with regards to payment of dividends and repayment of capital, non-voting, non-participating, a fixed monthly non-cumulative dividend of 1%, retractable and redeemable.
An unlimited number of Preferred Shares, Series G, ranking prior to all other shares with regards to payment of dividends and repayment of capital, non-voting, non-participating carrying the rights and restrictions attached to the class as well as a fixed annual cumulative preferred dividend of 11.25%, retractable and redeemable.
| (b) | Issued and outstanding capital stock |
| Common Shares | ||||||||
| Number | Amount | |||||||
Balance as of December 31, 2014 and 2013 | 2,516,829 | $ | 3,401 | |||||
|
|
|
| |||||
F-36
Table of Contents
VIDEOTRON LTD.
NOTES TO CONSOLIDATED FINANCIAL STATEMENTS (continued)
Years ended December 31, 2014, 2013 and 2012
(tabular amounts in thousands of Canadian dollars, except for option data)
| 21. | STOCK-BASED COMPENSATION PLANS |
| (a) | Ultimate parent corporation stock option plan |
Under a stock option plan established by the ultimate parent corporation, 13,000,000 of Class B Shares of the ultimate parent corporation have been set aside for directors, officers, senior employees, and other key employees of the ultimate parent corporation and its subsidiaries. The exercise price of each option is equal to the weighted average trading price of the parent corporation’s Class B Shares on the Toronto Stock Exchange over the last five trading days immediately preceding the granting of the option. Each option may be exercised during a period not exceeding 10 years from the date granted. Options usually vest as follows: 1/3 after one year, 2/3 after two years, and 100% three years after the original grant. Holders of options under the stock option plan have the choice, when they exercise their options, of acquiring the Class B Shares at the corresponding option exercise price, or receiving a cash payment equivalent to the difference between the market value of the underlying shares and the exercise price of the option. The Board of Directors of the ultimate parent corporation may, at its discretion, affix different vesting periods at the time of each grant.
The following table gives details on changes to outstanding options for the years ended December 31, 2014 and 2013:
| 2014 | 2013 | |||||||||||||||
| Options | Weighted average exercise price | Options | Weighted average exercise price | |||||||||||||
Balance at beginning of year | — | $ | — | — | $ | — | ||||||||||
Granted | 50,000 | 25.49 | — | — | ||||||||||||
|
|
|
|
|
|
|
| |||||||||
Balance at end of year | 50,000 | $ | 25.49 | — | $ | — | ||||||||||
|
|
|
|
|
|
|
| |||||||||
During the year ended December 31, 2014, none of the ultimate parent corporation’s stock options were exercised.
The following table gives summary information on outstanding options as of December 31, 2014:
| Outstanding options | Vested options | |||||||||||||||||||
Exercise price | Number | Weighted average years to maturity | Weighted average exercise price | Number | Weighted average exercise price | |||||||||||||||
$25.49 | 50,000 | 9.23 | $ | 25.49 | — | $ | — | |||||||||||||
F-37
Table of Contents
VIDEOTRON LTD.
NOTES TO CONSOLIDATED FINANCIAL STATEMENTS (continued)
Years ended December 31, 2014, 2013 and 2012
(tabular amounts in thousands of Canadian dollars, except for option data)
| 21. | STOCK-BASED COMPENSATION PLANS (continued) |
| (b) | Parent corporation stock option plan |
Under a stock option plan established by the parent corporation, options have been set aside for officers, senior employees, directors and other key employees of the Corporation. Each option may be exercised within a maximum period of 10 years following the date of grant at an exercise price not lower than, as the case may be, the fair market value of the Common Shares of the parent corporation at the date of grant, as determined by its Board of Directors (if the Common Shares of the parent corporation are not listed on a stock exchange at the time of the grant), or the five-day weighted average market price ending on the day preceding the date of grant of the Common Shares of the parent corporation on the stock exchange(s) where such shares are listed at the time of grant. As long as the Common Shares of the parent corporation are not listed on a recognized stock exchange, optionees may exercise their vested options during one of the following periods: from March 1 to March 30, from June 1 to June 29, from September 1 to September 29, and from December 1 to December 30. Holders of options under the plan have the choice at the time of exercising their options of receiving an amount in cash (equal to the difference between either thefive-day weighted average market price ending on the day preceding the date of exercise of the Common Shares of the parent corporation on the stock exchange(s) where such shares are listed at the time of exercise or the fair market value of the Common Shares, as determined by the parent corporation’s Board of Directors, and the exercise price of their vested options) or, subject to certain stated conditions, exercise their options to purchase Common Shares of the parent corporation at the exercise price. Except under specific circumstances, and unless the Human Resources and Compensation Committee decides otherwise, options vest over afive-year period in accordance with one of the following vesting schedules as determined by the Human Resources and Compensation Committee at the time of grant: (i) equally over five years with the first 20% vesting on the first anniversary of the date of the grant; (ii) equally over four years with the first 25% vesting on the second anniversary of the date of grant; and (iii) equally over three years with the first 33 1/3% vesting on the third anniversary of the date of grant.
The following table gives details on changes to outstanding options granted as of December 31, 2014 and 2013:
| 2014 | 2013 | |||||||||||||||
| Options | Weighted average exercise price | Options | Weighted average exercise price | |||||||||||||
Balance at beginning of year | 273,061 | $ | 54.00 | 360,628 | $ | 39.63 | ||||||||||
Granted | 14,000 | 63.50 | 200,711 | 57.44 | ||||||||||||
Exercised | (32,850 | ) | 42.49 | (286,278 | ) | 38.28 | ||||||||||
Cancelled | (13,000 | ) | 52.63 | (2,000 | ) | 57.64 | ||||||||||
|
|
|
|
|
|
|
| |||||||||
Balance at end of year | 241,211 | $ | 56.20 | 273,061 | $ | 54.00 | ||||||||||
|
|
|
|
|
|
|
| |||||||||
Vested options at end of year | 24,700 | $ | 48.85 | 23,500 | $ | 46.07 | ||||||||||
|
|
|
|
|
|
|
| |||||||||
During the year ended December 31, 2014, 32,850 of the Corporation’s stock options were exercised for a cash consideration of $0.7 million (286,278 stock options for $5.9 million in 2013).
F-38
Table of Contents
VIDEOTRON LTD.
NOTES TO CONSOLIDATED FINANCIAL STATEMENTS (continued)
Years ended December 31, 2014, 2013 and 2012
(tabular amounts in thousands of Canadian dollars, except for option data)
21. STOCK-BASED COMPENSATION PLANS (continued)
| (b) | Parent corporation stock-based compensation plan (continued) |
The following table gives summary information on outstanding options as of December 31, 2014:
| Outstanding options | Vested options | |||||||||||||||||||
Range of exercise price | Number | Weighted average years to maturity | Weighted average exercise price | Number | Weighted average exercise price | |||||||||||||||
$35.93 to $50.37 | 38,500 | 5.42 | $ | 47.51 | 20,100 | $ | 46.83 | |||||||||||||
$57.35 to $63.50 | 202,711 | 8.47 | 57.85 | 4,600 | 57.64 | |||||||||||||||
|
|
|
|
|
|
|
|
|
| |||||||||||
| 241,211 | 7.98 | $ | 56.20 | 24,700 | $ | 48.85 | ||||||||||||||
|
|
|
|
|
|
|
|
|
| |||||||||||
| (c) | Assumptions in estimating the fair value of stock-based awards |
The fair value of stock-based awards under the stock option plans of the ultimate parent corporation and parent corporation was estimated using the Black-Scholes option pricing model. The followingweighted-average assumptions were used to estimate the fair value of all outstanding stock options under the stock option plans as of December 31, 2014 and 2013:
December 31, 2014 | Ultimate parent corporation | Parent corporation | ||||||
Risk-free interest rate | 1.66% | 1.40% | ||||||
Dividend yield | 0.31% | 1.38% | ||||||
Expected volatility | 25.83% | 18.95% | ||||||
Expected remaining life | 5.7 years | 3.7 years | ||||||
December 31, 2013 | Ultimate parent corporation | Parent corporation | ||||||
Risk-free interest rate | — % | 1.85% | ||||||
Dividend yield | — % | 1.56% | ||||||
Expected volatility | — % | 23.97% | ||||||
Expected remaining life | — years | 4.3 year | ||||||
Except for the parent corporation, the expected volatility is based on the historical volatility of the underlying share price for a period equivalent to the expected remaining life of the options. Since the Common Shares of the parent corporation are not publicly traded on a stock exchange, expected volatility is derived from the implied volatility of the ultimate parent corporation’s stock. The expected remaining life of options granted represents the period of time that options granted are expected to be outstanding. Therisk-free rate over the expected remaining life of the option is based on the Government of Canada yield curve in effect at the time of the valuation. Dividend yield is based on the current average yield.
F-39
Table of Contents
VIDEOTRON LTD.
NOTES TO CONSOLIDATED FINANCIAL STATEMENTS (continued)
Years ended December 31, 2014, 2013 and 2012
(tabular amounts in thousands of Canadian dollars, except for option data)
21. STOCK-BASED COMPENSATION PLANS (continued)
| (d) | Liability of vested options |
As of December 31, 2014, the liability for all vested options was $0.5 million as calculated using the intrinsic value ($0.4 million as of December 31, 2013).
| (e) | Consolidated compensation charge |
For the year ended December 31, 2014, a consolidated charge related to thestock-based compensation plans was recorded in the amount of $1.3 million (charge of $2.7 million in 2013 and $3.3 million in 2012).
| 22. | ACCUMULATED OTHER COMPREHENSIVE LOSS |
| Cash flow hedges | Defined benefit plans | Total | ||||||||||
Balance as of December 31, 2011 | $ | (5,244 | ) | $ | (27,821 | ) | $ | (33,065 | ) | |||
Other comprehensive gain (loss) | 22,132 | (8,093 | ) | 14,039 | ||||||||
|
|
|
|
|
| |||||||
Balance as of December 31, 2012 | 16,888 | (35,914 | ) | (19,026 | ) | |||||||
Other comprehensive (loss) gain | (31,641 | ) | 41,558 | 9,917 | ||||||||
|
|
|
|
|
| |||||||
Balance as of December 31, 2013 | (14,753 | ) | 5,644 | (9,109 | ) | |||||||
Other comprehensive loss | (2,852 | ) | (35,028 | ) | (37,880 | ) | ||||||
|
|
|
|
|
| |||||||
Balance as of December 31, 2014 | $ | (17,605 | ) | $ | (29,384 | ) | $ | (46,989 | ) | |||
|
|
|
|
|
| |||||||
No significant amount is expected to be reclassified in income over the next 12 months in connection with derivatives designated as cash flow hedges. The balance is expected to reverse over a 9 1/2-year period.
| 23. | COMMITMENTS |
The Corporation rents premises and equipment under operating leases and has entered into long-term commitments to purchase services and capital equipment that call for total future payments of $575.9 million, including an amount of $51.7 million for future rent payments to the ultimate parent corporation. The operating leases have various terms, escalation clauses, purchase options and renewal rights. The minimum payments for the coming years are as follows:
| Leases | Services, capital equipment and other commitments | |||||||
2015 | $ | 36,357 | $ | 111,483 | ||||
2016 to 2019 | 88,292 | 192,137 | ||||||
2020 and thereafter | 51,609 | 96,064 | ||||||
The Corporation and its subsidiaries’ operating lease expenses amounted to $48.9 million in 2014 ($48.0 million in 2013 and $48.8 million in 2012).
F-40
Table of Contents
VIDEOTRON LTD.
NOTES TO CONSOLIDATED FINANCIAL STATEMENTS (continued)
Years ended December 31, 2014, 2013 and 2012
(tabular amounts in thousands of Canadian dollars, except for option data)
| 24. | GUARANTEES |
In the normal course of business, the Corporation enters into numerous agreements containing guarantees, including the following:
Operating leases
The Corporation has guaranteed a portion of the residual values of certain assets under operating leases for the benefit of the lessor. Should the Corporation terminate these leases prior to term (or at the end of the lease terms) and should the fair value of the assets be less than the guaranteed residual value, then the Corporation must, under certain conditions, compensate the lessor for a portion of the shortfall. As of December 31, 2014, the maximum exposure with respect to the guarantees was $13.0 million and no liability has been recorded in the consolidated balance sheet.
Business and asset disposals
In the sale of all or part of a business or an asset, in addition to possible indemnification relating to failure to perform covenants and breach of representations or warranties, the Corporation may agree to indemnify against claims related to the past conduct of the business. Typically, the term and amount of such indemnification will be limited by the agreement. The nature of these indemnification agreements prevents the Corporation from estimating the maximum potential liability it could be required to pay to guaranteed parties. The Corporation has not accrued any amount in respect of these items in the consolidated balance sheet.
Outsourcing companies and suppliers
In the normal course of its operations, the Corporation enters into contractual agreements with outsourcing companies and suppliers. In some cases, the Corporation agrees to provide indemnifications in the event of legal procedures initiated against them. In other cases, the Corporation provides indemnification to counterparties for damages resulting from the outsourcing companies and suppliers. The nature of the indemnification agreements prevents the Corporation from estimating the maximum potential liability it could be required to pay. No amount has been accrued in the consolidated balance sheet with respect to these indemnifications.
| 25. | FINANCIAL INSTRUMENTS AND FINANCIAL RISK MANAGEMENT |
The Corporation’s financial risk management policies have been established in order to identify and analyze the risks faced by the Corporation, to set appropriate risk limits and controls, and to monitor risks and adherence to limits. Risk management policies are reviewed regularly to reflect changes in market conditions and in the Corporation’s activities.
The Corporation uses a number of financial instruments, mainly cash and cash equivalents, accounts receivable, accounts payable and accrued charges, provisions, long-term debt and derivative financial instruments. As a result of their use of financial instruments, the Corporation and its subsidiaries are exposed to credit risk, liquidity risk and market risks relating to foreign exchange fluctuations and interest rate fluctuations.
In order to manage its foreign exchange and interest rate risks, the Corporation uses derivative financial instruments (i) to set in CAN dollars future payments on debts denominated in U.S. dollars (interest and principal) and certain purchases of inventories and other capital expenditures denominated in a foreign currency, (ii) to achieve a targeted balance of fixed and floating rate debts, and (iii) to lock-in the value of certain derivative financial instruments through offsetting transactions. The Corporation does not intend to settle its derivative financial instruments prior to their maturity as none of these instruments is held or issued for speculative purposes.
F-41
Table of Contents
VIDEOTRON LTD.
NOTES TO CONSOLIDATED FINANCIAL STATEMENTS (continued)
Years ended December 31, 2014, 2013 and 2012
(tabular amounts in thousands of Canadian dollars, except for option data)
| 25. | FINANCIAL INSTRUMENTS AND FINANCIAL RISK MANAGEMENT (continued) |
| (a) | Description of derivative financial instruments |
| (i) | Foreign exchange forward contracts |
Maturity | CAN dollar average exchange rate per one U.S. dollar | Notional amount sold (in millions of dollars) | Notional amount bought (in millions of dollars) | |||||||||
Less than 1 year | 1.1198 | $ | 106.3 | US$ | 94.9 | |||||||
20171 | 1.1204 | US$ | 260.0 | $ | 291.3 | |||||||
| (ii) | Cross-currency interest rate swaps |
Hedged item | Hedging instrument | |||||||||||||||
| Period covered | Notional amount | Annual interest rate on notional amount in CAN dollars | CAN dollar exchange rate on interest and capital payments per one U.S. dollar | |||||||||||||
6.375% Senior Notes due 2015 | 2005 to 2015 | US$ | 175,000 | 5.98 | % | 1.1781 | ||||||||||
9.125% Senior Notes due 2018 | 2008 to 2018 | US$ | 75,000 | 9.64 | % | 1.0215 | ||||||||||
5.000% Senior Notes due 2022 | 2014 to 2022 | US$ | 543,125 | 6.01 | % | 0.9983 | ||||||||||
5.000% Senior Notes due 2022 | 2012 to 2022 | US$ | 256,875 | 5.81 | % | 1.0016 | ||||||||||
5.375% Senior Notes due 20241 | 2014 to 2017 | US$ | 260,000 | 9.21 | % | 1.2965 | ||||||||||
5.375% Senior Notes due 2024 | 2014 to 2024 | US$ | 158,605 | | Bankers’ acceptances 3 months + 2.67 | % | 1.1034 | |||||||||
5.375% Senior Notes due 2024 | 2017 to 2024 | US$ | 441,395 | 5.62 | % | 1.1039 | ||||||||||
| 1 | The Corporation initially entered into these cross-currency interest rate swaps to hedge the foreign currency risk exposure under its 9.125% Senior Notes due in 2018 redeemed in 2014. These swaps are now used to set in CAN dollars all coupon payments through 2017 on US$441.4 million of notional amount under its 5.375% Senior Notes due in 2024 and issued on April 9, 2014. In conjunction with the repurposing of these swaps, the Corporation has entered into US$260.0 million offsetting foreign exchange forward contracts to lock-in the value of its hedging position related to the December 15, 2017 notional exchange. |
Certain cross-currency interest rate swaps entered into by the Corporation include an option that allows each party to unwind the transaction on a specific date at the then settlement amount.
F-42
Table of Contents
VIDEOTRON LTD.
NOTES TO CONSOLIDATED FINANCIAL STATEMENTS (continued)
Years ended December 31, 2014, 2013 and 2012
(tabular amounts in thousands of Canadian dollars, except for option data)
| 25. | FINANCIAL INSTRUMENTS AND FINANCIAL RISK MANAGEMENT (continued) |
| (b) | Fair value of financial instruments |
In accordance with IFRS 7,Financial Instruments: Disclosures, the Corporation has considered the following fair value hierarchy that reflects the significance of the inputs used in measuring its other financial instruments accounted for at fair value in the consolidated balance sheets:
| • | Level 1: quoted prices (unadjusted) in active markets for identical assets or liabilities; |
| • | Level 2: inputs other than quoted prices included in level 1 that are observable for the asset or liability, either directly (i.e., as prices) or indirectly (i.e., derived from prices); and |
| • | Level 3: inputs that are not based on observable market data (unobservable inputs). |
The fair value of long-term debt is estimated based on quoted market prices when available or on valuation models using level 1 and level 2 inputs. When the Corporation uses valuation models, the fair value is estimated using discounted cash flows usingyear-end market yields or the market value of similar instruments with the same maturity.
The fair value of cash equivalents classified as held for trading and accounted for at their fair value on the consolidated balance sheets, is determined using level 2 inputs.
The fair value of derivative financial instruments recognized on the consolidated balance sheets is estimated as per the Corporation’s valuation models. These models project future cash flows and discount the future amounts to a present value using the contractual terms of the derivative instrument and factors observable in external market data, such asperiod-end swap rates and foreign exchange rates (level 2 inputs). An adjustment is also included to reflectnon-performance risk impacted by the financial and economic environment prevailing at the date of the valuation in the recognized measure of the fair value of the derivative instruments by applying a credit default premium estimated using a combination of observable and unobservable inputs in the market (level 3 inputs) to the net exposure of the counterparty or the Corporation. Derivative financial instruments are classified as level 2.
The fair value of early settlement options recognized as embedded derivatives is determined by option pricing models using level 2 market inputs, including volatility, discount factors and underlying instruments adjusted implicit interest rate and credit premium.
F-43
Table of Contents
VIDEOTRON LTD.
NOTES TO CONSOLIDATED FINANCIAL STATEMENTS (continued)
Years ended December 31, 2014, 2013 and 2012
(tabular amounts in thousands of Canadian dollars, except for option data)
| 25. | FINANCIAL INSTRUMENTS AND FINANCIAL RISK MANAGEMENT (continued) |
| (b) | Fair value of financial instruments (continued) |
The carrying value and fair value of long term debt and derivative financial instruments as of December 31, 2014 and 2013 are as follows:
| 2014 | 2013 | |||||||||||||||
Asset (liability) | Carrying value | Fair value | Carrying value | Fair value | ||||||||||||
Long-term debt1, 2 | $ | (2,951,011 | ) | $ | (3,020,851 | ) | $ | (2,438,479 | ) | $ | (2,486,019 | ) | ||||
Derivative financial instruments3 | ||||||||||||||||
Early settlement options | 5,551 | 5,551 | 11,819 | 11,819 | ||||||||||||
Foreign exchange forward contracts4 | 4,216 | 4,216 | �� | 1,835 | 1,835 | |||||||||||
Cross-currency interest rate swaps4 | 107,023 | 107,023 | (165,705 | ) | (165,705 | ) | ||||||||||
| 1 | The carrying value of long-term debt excludes adjustments to record changes in the fair value of long-term debt related to hedged interest rate risk, embedded derivatives and financing fees. |
| 2 | The fair value of long-term debt excludes the fair value of early settlement options, which is presented separately in the table. |
| 3 | The fair value of derivative financial instruments designated as hedges is in a net asset position of $111.2 million as of December 31, 2014 (net liability position of $93.8 million as of December 31, 2013). |
| 4 | The value of foreign exchange forward contracts entered into to lock-in the value of existing hedging positions is netted from the value of the offset financial instruments. |
| (c) | Credit risk management |
Credit risk is the risk of financial loss to the Corporation if a customer or counterparty to a financial asset fails to meet its contractual obligations.
In the normal course of business, the Corporation continuously monitors the financial condition of its customers and reviews the credit history of each new customer. As of December 31, 2014, no customer balance represented a significant portion of the Corporation’s consolidated accounts receivable. The Corporation establishes an allowance for doubtful accounts based on the specific credit risk of its customers and historical trends. The allowance for doubtful accounts amounted to $15.4 million as of December 31, 2014 ($15.7 million as of December 31, 2013). As of December 31, 2014, 7.0% of accounts receivable were 90 days past their billing date (8.6% as of December 31, 2013), of which 82.6% had an allowance for doubtful accounts (71.1% as of December 31, 2013).
The following table shows changes to the allowance for doubtful accounts for the years ended December 31, 2014 and 2013:
| 2014 | 2013 | |||||||
Balance as of beginning of year | $ | 15,678 | $ | 16,638 | ||||
Charged to income | 28,962 | 36,911 | ||||||
Utilization | (29,218 | ) | (37,871 | ) | ||||
|
|
|
| |||||
Balance as of end of year | $ | 15,422 | $ | 15,678 | ||||
|
|
|
| |||||
F-44
Table of Contents
VIDEOTRON LTD.
NOTES TO CONSOLIDATED FINANCIAL STATEMENTS (continued)
Years ended December 31, 2014, 2013 and 2012
(tabular amounts in thousands of Canadian dollars, except for option data)
| 25. | FINANCIAL INSTRUMENTS AND FINANCIAL RISK MANAGEMENT (continued) |
| (c) | Credit risk management (continued) |
The Corporation believes that its product lines and the diversity of its customer base are instrumental in reducing its credit risk, as well as the impact of fluctuations in product-line demand. The Corporation does not believe that it is exposed to an unusual level of customer credit risk.
As a result of its use of derivative financial instruments, the Corporation is exposed to the risk ofnon-performance by a third party. When the Corporation enters into derivative contracts, the counterparties (either foreign or Canadian) must have credit ratings at least in accordance with the Corporation’s risk management policy and are subject to concentration limits. These credit ratings and concentration limits are monitored on an ongoing basis but at least quarterly.
| (d) | Liquidity risk management |
Liquidity risk is the risk that the Corporation will not be able to meet its financial obligations as they fall due or the risk that those financial obligations will have to be met at excessive cost. The Corporation manages this exposure through staggered debt maturities. The weighted average term of the Corporation’s consolidated debt was approximately 7.3 years as of December 31, 2014 (6.9 years as of December 31, 2013).
The Corporation’s management believes that cash flows and available sources of financing should be sufficient to cover committed cash requirements for capital investments, working capital, interest payments, debt repayments, pension plan contributions, and dividends in the future. The Corporation has access to cash flows generated by its subsidiaries through dividends and cash advances paid by its wholly owned subsidiaries.
As of December 31, 2014, material contractual obligations related to financial instruments included capital repayment and interest onlong-term debt and obligations related to derivative instruments, less estimated future receipts on derivative instruments. These obligations and their maturities are as follows:
| Total | Less than 1 year | 1-3 years | 3-5 years | 5 years or more | ||||||||||||||||
Accounts payable and accrued charges | $ | 412,917 | $ | 412,917 | $ | — | $ | — | $ | — | ||||||||||
Amounts payable to affiliated corporations | 49,384 | 49,384 | — | — | — | |||||||||||||||
Long-term debt1 | 2,951,011 | 213,688 | 21,428 | 91,754 | 2,624,141 | |||||||||||||||
Interest payments2 | 1,201,481 | 136,238 | 309,869 | 296,449 | 458,925 | |||||||||||||||
Derivative instruments3 | (109,882 | ) | 7,791 | 55,107 | (10,395 | ) | (162,385 | ) | ||||||||||||
|
|
|
|
|
|
|
|
|
| |||||||||||
Total | $ | 4,504,911 | $ | 820,018 | $ | 386,404 | $ | 377,808 | $ | 2,920,681 | ||||||||||
|
|
|
|
|
|
|
|
|
| |||||||||||
| 1 | The carrying value of long-term debt excludes adjustments to record changes in the fair value of long-term debt related to hedged interest rate risk, embedded derivatives and financing fees. |
| 2 | Estimate of interest payable on long-term debt, based on interest rates, hedging of interest rates and hedging of foreign exchange rates as of December 31, 2014. |
| 3 | Estimated future receipts, net of disbursements, on derivative financial instruments related to foreign exchange hedging. |
F-45
Table of Contents
VIDEOTRON LTD.
NOTES TO CONSOLIDATED FINANCIAL STATEMENTS (continued)
Years ended December 31, 2014, 2013 and 2012
(tabular amounts in thousands of Canadian dollars, except for option data)
| 25. | FINANCIAL INSTRUMENTS AND FINANCIAL RISK MANAGEMENT (continued) |
| (e) | Market risk |
Market risk is the risk that changes in market prices due to foreign exchange rates and/or interest rates will affect the value of the Corporation’s financial instruments. The objective of market risk management is to mitigate and control exposures within acceptable parameters while optimizing the return on risk.
Foreign currency risk
Most of the Corporation’s consolidated revenues and expenses, other than interest expense onU.S.-dollar-denominated debt, purchases ofset-top boxes, handsets and cable modems and certain capital expenditures, are received or denominated in CAN dollars. A large portion of the interest, principal and premium, if any, payable on its debt is payable in U.S. dollars. The Corporation has entered into transactions to hedge the foreign currency risk exposure on itsU.S.-dollar-denominated debt obligations outstanding as of December 31, 2014, to hedge its exposure on certain purchases ofset-top boxes, handsets, cable modems and capital expenditures and to lock-in the value of certain derivative financial instruments through offsetting transactions. Accordingly, the Corporation’s sensitivity to variations in foreign exchange rates is economically limited.
The following table summarizes the estimated sensitivity on income and other comprehensive income, before income tax, of a variance of $0.10 in theyear-end exchange rate of a CAN dollar per one U.S. dollar as of December 31, 2014:
Increase (decrease) | Income | Other comprehensive income | ||||||
Increase of $0.10 | ||||||||
U.S.-dollar-denominated accounts payable | $ | (1,023 | ) | $ | — | |||
Gain on valuation and translation of financial instruments and derivative financial instruments | 2,360 | 30,914 | ||||||
Decrease of $0.10 | ||||||||
U.S.-dollar-denominated accounts payable | 1,023 | — | ||||||
Gain on valuation and translation of financial instruments and derivative financial instruments | (2,360 | ) | (30,914 | ) | ||||
Interest rate risk
The Corporation’s bank credit facilities bear interest at floating rates based on the following reference rates: (i) Bankers’ acceptance rate, (ii) Canadian prime rate and (iii) U.S. prime rate. The Senior Notes issued by the Corporation bear interest at fixed rates. The Corporation has entered into cross-currency interest rate swap agreements in order to manage interest rate risk exposure. As of December 31, 2014, after taking into account the hedging instruments,long-term debt was comprised of 85.0% fixed rate debt (83.6% in 2013) and 15.0% floating rate debt (16.4% in 2013).
The estimated sensitivity on interest payments of a100 basis-point variance in theyear-end Canadian Bankers’ acceptance rate as of December 31, 2014 is $4.2 million.
F-46
Table of Contents
VIDEOTRON LTD.
NOTES TO CONSOLIDATED FINANCIAL STATEMENTS (continued)
Years ended December 31, 2014, 2013 and 2012
(tabular amounts in thousands of Canadian dollars, except for option data)
| 25. | FINANCIAL INSTRUMENTS AND FINANCIAL RISK MANAGEMENT (continued) |
| (e) | Market risk (continued) |
The estimated sensitivity on income and other comprehensive income, before income tax, of a100 basis-point variance in the discount rate used to calculate the fair value of financial instruments as of December 31, 2014, as per the Corporation’s valuation models, is as follows:
Increase (decrease) | Income | Other comprehensive income | ||||||
Increase of 100 basis points | $ | 445 | $ | (9,813 | ) | |||
Decrease of 100 basis points | (445 | ) | 9,813 | |||||
| (f) | Capital management |
The Corporation’s primary objective in managing capital is to maintain an optimal capital base in order to support the capital requirements of its various businesses, including growth opportunities.
In managing its capital structure, the Corporation takes into account the asset characteristics of its subsidiaries and planned requirements for funds. Management of the capital structure involves the issuance of new debt, the repayment of existing debt using cash flows generated by operations, and the level of distributions to the parent corporation. The Corporation has not significantly changed its strategy regarding the management of its capital structure since the last financial year.
The Corporation’s capital structure is composed of equity, long-term debt and net assets and liabilities related to derivative financial instruments, less cash and cash equivalents. The capital structure as of December 31, 2014 and 2013 is as follows:
| 2014 | 2013 | |||||||
Long-term debt | $ | 2,924,540 | $ | 2,399,105 | ||||
Derivative financial instruments (asset) liability | (111,239 | ) | 163,870 | |||||
Cash and cash equivalents | (342,802 | ) | (322,469 | ) | ||||
|
|
|
| |||||
Net liabilities | 2,470,499 | 2,240,506 | ||||||
Equity | $ | 793,907 | $ | 821,750 | ||||
|
|
|
| |||||
The Corporation is not subject to any externally imposed capital requirements other than certain restrictions under the terms of its borrowing agreements, which relate, among other things, to permitted investments,inter-corporation transactions, the declaration and payment of dividends or other distributions.
F-47
Table of Contents
VIDEOTRON LTD.
NOTES TO CONSOLIDATED FINANCIAL STATEMENTS (continued)
Years ended December 31, 2014, 2013 and 2012
(tabular amounts in thousands of Canadian dollars, except for option data)
| 26. | RELATED PARTY TRANSACTIONS |
Key management personnel compensation
Key management personnel comprise members of the Board of Directors and key senior management of the Corporation and its main subsidiaries. Their compensation is as follows:
| 2014 | 2013 | 2012 | ||||||||||
Salaries and short-term benefits | $ | 4,528 | $ | 4,242 | $ | 4,981 | ||||||
Post-employment benefits | 167 | 534 | 407 | |||||||||
Share-based compensation | 1,105 | 1,709 | 2,671 | |||||||||
Other long-term benefits | 1,889 | 1,859 | 2,924 | |||||||||
|
|
|
|
|
| |||||||
| $ | 7,689 | $ | 8,344 | $ | 10,983 | |||||||
|
|
|
|
|
| |||||||
Operating transactions
During the years ended December 31, 2014, 2013 and 2012, the Corporation and its subsidiaries made purchases and incurred rent charges with the parent corporation and affiliated corporations, which are included in purchase of goods and services. The Corporation and its subsidiaries also made sales to the parent corporation and affiliated corporations. These transactions were accounted for at the consideration agreed between parties:
| 2014 | 2013 | 2012 | ||||||||||
Ultimate parent and parent corporation : | ||||||||||||
Revenues | $ | 680 | $ | 541 | $ | 553 | ||||||
Purchase of goods and services | 7,572 | 8,508 | 6,539 | |||||||||
Operating expenses recovered | (682 | ) | (4,207 | ) | (1,154 | ) | ||||||
Affiliated corporations : | ||||||||||||
Revenues | 10,349 | 11,019 | 13,084 | |||||||||
Purchase of goods and services | 81,148 | 73,193 | 75,641 | |||||||||
Operating expenses recovered | (701 | ) | (3,418 | ) | (2,496 | ) | ||||||
F-48
Table of Contents
VIDEOTRON LTD.
NOTES TO CONSOLIDATED FINANCIAL STATEMENTS (continued)
Years ended December 31, 2014, 2013 and 2012
(tabular amounts in thousands of Canadian dollars, except for option data)
| 26. | RELATED PARTY TRANSACTIONS (continued) |
Accounts receivable from affiliated corporations:
| 2014 | 2013 | |||||||
Ultimate parent and parent corporation : | ||||||||
Accounts receivable | $ | 234 | $ | 3,706 | ||||
Dividends receivable | 3,852 | 8,133 | ||||||
Amount receivable from business disposal (note 8) | 7,848 | 7,848 | ||||||
Amount receivable from corporate reorganization (note 9) | — | 870 | ||||||
Affiliated corporations : | ||||||||
Accounts receivable | 6,390 | 5,556 | ||||||
|
|
|
| |||||
| $ | 18,324 | $ | 26,113 | |||||
|
|
|
| |||||
Accounts payable to affiliated corporations:
| 2014 | 2013 | |||||||
Ultimate parent and parent corporation : | ||||||||
Accounts payable | $ | 27,368 | $ | 11,443 | ||||
Interest payable | 3,782 | 7,924 | ||||||
Affiliated corporations : | ||||||||
Accounts payable | 18,234 | 18,929 | ||||||
Interest payable | — | 42 | ||||||
|
|
|
| |||||
| $ | 49,384 | $ | 38,338 | |||||
|
|
|
| |||||
Management arrangements
The Corporation pays annual management fees to the parent corporation for services rendered to the Corporation, including internal audit, legal and corporate, financial planning and treasury, tax, real estate, human resources, risk management, public relations and other services. Management fees amounted to $43.5 million in 2014 ($45.0 million in 2013 and $34.6 million in 2012). The agreement provides for an annual management fee to be agreed upon for the year 2015. In addition, the parent corporation is entitled to the reimbursement of out-of-pocket expenses incurred in connection with the services provided under the agreement.
F-49
Table of Contents
VIDEOTRON LTD.
NOTES TO CONSOLIDATED FINANCIAL STATEMENTS (continued)
Years ended December 31, 2014, 2013 and 2012
(tabular amounts in thousands of Canadian dollars, except for option data)
| 26. | RELATED PARTY TRANSACTIONS (continued) |
Tax arrangements
On October 31, 2012, Vidéotron Infrastructures inc., a wholly owned subsidiary of the Corporation, issued a subordinated loan of $800.0 million to Le Superclub Vidéotron Ltée, now a wholly owned subsidiary of Quebecor Media Inc., bearing interest at a rate of 11.00% payable every 6 months on June 20 and December 20 and maturing on October 31, 2027. On the same day, Vidéotron Infrastructures inc. issued 800,000 redeemable preferred shares, Class G to Le Superclub Vidéotron Ltée for a total cash consideration of $800.0 million. These shares carry the right to receive an annual dividend of 11.25%, payable semi-annually.
On January 21, 2013, Vidéotron Infrastructures inc. redeemed from Le Superclub Vidéotron Ltée 720,000 preferred shares, Class G, for a total cash consideration of $720.0 million, and settled cumulative unpaid dividends of $7.1 million. On the same day, Le Superclub Vidéotron Ltée used the total proceeds of $720.0 million to repay a portion of the subordinated loan contracted from Vidéotron Infrastructures Inc.
On October 18, 2013, Vidéotron Infrastructures inc. redeemed from Le Superclub Vidéotron Ltée 80,000 preferred shares, Class G, for a total cash consideration of $80.0 million, and settled cumulative unpaid dividends of $3.0 million. On the same day, Le Superclub Vidéotron Ltée used the total proceeds of $80.0 million to repay the outstanding portion of the subordinated loan contracted from Vidéotron Infrastructures Inc.
The above transactions were carried out for tax consolidation purposes of Quebecor Media Inc. and its subsidiaries, on terms equivalent to those that prevail in an arm’s length basis and accounted for at the consideration agreed between parties.
| 27. | PENSION PLANS AND POSTRETIREMENT BENEFITS |
The Corporation maintains various defined benefit and defined contribution plans. The Corporation also provides postretirement benefits to eligible retired employees, principally health care and cable services. The pension plans of the Corporation are registered with a Québec or federal regulatory authority.
The Corporation’s funding policy for its funded pension plans is to maintain its contribution at a level sufficient to cover benefits and to meet requirements of the applicable regulations and plan provisions that govern the funding of the plans. These provisions establish, among others, the future payment of amortization payments when the degree of solvability of the pension plans is less than 100% as defined by the relevant Québec and federal laws. Payments are determined by an actuarial report performed by an independent company at least every three years or annually, according to the applicable laws and in accordance with provisions of plans.
By their design, the defined benefit plans expose the Corporation to the typical risks faced by defined benefit plans, such as investment performance, changes to the discount rates used to value the obligation, longevity of plan participants, and future inflation. The administration of the plans is assured by pension committees composed of members of the plans, independent members of the Corporation’s management, or the Corporation in accordance with the provisions of the plans. Under the Corporation’s rules of governance, the approbation and oversight of the defined benefit plan policies are performed at different levels through the pension committees, the Corporation’s management, or the Audit Committee. The risk management of pension plans is also performed under the leadership of these committees at various levels. The custody of securities and management of securities transactions are assigned to trustees within a mandate given by the pension committee or the Corporation, as the case may be. Policies include those on investment objectives, risk mitigation strategies and the mandate to hire investment fund managers and monitor their work and performance. The benefit pension plans are monitored on an ongoing basis to assess the benefit, funding and investment policies, financial status, and the Corporation’s funding requirement.
F-50
Table of Contents
VIDEOTRON LTD.
NOTES TO CONSOLIDATED FINANCIAL STATEMENTS (continued)
Years ended December 31, 2014, 2013 and 2012
(tabular amounts in thousands of Canadian dollars, except for option data)
| 27. | PENSION PLANS AND POSTRETIREMENT BENEFITS (continued) |
The following tables show a reconciliation of the changes in the plans’ benefit obligations and the fair value of plan assets for the years ended December 31, 2014 and 2013:
| Pension benefits | Postretirement benefits | |||||||||||||||
| 2014 | 2013 | 2014 | 2013 | |||||||||||||
Change in benefit obligations | ||||||||||||||||
Benefit obligations at beginning of year | $ | 230,598 | $ | 227,484 | $ | 16,739 | $ | 20,839 | ||||||||
Service costs | 16,384 | 20,101 | 545 | 762 | ||||||||||||
Interest costs | 11,473 | 10,539 | 834 | 938 | ||||||||||||
Plan participants’ contributions | 7,600 | 7,896 | — | |||||||||||||
Actuarial loss (gain) arising from: | ||||||||||||||||
Demographic assumptions | 1,898 | 6,550 | (246 | ) | (602 | ) | ||||||||||
Financial assumptions | 48,327 | (28,652 | ) | 3,631 | (2,570 | ) | ||||||||||
Participant experience | 978 | (7,737 | ) | 10,478 | (2,426 | ) | ||||||||||
Benefits and settlements paid | (9,869 | ) | (9,701 | ) | (195 | ) | (202 | ) | ||||||||
Other | 2,005 | 4,118 | (169 | ) | — | |||||||||||
|
|
|
|
|
|
|
| |||||||||
Benefit obligations at end of year | $ | 309,394 | $ | 230,598 | $ | 31,617 | $ | 16,739 | ||||||||
|
|
|
|
|
|
|
| |||||||||
| Pension benefits | Postretirement benefits | |||||||||||||||
| 2014 | 2013 | 2014 | 2013 | |||||||||||||
Change in plan assets | ||||||||||||||||
Fair value of plan assets at beginning of year | $ | 234,614 | $ | 175,641 | $ | — | $ | — | ||||||||
Actual return on plan assets | 27,008 | 29,546 | — | — | ||||||||||||
Employer contributions | 23,767 | 27,114 | 195 | 202 | ||||||||||||
Plan participants’ contributions | 7,600 | 7,896 | — | — | ||||||||||||
Benefits and settlements paid | (9,869 | ) | (9,701 | ) | (195 | ) | (202 | ) | ||||||||
Other | 2,005 | 4,118 | — | — | ||||||||||||
|
|
|
|
|
|
|
| |||||||||
Fair value of plan assets at end of year | $ | 285,125 | $ | 234,614 | $ | — | $ | — | ||||||||
|
|
|
|
|
|
|
| |||||||||
F-51
Table of Contents
VIDEOTRON LTD.
NOTES TO CONSOLIDATED FINANCIAL STATEMENTS (continued)
Years ended December 31, 2014, 2013 and 2012
(tabular amounts in thousands of Canadian dollars, except for option data)
| 27. | PENSION PLANS AND POSTRETIREMENT BENEFITS (continued) |
As of December 31, 2014, the weighted average duration of defined benefit obligation was 23.7 years (22.5 years in 2013). The Corporation expects future benefit payments of $9.8 million in 2015.
The Corporation’s investment strategy for plan assets takes into account a number of factors, including the time horizon of the pension plans’ obligations and the investment risk. For each of the plans, an allocation range by asset class is developed whereby a mix of equities and fixed-income investments is used to optimize the risk-return profile of plan assets and to mitigate asset-liability mismatch. Plan assets are comprised of:
| 2014 | 2013 | |||||||
Equity securities: | ||||||||
Canadian | 25.1 | % | 25.9 | % | ||||
Foreign | 37.6 | 38.2 | ||||||
Debt securities | 37.0 | 34.2 | ||||||
Other | 0.3 | 1.7 | ||||||
|
|
|
| |||||
| 100.0 | % | 100.0 | % | |||||
|
|
|
| |||||
The fair value of plan assets is principally based on quoted prices in an active market. As of December 31, 2014, plan assets included shares of the ultimate parent corporation in the amount of $1.3 million ($1.1 million as of December 31, 2013).
Where funded plans have a net defined benefit asset, the Corporation determines if potential reductions in future contributions are permitted by applicable regulations. When a defined benefit asset is created, it cannot exceed the future economic benefit that the Corporation can expect to obtain from the asset. The future economic benefit represents the value of reductions in future contributions and expenses payable to the pension fund. It does not reflect gains that could be generated in the future that would allow reductions in contributions by the Corporation. When there is a minimum funding requirement, this could also limit the amount recognized in the balance sheet. A minimum funding requirement represents the present value of amortization payments based on the most recent actuarial financing reports filed.
The reconciliation of funded status to the net amount recognized in the consolidated balance sheets is as follows:
| Pension benefits | Postretirement benefits | |||||||||||||||
| 2014 | 2013 | 2014 | 2013 | |||||||||||||
Benefit obligations | $ | (309,394 | ) | $ | (230,598 | ) | $ | (31,617 | ) | $ | (16,739 | ) | ||||
Fair value of plan assets | 285,125 | 234,614 | — | — | ||||||||||||
|
|
|
|
|
|
|
| |||||||||
Plan (deficit) surplus | (24,269 | ) | 4,016 | (31,617 | ) | (16,739 | ) | |||||||||
Asset limit and minimum funding adjustment | — | (966 | ) | — | — | |||||||||||
|
|
|
|
|
|
|
| |||||||||
Net amount recognized1 | $ | (24,269 | ) | $ | 3,050 | $ | (31,617 | ) | $ | (16,739 | ) | |||||
|
|
|
|
|
|
|
| |||||||||
| 1 | The net amount recognized for 2014 consists of a liability of $55.9 million ($16.7 million in 2013) included in other liabilities (note 19). In 2013, an asset of $3.1 million was included in other assets (note 15). |
F-52
Table of Contents
VIDEOTRON LTD.
NOTES TO CONSOLIDATED FINANCIAL STATEMENTS (continued)
Years ended December 31, 2014, 2013 and 2012
(tabular amounts in thousands of Canadian dollars, except for option data)
| 27. | PENSION PLANS AND POSTRETIREMENT BENEFITS (continued) |
Components of re-measurements are as follows:
| Pension benefits | Postretirement benefits | |||||||||||||||||||||||
| 2014 | 2013 | 2012 | 2014 | 2013 | 2012 | |||||||||||||||||||
Actuarial (loss) gain on benefit obligations | $ | (51,203 | ) | $ | 29,839 | $ | (18,611 | ) | $ | (13,863 | ) | $ | 5,598 | $ | (1,616 | ) | ||||||||
Actual return on plan assets less interest income anticipated as part of the interest on net defined benefit liability | 16,134 | 22,284 | 9,155 | — | — | — | ||||||||||||||||||
Asset limit and minimum funding adjustment | 1,014 | (966 | ) | — | — | — | — | |||||||||||||||||
|
|
|
|
|
|
|
|
|
|
|
| |||||||||||||
Re-measurements recorded in other comprehensive income | $ | (34,055 | ) | $ | 51,157 | $ | (9,456 | ) | $ | (13,863 | ) | $ | 5,598 | $ | (1,616 | ) | ||||||||
|
|
|
|
|
|
|
|
|
|
|
| |||||||||||||
Components of the net benefit costs are as follows:
| Pension benefits | Postretirement benefits | |||||||||||||||||||||||
| 2014 | 2013 | 2012 | 2014 | 2013 | 2012 | |||||||||||||||||||
Employee costs: | ||||||||||||||||||||||||
Service costs | $ | 16,384 | $ | 20,101 | $ | 17,805 | $ | 545 | $ | 762 | $ | 654 | ||||||||||||
Other fees | 437 | 386 | 416 | — | — | — | ||||||||||||||||||
Interest on net defined benefit liability | 209 | 2,892 | 2,611 | 834 | 938 | 868 | ||||||||||||||||||
|
|
|
|
|
|
|
|
|
|
|
| |||||||||||||
Net benefit costs | $ | 17,030 | $ | 23,379 | $ | 20,832 | $ | 1,379 | $ | 1,700 | $ | 1,522 | ||||||||||||
|
|
|
|
|
|
|
|
|
|
|
| |||||||||||||
The expense related to defined contribution pension plans amounted to $10.8 million in 2014 ($10.0 million in 2013 and $8.7 million in 2012).
The expected employer contributions to the Corporation’s defined benefit pension plans and post-retirement benefits plans will be $22.7 million in 2015 based on the most recent financial actuarial reports filed (contributions of $24.0 million were paid in 2014).
F-53
Table of Contents
VIDEOTRON LTD.
NOTES TO CONSOLIDATED FINANCIAL STATEMENTS (continued)
Years ended December 31, 2014, 2013 and 2012
(tabular amounts in thousands of Canadian dollars, except for option data)
| 27. | PENSION PLANS AND POSTRETIREMENT BENEFITS (continued) |
Assumptions
The Corporation determines its assumption for the discount rate to be used for purposes of computing annual service and interest costs based on an index of high-quality corporate bond-yield and matched-funding yield curve analysis as of the measurement date.
The actuarial assumptions used in measuring the Corporation’s benefit obligations as of December 31, 2014, 2013 and 2012 and current periodic benefit costs are as follows:
| Pension benefits | Postretirement benefits | |||||||||||||||||||||||
| 2014 | 2013 | 2012 | 2014 | 2013 | 2012 | |||||||||||||||||||
Benefit obligations | ||||||||||||||||||||||||
Rates as of year-end: | ||||||||||||||||||||||||
Discount rate | 4.10 | % | 4.90 | % | 4.40 | % | 4.10 | % | 4.90 | % | 4.40 | % | ||||||||||||
Rate of compensation increase | 3.25 | 3.25 | 3.50 | 3.00 | 3.00 | 3.25 | ||||||||||||||||||
Current periodic costs | ||||||||||||||||||||||||
Rates as of preceding year-end: | ||||||||||||||||||||||||
Discount rate | 4.90 | % | 4.40 | % | 4.75 | % | 4.90 | % | 4.40 | % | 4.75 | % | ||||||||||||
Rate of compensation increase | 3.25 | 3.50 | 3.50 | 3.00 | 3.25 | 3.50 | ||||||||||||||||||
The assumed average retirement age of participants used was of 62 years in 2014, 2013 and 2012.
The assumed health care cost trend rate used in measuring the accumulated postretirement benefit obligations was 7.4% at the end of 2014. These costs, as per the estimate, are expected to decrease gradually over the next 12 years to 5.0% and to remain at that level thereafter.
Sensitivity analysis
A decrease of 10 basis points in the discount rate would have had the following impacts, before income tax, for the year ended December 31, 2014:
| Pension benefits | Postretirement benefits | |||||||||||||||||||||||
Increase (decrease) | Obligation in balance sheet | Income | Other comprehensive income | Obligation in balance sheet | Income | Other comprehensive income | ||||||||||||||||||
Discount rate | $ | 7,022 | $ | (880 | ) | $ | (7,022 | ) | $ | 757 | $ | (15 | ) | $ | (757 | ) | ||||||||
There are limitations to the above sensitivity analysis since it only considers the impacts of a decrease of 10 basis points in the discount rate assumption (at the beginning of the year having an impact on income and at the end of the year having an impact on comprehensive income) without changing any other assumptions. No sensitivity analysis was performed on other assumptions as a similar change to these assumptions would not have a significant impact on the consolidated financial statements.
F-54
Table of Contents
VIDEOTRON LTD.
NOTES TO CONSOLIDATED FINANCIAL STATEMENTS (continued)
Years ended December 31, 2014, 2013 and 2012
(tabular amounts in thousands of Canadian dollars, except for option data)
| 28. | SUBSEQUENT EVENTS |
In January 2015, the Corporation entered into new unsecured on demand credit facilities, under which letters of credit were issued and filed with Industry Canada as pre-auction financial deposits in respect to its application to participate to the 2500 MHz and AWS-3 spectrum auctions. Under Industry Canada’s published rules respecting restrictions on communications during the auction process, it is strictly forbidden for the Corporation to disclose the amount of the letters of credit, which can be withdrawn by the Corporation at any time prior to the auction commencement. On March 6, 2015, the Corporation announced that it had acquired four 30 MHz licences in the auction forAWS-3 commercial mobile spectrum at a total price of $31.8 million. The process will resume on April 14, 2015 with the auction for spectrum in the 2500 MHz band.
On February 5, 2015, the Corporation contracted a subordinated loan of $1.01 billion from Quebecor Media Inc., bearing interest at a rate of 10.75%, payable every six months on June 20 and December 20 and maturing on February 5, 2045. On the same day, the Corporation invested the total proceeds of $1.01 billion into 1,010,000 preferred shares, Series B, of 9101-0835 Québec Inc., a subsidiary of Quebecor Media Inc. These shares carry the right to receive an annual dividend of 10.85%, payable semi-annually.
On March 6, 2015, the Québec Court of Appeal ruled in favour of Videotron and TVA Group, an affiliated corporation, and ordered Bell ExpressVu Limited Partnership (“Bell ExpressVu”), a subsidiary of Bell, to pay compensation totalling $136.0 million for having deliberately neglected to implement an appropriate security system to prevent piracy of the signals broadcast by its satellite television service between 1999 and 2005. The judgement stated that Bell ExpressVu knew and must have foreseen that this practice would cause serious harm to its competitors, including the Corporation, its main rival in Québec.
On March 11, 2015, the Corporation issued a notice of redemption for all of its outstanding 6.375% Senior Notes due December 15, 2015 in aggregate principal amount of US$175.0 million at a redemption price of 100.000% of their principal amount. The redemption date is April 10, 2015.
F-55