Service Corporation International Investor Presentation June 17, 2013 $425 million Senior Unsecured Notes These materials are not to be printed, downloaded or distributed. These materials are only available to QIBs and non-]US persons. NYSE: SCI North America's largest provider of funeral, cemetery and cremation services |
Forward-Looking Statements This presentation is not a prospectus and is not an offer to sell securities. The securities described herein are not being registered under the US Securities Act of 1933, as amended (the "Act"), and are being offered only to Qualified Institutional Buyers as defined in Rule 144A under the Act and to certain y non-]U.S. persons in offshore transactions in reliance on Regulation S under the Act. Information set forth in this release contains forward-]looking statements, which involve a number of risks and uncertainties. Readers are cautioned that any forward-]looking information is not a guarantee of future performance and that actual results could differ materially from those contained in the forward-]looking information. Such forward-]looking statements include, but are not limited to, statements about the benefits of the business combination transaction involving SCI and Stewart Enterprises, including future financial and operating results, the combined company's plans, objectives, synergies, expectations and intentions and other statements that are not historical facts. These forward-]looking statements are made only as of the date hereof. The following factors, among others, could cause actual results to differ from those set forth in the forwardlooking statements: the ability to obtain regulatory approvals of the transaction on the proposed terms and schedule; the failure of Stewart Enterprises' shareholders to approve the transaction; the risk that the businesses will not be integrated successfully; divestitures that may be required in connection with obtaining antitrust approvals for the transaction; the risk that the cost savings and any other synergies from the transaction may not be fully realized or may take longer to realize than expected; disruption from the transaction making it more difficult to maintain relationships with customers, employees or suppliers. Additional factors that may affect future results are contained in SCI's filings with the SEC, which are available at www.sci-]corp.com. SCI disclaims any update and revise statements contained in these materials based on new information or These materials are not to be printed, downloaded or distributed. These materials are only available to QIBs and non-]US persons. obligation to otherwise. 2 |
Speakers Service Corporation International - Tom Ryan, President, Chief Executive Officer and Director - Eric Tanzberger, Senior Vice President, Chief Financial Officer and Treasurer - Aaron Foley, Managing Director and Assistant Treasurer These materials are not to be printed, downloaded or distributed. These materials are only available to QIBs and non-US persons. 3 |
Agenda - Financing overview - Acquisition highlights - Company overview - Financial overview - Appendix These materials are not to be printed, downloaded or distributed. These materials are only available to QIBs and non-]US persons. 4 |
Service Corporation International Financing overview These materials are not to be printed, downloaded or distributed. These materials are only available to QIBs and non-]US persons. NYSE: SCI North America's largest provider of funeral, cemetery and cremation services |
Summary of terms and conditions Senior Unsecured Notes Issuer: Service Corp. International (the "Company") Principal Amount: $425 million Issue: Senior unsecured notes Distribution: 144A with registration rights Security: None Guarantors: None Use of Proceeds: Finance the Acquisition, refinance certain indebtedness and pay fees and expenses associated with the Acquisition Maturity: 8.5 years Call Protection: NC4; In first year post non-call period, callable at par plus 50% of coupon, which premium will step down ratably annually to par Mandatory Redemption: "Change of Control" put at 101% plus accrued interest Covenants: Substantially similar to 4.50% senior y unsecured notes due November 2020 Coupon Frequency: Semi-annual Joint Bookrunners: J.P. Morgan Securities LLC, Merrill Lynch, Pierce, Fenner & Smith Incorporated and Wells Fargo Securities, LLC Senior Co-manager: SunTrust Robinson Humphrey, Inc. Co-managers: BBVA Compass Securities and Scotia Capital Escrow: Proceeds deposited in escrow until satisfaction of escrow conditions. If escrow conditions are not, or cannot, be satisfied by February 28, 2014, proceeds will be used to redeem the notes at 100% of the initial offering price, plus accrued and unpaid interest These materials are not to be printed, downloaded or distributed. These materials are only available to QIBs and non-US persons. 6 |
Transaction timeline June 2013 July 2013 S M T W T F S S M T W T F S 1 1 2 3 4 5 6 2 3 4 5 6 7 8 7 8 9 10 11 12 13 9 10 11 12 13 14 15 14 15 16 17 18 19 20 16 17 18 19 20 21 22 21 22 23 24 25 26 27 23 24 25 26 27 28 29 28 29 30 31 30 Execution event Market holiday Date Event June 17th - Announce notes offering, - Price offering July 1st - Issue and settle new notes (T +10 BD) Late Q4 2013 / Early Q1 20141 - Funds release from escrow to fund acquisition 1 Subject to HSR review These materials are not to be printed, downloaded or distributed. These materials are only available to QIBs and non-US persons. 7 |
Sources & uses and combined capitalization Sources Amount 
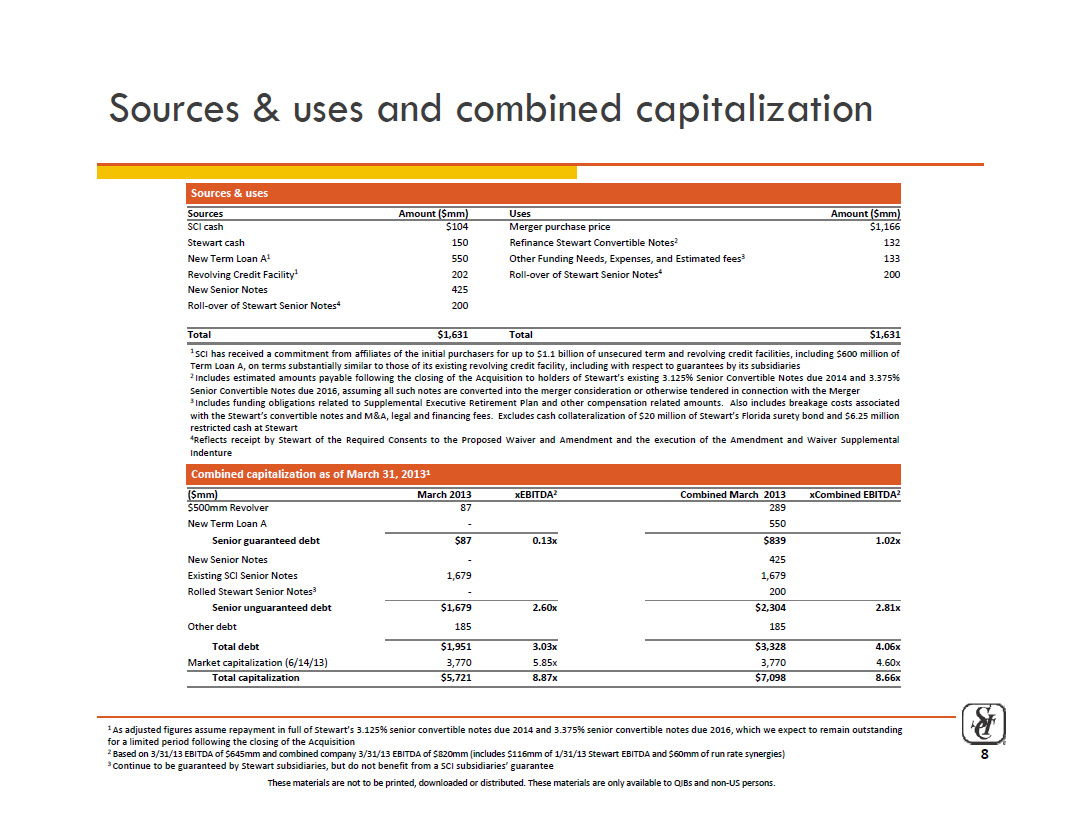
($mm) Uses Amount ($mm) SCI cash $104 Merger purchase price $1,166 Stewart cash 150 Refinance Stewart Convertible Notes2 132 New Term Loan A1 550 Other Needs Expenses fees3 133 
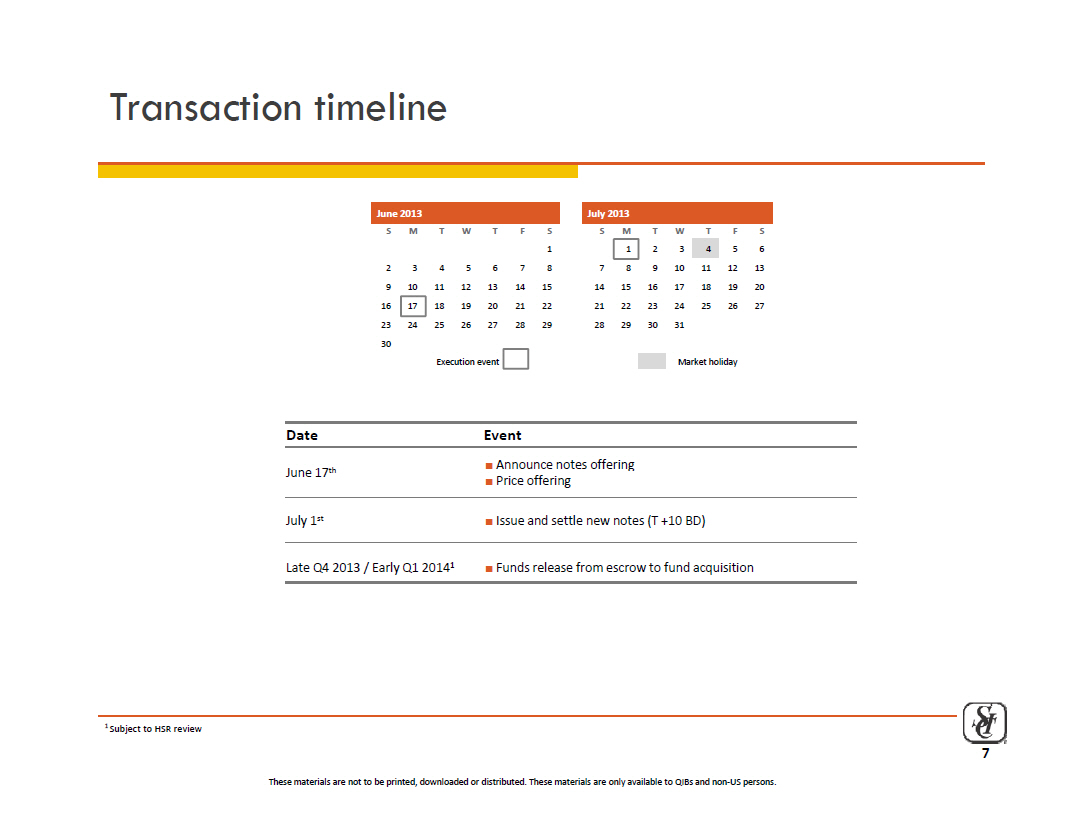
Sources & uses A Funding Needs, Expenses, and Estimated fees Revolving Credit Facility1 202 Roll-over of Stewart Senior Notes4 200 New Senior Notes 425 Roll-over of Stewart Senior Notes4 200 Total $1,631 Total $1,631 1 SCI has received a commitment from affiliates of the initial purchasers for up to $1.1 billion of unsecured term and revolving credit facilities, including $600 million of Term Loan A on terms substantially similar A, to those of its existing revolving credit facility, including with respect to guarantees by its subsidiaries 2 Includes estimated amounts payable following the closing of the Acquisition to holders of Stewart's existing 3.125% Senior Convertible Notes due 2014 and 3.375% Senior Convertible Notes due 2016, assuming all such notes are converted into the merger consideration or otherwise tendered in connection with the Merger 3 Includes funding obligations related to Supplemental Executive Retirement Plan and other compensation related amounts. Also includes breakage costs associated with the Stewart's convertible notes and M&A, legal and financing fees. Excludes cash collateralization of $20 million of Stewart's Florida surety bond and $6.25 million restricted cash at Stewart 4Reflects receipt by Stewart of the Required Consents to the Proposed Waiver and Amendment and the execution of the Amendment and Waiver Supplemental Indenture Combined capitalization as of March 31 20131 ($mm) March 2013 xEBITDA2 Combined March 2013 xCombined EBITDA2 $500mm Revolver 87 289 New Term Loan A - 550 Senior guaranteed debt $87 0.13x $839 1.02x New Senior Notes - 425 Existing 1,679 1,679 31, SCI Senior Notes Rolled Stewart Senior Notes3 - 200 Senior unguaranteed debt $1,679 2.60x $2,304 2.81x Other debt 185 185 Total debt $1,951 3.03x $3,328 4.06x Market capitalization (6/14/13) 3,770 5.85x 3,770 4.60x Total capitalization $5,721 8.87x $7,098 8.66x 1 As adjusted figures assume repayment in full of Stewart's 3.125% senior convertible notes due 2014 and 3.375% senior convertible notes due 2016, which we expect to remain outstanding for a limited period following the closing of the Acquisition 2 Based on 3/31/13 EBITDA of $645mm and combined company 3/31/13 EBITDA of $820mm (includes $116mm of 1/31/13 Stewart EBITDA and $60mm of run rate synergies) 3 Continue to be guaranteed by Stewart subsidiaries, but do not benefit from a SCI subsidiaries' guarantee These materials are not to be printed, downloaded or distributed. These materials are only available to QIBs and non-US persons. 8 |
Combined debt maturity profile Existing debt maturity profile ($mm) $1,000 Senior notes Letters of credit Credit facility borrowings Credit facility availability $ $382 $300 $400 $500 $600 $700 $800 $900 7.500% 8.000% Senior S i 4.500% Senior 7.000% Senior N t 7.625% Senior Notes 7.000% Senior Notes 6.750% Senior $500mm RC facility $136 $197 $295 $250 $250 $200 $150 $200 $32 87 $0 $100 $200 2013 2014 2015 2016 2017 2018 2019 2020 2021 2022 2027 Senior Notes Notes Notes Notes Notes Combined permanent debt maturity profile ($mm) $296 $148 $ 700 $800 $900 $1,000 $1,100 $1,200 Senior notes New TLA Stewart senior notes Letters of credit Credit facility borrowings Credit facility availability New senior notes 6.500% Stewart 1 $500mm RC facility New $425mm of senior notes 2 $136 $197 $295 $250 $250 $200 $150 $200 $28 $55 $55 $83 $330 $200 $56 $425 $0 $100 $200 $300 $400 $500 $600 2013 2014 2015 2016 2017 2018 2019 2020 2021 2022 2027 7.500% Senior Notes 8.000% Senior 7.000% Notes Senior Notes 7.625% Senior Notes 7.000% Senior Notes 6.750% Senior Notes Senior Notes 4.500% Senior 6.750% Notes Senior Notes Note: Excludes capital leases and other debt 1 New term loan A scheduled amortization per year: 5% / 10% / 10% / 15% / 15% 2 Contingent on successful best efforts syndication; if not successful, RC will mature in 2016 These materials are not to be printed, downloaded or distributed. These materials are only available to QIBs and non-US persons. 9 |
Service Corporation International Acquisition highlights These materials are not to be printed, downloaded or distributed. These materials are only available to QIBs and non-US persons. NYSE: SCI North America's largest provider of funeral, cemetery and cremation services |
Transaction overview - On May 29, 2013, Service Corporation International ("SCI" or the "Company") announced a definitive agreement to acquire all of the outstanding shares of Class A and Class B common stock Enterprises of Stewart Enterprises, Inc. ("Stewart") for $13.25 in cash, per share - Acquisition valued at $1.2 billion, or approximately $1.4 billion inclusive of cash and debt acquired - Transaction subject to customary closing conditions, which include the approval of Stewart's shareholders of their Class A common stock and the expiration of the waiting period under the Hart-]Scott-]Rodino Antitrust Act - Frank Stewart and certain of his affiliates have entered into a voting agreement to support the transaction - Acquisition not anticipated to close until end of year 2013 or early 2014 - No expected impact to normalized financial outlook for 2013; any costs incurred as a result of the transaction will be considered one-]time and removed from normalized earnings per share and adjusted cash flow from operations These materials are not to be printed, downloaded or distributed. These materials are only available to QIBs and non-]US persons. 11 |
Strategic rationale - Complementary geographic fit in a highly fragmented industry and established platform in attractive metropolitan markets - Further promotes our operational and preneed sales initiatives at a time when we believe the Baby Boomer impact is beginning to take effect - Stewart has leadership positions in many of their markets; strong local scale with significant volume through each location further leverages back-office costs - Compelling and opportunistic use of capital to accelerate long-term strategies and enhance shareholder value - Immediately accretive to adjusted cash flow from operations and normalized earnings per share, excluding one-time implementation and closing costs - Compelling return on investment that meaningfully exceeds our weighted average cost of capital - Attractive and tangible synergies - Favorable financing opportunities These materials are not to be printed, downloaded or distributed. These materials are only available to QIBs and non-US persons. 12 |
A look at the combined company SCI Stewart Post Synergy LTM LTM Combined Estimated Combined 3/31/13 1/31/13 Company Synergies Company1 -------------------------------------------------------------------------- Revenues (in millions) $2,459 $527 $2,986 Operating Income (in millions) $427 $87 $514 Operating Margin 17.4% 16.5% 17.2% Adjusted EBITDA (in millions) $645 $116 $760 $60 $820 Preneed Backlog (in billions) $7.5 $1.7 $9.2 Number of Funeral Homes 1,437 217 1,654 Number of Cemeteries 374 141 515 Total Operating locations 1,811 358 2,169 Total Combination Operations (included in above) 213 69 282 Employees (at fiscal year end 2012) 20,567 4,800 25,367 1 Combined Company does not reflect divestitures that may be required by regulatory agencies Adjusted EBITDA and Operating Margin are non-GAAP financial measures. Please see slides 31-32 for a reconciliation of Adjusted EBITDA to the appropriate GAAP measure and for other disclosures. The combined information does not include the impact of any divestitures which may be required in order to consummate the transaction. These materials are not to be printed, downloaded or distributed. These materials are only available to QIBs and non-US persons. 13 |
Significant synergies We expect to realize approximately $60 million in annual cost savings from the combined company within 24 months of closing - Synergy opportunities are significant - Reduced back-office systems and infrastructure costs - Elimination of duplicative public company and management structure costs - Improved purchasing power through greater scale - $60 million of synergies represent 11.4% of Stewart's revenues - To achieve these synergies, we expect to incur one-time cash costs of approximately $30 million spread over a 2 year period We have a proven track record of successfully integrating large acquisitions and delivering on or exceeding their expected synergies These materials are not to be printed, downloaded or distributed. These materials are only available to QIBs and non-US persons. 14 |
Service Corporation International Company overview These materials are not to be printed, downloaded or distributed. These materials are only available to QIBs and non-]US persons. NYSE: SCI North America's largest provider of funeral, cemetery and cremation services |
SCI at a glance - Founded in 1962, we are the largest company in the North American funeral and cemetery industry with more than 1,800 locations - NYSE: SCI with a market cap of ~$3.8 billion - LTM Mar-13 revenues of $2.5 billion or ~13% share of industry revenues - Backlog of future revenues of $7.5 billion or 3x annual revenues - Primarily supported by cash in regulated trust funds or 3rd party life insurance policies - Robust and consistent free cash flow1 - Generated greater than $250 million of free cash flow since 2009 with $310 million in the LTM period ended Mar-13 - Free cash flow used to enhance shareholder value through strategic acquisitions, share repurchases and dividends, while also managing debt maturity profile - Poised to benefit from aging of America 1 Defined as Net Operating Cash Flow less capital expenditures These materials are not to be printed, downloaded or distributed. These materials are only available to QIBs and non-US persons. 16 |
Investment highlights - Predominant player in stable funeral and cemetery industry - Unparalleled network and scale - Significant and consistent cash flows - Strong liquidity, financial flexibility and favorable debt maturity profile - Disciplined and focused capital allocation strategy - Differential growth strategies that are not capital intensive - Attractive demographic trends These materials are not to be printed, downloaded or distributed. These materials are only available to QIBs and non-]US persons. 17 |
Our competitive strengths - Unparalleled network - 1,437 funeral homes & 374 cemeteries (57% combos*) - 43 states and 8 Canadian provinces - Multi-]brand portfolio: key brand called Dignity Memorial(R) - Ability to leverage scale - Sharing of personnel, vehicles and other resources - Centralized or outsourced operating and accounting functions - Purchasing power - Preneed sales opportunity - Premier education platform for our ~21 000 employees *SCI has 213 combos which means 57% of our cemeteries has a funeral home located on the cemetery grounds creating additional synergies and added convenience for customers. 21,000 These materials are not to be printed, downloaded or distributed. These materials are only available to QIBs and non-]US persons. 18 |
Deathcare Industry landscape All data as based on most recent trailing 12 months SCI $2,459 Revenues (In millions) Public Consolidators = 18% Independent = 82% Stewart $527 StoneMor $194 Carriage $204 Properties SCI $1,811 - Cemeteries - Funeral homes Stewart $357 StoneMor $368 Carriage $200 Free Cash Flow1 (In millions) SCI $310 Stewart $57 StoneMor $21 Carriage $15 Total Preneed Backlog (In millions) SCI $7,300 Stewart $1,692 StoneMor $485 Carriage $463 1Defined as net operating cash flow less capital expenditures Free cash flow is a non-GAAP financial measure. Our peer companies may not use the measure Free cash flow, or if they do, they may not calculate it in the same way that we do. The numbers above are based on public disclosures and are calculated, to the extent we can determine, in the same manner that we calculate Free cash flow. These materials are not to be printed, downloaded or distributed. These materials are only available to QIBs and non-US persons. 19 |
Favorable demographic trends In 2011, the 60+ population was 18.5% and is projected to exceed 25% by 2030 25.7% 100,000 30% Population in Thousands % of total population 20.8% 23.1% 24.9% 75,000 25% Age 60 and over First "Baby Boomers" reached age 60 in 2006 15.7% 16.8% 15.7% 18.5% 15% 20% 25,000 50,000 Age 60 and over 10% 1980 1990 2000 2011 2015E 2020E 2025E 2030E 0 1980 1990 2000 2011 2015E 2020E 2025E 2030E Source: U.S. Census Bureau These materials are not to be printed, downloaded or distributed. These materials are only available to QIBs and non-US persons. 20 |
Preneed cemetery sales production is the primary driver of growth over the near term We anticipate growth in the mid to high single digit % range for 2013 Preneed Production Cemetery Growth1 6.0% 2010 12.3% 2011 10.2% 2012 6.7% Q1 13 1 Preneed cemetery production growth is based on same stores as reported Growing preneed is our key sales internal growth initiative - PAF and Cemetery Heritage Sales are the two major levers which allow us to control our success; the rest of our business and our is dependent upon current year mortality ability to prudently manage our costs - Investing nearly $250 million annually to further enhance our focus on sales growth - Because of our size and scale, we believe we have the greatest "game changing" opportunity of any company in the profession - Expanding the number of sales counselors - Training and development aimed at increasing sales counselor productivity - Generating quality leads through targeted direct mail, select media advertising, seminars, and the internet - Maximizing opportunity created by the aging population These materials are not to be printed, downloaded or distributed. These materials are only available to QIBs and non-US persons. 21 |
On the funeral side, we are mitigating soft volumes by increasing the average sale and by growing backlog Change in Funeral Volume/Sales Average1 Volume Average 1.0% 1.8% 2.2% 4.3% 1.1% (1.9%) (2.5%) (2.0%) 2010 2011 2012 Q1 13 Preneed Funeral Production Growth 8.4% 7.0% 3.6% 5.2% 2010 2011 2012 Q1 13 1 Funeral volume and average growth are based on same stores as reported These materials are not to be printed, downloaded or distributed. These materials are only available to QIBs and non-US persons. 22 |
Service Corporation International Financial overview NYSE: SCI North America's largest provider of funeral, cemetery and cremation services These materials are not to be printed, downloaded or distributed. These materials are only available to QIBs and non-US persons. |
SCI historical financial overview Revenue ($mm) $2,156 $2,054 $2,191 $2,316 $2,410 $ 1,800 $ 2,000 $ 2,200 $ 2,400 $ 2,600 2008A 2009A 2010A 2011A 2012A Adjusted EBITDA ($mm) $509 $505 $539 $576 $618 $0 200 $400 $600 $800 2008A 2009A 2010A 2011A 2012A Adjusted EBITDA less capex ($mm) $355 $421 $441 $458 $502 $0 $200 $400 $600 2008A 2009A 2010A 2011A 2012A Free cash flow ($mm) $196 $288 $256 $270 $254 $400 $300 $200 $100 $0 2008A 2009A 2010A 2011A 2012A Note: Free cash flow defined as net operating cash flow from operations less capital expenditures Note: SCI's fiscal year end is December 31 Free cash flow is a non-GAAP financial measure These materials are not to be printed, downloaded or distributed. These materials are only available to QIBs and non-US persons. 24 |
Stewart historical financial overview Revenue ($mm) $526 $486 $500 $513 $516 $460 $480 $500 $520 $540 2008A 2009A 2010A 2011A 2012A Adjusted EBITDA ($mm) $111 $90 $98 $103 $110 $0 $40 $80 $120 2008A 2009A 2010A 2011A 2012A Adjusted EBITDA less capex ($mm) $100 $80 $60 $40 $20 $0 $84 $69 $82 $76 $89 2008A 2009A 2010A 2011A 2012A Free cash flow ($mm) $0 $20 $40 $60 $80 $58 $64 $47 $60 $56 2008A 2009A 2010A 2011A 2012A Note: Free cash flow defined as cash flow from operations less capital expenditures Note: Stewart's fiscal year end is October 31 Free cash flow is a non-GAAP financial measure These materials are not to be printed, downloaded or distributed. These materials are only available to QIBs and non-US persons. 25 |
SCI has a track record of successful synergy realization KEY SYNERGIES ($ millions) Category Stand-alone costs1 Est. synergies Est. savings2 % of LTM sales3 Alderwoods Transaction Administration and Facilities 5.5 3.3 0.4% Asset management/Corp Dev. $1.2 $0.6 50% 0.1% Executive and bonuses $12.5 $10.0 80% 1.3% Finance and Accounting $17.5 $13.2 75% 1.8% HR and Payroll $4.0 $2.0 50% 0.3% IT & Process Improvement $16.3 $12.2 75% 1.6% Legal and Governance $10.7 $7.5 70% 1.0% Marketing $1.4 -- -- -- Operations and Support $27.2 $16.3 60% 2.2% Total $96.3 $65.1 68% 8.7% Actual synergies achieved $95.0 99% 12.7% Stewart Transaction Administration and Facilities $1.3 $1.2 93% 0.2% Asset management/Corp Dev. $1.2 $1.2 100% 0.2% Executive and bonuses $5.1 $3.9 76% 0.7% Finance and Accounting $11.7 $10.4 89% 2.0% HR and Payroll $7.0 $3.7 52% 0.7% IT & Process Improvement $10.8 $8.2 76% 1.6% Legal and Governance $2.3 $2.0 87% 0.4% Marketing $4.8 $2.8 58% 0.5% Operations and Support $39.9 $16.6 42% 3.1% Total $84.0 $50.0 59% 9.4% Purchasing synergies $10.0 1.9% Total estimated synergies $60.0 11.3% We have a proven track record of successfully integrating large acquisitions and delivering on or exceeding its expected synergies Source: SCI Management estimates 1 Reflects the identified duplicative costs that could potentially be eliminated 2 % of estimated savings costs 3 Based on LTM sales of Alderwoods of $749mm and Stewart of $530mm at time of announcement These materials are not to be printed, downloaded or distributed. These materials are only available to QIBs and non-US persons. 26 |
Immediate de-leveraging post Alderwoods transaction Net Debt PF LTM EBITDA Compliance Net Leverage Alderwoods acquisition closed in November 2006 $ in millions $2,012 $1,881 $1,800 $1,738 $1,776 4.2x Q3 2006 leverage impacted by larger than usual cash balance 3.6x 3.5x 3 4 SCI cash: $637 earmarked for pending acquisition $733 $418 $481 $525 $509 $515 $513 3.4x 3.5x Q3 2006 Q4 2006 Q1 2007 Q2 2007 Q3 2007 Q4 2007 1.8x Source: SCI's credit agreement and compliance certificates 1 Defined as total debt plus letters of credit less cash in excess of $25 million divided by LTM EBITDA These materials are not to be printed, downloaded or distributed. These materials are only available to QIBs and non-US persons. 27 |
Financial policy - we anticipate quickly returning to targeted leverage ratios - We anticipate our leverage to increase to approximately 4.0x on a net debt/EBITDA basis. But, similar to the Alderwoods transaction, we anticipate returning to targeted leverage ratios between 3.0x - 3.5x using strong cash flows and anticipated divestiture proceeds - We believe the strong cash flows and balance sheet of the combined company will facilitate rapid de-leveraging post-close - We will remain focused on de-leveraging post-close until target levels are achieved. We expect to maintain a balanced approach of investing in our business and returning capital to shareholders while also supporting a prudent capital structure - We anticipate the continuation of our regular quarterly cash dividend - On May 8, 2013, our board increased quarterly dividend by 17% to 7 cents These materials are not to be printed, downloaded or distributed. These materials are only available to QIBs and non-US persons. 28 |
Service Corporation International Questions and Answers NYSE: SCI North America's largest provider of funeral, cemetery and cremation services These materials are not to be printed, downloaded or distributed. These materials are only available to QIBs and non-US persons. |
Service Corporation International Appendix NYSE: SCI North America's largest provider of funeral, cemetery and cremation services These materials are not to be printed, downloaded or distributed. These materials are only available to QIBs and non-US persons. |
EBITDA & Adjusted EBITDA - We use EBITDA as an underlying operational performance measure of the continuing operations of the business and to have a basis to compare underlying operating results to prior and future periods - To calculate EBITDA we make adjustments EBITDA, to net income (a GAAP measure) to remove provision for income taxes, interest expense and depreciation and amortization expense - Adjusted EBITDA is a financial measure calculated in accordance with our credit agreement, and represents EBITDA further adjusted to reflect the impact of: - Gains or losses on the early extinguishment of debt - Gains or losses on divestitures and impairment charges, net - Non-cash stock compensation expenses - Other operating income, net - Acquisitions and dispositions - Other non-recurring expenses - We believe that EBITDA and Adjusted EBITDA provide investors and lenders with additional information to measure our financial performance and evaluate our ability to service debt - Our calculations of EBITDA and Adjusted EBITDA are non-GAAP measures and are not necessarily comparable to other similarly titled measures of other companies. In addition, EBITDA and Adjusted EBITDA do not include interest expense and the replacement costs of assets, both of which can impact its ability to generate profits and cash flows These materials are not to be printed, downloaded or distributed. These materials are only available to QIBs and non-US persons. 31 |
EBITDA and Adjusted EBITDA reconciliation (in millions) SCI LTM at March 31, 2013 STEWART LTM at January 31, 2013 2012 Q1 12 Q1 13 LTM 2012 Q1 12 Q1 13 LTM Net income $152.5 $48.0 $57.6 $162.1 $35.9 $8.5 $15.5 $42.9 Provision for income taxes 91.5 23.1 35.3 103.7 18.0 4.5 5.1 18.6 Interest expense 135.1 33.6 32.8 134.3 23.4 5.9 5.9 23.4 Depreciation and amortization 189.1 45.3 45.2 189.0 26.4 6.6 6.5 26.3 EBITDA $568.2 $150.0 $170.9 $589.1 $103.7 $25.5 $33.0 $111.2 Loss on early extinguishment of debt 22.7 - - 22.7 - - - - Non-cash stock compensation expenses 11.0 2.6 2.8 11.2 3.4 1.1 1.0 3.3 Acquisition, restructuring and system transition costs 9.1 - 2.3 11.4 3.8 - 0.2 4.0 (Gain) Loss on divestitures 1.5 0.5 1.0 2.0 (0.4) (0.3) (0.7) (0.8) Other 5.4 (1.2) 1.6 8.2 (1.1) - (1.0) (2.1) Adjusted EBITDA $617.9 $151.9 $178.6 $644.6 $109.4 $26.3 $32.5 $115.6 These materials are not to be printed, downloaded or distributed. These materials are only available to QIBs and non-US persons. 32 |