Free signup for more
- Track your favorite companies
- Receive email alerts for new filings
- Personalized dashboard of news and more
- Access all data and search results
Filing tables
SCI similar filings
- 19 May 14 Submission of Matters to a Vote of Security Holders
- 14 May 14 Service Corporation International Declares Quarterly Cash Dividend
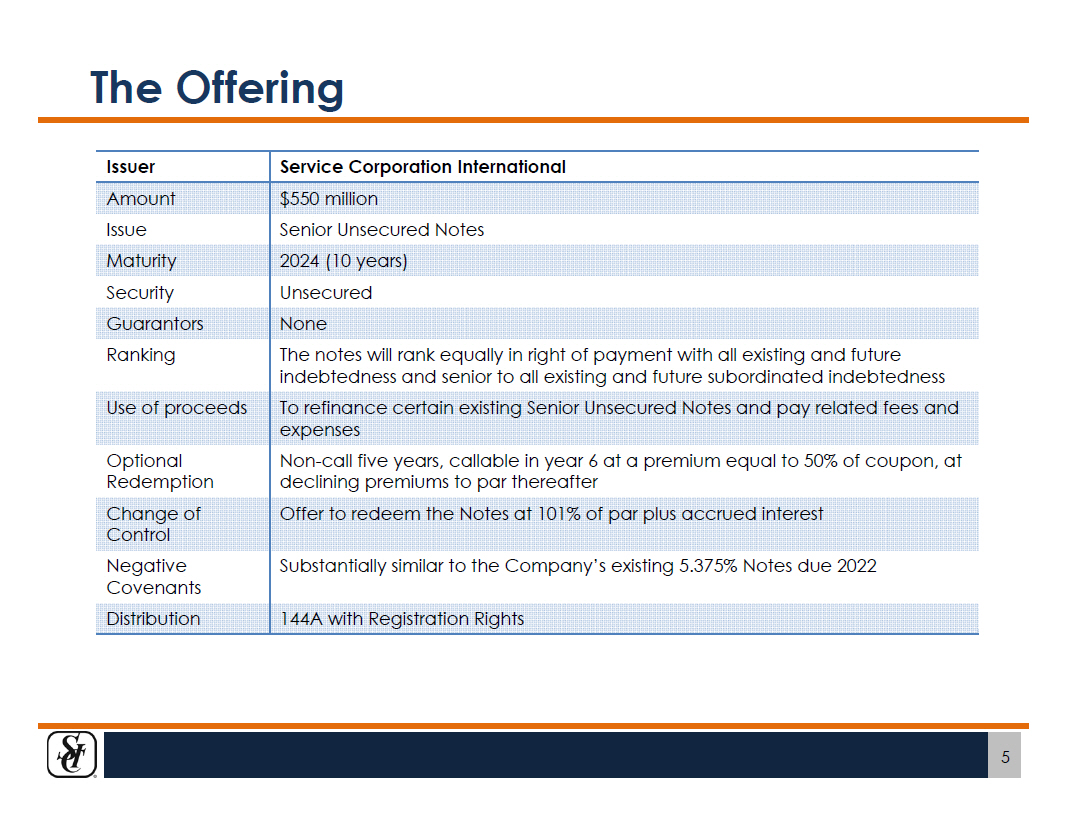
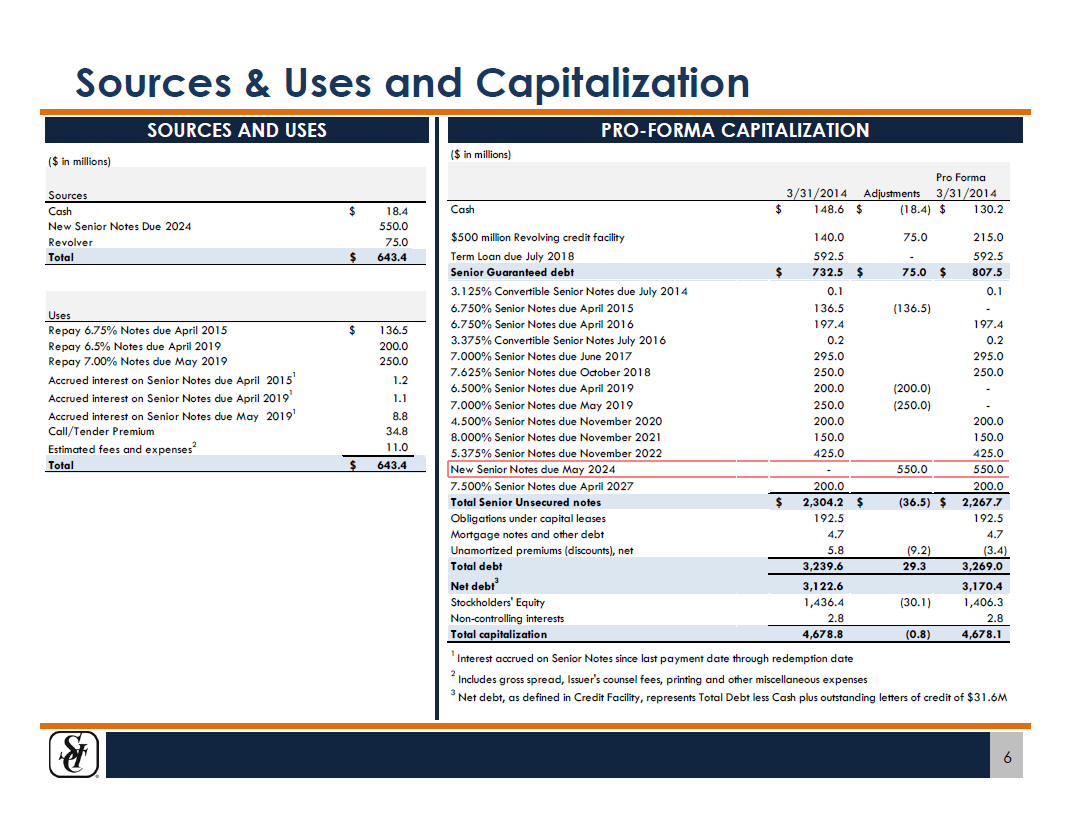
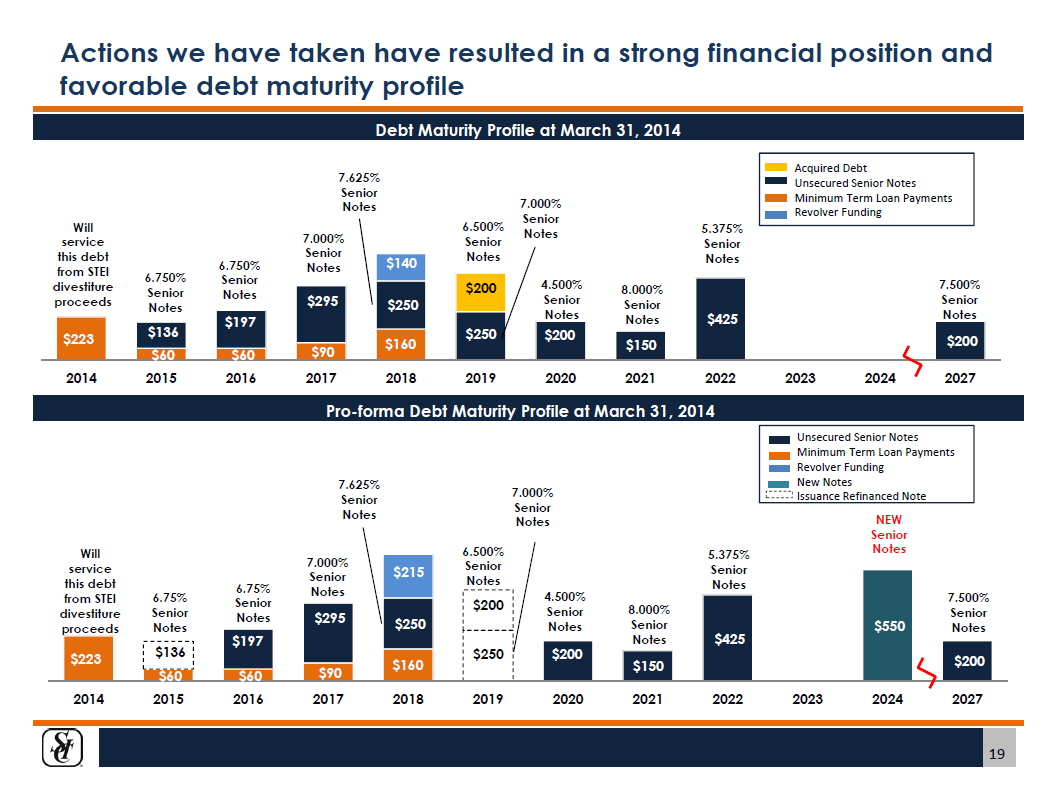
- 12 May 14 Service Corporation International Completes Private Offering of $550 million of 5.375% Senior Notes due 2024
- 29 Apr 14 Regulation FD Disclosure
- 28 Apr 14 Service Corporation International Announces Private Offering of $550 Million of Senior Notes
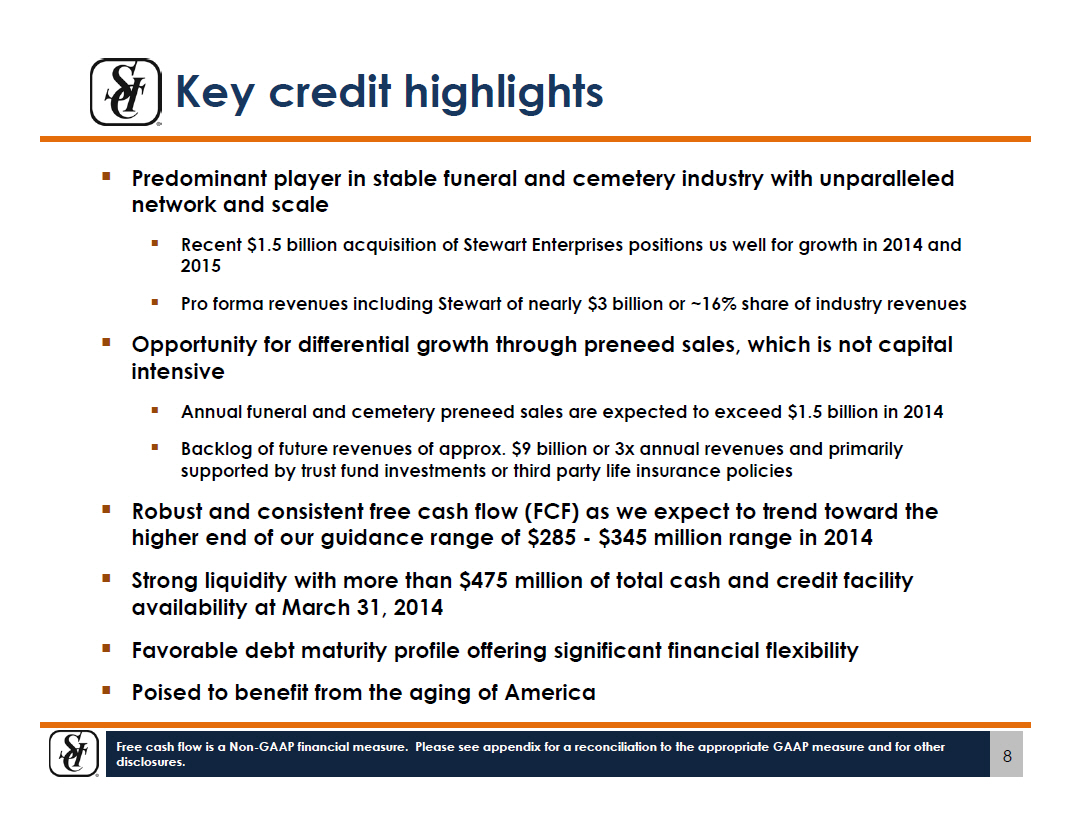
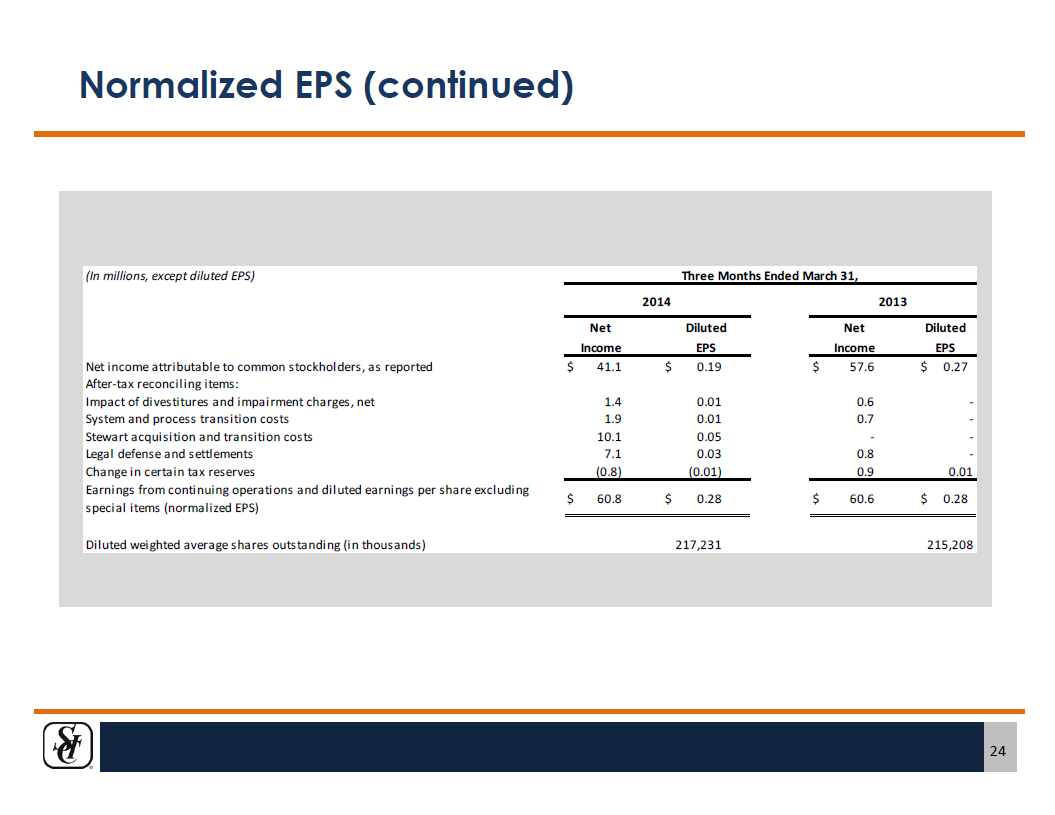
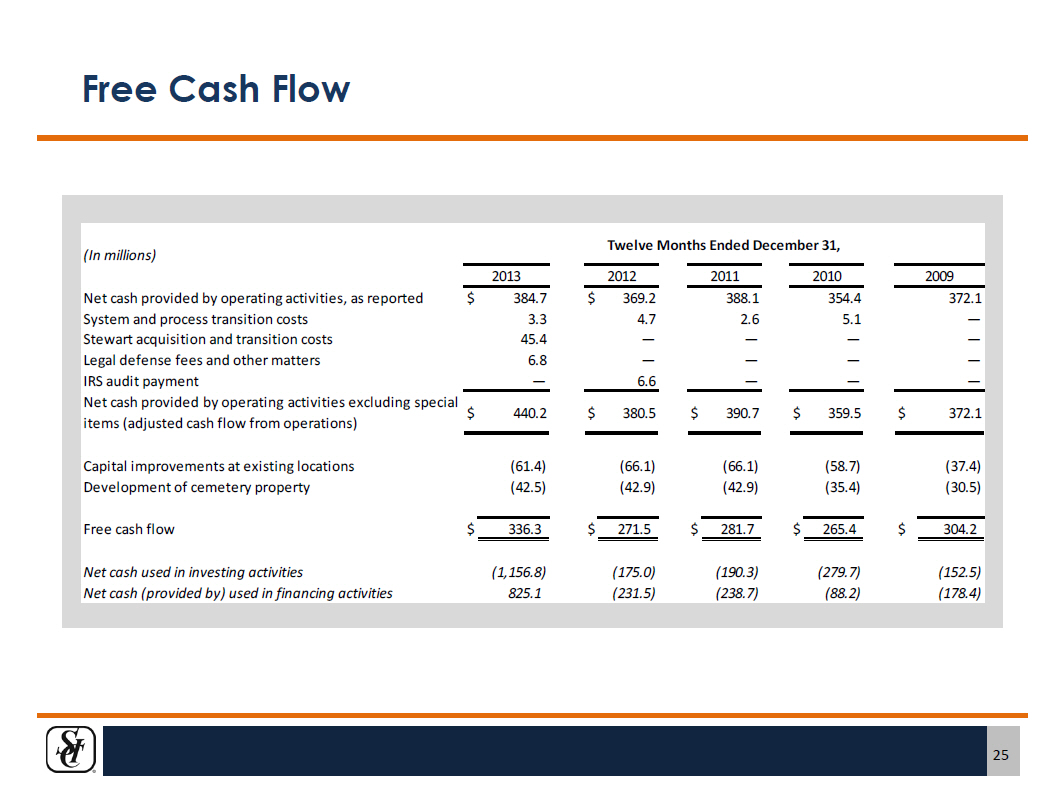
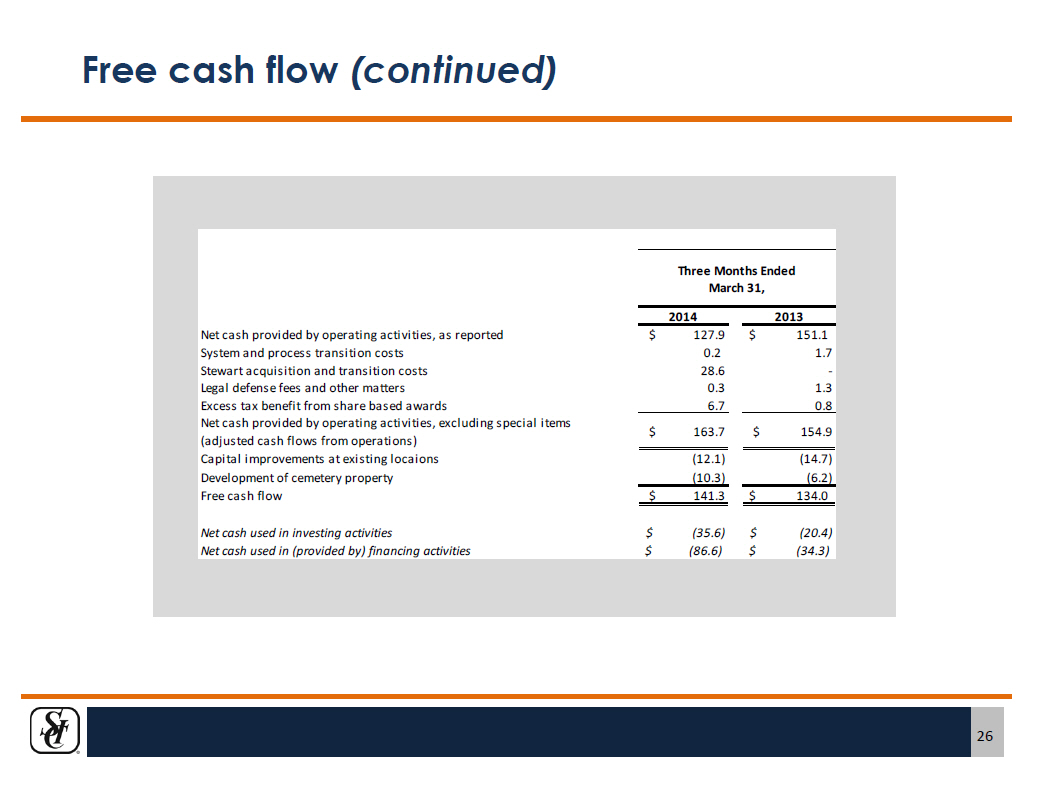
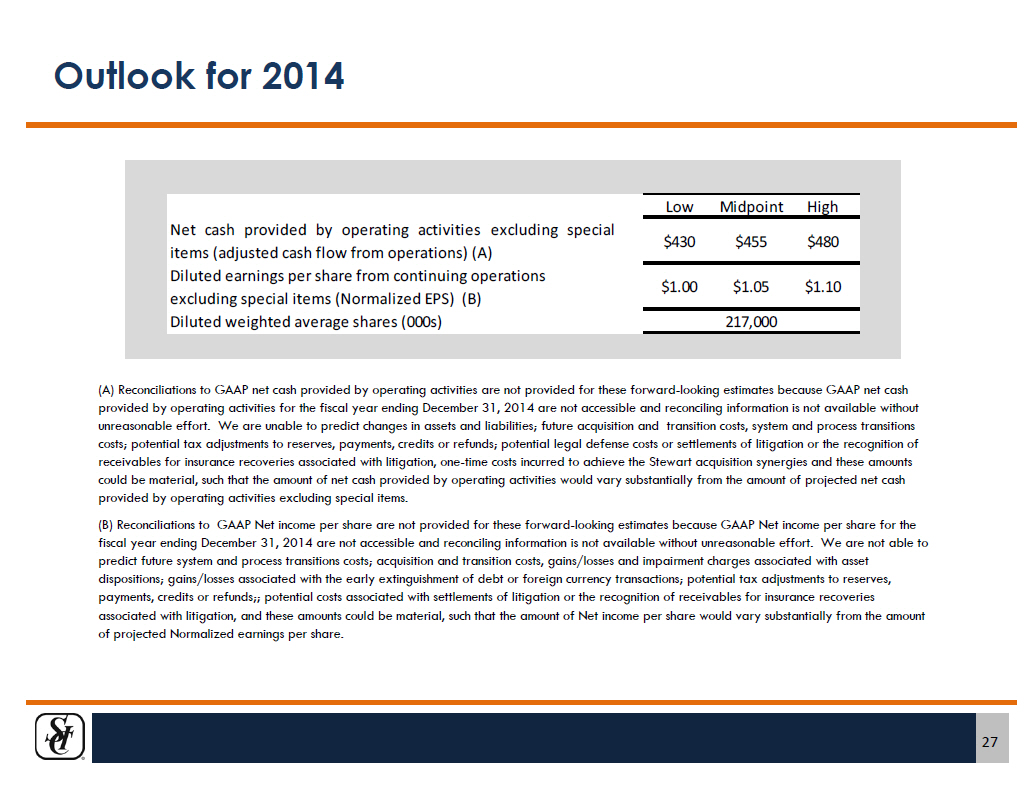
- 23 Apr 14 Service Corporation International Announces First Quarter 2014 Financial Results And Reconfirms Guidance For 2014
- 3 Mar 14 Financial Statements and Exhibits
Filing view
External links