UNITED STATES SECURITIES AND EXCHANGE COMMISSION
Washington, D.C. 20549
Form 10-K
| | | |
þ | | ANNUAL REPORT PURSUANT TO SECTION 13 OR 15(d) OF THE SECURITIES EXCHANGE ACT OF 1934 |
| | | For the fiscal year ended December 31, 2007 |
OR |
o | | TRANSITION REPORT PURSUANT TO SECTION 13 OR 15(d) OF THE SECURITIES EXCHANGE ACT OF 1934 |
| | | For the transition period from to |
Commission file number 1-6402-1
Service Corporation International
(Exact name of registrant as specified in its charter)
| | | |
Texas | | 74-1488375 |
(State or other jurisdiction of
incorporation or organization) | | (I.R.S. employer
identification no.) |
| | | |
1929 Allen Parkway
Houston, Texas
(Address of principal executive offices) | | 77019
(Zip code) |
Registrant’s telephone number, including area code:
713/522-5141
Securities registered pursuant to Section 12(b) of the Act:
| | | |
Title of Each Class | | Name of Each Exchange on Which Registered |
| Common Stock ($1 par value) | | New York Stock Exchange |
| Preferred Share Purchase Rights | | New York Stock Exchange |
Securities registered pursuant to Section 12(g) of the Act:
None
Indicate by check mark if the registrant is a well-known seasoned issuer, as defined in Rule 405 of the Securities Act. Yes þ No o
Indicate by check mark if the registrant is not required to file reports pursuant to Section 13 or Section 15(d) of the Act. Yes o No þ
Indicate by check mark whether the registrant (1) has filed all reports required to be filed by Section 13 or 15(d) of the Securities Exchange Act of 1934 during the preceding 12 months (or for such shorter period that the registrant was required to file such reports), and (2) has been subject to such filing requirements for the past 90 days. Yes þ No o
Indicate by check mark if disclosure of delinquent filers pursuant to Item 405 ofRegulation S-K is not contained herein, and will not be contained, to the best of registrant’s knowledge, in definitive proxy or information statements incorporated by reference in Part III of thisForm 10-K or any amendment to thisForm 10-K. þ
Indicate by check mark whether the registrant is a large accelerated filer, an accelerated filer, a non-accelerated filer, or a smaller reporting company. See the definitions of “large accelerated filer,” “accelerated filer” and “smaller reporting company” in Rule 12b-2 of the Exchange Act. (Check one):
| | | | | | | |
Large accelerated filerþ | | | | | | Accelerated filero |
Non-accelerated filer o (Do not check if a smaller reporting company) | | Smaller Reporting company o |
Indicate by check mark whether the registrant is a shell company (as defined in the Securities Exchange Act of 1934Rule 12b-2). Yes o No þ
The aggregate market value of the common stock held by non-affiliates of the registrant (assuming that the registrant’s only affiliates are its officers and directors) was $3,455,228,251 based upon a closing market price of $12.78 on June 30, 2007 of a share of common stock as reported on the New York Stock Exchange — Composite Transactions Tape.
The number of shares outstanding of the registrant’s common stock as of February 22, 2008 was 261,814,225 (net of treasury shares)
DOCUMENTS INCORPORATED BY REFERENCE
Portions of the registrant’s Proxy Statement in connection with its 2008 Annual Meeting of Shareholders (Part III)
SERVICE CORPORATION INTERNATIONAL
INDEX
2
GLOSSARY
The following terms are common to the deathcare industry, are used throughout this report, and have the following meanings:
Atneed — Funeral and cemetery arrangements after the death has occurred.
Burial Vaults — A reinforced outer burial container intended to protect the casket against the weight of the earth.
Cremation — The reduction of human remains to bone fragments by intense heat.
General Agency (GA) Revenues — Commissions paid to the General Agency (GA) for life insurance policies or annuities sold to preneed customers for the purpose of funding preneed funeral arrangements. The commission rate paid is determined based on the product type sold, the length of payment terms, and the age of the insured/annuitant. The commission rate is applied to the face amount of the policy purchased to determine the commission amount payable to the GA. GA revenues are recognized as funeral revenues when the insurance purchase transaction between the customer and third party insurance provider is completed.
Interment — The burial or final placement of human remains in the ground.
Lawn Crypt — An outer burial receptacle constructed of concrete and reinforced steel, which is usually pre-installed in predetermined designated areas.
Marker — A method of identifying the remains in a particular burial space, crypt, or niche. Permanent burial markers are usually made of bronze, granite, or stone.
Maturity — At the time of death. This is the point at which preneed contracts are converted to atneed contracts.
Mausoleum — An above ground structure that is designed to house caskets and cremation urns.
Perpetual Care or Endowment Care Fund — A trust fund used for the maintenance and upkeep of burial spaces within a cemetery in perpetuity.
Preneed — Purchase of products and services prior to use.
Preneed Backlog — Future revenues from unfulfilled preneed funeral and cemetery contractual arrangements.
Production — Sales of preneed funeral and preneed or atneed cemetery contracts.
As used herein, “SCI”, “Company”, “we”, “our”, and “us” refer to Service Corporation International and companies owned directly or indirectly by Service Corporation International, unless the context requires otherwise.
3
PART I
General
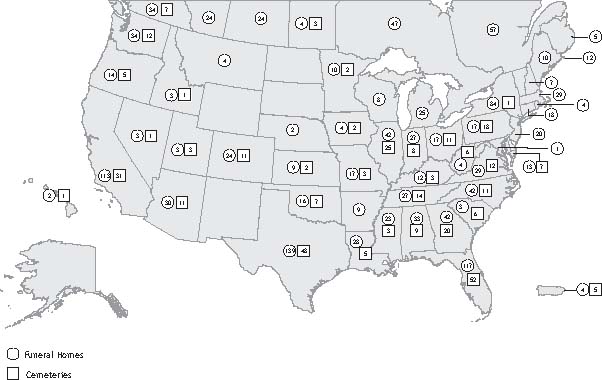
Service Corporation International (SCI) is North America’s leading provider of deathcare products and services, with a network of funeral homes and cemeteries unequalled in geographic scale and reach. At December 31, 2007, we operated 1,329 funeral service locations and 366 cemeteries (including 207 combination locations) in North America, which are geographically diversified across 43 states, eight Canadian provinces, the District of Columbia, and Puerto Rico. Our funeral segment also includes the operations of 13 funeral homes in Germany that we intend to exit when economic values and conditions are conducive to a sale. As part of the Alderwoods Group, Inc. (Alderwoods) transaction, we acquired Mayflower National Life Insurance Company (Mayflower), an insurance business that we sold in July 2007. The operations of this business through the date of sale are presented as discontinued operations in our consolidated statement of operations.
History
We were incorporated in Texas in July of 1962. Prior to 1999, we focused on the acquisition and consolidation of independent funeral homes and cemeteries in the fragmented deathcare industry in North America. During the 1990s, we also expanded our operations through acquisitions in Europe, Australia, South America, and the Pacific Rim. During the mid to late 1990s, acquisitions of deathcare facilities became extremely competitive resulting in increased prices for acquisitions and substantially reduced returns on invested capital. In 1999, we significantly reduced our level of acquisition activity and began to focus on identifying and addressing non-strategic or underperforming businesses.
This focus resulted in the divestiture of several North America and international operations beginning in 2001. During 2001 and 2002, we completed joint ventures of operations in Australia, the United Kingdom, Spain, and Portugal. In 2003, we sold our equity investment in our operations in Australia, Spain, and Portugal. During 2004, we sold our funeral operations in France and obtained an unconsolidated investment in the acquiring entity. We also sold our equity investment in the United Kingdom. During 2005, we divested of all of our operations in Argentina, Uruguay, and Chile. During 2006, we sold our funeral service location in Singapore, leaving our operations in Germany as our sole remaining funeral service locations outside of North America. During 2007, we sold our equity investment in France. We also divested 70% of the operations of Kenyon International Emergency Services (Kenyon). We may pursue discussions with various third parties concerning the sale or joint venture of our operations in Germany when economic values and conditions are conducive to a sale.
In 2006, as part of our strategy to enhance our position as North America’s premier funeral and cemetery provider, we acquired Alderwoods for $20.00 per share in cash. The purchase price of $1.2 billion included the refinancing of $357.7 million and the assumption of $2.2 million of Alderwoods debt. Alderwoods operations were substantially integrated into our operations as of December 31, 2007. These operations are operated in the same manner as our incumbent operations and are reported in the appropriate reporting segment (funeral or cemetery) in our consolidated financial statements.
Funeral and Cemetery Operations
Worldwide, we have 1,342 funeral service locations and 366 cemeteries (including 207 combination locations) covering 43 states, eight Canadian provinces, the District of Columbia, Puerto Rico, and Germany. See Part II, Item 8. Financial Statements and Supplementary Data , Note 17 of thisForm 10-K for financial information about our business segments and geographic areas.
Our funeral service and cemetery operations consist of funeral service locations, cemeteries, funeral service/cemetery combination locations, crematoria, and related businesses. We provide all professional services relating to funerals and cremations, including the use of funeral facilities and motor vehicles, and preparation and embalming services. Funeral related merchandise, including caskets, burial vaults, cremation receptacles, flowers, and other ancillary products and services, is sold at funeral service locations. Our cemeteries provide cemetery property
4
interment rights, including mausoleum spaces, lots, and lawn crypts, and sell cemetery related merchandise and services, including stone and bronze memorials, burial vaults, casket and cremation memorialization products, merchandise installations, and burial openings and closings. We also sell preneed funeral and cemetery preneed products and services whereby a customer contractually agrees to the terms of certain products and services to be delivered and performed in the future.
Funeral service/cemetery combination locations are those businesses in which a funeral service location is physically located within or adjoining a cemetery that we own. Combination locations allow certain facility, personnel, and equipment costs to be shared between the funeral service location and cemetery. Such combination facilities typically can be cost competitive and have higher gross margins than if the funeral and cemetery operations were operated separately. Combination locations also create synergies between funeral and cemetery sales force personnel and give families added convenience to purchase both funeral and cemetery products and services at a single location. With the acquisition of Alderwoods, we acquired Rose Hills, which is the largest combination operation in the United States, performing approximately 5,000 funeral services and 8,000 interments per year.
Our operations in the United States and Canada are organized into 37 major markets and 45 middle markets (including eight Hispana markets). Each market is led by a market director with responsibility for funeraland/or cemetery operations and preneed sales. Within each market, the funeral homes and cemeteries share common resources such as personnel, preparation services, and vehicles. There are four market support centers in North America to assist market directors with financial, administrative, pricing, and human resource needs. These support centers are located in Houston, Miami, New York, and Los Angeles. The primary functions of the support centers are to help facilitate the execution of corporate strategies, coordinate communication between the field and corporate offices, and serve as liaisons for the implementation of policies and procedures.
See Part II, Item 8. Financial Statements and Supplementary Data, Note 17 of thisForm 10-K for financial information related to our reportable segments and geographic areas.
The following table (which includes businessesheld-for-sale at December 31, 2007) provides the number of our funeral homes and cemeteries by country, and by state, territory, or province:
| | | | | | | | | | | | | |
| | | Number of
| | | Number of
| | | | |
Country, State/Territory/Province | | Funeral Homes | | | Cemeteries | | | Total | |
| |
| United States | | | | | | | | | | | | |
| Alabama | | | 33 | | | | 9 | | | | 42 | |
| Arizona | | | 30 | | | | 11 | | | | 41 | |
| Arkansas | | | 9 | | | | — | | | | 9 | |
| California | | | 113 | | | | 31 | | | | 144 | |
| Colorado | | | 24 | | | | 11 | | | | 35 | |
| Connecticut | | | 18 | | | | — | | | | 18 | |
| District of Columbia | | | 1 | | | | — | | | | 1 | |
| Florida | | | 117 | | | | 52 | | | | 169 | |
| Georgia | | | 42 | | | | 20 | | | | 62 | |
| Hawaii | | | 2 | | | | 1 | | | | 3 | |
| Idaho | | | 3 | | | | 1 | | | | 4 | |
| Illinois | | | 42 | | | | 25 | | | | 67 | |
| Indiana | | | 27 | | | | 8 | | | | 35 | |
| Iowa | | | 4 | | | | 2 | | | | 6 | |
| Kansas | | | 9 | | | | 2 | | | | 11 | |
| Kentucky | | | 12 | | | | 3 | | | | 15 | |
| Louisiana | | | 28 | | | | 5 | | | | 33 | |
| Maine | | | 10 | | | | — | | | | 10 | |
5
| | | | | | | | | | | | | |
| | | Number of
| | | Number of
| | | | |
Country, State/Territory/Province | | Funeral Homes | | | Cemeteries | | | Total | |
| |
| Maryland | | | 13 | | | | 7 | | | | 20 | |
| Massachusetts | | | 29 | | | | — | | | | 29 | |
| Michigan | | | 25 | | | | — | | | | 25 | |
| Minnesota | | | 10 | | | | 2 | | | | 12 | |
| Mississippi | | | 23 | | | | 3 | | | | 26 | |
| Missouri | | | 17 | | | | 3 | | | | 20 | |
| Montana | | | 4 | | | | — | | | | 4 | |
| Nebraska | | | 2 | | | | — | | | | 2 | |
| Nevada | | | 3 | | | | 1 | | | | 4 | |
| New Hampshire | | | 7 | | | | — | | | | 7 | |
| New Jersey | | | 20 | | | | — | | | | 20 | |
| New York | | | 84 | | | | 1 | | | | 85 | |
| North Carolina | | | 42 | | | | 11 | | | | 53 | |
| Ohio | | | 17 | | | | 11 | | | | 28 | |
| Oklahoma | | | 16 | | | | 7 | | | | 23 | |
| Oregon | | | 14 | | | | 5 | | | | 19 | |
| Pennsylvania | | | 17 | | | | 18 | | | | 35 | |
| Puerto Rico | | | 4 | | | �� | 5 | | | | 9 | |
| Rhode Island | | | 4 | | | | — | | | | 4 | |
| South Carolina | | | 3 | | | | 6 | | | | 9 | |
| Tennessee | | | 27 | | | | 14 | | | | 41 | |
| Texas | | | 139 | | | | 48 | | | | 187 | |
| Utah | | | 3 | | | | 3 | | | | 6 | |
| Virginia | | | 29 | | | | 12 | | | | 41 | |
| Washington | | | 34 | | | | 12 | | | | 46 | |
| West Virginia | | | 4 | | | | 6 | | | | 10 | |
| Wisconsin | | | 8 | | | | — | | | | 8 | |
| Canada | | | | | | | | | | | | |
| Alberta | | | 24 | | | | — | | | | 24 | |
| British Columbia | | | 34 | | | | 7 | | | | 41 | |
| Manitoba | | | 4 | | | | 3 | | | | 7 | |
| New Brunswick | | | 5 | | | | — | | | | 5 | |
| Nova Scotia | | | 12 | | | | — | | | | 12 | |
| Ontario | | | 47 | | | | — | | | | 47 | |
| Quebec | | | 57 | | | | — | | | | 57 | |
| Saskatchewan | | | 24 | | | | — | | | | 24 | |
| Germany | | | 13 | | | | — | | | | 13 | |
| | | | | | | | | | | | | |
| Total | | | 1,342 | | | | 366 | | | | 1,708 | (1) |
| | | | | | | | | | | | | |
| | |
| (1) | | Includes businesses held for sale at December 31, 2007. |
We believe we have satisfactory title to the properties owned and used in our business, subject to various liens, encumbrances, and easements, which are incidental to ownership rights and uses and do not materially detract from
6
the value of the property. We also lease a number of facilities that we use in our business under both capital and operating leases.
At December 31, 2007, we owned approximately 90% of the real estate and buildings used at our facilities, and the remainder of the facilities were leased. At December 31, 2007, our 366 cemeteries contained a total of approximately 28,362 acres, of which approximately 62% was developed.
A map of our locations in North America is presented below:
Competition
Although there are several public companies that own funeral homes and cemeteries, the majority of deathcare businesses are locally-owned, independent operations. We estimate that our funeral and cemetery market share in North America is approximately 13% based on estimated total industry revenues. The position of a single funeral home or cemetery in any community is a function of the name, reputation, and location of that funeral home or cemetery, although competitive pricing, professional service and attention, and well-maintained locations are also important.
We believe we have an unparalleled network of funeral service locations and cemeteries that offer high quality products and services at prices that are competitive with local competing funeral homes, cemeteries, and retail locations. Within this network, the funeral service locations and cemeteries operate under various names as most operations were acquired as existing businesses. We have branded our funeral operations in North America under the name Dignity Memorial®. We believe our national branding strategy gives us a strategic advantage and identity in the industry. While this branding process is intended to emphasize our seamless national network of funeral service locations and cemeteries, the original names associated with acquired operations, and their inherent goodwill and heritage, generally remain the same. For example, Geo. H. Lewis & Sons Funeral Directors is now Geo. H. Lewis & Sons Funeral Directors, a Dignity Memorial® provider.
Employees
At December 31, 2007, we employed 13,499 (13,456 in North America) individuals on a full time basis and 7,092 (7,088 in North America) individuals on a part time basis. Of the full time employees, 12,845 were employed in the funeral and cemetery operations and 654 were employed in corporate or other overhead activities and
7
services. All eligible employees in the United States who so elect are covered by our group health and life insurance plans. Eligible employees in the United States are participants in retirement plans of SCI or various subsidiaries, while international employees are covered by other SCI (or SCI subsidiary) defined or government mandated benefit plans. Approximately 3.9% of our employees in North America are represented by unions. Although labor disputes are experienced from time to time, relations with employees are generally considered favorable.
Regulation
Our operations are subject to regulations, supervision, and licensing under numerous foreign, federal, state, and local laws, ordinances, and regulations, including extensive regulations concerning trust funds, preneed sales of funeral and cemetery products and services, and various other aspects of our business. We strive to comply in all material respects with the provisions of these laws, ordinances, and regulations. Since 1984, we have operated in the United States under the Federal Trade Commission (FTC) comprehensive trade regulation rule for the funeral industry. The rule contains requirements for funeral industry practices, including extensive price and other affirmative disclosures and imposes mandatory itemization of funeral goods and services.
Other
Our corporate headquarters are located at 1929 Allen Parkway, Houston, Texas 77019. The property consists of approximately 120,000 square feet of office space and 185,000 square feet of parking space. We own and utilize two buildings located in Houston, Texas for corporate activities containing a total of approximately 172,000 square feet of office space.
We make available free of charge, on or through our website, our annual, quarterly, and current reports and any amendments to those reports, as soon as reasonably practicable after electronically filing such reports with the Securities and Exchange Commission (SEC). Our website ishttp://www.sci-corp.com and our telephone number is(713) 522-5141. The SEC also maintains an internet site athttp://www.sec.gov that contains reports, proxy and information statements, and other information regarding issuers that file electronically. The public may read and copy any materials we file with the SEC at the SEC’s Public Reference Room at 100 F Street, N.E., Washington, DC 20549. Information on the operation of the Public Reference Room may be obtained by calling the SEC at1-800-SEC-0330.
Each of our Board of Directors’ standing committee charters, our Corporate Governance Guidelines, our Code of Ethics for Board Members, and our Code of Conduct for Officers and Employees are available, free of charge, through our website or, upon request, in print. We will post on our internet website all waivers to or amendments of our Code of Conduct for Officers and Employees, which are required to be disclosed by applicable law and rules of the New York Stock Exchange listing standards. Information contained on our website is not part of this report.
Cautionary Statement on Forward-Looking Statements
The statements in thisForm 10-K that are not historical facts are forward-looking statements made in reliance on the safe harbor protections provided under the Private Securities Litigation Reform Act of 1995. These statements may be accompanied by words such as “believe”, “estimate”, “project”, “expect”, “anticipate”, or “predict” that convey the uncertainty of future events or outcomes. These statements are based on assumptions that we believe are reasonable; however, many important factors could cause our actual consolidated results in the future to differ materially from the forward-looking statements made herein and in any other documents or oral presentations made by, or on behalf of, the Company. These factors are discussed below. We assume no obligation to publicly update or revise any forward-looking statements made herein or any other forward-looking statements made by the Company, whether as a result of new information, future events, or otherwise.
8
Our ability to execute our business plan depends on many factors, many of which are beyond our control.
Our strategic plan is focused on cost management and the continued implementation of key revenue initiatives, including strategic pricing, designed to generate future internal growth in our core funeral and cemetery operations. Many of the factors necessary for the execution of our strategic plan, such as the number of deaths and general economic conditions, are beyond our control. We cannot give assurance that we will be able to execute any or all of our strategic plan. Failure to execute any or all of the strategic plan could have a material adverse effect on our financial condition, results of operations, or cash flows.
Our credit agreements and debt securities contain covenants that may prevent us from engaging in certain transactions.
Our credit agreements and debt securities contain, among other things, various affirmative and negative covenants that may prevent us from engaging in certain transactions that might otherwise be considered beneficial to us. These covenants limit, among other things, our and our subsidiaries’ ability to:
| | |
| | • | Incur additional secured indebtedness (including guarantee obligations); |
| |
| | • | Create liens on assets; |
| |
| | • | Engage in certain transactions with affiliates; |
| |
| | • | Enter into sale-leaseback transactions; |
| |
| | • | Engage in mergers, liquidations, and dissolutions; |
| |
| | • | Sell assets; |
| |
| | • | Enter into leases; |
| |
| | • | Pay dividends, distributions, and other payments in respect of capital stock and purchase our capital stock in the open market; |
| |
| | • | Make investments, loans, or advances; |
| |
| | • | Repay subordinated indebtedness or amend the agreements relating thereto; |
| |
| | • | Change our fiscal year; |
| |
| | • | Create restrictions on our ability to receive distributions from subsidiaries; and |
| |
| | • | Change our lines of business. |
Our bank credit facility also requires us to maintain certain leverage and interest coverage ratios. See Part II, Item 8. Financial Statements and Supplementary Data, Note 11 of thisForm 10-K for further information related to our bank credit facility.
If we lost the ability to use surety bonding to support our preneed funeral and preneed cemetery activities, we may be required to make material cash payments to fund certain trust funds.
We have entered into arrangements with certain surety companies whereby such companies agree to issue surety bonds on our behalf as financial assurance or as required by existing state and local regulations. The surety bonds are used for various business purposes; however, the majority of the surety bonds issued and outstanding have been issued to support our preneed funeral and cemetery activities. In the event all of the surety companies cancelled or did not renew our surety bonds, which are generally renewed for twelve-month periods, we would be required to either obtain replacement coverage or fund approximately $235.9 million as of December 31, 2007 into state-mandated trust accounts.
9
The funeral home and cemetery industry continues to be increasingly competitive.
In North America, the funeral and cemetery industry is characterized by a large number of locally owned, independent operations. To compete successfully, our funeral service locations and cemeteries must maintain good reputations and high professional standards, as well as offer attractive products and services at competitive prices. In addition, we must market the Company in such a manner as to distinguish us from our competitors. We have historically experienced price competition from independent funeral home and cemetery operators, monument dealers, casket retailers, low-cost funeral providers, and other non-traditional providers of services and merchandise. If we are unable to successfully compete, our financial condition, results of operations, and cash flows could be materially adversely affected.
Our affiliated funeral and cemetery trust funds own investments in equity securities, fixed income securities, and mutual funds, which are affected by financial market conditions that are beyond our control.
In connection with our preneed funeral and preneed cemetery merchandise and service sales, most affiliated funeral and cemetery trust funds own investments in equity securities and mutual funds. Our earnings and investment gains and losses on these equity securities and mutual funds are affected by financial market conditions that are beyond our control. In addition, our investments in our funeral, cemetery, and perpetual care trusts have an indirect exposure, through our investment fund managers, to mortgage-backed securities and therefore to sub-prime mortgage markets. At December 31, 2007, our exposure to sub-prime mortgage investments is approximately $18 million, or less than 1.0% of our total investment portfolio of over $3 billion.
As of December 31, 2007, net unrealized appreciation in the preneed funeral and cemetery merchandise and services trust funds amounted to $5.9 million and $29.4 million, respectively. Our perpetual care trust funds had net unrealized depreciation of $2.9 million as of December 31, 2007. The following table summarizes our investment returns, excluding fees, on our trust funds for the last three years.
| | | | | | | | | | | | | |
| | | 2007 | | | 2006 | | | 2005 | |
| |
| Preneed funeral trust funds | | | 9.9 | % | | | 8.8 | % | | | 6.6 | % |
| Cemetery merchandise and services trust funds | | | 9.8 | % | | | 8.4 | % | | | 6.9 | % |
| Perpetual care trust funds | | | 3.2 | % | | | 10.8 | % | | | 3.9 | % |
If earnings from our trust funds decline, we would likely experience a decline in future revenues. In addition, if the trust funds experienced significant investment losses, there could be insufficient funds in the trusts to cover the costs of delivering services and merchandise or maintaining cemeteries in the future. We would have to cover any such shortfall with cash flows from operations, which could have a material adverse effect on our financial condition, results of operations, or cash flows.
Increasing death benefits related to preneed funeral contracts funded through life insurance or annuity contracts may not cover future increases in the cost of providing a price-guaranteed funeral service.
We sell price-guaranteed preneed funeral contracts through various programs providing for future funeral services at prices prevailing when the agreements are signed. For preneed funeral contracts funded through life insurance or annuity contracts, we receive in cash a general agency commission that typically averages approximately 14% of the total sale from the third party insurance company. Additionally, there is an increasing death benefit associated with the contract of approximately 1% per year to be received in cash at the time the funeral is performed. There is no guarantee that the increasing death benefit will cover future increases in the cost of providing a price-guaranteed funeral service, which could materially adversely affect our future cash flows, revenues, and operating margins.
Unfavorable results of litigation could have a material adverse impact on our financial statements.
As discussed in Part II, Item 8. Financial Statements and Supplementary Data, Note 13 of thisForm 10-K, we are subject to a variety of claims and lawsuits in the ordinary course of our business. Adverse outcomes in some or all of the pending cases may result in significant monetary damages or injunctive relief against us. While management currently believes that resolving all of these matters, individually or in the aggregate, will not have
10
a material adverse impact on our financial position, cash flows, or results of operations, litigation and other claims are subject to inherent uncertainties and management’s view of these matters may change in the future. There exists the possibility of a material adverse impact on our financial position, cash flows, and the results of operations for the period in which the effect of an unfavorable final outcome becomes probable and reasonably estimable.
If the number of deaths in our markets declines, our cash flows and revenues may decrease.
If the number of deaths declines, the number of funeral services and interments performed by us could decrease and our financial condition, results of operations, and cash flows could be materially adversely affected.
The continuing upward trend in the number of cremations performed in North America could result in lower revenue and gross profit dollars.
There is a continuing upward trend in the number of cremations performed in North America as an alternative to traditional funeral service dispositions. However, we have seen a recent stabilization in the trend for our businesses as our strategic pricing initiative and discounting policies have resulted in a decline in highly-discounted, low-service cremation customers. In our operations in North America during 2007, 41.6% of the comparable funeral services we performed were cremation cases compared to 41.5% and 41.4% performed in 2006 and 2005, respectively. We expect this continuing upward trend to resume in the near future. We continue to expand our cremation memorialization products and services, which have resulted in higher average sales for cremation services. If we are unable to successfully expand our cremation memorialization products and services, and cremations continue to be a significant percentage of our funeral services, our financial condition, results of operations, and cash flows could be materially adversely affected.
The funeral home and cemetery businesses are high fixed-cost businesses.
The majority of our operations are managed in groups called “markets”. Markets are geographical groups of funeral service locations and cemeteries that share common resources such as operating personnel, preparation services, clerical staff, motor vehicles, and preneed sales personnel. Personnel costs, the largest of our operating expenses, are the cost components most beneficially affected by this grouping. We must incur many of these costs regardless of the number of funeral services or interments performed. Because we cannot necessarily decrease these costs when we experience lower sales volumes, a sales decline may cause margin percentages to decline at a greater rate than the decline in revenues.
Regulation and compliance could have a material adverse impact on our financial results.
Our operations are subject to regulation, supervision, and licensing under numerous foreign, federal, state, and local laws, ordinances, and regulations, including extensive regulations concerning trust funds, preneed sales of funeral and cemetery products and services, and various other aspects of our business. The impact of such regulations varies depending on the location of our funeral and cemetery operations. Violations of applicable laws could result in fines or sanctions to us.
In addition, from time to time, governments and agencies propose to amend or add regulations, which would increase costs and decrease cash flows. For example, foreign, federal, state, local, and other regulatory agencies have considered and may enact additional legislation or regulations that could affect the deathcare industry, such as regulations that require more liberal refund and cancellation policies for preneed sales of products and services, limit or eliminate our ability to use surety bonding, increase trust requirements,and/or prohibit the common ownership of funeral homes and cemeteries in the same market. If adopted by the regulatory authorities of the jurisdictions in which we operate, these and other possible proposals could have a material adverse effect on our financial condition, results of operations, and cash flows.
Compliance with laws, regulations, industry standards, and customs concerning burial procedures and the handling and care of human remains is critical to the continued success of our business and any operations we may acquire. Litigation and regulatory proceedings regarding these issues could have a material adverse effect on our financial condition, results of operations, and cash flows. We are continually monitoring and reviewing our
11
operations in an effort to insure that we are in compliance with these laws, regulations, and standards and, where appropriate, taking appropriate corrective action.
A number of years may elapse before particular tax matters, for which we have established accruals, are audited and finally resolved.
The number of tax years with open tax audits varies depending on the tax jurisdiction. In the United States, the Internal Revenue Service is currently examining our tax returns for 1999 through 2005 and various state jurisdictions are auditing years through 2006. While it is often difficult to predict the final outcome or the timing of resolution of any particular tax matter, we believe that our accruals reflect the probable outcome of known tax contingencies. Unfavorable settlement of any particular issue would reduce a deferred tax asset or require the use of cash. Favorable resolution could result in reduced income tax expense reported in the financial statements in the future.
Failure to maintain effective internal control over financial reporting could adversely affect our financial results, our operations and our stock price, and cause investors to lose confidence in the reliability of our financial statements.
Effective internal control over financial reporting is necessary for us to provide reliable financial reports. When we identify material weaknesses in our internal control over financial reporting, such as those disclosed in Item 9A, we are unable to conclude that our internal control over financial reporting is effective. In such event, our financial results, operations and stock price could be adversely affected, and investors could lose confidence in the reliability of our financial statements.
| |
| Item 1B. | Unresolved Staff Comments. |
None.
Information regarding properties is set forth in Part I, Item 1. Business of thisForm 10-K.
| |
| Item 3. | Legal Proceedings. |
Information regarding legal proceedings is set forth in Part II, Item 8. Financial Statements and Supplementary Data, Note 13 of thisForm 10-K.
| |
| Item 4. | Submission of Matters to a Vote of Security Holders. |
None.
12
EXECUTIVE OFFICERS OF THE COMPANY
The following table sets forth as of February 29, 2008 the name and age of each executive officer of the Company, the office held, and the year first elected an officer.
| | | | | | | | | |
| | | | | | | Year First
|
| | | | | | | Became
|
Officer Name | | Age | | Position | | Officer |
| |
| R. L. Waltrip | | 77 | | Chairman of the Board | | | 1962 | |
| Thomas L. Ryan | | 42 | | President and Chief Executive Officer | | | 1999 | |
| Michael R. Webb | | 49 | | Executive Vice President and Chief Operating Officer | | | 1998 | |
| J. Daniel Garrison | | 56 | | Senior Vice President Operations Support | | | 1998 | |
| Philip C. Jacobs | | 53 | | Senior Vice President and Chief Marketing Officer | | | 2007 | |
| Stephen M. Mack | | 56 | | Senior Vice President Middle Market Operations | | | 1998 | |
| Gregory T. Sangalis | | 52 | | Senior Vice President General Counsel and Secretary | | | 2007 | |
| Eric D. Tanzberger | | 39 | | Senior Vice President Chief Financial Officer and Treasurer | | | 2000 | |
| Sumner J. Waring, III | | 39 | | Senior Vice President Major Market Operations | | | 2002 | |
| Jeffrey I. Beason | | 59 | | Vice President Corporate Controller | | | 2006 | |
| Christopher H. Cruger | | 33 | | Vice President Business Development | | | 2005 | |
| Joseph A. Hayes | | 51 | | Vice President Ethics and Business Conduct and Assistant General Counsel | | | 2007 | |
| Jane D. Jones | | 52 | | Vice President Human Resources | | | 2005 | |
| Albert R. Lohse | | 47 | | Vice President Litigation and Risk Management | | | 2004 | |
| Elisabeth G. Nash | | 46 | | Vice President Process and Technology | | | 2004 | |
| Donald R. Robinson | | 50 | | Vice President Supply Chain Management | | | 2005 | |
Mr. Waltrip is the founder, Chairman of the Company, and a licensed funeral director. He grew up in his family’s funeral business and assumed management of the firm in the 1950s after earning a Bachelor’s degree in Business Administration from the University of Houston. He began buying additional funeral homes in the 1960s, achieving cost efficiencies by pooling their resources. At the end of 2007, the network he began had grown to include more than 1,700 funeral service locations and cemeteries. Mr. Waltrip took the Company public in 1969. He has provided leadership to the Company for over 40 years. In 2005, Mr. Waltrip resigned as Chief Executive Officer, but he continues to serve as Chairman of the Board.
Mr. Ryan joined the Company in June 1996 and served in a variety of financial management roles within the Company. In February 1999, Mr. Ryan was promoted to Vice President International Finance. In November 2000, he was promoted to Chief Executive Officer of European Operations based in Paris, France. In July 2002, Mr. Ryan was appointed President and Chief Operating Officer. In February 2005, he was promoted to Chief Executive Officer. Prior to joining the Company, Mr. Ryan was a Certified Public Accountant with Coopers & Lybrand L.L.P. for more than five years. Mr. Ryan is a Certified Public Accountant and holds a Bachelor of Business Administration degree from the University of Texas-Austin.
Mr. Webb joined the Company in 1991 when it acquired Arlington Corporation, a regional funeral and cemetery consolidator, where he was then Chief Financial Officer. Prior to joining Arlington Corporation, Mr. Webb held various executive financial and development roles at Days Inns of America and Telemundo Group, Inc. In 1993, Mr. Webb joined our corporate development group, which he later led on a global basis before accepting operational responsibility for our Australian and Hispanic businesses. Mr. Webb was promoted to Vice President
13
International Corporate Development in February 1998 and was named Executive Vice President in July 2002. In February 2005, he was promoted to Chief Operating Officer. He is a graduate of the University of Georgia, where he earned a Bachelor of Business Administration degree.
Mr. Garrison joined the Company in 1978 and worked in a series of management positions until he was promoted to President of the Southeastern Region in 1992. In 1998, Mr. Garrison was promoted to Vice President International Operations. In 2000, Mr. Garrison became Vice President North American Cemetery Operations and was promoted to Vice President Operations Services in August 2002. He assumed his current position as Senior Vice President Operations Support in February 2005. Mr. Garrison has a Bachelor of Science degree in Administrative Management from Clemson University.
Mr. Jacobs joined SCI in 2007 as Senior Vice President and Chief Marketing Officer. Prior to joining the Company, Mr. Jacobs was employed by CompUSA as Chief Marketing Officer. Prior to that he was employed by Publicis Worldwide as Chief Marketing Officer and prior to that held other management roles over the past 23 years at several of the nation’s top advertising agencies, as well as client-side positions. Mr. Jacobs holds a Bachelor of Science degree from the University of Tennessee and a Masters degree from Vanderbilt University.
Mr. Mack joined the Company in 1973 as a resident director after graduating from Farmingdale State University of New York. He became Vice President of the Eastern Region in 1987 and in February 1998 Mr. Mack was appointed Vice President North American Funeral Operations. Mr. Mack was promoted to Senior Vice President Eastern Operations in August 2002 and assumed the office of Senior Vice President Middle Market Operations, his current position, in May 2004.
Mr. Sangalis joined the Company in 2007 as Senior Vice President General Counsel and Secretary. He previously served as Senior Vice President, Law and Administration for Team Inc., a leading provider of specialty industrial maintenance and construction services. Prior to that, Mr. Sangalis served as Managing Director and General Counsel of Main Street Equity Ventures II, a private equity investment firm, and as Senior Vice President General Counsel and Secretary for Waste Management Inc., the leading provider of waste management services in North America. Mr. Sangalis holds a bachelor’s degree in finance from Indiana University and an M.B.A. from the University of Minnesota. He earned his juris doctorate from the University of Minnesota Law School.
Mr. Tanzberger joined the Company in August 1996 as Manager of Budgets & Financial Analysis. He was promoted to Vice President Investor Relations and Assistant Corporate Controller in January 2000 and to Corporate Controller in August 2002. In 2006, Mr. Tanzberger was promoted to the position of Senior Vice President and Chief Financial Officer. In 2007, Mr. Tanzberger was appointed Treasurer. Prior to joining the Company, Mr. Tanzberger was Assistant Corporate Controller at Kirby Marine Transportation Corporation, an inland waterway barge and tanker company, from January through August 1996. Prior thereto, he was a Certified Public Accountant with Coopers & Lybrand L.L.P. for more than five years. Mr. Tanzberger is a graduate of the University of Notre Dame, where he earned a Bachelor of Business Administration degree.
Mr. Waring, a licensed funeral director, joined the Company as an Area Vice President in 1996 when we merged with his family’s funeral business. Mr. Waring was appointed Regional President of the Northeast Region in 1999 and was promoted to Regional President of the Pacific Region in September 2001. Mr. Waring was promoted to Vice President Western Operations in August 2002 and assumed the office of Vice President Major Market Operations in November 2003. In February 2006, Mr. Waring was promoted to Senior Vice President Major Market Operations. Mr. Waring holds a Bachelor of Science degree in Business Administration from Stetson University in Deland, Florida, a degree in Mortuary Science from Mt. Ida College and a Masters of Business Administration degree from the University of Massachusetts Dartmouth.
Mr. Beason joined SCI in July 2006 as Vice President and Corporate Controller. Prior to joining SCI, he was an employee of El Paso Corporation, a natural gas transmission and production company. Mr. Beason joined El Paso in 1978 and held various accounting and reporting roles until 1993. From 1993 to 1996, he held the position of Sr. Vice President Administration of Mojave Pipeline Operating Company, a wholly owned subsidiary of El Paso Corporation. From 1996 to November 2005, Mr. Beason was Senior Vice President Controller and Chief Accounting Officer of El Paso Corporation. He is a Certified Public Accountant and holds a Bachelor of Business Administration in Accounting degree from Texas Tech University.
14
Mr. Cruger oversees Corporate Development, real estate, and the Dignity Memorial® affiliate network of independent funeral homes. He initially served the Company as a financial analyst in the corporate development department from 1996 until 1999, when he left to become Manager of Financial Analysis for R. H. Donnelley Corporation. During 2000, he returned to SCI to focus on international divestitures. From 2003 to February 2005, he served as Managing Director of Corporate Development. In February 2005, he was promoted to Vice President of Business Development. Mr. Cruger graduated from Lehigh University with a Bachelor of Science in Finance.
Mr. Hayes was appointed Vice President Ethics and Business Conduct and Assistant General Counsel in November 2007. Mr. Hayes joined the Company in 1991 as corporate counsel. He was named Managing Counsel in 1996 and Assistant General Counsel in 2005. Prior to joining SCI, Mr. Hayes practiced law in Chicago and San Diego, specializing in securities, mergers and acquisitions, and commercial transactions. He received a bachelors degree in commerce from DePaul University and earned his juris doctorate from the University of California at Berkeley.
Mrs. Jones joined SCI in 2003 from Dynegy, Inc., where she served as Vice President of Total Rewards. She oversees human resources, training and education, and payroll and commission services — activities that assist approximately 20,000 employees in North America. Mrs. Jones was promoted to Vice President Human Resources in February 2005. She holds a Bachelor of Business Administration degree in Accounting with a minor in Finance from Southern Methodist University. She is a Certified Compensation Professional.
Mr. Lohse joined SCI in 2000 as Managing Director of Litigation and has since been involved in the resolution of major litigation issues for the Company. In 2004, Mr. Lohse was promoted to Vice President Corporate Governance. Before joining the Company, Mr. Lohse was Managing Partner at McDade, Fogler, Maines & Lohse where he conducted a general civil trial practice. Prior to that, he practiced tort and commercial litigation at Fulbright & Jaworski. Mr. Lohse received a Bachelor of Business Administration degree from the University of Texas and a Juris Doctor from the University of Houston Law Center.
Ms. Nash joined SCI in 2002 as Managing Director of Strategic Planning and Process Improvement. Prior to joining SCI, Ms. Nash worked for the Pennzoil Corporation and held various senior management accounting and financial positions. In 2004, Ms. Nash was promoted to Vice President Continuous Process Improvement. Her primary responsibilities include improving operating systems, reducing overhead costs, and identifying and assisting in the implementation of initiatives to improve operating profit margins and cash flow. She is a graduate of Texas A&M University where she received a Bachelor of Business Administration degree in Accounting.
Mr. Robinson joined SCI in 1996 as Director of Procurement. Prior to joining the Company Mr. Robinson was employed by Marathon Oil Company, where he spent 16 years in a variety of procurement, logistics, and information technology positions. In February 2005, he was promoted to Vice President Supply Chain Management. Prior to this promotion, he was Managing Director of Business Support Services, a position in which he oversaw fleet management and office services; voice, travel, and shipping services; and supply chain and purchasing activities. Mr. Robinson holds a Bachelor of Science degree in Business Administration with a minor in Computer Service from Taylor University in Upland, Indiana.
Each officer of the Company is elected by the Board of Directors and holds their office until a successor is elected and qualified or until earlier death, resignation, or removal in the manner prescribed in the Bylaws of the Company. Each officer of a subsidiary of the Company is elected by the subsidiary’s board of directors and holds their office until a successor is elected and qualified or until earlier death, resignation, or removal in the manner prescribed in the Bylaws of the Subsidiary.
15
PART II
| |
| Item 5. | Market for Registrant’s Common Equity, Related Stockholder Matters and Issuer Purchases of Equity Securities. |
Our common stock has been traded on the New York Stock Exchange since May 14, 1974. On December 31, 2007, there were 5,018 holders of record of our common stock. In calculating the number of shareholders, we consider clearing agencies and security position listings as one shareholder for each agency or listing. At December 31, 2007, we had 262,858,169 shares outstanding, net of 1,961,300 treasury shares.
During 2007, we paid cash dividends totaling $34.6 million and accrued $10.6 million for dividends paid on January 31, 2008. While we intend to pay regular quarterly cash dividends for the foreseeable future, all subsequent dividends are subject to final determination by our Board of Directors each quarter after its review of our financial performance.
The table below shows our quarterly high and low closing common stock prices for the two years ended December 31, 2007:
| | | | | | | | | | | | | | | | | |
| | | 2007 | | | 2006 | |
| | | High | | | Low | | | High | | | Low | |
| |
| First quarter | | $ | 12.20 | | | $ | 10.31 | | | $ | 8.46 | | | $ | 7.75 | |
| Second quarter | | $ | 13.98 | | | $ | 11.66 | | | $ | 8.50 | | | $ | 7.73 | |
| Third quarter | | $ | 12.90 | | | $ | 11.04 | | | $ | 9.34 | | | $ | 7.37 | |
| Fourth quarter | | $ | 14.47 | | | $ | 12.83 | | | $ | 10.45 | | | $ | 8.97 | |
Options in our common stock are traded on the Philadelphia Stock Exchange. Our common stock is traded on the New York Stock Exchange under the symbol SCI.
Stock Performance Graph. This graph assumes the total return on $100 invested on December 31, 2002, in SCI Common Stock, the S&P 500 Index, and a peer group selected by the Company (the “Peer Group”). The Peer Group is comprised of Alderwoods Group, Inc., Carriage Services, Inc., Hillenbrand Industries, Inc., Matthews International Corp., Rock of Ages Corporation, and Stewart Enterprises, Inc. Alderwoods Group is included in the Peer Group until November 28, 2006, when it was acquired by SCI. Total return data assumes reinvestment of dividends.
TOTAL SHAREHOLDER RETURNS
For equity compensation plan information, see Part III of thisForm 10-K.
16
On October 31, 2007, we issued 361 deferred common stock equivalents or units pursuant to provisions regarding the receipt of dividends under the Amended and Restated Director Fee Plan to four non-employee directors. These issuances were unregistered as they did not constitute a “sale” within the meaning of Section 2(3) of the Securities Act of 1933, as amended.
Since 2004, we have repurchased a total of $868.4 million of common stock at an average cost per share of $9.70. During the three months ended December 31, 2007, we repurchased 21,614,539 shares of our common stock at an aggregate cost of $293.4 million and an average cost per share of $13.57. In November 2007, our Board of Directors approved an increase in our share repurchase program authorizing the investment of up to an additional $250 million to repurchase our common stock. The remaining dollar value of shares to be purchased under the share repurchase program was $145.6 million at December 31, 2007. As discussed in Item 1A, our credit agreement and debt securities contain covenants that restrict our ability to repurchase our common stock. Pursuant to the program, we repurchased shares of our common stock during the fourth quarter of 2007 as set forth in the table below:
| | | | | | | | | | | | | | | | | |
| | | | | | | | | Total Number of
| | | Dollar Value of
| |
| | | Total Number
| | | Average
| | | Shares Purchased
| | | Shares That May
| |
| | | of Shares
| | | Price Paid
| | | as Part of Publicly
| | | Yet be Purchased
| |
Period | | Purchased | | | per Share | | | Announced Programs | | | Under the Program | |
| |
| October 1, 2007 — October 31, 2007 | | | 3,518,100 | | | $ | 13.21 | | | | 3,518,100 | | | $ | 142,477,192 | |
| November 1, 2007 — November 30, 2007 | | | 13,590,245 | | | $ | 13.68 | | | | 13,590,245 | | | $ | 206,609,329 | |
| December 1, 2007 — December 31, 2007 | | | 4,506,194 | | | $ | 13.54 | | | | 4,506,194 | | | $ | 145,598,820 | |
| | | | | | | | | | | | | | | | | |
| | | | 21,614,539 | | | | | | | | 21,614,539 | | | | | |
Subsequent to December 31, 2007, we repurchased an additional 1,645,600 shares of common stock at an aggregate cost of $22.5 million including commissions (average cost per share of $13.68). After these purchases, the remaining dollar value of shares authorized to be purchased under our share repurchase program was approximately $123.1 million.
| |
| Item 6. | Selected Financial Data. |
The table below contains selected consolidated financial data for the years ended December 31, 2003 through December 31, 2007. The statement of operations data includes reclassifications of certain items to conform to current period presentations with no impact on net income or financial position.
The data set forth below should be read in conjunction with our consolidated financial statements and accompanying notes to the consolidated financial statements included in thisForm 10-K. This historical information is not necessarily indicative of future results.
17
Selected Consolidated Financial Information
| | | | | | | | | | | | | | | | | | | | | |
| | | Years Ended December 31, | |
| | | 2007(5) | | | 2006 | | | 2005 | | | 2004 | | | 2003 | |
| | | (Dollars in millions, except per share amounts) | |
| |
Selected Consolidated Statements of Operations Data: | | | | | | | | | | | | | | | | | | | | |
| Revenue | | $ | 2,285.3 | | | $ | 1,752.9 | | | $ | 1,717.0 | | | $ | 1,832.0 | | | $ | 2,314.5 | |
| Income from continuing operations before cumulative effect of accounting changes | | $ | 243.3 | | | $ | 52.6 | | | $ | 55.1 | | | $ | 117.4 | | | $ | 69.1 | |
| Income from discontinued operations, net of tax(1) | | $ | 4.4 | | | $ | 3.9 | | | $ | 4.5 | | | $ | 43.8 | | | $ | 16.0 | |
| Cumulative effect of accounting changes, net of tax(2)(3)(4) | | | — | | | | — | | | $ | (187.5 | ) | | $ | (50.6 | ) | | | — | |
| Net income (loss) | | $ | 247.7 | | | $ | 56.5 | | | $ | (127.9 | ) | | $ | 110.7 | | | $ | 85.1 | |
| Earnings (loss) per share: | | | | | | | | | | | | | | | | | | | | |
| Income from continuing operations before cumulative effect of accounting changes | | | | | | | | | | | | | | | | | | | | |
| Basic | | $ | .85 | | | $ | .18 | | | $ | .18 | | | $ | .37 | | | $ | .23 | |
| Diluted | | $ | .83 | | | $ | .18 | | | $ | .18 | | | $ | .36 | | | $ | .23 | |
| Net income (loss) | | | | | | | | | | | | | | | | | | | | |
| Basic | | $ | .87 | | | $ | .19 | | | $ | (.42 | ) | | $ | .35 | | | $ | .28 | |
| Diluted | | $ | .85 | | | $ | .19 | | | $ | (.42 | ) | | $ | .34 | | | $ | .28 | |
| Cash dividends declared per share | | $ | 0.13 | | | $ | 0.105 | | | $ | 0.10 | | | $ | — | | | $ | — | |
Selected Consolidated Balance Sheet Data (at December 31): | | | | | | | | | | | | | | | | | | | | |
| Total assets | | $ | 8,932.2 | | | $ | 9,729.4 | | | $ | 7,544.8 | | | $ | 8,227.2 | | | $ | 7,571.2 | |
| Long-term debt (less current maturities), including capital leases | | $ | 1,820.1 | | | $ | 1,912.7 | | | $ | 1,186.5 | | | $ | 1,200.4 | | | $ | 1,530.1 | |
| Stockholders’ equity | | $ | 1,492.1 | | | $ | 1,594.8 | | | $ | 1,581.6 | | | $ | 1,843.0 | | | $ | 1,516.3 | |
Selected Consolidated Statement of Cash Flows Data: | | | | | | | | | | | | | | | | | | | | |
| Net cash provided by operating activities | | $ | 356.2 | | | $ | 324.2 | | | $ | 312.9 | | | $ | 94.2 | | | $ | 374.3 | |
| | |
| (1) | | Our operations in Singapore, which were sold in 2006 and in Argentina, Uruguay, and Chile, which were sold in 2005 have been classified as discontinued operations for all periods presented. The operations of Mayflower, which were sold in 2007, have been classified as discontinued operations in 2007 and 2006 (since acquisition). For more information regarding discontinued operations, see Part II, Item 8. Financial Statements and Supplementary Data, Note 20, of thisForm 10-K. |
| |
| (2) | | Results for 2007, 2006, and 2005 reflect our change in accounting for direct selling costs related to preneed funeral and cemetery contracts. Results for 2005 include a $187.5 million charge, net of tax, for the cumulative effect of this change. For more information regarding this accounting change, see Part II, Item 8. Financial Statements and Supplementary Data, Note 3, of thisForm 10-K. |
| |
| (3) | | On March 18, 2004, we implemented revised Financial Accounting Standards Board (FASB) Interpretation No. 46 (FIN 46R). Under the provisions of FIN 46R, we are required to consolidate our preneed funeral and cemetery merchandise and service trust assets, cemetery perpetual care trusts, and certain cemeteries. As a result of this accounting change, we recognized a cumulative effect charge of $14.0 million, net of tax, in 2004. |
| |
| (4) | | Results for 2007, 2006, 2005, and 2004 reflect our change in accounting for pension gains and losses. Results for 2004 include a $36.6 million charge, net of tax, for the cumulative effect of this change. |
| |
| (5) | | Results for 2007 include a $158.1 million pretax gain on redemption of securities. |
18
| |
| Item 7. | Management’s Discussion and Analysis of Financial Condition and Results of Operations. |
The Company
We are North America’s leading provider of deathcare products and services, with a network of funeral homes and cemeteries unequalled in geographic scale and reach. During 2007, we accomplished our key goal by substantially completing the integration of Alderwoods into our operations. By combining the two leading companies in the deathcare industry, we have realized several cost-saving synergies through the elimination of duplicate information technology systems and infrastructure; duplicate accounting, finance, legal, and other systems; overlapping management; and duplicate executive and public company costs. In connection with the acquisition of Alderwoods, we identified annual pretax cost savings and revenue enhancement opportunities totaling $90 million to $100 million related to our integration of Alderwoods.
We continue to focus on returning capital to our shareholders. Since August 2004, we have invested nearly $1 billion in cumulative stock repurchases and quarterly dividends. We currently have over $123.1 million authorized to repurchase our common stock. Our financial stability is further enhanced by our $6.7 billion backlog of future revenues at December 31, 2007, which is the result of preneed funeral and cemetery sales. We believe we have the financial strength and flexibility to reward shareholders through dividends while maintaining a prudent capital structure and pursuing new opportunities for profitable growth.
Strategies for Growth
We are confident about our competitive position, our financial strength, and our ability to further our principal strategies to generate profitable growth over the long-term are as follows:
Target Our Customer
In 2007, we made good progress in better understanding our atneed consumers and their preferences. We are replacing the industry’s traditional one-size-fits-all service approach with a flexible operating and marketing strategy that is tailored to our customers’ needs. By doing so, we can focus our resources on the most profitable customer categories and improve our effectiveness. We continue to refine our pricing, product and market strategies to support this approach.
Consistent with this strategy, we made local business decisions in the last few years to exit unprofitable business relationships and activities, which resulted in a decrease in the number of total funeral services performed. However, we also experienced significant improvements in average revenue per funeral service. We expect these improvements to continue into the future as we redeploy resources to more profitable areas. We continue to analyze our existing operations, including those acquired in the Alderwoods acquisition, and may exit certain business relationships or activities that do not fit our customer segmentation strategy.
Going forward, our primary focus is shifting to the preneed consumer. We intend to develop a more compelling marketing message that is tailored to our customers and explore new marketing channels that will take advantage of our size. We are improving our selling approach and process to better attract and educate prospective customers. We continue to review our product and service offerings for opportunities to better serve our customers. And, we are working to establish an appropriate and effective means of ongoing communications with our preneed consumers that will lead to referrals.
Drive Operating Discipline and Leverage Our Scale
Although we have already made substantial improvements to our infrastructure, we believe we can continue to achieve operating improvements through better centralization and standardization of processes for staffing, central care, fleet management and cemetery maintenance. The acquisition of Alderwoods provides further opportunities for synergies and operating efficiencies, which will allow us to utilize our scale and increase profitability. We have developed and will continue to refine operating standards and track shared best practices to support higher productivity. We also intend to continue to capitalize on our nationwide network of properties by pursuing strategic affinity partnerships. Over the longer term, we believe these relationships can be important to potential customers in their funeral home and cemetery selection process.
19
Manage and Grow the Footprint
We are managing our network of business locations by positioning each business location to support the preferences of its local customer base while monitoring each market for changing demographics and competitive dynamics. As we develop comprehensive plans for each of our markets, we anticipate that we will have opportunities to decrease the number of locations without losing significant earnings. In addition, we expect to pursue selective business expansion through construction or targeted acquisitions of cemeteries and funeral homes with a focus on the highest return customer categories. Over the long term, our size and scale also allow us the opportunity to pursue a franchise business model, which could drive incremental revenue at very little cost.
Financial Condition, Liquidity and Capital Resources
Capital Allocation Considerations
Since 1999, we have gained significant financial flexibility by reducing debt and improving our cash flow. We rely on cash flow from operations as a significant source of liquidity. Our cash flow from operating activities provided $356.2 million in 2007. Our current cash and cash equivalents balance is approximately $150 million as of February 25, 2008. In addition, we have approximately $246 million in borrowing capacity under our5-year revolving credit facility (which is currently supporting $54.3 million of letters of credit). We have $45.2 million in 6.5% notes due in March 2008; however, we intend to refinance these notes on a long-term basis through the utilization of our revolving credit agreement. We believe these sources of liquidity can be supplemented by our ability to access the capital markets for additional debt or equity securities.
In order to finance the Alderwoods acquisition, we significantly increased our indebtedness in the fourth quarter of 2006. In addition to using $608 million of cash on hand, we issued $500 million in senior notes, $200 million in privately placed debt securities, and took out a $150 million term loan for up to three years under our new credit facility. We prepaid $50 million of our term loan indebtedness in December 2006 and prepaid the remaining $100 million in 2007. At December 31, 2007, our current liabilities exceeded our current assets by $5.1 million. We believe our future operating cash flows and the available capacity under our credit facility described above will be adequate to meet our working capital needs.
During 2007, we had the following issuances and repayments of our debt:
| | | | | | | | | | | | |
| | | Interest Rate | | | Principal | | | Due Date |
| | | (In millions) |
Issuances | | | | | | | | | | | |
| Notes | | | 6.75% | | | $ | 200 | | | | 2015 |
| Notes | | | 7.5% | | | | 200 | | | | 2027 |
| | | | | | | | | | | | |
| Issuances through December 31, 2007 | | | | | | $ | 400 | | | | |
| | | | | | | | | | | | |
Repayments — normal retirements | | | | | | | | | | | |
| Notes | | | 6.875% | | | $ | 13 | | | | 2007 |
| Other | | | various | | | | 16 | | | | various |
| | | | | | | | | | | | |
| Repayments through December 31, 2007 | | | | | | $ | 29 | | | | |
| | | | | | | | | | | | |
Repayments — early extinguishment | | | | | | | | | | | |
| Notes | | | 6.5% | | | $ | 150 | | | | 2008 |
| Notes | | | 7.7% | | | | 174 | | | | 2009 |
| Senior Notes Series A | | | Libor + 2.0% | | | | 50 | | | | 2011 |
| Term Loan | | | Libor + 2.0% | | | | 100 | | | | 2009 |
| | | | | | | | | | | | |
| Repayments through December 31, 2007 | | | | | | $ | 474 | | | | |
| | | | | | | | | | | | |
We will continue to focus on funding growth initiatives that generate increased profitability, revenue, and cash flows. These capital investments include the construction of high-end cemetery property (such as private family estates) and the construction of funeral home facilities. We will also consider the acquisition of additional deathcare operations that fit our long-term customer-focused strategy, if the expected returns exceed our cost of capital.
20
We paid our shareholders cash dividends from 1974 to 1999. In early 2005, we resumed paying shareholders a quarterly cash dividend of $0.025 per common share. In November 2006, we increased our quarterly dividend to $0.03 per common share. In November 2007, we increased our dividend to $0.04 per common share. While we intend to pay regular quarterly cash dividends for the foreseeable future, all future dividends are subject to final determination by our Board of Directors each quarter after its review of our financial performance and to limitations in debt covenants.
We currently have approximately $123.1 million authorized under our share repurchase program. We intend to make purchases from time to time in the open market or through privately negotiated transactions, subject to market conditions, debt covenants, and normal trading restrictions. Our credit agreement and privately-placed debt securities contain covenants that limit our ability to repurchase our common stock. There can be no assurance that we will buy our common stock under our share repurchase program in the future.
Cash Flow
We believe our ability to generate strong operating cash flow is one of our fundamental financial strengths and provides us with substantial flexibility in meeting operating and investing needs. Highlights of cash flow for the year ended December 31, 2007 compared to 2006 and 2005 are as follows:
Operating Activities — Cash flows from operating activities were $356.2 million in 2007 compared to $324.2 million in 2006. The 2006 cash flows from operating activities increased by $11.4 million as compared to the operating cash flows in 2005. Included in 2007 are one-time transition costs related to the Alderwoods acquisition of $38.6 million, $11.7 million of premiums paid on the early extinguishment of debt, pension termination costs of $40.9 million, and a distribution from our equity investment in our French operations of $17.0 million. Included in 2006 are transition costs related to the Alderwoods acquisition of $3.2 million and $15.7 million of premiums paid on the early extinguishment of debt. Included in 2005 was a federal income tax refund of $29.0 million and $12.2 million of premiums paid on the early extinguishment of debt.
Excluding the above items, cash flows from operating activities in 2007 increased approximately $87 million compared to 2006. This increase includes additional cash flow and synergies achieved related to the Alderwoods acquisition as well as $26.1 million in trust proceeds arising from our recent reconciliations of the preneed funeral and cemetery backlogs of Alderwoods. These increases were partially offset by $42.4 million in additional interest payments resulting from increased borrowings to finance the Alderwoods acquisition and $29 million in additional cash tax payments.
In addition to the items discussed above, the increase in operating cash flows in 2006 as compared to 2005 is the result of $21.2 million of rent payments that were classified in operating cash flows in 2005, but which are classified as principal payments on capital leases as a component of cash flows from financing activities in 2006 due to our revised lease terms. The remaining increase is the result of $10.9 million in proceeds from the redemption of convertible preferred equity certificates received in connection with our disposition of our operations in France, the receipt of $7.9 million of endowment care proceeds as a result of the resolution of disputes over ownership rights, and a net source of approximately $10.0 million from working capital. This working capital source resulted from an increase in preneed and atneed cash receipts, and increases in cash interest income, which were partially offset by an increase in bonus and long-term incentive compensation payments in 2006 related to a 2003 compensation program.
We did not pay federal income taxes in 2006 or 2005. Because of our net operating loss carryforwards, we did not pay federal income taxes until the fourth quarter of 2007. The federal income tax payment was $8.3 million in 2007. We expect to pay federal income taxes in 2008. Foreign, state, and local income tax payments increased $20.6 million to $36.2 million in 2007 as compared to $15.6 million in 2006 and $6.6 million in 2005 primarily as a result of the additional taxable income generated from our Alderwoods operations acquired at the end of 2006.
Investing Activities — Investing activities provided net cash flows of $378.1 million in 2007 compared to net cash used of $1.3 billion in 2006, due to $1.3 billion in cash outflows for acquisitions in 2006 (primarily Alderwoods) and a $327.5 million increase in proceeds from divestitures in 2007 compared to 2006. The 2006 net
21
cash outflows from investing activities of $1.3 billion represents a $1.5 billion change from 2005 primarily due to the 2006 acquisition of Alderwoods.
In 2007, we completed the sale of Mayflower National Life Insurance Company, Alderwoods former insurance subsidiary, and we divested all of our properties required to be divested by the FTC as a result of the Alderwoods acquisition. We also received $4.7 million of proceeds held as an income tax receivable related to the 2005 sale of our operations in Chile, $1.9 million in cash proceeds related to the 2006 sale of our operations in Singapore, and $144.0 million related to redemption of securities.
In 2006, we acquired Alderwoods for $1.2 billion, including refinancing of $357.7 million of Alderwoods debt. We also received $11.0 million of proceeds held as an income tax receivable related to the 2005 sale of our operations in Chile and $10.6 million in cash proceeds from the fourth quarter 2006 sale of our operations in Singapore.
In 2005, we received $90.4 million from the disposition of our cemetery operations in Chile, $42.7 million related to the collection of the EUR 10 million note receivable and the redemption of preferred equity certificates related to our equity investment in our former French operations (of which $39.7 million is reported as an investing activity), and $21.6 million from the disposition of our Argentina and Uruguay businesses.
Financing Activities — Cash flows from financing activities used $607.5 million in 2007 compared to generating $565.2 million in 2006. This $1.2 billion net decrease in financing cash flows in 2007 compared to 2006 was driven by lower proceeds from the issuance of long-term debt, higher share repurchases, and an increase in debt extinguishments. Cash flows from financing activities generated incremental cash of $891.6 million in 2006 compared to 2005 primarily due to higher proceeds from the issuance of long-term debt, a reduction in share repurchases, and a reduction in debt payments.
Proceeds from long-term debt (net of debt issuance costs) were $392.6 million in 2007 due to the issuance of $200.0 million of senior unsecured 6.75% notes due 2015 and $200.0 million of senior unsecured 7.50% notes due 2027. Proceeds from long-term debt (net of debt issuance costs) were $825.3 million in 2006 due to the issuance of $250.0 million of senior unsecured 7.625% notes due 2018, $250.0 million of senior unsecured 7.375% notes due 2014, $200 million of private placement offerings, and $150 million term loan. Proceeds from long term debt (net of debt issuance costs) were $291.5 million in 2005 due to the issuance of $300 million of senior unsecured 7.00% notes due 2017.
Payments of debt in 2007 were $528.8 million due to early extinguishments of $472.5 million, the acceptance of the tender of $13.5 million of our 6.875% notes due October 2007, $3.7 million in scheduled debt payments, $27.1 million in payments on capital leases, and $12.0 million of other note payments. Payments of debt in 2006 were $228.9 million due to early extinguishments of $181.5 million, $26.1 million in scheduled debt payments, and $21.3 million in payments on capital leases. The $377.1 million of debt payments in 2005 include early extinguishments of $291.3 million, the $63.5 million final payment of our 6.00% notes due December 2005 and $22.3 million of other note payments.
We repurchased 38.5 million shares of common stock for $505.1 million in 2007, compared to 3.4 million shares for $27.9 million in 2006 and 31.0 million shares for $225.1 million in 2005.
We paid $34.6 million of cash dividends during 2007, $29.4 million of cash dividends during 2006 and $22.6 million of cash dividends during 2005 related to the quarterly cash dividend reinstated in 2005 by the Board of Directors.
Off-Balance Sheet Arrangements, Contractual Obligations, and Commercial and Contingent Commitments
We have assumed various financial obligations and commitments in the ordinary course of conducting our business. We have contractual obligations requiring future cash payments under existing contractual arrangements, such as debt maturities, interest on long-term debt, and employment, consulting, and non-competition agreements. We also have commercial and contingent obligations that result in cash payments only if certain events occur requiring our performance pursuant to a funding commitment.
22
The following table details our known future cash payments (on an undiscounted basis) related to various contractual obligations as of December 31, 2007.
| | | | | | | | | | | | | | | | | | | | | |
| | | Payments Due by Period | |
Contractual Obligations | | 2008 | | | 2009-2010 | | | 2011-2012 | | | Thereafter | | | Total | |
| | | (Dollars in millions) | |
| |
| Debt maturities(1)(2) | | $ | 36.6 | | | $ | 91.4 | | | $ | 209.2 | | | $ | 1,519.5 | | | $ | 1,856.7 | |
| Interest obligation on long-term debt(3) | | | 131.1 | | | | 254.0 | | | | 233.3 | | | | 570.1 | | | | 1,188.5 | |
| Operating lease agreements(4) | | | 11.3 | | | | 18.4 | | | | 13.1 | | | | 55.4 | | | | 98.2 | |
| Employment, consulting, and non-competition agreements(5) | | | 7.9 | | | | 5.6 | | | | 2.1 | | | | 1.4 | | | | 17.0 | |
| Pension termination(6) | | | 3.9 | | | | — | | | | — | | | | — | | | | 3.9 | |
| | | | | | | | | | | | | | | | | | | | | |
Total contractual obligations | | $ | 190.8 | | | $ | 369.4 | | | $ | 457.7 | | | $ | 2,146.4 | | | $ | 3,164.3 | |
| | | | | | | | | | | | | | | | | | | | | |
| | |
| (1) | | Our outstanding indebtedness contains standard provisions, such as payment delinquency default clauses and change of control clauses. In addition, our bank credit agreement contains a maximum leverage ratio and a minimum interest coverage ratio. See Part II, Item 8. Financial Statements and Supplementary Data, Note 11 of thisForm 10-K for additional details of our long-term debt. |
| |
| (2) | | Included in2011-2012 is $45.2 million of 6.5% notes due March 2008 which we intend to refinance on a long-term basis through the utilization of our revolving credit agreement due November 2011. |
| |
| (3) | | Approximately 89% of our total debt is fixed rate debt for which the interest obligation was calculated at the stated rate. Future interest obligations on our floating rate debt are based on the current forward rate curve of the underlying index. |
| |
| (4) | | The majority of our lease arrangements contain options to (i) purchase the property at fair value on the exercise date, (ii) purchase the property for a value determined at the inception of the leases, or (iii) renew for the fair rental value at the end of the primary lease term. Our leases primarily relate to funeral service locations and cemetery operating and maintenance equipment. See Part II, Item 8. Financial Statements and Supplementary Data, Note 13 of thisForm 10-K for additional details related to leases. |
| |
| (5) | | We have entered into management employment, consulting and non-competition agreements which contractually require us to make cash payments over the contractual period. The agreements have been primarily entered into with certain officers and employees and former owners of businesses acquired. Agreements with contractual periods less than one year are excluded. See Part II, Item 8. Financial Statements and Supplementary Data, Note 13 of thisForm 10-K for additional details related to these agreements. |
| |
| (6) | | We have committed to a plan to terminate the Employee Retirement Plan of Rose Hills in 2008. See Part II, Item 8. Financial Statements and Supplementary Data, Note 16 of thisForm 10-K for additional details related to our pension plans. |
The following table details our known potential or possible future cash payments (on an undiscounted basis) related to various commercial and contingent obligations as of December 31, 2007.
| | | | | | | | | | | | | | | | | | | | | |
| | | Expiration by Period | |
Commercial and Contingent Obligations | | 2008 | | | 2009-2010 | | | 2011-2012 | | | Thereafter | | | Total | |
| | | (Dollars in millions) | |
| |
| Surety obligations(1) | | $ | 235.9 | | | $ | — | | | $ | — | | | $ | — | | | $ | 235.9 | |
| Long-term obligations related to uncertain tax positions(2) | | | — | | | | 177.8 | | | | — | | | | — | | | | 177.8 | |
| Letters of credit(3) | | | 54.3 | | | | — | | | | — | | | | — | | | | 54.3 | |
| Representations and warranties(4) | | | — | | | | 33.5 | | | | — | | | | — | | | | 33.5 | |
| Income distributions from trust(5) | | | 44.2 | | | | — | | | | — | | | | — | | | | 44.2 | |
| | | | | | | | | | | | | | | | | | | | | |
Total commercial and contingent obligations | | $ | 334.4 | | | $ | 211.3 | | | $ | — | | | $ | — | | | $ | 545.7 | |
| | | | | | | | | | | | | | | | | | | | | |
23
| | |
| (1) | | Represents the aggregate refund obligation associated with our surety bond arrangements. See the section titled “Financial Assurances” following this table in thisForm 10-K for more information related to surety bonds. |
| |
| (2) | | We adopted the provisions of FIN 48 on January 1, 2007 (see Part II, Item 8. Financial Statements and Supplementary Data, Note 10 for additional information). In accordance with the provisions of FIN 48, we have recorded $177.8 million of unrecognized tax benefits and related interest and penalties. Due to the uncertainty regarding the timing and completion of audits and possible outcomes, it is not possible to estimate the ranges of increase and decrease and the timing thereof; however, we believe the existing liabilities will expire by 2010. |
| |
| (3) | | We are occasionally required to post letters of credit, issued by a financial institution, to secure certain insurance programs or other obligations. Letters of credit generally authorize the financial institution to make a payment to the beneficiary upon the satisfaction of a certain event or the failure to satisfy an obligation. The letters of credit are generally posted for one-year terms and are usually automatically renewed upon maturity until such time as we have satisfied the commitment secured by the letter of credit. We are obligated to reimburse the issuer only if the beneficiary collects on the letter of credit. We believe that it is unlikely we will be required to fund a claim under our outstanding letters of credit. As of December 31, 2007, the full amount of the letters of credit was supported by our credit facility which expires November 2011. |
| |
| (4) | | In addition to the letters of credit described above, we currently have contingent obligations of $33.5 million related to our asset sales and joint venture transactions. We have agreed to guarantee certain representations and warranties associated with such disposition transactions with letters of credit or interest-bearing cash investments. We have interest-bearing cash investments of $23.0 million included inDeferred charges and other assetspledged as collateral for certain of these contingent obligations. We do not believe we will ultimately be required to fund to third parties any claims against these representations and warranties. During the year ended December 31, 2004, we recognized $35.8 million of contractual obligations related to representations and warranties associated with the disposition of our funeral operations in France. The remaining obligations of $23.5 million at December 31, 2007 are primarily related to certain foreign taxes and certain litigation matters. This amount is recorded inOther liabilitiesin our consolidated balance sheet. See Part II, Item 8. Financial Statements and Supplementary Data, Note 13 for additional information related to this obligation. |
| |
| (5) | | In certain states and provinces, we have withdrawn allowable distributable earnings including unrealized gains prior to the maturity or cancellation of the related contract. In the event of market declines, we may be required to re-deposit portions or all of these amounts into the respective trusts in some future period. |
Financial Assurances
In support of our operations, we have entered into arrangements with certain surety companies whereby such companies agree to issue surety bonds on our behalf as financial assuranceand/or as required by existing state and local regulations. The surety bonds are used for various business purposes; however, the majority of the surety bonds issued and outstanding have been used to support our preneed funeral and cemetery sales activities. The obligations underlying these surety bonds are recorded on the consolidated balance sheet asDeferred preneed funeral revenuesandDeferred preneed cemetery revenues.The breakdown of surety bonds between funeral and cemetery preneed arrangements, as well as surety bonds for other activities, is described below.
24
| | | | | | | | | |
| | | December 31,
| | | December 31,
| |
| | | 2007 | | | 2006 | |
| | | (Dollars in millions) | |
| |
| Preneed funeral | | $ | 134.9 | | | $ | 137.0 | |
| Preneed cemetery: | | | | | | | | |
| Merchandise and services | | | 148.0 | | | | 162.0 | |
| Pre-construction | | | 6.4 | | | | 8.6 | |
| | | | | | | | | |
| Bonds supporting preneed funeral and cemetery obligations | | | 289.3 | | | | 307.6 | |
| | | | | | | | | |
| Bonds supporting preneed business permits | | | 5.4 | | | | 3.6 | |
| Other bonds | | | 8.4 | | | | 12.4 | |
| | | | | | | | | |
| Total surety bonds outstanding | | $ | 303.1 | | | $ | 323.6 | |
| | | | | | | | | |
When selling preneed funeral and cemetery contracts, we may post surety bonds where allowed by state law. We post the surety bonds in lieu of trusting a certain amount of funds received from the customer. The amount of the bond posted is generally determined by the total amount of the preneed contract that would otherwise be required to be trusted, in accordance with applicable state law. For the years ended December 31, 2007, 2006, and 2005, we had $38.4 million, $50.9 million and $64.0 million, respectively, of cash receipts attributable to bonded sales. These amounts do not consider reductions associated with taxes, obtaining costs, or other costs.
Surety bond premiums are paid annually and are automatically renewable until maturity of the underlying preneed contracts, unless we are given prior notice of cancellation. Except for cemetery pre-construction bonds (which are irrevocable), the surety companies generally have the right to cancel the surety bonds at any time with appropriate notice. In the event a surety company was to cancel the surety bond, we are required to obtain replacement surety assurance from another surety company or fund a trust for an amount generally less than the posted bond amount. Management does not expect we will be required to fund material future amounts related to these surety bonds because of lack of surety capacity.
Preneed Funeral and Cemetery Activities and Backlog of Contracts
In addition to selling our products and services to client families at the time of need, we sell price-guaranteed preneed funeral and cemetery contracts, which provide for future funeral or cemetery services and merchandise. Since preneed funeral and cemetery services or merchandise will not be provided until some time in the future, most states and provinces require that all or a portion of the funds collected from customers on preneed funeral and cemetery contracts be paid into merchandise and service trusts until the merchandise is delivered or the service is performed. In certain situations, as described above, where permitted by state or provincial laws, we post a surety bond as financial assurance for a certain amount of the preneed funeral or cemetery contract in lieu of placing funds into trust accounts. Our backlog of funeral and cemetery contracts shown below represents the total amount of future revenues we have under contract at the end of 2007 and 2006.
Trust-Funded Preneed Funeral and Cemetery Contracts: The funds deposited into trust (in accordance with various state and provincial laws) are invested by independent trustees in accordance with the investment guidelines established by statute or, where the prudent investor rule is applicable, the guidelines established by the Investment Committee of our Board of Directors. We retain any funds above the amounts required to be deposited into trust accounts and use them for working capital purposes, generally to offset the selling and administrative costs of the preneed programs.
Investment earnings associated with the trust investments are expected to mitigate the inflationary costs of providing the preneed funeral and cemetery services and merchandise in the future for the prices that were guaranteed at the time of sale. The preneed funeral and cemetery trust assets are consolidated and recorded in our consolidated balance sheet at market value. Investment earnings on trust assets are generally accumulated in the trust and distributed as the revenue associated with the preneed funeral or cemetery contract is recognized or cancelled by the customer. In certain states and provinces, the trusts are allowed to distribute a portion of the investment earnings to us prior to that date.
25
If a preneed funeral or cemetery contract is cancelled prior to delivery, state or provincial law determines the amount of the refund owed to the customer, if any, including the amount of the attributed investment earnings. Upon cancellation, we receive the amount of principal deposited to trust and previously undistributed net investment earnings and, where required, issue a refund to the customer. We retain excess funds, if any, and recognize the attributed investment earnings (net of any investment earnings payable to the customer) as revenue in our consolidated statement of operations. In certain jurisdictions, we may be obligated to fund any shortfall if the amounts deposited by the customer exceed the funds in trust. Based on our historical experience, we have included a cancellation reserve for preneed funeral and cemetery contracts in our consolidated balance sheet of $143.7 million and $151.3 million as of December 31, 2007 and 2006, respectively.
The cash flow activity over the life of a trust funded preneed funeral or cemetery contract from the date of sale to its recognition or cancellation is captured in the operating cash flow line items(Increase) decrease in preneed receivables and trust investments, Increase (decrease) in deferred preneed revenue, Increase (decrease) in non-controlling interestandNet income (loss) in the consolidated statement of cash flows. While the contract is outstanding, cash flow is provided by the amount retained from funds collected from the customer and any distributed investment earnings. At the time of death maturity, we receive the principal and undistributed investment earnings from the funeral trust and any remaining receivable due from the customer. At the time of delivery or storage of cemetery merchandise and service items for which we were required to deposit funds to trust, we receive the principal and undistributed investment earnings from the cemetery trust. There is generally no remaining receivable due from the customer, as our policy is to deliver preneed cemetery merchandise and service items only upon payment of the contract balance in full. This cash flow at the time of service, delivery, or storage is generally less than the associated revenue recognized, thus reducing cash flow from operating activities.
26
The tables below detail our North America results of preneed funeral and cemetery production and maturities, excluding insurance contracts, for the years ended December 31, 2007 and 2006.
| | | | | | | | | |
| | | North America | |
| | | Years Ended
| |
| | | December 31, | |
| | | 2007 | | | 2006 | |
| | | (Dollars in millions) | |
| |
Funeral: | | | | | | | | |
| Preneed trust-funded (including bonded): | | | | | | | | |
| Sales production | | $ | 148.5 | | | $ | 121.9 | |
| | | | | | | | | |
| Sales production (number of contracts) | | | 30,363 | | | | 27,062 | |
| | | | | | | | | |
| Maturities | | $ | 210.1 | | | $ | 166.9 | |
| | | | | | | | | |
| Maturities (number of contracts) | | | 46,998 | | | | 40,813 | |
| | | | | | | | | |
Cemetery: | | | | | | | | |
| Sales production: | | | | | | | | |
| Preneed | | $ | 399.3 | | | $ | 308.0 | |
| Atneed | | | 272.8 | | | | 219.8 | |
| | | | | | | | | |
| Total sales production | | | 672.1 | | | | 527.8 | |
| | | | | | | | | |
| Sales production deferred to backlog: | | | | | | | | |
| Preneed | | $ | 169.7 | | | $ | 146.9 | |
| Atneed | | | 204.7 | | | | 164.3 | |
| | | | | | | | | |
| Total sales production deferred to backlog | | | 374.4 | | | | 311.2 | |
| | | | | | | | | |
| Revenue recognized from backlog: | | | | | | | | |
| Preneed | | $ | 176.1 | | | $ | 143.5 | |
| Atneed | | | 203.4 | | | | 162.3 | |
| | | | | | | | | |
| Total revenue recognized from backlog | | | 379.5 | | | | 305.8 | |
| | | | | | | | | |
Insurance-Funded Preneed Funeral Contracts: Where permitted by state or provincial law, customers may arrange their preneed funeral contract by purchasing a life insurance or annuity policy from third-party insurance companies, for which we earn a commission as general sales agent for the insurance company. These general agency commissions (GA revenues) are based on a percentage per contract sold and are recognized as funeral revenues when the insurance purchase transaction between the customer and third-party insurance provider is completed. Direct selling costs incurred pursuant to the sale of insurance-funded preneed funeral contracts are expensed as incurred. The policy amount of the insurance contract between the customer and the third-party insurance company generally equals the amount of the preneed funeral contract. We do not reflect the unfulfilled insurance-funded preneed funeral contract amounts in our consolidated balance sheet. Approximately 66% of our North America preneed funeral production in 2007 relates to insurance-funded preneed funeral contracts.
The third-party insurance company collects funds related to the insurance contract directly from the customer. The life insurance contracts include a death benefit escalation provision, which is expected to offset the inflationary costs of providing the preneed funeral services and merchandise in the future at the prices that were guaranteed at the time of the preneed sale. The customer/policy holder assigns the policy benefits to our funeral home to pay for the preneed funeral contract at the time of need.
Additionally, we may receive cash overrides based on achieving certain dollar volume targets of life insurance policies sold as a result of marketing agreements entered into in connection with the sale of our insurance subsidiaries in 2000.
27
The table below details the North America results of insurance-funded preneed funeral production and maturities for the years ended December 31, 2007 and 2006, and the number of contracts associated with those transactions.
| | | | | | | | | |
| | | North America | |
| | | Years | | | Ended | |
| | | December 31, | |
| | | 2007 | | | 2006 | |
| | | (Dollars in millions) | |
| |
| Preneed funeral insurance-funded(1): | | | | | | | | |
| Sales production | | $ | 285.8 | | | $ | 192.1 | |
| | | | | | | | | |
| Sales production (number of contracts) | | | 50,566 | | | | 36,152 | |
| | | | | | | | | |
| General agency revenue | | $ | 44.8 | | | $ | 35.1 | |
| | | | | | | | | |
| Maturities | | $ | 241.6 | | | $ | 192.9 | |
| | | | | | | | | |
| Maturities (number of contracts) | | | 51,240 | | | | 42,022 | |
| | | | | | | | | |
| | |
| (1) | | Amounts are not included in the consolidated balance sheet. |
North America Backlog of Preneed Funeral and Cemetery Contracts: The following table reflects our North America backlog of trust-funded deferred preneed funeral and cemetery contract revenues including amounts related toNon-controlling interest in funeral and cemetery trustsat December 31, 2007 and 2006. Additionally, the table reflects our North America backlog of unfulfilled insurance-funded contracts (which was not included in our consolidated balance sheet) at December 31, 2007 and 2006. The backlog amounts presented are reduced by an amount that we believe will cancel before maturity based on historical experience.
The table also reflects our North America preneed funeral and cemetery receivables and trust investments (market and cost bases) associated with the backlog of deferred preneed funeral and cemetery contract revenues, net of the estimated cancellation allowance. We believe that the table below is meaningful because it sets forth the aggregate amount of future revenues we expect to recognize as a result of preneed sales, as well as the amount of assets associated with those revenues. Because the future revenues exceed the asset amounts, future revenues will exceed the cash distributions actually received from the associated trusts.
| | | | | | | | | | | | | | | | | |
| | | North America | |
| | | 2007 | | | 2006 | |
| | | Market | | | Cost | | | Market | | | Cost | |
| | | (Dollars in billions) | |
| |
| Backlog of trust-funded deferred preneed funeral revenues | | $ | 1.54 | | | $ | 1.53 | | | $ | 1.66 | | | $ | 1.62 | |
| Backlog of insurance-funded preneed funeral revenues | | $ | 3.36 | | | $ | 3.36 | | | $ | 2.98 | | | $ | 2.98 | |
| | | | | | | | | | | | | | | | | |
| Total backlog of preneed funeral revenues | | $ | 4.90 | | | $ | 4.89 | | | $ | 4.64 | | | $ | 4.60 | |
| | | | | | | | | | | | | | | | | |
| Assets associated with backlog of trust-funded deferred preneed funeral revenues, net of estimated allowance for cancellation | | $ | 1.32 | | | $ | 1.31 | | | $ | 1.45 | | | $ | 1.41 | |
| Insurance policies associated with insurance-funded deferred preneed funeral revenues, net of estimated allowance for cancellation | | $ | 3.36 | | | $ | 3.36 | | | $ | 2.98 | | | $ | 2.98 | |
| | | | | | | | | | | | | | | | | |
| Total assets associated with backlog of preneed funeral revenues | | $ | 4.68 | | | $ | 4.67 | | | $ | 4.43 | | | $ | 4.39 | |
| | | | | | | | | | | | | | | | | |
| Backlog of deferred cemetery revenues | | $ | 1.78 | | | $ | 1.75 | | | $ | 1.85 | | | $ | 1.78 | |
| | | | | | | | | | | | | | | | | |
| Assets associated with backlog of deferred cemetery revenues, net of estimated allowance for cancellation | | $ | 1.27 | | | $ | 1.25 | | | $ | 1.36 | | | $ | 1.30 | |
| | | | | | | | | | | | | | | | | |
28
The market value of funeral and cemetery trust investments was based primarily on quoted market prices at December 31, 2007 and 2006. The difference between the backlog and asset amounts represents the contracts for which we have posted surety bonds as financial assurance in lieu of trusting, the amounts collected from customers that were not required to be deposited into trust, and allowable cash distributions from trust assets. The table also reflects the amounts expected to be received from insurance companies through the assignment of policy proceeds related to insurance-funded funeral contracts.
Results of Operations — Years Ended December 31, 2007, 2006, and 2005
Management Summary
Our primary focus in 2007 was on integrating the operations of former Alderwoods businesses into our own. These businesses contributed $558.9 million in revenues during 2007. Other key highlights in 2007 included:
| | |
| | • | an improvement in 2007 gross margin percentage to 20.5% from 20.0% in 2006; |
| |
| | • | a 5.3% increase in North America comparable average revenue per funeral service compared to 2006, which more than offset a 4.0% decline in North America comparable funeral services performed; and |
| |
| | • | comparable cemetery revenue increased $16.8 million, or 3.1%, in 2007 compared to 2006. |
Results of Operations
In 2007, we reported consolidated net income of $247.7 million ($.85 per diluted share) compared to net income in 2006 of $56.5 million ($.19 per diluted share) and a net loss in 2005 of $127.9 million ($(.42) per diluted share). These results were impacted by large non-recurring items that decreased earnings, including:
| | |
| | • | after-tax accounting changes of $187.5 million in 2005; |
| |
| | • | net after-tax losses on asset sales of $50.1 million in 2006 and $31.2 million in 2005; |
| |
| | • | after-tax losses from the early extinguishment of debt of $8.7 million in 2007, $10.7 million in 2006, and $9.3 million in 2005; |
| |
| | • | after-tax expenses related to our acquisition and integration of Alderwoods of $16.5 million in 2007 and $4.3 million in 2006; |
| |
| | • | after-tax expenses related to our Alderwoods bridge financing of $3.9 million in 2006; and |
| |
| | • | after-tax expenses to settle our Cash Balance pension plan of $6.5 million in 2007. |
Significant non-recurring items that increased earnings included:
| | |
| | • | state net operating loss tax benefits of $11.9 million in 2005; |
| |
| | • | after-tax earnings from discontinued operations of $4.4 million in 2007, $3.9 million in 2006, and $4.5 million in 2005; |
| |
| | • | net after-tax gain from the sale of assets of $6.0 million in 2007; |
| |
| | • | after-tax gain on redemption of securities of $99.8 million in 2007; and |
| |
| | • | after-tax gain on sale of our equity investment in French operations of $17.6 million in 2007. |
29
Consolidated Versus Comparable Results — Years Ended December 31, 2007, 2006, and 2005
The table below reconciles our consolidated GAAP results to our comparable, or “same store,” results for the years ended December 31, 2007, 2006, and 2005. We define comparable operations (or same store operations) as those funeral and cemetery locations that were owned for the entire period beginning January 1, 2006 and ending December 31, 2007. The following tables present operating results for funeral and cemetery locations that were owned by us for all three years. As implied by our definition of comparable operations, these results specifically exclude any impact from the Alderwoods acquisition.
| | | | | | | | | | | | | | | | | |
| | | | | | Less:
| | | | | | | |
| | | | | | Activity
| | | Less:
| | | | |
| | | | | | Associated with
| | | Activity
| | | | |
| | | | | | Acquisition/New
| | | Associated with
| | | | |
2007 | | Consolidated | | | Construction | | | Dispositions | | | Comparable | |
| | | (Dollars in millions) | |
| |
| North America | | | | | | | | | | | | | | | | |
| Funeral revenue | | $ | 1,518.2 | | | $ | 389.2 | | | $ | 75.1 | | | $ | 1,053.9 | |
| Cemetery revenue | | | 760.0 | | | | 169.7 | | | | 36.7 | | | | 553.6 | |
| | | | | | | | | | | | | | | | | |
| | | | 2,278.2 | | | | 558.9 | | | | 111.8 | | | | 1,607.5 | |
| | | | | | | | | | | | | | | | | |
| Other foreign | | | | | | | | | | | | | | | | |
| Funeral revenue | | | 7.1 | | | | — | | | | — | | | | 7.1 | |
| | | | | | | | | | | | | | | | | |
| Total revenues | | $ | 2,285.3 | | | $ | 558.9 | | | $ | 111.8 | | | $ | 1,614.6 | |
| | | | | | | | | | | | | | | | | |
| North America | | | | | | | | | | | | | | | | |
| Funeral gross profits | | $ | 308.4 | | | $ | 85.8 | | | $ | 0.4 | | | $ | 222.2 | |
| Cemetery gross profits | | | 159.9 | | | | 39.0 | | | | 2.8 | | | | 118.1 | |
| | | | | | | | | | | | | | | | | |
| | | | 468.3 | | | | 124.8 | | | | 3.2 | | | | 340.3 | |
| | | | | | | | | | | | | | | | | |
| Other foreign | | | | | | | | | | | | | | | | |
| Funeral gross profits | | | 0.2 | | | | — | | | | — | | | | 0.2 | |
| | | | | | | | | | | | | | | | | |
| Total gross profit | | $ | 468.5 | | | $ | 124.8 | | | $ | 3.2 | | | $ | 340.5 | |
| | | | | | | | | | | | | | | | | |
30
| | | | | | | | | | | | | | | | | |
| | | | | | Less:
| | | Less:
| | | | |
| | | | | | Activity
| | | Activity
| | | | |
| | | | | | Associated with
| | | Associated
| | | | |
| | | | | | Acquisition/ New
| | | with
| | | | |
2006 | | Consolidated | | | Construction | | | Dispositions | | | Comparable | |
| | | (Dollars in millions) | |
| |
| North America | | | | | | | | | | | | | | | | |
| Funeral revenue | | $ | 1,155.3 | | | $ | 30.4 | | | $ | 83.8 | | | $ | 1,041.1 | |
| Cemetery revenue | | | 591.1 | | | | 13.8 | | | | 40.5 | | | | 536.8 | |
| | | | | | | | | | | | | | | | | |
| | | | 1,746.4 | | | | 44.2 | | | | 124.3 | | | | 1,577.9 | |
| | | | | | | | | | | | | | | | | |
| Other foreign | | | | | | | | | | | | | | | | |
| Funeral revenue | | | 6.5 | | | | — | | | | — | | | | 6.5 | |
| | | | | | | | | | | | | | | | | |
| Total revenues | | $ | 1,752.9 | | | $ | 44.2 | | | $ | 124.3 | | | $ | 1,584.4 | |
| | | | | | | | | | | | | | | | | |
| North America | | | | | | | | | | | | | | | | |
| Funeral gross profits | | $ | 241.6 | | | $ | 7.3 | | | $ | 4.3 | | | $ | 230.0 | |
| Cemetery gross profits | | | 108.3 | | | | 2.4 | | | | 1.8 | | | | 104.1 | |
| | | | | | | | | | | | | | | | | |
| | | | 349.9 | | | | 9.7 | | | | 6.1 | | | | 334.1 | |
| | | | | | | | | | | | | | | | | |
| Other foreign | | | | | | | | | | | | | | | | |
| Funeral gross profits | | | 0.4 | | | | — | | | | — | | | | 0.4 | |
| | | | | | | | | | | | | | | | | |
| Total gross profit | | $ | 350.3 | | | $ | 9.7 | | | $ | 6.1 | | | $ | 334.5 | |
| | | | | | | | | | | | | | | | | |
| | | | | | | | | | | | | |
| | | | | | Less:
| | | | |
| | | | | | Activity
| | | | |
| | | | | | Associated
| | | | |
| | | | | | with
| | | | |
2005 | | Consolidated | | | Dispositions | | | Comparable | |
| | | (Dollars in millions) | |
| |
| North America | | | | | | | | | | | | |
| Funeral revenue | | $ | 1,149.5 | | | $ | 142.7 | | | $ | 1,006.8 | |
| Cemetery revenue | | | 560.4 | | | | 56.0 | | | | 504.4 | |
| | | | | | | | | | | | | |
| | | | 1,709.9 | | | | 198.7 | | | | 1,511.2 | |
| | | | | | | | | | | | | |
| Other foreign | | | | | | | | | | | | |
| Funeral revenue | | | 7.1 | | | | 0.1 | | | | 7.0 | |
| | | | | | | | | | | | | |
| Total revenues | | $ | 1,717.0 | | | $ | 198.8 | | | $ | 1,518.2 | |
| | | | | | | | | | | | | |
| North America | | | | | | | | | | | | |
| Funeral gross profits | | $ | 220.7 | | | $ | 9.7 | | | $ | 211.0 | |
| Cemetery gross profits | | | 81.9 | | | | 0.6 | | | | 81.3 | |
| | | | | | | | | | | | | |
| | | | 302.6 | | | | 10.3 | | | | 292.3 | |
| | | | | | | | | | | | | |
| Other foreign | | | | | | | | | | | | |
| Funeral gross profits | | | 0.4 | | | | — | | | | 0.4 | |
| | | | | | | | | | | | | |
| Total gross profit | | $ | 303.0 | | | $ | 10.3 | | | $ | 292.7 | |
| | | | | | | | | | | | | |
The following table provides the data necessary to calculate our consolidated average revenue per funeral service for the years ended December 31, 2007, 2006, and 2005. We calculate average revenue per funeral service by dividing consolidated North America funeral revenue, excluding General Agency (GA) revenues and other revenues in order to avoid distorting
31
our averages of normal funeral services revenue, by the number of funeral services performed during the period.
| | | | | | | | | | | | | |
| | | 2007 | | | 2006 | | | 2005 | |
| | | (Dollars in millions, except average revenue per funeral service) | |
| |
| Consolidated funeral revenue | | $ | 1,525.3 | | | $ | 1,161.8 | | | $ | 1,156.6 | |
| Less: GA revenues | | | 44.8 | | | | 35.1 | | | | 27.6 | |
| Less: Other revenues | | | 12.5 | | | | 12.3 | | | | 37.9 | |
| | | | | | | | | | | | | |
| Adjusted Consolidated funeral revenue | | $ | 1,468.0 | | | $ | 1,114.4 | | | $ | 1,091.1 | |
| | | | | | | | | | | | | |
| Consolidated funeral services performed | | | 299,801 | | | | 235,384 | | | | 251,020 | |
| Consolidated average revenue per funeral service | | $ | 4,897 | | | $ | 4,734 | | | $ | 4,347 | |
The following table provides the data necessary to calculate our comparable average revenue per funeral service for the years ended December 31, 2007, 2006, and 2005. We calculate average revenue per funeral service by dividing comparable funeral revenue, excluding General Agency (GA) revenues and other revenues in order to avoid distorting our averages of normal funeral services revenue, by the comparable number of funeral services performed during the period. The following data specifically excludes any impact from the Alderwoods acquisition.
| | | | | | | | | | | | | |
| | | 2007 | | | 2006 | | | 2005 | |
| | | (Dollars in millions, except average revenue per funeral service) | |
| |
| Comparable funeral revenue | | $ | 1,061.0 | | | $ | 1,047.6 | | | $ | 1,013.8 | |
| Less: GA revenues | | | 35.3 | | | | 33.6 | | | | 24.6 | |
| Less: Other revenues | | | 8.9 | | | | 7.8 | | | | 13.8 | |
| | | | | | | | | | | | | |
| Adjusted Comparable funeral revenue | | $ | 1,016.8 | | | $ | 1,006.2 | | | $ | 975.4 | |
| | | | | | | | | | | | | |
| Comparable funeral services performed | | | 201,377 | | | | 209,775 | | | | 221,883 | |
| Comparable average revenue per funeral service | | $ | 5,049 | | | $ | 4,797 | | | $ | 4,396 | |
Funeral Results
Funeral Revenue
Consolidated revenues from funeral operations were $1,525.3 million in the year ended December 31, 2007 compared to $1,161.8 million in the same period of 2006. The increase is primarily the result of the addition of Alderwoods and other operations, which contributed an additional $358.8 million in funeral revenues. Alderwoods average revenue per funeral for the year ended December 31, 2007 was approximately 2% above our expectation and Alderwoods funeral case volume was approximately 3% below our expectations, which we believe is generally consistent with death trends in North America in 2007. This is partially offset by an $8.7 million decline in revenue from divested locations. Our comparable funeral revenues were up $13.4 million, or 1.3% compared to the year ended December 31, 2006 primarily driven by the continued benefits of our strategic pricing initiatives at legacy locations.
Consolidated revenue from funeral operations increased $5.2 million in 2006 compared to 2005 primarily due to $30.4 million of revenues from former Alderwoods businesses since the acquisition date, combined with higher average revenue per funeral service and an increase in floral revenues of approximately $10.7 million. These increases were partially offset by a decline in funeral services performed due to a decrease in funeral properties as a result of our continuing efforts to dispose of non-strategic locations. We also believe the decline reflects a decrease in the number of deaths in the markets we serve. Additionally, Kenyon’s revenue declined $19.3 million to $4.6 million, as services related to catastrophic events in Asia, Greece, and the U.S. Gulf Coast in 2005 were not repeated in 2006. Comparable funeral revenue in 2006 increased $33.8 million, or 3.3%, over 2005. The increase was primarily a result of an increase in comparable atneed revenue resulting from an increase in funeral services performed and higher average revenue per funeral.
32
Funeral Services Performed
Our consolidated funeral services performed increased 64,417, or 27.4%, in the year ended December 31, 2007 compared to the same period in 2006. This increase includes 92,338 funeral services performed by locations acquired in the Alderwoods transaction. This increase was partially offset by a decrease from divested locations of 19,523 funeral services. Additionally, our comparable funeral services performed decreased 8,398, or 4.0%, which we attribute to certain local business decisions to exit unprofitable business relationships, primarily related to highly-discounted, low-service cremation funeral activities, and a decrease in the number of deaths in our markets in 2007. The local business decisions mentioned above were made based on our customer segmentation strategy, which focuses on more profitable opportunities with certain customer segments. We will continue to evaluate existing relationships and may ultimately choose to exit other markets as we continue to employ our strategy. Our comparable cremation rate of 41.6% in the year ended December 31, 2007 was up slightly compared to 41.5% for the same period in 2006. We have seen a relative stabilization in our cremation rate despite the continued increase in cremation generally in the markets where we compete, reflecting the impact of our decision to exit unprofitable immediate cremation activities.
Average Revenue Per Funeral Service
Our consolidated average revenue per funeral service increased $163, or 3.4%, in the year ended December 31, 2007 over the same period of 2006. Our comparable average revenue per funeral service (which excludes the Alderwoods locations) increased 5.3%, or $252 per funeral service, reflecting the continued benefits from our strategic pricing initiative at legacy locations. Pursuant to this strategy, we have realigned our pricing focus away from our products to our service offerings, reflecting our competitive advantage and concentration on those services that our customers believe add the most value. This strategy has resulted in a decline in highly discounted, low-service cremation funeral services. These initiatives, although reducing our funeral services volume, have generated improvements in average revenue per funeral service. Our strategic pricing initiative was implemented at former Alderwoods locations in 2007. We expect our average revenue per funeral service to continue to improve as we see the full impact of this initiative.
Funeral Gross Profit
Consolidated funeral gross profits increased $66.6 million in 2007 as compared to 2006 primarily due to additional gross profits contributed from former Alderwoods and other operations of $78.5 million. This increase was partially offset by a $3.9 million decline in gross profit from divested locations. Gross profit from our comparable funeral locations decreased $8.0 million, or 3.5%, and our comparable gross margin percentage decreased to 21.0% from 22.0% in 2007 compared to 2006. Comparable gross profits before allocation of corporate and field overhead costs increased $8.2 million, or 2.7%. Our corporate and field overhead includes costs related to the addition of the former Alderwoods’ funeral homes and cemeteries. We cannot separately identify and allocate these additional overhead costs; therefore, they negatively impact our gross profit and gross margin percentage for 2007 on a comparable basis.
Consolidated funeral gross profit increased $20.9 million in 2006, primarily due to decreases in costs and $7.3 million contributed in gross profits from former Alderwoods operations. Significant cost decreases included a $10.7 million decline in salary and fringe expense due to more centralization and standardization in our organization as well as a decrease in selling costs resulting from lower funeral production. These gross profit improvements were partially offset by a $4.6 million decline in Kenyon’s gross profits, which resulted from fixed costs incurred over a lower revenue base. Comparable funeral gross profit increased $19.0 million, or 9.0%, in 2006 versus 2005. The comparable funeral gross margin percentage increased to 22.0% in 2006 compared to 20.9% in 2005 due to the comparable revenue increases described above and continued cost improvements to our infrastructure, including a decrease in salary and fringe expense totaling $5.8 million.
33
Cemetery Results
Cemetery Revenue
Consolidated revenues from our cemetery operations increased $168.9 million, or 28.6%, in 2007 versus 2006, reflecting a $155.9 million increase from operations acquired from Alderwoods. This increase was partially offset by a $3.8 million decline in revenue from divested locations. Our comparable cemetery revenues rose $16.8 million, or 3.1%, in 2007 compared to 2006, as a result of our tiered-product strategy, which focused on the development of high-end cemetery property.
Consolidated revenues from our cemetery operations increased $30.7 million in 2006 compared to 2005, reflecting higher atneed revenues and increased delivery of preneed merchandise combined with a $13.8 million increase from acquired Alderwoods operations. Also contributing to the increase was the receipt and recognition of $7.9 million in endowment care income in 2006. Comparable cemetery revenue increased $32.4 million or 6.4% in 2006 compared to 2005. This increase primarily resulted from a $10.0 million increase in cemetery atneed revenues as well as an increase in trust fund income, partially offset by lower interest income on preneed receivables.
Cemetery Gross Profits
Consolidated cemetery gross profit increased $51.6 million, or 47.6%, in 2007 compared to 2006, reflecting the addition of $36.6 million of gross profit from acquired Alderwoods operations and $1.0 million of incremental gross profit from divested locations in 2007 compared to 2006. Consolidated cemetery gross margin percentage grew to 21.0% in 2007 compared to 18.3% in 2006. Our comparable cemetery gross profit increased $14.0 million, or 13.4%, in 2007 compared to 2006 as increases in revenue were partially offset by the receipt and recognition of $7.9 million of endowment care trust fund income in 2006. The comparable cemetery margin percentage was 21.3% in 2007 compared to 19.4% in 2006.
Consolidated cemetery gross profit increased $26.4 million or 32.2% in 2006 compared to 2005. Cemetery gross margin percentages increased from 14.6% in 2005 to 18.3% in 2006, reflecting $2.4 million from acquired Alderwoods operations, the $7.9 million of endowment care income received and recognized in 2006 related to the resolution of a dispute over the funds, and an increase in other trust fund income. Comparable cemetery gross profits increased $22.8 million in 2006 compared to 2005. The comparable cemetery gross margin percentage increased to 19.4% in 2006 from 16.1% in 2005. These improvements were a result of the increases in atneed cemetery revenues and in endowment care trust fund income discussed above and cost improvements. Selling and salary expenses decreased in 2006 due to increased centralization within our organization. The decrease in these expenses was partially offset by higher maintenance and utilities costs primarily resulting from increased fuel costs.
Other Financial Statement Items
General and Administrative Expenses
General and administrative expenses were $137.4 million in 2007 compared to $94.9 million in 2006 and $84.8 million in 2005. For 2007 compared to 2006, general and administrative costs increased $42.5 million primarily due to $28.4 million in costs related to the integration of Alderwoods and $11.2 million in costs to terminate our Cash Balance pension plan. For 2006 compared to 2005, general and administrative costs increased $10.1 million primarily due to $7.0 million in expenses related to our acquisition of Alderwoods and $3.9 million of share-based compensation costs related to stock options expensed under FAS 123(R). These costs were partially offset by a decrease in salary expense.
Gains (Losses) on Dispositions and Impairment Charges, Net
In 2007, we recognized a $16.9 million net pre-tax gain on asset divestitures. This gain was primarily associated with the disposition of funeral and cemetery businesses in the United States and Canada, including a $21.8 million gain on assets sold to StoneMor Partners LP, a $21.1 million gain from real estate dispositions, partially offset by $26.0 million in losses on FTC and non-strategic divestitures.
34
In 2006, we recognized a $58.7 million net pre-tax impairment loss. This loss was primarily associated with the disposition of underperforming funeral and cemetery businesses in North America, including a $16.6 million impairment of assets sold to StoneMor Partners LP in 2006 and a $26.4 million impairment of certain assets in Michigan for which we have commenced a plan to sell and which are classified as assets held for sale at December 31, 2007. Additionally, in connection with the Alderwoods acquisition, we entered into a consent agreement with the Federal Trade Commission to divest certain of our non-Alderwoods properties, and we recorded an impairment charge of $12.9 million for these properties which were owned by us and classified as assets held for sale at December 31, 2006.
In 2005, we recognized a $26.1 million net pretax loss from impairments. This loss was primarily associated with the disposition of underperforming funeral and cemetery businesses in North America (including a $30.0 million impairment of assets sold to StoneMor Partners LP). The net loss was partially offset by the release of approximately $15.6 million in indemnification liabilities previously recorded in connection with the 2004 sales of our United Kingdom and French operations.
Interest Expense
Interest expense increased to $146.9 million in 2007, compared to $123.4 million in 2006 and $103.7 million in 2005.
The increase of $23.5 million in interest expense between 2007 and 2006 resulted primarily from an incremental $31.5 million of interest costs related to our increased borrowings to finance the Alderwoods transaction.
The increase of $19.7 million in interest expense between 2006 and 2005 resulted primarily from $6.4 million in one-time bridge financing costs related to the Alderwoods acquisition and an incremental $10.5 million of interest costs related to our increased borrowings to finance the Alderwoods acquisition in the fourth quarter of 2006.
Interest Income
Interest income of $11.7 million in 2007, compared to $31.2 million in 2006, reflects the decrease in our cash balance as a result of the acquisition of Alderwoods.
Interest income of $31.2 million in 2006, a $14.5 million increase over 2005, reflects the increase in our cash balance for most of 2006 coupled with an increase in interest rates.
Loss on Early Extinguishment of Debt
During 2007, we repaid $100.0 million of our term loan, $50 million of our Series A Senior Notes, and purchased $149.8 million aggregate principal amount of our 6.50% Notes due 2008 and $173.8 million aggregate principal amount of our 7.70% Notes due 2009 in a tender offer. As a result of these transactions, we recognized a loss of $15.0 million, which represents the write-off of unamortized deferred loan costs of $3.3 million, a $1.0 million loss on a related interest rate hedge, and $10.7 million in premiums paid to extinguish the debt.
During 2006, we repurchased $139.0 million aggregate principal amount of our 7.7% notes due 2009 in a tender offer and prepaid $50.0 million of our term loan in December 2006. As a result of these transactions, we recognized a loss of $17.5 million, which is comprised of the redemption premiums paid of $8.2 million and the write-off of unamortized deferred loan costs of $9.3 million.
During 2005, we repurchased $16.6 million aggregate principal amount of our 7.70% notes due 2009 in the open market, and $0.3 million aggregate principal amount of our 6.00% notes due 2005 in the open market. Also during 2005, we redeemed $130.0 million aggregate principal amount of our 6.875% notes due 2007 and $139.3 million aggregate principal amount of our 7.20% notes due 2006, pursuant to a tender offer for such notes. As a result of these transactions, we recognized a loss of $14.3 million, which is comprised of the redemption premiums paid of $12.2 million and the write-off of unamortized deferred loan costs of $2.1 million.
35
Equity in Earnings of Unconsolidated Subsidiaries
Equity income from our equity investment in France was $36.6 million in 2007 compared to $1.1 million in 2006. This increase is primarily attributable to equity earnings generated by the sale of our unconsolidated subsidiary’s business operations in the fourth quarter of 2007.
Gain on Redemption of Securities
Gain on redemption of securities was $158.1 million in 2007 compared to $10.9 million in 2006. The 2007 and 2006 income is primarily related to the redemption of our convertible preferred equity certificates in our unconsolidated equity interest. This investment was liquidated in the fourth quarter of 2007. See Note 20 to the consolidated financial statements.
Provision for Income Taxes
The 2007 consolidated effective tax rate was 37.1%, compared to 46.0% and 36.8% in 2006 and 2005, respectively. During the fourth quarter of 2007, we generated taxable capital gains from the sale of our equity investment in our French operations which allowed us to recognize the benefit of capital loss carryforwards that we had previously concluded were more likely than not to expire unutilized. The 2007, 2006, and 2005 tax rates were negatively impacted by permanent differences between the book and tax bases of North American asset dispositions and the 2005 tax rate was partially offset by state net operating loss benefits.
Weighted Average Shares
The diluted weighted average number of shares outstanding was 290.4 million in 2007, compared to 297.4 million in 2006 and 306.7 million in 2005. The decrease in all years was mainly due to our share repurchase program, which began in the third quarter of 2004.
Critical Accounting Policies, Recent Accounting Pronouncements and Accounting Changes
Our consolidated financial statements are impacted by the accounting policies used and the estimates and assumptions made by management during their preparation. See Part II, Item 8. Financial Statements and Supplementary Data, Note 2 of thisForm 10-K. Estimates and assumptions affect the carrying values of assets and liabilities and disclosures of contingent assets and liabilities at the balance sheet date. Actual results could differ from such estimates due to uncertainties associated with the methods and assumptions underlying our critical accounting measurements. The following is a discussion of our critical accounting policies pertaining to revenue recognition, business combinations, the impairment or disposal of long-lived assets, and the use of estimates.
Revenue Recognition
Funeral revenue is recognized when funeral services are performed. Our trade receivables primarily consist of amounts due for funeral services already performed. Revenue associated with cemetery merchandise and services is recognized when the service is performed or merchandise is delivered. Revenue associated with cemetery property interment rights is recognized in accordance with the retail land sales provision of SFAS No. 66,“Accounting for the Sales of Real Estate”(SFAS 66). Under SFAS 66, revenue from constructed cemetery property is not recognized until a minimum percentage (10%) of the sales price has been collected. Revenue related to the preneed sale of unconstructed cemetery property is deferred until it is constructed and 10% of the sales price is collected.
When a customer enters into a preneed funeral trust contract, the entire purchase price is deferred and the revenue is recognized at the time of maturity. The revenues associated with a preneed cemetery contract, however, may be recognized as different contract events occur. Preneed sales of cemetery interment rights (cemetery burial property) are recognized when a minimum of 10% of the sales price has been collected and the property has been constructed or is available for interment. For personalized marker merchandise, with the customer’s direction generally obtained at the time of sale, we can choose to order, store, and transfer title to the customer. Upon the earlier of vendor storage of these items or delivery in our cemetery, we recognize the associated revenues and record the cost of sale. For services and non-personalized merchandise (such as vaults), we defer the revenues until the services are performed and the merchandise is delivered. In situations in which we have no further obligation or involvement related to the merchandise, we recognize revenues and record the cost of sales in accordance with SAB 104 upon the earlier of vendor storage of these items or delivery in our cemetery.
36
Business Combinations
We apply the principles provided in SFAS No. 141, “Business Combinations” (SFAS 141) when we acquire businesses. Tangible and intangible assets and liabilities assumed are recorded at their fair value and goodwill recognized for any difference between the price of the acquisition and our fair value determination. We customarily estimate our purchase costs and other related transactions known to us at closing of the acquisition. To the extent that information not available to us at the closing date subsequently becomes available during the allocation period, as defined by SFAS 141, we may adjust our goodwill, assets, or liabilities associated with the acquisition. These changes are disclosed in future reports as they occur.
On November 28, 2006, we completed the acquisition of Alderwoods for $20.00 per share in cash, resulting in a purchase price of $1.2 billion, which includes the refinancing of $357.7 million and the assumption of $2.2 million of Alderwoods’ debt resulting in goodwill of $183.0 million. Alderwoods properties have been substantially integrated into our operations as of December 31, 2007. These properties are operated in the same manner as our incumbent properties, under our leadership, and are reported in the appropriate reporting unit (segment) whether funeral or cemetery in our consolidated financial statements. See Part II, Item 8. Financial Statements and Supplementary Data, Note 4 of thisForm 10-K for details related to this acquisition.
Impairment or Disposal of Long-Lived Assets
We test for impairment of goodwill using a two-step approach as prescribed in SFAS No. 142,“Goodwill and Other Intangible Assets”(SFAS 142). The first step of our goodwill impairment test compares the fair value of a reporting unit with its carrying amount including goodwill. Our reporting units are the funeral and cemetery segments. We do not record an impairment of goodwill in instances where the fair value of a reporting unit exceeds its carrying amount. If fair value is less than the carrying amount for a reporting unit, we would perform the second step, which is to compare the implied fair value of goodwill (as defined in SFAS 142) to the carrying amount of goodwill. If the carrying amount of a reporting unit’s goodwill exceeds the implied fair value of that goodwill, an impairment loss is recognized in an amount equal to that excess. Fair market value of a reporting unit is determined using a calculation based on multiples of revenue and multiples of EBITDA, or earnings before interest, taxes, depreciation, and amortization, of both SCI and its competitors. Based on our impairment tests performed during the fourth quarter using September 30th financial information, there was no impairment of goodwill at December 31, 2007 or 2006.
We review our other non-goodwill long-lived assets for impairment when changes in circumstances indicate that the carrying amount of the asset may not be recoverable, in accordance with SFAS No. 144,“Accounting for the Impairment or Disposal of Long-Lived Assets”(SFAS 144). SFAS 144 requires that long-lived assets to be held and used are reported at the lower of their carrying amount or fair value. Assets to be disposed of and assets not expected to provide any future service potential are recorded at the lower of their carrying amount or fair value less estimated cost to sell. For additional information regarding impairment or disposal of long-lived assets, see Part II, Item 8. Financial Statements and Supplementary Data, Note 18 of thisForm 10-K.
Use of Estimates
The preparation of financial statements in conformity with Generally Accepted Accounting Principles in the United States (GAAP) requires management to make certain estimates and assumptions. These estimates and assumptions affect the carrying values of assets and liabilities and disclosures of contingent assets and liabilities at the balance sheet date. Actual results could differ from such estimates due to uncertainties associated with the methods and assumptions underlying our critical accounting measurements. Key estimates used by management, among others, include:
Allowances — We provide various allowancesand/or cancellation reserves for our funeral and cemetery preneed and atneed receivables, as well as for our preneed funeral and preneed cemetery deferred revenues. These allowances are based on an analysis of historical trends and include, where applicable, collection and cancellation activity. We also record an estimate of general agency revenues that may be cancelled in their first year, where the revenue would be charged back by the insurance company. These estimates are impacted by a number of factors, including changes in economy, relocation, and demographic or competitive changes in our areas of operation.
37
Valuation of trust investments — With the implementation of revised FASB Interpretation No. 46,“Consolidation of Variable Interest Entities, an Interpretation of Accounting Research Bulletin No. 51”(FIN 46R), as of March 31, 2004, we removed the receivables due from trust assets recorded at cost from our balance sheet and added the actual trust investments recorded at market value. The trust investments include marketable securities that are classified as available-for-sale in accordance with Statement of Financial Accounting Standards No. 115,“Accounting for Certain Investments in Debt and Equity Securities.”Where quoted market prices are not available, we estimate the fair value based on the market value of the underlying real estate and private equity investments. The underlying real estate value is determined using the most recent appraisals. The private equity investments are valued using appraisals and a discounted cash flow methodology depending on the underlying assets. The appraisals assess value based on a combination of replacement cost, comparative sales analysis, and discounted cash flow analysis.
Legal liability reserves — Contingent liabilities, principally for legal liability matters, are recorded when it is probable that a liability has been incurred and the amount of the loss can be reasonably estimated in accordance with Statement of Financial Accounting Standards No. 5,“Accounting for Contingencies.”Liabilities accrued for legal matters require judgments regarding projected outcomes and range of loss based on historical experience and recommendations of legal counsel. However, litigation is inherently unpredictable, and excessive verdicts do occur. As disclosed in Part II, Item 8. Financial Statements and Supplementary Data, Note 13 of thisForm 10-K, our legal exposures and the ultimate outcome of these legal proceedings could be material to operating results or cash flows in any given quarter or year.
Depreciation of long-lived assets — We depreciate our long-lived assets ratably over their estimated useful lives. These estimates of useful lives may be affected by such factors as changing market conditions or changes in regulatory requirements.
Valuation of assets acquired and liabilities assumed — We apply the principles of SFAS 141 when we acquire businesses. Tangible and intangible assets and liabilities assumed are recorded at their fair value and goodwill recognized for any difference between the price of acquisition and our fair value determination. We customarily estimate our purchase costs and other related transactions known to us at closing of the acquisition. To the extent that information not available to us at the closing date subsequently becomes available during the allocation period, as defined in SFAS 141, we may adjust our goodwill, assets, or liabilities associated with the acquisition.
Income taxes — Our ability to realize the benefit of our federal and state deferred tax assets requires us to achieve certain future earnings levels. We have established a valuation allowance against a portion of our deferred tax assets and could be required to further adjust that valuation allowance if market conditions change materially and future earnings are, or are projected to be, significantly different than our current estimates.
We intend to permanently reinvest the unremitted earnings of certain of our foreign subsidiaries in those businesses outside the United States. Therefore, we have not provided for deferred federal income taxes on such unremitted foreign earnings.
We file income tax returns, including tax returns for our subsidiaries, with U.S. federal, state, local, and foreign jurisdictions. Our tax returns are subject to routine compliance review by the various federal, state, and foreign taxing authorities in the jurisdictions in which we have operated and filed tax returns in the ordinary course of business. We accrue tax expense to reduce our tax benefits in those situations where it is more likely than not that we will not prevail against the tax authorities should they challenge the tax return position that gave rise to the benefit. We believe that our tax returns are materially correct as filed and we will vigorously defend any challenges and proposed adjustments to those filing made by the tax authorities. A number of years may elapse before particular tax matters, for which we have established accruals, are audited and finally resolved. The number of tax years that may be subject to a tax audit varies depending on the tax jurisdiction. In the United States, our open tax years are 1994 and 1996 to 2007. The Internal Revenue Service is currently examining our tax returns for 1999 through 2005 and various state jurisdictions are auditing years through 2006. While it is often difficult to predict the final outcome or the timing of resolution of any particular tax matter, we believe that our accruals reflect the probable outcome of known tax contingencies. Unfavorable settlement of any particular issue would reduce a deferred tax asset or require the payment of cash. Favorable
38
resolution could result in reduced income tax expense reported in the financial statements in the future. Our tax accruals are presented in the balance sheet withinDeferred income taxesandOther liabilities.
Pension cost — Our pension plans are frozen with no benefits accruing to participants except interest. Pension costs and liabilities are actuarially determined based on certain assumptions, including the discount rate used to compute future benefit obligations. On January 1, 2004, we changed our method of accounting for gains and losses on pension assets and obligations to recognize such gains and losses in our consolidated statement of operations during the year in which they occur. Therefore, the concept of an expected rate of return on plan assets is not applicable.
Discount rates used to determine pension obligations for our pension plans in 2007 and 2006 were 5.75% for the SCI SERP, Senior SERP and Directors Plans and 5.5% for all other plans. We determine the discount rate used to compute future benefit obligations using an analysis of expected future benefit payments. We verify the reasonableness of the discount rate by comparing our rate to the rate earned on high-quality fixed income investments, such as the Moody’s Aa index. In 2007, we completed the termination of our U.S. Pension Plan and there are no remaining assets or liabilities under the plan.
A sensitivity analysis of the net periodic benefit cost was modeled to assess the impact that changing discount rates could have on pre-tax earnings. The sensitivity analysis assumes a 0.25% adverse change to the discount rate with all other variables held constant. Using this model, our pre-tax earnings would have decreased by less than $0.5 million, or less than $.01 per diluted share, for the year ended December 31, 2007. See Part II, Item 8. Financial Statements and Supplementary Data, Note 16 of thisForm 10-K for more information related to our pension plans.
Insurance loss reserves — We purchase comprehensive general liability, morticians and cemetery professional liability, automobile liability, and workers’ compensation insurance coverages structured with high deductibles. This high deductible insurance program means we are primarily self-insured for claims and associated costs and losses covered by these policies. Historical insurance industry experience indicates a high degree of inherent variability in assessing the ultimate amount of losses associated with casualty insurance claims. This is especially true with respect to liability and workers’ compensation exposures due to the extended period of time that transpires between when the claim might occur and the full settlement of such claim, often many years. We continually evaluate loss estimates associated with claims and losses related to these insurance coverages falling within the deductible of each coverage. Assumptions based on factors such as claim settlement patterns, claim development trends, claim frequency and severity patterns, inflationary trends, and data reasonableness will generally affect the analysis and determination of the “best estimate” of the projected ultimate claim losses. The results of these evaluations are used to both analyze and adjust our insurance loss reserves.
As of December 31, 2007, reported losses within our retention for workers’ compensation, general liability, and auto liability incurred during the period May 1, 1987 through December 31, 2007 were approximately $275.1 million over 20.7 years. The selected fully developed ultimate settlement value estimated was $329.5 million for the same period. Paid losses were $259.6 million indicating a reserve requirement of $69.9 million.
At December 31, 2007 and 2006, the balances in the reserve for workers’ compensation, general, and auto liability and the related activity were as follows:
| | | | | |
| | | (Dollars in millions) | |
| |
| Balance at December 31, 2005 | | $ | 49.0 | |
| Additions | | | 29.2 | |
| Acquisition | | | 21.0 | |
| Payments | | | (31.5 | ) |
| | | | | |
| Balance at December 31, 2006 | | $ | 67.7 | |
| Additions | | | 35.9 | |
| Payments | | | (33.7 | ) |
| | | | | |
| Balance at December 31, 2007 | | $ | 69.9 | |
| | | | | |
39
Recent Accounting Pronouncements and Accounting Changes
For discussion of recent accounting pronouncements and accounting changes, see Part II, Item 8. Financial Statements and Supplementary Data, Note 3 of thisForm 10-K.
| |
| Item 7A. | Quantitative and Qualitative Disclosures About Market Risk. |
The information presented below should be read in conjunction with Part II, Item 8. Financial Statements and Supplementary Data, Note 1 of thisForm 10-K.
At December 31, 2007 and 2006, 89% and 82%, respectively, of our total debt consisted of fixed rate debt at a weighted average rate of 7.09% and 7.30%, respectively.
At December 31, 2007, approximately 14% of our stockholders’ equity and 8% of our operating income were denominated in foreign currencies, primarily the Canadian dollar. Approximately 11% of our stockholders’ equity and 7% of our operating income were denominated in foreign currencies, primarily the Canadian dollar, at December 31, 2006. We do not have a significant investment in foreign operations that are in highly inflationary economies.
Marketable Equity and Debt Securities — Price Risk
In connection with our preneed funeral operations and preneed cemetery merchandise and service sales, the related funeral and cemetery trust funds own investments in equity and debt securities and mutual funds, which are sensitive to current market prices. Cost and market values as of December 31, 2007 are presented in Part II, Item 8. Financial Statements and Supplementary Data, Notes 5, 6, and 7 of thisForm 10-K.
Market-Rate Sensitive Instruments — Interest Rate and Currency Risk
We perform a sensitivity analysis to assess the impact of interest rate and exchange rate risks on earnings. This analysis determines the effect of a hypothetical 10% adverse change in market rates. In actuality, market rate volatility is dependent on many factors that are impossible to forecast. Therefore, the adverse changes described below could differ substantially from the hypothetical 10% change.
We are currently not subject to significant interest rate risk on our outstanding debt as 89% of such debt has fixed rate interest terms. The fair market value of our debt was approximately $30.9 million less than its carrying value at December 31, 2007. A fifty basis point increase in our floating rate risk would increase interest expense by $1 million.
A similar model was used to assess the impact of changes in exchange rates for foreign currencies on our consolidated statement of operations. At December 31, 2007 and 2006, our foreign currency exposure was primarily associated with the Canadian dollar, and the euro. A 10% adverse change in the strength of the U.S. dollar relative to the foreign currency instruments would have negatively affected our income from our continuing operations on an annual basis, by $0.9 million for the year ended December 31, 2007 and $0.7 million for the year ended December 31, 2006.
40
| |
| Item 8. | Financial Statements and Supplementary Data. |
INDEX TO FINANCIAL STATEMENTS AND RELATED SCHEDULE
| | | | | |
| | | Page |
| |
| Financial Statements: | | | | |
| | | 42 | |
| | | 44 | |
| | | 45 | |
| | | 46 | |
| | | 47 | |
| | | 48 | |
| | | 48 | |
| | | 48 | |
| | | 52 | |
| | | 55 | |
| | | 57 | |
| | | 62 | |
| | | 66 | |
| | | 70 | |
| | | 73 | |
| | | 74 | |
| | | 79 | |
| | | 82 | |
| | | 83 | |
| | | 89 | |
| | | 91 | |
| | | 94 | |
| | | 97 | |
| | | 101 | |
| | | 103 | |
| | | 105 | |
| | | 109 | |
| | | | |
| | | 110 | |
All other schedules have been omitted because the required information is not applicable or is not present in amounts sufficient to require submission or because the information required is included in the consolidated financial statements or the related notes thereto.
41
REPORT OF INDEPENDENT REGISTERED PUBLIC ACCOUNTING FIRM
To the Board of Directors and Stockholders of
Service Corporation International:
In our opinion, the consolidated financial statements listed in the accompanying index present fairly, in all material respects, the financial position of Service Corporation International and its subsidiaries at December 31, 2007 and 2006, and the results of their operations and their cash flows for each of the three years in the period ended December 31, 2007 in conformity with accounting principles generally accepted in the United States of America. In addition, in our opinion, the financial statement schedule listed in the accompanying index presents fairly, in all material respects, the information set forth therein when read in conjunction with the related consolidated financial statements. Also in our opinion, the Company did not maintain, in all material respects, effective internal control over financial reporting as of December 31, 2007, based on criteria established inInternal Control — Integrated Frameworkissued by the Committee of Sponsoring Organizations of the Treadway Commission (COSO) because material weaknesses in internal control over financial reporting related to (i) the accounting for income taxes and (ii) certain account reconciliations existed as of that date. A material weakness is a deficiency, or a combination of deficiencies, in internal control over financial reporting, such that there is a reasonable possibility that a material misstatement of the annual or interim financial statements will not be prevented or detected on a timely basis. The material weaknesses referred to above are described in Management’s Annual Report on Internal Control over Financial Reporting appearing under Item 9A. We considered these material weaknesses in determining the nature, timing, and extent of audit tests applied in our audit of the 2007 consolidated financial statements and our opinion regarding the effectiveness of the Company’s internal control over financial reporting does not affect our opinion on those consolidated financial statements. The Company’s management is responsible for these financial statements and financial statement schedule, for maintaining effective internal control over financial reporting and for its assessment of the effectiveness of internal control over financial reporting included in management’s report referred to above. Our responsibility is to express opinions on these financial statements, on the financial statement schedule, and on the Company’s internal control over financial reporting based on our integrated audits. We conducted our audits in accordance with the standards of the Public Company Accounting Oversight Board (United States). Those standards require that we plan and perform the audits to obtain reasonable assurance about whether the financial statements are free of material misstatement and whether effective internal control over financial reporting was maintained in all material respects. Our audits of the financial statements included examining, on a test basis, evidence supporting the amounts and disclosures in the financial statements, assessing the accounting principles used and significant estimates made by management, and evaluating the overall financial statement presentation. Our audit of internal control over financial reporting included obtaining an understanding of internal control over financial reporting, assessing the risk that a material weakness exists, and testing and evaluating the design and operating effectiveness of internal control based on the assessed risk. Our audits also included performing such other procedures as we considered necessary in the circumstances. We believe that our audits provide a reasonable basis for our opinions.
As discussed in Note 3 to the consolidated financial statements, the Company changed its method of accounting for uncertain income tax positions effective January 1, 2007, its method of accounting for share-based compensation effective January 1, 2006, and its method of accounting for deferred selling costs related to preneed funeral and cemetery contracts effective January 1, 2005.
A company’s internal control over financial reporting is a process designed to provide reasonable assurance regarding the reliability of financial reporting and the preparation of financial statements for external purposes in accordance with generally accepted accounting principles. A company’s internal control over financial reporting includes those policies and procedures that (i) pertain to the maintenance of records that, in reasonable detail, accurately and fairly reflect the transactions and dispositions of the assets of the company; (ii) provide reasonable assurance that transactions are recorded as necessary to permit preparation of financial statements in accordance with generally accepted accounting principles, and that receipts and expenditures of the company are being made only in accordance with authorizations of management and directors of the company; and (iii) provide reasonable assurance regarding prevention or timely detection of unauthorized acquisition, use, or disposition of the company’s assets that could have a material effect on the financial statements.
42
Because of its inherent limitations, internal control over financial reporting may not prevent or detect misstatements. Also, projections of any evaluation of effectiveness to future periods are subject to the risk that controls may become inadequate because of changes in conditions, or that the degree of compliance with the policies or procedures may deteriorate.
/s/ PricewaterhouseCoopers LLP
Houston, Texas
March 2, 2008
43
SERVICE CORPORATION INTERNATIONAL
| | | | | | | | | | | | | |
| | | Years Ended December 31, | |
| | | 2007 | | | 2006 | | | 2005 | |
| | | (In thousands, except per share amounts) | |
| |
| Revenues | | $ | 2,285,303 | | | $ | 1,752,888 | | | $ | 1,717,007 | |
| Costs and expenses | | | (1,816,803 | ) | | | (1,402,627 | ) | | | (1,413,965 | ) |
| | | | | | | | | | | | | |
| Gross profits | | | 468,500 | | | | 350,261 | | | | 303,042 | |
| General and administrative expenses | | | (137,406 | ) | | | (94,900 | ) | | | (84,834 | ) |
| Gains (losses) on dispositions and impairment charges, net | | | 16,920 | | | | (58,683 | ) | | | (26,093 | ) |
| Other operating expense | | | (1,848 | ) | | | — | | | | — | |
| | | | | | | | | | | | | |
| Operating income | | | 346,166 | | | | 196,678 | | | | 192,115 | |
| Interest expense | | | (146,854 | ) | | | (123,399 | ) | | | (103,733 | ) |
| Interest income | | | 11,725 | | | | 31,171 | | | | 16,706 | |
| Loss on early extinguishment of debt | | | (14,986 | ) | | | (17,532 | ) | | | (14,258 | ) |
| Equity in earnings of unconsolidated subsidiaries | | | 36,607 | | | | 1,052 | | | | — | |
| Gain on redemption of securities | | | 158,133 | | | | 10,932 | | | | — | |
| Other expense, net | | | (3,804 | ) | | | (1,453 | ) | | | (3,703 | ) |
| | | | | | | | | | | | | |
| Income from continuing operations before income taxes and cumulative effect of accounting changes | | | 386,987 | | | | 97,449 | | | | 87,127 | |
| Provision for income taxes | | | (143,670 | ) | | | (44,845 | ) | | | (32,036 | ) |
| | | | | | | | | | | | | |
| Income from continuing operations before cumulative effect of accounting changes | | | 243,317 | | | | 52,604 | | | | 55,091 | |
| Income from discontinued operations (net of income tax (provision) benefit of $(4,818), $2,548 and $(5,961), respectively) | | | 4,412 | | | | 3,907 | | | | 4,506 | |
| Cumulative effect of accounting changes (net of income tax benefit of $117,428) | | | — | | | | — | | | | (187,538 | ) |
| | | | | | | | | | | | | |
| Net income (loss) | | $ | 247,729 | | | $ | 56,511 | | | $ | (127,941 | ) |
| | | | | | | | | | | | | |
| Basic earnings (loss) per share: | | | | | | | | | | | | |
| Income from continuing operations before cumulative effect of accounting changes | | $ | .85 | | | $ | .18 | | | $ | .18 | |
| Income from discontinued operations, net of tax | | | .02 | | | | .01 | | | | .02 | |
| Cumulative effect of accounting changes, net of tax | | | — | | | | — | | | | (.62 | ) |
| | | | | | | | | | | | | |
| Net income (loss) | | $ | .87 | | | $ | .19 | | | $ | (.42 | ) |
| | | | | | | | | | | | | |
| Basic weighted average number of shares | | | 284,966 | | | | 292,859 | | | | 302,213 | |
| | | | | | | | | | | | | |
| Diluted earnings (loss) per share: | | | | | | | | | | | | |
| Income from continuing operations before cumulative effect of accounting changes | | $ | .83 | | | $ | .18 | | | $ | .18 | |
| Income from discontinued operations, net of tax | | | .02 | | | | .01 | | | | .01 | |
| Cumulative effect of accounting changes, net of tax | | | — | | | | — | | | | (.61 | ) |
| | | | | | | | | | | | | |
| Net income (loss) | | $ | .85 | | | $ | .19 | | | $ | (.42 | ) |
| | | | | | | | | | | | | |
| Diluted weighted average number of shares | | | 290,444 | | | | 297,371 | | | | 306,745 | |
| | | | | | | | | | | | | |
| Dividends declared per share | | $ | .13 | | | $ | .105 | | | $ | .10 | |
| | | | | | | | | | | | | |
(See notes to consolidated financial statements)
44
SERVICE CORPORATION INTERNATIONAL
| | | | | | | | | |
| | | December 31, | |
| | | 2007 | | | 2006 | |
| | | (In thousands, except share amounts) | |
ASSETS |
| Current assets: | | | | | | | | |
| Cash and cash equivalents | | $ | 168,594 | | | $ | 39,880 | |
| Receivables, net | | | 113,793 | | | | 107,194 | |
| Deferred tax asset | | | 73,182 | | | | — | |
| Inventories | | | 36,203 | | | | 39,535 | |
| Current assets of discontinued operations | | | — | | | | 2,236 | |
| Current assets held for sale | | | 2,294 | | | | 6,330 | |
| Other | | | 27,261 | | | | 43,162 | |
| | | | | | | | | |
| Total current assets | | | 421,327 | | | | 238,337 | |
| | | | | | | | | |
| Preneed funeral receivables and trust investments | | | 1,434,403 | | | | 1,516,676 | |
| Preneed cemetery receivables and trust investments | | | 1,428,057 | | | | 1,522,584 | |
| Cemetery property, at cost | | | 1,451,666 | | | | 1,495,248 | |
| Property and equipment, at cost, net | | | 1,569,534 | | | | 1,641,353 | |
| Non-current assets of discontinued operations | | | — | | | | 371,132 | |
| Non-current assets held for sale | | | 122,626 | | | | 349,311 | |
| Goodwill | | | 1,198,153 | | | | 1,264,272 | |
| Deferred charges and other assets | | | 400,734 | | | | 436,545 | |
| Cemetery perpetual care trust investments | | | 905,744 | | | | 893,931 | |
| | | | | | | | | |
| | | $ | 8,932,244 | | | $ | 9,729,389 | |
| | | | | | | | | |
| |
| LIABILITIES & STOCKHOLDERS’ EQUITY |
| Current liabilities: | | | | | | | | |
| Accounts payable and accrued liabilities | | $ | 343,392 | | | $ | 341,173 | |
| Current maturities of long-term debt | | | 36,594 | | | | 46,176 | |
| Current liabilities of discontinued operations | | | — | | | | 2,351 | |
| Current liabilities held for sale | | | 149 | | | | 419 | |
| Income taxes | | | 46,305 | | | | 17,828 | |
| | | | | | | | | |
| Total current liabilities | | | 426,440 | | | | 407,947 | |
| | | | | | | | | |
| Long-term debt | | | 1,820,106 | | | | 1,912,696 | |
| Deferred preneed funeral revenues | | | 526,668 | | | | 537,792 | |
| Deferred preneed cemetery revenues | | | 753,876 | | | | 754,193 | |
| Deferred income taxes | | | 140,623 | | | | 177,341 | |
| Non-current liabilities of discontinued operations | | | — | | | | 311,498 | |
| Non-current liabilities held for sale | | | 91,928 | | | | 239,800 | |
| Other liabilities | | | 383,642 | | | | 357,418 | |
| Non-controlling interest in funeral and cemetery trusts | | | 2,390,288 | | | | 2,548,743 | |
| Non-controlling interest in perpetual care trusts | | | 906,590 | | | | 887,186 | |
| Commitments and contingencies (Note 13) | | | | | | | | |
| Stockholders’ equity: | | | | | | | | |
| Common stock, $1 per share par value, 500,000,000 shares authorized, 262,858,169 and 293,222,114 issued and outstanding (net of 1,961,300 and 10,000 treasury shares at par, respectively) | | | 262,858 | | | | 293,222 | |
| Capital in excess of par value | | | 1,874,600 | | | | 2,135,649 | |
| Accumulated deficit | | | (797,965 | ) | | | (906,394 | ) |
| Accumulated other comprehensive income | | | 152,590 | | | | 72,298 | |
| | | | | | | | | |
| Total stockholders’ equity | | | 1,492,083 | | | | 1,594,775 | |
| | | | | | | | | |
| | | $ | 8,932,244 | | | $ | 9,729,389 | |
| | | | | | | | | |
(See notes to consolidated financial statements)
45
SERVICE CORPORATION INTERNATIONAL
| | | | | | | | | | | | | |
| | | Years Ended December 31, | |
| | | 2007 | | | 2006 | | | 2005 | |
| | | (In thousands) | |
| |
Cash flows from operating activities: | | | | | | | | | | | | |
| Net income (loss) | | $ | 247,729 | | | $ | 56,511 | | | $ | (127,941 | ) |
| Adjustments to reconcile net income (loss) to net cash provided by operating activities: | | | | | | | | | | | | |
| Income from discontinued operations, net of tax | | | (4,412 | ) | | | (3,907 | ) | | | (4,506 | ) |
| Equity in earnings of unconsolidated subsidiaries, net of cash received | | | (19,566 | ) | | | (1,052 | ) | | | — | |
| Loss on early extinguishments of debt | | | 14,986 | | | | 17,532 | | | | 14,258 | |
| Premiums paid on early extinguishments of debt | | | (11,650 | ) | | | (15,725 | ) | | | (12,186 | ) |
| Cumulative effect of accounting changes, net of tax | | | — | | | | — | | | | 187,538 | |
| Depreciation and amortization | | | 130,429 | | | | 96,684 | | | | 74,866 | |
| Amortization of cemetery property | | | 35,824 | | | | 28,263 | | | | 27,505 | |
| Amortization of loan costs | | | 6,261 | | | | 16,328 | | | | 10,788 | |
| Provision for doubtful accounts | | | 10,754 | | | | 9,156 | | | | 8,638 | |
| Provision for deferred income taxes | | | 34,652 | | | | 38,257 | | | | 24,854 | |
| (Gains) losses on dispositions and impairment charges, net | | | (16,920 | ) | | | 58,683 | | | | 26,093 | |
| Gain on redemption of securities | | | (158,133 | ) | | | — | | | | — | |
| Share based compensation | | | 8,787 | | | | 7,035 | | | | 2,086 | |
| Excess tax benefits from share-based awards | | | (10,469 | ) | | | — | | | | — | |
| Change in assets and liabilities, net of effects from acquisitions and dispositions: | | | | | | | | | | | | |
| (Increase) decrease in receivables | | | (24,650 | ) | | | (362 | ) | | | 10,257 | |
| (Increase) decrease in other assets | | | (660 | ) | | | (7,938 | ) | | | 16,043 | |
| Increase (decrease) in payables and other liabilities | | | 51,407 | | | | (10,607 | ) | | | 1,766 | |
| Net effect of preneed funeral production and deliveries: | | | | | | | | | | | | |
| Decrease in preneed funeral receivables and trust investments | | | 102,080 | | | | 33,064 | | | | 29,717 | |
| Increase in deferred preneed funeral revenue | | | 21,419 | | | | 5,533 | | | | 110 | |
| Decrease in funeral non-controlling interest | | | (95,581 | ) | | | (29,968 | ) | | | (24,651 | ) |
| Net effect of preneed cemetery production and maturities: | | | | | | | | | | | | |
| Decrease in preneed cemetery receivables and trust investments | | | 83,689 | | | | 34,018 | | | | 49,601 | |
| Increase (decrease) in deferred preneed cemetery revenue | | | 10,561 | | | | (28,916 | ) | | | 24,583 | |
| (Decrease) increase in cemetery non-controlling interest | | | (77,640 | ) | | | 21,626 | | | | (21,203 | ) |
| Other | | | 6 | | | | (2,027 | ) | | | 87 | |
| | | | | | | | | | | | | |
| Net cash provided by operating activities from continuing operations | | | 338,903 | | | | 322,188 | | | | 318,303 | |
| Net cash provided by (used in) by operating activities from discontinued operations | | | 17,279 | | | | 2,031 | | | | (5,451 | ) |
| | | | | | | | | | | | | |
| Net cash provided by operating activities | | | 356,182 | | | | 324,219 | | | | 312,852 | |
Cash flows from investing activities: | | | | | | | | | | | | |
| Capital expenditures | | | (157,011 | ) | | | (97,527 | ) | | | (98,605 | ) |
| Acquisitions, net of cash acquired | | | (8,355 | ) | | | (1,301,359 | ) | | | — | |
| Proceeds from divestitures and sales of property and equipment | | | 410,689 | | | | 83,146 | | | | 223,518 | |
| Proceeds from redemption of securities | | | 158,691 | | | | — | | | | 26,839 | |
| Proceeds from notes receivable | | | — | | | | — | | | | 12,835 | |
| Net (deposits) withdrawals of restricted funds and other | | | (17,347 | ) | | | 8,639 | | | | 7,229 | |
| | | | | | | | | | | | | |
| Net cash provided by (used in) investing activities from continuing operations | | | 386,667 | | | | (1,307,101 | ) | | | 171,816 | |
| Net cash (used in) provided by investing activities from discontinued operations | | | (8,546 | ) | | | 9,599 | | | | (801 | ) |
| | | | | | | | | | | | | |
| Net cash provided by (used in) investing activities | | | 378,121 | | | | (1,297,502 | ) | | | 171,015 | |
Cash flows from financing activities: | | | | | | | | | | | | |
| Payments of debt | | | (29,234 | ) | | | (26,053 | ) | | | (85,692 | ) |
| Principal payments on capital leases | | | (27,057 | ) | | | (21,346 | ) | | | (120 | ) |
| Proceeds from long-term debt issued | | | 398,996 | | | | 850,000 | | | | 297,041 | |
| Debt issuance costs | | | (6,443 | ) | | | (24,716 | ) | | | (5,538 | ) |
| Early extinguishments of debt | | | (472,545 | ) | | | (181,543 | ) | | | (291,277 | ) |
| Proceeds from exercise of stock options | | | 52,938 | | | | 5,946 | | | | 7,834 | |
| Excess tax benefits from share-based awards | | | 10,469 | | | | — | | | | — | |
| Purchase of Company common stock | | | (505,121 | ) | | | (27,870 | ) | | | (225,152 | ) |
| Payments of dividends | | | (34,629 | ) | | | (29,431 | ) | | | (22,637 | ) |
| Bank overdrafts and other | | | 7,209 | | | | 20,480 | | | | (844 | ) |
| | | | | | | | | | | | | |
| Net cash (used in) provided by financing activities from continuing operations | | | (605,417 | ) | | | 565,467 | | | | (326,385 | ) |
| Net cash used in financing activities from discontinued operations | | | (2,113 | ) | | | (254 | ) | | | — | |
| | | | | | | | | | | | | |
| Net cash (used in) provided by financing activities from continuing operations | | | (607,530 | ) | | | 565,213 | | | | (326,385 | ) |
| Effect of foreign currency | | | 1,941 | | | | 1,168 | | | | 1,515 | |
| | | | | | | | | | | | | |
| Net increase (decrease) in cash and cash equivalents | | | 128,714 | | | | (406,902 | ) | | | 158,997 | |
| Cash and cash equivalents at beginning of period | | | 39,880 | | | | 446,782 | | | | 287,785 | |
| | | | | | | | | | | | | |
| Cash and cash equivalents at end of period | | $ | 168,594 | | | $ | 39,880 | | | $ | 446,782 | |
| | | | | | | | | | | | | |
(See notes to consolidated financial statements)
46
SERVICE CORPORATION INTERNATIONAL
| | | | | | | | | | | | | | | | | | | | | | | | | | | | | | | | | | |
| | | | | | | | | | | | | | | | | | | | | | Accumulated
| | | | |
| | | | | | | | | | | | | | | | | | | | | | Other
| | | | |
| | | | | | | | | | Treasury
| | | Capital in
| | | | | | | | | Comprehensive
| | | | |
| | | Outstanding
| | | | Common
| | | Stock, Par
| | | Excess of
| | | Unearned
| | | Accumulated
| | | (Loss)
| | | | |
| | | Shares | | | | Stock | | | Value | | | Par Value | | | Compensation | | | Deficit | | | Income | | | Total | |
| | | | | | | | | | (In thousands, except per share amounts) | | | | | | | | | | |
| Balance at December 31, 2004 | | | 323,225 | | | | $ | 341,727 | | | $ | (18,502 | ) | | $ | 2,395,057 | | | $ | (2,022 | ) | | $ | (834,964 | ) | | $ | (38,349 | ) | | $ | 1,842,947 | |
| Comprehensive income: | | | | | | | | | | | | | | | | | | | | | | | | | | | | | | | | | |
| Net loss | | | | | | | | | | | | | | | | | | | | | | | | (127,941 | ) | | | | | | | (127,941 | ) |
| Other comprehensive income: | | | | | | | | | | | | | | | | | | | | | | | | | | | | | | | | | |
| Foreign currency translation | | | | | | | | | | | | | | | | | | | | | | | | | | | | 7,260 | | | | 7,260 | |
| Reclassification for translation adjustments realized in net income, net | | | | | | | | | | | | | | | | | | | | | | | | | | | | 101,588 | | | | 101,588 | |
| | | | | | | | | | | | | | | | | | | | | | | | | | | | | | | | | | |
| Total other comprehensive income | | | | | | | | | | | | | | | | | | | | | | | | | | | | | | | | 108,848 | |
| Total comprehensive loss | | | | | | | | | | | | | | | | | | | | | | | | | | | | | | | | (19,093 | ) |
| Dividends on common stock ($.10 per share) | | | | | | | | | | | | | | | | (30,052 | ) | | | | | | | | | | | | | | | (30,052 | ) |
| Common Stock: | | | | | | | | | | | | | | | | | | | | | | | | | | | | | | | | | |
| Stock option exercises and other | | | 2,044 | | | | | 2,044 | | | | | | | | 6,183 | | | | | | | | | | | | | | | | 8,227 | |
| Tax benefit from stock options exercised | | | | | | | | | | | | | | | | 2,592 | | | | | | | | | | | | | | | | 2,592 | |
| Restricted stock award, net of forfeitures | | | 496 | | | | | | | | | 496 | | | | 3,161 | | | | (3,657 | ) | | | | | | | | | | | — | |
| Restricted stock amortization | | | | | | | | | | | | | | | | | | | | 2,086 | | | | | | | | | | | | 2,086 | |
| Purchase of Company common stock | | | (30,956 | ) | | | | | | | | (30,956 | ) | | | (194,196 | ) | | | | | | | | | | | | | | | (225,152 | ) |
| | | | | | | | | | | | | | | | | | | | | | | | | | | | | | | | | | |
| Balance at December 31, 2005 | | | 294,809 | | | | | 343,771 | | | | (48,962 | ) | | | 2,182,745 | | | | (3,593 | ) | | | (962,905 | ) | | | 70,499 | | | | 1,581,555 | |
| | | | | | | | | | | | | | | | | | | | | | | | | | | | | | | | | | |
| Comprehensive income: | | | | | | | | | | | | | | | | | | | | | | | | | | | | | | | | | |
| Net income | | | | | | | | | | | | | | | | | | | | | | | | 56,511 | | | | | | | | 56,511 | |
| Other comprehensive income: | | | | | | | | | | | | | | | | | | | | | | | | | | | | | | | | | |
| Foreign currency translation | | | | | | | | | | | | | | | | | | | | | | | | | | | | 1,039 | | | | 1,039 | |
| Unrealized loss on available-for-sale securities | | | | | | | | | | | | | | | | | | | | | | | | | | | | (3,731 | ) | | | (3,731 | ) |
| Reclassification for translation adjustments realized in net income, net | | | | | | | | | | | | | | | | | | | | | | | | | | | | 5,114 | | | | 5,114 | |
| | | | | | | | | | | | | | | | | | | | | | | | | | | | | | | | | | |
| Total other comprehensive income | | | | | | | | | | | | | | | | | | | | | | | | | | | | | | | | 2,422 | |
| Total comprehensive income | | | | | | | | | | | | | | | | | | | | | | | | | | | | | | | | 58,933 | |
| Adjustment for initial adoption of FAS 158 | | | | | | | | | | | | | | | | | | | | | | | | | | | | (623 | ) | | | (623 | ) |
| Dividends on common stock ($.105 per share) | | | | | | | | | | | | | | | | (30,764 | ) | | | | | | | | | | | | | | | (30,764 | ) |
| Common Stock: | | | | | | | | | | | | | | | | | | | | | | | | | | | | | | | | | |
| Stock option exercises | | | 1,403 | | | | | 1,403 | | | | | | | | 4,542 | | | | | | | | | | | | | | | | 5,945 | |
| Reclassification of unearned compensation for restricted stock | | | | | | | | | | | | | | | | (3,593 | ) | | | 3,593 | | | | | | | | | | | | — | |
| Retirement of treasury shares | | | | | | | | (51,942 | ) | | | 51,942 | | | | | | | | | | | | | | | | | | | | — | |
| Restricted stock award, net of forfeitures and other | | | 430 | | | | | | | | | 430 | | | | 134 | | | | | | | | | | | | | | | | 564 | |
| Employee share-based compensation earned | | | | | | | | | | | | | | | | 7,035 | | | | | | | | | | | | | | | | 7,035 | |
| Purchase of Company common stock | | | (3,420 | ) | | | | | | | | (3,420 | ) | | | (24,450 | ) | | | | | | | | | | | | | | | (27,870 | ) |
| | | | | | | | | | | | | | | | | | | | | | | | | | | | | | | | | | |
| Balance at December 31, 2006 | | | 293,222 | | | | $ | 293,232 | | | $ | (10 | ) | | $ | 2,135,649 | | | $ | — | | | $ | (906,394 | ) | | $ | 72,298 | | | $ | 1,594,775 | |
| | | | | | | | | | | | | | | | | | | | | | | | | | | | | | | | | | |
| Comprehensive income: | | | | | | | | | | | | | | | | | | | | | | | | | | | | | | | | | |
| Net income | | | | | | | | | | | | | | | | | | | | | | | | 247,729 | | | | | | | | 247,729 | |
| Other comprehensive income: | | | | | | | | | | | | | | | | | | | | | | | | | | | | | | | | | |
| Foreign currency translation | | | | | | | | | | | | | | | | | | | | | | | | | | | | 92,003 | | | | 92,003 | |
| Unrealized loss on available-for-sale securities | | | | | | | | | | | | | | | | | | | | | | | | | | | | (5,699 | ) | | | (5,699 | ) |
| Reclassification for losses on available-for-sale securities realized in net income | | | | | | | | | | | | | | | | | | | | | | | | | | | | 9,430 | | | | 9,430 | |
| Reclassification for translation adjustment realized in net gain. | | | | | | | | | | | | | | | | | | | | | | | | | | | | (16,065 | ) | | | (16,065 | ) |
| Recognition of prior service cost | | | | | | | | | | | | | | | | | | | | | | | | | | | | 623 | | | | 623 | |
| | | | | | | | | | | | | | | | | | | | | | | | | | | | | | | | | | |
| Total other comprehensive income | | | | | | | | | | | | | | | | | | | | | | | | | | | | | | | | 80,292 | |
| Total comprehensive income | | | | | | | | | | | | | | | | | | | | | | | | | | | | | | | | 328,021 | |
| Cumulative effect of FIN 48 adoption | | | | | | | | | | | | | | | | | | | | | | | | 29,853 | | | | | | | | 29,853 | |
| Tax benefits related to share-based awards | | | | | | | | | | | | | | | | 18,513 | | | | | | | | | | | | | | | | 18,513 | |
| Dividends on common stock ($.13 per share) | | | | | | | | | | | | | | | | (36,426 | ) | | | | | | | | | | | | | | | (36,426 | ) |
| Common Stock: | | | | | | | | | | | | | | | | | | | | | | | | | | | | | | | | | |
| Stock option exercises | | | 7,732 | | | | | 7,732 | | | | | | | | 45,206 | | | | | | | | | | | | | | | | 52,938 | |
| Restricted stock award, net of forfeitures and other | | | 374 | | | | | 314 | | | | 60 | | | | 369 | | | | | | | | | | | | | | | | 743 | |
| Employee share-based compensation earned | | | | | | | | | | | | | | | | 8,787 | | | | | | | | | | | | | | | | 8,787 | |
| Purchase of Company common stock | | | (38,470 | ) | | | | | | | | (38,470 | ) | | | (297,498 | ) | | | | | | | (169,153 | ) | | | | | | | (505,121 | ) |
| Retirement of treasury shares | | | | | | | | (36,459 | ) | | | 36,459 | | | | | | | | | | | | | | | | | | | | — | |
| | | | | | | | | | | | | | | | | | | | | | | | | | | | | | | | | | |
| Balance at December 31, 2007 | | | 262,858 | | | | $ | 264,819 | | | $ | (1,961 | ) | | $ | 1,874,600 | | | $ | — | | | $ | (797,965 | ) | | $ | 152,590 | | | $ | 1,492,083 | |
| | | | | | | | | | | | | | | | | | | | | | | | | | | | | | | | | | |
(See notes to consolidated financial statements)
47
SERVICE CORPORATION INTERNATIONAL
We are a provider of deathcare products and services, with a network of funeral service locations and cemeteries primarily operating in the United States and Canada. We divested our unconsolidated investment in the funeral operations of an entity in France in the fourth quarter of 2007. Additionally, we divested 70% of Kenyon International Emergency Services (Kenyon), a company that specializes in providing disaster management services in mass fatality incidents as well as training, planning, and crisis communications consulting services, in the fourth quarter of 2007. Kenyon’s results are included in our funeral operations segment through the date of the sale. As part of the Alderwoods transaction, we acquired an insurance business that we sold in the third quarter of 2007. The operations of this business through the date of the sale are presented as discontinued operations in our consolidated statement of operations.
Our funeral service and cemetery operations consist of funeral service locations, cemeteries, funeral service/cemetery combination locations, crematoria, and related businesses. Funeral service locations provide all professional services relating to funerals and cremations, including the use of funeral facilities and motor vehicles and preparation and embalming services. Funeral-related merchandise, including caskets, burial vaults, cremation receptacles, flowers, and other ancillary products and services, is sold at funeral service locations. Cemeteries provide cemetery property interment rights, including mausoleum spaces, lots, and lawn crypts, and sell cemetery related merchandise and services, including stone and bronze memorials, markers, casket and cremation memorialization products, merchandise installations, and burial openings and closings. We also sell preneed funeral and cemetery products and services whereby a customer contractually agrees to the terms of certain products and services to be provided in the future.
| |
| 2. | Summary of Significant Accounting Policies |
Principles of Consolidation and Basis of Presentation
Our consolidated financial statements include the accounts of Service Corporation International (SCI) and all wholly-owned subsidiaries. These statements also include the accounts of the funeral trusts, cemetery merchandise and services trusts, and perpetual care trusts in which we have a variable interest and are the primary beneficiary. Intercompany balances and transactions have been eliminated in consolidation.
Business Combinations
We apply the principles provided in Statement of Financial Accounting Standard (SFAS) 141 when we acquire businesses. Tangible and intangible assets acquired and liabilities assumed are recorded at fair value and goodwill is recognized for any difference between the price of the acquisition and our fair value determination. We customarily estimate our purchase costs and other related transactions known at closing of the acquisition. To the extent that information is not practicably available to us at the closing date subsequently becomes available during the allocation period, as defined in SFAS 141, we may adjust goodwill, assets, or liabilities associated with the acquisition.
On November 28, 2006, we completed the acquisition of Alderwoods Group, Inc. (Alderwoods) for $20.00 per share in cash, resulting in a purchase price of $1.2 billion, which includes the refinancing of $357.7 million and the assumption of $2.2 million of Alderwoods’ debt. Alderwoods properties were substantially integrated into our operations at December 31, 2007. These properties are operated in the same manner as our incumbent properties, and are reported in the appropriate reporting unit (segment) whether funeral or cemetery in our consolidated financial statements. For further information related to this acquisition, see Note 4.
48
SERVICE CORPORATION INTERNATIONAL
NOTES TO CONSOLIDATED FINANCIAL STATEMENTS — (Continued)
Reclassifications
Certain reclassifications have been made to prior years to conform to current period financial statement presentation with no effect on our previously reported consolidated financial position, results of operations, or cash flows.
Use of Estimates in the Preparation of Financial Statements
The preparation of the consolidated financial statements in conformity with accounting principles generally accepted in the United States of America requires management to make estimates and assumptions that may affect the reported amounts of assets and liabilities and disclosure of contingent assets and liabilities at the date of the consolidated financial statements and the reported amounts of expenses during the reporting period. As a result, actual results could differ from these estimates.
Cash and Cash Equivalents
We consider all highly liquid investments with an original maturity of three months or less to be cash equivalents. At December 31, 2007, the majority of our cash was invested in commercial paper.
Accounts Receivables and Allowance for Doubtful Accounts
Our trade receivables primarily consist of amounts due for funeral services already performed. We provide various allowancesand/or cancellation reserves for our funeral and cemetery preneed and atneed receivables as well as for our preneed funeral and preneed cemetery deferred revenues. These allowances are based on an analysis of historical trends and include, where applicable, collection and cancellation activity. Atneed funeral and cemetery receivables are considered past due after 30 days. Collections are managed by the locations until a receivable is 180 days delinquent at which time it is fully reserved and sent to a collection agency. These estimates are impacted by a number of factors, including changes in economy, relocation, and demographic or competitive changes in our areas of operation.
Inventories and Cemetery Property
Funeral and cemetery merchandise are stated at the lower of average cost or market. Cemetery property is recorded at cost. Inventory costs and cemetery property are primarily relieved using specific identification in performance of a contract.
Property and Equipment, Net
Property and equipment are recorded at cost. Maintenance and repairs are charged to expense whereas renewals and major replacements that extend the assets useful lives are capitalized. Depreciation is recognized ratably over the estimated useful lives of the various classes of assets. Property is depreciated over a period ranging from seven to forty years, equipment is depreciated over a period from three to eight years and leasehold improvements are depreciated over the shorter of the lease term or ten years. Depreciation expense related to property and equipment was $115.7 million, $84.0 million and $60.7 million for the years ended December 31, 2007, 2006, and 2005, respectively. When property is sold or retired, the cost and related accumulated depreciation are removed from the consolidated balance sheet; resulting gains and losses are included in the consolidated statement of operations in the period of sale or disposal.
Leases
We have lease arrangements primarily related to funeral service locations and transportation equipment which were primarily classified as capital leases at December 31, 2007. Lease terms related to funeral home properties generally range from one to 35 years with options to renew at varying terms. Lease terms related to transportation
49
SERVICE CORPORATION INTERNATIONAL
NOTES TO CONSOLIDATED FINANCIAL STATEMENTS — (Continued)
equipment generally range from one to five years with options to renew at varying terms. We calculate operating lease expense ratably over the lease term. We consider reasonably assured renewal options and fixed escalation provisions in our calculation. For more information related to leases, see Note 13 to these consolidated financial statements.
Goodwill
The excess of purchase price over the fair value of identifiable net assets acquired in business combinations accounted for as purchases is recorded as goodwill. Goodwill is tested annually for impairment or as otherwise required by assessing the fair value of each of our reporting units. As of December 31, 2007, our funeral segment reporting unit includes assets in North America and Germany. Our cemetery segment reporting unit includes assets in North America. The acquisition of Alderwoods resulted in an increase in goodwill to both our funeral and cemetery segments.
We test for impairment of goodwill in accordance with Statement of Financial Accounting Standards (SFAS) No. 142“Goodwill and Other Intangible Assets”(SFAS 142) annually during the fourth quarter using information as of September 30.
We test for impairment of goodwill using a two-step approach as prescribed in SFAS 142. The first step of our goodwill impairment test compares the fair value of a reporting unit to its carrying amount, including goodwill. Our reporting units are the funeral and cemetery segments. We do not record an impairment of goodwill in instances where the fair value of a reporting unit exceeds its carrying amount. If fair value is less than the carrying amount for a reporting unit, we compare the implied fair value of goodwill (as defined in SFAS 142) to the carrying amount of goodwill. If the carrying amount of reporting unit goodwill exceeds the implied fair value of that goodwill, an impairment loss is recognized in an amount equal to that excess. Fair market value of a reporting unit is determined using a calculation based on discounted cash flows and multiples of EBITDA, or earnings before interest, taxes, depreciation and amortization, of both SCI and its competitors. Based on the impairment tests performed during the fourth quarter using September 30 information, we concluded that there was no impairment of goodwill at December 31, 2007 or 2006. See Note 9 of these consolidated financial statements.
Other Intangible Assets
Our intangible assets include cemetery customer relationships, trademarks and tradenames, and other assets primarily resulting from the acquisition of Alderwoods. Our trademark, tradename, and water rights assets are considered to have an indefinite life and are not subject to amortization; rather, such assets are tested annually, and as otherwise needed, for impairment. Based on the impairment tests performed during the fourth quarter using September 30 information, we concluded there was no impairment of these intangible assets as of December 31, 2007. Our preneed deferred revenue intangible asset is relieved using specific identification in performance of a contract. We amortize all other intangible assets on a straight-line basis over their estimated useful lives of10-20 years. Amortization expense for other intangible assets was $14.7 million, $12.7 million, and $14.2 million for the years ended December 31, 2007, 2006, and 2005, respectively.
Impairment or Disposal of Long-Lived Assets
We review our other definite-lived long-lived assets for impairment when changes in circumstances indicate that the carrying amount of the asset may not be recoverable, in accordance with SFAS No. 144,“Accounting for the Impairment or Disposal of Long-Lived Assets”(SFAS 144). SFAS 144 requires that long-lived assets to be held and used are reported at the lower of their carrying amount or fair value. Assets to be disposed of and assets not expected to provide any future service potential are recorded at the lower of their carrying amount or fair value less estimated cost to sell.
50
SERVICE CORPORATION INTERNATIONAL
NOTES TO CONSOLIDATED FINANCIAL STATEMENTS — (Continued)
Treasury Stock
We make treasury stock purchases in the open market or through privately negotiated transactions subject to market conditions and normal trading restrictions. We account for the repurchase of our common stock under the par value method. We use the average cost method upon the subsequent reissuance of treasury shares. On December 15, 2007, we cancelled 36.5 million shares of common stock held in our treasury. These retired treasury shares were changed to authorized but unissued status.
Foreign Currency Translation
All assets and liabilities of our foreign subsidiaries are translated into U.S. dollars at exchange rates in effect as of the end of the reporting period. Revenue and expense items are translated at the average exchange rates for the reporting period. The resulting translation adjustments are included in stockholders’ equity as a component ofAccumulated other comprehensive income in the consolidated statement of stockholders’ equity and balance sheet.
The functional currency of SCI and its subsidiaries is the respective local currency. The transactional currency gains and losses that arise from transactions denominated in currencies other than the functional currencies of our operations are recorded inOther income, netin the consolidated statement of operations. We do not operate in countries which are considered to have hyperinflationary economies.
Funeral Operations
Revenue is recognized when the funeral services are performed and funeral merchandise is delivered. Our funeral trade receivables consist of amounts due for services already performed and merchandise delivered. An allowance for doubtful accounts is provided based on historical experience. We sell price guaranteed preneed funeral contracts through various programs providing for future funeral services at prices prevailing when the agreements are signed. Revenues associated with sales of preneed funeral contracts are deferred until such time that the funeral services are performed. Allowances for customer cancellations are based upon historical experience. Sales taxes collected are recognized on a net basis.
Pursuant to state or provincial law, all or a portion of the proceeds from funeral merchandise or services sold on a preneed basis may be required to be paid into trust funds. We defer investment earnings related to these merchandise and services trusts until the associated merchandise is delivered or services are performed. Costs related to sales of merchandise and services are charged to expense when merchandise is delivered and services performed. See Note 5 to the consolidated financial statements regarding preneed funeral activities.
Cemetery Operations
Revenue associated with sales of cemetery merchandise and services is recognized when the service is performed or merchandise is delivered. Our cemetery trade receivables consist of amounts due for services already performed and merchandise already delivered. An allowance for doubtful accounts has been provided based on historical experience. Revenue associated with sales of preneed cemetery interment rights is recognized in accordance with the retail land sales provisions of SFAS No. 66,“Accounting for the Sales of Real Estate”(SFAS 66). Under SFAS 66, revenue from constructed cemetery property is not recognized until 10% of the sales price has been collected. Revenue related to the preneed sale of unconstructed cemetery property is deferred until it is constructed and 10% of the sales price is collected. Revenue associated with sales of preneed merchandise and services is not recognized until the merchandise is delivered or the services are performed. Allowances for customer cancellations for preneed cemetery contracts are based upon historical experience. For personalized marker merchandise, with the customer’s direction generally obtained at the time of sale, we can choose to order, store, and transfer title to the customer. In situations in which we have no further obligation or involvement related to the merchandise, we recognize revenues and record the cost of sales in accordance with SAB 104 upon the earlier of vendor storage of these items or delivery in our cemetery. For services and non-personalized merchandise (such as
51
SERVICE CORPORATION INTERNATIONAL
NOTES TO CONSOLIDATED FINANCIAL STATEMENTS — (Continued)
vaults), we defer the revenues until the services are performed and the merchandise is delivered. Sales taxes collected are recognized on a net basis.
Pursuant to state or provincial law, all or a portion of the proceeds from cemetery merchandise or services sold on a preneed basis may be required to be paid into trust funds. We defer investment earnings related to these merchandise and services trusts until the associated merchandise is delivered or services are performed.
A portion of the proceeds from the sale of cemetery property interment rights is required by state or provincial law to be paid into perpetual care trust funds. Investment earnings from these trusts are distributed to us regularly, are recognized in current cemetery revenues, and are intended to defray cemetery maintenance costs, which are expensed as incurred. The principal of such perpetual care trust funds generally cannot be withdrawn.
Costs related to the sale of property interment rights include the property and construction costs specifically identified by project. At the completion of the project, construction costs are charged to expense in the same period revenue is recognized. Costs related to sales of merchandise and services are charged to expense when merchandise is delivered and when services are performed. See Note 6 to the consolidated financial statements regarding preneed cemetery activities.
Income Taxes
Income taxes are computed using the liability method. Deferred taxes are provided on all temporary differences between the financial bases and the tax bases of assets and liabilities. We record a valuation allowance to reduce our deferred tax assets when uncertainty regarding their realization exists. We intend to permanently reinvest the unremitted earnings of certain of our foreign subsidiaries in those businesses outside the United States and, therefore, have not provided for deferred federal income taxes on such unremitted foreign earnings. For more information related to income taxes, see Note 10 to the consolidated financial statements.
| |
| 3. | Recent Accounting Pronouncements and Accounting Changes |
In December 2007, the Financial Accounting Standards Board (FASB) issued Statement of Financial Accounting Standards (SFAS) No. 141 (revised 2007),“Business Combinations”(SFAS 141(R)), which establishes principles and requirements for how an acquirer recognizes and measures in its financial statements the identifiable assets acquired (including goodwill), the liabilities assumed and any non-controlling interest in the acquiree. SFAS 141(R) also establishes disclosure requirements to enable users of the financial statements to evaluate the nature and financial effects of the business combination. SFAS 141(R) is effective for us for business combinations for which the acquisition date is on after January 1, 2009. The impact of adopting SFAS 141(R) will be dependent on the future business combinations, if any, that we may pursue after its effective date.
In December 2007, the FASB issued SFAS No 160,“Noncontrolling Interests in Consolidated Financial Statements — an amendment of ARB No. 51”(SFAS 160), which establishes accounting and reporting standards for the noncontrolling interest in a subsidiary and for the deconsolidation of a subsidiary. SFAS 160 clarifies that a noncontrolling interest in a subsidiary, which is sometimes referred to as unconsolidated investment, is an ownership interest in the consolidated entity that should be reported as a component of equity in the consolidated financial statements. Among other requirements, SFAS 160 requires consolidated net income to be reported at amounts that include the amounts attributable to both the parent and the non-controlling interest. It also requires disclosure, on the face of the consolidated income statement, of the amounts of consolidated net income attributable to the parent and to the noncontrolling interest. The provisions of SFAS 160 are effective for us on January 1, 2009. We are currently evaluating the impact of adopting SFAS 160 on our consolidated financial statements.
In March 2007, the FASB ratified Emerging Issues Task Force (EITF) IssueNo. 06-10“Accounting for Collateral Assignment Split-Dollar Life Insurance Agreements”(EITF 06-10).EITF 06-10 provides guidance for determining a liability for the postretirement benefit obligation as well as recognition and measurement of the associated asset on the basis of the terms of a collateral assignment agreement. The provisions ofEITF 06-10 are
52
SERVICE CORPORATION INTERNATIONAL
NOTES TO CONSOLIDATED FINANCIAL STATEMENTS — (Continued)
effective for us beginning January 1, 2008. We are currently evaluating the impact of adoptingEITF 06-10 on our consolidated financial statements.
In February 2007, the FASB issued SFAS No. 159,“The Fair Value Option for Financial Assets and Financial Liabilities” (SFAS 159). SFAS 159 permits entities to choose to measure various financial assets and financial liabilities at fair value. Unrealized gains and losses on items for which the fair value option has been elected are reported in earnings. The provisions of SFAS 159 are effective for us beginning January 1, 2008. The adoption of this statement is not expected to have a material impact on our consolidated financial statements.
In September 2006, the FASB issued SFAS No. 158,“Employers’ Accounting for Defined Benefit Pension and Other Postretirement Plans-an amendment of FASB Statements No. 87, 88, 106, and 132(R)”(SFAS 158), which requires recognition of the funded status of a benefit plan in the balance sheet. SFAS 158 also requires recognition, in other comprehensive income, of certain gains and losses that arise during the period but which were deferred under previous pension accounting rules. SFAS 158 also modifies the requirements for the timing of reports and disclosures. SFAS 158 provides recognition and disclosure elements that are effective for us during the year ended December 31, 2006 and measurement date elements that will be effective for us during the year ended December 31, 2008. We terminated our cash balance plan in 2007. We adopted the recognition and disclosure element of SFAS 158 effective December 31, 2006 and as a result we reclassified $0.6 million of unamortized prior service costs fromOther long-term liabilitiestoAccumulated other comprehensive income.
In September 2006, the FASB issued SFAS No. 157,“Fair Value Measurements” (SFAS 157), which defines fair value, establishes a framework for measuring fair value in accordance with generally accepted accounting principles, and expands disclosures about fair value measurements. The provisions of SFAS 157 are effective for us beginning January 1, 2008. We do not expect the adoption of SFAS 157 to have a material impact on our financial position or results of operations.
In September 2006, the FASB ratified EITF IssueNo. 06-5,“Accounting for Purchases of Life Insurance — Determining the Amount that Could be Realized in Accordance with FASB TechnicalBulletin 85-4”(EITF 06-5). The EITF concluded that a policyholder should consider any additional amounts included in the contractual terms of the life insurance policy in determining the “amount that could be realized under the insurance contract.” For group policies with multiple certificates or multiple policies with a group rider, the EITF also tentatively concluded that the amount that could be realized should be determined at the individual policy or certificate level, (i.e., amounts that would be realized only upon surrendering all of the policies or certificates would not be included when measuring the assets). We adopted the provisions ofEITF 06-5 effective January 1, 2007. The adoption ofEITF 06-5 had no impact to our consolidated financial statements.
In June 2006, the FASB issued FASB Interpretation No. 48, “Accounting for Uncertainty in Income Taxes — an Interpretation of FASB Statement No. 109” (FIN 48), which clarifies the accounting for uncertain income tax positions recognized in an enterprise’s financial statements in accordance with SFAS No. 109, “Accounting for Income Taxes”. This interpretation requires companies to use a prescribed model for assessing the financial statement recognition and measurement of all tax positions taken or expected to be taken in its tax returns. FIN 48 also provides guidance on derecognition, classification, interest and penalties, accounting in interim periods, disclosure, and transition. See Note 10 for a detailed description of the impact of the adoption of FIN 48 on our 2007 consolidated financial statements.
In February 2006, the FASB issued SFAS No. 155,“Accounting for Certain Hybrid Financial Instruments — an amendment of FASB Statements No. 133 and 140”(SFAS 155). SFAS 155 amends SFAS No. 133,“Accounting for Derivative Instruments and Hedging Activities”(SFAS 133), and SFAS No. 140,“Accounting for Transfers and Servicing of Financial Assets and Extinguishments of Liabilities”(SFAS 140). This statement also resolves issues addressed in Statement No. 133 Implementation Issue No. D1,“Application of Statement 133 to Beneficial Interests in Securitized Financial Assets.”SFAS 155 permits fair value remeasurement for any hybrid financial instrument that contains an embedded derivative that otherwise would require bifurcation and clarifies which interest-only
53
SERVICE CORPORATION INTERNATIONAL
NOTES TO CONSOLIDATED FINANCIAL STATEMENTS — (Continued)
strips and principal-only strips are not subject to the requirements of SFAS 133. SFAS 140 is amended to eliminate the prohibition on a qualifying special-purpose entity from holding a derivative financial instrument that pertains to a beneficial interest other than another derivative financial instrument. We adopted the provisions of SFAS 155 effective January 1, 2007. The adoption of SFAS 155 had no impact to our consolidated financial statements.
Effective January 1, 2005, we changed our method of accounting for direct selling costs related to the acquisition of preneed funeral and preneed cemetery contracts. Prior to this change, we capitalized these direct selling costs and amortized them in proportion to the revenue recognized. Under the new method of accounting, we expense direct selling costs as incurred. We believe the new method is preferable because it better reflects the economics of our business. We recorded a cumulative effect charge of $187.5 million, net of tax of $117.4 million.
In December 2004, the FASB issued SFAS No. 123R, “Share-Based Payment” (SFAS 123R). SFAS 123R is a revision of SFAS No. 123,“Accounting for Stock-Based Compensation”, and supersedes Accounting Principles Board Opinion No. 25,“Accounting for Stock Issued to Employees”(APB 25). Among other items, SFAS 123R eliminates the use of the intrinsic value method of accounting and requires companies to recognize in the statement of operations the cost of employee services received in exchange for awards of equity instruments based on the grant-date fair value of those awards. We adopted SFAS 123R on January 1, 2006 utilizing the modified-prospective transition method.
Prior to January 1, 2006, we accounted for share-based payments using the intrinsic value recognition method prescribed by APB 25. Because all of our stock options were granted at market value on the date of each grant, no stock-based compensation expense related to stock options was reflected in net income prior to adopting SFAS 123R.
Under the modified-prospective transition method, we recognize compensation expense on a straight-line basis in our consolidated financial statements issued subsequent to the date of adoption for all share-based payments granted, modified or settled after December 31, 2005, as well as for any awards that were granted prior to December 31, 2005 for which requisite service will be provided after December 31, 2005. The compensation expense on awards granted prior to December 31, 2005 is recognized using the fair values determined for the pro forma disclosures on stock-based compensation included in prior filings. The amount of compensation expense recognized on awards that were not fully vested at the date of SFAS 123R adoption excludes the compensation expense cumulatively recognized in the pro forma disclosures on stock-based compensation. Further, we assume no forfeitures on restricted shares granted prior to the adoption of SFAS 123R due to the nature of the employees to whom the shares were granted; thus, we recorded no cumulative effect of accounting change upon the adoption of SFAS 123R. For further information on share-based compensation see Note 15.
At the adoption date of SFAS 123R, 1,959,283 options were outstanding with alternative vesting methods. These shares were fully vested prior to the implementation of SFAS 123R and, as such, compensation expense for these options is not included in our consolidated statement of operations for the year ended December 31, 2007 or December 31, 2006. As of December 31, 2007 and 2006, 255,160 and 1,868,163, respectively, of these options remain outstanding. No additional options with alternative vesting methods were granted during the years ended December 31, 2007 and 2006.
As a result of the adoption of SFAS 123R,Income from continuing operations before income taxeswas reduced by $4.0 million,Income from continuing operationsandNet incomewere both reduced by $2.2 million, and basic and diluted earnings per share were both reduced by $.01 for the year ended December 31, 2006.
Results for the year ended December 31, 2005 have not been restated to reflect the impact of compensation expense for our stock option plans. If, prior to January 1, 2006, we had elected to recognize compensation expense
54
SERVICE CORPORATION INTERNATIONAL
NOTES TO CONSOLIDATED FINANCIAL STATEMENTS — (Continued)
for our stock option plans, based on the fair value of awards at the grant dates,Net lossandLoss per sharewould have changed for the year ended December 31, 2005 by the following pro forma amounts:
| | | | | |
| | | 2005 | |
| | | (In thousands,
| |
| | | except per
| |
| | | share amounts) | |
| |
| Net loss, as reported | | $ | (127,941 | ) |
| Deduct: Total pro forma stock-based employee compensation expense determined under fair value based method, net of related tax benefit | | | (1,767 | ) |
| | | | | |
| Pro forma net loss | | $ | (129,708 | ) |
| | | | | |
| Basic loss per share: | | | | |
| Net loss, as reported | | $ | (.42 | ) |
| Deduct: Total pro forma stock-based employee compensation expense determined under fair value based method, net of related tax benefit | | | (.01 | ) |
| | | | | |
| Pro forma basic loss per share | | $ | (.43 | ) |
| | | | | |
| Diluted loss per share: | | | | |
| Net loss, as reported | | $ | (.42 | ) |
| Deduct: Total pro forma stock-based employee compensation expense determined under fair value based method, net of related tax benefit | | | (.01 | ) |
| | | | | |
| Pro forma diluted loss per share | | $ | (.43 | ) |
| | | | | |
Prior to the implementation of SFAS 123R, we amortized stock-based compensation cost for employees eligible to retire over the three-year standard vesting period of the grants. Upon adoption of SFAS 123R, we recognize costs on new option grants to such retirement-eligible employees immediately upon grant, consistent with the retirement vesting acceleration provisions of these grants. If we had historically computed stock-based compensation cost for these employees under this accelerated method, $0.4 million or less than $.01 per diluted share of after-tax compensation cost would have been accelerated and cumulatively included in the pro forma expense above for the year ended December 31, 2005. The tax benefit associated with this additional compensation expense would have been $0.2 million for the year ended December 31, 2005.
| |
| 4. | Alderwoods Acquisition |
On November 28, 2006, we acquired all of the outstanding common stock of Alderwoods Group, Inc. (Alderwoods) for $20.00 per share in cash, resulting in a purchase price of approximately $1.2 billion, which includes the refinancing of $357.7 million and the assumption of $2.2 million of Alderwoods’ debt. Included in our results of operations for the year ended December 31, 2006 are the results of Alderwoods’ operations from the date of acquisition through December 31, 2006.
The primary reasons for the merger and the principal factors that contributed to the recognition of goodwill in this acquisition were:
| | |
| | • | the acquisition of Alderwoods creates a stronger company with the benefits of increased size and scale, enabling us to serve a number of new, complementary areas; |
| |
| | • | the acquisition of Alderwoods’ preneed backlog of deferred revenues enhances our long-term stability; and |
| |
| | • | combining the two companies’ operations provides significant synergies and related cost savings. |
The allocation of the purchase price to specific assets and liabilities was based upon the fair value of Alderwoods’ assets and liabilities and from information obtained from the accounting systems of Alderwoods. The
55
SERVICE CORPORATION INTERNATIONAL
NOTES TO CONSOLIDATED FINANCIAL STATEMENTS — (Continued)
fair value of assets and liabilities was determined using various methodologies and assumptions including the direct cost approach, expected sales proceeds of divested Alderwoods locations, historical operating results and income and market approaches. To the extent that information was not practicably available to us at the closing date, but subsequently became available during the allocation period, as defined in SFAS 141, we adjusted goodwill, assets, or liabilities associated with the acquisition. For more information on these adjustments, see Note 9. The following table summarizes, based on our final purchase price allocation, the fair values of the assets acquired and liabilities assumed in the Alderwoods acquisition:
| | | | | |
| | | (In thousands) | |
| |
| Current assets | | $ | 54,679 | |
| Cemetery property | | | 190,299 | |
| Property and equipment, net | | | 723,983 | |
| Preneed funeral and cemetery receivables and trust investments | | | 767,676 | |
| Intangible assets | | | 134,156 | |
| Deferred charges and other assets | | | 343,611 | |
| Goodwill | | | 95,040 | |
| | | | | |
| Total assets acquired | | | 2,309,444 | |
| Current liabilities | | | 129,396 | |
| Long-term debt | | | 9,090 | |
| Deferred preneed funeral and cemetery revenues and non-controlling interest in trusts | | | 781,710 | |
| Other liabilities | | | 159,590 | |
| | | | | |
| Total liabilities assumed | | | 1,079,786 | |
| | | | | |
| Net assets acquired | | $ | 1,229,658 | |
| | | | | |
Goodwill, land and certain identifiable intangible assets recorded in the acquisition are not subject to amortization; however, the goodwill and intangible assets are tested periodically for impairment as required by SFAS 142. Of the $95.0 million in goodwill recognized, $21.0 million was allocated to our cemetery segment and $74.0 million was allocated to our funeral segment. None of this goodwill is deductible for tax purposes. The $134.2 million of identified intangible assets acquired in the Alderwoods acquisition consists of the following:
| | | | | | | | | |
| | | Useful life | | | Fair Value | |
| | | | | | (In thousands) | |
| |
Asset |
| Preneed customer relationships related to insurance claims | | | 10 years | | | $ | 16,900 | |
| Referral relationships | | | 10-20 years | | | | 16,400 | |
| Preneed deferred revenue | | | 10-14 years | | | | 51,456 | |
| Tradenames | | | Indefinite | | | | 40,000 | |
| Licenses and permits | | | Indefinite | | | | 2,600 | |
| Water rights | | | Indefinite | | | | 6,800 | |
| | | | | | | | | |
| Total intangible assets | | | | | | $ | 134,156 | |
| | | | | | | | | |
56
SERVICE CORPORATION INTERNATIONAL
NOTES TO CONSOLIDATED FINANCIAL STATEMENTS — (Continued)
The following unaudited pro forma summary presents information as if the merger had occurred as of January 1, 2006:
| | | | | |
| | | Year Ended
| |
| | | December 31, 2006 | |
| | | (In thousands, except
| |
| | | per share amounts) | |
| |
| Revenue | | $ | 2,358,644 | |
| Income from continuing operations before cumulative effects of accounting change | | | 15,505 | |
| Net income | | | 22,450 | |
| Income from continuing operations before cumulative effects of accounting change per share: | | | | |
| Basic | | | .05 | |
| Diluted | | | .05 | |
| Net income per share: | | | | |
| Basic | | | .08 | |
| Diluted | | | .08 | |
| |
| 5. | Preneed Funeral Activities |
Preneed Funeral Receivables and Trust Investments
Preneed funeral receivables and trust investments, net of allowance for cancellation, represent trust investments, including investment earnings, and customer receivables related to unperformed, price-guaranteed preneed funeral contracts. When we, as the primary beneficiary, receive payments from the customer, we deposit the amount required by law into the trust and reclassify the corresponding amount fromDeferred preneed funeral revenuesintoNon-controlling interest in funeral and cemetery trusts.Amounts are withdrawn from the trusts after the contract is performed. We deposited $84.7 million, $77.7 million, and $72.0 million into and withdrew $176.5 million, $109.8 million, and $97.1 million from trusts during the years ended December 31, 2007, 2006, and 2005, respectively. Cash flows from preneed funeral contracts are presented as operating cash flows in our consolidated statement of cash flows.
The components ofPreneed funeral receivables and trust investmentsin our consolidated balance sheet at December 31 are as follows:
| | | | | | | | | |
| | | 2007 | | | 2006 | |
| | | (In thousands) | |
| |
| Trust investments, at market | | $ | 1,244,181 | | | $ | 1,329,922 | |
| Receivables from customers | | | 225,905 | | | | 230,183 | |
| Unearned finance charge | | | (5,961 | ) | | | (5,443 | ) |
| | | | | | | | | |
| | | | 1,464,125 | | | | 1,554,662 | |
| Allowance for cancellation | | | (29,722 | ) | | | (37,986 | ) |
| | | | | | | | | |
| Preneed funeral receivables and trust investments | | $ | 1,434,403 | | | $ | 1,516,676 | |
| | | | | | | | | |
An allowance for contract cancellation is estimated based on historical experience. Upon cancellation of a trust funded preneed funeral contract, a customer is generally entitled to receive a refund of the funds held in trust. In many jurisdictions, we may be obligated to fund any shortfall if the amounts deposited by the customer exceed the funds in trust including investment returns. Therefore, when realized or unrealized losses of a trust result in preneed funeral contracts being insufficient to meet contingent customer withdrawals, we assess such contracts to determine
57
SERVICE CORPORATION INTERNATIONAL
NOTES TO CONSOLIDATED FINANCIAL STATEMENTS — (Continued)
whether a loss provision should be recorded. No such loss provisions were required to be recognized as of December 31, 2007 or 2006.
Preneed funeral receivables and trust investmentsare reduced by the trust investment earnings (realized and unrealized) that we have been allowed to withdraw in certain states prior to maturity. These earnings are recorded inDeferred preneed funeral revenuesuntil the service is performed or the merchandise is delivered.
The activity inPreneed funeral receivables and trust investmentsfor the years ended December 31 is as follows:
| | | | | | | | | | | | | |
| | | 2007 | | | 2006 | | | 2005 | |
| | | (In thousands) | |
| |
| Beginning balance — Preneed funeral receivables and trust investments | | $ | 1,516,676 | | | $ | 1,226,192 | | | $ | 1,267,784 | |
| Net preneed contract sales | | | 146,250 | | | | 121,287 | | | | 132,157 | |
| Cash receipts from customers | | | (119,458 | ) | | | (110,438 | ) | | | (109,879 | ) |
| Deposits to trust | | | 84,712 | | | | 77,691 | | | | 71,961 | |
| Acquisitions (dispositions) of businesses, net | | | (73,502 | ) | | | 256,138 | | | | (17,257 | ) |
| Net undistributed investment earnings | | | 54,397 | | | | 82,007 | | | | 27,140 | |
| Maturities and distributed earnings | | | (184,579 | ) | | | (130,852 | ) | | | (131,651 | ) |
| Change in cancellation allowance | | | 8,816 | | | | (532 | ) | | | (10,714 | ) |
| Sale of debt associated with certain trust investments | | | — | | | | — | | | | (31,800 | ) |
| Effect of foreign currency and other | | | 1,091 | | | | (4,817 | ) | | | 28,451 | |
| | | | | | | | | | | | | |
| Ending balance — Preneed funeral receivables and trust investments | | $ | 1,434,403 | | | $ | 1,516,676 | | | $ | 1,226,192 | |
| | | | | | | | | | | | | |
The cost and market values associated with funeral trust investments at December 31, 2007 and 2006 are detailed below. Cost reflects the investment (net of redemptions) of control holders in common trust funds, mutual funds, and private equity investments. Fair market value represents the value of the underlying securities or cash held by the common trust funds, mutual funds at published values, and the estimated market value of private equity investments (including debt as well as the estimated fair value related to the contract holders’ equity in majority-owned real estate investments). The fair market value of funeral trust investments, which in the aggregate represented 100% and 103% of the related cost basis of such investments as of December 31, 2007 and 2006, respectively, was based primarily on quoted market prices at December 31, 2007 and 2006. We assess our trust investments forother-than-temporary declines in fair value on a quarterly basis, primarily using actively traded, published values, in accordance with SFAS 115,“Accounting for Certain Investments in Debt and Equity Securities” (SFAS 115). As a result of our reviews during 2007, we recorded a $3.6 million impairment charge for other-than-temporary declines in fair value related to unrealized losses on certain private equity and other investments. Such impairment charges are recognized as investment losses and offset by interest income related to non-controlling interest in funeral trust investments inOther expense, netin our Consolidated Statements of Operations. As a result of our most recent review at December 31, 2007, we recorded no additional impairment charges. The review at December 31, 2006 resulted in no adjustments for unrealized losses related to certain private equity and other investments. See Note 8 to the consolidated financial statements for further information related to non-controlling interest in funeral trust investments.
58
SERVICE CORPORATION INTERNATIONAL
NOTES TO CONSOLIDATED FINANCIAL STATEMENTS — (Continued)
| | | | | | | | | | | | | | | | | |
| | | December 31, 2007 | |
| | | | | | Unrealized
| | | Unrealized
| | | Fair Market
| |
| | | Cost | | | Gains | | | Losses | | | Value | |
| | | (In thousands) | |
| |
| Cash and cash equivalents | | $ | 194,728 | | | $ | — | | | $ | — | | | $ | 194,728 | |
| Fixed income securities: | | | | | | | | | | | | | | | | |
| U.S. Treasury | | | 79,430 | | | | 630 | | | | (378 | ) | | | 79,682 | |
| Foreign government | | | 68,205 | | | | 367 | | | | (597 | ) | | | 67,975 | |
| Corporate | | | 7,062 | | | | 183 | | | | (76 | ) | | | 7,169 | |
| Mortgage-backed | | | 2,670 | | | | 53 | | | | (17 | ) | | | 2,706 | |
| Insurance-backed | | | 196,406 | | | | — | | | | — | | | | 196,406 | |
| Asset-backed | | | 33 | | | | — | | | | — | | | | 33 | |
| Equity securities: | | | | | | | | | | | | | | | | |
| Preferred stock | | | 1,581 | | | | 36 | | | | (23 | ) | | | 1,594 | |
| Common stock | | | 378,628 | | | | 12,415 | | | | (6,131 | ) | | | 384,912 | |
| Mutual funds: | | | | | | | | | | | | | | | | |
| Equity | | | 127,606 | | | | 3,991 | | | | (2,246 | ) | | | 129,351 | |
| Fixed income | | | 140,857 | | | | 3,005 | | | | (1,612 | ) | | | 142,250 | |
| Private equity and other | | | 49,854 | | | | 2,854 | | | | (6,518 | ) | | | 46,190 | |
| | | | | | | | | | | | | | | | | |
| Trust investments | | $ | 1,247,060 | | | $ | 23,534 | | | $ | (17,598 | ) | | $ | 1,252,996 | |
| | | | | | | | | | | | | | | | | |
| Less: Assets associated with businesses held for sale | | | | | | | | | | | | | | | (8,815 | ) |
| | | | | | | | | | | | | | | | | |
| | | | | | | | | | | | | | | $ | 1,244,181 | |
| | | | | | | | | | | | | | | | | |
59
SERVICE CORPORATION INTERNATIONAL
NOTES TO CONSOLIDATED FINANCIAL STATEMENTS — (Continued)
| | | | | | | | | | | | | | | | | |
| | | December 31, 2006 | |
| | | | | | Unrealized
| | | Unrealized
| | | Fair Market
| |
| | | Cost | | | Gains | | | Losses | | | Value | |
| | | (In thousands) | |
| |
| Cash and cash equivalents | | $ | 235,178 | | | $ | — | | | $ | — | | | $ | 235,178 | |
| Fixed income securities: | | | | | | | | | | | | | | | | |
| U.S. Treasury | | | 72,280 | | | | 1,648 | | | | (278 | ) | | | 73,650 | |
| Foreign government | | | 86,770 | | | | 608 | | | | (471 | ) | | | 86,907 | |
| Corporate | | | 4,844 | | | | 132 | | | | (44 | ) | | | 4,932 | |
| Mortgage-backed | | | 4,390 | | | | 116 | | | | (43 | ) | | | 4,463 | |
| Insurance-backed | | | 203,709 | | | | — | | | | — | | | | 203,709 | |
| Equity securities: | | | | | | | | | | | | | | | | |
| Preferred stock | | | 714 | | | | 47 | | | | (5 | ) | | | 756 | |
| Common stock | | | 328,672 | | | | 22,425 | | | | (2,698 | ) | | | 348,399 | |
| Mutual funds: | | | | | | | | | | | | | | | | |
| Equity | | | 124,154 | | | | 12,896 | | | | (539 | ) | | | 136,511 | |
| Fixed income | | | 212,302 | | | | 8,561 | | | | (2,254 | ) | | | 218,609 | |
| Private equity and other | | | 65,127 | | | | 1,328 | | | | (783 | ) | | | 65,672 | |
| | | | | | | | | | | | | | | | | |
| Trust investments | | $ | 1,338,140 | | | $ | 47,761 | | | $ | (7,115 | ) | | $ | 1,378,786 | |
| | | | | | | | | | | | | | | | | |
| Less: Assets associated with businesses held for sale | | | | | | �� | | | | | | | | | (48,864 | ) |
| | | | | | | | | | | | | | | | | |
| | | | | | | | | | | | | | | $ | 1,329,922 | |
| | | | | | | | | | | | | | | | | |
Maturity dates of the fixed income securities range from 2007 to 2038. Maturities of fixed income securities at December 31, 2007 are estimated as follows:
| | | | | |
| | | Fair Market
| |
| | | Value | |
| | | (In thousands) | |
| |
| Due in one year or less | | $ | 140,881 | |
| Due in one to five years | | | 70,471 | |
| Due in five to ten years | | | 92,852 | |
| Thereafter | | | 49,767 | |
| | | | | |
| | | $ | 353,971 | |
| | | | | |
We have determined that unrealized losses in our funeral trust investments at both December 31, 2007 and 2006 are considered temporary in nature, as the unrealized losses were due to temporary fluctuations in interest rates and equity prices. We believe that none of the securities are other-than-temporarily impaired based on an analysis of the investments as well as our discussions with trustees, money managers and consultants. Our funeral
60
SERVICE CORPORATION INTERNATIONAL
NOTES TO CONSOLIDATED FINANCIAL STATEMENTS — (Continued)
trust investment unrealized losses, their durations and the fair market value as of December 31, 2007, are shown in the following table.
| | | | | | | | | | | | | | | | | | | | | | | | | |
| | | Less Than 12 Months | | | Greater Than 12 Months | | | Total | |
| | | Fair
| | | | | | Fair
| | | | | | Fair
| | | | |
| | | Market
| | | Unrealized
| | | Market
| | | Unrealized
| | | Market
| | | Unrealized
| |
| | | Value | | | Losses | | | Value | | | Losses | | | Value | | | Losses | |
| | | (In thousands) | |
| |
| Fixed income securities: | | | | | | | | | | | | | | | | | | | | | | | | |
| U.S. Treasury | | $ | 9,712 | | | $ | (284 | ) | | $ | 2,913 | | | $ | (94 | ) | | $ | 12,625 | | | $ | (378 | ) |
| Foreign government | | | 6,975 | | | | (408 | ) | | | 9,204 | | | | (189 | ) | | | 16,179 | | | | (597 | ) |
| Corporate | | | 1,859 | | | | (54 | ) | | | 639 | | | | (22 | ) | | | 2,498 | | | | (76 | ) |
| Mortgage-backed | | | 579 | | | | (12 | ) | | | 303 | | | | (5 | ) | | | 882 | | | | (17 | ) |
| Equity securities: | | | | | | | | | | | | | | | | | | | | | | | | |
| Preferred stock | | | 597 | | | | (17 | ) | | | 192 | | | | (6 | ) | | | 789 | | | | (23 | ) |
| Common stock | | | 139,050 | | | | (4,439 | ) | | | 45,594 | | | | (1,692 | ) | | | 184,644 | | | | (6,131 | ) |
| Mutual funds: | | | | | | | | | | | | | | | | | | | | | | | | |
| Equity | | | 47,543 | | | | (1,631 | ) | | | 13,882 | | | | (615 | ) | | | 61,425 | | | | (2,246 | ) |
| Fixed income | | | 46,640 | | | | (1,153 | ) | | | 15,940 | | | | (459 | ) | | | 62,580 | | | | (1,612 | ) |
| Private equity and other | | | 46 | | | | (18 | ) | | | 27,234 | | | | (6,500 | ) | | | 27,280 | | | | (6,518 | ) |
| | | | | | | | | | | | | | | | | | | | | | | | | |
| Total temporarily impaired securities | | $ | 253,001 | | | $ | (8,016 | ) | | $ | 115,901 | | | $ | (9,582 | ) | | $ | 368,902 | | | $ | (17,598 | ) |
| | | | | | | | | | | | | | | | | | | | | | | | | |
During the year ended December 31, 2007, purchases and sales ofavailable-for-sale securities included in trust investments were $1,093.3 million and $901.6 million, respectively. These sale transactions resulted in $106.4 million and $29.9 million of realized gains and realized losses, respectively, for the year ended December 31, 2007. During the year ended December 31, 2006, purchases and sales ofavailable-for-sale securities included in trust investments were $646.7 million and $862.5 million, respectively. These sale transactions resulted in $83.4 million and $36.7 million of realized gains and realized losses, respectively for the year ended December 31, 2006. During the year ended December 31, 2005, purchases and sales ofavailable-for-sale securities included in trust investments were $835.0 million and $1,036.0 million, respectively. These sale transactions resulted in $56.6 million and $19.5 million of realized gains and losses, respectively, for the year ended December 31, 2005. We use the first in, first out (FIFO) method to determine the cost of funeral trustavailable-for-sale securities sold during the period.
Earnings from all trust investments are recognized in current funeral revenues when the service is performed, merchandise is delivered, or upon cancellation of the amount we are entitled to retain. Recognized earnings (realized and unrealized) related to these trust investments were $45.8 million, $35.1 million, and $37.8 million for the years ended December 31, 2007, 2006, and 2005, respectively.
Deferred Preneed Funeral Revenues
At December 31, 2007 and 2006,Deferred preneed funeral revenues, net of allowance for cancellation, represent future funeral service revenues, including distributed trust investment earnings associated with unperformed trust funded preneed funeral contracts that are not held in trust accounts.Deferred preneed funeral revenuesare recognized in current funeral revenues when the service is performed or merchandise is delivered. Future funeral service revenues and net trust investment earnings that are held in trust accounts are included inNon-controlling interest in funeral and cemetery trusts.
61
SERVICE CORPORATION INTERNATIONAL
NOTES TO CONSOLIDATED FINANCIAL STATEMENTS — (Continued)
The following table summarizes the activity inDeferred preneed funeral revenuesfor the years ended December 31:
| | | | | | | | | | | | | |
| | | 2007 | | | 2006 | | | 2005 | |
| | | (In thousands) | |
| |
| Beginning balance — Deferred preneed funeral revenues, net | | $ | 537,792 | | | $ | 535,384 | | | $ | 540,794 | |
| Net preneed contract sales | | | 135,417 | | | | 107,291 | | | | 129,459 | |
| Acquisitions (dispositions) of businesses, net | | | (120,290 | ) | | | 25,758 | | | | (18,253 | ) |
| Net investment earnings | | | 56,779 | | | | 76,127 | | | | 22,783 | |
| Recognized deferred preneed revenues | | | (173,126 | ) | | | (136,376 | ) | | | (157,861 | ) |
| Change in cancellation allowance | | | 6,499 | | | | (7,815 | ) | | | (5,539 | ) |
| Change in non-controlling interest | | | 76,370 | | | | (52,512 | ) | | | 8,167 | |
| Effect of foreign currency and other | | | 7,227 | | | | (10,065 | ) | | | 15,834 | |
| | | | | | | | | | | | | |
| Ending balance — Deferred preneed funeral revenues, net | | $ | 526,668 | | | $ | 537,792 | | | $ | 535,384 | |
| | | | | | | | | | | | | |
Insurance-Funded Preneed Funeral Contracts
Not included in the consolidated balance sheet are insurance-funded preneed funeral contracts that will be funded by life insurance or annuity contracts issued by third party insurers. The proceeds of the life insurance policies or annuity contracts will be reflected in funeral revenues as these funerals are performed by the Company.
| |
| 6. | Preneed Cemetery Activities |
Preneed Cemetery Receivables and Trust Investments
Preneed cemetery receivables and trust investments, net of allowance for cancellation, represent trust investments, including investment earnings, and customer receivables, net of unearned finance charges, for contracts sold in advance of when the property interment rights, merchandise, or services are needed. When we, as the primary beneficiary, receive payments from the customer, we deposit the amount required by law into the trust, remove the corresponding amount fromDeferred preneed cemetery revenues, and record the amount intoNon-controlling interest in funeral and cemetery trusts.Amounts are withdrawn from the trusts when the contract is performed. We deposited $115.7 million, $117.5 million, and $114.3 million into and withdrew $148.6 million, $88.7 million, and $128.2 million from the trusts during the years ended December 31, 2007, 2006, and 2005, respectively. Cash flows from preneed cemetery contracts are presented as operating cash flows in our consolidated statement of cash flows.
The components ofPreneed cemetery receivables and trust investmentsin the consolidated balance sheet at December 31, 2007 and 2006 are as follows:
| | | | | | | | | |
| | | December 31,
| | | December 31,
| |
| | | 2007 | | | 2006 | |
| | | (In thousands) | |
| |
| Trust investments, at market | | $ | 1,158,516 | | | $ | 1,236,446 | |
| Receivables from customers | | | 351,409 | | | | 384,428 | |
| Unearned finance charges | | | (47,527 | ) | | | (54,704 | ) |
| | | | | | | | | |
| | | | 1,462,398 | | | | 1,566,170 | |
| Allowance for cancellation | | | (34,341 | ) | | | (43,586 | ) |
| | | | | | | | | |
| Preneed cemetery receivables and trust investments | | $ | 1,428,057 | | | $ | 1,522,584 | |
| | | | | | | | | |
62
SERVICE CORPORATION INTERNATIONAL
NOTES TO CONSOLIDATED FINANCIAL STATEMENTS — (Continued)
The activity inPreneed cemetery receivables and trust investmentsfor the years ended December 31 is as follows:
| | | | | | | | | | | | | |
| | | 2007 | | | 2006 | | | 2005 | |
| | | (In thousands) | |
| |
| Beginning balance — Preneed cemetery receivables and trust investments | | $ | 1,522,584 | | | $ | 1,288,515 | | | $ | 1,399,778 | |
| Net sales including deferred and recognized revenue | | | 499,965 | | | | 324,713 | | | | 334,615 | |
| Acquisitions (dispositions) of businesses, net | | | (105,428 | ) | | | 155,224 | | | | (65,112 | ) |
| Net investment earnings | | | 88,700 | | | | 107,760 | | | | 27,229 | |
| Cash receipts from customers, net of refunds | | | (521,475 | ) | | | (381,688 | ) | | | (368,234 | ) |
| Deposits to trust | | | 115,651 | | | | 117,518 | | | | 114,303 | |
| Maturities, deliveries, and associated earnings | | | (148,627 | ) | | | (88,673 | ) | | | (128,196 | ) |
| Change in cancellation allowance | | | 9,124 | | | | 890 | | | | 3,696 | |
| Sale of debt associated with certain trust investments | | | — | | | | — | | | | (27,367 | ) |
| Effect of foreign currency and other | | | (32,437 | ) | | | (1,675 | ) | | | (2,197 | ) |
| | | | | | | | | | | | | |
| Ending balance — Preneed cemetery receivables and trust investments | | $ | 1,428,057 | | | $ | 1,522,584 | | | $ | 1,288,515 | |
| | | | | | | | | | | | | |
The cost and market values associated with the cemetery merchandise and service trust investments at December 31, 2007 and 2006 are detailed below. Cost reflects the investment (net of redemptions) of control holders in common trust funds, mutual funds, and private equity investments. Fair market value represents the value of the underlying securities or cash held by the common trust funds, mutual funds at published values, and the estimated market value of private equity investments (including debt as well as the estimated fair value related to the contract holders’ equity in majority-owned real estate investments). The fair market value of cemetery trust investments, which in the aggregate represented 102% and 106% of the related cost basis of such investments as of December 31, 2007 and 2006, respectively, was based primarily on quoted market prices at the balance sheet date. We assess our trust investments forother-than-temporary declines in fair value on a quarterly basis, primarily using actively traded, published values, in accordance with SFAS 115. As a result of our reviews during 2007, we recorded a $3.2 million impairment charge for other-than-temporary declines in fair value related to unrealized losses on certain private equity and other investments. Such impairment charges are recognized as investment losses and offset by interest income related to non-controlling interest in cemetery trust investments inOther expense, netin our consolidated statements of operations. As a result of our most recent review at December 31, 2007, we recorded no additional impairment charges. The review at December 31, 2006 resulted in no adjustments for unrealized
63
SERVICE CORPORATION INTERNATIONAL
NOTES TO CONSOLIDATED FINANCIAL STATEMENTS — (Continued)
losses related to certain private equity and other investments. See Note 8 to the consolidated financial statements for further information related to non-controlling interest in cemetery trust investments.
| | | | | | | | | | | | | | | | | |
| | | December 31, 2007 | |
| | | | | | Unrealized
| | | Unrealized
| | | Fair Market
| |
| | | Cost | | | Gains | | | Losses | | | Value | |
| | | (In thousands) | |
| |
| Cash and cash equivalents | | $ | 399,301 | | | $ | — | | | $ | — | | | $ | 399,301 | |
| Fixed income securities: | | | | | | | | | | | | | | | | |
| U.S. Treasury | | | 19,371 | | | | 899 | | | | (205 | ) | | | 20,065 | |
| Foreign government | | | 23,301 | | | | 363 | | | | (2 | ) | | | 23,662 | |
| Corporate | | | 8,012 | | | | 385 | | | | (88 | ) | | | 8,309 | |
| Equity securities: | | | | | | | | | | | | | | | | |
| Preferred stock | | | 2,979 | | | | 144 | | | | (33 | ) | | | 3,090 | |
| Common stock | | | 395,942 | | | | 20,923 | | | | (4,823 | ) | | | 412,042 | |
| Mutual funds: | | | | | | | | | | | | | | | | |
| Equity | | | 182,214 | | | | 12,905 | | | | (2,861 | ) | | | 192,258 | |
| Fixed income | | | 126,728 | | | | 5,535 | | | | (1,185 | ) | | | 131,078 | |
| Private equity and other | | | 32,210 | | | | 2,103 | | | | (4,626 | ) | | | 29,687 | |
| | | | | | | | | | | | | | | | | |
| Trust investments | | $ | 1,190,058 | | | $ | 43,257 | | | $ | (13,823 | ) | | $ | 1,219,492 | |
| | | | | | | | | | | | | | | | | |
| Less: Assets associated with businesses held for sale | | | | | | | | | | | | | | | (60,976 | ) |
| | | | | | | | | | | | | | | | | |
| | | | | | | | | | | | | | | $ | 1,158,516 | |
| | | | | | | | | | | | | | | | | |
| | | | | | | | | | | | | | | | | |
| | | December 31, 2006 | |
| | | | | | Unrealized
| | | Unrealized
| | | Fair Market
| |
| | | Cost | | | Gains | | | Losses | | | Value | |
| | | (In thousands) | |
| |
| Cash and cash equivalents | | $ | 258,365 | | | $ | — | | | $ | — | | | $ | 258,365 | |
| Fixed income securities: | | | | | | | | | | | | | | | | |
| U.S. Treasury | | | 61,785 | | | | 4,195 | | | | (2,147 | ) | | | 63,833 | |
| Foreign government | | | 25,187 | | | | 745 | | | | (30 | ) | | | 25,902 | |
| Corporate | | | 5,223 | | | | 398 | | | | (32 | ) | | | 5,589 | |
| Equity securities: | | | | | | | | | | | | | | | | |
| Preferred stock | | | 2,054 | | | | 158 | | | | (12 | ) | | | 2,200 | |
| Common stock | | | 300,188 | | | | 26,726 | | | | (1,756 | ) | | | 325,158 | |
| Mutual funds: | | | | | | | | | | | | | | | | |
| Equity | | | 208,396 | | | | 28,309 | | | | (729 | ) | | | 235,976 | |
| Fixed income | | | 374,636 | | | | 21,204 | | | | (3,039 | ) | | | 392,801 | |
| Private equity and other | | | 28,802 | | | | 499 | | | | (4,153 | ) | | | 25,148 | |
| | | | | | | | | | | | | | | | | |
| Trust investments | | $ | 1,264,636 | | | $ | 82,234 | | | $ | (11,898 | ) | | $ | 1,334,972 | |
| | | | | | | | | | | | | | | | | |
| Less: Assets associated with businesses held for sale | | | | | | | | | | | | | | | (98,526 | ) |
| | | | | | | | | | | | | | | | | |
| | | | | | | | | | | | | | | $ | 1,236,446 | |
| | | | | | | | | | | | | | | | | |
64
SERVICE CORPORATION INTERNATIONAL
NOTES TO CONSOLIDATED FINANCIAL STATEMENTS — (Continued)
Maturity dates of the fixed income securities range from 2008 to 2038. Maturities of fixed income securities at December 31, 2007 are estimated as follows:
| | | | | |
| | | Fair Market
| |
| | | Value | |
| | | (In thousands) | |
| |
| Due in one year or less | | $ | 1,028 | |
| Due in one to five years | | | 23,631 | |
| Due in five to ten years | | | 17,516 | |
| Thereafter | | | 9,861 | |
| | | | | |
| | | $ | 52,036 | |
| | | | | |
We have determined that unrealized losses in our cemetery trust investments are considered temporary in nature, as the unrealized losses were due to temporary fluctuations in interest rates and equity prices. We believe that none of the securities are other-than-temporarily impaired based on an analysis of the investments as well as our discussions with trustees, money managers and consultants. Our cemetery trust investment unrealized losses, their durations and their fair market value as of December 31, 2007, are shown in the following table.
| | | | | | | | | | | | | | | | | | | | | | | | | |
| | | Less Than 12 Months | | | Greater Than 12 Months | | | Total | |
| | | Fair Market
| | | Unrealized
| | | Fair Market
| | | Unrealized
| | | Fair Market
| | | Unrealized
| |
| | | Value | | | Losses | | | Value | | | Losses | | | Value | | | Losses | |
| | | (In thousands) | |
| |
| Fixed income securities: | | | | | | | | | | | | | | | | | | | | | | | | |
| U.S. Treasury | | $ | 5,049 | | | $ | (166 | ) | | $ | 1,883 | | | $ | (39 | ) | | $ | 6,932 | | | $ | (205 | ) |
| Foreign government | | | 1,502 | | | | (2 | ) | | | — | | | | — | | | | 1,502 | | | | (2 | ) |
| Corporate | | | 2,161 | | | | (71 | ) | | | 806 | | | | (17 | ) | | | 2,967 | | | | (88 | ) |
| Equity securities: | | | | | | | | | | | | | | | | | | | | | | | | |
| Preferred stock | | | 808 | | | | (27 | ) | | | 302 | | | | (6 | ) | | | 1,110 | | | | (33 | ) |
| Common stock | | | 108,127 | | | | (4,026 | ) | | | 38,552 | | | | (797 | ) | | | 146,679 | | | | (4,823 | ) |
| Mutual funds: | | | | | | | | | | | | | | | | | | | | | | | | |
| Equity | | | 59,092 | | | | (2,238 | ) | | | 13,975 | | | | (623 | ) | | | 73,067 | | | | (2,861 | ) |
| Fixed income | | | 25,865 | | | | (837 | ) | | | 15,907 | | | | (348 | ) | | | 41,772 | | | | (1,185 | ) |
| Private equity and other | | | 0 | | | | — | | | | 21,077 | | | | (4,626 | ) | | | 21,077 | | | | (4,626 | ) |
| | | | | | | | | | | | | | | | | | | | | | | | | |
| Total temporarily impaired securities | | $ | 202,604 | | | $ | (7,367 | ) | | $ | 92,502 | | | $ | (6,456 | ) | | $ | 295,106 | | | $ | (13,823 | ) |
| | | | | | | | | | | | | | | | | | | | | | | | | |
During the year ended December 31, 2007, purchases and sales ofavailable-for-sale securities included in trust investments were $1,067.2 million and $1,377.9 million, respectively. These sale transactions resulted in $196.9 million and $77.5 million of realized gains and realized losses, respectively, for the year ended December 31, 2007. During the year ended December 31, 2006, purchases and sales ofavailable-for-sale securities included in trust investments were $772.9 million and $990.1 million, respectively. These sale transactions resulted in $100.3 million and $47.3 million of realized gains and realized losses, respectively for year ended December 31, 2006. During the year ended December 31, 2005 purchases and sales ofavailable-for-sale securities included in trust investments were $916.0 million and $1.0 billion, respectively. These transactions resulted in $67.7 million and $21.5 million of realized gains and realized losses, respectively, for the year ended December 31, 2005. We use the FIFO method to determine the cost of cemetery trustavailable-for-sale securities sold during the period.
Earnings from all trust investments are recognized in current cemetery revenues when the service is performed or the merchandise is delivered or upon cancellation of the amount we are entitled to retain. Recognized earnings
65
SERVICE CORPORATION INTERNATIONAL
NOTES TO CONSOLIDATED FINANCIAL STATEMENTS — (Continued)
(realized and unrealized) related to these trust investments were $25.9 million, $15.0 million, and $13.0 million for the years ended December 31, 2007, 2006, and 2005, respectively.
Deferred Preneed Cemetery Revenues
At December 31, 2007 and 2006,Deferred preneed cemetery revenues, net of allowance for cancellation, represent future cemetery revenues, including distributed trust investment earnings associated with unperformed trust funded preneed cemetery contracts that are not held in trust accounts.Deferred preneed cemetery revenuesare recognized in current cemetery revenues when the service is performed or merchandise delivered. Future cemetery revenues and net trust investment earnings that are held in trust accounts are included inNon-controlling interest in funeral and cemetery trusts.
The following table summarizes the activity inDeferred preneed cemetery revenuesfor the years ended December 31:
| | | | | | | | | | | | | |
| | | 2007 | | | 2006 | | | 2005 | |
| | | (In thousands) | |
| |
| Beginning balance — Deferred preneed cemetery revenues | | $ | 754,193 | | | $ | 792,485 | | | $ | 803,144 | |
| Net preneed and atneed deferred sales | | | 374,412 | | | | 311,077 | | | | 308,202 | |
| Dispositions of businesses, net | | | (20,321 | ) | | | (12,073 | ) | | | (68,378 | ) |
| Net investment earnings | | | 91,601 | | | | 103,587 | | | | 27,260 | |
| Recognized deferred preneed revenues | | | (405,891 | ) | | | (320,076 | ) | | | (315,663 | ) |
| Change in cancellation allowance | | | 3,233 | | | | 2,711 | | | | 6,140 | |
| Change in non-controlling interest | | | (21,347 | ) | | | (129,180 | ) | | | 27,889 | |
| Effect of foreign currency and other | | | (22,004 | ) | | | 5,662 | | | | 3,891 | |
| | | | | | | | | | | | | |
| Ending balance — Deferred preneed cemetery revenues | | $ | 753,876 | | | $ | 754,193 | | | $ | 792,485 | |
| | | | | | | | | | | | | |
| |
| 7. | Cemetery Perpetual Care Trusts |
We are required by state or provincial law to pay into perpetual care trusts a portion of the proceeds from the sale of cemetery property interment rights. As the primary beneficiary of the trusts, we consolidate the perpetual care trust investments with a corresponding amount recorded asNon-controlling interest in perpetual care trusts.We deposited $26.3 million, $22.5 million, and $21.3 million into trusts and withdrew $26.4 million, $43.3 million, and $28.1 million from trusts during the years ended December 31, 2007, 2006, and 2005, respectively. Cash flows from cemetery perpetual care contracts are presented as operating cash flows in our consolidated statement of cash flows.
The cost and market values associated with trust investments held in perpetual care trusts at December 31, 2007 and 2006 are detailed below. Cost reflects the investment (net of redemptions) of control holders in common trust funds, mutual funds, and private equity investments. Fair market value represents the value of the underlying securities or cash held by the common trust funds, mutual funds at published values, and the estimated market value of private equity investments (including debt as well as the estimated fair value related to the contract holders’ equity in majority-owned real estate investments). The fair market value of perpetual care trusts, which in the aggregate represented 100% and 105% of the related cost basis of such investments as of December 31, 2007 and 2006, respectively, was based primarily on quoted market prices at the balance sheet date. We assess our trust investments forother-than-temporary declines in fair value on a quarterly basis. As a result of our reviews during 2007, we recorded a $1.2 million impairment charge for other-than-temporary declines in fair value related to unrealized losses on certain private equity and other investments. Such impairment charges are recognized as investment losses and offset by interest income related to non-controlling interest in perpetual care trust investments inOther (expense) income, netin our consolidated statements of operations. As a result of our most recent review at
66
SERVICE CORPORATION INTERNATIONAL
NOTES TO CONSOLIDATED FINANCIAL STATEMENTS — (Continued)
December 31, 2007, we recorded no additional impairment charges. See Note 8 to the consolidated financial statements for further information related to non-controlling interest in perpetual care trust investments.
| | | | | | | | | | | | | | | | | |
| | | December 31, 2007 | |
| | | | | | Unrealized
| | | Unrealized
| | | Fair Market
| |
| | | Cost | | | Gains | | | Losses | | | Value | |
| | | (In thousands) | |
| |
| Cash and cash equivalents | | $ | 88,516 | | | $ | — | | | $ | — | | | $ | 88,516 | |
| Fixed income securities: | | | | | | | | | | | | | | | | |
| U.S. Treasury | | | 2,647 | | | | 703 | | | | (1 | ) | | | 3,349 | |
| Foreign government | | | 25,065 | | | | 789 | | | | (13 | ) | | | 25,841 | |
| Corporate | | | 42,437 | | | | 225 | | | | (555 | ) | | | 42,107 | |
| Mortgage-backed | | | 348 | | | | 7 | | | | — | | | | 355 | |
| Equity securities: | | | | | | | | | | | | | | | | |
| Preferred stock | | | 2,403 | | | | 13 | | | | (58 | ) | | | 2,358 | |
| Common stock | | | 128,815 | | | | 3,501 | | | | (2,840 | ) | | | 129,476 | |
| Mutual funds: | | | | | | | | | | | | | | | | |
| Equity | | | 44,221 | | | | 1,208 | | | | (1,003 | ) | | | 44,426 | |
| Fixed income | | | 555,509 | | | | 3,256 | | | | (10,714 | ) | | | 548,051 | |
| Private equity and other | | | 34,894 | | | | 3,145 | | | | (542 | ) | | | 37,497 | |
| | | | | | | | | | | | | | | | | |
| Perpetual care trust investments | | $ | 924,855 | | | $ | 12,847 | | | $ | (15,726 | ) | | $ | 921,976 | |
| | | | | | | | | | | | | | | | | |
| Less: Assets associated with businesses held for sale | | | | | | | | | | | | | | | (16,232 | ) |
| | | | | | | | | | | | | | | | | |
| | | | | | | | | | | | | | | $ | 905,744 | |
| | | | | | | | | | | | | | | | | |
67
SERVICE CORPORATION INTERNATIONAL
NOTES TO CONSOLIDATED FINANCIAL STATEMENTS — (Continued)
| | | | | | | | | | | | | | | | | |
| | | December 31, 2006 | |
| | | | | | Unrealized
| | | Unrealized
| | | Fair Market
| |
| | | Cost | | | Gains | | | Losses | | | Value | |
| | | (In thousands) | |
| |
| Cash and cash equivalents | | $ | 167,464 | | | $ | — | | | $ | — | | | $ | 167,464 | |
| Fixed income securities: | | | | | | | | | | | | | | | | |
| U.S. Treasury | | | 11,557 | | | | 655 | | | | (117 | ) | | | 12,095 | |
| Foreign government | | | 28,738 | | | | 952 | | | | (101 | ) | | | 29,589 | |
| Corporate | | | 24,067 | | | | 1,255 | | | | (13 | ) | | | 25,309 | |
| Mortgage-backed | | | 639 | | | | 2 | | | | (8 | ) | | | 633 | |
| Equity securities: | | | | | | | | | | | | | | | | |
| Preferred stock | | | 7,931 | | | | 557 | | | | (1 | ) | | | 8,487 | |
| Common stock | | | 86,945 | | | | 8,806 | | | | (115 | ) | | | 95,636 | |
| Mutual funds: | | | | | | | | | | | | | | | | |
| Equity | | | 61,498 | | | | 5,077 | | | | (212 | ) | | | 66,363 | |
| Fixed income | | | 481,267 | | | | 24,048 | | | | (1,431 | ) | | | 503,884 | |
| Private equity and other | | | 36,948 | | | | 2,446 | | | | (694 | ) | | | 38,700 | |
| | | | | | | | | | | | | | | | | |
| Perpetual care trust investments | | $ | 907,054 | | | $ | 43,798 | | | $ | (2,692 | ) | | $ | 948,160 | |
| | | | | | | | | | | | | | | | | |
| Less: Assets associated with businesses held for sale | | | | | | | | | | | | | | | (54,229 | ) |
| | | | | | | | | | | | | | | | | |
| | | | | | | | | | | | | | | $ | 893,931 | |
| | | | | | | | | | | | | | | | | |
We have determined that unrealized losses in our perpetual care trust investments are considered temporary in nature, as the unrealized losses were due to temporary fluctuations in interest rates and equity prices. We believe that none of the securities are other-than-temporarily impaired based on an analysis of the investments as well as our
68
SERVICE CORPORATION INTERNATIONAL
NOTES TO CONSOLIDATED FINANCIAL STATEMENTS — (Continued)
discussions with trustees, money managers and consultants. Our perpetual care trust investment unrealized losses, their durations and fair market values as of December 31, 2007, are shown in the following table.
| | | | | | | | | | | | | | | | | | | | | | | | | |
| | | Less Than 12 Months | | | Greater Than 12 Months | | | Total | |
| | | Fair
| | | | | | Fair
| | | | | | Fair
| | | | |
| | | Market
| | | Unrealized
| | | Market
| | | Unrealized
| | | Market
| | | Unrealized
| |
| | | Value | | | Losses | | | Value | | | Losses | | | Value | | | Losses | |
| | | (In thousands) | |
| |
| Fixed income securities: | | | | | | | | | | | | | | | | | | | | | | | | |
| U.S. Treasury | | $ | 10 | | | $ | (1 | ) | | $ | — | | | $ | — | | | $ | 10 | | | $ | (1 | ) |
| Foreign government | | | 1,080 | | | | (13 | ) | | | — | | | | — | | | | 1,080 | | | | (13 | ) |
| Corporate | | | 12,237 | | | | (316 | ) | | | 10,347 | | | | (239 | ) | | | 22,584 | | | | (555 | ) |
| Equity securities: | | | | | | | | | | | | | | | | | | | | | | | | |
| Preferred stock | | | 759 | | | | (37 | ) | | | 927 | | | | (21 | ) | | | 1,686 | | | | (58 | ) |
| Common stock | | | 39,947 | | | | (1,776 | ) | | | 46,233 | | | | (1,064 | ) | | | 86,180 | | | | (2,840 | ) |
| Mutual funds: | | | | | | | | | | | | | | | | | | | | | | | | |
| Equity | | | 12,250 | | | | (556 | ) | | | 14,551 | | | | (447 | ) | | | 26,801 | | | | (1,003 | ) |
| Fixed income | | | 163,313 | | | | (5,896 | ) | | | 203,975 | | | | (4,818 | ) | | | 367,288 | | | | (10,714 | ) |
| Private equity and other | | | — | | | | — | | | | 12,652 | | | | (542 | ) | | | 12,652 | | | | (542 | ) |
| | | | | | | | | | | | | | | | | | | | | | | | | |
| Total temporarily impaired securities | | $ | 229,596 | | | $ | (8,595 | ) | | $ | 288,685 | | | $ | (7,131 | ) | | $ | 518,281 | | | $ | (15,726 | ) |
| | | | | | | | | | | | | | | | | | | | | | | | | |
Maturity dates of the fixed income securities range from 2008 to 2038. Maturities of fixed income securities at December 31, 2007 are estimated as follows:
| | | | | |
| | | Fair Market
| |
| | | Value | |
| | | (In thousands) | |
| |
| Due in one year or less | | $ | 2,529 | |
| Due in one to five years | | | 35,227 | |
| Due in five to ten years | | | 16,817 | |
| Thereafter | | | 17,079 | |
| | | | | |
| | | $ | 71,652 | |
| | | | | |
During the year ended December 31, 2007, purchases and sales ofavailable-for-sale securities in the perpetual care trust were $727.7 million and $470.7 million, respectively. These sale transactions resulted in $45.2 million and $15.3 million of realized gains and realized losses, respectively. During the year ended December 31, 2006, purchases and sales ofavailable-for-sale securities in the perpetual care trusts were $915.9 million and $1.1 billion, respectively. These sales transactions resulted in $40.9 million and $26.7 million of realized gains and realized losses, respectively. During the year ended December 31, 2005, purchases and sales ofavailable-for-sale securities in the perpetual care trusts were $920.0 million and $970.3 million, respectively. These sales transactions resulted in $19.1 million and $9.7 million of realized gains and losses, respectively. We use the FIFO method to determine the cost of perpetual care trustsavailable-for-sale securities sold during the period.
Distributable earnings from these perpetual care trust investments are recognized in current cemetery revenues to the extent of qualifying cemetery maintenance costs. Recognized earnings related to these perpetual care trust investments were $44.9 million, $42.1 million, and $26.4 million for the years ended December 31, 2007, 2006, and 2005, respectively.
69
SERVICE CORPORATION INTERNATIONAL
NOTES TO CONSOLIDATED FINANCIAL STATEMENTS — (Continued)
| |
| 8. | Non-Controlling Interest in Funeral and Cemetery Trusts and in Perpetual Care Trusts |
Non-Controlling Interest in Funeral and Cemetery Trusts
We consolidate in our balance sheet the merchandise and service trusts associated with our preneed funeral and cemetery activities in accordance with FIN 46R. Although FIN 46R requires the consolidation of the merchandise and service trusts, it does not change the legal relationships among the trusts, us or our customers. The customers are the legal beneficiaries of these merchandise and service trusts, and therefore their interests in these trusts represent a non-controlling interest in subsidiaries.
Non-Controlling Interest in Perpetual Care Trusts
TheNon-controlling interest in perpetual care trustsreflected in the consolidated balance sheet represents the cemetery perpetual care trusts, net of the accrued expenses and other long-term liabilities of the perpetual care trusts.
The components ofNon-controlling interest in funeral and cemetery trustsandNon-controlling interest in perpetual care trustsin our consolidated balance sheet at December 31, 2007 and 2006 are detailed below.
| | | | | | | | | | | | | | | | | |
| | | December 31, 2007 | | | December 31, 2007 | |
| | | Preneed
| | | Preneed
| | | | | | Cemetery
| |
| | | Funeral | | | Cemetery | | | Total | | | Perpetual Care | |
| | | (In thousands) | |
| |
| Trust investments, at market value | | $ | 1,244,181 | | | $ | 1,158,516 | | | $ | 2,402,697 | | | $ | 905,744 | |
| Accrued trust operating payables, deferred taxes and other | | | (3,737 | ) | | | (8,672 | ) | | | (12,409 | ) | | | 846 | |
| | | | | | | | | | | | | | | | | |
| Non-controlling interest | | $ | 1,240,444 | | | $ | 1,149,844 | | | $ | 2,390,288 | | | $ | 906,590 | |
| | | | | | | | | | | | | | | | | |
| | | | | | | | | | | | | | | | | |
| | | December 31, 2006 | | | December 31, 2006 | |
| | | Preneed
| | | Preneed
| | | | | | Cemetery
| |
| | | Funeral | | | Cemetery | | | Total | | | Perpetual Care | |
| | | (In thousands) | |
| |
| Trust investments, at market value | | $ | 1,329,922 | | | $ | 1,236,446 | | | $ | 2,566,368 | | | $ | 893,931 | |
| Accrued trust operating payables, deferred taxes and other | | | (6,052 | ) | | | (11,573 | ) | | | (17,625 | ) | | | (6,745 | ) |
| | | | | | | | | | | | | | | | | |
| Non-controlling interest | | $ | 1,323,870 | | | $ | 1,224,873 | | | $ | 2,548,743 | | | $ | 887,186 | |
| | | | | | | | | | | | | | | | | |
Other Expense, Net
The components ofOther expense, netin our consolidated statement of operations for the years ended December 31, 2007, 2006, and 2005 are detailed below. See Notes 5 through 7 to the consolidated financial statements for further discussion of the amounts related to the funeral, cemetery and perpetual care trusts.
70
SERVICE CORPORATION INTERNATIONAL
NOTES TO CONSOLIDATED FINANCIAL STATEMENTS — (Continued)
| | | | | | | | | | | | | | | | | | | | | |
| | | Year Ended December 31, 2007 | |
| | | Funeral
| | | Cemetery
| | | Cemetery Perpetual
| | | | | | | |
| | | Trusts | | | Trusts | | | Care Trusts | | | Other, Net(1) | | | Total | |
| | | (In thousands) | |
| |
| Realized gains | | $ | 106,394 | | | $ | 196,880 | | | $ | 45,203 | | | $ | — | | | $ | 348,477 | |
| Realized losses and impairment charges | | | (33,507 | ) | | | (80,732 | ) | | | (16,505 | ) | | | — | | | | (130,744 | ) |
| Interest, dividend and other ordinary income | | | 26,791 | | | | 41,218 | | | | 40,713 | | | | — | | | | 108,722 | |
| Trust expenses and income taxes | | | (10,534 | ) | | | (17,264 | ) | | | (4,644 | ) | | | — | | | | (32,442 | ) |
| | | | | | | | | | | | | | | | | | | | | |
| Net trust investment income | | | 89,144 | | | | 140,102 | | | | 64,767 | | | | — | | | | 294,013 | |
| Interest expense related to non-controlling interest in funeral and cemetery trust investments | | | (89,144 | ) | | | (140,102 | ) | | | — | | | | — | | | | (229,246 | ) |
| Interest expense related to non-controlling interest in perpetual care trust investments | | | — | | | | — | | | | (64,767 | ) | | | — | | | | (64,767 | ) |
| | | | | | | | | | | | | | | | | | | | | |
| Total non-controlling interest | | | — | | | | — | | | | — | | | | — | | | | — | |
| Other expense | | | — | | | | — | | | | — | | | | (3,804 | ) | | | (3,804 | ) |
| | | | | | | | | | | | | | | | | | | | | |
| Total other expense, net | | $ | — | | | $ | — | | | $ | — | | | $ | (3,804 | ) | | $ | (3,804 | ) |
| | | | | | | | | | | | | | | | | | | | | |
71
SERVICE CORPORATION INTERNATIONAL
NOTES TO CONSOLIDATED FINANCIAL STATEMENTS — (Continued)
| | | | | | | | | | | | | | | | | | | | | |
| | | Year Ended December 31, 2006 | |
| | | Funeral
| | | Cemetery
| | | Cemetery Perpetual
| | | | | | | |
| | | Trusts | | | Trusts | | | Care Trusts | | | Other, Net(1) | | | Total | |
| | | (In thousands) | |
| |
| Realized gains | | $ | 83,350 | | | $ | 100,326 | | | $ | 40,934 | | | $ | — | | | $ | 224,610 | |
| Realized losses | | | (36,653 | ) | | | (47,256 | ) | | | (26,675 | ) | | | — | | | | (110,584 | ) |
| Interest, dividend and other ordinary income | | | 22,614 | | | | 36,337 | | | | 30,881 | | | | — | | | | 89,832 | |
| Trust expenses and income taxes | | | (8,492 | ) | | | (12,989 | ) | | | (2,148 | ) | | | — | | | | (23,629 | ) |
| | | | | | | | | | | | | | | | | | | | | |
| Net trust investment income | | | 60,819 | | | | 76,418 | | | | 42,992 | | | | — | | | | 180,229 | |
| Interest expense related to non-controlling interest in funeral and cemetery trust investments | | | (60,819 | ) | | | (76,418 | ) | | | — | | | | — | | | | (137,237 | ) |
| Interest expense related to non-controlling interest in perpetual care trust investments | | | — | | | | — | | | | (42,992 | ) | | | — | | | | (42,992 | ) |
| | | | | | | | | | | | | | | | | | | | | |
| Total non-controlling interest | | | — | | | | — | | | | — | | | | — | | | | — | |
| Other expense | | | — | | | | — | | | | — | | | | (1,453 | ) | | | (1,453 | ) |
| | | | | | | | | | | | | | | | | | | | | |
| Total other expense, net | | $ | — | | | $ | — | | | $ | — | | | $ | (1,453 | ) | | $ | (1,453 | ) |
| | | | | | | | | | | | | | | | | | | | | |
72
SERVICE CORPORATION INTERNATIONAL
NOTES TO CONSOLIDATED FINANCIAL STATEMENTS — (Continued)
| | | | | | | | | | | | | | | | | | | | | |
| | | Year Ended December 31, 2005 | |
| | | Funeral
| | | Cemetery
| | | Cemetery Perpetual
| | | | | | | |
| | | Trusts | | | Trusts | | | Care Trusts | | | Other, Net(1) | | | Total | |
| | | (In thousands) | |
| |
| Realized gains | | $ | 56,560 | | | $ | 67,732 | | | $ | 19,088 | | | $ | — | | | $ | 143,380 | |
| Realized losses | | | (19,503 | ) | | | (21,506 | ) | | | (9,718 | ) | | | — | | | | (50,727 | ) |
| Interest, dividend and other ordinary income | | | 19,894 | | | | 23,458 | | | | 29,999 | | | | — | | | | 73,351 | |
| Trust expenses and income taxes | | | (11,924 | ) | | | (13,419 | ) | | | (8,650 | ) | | | — | | | | (33,993 | ) |
| | | | | | | | | | | | | | | | | | | | | |
| Net trust investment income | | | 45,027 | | | | 56,265 | | | | 30,719 | | | | — | | | | 132,011 | |
| Interest expense related to non-controlling interest in funeral and cemetery trust investments | | | (45,027 | ) | | | (56,265 | ) | | | — | | | | — | | | | (101,292 | ) |
| Interest expense related to non-controlling interest in perpetual care trust investments | | | — | | | | — | | | | (30,719 | ) | | | — | | | | (30,719 | ) |
| | | | | | | | | | | | | | | | | | | | | |
| Total non-controlling interest | | | — | | | | — | | | | — | | | | — | | | | — | |
| Other expense | | | — | | | | — | | | | — | | | | (3,703 | ) | | | (3,703 | ) |
| | | | | | | | | | | | | | | | | | | | | |
| Total other expense, net | | $ | — | | | $ | — | | | $ | — | | | $ | (3,703 | ) | | $ | (3,703 | ) |
| | | | | | | | | | | | | | | | | | | | | |
| | |
| (1) | | Amounts included withinOther expense, netprimarily relate to foreign currency gains and losses and surety bonding expenses. |
The changes in the carrying amounts of goodwill for our funeral and cemetery segments are as follows:
| | | | | | | | | | | | | |
| | | Funeral
| | | Cemetery
| | | | |
| | | Segment | | | Segment | | | Total | |
| | | (In thousands) | |
| |
| Balance as of December 31, 2005 | | $ | 1,123,888 | | | $ | — | | | $ | 1,123,888 | |
| Increase in goodwill related to acquisitions | | | 165,308 | | | | 22,606 | | | | 187,914 | |
| Reduction of goodwill related to dispositions | | | (48,605 | ) | | | — | | | | (48,605 | ) |
| Effect of foreign currency and other | | | 1,075 | | | | — | | | | 1,075 | |
| | | | | | | | | | | | | |
| Balance as of December 31, 2006 | | | 1,241,666 | | | | 22,606 | | | | 1,264,272 | |
| | | | | | | | | | | | | |
| Reduction in goodwill related to the Alderwoods acquisition | | | (86,437 | ) | | | (1,561 | ) | | | (87,998 | ) |
| Increase in goodwill related to other acquisitions | | | 984 | | | | 6,432 | | | | 7,416 | |
| Reduction of goodwill related to dispositions | | | (27,045 | ) | | | (179 | ) | | | (27,224 | ) |
| Effect of foreign currency and other | | | 41,687 | | | | — | | | | 41,687 | |
| | | | | | | | | | | | | |
| Balance as of December 31, 2007 | | $ | 1,170,855 | | | $ | 27,298 | | | $ | 1,198,153 | |
| | | | | | | | | | | | | |
73
SERVICE CORPORATION INTERNATIONAL
NOTES TO CONSOLIDATED FINANCIAL STATEMENTS — (Continued)
During 2007, we adjusted our goodwill for various purchase price allocation adjustments as follows (in thousands):
| | | | | |
| Adjustments to fair value of deferred revenue | | $ | (2,681 | ) |
| Adjustments to fair value of intangible assets | | | 35,158 | |
| Adjustments to fair value of trust assets | | | 26,906 | |
| Adjustments to fair value of acquired locations | | | (49,469 | ) |
| Adjustments to deferred taxes | | | (93,656 | ) |
| Other | | | (4,256 | ) |
| | | | | |
| Total adjustment to Alderwoods goodwill | | $ | (87,998 | ) |
| | | | | |
During 2007, we finalized our assessment of the fair value of assets acquired and liabilities assumed in our Alderwoods acquisition. Accordingly, we reflected the final impact of the assessment on goodwill and deferred federal income taxes, including the impact of the adoption of FIN 48 as explained in Note 10. Additionally, we recorded adjustments to our acquired Alderwoods goodwill related to our verification of the contract status and fair values of preneed cemetery and funeral deferred revenues and related trust and intangible assets. We also adjusted the fair values of certain assets and liabilities sold during 2007 in relation to certain Alderwoods locations mandated for divestment pursuant to our recent FTC decree.
The provision or benefit for income taxes includes U.S. federal income taxes, determined on a consolidated return basis, foreign and state income taxes.
Income from continuing operations before income taxes and cumulative effects of accounting changes for the years ended December 31 is as follows:
| | | | | | | | | | | | | |
| | | 2007 | | 2006 | | 2005 |
| | | (In thousands) |
| |
| United States | | $ | 369,730 | | | $ | 85,928 | | | $ | 71,311 | |
| Foreign | | | 17,257 | | | | 11,521 | | | | 15,816 | |
| | | | | | | | | | | | | |
| | | $ | 386,987 | | | $ | 97,449 | | | $ | 87,127 | |
| | | | | | | | | | | | | |
Income tax provision (benefit) for the years ended December 31 consisted of the following:
| | | | | | | | | | | | | |
| | | 2007 | | | 2006 | | | 2005 | |
| | | (In thousands) | |
| |
| Current: | | | | | | | | | | | | |
| United States | | $ | 84,405 | | | $ | 2,522 | | | $ | 2,328 | |
| Foreign | | | 8,296 | | | | 8,236 | | | | 1,384 | |
| State | | | 16,317 | | | | (4,170 | ) | | | 3,470 | |
| | | | | | | | | | | | | |
| Total current income taxes | | | 109,018 | | | | 6,588 | | | | 7,182 | |
| | | | | | | | | | | | | |
| Deferred: | | | | | | | | | | | | |
| United States | | $ | 16,058 | | | $ | 33,114 | | | $ | 38,128 | |
| Foreign | | | (210 | ) | | | (1,982 | ) | | | 5,704 | |
| State | | | 18,804 | | | | 7,125 | | | | (18,978 | ) |
| | | | | | | | | | | | | |
| Total deferred income taxes | | | 34,652 | | | | 38,257 | | | | 24,854 | |
| | | | | | | | | | | | | |
| Total income taxes | | $ | 143,670 | | | $ | 44,845 | | | $ | 32,036 | |
| | | | | | | | | | | | | |
74
SERVICE CORPORATION INTERNATIONAL
NOTES TO CONSOLIDATED FINANCIAL STATEMENTS — (Continued)
The differences between the U.S. federal statutory income tax rate and our effective tax rate for the years ended December 31 were as follows:
| | | | | | | | | | | | | |
| | | 2007 | | | 2006 | | | 2005 | |
| | | (In thousands) | |
| |
| Computed tax provision at the applicable federal statutory income tax rate | | $ | 135,446 | | | $ | 34,108 | | | $ | 30,494 | |
| State and local taxes, net of federal income tax benefits | | | 22,829 | | | | 1,921 | | | | (10,081 | ) |
| Dividends received deduction and tax exempt interest | | | (1,453 | ) | | | (686 | ) | | | (133 | ) |
| Foreign jurisdiction differences | | | (1,349 | ) | | | (1,343 | ) | | | (105 | ) |
| Write down of assets and other losses with no tax benefit | | | — | | | | 1,471 | | | | 558 | |
| Permanent differences associated with dispositions | | | 14,611 | | | | 9,508 | | | | 11,799 | |
| Tax benefit associated with uncertain tax positions | | | (29,287 | ) | | | — | | | | — | |
| Other | | | 2,873 | | | | (134 | ) | | | (496 | ) |
| | | | | | | | | | | | | |
| Provision for income taxes | | $ | 143,670 | | | $ | 44,845 | | | $ | 32,036 | |
| | | | | | | | | | | | | |
| Total effective tax rate | | | 37.1 | % | | | 46.0 | % | | | 36.8 | % |
| | | | | | | | | | | | | |
During the fourth quarter of 2007 we generated taxable capital gains on the sale of our investment in our French unconsolidated subsidiary (See Note 20) which allowed us to recognize the benefit of capital loss carryforwards that we had previously concluded were more likely than not to expire unutilized because of uncertainty with respect to the timing of the deduction. That benefit decreased our 2007 effective tax rate by nine percentage points. Our 2007, 2006, and 2005 effective tax rates were negatively impacted by permanent differences between the book and tax bases of North American asset dispositions and the 2005 tax rate was partially offset by state net operating loss benefits.
75
SERVICE CORPORATION INTERNATIONAL
NOTES TO CONSOLIDATED FINANCIAL STATEMENTS — (Continued)
Deferred taxes are determined based on differences between the financial reporting and tax bases of assets and liabilities and are measured using the enacted tax rates. The tax effects of temporary differences and carryforwards that give rise to significant portions of deferred tax assets and liabilities as of December 31 consisted of the following:
| | | | | | | | | |
| | | 2007 | | | 2006 | |
| | | (In thousands) | |
| |
| Inventories and cemetery property, principally due to purchase accounting adjustments | | $ | (325,051 | ) | | $ | (353,797 | ) |
| Property and equipment, principally due to differences in depreciation methods and purchase accounting adjustments | | | (72,599 | ) | | | — | |
| Intangibles | | | (46,992 | ) | | | (14,016 | ) |
| Accrued liabilities | | | — | | | | (46,120 | ) |
| Receivables, principally due to sales of cemetery interment rights and related products | | | — | | | | (128,247 | ) |
| Other | | | (241 | ) | | | (176,468 | ) |
| | | | | | | | | |
| Deferred tax liabilities | | | (444,883 | ) | | | (718,648 | ) |
| | | | | | | | | |
| Deferred revenue on preneed funeral and cemetery contracts, principally due to earnings from trust funds | | | 141,767 | | | | 258,692 | |
| Property and equipment, principally due to differences in depreciation methods and purchase accounting adjustments | | | — | | | | 75,461 | |
| Accrued liabilities | | | 2,015 | | | | — | |
| Receivables, principally due to sales of cemetery interment rights and related products | | | 30,548 | | | | — | |
| Loss and tax credit carryforwards | | | 271,581 | | | | 273,778 | |
| | | | | | | | | |
| Deferred tax assets | | | 445,911 | | | | (607,931 | ) |
| | | | | | | | | |
| Less: Valuation allowance | | | (68,469 | ) | | | (70,547 | ) |
| | | | | | | | | |
| Net deferred income taxes | | $ | (67,441 | ) | | $ | (181,264 | ) |
| | | | | | | | | |
At December 31, 2006, prior to the adoption of FIN 48, we previously disclosed multi-jurisdictional long-term tax liabilities of $104.9 million in theOther line of theDeferred tax liabilities section above. See below for a discussion of FIN 48 which changed the application of how we valued and disclosed these liabilities.
At December 31, 2007 and 2006, U.S. income taxes had not been provided on $121.8 million and $71.9 million, respectively, of the remaining undistributed earnings of our Canadian subsidiaries. We intend to permanently reinvest these undistributed foreign earnings in those businesses outside the United States. It is not practicable to determine the amount of federal income taxes, if any, that might become due if such earnings are repatriated.
In June 2006, the FASB issued FIN 48, which clarifies the accounting for uncertain income tax positions recognized in an enterprise’s financial statements in accordance with SFAS No. 109, “Accounting for Income Taxes”. This interpretation requires companies to use a prescribed model for assessing the financial statement recognition and measurement of all tax positions taken or expected to be taken in its tax returns. FIN 48 also provides guidance on derecognition, classification, interest and penalties, accounting in interim periods, disclosure, and transition.
76
SERVICE CORPORATION INTERNATIONAL
NOTES TO CONSOLIDATED FINANCIAL STATEMENTS — (Continued)
The following table summarizes the activity related to our gross unrecognized tax benefits from January 1, 2007 to December 31, 2007 (in thousands):
| | | | | |
| | | Federal, State and
| |
| | | Foreign Tax | |
| | | (In thousands) | |
| |
| Balance at January 1, 2007 | | $ | 198,773 | |
| Additions to tax positions related to the current year | | | 803 | |
| Reductions to tax positions related to prior years | | | (45,115 | ) |
| Reductions to tax positions related to acquired entities in prior years, offset to goodwill | | | (774 | ) |
| Statute expirations | | | (5,799 | ) |
| | | | | |
| Balance at December 31, 2007 | | $ | 147,888 | |
| | | | | |
Our total unrecognized tax benefits that, if recognized, would affect our effective tax rate was $41.9 million as of December 31, 2007.
We adopted the provisions of FIN 48 on January 1, 2007. As a result of the initial adoption of FIN 48, we recognized a $12.0 million net increase in our liability for unrecognized tax benefits, which was recorded as a $24.0 million increase to goodwill (related to uncertain tax positions acquired in the recent Alderwoods transaction) and a $12.0 million decrease in ourAccumulated deficit as of January 1, 2007. As of the date of the initial adoption and after considering the impact of recognizing the net liability increase noted above, our unrecognized tax benefits totaled $257.1 million, of which $156.3 million would impact our effective tax rate, if recognized.
During the fourth quarter of 2007, we identified certain computational errors in our initial FIN 48 adoption impact related to both unrecognized tax benefits and the potential accrued interest associated with such unrecognized tax benefits at the time of adoption. The net effect of these computational errors, including an $11.1 million adjustment for interest, was recorded as a $17.9 million decrease in our liability for unrecognized tax benefits during the fourth quarter of 2007. As revised for this immaterial correction of an error, our FIN 48 adoption resulted in our recording a $5.9 million reduction in our liability for unrecognized tax benefits, of which $24.0 million was recorded as an increase to goodwill and $29.9 million was recorded as a decrease in ourAccumulated deficitas of January 1, 2007. As of the date of adoption and after considering the impact of recognizing the immaterial correction of an error noted above, our unrecognized tax benefits totalled $198.8 million, of which $80.0 million would impact our effective tax rate, if recognized.
Consistent with our historical financial reporting, we include potential accrued interest and penalties related to unrecognized tax benefits within our income tax provision account. We have accrued $22.6 million and $29.8 million for the payment of interest, net of tax benefits, and penalties as January 1, 2007 and December 31, 2007 respectively. To the extent interest and penalties are not assessed with respect to uncertain tax positions or the uncertainty of deductions in the future, amounts accrued will be reduced and reflected as a reduction of the overall income tax provision.
During the fourth quarter of 2007 we generated taxable capital gains from the sale of our investment in our French operations which allowed us to recognize the benefit of capital loss carryforwards that we had previously concluded were more likely than not to expire unutilized. The reduction to the tax associated with prior years of $45.1 million primarily relates to the recognition of capital loss carryforward amounts.
In the fourth quarter of 2007, we recorded a net decrease in our liability for uncertain tax positions of approximately $5.8 million relating to uncertain positions taken in prior years, as a result of expiring federal, state, and foreign statute of limitations.
We file income tax returns, including tax returns for our subsidiaries, with federal, state, local, and foreign jurisdictions. Our tax returns are subject to routine compliance review by the taxing authorities in the jurisdictions in
77
SERVICE CORPORATION INTERNATIONAL
NOTES TO CONSOLIDATED FINANCIAL STATEMENTS — (Continued)
which we file tax returns in the ordinary course of business. We consider the United States to be our most significant tax jurisdiction; however, the taxing authorities in France and Spain are auditing various tax returns. Current audits are occurring in the United States and various state and foreign locations covering open tax years through 2006. The Internal Revenue Service has recently completed its field of work for tax years 1999 through 2002 and is currently auditing tax years 2003 through 2005. It is reasonably possible that changes to our global unrecognized tax benefits could be significant, however due to the uncertainty regarding the timing of completion of audits and possible outcomes, a current estimate of the range of increases or decreases that may occur within the next twelve months cannot be made.
Various subsidiaries have foreign, federal and state carryforwards of $2.2 billion with expiration dates through 2025.
The loss carryforwards will expire as follows:
| | | | | | | | | | | | | | | | | |
| | | Federal | | | State | | | Foreign | | | Total | |
| | | (In thousands) | |
| |
| 2008 | | $ | 484 | | | $ | 11,561 | | | $ | — | | | $ | 12,045 | |
| 2009 | | | 809 | | | | 30,534 | | | | 202 | | | | 31,545 | |
| 2010 | | | 742 | | | | 16,898 | | | | 289 | | | | 17,929 | |
| 2011 | | | 389 | | | | 68,764 | | | | — | | | | 69,153 | |
| Thereafter | | | 377,093 | | | | 1,656,901 | | | | 47,687 | | | | 2,081,681 | |
| | | | | | | | | | | | | | | | | |
| Total | | $ | 379,517 | | | $ | 1,784,658 | | | $ | 48,178 | | | $ | 2,212,353 | |
| | | | | | | | | | | | | | | | | |
We believe that some uncertainty exists with respect to future realization of certain loss carryforwards, therefore a valuation allowance has been established for those carryforwards where uncertainty exists. The valuation allowance is primarily attributable to state net operating losses and is due to complexities of the various state laws restricting state net operating loss utilization. The 2007 decrease in valuation allowance is due to a $7.3 million decrease in valuation allowance on state operating losses and an offsetting increase of $5.2 million increase in valuation allowances on tax losses in foreign jurisdictions. At December 31, 2007, the loss and credit carryforward tax assets and associated valuation allowances by jurisdiction are as follows:
| | | | | | | | | | | | | | | | | |
| | | Federal | | | State | | | Foreign | | | Total | |
| | | (In thousands) | |
| |
| Loss and tax credit carryforwards | | $ | 132,861 | | | $ | 115,881 | | | $ | 22,839 | | | $ | 271,581 | |
| Valuation allowance | | $ | 2,617 | | | $ | 50,109 | | | $ | 15,743 | | | $ | 68,469 | |
78
SERVICE CORPORATION INTERNATIONAL
NOTES TO CONSOLIDATED FINANCIAL STATEMENTS — (Continued)
Debt as of December 31, 2007 and 2006 was as follows:
| | | | | | | | | |
| | | December 31, 2007 | | | December 31, 2006 | |
| | | (In thousands) | |
| |
| 6.875% notes due October 2007 | | $ | — | | | $ | 13,497 | |
| 6.5% notes due March 2008 | | | 45,209 | | | | 195,000 | |
| 7.7% notes due April 2009 | | | 28,731 | | | | 202,588 | |
| 7.875% debentures due February 2013 | | | 55,627 | | | | 55,627 | |
| 7.375% senior notes due October 2014 | | | 250,000 | | | | 250,000 | |
| 6.75% notes due April 2015 | | | 200,000 | | | | — | |
| 6.75% notes due April 2016 | | | 250,000 | | | | 250,000 | |
| 7.0% notes due June 2017 | | | 300,000 | | | | 300,000 | |
| 7.625% senior notes due October 2018 | | | 250,000 | | | | 250,000 | |
| 7.5% notes due April 2027 | | | 200,000 | | | | — | |
| Term loan due 2009 | | | — | | | | 100,000 | |
| Series A and Series B senior notes due November 2011 | | | 150,000 | | | | 200,000 | |
| Convertible debentures, maturities through 2013, fixed interest rates at 5.00%, conversion prices from $13.02 to $50.00 per share | | | 4,175 | | | | 9,925 | |
| Obligations under capital leases | | | 112,507 | | | | 113,484 | |
| Mortgage notes and other debt, maturities through 2050 | | | 15,742 | | | | 26,304 | |
| Unamortized pricing discounts and other | | | (5,291 | ) | | | (7,553 | ) |
| | | | | | | | | |
| Total debt | | | 1,856,700 | | | | 1,958,872 | |
| Less current maturities | | | (36,594 | ) | | | (46,176 | ) |
| | | | | | | | | |
| Total long-term debt | | $ | 1,820,106 | | | $ | 1,912,696 | |
| | | | | | | | | |
Current maturities of debt at December 31, 2007 were comprised primarily of convertible debentures and capital leases. Our 6.5% notes due March 2008 are classified as long-term as we intend to refinance these notes through a drawdown on our revolving credit agreement. Our consolidated debt had a weighted average interest rate of 7.09% and 7.30% at December 31, 2007 and 2006, respectively. Approximately 89% and 82% of our total debt had a fixed interest rate at December 31, 2007 and 2006, respectively.
The aggregate maturities of our debt for the five years subsequent to December 31, 2007 are as follows:
| | | | | |
| | | 2007 | |
| | | (In thousands) | |
| |
| 2008 | | $ | 36,594 | |
| 2009 | | | 49,643 | |
| 2010 | | | 41,756 | |
| 2011 | | | 204,741 | |
| 2012 | | | 4,465 | |
| 2013 and thereafter | | | 1,519,501 | |
| | | | | |
| | | $ | 1,856,700 | |
| | | | | |
79
SERVICE CORPORATION INTERNATIONAL
NOTES TO CONSOLIDATED FINANCIAL STATEMENTS — (Continued)
Bank Credit Facility
We entered into a five-year $450 million bank credit facility in November 2006 with a syndicate of financial institutions, comprised of a $300 million revolving credit facility and a $150 million term loan facility, including a sublimit of $175 million for letters of credit. The term loan was funded under the credit facility. We repaid $50 million of the term loan in December 2006 and the remaining $100 million in the first quarter of 2007. The $300 million revolving credit facility remains unfunded.
The bank credit facility matures in November 2011. As of December 31, 2007, we have used the facility to support $54.3 million of letters of credit. The credit facility provides us with flexibility for working capital, if needed, and is guaranteed by our domestic subsidiaries. The subsidiary guaranty is a guaranty of payment of the outstanding amount of the total lending commitment. It covers the term of the credit facility, including extensions, and totaled a maximum potential amount of $54.3 million at December 31, 2007. The credit facility contains certain financial covenants, including a minimum interest coverage ratio, a maximum leverage ratio, maximum capital expenditure limitations, and certain cash distribution and share repurchase restrictions. As of December 31, 2007, we were in compliance with all of our debt covenants. We also pay a quarterly fee on the unused commitment, which ranges from 0.25% to 0.50%.
Debt Issuances and Additions
In April 2007, we completed a private offering of $400.0 million aggregate principal unsecured senior notes, consisting of $200.0 million aggregate principal amount of 6.75% Senior Notes due 2015 and $200.0 million aggregate principal amount of 7.50% Senior Notes due 2027. We are entitled to redeem the notes at any time by paying a make-whole premium. The notes are subject to the provisions of our Senior Indenture dated as of February 1, 1993, as amended, which includes covenants limiting, among other things, the creation of liens securing indebtedness and sale-leaseback transactions. As of December 31, 2007, we were in compliance with all such debt covenants. We used the net proceeds from the offering to fund the closing of the tender offers for our 6.50% Notes due 2008 and 7.70% Notes due 2009 as further discussed below and for general corporate purposes. Under the terms of the registration rights agreement entered into in connection with the offerings of the notes, we filed a registration statement with the SEC with respect to an offer to exchange the notes for registered notes with substantially identical terms. The registration statement was declared effective by the SEC and the offering to exchange was completed in the third quarter of 2007.
On November 28, 2006, in connection with the closing of the Alderwoods acquisition, SCI issued $200.0 million of privately placed debt securities, consisting of $50.0 million of Floating Rate Series A Senior Notes due October 2011 and $150.0 million of Floating Rate Series B Notes due October 2011. Interest on these privately placed debt securities will accrue at the rate of3-month LIBOR plus 2.0% (7.05% at December 31, 2007) and will be payable quarterly in arrears.
On October 3, 2006, we completed a private offering of $500.0 million aggregate principal unsecured senior notes, consisting of $250.0 million aggregate principal of 7.375% Senior Notes due 2014 and $250.0 million aggregate principal of 7.625% Senior Notes due 2018. We are entitled to redeem the notes at any time by paying a make-whole premium. The notes are subject to the provisions of our Senior Indenture dated as of February 1, 1993, as amended, which includes certain covenants limiting, among other things, the creation of liens securing indebtedness and sale-leaseback transactions. During the fourth quarter of 2006, we completed the required registration statement and exchanged publicly held registered notes for the unregistered notes.
Debt Extinguishments and Reductions
In the fourth quarter of 2007, we repaid $13.5 million aggregate principal amount of our 6.875% notes due October 2007. In addition to this repayment, we also prepaid $50 million of our Series A Senior Notes due November 2011. As a result of this transaction, we recognized a loss of $0.5 million recorded inLoss on early
80
SERVICE CORPORATION INTERNATIONAL
NOTES TO CONSOLIDATED FINANCIAL STATEMENTS — (Continued)
extinguishment of debtin our condensed consolidated statement of operations, which represents the write-off of unamortized deferred loan costs of $0.5 million.
In the second quarter of 2007, we purchased $149.8 million aggregate principal amount of our 6.50% Notes due 2008 and $173.8 million aggregate principal amount of our 7.70% Notes due 2009 in a tender offer. In connection with the repurchase of the notes, we recognized aLoss on early extinguishment of debtof approximately $12.1 million, which represents the write-off of unamortized deferred loan costs of $1.1 million, a $1.0 million loss on a related interest rate hedge, and $10.0 million in premiums paid to extinguish the debt.
In the first quarter of 2007, we repaid $100.0 million aggregate principal amount of our term loan. As a result of this transaction, we recognized a loss of $2.4 million recorded inLoss on early extinguishment of debtin our consolidated statement of operations, which represents the write-off of unamortized deferred loan costs of $1.7 million and a $0.7 million premium to early extinguish the debt.
In the fourth quarter of 2006, we purchased $139.0 million aggregate principal amount of our outstanding 7.70% notes due 2009 in a tender offer. As a result of this transaction, we recognized a loss of $17.5 million recorded inLoss on early extinguishment of debt, in our consolidated statement of operations. Also in the fourth quarter of 2006, we redeemed $11.3 million aggregate principal amount of our debentures associated with the acquisitions of various locations. These transactions resulted in no recognized gain or loss.
During the second quarter of 2006, our 7.2% notes matured, and we made a payment consisting of $10.7 million in principal and $0.4 million in interest to the debtholders and redeemed $1.0 million aggregate principal amount of our debentures associated with the acquisition of various locations. These transactions resulted in no recognized gain or loss.
On December 15, 2005, as required by the terms of the agreement, we repaid the remaining $63.5 million of the 6.00% notes due 2005.
Capital Leases
In 2007, we acquired $31.7 million of transportation equipment using capital leases.
In 2006, we acquired $126.4 million of transportation equipment using capital leases, of which $102.3 million was classified as operating leases in prior periods. See additional information regarding these leases in Note 13 of these consolidated financial statements.
Additional Debt Disclosures
At December 31, 2007 and 2006, we had deposited $23.7 million and $10.1 million, respectively, in restricted, interest-bearing accounts that were pledged as collateral for various credit instruments and commercial commitments. This restricted cash is included inDeferred charges and other assetsin our consolidated balance sheet. Unamortized pricing discounts, totaling $5.3 million and $4.2 million at December 31, 2007 and 2006, respectively, primarily relate to our September 2002 exchange offering of the 7.7% notes due in 2009.
We had assets of approximately $4.8 million and $6.9 million pledged as collateral for the mortgage notes and other debt at December 31, 2007 and 2006, respectively.
Cash interest payments for the three years ended December 31 were, in thousands, as follows:
| | | | | |
| 2007 | | $ | 140,298 | |
| 2006 | | $ | 104,789 | |
| 2005 | | $ | 95,678 | |
Cash interest payments in 2006 include $6.4 million of bridge financing costs related to the Alderwoods acquisition.
81
SERVICE CORPORATION INTERNATIONAL
NOTES TO CONSOLIDATED FINANCIAL STATEMENTS — (Continued)
Cash interest payments forecasted as of December 31, 2007 for the five years subsequent to December 31, 2007 are, in thousands, as follows:
| | | | | |
| 2008 | | $ | 131,070 | |
| 2009 | | $ | 128,017 | |
| 2010 | | $ | 125,995 | |
| 2011 | | $ | 123,225 | |
| 2012 | | $ | 110,083 | |
| 2013 and thereafter | | $ | 570,100 | |
| |
| 12. | Credit Risk and Fair Value of Financial Instruments |
Fair Value Estimates
The fair value estimates of the following financial instruments have been determined using available market information and appropriate valuation methodologies. The carrying values of cash and cash equivalents, trade receivables, and trade payables approximate the fair values of those instruments due to the short-term nature of the instruments. The fair values of receivables on preneed funeral contracts and cemetery contracts are impracticable to estimate because of the lack of a trading market and the diverse number of individual contracts with varying terms. The carrying value of other notes receivable approximates the fair value. At December 31, 2007 and 2006, notes receivable included inReceivables, nettotaled $4.8 million and $6.1 million, respectively, and long-term notes receivable included inDeferred charges and other assetsin the consolidated balance sheet totaled $25.2 million and $28.0 million, respectively.
The fair value of our debt at December 31 was as follows:
| | | | | | | | | |
| | | 2007 | | | 2006 | |
| | | (In thousands, except per share data) | |
| |
| 6.875% notes due 2007 | | | — | | | | 13,571 | |
| 6.5% notes due 2008 | | | 45,209 | | | | 195,975 | |
| 7.7% notes due 2009 | | | 28,444 | | | | 210,185 | |
| 7.875% debentures due 2013 | | | 55,071 | | | | 58,408 | |
| 7.375% senior notes due 2014 | | | 253,750 | | | | 260,625 | |
| 6.75% notes due 2015 | | | 196,500 | | | | — | |
| 6.75% notes due 2016 | | | 239,375 | | | | 248,438 | |
| 7.0% notes due 2017 | | | 288,750 | | | | 302,625 | |
| 7.625% senior notes due 2018 | | | 251,250 | | | | 263,125 | |
| 7.5% notes due 2027 | | | 185,000 | | | | — | |
| Term loan | | | — | | | | 100,000 | |
| Floating rate series A and series B senior notes | | | 150,000 | | | | 200,000 | |
| Obligations under capital leases | | | 112,507 | | | | 113,484 | |
| Convertible debentures, maturities through 2013, fixed interest rates at 5.00%, conversion prices from $13.02 to $50.00 per share | | | 4,175 | | | | 9,925 | |
| Mortgage notes and other debt, maturities through 2050 | | | 15,742 | | | | 26,304 | |
| | | | | | | | | |
| Total fair value of debt | | $ | 1,825,773 | | | $ | 2,002,665 | |
| | | | | | | | | |
82
SERVICE CORPORATION INTERNATIONAL
NOTES TO CONSOLIDATED FINANCIAL STATEMENTS — (Continued)
The fair values of our long-term, fixed rate and convertible debt securities were estimated using market prices for those securities or for other securities having similar terms and maturities. Mortgage notes and other debt have been reported at face value because of the diverse terms and conditions and non-marketable nature of these notes.
Credit Risk Exposure
Our cash deposits, some of which exceed insured limits, are distributed among various market and national banks in the jurisdictions in which we operate. In addition, we regularly invest excess cash in financial instruments which are not insured, such as money-market funds and Eurodollar time deposits, that are offered by a variety of reputable financial institutions and commercial paper that is offered by corporations with quality credit ratings. We believe that the credit risk associated with such instruments is minimal.
We grant credit to customers in the normal course of business. The credit risk associated with funeral, cemetery, and preneed funeral and preneed cemetery receivables due from customers is generally considered minimal because of the diversification of the customers served. Furthermore, bad debts have not been significant relative to the volume of deferred revenues. Customer payments on preneed funeral or preneed cemetery contracts that are either placed into state regulated trusts or used to pay premiums on life insurance contracts generally do not subject us to collection risk. Insurance funded contracts are subject to supervision by state insurance departments and are protected in the majority of states by insurance guaranty acts.
| |
| 13. | Commitments and Contingencies |
Leases
Our leases principally relate to funeral home facilities and transportation equipment. The majority of our lease arrangements contain options to (i) purchase the property at fair value on the exercise date, (ii) purchase the property for a value determined at the inception of the leases, or (iii) renew for the fair rental value at the end of the primary lease term. Rental expense for these leases was $30.1 million, $24.5 million, and $54.2 million for the years ended December 31, 2007, 2006, and 2005, respectively. As of December 31, 2007, future minimum lease payments for non-cancelable operating and capital leases exceeding one year are as follows:
| | | | | | | | | |
| | | Operating | | | Capital | |
| | | (In thousands) | |
| |
| 2008 | | $ | 11,267 | | | $ | 30,024 | |
| 2009 | | | 10,040 | | | | 25,116 | |
| 2010 | | | 8,319 | | | | 45,272 | |
| 2011 | | | 6,806 | | | | 10,552 | |
| 2012 | | | 6,247 | | | | 6,996 | |
| 2013 and thereafter | | | 55,522 | | | | 27,864 | |
| | | | | | | | | |
| Total | | $ | 98,201 | | | $ | 145,824 | |
| | | | | | | | | |
| Less: Interest on capital leases | | | | | | | (33,314 | ) |
| | | | | | | | | |
| Total principal payable on capital leases | | | | | | $ | 112,510 | |
| | | | | | | | | |
Management, Consulting and Non-Competition Agreements
We have entered into management, employment, consulting and non-competition agreements, generally for five to ten years, with certain officers and employees and former owners of businesses that we acquired. At
83
SERVICE CORPORATION INTERNATIONAL
NOTES TO CONSOLIDATED FINANCIAL STATEMENTS — (Continued)
December 31, 2007, the maximum estimated future cash commitment under agreements with remaining commitment terms was as follows:
| | | | | | | | | | | | | | | | | |
| | | Employment | | | Consulting | | | Non-Competition | | | Total | |
| | | (In thousands) | |
| |
| 2008 | | $ | 1,389 | | | $ | 1,479 | | | $ | 5,022 | | | $ | 7,890 | |
| 2009 | | | 402 | | | | 1,448 | | | | 1,848 | | | | 3,698 | |
| 2010 | | | 60 | | | | 371 | | | | 1,443 | | | | 1,874 | |
| 2011 | | | 43 | | | | 46 | | | | 1,065 | | | | 1,154 | |
| 2012 | | | 43 | | | | 39 | | | | 892 | | | | 974 | |
| 2013 and thereafter | | | 346 | | | | 301 | | | | 742 | | | | 1,389 | |
| | | | | | | | | | | | | | | | | |
| Total | | $ | 2,283 | | | $ | 3,684 | | | $ | 11,012 | | | $ | 16,979 | |
| | | | | | | | | | | | | | | | | |
Representations and Warranties
As of December 31, 2007, we have contingent obligations of $33.5 million (of which $27.5 million is reflected in our financial statements as a liability) resulting from our previous international asset sales and joint venture transactions. In some cases, we have agreed to guarantee certain representations and warranties made in such disposition transactions with letters of credit or interest-bearing cash investments. We have interest-bearing cash investments of $23.0 million included inDeferred charges and other assetscollateralizing certain of these contingent obligations. We believe it is remote that it will ultimately be required to fund to third parties claims against these representations and warranties above the carrying value of the liability.
In March 2004, we disposed of our funeral operations in France to a newly formed, third party company. As a result of this sale, we recognized $35.8 million of contractual obligations related to representations, warranties, and other indemnifications in accordance with the provisions of FIN 45,“Guarantor’s Accounting and Disclosure Requirements for Guarantees, Including Indirect Guarantees of Indebtedness of Others.”During 2007, we paid $0.2 million to settle certain tax and litigation matters. The remaining obligation of $23.5 million at December 31, 2007 represents the following:
| | | | | | | | | | | | | | | |
| | | | | | | | | | | Carrying
| |
| | | | | | | | Maximum Potential
| | | Value as of
| |
| | | Contractual
| | | | | Amount of Future
| | | December 31,
| |
| | | Obligation | | | Time Limit | | Payments | | | 2007 | |
| | | (In thousands) | | | | | | | | (In thousands) | |
| |
| Tax reserve liability | | $ | 18,610 | | | March 31, 2010 | | € | 30 million | | | $ | 10,000 | |
| Litigation provision | | | 7,765 | | | Until entire resolution of | | | (1 | ) | | | 4,137 | |
| | | | | | | (i) the relevant claims or | | | | | | | | |
| | | | | | | (ii) settlement of the | | | | | | | | |
| | | | | | | claim by the purchaser at the request | | | | | | | | |
| | | | | | | of the vendor | | | | | | | | |
| Employee litigation provision | | | 6,512 | | | One month after expiration of | | | (2 | ) | | | 6,512 | |
| | | | | | | the statutory period of limitations | | | | | | | | |
| VAT taxes | | | 3,882 | | | One month after expiration of | | | (1 | ) | | | 3,882 | |
| | | | | | | the statutory period of limitations | | | | | | | | |
| Other | | | 3,381 | | | Until entire resolution of (i) the relevant claims or | | | (2 | ) | | | 3,381 | |
| | | | | | | | | | | | | | | |
| | | | | | | (ii) settlement of the | | | | | | | | |
| | | | | | | claim by the purchaser at | | | | | | | | |
| | | | | | | the request of the vendor | | | | | | | | |
| Total | | $ | 40,150 | | | | | | | | | $ | 27,912 | |
| | | | | | | | | | | | | | | |
| Less: Deductible of majority equity | | | | | | | | | | | | | | |
| owner | | | (4,382 | ) | | | | | | | | | (4,382 | ) |
| | | | | | | | | | | | | | | |
| | | $ | 35,768 | | | | | | | | | $ | 23,530 | |
| | | | | | | | | | | | | | | |
| | |
| (1) | | The potential maximum exposure for these two items combined is €20.0 million or $29.4 million at December 31, 2007. |
| |
| (2) | | The potential maximum exposure for these two items combined is €40.0 million or $58.8 million at December 31, 2007. |
84
SERVICE CORPORATION INTERNATIONAL
NOTES TO CONSOLIDATED FINANCIAL STATEMENTS — (Continued)
Insurance Loss Reserves
We purchase comprehensive general liability, morticians and cemetery professional liability, automobile liability and workers’ compensation insurance coverage structured with high deductibles. The high deductible insurance program means we are primarily self-insured for claims and associated costs and losses covered by these policies. As of December 31, 2007 and 2006 we had recorded a reserve of $69.9 million and $67.7 million, respectively.
Litigation
We are a party to various litigation matters, investigations, and proceedings. For each of our outstanding legal matters, we evaluate the merits of the case, our exposure to the matter, possible legal or settlement strategies, and the likelihood of an unfavorable outcome. We intend to defend ourselves in the lawsuits described herein; however, if we determine that an unfavorable outcome is probable and can be reasonably estimated, we establish the necessary accruals. We hold certain insurance policies that may reduce cash outflows with respect to an adverse outcome of certain of these litigation matters. We accrue such insurance recoveries when they become probable of being paid and can be reasonably estimated.
Conley Investment Counsel v. Service Corporation International, et al; Civil Action 04-MD-1609; In the United States District Court for the Southern District of Texas, Houston Division (the “2003 Securities Lawsuit”). The 2003 Securities Lawsuit resulted from the transfer and consolidation by the Judicial Panel on Multidistrict Litigation of three lawsuits— Edgar Neufeld v. Service Corporation International, et al; CauseNo. CV-S-03-1561-HDM-PAL; In the United States District Court for the District of Nevada; andRujira Srisythemp v. Service Corporation International, et. Al.; CauseNo. CV-S-03-1392-LDG-LRL; In the United States District Court for the District of Nevada; andJoshua Ackerman v. Service Corporation International, et. Al.; CauseNo. 04-CV-20114; In the United States District Court for the Southern District of Florida. The 2003 Securities Lawsuit names as defendants SCI and several of SCI’s current and former executive officers or directors. The 2003 Securities Lawsuit is a purported class action alleging that the defendants failed to disclose the unlawful treatment of human remains and gravesites at two cemeteries in Fort Lauderdale and West Palm Beach, Florida. Since the action is in its preliminary stages, no discovery has occurred, and we cannot quantify our ultimate liability, if any, for the payment of damages.
Burial Practices Claims. We are named as a defendant in various lawsuits alleging improper burial practices at certain of our cemetery locations. These lawsuits include theVallsandGarcialawsuits described in the following paragraphs.
Maria Valls, Pedro Valls and Roberto Valls, on behalf of themselves and all other similarly situated v. SCI Funeral Services of Florida, Inc. d/b/a Memorial Plan a/k/a Flagler Memorial Park, John Does and Jane Does; Case No. 23693CA08; In the Circuit Court of the 11th Judicial Circuit in and for Miami-Dade County, Florida (“Valls Lawsuit”). The Valls Lawsuit was filed December 5, 2005, and named a subsidiary of SCI as a defendant. Plaintiffs have requested that the court certify this matter as a class action. The plaintiffs allege the defendants improperly handled remains, did not keep adequate records of interments, and engaged in various other improprieties in connection with the operation of the cemetery. Although the plaintiffs seek to certify as a class all family members of persons buried at the cemetery, the court dismissed plaintiffs’ class action allegations on two occasions; however, the dismissals were without prejudice. Plaintiffs have filed a third amended complaint and we have again moved to dismiss the class action allegations. The plaintiffs are seeking monetary damages and have reserved the right to seek leave from the court to claim punitive damages. The plaintiffs are also seeking injunctive relief. Since the action is in its preliminary stages, we cannot quantify our ultimate liability, if any, for the payment of any damages.
In addition to the Valls Lawsuit, we have met with separate counsel representing other families who have made burial practices claims related to this cemetery. In cooperation with the families, our cemetery management
85
SERVICE CORPORATION INTERNATIONAL
NOTES TO CONSOLIDATED FINANCIAL STATEMENTS — (Continued)
initiated an investigation into certain of the families’ claims. After working with the families and their counsel, we reached an agreement to settle all of their claims.
Reyvis Garcia and Alicia Garcia v. Alderwoods Group, Inc., Osiris Holding of Florida, Inc, a Florida corporation, d/b/a Graceland Memorial Park South, f/k/a Paradise Memorial Gardens, Inc., was filed in December 2004, in the Circuit Court of the Eleventh Judicial Circuit in and for Miami-Dade County, Florida, Case No.:04-25646 CA 32. Plaintiffs are the son and sister of the decedent, Eloisa Garcia, who was buried at Graceland Memorial Park South in March 1986, when the cemetery was owned by Paradise Memorial Gardens, Inc. Initially, the suit sought damages on the individual claims of the plaintiffs relating to the burial of Eloisa Garcia. Plaintiffs claimed that due to poor record keeping, spacing issues and maps, and the fact that the family could not afford to purchase a marker for the grave, the burial location of the decedent could not be readily located. Subsequently, the decedent’s grave was located and verified. In July 2006, plaintiffs amended their complaint, seeking to certify a class of all persons buried at this cemetery whose burial sites cannot be located, claiming that this is due to poor record keeping, maps, and surveys at the cemetery. Plaintiffs subsequently filed a third amended class action complaint and added two additional named plaintiffs. The plaintiffs are seeking unspecified monetary damages, as well as equitable and injunctive relief. No class has been certified in this matter. Since the action is in its preliminary stages, we cannot quantify our ultimate liability, if any, for the payment of any damages.
Funeral Regulations Lawsuits. We are named as a defendant in various lawsuits alleging violations of federal and state funeral related regulationsand/or statutes, including theHijar,Baudino, andSanchezlawsuits described in the following paragraphs.
David Hijar v. SCI Texas Funeral Services, Inc., SCI Funeral Services, Inc., and Service Corporation International; In the County Court of El Paso, County, Texas, County Court at Law Number Three; Cause Number2002-740, (the “Hijar Lawsuit”). The Hijar Lawsuit was initially filed as a putative state-wide class action brought on behalf of all persons, entities, and organizations who purchased funeral services from SCI or its subsidiaries in Texas at any time since March 18, 1998. Plaintiffs allege that federal and Texas funeral related regulationsand/or statutes (“Rules”) required us to disclose our markups on all items obtained from third parties in connection with funeral service contracts and that the failure to make certain disclosures of markups resulted in breach of contract and other legal claims. The plaintiffs seek to recover an unspecified amount of monetary damages. The plaintiffs also seek attorneys’ fees, costs of court, pre- and post-judgment interest, and unspecified “injunctive and declaratory relief.” We deny that the plaintiffs have standing to sue for violations of the Texas Occupations Code or the Rules, deny that plaintiffs have standing to sue for violations under the relevant regulations and statutes, deny that any breaches of contractual terms occurred, and on other grounds deny liability on all of the plaintiffs’ claims. We deny that the Hijar Lawsuit satisfies the requirements for class certification.
In May 2004, the trial court heard summary judgment cross-motions filed by us and plaintiff Hijar (at that time, the only plaintiff). The trial court granted Hijar’s motion for partial summary judgment and denied our motion. In its partial summary judgment order, the trial court made certain findings to govern the case, consistent with its summary judgment ruling. Our request for rehearing was denied.
During the course of the Hijar Lawsuit, the parties disputed the proper scope and substance of discovery. Following briefing by both parties and evidentiary hearings, the trial court entered three orders against us for which we sought appellate review: (a) a January 2005 discovery sanctions order; (b) an April 2005 discovery sanctions order; and (c) an April 2005 certification order, certifying a class and two subclasses. On April 29, 2005, we filed an appeal regarding the certification order and, concurrently with our initial brief in that appeal, filed a separate mandamus proceeding regarding the sanctions orders.
In the certification appeal, the court of appeals issued an opinion holding that the plaintiffs do not have a private right of action for monetary damages under the relevant regulations and statutes. The opinion concludes that the plaintiffs do not have standing to assert their claims for monetary damages on behalf of themselves or the class. The court of appeals therefore reversed the trial court���s order certifying a class, rendered judgment against the
86
SERVICE CORPORATION INTERNATIONAL
NOTES TO CONSOLIDATED FINANCIAL STATEMENTS — (Continued)
plaintiffs on their claims for damages, and remanded the remaining general individual claims for injunctive relief back to the trial court (without opining on the merits of those claims) for further handling consistent with the court’s opinion. Plaintiffs filed a motion for rehearing on August 11, 2006. On January 11, 2007, in response to the motion, the court of appeals issued a substitute opinion in which the court revised a portion of its discussion but reached the same result on certification (i.e., the class was decertified). Plaintiffs’ second motion for rehearing was denied.
On March 20, 2007, plaintiffs filed a petition for review in the Supreme Court of Texas. At the Supreme Court’s request, we filed a response. On September 28, 2007, the Supreme Court denied the plaintiffs’ petition for review. The Supreme Court issued its final order to the court of appeals on November 13, 2007. On November 27, 2007, the court of appeals issued its mandate, returning jurisdiction over the individual plaintiffs’ lawsuit to the trial court for proceedings consistent with the court of appeals’ opinion on rehearing.
In the mandamus proceeding, the court of appeals denied the mandamus petition in January 2006, and denied rehearing on March 15, 2006. We filed a petition for writ of mandamus in the Supreme Court of Texas, which on September 11, 2006 requested full briefing on the merits. On October 12, 2007, after full briefing on the merits, the Supreme Court of Texas granted our request and directed the trial court to vacate its sanction orders. On February 21, 2008, the plaintiffs voluntarily dismissed, with prejudice, all of their claims against us, ending the case.
Mary Louise Baudino, et al v. Service Corporation International, et al; the plaintiffs’ counsel in the Hijar Lawsuit initiated an arbitration claim raising similar issues in California and filed in November 2004 a case styledMary Louise Baudino, et al v. Service Corporation International, et al; in Los Angeles County Superior Court; Case No. BC324007 (“Baudino Lawsuit”). The Baudino Lawsuit makes claims similar to those made in the Hijar lawsuit. However, the Baudino Lawsuit seeks a nation-wide class of plaintiffs. On September 15, 2006, the trial court granted our motion for summary judgment on the merits. Plaintiffs are appealing the summary judgment ruling.
Richard Sanchez et al v. Alderwoods Group, Inc. et alwas filed in February 2005 in the Superior Court of the State of California, for the County of Los Angeles, Central District; Case No. BC328962. Plaintiffs seek to certify a nationwide class on behalf of all consumers who purchased funeral goods and services from Alderwoods. Plaintiffs allege in essence that the Federal Trade Commission’s Funeral Rule requires Alderwoods to disclose its markups on all items obtained from third-parties in connection with funeral service contracts. Plaintiffs allege further that Alderwoods has failed to make such disclosures. Plaintiffs seek to recover an unspecified amount of monetary damages, attorney’s fees, costs, and unspecified “injunctive and declaratory relief.” This case is substantially similar to the Baudino Lawsuit, and we expect that the outcome of this case will be governed by the law applied in the Baudino Lawsuit.
Antitrust Claims. We are named as a defendant in two related class action antitrust cases filed in 2005. The first case is Cause No 4:05-CV-03394;Funeral Consumers Alliance, Inc. v. Service Corporation International, et al; In the United States District Court for the Southern District of Texas — Houston (“Funeral Consumers Case”). This is a purported class action on behalf of casket consumers throughout the United States alleging that we and several other companies involved in the funeral industry violated federal antitrust laws and state consumer laws by engaging in various anti-competitive conduct associated with the sale of caskets.
The second case is CauseNo. 4:05-CV-03399;Pioneer Valley Casket, et al. v. Service Corporation International, et al.; In the United States District Court for the Southern District of Texas — Houston Division (“Pioneer Valley Case”). This lawsuit makes the same allegations as the Funeral Consumers Case and is also brought against several other companies involved in the funeral industry. Unlike the Funeral Consumers Case, the Pioneer Case is a purported class action on behalf of all independent casket distributors that are in the business or were in the business any time between July 18, 2001 to the present.
The Funeral Consumers Case and the Pioneer Valley Case seek injunctions, monetary damages, and treble damages. The plaintiffs in the Funeral Consumers Case filed an expert report indicating that the damages sought from all defendants range from approximately $950 million to $1.5 billion, before trebling. Additionally, the
87
SERVICE CORPORATION INTERNATIONAL
NOTES TO CONSOLIDATED FINANCIAL STATEMENTS — (Continued)
plaintiffs in the Pioneer Valley Case filed an expert report indicating that the damages sought from all defendants would be approximately $99 million, before trebling. We deny that we engaged in anticompetitive practices related to our casket sales and intend to vigorously contest these claims and plaintiffs’ damages reports. In both cases, we have filed reports of our experts which vigorously dispute the validity of the plaintiffs’ damages theories and calculations. Since the litigation is in its preliminary stages, we cannot quantify our ultimate liability, if any, for the payment of damages.
In addition to the Funeral Consumers Case and the Pioneer Valley Case, we received Civil Investigative Demands, dated August 2005 and February 2006, from the Attorney General of Maryland on behalf of itself and other state attorneys general, who have commenced an investigation of alleged anticompetitive practices in the funeral industry. We have also received similar Civil Investigative Demands from the Attorneys General of Florida and Connecticut.
Wage and Hour Claims. We are named a defendant in various lawsuits alleging violations of federal and state laws regulating wage and hour overtime pay, including the lawsuits described in the following paragraphs.
Prise, et al., v. Alderwoods Group, Inc., and Service Corporation International; CauseNo. 06-164; In the United States District Court for the Western District of Pennsylvania (the “Wage and Hour Lawsuit”). The Wage and Hour Lawsuit was filed by two former Alderwoods (Pennsylvania), Inc., employees in December 2006 and purports to have been brought under the Fair Labor Standards Act (“FLSA”) on behalf of all Alderwoods and SCI affiliated employees who performed work for which they were not fully compensated, including work for which overtime pay was owed. The court has conditionally certified a class of claims as to certain job positions for Alderwoods employees. On three occasions, the court has denied without prejudice plaintiffs’ request for certification of claims against SCI and has dismissed such claims without prejudice.
Plaintiffs allege causes of action for violations of the FLSA, failure to maintain proper records, breach of contract, violations of state wage and hour laws, unjust enrichment, fraud and deceit, quantum meruit, negligent misrepresentation, and negligence. Plaintiffs seek injunctive relief, unpaid wages, liquidated, compensatory, consequential and punitive damages, attorneys’ fees and costs, and pre- and post-judgment interest. The Wage and Hour Lawsuit is in its preliminary stages and we cannot quantify our ultimate liability, if any.
Prise, et al., v. Alderwoods Group, Inc., and Service Corporation International; Cause No. RG7384642; In the Superior Court of the State of California, County of Alameda. This lawsuit is related to the Wage and Hour Lawsuit and was filed in July 2007. It raises state law claims that were previously dismissed by the court in the Wage and Hour Lawsuit. We removed the case to federal court and moved to dismiss the plaintiffs’ claims. In response, the plaintiffs voluntarily dismissed the case in December 2007.
Bryant, et al. v. Alderwoods Group, Inc., Service Corporation International, et al.; CaseNo. 3:07-CV-5696-SI; In the U.S. District Court for the Northern District of California. This lawsuit was filed on November 8, 2007 against SCI and various subsidiaries and individuals. It too is related to the Wage and Hour Lawsuit, raising similar claims and brought by the same attorneys. The lawsuit is in its preliminary stages, and we cannot quantify our ultimate liability, if any.
Bryant, et al. v. Service Corporation International, et al.;CaseNo. RG-07359593; andHelm, et al. v. AWGI & SCI; CaseNo. RG-07359602; In the Superior Court of the State of California, County of Almeda. These cases were filed on December 5, 2007 by counsel for plaintiffs in the Wage and Hour Lawsuit. These cases assert state law claims like those previously dismissed in the Wage and Hour Lawsuit. The lawsuits are in their preliminary stages, and we cannot quantify our ultimate liability, if any.
Stickle, et al. v. Service Corporation International, et al.; CaseNo. 08-CV-83; In the U.S. District Court for Arizona, Phoenix Division. Counsel for plaintiffs in the Wage and Hour Lawsuit filed this case on January 17, 2008, against SCI and various related entities and individuals asserting FLSA and other ancillary claims based on the alleged failure to pay for overtime. Plaintiffs seek the same class notice to SCI and related entities that were rejected
88
SERVICE CORPORATION INTERNATIONAL
NOTES TO CONSOLIDATED FINANCIAL STATEMENTS — (Continued)
by the Court in the Wage and Hour Lawsuit. The lawsuit is in its preliminary stages and we cannot quantify our ultimate liability, if any.
The ultimate outcome of the matters described above cannot be determined at this time. We intend to aggressively defend all of the above lawsuits; however, an adverse decision in one or more of such matters could have a material adverse effect on us, our financial condition, results of operations, and cash flows.
(All shares reported in whole numbers)
Share Authorization
We are authorized to issue 1,000,000 shares of preferred stock, $1 per share par value. No preferred shares were issued as of December 31, 2007 or 2006. At December 31, 2007 and 2006, 500,000,000 common shares of $1 par value were authorized. We had 262,858,169 and 293,222,114 shares issued and outstanding, net of 1,961,300 and 10,000 shares held in treasury at par at December 31, 2007 and 2006, respectively.
Share Purchase Rights Plan
Our preferred share purchase rights plan declares a dividend of one preferred share purchase right for each share of common stock outstanding. The rights are exercisable in the event certain investors attempt to acquire 20% or more of our common stock and entitle the rights holders to purchase certain of our securities or the securities of the acquiring company. The rights, which are redeemable by us for $.01 per right, expire in July 2008 unless extended.
89
SERVICE CORPORATION INTERNATIONAL
NOTES TO CONSOLIDATED FINANCIAL STATEMENTS — (Continued)
Accumulated Other Comprehensive (Loss) Income
Our components ofaccumulated other comprehensive (loss) incomeat December 31 are as follows:
| | | | | | | | | | | | | | | | | |
| | | Foreign
| | | | | | | | | Accumulated
| |
| | | Currency
| | | Pension
| | | Unrealized
| | | Other
| |
| | | Translation
| | | Related
| | | Gains and
| | | Comprehensive
| |
| | | Adjustment | | | Adjustments | | | Losses | | | (Loss) Income | |
| | | (In thousands) | |
| |
| Balance at December 31, 2004 | | | (38,349 | ) | | | — | | | | — | | | | (38,349 | ) |
| Activity in 2005 | | | 7,260 | | | | — | | | | — | | | | 7,260 | |
| Reduction in net unrealized gains associated with available-for-sale securities of the trusts | | | — | | | | — | | | | (69,226 | ) | | | (69,226 | ) |
| Reclassification of net unrealized gains activity attributable to the non-controlling interest holders | | | — | | | | — | | | | 69,226 | | | | 69,226 | |
| Reclassification for translation adjustment realized in net loss | | | 101,588 | | | | — | | | | — | | | | 101,588 | |
| | | | | | | | | | | | | | | | | |
| Balance at December 31, 2005 | | $ | 70,499 | | | $ | — | | | $ | — | | | $ | 70,499 | |
| | | | | | | | | | | | | | | | | |
| Activity in 2006 | | | 1,039 | | | | — | | | | (3,731 | ) | | | (2,692 | ) |
| Adjustment upon initial adoption of FAS 158 | | | — | | | | (623 | ) | | | — | | | | (623 | ) |
| Reduction in net unrealized gains associated with available-for-sale securities of the trusts | | | — | | | | — | | | | (37,751 | ) | | | (37,751 | ) |
| Reclassification of net unrealized gains activity attributable to the non-controlling interest holders | | | — | | | | — | | | | 37,751 | | | | 37,751 | |
| Reclassification for translation adjustment realized in net loss | | | 5,114 | | | | — | | | | — | | | | 5,114 | |
| | | | | | | | | | | | | | | | | |
| Balance at December 31, 2006 | | $ | 76,652 | | | $ | (623 | ) | | $ | (3,731 | ) | | $ | 72,298 | |
| | | | | | | | | | | | | | | | | |
| Activity in 2007 | | | 92,003 | | | | 623 | | | | (5,699 | ) | | | 86,927 | |
| Increase in net unrealized gains associated with available-for-sale securities of the trusts | | | — | | | | — | | | | 105,438 | | | | 105,438 | |
| Reclassification of unrealized gains activity attributable to the non-controlling interest holders | | | — | | | | — | | | | (105,438 | ) | | | (105,438 | ) |
| Reclassification for losses on available-for-sale securities realized in net income | | | — | | | | — | | | | 9,430 | | | | 9,430 | |
| Reclassification for translation adjustment in net gain | | | (16,065 | ) | | | | | | | | | | | (16,065 | ) |
| | | | | | | | | | | | | | | | | |
| Balance at December 31, 2007 | | $ | 152,590 | | | $ | — | | | $ | — | | | $ | 152,590 | |
| | | | | | | | | | | | | | | | | |
The reclassification for losses on available-for-sale securities adjustment of $9.4 million for the year ended December 31, 2007 primarily relates to the sale of a consolidated subsidiary and is included inIncome from discontinued operationson the consolidated statement of operations. The reclassification for translation adjustment of $16.1 million for the year ended December 31, 2007 relates to the sale of our unconsolidated French subsidiary and is included in equity in earnings of unconsolidated subsidiaries on our consolidated statement of operations.
The reclassification adjustment of $5.1 million for the year ended December 31, 2006 primarily relates to the sale of our operations in Singapore. The $3.7 million unrealized loss on investment securities is related to investment securities held by a consolidated subsidiary. The reclassification adjustment of $101.6 million during the year ended December 31, 2005 includes $71.8 million related to the sale of our operations in Argentina and Uruguay and $29.8 million related to the sale of our cemetery businesses in Chile.
90
SERVICE CORPORATION INTERNATIONAL
NOTES TO CONSOLIDATED FINANCIAL STATEMENTS — (Continued)
The assets and liabilities of foreign operations are translated into U.S. dollars using the current exchange rate. The U.S. dollar amount that arises from such translation, as well as exchange gains and losses on intercompany balances of a long-term investment nature, are included in the cumulative currency translation adjustments inAccumulated other comprehensive (loss) income.Income taxes are generally not provided for foreign currency translation.
Share Repurchase Program
Subject to market conditions, normal trading restrictions, and limitations in our debt covenants, we may make purchases in the open market or through privately negotiated transactions under our share repurchase program. During 2007, we repurchased 38.5 million shares of common stock at an aggregate cost of $505.1 million including commissions, or an average cost per share of $13.13. During 2006, we repurchased 3.4 million shares of common stock at an aggregate cost of $27.9 million. During 2005, we repurchased 31.0 million shares of common stock at an aggregate cost of $225.2 million. In November 2007, our Board of Directors approved an increase in our share repurchase program authorizing the investment of up to an additional $250 million to repurchase our common stock. The remaining dollar value of shares authorized to be purchased under the share repurchase program was $145.6 million at December 31, 2007.
Subsequent to December 31, 2007, we repurchased an additional 1.6 million shares of common stock at an aggregate cost of $22.5 million including commissions, or an average cost per share of $13.68. After these purchases, the remaining dollar value of shares authorized to be purchased under our share repurchase program was approximately $123.1 million.
Cash Dividends
On November 14, 2007, our Board of Directors approved a cash dividend of $.04 per common share. At December 31, 2007, this dividend totaling $10.6 million was recorded inAccounts payable and accrued liabilitiesandCapital in Excess of Par Valuein the consolidated balance sheet. Subsequent to December 31, 2007, this dividend was paid. We paid $34.6 million and $29.4 million in cash dividends in 2007 and 2006, respectively.
| |
| 15. | Share-Based Compensation |
Stock Benefit Plans
We maintain benefit plans whereby shares of our common stock may be issued pursuant to the exercise of stock options or restricted stock granted to officers and key employees. Our Amended 1996 Incentive Plan reserves 34,000,000 shares of common stock for outstanding and future awards of stock options, restricted stock, and other stock based awards to officers and key employees.
The benefit plans allow for options to be granted as either non-qualified or incentive stock options. The options historically have been granted only once each year, or upon hire, as approved by the compensation committee of the Board of Directors. The options are granted with an exercise price equal to the market price of our common stock on the date the grant is approved by the compensation committee of the Board of Directors. The options are generally exercisable at a rate of 331/3% each year unless alternative vesting methods are approved by the compensation committee of the Board of Directors. Restricted stock awards are generally expensed to income ratably over the period during which the restrictions lapse. At December 31, 2007 and 2006, 13,358,979 and 2,615,487 shares, respectively, were reserved for future option and restricted stock grants under these stock benefit plans.
We utilize the Black-Scholes option valuation model for estimating the fair value of our stock options. This model allows the use of a range of assumptions related to volatility, the risk-free interest rate, the expected life, and the dividend yield. The expected volatility utilized in the valuation model is based on implied volatilities from traded options on our stock and the historical volatility of our stock price. The dividend yield and the expected holding period are both based on historical experience and management’s estimate of future events. The risk-free
91
SERVICE CORPORATION INTERNATIONAL
NOTES TO CONSOLIDATED FINANCIAL STATEMENTS — (Continued)
interest rate is derived from the U.S. Treasury yield curve based on the expected life of the option in effect at the time of grant. The fair values of our stock options are calculated using the following weighted average assumptions based on the methods described above for the years ended December 31, 2007, 2006, and 2005:
| | | | | | | | | | | | | |
| | | Twelve Months Ended December 31, | |
Assumptions | | 2007 | | | 2006 | | | 2005 | |
| |
| Dividend yield | | | 1.4 | % | | | 1.3 | % | | | 1.5 | % |
| Expected volatility | | | 38.9 | % | | | 37.9 | % | | | 43.3 | % |
| Risk-free interest rate | | | 4.8 | % | | | 4.5 | % | | | 3.7 | % |
| Expected holding period | | | 5.9 years | | | | 5.6 years | | | | 5.5 years | |
The following table shows a summary of information with respect to stock option and restricted share compensation for 2007 and 2006 and for 2005, which are included in our consolidated statement of operations for those respective periods:
| | | | | | | | | | | | | |
| | | December 31, | |
| | | 2007 | | | 2006 | | | 2005 | |
| | | (In thousands) | |
| |
| Total pretax share-based compensation expense included in net income (loss) | | $ | 8,787 | | | $ | 7,035 | | | $ | 2,086 | |
| Income tax benefit related to share-based compensation included in net income (loss) | | $ | 3,401 | | | $ | 3,198 | | | $ | 782 | |
Stock Options
The following table sets forth stock option activity for the year ended December 31, 2007:
(Shares reported in whole numbers and not in thousands)
| | | | | | | | | |
| | | | | | Weighted-Average
| |
| | | Options | | | Exercise Price | |
| |
| Outstanding at December 31, 2006 | | | 22,531,316 | | | $ | 7.79 | |
| Granted | | | 2,234,900 | | | | 10.86 | |
| Exercised | | | (7,732,382 | ) | | | 6.83 | |
| Forfeited | | | (17,600 | ) | | | 10.73 | |
| Expired | | | (3,447,789 | ) | | | 17.95 | |
| | | | | | | | | |
| Outstanding at December 31, 2007 | | | 13,568,445 | | | $ | 6.25 | |
| | | | | | | | | |
| Exercisable at December 31, 2007 | | | 10,068,822 | | | $ | 5.05 | |
| | | | | | | | | |
92
SERVICE CORPORATION INTERNATIONAL
NOTES TO CONSOLIDATED FINANCIAL STATEMENTS — (Continued)
As of December 31, 2007, the aggregate intrinsic value for stock options outstanding and exercisable was $106.7 million and $91.4 million, respectively. Set forth below is certain information related to stock options outstanding and exercisable at December 31, 2007:
(Shares reported in whole numbers and not in thousands)
| | | | | | | | | | | | | | | | | | | | | |
| | | Options Outstanding | | | Options Exercisable | |
| | | Number
| | | Weighted-
| | | | | | Number
| | | | |
| | | Outstanding at
| | | Average
| | | Weighted-
| | | Exercisable at
| | | Weighted-
| |
Range of
| | December 31,
| | | Remaining
| | | Average
| | | December 31,
| | | Average
| |
Exercise Price | | 2007 | | | Contractual Life | | | Exercise Price | | | 2007 | | | Exercise Price | |
| |
| $0.00 — 4.00 | | | 4,719,000 | | | | 1.2 | | | $ | 3.60 | | | | 4,719,000 | | | $ | 3.60 | |
| 4.01 — 6.00 | | | 3,425,000 | | | | 2.1 | | | | 4.97 | | | | 3,425,000 | | | | 4.97 | |
| 6.01 — 9.00 | | | 2,986,722 | | | | 5.5 | | | | 7.57 | | | | 1,606,399 | | | | 7.29 | |
| 9.01 — 15.00 | | | 2,175,300 | | | | 7.2 | | | | 10.87 | | | | 56,000 | | | | 10.73 | |
| 15.01 — 38.00 | | | 262,423 | | | | 1.5 | | | | 17.20 | | | | 262,423 | | | | 17.20 | |
| | | | | | | | | | | | | | | | | | | | | |
| $0.00 — 38.00 | | | 13,568,445 | | | | 3.3 | | | $ | 6.25 | | | | 10,068,822 | | | $ | 5.05 | |
| | | | | | | | | | | | | | | | | | | | | |
Other information pertaining to option activity during the years ended December 31 was as follows:
| | | | | | | | | | | | | |
| | | 2007 | | | 2006 | | | 2005 | |
| |
| Weighted average grant-date fair value of stock options granted (valued using Black-Scholes model) | | $ | 4.35 | | | $ | 3.11 | | | $ | 2.71 | |
| Total fair value of stock options vested | | $ | 3,965 | | | $ | 1,987 | | | $ | 6,003 | |
| Total intrinsic value of stock options exercised | | $ | 47,800 | | | $ | 6,448 | | | $ | 7,523 | |
We calculated our historical pool of windfall tax benefits by comparing the book expense for individual stock grants and the related tax deduction for options granted after January 1, 1995. Adjustments were made to exclude windfall tax benefits that were not realized due to our net operating loss position prior to December 31, 2006. Upon completion of this calculation, we determined an additional paid in capital pool of $2.1 million. The tax benefits realized from stock option exercises in 2007 was $18.5 million.
For the years ended December 31, 2007 and 2006, cash received from the exercise of stock options was $52.9 million and $5.9 million, respectively. We recognized compensation cost of $5.4 million and $4.0 million related to stock options in the years ended December 31, 2007 and 2006, respectively. As of December 31, 2007, the unrecognized compensation expense related to stock options of $7.8 million is expected to be recognized over a weighted average period of 1.7 years.
Restricted Shares
Restricted shares awarded under the Amended 1996 Incentive Plan were 313,800 in 2007 and 359,900 in 2006. The weighted average fair market value per share at the date of grant for shares granted during 2007 and 2006 was $10.73 and $8.24, respectively. The fair market value of the stock, as determined on the grant date, is being amortized and charged to income (with an offsetting credit toCapital in excess of par value) generally over the average period during which the restrictions lapse. At December 31, 2007, unrecognized compensation expense of $3.3 million related to restricted shares, which is recorded inCapital in excess of par valueon the balance sheet, is expected to be recognized over a weighted average period of 1.3 years. Prior to the implementation of SFAS 123R, we recorded this compensation asUnrecognized compensationon the balance sheet. We recognized compensation cost of $3.4 million, $3.0 million, and $2.1 million in the years ended December 31, 2007, 2006, and 2005, respectively, related to the restricted shares of this Plan.
93
SERVICE CORPORATION INTERNATIONAL
NOTES TO CONSOLIDATED FINANCIAL STATEMENTS — (Continued)
Restricted share activity was as follows:
(Shares reported in whole numbers)
| | | | | | | | | |
| | | | | | Weighted-Average
| |
| | | Restricted
| | | Grant-Date
| |
| | | Shares | | | Fair Value | |
| |
| Nonvested restricted shares at December 31, 2006 | | | 795,176 | | | $ | 7.50 | |
| Granted | | | 313,800 | | | $ | 10.73 | |
| Vested | | | (434,400 | ) | | $ | 7.41 | |
| Nonvested restricted shares at December 31, 2007 | | | | | | | 674,576 | |
| | | | | | | | | |
Prior to termination in the fourth quarter of 2007, we had a non-contributory defined benefit pension plan covering employees in the United States (U.S. Pension Plan). We currently have a supplemental retirement plan for certain current and former key employees (SERP), a supplemental retirement plan for officers and certain key employees (Senior SERP), a retirement plan for certain non-employee directors (Directors’ Plan), the Employees Retirement Plan of Rose Hills, the Retirement Plan for Rose Hills Trustees, and the Rose Hills Supplemental Retirement Plan (collectively, the “Plans”). We also provide a 401(k) employee savings plan.
Effective January 1, 2001, we curtailed our U.S. Pension Plan, SERP, Senior SERP, and Directors’ Plan. Additionally, the plans assumed in connection with the Alderwoods acquisition are frozen. As the Plans have been frozen, the participants do not earn incremental benefits from additional years of service and have not incurred new service cost after December 31, 2000.
Retirement benefits under the SERP are based on years of service and average monthly compensation, reduced by benefits under the US Pension Plan and Social Security. The Senior SERP provides retirement benefits based on years of service and position. The Directors’ Plan provides for an annual benefit to directors following retirement, based on a vesting schedule.
The components of the Plans’ net periodic benefit cost for the years ended December 31 were as follows:
| | | | | | | | | | | | | |
| | | 2007 | | | 2006 | | | 2005 | |
| | | (In thousands) | |
| |
| Interest cost on projected benefit obligation | | $ | 6,559 | | | $ | 7,348 | | | $ | 8,111 | |
| Actual return on plan assets | | | (5,483 | ) | | | (6,829 | ) | | | (7,226 | ) |
| Amortization of prior service cost | | | 168 | | | | 183 | | | | 183 | |
| Recognized net actuarial loss | | | 3,052 | | | | 2,961 | | | | 8,124 | |
| Plan dissolution and other | | | 11,176 | | | | — | | | | — | |
| | | | | | | | | | | | | |
| | | $ | 15,472 | | | $ | 3,663 | | | $ | 9,192 | |
| | | | | | | | | | | | | |
94
SERVICE CORPORATION INTERNATIONAL
NOTES TO CONSOLIDATED FINANCIAL STATEMENTS — (Continued)
The Plans’ funded status at December 31 was as follows (based on valuations as of September 30):
| | | | | | | | | |
| | | 2007 | | | 2006 | |
| | | (In thousands) | |
| |
Change in Benefit Obligation: | | | | | | | | |
| Benefit obligation at beginning of year | | $ | 150,124 | | | $ | 137,252 | |
| Acquisition | | | — | | | | 20,183 | |
| Interest cost | | | 6,559 | | | | 7,348 | |
| Actuarial loss | | | 11,558 | | | | 2,644 | |
| Benefits paid | | | (64,034 | ) | | | (17,303 | ) |
| | | | | | | | | |
| Benefit obligation at end of year | | $ | 104,207 | | | $ | 150,124 | |
| | | | | | | | | |
Change in Plan Assets: | | | | | | | | |
| Fair value of plan assets at beginning of year | | $ | 84,686 | | | $ | 80,803 | |
| Acquisition | | | — | | | | 10,746 | |
| Actual return on plan assets | | | 5,483 | | | | 6,829 | |
| Employer contributions | | | 41,894 | | | | 3,928 | |
| Benefits paid, including expenses | | | (64,959 | ) | | | (17,620 | ) |
| | | | | | | | | |
| Fair value of plan assets at end of year | | $ | 67,104 | | | $ | 84,686 | |
| | | | | | | | | |
| Funded status of plan | | $ | (37,103 | ) | | $ | (65,438 | ) |
| Adoption of SFAS 158 | | | — | | | | 623 | |
| | | | | | | | | |
| Net amount recognized in the Consolidated Balance Sheet | | $ | (37,103 | ) | | $ | (64,815 | ) |
| | | | | | | | | |
Funding Summary: | | | | | | | | |
| Projected benefit obligations | | $ | 104,207 | | | $ | 150,124 | |
| Accumulated benefit obligation | | $ | 104,207 | | | $ | 150,124 | |
| Fair value of plan assets | | $ | 67,104 | | | $ | 84,686 | |
Amounts recognized in the Consolidated Balance Sheet: | | | | | | | | |
| Accrued benefit liability | | $ | (37,103 | ) | | $ | (65,438 | ) |
| Accumulated other comprehensive income | | | — | | | | 623 | |
| | | | | | | | | |
| Net amount recognized in the Consolidated Balance Sheet | | $ | (37,103 | ) | | $ | (64,815 | ) |
| | | | | | | | | |
The retirement benefits under the SERP, Senior SERP, Directors’ Plan, the Rose Hills Trustee Plan, and the Rose Hills SERP Plan are unfunded obligations of the Company. As of December 31, 2007 and 2006, the benefit obligation of the SERP, Senior SERP, and Directors’ Plan (excluding the Rose Hills SERP) was $27.7 million and $29.0 million, respectively. We have purchased various life insurance policies on the participants in the Senior SERP with the intent to use the proceeds or any cash value buildup from such policies to assist in meeting, at least to the extent of such assets, the plan’s funding requirements. The face value of these insurance policies at December 31, 2007 and 2006 was $59.5 million and $55.7 million, respectively, and the cash surrender value was $42.0 million and $38.7 million as of December 31, 2007 and 2006, respectively. No loans are outstanding against the policies, but there are no restrictions in the policies regarding loans.
The Plans’ weighted-average assumptions used to determine the benefit obligation and net benefit cost were as follows: We base our discount rate used to compute future benefit obligations using an analysis of expected future benefit payments. The reasonableness of our discount rate is verified by comparing the rate to the rate earned on high-quality fixed income investments, such as the Moody’s Aa index, on high-quality fixed income investments plus 50 basis points. Weighted-average discount rates used to determine pension obligations for the Plans were
95
SERVICE CORPORATION INTERNATIONAL
NOTES TO CONSOLIDATED FINANCIAL STATEMENTS — (Continued)
5.64%, 5.55%, and 5.75% for the years ended 2007, 2006, and 2005, respectively. The assumed rate of return on plan assets was not applicable as we recognize gains and losses on plan assets during the year in which they occur. As all Plans are curtailed, the assumed rate of compensation increase is zero.
| | | | | | | | | | | | | |
| | | 2007 | | | 2006 | | | 2005 | |
| |
| Discount rate used to determine obligations | | | 5.64 | % | | | 5.55 | % | | | 5.75 | % |
| Assumed rate of return on plan assets | | | n/a | | | | n/a | | | | n/a | |
| Discount rate used to determine net periodic pension cost | | | 5.53 | % | | | 5.75 | % | | | 6.00 | % |
The Plans’ weighted-average asset allocations at December 31 by asset category are as follows:
| | | | | | | | | |
| | | 2007 | | | 2006 | |
| |
| Cash and cash equivalents | | | 2 | % | | | 55 | % |
| Fixed income investments | | | 62 | % | | | 10 | % |
| Equity securities(1) | | | 36 | % | | | 35 | % |
| | | | | | | | | |
| Total | | | 100 | % | | | 100 | % |
| | | | | | | | | |
| | |
| (1) | | Equity securities do not include shares of our common stock at December 31, 2007 or 2006. |
Our non-contributory, defined benefit pension plan covering approximately 34% of our United States employees was terminated in December 2007. The revaluation of projected benefit obligation (PBO) on a plan termination basis resulted in an additional PBO of $4.7 million. On the asset side, the fund experienced a negative actual return in the fourth quarter and paid expenses from the fund, the total of which was $0.5 million. In 2007 we made a contribution of $38.8 million to fully fund the plan bringing the value of assets to $56.4 million prior to adjusting for benefits paid and settlement of the obligation. To effect the termination of the plan, we settled all remaining obligations in December 2007. Monthly annuities paid were $0.8 million for the fourth quarter, lump sums paid were $14.4 million, and the total annuity purchase for remaining obligations was $41.2 million for a total of $56.4 million. Of this, the lump sums paid and annuity purchases totaling $55.6 million were considered settlements under FAS 88. After all fourth quarter FAS 88 adjustments were made, the outstanding balances of our PBO and accumulated other comprehensive income related to the U.S. Pension Plan are $0.
The following Plan benefit payments are expected to be paid (assuming no plan terminations):
| | | | | |
| 2008(1) | | $ | 4,017 | |
| 2009 | | | 4,386 | |
| 2010 | | | 4,946 | |
| 2011 | | | 4,671 | |
| 2012 | | | 4,656 | |
| Years 2013 through 2017 | | | 20,603 | |
| | |
| (1) | | Included in the $4.0 million expected benefit payments for 2008 is $3.2 million we expect to contribute for the SERP, Senior SERP, Directors’ Plan, Rose Hills Retirement Plan for Trustees, and Rose Hills SERP expected benefit payments. |
On December 31, 2006, we adopted FASB Statement No. 158 —Employers’ Accounting for Defined Benefit Pension and Other Postretirement Plans.The objective of the Statement is to improve financial reporting by requiring an employer to recognize the funded status of a benefit plan — measured as the difference between plan assets at fair value and the projected benefit obligation — in its statement of financial position. SFAS 158 requires an employer to recognize as a component of other comprehensive income, net of tax, the gains and losses and prior service costs or credits that arise during the period which were not recognized as components of net periodic benefit
96
SERVICE CORPORATION INTERNATIONAL
NOTES TO CONSOLIDATED FINANCIAL STATEMENTS — (Continued)
costs pursuant to FASB Statement No. 87,Employers’ Accounting for Pensions, or No. 106,Employers Accounting for Postretirement Benefits Other Than Pension.
The Statement calls for measuring the defined benefit plan assets and obligations as of the date of the employer’s fiscal year-end statement of financial position. The requirement to change the measurement date is effective for fiscal years ending after December 15, 2008. All of the Plans have a measurement date of December 31.
The unfunded status of the pension plan had been recognized as a non-current liability prior to the adoption of SFAS 158. At year end December 31, 2007 and 2006, the unfunded status was $37.1 million and $64.8 million, respectively.
We have an employee savings plan that qualifies under section 401(k) of the Internal Revenue Code for the exclusive benefit of our United States employees. Under the plan, participating employees may contribute a portion of their pretaxand/or after tax income in accordance with specified guidelines up to a maximum of 50%. During 2007, 2006, and 2005, we matched a percentage of the employee contributions through contributions of cash. For each of the three years, our matching contribution was based upon the following:
| | | |
Years of Vesting Service | | Percentage of Deferred Compensation |
| |
| 0 — 5 years | | 75% of the first 6% of deferred compensation |
| 6 — 10 years | | 110% of the first 6% of deferred compensation |
| 11 or more years | | 135% of the first 6% of deferred compensation |
The amount of our matched contributions in 2007, 2006, and 2005 was $17.0 million, $16.8 million and $16.5 million, respectively.
Our operations are both product based and geographically based, and the reportable operating segments presented below include our funeral and cemetery operations. Our geographic areas include United States and Foreign.
Alderwoods operating results are included in our full-year 2007 results and since November 28, 2006 for the year ended December 31, 2006. Please refer to Note 4 for pro forma presentations related to the Alderwoods acquisition for 2006.
Foreign operations consists of our operations in Canada and Germany. Results from our funeral and cemetery businesses in Argentina and Uruguay, which were sold in the first quarter of 2005, our cemetery business in Chile, which was sold in the third quarter of 2005, and our funeral business in Singapore, which was sold in the fourth quarter of 2006, are classified as discontinued operations for all periods presented. We conduct both funeral and cemetery operations in the United States and Canada and funeral operations in Germany.
97
SERVICE CORPORATION INTERNATIONAL
NOTES TO CONSOLIDATED FINANCIAL STATEMENTS — (Continued)
Our reportable segment information is as follows:
| | | | | | | | | | | | | |
| | | | | | | | | Reportable
| |
| | | Funeral | | | Cemetery | | | Segments | |
| | | (In thousands) | |
| |
2007 | | | | | | | | | | | | |
| Revenues from external customers | | $ | 1,525,349 | | | $ | 759,954 | | | $ | 2,285,303 | |
| Interest expense | | | 6,897 | | | | 1,837 | | | | 8,734 | |
| Depreciation and amortization | | | 100,451 | | | | 25,457 | | | | 125,908 | |
| Gross profit | | | 308,626 | | | | 159,874 | | | | 468,500 | |
| Amortization of cemetery property | | | — | | | | 35,824 | | | | 35,824 | |
| Total assets | | | 4,245,164 | | | | 4,262,264 | | | | 8,507,428 | |
| Capital expenditures | | | 77,625 | | | | 78,777 | | | | 156,402 | |
2006 | | | | | | | | | | | | |
| Revenues from external customers | | $ | 1,161,762 | | | $ | 591,126 | | | $ | 1,752,888 | |
| Interest expense | | | 6,384 | | | | 2,468 | | | | 8,852 | |
| Depreciation and amortization | | | 69,036 | | | | 18,037 | | | | 87,073 | |
| Gross profit | | | 241,963 | | | | 108,298 | | | | 350,261 | |
| Amortization of cemetery property | | | — | | | | 28,263 | | | | 28,263 | |
| Total assets | | | 4,505,437 | | | | 4,575,424 | | | | 9,080,861 | |
| Capital expenditures | | | 38,031 | | | | 53,506 | | | | 91,537 | |
2005 | | | | | | | | | | | | |
| Revenues from external customers | | $ | 1,156,627 | | | $ | 560,380 | | | $ | 1,717,007 | |
| Interest expense | | | 4,124 | | | | 1,539 | | | | 5,663 | |
| Depreciation and amortization | | | 49,529 | | | | 17,828 | | | | 67,357 | |
| Gross profit | | | 221,121 | | | | 81,921 | | | | 303,042 | |
| Amortization of cemetery property | | | — | | | | 27,505 | | | | 27,505 | |
| Total assets | | | 3,360,546 | | | | 3,600,473 | | | | 6,961,019 | |
| Capital expenditures | | | 48,153 | | | | 46,756 | | | | 94,909 | |
98
SERVICE CORPORATION INTERNATIONAL
NOTES TO CONSOLIDATED FINANCIAL STATEMENTS — (Continued)
The following table reconciles certain reportable segment amounts to our corresponding consolidated amounts:
| | | | | | | | | | | | | | | | | |
| | | Reportable
| | | | | | Discontinued
| | | | |
| | | Segments | | | Corporate | | | Operations | | | Consolidated | |
| | | (In thousands) | |
| |
2007 | | | | | | | | | | | | | | | | |
| Revenue from external customers | | $ | 2,285,303 | | | $ | — | | | $ | — | | | $ | 2,285,303 | |
| Interest expense | | | 8,734 | | | | 138,120 | | | | — | | | | 146,854 | |
| Depreciation and amortization | | | 125,908 | | | | 4,521 | | | | — | | | | 130,429 | |
| Total assets | | | 8,507,428 | | | | 424,816 | | | | — | | | | 8,932,244 | |
| Capital expenditures | | | 156,402 | | | | 609 | | | | — | | | | 157,011 | |
2006 | | | | | | | | | | | | | | | | |
| Revenue from external customers | | $ | 1,752,888 | | | $ | — | | | $ | — | | | $ | 1,752,888 | |
| Interest expense | | | 8,852 | | | | 114,547 | | | | — | | | | 123,399 | |
| Depreciation and amortization | | | 87,073 | | | | 9,611 | | | | — | | | | 96,684 | |
| Total assets | | | 9,080,861 | | | | 275,160 | | | | 373,368 | | | | 9,729,389 | |
| Capital expenditures | | | 91,537 | | | | 5,990 | | | | — | | | | 97,527 | |
2005 | | | | | | | | | | | | | | | | |
| Revenue from external customers | | $ | 1,717,007 | | | $ | — | | | $ | — | | | $ | 1,717,007 | |
| Interest expense | | | 5,663 | | | | 98,070 | | | | — | | | | 103,733 | |
| Depreciation and amortization | | | 67,357 | | | | 7,509 | | | | — | | | | 74,866 | |
| Total assets | | | 6,961,019 | | | | 583,750 | | | | — | | | | 7,544,769 | |
| Capital expenditures | | | 94,909 | | | | 3,696 | | | | — | | | | 98,605 | |
The following table reconciles gross profits from reportable segments shown above to our consolidated income from continuing operations before income taxes and cumulative effects of accounting changes:
| | | | | | | | | | | | | |
| | | 2007 | | | 2006 | | | 2005 | |
| | | (In thousands) | |
| |
| Gross profit from reportable segments | | $ | 468,500 | | | $ | 350,261 | | | $ | 303,042 | |
| General and administrative expenses | | | (137,406 | ) | | | (94,900 | ) | | | (84,834 | ) |
| Gains (losses) on dispositions and impairment charges, net | | | 16,920 | | | | (58,683 | ) | | | (26,093 | ) |
| Other operating expense | | | (1,848 | ) | | | — | | | | — | |
| | | | | | | | | | | | | |
| Operating income | | | 346,166 | | | | 196,678 | | | | 192,115 | |
| Interest expense | | | (146,854 | ) | | | (123,399 | ) | | | (103,733 | ) |
| Interest income | | | 11,725 | | | | 31,171 | | | | 16,706 | |
| Loss on early extinguishment of debt | | | (14,986 | ) | | | (17,532 | ) | | | (14,258 | ) |
| Equity in earnings of unconsolidated subsidiaries | | | 36,607 | | | | 1,052 | | | | — | |
| Gain on redemption of securities | | | 158,133 | | | | 10,932 | | | | — | |
| Other expense, net | | | (3,804 | ) | | | (1,453 | ) | | | (3,703 | ) |
| | | | | | | | | | | | | |
| Income from continuing operations before income taxes and cumulative effect of accounting changes | | $ | 386,987 | | | $ | 97,449 | | | $ | 87,127 | |
| | | | | | | | | | | | | |
99
SERVICE CORPORATION INTERNATIONAL
NOTES TO CONSOLIDATED FINANCIAL STATEMENTS — (Continued)
Our geographic area information was as follows:
| | | | | | | | | | | | | |
| | | United States | | | Foreign | | | Total | |
| | | (In thousands) | |
| |
2007 | | | | | | | | | | | | |
| Revenues from external customers | | $ | 2,079,088 | | | $ | 206,215 | | | $ | 2,285,303 | |
| Interest expense | | | (146,632 | ) | | | (222 | ) | | | (146,854 | ) |
| Depreciation and amortization | | | 116,071 | | | | 14,358 | | | | 130,429 | |
| Amortization of cemetery property | | | 31,454 | | | | 4,370 | | | | 35,824 | |
| Operating income | | | 318,348 | | | | 27,818 | | | | 346,166 | |
| Gains (losses) on dispositions and impairment charges, net | | | 18,942 | | | | (2,022 | ) | | | 16,920 | |
| Long-lived assets | | $ | 4,161,000 | | | $ | 581,713 | | | $ | 4,742,713 | |
2006 | | | | | | | | | | | | |
| Revenues from external customers | | $ | 1,630,680 | | | $ | 122,208 | | | $ | 1,752,888 | |
| Interest expense | | | 123,112 | | | | 287 | | | | 123,399 | |
| Depreciation and amortization | | | 88,908 | | | | 7,776 | | | | 96,684 | |
| Amortization of cemetery property | | | 25,829 | | | | 2,434 | | | | 28,263 | |
| Operating income | | | 178,943 | | | | 17,735 | | | | 196,678 | |
| Gains (losses) on dispositions and impairment charges, net | | | (56,710 | ) | | | (1,973 | ) | | | (58,683 | ) |
| Long-lived assets | | $ | 5,043,144 | | | $ | 514,718 | | | $ | 5,557,862 | |
2005 | | | | | | | | | | | | |
| Revenues from external customers | | $ | 1,602,419 | | | $ | 114,588 | | | $ | 1,717,007 | |
| Interest expense | | | 103,650 | | | | 83 | | | | 103,733 | |
| Depreciation and amortization | | | 69,791 | | | | 5,075 | | | | 74,866 | |
| Amortization of cemetery property | | | 24,167 | | | | 3,338 | | | | 27,505 | |
| Operating income | | | 167,783 | | | | 24,332 | | | | 192,115 | |
| Gains (losses) on dispositions and impairment charges, net | | | (27,597 | ) | | | 1,504 | | | | (26,093 | ) |
| Long-lived assets | | $ | 3,433,506 | | | $ | 245,791 | | | $ | 3,679,297 | |
100
SERVICE CORPORATION INTERNATIONAL
NOTES TO CONSOLIDATED FINANCIAL STATEMENTS — (Continued)
| |
| 18. | Supplementary Information |
The detail of certain balance sheet accounts is as follows:
| | | | | | | | | |
| | | December 31, | |
| | | 2007 | | | 2006 | |
| | | (In thousands) | |
| |
| Cash and cash equivalents: | | | | | | | | |
| Cash | | $ | 42,928 | | | $ | 14,883 | |
| Commercial paper and temporary investments | | | 125,666 | | | | 24,997 | |
| | | | | | | | | |
| | | $ | 168,594 | | | $ | 39,880 | |
| | | | | | | | | |
| Receivables, net: | | | | | | | | |
| Notes receivable | | $ | 4,753 | | | $ | 6,144 | |
| Atneed funeral receivables, net | | | 82,734 | | | | 82,450 | |
| Atneed cemetery receivables, net | | | 16,068 | | | | 6,869 | |
| Other | | | 10,238 | | | | 11,731 | |
| | | | | | | | | |
| | | $ | 113,793 | | | $ | 107,194 | |
| | | | | | | | | |
| Other current assets: | | | | | | | | |
| Income tax receivable | | $ | 2,255 | | | $ | 7,998 | |
| Prepaid insurance | | | 4,932 | | | | 4,741 | |
| Other | | | 20,074 | | | | 30,423 | |
| | | | | | | | | |
| | | $ | 27,261 | | | $ | 43,162 | |
| | | | | | | | | |
| Cemetery property: | | | | | | | | |
| Undeveloped land | | $ | 1,078,322 | | | $ | 1,136,334 | |
| Developed land, lawn crypts and mausoleums | | | 373,344 | | | | 358,914 | |
| | | | | | | | | |
| | | $ | 1,451,666 | | | $ | 1,495,248 | |
| | | | | | | | | |
| Property and equipment: | | | | | | | | |
| Land | | $ | 494,715 | | | $ | 516,256 | |
| Buildings and improvements | | | 1,355,324 | | | | 1,337,286 | |
| Operating equipment | | | 464,153 | | | | 414,670 | |
| Leasehold improvements | | | 24,314 | | | | 26,493 | |
| | | | | | | | | |
| | | | 2,338,506 | | | | 2,294,705 | |
| Less: accumulated depreciation | | | (768,972 | ) | | | (653,352 | ) |
| | | | | | | | | |
| | | $ | 1,569,534 | | | $ | 1,641,353 | |
| | | | | | | | | |
| Deferred charges and other assets: | | | | | | | | |
| Prepaid covenants-not-to-compete, net | | $ | 58,640 | | | $ | 68,850 | |
| Investments, net | | | 4,560 | | | | 4,839 | |
| Preneed backlog intangible assets | | | 40,900 | | | | 86,640 | |
| Other intangible assets, net | | | 77,321 | | | | 79,886 | |
| Restricted cash | | | 23,658 | | | | 7,354 | |
| Notes receivable, net | | | 25,172 | | | | 28,042 | |
| Cash surrender value of insurance policies | | | 75,385 | | | | 61,405 | |
| Other | | | 95,098 | | | | 99,529 | |
| | | | | | | | | |
| | | $ | 400,734 | | | $ | 436,545 | |
| | | | | | | | | |
Included inReceivables, neton our consolidated balance sheet are funeral and cemetery atneed allowances for doubtful accounts of approximately $19.5 million and $25.8 million at December 31, 2007 and 2006, respectively.
101
SERVICE CORPORATION INTERNATIONAL
NOTES TO CONSOLIDATED FINANCIAL STATEMENTS — (Continued)
| | | | | | | | | |
| | | December 31, | |
| | | 2007 | | | 2006 | |
| | | (In thousands) | |
| |
| Accounts payable and accrued liabilities: | | | | | | | | |
| Accounts payable | | $ | 53,739 | | | $ | 75,037 | |
| Accrued compensation | | | 59,389 | | | | 57,153 | |
| Restructuring liability | | | 3,059 | | | | 7,564 | |
| Accrued dividend | | | 10,585 | | | | 8,788 | |
| Accrued interest | | | 26,101 | | | | 25,805 | |
| Self insurance | | | 69,914 | | | | 67,698 | |
| Accrued trust expenses | | | 10,066 | | | | 11,069 | |
| Bank overdraft | | | 27,689 | | | | 20,480 | |
| Other accrued liabilities | | | 82,850 | | | | 67,579 | |
| | | | | | | | | |
| | | $ | 343,392 | | | $ | 341,173 | |
| | | | | | | | | |
| Other liabilities: | | | | | | | | |
| Accrued pension | | $ | 37,103 | | | $ | 65,438 | |
| Deferred compensation | | | 24,105 | | | | 15,565 | |
| Customer refund obligation reserve | | | 93,626 | | | | 83,951 | |
| Tax liability | | | 146,995 | | | | 104,874 | |
| Indemnification liability | | | 27,532 | | | | 26,364 | |
| Other | | | 54,281 | | | | 61,226 | |
| | | | | | | | | |
| | | $ | 383,642 | | | $ | 357,418 | |
| | | | | | | | | |
102
SERVICE CORPORATION INTERNATIONAL
NOTES TO CONSOLIDATED FINANCIAL STATEMENTS — (Continued)
Revenues and Costs and Expenses
The detail of certain income statement accounts in thousands is as follows for the years ended December 31,
| | | | | | | | | | | | | |
| | | 2007 | | | 2006 | | | 2005 | |
| | | (In thousands) | |
| |
| Merchandise revenues: | | | | | | | | | | | | |
| Funeral | | $ | 515,944 | | | $ | 424,786 | | | $ | 504,415 | |
| Cemetery | | | 519,066 | | | | 391,231 | | | | 381,047 | |
| | | | | | | | | | | | | |
| Total merchandise revenues | | | 1,035,010 | | | | 816,017 | | | | 885,462 | |
| | | | | | | | | | | | | |
| Services revenues: | | | | | | | | | | | | |
| Funeral | | | 962,854 | | | | 700,506 | | | | 617,760 | |
| Cemetery | | | 207,007 | | | | 170,523 | | | | 146,060 | |
| | | | | | | | | | | | | |
| Total services revenues | | | 1,169,861 | | | | 871,029 | | | | 763,820 | |
| | | | | | | | | | | | | |
| Other revenues | | | 80,432 | | | | 65,842 | | | | 67,725 | |
| | | | | | | | | | | | | |
| Total revenues | | $ | 2,285,303 | | | $ | 1,752,888 | | | $ | 1,717,007 | |
| | | | | | | | | | | | | |
| | | | | | | | | | | | | |
| Merchandise costs and expenses: | | | | | | | | | | | | |
| Funeral | | $ | 256,753 | | | $ | 198,053 | | | $ | 196,015 | |
| Cemetery | | | 205,629 | | | | 161,157 | | | | 158,785 | |
| | | | | | | | | | | | | |
| Total cost of merchandise | | | 462,382 | | | | 359,210 | | | | 354,800 | |
| | | | | | | | | | | | | |
| Services costs and expenses: | | | | | | | | | | | | |
| Funeral | | | 473,559 | | | | 353,117 | | | | 375,840 | |
| Cemetery | | | 112,175 | | | | 93,881 | | | | 96,917 | |
| | | | | | | | | | | | | |
| Total cost of services | | | 585,734 | | | | 446,998 | | | | 472,757 | |
| | | | | | | | | | | | | |
| Overhead and other expenses | | | 768,687 | | | | 596,419 | | | | 586,408 | |
| | | | | | | | | | | | | |
| Total cost and expenses | | $ | 1,816,803 | | | $ | 1,402,627 | | | $ | 1,413,965 | |
| | | | | | | | | | | | | |
Certain Non-Cash Transactions
| | | | | | | | | | | | | |
| | | Years Ended December 31, | |
| | | 2007 | | | 2006 | | | 2005 | |
| | | (In thousands) | |
| |
| Value of StoneMor partnership units received in disposition | | $ | — | | | $ | 5,875 | | | $ | 5,900 | |
| Dividends accrued but not paid | | $ | 10,585 | | | $ | 8,788 | | | $ | 7,415 | |
Basic earnings (loss) per common share (EPS) excludes dilution and is computed by dividing net income (loss) by the weighted average number of common shares outstanding for the period. Diluted EPS reflects the potential dilution that could occur if securities or other obligations to issue common stock were exercised or converted into common stock or resulted in the issuance of common stock that then shared in our earnings (losses).
103
SERVICE CORPORATION INTERNATIONAL
NOTES TO CONSOLIDATED FINANCIAL STATEMENTS — (Continued)
A reconciliation of the numerators and denominators of the basic and diluted EPS for the three years ended December 31 is presented below:
| | | | | | | | | | | | | |
| | | 2007 | | | 2006 | | | 2005 | |
| | | (In thousands, except per share amounts) | |
| |
| Income from continuing operations before cumulative effect of accounting changes (numerator): | | | | | | | | | | | | |
| Income from continuing operations before cumulative effect of accounting changes — basic | | $ | 243,317 | | | $ | 52,604 | | | $ | 55,091 | |
| After tax interest on convertible debt | | | 179 | | | | — | | | | — | |
| | | | | | | | | | | | | |
| Income from continuing operations before cumulative effect of accounting changes — diluted | | $ | 243,496 | | | $ | 52,604 | | | $ | 55,091 | |
| | | | | | | | | | | | | |
| Income from discontinued operations, net of tax | | $ | 4,412 | | | $ | 3,907 | | | $ | 4,506 | |
| Cumulative effect of accounting changes, net of tax | | $ | — | | | $ | — | | | $ | (187,538 | ) |
| | | | | | | | | | | | | |
| Net income (loss) (numerator): | | | | | | | | | | | | |
| Net income (loss) — basic | | $ | 247,729 | | | $ | 56,511 | | | $ | (127,941 | ) |
| After tax interest on convertible debt | | | 179 | | | | — | | | | — | |
| | | | | | | | | | | | | |
| Net (loss) income — diluted | | $ | 247,908 | | | $ | 56,511 | | | $ | (127,941 | ) |
| | | | | | | | | | | | | |
| Weighted average shares (denominator): | | | | | | | | | | | | |
| Weighted average shares — basic | | | 284,966 | | | | 292,859 | | | | 302,213 | |
| Stock options | | | 5,002 | | | | 4,317 | | | | 4,399 | |
| Convertible debt | | | 235 | | | | — | | | | — | |
| Restricted stock | | | 241 | | | | 195 | | | | 133 | |
| | | | | | | | | | | | | |
| Weighted average shares — diluted | | | 290,444 | | | | 297,371 | | | | 306,745 | |
| | | | | | | | | | | | | |
| Income per share from continuing operations before cumulative effect of accounting changes: | | | | | | | | | | | | |
| Basic | | $ | .85 | | | $ | .18 | | | $ | .18 | |
| Diluted | | $ | .83 | | | $ | .18 | | | $ | .18 | |
| Income per share from discontinued operations, net of tax: | | | | | | | | | | | | |
| Basic | | $ | .02 | | | $ | .01 | | | $ | .02 | |
| Diluted | | $ | .02 | | | $ | .01 | | | $ | .01 | |
| Cumulative effect of accounting changes per share, net of tax: | | | | | | | | | | | | |
| Basic | | $ | — | | | $ | — | | | $ | (.62 | ) |
| Diluted | | $ | — | | | $ | — | | | $ | (.61 | ) |
| Net income (loss) per share: | | | | | | | | | | | | |
| Basic | | $ | .87 | | | $ | .19 | | | $ | (.42 | ) |
| Diluted | | $ | .85 | | | $ | .19 | | | $ | (.42 | ) |
The computation of diluted earnings (loss) per share excludes outstanding stock options and convertible debt in certain periods in which the inclusion of such options and debt would be antidilutive in the periods presented. Total
104
SERVICE CORPORATION INTERNATIONAL
NOTES TO CONSOLIDATED FINANCIAL STATEMENTS — (Continued)
options and convertible debentures not currently included in the computation of dilutive earnings (loss) per share for the respective periods are as follows (in shares):
| | | | | | | | | | | | | |
| | | 2007 | | | 2006 | | | 2005 | |
| |
| Antidilutive options | | | 205 | | | | 5,420 | | | | 7,039 | |
| Antidilutive convertible debentures | | | 52 | | | | 602 | | | | 644 | |
| | | | | | | | | | | | | |
| Total common stock equivalents excluded from computations | | | 257 | | | | 6,022 | | | | 7,683 | |
| | | | | | | | | | | | | |
| |
| 20. | Divestiture-Related Activities |
As dispositions occur in the normal course of business, gains or losses on the sale of such businesses are recognized in the income statement line item Gains (losses) on dispositions and impairment charges, net.Additionally, as dispositions occur pursuant to our ongoing asset sale programs, adjustments are made through this income statement line item to reflect the difference between actual proceeds received from the sale compared to the original estimates.
Gains (losses) on dispositions and impairment charges, netconsists of the following for the years ended December 31:
| | | | | | | | | | | | | |
| | | 2007 | | | 2006 | | | 2005 | |
| | | (In thousands) | |
| |
| Gains (losses) on dispositions, net | | $ | 30,083 | | | $ | (18,726 | ) | | $ | 68,167 | |
| Impairment losses on assets held for sale | | | (13,163 | ) | | | (39,957 | ) | | | (94,260 | ) |
| | | | | | | | | | | | | |
| | | $ | 16,920 | | | $ | (58,683 | ) | | $ | (26,093 | ) |
| | | | | | | | | | | | | |
Sale of Kenyon Operations
In October 2007, we divested 70% of our Kenyon investment for proceeds of $0.7 million. We recognized a pre-tax gain of $0.4 million inGains (losses) on dispositions and impairment charges, netin our consolidated statement of operations for the year ended December 31, 2007.
Sale of Operations in Michigan
In 2006, our Board of Directors approved a plan to divest certain funeral homes and cemeteries in Michigan. As a result, we recognized a pretax impairment charge in 2006 of $26.4 million on these properties. As of December 31, 2007, these locations are classified as assets held for sale and we have recorded an additional impairment charge of approximately $1.6 million.
Sale of Operations in Singapore
In October 2006, we sold our businesses in Singapore for proceeds of approximately $11.6 million. We recognized an after-tax gain in 2006 of $2.9 million inIncome from discontinued operationsin our consolidated statement of operations as a result of this transaction. In 2007, we received proceeds totaling $1.9 million and recorded a receivable of $0.8 million related to this sale. We recognized an after-tax gain in 2007 of $1.5 million inIncome from discontinued operationsin our consolidated statement of operations as a result of this transaction.
Sale of Operations in Chile
In September 2005, we completed the sale of our cemetery operations in Chile for proceeds of approximately $106 million. We received net cash proceeds of $90.0 million upon completion of the sale and received additional cash proceeds of CLP 5.8 billion or approximately $11.0 million in 2006. In the first quarter of 2007, we received the remainder of the proceeds totaling CLP 2.5 billion or approximately $4.7 million.
105
SERVICE CORPORATION INTERNATIONAL
NOTES TO CONSOLIDATED FINANCIAL STATEMENTS — (Continued)
Sales of Assets to StoneMor Partners LP
In December 2007, we sold 46 cemeteries and 30 funeral homes to StoneMor Partners LP for proceeds of approximately $71.0 million. As a result of this transaction, we recognized a pre-tax gain of $21.1 million inGains (losses) on dispositions and impairment charges, netin our consolidated statement of operations for the year ended December 31, 2007.
In September 2006, we sold 21 cemeteries and 14 funeral homes to StoneMor Partners LP (StoneMor) for proceeds of approximately $11.8 million. We received net cash proceeds of $5.9 million and 275,046 StoneMor units valued at $5.9 million. As a result of this transaction, we recognized a pre-tax loss of $16.6 million inGains (losses) on dispositions and impairment charges, netin our consolidated statement of operations for the year ended December 31, 2006.
In November 2005, we sold 21 cemeteries and six funeral homes to StoneMor for $12.7 million. In the third quarter of 2005, we had classified these properties as held for sale and recorded an impairment charge inGains (losses) on dispositions and impairment charges, netin our consolidated statement of operations of approximately $19.6 million, net of a tax benefit of $10.5 million in our consolidated statement of operations. In connection with this sale, we received $6.8 million in cash and 280,952 StoneMor units, valued at $5.9 million in November of 2005. In 2006, we disposed of our investment in these StoneMor Limited Partners LP units for $6.0 million, resulting in a pretax gain of $0.1 million.
Sale of Mayflower National Life Insurance Company
In July 2007, we completed the sale of Mayflower National Life Insurance Company, Alderwoods former insurance subsidiary, to Assurant Inc. for proceeds of approximately $67.5 million. We recognized a $1.5 million gain related to this sale in the third quarter of 2007. The operations of this subsidiary are presented as discontinued operations in our condensed consolidated statement of operations.
Equity Investment and Redemption of Securities
In October 2007, we sold our remaining equity investment in our French operations for 12.0 million euros, or $17.0 million and recognized a gain on disposition of $17.6 million recorded inEquity in earnings of unconsolidated subsidiaries. Proceeds received from this sale are classified as an operating cash flow in the accompanying statement of cash flows. In connection with this sale, we also received 101.5 million euros, or $144.0 million, in cash from the redemption of the remainder of our convertible preferred equity certificates, which were received in connection with the original disposition of our operations in France in March 2004. The securities had a carrying value of zero. In addition, 10 million euros, or approximately $14.1 million, related to the redemption were deposited into a euro-denominated escrow account for potential payment for existing indemnification liabilities. We recognized a gain of $158.1 million related to the redemption of these convertible preferred equity certificates. Proceeds of $158.7 million are classified as investing activities in the accompanying statement of cash flows.
Assets Held for Sale
In connection with the acquisition of Alderwoods, we agreed to a consent order with the staff of the Federal Trade Commission (FTC) whereby we would divest of certain properties identified by the FTC. In 2007, we divested of all these properties.
In addition, we had committed to a plan to sell certain other operating properties as of both December 31, 2007 and 2006. In connection with these assets held for sale, we recorded impairment losses of approximately $13 million and $40 million, respectively, in our consolidated statement of operations for the years ended December 31, 2007 and 2006.
106
SERVICE CORPORATION INTERNATIONAL
NOTES TO CONSOLIDATED FINANCIAL STATEMENTS — (Continued)
Net assets held for sale were as follows:
| | | | | | | | | |
| | | December 31, | |
| | | 2007 | | | 2006 | |
| |
| Assets: | | | | | | | | |
| Current assets | | $ | 2,294 | | | $ | 6,330 | |
| Preneed funeral receivables and trust investments | | | 9,944 | | | | 56,968 | |
| Preneed cemetery receivables and trust investments | | | 64,751 | | | | 107,796 | |
| Cemetery property | | | 9,341 | | | | 65,448 | |
| Property and equipment, at cost (net) | | | 9,968 | | | | 23,829 | |
| Deferred charges and other assets | | | 12,390 | | | | 13,914 | |
| Goodwill | | | — | | | | 27,127 | |
| Cemetery perpetual care trust investments | | | 16,232 | | | | 54,229 | |
| | | | | | | | | |
| Total assets | | | 124,920 | | | | 355,641 | |
| | | | | | | | | |
| Liabilities: | | | | | | | | |
| Accounts payable and accrued liabilities | | | 149 | | | | 419 | |
| Deferred preneed funeral revenues | | | 8,388 | | | | 66,841 | |
| Deferred preneed cemetery revenues | | | 67,141 | | | | 117,604 | |
| Other liabilities | | | 167 | | | | 1,126 | |
| Non-controlling interest in perpetual care trusts | | | 16,232 | | | | 54,229 | |
| | | | | | | | | |
| Total liabilities | | | 92,077 | | | | 240,219 | |
| | | | | | | | | |
| Net assets held for sale | | $ | 32,843 | | | $ | 115,422 | |
| | | | | | | | | |
Discontinued Operations
During the fourth quarter of 2006, we disposed of our funeral operations in Singapore. During the first quarter of 2005, we disposed of our funeral and cemetery operations in Argentina and Uruguay. During the third quarter of 2005, we also disposed of our cemetery operations in Chile. Our operations in these countries are classified as discontinued operations for all periods presented.
As part of the Alderwoods transaction, we acquired an insurance subsidiary that we sold on June 30, 2007. The operations of this subsidiary from November 28, 2006 to June 30, 2007 are presented as discontinued operations in our consolidated statement of operations and as assets and liabilities of discontinued operations on our consolidated balance sheet at December 31, 2006.
107
SERVICE CORPORATION INTERNATIONAL
NOTES TO CONSOLIDATED FINANCIAL STATEMENTS — (Continued)
The results of our discontinued operations for the years ended December 31, 2007, 2006 and 2005 were as follows:
| | | | | | | | | | | | | |
| | | Years Ended December 31, | |
| | | 2007 | | | 2006 | | | 2005 | |
| | | (In thousands) | |
| |
| Revenues | | $ | 42,626 | | | $ | 12,324 | | | $ | 27,651 | |
| Gains on dispositions and impairment charges, net | | | 1,548 | | | | 128 | | | | 249 | |
| Costs and other expenses | | | (36,448 | ) | | | (11,093 | ) | | | (17,433 | ) |
| Other income | | | 1,504 | | | | — | | | | — | |
| | | | | | | | | | | | | |
| Income from discontinued operations before income taxes | | | 9,230 | | | | 1,359 | | | | 10,467 | |
| (Provision) benefit for income taxes | | | (4,818 | ) | | | 2,548 | | | | (5,961 | ) |
| | | | | | | | | | | | | |
| Income from discontinued operations | | $ | 4,412 | | | $ | 3,907 | | | $ | 4,506 | |
| | | | | | | | | | | | | |
As of December 31, 2006, we reported assets and liabilities related to discontinued operations as follows (in thousands):
| | | | | |
| | | December 31,
| |
| | | 2006 | |
| |
Assets: | | | | |
| Receivables, net | | $ | 2,236 | |
| Goodwill | | | 4,974 | |
| Deferred charges and other assets | | | 366,158 | |
| | | | | |
| Total assets | | | 373,368 | |
| | | | | |
Liabilities: | | | | |
| Accounts payable and accrued liabilities | | | (2,351 | ) |
| Other liabilities | | | (311,498 | ) |
| | | | | |
| Total liabilities | | | (313,849 | ) |
| | | | | |
| Net assets of discontinued operations | | $ | 59,519 | |
| | | | | |
108
SERVICE CORPORATION INTERNATIONAL
NOTES TO CONSOLIDATED FINANCIAL STATEMENTS — (Continued)
| |
| 21. | Quarterly Financial Data (Unaudited) |
Quarterly financial data for 2007 and 2006 is as follows:
| | | | | | | | | | | | | | | | | |
| | | First
| | | Second
| | | Third
| | | Fourth
| |
| | | Quarter | | | Quarter | | | Quarter | | | Quarter | |
| | | (In thousands, except per share amounts) | |
| |
2007 | | | | | | | | | | | | | | | | |
| Revenues | | $ | 607,555 | | | $ | 565,492 | | | $ | 539,334 | | | $ | 572,922 | |
| Costs and expenses | | | (466,401 | ) | | | (462,131 | ) | | | (436,814 | ) | | | (451,457 | ) |
| Gross profits | | | 141,154 | | | | 103,361 | | | | 102,520 | | | | 121,465 | |
| Operating income | | | 98,075 | | | | 82,823 | | | | 75,332 | | | | 89,936 | |
| Income from continuing operations before income taxes | | | 58,214 | | | | 41,850 | | | | 42,907 | | | | 244,016 | |
| Provision for income taxes | | | (23,497 | ) | | | (28,941 | ) | | | (14,062 | ) | | | (77,170 | ) |
| Income from continuing operations | | | 34,717 | | | | 12,909 | | | | 28,845 | | | | 166,846 | |
| Income (loss) from discontinued operations | | | 2,925 | | | | 2,209 | | | | (675 | ) | | | (47 | ) |
| Net income | | | 37,642 | | | | 15,118 | | | | 28,170 | | | | 166,799 | |
| Earnings per share: | | | | | | | | | | | | | | | | |
| Basic — EPS | | | .13 | | | | .05 | | | | .10 | | | | .61 | |
| Diluted — EPS | | | .13 | | | | .05 | | | | .10 | | | | .60 | |
2006 | | | | | | | | | | | | | | | | |
| Revenues | | $ | 442,001 | | | $ | 431,400 | | | $ | 400,389 | | | $ | 479,098 | |
| Costs and expenses | | | (353,307 | ) | | | (347,212 | ) | | | (327,341 | ) | | | (374,767 | ) |
| Gross profits | | | 88,694 | | | | 84,188 | | | | 73,048 | | | | 104,331 | |
| Operating income | | | 62,177 | | | | 60,385 | | | | 21,342 | | | | 52,774 | |
| Income from continuing operations before income taxes | | | 42,422 | | | | 40,761 | | | | 7,603 | | | | 6,663 | |
| Provision for income taxes | | | (15,645 | ) | | | (15,404 | ) | | | (4,797 | ) | | | (8,999 | ) |
| Income (loss) from continuing operations | | | 26,777 | | | | 25,357 | | | | 2,806 | | | | (2,336 | ) |
| Income from discontinued operations | | | 149 | | | | 93 | | | | 559 | | | | 3,106 | |
| Net income | | | 26,926 | | | | 25,450 | | | | 3,365 | | | | 770 | |
| Earnings per share: | | | | | | | | | | | | | | | | |
| Basic — EPS | | | .09 | | | | .09 | | | | .01 | | | | .00 | |
| Diluted — EPS | | | .09 | | | | .09 | | | | .01 | | | | .00 | |
109
SERVICE CORPORATION INTERNATIONAL
SCHEDULE II — VALUATION AND QUALIFYING ACCOUNTS
Three Years Ended December 31, 2007
| | | | | | | | | | | | | | | | | | | | | |
| | | | | | Charged
| | | Charged
| | | | | | | |
| | | Balance at
| | | (Credited) to
| | | (Credited) to
| | | | | | Balance at
| |
| | | Beginning
| | | Costs and
| | | Other
| | | | | | End of
| |
Description | | of Period | | | Expenses | | | Accounts(1) | | | Write-Offs(2) | | | Period | |
| | | (In thousands) | |
| |
| Current provision: | | | | | | | | | | | | | | | | | | | | |
| Allowance for doubtful accounts: | | | | | | | | | | | | | | | | | | | | |
| Year ended December 31, 2007 | | $ | 25,793 | | | $ | 11,489 | | | $ | 9 | | | $ | (17,816 | ) | | $ | 19,475 | |
| Year ended December 31, 2006 | | | 11,835 | | | | 10,020 | | | | 12,060 | | | | (8,122 | ) | | | 25,793 | |
| Year ended December 31, 2005 | | | 12,572 | | | | 9,470 | | | | (39 | ) | | | (10,168 | ) | | | 11,835 | |
| Due After One Year: | | | | | | | | | | | | | | | | | | | | |
| Allowance for doubtful accounts: | | | | | | | | | | | | | | | | | | | | |
| Year ended December 31, 2007 | | $ | 3,844 | | | $ | (705 | ) | | $ | (314 | ) | | $ | — | | | $ | 2,825 | |
| Year ended December 31, 2006 | | | 7,312 | | | | (2,100 | ) | | | 450 | | | | (1,818 | ) | | | 3,844 | |
| Year ended December 31, 2005 | | | 33,362 | | | | (111 | ) | | | (25,939 | ) | | | — | | | | 7,312 | |
| Preneed Funeral and Preneed Cemetery Asset: | | | | | | | | | | | | | | | | | | | | |
| Year ended December 31, 2007 | | $ | 81,572 | | | $ | (3,546 | ) | | $ | (13,964 | ) | | $ | — | | | $ | 64,062 | |
| Year ended December 31, 2006 | | | 60,358 | | | | (803 | ) | | | 22,017 | | | | — | | | | 81,572 | |
| Year ended December 31, 2005 | | | 53,340 | | | | (749 | ) | | | 7,767 | | | | — | | | | 60,358 | |
| Deferred Preneed Funeral and Cemetery Revenue: | | | | | | | | | | | | | | | | | | | | |
| Year ended December 31, 2007 | | $ | (151,341 | ) | | $ | — | | | $ | 7,611 | | | $ | — | | | $ | (143,730 | ) |
| Year ended December 31, 2006 | | | (112,002 | ) | | | — | | | | (39,339 | ) | | | — | | | | (151,341 | ) |
| Year ended December 31, 2005 | | | (112,290 | ) | | | — | | | | 288 | | | | — | | | | (112,002 | ) |
| Deferred Tax Valuation Allowance: | | | | | | | | | | | | | | | | | | | | |
| Year ended December 31, 2007 | | $ | 70,547 | | | $ | 8,034 | | | $ | (10,112 | ) | | $ | — | | | $ | 68,469 | |
| Year ended December 31, 2006 | | | 34,829 | | | | (3,033 | ) | | | 38,751 | | | | — | | | | 70,547 | |
| Year ended December 31, 2005 | | | 43,908 | | | | (9,079 | ) | | | — | | | | — | | | | 34,829 | |
| | |
| (1) | | Primarily relates to cumulative effect of accounting change and acquisitions and dispositions of operations. |
| |
| (2) | | Uncollected receivables written off, net of recoveries. |
110
| |
| Item 9. | Changes In and Disagreements with Accountants on Accounting and Financial Disclosure |
None.
| |
| Item 9A. | Controls and Procedures |
Evaluation of Disclosure Controls and Procedures
Management is responsible for establishing and maintaining effective disclosure controls and procedures. As of December 31, 2007, we carried out an evaluation, under the supervision and with the participation of our Chief Executive Officer and Chief Financial Officer, of the effectiveness of our disclosure controls and procedures (as defined inRules 13a-15(e) and15d-15(e) under the Securities Exchange Act of 1934, as amended (the “Exchange Act”)). Our disclosure controls and procedures are designed to ensure that information required to be disclosed in the Securities and Exchange Commission (“SEC”) reports we file or submit under the Exchange Act is recorded, processed, summarized, and reported within the time period specified by the SEC’s rules and forms and that such information is accumulated and communicated to management, including our Chief Executive Officer and Chief Financial Officer, to allow timely decisions regarding required disclosure. In light of the discussion of material weaknesses set forth below, these officers have concluded that our disclosure controls and procedures were not effective as of December 31, 2007. To address the material weaknesses described below, we performed additional analyses and other post-closing procedures to ensure our consolidated financial statements were prepared in accordance with accounting principles generally accepted in the United States of America (US GAAP). These measures included, among other things: (i) expansion of our normal year-end closing and testing procedures, (ii) assignment of a dedicated team of personnel to review all account reconciliations, including reconciliations performed by our outsourced accounting functions, and (iii) deployment of significant in-house and external resources to complete our income tax provision and various account reconciliations, ensure posting of all transactions, and perform a detailed review and comprehensive analysis of account balances and reconciliations. Based on the additional procedures performed, management has determined that the consolidated financial statements included in this Annual Report onForm 10-K fairly present, in all material respects, our financial condition, results of operations, and cash flows for the periods presented.
Management’s Annual Report on Internal Control over Financial Reporting
Our management is responsible for establishing and maintaining adequate internal control over financial reporting as defined inRule 13a-15(f) under the Exchange Act. Internal control over financial reporting is a process designed by, or under the supervision of, the company’s principal executive and principal financial officers, and effected by the board of directors, management, and other personnel, to provide reasonable assurance regarding the reliability of financial reporting and the preparation of financial statements for external purposes in accordance with US GAAP including those policies and procedures that: (i) pertain to the maintenance of records that, in reasonable detail, accurately and fairly reflect the transactions and dispositions of the assets of the company, (ii) provide reasonable assurance that transactions are recorded as necessary to permit preparation of financial statements in accordance with US GAAP and that receipts and expenditures are being made only in accordance with authorizations of management and directors of the company, and (iii) provide reasonable assurance regarding prevention or timely detection of unauthorized acquisition, use, or disposition of the company’s assets that could have a material effect on the financial statements.
Because of its inherent limitations, internal control over financial reporting may not prevent or detect misstatements. Also, projections of any evaluation of effectiveness to future periods are subject to the risk that controls may become inadequate because of changes in conditions, or that the degree of compliance with policies and procedures may deteriorate.
Under the supervision and with the participation of our management, including our Chief Executive Officer and Chief Financial Officer, we have assessed the effectiveness of our internal control over financial reporting as of December 31, 2007. In making this assessment, our management used the criteria described inInternal Control — Integrated Frameworkissued by the Committee of Sponsoring Organizations of the Treadway Commission (COSO). Based on this assessment and those criteria, our management concluded that the Company did not
111
maintain effective internal control over financial reporting as of December 31, 2007 as a result of material weaknesses in (a) accounting for income taxes and (b) account reconciliations.
A material weakness is a deficiency, or combination of deficiencies, in internal control over financial reporting, such that there is a reasonable possibility that a material misstatement of the Company’s annual or interim financial statements will not be prevented or detected on a timely basis. Management identified the following material weaknesses as of December 31, 2007.
Accounting for Income Taxes:
As of December 31, 2007, we did not maintain effective controls over the calculation of the completeness, accuracy, and presentation of our accounting for income taxes, including the tax provision and related tax assets and liabilities. Specifically, our controls related to the determination and review of our quarterly and annual tax provisions were not adequate to ensure the timely and accurate preparation of the income tax provision and related current and deferred tax asset and liability accounts in accordance with US GAAP. This control deficiency resulted in the fourth quarter 2007 revision of the Company’s adoption impact of FIN 48, “Accounting for Uncertainty in Income Taxes — an Interpretation of FASB Statement No. 109” (FIN 48) and various audit adjustments to the consolidated financial statements in the second, third, and fourth quarters of 2007. Additionally, this control deficiency, if not corrected, could result in a material misstatement of the income tax accounts that would result in a material misstatement in our annual or interim consolidated financial statements that would not be prevented or detected on a timely basis. Therefore, we have concluded that this control deficiency constitutes a material weakness.
Account Reconciliations:
As of December 31, 2007, we did not maintain effective controls over the timely completion and review of certain of our balance sheet account reconciliations, including reconciliations related to our outsourced accounting functions and accounts acquired in our recent Alderwoods transaction. Specifically, our controls related to the preparation and review of account reconciliations related to certain trust accounts, cemetery properties, leases, divested properties, merchandise inventory, and sales and property taxes were not adequate to ensure the accurate and complete presentation of these balance sheet and related income statement accounts in accordance with US GAAP. This control deficiency resulted in various adjustments, including audit adjustments, to the consolidated financial statements in the fourth quarter of 2007 which were not material. Additionally, this control deficiency, if not corrected, could result in a material misstatement to our annual or interim consolidated financial statements that would not be prevented or detected on a timely basis. Therefore, we have concluded that this control deficiency constitutes a material weakness.
The effectiveness of the Company’s internal control over financial reporting as of December 31, 2007 has been audited by PricewaterhouseCoopers LLP, an independent registered public accounting firm, as stated in their report which is included herein.
Remediation Efforts and Plans for Material Weaknesses in Internal Control over Financial Reporting
In response to the identified material weaknesses, our management, with oversight from the Company’s Audit Committee has dedicated significant in-house and external resources to implement enhancements to the Company’s internal control over financial reporting and remediate the material weaknesses described above. These ongoing efforts are focused on (i) expanding our organizational capabilities to improve our monitoring, communications, training, and governance processes, (ii) implementing process improvements to strengthen our internal control and monitoring activities, and (iii) placement of additional staff to timely complete the Company’s income tax provision and account reconciliations, thus allowing for proper review and oversight.
Until the remediation steps set forth below are fully implemented, the material weaknesses described above will continue to exist.
112
Accounting for Income Taxes:
The principal factors contributing to the material weakness in accounting for income taxes were as follows:
| | |
| | • | Incorrect application of the provisions of SFAS No. 109 and FIN 48 resulting in errors in the accounting for income taxes; |
| |
| | • | Improper verification of data used in tax provision and tax reserve computations; and |
| |
| | • | Insufficient or ineffective review and approval of income tax schedules and journal entries resulting in errors not being prevented or detected in a timely manner. |
In response to these contributing factors, our management has implemented or will implement the following remediation steps to enhance our internal controls over the calculation of the Company’s income tax provision and related balance sheet accounts:
| | |
| | • | The hiring of an experienced Managing Director in the first quarter of 2008 to lead the Company’s tax department, with responsibility for direction and oversight of all income tax and other tax functions. |
| |
| | • | The engagement of third party contract tax advisors in the fourth quarter of 2007; such tax advisors have provided and will continue to provide day-to-day oversight and review of the Company’s tax provision and compliance processes, pending our Managing Director’s assessment of resource requirements and capabilities. |
| |
| | • | The commitment to reevaluate existing roles and responsibilities within the tax function to ensure they are staffed by appropriate personnel. |
| |
| | • | The enhancement of standardized documentation and processes in the income tax provision area, including the review and approval of related journal entries by experienced tax and finance personnel. |
Account Reconciliations:
The principal factors contributing to the material weakness in account reconciliations were as follows:
| | |
| | • | Inadequate policies and procedures in place to effectively reconcile general ledger accounts to supporting detail; |
| |
| | • | High turnover within the accounting and finance function, which led to the extensive use of contract and temporary resources to prepare certain account reconciliations; and |
| |
| | • | Insufficient or ineffective review and approval of certain account reconciliations resulting in errors not being prevented or detected in a timely manner. |
In response to these contributing factors, our management has implemented or will implement the following remediation steps to enhance our internal controls over the timely completion and review of account reconciliations:
| | |
| | • | The creation of a monitoring function within the Company’s financial reporting group in the fourth quarter of 2007 to periodically review all account reconciliations. |
| |
| | • | The hiring and training of additional in-house resources and ongoing commitment to evaluate existing roles and responsibilities within the accounting and finance function. |
| |
| | • | The performance of an effectiveness review of certain financial processes and related controls to help evaluate the Company’s organizational structure and control environment; such review will encompass processes, policies and procedures, personnel, and technology. |
| |
| | • | The refinement of certain entity-level monitoring controls, first implemented in the third quarter of 2007 to gain visibility into material issues within business functions, in order to achieve the level of precision and operating effectiveness desired by our management. |
113
Changes in Internal Control over Financial Reporting
There have been no changes in our internal control over financial reporting during the most recently completed fiscal quarter that have materially affected, or are reasonably likely to materially affect, our internal control over financial reporting.
| |
| Item 9B. | Other Information |
None.
PART III
| |
| Item 10. | Directors, Executive Officers and Corporate Governance |
| |
| Item 11. | Executive Compensation |
| |
| Item 12. | Security Ownership of Certain Beneficial Owners and Management and Related Stockholder Matters |
| |
| Item 13. | Certain Relationships and Related Transactions, and Director Independence |
| |
| Item 14. | Principal Accountant Fees and Services |
Information required by PART III (Items 10, 11, 12, 13 and 14) has been omitted as we intend to file with the Commission not later than 120 days after the end of our fiscal year a definitive proxy statement that includes such information. Such information is set forth in such proxy statement (i) with respect to Item 10, under the captions “Proxy Voting: Questions and Answers,” “Election of Directors,” “Other Matters — Section 16(a) Beneficial Ownership Reporting Compliance” and “Report of the Audit Committee,” (ii) with respect to Items 11 and 13, under the captions “Election of Directors,” “Compensation Discussion and Analysis,” “Compensation Committee Report,” “Certain Information with Respect to Officers and Directors,” “Compensation Committee Interlocks and Insider Participation” and “Certain Transactions”, (iii) with respect to Item 12, under the caption “Voting Securities and Principal Holders”, and (iv) with respect to Item 14, under the caption “Proposal to Approve the Selection of Independent Accountants — Audit Fees and All Other Fees”. The information as specified in the preceding sentence is incorporated herein by reference; provided however, notwithstanding anything set forth in thisForm 10-K, the information under the captions “Compensation Committee Report” and “Report of the Audit Committee” in such proxy statement, is not incorporated by reference into thisForm 10-K.
The information regarding our executive officers called for by Item 401 ofRegulation S-K and the information regarding our code of ethics called for by Item 406 ofRegulation S-K has been included in PART I of this report. The information regarding our equity compensation plan information called for by Item 201(d) ofRegulation S-K is set forth below.
Equity Compensation Plan Information at December 31, 2007:
| | | | | | | | | | | | | |
| | | | | | | | | Number of Securities
| |
| | | | | | | | | Remaining Available for
| |
| | | Number of Securities to be
| | | Weighted-Average
| | | Future Issuance Under
| |
| | | Issued upon Exercise of
| | | Exercise Price of
| | | Equity Compensation Plans
| |
| | | Outstanding Options,
| | | Outstanding Options,
| | | (Excluding Securities
| |
| | | Warrants and Rights
| | | Warrants and Rights
| | | Reflected in Column (a))
| |
Plan Category | | (a) | | | (b) | | | (c) | |
| |
| Equity compensation plans approved by security holders | | | 11,910,044 | | | | 6.20 | | | | 13,358,979 | |
| Equity compensation plans not approved by security holders(1) | | | 1,658,401 | | | | 6.66 | | | | 829,474 | (2) |
| | | | | | | | | | | | | |
| Total | | | 13,568,445 | | | | 6.25 | | | | 14,188,453 | |
| | | | | | | | | | | | | |
114
| | |
| (1) | | Includes options outstanding under the Equity Corporation International 1994 Long-Term Incentive Plan which became exercisable to acquire our common stock when we acquired Equity Corporation International in January 1999. The outstanding options cover an aggregate of 7,263 shares at a weighted-average exercise price of $29.82 per share. No shares of our common stock are available for any future grants under this plan. |
| |
| | Also includes options outstanding under the 1996 Nonqualified Incentive Plan under which nonqualified stock options were granted to employees who are not officers or directors. We have 1,651,138 total options outstanding under the 1996 Non-qualified Incentive Plan. No shares of our common stock are available for any future grants under this plan. See Note 4 to the consolidated financial statements in Item 8 of thisForm 10-K for a further description of 1996 Nonqualified Incentive Plan. These plans have not been submitted for shareholder approval. |
| |
| (2) | | Includes an estimated 829,474 shares available under the Employee Stock Purchase Plan. Under such plan, a dollar value of shares (not an amount of shares) are registered. The above estimate was determined by dividing (i) the remaining unissued dollar value of registered shares at December 31, 2007, which was $11.7 million, by (ii) the closing price of $14.05 per share of common stock at December 31, 2007. |
The Employee Stock Purchase Plan enables Company employees in North America to invest via payroll deductions up to $500 (or $700 Canadian) per month in our common stock. Contributions are utilized to purchase the stock in the open market. With respect to Canadian employees who meet certain requirements, we will provide annually a match equal to 25% of the amount of the employee’s contribution subject to a maximum contribution per participant of $2,100 Canadian. This plan has not been submitted for shareholder approval.
Certifications
In 2007, the Company submitted to the New York Stock Exchange the Section 12(a) certification by the Company’s Chief Executive Officer regarding compliance with the Exchange’s corporate governance listing standards. The Sarbanes-Oxley Act Section 302 certifications regarding the quality of the Company’s public disclosure are attached as Exhibits 31.1 and 31.2 to this report onForm 10-K.
PART IV
| |
| Item 15. | Exhibits and Financial Statement Schedule |
(a)(1)-(2)Financial Statements and Schedule:
The financial statements and schedule are listed in the accompanying Index to Financial Statements and Related Schedule on page 41 of this report.
(3) Exhibits:
The exhibits listed on the accompanying Exhibit Index on pages118-121 are filed as part of this report.
(b) Included in (a) above.
(c) Included in (a) above.
115
SIGNATURES
Pursuant to the requirements of Section 13 or 15(d) of the Securities Exchange Act of 1934, the Registrant, Service Corporation International, has duly caused this report to be signed on its behalf by the undersigned, thereunto duly authorized.
SERVICE CORPORATION INTERNATIONAL
| | |
| | By: | /s/ gregory t. sangalis |
(Gregory T. Sangalis,
Senior Vice President, General
Counsel, and Secretary)
Dated: March 3, 2008
Pursuant to the requirements of the Securities Exchange Act of 1934, this report has been signed below by the following persons on behalf of the Registrant and in the capacities and on the date indicated.
| | | | | | | |
Signature | | Title | | Date |
| |
/s/ R. L. WALTRIP* (R. L. Waltrip) | | Chairman of the Board | | March 3, 2008 |
| | | | | |
/s/ THOMAS L. RYAN* (Thomas L. Ryan) | | President, Chief Executive Officer, and Director (Principal Executive Officer) | | March 3, 2008 |
| | | | | |
/s/ ERIC D. TANZBERGER* (Eric D. Tanzberger) | | Senior Vice President, Chief Financial Officer, and Treasurer (Principal Financial Officer) | | March 3, 2008 |
| | | | | |
/s/ JEFFREY I. BEASON* (Jeffrey I. Beason) | | Vice President and Corporate Controller (Chief Accounting Officer) | | March 3, 2008 |
| | | | | |
/s/ ALAN R. BUCKWALTER, III* (Alan R. Buckwalter, III) | | Director | | March 3, 2008 |
| | | | | |
/s/ ANTHONY L. COELHO* (Anthony L. Coelho) | | Director | | March 3, 2008 |
| | | | | |
/s/ A. J. FOYT, JR.* (A. J. Foyt, Jr.) | | Director | | March 3, 2008 |
| | | | | |
/s/ MALCOLM GILLIS* (Malcolm Gillis) | | Director | | March 3, 2008 |
| | | | | |
/s/ VICTOR L. LUND* (Victor L. Lund) | | Director | | March 3, 2008 |
| | | | | |
/s/ JOHN W. MECOM, JR.* (John W. Mecom, Jr.) | | Director | | March 3, 2008 |
116
| | | | | | | |
Signature | | Title | | Date |
| |
/s/ CLIFTON H. MORRIS, JR.* (Clifton H. Morris, Jr.) | | Director | | March 3, 2008 |
| | | | | |
/s/ W. BLAIR WALTRIP* (W. Blair Waltrip) | | Director | | March 3, 2008 |
| | | | | |
/s/ EDWARD E. WILLIAMS* (Edward E. Williams) | | Director | | March 3, 2008 |
| | | | | | | |
| *By | | /s/ GREGORY T. SANGALIS
(Gregory T. Sangalis, as Attorney-In-Fact
For each of the Persons indicated) | | | | March 3, 2008 |
117
EXHIBIT INDEX
PURSUANT TO ITEM 601 OF REG. S-K
| | | | | | | |
Exhibit
| | | | |
Number | | | | Description |
| |
| | 3 | .1 | | — | | Restated Articles of Incorporation. (Incorporated by reference to Exhibit 3.1 to Registration StatementNo. 333-10867 onForm S-3). |
| | 3 | .2 | | — | | Articles of Amendment to Restated Articles of Incorporation. (Incorporated by reference to Exhibit 3.1 toForm 10-Q for the fiscal quarter ended September 30, 1996). |
| | 3 | .3 | | — | | Statement of Resolution Establishing Series of Shares of Series D Junior Participating Preferred Stock, dated July 27, 1998. (Incorporated by reference to Exhibit 3.2 toForm 10-Q for the fiscal quarter ended June 30, 1998). |
| | 3 | .4 | | — | | Bylaws, as amended. (Incorporated by reference to Exhibit��3.1 toForm 8-K dated November 16, 2007). |
| | 4 | .1 | | — | | Rights Agreement dated as of May 14, 1998 between the Company and Harris Trust and Savings Bank. (Incorporated by reference to Exhibit 99.1 toForm 8-K dated May 14, 1998). |
| | 4 | .2 | | — | | Agreement Appointing a Successor Rights Agent Under Rights Agreement, dated June 1, 1999, by the Company, Harris Trust and Savings Bank and The Bank of New York. (Incorporated by reference to Exhibit 4.1 toForm 10-Q for the fiscal quarter ended June 30, 1999). |
| | 4 | .3 | | — | | Senior Indenture dated as of February 1, 1993 by and between the Company and The Bank of New York, as trustee. (Incorporated by reference as Exhibit 4.1 toForm S-4 filed September 2, 2004 (FileNo. 333-118763)). |
| | 4 | .4 | | — | | Agreement of Resignation, Appointment of Acceptance, dated October 21, 2005, among the Company, The Bank of New York and The Bank of New York Trust Company, N.A., appointing a successor trustee for the Senior Indenture dated as of February 1, 1993. (Incorporated by reference to Exhibit 4.1 toForm 10-Q for the fiscal quarter ended June 30, 2005). |
| | 10 | .1 | | — | | Retirement Plan For Non-Employee Directors. (Incorporated by reference to Exhibit 10.1 toForm 10-K for the fiscal year ended December 31, 1991). |
| | 10 | .2 | | — | | First Amendment to Retirement Plan For Non-Employee Directors. (Incorporated by reference to Exhibit 10.2 toForm 10-K for the fiscal year ended December 31, 2000). |
| | 10 | .3 | | — | | Agreement dated May 14, 1992 between the Company, R. L. Waltrip and related parties relating to life insurance. (Incorporated by reference to Exhibit 10.4 toForm 10-K for the fiscal year ended December 31, 1992). |
| | 10 | .4 | | — | | Employment Agreement, dated December 28, 2006, between SCI Executive Services, Inc. and R.L. Waltrip (including Non-Competition Agreement and Amendment to Employment Agreement, dated November 11, 1991, among the Company, R. L. Waltrip and Claire Waltrip). (Incorporated by reference to Exhibit 10.4 toForm 10-K for the fiscal year ended December 31, 2006). |
| | 10 | .5 | | — | | Amendment to Employment and Noncompetition Agreement, dated November 30, 2007, between SCI Executive Services, Inc. and R. L. Waltrip. |
| | 10 | .6 | | — | | Employment and Noncompetition Agreement, dated January 1, 2004, between SCI Executive Services, Inc. and Thomas L. Ryan. (Incorporated by reference to Exhibit 10.9 toForm 10-K for the fiscal year ended December 31, 2003). |
| | 10 | .7 | | — | | Addendum to Employment and Noncompetition Agreement, dated December 1, 2005, between SCI Executive Services, Inc. and Thomas L. Ryan. (Incorporated by reference to Exhibit 10.12 toForm 10-K for the fiscal year ended December 31, 2005). |
| | 10 | .8 | | — | | Amendment to Employment and Noncompetition Agreement, dated November 30, 2007, between SCI Executive Services, Inc. and Thomas L. Ryan. |
| | 10 | .9 | | — | | Employment and Noncompetition Agreement, dated January 1, 2004, between SCI Executive Services, Inc. and Michael R. Webb. (Incorporated by reference to Exhibit 10.10 toForm 10-K for the fiscal year ended December 31, 2003). |
| | 10 | .10 | | — | | Addendum to Employment and Noncompetition Agreement, dated December 1, 2005, between SCI Executive Services, Inc. and Michael R. Webb. (Incorporated by reference to Exhibit 10.14 toForm 10-K for the fiscal year ended December 31, 2005). |
118
| | | | | | | |
Exhibit
| | | | |
Number | | | | Description |
| |
| | 10 | .11 | | — | | Amendment to Employment and Noncompetition Agreement, dated November 30, 2007, between SCI Executive Services, Inc. and Michael R. Webb. |
| | 10 | .12 | | — | | Employment and Noncompetition Agreement, dated December 28, 2006 between SCI Executive Services, Inc. and Eric D. Tanzberger. (Incorporated by reference to Exhibit 10.11 toForm 10-K for the fiscal year ended December 31, 2006). |
| | 10 | .13 | | — | | Amendment to Employment and Noncompetition Agreement, dated November 30, 2007, between SCI Executive Services, Inc. and Eric D. Tanzberger. |
| | 10 | .14 | | — | | Employment and Noncompetition Agreement, dated January 1, 2004, between SCI Executive Services, Inc. and James Shelger; Addendum to Employment and Noncompetition Agreement, dated December 1, 2005, between SCI Executive Services, Inc. and James M. Shelger. (Incorporated by reference to Exhibit 10.1 toForm 10-Q for the fiscal quarter ended March 31, 2007). |
| | 10 | .15 | | — | | Executive Retirement and Consulting Agreement and General Release, dated December 28, 2007, between SCI Executive Services, Inc. and James M. Shelger. (Incorporated by reference to Exhibit 10.1 toForm 8-K dated January 2, 2008). |
| | 10 | .16 | | — | | Form of Employment and Noncompetition Agreement pertaining to non-senior officers. (Incorporated by reference to Exhibit 10.12 toForm 10-K for the fiscal year ended December 31, 2003). |
| | 10 | .17 | | — | | Form of Addendum to Employment and Noncompetition Agreement pertaining to the preceding exhibit. (Incorporated by reference to Exhibit 10.20 toForm 10-K for the fiscal year ended December 31, 2005). |
| | 10 | .18 | | — | | Form of Amendment to Employment and Noncompetition Agreement dated November 30, 2007, between SCI Executive Services, Inc. and non-senior officers. |
| | 10 | .19 | | — | | 1993 Long-Term Incentive Stock Option Plan. (Incorporated by reference to Exhibit 4.12 to Registration StatementNo. 333-00179 onForm S-8). |
| | 10 | .20 | | — | | Amendment to 1993 Long-Term Incentive Stock Option Plan, dated February 12, 1997. (Incorporated by reference to Exhibit 10.15 toForm 10-K for the fiscal year ended December 31, 1996). |
| | 10 | .21 | | — | | Amendment to 1993 Long-Term Incentive Stock Option Plan, dated November 13, 1997. (Incorporated by reference to Exhibit 10.17 toForm 10-K for fiscal year ended December 31, 1997). |
| | 10 | .22 | | — | | Amended 1996 Incentive Plan. (Incorporated by reference to Appendix A to Proxy Statement dated April 6, 2007). |
| | 10 | .23 | | — | | Split Dollar Life Insurance Plan. (Incorporated by reference to Exhibit 10.36 toForm 10-K for the fiscal year ended December 31, 1995). |
| | 10 | .24 | | — | | Supplemental Executive Retirement Plan for Senior Officers (as Amended and Restated Effective as of January 1, 1998). (Incorporated by reference to Exhibit 10.28 toForm 10-K for the fiscal year ended December 31, 1998). |
| | 10 | .25 | | — | | First Amendment to Supplemental Executive Retirement Plan for Senior Officers. (Incorporated by reference to Exhibit 10.28 toForm 10-K for the fiscal year ended December 31, 2000). |
| | 10 | .26 | | — | | SCI 401(k) Retirement Savings Plan as Amended and Restated. (Incorporated by reference to Exhibit 4.7 to Registration StatementNo. 333-119681). |
| | 10 | .27 | | — | | First Amendment to the SCI 401(k) Retirement Savings Plan. (Incorporated by reference to Exhibit 10.2 toForm 10-Q for the quarterly period ended September 30, 2004). |
| | 10 | .28 | | — | | Second Amendment to the SCI 401(k) Retirement Savings Plan, and Third Amendment to the SCI 401(k) Retirement Savings Plan. (Incorporated by reference to Exhibit 10.26 toForm 10-K for the fiscal year ended December 31, 2004). |
| | 10 | .29 | | — | | Fourth Amendment to the SCI 401(k) Retirement Savings Plan. (Incorporated by reference to Exhibit 10.27 toForm 10-K for the fiscal year ended December 31, 2006). |
| | 10 | .30 | | — | | Fifth Amendment to the SCI 401(k) Retirement Savings Plan. |
| | 10 | .31 | | — | | Amended and Restated Director Fee Plan. (Incorporated by reference to Annex A to Proxy Statement dated April 17, 2006). |
| | 10 | .32 | | — | | 1996 Nonqualified Incentive Plan. (Incorporated by reference to Exhibit 99.1 to Registration StatementNo. 333-33101). |
119
| | | | | | | |
Exhibit
| | | | |
Number | | | | Description |
| |
| | 10 | .33 | | — | | Amendment to 1996 Nonqualified Incentive Plan dated November 13, 1997. (Incorporated by reference to Exhibit 99.2 to Registration StatementNo. 333-50084). |
| | 10 | .34 | | — | | Amendment to 1996 Nonqualified Incentive Plan dated November 11, 1999. (Incorporated by reference to Exhibit 99.3 Registration StatementNo. 333-50084). |
| | 10 | .35 | | — | | Amendment to 1996 Nonqualified Incentive Plan dated February 14, 2001. (Incorporated by reference to Exhibit 99.4 to Registration StatementNo. 333-67800). |
| | 10 | .36 | | — | | Employee Stock Purchase Plan. (Incorporated by reference to Exhibit 1.1 to Registration StatementNo. 2-62484 onForm S-8). |
| | 10 | .37 | | — | | Amendment No. 1 to the Employee Stock Purchase Plan. (Incorporated by reference to Exhibit 15.1 to Registration StatementNo. 2-62484 onForm S-8). |
| | 10 | .38 | | — | | Amendment No. 2 to the Employee Stock Purchase Plan. (Incorporated by reference to Exhibit 28.3 to Registration StatementNo. 33-25061 onForm S-8). |
| | 10 | .39 | | — | | Amendment No. 3 to the Employee Stock Purchase Plan. (Incorporated by reference to Exhibit 28.4 to Registration StatementNo. 33-35708 onForm S-8). |
| | 10 | .40 | | — | | Amendment No. 4 to the Employee Stock Purchase Plan. (Incorporated by reference to Exhibit 4.1 to Current Report onForm 8-K dated December 21, 1993). |
| | 10 | .41 | | — | | Amendment No. 5 to the Employee Stock Purchase Plan. (Incorporated by reference to |
| | | | | | | Exhibit 10.31 toForm 10-K for the fiscal year ended December 31, 1999). |
| | 10 | .42 | | — | | Amendment No. 6 to the Employee Stock Purchase Plan. (Incorporated by reference to Exhibit 10.44 toForm 10-K for the fiscal year ended December 31, 2002. |
| | 10 | .43 | | — | | Amendment No. 7 to the Employee Stock Purchase Plan. (Incorporated by reference to Exhibit 10.45 toForm 10-K for the fiscal year ended December 31, 2002). |
| | 10 | .44 | | — | | Agreement between Merrill Lynch Canada Inc. and Service Corporation International. (Incorporated by reference to Exhibit 28.5 to Post-Effective Amendment No. 1 to Registration StatementNo. 33-8907 onForm S-8). |
| | 10 | .45 | | — | | First Amendment to Agreement between Merrill Lynch Canada Inc. and Service Corporation International. (Incorporated by reference to Exhibit 4.2 to Current Report onForm 8-K dated December 21, 1993). |
| | 10 | .46 | | — | | Employee Stock Purchase Plan Administration Agreement dated July 25, 2001 between Service Corporation International (Canada) Limited and Fastrak Systems Inc. (Incorporated by reference to Exhibit 10.48 toForm 10-K for the fiscal year ended December 31, 2002). |
| | 10 | .47 | | — | | Form of Indemnification Agreement for officers and directors. (Incorporated by reference to Exhibit 10.1 toForm 10-Q for the quarterly period ended September 30, 2004). |
| | 10 | .48 | | — | | Form of Executive Deferred Compensation Plan. (Incorporated by reference to Exhibit 10.52 toForm 10-K for the fiscal year ended December 31, 2005). |
| | 10 | .49 | | — | | Form of amendment to Executive Deferred Compensation Plan. |
| | 10 | .50 | | — | | Form of Performance Unit Grant Award Agreement. (Incorporated by reference to Exhibit 99.1 toForm 10-Q for the fiscal quarter ended September 30, 2007). |
| | 10 | .51 | | — | | Note Purchase Agreement, dated November 28, 2006 among Service Corporation International and Purchasers identified therein. (Incorporated by reference to Exhibit 4.1 to Current Report onForm 8-K dated November 28, 2006). |
| | 10 | .52 | | — | | First Amendment to Note Purchase Agreement, dated as of June 11, 2007, among the Company and the purchasers party thereto. (Incorporated by reference to Exhibit 10.2 toForm 8-K dated June 20, 2007). |
| | 10 | .53 | | — | | Credit Agreement, dated November 28, 2006 among Service Corporation International, the lenders party thereto, and JPMorgan Chase Bank, N.A., as Administrative Agent. (Incorporated by reference to Exhibit 4.2 to Current Report onForm 8-K dated November 28, 2006). |
| | 10 | .54 | | — | | Agreement and First Amendment to Credit Agreement, dated as of June 14, 2007, among the Company and the lenders party thereto. (Incorporated by reference to Exhibit 10.1 toForm 8-K dated June 20, 2007). |
120
| | | | | | | |
Exhibit
| | | | |
Number | | | | Description |
| |
| | 12 | .1 | | — | | Ratio of Earnings to Fixed Charges. |
| | 21 | .1 | | — | | Subsidiaries of the Company. |
| | 23 | .1 | | — | | Consent of Independent Registered Public Accounting Firm (PricewaterhouseCoopers LLP). |
| | 24 | .1 | | — | | Powers of Attorney. |
| | 31 | .1 | | — | | Certification of Thomas L. Ryan as Principal Executive Officer in satisfaction of Section 302 of the Sarbanes-Oxley Act of 2002. |
| | 31 | .2 | | — | | Certification of Eric D. Tanzberger as Principal Financial Officer in satisfaction of Section 302 of the Sarbanes-Oxley Act of 2002. |
| | 32 | .1 | | — | | Certification of Periodic Financial Reports by Thomas L. Ryan as Principal Executive Officer in satisfaction of Section 906 of the Sarbanes- Oxley Act of 2002. |
| | 32 | .2 | | — | | Certification of Periodic Financial Reports by Eric D. Tanzberger as Principal Financial Officer in satisfaction of Section 906 of the Sarbanes-Oxley Act of 2002. |
In the above list, the management contracts or compensatory plans or arrangements are set forth in Exhibits 10.1 through 10.50.
Pursuant to Item 601(b)(4) ofRegulation S-K, there are not filed as exhibits to this report certain instruments with respect to long-term debt under which the total amount of securities authorized thereunder does not exceed 10 percent of the total assets of Registrant and its subsidiaries on a consolidated basis. Registrant agrees to furnish a copy of any such instrument to the Commission upon request.
121