Exhibit 99.1

INVESTOR DAY NEW YORK, NY | February 20, 2018
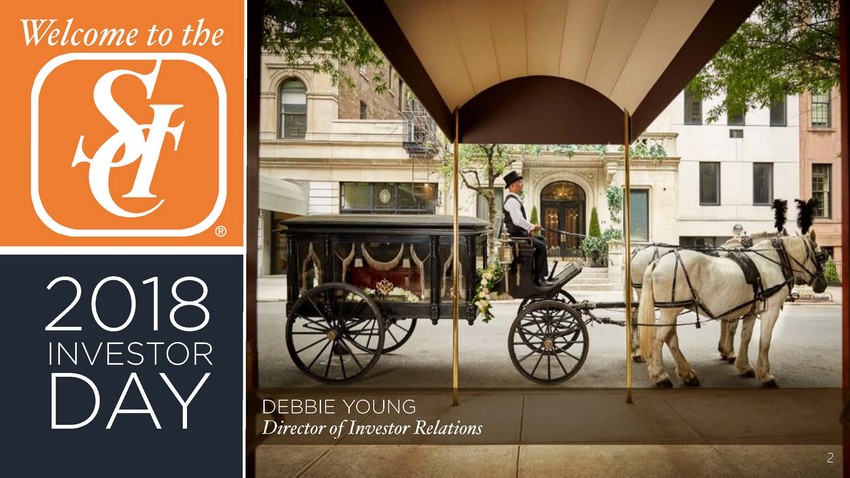
Welcome to the 2018 INVESTOR DAY DEBBIE YOUNG Director of Investor Relations 2

3 Management Introductions WELCOME TO THE 2018 SCI INVESTOR DAY Chairman of the Board | CEO President | COO SVP | CFO SVP | Operations SVP | Sales & Merchandising SVP, Operations Services VP, Business Development VP, Treasurer Director, Investor Relations Director, Financial Services MIKE WEBB ELISABETH NASH ERIC TANZBERGER JAY WARING STEVE TIDWELL JOHN FAULK AARON FOLEY DEBBIE YOUNG ANASTHASIA JONES TOM RYAN

Discussion Topics 4 1 Global Overview 2 Funeral 3 Cemetery 4 Preneed Funeral and Cemetery Sales Strategy 5 Business Development Strategy 6 Network Optimization and Customer - Facing Technology 7 Preneed Backlog 8 Financial Overview 9 Future Growth 2018 SCI INVESTOR DAY 1pm – 4pm WELCOME TO THE 2018 SCI INVESTOR DAY
FORWARD - LOOKING STATEMENTS The statements in this presentation that are not historical facts are forward - looking statements made in reliance on the “safe harbor” protections provided under the Private Securities Litigation Reform Act of 1995 . These statements are based on assumptions that the Company believes are reasonable ; however, many important factors could cause the Company’s actual results in the future to differ materially from the forward - looking statements made herein and in any other documents or oral presentations made by, or on behalf of, the Company . For further information on these and other risks and uncertainties, see our Securities and Exchange Commission filings, including our 2017 Annual Report on Form 10 - K filed on February 14 , 2018 . Copies of this document as well as other SEC filings can be obtained from our website at www . sci - corp . com . We assume no obligation to publicly update or revise any forward - looking statements made herein or any other forward - looking statements made by us, whether as a result of new information, future events, or otherwise . 5 WELCOME TO THE 2018 SCI INVESTOR DAY

SCI OVERVIEW INDUSTRY OVERVIEW COMPANY PERFORMANCE COMPANY STRATEGY GLOBAL OVERVIEW 6

COMPANY PERFORMANCE COMPANY STRATEGY SCI OVERVIEW INDUSTRY OVERVIEW GLOBAL OVERVIEW 7
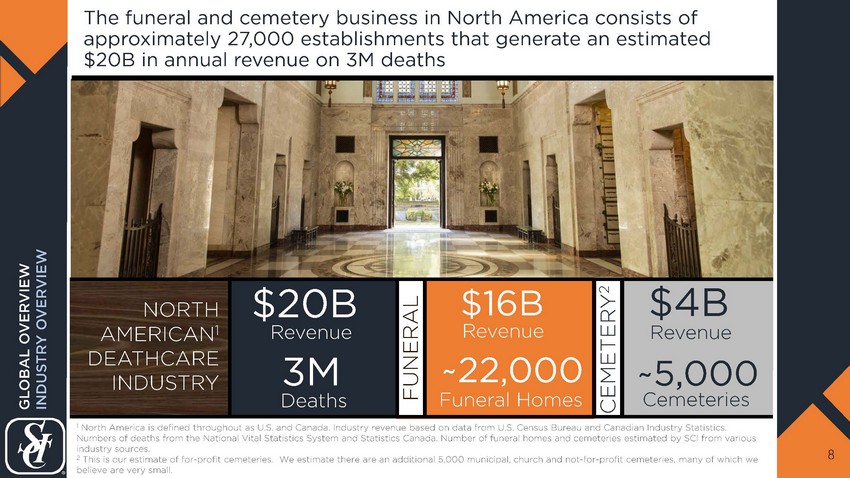
The funeral and cemetery business in North America consists of approximately 27,000 establishments that generate an estimated $20B in annual revenue on 3M deaths 8 GLOBAL OVERVIEW INDUSTRY OVERVIEW $16B ~22,000 Funeral Homes Revenue $4B Revenue ~ 5,000 Cemeteries $ 20B NORTH AMERICAN 1 DEATHCARE INDUSTRY Revenue 3M Deaths FUNERAL CEMETERY 2 1 North America is defined throughout as U.S. and Canada. I ndustry revenue based on data from U.S. Census Bureau and Canadian Industry Statistics. Numbers of deaths from the National Vital Statistics System and Statistics Canada. Number of funeral homes and cemeteries estimated by SCI from various industry sources . 2 This is our estimate of for - profit cemeteries. We estimate there are an additional 5,000 municipal, church and not - for - profit cemeteries, many of which we believe are very small.
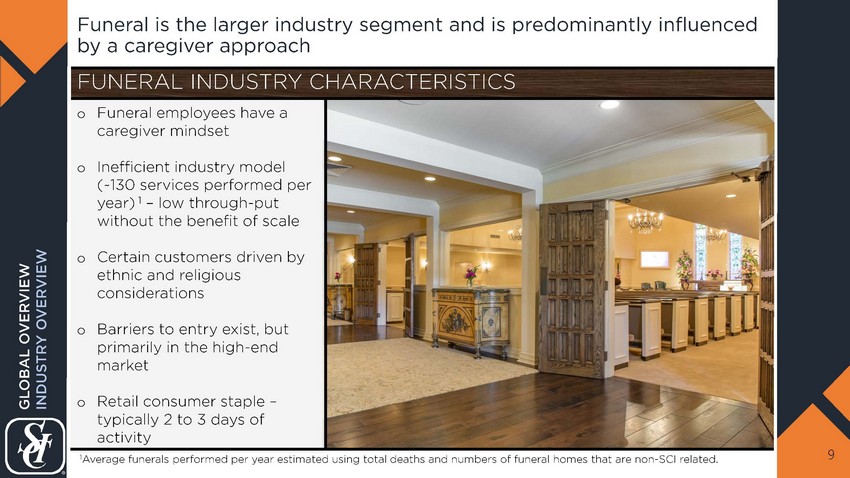
Funeral is the larger industry segment and is predominantly influenced by a caregiver approach 9 o Funeral employees have a caregiver mindset o Inefficient industry model (~130 services performed per year) 1 – low through - put without the benefit of scale o Certain customers driven by ethnic and religious considerations o Barriers to entry exist, but primarily in the high - end market o Retail consumer staple – typically 2 to 3 days of activity FUNERAL INDUSTRY CHARACTERISTICS 1 Average funerals performed per year estimated using total deaths and numbers of funeral homes that are non - SCI related. GLOBAL OVERVIEW INDUSTRY OVERVIEW

Cemetery is the smaller industry segment and is predominantly influenced by a sales - centric approach 10 o Cemetery employees have a sales - centric mindset o High barriers to entry – zoning restrictions and capital requirements o Ample capacity with very few new builds occurring o Retail consumer discretionary with real estate development strategy CEMETERY INDUSTRY CHARACTERISTICS GLOBAL OVERVIEW INDUSTRY OVERVIEW
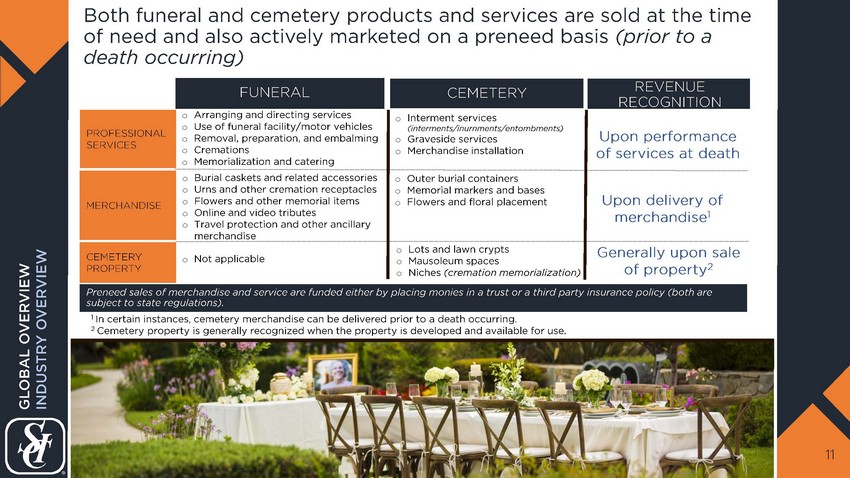
Both funeral and cemetery products and services are sold at the time of need and also actively marketed on a preneed basis (prior to a death occurring) 11 PROFESSIONAL SERVICES MERCHANDISE CEMETERY PROPERTY FUNERAL o Arranging and directing services o Use of funeral facility/motor vehicles o Removal, preparation, and embalming o Cremations o Memorialization and catering o Interment services (interments/inurnments/entombments) o Graveside services o Merchandise installation o Burial caskets and related accessories o Urns and other cremation receptacles o Flowers and other memorial items o Online and video tributes o Travel protection and other ancillary merchandise o Outer burial containers o Memorial markers and bases o Flowers and floral placement o Lots and lawn crypts o Mausoleum spaces o Niches (cremation memorialization) o Not applicable Preneed sales of merchandise and service are funded either by placing monies in a trust or a third party insurance policy (both are subject to state regulations ). CEMETERY REVENUE RECOGNITION Upon performance of services at death Generally upon sale of property 2 Upon delivery of merchandise 1 1 In certain instances, cemetery merchandise can be delivered prior to a death occurring. 2 Cemetery property is generally recognized when the property is developed and available for use. GLOBAL OVERVIEW INDUSTRY OVERVIEW

The demographic landscape of an aging population is already benefiting the cemetery industry and provides opportunity for the future 12 GLOBAL OVERVIEW INDUSTRY OVERVIEW 0 20,000 40,000 60,000 80,000 100,000 120,000 2010 2015 2020 2025 2030 2035 AGING OF AMERICA Atneed Customer Preneed F uneral C ustomer Preneed Cemetery Customer Late 50’s/Early 60’s Late 60’s/Early 70’s Late 70’s/Early 80’s AVERAGE AGE SCI CUSTOMER LEGEND SOURCE: U.S. Census Bureau Population (in thousands) Age 55 - 64 Age 65 - 74 Age 75+
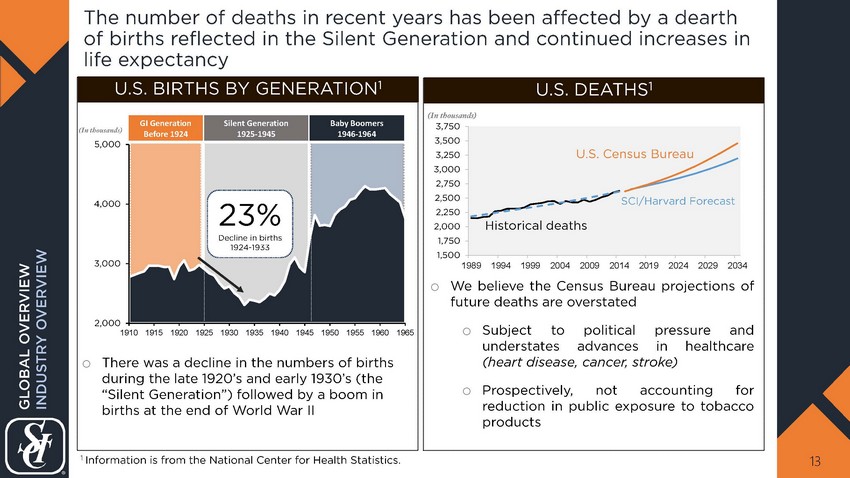
The number of deaths in recent years has been affected by a dearth of births reflected in the S ilent Generation and continued increases in life expectancy 13 U.S. BIRTHS BY GENERATION 1 (In thousands) U.S. DEATHS 1 (In thousands) o There was a decline in the numbers of births during the late 1920’s and early 1930’s (the “Silent Generation”) followed by a boom in births at the end of World War II o We believe the Census B ureau projections of future deaths are overstated o Subject to political pressure and understates advances in healthcare (heart disease, cancer, stroke) o Prospectively, not accounting for reduction in public exposure to tobacco products 1,500 1,750 2,000 2,250 2,500 2,750 3,000 3,250 3,500 3,750 1989 1994 1999 2004 2009 2014 2019 2024 2029 2034 SCI/Harvard Forecast U.S. Census Bureau Historical deaths GLOBAL OVERVIEW INDUSTRY OVERVIEW 23% Decline in births 1924 - 1933 1 Information is from the National Center for Health Statistics. 2,000 3,000 4,000 5,000 1910 1915 1920 1925 1930 1935 1940 1945 1950 1955 1960 1965 GI Generation Before 1924 Silent Generation 1925 - 1945 Baby Boomers 1946 - 1964

INDUSTRY OVERVIEW COMPANY STRATEGY Chairman of the Board and Chief Executive Officer TOM RYAN COMPANY PERFORMANCE SCI OVERVIEW GLOBAL OVERVIEW 14

We are the largest company in the highly fragmented deathcare space with ~15% - 16% revenue market share in the U .S. and Canada 15 $3.1B Revenue Capitalization 2 SCI MARKET 1 Information is based on consolidated information as of December 31, 2017. GLOBAL OVERVIEW SCI OVERVIEW $1.7B Preneed Sales $10.7B Backlog of Future Revenue Employees 23,400 2 1.6% StoneMor 1 3 1.3% Carriage 1 4 1.2% NorthStar 1 5 1.1% Arbor 1 2017 SCI FINANCIAL SNAPSHOT 1 1 15% - 16% SCI LARGEST NORTH AMERICAN DEATHCARE COMPANIES 2 As of February 14, 2018 1 Carriage and StoneMor revenue are based on publicly available information. NorthStar and Arbor are based on internal estimates.

Our funeral segment generates ~60% of consolidated revenue and provides steady margins and cash flow 16 o National brands, e.g., Dignity Memorial o Leveraging our scale from operations o Proactive preneed sales program o Contemporary products and life celebrations o Leading edge customer - facing technology enhancing customer selection process and transparency o Ability to serve varying customer preferences o Asset - light SCI Direct business emphasizing a preneed strategy o Funeral revenue generally reliant upon death occurring (tough to grow until we see demographic benefit) 1 SCI’s funeral market share is based on revenue data from U.S. Census Bureau and Statistics Canada. 2 SCI’s preneed market share is based on internal estimates. NOTE: Information is based on consolidated information for the year ended December 31, 2017, except for operating margin and services performed, which are presented for comparable locations. GLOBAL OVERVIEW SCI OVERVIEW $1.9B REVENUE 11% - 12% REVENUE MARKETSHARE 1 1,488 LOCATIONS $829M PRENEED SALES 22% - 25% estimated preneed market share 2 $7.9B PRENEED BACKLOG 303K SERVICES PERFORMED 19% - 21% OPERATING PROFIT MARGIN NOTABLE DIFFERENTIATING FACTORS OF A SCI FUNERAL HOME FROM THE INDUSTRY
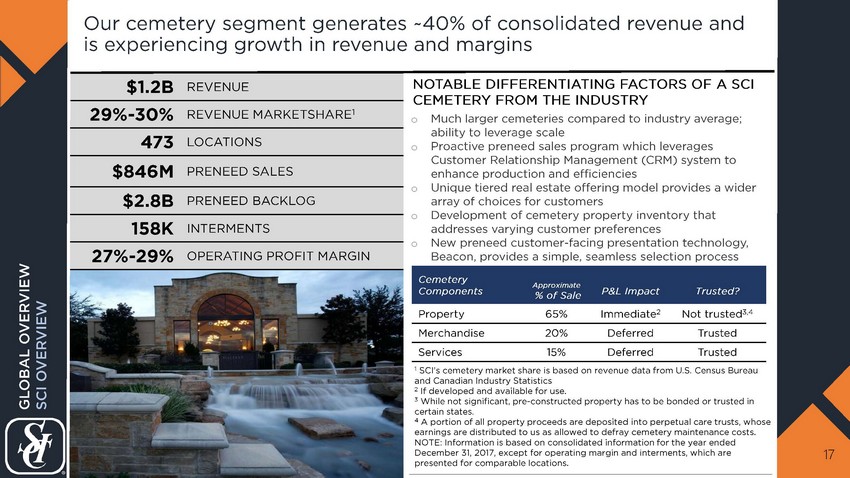
Our cemetery segment generates ~40% of consolidated revenue and is experiencing growth in revenue and margins 17 o Much larger cemeteries compared to industry average; ability to leverage scale o Proactive preneed sales program which leverages Customer Relationship Management (CRM) system to enhance production and efficiencies o Unique tiered real estate offering model provides a wider array of choices for customers o Development of cemetery property inventory that addresses varying customer preferences o New preneed customer - facing presentation technology, Beacon, provides a simple, seamless selection process NOTABLE DIFFERENTIATING FACTORS OF A SCI CEMETERY FROM THE INDUSTRY Cemetery Components Approximate % of Sale P&L Impact Trusted? Property 65% Immediate 2 Not trusted 3,4 Merchandise 20% Deferred Trusted Services 15% Deferred Trusted 1 SCI’s cemetery market share is based on revenue data from U.S. Census Bureau and Canadian Industry Statistics 2 If developed and available for use. 3 While not significant, pre - constructed property has to be bonded or trusted in certain states. 4 A portion of all property proceeds are deposited into perpetual care trusts, whose earnings are distributed to us as allowed to defray cemetery maintenance costs. NOTE: Information is based on consolidated information for the year ended December 31, 2017, except for operating margin and interments, which are presented for comparable locations. GLOBAL OVERVIEW SCI OVERVIEW $1.2B REVENUE 29% - 30% REVENUE MARKETSHARE 1 473 LOCATIONS $846M PRENEED SALES $2.8B PRENEED BACKLOG 158K INTERMENTS 27% - 29% OPERATING PROFIT MARGIN
INDUSTRY OVERVIEW SCI OVERVIEW COMPANY STRATEGY COMPANY PERFORMANCE GLOBAL OVERVIEW 18
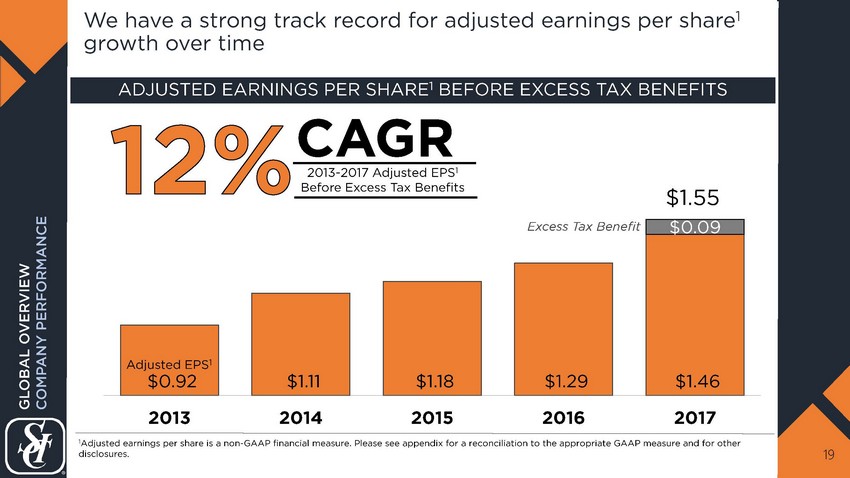
We have a strong track record for adjusted earnings per share 1 growth over time 19 CAGR $0.92 $1.11 $1.18 $1.29 $1.46 $0.09 2013 2014 2015 2016 2017 ADJUSTED EARNINGS PER SHARE 1 BEFORE EXCESS TAX BENEFITS Adjusted EPS 1 Excess Tax Benefit 1 Adjusted earnings per share is a non - GAAP financial measure. Please see appendix for a reconciliation to the appropriate GAAP measure and for other disclosures. 2013 - 2017 Adjusted EPS 1 Before Excess Tax Benefits GLOBAL OVERVIEW COMPANY PERFORMANCE $1.55

$465 $551 $607 $621 $687 $(25) $(42) $(93) $(113) $(133) We also have steady and robust cash flow despite our journey towards becoming a full cash tax payer 20 2013 2014 2015 2016 2017 Adjusted Operating Cash Flows $440M $509M $514M $508M $554M 10% CAGR Adjusted Operating Cash Flows before Recurring Cash Taxes Recurring Cash Taxes 1 Adjusted operating cash flow is a non - GAAP financial measure. Please see appendix for a reconciliation to the appropriate GAAP measure and for other disclosures . 2013 - 2017 Adjusted Operating Cash Flows before Recurring Cash Taxes GLOBAL OVERVIEW COMPANY PERFORMANCE In millions ADJUSTED OPERATING CASH FLOW 1 AND RECURRING CASH TAXES
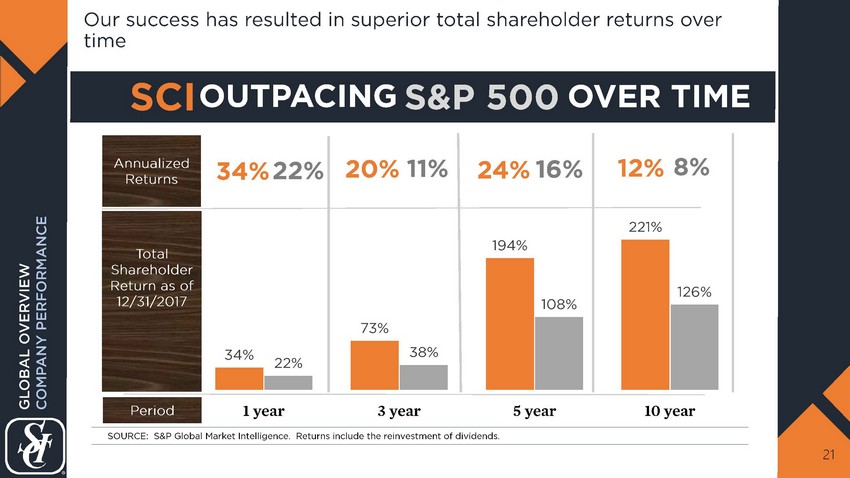
Our success has resulted in superior total shareholder returns over time 21 Total Shareholder Return as of 12/31/2017 34% 73% 194% 221% 22% 38% 108% 126% 1 year 3 year 5 year 10 year Annualized Returns 22% 20% 34% 11% 16% 12% 24% 8 % SCI S&P 500 OUTPACING Period OVER TIME SOURCE: S&P Global Market Intelligence. Returns include the reinvestment of dividends. GLOBAL OVERVIEW COMPANY PERFORMANCE

INDUSTRY OVERVIEW SCI OVERVIEW COMPANY PERFORMANCE COMPANY STRATEGY GLOBAL OVERVIEW 22

Our three core strategies are centered on our customer and our competitive advantages 23 FIRST CORE STRATEGY SECOND CORE STRATEGY THIRD CORE STRATEGY o Remain relevant to our customers o Drive preneed sales now and into the future o Develop the sales organization o Network optimization and customer - facing technology o Preneed backlog o Growth capital o Dividends o Share repurchases o Debt profile and liquidity management REVENUE SCALE CAPITAL GLOBAL OVERVIEW COMPANY STRATEGY
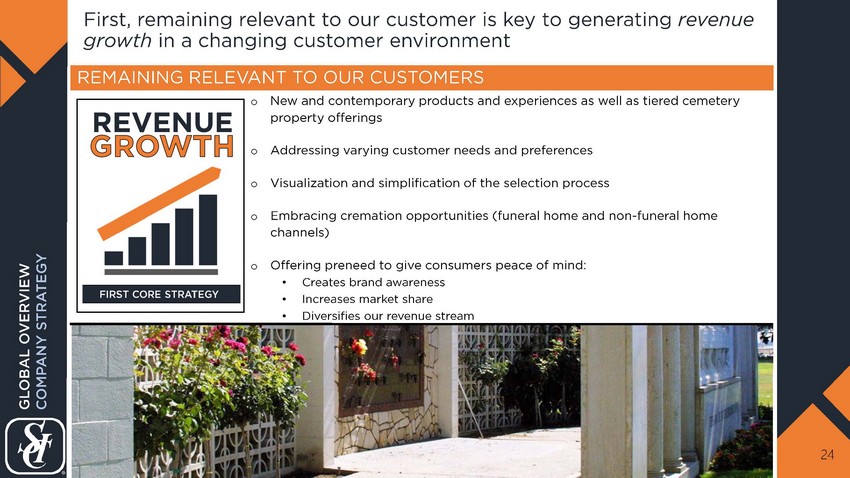
First, remaining relevant to our customer is key to generating revenue growth in a changing customer environment 24 REMAINING RELEVANT TO OUR CUSTOMERS o New and contemporary products and experiences as well as tiered cemetery property offerings o Addressing varying customer needs and preferences o Visualization and simplification of the selection process o Embracing cremation opportunities (funeral home and non - funeral home channels) o Offering preneed to give consumers peace of mind: • Creates brand awareness • Increases market share • Diversifies our revenue stream GLOBAL OVERVIEW COMPANY STRATEGY
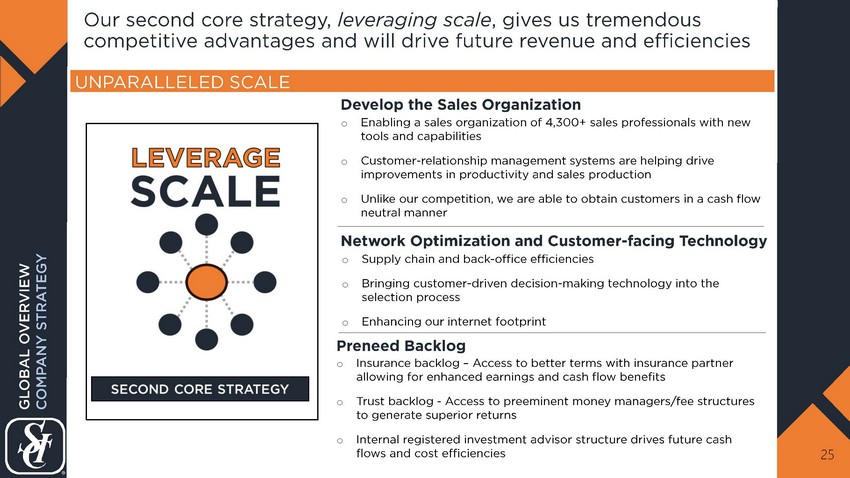
Our second core strategy, leveraging scale , gives us tremendous competitive advantages and will drive future revenue and efficiencies 25 o Enabling a sales organization of 4,300+ sales professionals with new tools and capabilities o Customer - relationship management systems are helping drive improvements in productivity and sales production o Unlike our competition, we are able to obtain customers in a cash flow neutral manner o Insurance b acklog – Access to better terms with insurance partner allowing for enhanced earnings and cash flow benefits o Trust backlog - Access to preeminent money managers/fee structures to generate superior returns o Internal registered investment advisor structure drives future cash flows and cost efficiencies o Supply chain and back - office efficiencies o Bringing customer - driven decision - making technology into the selection process o Enhancing our internet footprint Develop the Sales Organization Preneed Backlog Network Optimization and Customer - facing Technology UNPARALLELED SCALE GLOBAL OVERVIEW COMPANY STRATEGY
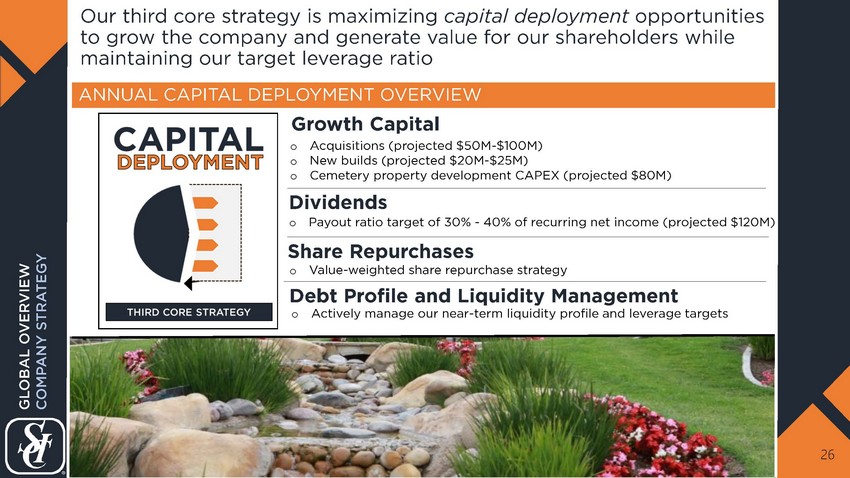
Our third core strategy is maximizing capital deployment opportunities to grow the company and generate value for our shareholders while maintaining our target leverage ratio 26 ANNUAL CAPITAL DEPLOYMENT OVERVIEW Dividends Share Repurchases Debt Profile and Liquidity Management o Payout ratio target of 30% - 40% of recurring net income (projected $120M) o Value - weighted share repurchase strategy o Actively manage our near - term liquidity profile and leverage targets Growth Capital o Acquisitions (projected $50M - $100M) o New builds (projected $20M - $25M) o Cemetery property development CAPEX (projected $80M) GLOBAL OVERVIEW COMPANY STRATEGY
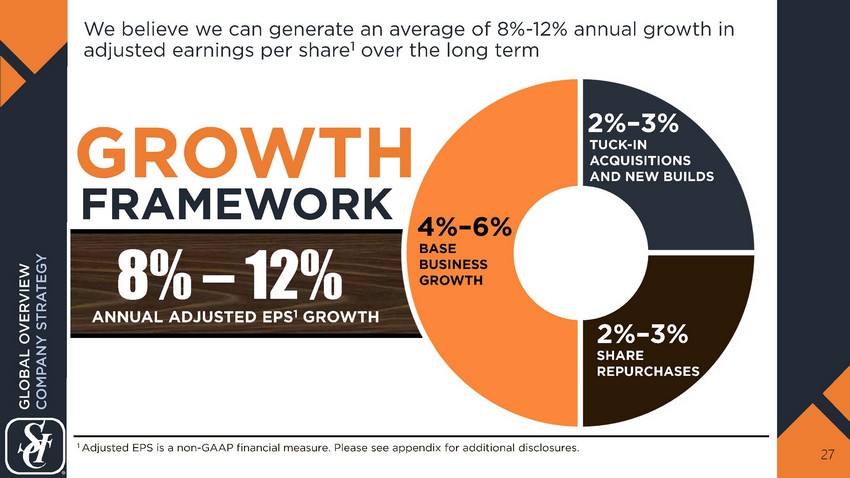
We believe we can generate an average of 8% - 12% annual growth in adjusted earnings per share 1 over the long term 27 FRAMEWORK 2 % – 3% SHARE REPURCHASES 1 Adjusted EPS is a non - GAAP financial measure. Please see appendix for additional disclosures. 2 % – 3% 4% – 6% BASE BUSINESS GROWTH TUCK - IN ACQUISITIONS AND NEW BUILDS ANNUAL ADJUSTED EPS 1 GROWTH GLOBAL OVERVIEW COMPANY STRATEGY 8% – 12% GROWTH
FUNERAL SENIOR VICE PRESIDENT JAY WARING FUNERAL OVERVIEW CUSTOMER TRENDS North American Operations 28
CUSTOMER TRENDS FUNERAL OVERVIEW FUNERAL 29

Our 1,488 funeral locations serve our customers through two channels addressing unique preferences 30 o Simple and direct service at low price o Ability to pre - plan arrangements o Does not want to visit a funeral home o Does not want service or memorialization o Quality and prestige o Reputation o Location convenience o Religious, ethnic, and cultural FUNERAL HOME NON - FUNERAL HOME CHANNELS CUSTOMER NEEDS FUNERAL FUNERAL OVERVIIEW
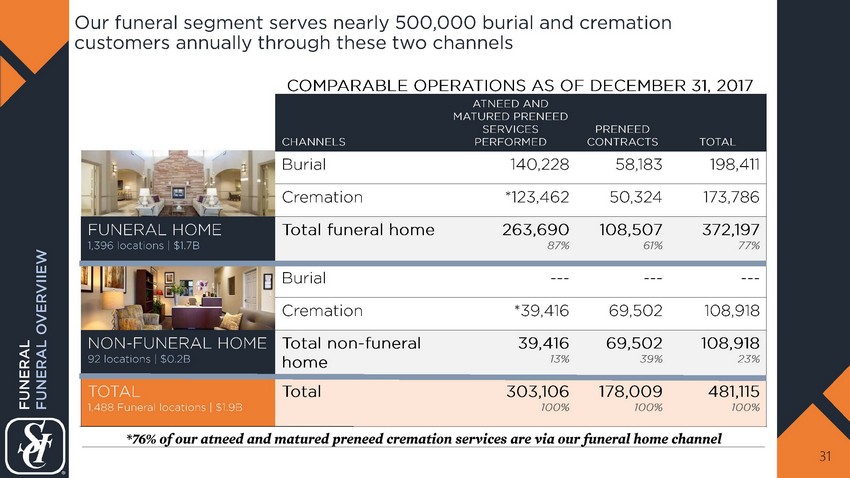
CHANNELS ATNEED AND MATURED PRENEED SERVICES PERFORMED PRENEED CONTRACTS TOTAL Burial 140,228 58,183 198,411 Cremation *123,462 50,324 173,786 FUNERAL HOME 1,396 locations | $1.7B Total funeral home 263,690 87% 108,507 61% 372,197 77% Burial --- --- --- Cremation *39,416 69,502 108,918 NON - FUNERAL HOME 92 locations | $0.2B Total non - funeral home 39,416 13% 69,502 39% 108,918 23% TOTAL 1,488 Funeral locations | $1.9B Total 303,106 100% 178,009 100% 481,115 100% Our funeral segment serves nearly 500,000 burial and cremation customers annually through these two channels 31 *76% of our a tneed and matured preneed cremation services are via our funeral home channel FUNERAL FUNERAL OVERVIIEW COMPARABLE OPERATIONS AS OF DECEMBER 31, 2017
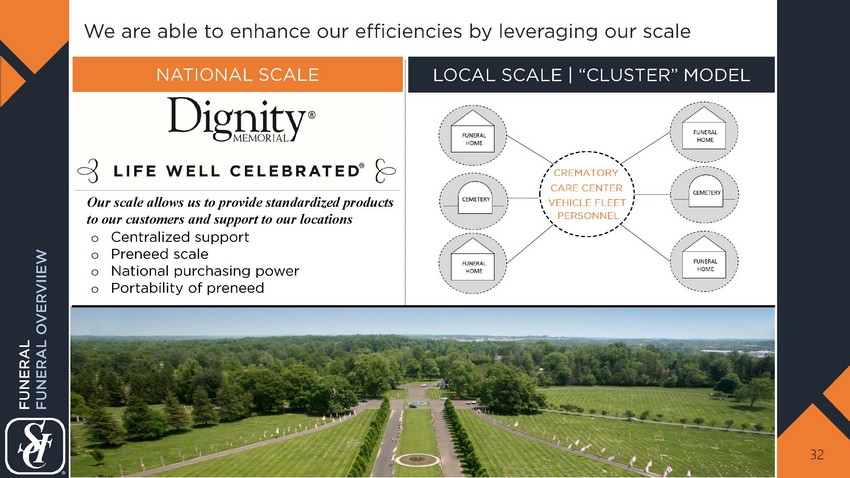
We are able to enhance our efficiencies by leveraging our scale 32 o Centralized support o Preneed scale o National purchasing power o Portability of preneed NATIONAL SCALE LOCAL SCALE | “CLUSTER” MODEL Our scale allows us to provide standardized products to our customers and support to our locations CREMATORY CARE CENTER VEHICLE FLEET PERSONNEL FUNERAL FUNERAL OVERVIIEW

FUNERAL OVERVIEW Palm Mortuary Southwest | Las Vegas, NV CUSTOMER TRENDS o Customer Preferences o Cremation Overview o Contemporary Products and Services FUNERAL 33
FUNERAL CUSTOMER TRENDS: Customer Preferences 34
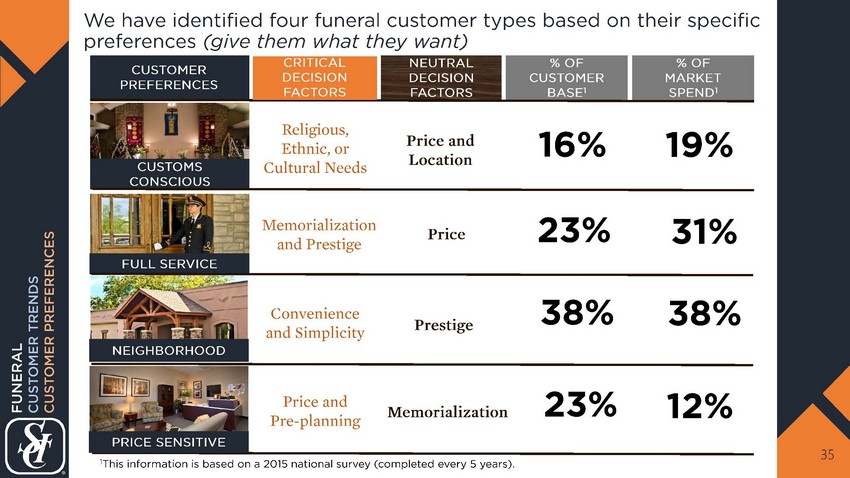
We have identified four funeral customer types based on their specific preferences (give them what they want) 35 FUNERAL CUSTOMER TRENDS CUSTOMER PREFERENCES Memorialization and Prestige Religious, Ethnic, or Cultural N eeds Convenience and Simplicity Price and Pre - planning Price Price and Location Prestige Memorialization CUSTOMER PREFERENCES 31% 12% % OF CUSTOMER BASE 1 23% 16% 38% 23% 19% FULL SERVICE CUSTOMS CONSCIOUS NEUTRAL DECISION FACTORS % OF MARKET SPEND 1 1 This information is based on a 2015 national survey (completed every 5 years). 38% NEIGHBORHOOD PRICE SENSITIVE CRITICAL DECISION FACTORS
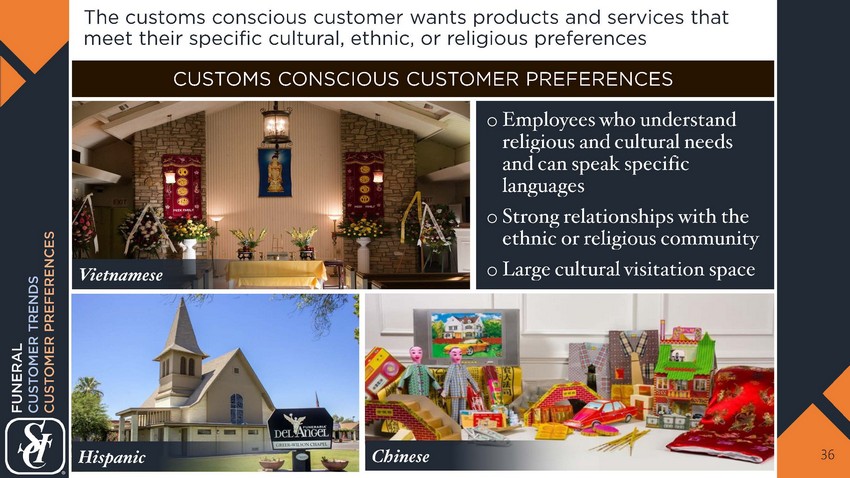
The customs conscious customer wants products and services that meet their specific cultural, ethnic, or religious preferences o Employees who understand religious and cultural needs and can speak specific languages o Strong relationships with the ethnic or religious community o Large cultural visitation space 36 Vietnamese CUSTOMS CONSCIOUS CUSTOMER PREFERENCES FUNERAL CUSTOMER TRENDS CUSTOMER PREFERENCES Hispanic Chinese

The full service funeral customer desires prestige and premier facilities o Prestigious location o High staff to guest ratio o White glove service o Large visitation space 37 FULL SERVICE CUSTOMER PREFERENCES FUNERAL CUSTOMER TRENDS CUSTOMER PREFERENCES

The neighborhood customer is primarily looking for simple quality and convenience as well as value for price o Location in close proximity to family and/or residence o Simplicity of packaging to facilitate efficient selection experience o Guidance in determining what they want for memorialization o Trending towards more contemporary approach (must provide options) 38 NEIGHBORHOOD CUSTOMER PREFERENCES Catered Reception FUNERAL CUSTOMER TRENDS CUSTOMER PREFERENCES Event Room
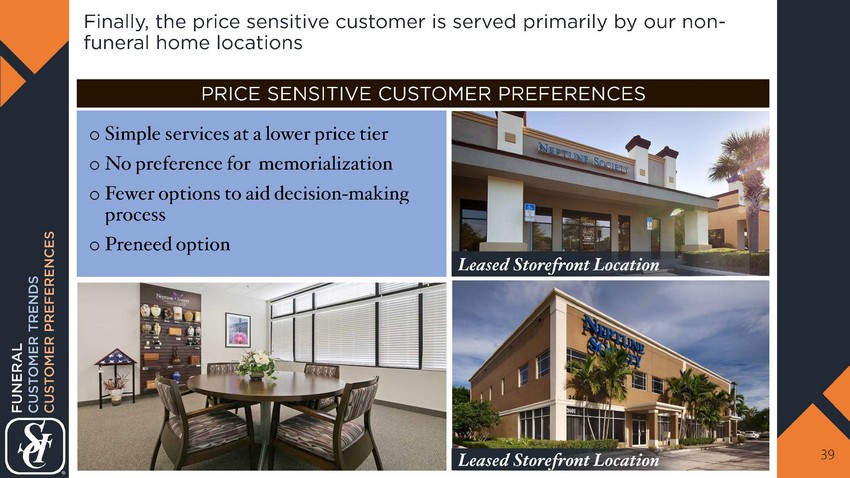
Finally, the price sensitive customer is served primarily by our non - funeral home locations o Simple services at a lower price tier o No preference for memorialization o Fewer options to aid decision - making process o Preneed option 39 PRICE SENSITIVE CUSTOMER PREFERENCES Leased Storefront Location Leased Storefront Location FUNERAL CUSTOMER TRENDS CUSTOMER PREFERENCES
CUSTOMER TRENDS: Cremation Overview FUNERAL 40
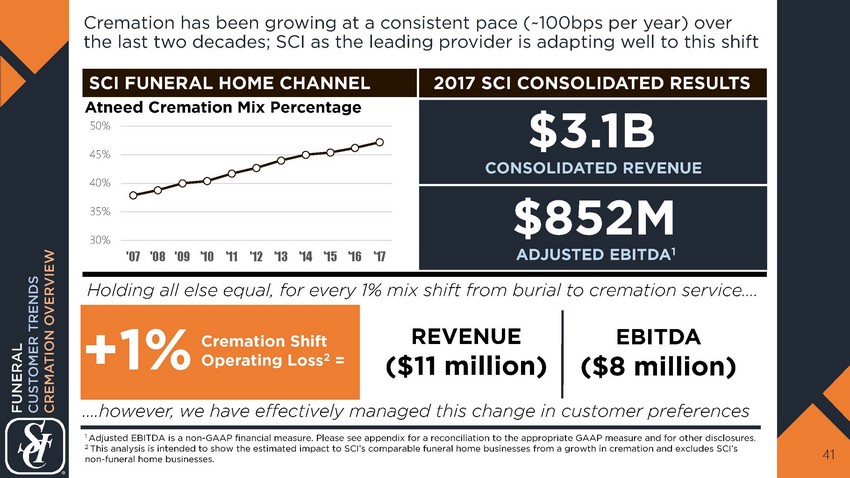
Cremation has been growing at a consistent pace (~100bps per year) over the last two decades; SCI as the leading provider is adapting well to this shift 41 $3.1B $ 852M REVENUE ($11 million) EBITDA ($8 million) Cremation Shift Operating Loss 2 = +1% ADJUSTED EBITDA 1 Holding all else equal, for every 1% mix shift from burial to cremation service…. 1 Adjusted EBITDA is a non - GAAP financial measure. Please see appendix for a reconciliation to the appropriate GAAP measure and for other d isclosures. 2 This analysis is intended to show the estimated impact to SCI’s comparable funeral home businesses from a growth in cremation an d excludes SCI’s non - funeral home businesses. 30% 35% 40% 45% 50% '07 '08 '09 '10 '11 '12 '13 '14 '15 '16 '17 ….however, we have effectively managed this change in customer preferences SCI FUNERAL HOME CHANNEL CONSOLIDATED REVENUE FUNERAL CUSTOMER TRENDS CREMATION OVERVIEW 2017 SCI CONSOLIDATED RESULTS Atneed Cremation Mix Percentage
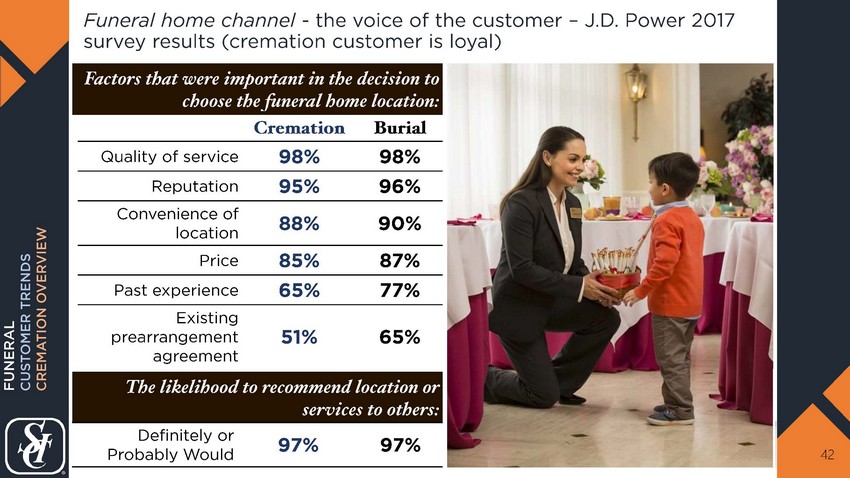
Funeral home channel - the voice of the customer – J.D. Power 2017 survey results (cremation customer is loyal) 42 Factors that were important in the decision to choose the funeral home location: Cremation Burial Quality of service 98% 98% Reputation 95% 96% Convenience of location 88% 90% Price 85% 87% Past experience 65% 77% Existing prearrangement agreement 51% 65% The likelihood to recommend location or services to others: Definitely or Probably Would 97% 97% FUNERAL CUSTOMER TRENDS CREMATION OVERVIEW
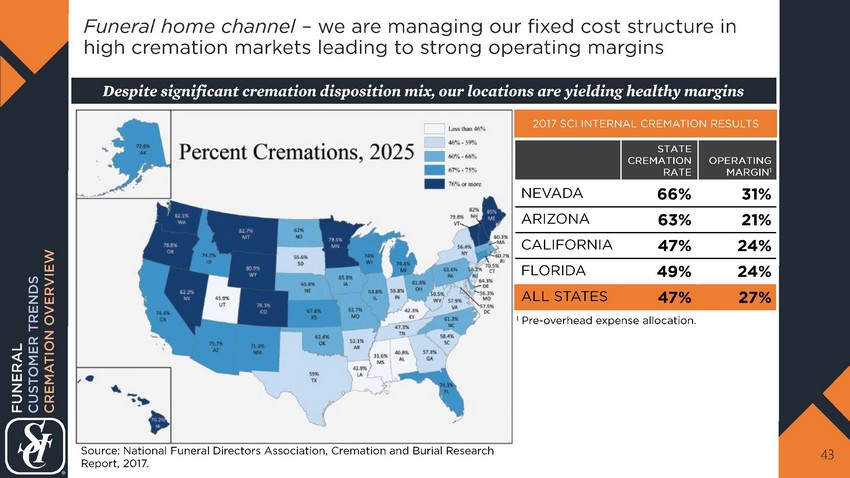
Funeral home channel – we are managing our fixed cost structure in high cremation markets leading to strong operating margins 43 1 Pre - overhead expense allocation. Despite significant cremation disposition mix, our locations are yielding healthy margins FUNERAL CUSTOMER TRENDS CREMATION OVERVIEW STATE CREMATION RATE OPERATING MARGIN 1 NEVADA 66% 31% ARIZONA 63% 21% CALIFORNIA 47% 24% FLORIDA 49% 24% ALL STATES 47% 27% Source: National Funeral Directors Association, Cremation and Burial Research Report, 2017. 2017 SCI INTERNAL CREMATION RESULTS
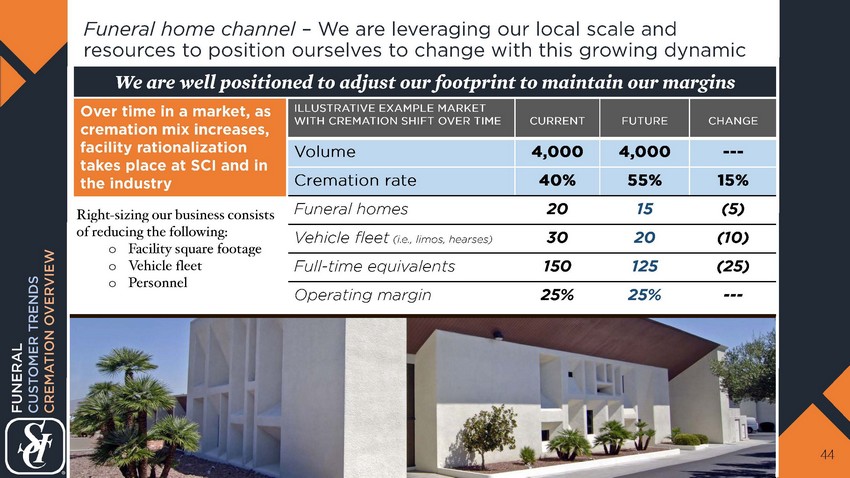
Funeral home channel – We are leveraging our local scale and resources to position ourselves to change with this growing dynamic 44 Right - sizing our business consists of reducing the following: o Facility square f ootage o Vehicle fleet o Personnel Over time in a market, as cremation mix increases, facility rationalization takes place at SCI and in the industry We are well positioned to adjust our footprint to maintain our margins ILLUSTRATIVE E XAMPLE MARKET WITH CREMATION SHIFT OVER TIME CURRENT FUTURE CHANGE Volume 4,000 4,000 --- Cremation rate 40% 55% 15% Funeral homes 20 15 (5) Vehicle fleet (i.e., limos, hearses) 30 20 (10) Full - time equivalents 150 125 (25) Operating margin 25% 25% --- FUNERAL CUSTOMER TRENDS CREMATION OVERVIEW
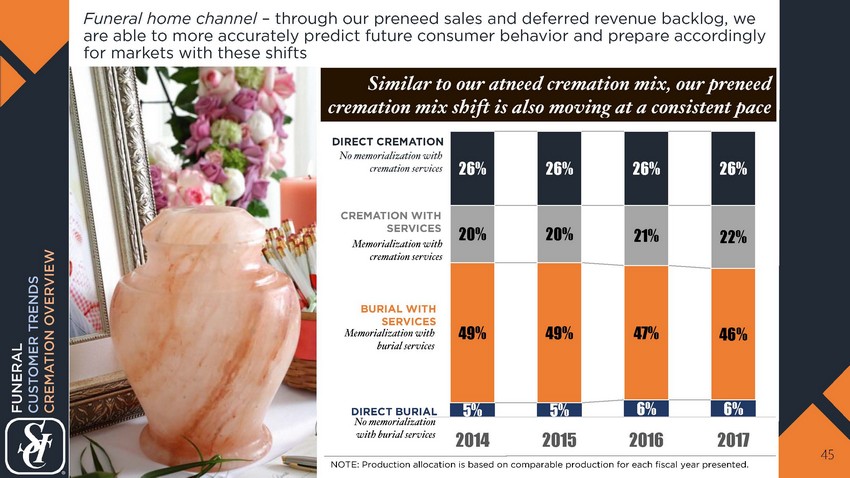
Funeral home channel – through our preneed sales and deferred revenue backlog, we are able to more accurately predict future consumer behavior and prepare accordingly for markets with these shifts 45 Similar to our atneed cremation mix, our preneed cremation mix shift is also moving at a consistent pace DIRECT CREMATION CREMATION WITH SERVICES BURIAL WITH SERVICES DIRECT BURIAL No memorialization with cremation services Memorialization with cremation services Memorialization with burial services No memorialization with burial services NOTE: Production allocation is based on comparable production for each fiscal year presented. 5% 5% 6% 6% 49% 49% 47% 46% 20% 20% 21% 22% 26% 26% 26% 26% 2014 2015 2016 2017 FUNERAL CUSTOMER TRENDS CREMATION OVERVIEW
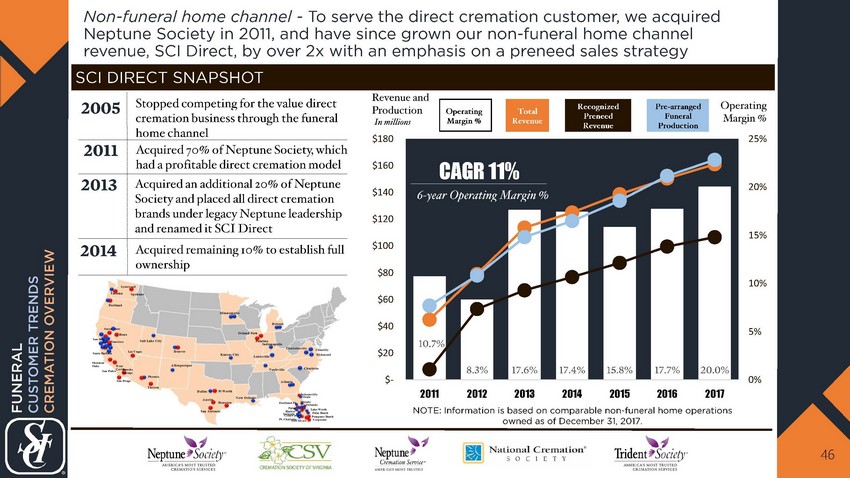
Non - funeral home channel - To serve the direct cremation customer, we acquired N eptune Society in 2011, and have since grown our non - funeral home channel revenue, SCI Direct, by over 2x with an emphasis on a preneed sales strategy 46 10.7% 8.3% 17.6% 17.4% 15.8% 17.7% 20.0% 0% 5% 10% 15% 20% 25% $- $20 $40 $60 $80 $100 $120 $140 $160 $180 2011 2012 2013 2014 2015 2016 2017 CAGR 11% SCI DIRECT SNAPSHOT I n millions A cquired 70% of Neptune Society, which had a profitable direct cremation model 2011 Acquired remaining 10% to establish full ownership 2013 2005 Stopped competing for the value direct cremation business through the funeral home channel NOTE: Information is based on comparable non - funeral home operations owned as of December 31, 2017. Revenue and Production 6 - year Operating Margin % Operating Margin % 2014 Acquired an additional 20 % of Neptune Society and placed all direct cremation brands under legacy Neptune leadership and renamed it SCI Direct FUNERAL CUSTOMER TRENDS CREMATION OVERVIEW Operating Margin % Total Revenue Recognized Preneed Revenue Pre - arranged Funeral Production
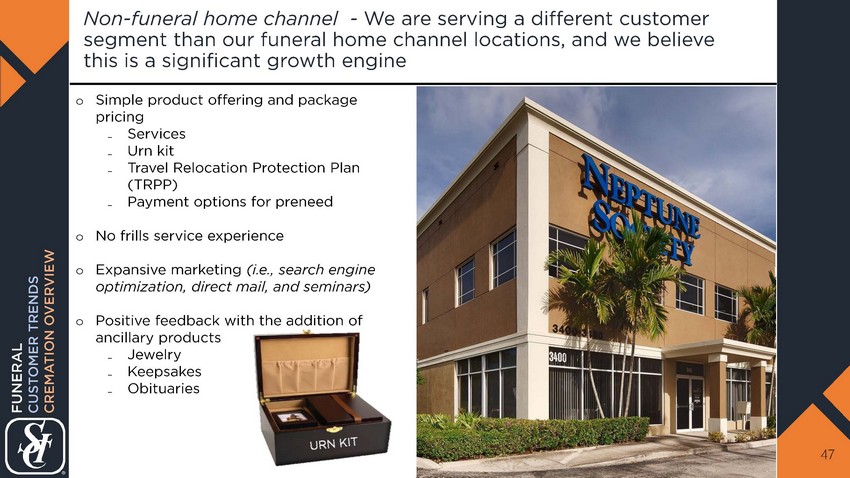
Non - funeral home channel - We are serving a different customer segment than our funeral home channel locations, and we believe this is a significant growth engine 47 o Simple product offering and package pricing ₋ Services ₋ Urn kit ₋ Travel Relocation Protection Plan (TRPP ) ₋ Payment options for preneed o No frills service experience o Expansive marketing (i.e., search e ngine o ptimization, direct mail, and seminars) o Positive feedback with the addition of ancillary products ₋ Jewelry ₋ Keepsakes ₋ Obituaries FUNERAL CUSTOMER TRENDS CREMATION OVERVIEW

Non - funeral home channel - Due to our scale, we have been able to significantly grow SCI Direct without substantial capital outlays, which is partially offsetting the cremation mix shift headwind in our funeral home channel 48 UNDERLYING GROWTH FACTORS o Scale in existing and new markets with ample room to grow (crematory and personal care center concentrations) o Low investment of ~$150K investment per location o Acquisition of direct cremation brands o 3.7% CAGR improvement in atneed volume since 2013 (growth in funeral business) o Preneed contract average has increased 4% - 5% annually o Recognized preneed revenue (delivery of merchandise and travel protection sold on a preneed contract) grows at high single digit percentages, helping to drive margin expansion of over 200bps o Minimal cannibalization of our funeral home channel volume or revenue growth as this channel addresses the needs of a different customer o Operating profit growth of $4M - $5M annually FUTURE GROWTH PLAN FOR SCI DIRECT o Grow the top line and focus on margin expansion through ancillary products and cost synergies o Continued location expansion − 6 to 8 new locations annually − Compete in markets where population is greater than 400K within 25 miles INVESTMENT GROWTH FACTORS (Capital Deployment) ORGANIC GROWTH FACTORS FUNERAL CUSTOMER TRENDS CREMATION OVERVIEW Operating profit of $4M - $5M ANNUALLY offsets HALF OF THE CREMATION MIX SHIFT HEADWIND in our funeral home channel
CUSTOMER TRENDS: Contemporary Products and Services FUNERAL 49

Some customers are transitioning from traditional mourning to unique ceremonial services 50 TRADITIONAL CONTEMPORARY FUNERAL CUSTOMER TRENDS CONTEMPORARY PRODUCTS AND SERVICES

Whether burial or cremation, funeral customs are changing from the mourning of death to celebration of life 51 o T raditional casket rooms have been transformed into event rooms o Funeral directors have been trained to plan post - ceremonial events FUNERAL CUSTOMER TRENDS CONTEMPORARY PRODUCTS AND SERVICES
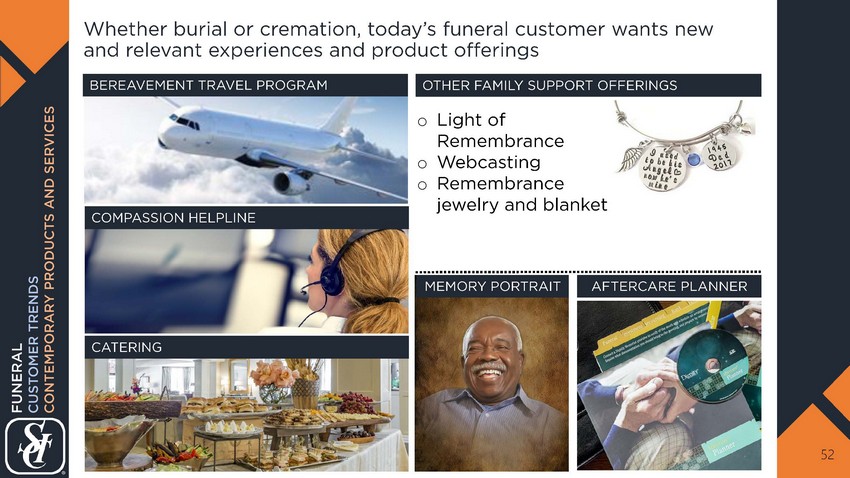
o Light of Remembrance o Webcasting o Remembrance jewelry and blanket Whether burial or cremation, today’s funeral customer wants new and relevant experiences and product offerings 52 OTHER FAMILY SUPPORT OFFERINGS CATERING BEREAVEMENT TRAVEL PROGRAM MEMORY PORTRAIT AFTERCARE PLANNER COMPASSION HELPLINE FUNERAL CUSTOMER TRENDS CONTEMPORARY PRODUCTS AND SERVICES
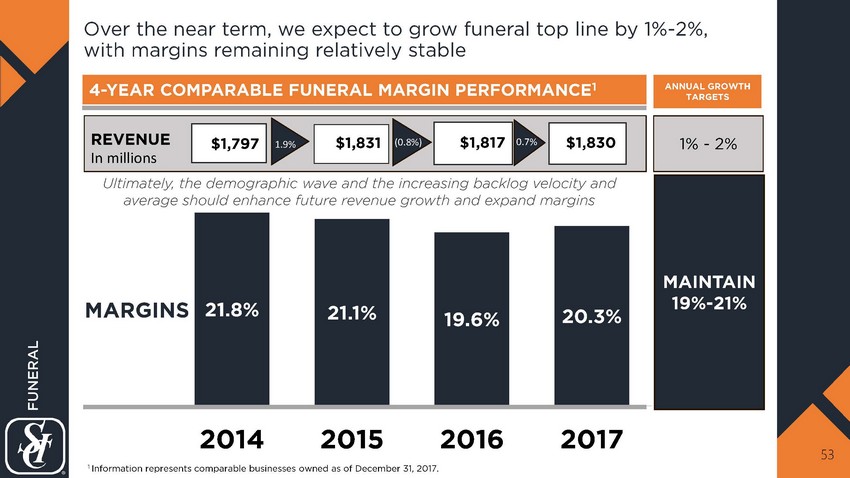
21.8% 21.1% 19.6% 20.3% 2014 2015 2016 2017 Over the near term, we expect to grow funeral top line by 1% - 2%, with margins remaining relatively stable 53 1 Information represents comparable businesses owned as of December 31, 2017. 4 - YEAR COMPARABLE FUNERAL MARGIN PERFORMANCE 1 ANNUAL GROWTH TARGETS 1 % - 2% MAINTAIN 19% - 21% FUNERAL $1,817 $1,831 $1,830 MARGINS REVENUE 0.7% In millions Ultimately, the demographic wave and the increasing backlog velocity and average should enhance future revenue growth and expand margins (0.8%) $1,797 1.9%

We are strategically positioned to drive funeral growth in the future 54 FUNERAL FOCUSED ON CUSTOMER PREFERENCES o Remaining relevant continues to be the pillar of our funeral strategy o Ensuring our customers have the appropriate channel access to meet their purchasing needs EMBRACING CUSTOMER TRENDS o Creating excitement about cremation opportunities o Memorializing loved ones beyond customer expectations through contemporary products and life celebrations CONTEMPORARY PRODUCT AND SERVICE OFFERINGS o Focusing on visualizing product offerings and services through customer - facing technology o Reducing administrative burdens for our customers
CEMETERY SENIOR VICE PRESIDENT STEVE TIDWELL CEMETERY OVERVIEW AND CUSTOMER PREFERENCES Sales and Merchandising 55

Our network of 473 cemeteries interact with ~300,000 customers annually 56 Burial Cremation 2017 DISPOSITION 1 281, or 59%, of our cemeteries share property with an SCI - owned funeral home , which we refer to as combination locations PRENEED PROPERTY UNITS TOTAL 243,153 52,590 ATNEED AND MATURED PRENEED SERVICES 132,010 111,143 25,630 26,960 295,743 157,640 138,103 TOTAL CEMETERY CEMETERY OVERVIEW AND CUSTOMER PREFERENCES 53% 47% 100% 18% 82% COMPARABLE OPERATIONS AS OF DECEMBER 31, 2017
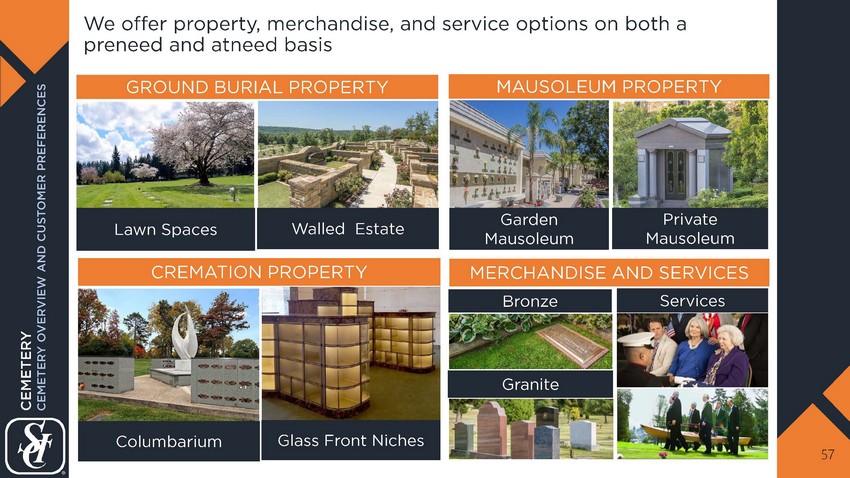
We offer property, merchandise, and service options on both a preneed and atneed basis 57 Lawn Spaces Walled Estate GROUND BURIAL PROPERTY MAUSOLEUM PROPERTY CREMATION PROPERTY Columbarium MERCHANDISE AND SERVICES Bronze Granite Garden Mausoleum Private Mausoleum Services Glass Front Niches CEMETERY CEMETERY OVERVIEW AND CUSTOMER PREFERENCES
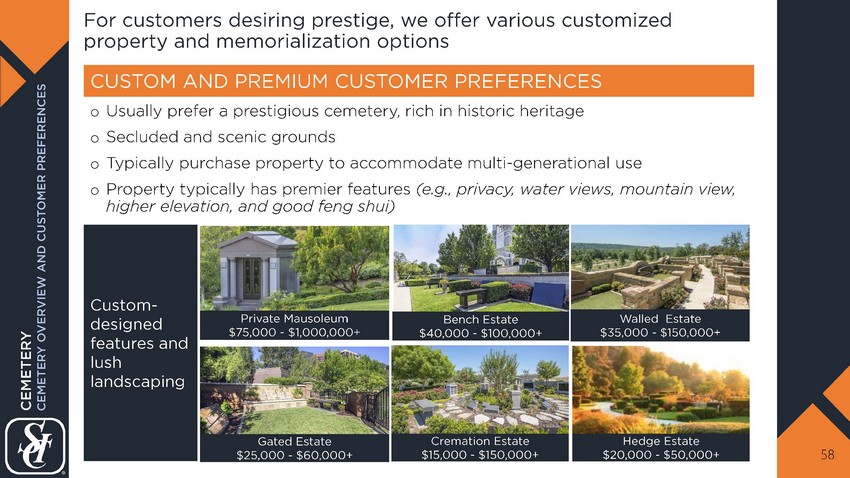
For customers desiring prestige, we offer various customized property and memorialization options 58 o Usually prefer a prestigious cemetery, rich in historic heritage o Secluded and scenic grounds o Typically purchase property to accommodate multi - generational use o Property typically has premier features (e.g., privacy, water views, mountain view, higher elevation, and good feng shui) CUSTOM AND PREMIUM CUSTOMER PREFERENCES Custom - designed features and lush landscaping Private Mausoleum $75,000 - $1,000,000+ Walled Estate $35,000 - $150,000+ Bench Estate $40,000 - $100,000+ Cremation Estate $15,000 - $150,000+ Gated Estate $25,000 - $60,000+ Hedge Estate $20,000 - $50,000+ CEMETERY CEMETERY OVERVIEW AND CUSTOMER PREFERENCES

For consumers desiring mid - tier products, we offer a variety of solutions 59 o A good balance of quality and price o Adjacency (being close to relatives and friends) is not as critical o Cemetery is typically located within a close proximity of their residence o Offerings include appropriately landscaped lot gardens, lawn crypts, and a variety of niche selections MID - TIER CUSTOMER PREFERENCES Garden Mausoleum $4,500 - $25,000+ Outside Niche $1,500 - $10,000 Interior Mausoleum $7,500 - $45,000+ Glass Front Niche $4,500 - $50,000+ CEMETERY CEMETERY OVERVIEW AND CUSTOMER PREFERENCES
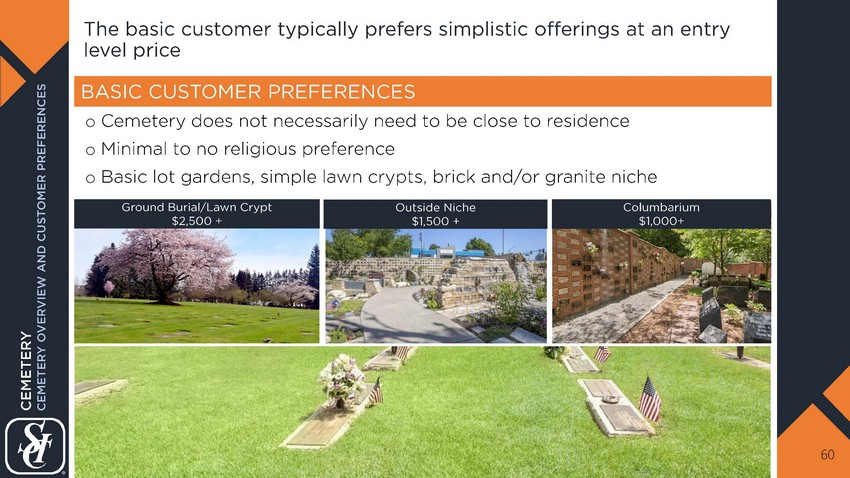
The basic customer typically prefers simplistic offerings at an entry level price 60 o Cemetery does not necessarily need to be close to residence o Minimal to no religious preference o Basic lot gardens, simple lawn crypts, brick and/or granite niche BASIC CUSTOMER PREFERENCES Outside Niche $1,500 + Ground Burial/Lawn Crypt $2,500 + Columbarium $1,000+ CEMETERY CEMETERY OVERVIEW AND CUSTOMER PREFERENCES
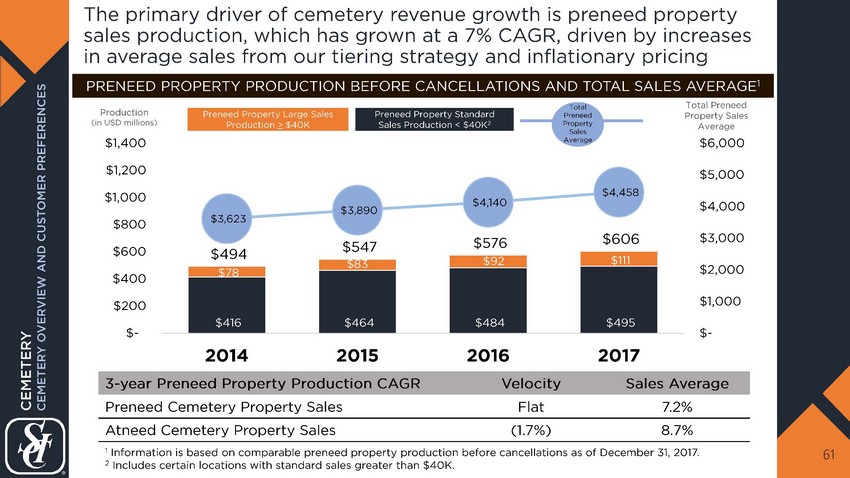
The primary driver of cemetery revenue growth is preneed property sales production, which has grown at a 7% CAGR, driven by increases in average sales from our tiering strategy and inflationary pricing 61 PRENEED PROPERTY PRODUCTION BEFORE CANCELLATIONS AND TOTAL SALES AVERAGE 1 3 - year Preneed Property Production CAGR Velocity Sales Average Preneed Cemetery Property Sales Flat 7.2% Atneed Cemetery Property Sales (1.7%) 8.7% CEMETERY CEMETERY OVERVIEW AND CUSTOMER PREFERENCES 1 Information is based on comparable preneed property production before cancellations as of December 31, 2017. 2 Includes certain locations with standard sales greater than $40K. $416 $464 $484 $495 $78 $83 $92 $111 $494 $547 $576 $606 $3,623 $3,890 $4,140 $4,458 $- $1,000 $2,000 $3,000 $4,000 $5,000 $6,000 $- $200 $400 $600 $800 $1,000 $1,200 $1,400 2014 2015 2016 2017 Total Preneed Property Sales Average Production (in USD millions) Preneed Property Large Sales Production > $ 40K Preneed Property Standard Sales Production < $40K 2 Total Preneed Property Sales Average
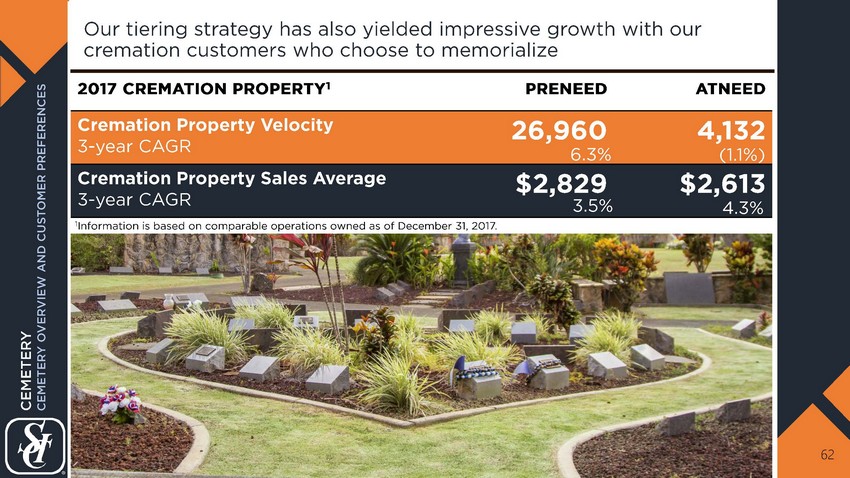
62 Our tiering strategy has also yielded impressive growth with our cremation customers who choose to memorialize 2017 CREMATION PROPERTY 1 PRENEED ATNEED Cremation Property Velocity 3 - year CAGR 26,960 4,132 Cremation Property Sales Average 3 - year CAGR $2,829 $2,613 1 Information is based on comparable operations owned as of December 31, 2017. 6.3% (1.1%) 3.5% 4.3% CEMETERY CEMETERY OVERVIEW AND CUSTOMER PREFERENCES
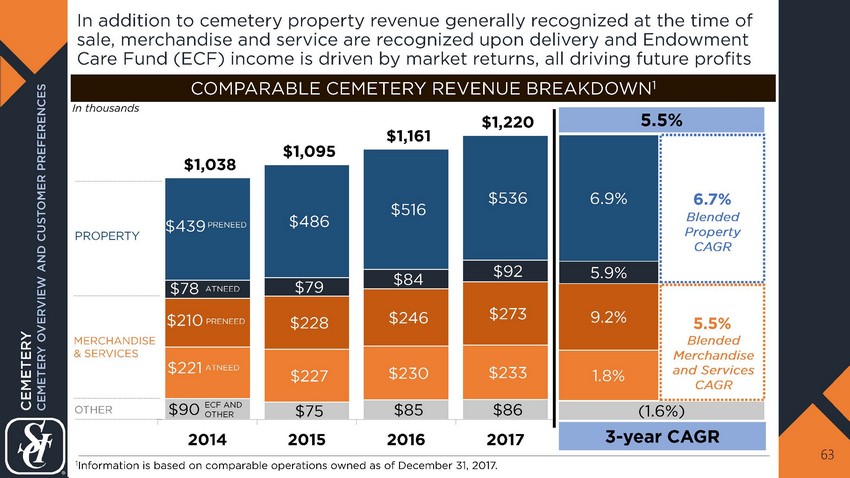
63 $90 $75 $85 $86 $221 $227 $230 $233 $210 $228 $246 $273 $78 $79 $84 $92 $439 $486 $516 $536 $1,038 $1,095 $1,161 $1,220 2014 2015 2016 2017 ATNEED 3 - year CAGR COMPARABLE CEMETERY REVENUE BREAKDOWN 1 1 Information is based on comparable operations owned as of December 31, 2017 . ECF AND OTHER MERCHANDISE & SERVICES PROPERTY OTHER (1.6%) 5.5% 9.2% 5.9% PRENEED 6.9% 1.8% ATNEED PRENEED CEMETERY CEMETERY OVERVIEW AND CUSTOMER PREFERENCES In addition to cemetery property revenue generally recognized at the time of sale, merchandise and service are recognized upon delivery and Endowment Care Fund (ECF) income is driven by market returns, all driving future profits I n thousands 5.5% 6.7% Blended Property CAGR Blended Merchandise and Services CAGR

We expect to continue to grow cemetery revenue by 4% - 6% resulting in margin growth of 50 - 130bps annually 64 2015 2016 2017 $1,161 $1,095 $1,220 MARGINS REVENUE 1 Information represents comparable businesses owned as of December 31, 2017. 4 - YEAR COMPARABLE CEMETERY MARGIN PERFORMANCE 1 6.0% 5.1% ANNUAL GROWTH TARGETS 4% - 6% 5 0 - 130bps In millions CEMETERY 2014 $1,038 5.5% 25.3% 26.0% 27.2% 28.6%
Memorial Oaks | Houston, TX FUNERAL AND CEMETERY PRENEED SALES STRATEGY PRENEED SALES TRENDS PRENEED OVERVIEW DEVELOP THE SALES ORGANIZATION 65

DEVELOP THE SALES ORGANIZATION PRENEED SALES TRENDS PRENEED OVERVIEW FUNERAL AND CEMETERY PRENEED SALES STRATEGY 66
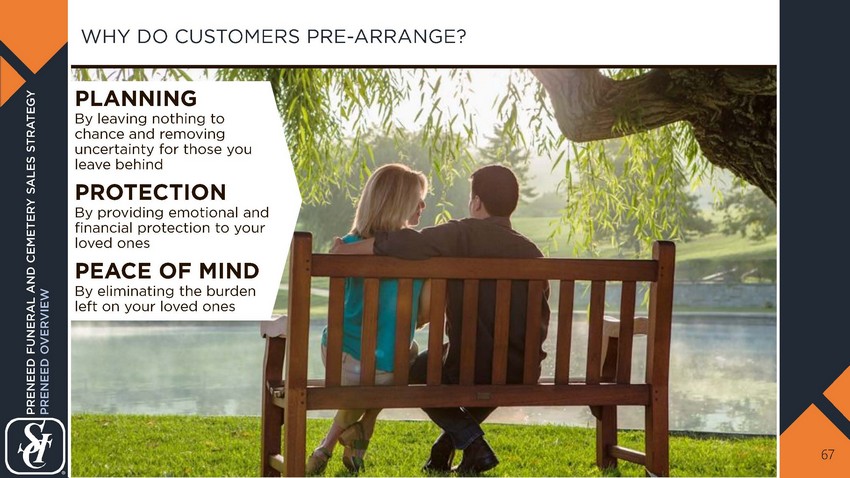
WHY DO CUSTOMERS PRE - ARRANGE? 67 PLANNING By leaving nothing to chance and removing uncertainty for those you leave behind PROTECTION By providing emotional and financial protection to your loved ones PEACE OF MIND By eliminating the burden left on your loved ones PRENEED FUNERAL AND CEMETERY SALES STRATEGY PRENEED OVERVIEW

Recall how the demographic landscape benefits our preneed sales strategy today and in the future 68 0 20,000 40,000 60,000 80,000 100,000 120,000 2010 2015 2020 2025 2030 2035 AGING OF AMERICA Atneed Customer Preneed F uneral C ustomer Preneed Cemetery Customer Late 50’s/Early 60’s Late 60’s/Early 70’s Late 70’s/Early 80’s AVERAGE AGE SCI CUSTOMER LEGEND SOURCE: U.S. Census Bureau Population (in thousands) Age 55 - 64 Age 65 - 74 Age 75+ PRENEED FUNERAL AND CEMETERY SALES STRATEGY PRENEED OVERVIEW
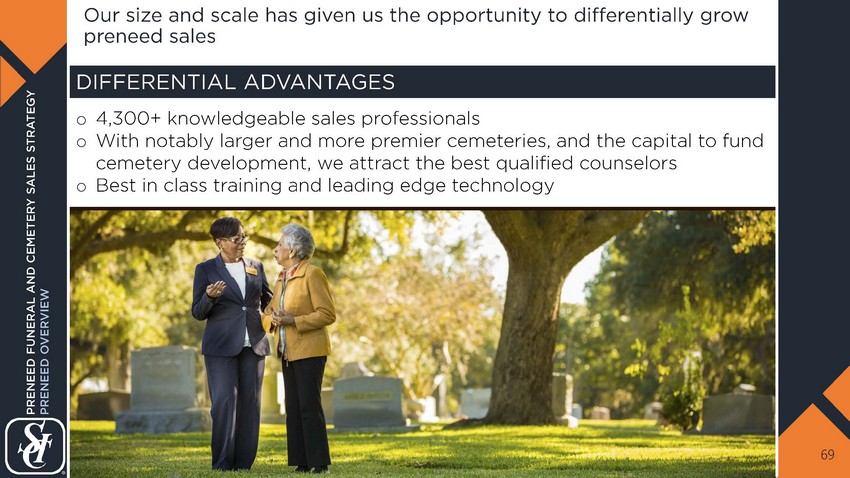
Our size and scale has given us the opportunity to differentially grow preneed sales 69 DIFFERENTIAL ADVANTAGES o 4,300+ knowledgeable sales p rofessionals o With notably larger and more premier cemeteries, and the capital to fund cemetery development, we attract the best qualified counselors o Best in class training and leading edge technology PRENEED FUNERAL AND CEMETERY SALES STRATEGY PRENEED OVERVIEW
PRENEED OVERVIEW PRENEED SALES TRENDS DEVELOP THE SALES ORGANIZATION FUNERAL AND CEMETERY PRENEED SALES STRATEGY 70
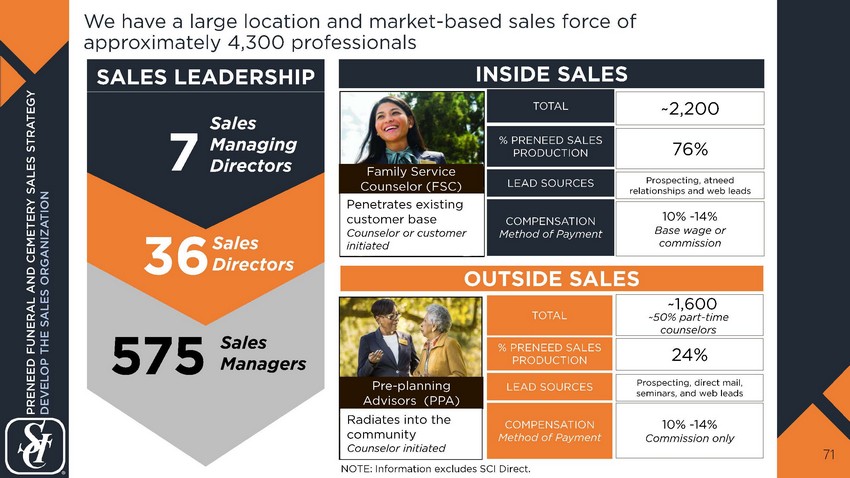
We have a large location and market - based sales force of approximately 4,300 professionals 71 INSIDE SALES TOTAL % PRENEED SALES PRODUCTION LEAD SOURCES COMPENSATION Method of Payment 24% Prospecting, direct mail, seminars, and web leads 10% - 14% Commission only Sales Managers 575 Sales Directors 36 Sales Managing Directors 7 ~2,200 76% Prospecting, atneed relationships and web leads 10% - 14% Base wage or commission TOTAL % PRENEED SALES PRODUCTION LEAD SOURCES COMPENSATION Method of Payment NOTE : Information excludes SCI Direct. ~50% part - time counselors Family Service Counselor (FSC) Pre - planning Advisors (PPA) Radiates into the community Counselor initiated ~1,600 PRENEED FUNERAL AND CEMETERY SALES STRATEGY DEVELOP THE SALES ORGANIZATION OUTSIDE SALES SALES LEADERSHIP Penetrates existing customer b ase Counselor or customer initiated
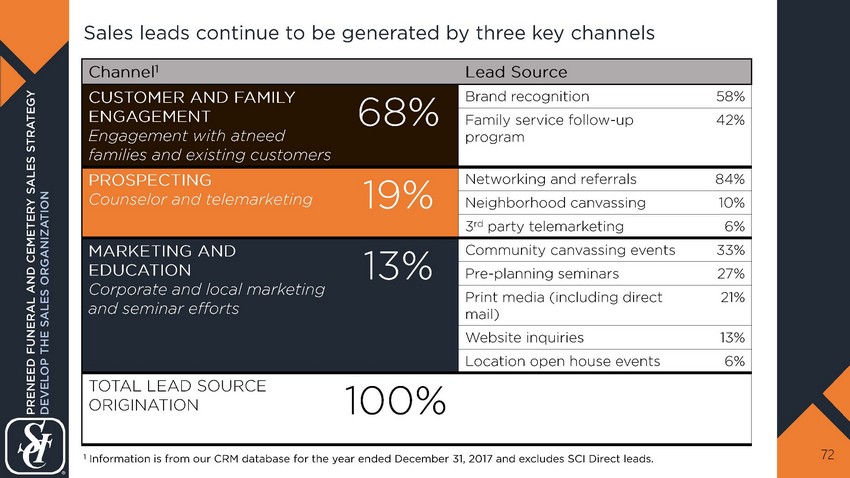
Sales leads continue to be generated by three key channels 72 1 Information is from our CRM database for the year ended December 31, 2017 and excludes SCI Direct leads. Channel 1 Lead Source CUSTOMER AND FAMILY ENGAGEMENT Engagement with atneed families and existing customers 68% Brand recognition 58% Family service follow - up program 42% PROSPECTING Counselor and telemarketing 19% Networking and referrals 84% Neighborhood canvassing 10% 3 rd party telemarketing 6% MARKETING AND EDUCATION Corporate and local marketing and seminar efforts 13% Community canvassing events 33% Pre - planning seminars 27% Print media (including direct mail) 21% Website inquiries 13% Location open house events 6% TOTAL LEAD SOURCE ORIGINATION 100% PRENEED FUNERAL AND CEMETERY SALES STRATEGY DEVELOP THE SALES ORGANIZATION

With our customer relationship management system (CRM), we have increased sales production while managing headcount 73 Preneed board volume, activities, and appointments 1,2 Preneed Board Volume 2 $1.2B $1.3B $ 1.4B 1 Includes PPAs and FSCs and excludes SCI Direct. 2 Board volume is the measure used to weight production for compensation. 3,650 3,700 3,750 3,800 3,850 3,900 3,950 - 500 1,000 1,500 2,000 2015 2016 2017 Leads Created Appointment Attendees Activities (tasks, calls, emails, etc.) Total Headcount PRENEED FUNERAL AND CEMETERY SALES STRATEGY DEVELOP THE SALES ORGANIZATION Velocity I n thousands Headcount
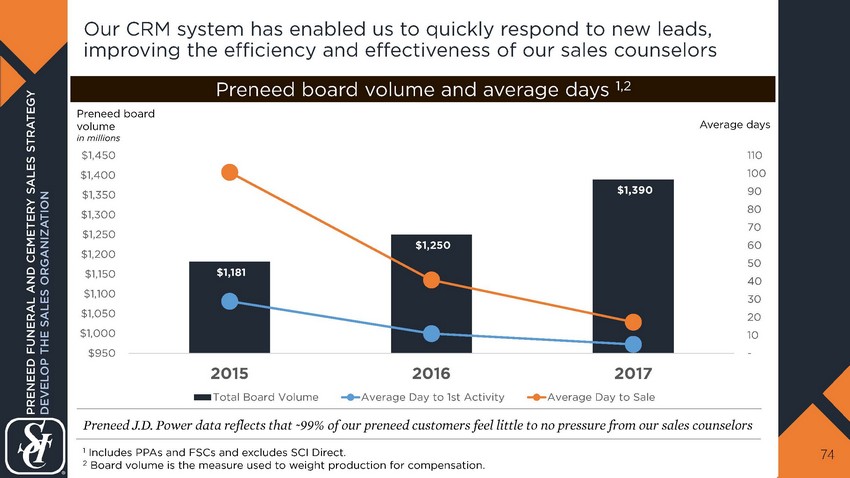
Our CRM system has enabled us to quickly respond to new leads, improving the efficiency and effectiveness of our sales counselors 74 Preneed board volume and average days 1,2 Preneed board volume in millions Preneed J.D. Power data reflects that ~99% of our preneed customers feel little to no pressure from our sales counselors $1,181 $1,250 $1,390 - 10 20 30 40 50 60 70 80 90 100 110 $950 $1,000 $1,050 $1,100 $1,150 $1,200 $1,250 $1,300 $1,350 $1,400 $1,450 2015 2016 2017 Total Board Volume Average Day to 1st Activity Average Day to Sale 1 Includes PPAs and FSCs and excludes SCI Direct. 2 Board volume is the measure used to weight production for compensation . PRENEED FUNERAL AND CEMETERY SALES STRATEGY DEVELOP THE SALES ORGANIZATION Average days

PRENEED OVERVIEW DEVELOP THE SALES ORGANIZATION PRENEED SALES TRENDS FUNERAL AND CEMETERY PRENEED SALES STRATEGY 75

$602 $585 $599 $589 $64 $78 $87 $82 $119 $134 $153 $165 $785 $797 $839 $836 2014 2015 2016 2017 76 Comparable Preneed Funeral Sales Production 1 In millions 1 Information is based on comparable operations owned as of December 31, 2017. 2 % CAGR $494 $521 $554 $618 2010 2011 2012 2013 SCI non - funeral home Legacy Stewart funeral homes Legacy SCI funeral homes From 2010 - 2013, our core preneed funeral sales production achieved a CAGR of 8%; however, due to a few changes in the sales process, our growth flattened but we are slated to achieve 3% - 5% annual growth We believe our sales force and technology initiatives will help us achieve a new normal of 3% - 5% 2014 - 2017 8 % CAGR 2010 - 2013 Legacy SCI Funeral Homes Only PRENEED FUNERAL AND CEMETERY SALES STRATEGY PRENEED SALES TRENDS Total SCI
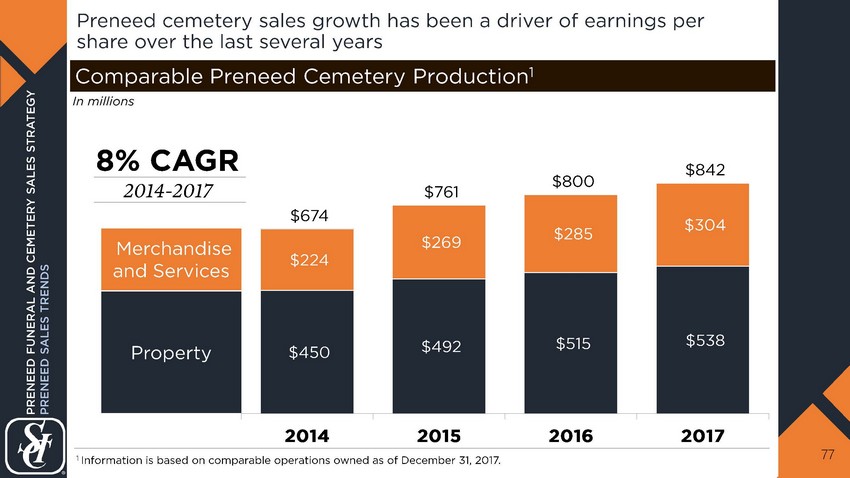
Preneed cemetery sales growth has been a driver of earnings per share over the last several years 77 $450 $492 $515 $538 $224 $269 $285 $304 $674 $761 $800 $842 2014 2015 2016 2017 Property Comparable Preneed Cemetery Production 1 1 Information is based on comparable operations owned as of December 31, 2017. Merchandise and Services In millions PRENEED FUNERAL AND CEMETERY SALES STRATEGY PRENEED SALES TRENDS 8 % CAGR 2014 - 2017
We believe our preneed sales program is poised to continue growing, driven by three key elements 78 LEVERAGE TECHNOLOGY o Beacon Our tablet - based preneed sales enablement tool • Funeral module is live now in select markets • Cemetery m odule scheduled to go live in the back half of 2018 o Salesforce Connect CRM An improved and simplified platform that enables managers and counselors to better organize their activities, nurture leads, and drive greater efficiency and effectiveness TRAINING AND STAFFING o Eight counselor training centers across North America o Two sales manager training centers o Consistent curriculum, product knowledge, and presentation skills o Bi - annual conference designed to move the middle band of performers into the top 25% o Taking a disciplined approach to expanding our sales force to serve a growing boomer demographic BUNDLE, TIER, AND SIMPLIFY o Ample room to continue growing our cemetery property tiering strategy o Continue to package products and services that resonate with the customer o Continue to grow our ancillary services such as travel protection and cemetery flower placements THE FUTURE IS BRIGHT AND THE BEST IS YET TO COME PRENEED FUNERAL AND CEMETERY SALES STRATEGY

BUSINESS DEVELOPMENT STRATEGY VICE PRESIDENT JOHN FAULK ACQUISITION AND NEW BUILD STRATEGY FOOTPRINT AND MARKET STRATEGY Business Development 79

80 ACQUISITION AND NEW BUILD STRATEGY FOOTPRINT AND MARKET STRATEGY BUSINESS DEVELOPMENT STRATEGY

Our location footprint is geographically diverse with unparalleled scale in this industry 81 BUSINESS DEVELOPMENT STRATEGY FOOTPRINT AND MARKET STRATEGY LOCATIONS 1,961 As of December 31, 2017 BROAD GEOGRAPHIC COVERAGE STAND - ALONE FUNERAL STAND - ALONE CEMETERY COMBOS FUNERAL AND CEMETERY UNDER ONE ROOFTOP 2 LOCATIONS PER COMBO United States, including D.C. (46) 1,050 183 272 Canada (8) 151 2 8 Puerto Rico 6 7 1 TOTAL LOCATIONS 1,207 192 281 % of Footprint 61% 10% 29%
Below is an example of one of our larger markets and the strength of our footprint: D allas, TX 82 Dallas footprint highlights: Stand - alone Funeral Homes Stand - alone Cemeteries Combos 2,200 300 5,000 Customers s erved a nnually 157 100 Average customers s erved per location annually o Full service combo location Sparkman Hillcrest in Highland Park area o Multiple Hispanic customs c onscious locations branded Gonzalez o Strong Neptune/SCI Direct location o Partnership with the Catholic Archdiocese to manage their Dallas cemeteries Dallas market strengths: 14 3 5 Locations 1,000 630 Cemetery and 380 Funeral SCI Direct SCI Funeral Home SCI Cemetery SCI Combo BUSINESS DEVELOPMENT STRATEGY FOOTPRINT AND MARKET STRATEGY

Cemetery is the growth engine of our footprint 83 o Strong multi - generational heritage o SCI’s unique tiered offering approach o High barriers to entry o Ability to recognize property at the time of the sale 1 and build our backlog for merchandise and services at the time of death o Progressive sales driven model o Ability to serve all customer types out of one facility Over 470 cemetery properties with average interments (~335) per location higher than our estimate of the national interment average (200) Cemetery growth drivers include: 1 If developed and available for use. BUSINESS DEVELOPMENT STRATEGY FOOTPRINT AND MARKET STRATEGY
COMPARABLE CEMETERY REVENUE 1 GROWTH Our cemeteries have performed well growing their top line revenue 84 o Cemetery revenue has grown at a rate of 5 % - 6 % in recent years o Preneed property h eritage sales have driven growth through SCI’s tiered offering model 5.5% 6.0% 5.1% 2015 2016 2017 1 Information is based on comparable operations owned as of December 31, 2017. BUSINESS DEVELOPMENT STRATEGY FOOTPRINT AND MARKET STRATEGY

Funeral is a more steady business driven by volume that has been static due to accounting requirements, demographics, and death rates 85 1.9% (0.8%) 0.7% 2015 2016 2017 WHILE WE EXPECT PRENEED WILL DRIVE COMPARABLE FUNERAL VOLUME GROWTH, WHAT CAN WE DO NOW TO COMPETE MORE EFFECTIVELY? o Comparable funeral revenue trends are more modest o Revenue is much more susceptible to volume changes and death rates, as we cannot recognize growth in preneed in the funeral segment until death occurs COMPARABLE FUNERAL REVENUE 1 CHANGE 1 Information is based on comparable operations owned as of December 31, 2017. BUSINESS DEVELOPMENT STRATEGY FOOTPRINT AND MARKET STRATEGY

Our combination properties leverage the growth of our cemetery segment in our co - located funeral operations 19% 33% 49% 75% 60% 48% 6% 7% 3% Locations Revenue Profits 86 Stand - alones Combos Non - funeral o Offer customer the convenience of one - stop shopping o Appeal to a more traditional funeral customer that values memorialization o Generally larger and newer than stand - alones Combos a re m ore attractive 1 Information is based on consolidated results as of December 31, 2017. FUNERAL OPERATIONS 1 BUSINESS DEVELOPMENT STRATEGY FOOTPRINT AND MARKET STRATEGY

Our funeral homes can be segmented into three primary categories: (1) full service, (2) customs conscious, and (3) neighborhood o Differentiated by brand, facility, and service o Consumers want to go there and will travel o Premium offering at a premium price o Strong preneed program CUSTOMS CONSCIOUS FULL SERVICE 87 o Differentiated by ability to serve ethnicity or religion o Offers service and merchandise elements others cannot o Strong preneed program o Relatively new build in a growing, suburban area o Facility is updated and fresh at a fair price o Similar funeral to what others will offer o Strong preneed program NEIGHBORHOOD We have strong locations in this model… ...but also more challenged locations o In a slower growth area with similar competitors o Facility is clean, but dated and may lack competitiveness o The facility is susceptible to competition and price o Generally not a robust preneed program BUSINESS DEVELOPMENT STRATEGY FOOTPRINT AND MARKET STRATEGY “OUR LARGEST OPPORTUNITY”

Areas we are driving to improve funeral performance in neighborhood funeral homes 88 OPPORTUNITY WHY IT IS AN OPPORTUNITY o In 2005 - 2007, we stopped competing aggressively for the value direct cremation business through the funeral home channel o As a result, we have an opportunity to grow cremation volume with a more attractive price point for consumers, particularly in neighborhood funeral homes o We know funeral burial share has performed better than cremation o “Neighborhood funeral h ome ” is a highly competitive space where there is less ability to differentiate o Our capital has been differentially invested in combos and f ull service and c ustoms c onscious stand - alones due to their competitiveness o As a result, some neighborhood funeral homes need updating for current consumer tastes and trends o Preneed funeral is the surest way to improve future market share o We have seen the correlation between funeral volume and preneed performance 1a 2 3 1b o We have seen discounting in certain markets to remain competitive o In some areas, our pricing may have become too homogeneous across our funeral homes, creating an opportunity for a clear tier at the neighborhood funeral home level o By modifying pricing to ensure competitiveness in local markets, we can reduce discounts, drive incremental volume, and ultimately revenue Drive cremation volume by repositioning pricing Review market tiering in burial pricing Address facilities and offerings to increase competitiveness Continue to drive preneed funeral BUSINESS DEVELOPMENT STRATEGY FOOTPRINT AND MARKET STRATEGY
We are testing and learning in our neighborhood funeral homes: testing price repositioning in select areas (Opportunity 1a/1b) 89 NOT ONLY IS CREMATION VOLUME UP SIGNIFICANTLY, BUT WE ARE ALSO GROWING REVENUE WHAT WE DID o Repositioned our pricing, particularly in cremation, in areas we felt we could be more competitive o Created a clearer tier of offerings beneath the premium and customs conscious locations where the market required it PRELIMINARY RESULTS o Growth in cremation volume due to changes made; burial volume has been less a ffected o In both cremation and burial, we are seeing a decrease in discounting and an increase in the quality of the sale 0.5% 10.7% 2.2% 3.0% 27.5% 13.6% Total SCI Core Test Market #1 Test Market #2 $(202) $(63) $269 $205 $67 $142 Test Market #1 Test Market #2 2017 Cremation Revenue Change Variance Analysis 1 1 Information provided is based on comparable operations owned as of December 31, 2017, and excludes SCI Direct. BUSINESS DEVELOPMENT STRATEGY FOOTPRINT AND MARKET STRATEGY Cremation Average $ Impact Cremation Volume $ Impact Total Volume Change Cremation Volume Change (in thousands) 2017 YOY Cremation Volume Change vs. SCI Overall 1
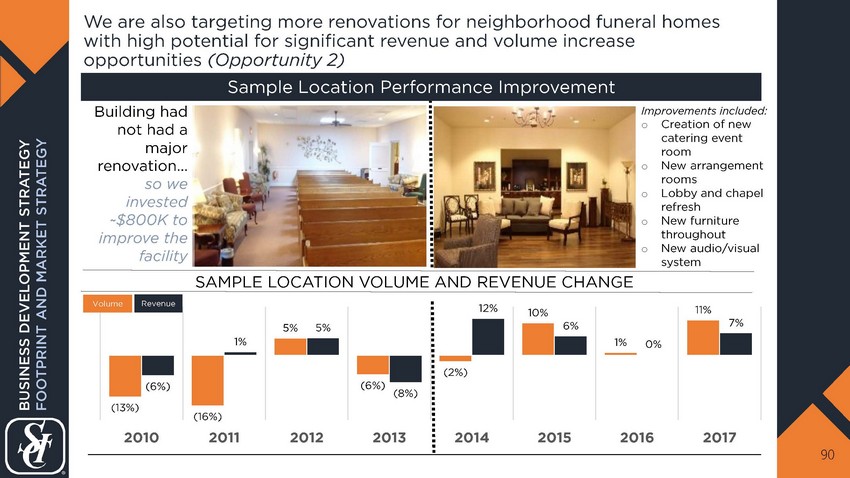
We are also targeting more renovations for neighborhood funeral homes with high potential for significant revenue and volume increase opportunities (Opportunity 2) 90 (13%) (16%) 5% (6%) (2%) 10% 1% 11% (6%) 1% 5% (8%) 12% 6% 0% 7% 2010 2011 2012 2013 2014 2015 2016 2017 Building had not had a major renovation . .. so we invested ~$800K to improve the facility Improvements included: o Creation of new catering event room o New arrangement rooms o Lobby and chapel refresh o New furniture throughout o New audio/visual system SAMPLE LOCATION VOLUME AND REVENUE CHANGE Volume Revenue BUSINESS DEVELOPMENT STRATEGY FOOTPRINT AND MARKET STRATEGY Sample Location Performance Improvement
FOOTPRINT AND MARKET STRATEGY ACQUISITION AND NEW BUILD STRATEGY BUSINESS DEVELOPMENT STRATEGY 91
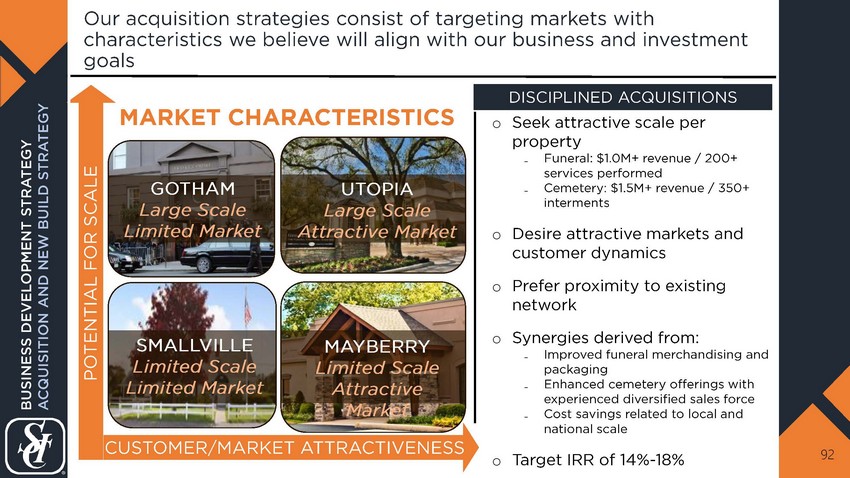
Our acquisition strategies consist of targeting markets with characteristics we believe will align with our business and investment goals 92 MARKET CHARACTERISTICS o Seek attractive scale per property ₋ Funeral: $1.0M+ revenue / 200+ services performed ₋ Cemetery: $1.5M+ revenue / 350+ interments o Desire attractive markets and customer dynamics o Prefer proximity to existing network o Synergies derived from: ₋ Improved funeral merchandising and packaging ₋ Enhanced cemetery offerings with experienced diversified sales force ₋ Cost savings related to local and national scale o Target IRR of 14% - 18% DISCIPLINED ACQUISITIONS CUSTOMER/MARKET ATTRACTIVENESS POTENTIAL FOR SCALE SMALLVILLE Limited Scale Limited Market MAYBERRY Limited Scale Attractive Market UTOPIA Large Scale Attractive Market GOTHAM Large Scale Limited Market BUSINESS DEVELOPMENT STRATEGY ACQUISITION AND NEW BUILD STRATEGY

Acquisitions yield the highest return on investment for us due to significant synergy opportunities 93 In millions $88 $26 $103 $72 $34 $41 $71 $75 $81 2009 2010 2011 2012 2013 2014 2015 2016 2017 TUCK - IN LARGE $283 $1,049 KEYSTONE 199 funeral homes 15 cemeteries STEWART 217 funeral homes 141 cemeteries 69 combos Minimal tuck - in activity due to Stewart acquisition and FTC review 1 Acquisition spend includes 1031 exchange funds as well as purchases of noncontrolling interests. STAND - ALONE FUNERAL 3 2 43 27 2 5 4 10 20 STAND - ALONE CEMETERY 1 − 2 − − 1 2 3 4 COMBOS 2 LOCATIONS PER COMBO 5 1 − − 1 − 2 − 2 IRR 12.0% 14.4% 18.8% 15.6% 16.4% 15.5% 13.3% 15.1% 14.7% BUSINESS DEVELOPMENT STRATEGY ACQUISITION AND NEW BUILD STRATEGY ACQUISITION SPEND 1 AND NUMBER OF LOCATIONS

Our 2017 acquisitions consisted of 28 businesses in 10 different markets (examples depicted) 94 WEED - CORLEY - FISH | AUSTIN, TX 5 funeral businesses serving ~1,050 families ARLINGTON PARK CEMETERY | MILWAUKEE, WI 4 cemetery business serving ~870 families ALLNUTT FUNERAL | PRIMARILY LOCATED IN FORT COLLINS, CO AREA 12 funeral businesses / 1 combo business serving ~2,400 families BUSINESS DEVELOPMENT STRATEGY ACQUISITION AND NEW BUILD STRATEGY
We are excited about our pipeline as we have a strong list of prospects we would like to buy, but we must stay disciplined in our acquisition approach 95 o Represents approximately $1B in revenue across ~450 funeral and ~350 cemetery properties o Maintain relationships with many of these businesses o We want to partner with these businesses on their timeline TARGET ACQUISITION LIST WHY NOT BUY MORE? o We target larger, more institutional businesses that change hands infrequently o The timing has to be right for a successful partnership o Our footprint is a significant strength for us, and we are selective about where and how we grow it BUSINESS DEVELOPMENT STRATEGY ACQUISITION AND NEW BUILD STRATEGY
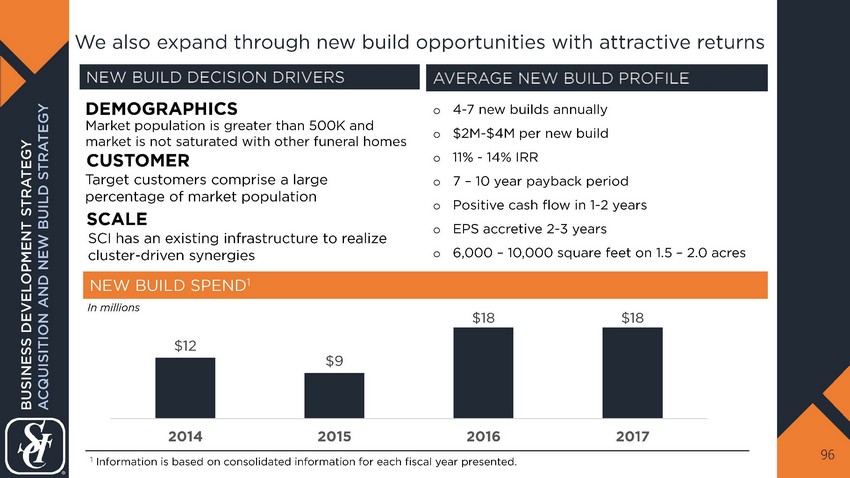
We also expand through new build opportunities with attractive returns 96 NEW BUILD DECISION DRIVERS AVERAGE NEW BUILD PROFILE o 4 - 7 new builds annually o $2M - $4M per new build o 11% - 14% IRR o 7 – 10 year payback period o Positive cash flow in 1 - 2 years o EPS accretive 2 - 3 years o 6,000 – 10,000 square feet on 1.5 – 2.0 acres SCALE NEW BUILD SPEND 1 $12 $9 $18 $18 2014 2015 2016 2017 Market population is greater than 500K and market is not saturated with other funeral homes CUSTOMER DEMOGRAPHICS Target customers comprise a large percentage of market population SCI has an existing infrastructure to realize cluster - driven synergies 1 Information is based on consolidated information for each fiscal year presented. BUSINESS DEVELOPMENT STRATEGY ACQUISITION AND NEW BUILD STRATEGY In millions

Example new builds in growing communities of T exas, Arkansas, and N evada are performing well 97 EVERGREEN EAST FUNERAL HOME | EL PASO, TX o Built on Evergreen East Cemetery in El Paso o Property was acquired in 2016 o Opened in March 2017 PINECREST FUNERAL HOME | LITTLE ROCK, AR o Built on Pinecrest Memorial Park in Little Rock, AR o Opened in March 2017 PALM SOUTHWEST MORTUARY | LAS VEGAS, NV o Stand - alone built for geographic expansion of our Palm brand o Opened in February 2016 BUSINESS DEVELOPMENT STRATEGY ACQUISITION AND NEW BUILD STRATEGY

We will continue to maximize growth opportunities both organically and through acquisition 98 o Continue preneed sales strategy to help grow future profits o Proactively execute initiatives to address identified opportunities o Remain flexible and open - minded to consumer changes at the local level FOOTPRINT AND MARKET STRATEGY ACQUISITION AND NEW BUILD STRATEGY o Increase shareholder value through high yield capital deployment on acquisition and new build opportunities o Be patient and focus on locations that meet our targeted footprint goals BUSINESS DEVELOPMENT STRATEGY
NETWORK OPTIMIZATION AND CUSTOMER - FACING TECHNOLOGY SENIOR VICE PRESIDENT ELISABETH NASH CUSTOMER SERVICE TECHNOLOGY INNOVATION Operations Services 99
CUSTOMER SERVICE TECHNOLOGY INNOVATION NETWORK OPTIMIZATION AND CUSTOMER - FACING TECHNOLOGY 100
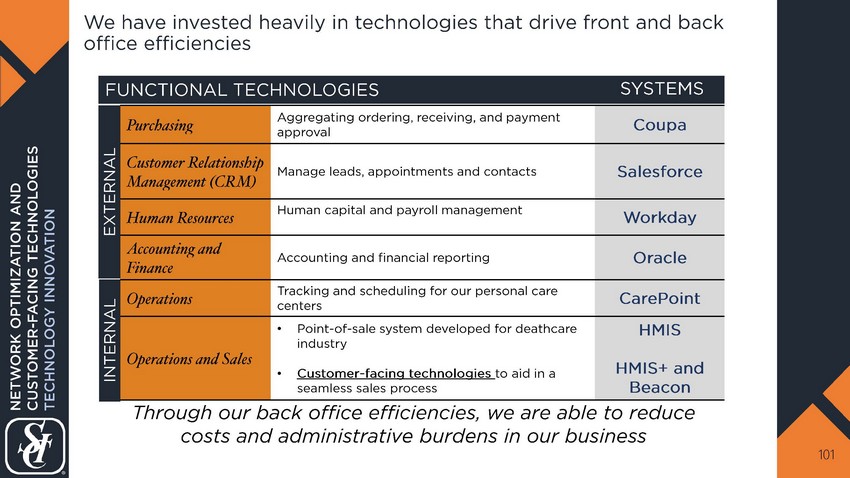
We have invested heavily in technologies that drive front and back office efficiencies 101 FUNCTIONAL TECHNOLOGIES Purchasing Aggregating ordering, receiving, and payment approval Coupa Customer Relationship Management (CRM) Manage leads, appointments and contacts Salesforce Human Resources Human capital and payroll management Workday Accounting and Finance Accounting and financial reporting Oracle Operations Tracking and scheduling for our personal care centers CarePoint Operations and Sales • Point - of - sale system developed for deathcare industry • Customer - facing technologies to aid in a seamless sales process HMIS HMIS+ and Beacon Through our back office efficiencies, we are able to reduce costs and administrative burdens in our business SYSTEMS EXTERNAL INTERNAL NETWORK OPTIMIZATION AND CUSTOMER - FACING TECHNOLOGIES TECHNOLOGY INNOVATION

Our advancements in technology are giving our customers a more contemporary view of product and service offerings 102 BEACON Our newly implemented preneed sales system provides customers with the convenience of a mobile digital presentation HMIS+ Our new atneed customer system uses a digital platform and photographs to create a seamless presentation of our products and services NETWORK OPTIMIZATION AND CUSTOMER - FACING TECHNOLOGIES TECHNOLOGY INNOVATION REFRESHED WEBSITES Refreshed websites that provide a better customer mobile experience and enhanced search engine capability
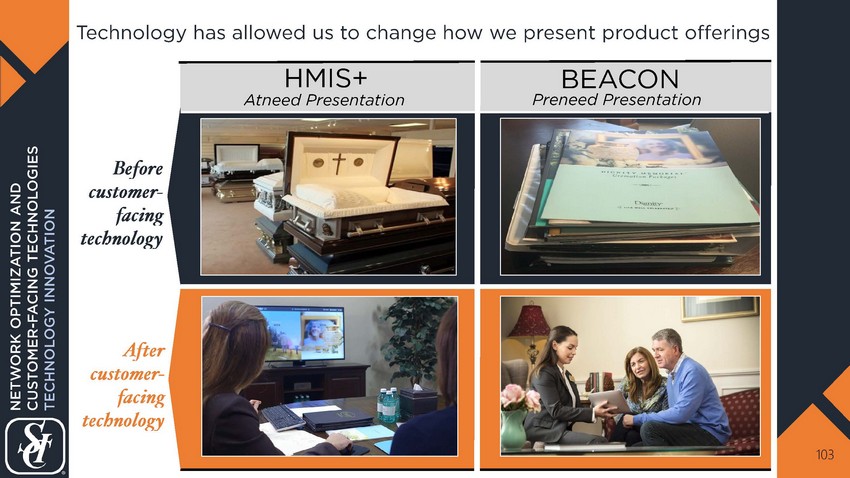
Technology has allowed us to change how we present product offerings 103 HMIS+ BEACON After customer - facing technology Atneed Presentation Preneed Presentation Before customer - facing technology NETWORK OPTIMIZATION AND CUSTOMER - FACING TECHNOLOGIES TECHNOLOGY INNOVATION
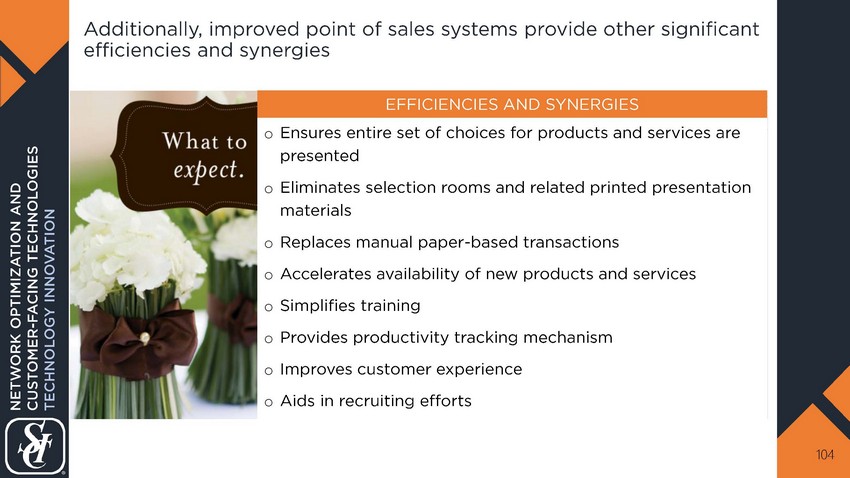
Additionally, improved point of sales systems provide other significant efficiencies and synergies 104 o Ensures entire set of choices for products and services are presented o Eliminates selection rooms and related printed presentation materials o Replaces manual paper - based transactions o Accelerates availability of new products and services o Simplifies training o Provides productivity tracking mechanism o I mproves customer experience o Aids in recruiting efforts EFFICIENCIES AND SYNERGIES NETWORK OPTIMIZATION AND CUSTOMER - FACING TECHNOLOGIES TECHNOLOGY INNOVATION
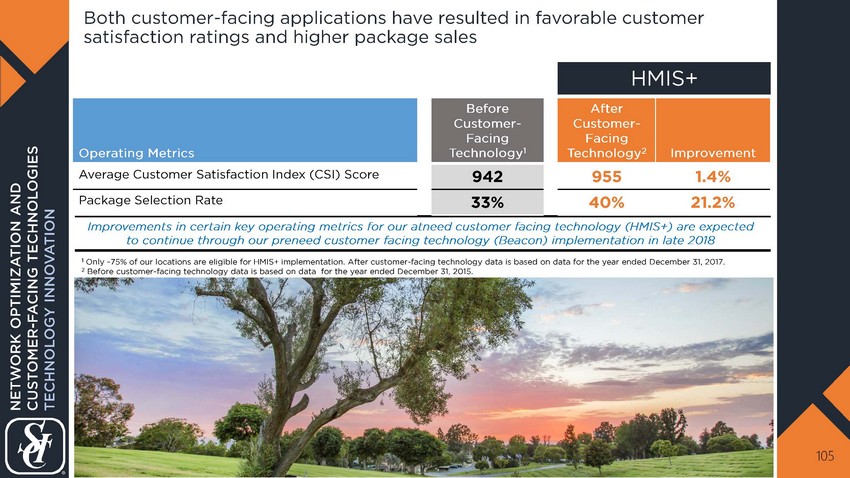
Both customer - facing applications have resulted in favorable customer satisfaction ratings and higher package sales 105 HMIS+ NETWORK OPTIMIZATION AND CUSTOMER - FACING TECHNOLOGIES TECHNOLOGY INNOVATION 1 Only ~75% of our locations are eligible for HMIS+ implementation . After customer - facing technology data is based on data for the year ended December 31, 2017. 2 Before customer - facing technology data is based on data for the year ended December 31, 2015. Improvements in certain key operating metrics for our atneed customer facing technology (HMIS+) are expected to continue through our preneed customer facing technology (Beacon ) implementation in late 2018 Operating Metrics Before Customer - Facing Technology 1 After Customer - Facing Technology 2 Improvement Average Customer Satisfaction Index (CSI) Score 942 955 1.4% Package Selection Rate 33% 40% 21.2%
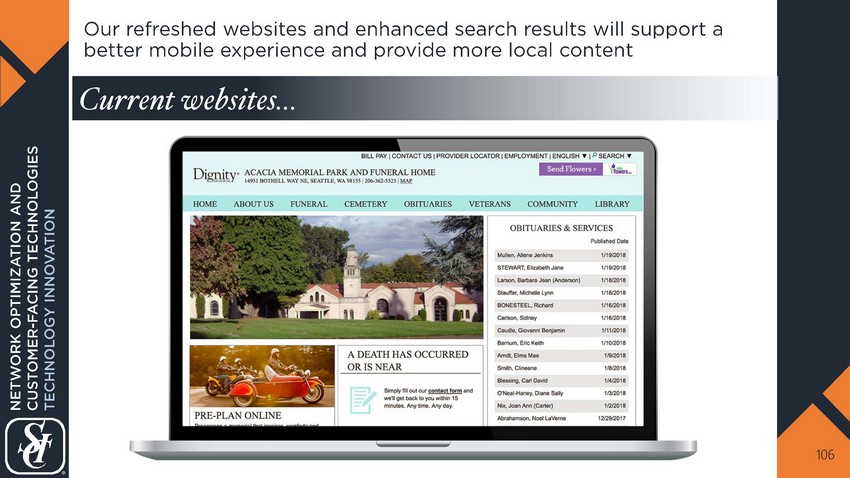
Our refreshed websites and enhanced search results will support a better mobile experience and provide more local content 106 Current websites... NETWORK OPTIMIZATION AND CUSTOMER - FACING TECHNOLOGIES TECHNOLOGY INNOVATION
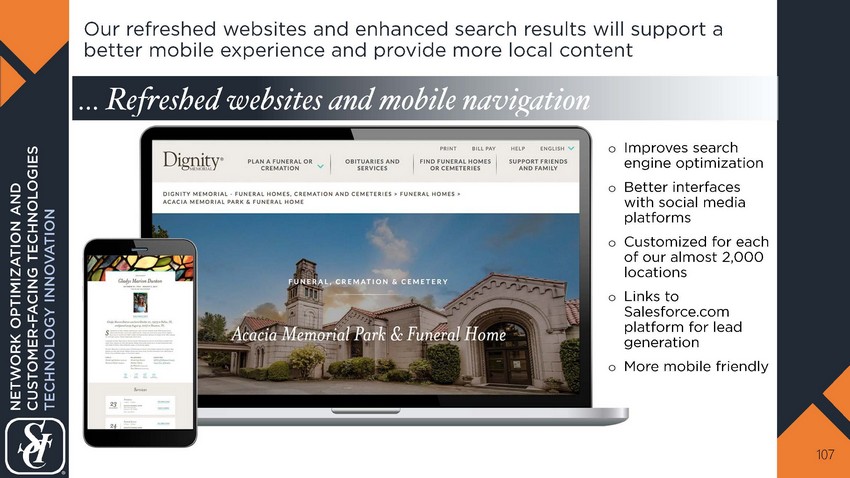
o Improves search engine optimization o Better interfaces with social media platforms o C ustomized for each of our almost 2,000 locations o Links to Salesforce.com platform for lead generation o More mobile friendly 107 NETWORK OPTIMIZATION AND CUSTOMER - FACING TECHNOLOGIES TECHNOLOGY INNOVATION Our refreshed websites and enhanced search results will support a better mobile experience and provide more local content … Refreshed websites and mobile navigation

TECHNOLOGY INNOVATION CUSTOMER SERVICE NETWORK OPTIMIZATION AND CUSTOMER - FACING TECHNOLOGY 108
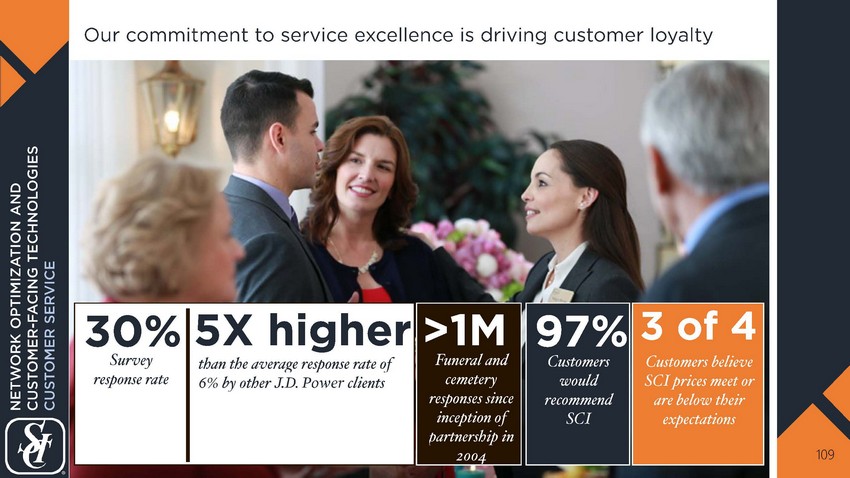
Our commitment to service excellence is driving customer loyalty 109 30% Survey response r ate than the average response rate of 6% by other J.D. Power clients 5X higher Customers would recommend SCI 97% 3 of 4 Customers believe SCI prices meet or are below their expectations Funeral and cemetery responses since inception of partnership in 2004 >1M drop from 33% NETWORK OPTIMIZATION AND CUSTOMER - FACING TECHNOLOGIES CUSTOMER SERVICE

We are proud of our customer satisfaction index (CSI) scores – some of the highest among J.D. Power clients 110 962 955 919 912 906 906 903 898 898 896 894 893 892 891 891 890 890 890 886 886 886 883 882 Investment Financial Network SCI Funeral Home SCI Cemetery National Grocery Chain Major HMO By-Mail Pharmacy SCI Direct Major Luxury Hotel Brand National Pharmacy Brand Top Investment Research Brand Major Retail Pharmacy Brand Luxury Auto Financial Services Luxury Auto Financial Services Domestic Automotive Financial Services Top Major Insurance Brand Major Retail HMO Pharma Brand Luxury Hotel/Resorts Brand Mid Lux Auto Financial Services Big Three Auto Financial Svcs International Lux Hotel/Resort Brand National Retail Pharma Mail Service Big Box Retail Big Box Retail Pharmacy Mail Services o Compensation o Capital improvement allocation o Staffing needs Outcomes impacted b y CSI scores: SCI FUNERAL HOMES have a 52 point , or 6%, HIGHER score than the Major Retail Luxury Hotel Brand well known for catering to their clientele’s needs NETWORK OPTIMIZATION AND CUSTOMER - FACING TECHNOLOGIES CUSTOMER SERVICE

Our commitment to service excellence has been recognized by J.D. Power 111 1 of 12 Companies in J.D. Power’s 47 year history to receive this prestigious award NETWORK OPTIMIZATION AND CUSTOMER - FACING TECHNOLOGIES CUSTOMER SERVICE SERVICE EXCELLENCE. THIS IS WHO WE ARE.
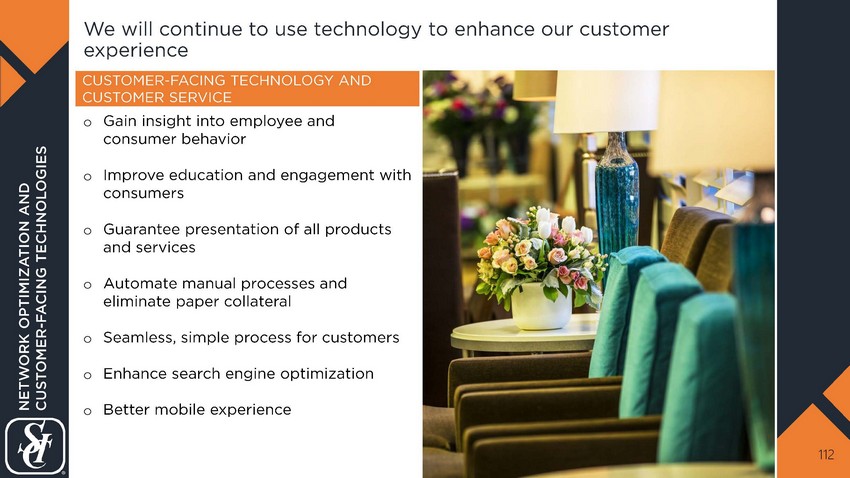
We will continue to use technology to enhance our customer experience 112 o Gain insight into employee and consumer behavior o Improve education and engagement with consumers o Guarantee presentation of all products and services o Automate manual processes and eliminate paper collateral o Seamless, simple process for customers o Enhance search engine optimization o Better mobile experience CUSTOMER - FACING TECHNOLOGY AND CUSTOMER SERVICE NETWORK OPTIMIZATION AND CUSTOMER - FACING TECHNOLOGIES
INSURANCE BACKLOG MECHANICS DEFERRED REVENUE BACKLOG OVERVIEW TRUST BACKLOG MECHANICS CEMETERY PERPETUAL CARE OVERVIEW PRENEED BACKLOG OUTLOOK PRENEED BACKLOG 113

114 TRUST BACKLOG MECHANICS INSURANCE BACKLOG MECHANICS CEMETERY PERPETUAL CARE OVERVIEW PRENEED BACKLOG OUTLOOK Director of Financial Services ANASTHASIA JONES DEFERRED REVENUE BACKLOG OVERVIEW PRENEED BACKLOG

Preneed arrangements provide a benefit to both our customer and to SCI 115 o Planning alleviates uncertainty o Price p rotection o Peace of mind knowing it was done their way o Availability of financing options o Availability of financing options leads to better average (Individuals spend more on themselves than their descendants would spend on them) o Locks in the sale today, preventing it from going to a competitor down the road (increased market share) o Drives differential average growth in comparison to the atneed average o NPV positive to SCI WHY PRENEED SALES? CUSTOMER SCI PRENEED BACKLOG DEFERRED REVENUE BACKLOG OVERVIEW
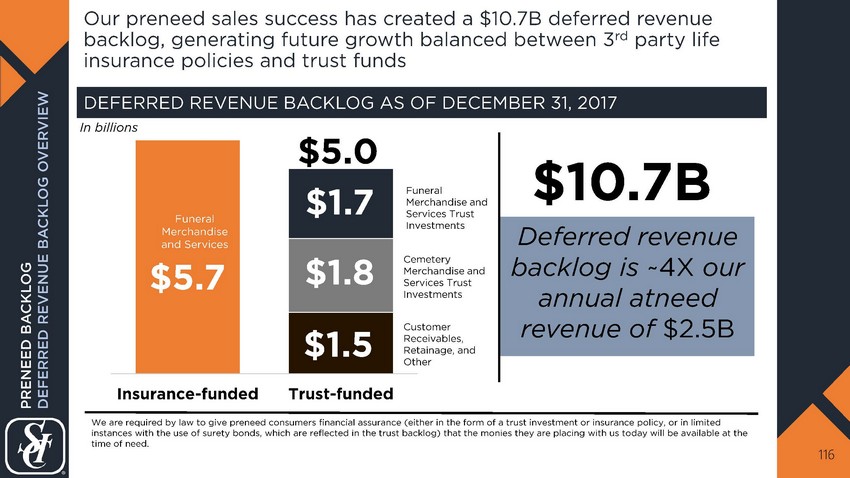
Our preneed sales success has created a $10.7B deferred revenue backlog, generating future growth balanced between 3 rd party life insurance policies and trust funds 116 $5.7 $1.5 $1.8 $1.7 Insurance-funded Trust-funded $5.0 We are required by law to give preneed consumers financial assurance (either in the form of a trust investment or insurance p oli cy, or in limited instances with the use of surety bonds, which are reflected in the trust backlog) that the monies they are placing with us to day will be available at the time of need. In billions DEFERRED REVENUE BACKLOG AS OF DECEMBER 31, 2017 Cemetery Merchandise and Services Trust Investments Funeral Merchandise and Services Deferred revenue backlog is ~4X our annual atneed revenue of $2.5B $10.7B Funeral Merchandise and Services Trust Investments Customer Receivables, Retainage, and Other PRENEED BACKLOG DEFERRED REVENUE BACKLOG OVERVIEW

DEFERRED REVENUE BACKLOG OVERVIEW CEMETERY PERPETUAL CARE OVERVIEW PRENEED BACKLOG OUTLOOK TRUST BACKLOG MECHANICS INSURANCE BACKLOG MECHANICS PRENEED BACKLOG 117
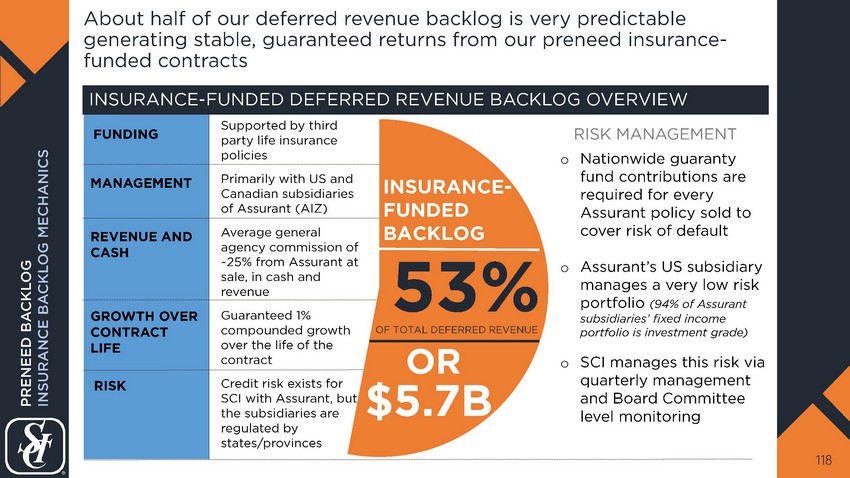
About half of our deferred revenue backlog is very predictable generating stable, guaranteed returns from our preneed insurance - funded contracts 118 FUNDING MANAGEMENT REVENUE AND CASH GROWTH OVER CONTRACT LIFE RISK INSURANCE - FUNDED DEFERRED REVENUE BACKLOG OVERVIEW 53% INSURANCE - FUNDED BACKLOG OF TOTAL DEFERRED REVENUE $5.7B Supported by third party life insurance policies Primarily with US and Canadian subsidiaries of Assurant (AIZ) Average general agency commission of ~25% from Assurant at sale, in cash and revenue Guaranteed 1% compounded growth over the life of the contract Credit risk exists for SCI with Assurant, but the subsidiaries are regulated by states/provinces OR o Nationwide guaranty fund contributions are required for every Assurant policy sold to cover risk of default o Assurant’s US subsidiary manages a very low risk portfolio (94% of Assurant subsidiaries’ fixed income portfolio is investment grade) o SCI manages this risk via quarterly management and Board Committee level monitoring RISK MANAGEMENT PRENEED BACKLOG INSURANCE BACKLOG MECHANICS

Current preneed sales production is also balanced between insurance and trust 119 $ 1.7B 2017 PRENEED CEMETERY AND FUNERAL PRODUCTION o Provides consumer with layer of insurance protection o Helps organic growth strategy to be cash flow neutral 43% 27% 30% Funeral Insurance - Funded Production Cemetery $0.5B CEMETERY PROPERTY PRODUCTION (generally not included in backlog) $1.2B FUNERAL AND CEMETERY SERVICES AND MERCHANDISE PRODUCTION (included in backlog) Funeral Trust - Funded Production NOTE: Information is based on comparable operations owned as of December 31, 2017. BENEFITS OF INSURANCE PRENEED BACKLOG INSURANCE BACKLOG MECHANICS

By emphasizing insurance - funded preneed funeral production through our commission structure, our overall funeral preneed growth strategy is cash flow neutral 120 TRUST INSURANCE NET AVERAGE FUNERAL TRUST RETAINAGE NET CASH FLOWS ---- (21%) 10% (16%) AVERAGE FUNERAL GENERAL AGENCY COMMISSION 25% ---- INFLOWS OUTFLOWS AVERAGE FUNERAL SELLING COSTS 4 % (6%) PRODUCTION WEIGHTING 60% 40% NET IMPACT 1 0 % 2 % (2%) 1 Information is based on comparable operations owned as of December 31, 2017. PRENEED BACKLOG INSURANCE BACKLOG MECHANICS FUNERAL PRODUCTION
121 INSURANCE BACKLOG MECHANICS DEFERRED REVENUE BACKLOG OVERVIEW CEMETERY PERPETUAL CARE OVERVIEW PRENEED BACKLOG OUTLOOK Vice President, Treasurer AARON FOLEY TRUST BACKLOG MECHANICS PRENEED BACKLOG

47% We like the potential upside capture from market returns on the preneed trust - funded contracts for the remainder of our deferred revenue backlog 122 OF TOTAL DEFERRED REVENUE $5.0B TRUST - FUNDED BACKLOG Supported by marketable securities and customer receivables 25 p rofessional investment m anagers across 22 strategies Average retainage of ~10% for funeral and ~30% for cemetery, reflects the portion of the sales we are entitled to keep by state/provincial regulations Portfolio returns $3.5B of trust - funded contracts , or 33% of total $10.7B deferred revenue backlog, exposed to market risk OR TRUST - FUNDED DEFERRED REVENUE BACKLOG OVERVIEW FUNDING MANAGEMENT CASH GROWTH OVER CONTRACT LIFE RISK PRENEED BACKLOG TRUST BACKLOG MECHANICS

The average length of time a preneed contract is in our backlog helps guide our trust asset allocation 123 FUNERAL CEMETERY AVERAGE LENGTH OF PRENEED CONTRACTS | 10 - 14 YEARS This contract length allows trust assets to be invested through several market cycles Gains and losses are marked to market on the balance sheet over the life of the contracts, and are recognized into income when the contracts mature Revenue for a preneed contract, including trust income, is recognized upon delivery of the service or merchandise (typically at death). PRENEED BACKLOG TRUST BACKLOG MECHANICS
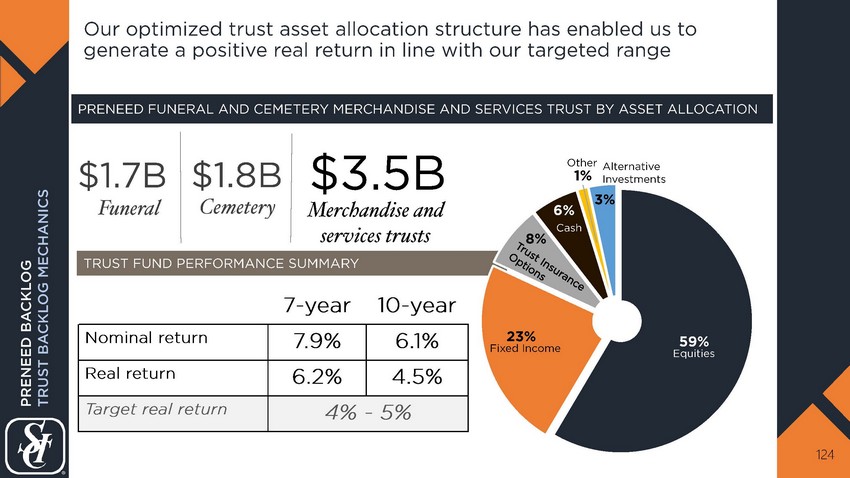
Our optimized trust asset allocation structure has enabled us to generate a positive real return in line with our targeted range 124 PRENEED FUNERAL AND CEMETERY MERCHANDISE AND SERVICES TRUST BY ASSET ALLOCATION $1.7B TRUST FUND PERFORMANCE SUMMARY Merchandise and services trusts $3.5B $ 1.8B Funeral Cemetery 59% 23% 8% 6% 1% 3% Equities Alternative Investments Fixed Income Cash Other PRENEED BACKLOG TRUST BACKLOG MECHANICS 7 - year 10 - year Nominal return 7.9% 6.1% Real return 6.2% 4.5% Target real return 4% - 5%
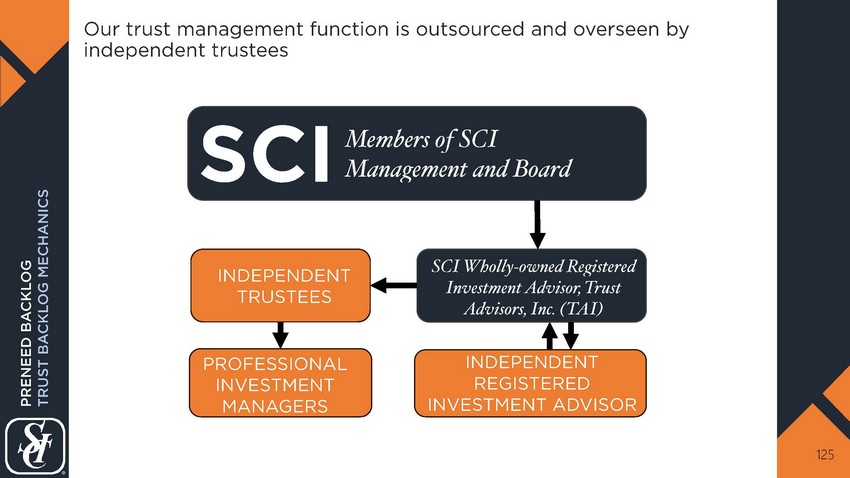
Our trust management function is outsourced and overseen by independent trustees 125 SCI Members of SCI Management and Board SCI Wholly - owned Registered Investment Advisor, Trust Advisors, Inc. (TAI) PROFESSIONAL INVESTMENT MANAGERS INDEPENDENT REGISTERED INVESTMENT ADVISOR INDEPENDENT TRUSTEES PRENEED BACKLOG TRUST BACKLOG MECHANICS

Our disclosed trust return metrics are after investment manager fees, but before trust operating fees 126 1 This information excludes the cemetery perpetual care trusts. o Trustee fees o Trust taxes o Accounting and record - keeping for contracts in the backlog (Approximately 230 people both onshore and offshore) o Electronic data aggregation and investment performance monitoring o Registered investment advisory costs for in - house and external support o Other back - office support (e.g., Legal, IT, etc.) TRUST OPERATING FEES PRENEED BACKLOG TRUST BACKLOG MECHANICS FUNERAL/CEMETERY PRENEED TRUST RETURNS 1 7 - year 10 - year Nominal return, net of investment manager fees 7.9% 6.1% Nominal trust operating fee adjusted net return 6.1% 4.3%

TRUST BACKLOG MECHANICS DEFERRED REVENUE BACKLOG OVERVIEW PRENEED BACKLOG OUTLOOK INSURANCE BACKLOG MECHANICS CEMETERY PERPETUAL CARE OVERVIEW PRENEED BACKLOG 127

In addition to our $10.7B deferred revenue backlog, we also have approximately $1.5B in perpetual care trust funds o Required to fund ~10% of a cemetery property sale proceeds into a cemetery perpetual care trust to fund cemetery maintenance expense o Included on our balance sheet, but only realized earnings, interest, and dividends can be withdrawn as SCI generally does not have legal rights to the corpus (no principal or capital gains) o Asset allocation was heavily oriented to fixed income (yield - oriented) 128 CURRENT CEMETERY PERPETUAL CARE YIELD INVESTMENT STRUCTURE $1.5 $1.4 $1.3 2015 2016 2017 CEMETERY PERPETUAL CARE TRUST ASSET BALANCES AT DECEMBER 31 SHIFT TO CEMETERY PERPETUAL CARE TOTAL RETURN INVESTMENT STRUCTURE o Pursuing a more traditional asset allocation structure, which provides higher long - term returns and reduces the impact of rising interest rates o Collaborated with states to allow for a set annual distribution percentage of total assets annually (i.e., similar to many university endowments and certain funeral and cemetery merchandise and service trusts) o Equity - oriented trust allocation (assets will shift by state) In billions PRENEED BACKLOG CEMETERY PERPETUAL CARE OVERVIEW

While our current perpetual care trust asset allocation focuses on yield, we are working to shift to a total return allocation to benefit our customers and stakeholders 129 EQUITY FIXED INCOME CASH ALTERNATIVE INVESTMENTS CURRENT YIELD ALLOCATION SHIFT TO TOTAL RETURN ALLOCATION 10% 1% 69% 20% 57% 43% 57% TOTAL RETURN INVESTMENT STRUCTURE YIELD INVESTMENT STRUCTURE 10% 5% 20% 65% 43% Future asset allocation will significantly change from a fixed income to an equity driven investment structure As of December 31, 2017 PRENEED BACKLOG CEMETERY PERPETUAL CARE OVERVIEW
INSURANCE BACKLOG MECHANICS DEFERRED REVENUE BACKLOG OVERVIEW TRUST BACKLOG MECHANICS CEMETERY PERPETUAL CARE OVERVIEW Senior Vice President, Chief Financial Officer ERIC TANZBERGER PRENEED BACKLOG OUTLOOK PRENEED BACKLOG 130
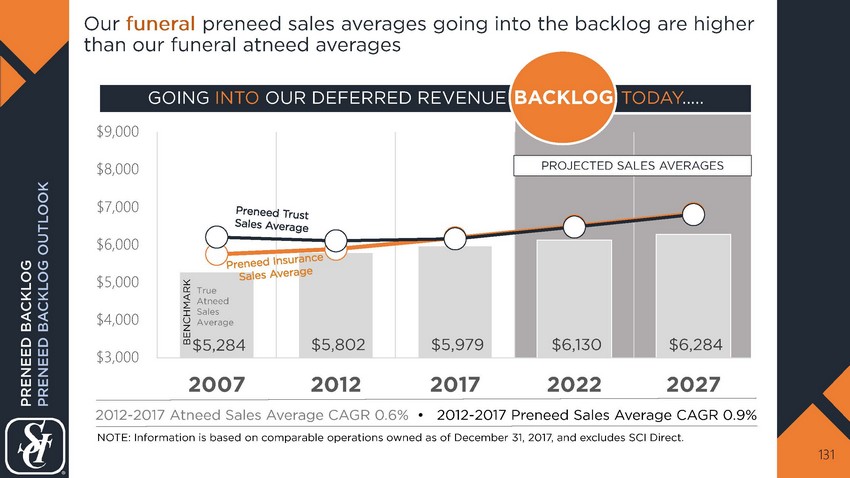
Our funeral preneed sales averages going into the backlog are higher than our funeral atneed averages 131 $5,284 $5,802 $5,979 $6,130 $6,284 $3,000 $4,000 $5,000 $6,000 $7,000 $8,000 $9,000 2007 2012 2017 2022 2027 GOING INTO OUR DEFERRED REVENUE G TODAY ..... BENCHMARK BACKLOG 2012 - 2017 Atneed Sales Average CAGR 0.6% • 2012 - 2017 Preneed Sales Average CAGR 0.9% NOTE: Information is based on comparable operations owned as of December 31, 2017, and excludes SCI Direct. PRENEED BACKLOG PRENEED BACKLOG OUTLOOK PROJECTED SALES AVERAGES True Atneed Sales Average
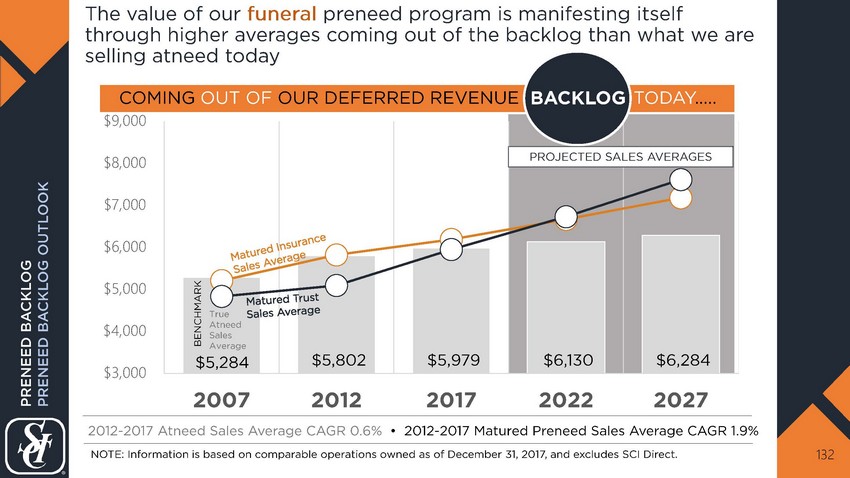
The value of our funeral preneed program is manifesting itself through higher averages coming out of the backlog than what we are selling atneed today 132 $5,284 $5,802 $5,979 $6,130 $6,284 $3,000 $4,000 $5,000 $6,000 $7,000 $8,000 $9,000 2007 2012 2017 2022 2027 True Atneed Sales Average BENCHMARK 2012 - 2017 Atneed Sales Average CAGR 0.6% • 2012 - 2017 Matured Preneed Sales Average CAGR 1.9% COMING OUT OF OUR DEFERRED REVENUE G TODAY ..... BACKLOG NOTE: Information is based on comparable operations owned as of December 31, 2017, and excludes SCI Direct. PRENEED BACKLOG PRENEED BACKLOG OUTLOOK PROJECTED SALES AVERAGES

263,690 263,690 A larger portion of our funeral customers are coming from a previously written contract with a more favorable growth profile 133 TRUE ATNEED MATURED INSURANCE MATURED TRUST TOTAL MATURED PRENEED VOLUME 237,262 237,040 263,690 FUNERAL HISTORICAL AND PROJECTED VOLUME MIX CHANGE 31.8% 35.0% NOTE: Information is based on comparable locations as of December 31, 2017, excluding SCI Direct, and holds overall future volume constant for illustrative purposes. PRENEED BACKLOG PRENEED BACKLOG OUTLOOK PROJECTED VOLUME MIX 68.2% 65.0% 64.1% 61.9% 59.6% 17.5% 21.7% 20.6% 23.3% 26.2% 14.3% 13.3% 15.3% 14.8% 14.2% 2007 2012 2017 2022 2027 35.9% 38.1% 40.4%

134 PRENEED BACKLOG PRENEED BACKLOG OUTLOOK $224 $269 $285 $304 1 1 2014 2015 2016 2017 1 Information is based on comparable operations owned as of December 31, 2017 . I n millions HISTORICAL 1 PRENEED CEMETERY MERCHANDISE AND SERVICES PRODUCTION Mid - single digit sales production growth The value of our cemetery merchandise and services preneed backlog is being driven by the success of our preneed cemetery merchandise and services sales production 11% CAGR 2014 - 2017

135 PRENEED BACKLOG PRENEED BACKLOG OUTLOOK $221 $227 $230 $233 $210 $228 $246 $273 1 1 $431 $455 $476 $506 2014 2015 2016 2017 3 - year CAGR 1 Information is based on comparable operations owned as of December 31, 2017 . 9 % 2 % I n millions ATNEED MATURED PRENEED 6 % HISTORICAL 1 AND FUTURE CEMETERY MERCHANDISE AND SERVICES REVENUE Merchandise and Service Revenue Growth 5 % - 7% 1% - 2% Low - to - mid single digit The value of our cemetery merchandise and service preneed program is manifesting itself through higher revenue growth rates

Our preneed sales program is and will continue to be a pillar of our growth strategy 136 REMAINING RELEVANT TO OUR CUSTOMER o Offer financing options that allow customers to pre - plan for final farewell o Provide peace of mind and alleviate uncertainty SECURING MARKET SHARE BY LEVERAGING OUR SCALE o Structure allows procurement of quality sales with minimal capital outlay o Provides customers with funding options managed through efficient trust and insurance structure MANTAINING OPTIMAL STRUCTURE TO MAXIMIZE RETURNS AND MINIMIZE RISK o 50/50 insurance/trust mix provides predictability with upside opportunity for stakeholders o Focus on optimal allocation of trust assets PRENEED BACKLOG
FINANCIAL OVERVIEW 137

($20M) We should become a full cash tax payer in 2018; however, due to the 2017 Tax Cuts and Jobs Act (“Tax Reform”), we will benefit from a more favorable tax rate 138 FINANCIAL OVERVIEW GUIDANCE HISTORICAL 1 1 Assumes 200bps reduction for excess tax benefits. 2 Adjusted cash tax rate represents federal, state, and foreign taxes paid divided by recurring pre - tax income, and specifically excludes the 2017 paymen t made to the IRS for settlements on prior year audits. Approximate y ear - over - year net cash tax savings 2016 2017 Before Tax Reform 2018 Tax Reform Savings After Tax Reform 2018 Adjusted Effective Tax Rate 37% 29% 34% - 36% 24% - 26% Adjusted Cash Tax Rate 2 28% 32% 35% - 37% 25% - 27% Adjusted Cash Taxes (in millions) ~$115 ~$135 $160 - $170 ($50) $110 - $120

Our capital deployment strategy is dependent upon managing financial risk by maintaining substantial liquidity 139 FINANCIAL OVERVIEW $419 $233 $199 $317 $967 $792 $112 $138 $86 $134 $297 $207 2013 2014 2015 2016 2017 In millions $531 $371 $285 $451 Unencumbered Liquidity $1,264 Credit Facility Availability Cash on hand Operating Cash Floor $25M Canadian Repatriation Tax Penalty 1 UN ENCUMBERED LIQUIDITY ENCUMBERED LIQUIDITY LEGEND $30 $39 $49 $61 $33 Encumbered Liquidity 1 Canadian repatriation tax penalty was 35% from 2011 - 2016 and 21% in 2017 forward as a result of the 2017 Tax Reform Act. HISTORICAL AND PRO - FORMA LIQUIDITY AT DECEMBER 31, 2017 PRO - FORMA 2 $999 $33 2017 2 In January 2018, we drew $175M on our Credit Facility due December 2022 and used $90M cash on hand to repay our $250M 7.625% Senior Notes due October 2018 and associated transaction costs.

Additionally, we maintain flexibility by actively managing our debt maturity profile, ensuring no significant near term maturities 140 FINANCIAL OVERVIEW LEVERAGE 1 3.72x 3.50x – 4.00x $34 $34 $34 $34 $539 $250 $200 $150 $175 $850 $200 $425 $550 2018 2019 2020 2021 2022 2023 2024 2027 4.500% In millions 1 Leverage ratio calculated using net debt to EBITDA in accordance with our credit agreement. TARGET ACTUAL TERM LOAN AMORTIZATION PAYMENTS REVOLVER MATURITIES SENIOR BONDS 5.375% 8.000% 5.375% 4.625% 7.500% 7.625% DEBT EXTINGUISHMENT NEW SENIOR BOND PRO - FORMA DEBT MATURITY PROFILE AT DECEMBER 31, 2017 2 DECEMBER 31, 2017 2 In January 2018, we drew $175M on our Credit Facility due December 2022 and used $90M cash on hand to repay our $250M 7.625% Senior Notes due October 2018 and associated transaction costs.
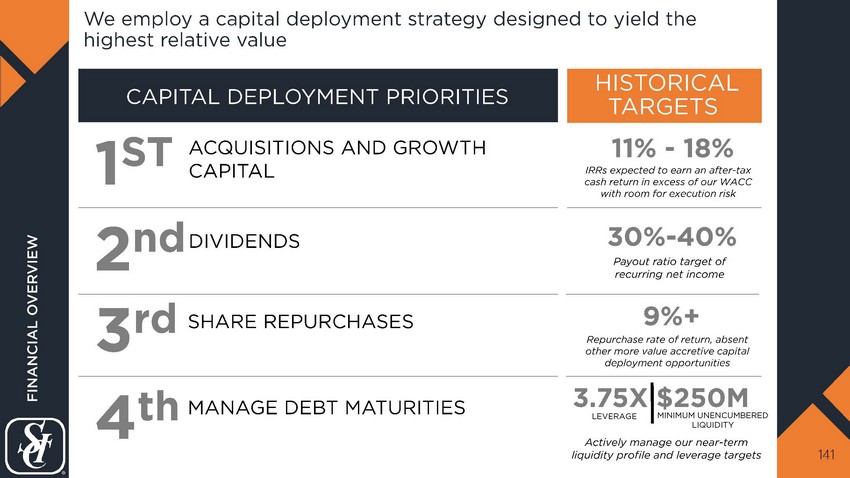
We employ a capital deployment strategy designed to yield the highest relative value 141 FINANCIAL OVERVIEW 1 ST 2 nd 3 rd 4 th ACQUISITIONS AND GROWTH CAPITAL DIVIDENDS SHARE REPURCHASES MANAGE DEBT MATURITIES 11% - 18% 30% - 40% Payout ratio target of recurring net income IRRs expected to earn an after - tax cash return in excess of our WACC with room for execution risk Repurchase rate of return, absent other more value accretive capital deployment opportunities Actively manage our near - term liquidity profile and leverage targets 9 %+ 3.75X $250M LEVERAGE MINIMUM UNENCUMBERED LIQUIDITY HISTORICAL CAPITAL DEPLOYMENT PRIORITIES TARGETS

$ 570M Adjusted Cash Flow from Operations Midpoint of 2018 Guidance 2018 EXPECTED CAPITAL ALLOCATION: Maintenance $135 $100 Maintenance CAPEX $35 Capital Leases Growth $180 $80 Cemetery Property Development $75 Acquisitions $25 New Builds Return to Shareholders $255 $120 Dividends $135 Share Repurchases (balance remaining absent opportunities for further acquisitions and before excess cash and divestiture proceeds) Strong cash flow allows us to strategically deploy capital to yield the highest relative value 142 FINANCIAL OVERVIEW Maintenance CAPEX 13% 4% 14% 18% 6% 21% 24% Acquisitions Share Repurchases Dividends Cemetery Property Development Maintenance CAPEX Capital Leases We believe we will have incremental capital deployment of $50M - $100M resulting from EBITDA growth as we maintain our target leverage

Since 2010, we have reduced shares outstanding by 23% and increased the dividend per share at a 20% CAGR 143 FINANCIAL OVERVIEW $- $0.10 $0.20 $0.30 $0.40 $0.50 $0.60 170,000 195,000 220,000 245,000 270,000 295,000 320,000 345,000 2004 2005 2006 2007 2008 2009 2010 2011 2012 2013 2014 2015 2016 2017 Shares Outstanding Dividends per Share Shares Outstanding in millions Dividends per Share SHARES OUTSTANDING AND DIVIDENDS PER SHARE Value returned to shareholders through dividends and share repurchases since 2004 $3.3B The amount of capital available for share repurchases in 2018 is expected to be ~$185M - $235M 1 based on our financial outlook for the year 20% CAGR 2010 - 2017 Dividends per Share 1 Capital available for share repurchases is derived from the 2018 expected share repurchase capital allocation of $135M, plus an additional $50M - $100M resulting from EBITDA growth in 2018.

We will continue to maximize shareholder value following a results - weighted capital deployment strategy 144 o Continue to deploy capital to highest yielding investment opportunities o Maintain dividend payout targets o Maximize share repurchases formulaically when better capital deployment opportunities are not present o Actively manage our near - term liquidity profile and leverage targets FINANCIAL OVERVIEW FINANCIAL OVERVIEW
145 FUTURE GROWTH CHAIRMAN OF THE BOARD AND CHIEF EXECUTIVE OFFICER TOM RYAN

We believe we can generate an average of 8% - 12% annual growth in adjusted earnings per share over the long term 146 FUTURE GROWTH FRAMEWORK 2 % – 3% SHARE REPURCHASES 1 Adjusted EPS is a non - GAAP financial measure. Please see appendix for additional disclosures. 4% – 6% BASE BUSINESS GROWTH 8% – 12% GROWTH ANNUAL ADJUSTED EPS 1 GROWTH 2 % – 3% TUCK - IN ACQUISITIONS AND NEW BUILDS
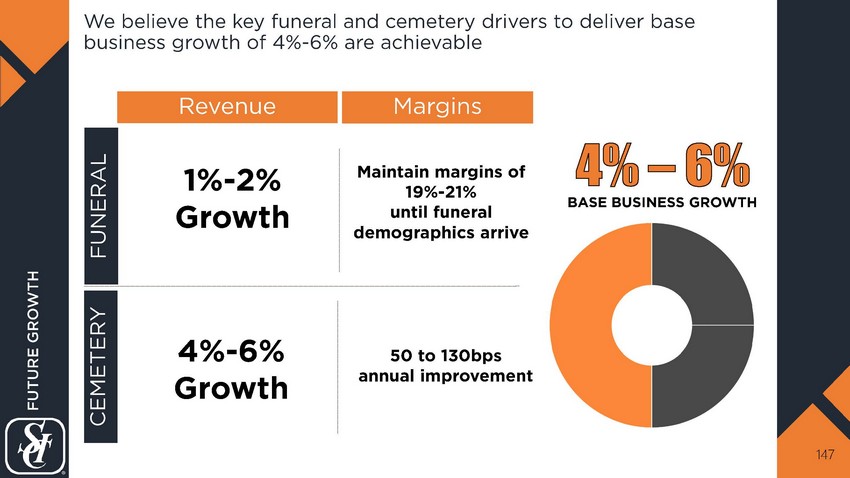
We believe the key funeral and cemetery drivers to deliver base business growth of 4% - 6% are achievable 147 FUTURE GROWTH 1% - 2% Growth 4% - 6% Growth Maintain margins of 19% - 21% u ntil funeral demographics arrive 5 0 to 130bps annual improvement FUNERAL CEMETERY Revenue Margins BASE BUSINESS GROWTH

We believe tuck - in acquisitions and new builds can contribute an additional 2% - 3% 148 FUTURE GROWTH 2% – 3% TUCK - IN ACQUISITIONS $71 $75 $81 $9 $18 $18 $80 $93 $99 2015 2016 2017 In millions 1 Consolidated amounts presented above include 1031 exchange funds and the purchases of non - controlling interests of $4.6M, $1.9M, and $2.1M in 2017, 2016, and 2015, respectively, which is reflected in f inancing cash flows. New Builds Acquisitions AVERAGE ACQUISITION AND NEW BUILD SPEND 1 PER YEAR $70M - $125M
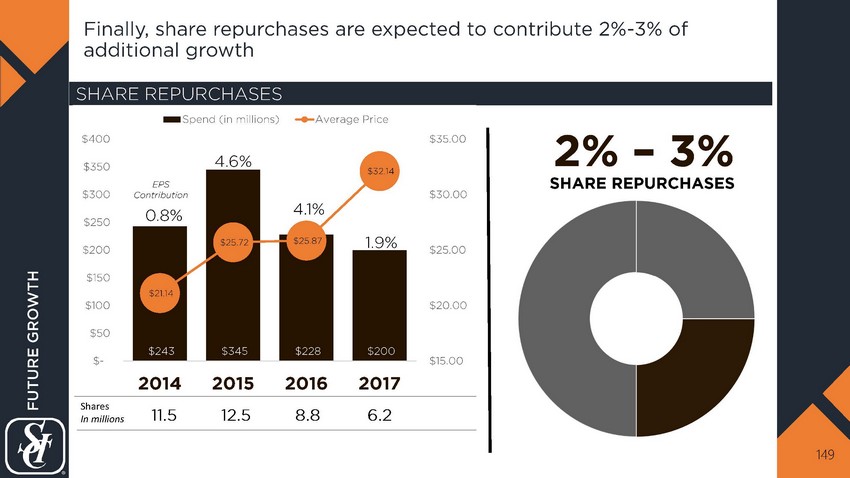
Finally, share repurchases are expected to contribute 2% - 3% of additional growth 149 FUTURE GROWTH 2 % – 3% SHARE REPURCHASES SHARE REPURCHASES $243 $345 $228 $200 $21.14 $25.72 $25.87 $32.14 $15.00 $20.00 $25.00 $30.00 $35.00 $- $50 $100 $150 $200 $250 $300 $350 $400 2014 2015 2016 2017 Spend (in millions) Average Price 11.5 12.5 8.8 6.2 Shares I n millions 0.8% 4.6% 4.1% 1.9% EPS Contribution
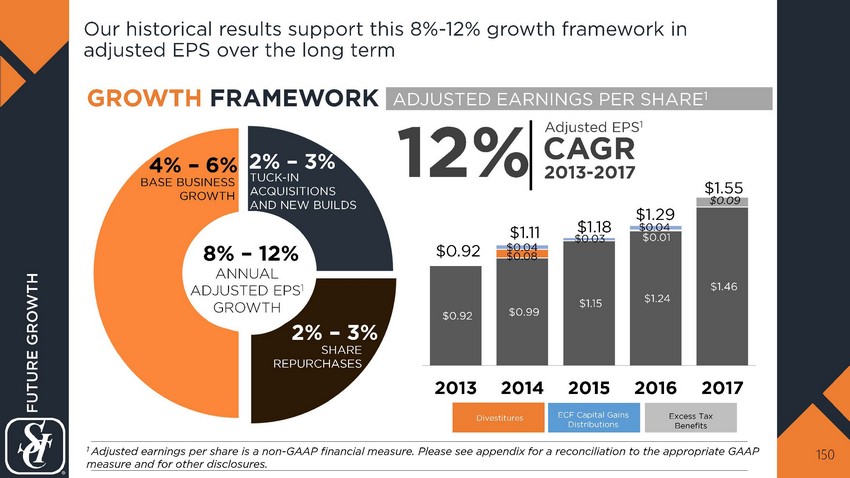
Our historical results support this 8% - 12% growth framework in adjusted EPS over the long term 150 FUTURE GROWTH GROWTH FRAMEWORK 8% – 12% 2 % – 3% SHARE REPURCHASES 2 % – 3% 4% – 6% BASE BUSINESS GROWTH TUCK - IN ACQUISITIONS AND NEW BUILDS ANNUAL ADJUSTED EPS 1 GROWTH $0.92 $0.99 $1.15 $1.24 $1.46 $0.08 $0.01 $0.09 $0.04 $0.03 $0.04 $0.92 $1.11 $1.18 $1.29 $1.55 2013 2014 2015 2016 2017 ADJUSTED EARNINGS PER SHARE 1 12% CAGR 1 Adjusted earnings per share is a non - GAAP financial measure. Please see appendix for a reconciliation to the appropriate GAAP measure and for other disclosures. Adjusted EPS 1 2013 - 2017 Divestitures Excess Tax Benefits ECF Capital Gains Distributions
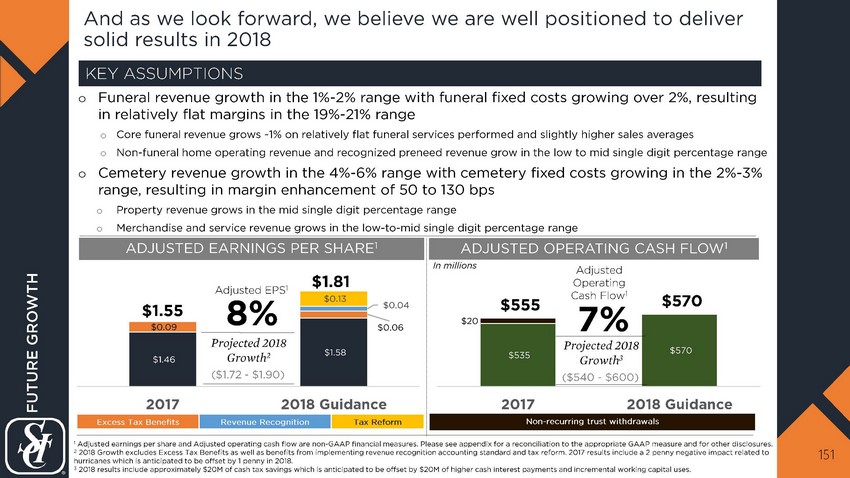
And as we look forward, we believe we are well positioned to deliver solid results in 2018 151 ADJUSTED EARNINGS PER SHARE 1 o Funeral revenue growth in the 1% - 2% range with funeral fixed costs growing over 2%, resulting in relatively flat margins in the 19% - 21% range o Core funeral revenue grows ~1% on relatively flat funeral services performed and slightly higher sales averages o Non - funeral home operating revenue and recognized preneed revenue grow in the low to mid single digit percentage range o Cemetery revenue growth in the 4% - 6% range with cemetery fixed costs growing in the 2% - 3% range, resulting in margin enhancement of 50 to 130 bps o Property revenue grows in the mid single digit percentage range o Merchandise and service revenue grows in the low - to - mid single digit percentage range KEY ASSUMPTIONS FUTURE GROWTH 1 Adjusted earnings per share and Adjusted operating cash flow are non - GAAP financial measures. Please see appendix for a reconci liation to the appropriate GAAP measure and for other disclosures. 2 2018 Growth excludes Excess Tax Benefits as well as benefits from implementing revenue recognition accounting standard and ta x reform. 2017 results include a 2 penny negative impact related to hurricanes which is anticipated to be offset by 1 penny in 2018. 3 2018 results include approximately $20M of cash tax savings which is anticipated to be offset by $20M of higher cash interest p ayments and incremental working capital uses. $1.46 $1.58 $0.09 $0.06 $0.04 $0.13 2017 2018 Guidance 8% Projected 2018 Growth 2 Adjusted EPS 1 ($1.72 - $1.90) $535 $570 $20 $555 $570 2017 2018 Guidance 7 % Projected 2018 Growth 3 Adjusted Operating Cash Flow 1 ($540 - $600) $1.55 $1.81 Excess Tax Benefits Revenue Recognition Tax Reform Non - recurring trust withdrawals ADJUSTED OPERATING CASH FLOW 1 In millions
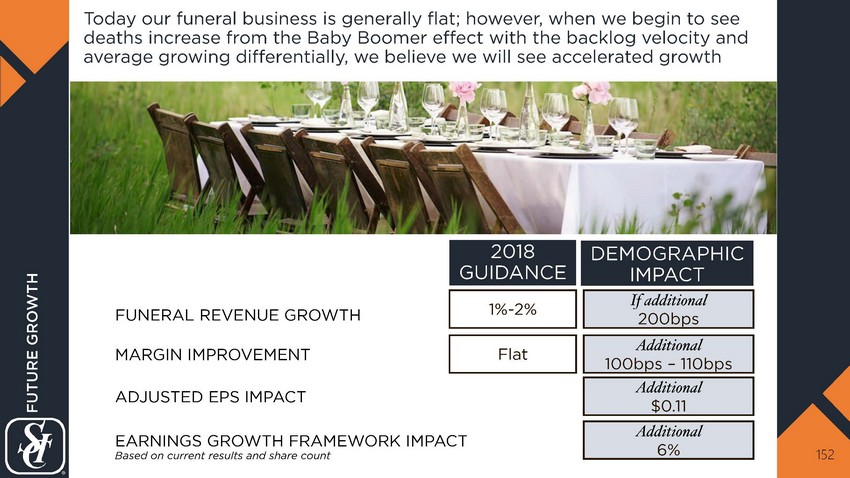
Today our funeral business is generally flat; however, when we begin to see deaths increase from the Baby B oomer effect with the backlog velocity and average growing differentially, we believe we will see accelerated growth 152 2018 GUIDANCE DEMOGRAPHIC IMPACT FUNERAL REVENUE GROWTH MARGIN IMPROVEMENT ADJUSTED EPS IMPACT EARNINGS GROWTH FRAMEWORK IMPACT 1% - 2% If additional 200bps Flat Additional 100bps – 110bps Additional $0.11 Additional 6% FUTURE GROWTH Based on current results and share count
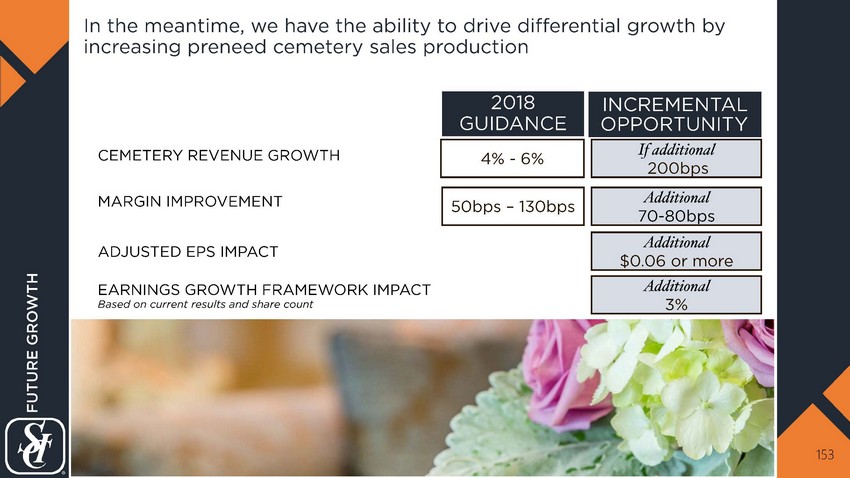
In the meantime, we have the ability to drive differential growth by increasing preneed cemetery sales production 153 CEMETERY REVENUE GROWTH MARGIN IMPROVEMENT ADJUSTED EPS IMPACT 4 % - 6% If additional 200bps 50bps – 130bps Additional 70 - 80bps Additional $0.06 or more EARNINGS GROWTH FRAMEWORK IMPACT Additional 3% FUTURE GROWTH 2018 GUIDANCE INCREMENTAL Based on current results and share count OPPORTUNITY
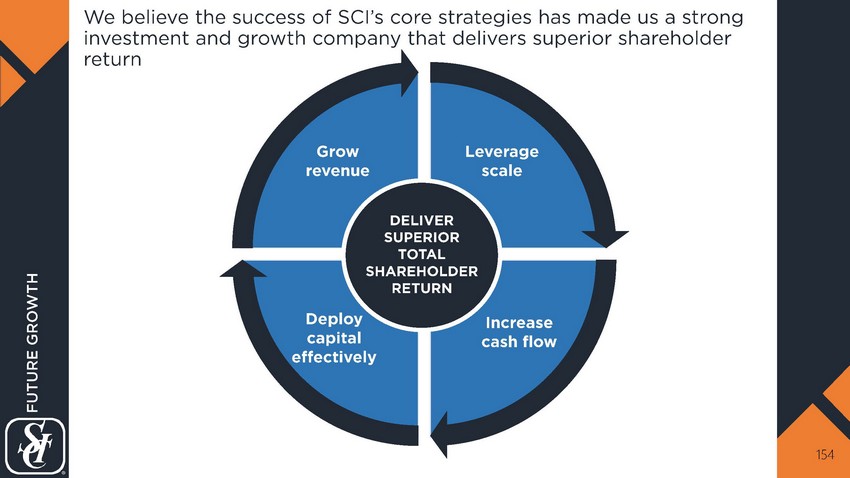
We believe the success of SCI’s core strategies has made us a strong investment and growth company that delivers superior shareholder return 154 FUTURE GROWTH Grow revenue Leverage scale Increase cash flow Deploy capital effectively DELIVER SUPERIOR TOTAL SHAREHOLDER RETURN
APPENDIX 155
Non - GAAP Financial Measures 156 ADJUSTED EPS OR DILUTED EARNINGS PER SHARE EXCLUDING SPECIAL ITEMS We use diluted earnings per share excluding special items (adjusted EPS) as an underlying operational performance measure of the business and to have a basis to compare operating results to prior and future periods . We make adjustments to net income (a GAAP measure) to remove certain charges and credits . We believe these adjustments are relevant in evaluating the overall performance of the business . ADJUSTED CASH FLOW FROM OPERATIONS OR NET CASH PROVIDED BY OPERATING ACTIVITIES EXCLUDING SPECIAL ITEMS We use a djusted cash flow from operations , or net cash provided by operating activities , as an underlying operational performance measure of the continuing operations of the business and to have a basis to compare excluding special items cash flow results to prior and future periods . We make adjustments to cash flow from operations (a GAAP measure) to remove certain receipts and payments . We believe these adjustments are relevant in evaluating the overall performance of the business . FREE CASH FLOW We define f ree cash flow as adjusted cash flow from operations minus expenditures for capital improvements at existing locations and expenditures for the development of cemetery property, collectively referred to as recurring CAPEX . We use free cash flow to assess the financial performance of the Company . We believe that free cash flow is useful to investors because it relates the operating cash flow of the Company to the capital that is spent to continue and improve business operations, such as investment in the Company’s existing businesses . Further, free cash flow facilitates our ability to strengthen the Company’s balance sheet, repay our debt obligations, pay cash dividends, and repurchase our common shares . We also believe the presentation of this measure will enhance the investors' ability to analyze trends in the business and evaluate our underlying performance relative to other companies in the industry . ADJUSTED EBITDA We define a djusted EBITDA as a financial measure calculated in accordance with our credit agreement and represents EBITDA to remove certain charges and credits . We use adjusted EBITDA to provide investors and lenders with additional information to measure our financial performance and evaluate our ability to service debt . COMPARABLE OPERATIONS We define comparable (or same store) operations as those funeral and cemetery locations owned by us for the entire fiscal period beginning January 1 , 2016 , and ending December 31 , 2017 . This information should not be considered in isolation or as a substitute for related GAAP measures . Additionally, these measures as calculated by the Company may not be comparable to similarly titled measures used by other companies . APPENDIX
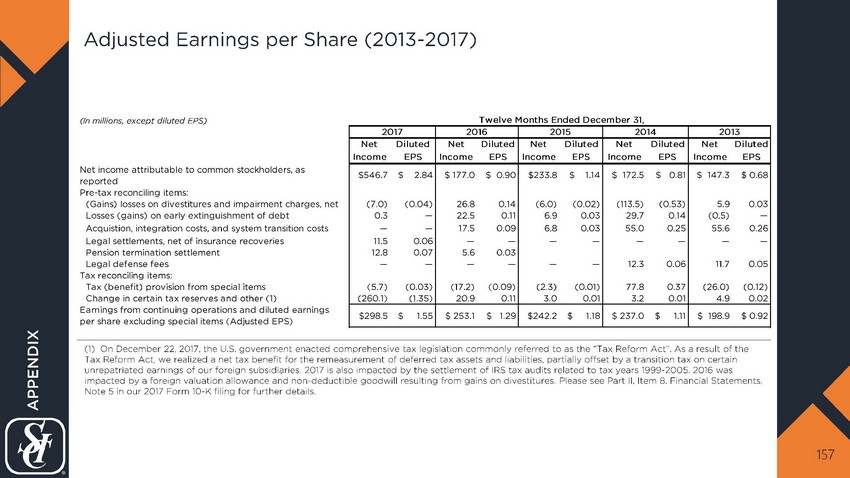
Adjusted Earnings per Share (2013 - 2017) 157 (In millions, except diluted EPS) Net Diluted Net Diluted Net Diluted Net Diluted Net Diluted Income EPS Income EPS Income EPS Income EPS Income EPS Net income attributable to common stockholders, as reported $546.7 $ 2.84 $ 177.0 $ 0.90 $233.8 $ 1.14 $ 172.5 $ 0.81 $ 147.3 $ 0.68 Pre-tax reconciling items: (Gains) losses on divestitures and impairment charges, net (7.0) (0.04) 26.8 0.14 (6.0) (0.02) (113.5) (0.53) 5.9 0.03 Losses (gains) on early extinguishment of debt 0.3 — 22.5 0.11 6.9 0.03 29.7 0.14 (0.5) — Acquistion, integration costs, and system transition costs — — 17.5 0.09 6.8 0.03 55.0 0.25 55.6 0.26 Legal settlements, net of insurance recoveries 11.5 0.06 — — — — — — — — Pension termination settlement 12.8 0.07 5.6 0.03 Legal defense fees — — — — — — 12.3 0.06 11.7 0.05 Tax reconciling items: Tax (benefit) provision from special items (5.7) (0.03) (17.2) (0.09) (2.3) (0.01) 77.8 0.37 (26.0) (0.12) Change in certain tax reserves and other (1) (260.1) (1.35) 20.9 0.11 3.0 0.01 3.2 0.01 4.9 0.02 Earnings from continuing operations and diluted earnings per share excluding special items (Adjusted EPS) $298.5 $ 1.55 $ 253.1 $ 1.29 $242.2 $ 1.18 $ 237.0 $ 1.11 $ 198.9 $ 0.92 20132017 2014 Twelve Months Ended December 31, 2016 2015 APPENDIX (1) On December 22, 2017, the U.S. government enacted comprehensive tax legislation commonly referred to as the "Tax Reform Act”. As a result of the Tax Reform Act, we realized a net tax benefit for the remeasurement of deferred tax assets and liabilities, partially offset by a transition tax on certain unrepatriated earnings of our foreign subsidiaries. 2017 is also impacted by the settlement of IRS tax audits related to tax years 1999 - 2005. 2016 was impacted by a foreign valuation allowance and non - deductible goodwill resulting from gains on divestitures. Please see Part II, Item 8. Financial Statements, Note 5 in our 2017 Form 10 - K filing for further details.
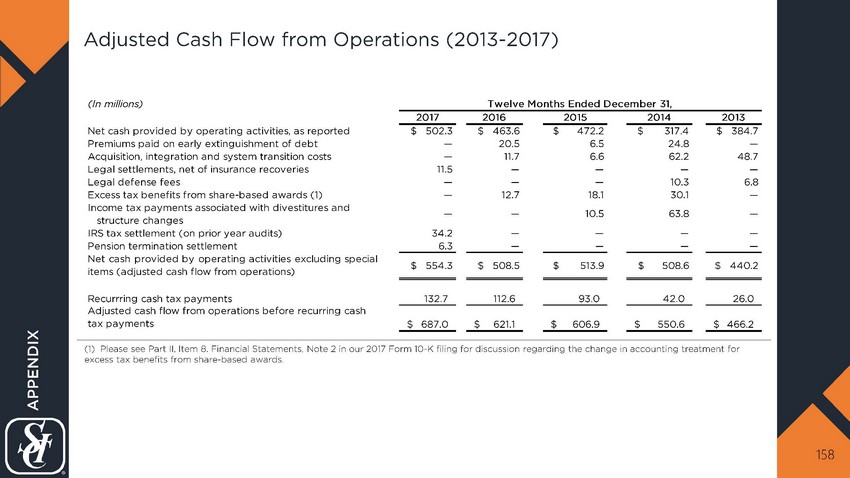
Adjusted Cash F low from Operations (2013 - 2017) 158 (In millions) 2017 2016 2015 2014 2013 Net cash provided by operating activities, as reported $ 502.3 $ 463.6 $ 472.2 $ 317.4 $ 384.7 Premiums paid on early extinguishment of debt — 20.5 6.5 24.8 — Acquisition, integration and system transition costs — 11.7 6.6 62.2 48.7 Legal settlements, net of insurance recoveries 11.5 — — — — Legal defense fees — — — 10.3 6.8 Excess tax benefits from share-based awards (1) — 12.7 18.1 30.1 — Income tax payments associated with divestitures and structure changes — — 10.5 63.8 — IRS tax settlement (on prior year audits) 34.2 — — — — Pension termination settlement 6.3 — — — — Netcashprovidedbyoperatingactivitiesexcludingspecial items (adjusted cash flow from operations) $ 554.3 $ 508.5 $ 513.9 $ 508.6 $ 440.2 Recurrring cash tax payments 132.7 112.6 93.0 42.0 26.0 Adjusted cash flow from operations before recurring cash tax payments 687.0$ 621.1$ 606.9$ 550.6$ 466.2$ Twelve Months Ended December 31, APPENDIX (1) Please see Part II, Item 8. Financial Statements, Note 2 in our 2017 Form 10 - K filing for discussion regarding the change in accounting treatment for excess tax benefits from share - based awards.
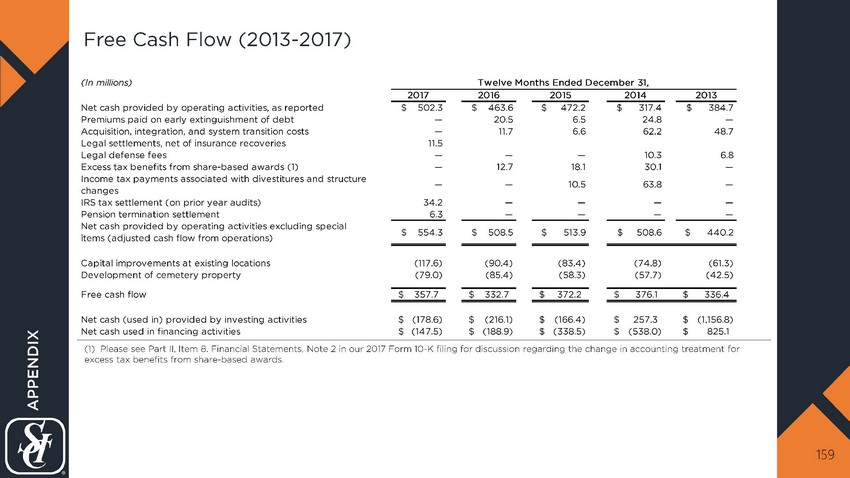
Free Cash Flow (2013 - 2017) 159 (In millions) 2017 2016 2015 2014 2013 Net cash provided by operating activities, as reported $ 502.3 $ 463.6 $ 472.2 $ 317.4 $ 384.7 Premiums paid on early extinguishment of debt — 20.5 6.5 24.8 — Acquisition, integration, and system transition costs — 11.7 6.6 62.2 48.7 Legal settlements, net of insurance recoveries 11.5 Legal defense fees — — — 10.3 6.8 Excess tax benefits from share-based awards (1) — 12.7 18.1 30.1 — Income tax payments associated with divestitures and structure changes — — 10.5 63.8 — IRS tax settlement (on prior year audits) 34.2 — — — — Pension termination settlement 6.3 — — — — Net cash provided by operating activities excluding special items (adjusted cash flow from operations) $ 554.3 $ 508.5 $ 513.9 $ 508.6 $ 440.2 Capital improvements at existing locations (117.6) (90.4) (83.4) (74.8) (61.3) Development of cemetery property (79.0) (85.4) (58.3) (57.7) (42.5) Free cash flow 357.7$ 332.7$ 372.2$ 376.1$ 336.4$ Net cash (used in) provided by investing activities (178.6)$ (216.1)$ (166.4)$ 257.3$ (1,156.8)$ Net cash used in financing activities (147.5)$ (188.9)$ (338.5)$ (538.0)$ 825.1$ Twelve Months Ended December 31, APPENDIX (1) Please see Part II, Item 8. Financial Statements, Note 2 in our 2017 Form 10 - K filing for discussion regarding the change in accounting treatment for excess tax benefits from share - based awards.
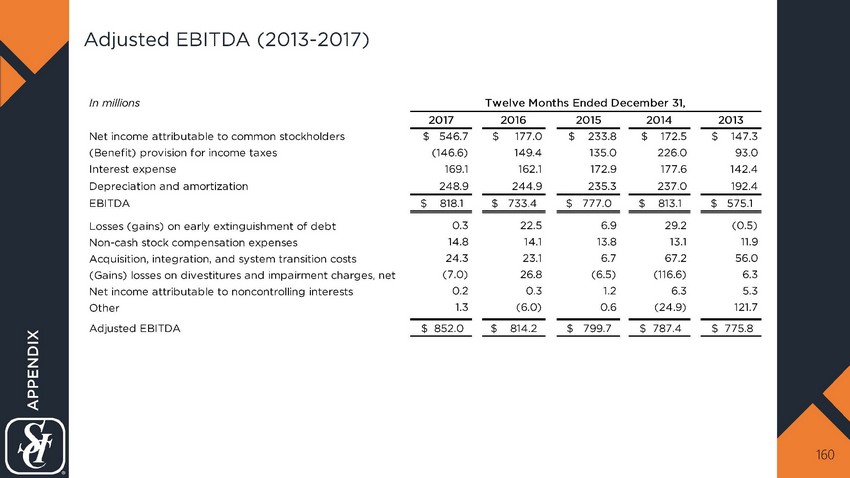
Adjusted EBITDA (2013 - 2017) 160 APPENDIX In millions 2017 2016 2015 2014 2013 Net income attributable to common stockholders $ 546.7 $ 177.0 $ 233.8 $ 172.5 $ 147.3 (Benefit) provision for income taxes (146.6) 149.4 135.0 226.0 93.0 Interest expense 169.1 162.1 172.9 177.6 142.4 Depreciation and amortization 248.9 244.9 235.3 237.0 192.4 EBITDA 818.1$ 733.4$ 777.0$ 813.1$ 575.1$ Losses (gains) on early extinguishment of debt 0.3 22.5 6.9 29.2 (0.5) Non-cash stock compensation expenses 14.8 14.1 13.8 13.1 11.9 Acquisition, integration, and system transition costs 24.3 23.1 6.7 67.2 56.0 (Gains) losses on divestitures and impairment charges, net (7.0) 26.8 (6.5) (116.6) 6.3 Net income attributable to noncontrolling interests 0.2 0.3 1.2 6.3 5.3 Other 1.3 (6.0) 0.6 (24.9) 121.7 Adjusted EBITDA 852.0$ 814.2$ 799.7$ 787.4$ 775.8$ Twelve Months Ended December 31,
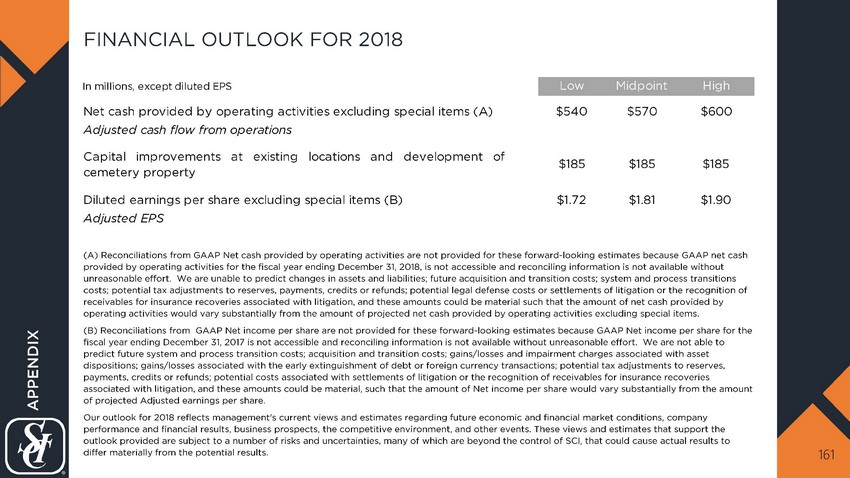
FINANCIAL OUTLOOK FOR 2018 161 (A) Reconciliations from GAAP Net cash provided by operating activities are not provided for these forward - looking estimates because GAAP net cash provided by operating activities for the fiscal year ending December 31, 2018, is not accessible and reconciling information is not available without unreasonable effort. We are unable to predict changes in assets and liabilities; future acquisition and transition costs; system and process transitions costs; potential tax adjustments to reserves, payments, credits or refunds; potential legal defense costs or settlements of l iti gation or the recognition of receivables for insurance recoveries associated with litigation, and these amounts could be material such that the amount of net cash provided by operating activities would vary substantially from the amount of projected net cash provided by operating activities excludin g s pecial items. (B) Reconciliations from GAAP N et income per share are not provided for these forward - looking estimates because GAAP Net income per share for the fiscal year ending December 31, 2017 is not accessible and reconciling information is not available without unreasonable effo rt. We are not able to predict future system and process transition costs; acquisition and transition costs; gains/losses and impairment charges associated with asset dispositions; gains/losses associated with the early extinguishment of debt or foreign currency transactions; potential tax a dju stments to reserves, payments, credits or refunds; potential costs associated with settlements of litigation or the recognition of receivables for in surance recoveries associated with litigation, and these amounts could be material, such that the amount of Net income per share would vary subs tan tially from the amount of projected Adjusted earnings per share. Our outlook for 2018 reflects management's current views and estimates regarding future economic and financial market conditions, company performance and financial results, business prospects, the competitive environment, and other events. These views and estimates that support the outlook provided are subject to a number of risks and uncertainties, many of which are beyond the control of SCI, that could cau se actual results to differ materially from the potential results. APPENDIX In millions, except diluted EPS Low Midpoint High Net cash provided by operating activities excluding special items (A) $540 $570 $600 Adjusted cash flow from operations Capital improvements at existing locations and development of cemetery property $185 $185 $185 Diluted earnings per share excluding special items (B) $1.72 $1.81 $1.90 Adjusted EPS